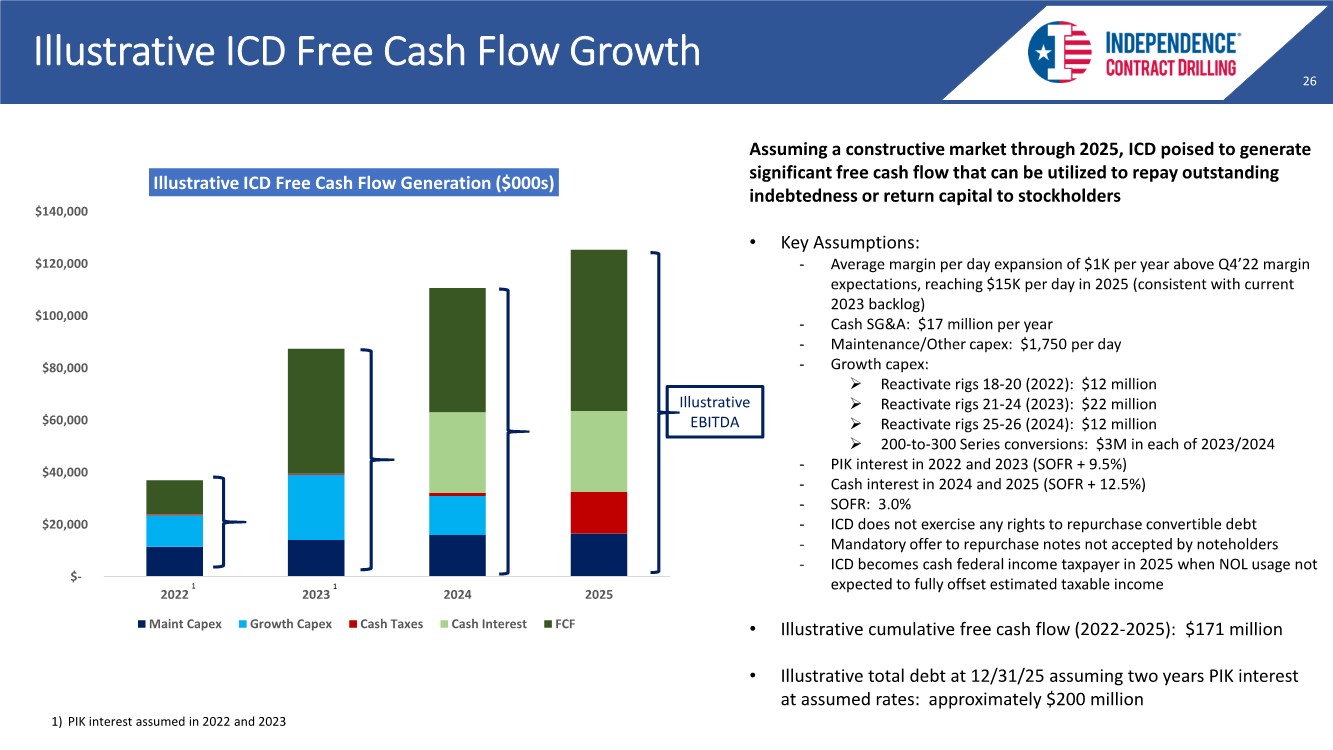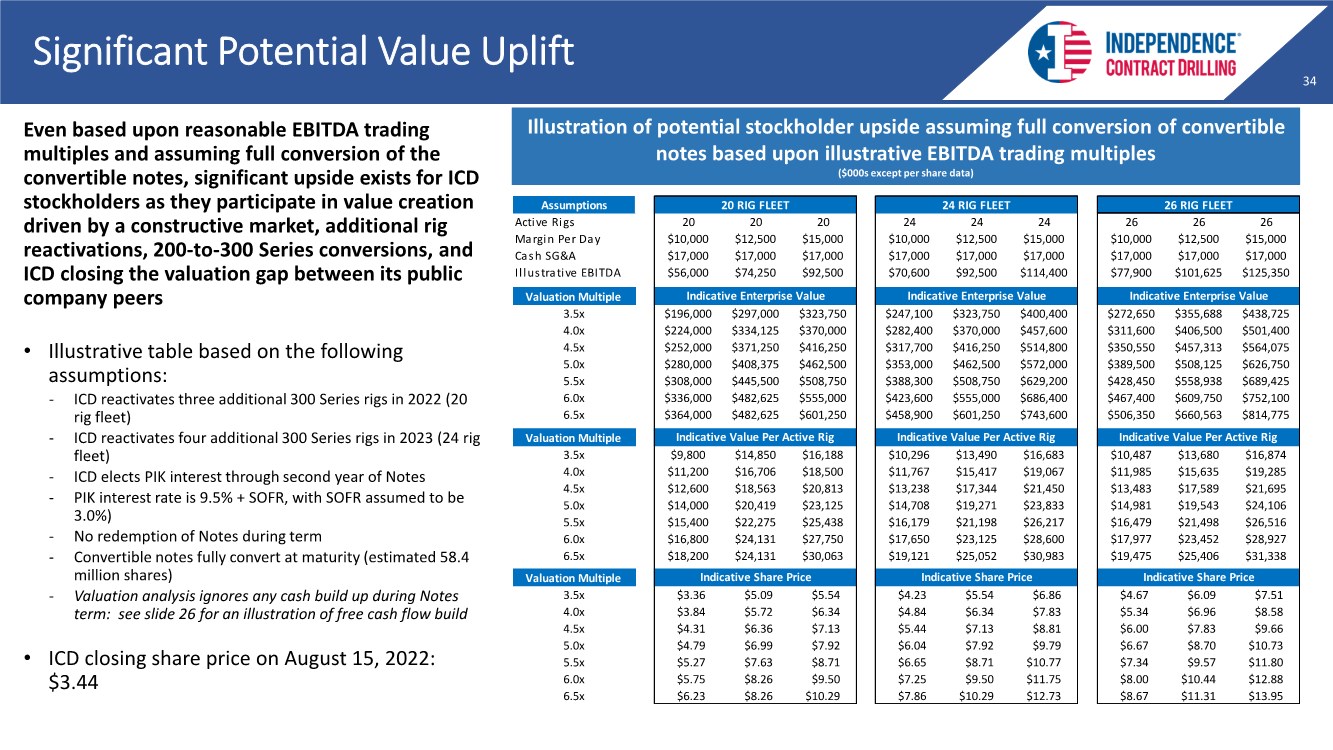
| 34 34 34 Significant Potential Value Uplift Illustration of potential stockholder upside assuming full conversion of convertible notes based upon illustrative EBITDA trading multiples ($000s except per share data) Even based upon reasonable EBITDA trading multiples and assuming full conversion of the convertible notes, significant upside exists for ICD stockholders as they participate in value creation driven by a constructive market, additional rig reactivations, 200-to-300 Series conversions, and ICD closing the valuation gap between its public company peers • Illustrative table based on the following assumptions: - ICD reactivates three additional 300 Series rigs in 2022 (20 rig fleet) - ICD reactivates four additional 300 Series rigs in 2023 (24 rig fleet) - ICD elects PIK interest through second year of Notes - PIK interest rate is 9.5% + SOFR, with SOFR assumed to be 3.0%) - No redemption of Notes during term - Convertible notes fully convert at maturity (estimated 58.4 million shares) - Valuation analysis ignores any cash build up during Notes term: see slide 26 for an illustration of free cash flow build • ICD closing share price on August 15, 2022: $3.44 Assumptions 20 RIG FLEET 24 RIG FLEET 26 RIG FLEET Active Rigs 20 20 20 24 24 24 26 26 26 Margin Per Day $10,000 $12,500 $15,000 $10,000 $12,500 $15,000 $10,000 $12,500 $15,000 Cash SG&A $17,000 $17,000 $17,000 $17,000 $17,000 $17,000 $17,000 $17,000 $17,000 Illustrative EBITDA $56,000 $74,250 $92,500 $70,600 $92,500 $114,400 $77,900 $101,625 $125,350 Valuation Multiple 3.5x $196,000 $297,000 $323,750 $247,100 $323,750 $400,400 $272,650 $355,688 $438,725 4.0x $224,000 $334,125 $370,000 $282,400 $370,000 $457,600 $311,600 $406,500 $501,400 4.5x $252,000 $371,250 $416,250 $317,700 $416,250 $514,800 $350,550 $457,313 $564,075 5.0x $280,000 $408,375 $462,500 $353,000 $462,500 $572,000 $389,500 $508,125 $626,750 5.5x $308,000 $445,500 $508,750 $388,300 $508,750 $629,200 $428,450 $558,938 $689,425 6.0x $336,000 $482,625 $555,000 $423,600 $555,000 $686,400 $467,400 $609,750 $752,100 6.5x $364,000 $482,625 $601,250 $458,900 $601,250 $743,600 $506,350 $660,563 $814,775 Valuation Multiple 3.5x $9,800 $14,850 $16,188 $10,296 $13,490 $16,683 $10,487 $13,680 $16,874 4.0x $11,200 $16,706 $18,500 $11,767 $15,417 $19,067 $11,985 $15,635 $19,285 4.5x $12,600 $18,563 $20,813 $13,238 $17,344 $21,450 $13,483 $17,589 $21,695 5.0x $14,000 $20,419 $23,125 $14,708 $19,271 $23,833 $14,981 $19,543 $24,106 5.5x $15,400 $22,275 $25,438 $16,179 $21,198 $26,217 $16,479 $21,498 $26,516 6.0x $16,800 $24,131 $27,750 $17,650 $23,125 $28,600 $17,977 $23,452 $28,927 6.5x $18,200 $24,131 $30,063 $19,121 $25,052 $30,983 $19,475 $25,406 $31,338 Valuation Multiple 3.5x $3.36 $5.09 $5.54 $4.23 $5.54 $6.86 $4.67 $6.09 $7.51 4.0x $3.84 $5.72 $6.34 $4.84 $6.34 $7.83 $5.34 $6.96 $8.58 4.5x $4.31 $6.36 $7.13 $5.44 $7.13 $8.81 $6.00 $7.83 $9.66 5.0x $4.79 $6.99 $7.92 $6.04 $7.92 $9.79 $6.67 $8.70 $10.73 5.5x $5.27 $7.63 $8.71 $6.65 $8.71 $10.77 $7.34 $9.57 $11.80 6.0x $5.75 $8.26 $9.50 $7.25 $9.50 $11.75 $8.00 $10.44 $12.88 6.5x $6.23 $8.26 $10.29 $7.86 $10.29 $12.73 $8.67 $11.31 $13.95 Indicative Enterprise Value Indicative Value Per Active Rig Indicative Share Price Indicative Value Per Active Rig Indicative Share Price Indicative Enterprise Value Indicative Enterprise Value Indicative Value Per Active Rig Indicative Share Price |