Exhibit 99.1
Exhibit 99.1
Independence Contract Drilling
Evercore ISI Oilfield Tour & Growth Company 1x1 Forum
March 11, 2015
Customer focus
HSE
VISION
Our vision is to be the premier US land drilling company who provides best in class drilling services with a focus on our employees, technology and HSE. We will continuously strive to understand and exceed our customers’ expectations and in so doing, maximize value for all stakeholders.
Fiancial stewardship
People
Integrity
Forward-Looking Statements and Non-GAAP Financial Measures
Various statements contained in this presentation, including those that express a belief, expectation or intention, as well as those that are not statements of historical fact, are forward-looking statements. These forward-looking statements may include projections and estimates concerning the timing and success of specific projects and our future revenues, income and capital spending. Our forward-looking statements are generally accompanied by words such as “estimate,” “project,” “predict,” “believe,” “expect,” “anticipate,” “potential,” “plan,” “goal,” “will” or other words that convey the uncertainty of future events or outcomes. The forward-looking statements in this presentation speak only as of the date of this presentation; we disclaim any obligation to update these statements unless required by law, and we caution you not to rely on them unduly. We have based these forward-looking statements on our current expectations and assumptions about future events. While our management considers these expectations and assumptions to be reasonable, they are inherently subject to significant business, economic, competitive, regulatory and other risks, contingencies and uncertainties, most of which are difficult to predict and many of which are beyond our control. These and other important factors, including those discussed under “Risk Factors” and “Management’s Discussion and Analysis of Financial Condition and Results of Operations” included in the Company’s filings with the Securities and Exchange Commission, including the Company’s Registration Statement on Form S-1, may cause our actual results, performance or achievements to differ materially from any future results, performance or achievements expressed or implied by these forward-looking statements. These risks, contingencies and uncertainties include, but are not limited to, the following:
our inability to implement our business and growth strategy;
a sustained decrease in domestic spending by the oil and natural gas exploration and production industry;
decline in or substantial volatility of crude oil and natural gas commodity prices;
fluctuation of our operating results and volatility of our industry;
inability to maintain or increase pricing on our contract drilling services;
delays in construction or deliveries of our new land drilling rigs;
the loss of our customer, financial distress or management changes of potential customers or failure to obtain contract renewals and additional customer contracts for our drilling services;
an increase in interest rates and deterioration in the credit markets;
our inability to raise sufficient funds through debt financing and equity issuances needed to fund our planned rig construction projects;
our inability to comply with the financial and other covenants in debt agreements that we may enter into as a result of reduced revenues and financial performance;
overcapacity and competition in our industry;
unanticipated costs, delays and other difficulties in executing our long-term growth strategy;
the loss of key management personnel;
new technology that may cause our drilling methods or equipment to become less competitive;
labor costs or shortages of skilled workers;
the loss of or interruption in operations of one or more key vendors;
the effect of operating hazards and severe weather on our rigs, facilities, business, operations and financial results, and limitations on our insurance coverage;
increased regulation of drilling in unconventional formations;
the incurrence of significant costs and liabilities in the future resulting from our failure to comply with new or existing environmental regulations or an accidental release of hazardous substances into the environment;
the potential failure by us to establish and maintain effective internal control over financial reporting;
lack of operating history as a contract drilling company; and
uncertainties associated with any registration statement, including financial statements, we may be required to file with the SEC.
All forward-looking statements are necessarily only estimates of future results, and there can be no assurance that actual results will not differ materially from expectations, and, therefore, you are cautioned not to place undue reliance on such statements. Any forward-looking statements are qualified in their entirety by reference to the factors discussed throughout this presentation. Further, any forward-looking statement speaks only as of the date on which it is made, and we undertake no obligation to update any forward-looking statement to reflect events or circumstances after the date on which the statement is made or to reflect the occurrence of unanticipated events.
Each of EBITDA and Adjusted EBITDA is a supplemental non-GAAP financial measure that is used by management and external users of our financial statements, such as industry analysts, investors, lenders and rating agencies. We define “EBITDA” as earnings (or loss) before interest, taxes, depreciation, and amortization, and we define “Adjusted EBITDA” as EBITDA before stock-based compensation, gain/loss on warrant derivative liability and non-cash asset impairments. Adjusted EBITDA is not a measure of net income as determined by U.S. generally accepted accounting principles (“GAAP”).
Management believes each of EBITDA and Adjusted EBITDA is useful because it allows us and our stockholders to more effectively evaluate our operating performance and compare the results of our operations from period to period and against our peers without regard to our financing methods or capital structure. We exclude the items listed above from net income (loss) in calculating EBITDA and Adjusted EBITDA because these amounts can vary substantially from company to company within our industry depending upon accounting methods and book values of assets, capital structures and the method by which the assets were acquired. EBITDA and Adjusted EBITDA should not be considered an alternative to, or more meaningful than, net income (loss), the most closely comparable financial measure calculated in accordance with GAAP or as an indicator of our operating performance or liquidity. Certain items excluded from EBITDA and Adjusted EBITDA are significant components in understanding and assessing a company’s financial performance, such as a company’s cost of capital and tax structure, as well as stock-based compensation and the historic costs of depreciable assets, none of which are components of EBITDA or Adjusted EBITDA. Our presentation of EBITDA and Adjusted EBITDA should not be construed as an inference that our results will be unaffected by unusual or non-recurring items. Our computations of EBITDA and Adjusted EBITDA may not be comparable to other similarly titled measures of other companies.
3
Independence Contract Drilling Overview
U.S. Land-Based Contract Driller Providing Premium Services
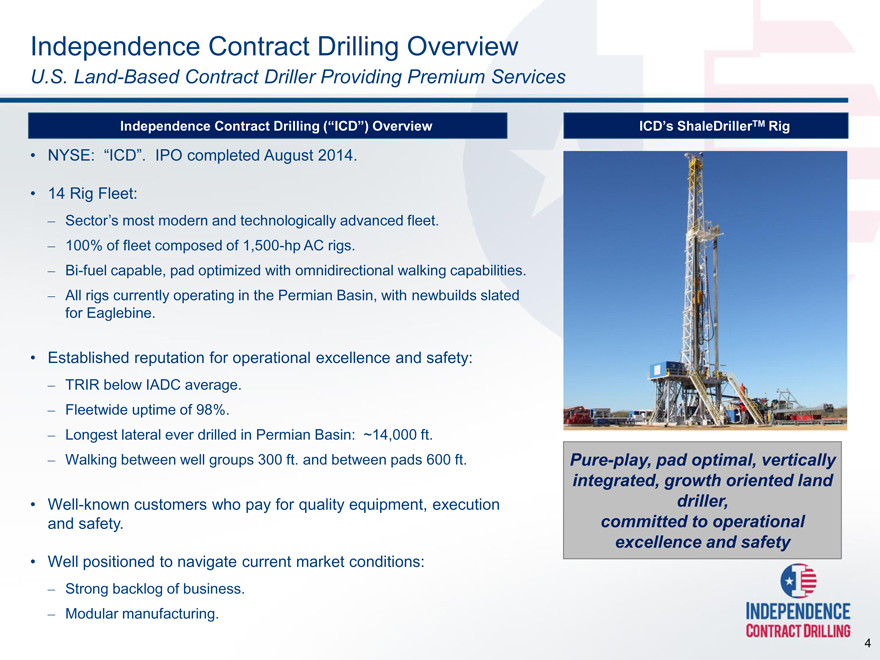
Independence Contract Drilling (“ICD”) Overview
NYSE: “ICD”. IPO completed August 2014.
14 Rig Fleet:
Sector’s most modern and technologically advanced fleet.
100% of fleet composed of 1,500-hp AC rigs.
Bi-fuel capable, pad optimized with omnidirectional walking capabilities.
All rigs currently operating in the Permian Basin, with newbuilds slated for Eaglebine.
Established reputation for operational excellence and safety:
TRIR below IADC average.
Fleetwide uptime of 98%.
Longest lateral ever drilled in Permian Basin: ~14,000 ft.
Walking between well groups 300 ft. and between pads 600 ft.
Well-known customers who pay for quality equipment, execution and safety.
Well positioned to navigate current market conditions:
Strong backlog of business.
Modular manufacturing.
ICD’s ShaleDrillerTM Rig
Pure-play, pad optimal, vertically integrated, growth oriented land driller, committed to operational excellence and safety
4
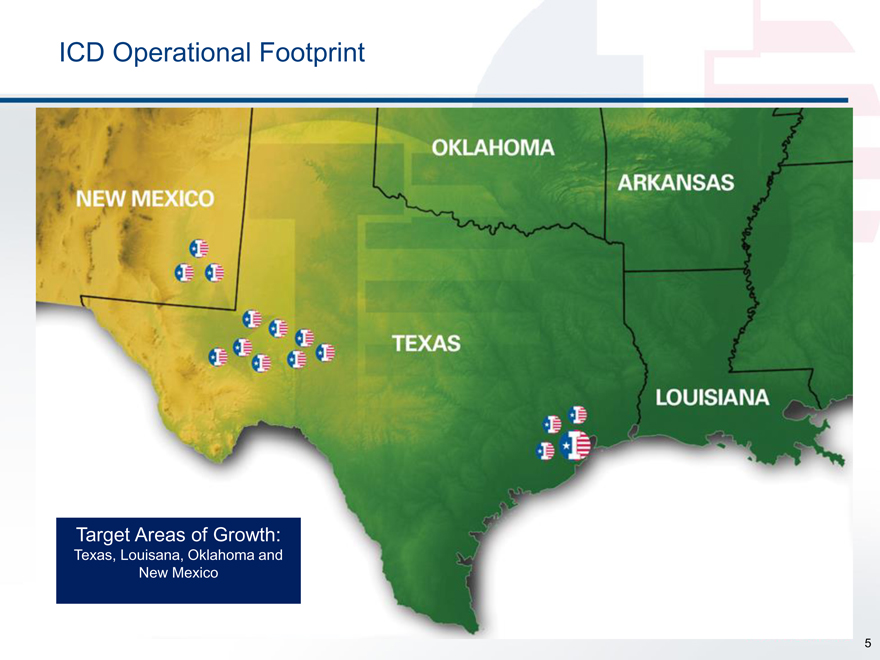
ICD Operational Footprint
Target Areas of Growth:
Texas, Louisana, Oklahoma and New Mexico
5
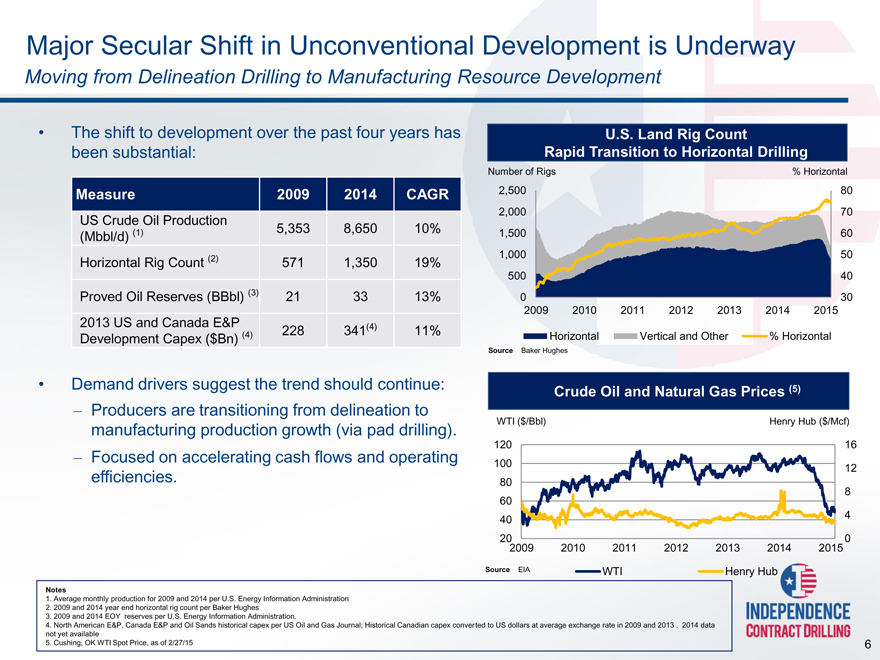
Major Secular Shift in Unconventional Development is Underway
Moving from Delineation Drilling to Manufacturing Resource Development
The shift to development over the past four years has
U.S. Land Rig Count
been substantial:
Rapid Transition to Horizontal Drilling
Number of Rigs% Horizontal
Measure 2009 2014 CAGR 2,500 80
2,000 70
US Crude Oil Production 5,353 8,650 10%
(Mbbl/d) (1) 1,500 60
Horizontal Rig Count (2) 571 1,350 19% 1,000 50
500 40
Proved Oil Reserves (BBbl) (3) 21 33 13% 0 30
2009 2010 2011 2012 2013 2014 2015
2013 US and Canada E&P 228 341(4) 11%
Development Capex ($Bn) (4) Horizontal Vertical and Other% Horizontal
Source Baker Hughes
Demand drivers suggest the trend should continue:
Producers are transitioning from delineation to manufacturing production growth (via pad drilling).
Focused on accelerating cash flows and operating efficiencies.
Crude Oil and Natural Gas Prices (5)
WTI ($/Bbl) Henry Hub ($/Mcf)
120 16
100 12
80
8
60
40 4
20 0
2009 2010 2011 2012 2013 2014 2015
Source EIA WTI Henry Hub
Notes
Average monthly production for 2009 and 2014 per U.S. Energy Information Administration
2009 and 2014 year end horizontal rig count per Baker Hughes
2009 and 2014 EOY reserves per U.S. Energy Information Administration.
North American E&P, Canada E&P and Oil Sands historical capex per US Oil and Gas Journal; Historical Canadian capex converted to US dollars at average exchange rate in 2009 and 2013 . 2014 data
not yet available
5. Cushing, OK WTI Spot Price, as of 2/27/15 6
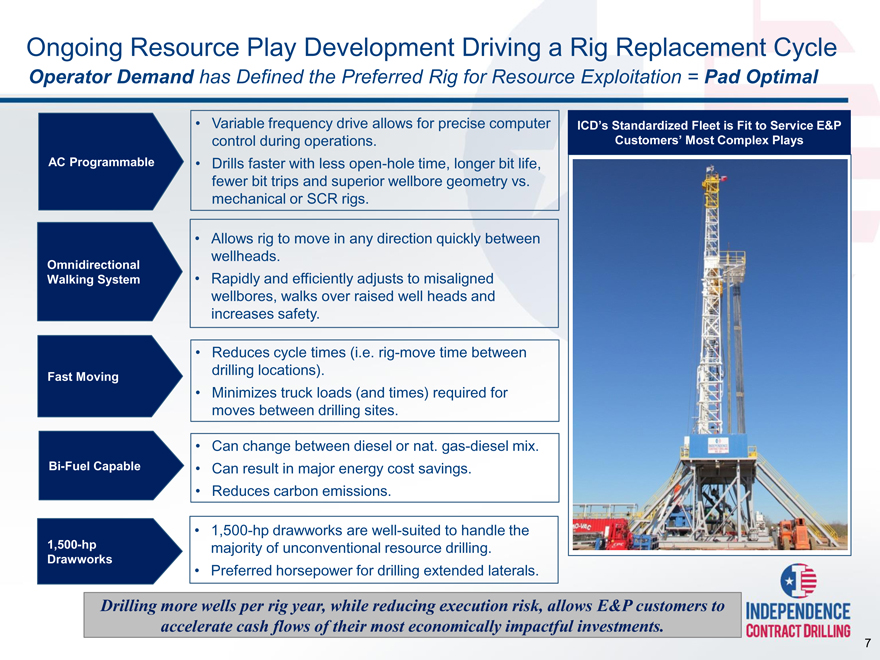
Ongoing Resource Play Development Driving a Rig Replacement Cycle
Operator Demand has Defined the Preferred Rig for Resource Exploitation = Pad Optimal
AC Programmable
Omnidirectional
Walking System
Fast Moving
Bi-Fuel Capable
1,500-hp
Drawworks
Variable frequency drive allows for precise computer ICD’s Standardized Fleet is Fit to Service E&P
control during operations. Customers’ Most Complex Plays
Drills faster with less open-hole time, longer bit life,
fewer bit trips and superior wellbore geometry vs.
mechanical or SCR rigs.
• Allows rig to move in any direction quickly between
wellheads.
• Rapidly and efficiently adjusts to misaligned
wellbores, walks over raised well heads and
increases safety.
• Reduces cycle times (i.e. rig-move time between
drilling locations).
• Minimizes truck loads (and times) required for
moves between drilling sites.
• Can change between diesel or nat. gas-diesel mix.
• Can result in major energy cost savings.
• Reduces carbon emissions.
• 1,500-hp drawworks are well-suited to handle the
majority of unconventional resource drilling.
• Preferred horsepower for drilling extended laterals.
Drilling more wells per rig year, while reducing execution risk, allows E&P customers to accelerate cash flows of their most economically impactful investments.
7
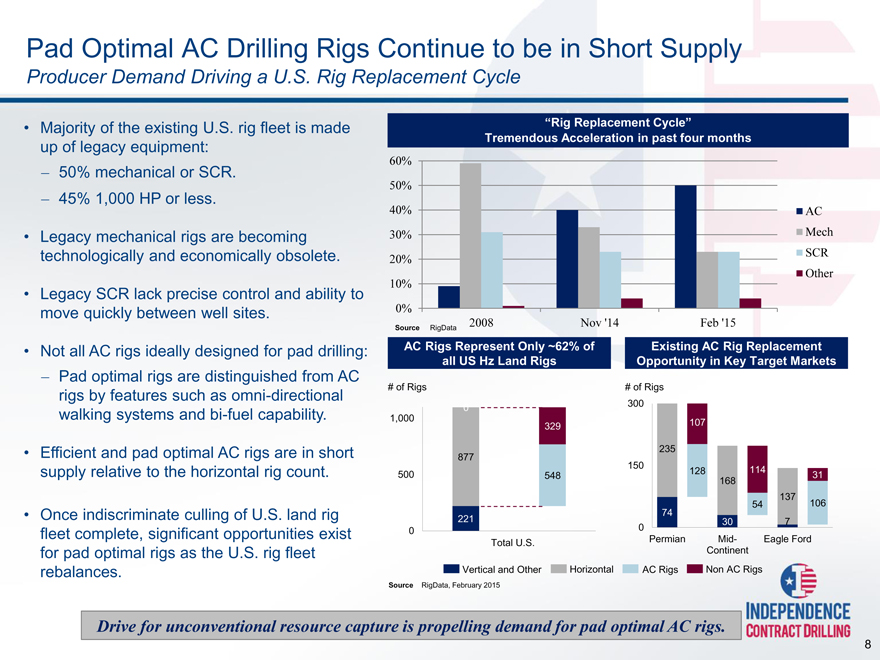
Pad Optimal AC Drilling Rigs Continue to be in Short Supply
Producer Demand Driving a U.S. Rig Replacement Cycle
Majority of the existing U.S. rig fleet is made up of legacy equipment:
50% mechanical or SCR.
45% 1,000 HP or less.
Legacy mechanical rigs are becoming technologically and economically obsolete.
Legacy SCR lack precise control and ability to move quickly between well sites.
Not all AC rigs ideally designed for pad drilling:
Pad optimal rigs are distinguished from AC rigs by features such as omni-directional walking systems and bi-fuel capability.
Efficient and pad optimal AC rigs are in short supply relative to the horizontal rig count.
Once indiscriminate culling of U.S. land rig fleet complete, significant opportunities exist for pad optimal rigs as the U.S. rig fleet rebalances.
“Rig Replacement Cycle”
Tremendous Acceleration in past four months
60%
50%
40% AC
30% Mech
20% SCR
Other
10%
0%
Source RigData 2008 Nov ‘14 Feb ‘15
AC Rigs Represent Only ~62% of Existing AC Rig Replacement
all US Hz Land Rigs Opportunity in Key Target Markets
# of Rigs # of Rigs
0 300
1,000
329 107
235
877
150 128 114
500 548 31
168
137
54 106
74
221 30 7
0 0
Total U.S. Permian Mid- Eagle Ford
Continent
Vertical and Other Horizontal AC Rigs Non AC Rigs
Source RigData, February 2015
Drive for unconventional resource capture is propelling demand for pad optimal AC rigs.
8
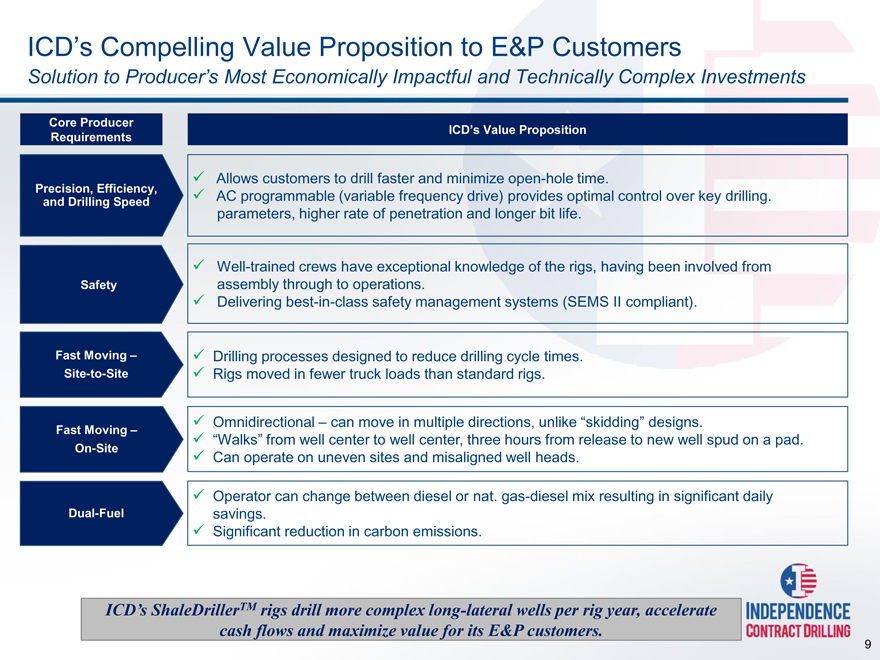
ICD’s Compelling Value Proposition to E&P Customers
Solution to Producer’s Most Economically Impactful and Technically Complex Investments
Core Producer Requirements
Precision, Efficiency, and Drilling Speed
Safety
Fast Moving – Site-to-Site
Fast Moving – On-Site
Dual-Fuel
ICD’s Value Proposition
Allows customers to drill faster and minimize open-hole time.
AC programmable (variable frequency drive) provides optimal control over key drilling. parameters, higher rate of penetration and longer bit life.
Well-trained crews have exceptional knowledge of the rigs, having been involved from assembly through to operations.
Delivering best-in-class safety management systems (SEMS II compliant).
Drilling processes designed to reduce drilling cycle times.
Rigs moved in fewer truck loads than standard rigs.
Omnidirectional – can move in multiple directions, unlike “skidding” designs.
“Walks” from well center to well center, three hours from release to new well spud on a pad.
Can operate on uneven sites and misaligned well heads.
Operator can change between diesel or nat. gas-diesel mix resulting in significant daily savings.
Significant reduction in carbon emissions.
ICD’s ShaleDrillerTM rigs drill more complex long-lateral wells per rig year, accelerate cash flows and maximize value for its E&P customers.
9
Operational Excellence
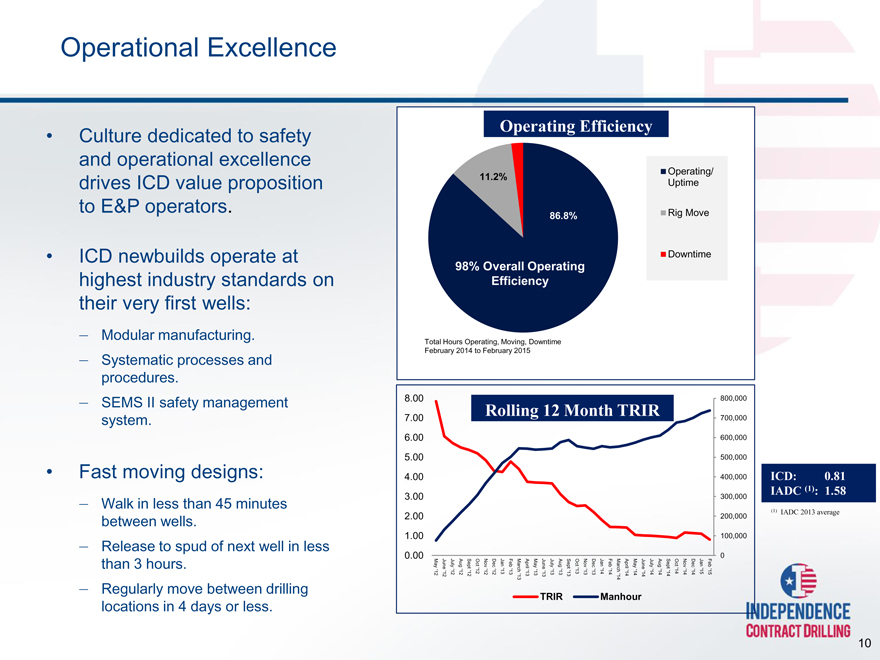
Culture dedicated to safety and operational excellence drives ICD value proposition to E&P operators.
ICD newbuilds operate at highest industry standards on their very first wells:
Modular manufacturing.
Systematic processes and procedures.
SEMS II safety management system.
Fast moving designs:
Walk in less than 45 minutes between wells.
Release to spud of next well in less than 3 hours.
Regularly move between drilling locations in 4 days or less.
Operating Efficiency
11.2% Operating/
Uptime
86.8% Rig Move
Downtime
98% Overall Operating
Efficiency
Total Hours Operating, Moving, Downtime
February 2014 to February 2015
81 58
0 1 average
(1) : 2013
ICD: IADC (1) IADC
800,000 700,000 600,000 500,000 400,000 300,000 200,000 100,000 0
Feb ‘15
Jan ‘15
Dec ‘14
Nov ‘14
Oct ‘14
Sept ‘14
Aug ‘14
July ‘14
June ‘14
May ‘14
TRIR April ‘14
March ‘14
Feb ‘14
Jan ‘14 Manhour
Dec ‘13
Nov ‘13
Oct ‘13
Month Sept ‘13
Aug ‘13
July ‘13
12 June ‘13 TRIR
May ‘13
April ‘13
March ‘13
Feb ‘13
Jan ‘13
Rolling Dec ‘12
Nov ‘12
Oct ‘12
Sept ‘12
Aug ‘12
July ‘12
June ‘12
May ‘12
00 00 00 00 00 00 00 00 00
8 7 6 5 4 3 2 1 0
10
Shaledriller = Enabling Technology
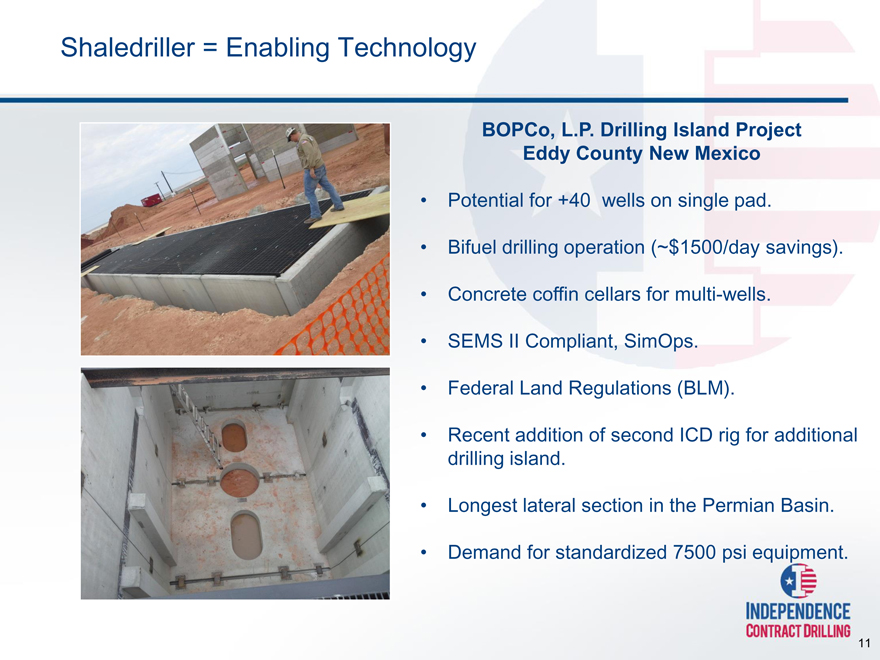
BOPCo, L.P. Drilling Island Project
Eddy County New Mexico
Potential for +40 wells on single pad.
Bifuel drilling operation (~$1500/day savings).
Concrete coffin cellars for multi-wells.
SEMS II Compliant, SimOps.
Federal Land Regulations (BLM).
Recent addition of second ICD rig for additional drilling island.
Longest lateral section in the Permian Basin.
Demand for standardized 7500 psi equipment.
11
Current Market Conditions
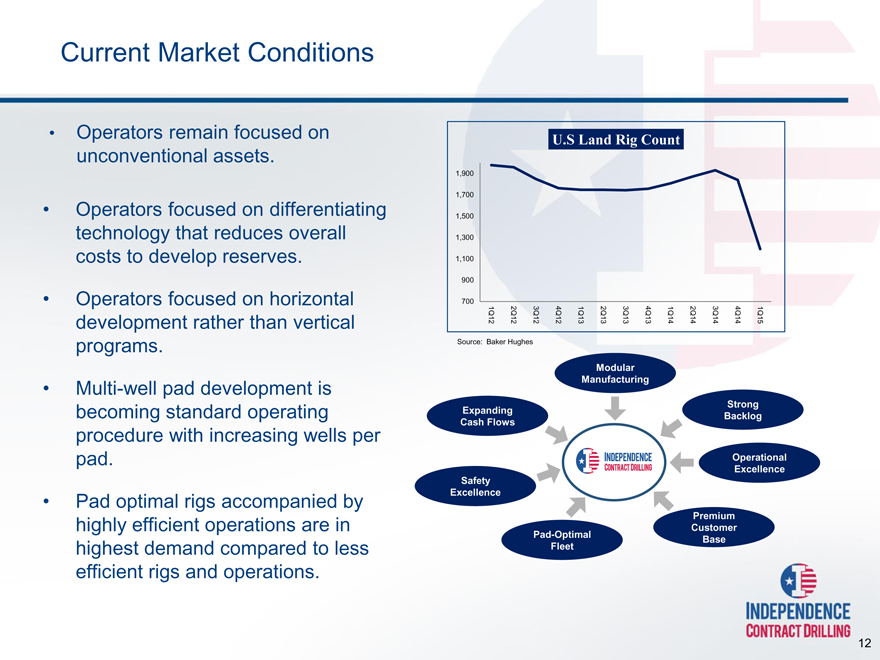
Operators remain focused on unconventional assets.
Operators focused on differentiating technology that reduces overall costs to develop reserves.
Operators focused on horizontal development rather than vertical programs.
Multi-well pad development is becoming standard operating procedure with increasing wells per pad.
Pad optimal rigs accompanied by highly efficient operations are in highest demand compared to less efficient rigs and operations.
U.S Land Rig Count
1,900
1,700
1,500
1,300
1,100
900
700
1Q12 2Q12 3Q12 4Q12 1Q13 2Q13 3Q13 4Q13 1Q14 2Q14 3Q14 4Q14 1Q15
Source: Baker Hughes
Modular
Manufacturing
Strong
Expanding Backlog
Cash Flows
Operational
Excellence
Safety
Excellence
Premium
Customer
Pad-Optimal Base
Fleet
12
Control Over Cost Chain
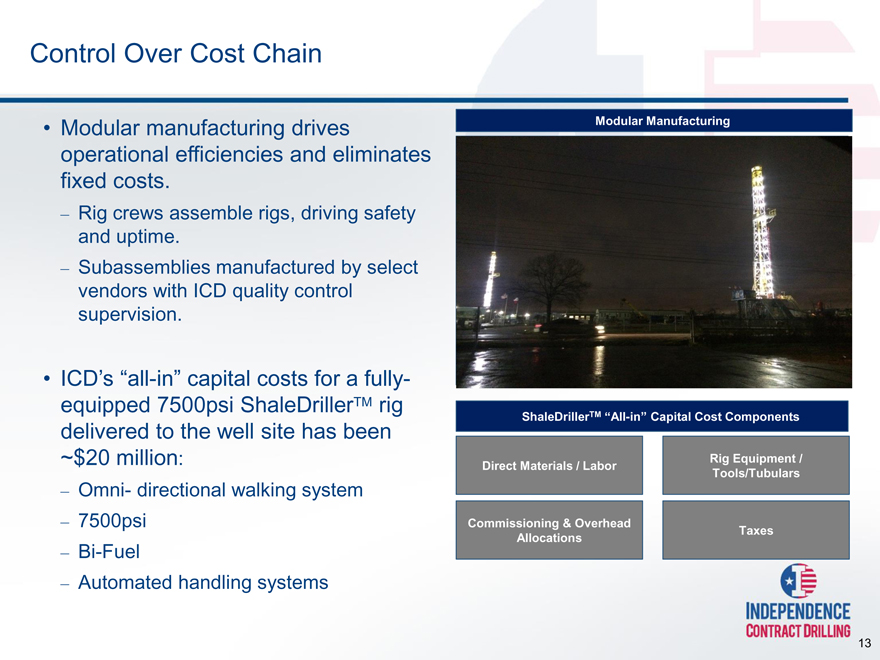
Modular manufacturing drives operational efficiencies and eliminates fixed costs.
Rig crews assemble rigs, driving safety and uptime.
Subassemblies manufactured by select vendors with ICD quality control supervision.
ICD’s “all-in” capital costs for a fully- equipped 7500psi ShaleDrillerTM rig delivered to the well site has been ~$20 million:
Omni- directional walking system
7500psi
Bi-Fuel
Automated handling systems
Modular Manufacturing
ShaleDrillerTM “All-in” Capital Cost Components
Direct Materials / Labor Rig Equipment /
Tools/Tubulars
Commissioning & Overhead
Allocations Taxes
13
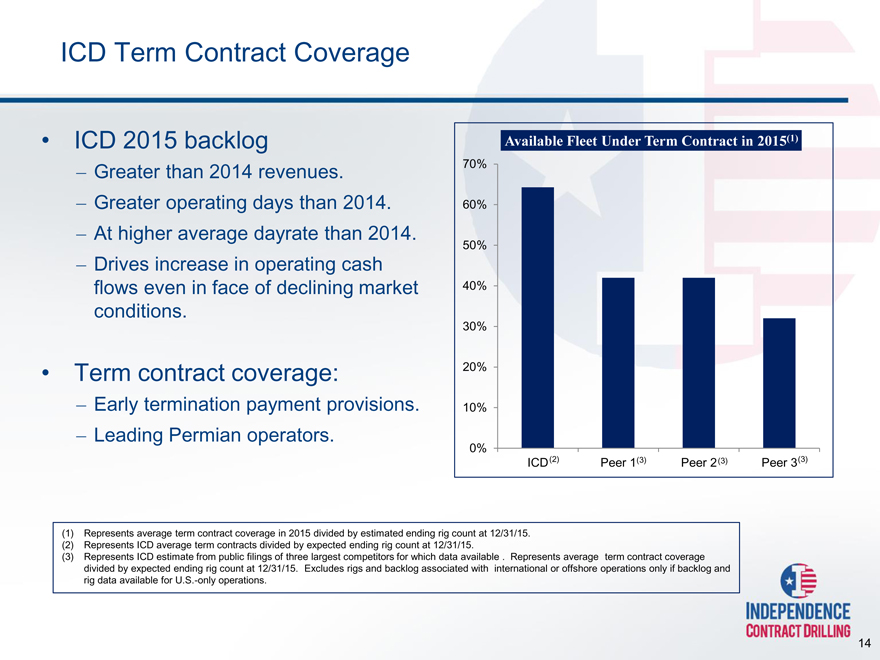
ICD Term Contract Coverage
ICD 2015 backlog
Greater than 2014 revenues.
Greater operating days than 2014.
At higher average dayrate than 2014.
Drives increase in operating cash flows even in face of declining market conditions.
Term contract coverage:
Early termination payment provisions.
Leading Permian operators.
Available Fleet Under Term Contract in 2015(1)
70%
60%
50%
40%
30%
20%
10%
0%
ICD(2)
Peer 1(3)
Peer 2(3)
Peer 3(3)
Represents average term contract coverage in 2015 divided by estimated ending rig count at 12/31/15.
Represents ICD average term contracts divided by expected ending rig count at 12/31/15.
Represents ICD estimate from public filings of three largest competitors for which data available . Represents average term contract coverage divided by expected ending rig count at 12/31/15. Excludes rigs and backlog associated with international or offshore operations only if backlog and rig data available for U.S.-only operations.
14
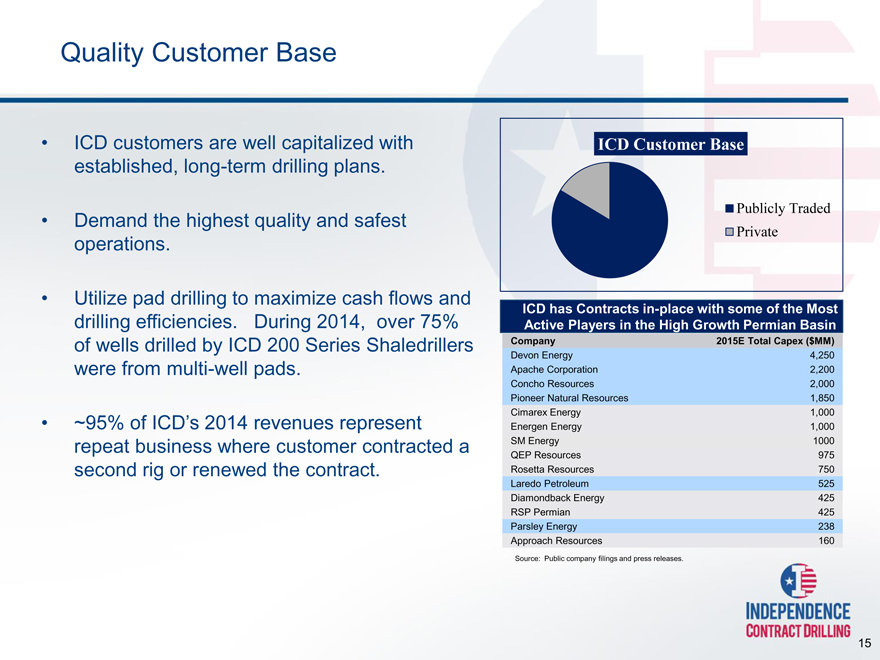
Quality Customer Base
ICD customers are well capitalized with established, long-term drilling plans.
Demand the highest quality and safest operations.
Utilize pad drilling to maximize cash flows and drilling efficiencies. During 2014, over 75% of wells drilled by ICD 200 Series Shaledrillers were from multi-well pads.
~95% of ICD’s 2014 revenues represent repeat business where customer contracted a second rig or renewed the contract.
ICD Customer Base
Publicly Traded
Private
ICD has Contracts in-place with some of the Most Active Players in the High Growth Permian Basin
Company 2015E Total Capex ($MM)
Devon Energy 4,250
Apache Corporation 2,200
Concho Resources 2,000
Pioneer Natural Resources 1,850
Cimarex Energy 1,000
Energen Energy 1,000
SM Energy 1000
QEP Resources 975
Rosetta Resources 750
Laredo Petroleum 525
Diamondback Energy 425
RSP Permian 425
Parsley Energy 238
Approach Resources 160
Source: Public company filings and press releases.
15
ICD is Poised to Deliver Substantial Value to Investors
Large Operators are
Leading
Unconventional
Resource Capture
ShaleDrillerTM Offers a Major Secular Shift in
Compelling Value Unconventional
Proposition to E&P Development is
Customers Underway
Vertically Integrated Ongoing Resource
Land Drilling’s Only
Model Provides a Play Development
Pure-Play, Pad Optimal,
Compounding Capital Driving a Rig
Growth Story
Advantage Replacement Cycle
Major Barriers to Pad Optimal AC Entry Exist for New Drilling Rigs are in Contract Drillers Short Supply
16
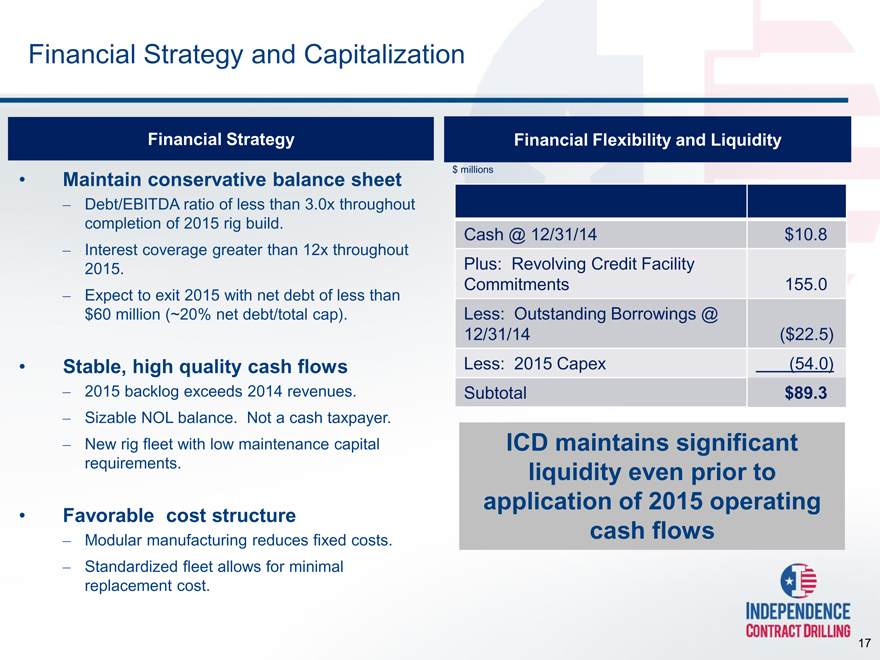
Financial Strategy and Capitalization
Financial Strategy
Maintain conservative balance sheet
Debt/EBITDA ratio of less than 3.0x throughout completion of 2015 rig build.
Interest coverage greater than 12x throughout 2015.
Expect to exit 2015 with net debt of less than $60 million (~20% net debt/total cap).
Stable, high quality cash flows
2015 backlog exceeds 2014 revenues.
Sizable NOL balance. Not a cash taxpayer.
New rig fleet with low maintenance capital requirements.
Favorable cost structure
Modular manufacturing reduces fixed costs.
Standardized fleet allows for minimal replacement cost.
Financial Flexibility and Liquidity
$ millions
Cash @ 12/31/14 $10.8
Plus: Revolving Credit Facility
Commitments 155.0
Less: Outstanding Borrowings @
12/31/14($22.5)
Less: 2015 Capex(54.0)
Subtotal $89.3
ICD maintains significant liquidity even prior to application of 2015 operating cash flows
17
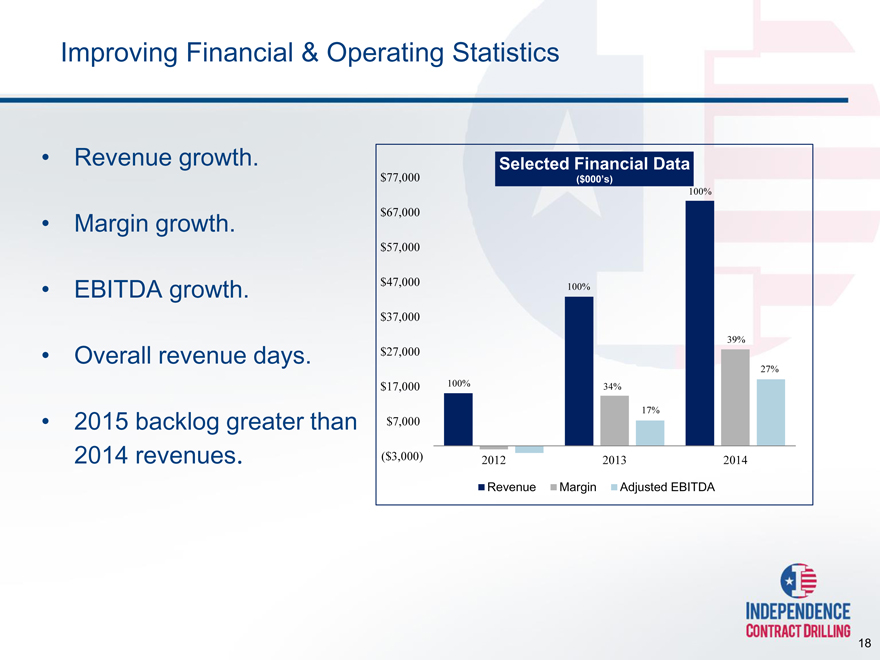
Improving Financial & Operating Statistics
Revenue growth.
Margin growth.
EBITDA growth.
Overall revenue days.
2015 backlog greater than 2014 revenues.
Selected Financial Data
$77,000($000’s)
100%
$67,000
$57,000
$47,000 100%
$37,000
39%
$27,000
27%
$17,000 100% 34%
17%
$7,000
($3,000) 2012 2013 2014
Revenue Margin Adjusted EBITDA
18
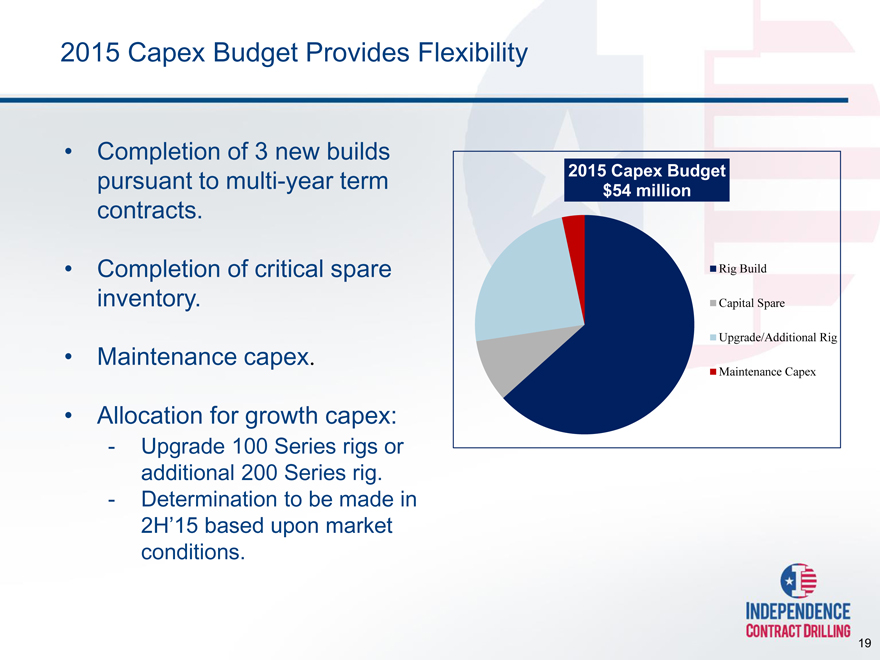
2015 Capex Budget Provides Flexibility
Completion of 3 new builds pursuant to multi-year term contracts.
Completion of critical spare inventory.
Maintenance capex.
Allocation for growth capex:
Upgrade 100 Series rigs or additional 200 Series rig.
Determination to be made in
2H’15 based upon market conditions.
2015 Capex Budget
$54 million
Rig Build
Capital Spare
Upgrade/Additional Rig
Maintenance Capex
19
APPENDICES
20
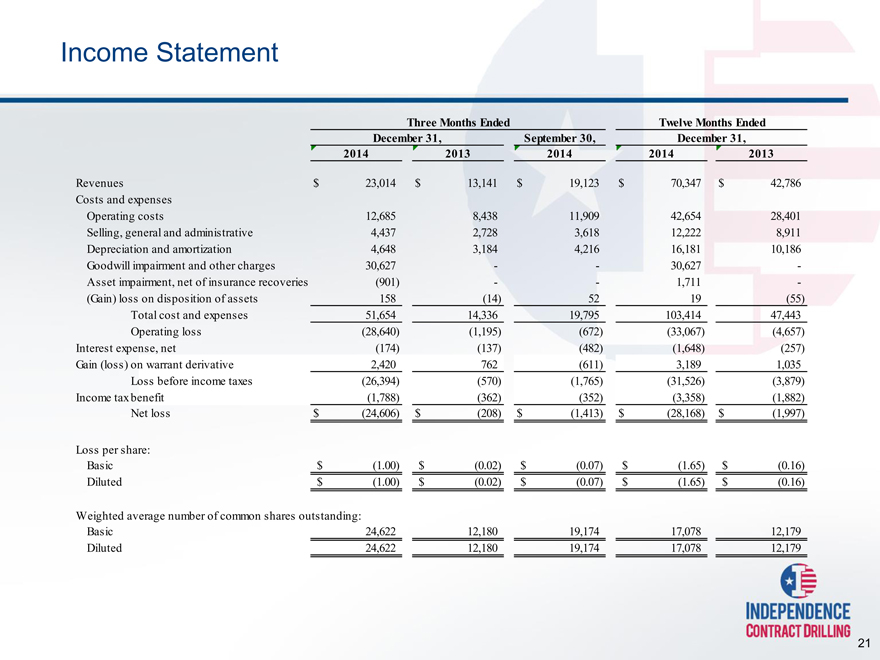
Income Statement
Three Months Ended Twelve Months Ended
December 31, September 30, December 31,
2014 2013 2014 2014 2013
Revenues $ 23,014 $ 13,141 $ 19,123 $ 70,347 $ 42,786
Costs and expenses
Operating costs 12,685 8,438 11,909 42,654 28,401
Selling, general and administrative 4,437 2,728 3,618 12,222 8,911
Depreciation and amortization 4,648 3,184 4,216 16,181 10,186
Goodwill impairment and other charges 30,627 — 30,627 -
Asset impairment, net of insurance recoveries(901) — 1,711 -
(Gain) loss on disposition of assets 158(14) 52 19(55)
Total cost and expenses 51,654 14,336 19,795 103,414 47,443
Operating loss(28,640)(1,195)(672)(33,067)(4,657)
Interest expense, net(174)(137)(482)(1,648)(257)
Gain (loss) on warrant derivative 2,420 762(611) 3,189 1,035
Loss before income taxes(26,394)(570)(1,765)(31,526)(3,879)
Income tax benefit(1,788)(362)(352)(3,358)(1,882)
Net loss $(24,606) $(208) $(1,413) $(28,168) $(1,997)
Loss per share:
Basic $(1.00) $(0.02) $(0.07) $(1.65) $(0.16)
Diluted $(1.00) $(0.02) $(0.07) $(1.65) $(0.16)
Weighted average number of common shares outstanding:
Basic 24,622 12,180 19,174 17,078 12,179
Diluted 24,622 12,180 19,174 17,078 12,179
21
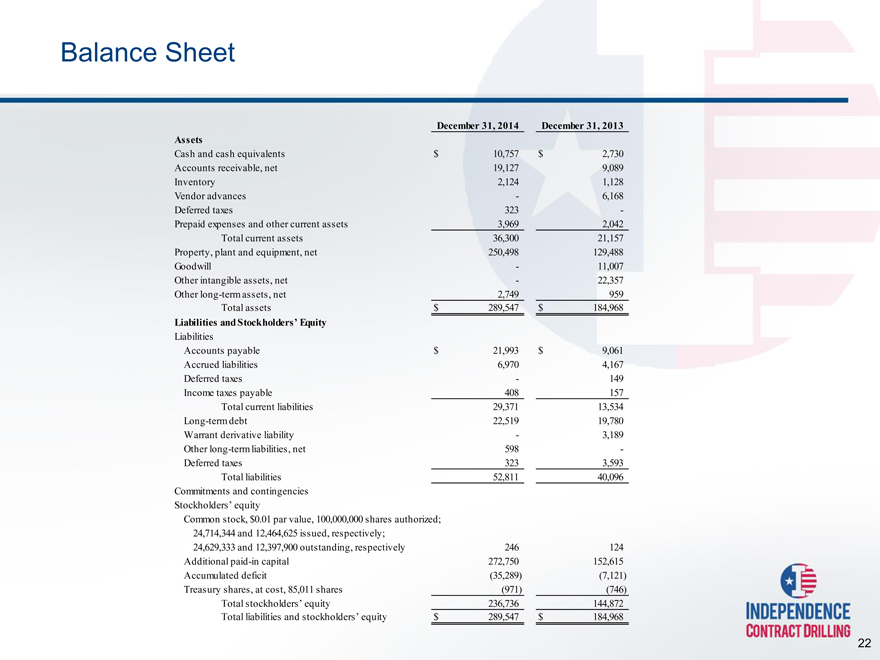
Balance Sheet
December 31, 2014 December 31, 2013
Assets
Cash and cash equivalents $ 10,757 $ 2,730
Accounts receivable, net 19,127 9,089
Inventory 2,124 1,128
Vendor advances—6,168
Deferred taxes 323 -
Prepaid expenses and other current assets 3,969 2,042
Total current assets 36,300 21,157
Property, plant and equipment, net 250,498 129,488
Goodwill—11,007
Other intangible assets, net—22,357
Other long-term assets, net 2,749 959
Total assets $ 289,547 $ 184,968
Liabilities and Stockholders’ Equity
Liabilities
Accounts payable $ 21,993 $ 9,061
Accrued liabilities 6,970 4,167
Deferred taxes—149
Income taxes payable 408 157
Total current liabilities 29,371 13,534
Long-term debt 22,519 19,780
Warrant derivative liability—3,189
Other long-term liabilities, net 598 -
Deferred taxes 323 3,593
Total liabilities 52,811 40,096
Commitments and contingencies
Stockholders’ equity
Common stock, $0.01 par value, 100,000,000 shares authorized;
24,714,344 and 12,464,625 issued, respectively;
24,629,333 and 12,397,900 outstanding, respectively 246 124
Additional paid-in capital 272,750 152,615
Accumulated deficit(35,289)(7,121)
Treasury shares, at cost, 85,011 shares(971)(746)
Total stockholders’ equity 236,736 144,872
Total liabilities and stockholders’ equity $ 289,547 $ 184,968
22
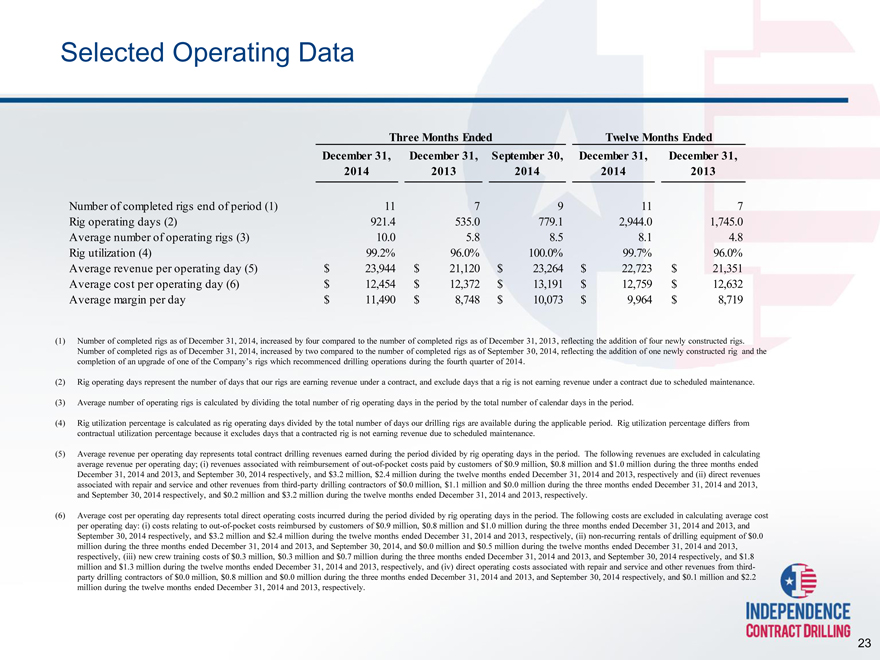
Selected Operating Data
Three Months Ended Twelve Months Ended
December 31, December 31, September 30, December 31, December 31,
2014 2013 2014 2014 2013
Number of completed rigs end of period (1) 11 7 9 11 7
Rig operating days (2) 921.4 535.0 779.1 2,944.0 1,745.0
Average number of operating rigs (3) 10.0 5.8 8.5 8.1 4.8
Rig utilization (4) 99.2% 96.0% 100.0% 99.7% 96.0%
Average revenue per operating day (5) $ 23,944 $ 21,120 $ 23,264 $ 22,723 $ 21,351
Average cost per operating day (6) $ 12,454 $ 12,372 $ 13,191 $ 12,759 $ 12,632
Average margin per day $ 11,490 $ 8,748 $ 10,073 $ 9,964 $ 8,719
Number of completed rigs as of December 31, 2014, increased by four compared to the number of completed rigs as of December 31, 2013, reflecting the addition of four newly constructed rigs. Number of completed rigs as of December 31, 2014, increased by two compared to the number of completed rigs as of September 30, 2014, reflecting the addition of one newly constructed rig and the completion of an upgrade of one of the Company’s rigs which recommenced drilling operations during the fourth quarter of 2014.
Rig operating days represent the number of days that our rigs are earning revenue under a contract, and exclude days that a rig is not earning revenue under a contract due to scheduled maintenance.
Average number of operating rigs is calculated by dividing the total number of rig operating days in the period by the total number of calendar days in the period.
Rig utilization percentage is calculated as rig operating days divided by the total number of days our drilling rigs are available during the applicable period. Rig utilization percentage differs from contractual utilization percentage because it excludes days that a contracted rig is not earning revenue due to scheduled maintenance.
Average revenue per operating day represents total contract drilling revenues earned during the period divided by rig operating days in the period. The following revenues are excluded in calculating average revenue per operating day; (i) revenues associated with reimbursement of out-of-pocket costs paid by customers of $0.9 million, $0.8 million and $1.0 million during the three months ended December 31, 2014 and 2013, and September 30, 2014 respectively, and $3.2 million, $2.4 million during the twelve months ended December 31, 2014 and 2013, respectively and (ii) direct revenues associated with repair and service and other revenues from third-party drilling contractors of $0.0 million, $1.1 million and $0.0 million during the three months ended December 31, 2014 and 2013, and September 30, 2014 respectively, and $0.2 million and $3.2 million during the twelve months ended December 31, 2014 and 2013, respectively.
Average cost per operating day represents total direct operating costs incurred during the period divided by rig operating days in the period. The following costs are excluded in calculating average cost per operating day: (i) costs relating to out-of-pocket costs reimbursed by customers of $0.9 million, $0.8 million and $1.0 million during the three months ended December 31, 2014 and 2013, and September 30, 2014 respectively, and $3.2 million and $2.4 million during the twelve months ended December 31, 2014 and 2013, respectively, (ii) non-recurring rentals of drilling equipment of $0.0 million during the three months ended December 31, 2014 and 2013, and September 30, 2014, and $0.0 million and $0.5 million during the twelve months ended December 31, 2014 and 2013, respectively, (iii) new crew training costs of $0.3 million, $0.3 million and $0.7 million during the three months ended December 31, 2014 and 2013, and September 30, 2014 respectively, and $1.8 million and $1.3 million during the twelve months ended December 31, 2014 and 2013, respectively, and (iv) direct operating costs associated with repair and service and other revenues from third- party drilling contractors of $0.0 million, $0.8 million and $0.0 million during the three months ended December 31, 2014 and 2013, and September 30, 2014 respectively, and $0.1 million and $2.2 million during the twelve months ended December 31, 2014 and 2013, respectively.
23
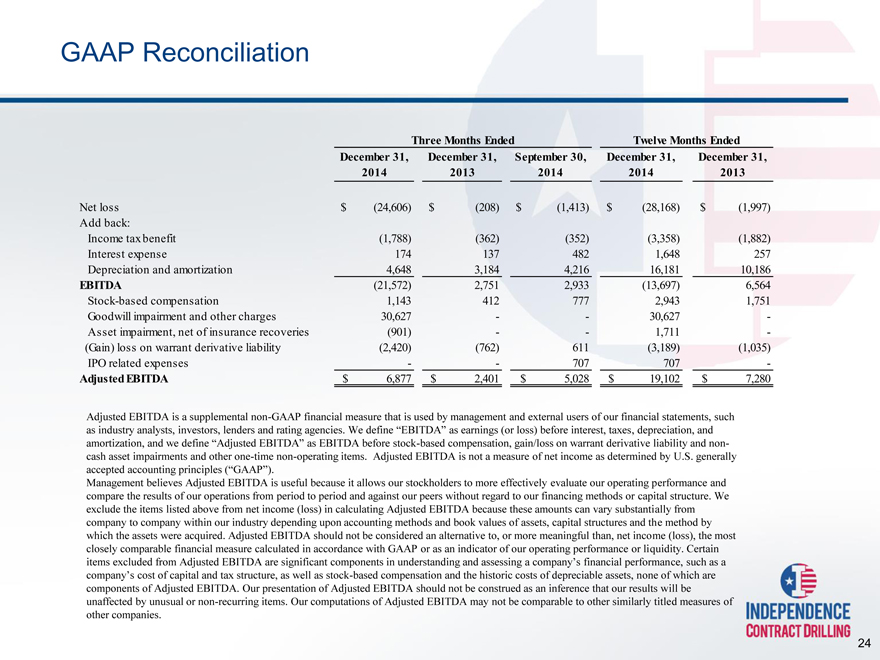
GAAP Reconciliation
Three Months Ended Twelve Months Ended
December 31, December 31, September 30, December 31, December 31,
2014 2013 2014 2014 2013
Net loss $(24,606) $(208) $(1,413) $(28,168) $(1,997)
Add back:
Income tax benefit(1,788)(362)(352)(3,358)(1,882)
Interest expense 174 137 482 1,648 257
Depreciation and amortization 4,648 3,184 4,216 16,181 10,186
EBITDA(21,572) 2,751 2,933(13,697) 6,564
Stock-based compensation 1,143 412 777 2,943 1,751
Goodwill impairment and other charges 30,627 — 30,627 -
Asset impairment, net of insurance recoveries(901) — 1,711 -
(Gain) loss on warrant derivative liability(2,420)(762) 611(3,189)(1,035)
IPO related expenses — 707 707 -
Adjusted EBITDA $ 6,877 $ 2,401 $ 5,028 $ 19,102 $ 7,280
Adjusted EBITDA is a supplemental non-GAAP financial measure that is used by management and external users of our financial statements, such as industry analysts, investors, lenders and rating agencies. We define “EBITDA” as earnings (or loss) before interest, taxes, depreciation, and amortization, and we define “Adjusted EBITDA” as EBITDA before stock-based compensation, gain/loss on warrant derivative liability and non-cash asset impairments and other one-time non-operating items. Adjusted EBITDA is not a measure of net income as determined by U.S. generally accepted accounting principles (“GAAP”).
Management believes Adjusted EBITDA is useful because it allows our stockholders to more effectively evaluate our operating performance and compare the results of our operations from period to period and against our peers without regard to our financing methods or capital structure. We exclude the items listed above from net income (loss) in calculating Adjusted EBITDA because these amounts can vary substantially from company to company within our industry depending upon accounting methods and book values of assets, capital structures and the method by which the assets were acquired. Adjusted EBITDA should not be considered an alternative to, or more meaningful than, net income (loss), the most closely comparable financial measure calculated in accordance with GAAP or as an indicator of our operating performance or liquidity. Certain items excluded from Adjusted EBITDA are significant components in understanding and assessing a company’s financial performance, such as a company’s cost of capital and tax structure, as well as stock-based compensation and the historic costs of depreciable assets, none of which are components of Adjusted EBITDA. Our presentation of Adjusted EBITDA should not be construed as an inference that our results will be unaffected by unusual or non-recurring items. Our computations of Adjusted EBITDA may not be comparable to other similarly titled measures of other companies.
24
[Graphic Appears Here]
[Graphic Appears Here]