
2019 RBC Capital Markets Global Energy and Power Conference June 4-5, 2019 www.icdrilling.com
Preliminary Matters Various statements contained in this presentation, including those that express a belief, expectation or intention, as well as those that are not statements of historical fact, are forward-looking statements. These forward-looking statements may include projections and estimates concerning the timing and success of specific projects and our future revenues, income and capital spending. Our forward-looking statements are generally accompanied by words such as “estimate,”“project,”“predict,”“believe,”“expect,”“anticipate,”“potential,”“plan,”“goal,”“will” or other words that convey the uncertainty of future events or outcomes. The forward-looking statements in this presentation speak only as of the date of this presentation; we disclaim any obligation to update these statements unless required by law, and we caution you not to rely on them unduly. We have based these forward-looking statements on our current expectations and assumptions about future events. While our management considers these expectations and assumptions to be reasonable, they are inherently subject to significant business, economic, competitive, regulatory and other risks, contingencies and uncertainties, most of which are difficult to predict and many of which are beyond our control. These and other important factors, including those discussed under “Risk Factors” and “Management’s Discussion and Analysis of Financial Condition and Results of Operations” included in the Company’s filings with the Securities and Exchange Commission, including the Company’s Annual Report on Form 10-K, may cause our actual results, performance or achievements to differ materially from any future results, performance or achievements expressed or implied by these forward-looking statements. These risks, contingencies and uncertainties include, but are not limited to, the following: • a decline in or substantial volatility of crude oil and natural gas commodity prices; • a sustained decrease in domestic spending by the oil and natural gas exploration and production industry; • our inability to implement our business and growth strategy, including plans to upgrade and convert SCR rigs acquired in the Sidewinder Drilling LLC combination; • fluctuation of our operating results and volatility of our industry; • inability to maintain or increase pricing on our contract drilling services, or early termination of any term contract for which early termination compensation is not paid; • our backlog of term contracts declining rapidly; • the loss of customers, financial distress or management changes of potential customers or failure to obtain contract renewals and additional customer contracts for our drilling services; • an increase in interest rates and deterioration in the credit markets; • our inability to raise sufficient funds through debt financing and equity issuances needed to fund future rig construction projects; • additional leverage associated with borrowings; • our inability to comply with the financial and other covenants in debt agreements that we may enter into as a result of reduced revenues and financial performance; • overcapacity and competition in our industry; unanticipated costs, delays and other difficulties in executing our long-term growth strategy; • the loss of key management personnel; • new technology that may cause our drilling methods or equipment to become less competitive; • labor costs or shortages of skilled workers; • the loss of or interruption in operations of one or more key vendors; • the effect of operating hazards and severe weather on our rigs, facilities, business, operations and financial results, and limitations on our insurance coverage; • increased regulation of drilling in unconventional formations; • the incurrence of significant costs and liabilities in the future resulting from our failure to comply with new or existing environmental regulations or an accidental release of hazardous substances into the environment; and • the potential failure by us to establish and maintain effective internal control over financial reporting. All forward-looking statements are necessarily only estimates of future results, and there can be no assurance that actual results will not differ materially from expectations, and, therefore, you are cautioned not to place undue reliance on such statements. Any forward-looking statements are qualified in their entirety by reference to the factors discussed throughout this presentation and in the Company’s filings with the Securities and Exchange Commission, including the Company’s Annual Report on Form 10-K. Further, any forward-looking statement speaks only as of the date of this presentation, and we undertake no obligation to update any forward-looking statement to reflect events or circumstances after the date on which the statement is made or to reflect the occurrence of unanticipated events. Adjusted Net Income or Loss, EBITDA and adjusted EBITDA are supplemental non-GAAP financial measures that are used by management and external users of the Company’s financial statements, such as industry analysts, investors, lenders and rating agencies. The Company’s management believes adjusted Net Income or Loss, EBITDA and adjusted EBITDA are useful because such measures allow the Company and its stockholders to more effectively evaluate its operating performance and compare the results of its operations from period to period and against its peers without regard to its financing methods or capital structure. See non-GAAP financial measures at the end of this presentation for a full reconciliation of Net Income or Loss to adjusted Net Income or Loss, EBITDA and adjusted EBITDA. 2

Investment Thesis Sectors only pure-play, pad-optimal growth story focused solely on North America’s most attractive oil and gas basins • Sidewinder strategic combination more than doubled fleet size by Scale, combining complementary assets in core markets, driving step-change Asset Quality, improvements in operational and financial scale Growth • Meaningful high-return organic growth opportunities executable within free cash flow • Focus on most attractive operating basins supported by high-quality Attractive Presence in customer base Lower 48’s Most • Majority of rigs in Permian with additional meaningful presence in Attractive Basins Haynesville (East Texas / North Louisiana) • Meaningful growth in earnings and free cash flow per share from existing Free Cash Flow rig fleet; newbuild rigs and economics no longer necessary for earnings Generation Across Oil and free cash flow growth and Gas Drilling Cycles • Strategic combination synergies drives more efficient overhead structure • Tax advantaged: NOL’s plus full step-up in Sidewinder assets • 1Q’19 Net Debt / Adjusted EBITDA < 2X; Net Debt / Total Cap: 23.6% Strong Balance Sheet, • No maturities until October 2023 Financial Flexibility and • Flexible debt structure: pre-payable/re-financeable at any time, minimal Liquidity financial covenants 3
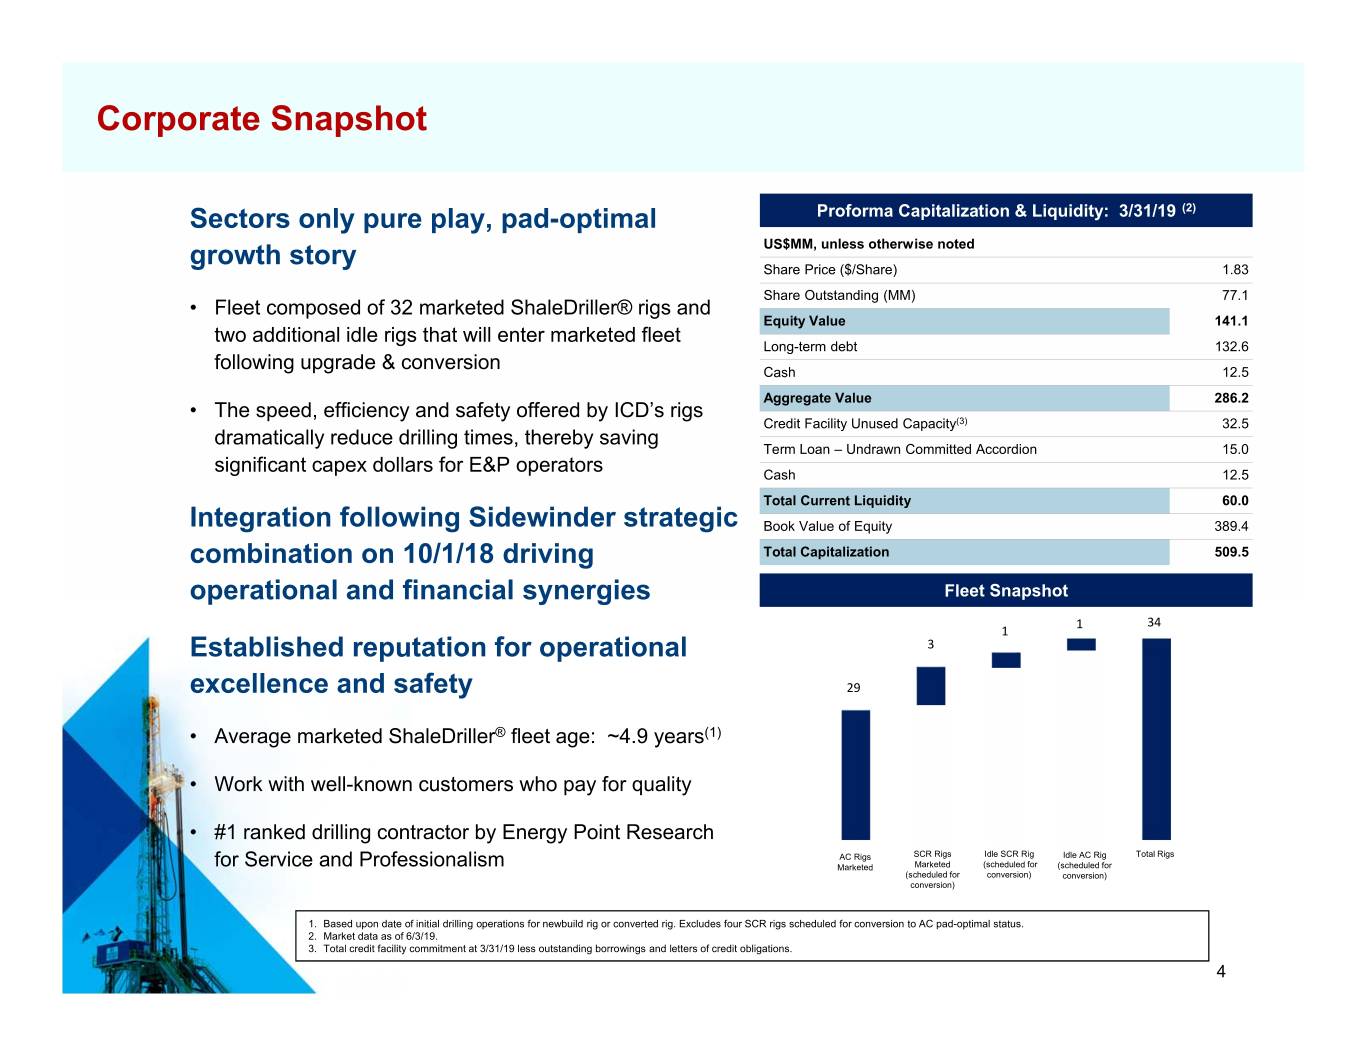
Corporate Snapshot (2) Sectors only pure play, pad-optimal Proforma Capitalization & Liquidity: 3/31/19 US$MM, unless otherwise noted growth story Share Price ($/Share) 1.83 Share Outstanding (MM) 77.1 • Fleet composed of 32 marketed ShaleDriller® rigs and Equity Value 141.1 two additional idle rigs that will enter marketed fleet Long-term debt 132.6 following upgrade & conversion Cash 12.5 • The speed, efficiency and safety offered by ICD’s rigs Aggregate Value 286.2 Credit Facility Unused Capacity(3) 32.5 dramatically reduce drilling times, thereby saving Term Loan – Undrawn Committed Accordion 15.0 significant capex dollars for E&P operators Cash 12.5 Total Current Liquidity 60.0 Integration following Sidewinder strategic Book Value of Equity 389.4 combination on 10/1/18 driving Total Capitalization 509.5 operational and financial synergies Fleet Snapshot 1 34 1 Established reputation for operational 3 excellence and safety 29 • Average marketed ShaleDriller® fleet age: ~4.9 years(1) • Work with well-known customers who pay for quality • #1 ranked drilling contractor by Energy Point Research AC Rigs SCR Rigs Idle SCR Rig Idle AC Rig Total Rigs for Service and Professionalism Marketed Marketed (scheduled for (scheduled for (scheduled for conversion) conversion) conversion) 1. Based upon date of initial drilling operations for newbuild rig or converted rig. Excludes four SCR rigs scheduled for conversion to AC pad-optimal status. 2. Market data as of 6/3/19. 3. Total credit facility commitment at 3/31/19 less outstanding borrowings and letters of credit obligations. 4
2Q’19 Update • ICD continues to successfully recontract rigs, executing extensions or new contracts during 2Q’19 for ten rigs, with durations ranging up to one year for five contract renewals • ICD in the process of completing one budgeted 300 series conversion, with the rig re-entering the marketed fleet mid 3Q’19 • ICD accelerated commencement of first budgeted SCR conversion into 2Q’19; rig relocated to ICD premises in late May 2Q’19 and expected to re-enter to marketed fleet late 3Q’19 • Second budgeted SCR conversion scheduled to begin early 3Q’19, with rig re-entering the marketed fleet 4Q’19 5 5
2Q’19 Update Continued • Utilization issues associated with customer budget and commodity price uncertainty continue during 2Q’19 and are expected to continue through at least 3Q’19 • ICD 2Q’19 rig utilization of marketed rigs expected to be approximately 87%(1), with decline from prior guidance principally associated with: - Delay of expected customer projects to 4Q’19 - One rig placed on standby during 2Q’19 for approximately 65 days, with the rig scheduled to resume operations in June 2019 - Acceleration of commencement of first SCR conversion into 2Q’19 (1) Expected 2Q’19 Rig utilization calculated using 2,410 revenue days based upon a marketed rig fleet of 32 rigs, excluding one rig undergoing 300 series upgrade that will not re-enter the marketed fleet until 3Q’19 and one rig that was removed from the marketed fleet mid-2Q’19 while it undergoes a budgeted conversion from SCR to AC pad-optimal specifications. 6 6

ICD Today: Nothing has Changed but Everything is Different Post combination, ICD’s strategic focus and operational priorities remain unchanged, but our ability to generate free cash flow and investor returns increased dramatically Pre Combination Post Combination Asset Quality • Pad-Optimal rig fleet & Geographic • Texas & contiguous states weighted SAME Focus towards Permian/Haynesville Operational • Safety & Operational Excellence SAME Priorities • 34 Rig Fleet • $250M+ revenues, more aligned • 15 rig fleet overhead structure Operational & • $100M+ revenues, misaligned • 14 “300” Series rigs; 19 “200” Financial overhead structure Scale Series rigs; One “100” Series rig • 15 “200” Series rigs • Increased exposure to Super Majors • High-return focused / free cash flow growth through organic Free Cash • Subscale size drove disproportionate opportunities - Newbuild Flow / High weighting to rig fleet growth over economics and fleet growth not Returns returns and free cash flow Focus necessary to drive incremental returns and free cash flow 7 7
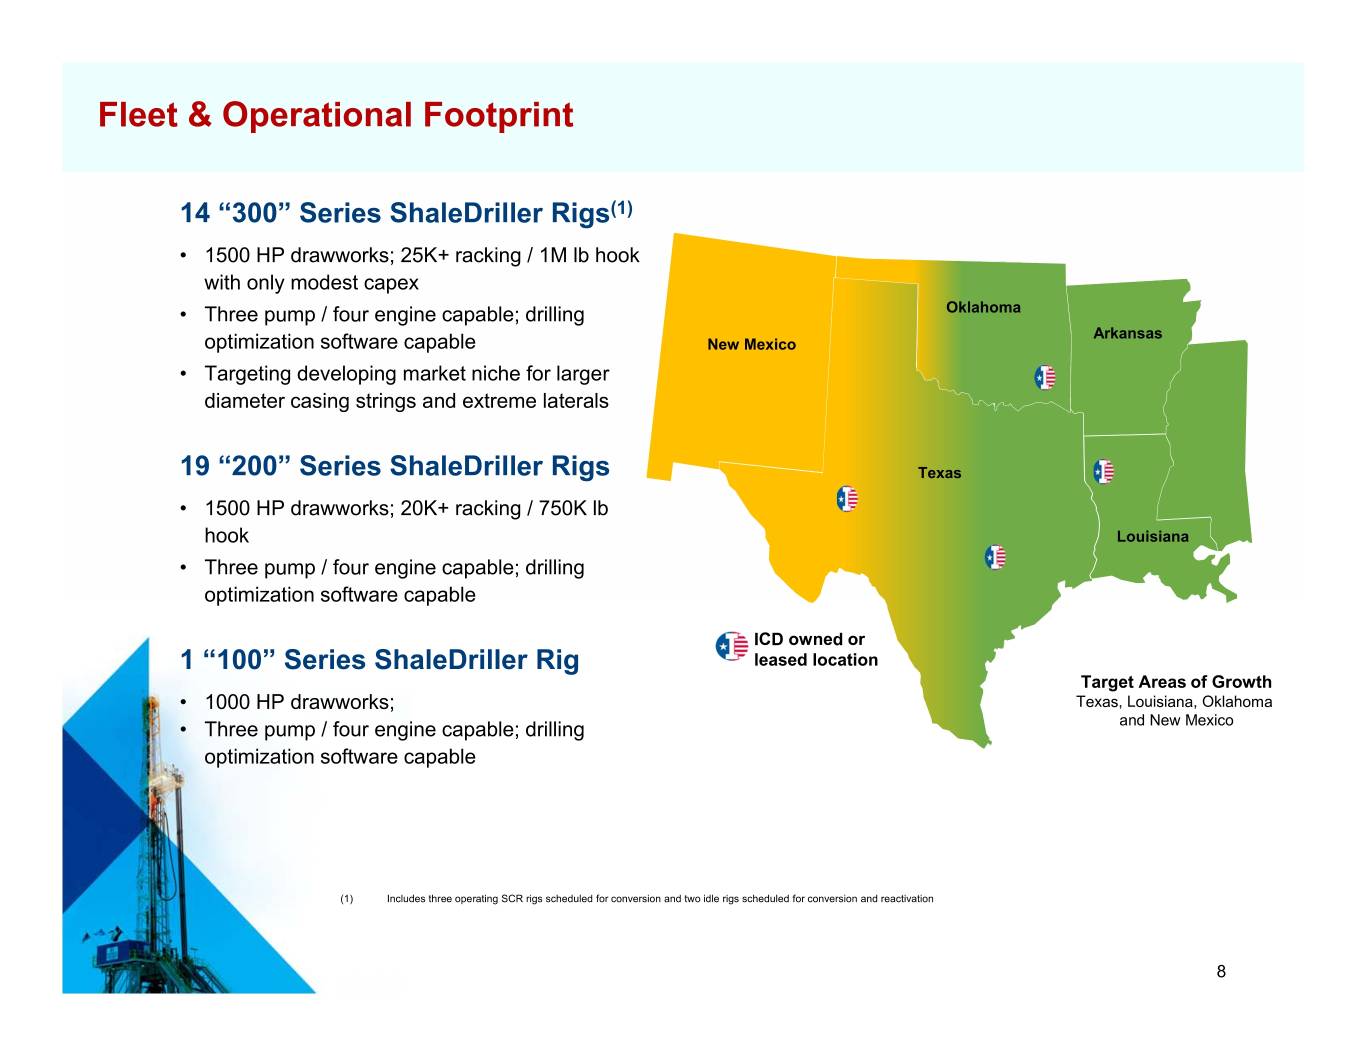
Fleet & Operational Footprint 14 “300” Series ShaleDriller Rigs(1) • 1500 HP drawworks; 25K+ racking / 1M lb hook with only modest capex • Three pump / four engine capable; drilling Oklahoma Arkansas optimization software capable New Mexico • Targeting developing market niche for larger diameter casing strings and extreme laterals 19 “200” Series ShaleDriller Rigs Texas • 1500 HP drawworks; 20K+ racking / 750K lb hook Louisiana • Three pump / four engine capable; drilling optimization software capable ICD owned or 1 “100” Series ShaleDriller Rig leased location Target Areas of Growth • 1000 HP drawworks; Texas, Louisiana, Oklahoma • Three pump / four engine capable; drilling and New Mexico optimization software capable (1) Includes three operating SCR rigs scheduled for conversion and two idle rigs scheduled for conversion and reactivation 8 8
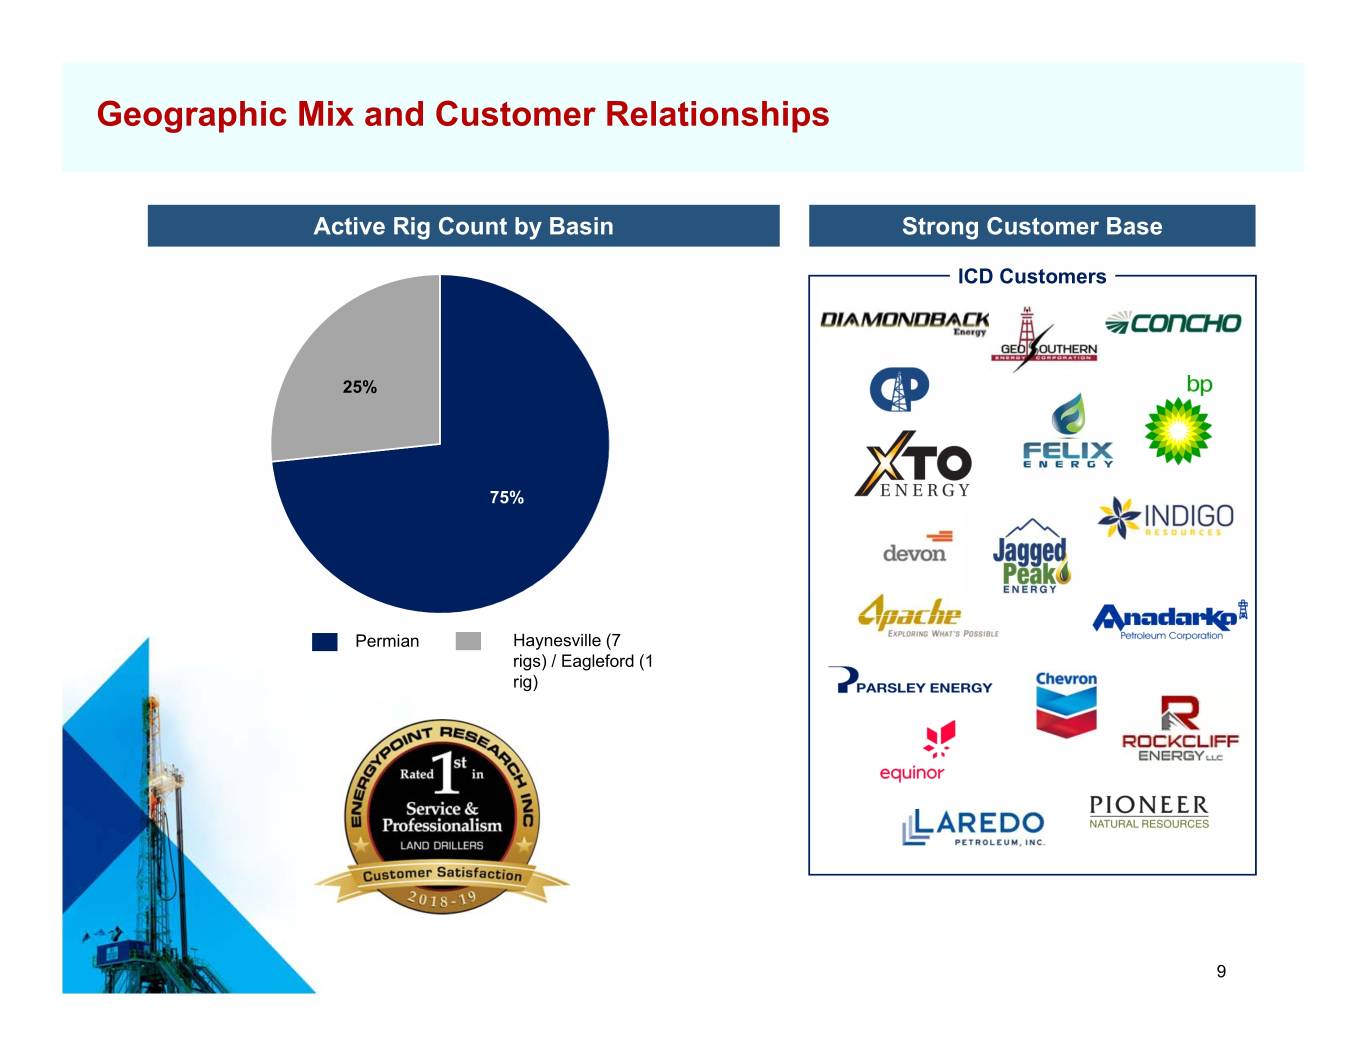
Geographic Mix and Customer Relationships Active Rig Count by Basin Strong Customer Base ICD Customers 25% 75% Permian Haynesville (7 rigs) / Eagleford (1 rig) 9
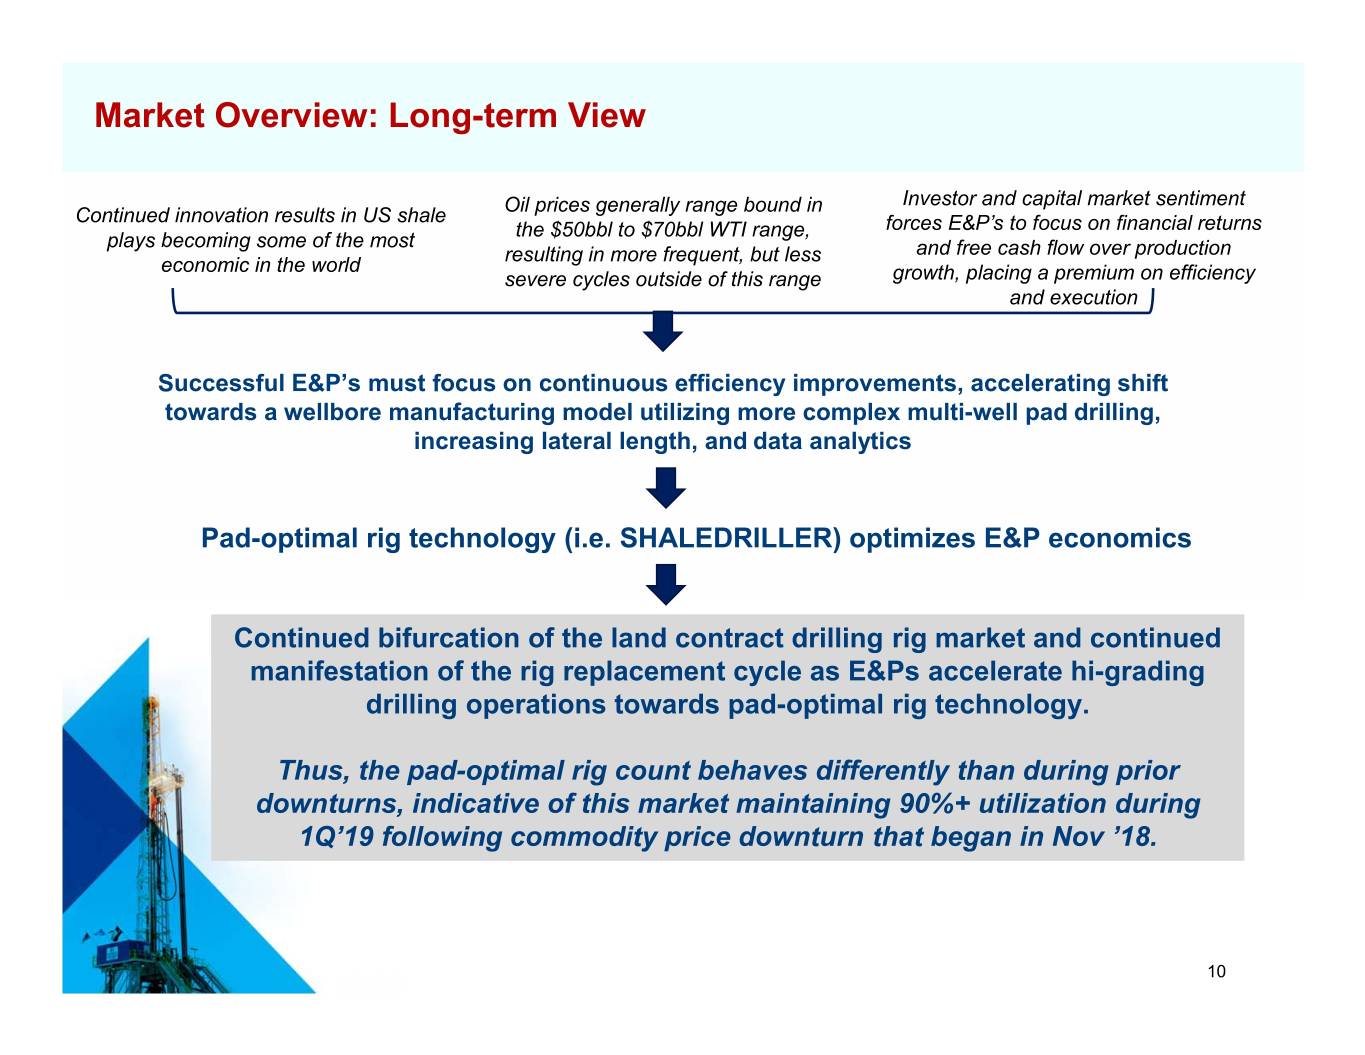
Market Overview: Long-term View Oil prices generally range bound in Investor and capital market sentiment Continued innovation results in US shale the $50bbl to $70bbl WTI range, forces E&P’s to focus on financial returns plays becoming some of the most resulting in more frequent, but less and free cash flow over production economic in the world severe cycles outside of this range growth, placing a premium on efficiency and execution Successful E&P’s must focus on continuous efficiency improvements, accelerating shift towards a wellbore manufacturing model utilizing more complex multi-well pad drilling, increasing lateral length, and data analytics Pad-optimal rig technology (i.e. SHALEDRILLER) optimizes E&P economics Continued bifurcation of the land contract drilling rig market and continued manifestation of the rig replacement cycle as E&Ps accelerate hi-grading drilling operations towards pad-optimal rig technology. Thus, the pad-optimal rig count behaves differently than during prior downturns, indicative of this market maintaining 90%+ utilization during 1Q’19 following commodity price downturn that began in Nov ’18. 10 10
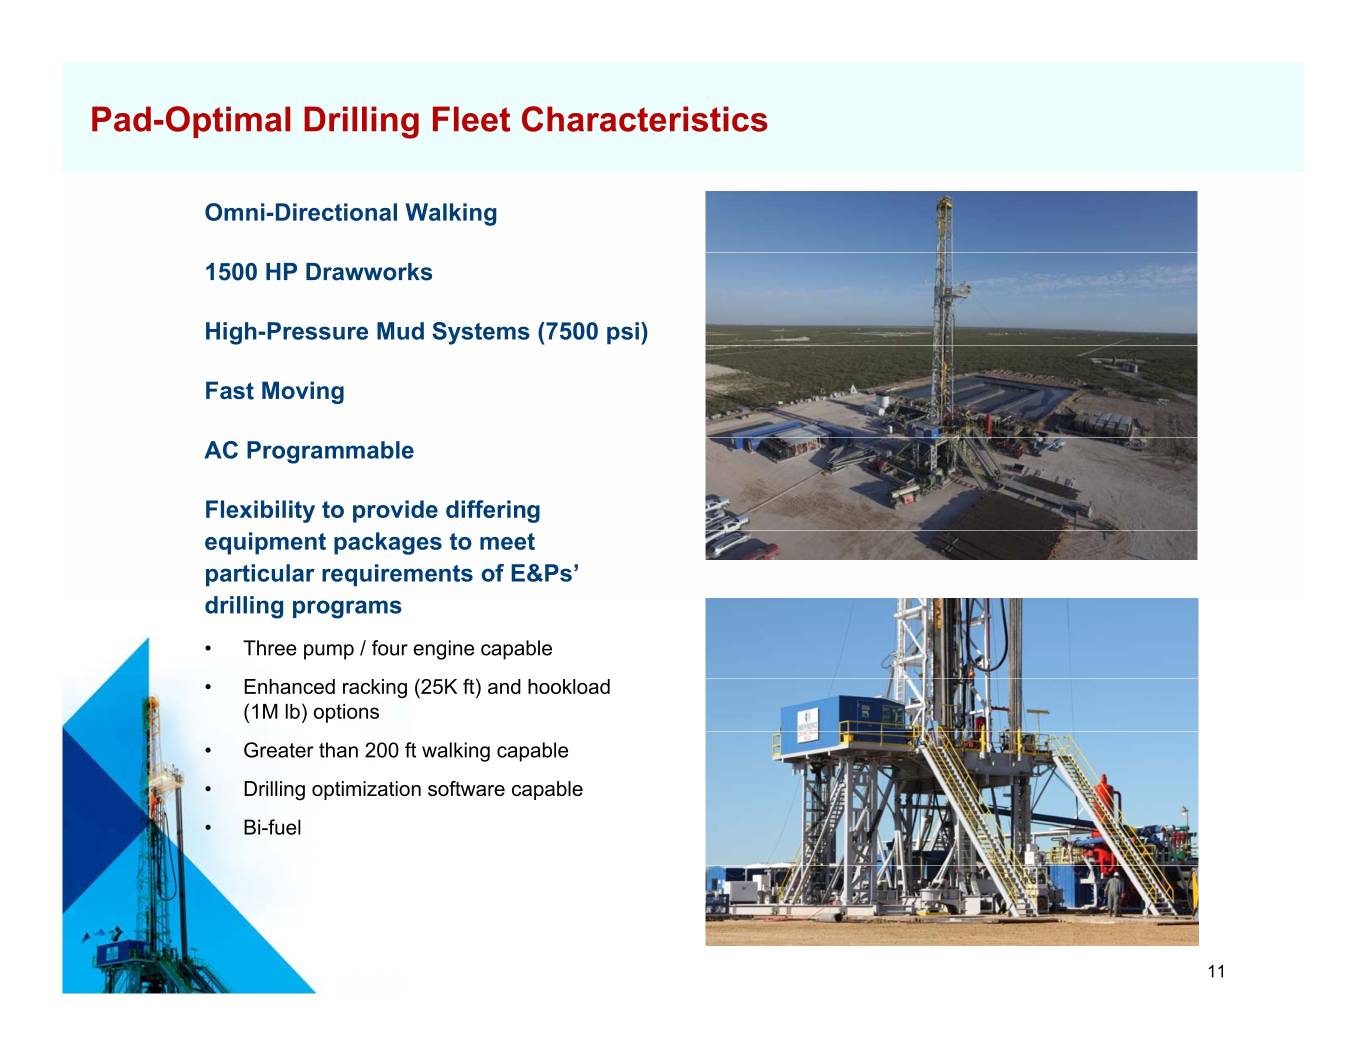
Pad-Optimal Drilling Fleet Characteristics Omni-Directional Walking 1500 HP Drawworks High-Pressure Mud Systems (7500 psi) Fast Moving AC Programmable Flexibility to provide differing equipment packages to meet particular requirements of E&Ps’ drilling programs • Three pump / four engine capable • Enhanced racking (25K ft) and hookload (1M lb) options • Greater than 200 ft walking capable • Drilling optimization software capable • Bi-fuel 11

Meaningful Player in Consolidating Pad-Optimal Market Market Share – ICD Target Markets – TX & 1,200 Operating Rigs(1) Contiguous States Operating Rigs – Pad-Optimal & Upgradeable (1)(2) 1,000 800 600 ICD 400 PDS HP 200 ESI 0 NBR PTEN US Land Total ICD Target Markets Legacy rigs (mechanical, SCR, AC (less than 1500 HP) AC Rigs – Pad-optimal and upgradeable rigs(2) Pad-Optimal / Upgradeable rigs not operating in ICD target markets. Fragmented (17 companies) Consolidating pad-optimal rig market driven (i) economically by the continued manifestation of the rig replacement cycle and (ii) by recent consolidating transactions (ICD-Sidewinder and Ensign-Trinidad) (1) Per Rig Data and internal estimates. (2) Represents AC rig fleet, 1500 HP or greater (includes skidding rigs and rigs without 7500psi mud systems that would require significant upgrade investment to meet pad-optimal 12 specifications) 12
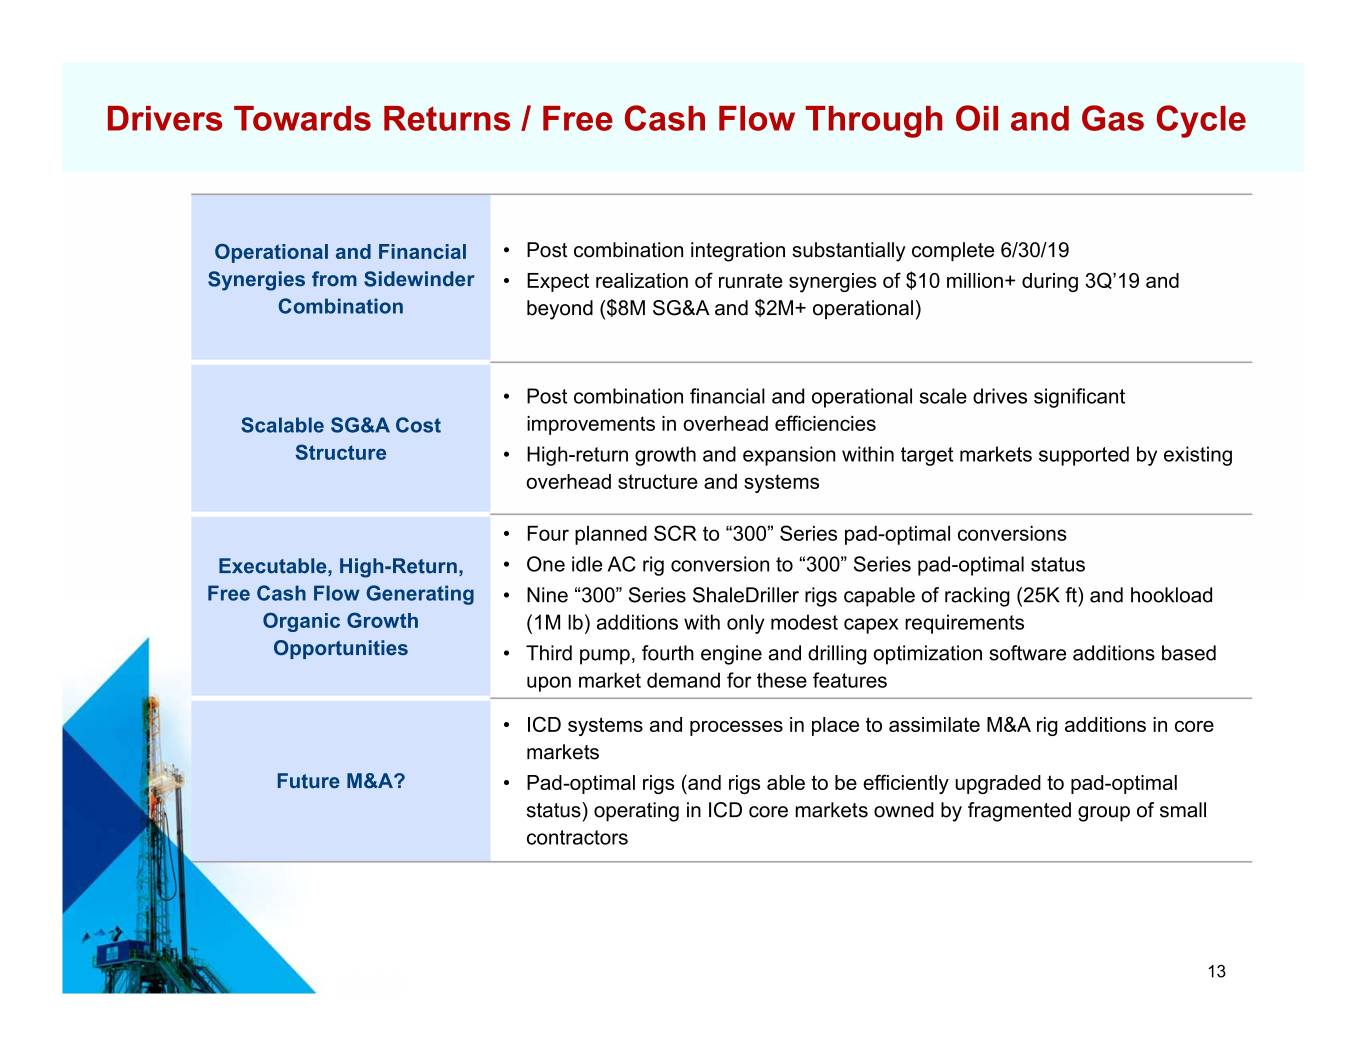
Drivers Towards Returns / Free Cash Flow Through Oil and Gas Cycle Operational and Financial • Post combination integration substantially complete 6/30/19 Synergies from Sidewinder • Expect realization of runrate synergies of $10 million+ during 3Q’19 and Combination beyond ($8M SG&A and $2M+ operational) • Post combination financial and operational scale drives significant Scalable SG&A Cost improvements in overhead efficiencies Structure • High-return growth and expansion within target markets supported by existing overhead structure and systems • Four planned SCR to “300” Series pad-optimal conversions Executable, High-Return, • One idle AC rig conversion to “300” Series pad-optimal status Free Cash Flow Generating • Nine “300” Series ShaleDriller rigs capable of racking (25K ft) and hookload Organic Growth (1M lb) additions with only modest capex requirements Opportunities • Third pump, fourth engine and drilling optimization software additions based upon market demand for these features • ICD systems and processes in place to assimilate M&A rig additions in core markets Future M&A? • Pad-optimal rigs (and rigs able to be efficiently upgraded to pad-optimal status) operating in ICD core markets owned by fragmented group of small contractors 13

Synergy Realization Driving Overhead Efficiencies SG&A Expense as a % of Revenue 14% 12% Full realization of strategic combination 10% synergies expected 3Q’19 8% 6% 4% 2% 0% ICD 3Q'18: Pre-SW ICD 1Q'19 Other Public Land Drillers (1) Continued realization of synergies from strategic combination driving overhead efficiencies that are scalable in connection with execution of high-return growth opportunities in core markets (1) Weighted Average SG&A expense as a percentage of total revenues for HP, PTEN, NBR, PDS and PES combined during 1Q’19. Includes research and development expenses. Per available public filings. 14 14
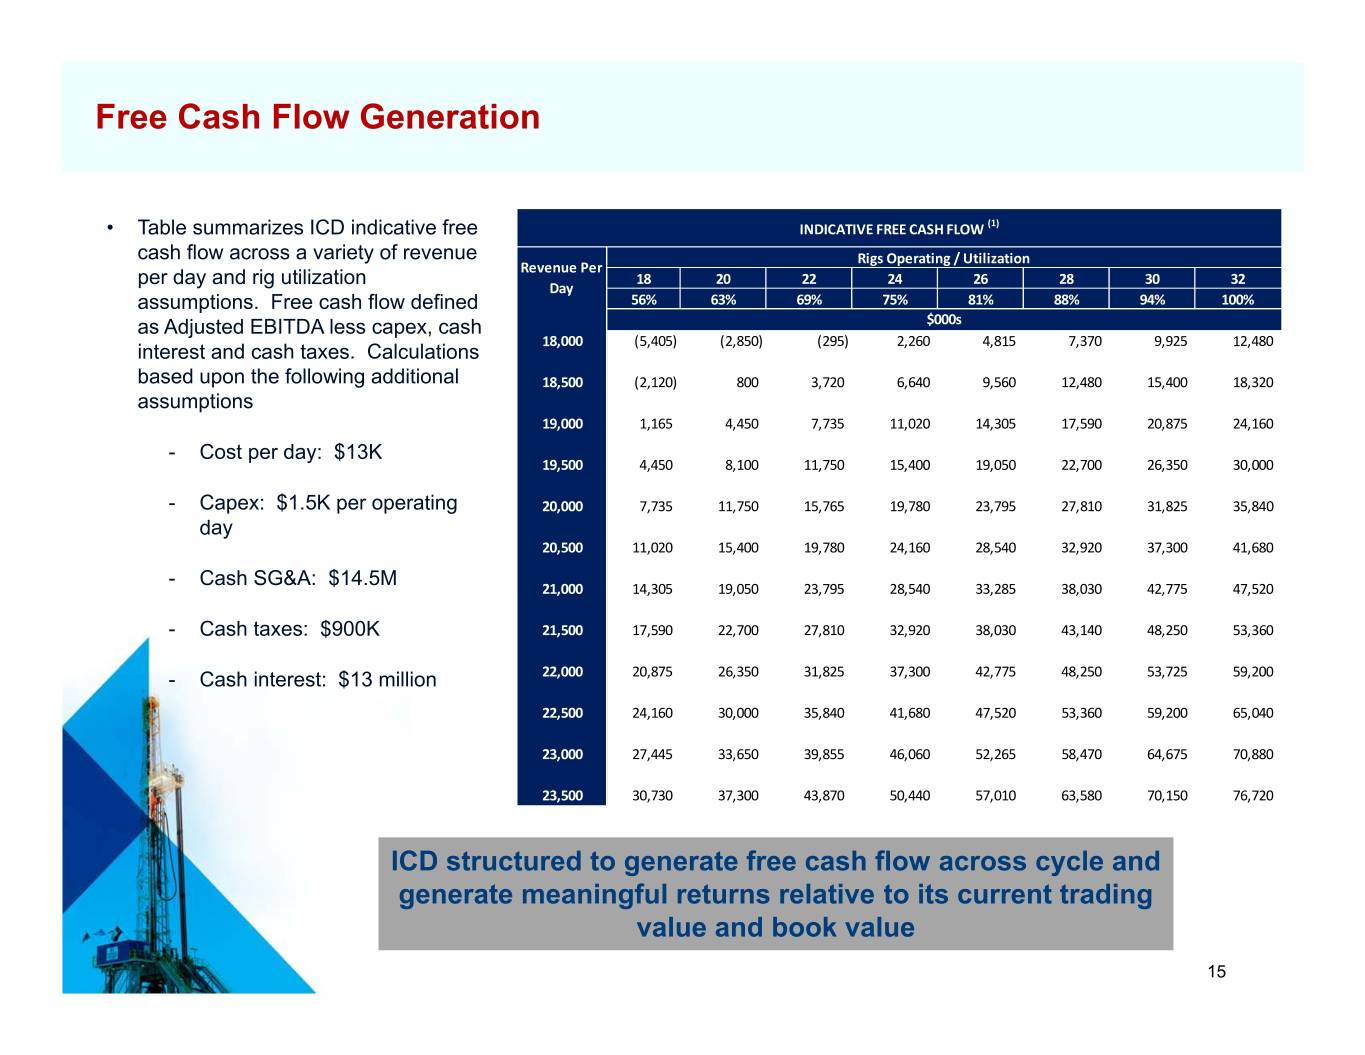
Free Cash Flow Generation • Table summarizes ICD indicative free INDICATIVE FREE CASH FLOW (1) cash flow across a variety of revenue Rigs Operating / Utilization Revenue Per per day and rig utilization 18 20 22 24 26 28 30 32 Day assumptions. Free cash flow defined 56% 63% 69% 75% 81% 88% 94% 100% as Adjusted EBITDA less capex, cash $000s 18,000 (5,405) (2,850) (295) 2,260 4,815 7,370 9,925 12,480 interest and cash taxes. Calculations based upon the following additional 18,500 (2,120) 800 3,720 6,640 9,560 12,480 15,400 18,320 assumptions 19,000 1,165 4,450 7,735 11,020 14,305 17,590 20,875 24,160 - Cost per day: $13K 19,500 4,450 8,100 11,750 15,400 19,050 22,700 26,350 30,000 - Capex: $1.5K per operating 20,000 7,735 11,750 15,765 19,780 23,795 27,810 31,825 35,840 day 20,500 11,020 15,400 19,780 24,160 28,540 32,920 37,300 41,680 - Cash SG&A: $14.5M 21,000 14,305 19,050 23,795 28,540 33,285 38,030 42,775 47,520 - Cash taxes: $900K 21,500 17,590 22,700 27,810 32,920 38,030 43,140 48,250 53,360 - Cash interest: $13 million 22,000 20,875 26,350 31,825 37,300 42,775 48,250 53,725 59,200 22,500 24,160 30,000 35,840 41,680 47,520 53,360 59,200 65,040 23,000 27,445 33,650 39,855 46,060 52,265 58,470 64,675 70,880 23,500 30,730 37,300 43,870 50,440 57,010 63,580 70,150 76,720 ICD structured to generate free cash flow across cycle and generate meaningful returns relative to its current trading value and book value 15 15
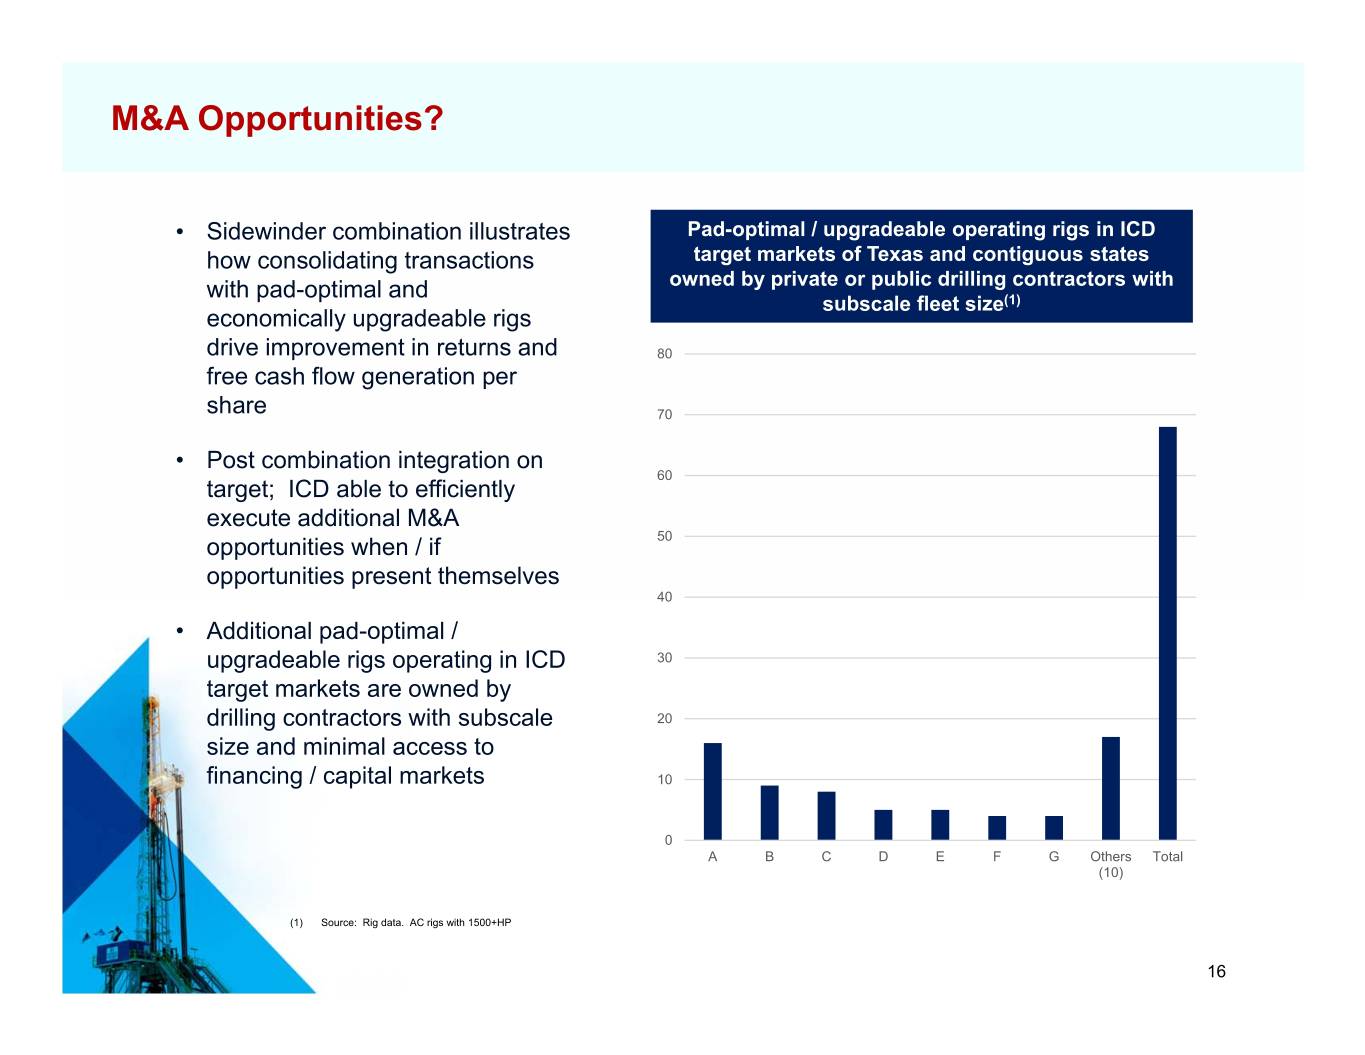
M&A Opportunities? • Sidewinder combination illustrates Pad-optimal / upgradeable operating rigs in ICD how consolidating transactions target markets of Texas and contiguous states with pad-optimal and owned by private or public drilling contractors with (1) economically upgradeable rigs subscale fleet size drive improvement in returns and 80 free cash flow generation per share 70 • Post combination integration on 60 target; ICD able to efficiently execute additional M&A opportunities when / if 50 opportunities present themselves 40 • Additional pad-optimal / upgradeable rigs operating in ICD 30 target markets are owned by drilling contractors with subscale 20 size and minimal access to financing / capital markets 10 0 A B C D E F G Others Total (10) (1) Source: Rig data. AC rigs with 1500+HP 16 16
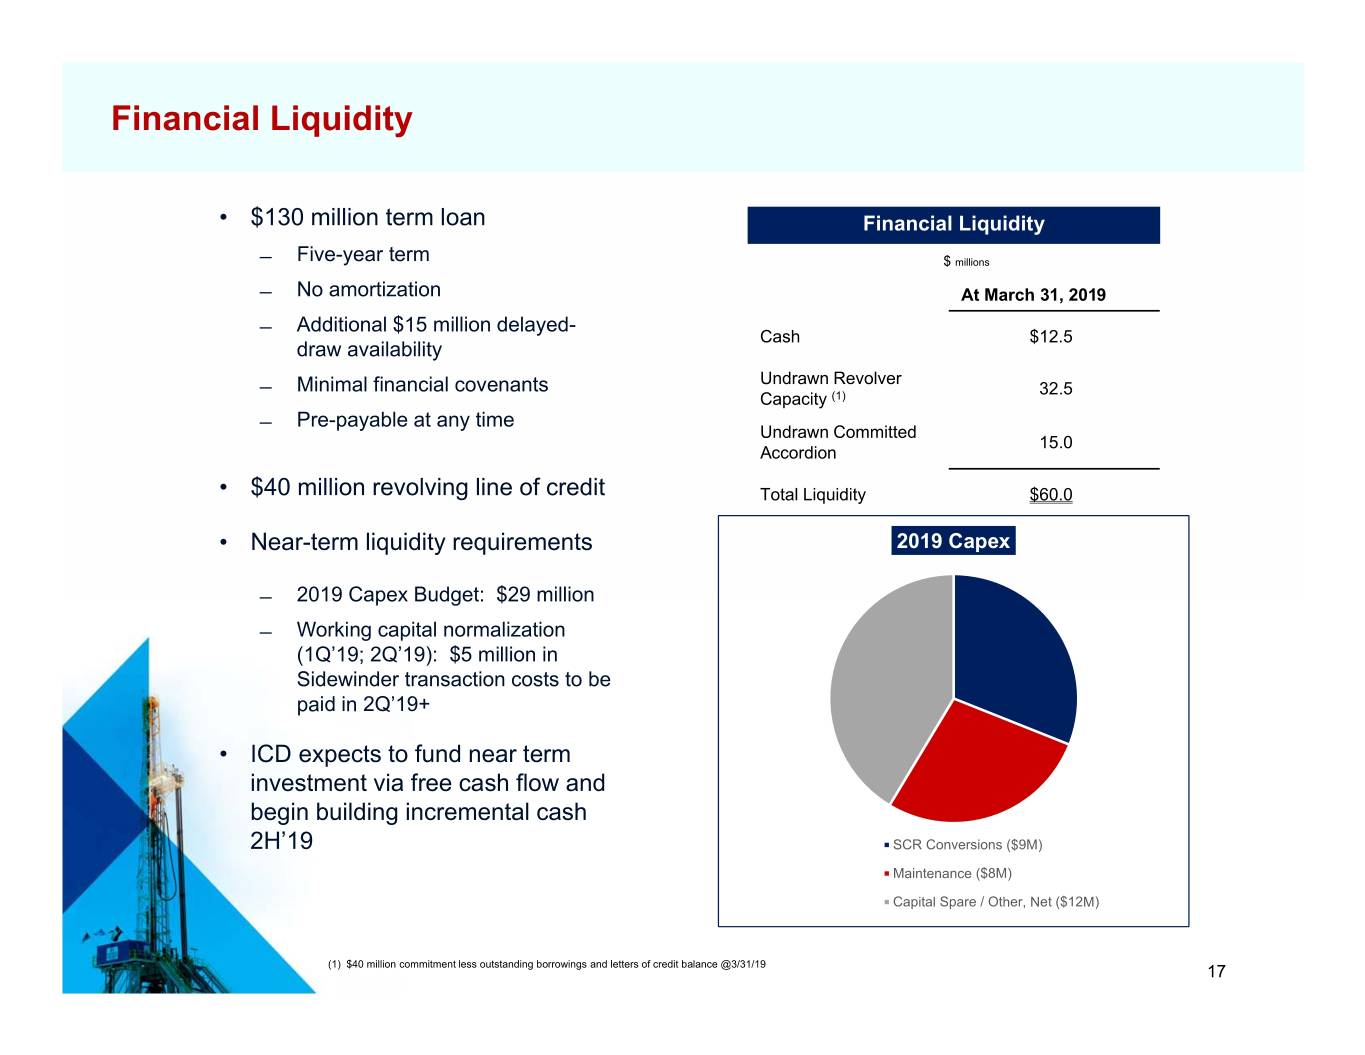
Financial Liquidity • $130 million term loan Financial Liquidity ̶ Five-year term $ millions ̶ No amortization At March 31, 2019 ̶ Additional $15 million delayed- Cash $12.5 draw availability Undrawn Revolver ̶ Minimal financial covenants 32.5 Capacity (1) ̶ Pre-payable at any time Undrawn Committed 15.0 Accordion • $40 million revolving line of credit Total Liquidity $60.0 • Near-term liquidity requirements 2019 Capex ̶ 2019 Capex Budget: $29 million ̶ Working capital normalization (1Q’19; 2Q’19): $5 million in Sidewinder transaction costs to be paid in 2Q’19+ • ICD expects to fund near term investment via free cash flow and begin building incremental cash 2H’19 SCR Conversions ($9M) Maintenance ($8M) Capital Spare / Other, Net ($12M) 17 (1) $40 million commitment less outstanding borrowings and letters of credit balance @3/31/19 17
Closing Summary Maintaining a Pad-Optimal drilling fleet…while increasing Returns and Free Cash Flow by focusing on operational excellence and executable high-return internal Growth opportunities • High-quality pad-optimal drilling fleet • Presence in most active US Shale basins supported by high-quality customers • Execution on attractive cost and operating synergy opportunities of $10 million+ • Generation of free cash flow and returns across oil and gas cycle • Strong balance sheet with financial flexibility 18
19
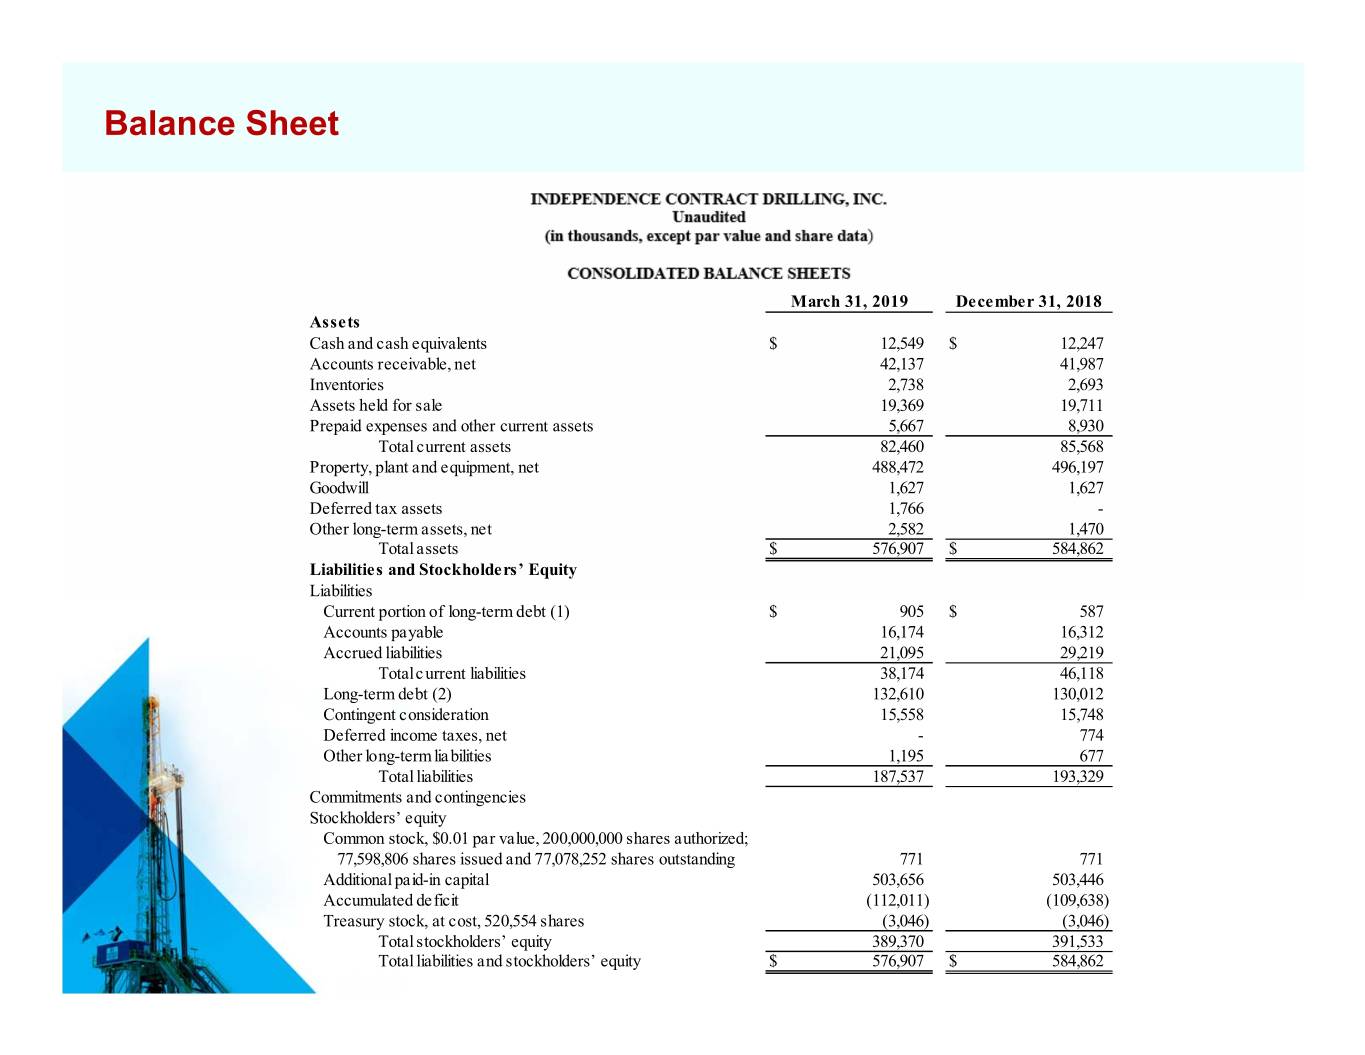
Balance Sheet March 31, 2019 December 31, 2018 Assets Cash and cash equivalents $ 12,549 $ 12,247 Accounts receivable, net 42,137 41,987 Inventories 2,738 2,693 Assets held for sale 19,369 19,711 Prepaid expenses and other current assets 5,667 8,930 Total current assets 82,460 85,568 Property, plant and equipment, net 488,472 496,197 Goodwill 1,627 1,627 Deferred tax assets 1,766 - Other long-term assets, net 2,582 1,470 Total assets $ 576,907 $ 584,862 Liabilities and Stockholders’ Equity Liabilities Current portion of long-term debt (1) $ 905 $ 587 Accounts payable 16,174 16,312 Accrued liabilities 21,095 29,219 Total c urrent liabilities 38,174 46,118 Long-term debt (2) 132,610 130,012 Contingent consideration 15,558 15,748 Deferred income taxes, net - 774 Other lo ng-term lia bilities 1,195 677 Total liabilities 187,537 193,329 Commitments and contingencies Stockholders’ equity Common stock, $0.01 par value, 200,000,000 shares authorized; 77,598,806 shares issued and 77,078,252 shares outstanding 771 771 Additional paid-in capital 503,656 503,446 Accumulated deficit (112,011) (109,638) Treasury stock, at cost, 520,554 shares (3,046) (3,046) Total stockholders’ equity 389,370 391,533 20 Total liabilities and stockholders’ equity $ 576,907 $ 584,862
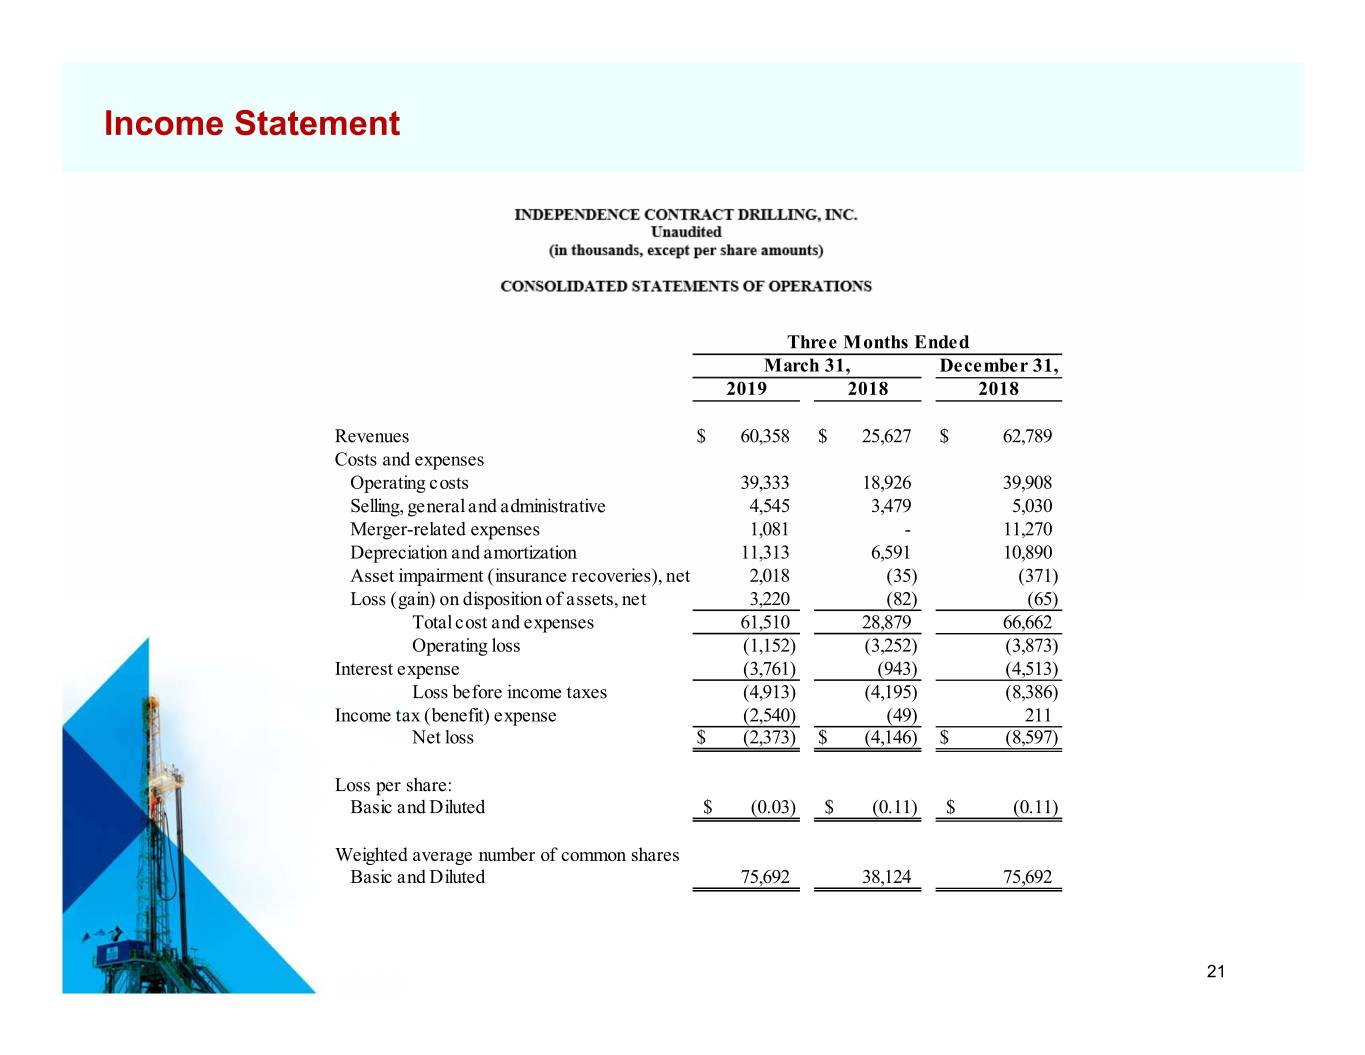
Income Statement Three Months Ended March 31, December 31, 2019 2018 2018 Revenues $ 60,358 $ 726,52$ 62,789 Costs and expenses Operating costs 39,333 18,926 39,908 Selling, general and administrative 4,545 3,479 5,030 Merger-related expenses 1,081 - 11,270 Depreciation and amortization 11,313 6,591 10,890 Asset impairment (insurance recoveries), net 2,018 (35) (371) Loss (gain) on disposition of assets, net 3,220 (82) (65) Total cost and expenses 61,510 28,879 66,662 Operating loss (1,152) (3,252) (3,873) Interest expense (3,761) (943) (4,513) Loss before income taxes (4,913) (4,195) (8,386) Income tax (benefit) expense (2,540) (49) 211 Net loss $ (2,373) $ (4,146) $ (8,597) Loss per share: Basic and Diluted $ (0.03) $ )1.10($ (0.11) Weighted average number of common shares Basic and Diluted 75,692 38,124 75,692 21 21
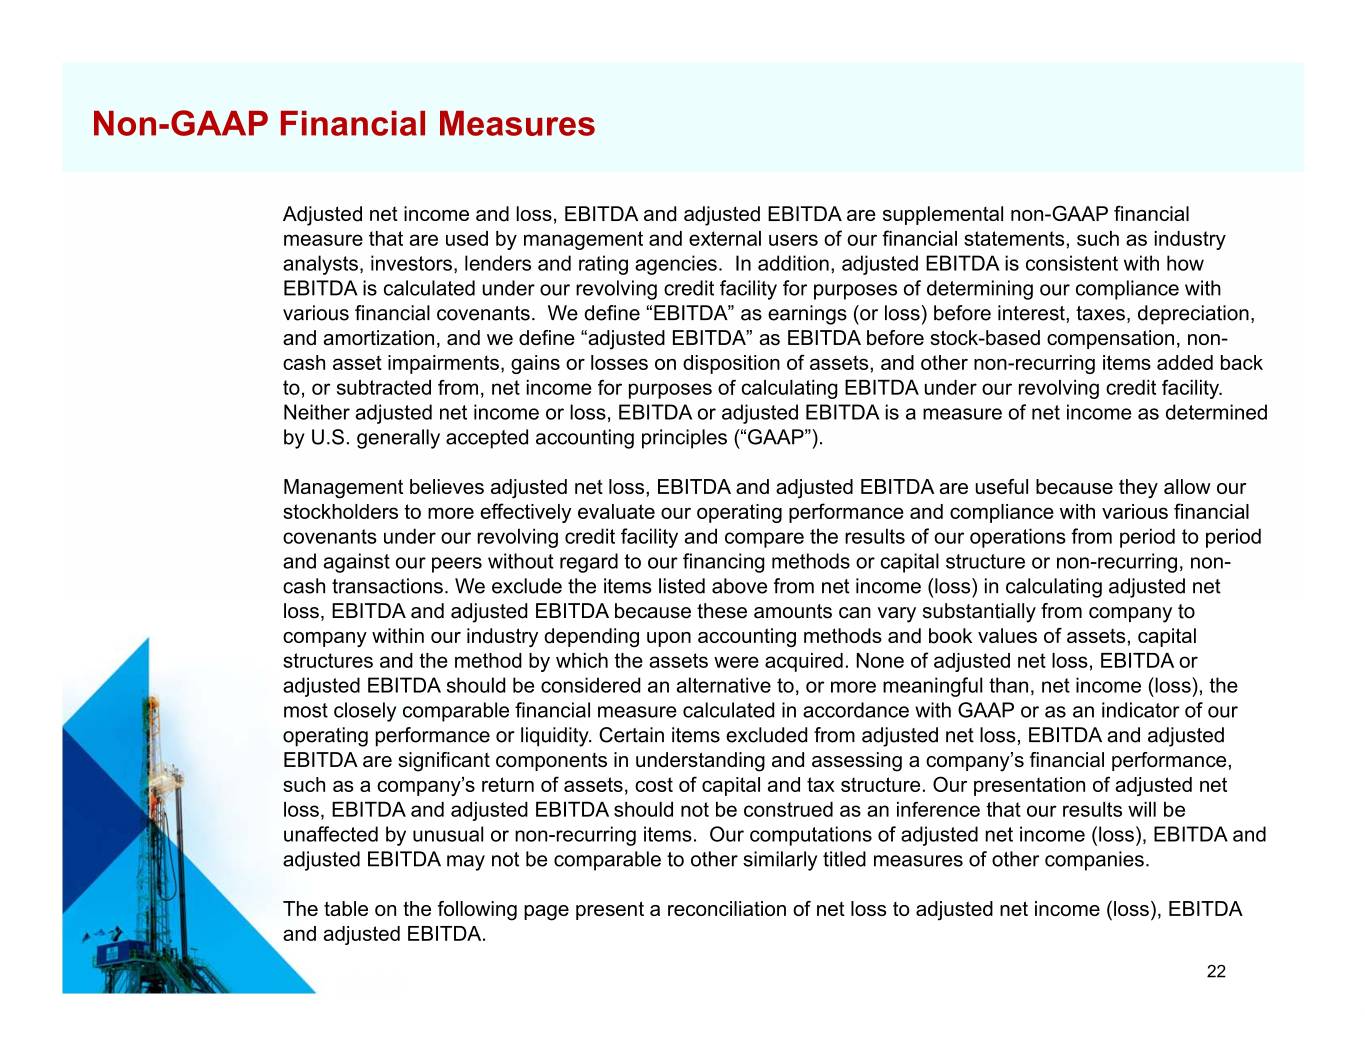
Non-GAAP Financial Measures Adjusted net income and loss, EBITDA and adjusted EBITDA are supplemental non-GAAP financial measure that are used by management and external users of our financial statements, such as industry analysts, investors, lenders and rating agencies. In addition, adjusted EBITDA is consistent with how EBITDA is calculated under our revolving credit facility for purposes of determining our compliance with various financial covenants. We define “EBITDA” as earnings (or loss) before interest, taxes, depreciation, and amortization, and we define “adjusted EBITDA” as EBITDA before stock-based compensation, non- cash asset impairments, gains or losses on disposition of assets, and other non-recurring items added back to, or subtracted from, net income for purposes of calculating EBITDA under our revolving credit facility. Neither adjusted net income or loss, EBITDA or adjusted EBITDA is a measure of net income as determined by U.S. generally accepted accounting principles (“GAAP”). Management believes adjusted net loss, EBITDA and adjusted EBITDA are useful because they allow our stockholders to more effectively evaluate our operating performance and compliance with various financial covenants under our revolving credit facility and compare the results of our operations from period to period and against our peers without regard to our financing methods or capital structure or non-recurring, non- cash transactions. We exclude the items listed above from net income (loss) in calculating adjusted net loss, EBITDA and adjusted EBITDA because these amounts can vary substantially from company to company within our industry depending upon accounting methods and book values of assets, capital structures and the method by which the assets were acquired. None of adjusted net loss, EBITDA or adjusted EBITDA should be considered an alternative to, or more meaningful than, net income (loss), the most closely comparable financial measure calculated in accordance with GAAP or as an indicator of our operating performance or liquidity. Certain items excluded from adjusted net loss, EBITDA and adjusted EBITDA are significant components in understanding and assessing a company’s financial performance, such as a company’s return of assets, cost of capital and tax structure. Our presentation of adjusted net loss, EBITDA and adjusted EBITDA should not be construed as an inference that our results will be unaffected by unusual or non-recurring items. Our computations of adjusted net income (loss), EBITDA and adjusted EBITDA may not be comparable to other similarly titled measures of other companies. The table on the following page present a reconciliation of net loss to adjusted net income (loss), EBITDA and adjusted EBITDA. 22
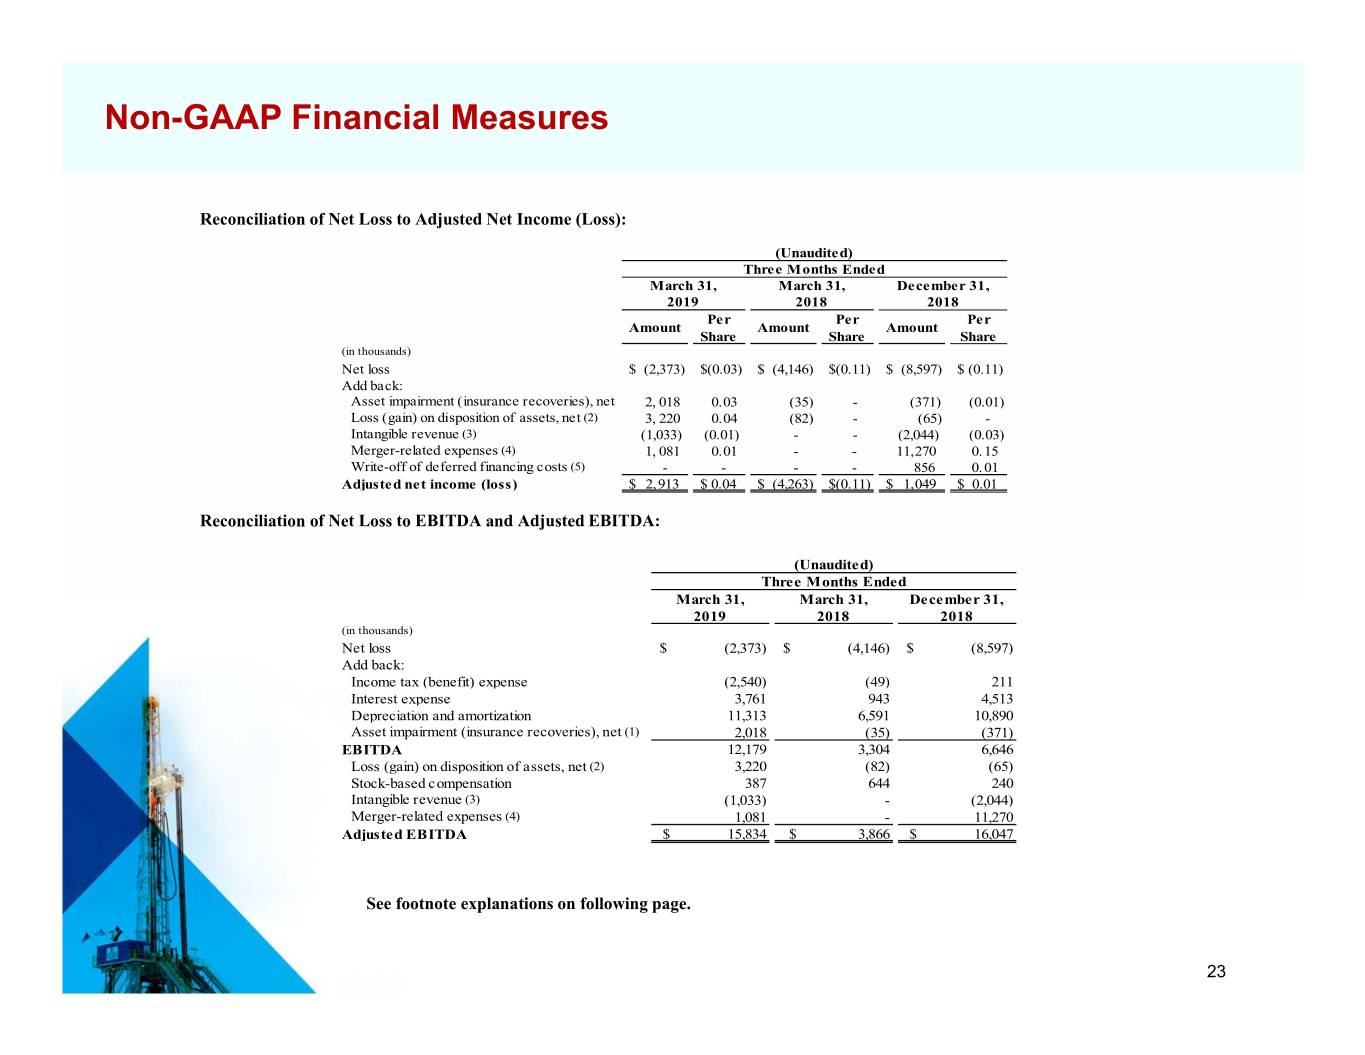
Non-GAAP Financial Measures Reconciliation of Net Loss to Adjusted Net Income (Loss): (Unaudited) Three Months Ended March 31, March 31, December 31, 2019 2018 2018 Per Per Per Amount Amount Amount Share Share Share (in thousands) Net loss $ (2,373 ) $(0.03 ) $ (4,146 ) $(0.11 ) $ (8,597 ) $ (0.11 ) Add back: Asset impairment (insurance recoveries), net 2, 018 0.03 (35) - (371 ) (0.01 ) Loss (gain) on disposition of assets, net (2) 3, 220 0.04 (82) - (65) - Intangible revenue (3) (1,033 ) (0.01 ) - - (2,044 ) (0.03 ) Merger-related expenses (4) 1, 081 0.01 - - 11,270 0. 15 Write-off of deferred financing costs (5) - - - - 856 0. 01 Adjusted net income (loss ) $ 2, 913 $ 0.04 $ (4,263 ) $(0.11 ) $ 1,049 $ 0.01 Reconciliation of Net Loss to EBITDA and Adjusted EBITDA: (Unaudited) Three Months Ended March 31 , March 31 , December 31 , 2019 2018 2018 (in thousands) Net loss $ (2,373 ) $ (4,146 ) $ (8,597 ) Add back: Income tax (benefit ) expense (2,540 ) (49) 211 Interest ex pense 3,761 943 4,513 Depreciation and amortizatio n 11,313 6,591 10,890 Asset impairment (insurance recoveries), net (1) 2,018 (35) (371 ) EBITDA 12,179 3,304 6,646 Loss (gain) on dis position of assets, ne t (2) 3,220 (82) (65) Stock-based com pensatio n 387 644 240 Intangible revenue (3) (1,033 ) - (2,044 ) Merger-related expenses (4) 1,081 - 11,270 Adjusted EBITDA $ 15,834 $ 3,866 $ 16,047 See footnote explanations on following page. 23
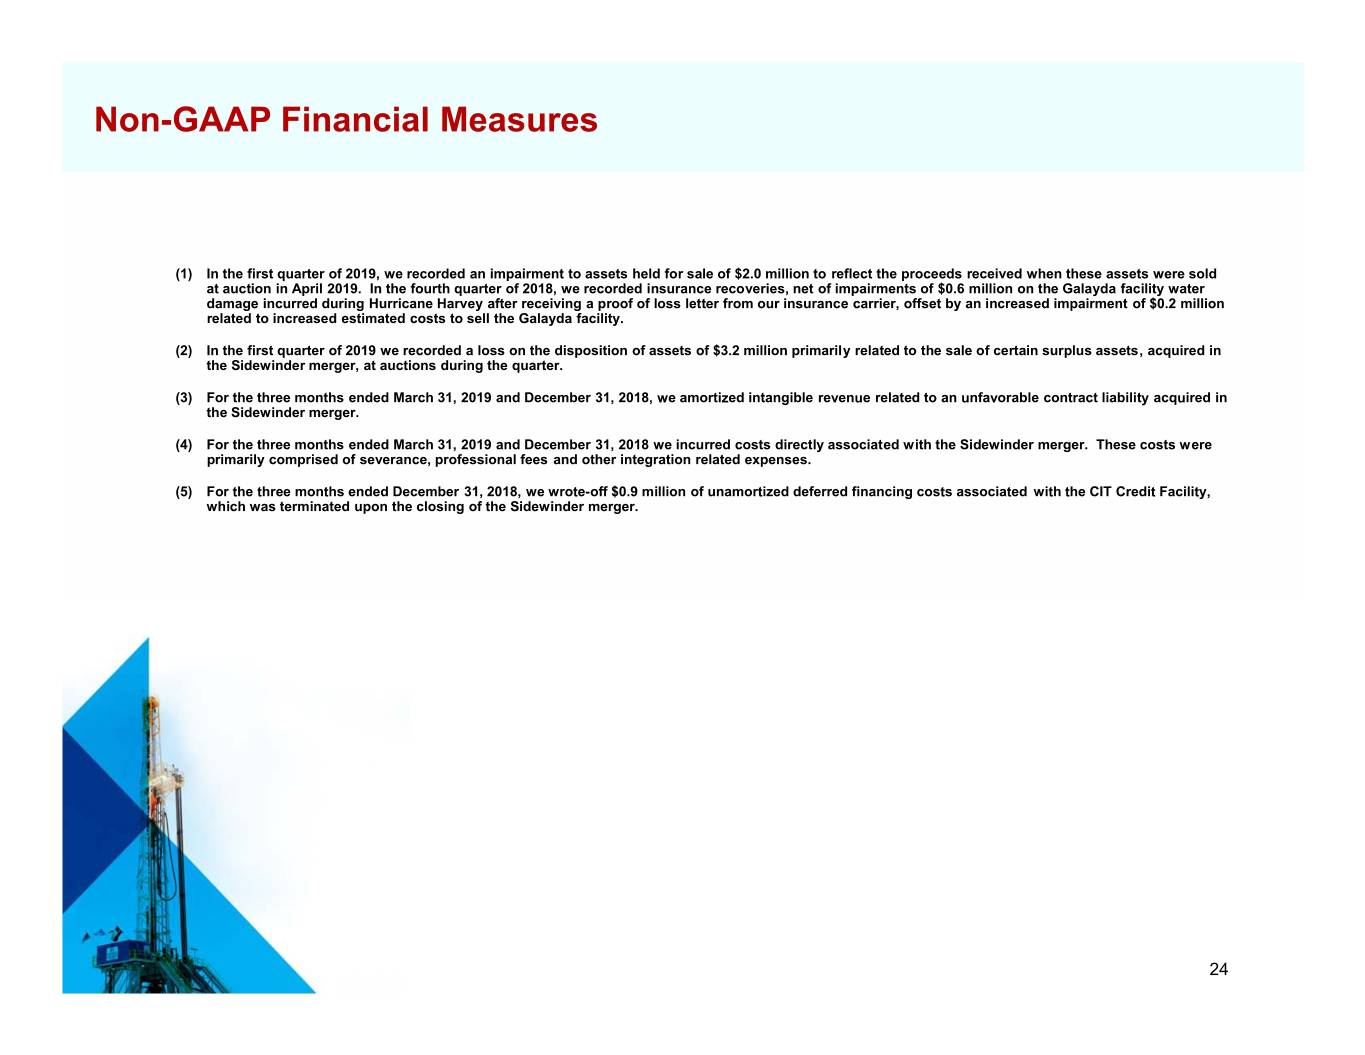
Non-GAAP Financial Measures (1) In the first quarter of 2019, we recorded an impairment to assets held for sale of $2.0 million to reflect the proceeds received when these assets were sold at auction in April 2019. In the fourth quarter of 2018, we recorded insurance recoveries, net of impairments of $0.6 million on the Galayda facility water damage incurred during Hurricane Harvey after receiving a proof of loss letter from our insurance carrier, offset by an increased impairment of $0.2 million related to increased estimated costs to sell the Galayda facility. (2) In the first quarter of 2019 we recorded a loss on the disposition of assets of $3.2 million primarily related to the sale of certain surplus assets, acquired in the Sidewinder merger, at auctions during the quarter. (3) For the three months ended March 31, 2019 and December 31, 2018, we amortized intangible revenue related to an unfavorable contract liability acquired in the Sidewinder merger. (4) For the three months ended March 31, 2019 and December 31, 2018 we incurred costs directly associated with the Sidewinder merger. These costs were primarily comprised of severance, professional fees and other integration related expenses. (5) For the three months ended December 31, 2018, we wrote-off $0.9 million of unamortized deferred financing costs associated with the CIT Credit Facility, which was terminated upon the closing of the Sidewinder merger. 24
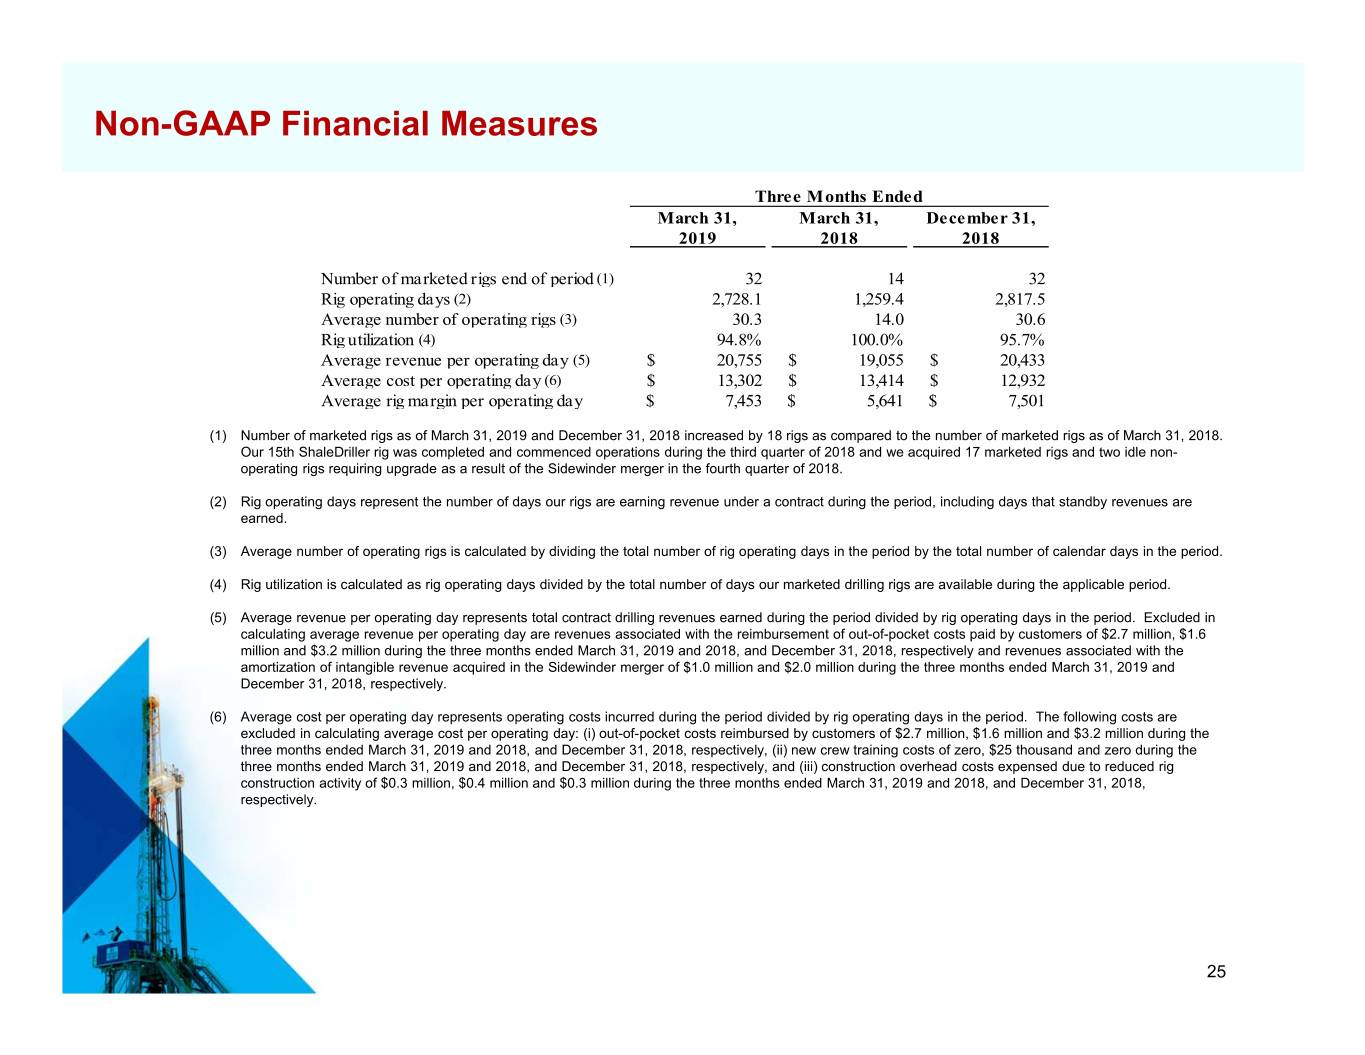
Non-GAAP Financial Measures Three Months Ended March 31 , March 31 , December 31 , 2019 2018 2018 Number of ma rketed ri gs end of period (1) 32 14 32 Rig operating da ys (2) 2,728.1 1,259.4 2,817.5 Avera ge number of o perating rigs (3) 30.3 14.0 30.6 Rig u tilization (4) 94.8% 100.0% 95.7% Avera ge revenue per operating da y (5) $ 20,755 $ 19,055 $ 20,433 Avera ge cost per operating da y (6) $ 13,302 $ 13,414 $ 12,932 Avera ge rig ma r gin per operating da y $ 7,453 $ 5,641 $ 7,501 (1) Number of marketed rigs as of March 31, 2019 and December 31, 2018 increased by 18 rigs as compared to the number of marketed rigs as of March 31, 2018. Our 15th ShaleDriller rig was completed and commenced operations during the third quarter of 2018 and we acquired 17 marketed rigs and two idle non- operating rigs requiring upgrade as a result of the Sidewinder merger in the fourth quarter of 2018. (2) Rig operating days represent the number of days our rigs are earning revenue under a contract during the period, including days that standby revenues are earned. (3) Average number of operating rigs is calculated by dividing the total number of rig operating days in the period by the total number of calendar days in the period. (4) Rig utilization is calculated as rig operating days divided by the total number of days our marketed drilling rigs are available during the applicable period. (5) Average revenue per operating day represents total contract drilling revenues earned during the period divided by rig operating days in the period. Excluded in calculating average revenue per operating day are revenues associated with the reimbursement of out-of-pocket costs paid by customers of $2.7 million, $1.6 million and $3.2 million during the three months ended March 31, 2019 and 2018, and December 31, 2018, respectively and revenues associated with the amortization of intangible revenue acquired in the Sidewinder merger of $1.0 million and $2.0 million during the three months ended March 31, 2019 and December 31, 2018, respectively. (6) Average cost per operating day represents operating costs incurred during the period divided by rig operating days in the period. The following costs are excluded in calculating average cost per operating day: (i) out-of-pocket costs reimbursed by customers of $2.7 million, $1.6 million and $3.2 million during the three months ended March 31, 2019 and 2018, and December 31, 2018, respectively, (ii) new crew training costs of zero, $25 thousand and zero during the three months ended March 31, 2019 and 2018, and December 31, 2018, respectively, and (iii) construction overhead costs expensed due to reduced rig construction activity of $0.3 million, $0.4 million and $0.3 million during the three months ended March 31, 2019 and 2018, and December 31, 2018, respectively. 25

26


