 1 st Quarter 2015 Earnings Results Michael Small – Chief Executive Officer Norman Smagley – Chief Financial Officer May 7, 2015 Exhibit 99.2 |
 ©2014 Gogo Inc. and Affiliates. Proprietary & Confidential. 2 SAFE HARBOR STATEMENT 2 Safe Harbor Statement This presentation contains “forward-looking statements” within the meaning of Section 27A of the Securities Act of 1933 and Section 21E of the Securities Exchange Act of 1934 that are based on management’s beliefs and assumptions and on information currently available to management. Most forward-looking statements contain words that identify them as forward-looking, such as “anticipates,” “believes,” “continues,” “could,” “seeks,” “estimates,” “expects,” “intends,” “may,” “plans,” “potential,” “predicts,” “projects,” “should,” “will,” “would” or similar expressions and the negatives of those terms that relate to future events. Forward-looking statements involve known and unknown risks, uncertainties and other factors that may cause Gogo’s actual results, performance or achievements to be materially different from any projected results, performance or achievements expressed or implied by the forward-looking statements. Forward-looking statements represent the beliefs and assumptions of Gogo only as of the date of this presentation and Gogo undertakes no obligation to update or revise publicly any such forward-looking statements, whether as a result of new information, future events or otherwise. As such, Gogo’s future results may vary from any expectations or goals expressed in, or implied by, the forward-looking statements included in this presentation, possibly to a material degree. Gogo cannot assure you that the assumptions made in preparing any of the forward-looking statements will prove accurate or that any long-term financial or operational goals and targets will be realized. In particular, the availability and performance of certain technology solutions yet to be implemented by the Company set forth in this presentation represent aspirational long-term goals based on current expectations. For a discussion of some of the important factors that could cause Gogo’s results to differ materially from those expressed in, or implied by, the forward-looking statements included in this presentation, investors should refer to the disclosure contained under the headings “Risk Factors” and “Cautionary Note Regarding Forward-Looking Statements” in the Company’s Annual Report on Form 10-K filed with the SEC on February 27, 2015. Note to Certain Operating and Financial Data In addition to disclosing financial results that are determined in accordance with U.S. generally accepted accounting principles (“GAAP”), Gogo also discloses in this presentation certain non-GAAP financial information, including Adjusted EBITDA and Cash CapEx. These financial measures are not recognized measures under GAAP, and when analyzing our performance or liquidity, as applicable, investors should (i) use Adjusted EBITDA in addition to, and not as an alternative to, net loss attributable to common stock as a measure of operating results, and (ii) use Cash CAPEX in addition to, and not as an alternative to, consolidated capital expenditures when evaluating our liquidity. In addition, this presentation contains various customer metrics and operating data, including numbers of aircraft or units online, that are based on internal company data, as well as information relating to the commercial and business aviation market, and our position within those markets. While management believes such information and data are reliable, they have not been verified by an independent source and there are inherent challenges and limitations involved in compiling data across various geographies and from various sources. |
 ©2014 Gogo Inc. and Affiliates. Proprietary & Confidential. 3 Q1 2015 EARNINGS CALL OBJECTIVES 3 Perspective on the in-flight connectivity industry Why Gogo wins Update on the quarter |
 ©2014 Gogo Inc. and Affiliates. Proprietary & Confidential. 4 GLOBAL AERO-COMMUNICATIONS SERVICE PROVIDER REQUIREMENTS 4 Global scale is essential Most bandwidth at the lowest cost Invest in R&D and network engineering capabilities |
 ©2014 Gogo Inc. and Affiliates. Proprietary & Confidential. 5 GOGO CHECKS ALL THE BOXES 5 We have the largest scale We are global We have nearly 1,000 smart, specialized, and passionate employees around the world We have industry leading R&D and network capabilities GOGO DELIVERS HIGHLY RELIABLE AND SOPHISTICATED IN-FLIGHT CONNECTIVITY SOLUTIONS |
 ©2014 Gogo Inc. and Affiliates. Proprietary & Confidential. 6 GOGO LEADS TECHNOLOGY INNOVATION 6 1 st generation – ATG / ATG4 2 nd generation – 2Ku 3 rd generation – in progress… GOGO IS PLAYING TO WIN |
 ©2014 Gogo Inc. and Affiliates. Proprietary & Confidential. 7 DELIVERING ON 2015 PRIORITIES 7 Add new aircraft Increase bandwidth to aircraft Hit the numbers (1) As of March 31, 2015. - Expanded partnership with NetJets - Expanded partnership with Delta - Installed 300+ broadband aircraft - Announced ATG8000 and ATG1000 for BA - 730 ATG4 equipped aircraft (1) - Nearly 50% of data traffic goes through ATG4 equipped aircraft - 2Ku will bring more capacity starting in 2016 - Record revenue of $116M, up 21% Y/Y - Service revenue of $95M, up 32% Y/Y - Combined segment profit margin for CA-NA and BA of 23% - Issued $362M in convertible notes |
 ©2014 Gogo Inc. and Affiliates. Proprietary & Confidential. 8 8 Gogo has a scalable business model Gogo has industry leading R&D capabilities WE ARE PLAYING TO WIN IFC industry is large and global Gogo has scale and experience EXECUTING ON THE WORLD’S FASTEST GLOBAL COMMUNICATIONS INFRASTRUCTURE DEPLOYMENT YET |
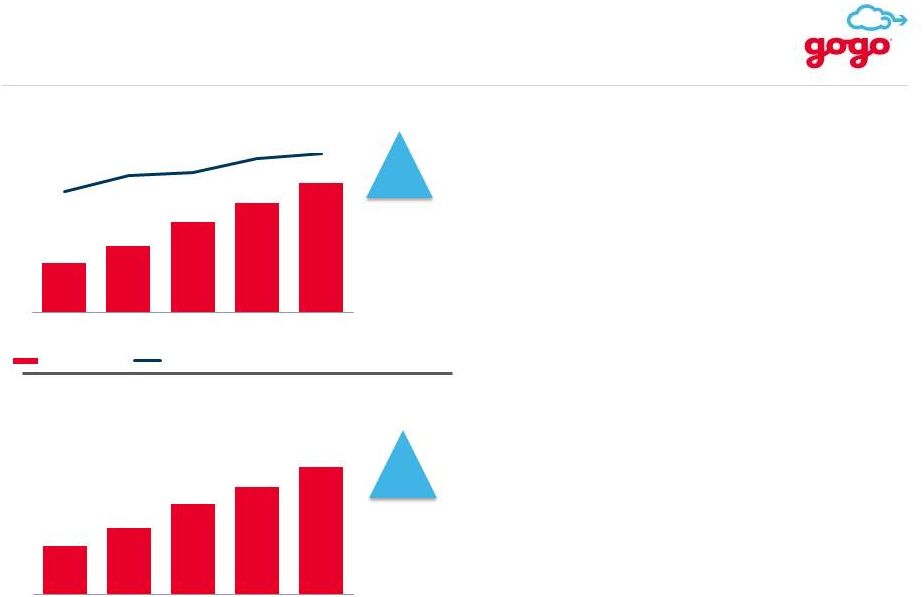
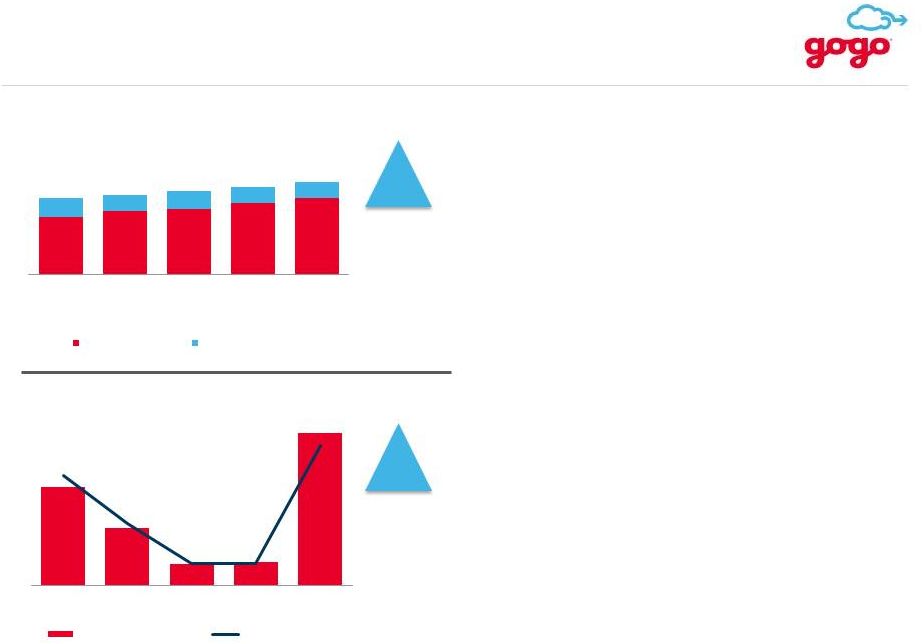 ©2014 Gogo Inc. and Affiliates. Proprietary & Confidential. 9 Q1 2015 RECORD REVENUE & ADJUSTED EBITDA 9 21% Y/Y Growth • Q1 2015 record revenue quarter: - Service revenue up 32% y/y - CA-NA service revenue up 28% y/y - BA service revenue up 38% y/y • Q1 2015 Adjusted EBITDA margin of 7% 54% Y/Y Growth $96 $116 $104 $100 $109 Note: Minor differences exist due to rounding $72 $79 $82 $90 $95 $23 $20 $22 $20 $20 Q1 '14 Q2 '14 Q3 '14 Q4 '14 Q1 '15 Total Revenue ($MM) Service Revenue Equipment Revenue $5 $3 $1 $1 $8 6% 3% 1% 1% 7% Q1 '14 Q2 '14 Q3 '14 Q4 '14 Q1 '15 Adjusted EBITDA ($MM) Adjusted EBITDA Adjusted EBITDA Margin |
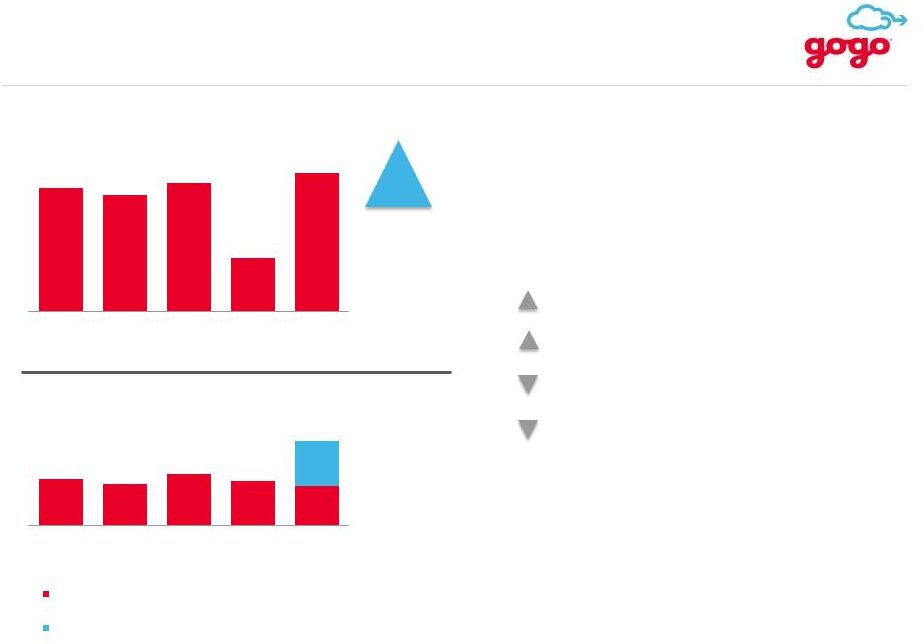 ©2014 Gogo Inc. and Affiliates. Proprietary & Confidential. 10 CONSOLIDATED CASH CAPEX & CASH 10 CA facilities build out of $6M Airborne equipment purchases ATG network Airborne equipment proceeds $400 $3MM Y/Y Increase Note: Minor differences exist due to rounding. Cash balance is end of period. All figures as of 3/31/2015 $29 $27 $30 $12 $32 Q1 '14 Q2 '14 Q3 '14 Q4 '14 Q1 2015 Cash CapEx ($MM) $220 $196 $243 $211 $189 $212 Q1 '14 Q2 '14 Q3 '14 Q4 '14 Q1 '15 Cash Balance ($MM) Cash Convertible Debt Proceeds Net of Issuance Costs and the Prepaid Forward Transactions • Q1 ’15 Y/Y changes in capital expenditures: • Strong cash position following $362M convertible notes offering |
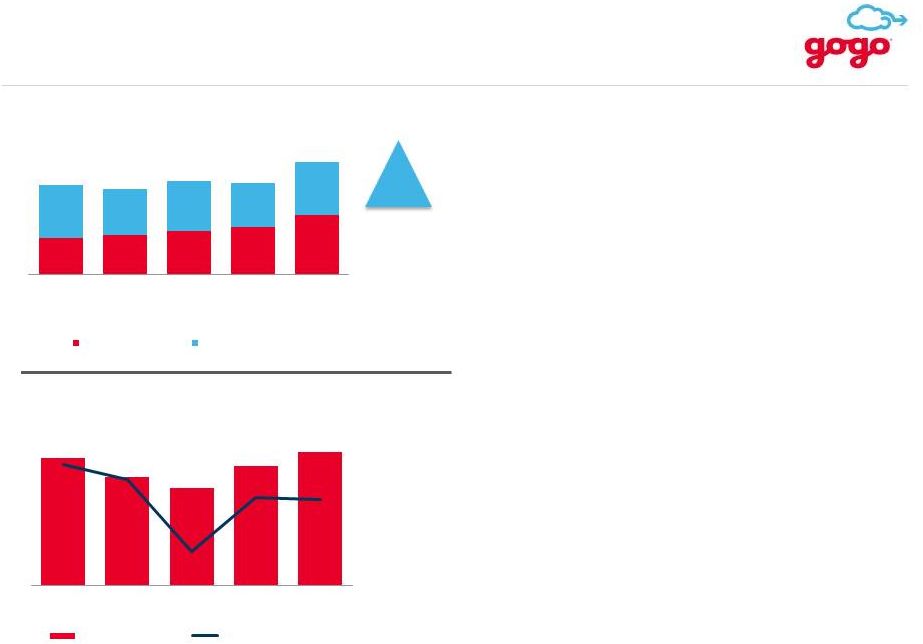
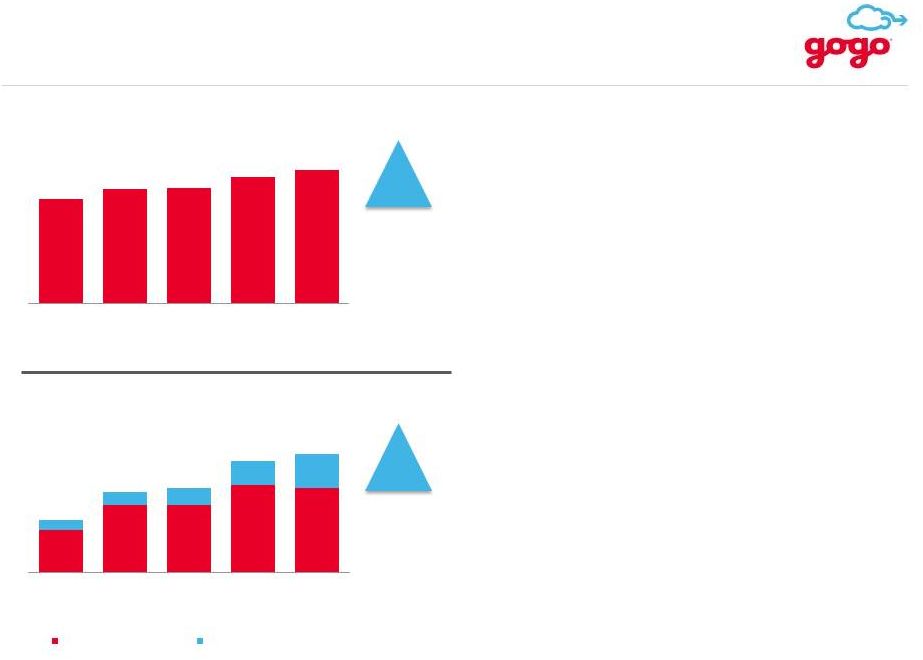 ©2014 Gogo Inc. and Affiliates. Proprietary & Confidential. 11 CA-NA STRONG REVENUE & ARPA GROWTH 11 28% Y/Y Growth • Service revenue driven by: - 22% y/y growth in ARPA - 7% y/y growth in aircraft online • Strong ARPA growth continues: - Changes in pricing and product mix drove ARPS increase - In-flight wireless entertainment revenue continues to grow - Connectivity take rate increased excluding impact of sponsorships 22% Y/Y Growth Note: Minor differences exist due to rounding $110 $120 $122 $131 $134 $56 $62 $62 $68 $72 Q1 '14 Q2 '14 Q3 '14 Q4 '14 Q1 '15 Service Revenue ($MM) $106 $115 $115 $122 $121 $4 $5 $6 $9 $14 Q1 '14 Q2 '14 Q3 '14 Q4 '14 Q1 '15 Annualized ARPA Connectivity Revenue Other Service Revenue Note: Other service revenue includes content filtering, VoIP access for airlines’ flight crews, portal development services, operations-oriented communications services, third-party advertising, e-commerce revenue share arrangements and partner co-branding and reseller arrangements. |
 ©2014 Gogo Inc. and Affiliates. Proprietary & Confidential. 12 CA-NA AIRCRAFT ONLINE & SEGMENT PROFIT GROWTH 12 7% Y/Y Growth Note: Minor differences exist due to rounding • 102 aircraft online added in Q1 2015 • Segment profit margin expands to 13% • Strong leverage of network infrastructure 2,200 2,098 2,044 2,058 2,056 66% Y/Y Growth Q1 '14 Q2 '14 Q3 '14 Q4 '14 Q1 '15 Aircraft Online (End of Period) $6 $6 $6 $8 $10 10% 10% 9% 12% 13% Q1 '14 Q2 '14 Q3 '14 Q4 '14 Q1 '15 Segment Profit ($MM) Segment Profit Segment Profit Margin |
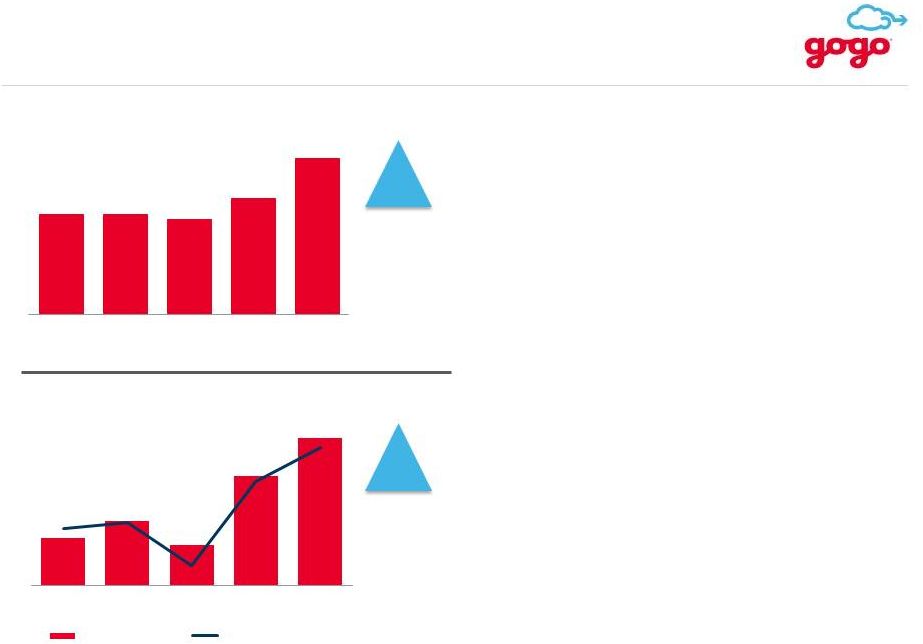
 ©2014 Gogo Inc. and Affiliates. Proprietary & Confidential. 13 BA SERVICE REVENUE & ATG AIRCRAFT ONLINE GROWTH 13 • Strong growth in ATG aircraft online and ATG ARPU • NetJets expands long-standing partnership • Announced ATG 8000 & ATG1000 38% Y/Y Growth 41% 46% 47% 51% 52% 33% Y/Y Growth $16 $17 $19 $20 $22 Q1 '14 Q2 '14 Q3 '14 Q4 '14 Q1 '15 Service Revenue ($MM) Service Revenue Service Revenue as a % of Total BA Revenue 2,250 2,415 2,637 2,797 2,983 Q1 '14 Q2 '14 Q3 '14 Q4 '14 Q1 '15 ATG Aircraft Online (End of Period) |
 ©2014 Gogo Inc. and Affiliates. Proprietary & Confidential. 14 BA REVENUE & SEGMENT PROFIT GROWTH 14 8% Y/Y Growth $39 $42 $37 $40 Note: Minor differences exist due to rounding • Q1 2015 record revenue quarter: - Service revenue up 38% y/y - ATG aircraft online up 33% y/y • Equipment revenue down Y/Y - Change in product mix - Normalized sales of Text & Talk • Q1 2015 segment profit margin of 40% $40 $16 $17 $19 $20 $22 $23 $20 $21 $19 $20 Q1 '14 Q2 '14 Q3 '14 Q4 '14 Q1 '15 Total Revenue ($MM) Service Revenue Equipment Revenue $16 $15 $15 $16 $17 43% 42% 37% 41% 40% Q1 '14 Q2 '14 Q3 '14 Q4 '14 Q1 '15 Segment Profit ($MM) Segment Profit Segment Profit Margin |
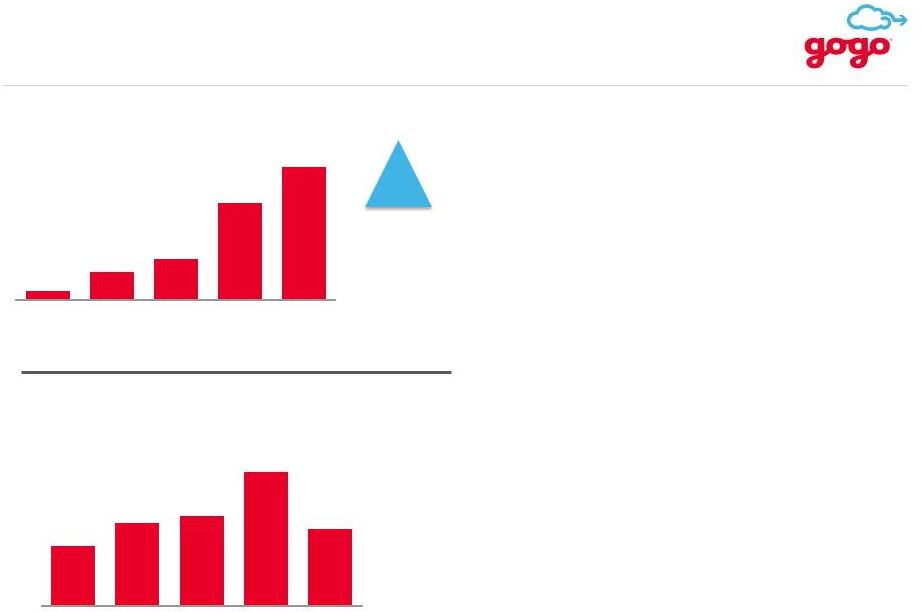 ©2014 Gogo Inc. and Affiliates. Proprietary & Confidential. 15 FOCUS ON INTERNATIONAL EXPANSION 15 36% Q/Q Growth • 31 Ku aircraft installed in Q1 2015 • Revenue of $1.4M impacted by: - Classification of certain CA-ROW transactions - Some aircraft flying CA-NA routes - Adjusting for the above activities revenue would have been approx. $2.6M • Y/Y increase in segment loss includes higher SG&A and satellite costs • Decrease in segment loss from Q4 2014 impacted by timing of STC milestones and related design work 5 19 35 85 116 Q1 '14 Q2 '14 Q3 '14 Q4 '14 Q1 '15 Satellite Aircraft Online (End of Period) Q1 '14 Q2 '14 Q3 '14 Q4 '14 Q1 '15 $17 $19 $19 $23 $18 CA-ROW Segment Loss ($MM) |
 ©2014 Gogo Inc. and Affiliates. Proprietary & Confidential. 16 2015 GUIDANCE 16 Revenue $485 - $505 million CA-NA $300 - $320 million BA $170 - $180 million CA-ROW $10 - $15 million Adjusted EBITDA $15 - $25 million Cash CAPEX $100 - $120 million |
 ©2014 Gogo Inc. and Affiliates. Proprietary & Confidential. 17 STRONG Q1 FINANCIAL PERFORMANCE 17 Record revenue of $116M, up 21% y/y Adjusted EBITDA of $8.2M, up 54% y/y Strong cash position of $400M WELL POSITIONED TO ACHIEVE OUR GOALS |
 Q&A |
 Appendix |
 ©2014 Gogo Inc. and Affiliates. Proprietary & Confidential. 20 CONVERTIBLE NOTES DETAILS 20 • $362 million aggregate principal amount of 3.75% Convertible Senior Notes issued in March 2015, due March 1, 2020; conversion price of $23.85 per share. • Conversion may occur prior to December 1, 2019 upon the occurrence of certain events or any time after December 1, 2019. • In conjunction with the convertible notes offering, the company entered into forward stock purchase transactions for approximately $140 million, representing 7.2 million shares to settle on or around March 1, 2020. Transaction Summary Accounting EPS Impact • “If converted” method is used to account for dilution caused by convertible notes. • Approximately 7.2 shares of common stock that will be effectively repurchased through the forward stock purchase transactions are treated as retired shares for basic and diluted EPS purposes although they remain legally outstanding. • Cash increased by $212 million, net of approximately $140 million in forward stock purchase transactions and $10.4 million in issuance costs. • Convertible allocation to long-term debt at the time of issuance is $262 million and additional paid in capital is $100 million. • Long-term debt portion of convertible is booked on the balance sheet at fair value and is accreted to full principal amount of convertible notes outstanding over life of notes. The accretion expense is recognized on the income statement as non-cash interest. |
 ©2014 Gogo Inc. and Affiliates. Proprietary & Confidential. 21 ADJUSTED EBITDA RECONCILIATION ($MM) 2009 2010 2011 2012 2013 2014 Q1 2014 Q2 2014 Q3 2014 Q4 2015 Q1 Net Income (142) (140) (18) (96) (146) (17) (19) (25) (24) (20) Interest Income (0) (0) (0) (0) (0) (0) (0) (0) (0) (0) Interest Expense 30 – 1 9 29 7 7 9 9 10 Income Tax Provision – 3 1 1 1 – – – – – Depreciation & Amortization 22 31 33 37 56 16 15 17 17 19 EBITDA (91) (106) 16 (49) (60) 6 4 2 2 9 Fair Value Derivative Adjustments – 33 (59) (10) 36 – – – – – Class A and Class B Senior Convertible Preferred Stock Return – 18 31 52 29 – – – – – Accretion of Preferred Stock – 9 10 10 5 – – – – – Stock-based Compensation Expense 1 2 2 4 6 2 2 3 3 3 Loss on Extinguishment of Debt 2 – – – – – – – – – Write Off of Deferred Equity Financing Costs – – – 5 – – – – – – Amortization of Deferred Airborne Lease Incentives – (1) (1) (4) (8) (3) (3) (4) (4) (4) Adjusted EBITDA (89) (45) (1) 9 8 5 3 1 1 8 Note: Minor differences exist due to rounding |
 ©2014 Gogo Inc. and Affiliates. Proprietary & Confidential. 22 CASH CAPEX RECONCILIATION ($MM) 2009 2010 2011 2012 2013 2014 Q1 2014 Q2 2014 Q3 2014 Q4 2015 Q1 Purchases of Property and Equipment (69) (33) (33) (67) (105) (32) (28) (35) (37) (53) Acquisition of Intangible Assets (Capitalized Software) (8) (7) (10) (12) (16) (4) (5) (5) (3) (4) Consolidated Capital Expenditures (77) (40) (43) (79) (121) (36) (33) (41) (40) (57) Change in Deferred Airborne Lease Incentives – 9 11 18 9 5 3 5 17 9 Amortization of Deferred Airborne Lease Incentives – 1 1 4 8 3 3 3 4 4 Landlord Incentives – – – – – – – 2 7 12 Cash CapEx (77) (30) (31) (58) (104) (29) (27) (30) (12) (32) Note: Minor differences exist due to rounding |