2nd Quarter 2017 Earnings Results Michael Small – Chief Executive Officer John Wade – Chief Operating Officer Barry Rowan – Chief Financial Officer August 7, 2017 Exhibit 99.2
Safe harbor statement Safe Harbor Statement This presentation contains “forward-looking statements” within the meaning of Section 27A of the Securities Act of 1933 and Section 21E of the Securities Exchange Act of 1934 that are based on management’s beliefs and assumptions and on information currently available to management. Most forward-looking statements contain words that identify them as forward-looking, such as “anticipates,” “believes,” “continues,” “could,” “seeks,” “estimates,” “expects,” “intends,” “may,” “plans,” “potential,” “predicts,” “projects,” “should,” “will,” “would” or similar expressions and the negatives of those terms that relate to future events. Forward-looking statements involve known and unknown risks, uncertainties and other factors that may cause Gogo’s actual results, performance or achievements to be materially different from any projected results, performance or achievements expressed or implied by the forward-looking statements. Forward-looking statements represent the beliefs and assumptions of Gogo only as of the date of this presentation and Gogo undertakes no obligation to update or revise publicly any such forward-looking statements, whether as a result of new information, future events or otherwise. As such, Gogo’s future results may vary from any expectations or goals expressed in, or implied by, the forward-looking statements included in this presentation, possibly to a material degree. Gogo cannot assure you that the assumptions made in preparing any of the forward-looking statements will prove accurate or that any long-term financial or operational goals and targets will be realized. In particular, the availability and performance of certain technology solutions yet to be implemented by the Company set forth in this presentation represent aspirational long-term goals based on current expectations. For a discussion of some of the important factors that could cause Gogo’s results to differ materially from those expressed in, or implied by, the forward-looking statements included in this presentation, investors should refer to the disclosures contained under the headings “Risk Factors” and “Cautionary Note Regarding Forward-Looking Statements” in the Company’s Annual Report on Form 10-K and Quarterly Reports on Form 10-Q. Note to Certain Operating and Financial Data In addition to disclosing financial results that are determined in accordance with U.S. generally accepted accounting principles (“GAAP”), Gogo also discloses in this presentation certain non-GAAP financial information, including Adjusted EBITDA, Adjusted EBITDA margin and Cash CAPEX. These financial measures are not recognized measures under GAAP, and when analyzing our performance or liquidity, as applicable, investors should (i) use Adjusted EBITDA and Adjusted EBITDA margin in addition to, and not as an alternative to, net loss attributable to common stock as a measure of operating results, and (ii) use Cash CAPEX in addition to, and not as an alternative to, consolidated capital expenditures when evaluating our liquidity. See the Appendix for a reconciliation of each of Adjusted EBITDA and Cash CAPEX to the comparable GAAP measure. No reconciliation of the forecasted range for Adjusted EBITDA for fiscal 2017 is included in this release because we are unable to quantify certain amounts that would be required to be included in the respective corresponding GAAP measure without unreasonable efforts and we believe such reconciliations would imply a degree of precision that would be confusing or misleading to investors. In particular, we are not able to provide a reconciliation for the forecasted range of Adjusted EBITDA for 2017 due to variability in the timing of aircraft installations and de-installations impacting depreciation expense and amortization of deferred airborne leasing proceeds. In addition, this presentation contains various customer metrics and operating data, including numbers of aircraft or units online, that are based on internal company data, as well as information relating to the commercial and business aviation market, and our position within those markets. While management believes such information and data are reliable, they have not been verified by an independent source and there are inherent challenges and limitations involved in compiling data across various geographies and from various sources.
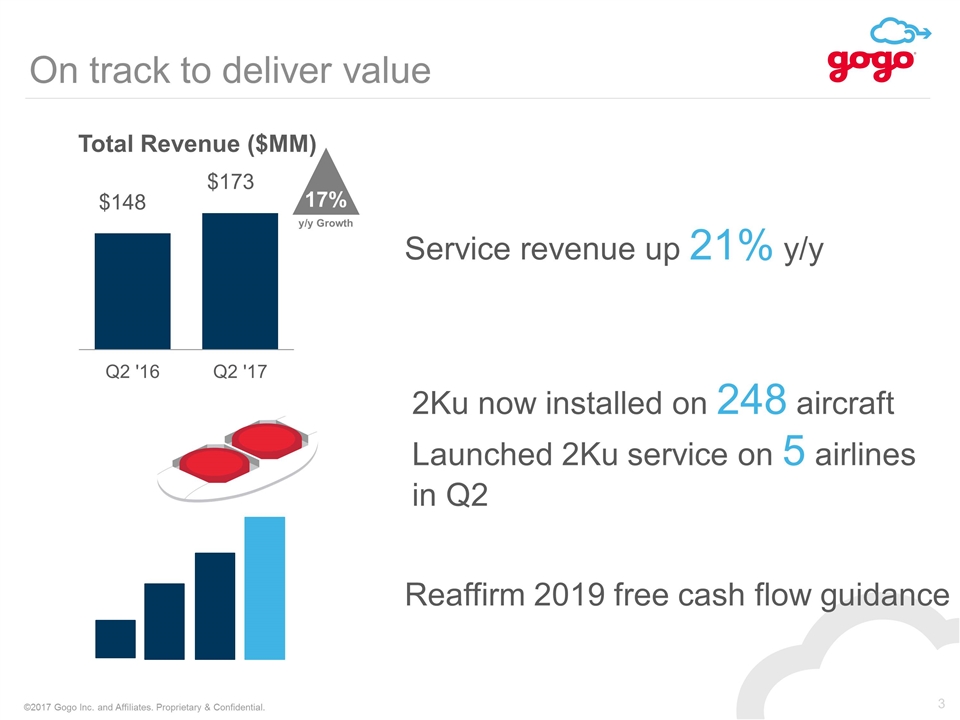
On track to deliver value 17% y/y Growth Total Revenue ($MM) 2Ku now installed on 248 aircraft Launched 2Ku service on 5 airlines in Q2 Reaffirm 2019 free cash flow guidance Service revenue up 21% y/y $148 $173
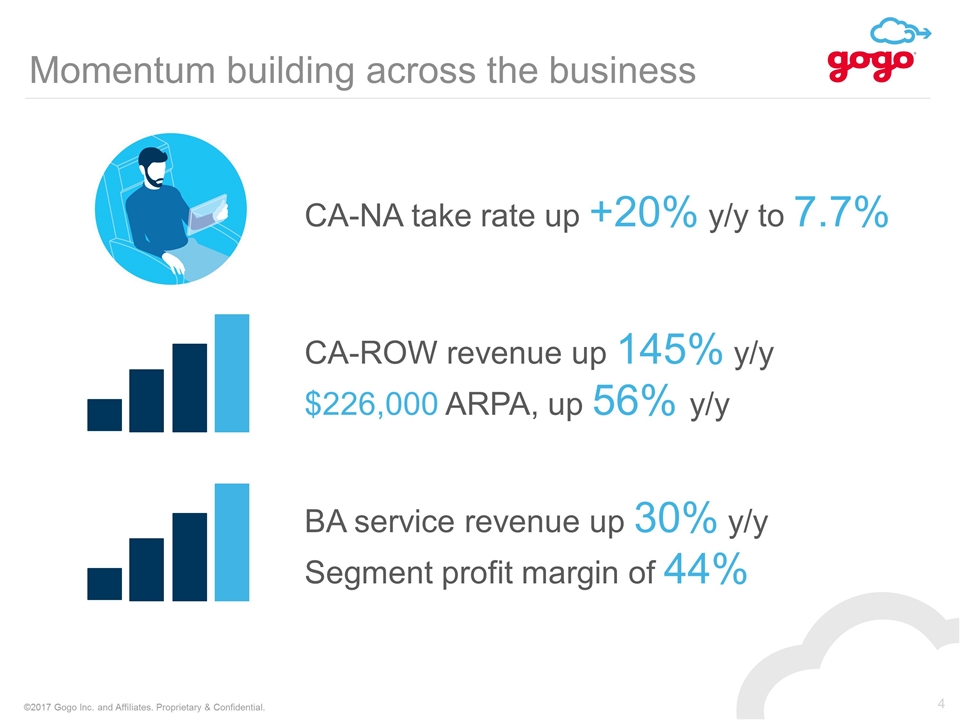
Momentum building across the business CA-NA take rate up +20% y/y to 7.7% CA-ROW revenue up 145% y/y $226,000 ARPA, up 56% y/y BA service revenue up 30% y/y Segment profit margin of 44%
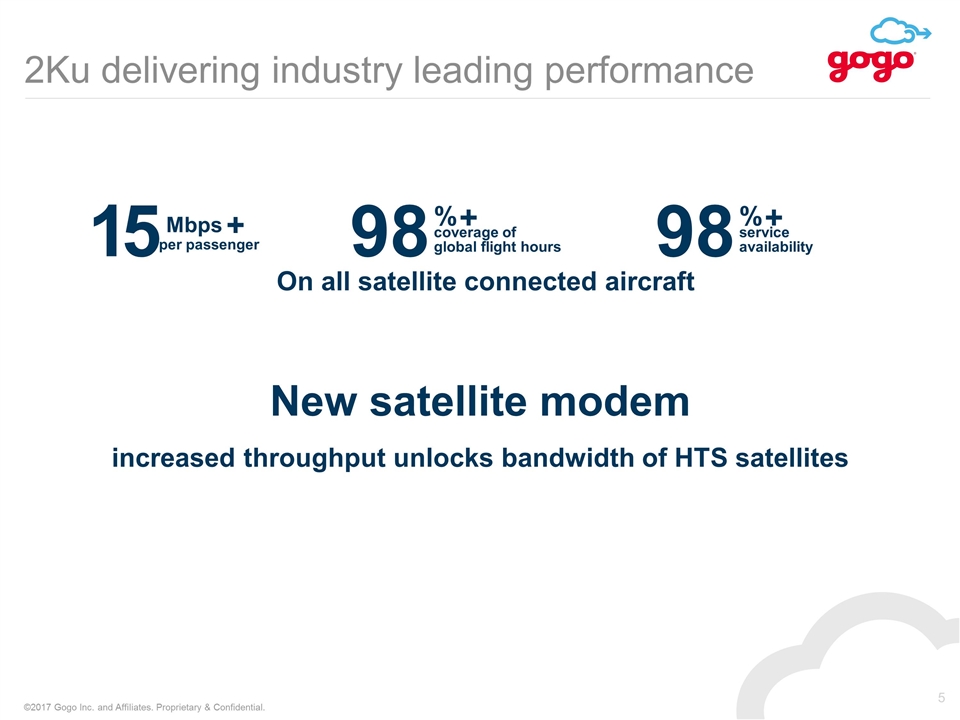
2Ku delivering industry leading performance On all satellite connected aircraft increased throughput unlocks bandwidth of HTS satellites New satellite modem 15 Mbps + per passenger 98 % + coverage of global flight hours 98 % + service availability
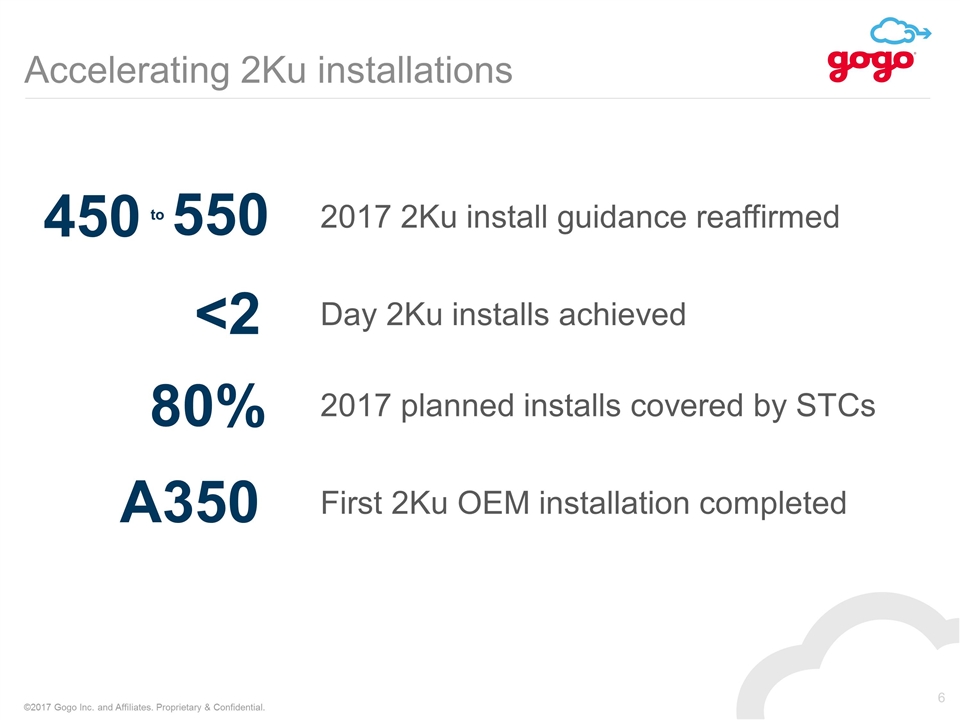
Accelerating 2Ku installations 2017 2Ku install guidance reaffirmed 550 450 to Day 2Ku installs achieved <2 2017 planned installs covered by STCs 80% A350 First 2Ku OEM installation completed
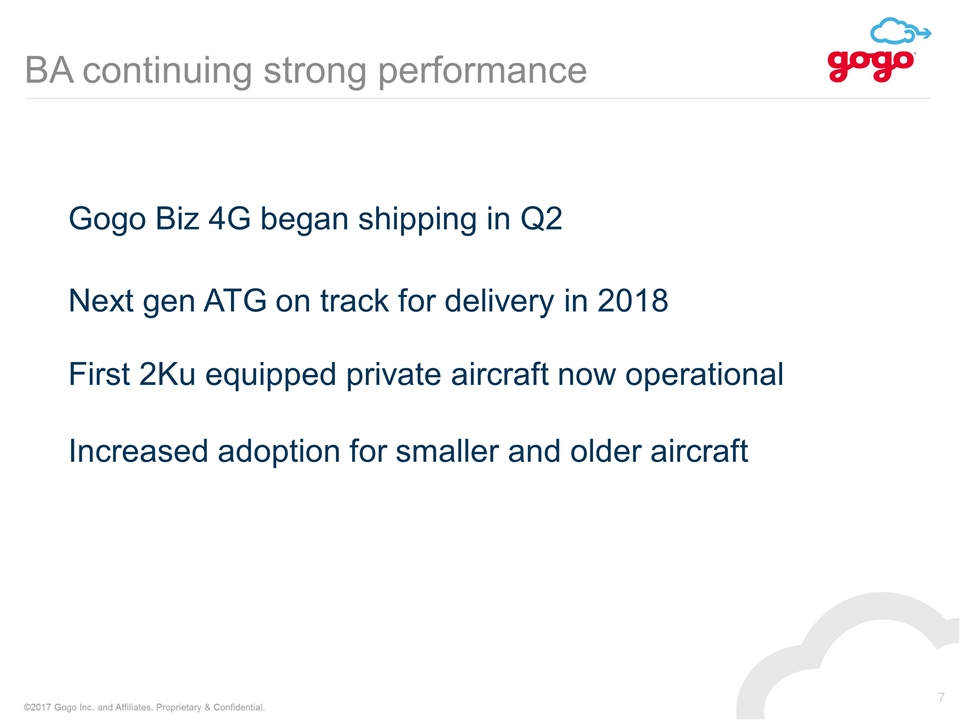
BA continuing strong performance Gogo Biz 4G began shipping in Q2 Next gen ATG on track for delivery in 2018 Increased adoption for smaller and older aircraft First 2Ku equipped private aircraft now operational
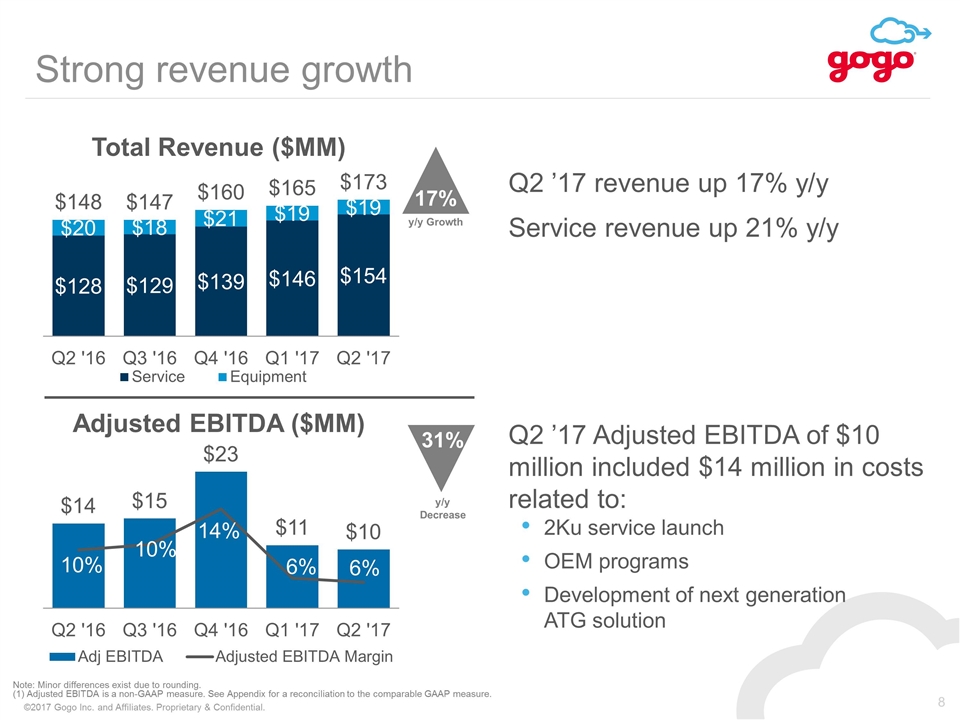
31% y/y Decrease Strong revenue growth 17% y/y Growth Q2 ’17 revenue up 17% y/y Service revenue up 21% y/y Q2 ’17 Adjusted EBITDA of $10 million included $14 million in costs related to: 2Ku service launch OEM programs Development of next generation ATG solution Note: Minor differences exist due to rounding. (1) Adjusted EBITDA is a non-GAAP measure. See Appendix for a reconciliation to the comparable GAAP measure.
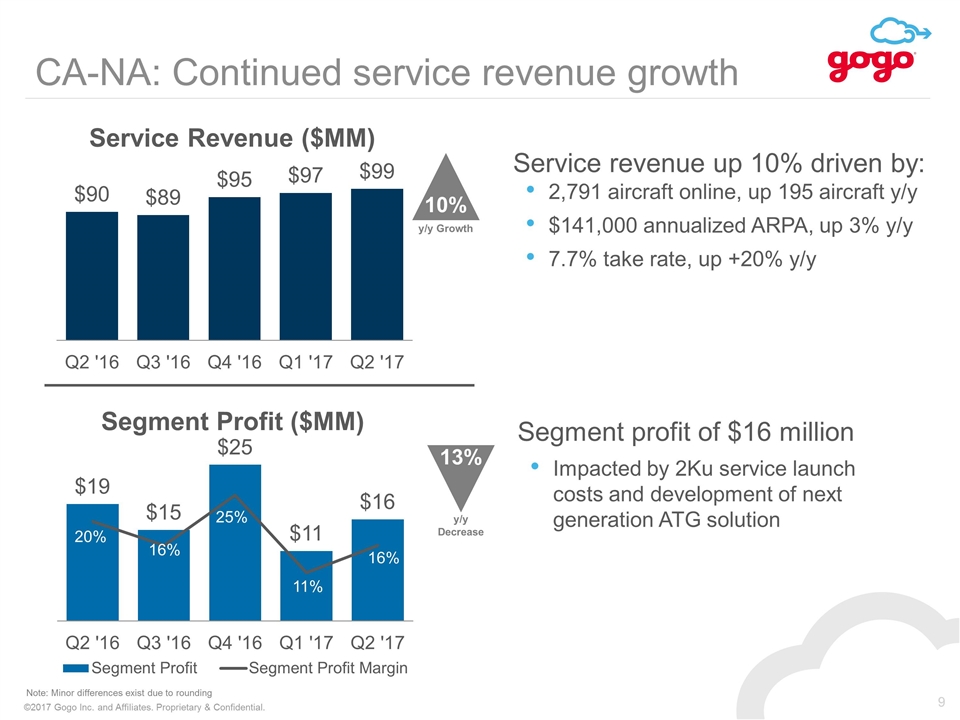
CA-NA: Continued service revenue growth 10% y/y Growth Service revenue up 10% driven by: 2,791 aircraft online, up 195 aircraft y/y $141,000 annualized ARPA, up 3% y/y 7.7% take rate, up +20% y/y Note: Minor differences exist due to rounding 13% y/y Decrease Segment profit of $16 million Impacted by 2Ku service launch costs and development of next generation ATG solution
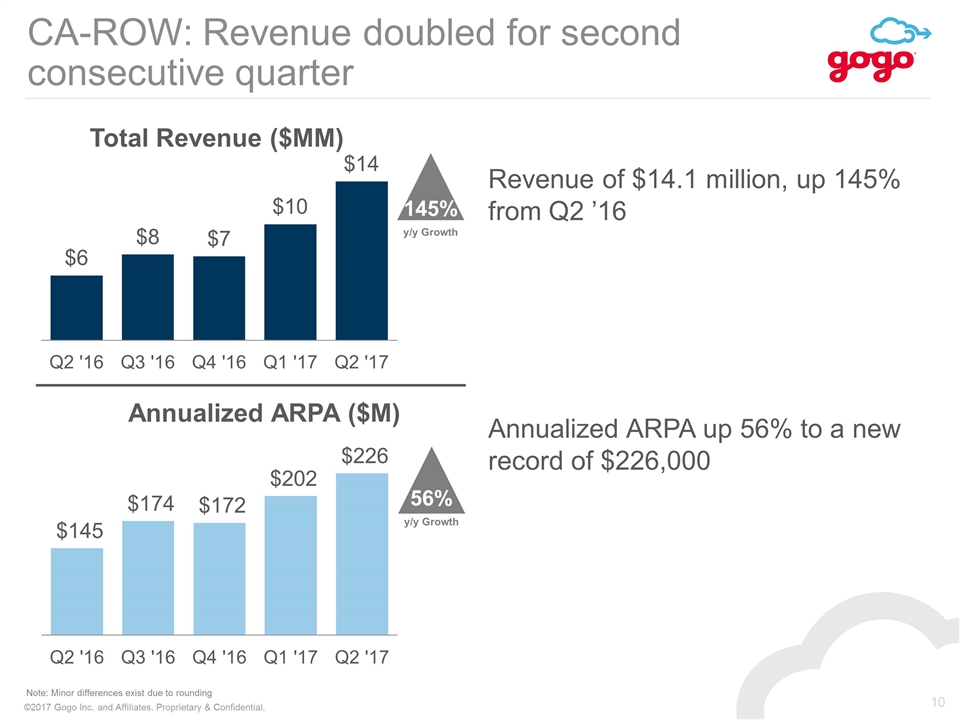
CA-ROW: Revenue doubled for second consecutive quarter 145% y/y Growth Note: Minor differences exist due to rounding Revenue of $14.1 million, up 145% from Q2 ’16 Annualized ARPA up 56% to a new record of $226,000 56% y/y Growth
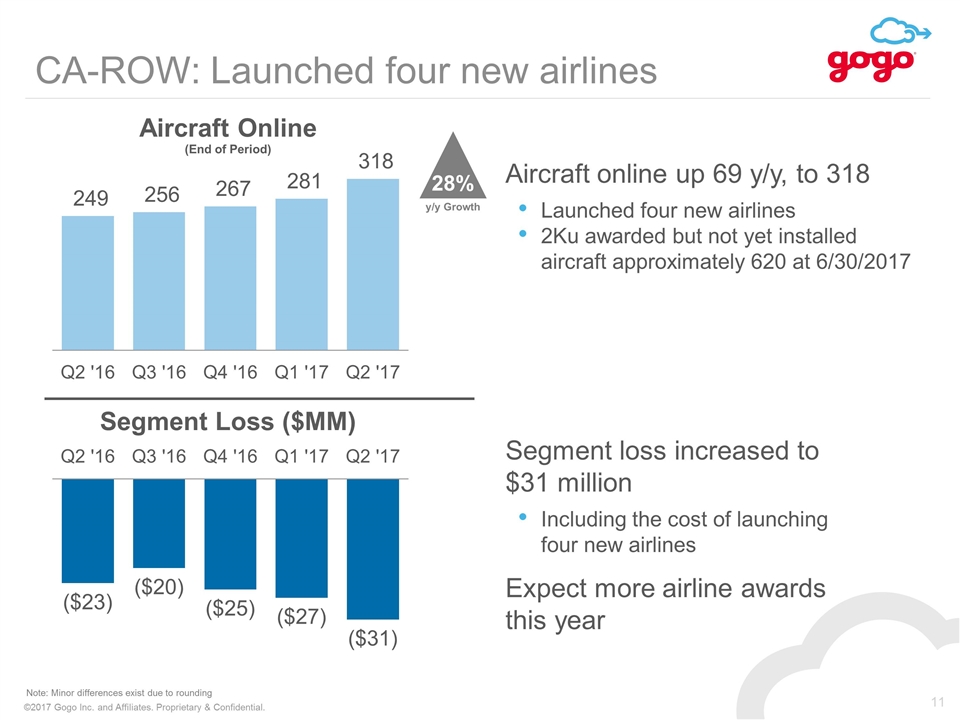
CA-ROW: Launched four new airlines Note: Minor differences exist due to rounding Aircraft online up 69 y/y, to 318 Launched four new airlines 2Ku awarded but not yet installed aircraft approximately 620 at 6/30/2017 Segment loss increased to $31 million Including the cost of launching four new airlines Expect more airline awards this year 28% y/y Growth
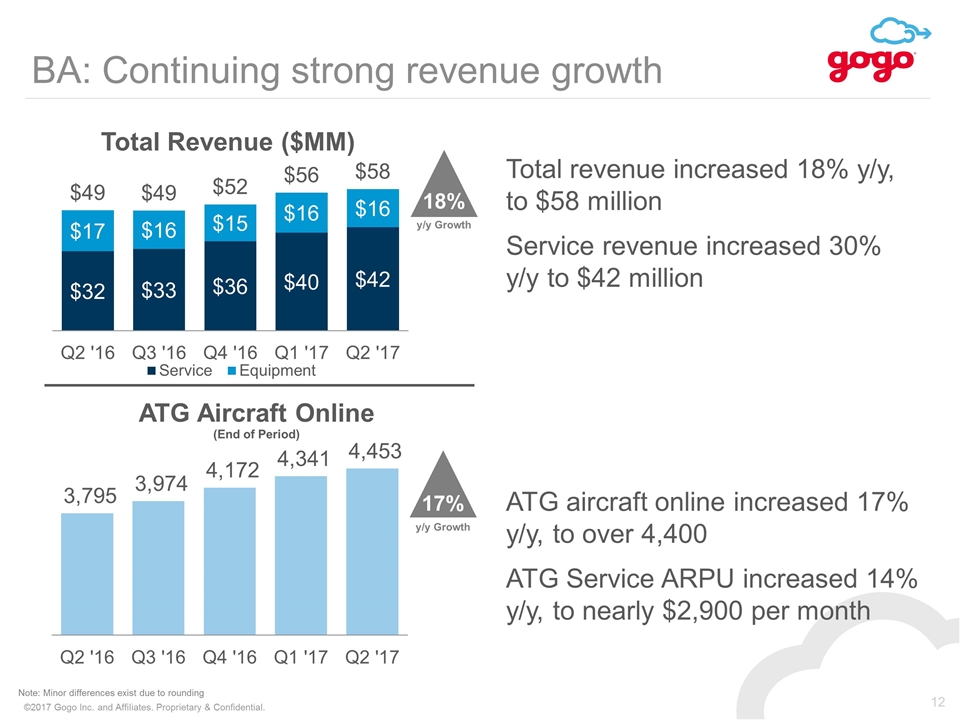
BA: Continuing strong revenue growth Total revenue increased 18% y/y, to $58 million Service revenue increased 30% y/y to $42 million ATG aircraft online increased 17% y/y, to over 4,400 ATG Service ARPU increased 14% y/y, to nearly $2,900 per month Note: Minor differences exist due to rounding 17% y/y Growth 18% y/y Growth
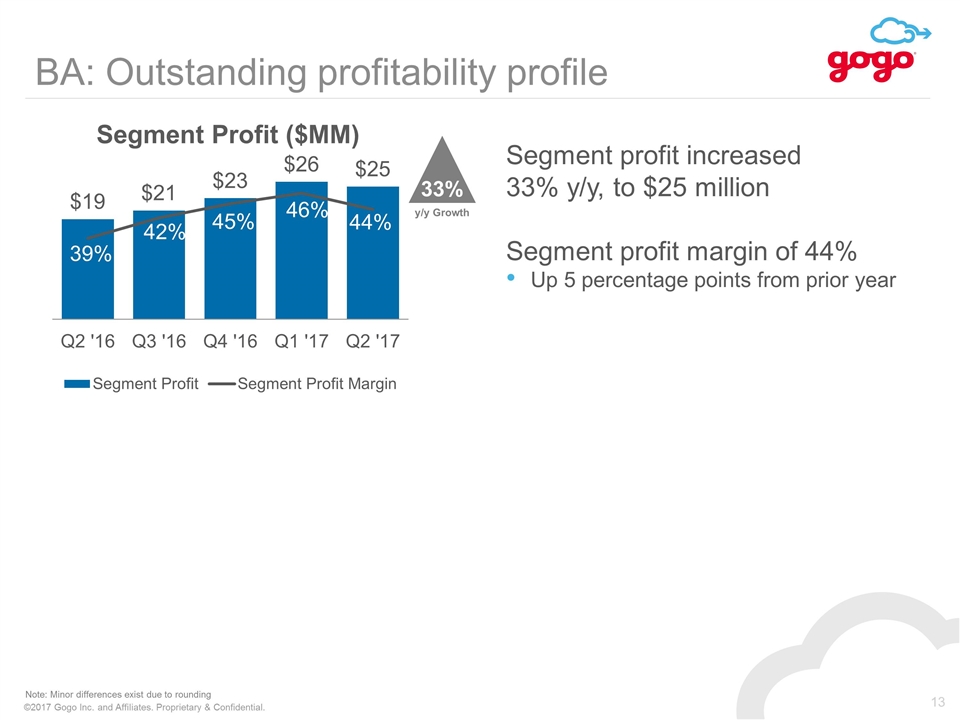
BA: Outstanding profitability profile Segment profit increased 33% y/y, to $25 million Segment profit margin of 44% Up 5 percentage points from prior year Note: Minor differences exist due to rounding 33% y/y Growth
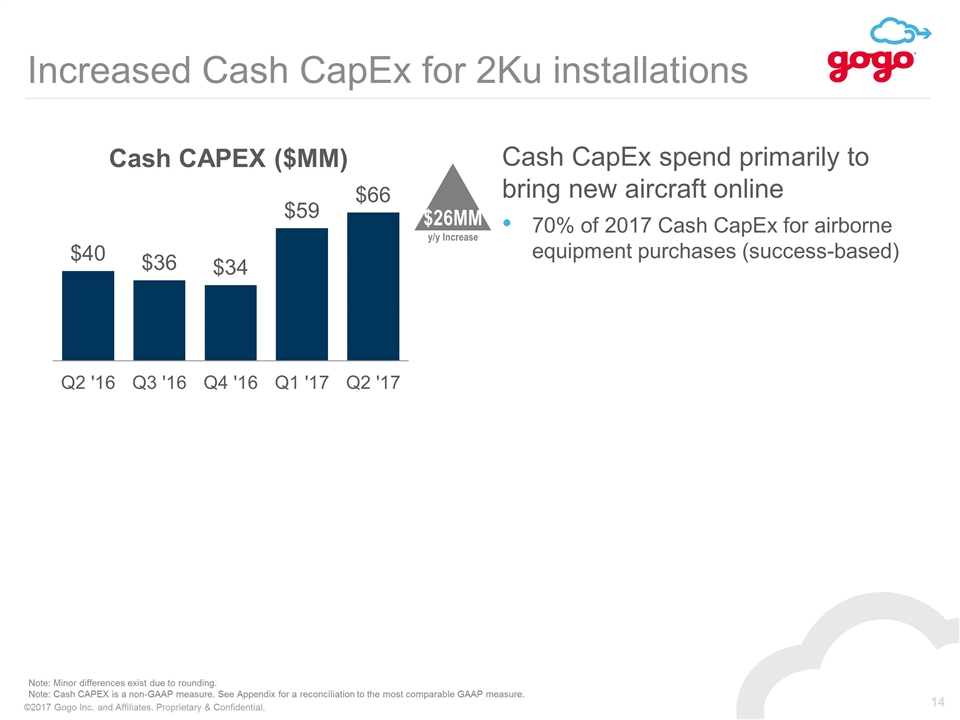
Increased Cash CapEx for 2Ku installations Note: Minor differences exist due to rounding. Note: Cash CAPEX is a non-GAAP measure. See Appendix for a reconciliation to the most comparable GAAP measure. $26MM y/y Increase Cash CapEx spend primarily to bring new aircraft online 70% of 2017 Cash CapEx for airborne equipment purchases (success-based)
Outlook On track to achieve 450-550 2Ku installs in 2017, including approximately 150 in CA-ROW Expect 2017 revenue to be at the high end of $670-$695 million guidance range Adjusted EBITDA expected to approximately double in the second half of 2017 and to be at the low end of $60-$75 million guidance range 2017 Cash CapEx of $230-$260 million, approximately 70% is related to success-based airborne equipment purchases Gogo reaffirms all other 2017 and long-term guidance previously provided in the fourth quarter 2016 earnings press release

Q&A
Appendix
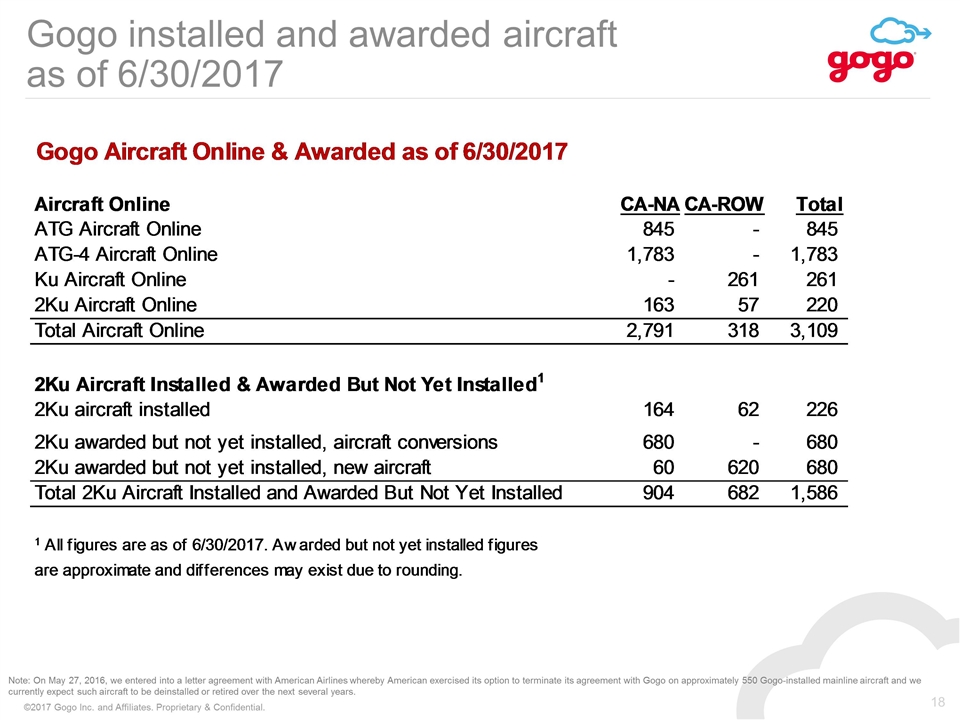
Gogo installed and awarded aircraft as of 6/30/2017 Note: On May 27, 2016, we entered into a letter agreement with American Airlines whereby American exercised its option to terminate its agreement with Gogo on approximately 550 Gogo-installed mainline aircraft and we currently expect such aircraft to be deinstalled or retired over the next several years.
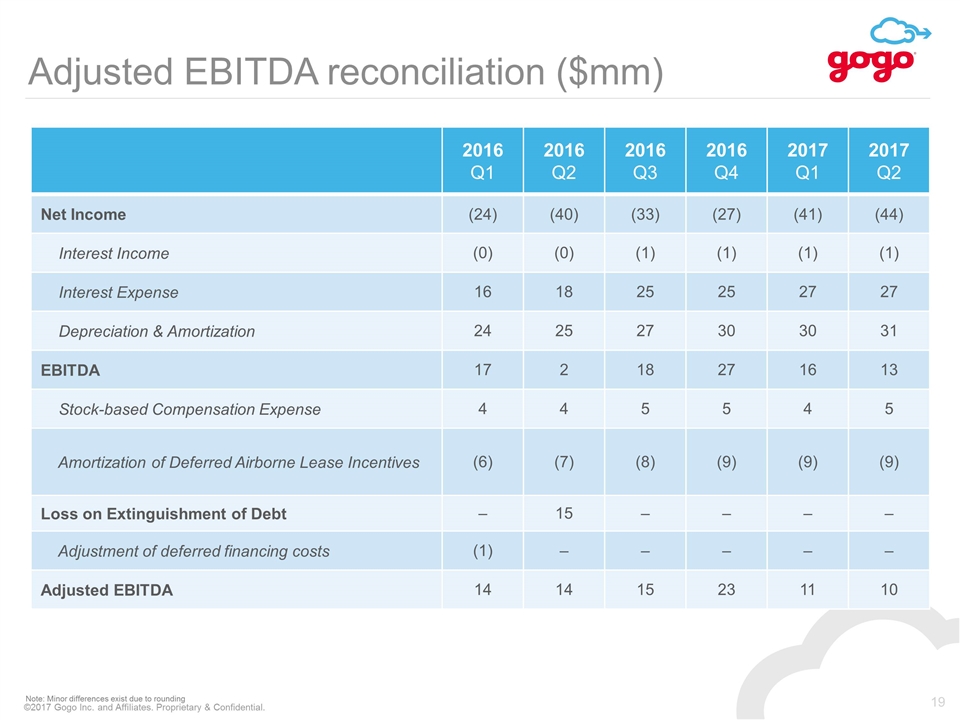
Adjusted EBITDA reconciliation ($mm) 2016 Q1 2016 Q2 2016 Q3 2016 Q4 2017 Q1 2017 Q2 Net Income (24) (40) (33) (27) (41) (44) Interest Income (0) (0) (1) (1) (1) (1) Interest Expense 16 18 25 25 27 27 Depreciation & Amortization 24 25 27 30 30 31 EBITDA 17 2 18 27 16 13 Stock-based Compensation Expense 4 4 5 5 4 5 Amortization of Deferred Airborne Lease Incentives (6) (7) (8) (9) (9) (9) Loss on Extinguishment of Debt – 15 – – – – Adjustment of deferred financing costs (1) – – – – – Adjusted EBITDA 14 14 15 23 11 10 Note: Minor differences exist due to rounding
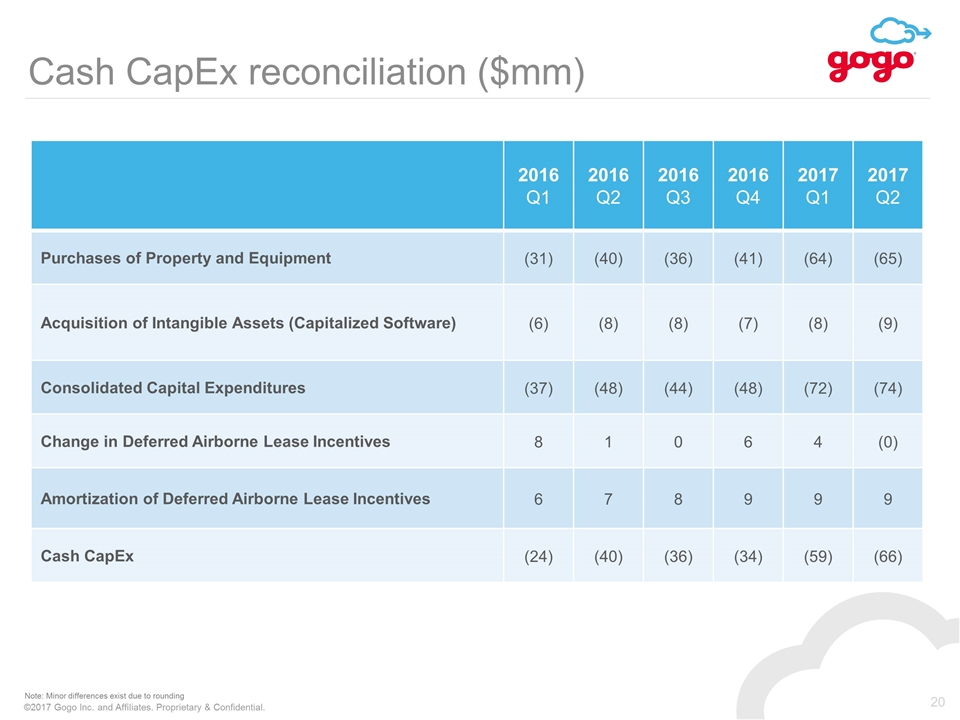
Cash CapEx reconciliation ($mm) 2016 Q1 2016 Q2 2016 Q3 2016 Q4 2017 Q1 2017 Q2 Purchases of Property and Equipment (31) (40) (36) (41) (64) (65) Acquisition of Intangible Assets (Capitalized Software) (6) (8) (8) (7) (8) (9) Consolidated Capital Expenditures (37) (48) (44) (48) (72) (74) Change in Deferred Airborne Lease Incentives 8 1 0 6 4 (0) Amortization of Deferred Airborne Lease Incentives 6 7 8 9 9 9 Cash CapEx (24) (40) (36) (34) (59) (66) Note: Minor differences exist due to rounding


