DEAR UNITHOLDERS,
2012 was another successful year for Brookfield Canada Office Properties (“BOX”) (TSX: BOX.UN, NYSE: BOXC) as we successfully integrated our newest properties in Toronto and Ottawa which were acquired in December 2011. Our performance over the past year reiterates our belief that BOX offers institutional investors and individual shareholders alike the best option to invest in the most prestigious office properties in Canada. Although we continue to believe there is room for the value of our units to grow in the market, we were pleased that our unitholders realized a 25% total return on investment over the course of the year.
We are currently invested in 28 office properties totaling 20.7 million square feet across Toronto, Ottawa, Calgary and Vancouver, each of those cities having exhibited positive real estate fundamentals over the course of the year. Our best-in-class office towers help define the skylines in these markets – from Bay Wellington Tower and First Canadian Place in Toronto to Bankers Hall and Suncor Energy Centre in Calgary. Our portfolio consistently outperforms the market in terms of occupancy and achievable rents.
FINANCIAL PERFORMANCE Funds from operations (FFO) was $139.0 million in 2012, a 9% increase from the 2011 total of $127.0 million. Commercial property net operating income increased 15% year-over-year, to $269.2 million in 2012 from $234.6 million in 2011. Net income, which under IFRS measures changes in the fair values of an entity’s assets, increased 48% over the course of the year to $527.5 million. This increase speaks to the strength of the Canadian office markets we are invested in and the quality of our assets therein. LEASING BOX achieved a full-year leasing total of 1.3 million square feet and our occupancy rate finished the year at 96.9%, an increase of 70 basis points from year-end 2011. This rate compares favourably with the Canadian national average of 92.8%. Leasing highlights for 2012 include: • A five-year renewal for 145,000 square feet with Bennett Jones Services Limited at First Canadian Place, Toronto • A six-year renewal for 95,000 square feet with PwC Management Services at Suncor Energy Centre, Calgary. Subsequent to year-end, the renewal term was increased by four years to ten years in total. | | • A six-year renewal and expansion for 56,000 square feet with McMillan LLP at Royal Centre, Vancouver • A 14-year new lease for 43,000 square feet with Deloitte Management at Bankers Court, Calgary • A five-year renewal for 40,000 square feet with Spectra Energy Corp. at Royal Centre, Vancouver CAPITAL INITIATIVES Continuing to take advantage of the appealing interest rate environment, we executed several capital initiatives of note during 2012, including: •Increased the Corporate Credit Facility.The Trust increased its liquidity by upsizing its corporate credit facility by $75 million to $200 million. •Refinanced debt at Exchange Tower, Toronto for $120 million.After repayment of the previous mortgage, the Trust generated net proceeds of $65 million. The new financing has a ten-year term with a fixed rate of 4.031% per annum. •Refinanced debt at Royal Centre, Vancouver for $150 million.After repayment of the previous mortgage, the Trust generated net proceeds of $39 million. The new financing has a three-year term with a fixed interest rate of 3.325% per annum. |
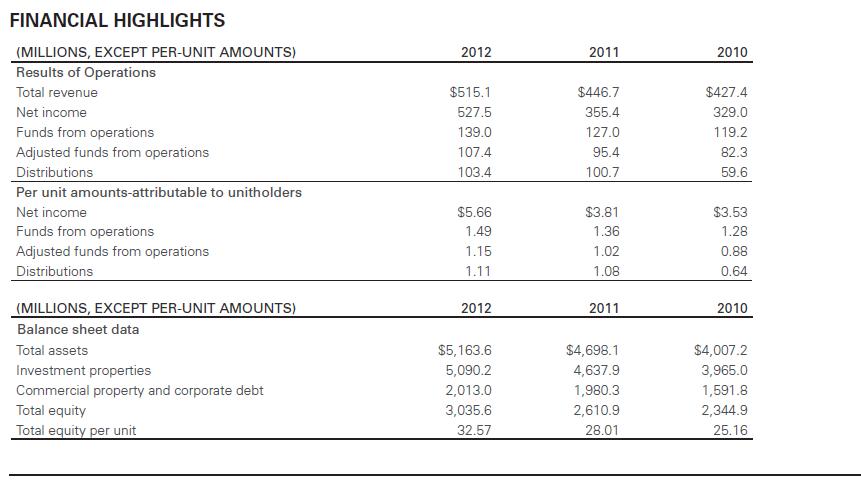
FINANCIAL HIGHLIGHTS
(MILLIONS, EXCEPT PER-UNIT AMOUNTS) 2012 2011 2010
Results of Operations
Total revenue $515.1 $446.7 $427.4
Net income 527.5 355.4 329.0
Funds from operations 139.0 127.0 119.2
Adjusted funds from operations 107.4 95.4 82.3
Distributions 103.4 100.7 59.6
Per unit amounts-attributable to unitholders
Net income $5.66 $3.81 $3.53
Funds from operations 1.49 1.36 1.28
Adjusted funds from operations 1.15 1.02 0.88
Distributions 1.11 1.08 0.64
(MILLIONS, EXCEPT PER-UNIT AMOUNTS) 2012 2011 2010
Balance sheet data
Total assets $5,163.6 $4,698.1 $4,007.2
Investment properties 5,090.2 4,637.9 3,965.0
Commercial property and corporate debt 2,013.0 1,980.3 1,591.8
Total equity 3,035.6 2,610.9 2,344.9
Total equity per unit 32.57 28.01 25.16
• Extended the $10 million debt at 151 Yonge St., Toronto, for a two-year period to July 2014 at a rate of bankers’ acceptance plus 170 basis points. • Refinanced debt at HSBC Building, Toronto for $45 million. After repayment of the previous mortgage, the Trust generated net proceeds of $24 million. The new financing has a ten-year term with a fixed interest rate of 4.056% per annum. • Early refinanced debt at Bay Wellington Tower, Toronto for $525 million, subsequent to year-end. After repayment of the previous mortgage, the Trust generated net proceeds of $213 million of which a portion of the proceeds was used to fully repay the Trust’s corporate revolver. The new financing has a seven-year term with a fixed interest rate of 3.244% per annum. REJUVENTATION PROGRAM AT FIRST CANADIAN PLACE After three years of extensive exterior and interior renovation work, First Canadian Place, Canada’s tallest building, celebrated the completion of its large-scale rejuvenation project, Redefining First. Brookfield transformed the 72-storey, 2.8-million-square-foot building into a spectacular, energy-conscious centre for business, retail and leisure. | | The most visible change to the iconic office tower was the total recladding of the building’s exterior. Replaced were the existing 45,000 pieces of Carrera marble with architecturally unique glass spandrel panels, creating a shimmering “new” silhouette on the Toronto skyline. Other significant upgrades included a refurbished main entrance, retail concourse and market area, along with a new physical plant and numerous energy efficiency upgrades to the building’s infrastructure. ENVIRONMENTAL INITIATIVES In addition to the changes described above, comprehensive environmental upgrades associated with the renovation led to First Canadian Place’s achieving LEED (Leadership in Energy and Environmental Design) Gold certification. Joining First Canadian Place, the following BOX properties achieved LEED EB:OM (Existing Buildings: Operations and Maintenance) Gold certification in 2012: • Bay Wellington Tower, Toronto • Exchange Tower, Toronto • HSBC Building, Toronto • Bankers Hall, Calgary • Suncor Energy Centre, Calgary • Fifth Avenue Place, Calgary |
These properties join Bay Adelaide Centre West in Toronto and Bankers Court in Calgary, both of which were certified upon their completion in 2009. Our portfolio is now 72% LEED-Gold certified. DISTRIBUTION INCREASE In July 2012, the Board of Trustees was pleased to declare an 8% increase to the yearly distribution per trust unit from $1.08 to $1.17. The Board and the rest of the management team felt that this increase in payout to those that hold our units was an appropriate and timely use of capital. TRADING ON NYSE In January 2012, BOX’s trust units began trading on the New York Stock Exchange (NYSE) under the stock symbol “BOXC.” Listing on the NYSE has opened up the opportunity to a wider range of companies and individuals looking to invest in the best commercial office properties in Canada. 2013 OUTLOOK & PRIORITIES • As always, our first area of focus is leasing. We will continue our strategy of being proactive and maintaining an above-market occupancy rate. In particular, our main priorities are squarely aimed at the renewal of the government leases in Ottawa and leasing the larger vacancies within our portfolio. Specifically, these are in Toronto at 151 Yonge Street, First Canadian Place and Exchange Tower. | | • Our second objective is to generate and preserve capital through refinancing and seek out opportunistic re-financings in advance of maturity dates given the continued low interest rate environment. We had significant success in this area during 2012 and as a result have built up our cash reserves. We will continue to look for opportunities to deploy the cash generated from recent up-financings. • Our third objective is to complete our sustainability initiatives. As mentioned earlier, 72% of our properties are LEED Gold-certified. We are targeting to certify to LEED Gold our Royal Centre property in Vancouver in 2013. Upon completion of our sustainability initiatives, we will monitor the quantitative impact and be proactive in reducing energy consumption and operating costs. Our operating markets remain strong and we will continue to look for opportunities to grow our business and add value for our unitholders. On behalf of our employees and the Board of Trustees, I thank you for your continued support. Sincerely, 
Jan Sucharda President & Chief Executive Officer |
Portfolio by City
Brookfield Canada Office Properties’ portfolio is composed of interests in 28 premier office properties totaling 20.7 million square feet, including 4.0 million square feet of parking. Landmark properties include Brookfield Place and First Canadian Place in Toronto and Bankers Hall in Calgary.
| (Square feet in 000’s) | Number of Properties | Leased % | Office | Retail | Leasable Area | Parking | Total | Ownership Interest % | Owned Interest |
| TORONTO | | | | | | | | | |
| First Canadian Place | 1 | 90.3% | 2,379 | 232 | 2,611 | 169 | 2,780 | 25% | 695 |
| Bay Wellington Tower | 1 | 98.1% | 1,297 | 42 | 1,339 | — | 1,339 | 100% | 1,339 |
| Brookfield Place Retail & Parking(1) | 1 | 97.6% | — | 52 | 52 | 690 | 742 | 56% | 412 |
| Bay Adelaide Centre West Tower | 1 | 95.4% | 1,155 | 37 | 1,192 | 382 | 1,574 | 100% | 1,574 |
| Exchange Tower | 1 | 91.1% | 963 | 66 | 1,029 | 131 | 1,160 | 50% | 580 |
| Hudson's Bay Centre | 1 | 99.9% | 536 | 209 | 745 | 186 | 931 | 100% | 931 |
| 2 Queen St. E. | 1 | 100.0% | 448 | 16 | 464 | 81 | 545 | 25% | 136 |
| Queen’s Quay Terminal | 1 | 98.3% | 427 | 78 | 505 | — | 505 | 100% | 505 |
| 151 Yonge St. | 1 | 85.0% | 289 | 11 | 300 | 72 | 372 | 25% | 93 |
| 105 Adelaide St. West | 1 | 100.0% | 177 | 7 | 184 | 48 | 232 | 100% | 232 |
| HSBC Building | 1 | 98.9% | 188 | 6 | 194 | 31 | 225 | 100% | 225 |
| 22 Front St. West | 1 | 100.0% | 136 | 8 | 144 | — | 144 | 100% | 144 |
| | 12 | 94.5% | 7,995 | 764 | 8,759 | 1,790 | 10,549 | | 6,866 |
| | | | | | | | | | |
| OTTAWA | | | | | | | | | |
| Place de Ville I | 2 | 99.9% | 570 | 12 | 582 | 502 | 1,084 | 25% | 271 |
| Place de Ville II | 2 | 99.2% | 597 | 12 | 609 | 433 | 1,042 | 25% | 261 |
| Jean Edmonds Towers | 2 | 100.0% | 541 | 13 | 554 | 95 | 649 | 25% | 162 |
| | 6 | 99.7% | 1,708 | 37 | 1,745 | 1,030 | 2,775 | | 694 |
| | | | | | | | | | |
| CALGARY | | | | | | | | | |
| Bankers Hall | 3 | 99.7% | 1,944 | 224 | 2,168 | 409 | 2,577 | 50% | 1,289 |
| Bankers Court | 1 | 98.8% | 256 | 7 | 263 | 62 | 325 | 50% | 163 |
| Suncor Energy Centre | 2 | 99.6% | 1,710 | 22 | 1,732 | 220 | 1,952 | 50% | 976 |
| Fifth Avenue Place | 2 | 99.8% | 1,430 | 46 | 1,476 | 206 | 1,682 | 50% | 841 |
| | 8 | 99.6% | 5,340 | 299 | 5,639 | 897 | 6,536 | | 3,269 |
| VANCOUVER | | | | | | | | | |
| Royal Centre | 1 | 97.7% | 493 | 96 | 589 | 264 | 853 | 100% | 853 |
| OTHER | | | | | | | | | |
| Merivale Place, Nepean | 1 | 100.0% | — | 3 | 3 | — | 3 | 100% | 3 |
| TOTAL PORTFOLIO | 28 | 96.9% | 15,536 | 1,199 | 16,735 | 3,981 | 20,716 | | 11,685 |
| | | | | | | | | | | | |
(1) Brookfield Canada Office Properties owns a 50% interest in the retail operations and is entitled to a 56% interest in the parking operations.
Contents
| MANAGEMENT’S DISCUSSION AND ANALYSIS OF FINANCIAL RESULTS | |
| | |
| PART I – OBJECTIVES AND FINANCIAL HIGHLIGHTS | 4 |
| | |
| PART II – FINANCIAL STATEMENT ANALYSIS | 9 |
| | |
| PART III – RISKS AND UNCERTAINTIES | 22 |
| | |
| PART IV – CRITICAL ACCOUNTING POLICIES AND ESTIMATES | 25 |
| | |
| PART V – BUSINESS ENVIRONMENT AND OUTLOOK | 28 |
| | |
| MANAGEMENT’S RESPONSIBILITY FOR THE FINANCIAL STATEMENTS | 30 |
| | |
| REPORT OF INDEPENDENT REGISTERED CHARTERED ACCOUNTANTS | 31 |
| | |
| Management’s Report on Internal Control over Financial Reporting | 32 |
| | |
| REPORT OF INDEPENDENT REGISTERED CHARTERED ACCOUNTANTS | 33 |
| | |
| CONSOLIDATED FINANCIAL STATEMENTS | 34 |
| | |
| NOTES TO THE CONSOLIDATED FINANCIAL STATEMENTS | 38 |
| | |
| UNITHOLDER INFORMATION | 51 |
| | |
| SELECTED FINANCIAL AND OPERATIONAL INFORMATION | 52 |
| | |
| BOARD OF TRUSTEES AND OFFICERS | 53 |
FORWARD-LOOKING STATEMENTS
This annual report to unitholders contains “forward-looking information” within the meaning of Canadian provincial securities laws and “forward-looking statements” within the meaning of Section 27A of the U.S. Securities Act of 1933, as amended, Section 21E of the U.S. Securities Exchange Act of 1934, as amended, “safe harbor” provisions of the United States Private Securities Litigation Reform Act of 1995 and in any applicable Canadian securities regulations. Forward-looking statements include statements that are predictive in nature, depend upon or refer to future events or conditions, include statements regarding the operations, business, financial condition, expected financial results, performance, prospects, opportunities, priorities, targets, goals, ongoing objectives, strategies and outlook of the Trust and its subsidiaries, as well as the outlook for the Canadian economy for the current fiscal year and subsequent periods, and include words such as “expects”, “anticipates”, “plans”, “believes”, “estimates”, “seeks”, “intends”, “targets”, “projects”, “forecasts” or negative versions thereof and other similar expressions, or future or conditional verbs such as “may”, “will”, “should”, “would” and “could”.
Although the Trust believes that the anticipated future results, performance or achievements expressed or implied by the forward-looking statements and information are based upon reasonable assumptions and expectations, the reader should not place undue reliance on forward-looking statements and information because they involve known and unknown risks, uncertainties and other factors, many of which are beyond the control of the Trust, which may cause the actual results, performance or achievements of the Trust to differ materially from anticipated future results, performance or achievement expressed or implied by such forward-looking statements and information.
Factors that could cause actual results to differ materially from those contemplated or implied by forward-looking statements include, but are not limited to: risks incidental to the ownership and operation of real estate properties including local real estate conditions, the ability to enter into new leases or renew leases on favorable terms, dependence on tenants’ financial condition, uncertainties of real estate development, acquisition and disposition activity; the impact or unanticipated impact of general economic, political and market factors in Canada; the behavior of financial markets, including fluctuations in interest rates; equity and capital markets and the availability of equity and debt financing and refinancing within these markets; the ability to complete and effectively integrate acquisitions into existing operations and the ability to attain expected benefits therefrom; changes in accounting policies and methods used to report financial condition (including uncertainties associated with critical accounting assumptions and estimates); the effect of applying future accounting changes; business competition; operational and reputational risks; changes in government regulation and legislation; changes in tax laws, catastrophic events, such as earthquakes and hurricanes; the possible impact of international conflicts and other developments including terrorist acts; and other risks and factors detailed from time to time in our documents filed with the securities regulators in Canada and the United States.
Caution should be taken that the foregoing list of important factors that may affect future results is not exhaustive. When relying on the Trust’s forward-looking statements, investors and others should carefully consider the foregoing factors and other uncertainties and potential events. Except as required by law, the Trust undertakes no obligation to publicly update or revise any forward-looking statements or information, whether written or oral, that may be as a result of new information, future events or otherwise.
Management’s Discussion and Analysis of Financial Results
March 1, 2013
PART I – OBJECTIVES AND FINANCIAL HIGHLIGHTS
BASIS OF PRESENTATION
Financial data included in this Management’s Discussion and Analysis (“MD&A”) for the year ended December 31, 2012, includes material information up to March 1, 2013. Financial data provided has been prepared in accordance with International Financial Reporting Standards as issued by the International Accounting Standards Board (“IFRS”). All dollar references, unless otherwise stated, are in millions of Canadian dollars except per unit amounts. Amounts in U.S. dollars are identified as “US$.”
Brookfield Canada Office Properties (“BOX” or the “Trust”) was formed in connection with the reorganization of BPO Properties Ltd. (“BPP”) on May 1, 2010, in which BPP’s directly owned office assets were transferred to the Trust. In connection with the reorganization, the Trust also acquired the interests of Brookfield Office Properties Inc. (“BPO” or “Brookfield Office Properties”) in Brookfield Place, which includes Bay Wellington Tower and partial interests in the retail concourse and parking operations.
On December 1, 2011, we acquired from our parent company, BPP, a 25% interest in nine office assets from its Canadian Office Fund portfolio totaling 6.5 million square feet in Toronto and Ottawa (the “Acquired Assets” or the “Acquisition”).
The following discussion and analysis is intended to provide readers with an assessment of the performance of BOX over the past two years as well as our financial position and future prospects. It should be read in conjunction with the consolidated financial statements and appended notes, which begin on page 34 of this report. In Part II – Financial Statement Analysis, we review our operating performance and financial position as presented in our financial statements prepared in accordance with IFRS.
In our discussion of operating performance, we refer to commercial property net operating income, funds from operations, and adjusted funds from operations on a total and per-unit basis. Commercial property net operating income, funds from operations, adjusted funds from operations and total equity per unit do not have any standardized meaning prescribed by IFRS and therefore may not be comparable to similar measures presented by other companies. We define commercial property net operating income as income from commercial property operations after direct property operating expenses, including property administration costs have been deducted but prior to deducting interest expense, general and administrative expenses, and fair value gains (losses). We define funds from operations as net income prior to transaction costs and fair value gains (losses). Adjusted funds from operations is defined by us as funds from operations net of normalized second-generation leasing commissions and tenant improvements, normalized sustaining capital expenditures, and straight-line rental income. Total equity per unit represents the book value of our total equity, divided by total units outstanding.
Commercial property net operating income is an important measure that we use to assess operating performance of our commercial properties, and funds from operations is a widely used measure in analyzing the performance of real estate. Adjusted funds from operations is a measure used to assess an entity’s ability to pay distributions. We provide the components of commercial property net operating income on page 17, a reconciliation of net income to funds from operations and adjusted funds from operations on page 20, and a reconciliation of cash generated from operating activities to adjusted funds from operations on page 20.
Additional information, including our Annual Information Form, is available on our Web site atwww.brookfieldcanadareit.com or at www.sedar.com or www.sec.gov.
OVERVIEW OF THE BUSINESS
BOX is a publicly traded, real estate investment trust listed on the Toronto and New York stock exchanges under the symbol BOX.UN and BOXC, respectively.
The Trust invests and operates commercial office properties in Toronto, Ottawa, Calgary, and Vancouver.
At December 31, 2012, the carrying value of BOX’s total assets was $5,163.6 million. During 2012, we generated $527.5 million of net income ($5.66 per unit), $139.0 million of funds from operations ($1.49 per unit), and $107.4 million of adjusted funds from operations ($1.15 per unit).
FINANCIAL HIGHLIGHTS
BOX’s financial results are as follows:
| (Millions, except per-unit amounts) | | | 2012 | | 2011 | | 2010 |
| Results of operations | | | | | | | | | |
| Total revenue | | | | $ | 515.1 | $ | 446.7 | $ | 427.4 |
| Net income | | | | | 527.5 | | 355.4 | | 329.0 |
| Funds from operations(1) | | | | | 139.0 | | 127.0 | | 119.2 |
| Adjusted funds from operations(1) | | | | | 107.4 | | 95.4 | | 82.3 |
| Distributions | | | | | 103.4 | | 100.7 | | 59.6 |
| Per unit amounts – attributable to unitholders | | | | | | | | | |
| Net income | | | | | 5.66 | | 3.81 | | 3.53 |
| Funds from operations | | | | | 1.49 | | 1.36 | | 1.28 |
| Adjusted funds from operations | | | | | 1.15 | | 1.02 | | 0.88 |
| Distributions | | | | | 1.11 | | 1.08 | | 0.64 |
| | | | |
| (Millions, except per-unit amounts) | Dec. 31, 2012 | Dec. 31, 2011 | Dec. 31, 2010 |
| Balance sheet data | | | | | | |
| Total assets | $ | 5,163.6 | $ | 4,698.1 | $ | 4,007.2 |
| Investment properties | | 5,090.2 | | 4,637.9 | | 3,965.0 |
| Commercial property and corporate debt | | 2,013.0 | | 1,980.3 | | 1,591.8 |
| Total equity | | 3,035.6 | | 2,610.9 | | 2,344.9 |
| Total equity per unit(1) | | 32.57 | | 28.01 | | 25.16 |
| | | | | | | | | | | | |
(1) Non-IFRS measure. Refer to page 7 for description of non-IFRS measures and reference to reconciliation to comparable IFRS measures.
COMMERCIAL-PROPERTY OPERATIONS
Our strategy is to own premier properties in dynamic and supply-constrained markets with high barriers to entry, creating one of Canada’s most distinguished portfolios of office properties. Our commercial-property portfolio consists of interests in 28 properties totaling 20.7 million square feet, including 4.0 million square feet of parking. Our markets are the financial, government and energy sectors in the cities of Toronto, Ottawa, Calgary, and Vancouver. Our strategy is concentrating operations within a select number of Canadian gateway cities with attractive tenant bases in order to maintain a meaningful presence and build on the strength of our tenant relationships within these markets.
We remain focused on the following strategic priorities:
| · | Realizing value from our investment properties through proactive leasing initiatives; |
| · | Prudent capital management, including the refinancing of mature investment properties; and |
| · | Acquiring high-quality investment properties in our primary markets for value when opportunities arise. |
The following table summarizes our investment property portfolio by region:
Region | Number of Properties | Total Area
(000’s Sq. Ft.) | BOX’s Owned Interest (000’s Sq. Ft.) | Fair Value (Millions) | Fair Value Per Sq. Ft. | Debt
(Millions) | Net Book Equity(1)
(Millions) | |
| Eastern region | 19 | 13,327 | 7,563 | $ | 3,208.5 | $ | 424 | $ | 1,287.9 | $ | 1,920.6 |
| Western region | 9 | 7,389 | 4,122 | | 1,881.7 | | 457 | | 725.1 | | 1,156.6 |
| Total | 28 | 20,716 | 11,685 | $ | 5,090.2 | $ | 436 | $ | 2,013.0 | $ | 3,077.2 |
| | | | | | | | | | | | | | |
(1) Represents fair value less debt and excludes working capital.
An important characteristic of our portfolio is the strong credit quality of our tenants. We direct special attention to credit quality, particularly in the current economic environment, in order to ensure the long-term sustainability of rental revenues through economic cycles. Major tenants with over 500,000 square feet of space in the portfolio include government and related agencies, Suncor Energy Inc., Bank of Montreal, Imperial Oil and Talisman Energy. A detailed list of major tenants is included in Part III (“Risks and Uncertainties”) of this MD&A, beginning on page 22.
Our strategy is to sign long-term leases in order to mitigate risk and reduce our overall re-tenanting costs. We typically commence discussions with tenants regarding their space requirements well in advance of the contractual expiration, and although each market is different, the majority of our leases, when signed, extend between five and 10-year terms. As a result of this strategy, approximately 6.9% of our leases, on average, mature annually up to 2017.
Our average lease term is eight years. The following is a breakdown of lease maturities by region with associated in-place rental rates:
| Total Portfolio | Toronto, Ontario | Ottawa, Ontario |
| | | | Net Rent | | | Net Rent | | | Net Rent |
| | 000's | | | per | 000's | | | per | 000's | | | Per |
| Year of Expiry | Sq. Ft. | % | Sq. Ft.(1) | Sq. Ft. | % | Sq. Ft.(1) | Sq. Ft. | % | Sq. Ft.(1) |
| Currently available | 523 | 3.1 | | | 484 | 5.5 | | | 5 | 0.3 | | |
| 2013 | 1,696 | 10.1 | $ | 23 | 405 | 4.6 | $ | 30 | 1,153 | 66.1 | $ | 20 |
| 2014 | 321 | 1.9 | | 32 | 249 | 2.9 | | 32 | 9 | 0.5 | | 26 |
| 2015 | 1,486 | 8.9 | | 24 | 508 | 5.8 | | 32 | 546 | 31.3 | | 14 |
| 2016 | 1,630 | 9.7 | | 26 | 793 | 9.1 | | 29 | 4 | 0.2 | | 21 |
| 2017 | 645 | 3.9 | | 30 | 553 | 6.3 | | 30 | 8 | 0.4 | | 18 |
| 2018 | 679 | 4.1 | | 32 | 431 | 4.9 | | 30 | ¾ | ¾ | | ¾ |
| 2019 | 722 | 4.3 | | 29 | 596 | 6.8 | | 27 | ¾ | ¾ | | ¾ |
| 2020 & beyond | 9,033 | 54.0 | | 31 | 4,740 | 54.1 | | 29 | 20 | 1.2 | | 23 |
| Parking | 3,981 | ¾ | | ¾ | 1,790 | ¾ | | ¾ | 1,030 | ¾ | | ¾ |
| Total | 20,716 | 100.0 | | | 10,549 | 100.0 | | | 2,775 | 100.0 | | |
| Average market net rent(2) (3) | $ | 32 | | | $ | 31 | | | $ | 21 |
| | | | | | | | | | | | | | | | |
| Calgary, Alberta | Vancouver, B.C. | Other |
| | | | Net Rent | | | Net Rent | | | Net Rent |
| | 000's | | | per | 000’s | | | per | 000’s | | | Per |
| Year of Expiry | Sq. Ft. | % | | Sq. Ft.(1) | Sq. Ft. | % | Sq. Ft.(1) | Sq. Ft. | % | Sq. Ft.(1) |
| Currently available | 20 | 0.4 | | | 14 | 2.3 | | | ¾ | ¾ | | |
| 2013 | 37 | 0.7 | $ | 34 | 100 | 17.0 | $ | 16 | 1 | 33.3 | $ | 32 |
| 2014 | 52 | 0.9 | | 37 | 11 | 1.9 | | 27 | ¾ | ¾ | | ¾ |
| 2015 | 397 | 7.0 | | 28 | 35 | 5.9 | | 27 | ¾ | ¾ | | ¾ |
| 2016 | 756 | 13.4 | | 22 | 77 | 13.1 | | 26 | ¾ | ¾ | | ¾ |
| 2017 | 65 | 1.2 | | 28 | 19 | 3.3 | | 29 | ¾ | ¾ | | ¾ |
| 2018 | 225 | 4.0 | | 37 | 23 | 3.9 | | 38 | ¾ | ¾ | | ¾ |
| 2019 | 89 | 1.6 | | 44 | 35 | 5.9 | | 26 | 2 | 66.7 | | 28 |
| 2020 & beyond | 3,998 | 70.8 | | 35 | 275 | 46.7 | | 21 | ¾ | ¾ | | ¾ |
| Parking | 897 | ¾ | | ¾ | 264 | ¾ | | ¾ | ¾ | ¾ | | ¾ |
| Total | 6,536 | 100.0 | | | 853 | 100.0 | | | 3 | 100.0 | | |
| Average market net rent(2) | $ | 36 | | | $ | 33 | | | $ | ¾ |
| | | | | | | | | | | | | | | | |
(1) Net rent at expiration of lease.
(2) Average market net rent represents management’s estimate of average rent per square foot for buildings of similar quality to our portfolio. However, it may not necessarily be representative of the specific space that is rolling in any specific year. Included on page 19 is the average leasing net rent achieved on our year-to-date leasing as compared to the average expiring net rent.
(3) Average market net rent for Toronto reflects higher market rents for Bay Wellington Tower and Bay Adelaide Centre West Tower, which compose 29% of BOX’s exposure in Toronto.
PERFORMANCE MEASUREMENT
The key indicators by which we measure our performance are:
| · | Commercial property net operating income; |
| · | Funds from operations per unit; |
| · | Adjusted funds from operations per unit; |
| · | Overall indebtedness level; |
| · | Weighted-average cost of debt; and |
Although we monitor and analyze our financial performance using a number of indicators, our primary business objective of generating reliable and growing cash flow is monitored and analyzed using net income, commercial property net operating income, funds from operations, and adjusted funds from operations. Although net income is calculated in accordance with IFRS, commercial property net operating income, funds from operations, and adjusted funds from operations do not have any standardized meaning prescribed by IFRS and are therefore unlikely to be comparable to similar measures presented by other entities. We provide the components of commercial property net operating income and a full reconciliation of net income to funds from operations and adjusted funds from operations beginning on page 17 of this MD&A.
Net Income
Net income is calculated in accordance with IFRS. Net income is used as a key indicator in assessing the profitability of the Trust.
Commercial property net operating income
Commercial property net operating income is defined by us as income from commercial property operations after direct property operating expenses, including property administration costs have been deducted but prior to deducting interest expense, general and administrative expenses, and fair value gains (losses). Commercial property net operating income is used as a key indicator of performance, as it represents a measure over which management of our commercial property operations has control.
Funds from Operations
We define funds from operations as net income prior to transaction costs and fair value gains (losses). Funds from operations does not represent or approximate cash generated from operating activities determined in accordance with IFRS. We provide a reconciliation of net income to funds from operations on page 20.
Adjusted Funds from Operations
Adjusted funds from operations is defined by us as funds from operations net of normalized second-generation leasing commissions and tenant improvements, normalized sustaining capital expenditures, and straight-line rental income. Adjusted funds from operations is a widely used measure used to assess an entity’s ability to pay distributions. We provide a reconciliation of funds from operations to adjusted funds from operations on page 20. We also provide a reconciliation of cash generated from operating activities to adjusted funds from operations on page 20.
Total equity per unit
Total equity per unit represents the book value of our total equity divided by total units outstanding. We believe that total equity per unit is the best indicator of our current financial position because it reflects our total equity adjusted for all inflows and outflows, including funds from operations and changes in the value of our investment properties.
Although we believe funds from operations is a widely used measure to analyze real estate, we believe that funds from operations, adjusted funds from operations, commercial property net operating income, total equity per unit and net income are all relevant measures.
KEY PERFORMANCE DRIVERS
In addition to monitoring and analyzing performance in terms of net income, commercial property net operating income, funds from operations, and adjusted funds from operations, we consider the following items to be important drivers of our current and anticipated financial performance:
| · | Increases in occupancies by leasing vacant space; |
| · | Increases in rental rates as market conditions permit; and |
| · | Reduction in operating costs through achieving economies of scale and diligently managing contracts. |
We also believe that the key external performance drivers include the availability of:
| · | Debt capital at a cost and on terms conducive to our goals; |
| · | Equity capital at a reasonable cost; |
| · | New property acquisitions that fit into our strategic plan; and |
| · | Investors for dispositions of peak value on non-core assets. |
PART II – FINANCIAL STATEMENT ANALYSIS
ASSET PROFILE
Our total asset carrying value was $5,163.6 million at December 31, 2012 (compared to $4,698.1 million at December 31, 2011). The following is a summary of our assets:
| (Millions) | Dec. 31, 2012 | Dec. 31, 2011 |
| Non-current assets | | | | |
| Investment properties | $ | 5,090.2 | $ | 4,637.9 |
| | | | | |
| Current assets | | | | |
| Tenant and other receivables | | 25.4 | | 17.5 |
| Other assets | | 7.0 | | 7.2 |
| Cash and cash equivalents | | 41.0 | | 35.5 |
| | | 73.4 | | 60.2 |
| Total | $ | 5,163.6 | $ | 4,698.1 |
INVESTMENT PROPERTIES
Investment properties comprise of our direct interests in wholly owned commercial properties and our proportionate share in jointly controlled commercial properties.
The fair value of our investment properties was $5,090.2 million as at December 31, 2012 (compared to $4,637.9 million at December 31, 2011). The increase in value of investment properties is primarily attributable to the recognition of fair value gains as a result of improved market conditions and change in valuation parameters.
A breakdown of our investment properties is as follows:
| | | | BOX’s | Fair Value | Fair Value |
| | Number of | Total Area | Owned Interest | Dec. 31, 2012 | Dec. 31, 2011 |
| | Properties | (000's Sq. Ft.) | (000's Sq. Ft.) | (Millions) | (Millions) |
| Eastern region | 19 | 13,327 | 7,563 | $ | 3,208.5 | $ | 2,947.3 |
| Western region | 9 | 7,389 | 4,122 | | 1,881.7 | | 1,690.6 |
| Total investment properties | 28 | 20,716 | 11,685 | $ | 5,090.2 | $ | 4,637.9 |
| Fair value per Sq. ft. | | | | $ | 436 | $ | 397 |
The key valuation metrics for our investment properties are as follows:
| | December 31, 2012 | December 31, 2011 |
| | Value psf | Discount Rate | Terminal Cap Rate | Hold Period (yrs) | Value psf | Discount Rate | Terminal Cap Rate | Hold Period (yrs) |
| Eastern region | | $ 424 | 6.4% | 5.6% | 11 | $ 390 | 6.6% | 6.1% | 11 |
| Western region | | 457 | 6.4% | 5.7% | 10 | 410 | 6.8% | 6.3% | 10 |
| Average | | $ 436 | 6.4% | 5.6% | 11 | $ 397 | 6.7% | 6.2% | 11 |
Values are most sensitive to changes in discount rates and timing or variability of cash flows.
Upon the signing of the majority of our leases, we provide a capital allowance for tenant improvements or tenant inducements for leased space in order to accommodate the specific space requirements of the tenant. In addition to these allowances, leasing commissions are paid to third-party brokers and Brookfield Properties Management Corporation. For the year ended December 31, 2012, such expenditures totaled $27.0 million (compared to $50.8 million in 2011). The decrease is primarily related to higher tenant installation costs incurred on the lease-up of space at Bay Adelaide Centre West Tower, Suncor Energy Centre, Fifth Avenue Place, Bankers Court, Bay Wellington Tower and 105 Adelaide St. West during 2011.
We also invest in ongoing maintenance and capital improvement projects to sustain the high quality of the infrastructure and tenant service amenities in our properties. Capital expenditures for the year ended December 31, 2012 totaled $28.8 million (compared to $17.9 million in 2011). These expenditures exclude repairs and maintenance costs. Fluctuations in our capital expenditures vary period over period based on required and planned expenditures on our investment properties.
Capital expenditures include sustaining expenditures, which are those required in order to maintain the properties in their current operating state. Capital expenditures also include projects which represent improvements to an asset or reconfiguration of space that adds productive capacity in order to increase rentable area or increase current rental rates. For the year ended December 31, 2012, sustaining capital expenditures totaled $3.2 million (compared with $3.2 million in 2011), while the remainder of $25.6 million (compared with $14.7 million in 2011) primarily consist of the re-cladding project at First Canadian Place, elevator upgrades at Royal Centre, structural work on the parking garage at Hudson’s Bay Centre and washroom upgrades at Bay Wellington Tower, Suncor Energy Centre, Fifth Avenue Place and First Canadian Place. Capital expenditures are recoverable in some cases through contractual tenant cost-recovery payments. During the year ended December 31, 2012, $15.4 million of our total capital expenditures were recoverable, compared with $10.6 million during the prior year.
The following table summarizes the second-generation leasing commissions and tenant improvements, and sustaining capital expenditures recorded on our investment properties during the year ended December 31, 2012, as well as the normalized level of activities. The normalized activities are used in calculating adjusted funds from operations and they are estimated based on historical spend levels as well as anticipated spend levels over the next few years. Second-generation leasing commissions and tenant improvements vary with the timing of renewals, vacancies, and tenant mix. These costs historically have been lower for renewals of existing tenants compared to new tenants. Refer to the reconciliation of funds from operations to adjusted funds from operations on page 20.
For the year ended December 31, 2012, second-generation leasing commissions and tenant improvements consisted primarily of leasing commissions incurred at Bankers Hall, Hudson’s Bay Centre and Royal Centre, and tenant improvements at Suncor Energy Centre, HSBC Building, Bay Wellington Tower, First Canadian Place and Exchange Tower related to tenant build-outs.
| | | | Normalized annual activities(1) |
| (Millions) | | | | | | 2012 | | 2011 | | 2012 |
| Second-generation leasing commissions and tenant improvements | | | | | $ | 21.4 | $ | 33.0 | $ | 18.0 |
| Sustaining capital expenditures | | | | | | 3.2 | | 3.2 | | 5.6 |
| Total | | | | | $ | 24.6 | $ | 36.2 | $ | 23.6 |
(1)A normalized level of activity is estimated based on historical spend levels as well as anticipated spend levels over the next few years.
The following table summarizes the changes in value of our investment properties during the year ended December 31, 2012:
| (Millions) | | | | Dec. 31, 2012 |
| Beginning of year | | | | $ | 4,637.9 |
| Additions: | | | | | |
| Capital expenditures and tenant improvements | | | | | 47.8 |
| Leasing commissions | | | | | 5.8 |
| Tenant inducements | | | | | 2.2 |
| Fair value gains | | | | | 388.5 |
| Other changes | | | | | 8.0 |
| End of year | | | | $ | 5,090.2 |
Other changes represent net straight-line rent recognized in accordance with IAS 17, “Leases” that is implied within the fair value of investment properties.
TENANT AND OTHER RECEIVABLES
Tenant and other receivables increased to $25.4 million at December 31, 2012, from $17.5 million at December 31, 2011.
OTHER ASSETS
The components of other assets are as follows:
| (Millions) | Dec. 31, 2012 | Dec. 31, 2011 |
| Prepaid expenses and other assets | $ | 6.2 | $ | 6.4 |
| Restricted cash | | 0.8 | | 0.8 |
| Total | $ | 7.0 | $ | 7.2 |
CASH AND CASH EQUIVALENTS
We endeavor to maintain high levels of liquidity to ensure that we can meet distribution requirements and react quickly to potential investment opportunities. At December 31, 2012, cash balances were $41.0 million, compared to $35.5 million at December 31, 2011.
LIABILITIES AND EQUITY
Our asset base of $5,163.6 million is financed with a combination of debt and equity. The components of our liabilities and equity are as follows:
| (Millions) | Dec. 31, 2012 | Dec. 31, 2011 |
| Liabilities | | | | |
| Non-current liabilities | | | | |
| Commercial property and corporate debt | $ | 1,396.6 | | $ 1,748.2 |
| | | | | |
| Current liabilities | | | | |
| Commercial property and corporate debt | | 616.4 | | 232.1 |
| Accounts payable and other liabilities | | 115.0 | | 106.9 |
| | | 2,128.0 | | 2,087.2 |
| | | | |
| Equity | | | | |
| Unitholders’ equity | | 838.1 | | 718.8 |
| Non-controlling interest | | 2,197.5 | | 1,892.1 |
| | | 3,035.6 | | 2,610.9 |
| Total liabilities and equity | $ | 5,163.6 | | $ 4,698.1 |
| | | | | | |
COMMERCIAL PROPERTY AND CORPORATE DEBT
Commercial property and corporate debt (current and non-current) totaled $2,013.0 million at December 31, 2012 (compared to $1,980.3 million at December 31, 2011). The increase is primarily attributable to refinancing related to Exchange Tower and HSBC Building in Toronto and Royal Centre in Vancouver, offset by principal amortization payments. Commercial property and corporate debt at December 31, 2012 had a weighted-average interest rate of 5.2%. Debt on our investment properties are mainly non-recourse, thereby reducing overall financial risk to the Trust.
We attempt to match the maturity of our commercial property debt portfolio with the average lease term of our properties. At December 31, 2012, the average term to maturity of our commercial property debt was five years, compared to our average lease term of eight years.
During the first quarter of 2012 we increased our revolving corporate credit facility by $75.0 million to $200.0 million with the same five Canadian chartered banks. No changes were made to the terms of the original facility. As of December 31, 2012, $68.0 million was drawn on the revolving corporate credit facility (compared to $120.0 million at December 31, 2011).
The details of the financing transactions completed in 2012 are as follows:
| (Millions) | | | New Proceeds | Net Proceeds Generated (1) | Interest Rate (%) | Mortgage Detail | Maturity |
| Exchange Tower | Q2 | Refinancing | $ | 120.0 | $ | 64.3 | 4.031% | Non-recourse | April 2022 |
| Royal Centre | Q2 | Refinancing | | 150.0 | | 39.0 | 3.325% | Non-recourse | June 2015 |
| 151 Yonge St. | Q3 | Extension | | ¾ | | ¾ | BA + 170 basis points | Non-recourse | July 2014 |
| HSBC Building | Q4 | Refinancing | | 44.5 | | 24.7 | 4.056% | Non-recourse | January 2023 |
(1)Excludes financing costs.
The details of commercial property and corporate debt at December 31, 2012, are as follows:
| | | Interest | Maturity | BOX’s Share | |
| | Location | Rate % | Date | | (Millions) | Mortgage Details |
| Commercial property | | | | | | |
| 105 Adelaide St. West | Toronto | 5.3 | February 2013 | $ | 20.7 | Non-recourse - fixed rate |
| Bay Wellington Tower | Toronto | 6.4 | April 2013 | | 247.7 | Non-recourse - fixed rate |
| Bay Wellington Tower | Toronto | 6.8 | April 2013 | | 59.6 | Non-recourse - fixed rate |
| Hudson's Bay Centre(1) | Toronto | 5.2 | May 2013 | | 104.1 | Limited recourse - fixed rate |
| Bankers Hall | Calgary | 6.7 | November 2013 | | 9.8 | Non-recourse - fixed rate |
| Bankers Hall | Calgary | 7.2 | November 2013 | | 147.5 | Non-recourse - fixed rate |
| Jean Edmonds Towers | Ottawa | 5.6 | January 2014 | | 0.3 | Non-recourse - fixed rate |
| Suncor Energy Centre(2) | Calgary | 6.4 | June 2014 | | 205.8 | Non-recourse - fixed rate |
| 151 Yonge St. | Toronto | 2.9 | July 2014 | | 9.7 | Non-recourse - floating rate |
| First Canadian Place | Toronto | 5.4 | December 2014 | | 72.9 | Non-recourse - fixed rate |
| Royal Centre | Vancouver | 3.3 | June 2015 | | 148.0 | Non-recourse - fixed rate |
| 2 Queen St. E. | Toronto | 5.6 | December 2017 | | 28.6 | Non-recourse - fixed rate |
| 22 Front St. West | Toronto | 6.2 | October 2020 | | 18.4 | Non-recourse - fixed rate |
| Bankers Court | Calgary | 5.0 | November 2020 | | 45.9 | Non-recourse - fixed rate |
| Queen's Quay Terminal | Toronto | 5.4 | April 2021 | | 87.0 | Non-recourse - fixed rate |
| Fifth Avenue Place | Calgary | 4.7 | August 2021 | | 171.2 | Non-recourse - fixed rate |
| Bay Adelaide Centre West Tower | Toronto | 4.4 | December 2021 | | 398.3 | Non-recourse - fixed rate |
| Exchange Tower | Toronto | 4.0 | April 2022 | | 118.1 | Non-recourse - fixed rate |
| HSBC Building | Toronto | 4.1 | January 2023 | | 44.5 | Non-recourse - fixed rate |
| Jean Edmonds Towers | Ottawa | 6.8 | January 2024 | | 15.6 | Non-recourse - fixed rate |
| | | | | | | |
| Corporate | | | | | | |
| $200M Corporate Revolver(3) | ¾ | 3.2 | June 2014 | | 68.0 | Recourse - floating rate |
| | | 5.2 | | | 2,021.7 | |
| Premium on assumed mortgages | | | | | 1.3 | |
| Deferred financing costs | | | | | (10.0) | |
| Total | | 5.2 | | $ | 2,013.0 | |
| | | | | | | | |
(1)This loan has limited recourse to the Trust’s parent, BPP, for up to $15.0 million. A two-year extension option that extends the maturity to May 2015 is available to the Trust provided that certain debt service and loan-to-value thresholds are met.
(2)This loan includes a $32.7 million unsecured loan payable to the property’s joint venture partner.
(3)A one-year extension option that extends the maturity to June 2015 is available to the Trust provided that no material defaults have occurred.
Commercial property and corporate debt maturities for the next five years and thereafter are as follows:
| | | | | | Weighted-Average |
| | �� | Scheduled | | | Interest Rate (%) at |
| | (Millions, except interest data) | Amortization | Maturities | Total | Dec. 31, 2012 |
| 2013 | $ | 32.3 | $ | 584.1 | $ | 616.4 | 6.4% |
| 2014 | | 26.3 | | 345.6 | | 371.9 | 5.5% |
| 2015 | | 21.4 | | 137.8 | | 159.2 | 3.3% |
| 2016 | | 20.3 | | ¾ | | 20.3 | ¾% |
| 2017 | | 21.3 | | 28.6 | | 49.9 | 5.6% |
| 2018 and thereafter | | 94.6 | | 700.7 | | 795.3 | 4.6% |
| Total | $ | 216.2 | $ | 1,796.8 | $ | 2,013.0 | 5.2% |
| | | | | | | | | | | |
CONTRACTUAL OBLIGATIONS
The following table presents our contractual obligations over the next five years and beyond:
| | | | Payments Due By Period |
| | | | | | | | |
| (Millions) | | Total | 1 year | 2 – 3 years | 4 – 5 Years | After 5 Years |
| Commercial property and corporate debt(1) | | $ | 2,013.0 | $ | 616.4 | $ | 531.1 | $ | 70.2 | $ | 795.3 |
| Interest expense – commercial property and corporate debt(2) | 401.4 | | 86.6 | | 99.3 | | 78.4 | | 137.1 |
| Minimum rental payments - ground leases(3) | | | 499.7 | | 7.0 | | 14.0 | | 14.0 | | 464.7 |
| | | $ | 2,914.1 | $ | 710.0 | $ | 644.4 | $ | 162.6 | $ | 1,397.1 |
| | | | | | | | | | | | | | | | | | | | |
(1) Net of transaction costs.
(2)Represents aggregate interest expense expected to be paid over the term of the debt, on an undiscounted basis, based at current interest rates.
(3) Represents minimum rental payments, on an undiscounted basis, on land leases or other agreements.
CREDIT RATINGS
Our access to financing depends on, among other things, suitable market conditions and the maintenance of suitable long-term credit ratings. Our credit ratings may be adversely affected by various factors, including increased debt levels, decreased earnings, declines in tenant demand, increased competition, a further deterioration in general economic and business conditions and adverse publicity. Any downgrades in our credit ratings may impede our access to capital markets or raise our borrowing rates.
We are currently rated by Dominion Bond Rating Service Inc. (“DBRS”) and Standard & Poor’s (“S & P”). We are committed to arranging our affairs to maintain this rating and improve further over time.
Our credit rating at December 31, 2012, and at the date of this report was:
| | | DBRS | S & P |
| Issuer Rating | | BBB (stable) | BBB (negative) (1) |
(1)Rating was given in conjunction with BPO’s rating as S & P views these two related companies as one rated entity.
Credit ratings are intended to provide investors with an independent measure of the credit quality of an issue of securities. The credit rating presented is not a recommendation to purchase, hold or sell our Trust Units, as such rating does not comment as to market price or suitability for a particular investor. There is no assurance that any rating will remain in effect for any given period or that any rating will not be revised or withdrawn entirely by the rating agency in the future if, in its judgment, circumstances so warrant.
CORPORATE GUARANTEES AND CONTINGENT OBLIGATIONS
We and our operating subsidiaries are contingently liable with respect to litigation and claims that arise from time to time in the normal course of business or otherwise. A specific litigation is being pursued against one of our subsidiaries related to security on a defaulted loan. At this time, the amount of contingent cash outflow related to the litigation and claims currently being pursued against us is uncertain but could be up to $65.0 million ($63.0 million Australian dollars) in the event we are completely unsuccessful in defending the claims. During the year ended December 31, 2012, the amount of the contingent cash outflow increased by $19.6 million ($19.0 million Australian dollars) due to a change in the methodology of determining the amount of the claim that was adopted by the Courts.
In addition, we may execute agreements that provide for indemnifications and guarantees to third parties. Disclosure of commitments, guarantees, and contingencies can be found in Note 14 of the consolidated financial statements.
INCOME TAXES
The Trust is a “mutual fund trust” pursuant to theIncome Tax Act (Canada). The Trust distributes or designates all taxable earnings to unitholders, and as such, under current legislation, the obligation to pay tax rests with each unitholder. No current and deferred tax provisions are required on the Trust’s income.
ACCOUNTS PAYABLE AND OTHER LIABILITIES
Accounts payable and other liabilities totaled $115.0 million at December 31, 2012 (compared to $106.9 million at December 31, 2011). The increase is primarily related to timing of accrued liabilities.
A summary of the components of accounts payable and other liabilities is as follows:
| (Millions) | Dec. 31, 2012 | Dec. 31, 2011 |
| Accounts payable and accrued liabilities | $ | 102.3 | $ | 93.1 |
| Accrued interest | | 12.7 | | 13.8 |
| Total | $ | 115.0 | $ | 106.9 |
EQUITY
The components of equity are as follows:
| (Millions) | Dec. 31, 2012 | Dec. 31, 2011 |
| Trust Units | $ | 551.1 | $ | 550.5 |
| Contributed surplus | | 3.1 | | 3.1 |
| Retained earnings | | 283.9 | | 165.2 |
| Unitholders’ equity | | 838.1 | | 718.8 |
| Non-controlling interest | | 2,197.5 | | 1,892.1 |
| Total | $ | 3,035.6 | $ | 2,610.9 |
The following tables summarize the changes in the units outstanding during the year ended December 31, 2012 and December 31, 2011:
| | | 2012 |
| | | | Trust Units | Class B LP Units |
| Units issued and outstanding at beginning of year | | | 26,110,560 | 67,088,022 |
| Units issued pursuant to Distribution Reinvestment Plan | | | 22,322 | ¾ |
| Total units outstanding at December 31, 2012 | | | 26,132,882 | 67,088,022 |
| | | 2011 |
| | | | Trust Units | Class B LP Units |
| Units issued and outstanding at beginning of year | | | 26,095,603 | 67,088,022 |
| Units issued pursuant to Distribution Reinvestment Plan | | | 14,957 | ¾ |
| Total units outstanding at December 31, 2011 | | | 26,110,560 | 67,088,022 |
At December 31, 2012, the weighted average number of Trust Units outstanding was 26,121,860 (compared to 26,101,811 at December 31, 2011).
In November 2012, we renewed our normal course issuer bid for our Trust Units for a further one-year period. During the twelve-month period commencing November 7, 2012, and ending November 6, 2013, we may purchase on the Toronto Stock Exchange and/or the New York Stock Exchange up to 1,306,448 Trust Units, representing approximately 5% of our issued and outstanding Trust Units. No Trust Units were repurchased by the Trust under our normal course issuer bid for the year ended December 31, 2012.
Trust Units
Each Trust Unit is transferable and represents an equal, undivided, beneficial interest in BOX and any distributions, whether of net income, net realized capital gains, or other amounts, and in the event of the termination or winding-up of the Trust, in the Trust’s net assets remaining after satisfaction of all liabilities. All Trust Units rank among themselves equally and ratably without discrimination, preference, or priority. Each Trust Unit entitles the holder thereof to one vote at all meetings of unitholders or with respect to any written resolution of unitholders. The Trust Units have no conversion, retraction, or redemption rights.
Special Voting Units
Special Voting Units are only issued in tandem with Class B limited partnership units (“Class B LP Units”) of Brookfield Office Properties Canada LP (“BOPC LP”) and are not transferable separately from the Class B LP Units to which they relate and upon any transfer of Class B LP Units, such Special Voting Units will automatically be transferred to the transferee of the Class B LP Units. As Class B LP Units are exchanged for Trust Units or purchased for cancellation, the corresponding Special Voting Units will be cancelled for no consideration.
Each Special Voting Unit entitles the holder thereof to one vote at all meetings of unitholders or with respect to any resolution in writing of unitholders. Except for the right to attend and vote at meetings of the unitholders or with respect to written resolutions of the unitholders, Special Voting Units do not confer upon the holders thereof any other rights. A Special Voting Unit does not entitle its holder to any economic interest in BOX, or to any interest or share in BOX, or to any interest in any distributions (whether of net income, net realized capital gains, or other amounts), or to any interest in any net assets in the event of termination or winding-up.
Non-Controlling interest
We classify the outstanding Class B LP Units as non-controlling interest for financial statement purposes in accordance with IFRS. The Class B LP Units are exchangeable on a one-for-one basis (subject to customary anti-dilution provisions) for Trust Units at the option of the holder. Each Class B LP Unit is accompanied by a Special Voting Unit that entitles the holder thereof to receive notice of, to attend, and to vote at all meetings of unitholders of BOX. The holders of Class B LP Units are entitled to receive distributions when declared by BOPC LP equal to the per-unit amount of distributions payable to each holder of Trust Units. However, the Class B LP Units have limited voting rights over BOPC LP.
The following tables present distributions declared to Trust unitholders and non-controlling interest for the year ended December 31, 2012 and December 31, 2011:
| | | 2012 |
| (Millions, except per unit amounts) | | | Trust Units | Class B LP Units |
| Paid in cash or DRIP | | | | | $ | 26.4 | $ 67.9 |
| Payable as of December 31, 2012 | | | | | | 2.6 | 6.5 |
| Total | | | | | | 29.0 | 74.4 |
| Per unit | | | | | $ | 1.11 | $ 1.11 |
| | | 2011 |
| (Millions, except per unit amounts) | | | Trust Units | Class B LP Units |
| Paid in cash or DRIP | | | | | $ | 25.8 | $ 66.5 |
| Payable as of December 31, 2011 | | | | | | 2.4 | 6.0 |
| Total | | | | | | 28.2 | 72.5 |
| Per unit | | | | | $ | 1.08 | $ 1.08 |
We determine annual distributions to unitholders by looking at forward-looking cash flow information, including forecasts and budgets and the future business prospects of the Trust. We do not consider periodic cash flow fluctuations resulting from items such as the timing of property operating costs, property tax installments, or semi-annual debenture and mortgage payable interest payments in determining the level of distributions to unitholders. To determine the level of cash distributions made to unitholders, we consider the impact of, among other items, the future growth in the income-producing portfolio, future acquisitions, and leasing related to the income-producing portfolio. Annual distributions to unitholders are expected to continue to be funded by cash flows generated from our portfolio.
CAPITAL RESOURCES AND LIQUIDITY
We employ a broad range of financing strategies to facilitate growth and manage financial risk, with particular emphasis on the overall reduction of the weighted-average cost of capital, in order to enhance returns for unitholders. Our principal liquidity needs for the next twelve months are to:
| • | fund recurring expenses; |
| • | meet debt service requirements; |
| • | fund those capital expenditures deemed mandatory, including tenant improvements; and |
| • | fund investing activities, which could include: |
| § | discretionary capital expenditures; |
| § | property acquisitions; and |
| § | repurchase of our units. |
We believe that our liquidity needs will be satisfied using cash on hand and cash flows generated from operating and financing activities. Rental revenue, recoveries from tenants, interest and other income, available cash balances, draws on our credit facilities and refinancings (including upward refinancings) of maturing indebtedness are our principal sources of capital used to pay operating expenses, distributions, debt service, capital expenditures, and leasing costs in our commercial-property portfolio. We seek to increase income from our existing properties by controlling operating expenses and by maintaining quality standards for our properties that promote high occupancy rates and support increases in rental rates while reducing tenant turnover. We believe our revenue, along with proceeds from financing activities, will continue to provide the necessary funds for our short-term liquidity needs and to fund anticipated ongoing distributions. However, material changes in these factors may adversely affect our net cash flows.
Our principal liquidity needs for periods beyond the next year are for scheduled debt maturities, unit distributions, and capital expenditures. We plan to meet these needs with one or more of the following:
| • | cash flow from operating activities; and |
| • | credit facilities and refinancing opportunities. |
Our commercial property and corporate debt is primarily fixed-rate and non-recourse to the Trust. These investment-grade financings are typically structured on a loan-to-appraised-value basis of between 50% and 65% as market conditions permit. In addition, in certain circumstances where a building is leased almost exclusively to a high-credit-quality tenant, a higher loan-to-value financing, based on the tenant’s credit quality, is put in place at rates commensurate with the cost of funds for the tenant. This reduces our equity requirements to finance commercial property and enhances equity returns.
Most of our borrowings are in the form of long-term property-specific financings with recourse only to the specific assets. Limiting recourse to specific assets ensures that poor performance within one area does not compromise our ability to finance the balance of our operations. Our maturity schedule is fairly diversified so that financing requirements in any given year are manageable.
Our focus on structuring financings with investment-grade characteristics ensures that debt levels on any particular asset can typically be maintained throughout a business cycle. This enables us to limit covenants and other performance requirements, thereby reducing the risk of early payment requirements or restrictions on the distribution of cash from the assets being financed.
To help ensure we are able to react to investment opportunities quickly and on a value basis, we attempt to maintain a high level of liquidity. Our primary sources of liquidity consists of cash and undrawn committed credit facilities. In addition, we structure our affairs to facilitate monetization of longer-duration assets through financings, co-investor participations, or refinancings.
At December 31, 2012, we had approximately $139.3 million of liquidity consisting of $41.0 million of cash on hand, and $98.3 million of undrawn capacity on our credit facility.
Cost of Capital
We continually strive to reduce our weighted-average cost of capital and improve unitholders’ equity returns through value-enhancement initiatives and the consistent monitoring of the balance between debt and equity financing.
As of December 31, 2012, our weighted-average cost of capital, assuming a long-term 9.0% return on equity, was 7.4%. Our cost of capital is lower than many of our peers because of the greater amount of investment-grade financing that can be placed on our assets, which is a function of the high-quality nature of both the assets and the tenant base that composes our portfolio.
The following schedule details the capitalization of the Trust and the related costs thereof:
| | Cost of Capital(1) | Underlying Value(2) |
| (Millions, except cost of capital data) | Dec. 31, 2012 | Dec. 31, 2011 | Dec. 31, 2012 | Dec. 31, 2011 |
| Liabilities | | | | | | |
| Commercial property and corporate debt | 5.2% | 5.5% | $ | 2,013.0 | $ | 1,980.3 |
| Unitholders’ equity | | | | | | |
| Trust Units(3) | 9.0% | 9.0% | | 764.0 | | 634.7 |
| Other equity | | | | | | |
| Non-controlling interest(3) | 9.0% | 9.0% | | 1,964.0 | | 1,631.9 |
| Total | 7.4% | 7.4% | $ | 4,741.0 | $ | 4,246.9 |
| | | | | | | | |
(1) Total weighted-average cost of capital is calculated on the weighted average of underlying value.
| (2) | Underlying value of liabilities presents the cost to retire debt on maturity. Underlying value of unitholders’ equity and other equity is based on the closing unit price of BOX on the TSX. |
(3)Assumes a long-term 9.0% return on equity for December 31, 2012 and December 31, 2011.
OPERATING RESULTS
Included on the following pages is a discussion of the various components of our income statement results followed by a reconciliation of funds from operations and adjusted funds from operations to comparable IFRS measures.
| (Millions, except per unit amounts) | | | | | | | | 2012 | | 2011 |
| Commercial property revenue | | | | | | | | | $ | 515.1 | $ | 445.4 |
| Direct commercial property expense | | | | | | | | | | 245.9 | | 210.8 |
| Investment and other income | | | | | | | | | | ¾ | | 1.3 |
| Interest expense | | | | | | | | | | 109.3 | | 91.9 |
| General and administrative expense | | | | | | | | | | 20.9 | | 17.0 |
| Transaction costs | | | | | | | | | | ¾ | | 0.9 |
| Income beforefair value gains | | | | | | | | | | 139.0 | | 126.1 |
| Fair value gains | | | | | | | | | | 388.5 | | 229.3 |
| Net income and comprehensive income | | | | | | | | | $ | 527.5 | $ | 355.4 |
| Net income and comprehensive income attributable to: | | | | | | | | | |
| Unitholders | | | | | | | | | $ | 147.7 | $ | 99.5 |
| Non-controlling interest | | | | | | | | | | 379.8 | | 255.9 |
| | | | | | | | | | $ | 527.5 | $ | 355.4 |
| Net income per Trust unit | | | | | | | | | $ | 5.66 | $ | 3.81 |
COMMERCIAL PROPERTY REVENUE
Revenue from commercial properties includes rental revenues earned from tenant leases, straight-line rent, percentage rent, and additional rent from the recovery of operating costs and property taxes. Revenue from investment properties totaled $515.1 million for the year ended December 31, 2012 (compared to $445.4 million in 2011). The increase is primarily due to the increase in occupancy at Bay Adelaide Centre West Tower, revenue generated from the Acquired Assets commencing December 1, 2011 and the continued growth in same property revenues.
The components of revenue are as follows:
| (Millions) | | | | 2012 | | 2011 |
| Rental revenue | | | | | $ | 505.8 | $ | 430.5 |
| Straight-line rental income | | | | | | 8.0 | | 12.8 |
| Lease termination and other income | | | | | | 1.3 | | 2.1 |
| Commercial property revenue | | | | | $ | 515.1 | $ | 445.4 |
COMMERCIAL PROPERTY NET OPERATING INCOME
Commercial property net operating income includes commercial property revenue less direct commercial property expense (refer to page 7 for definition) and is a key indicator of performance as it represents a measure over which management of the commercial property operations has control. Our commercial property net operating income for the year ended December 31, 2012, was $269.2 million (compared to $234.6 million in 2011). The increase is primarily due to the increase in occupancy at Bay Adelaide Centre West Tower, net operating income generated from the Acquired Assets commencing December 1, 2011 and the continued growth in same property net operating income.
The components of commercial property net operating income are as follows:
| (Millions) | | | | | | 2012 | | 2011 |
| Commercial property revenue | | | | | $ | 515.1 | $ | 445.4 |
| Direct commercial property expense | | | | | | 245.9 | | 210.8 |
| Total | | | | | $ | 269.2 | $ | 234.6 |
| (Millions) | | | | 2012 | | 2011 |
| Commercial property net operating income – same property | | | | | $ | 240.8 | $ | 229.8 |
| Investment properties acquired | | | | | | 27.1 | | 2.7 |
| Lease termination and other income | | | | | | 1.3 | | 2.1 |
| Total | | | | | $ | 269.2 | $ | 234.6 |
Our strategy of owning premier properties in high-growth, and in many instances supply-constrained markets with high barriers to entry, along with our focus on executing long-term leases with strong credit-rated tenants, has created one of Canada’s most distinguished portfolios of office properties. In the past, this strategy has reduced our exposure to the cyclical nature of the real estate business. In 2012, we continued to reduce our lease expiry profile.We feel confident with our current rollover exposure, which is the percentage of our total managed space currently scheduled to expire and are focused on working toward renewals on expiries in the upcoming months, as well as continuing to manage our rollover exposure in the future years.
Our leases generally have clauses that provide for the collection of rental revenues in amounts that increase every few years, with these increases negotiated at the signing of the lease. During the year ended December 31, 2012, approximately 48.0% of our leases completed have rent escalation clauses that will increase rent by an average of $0.73 per square foot on an annual basis over the term of the lease. The large number of high-credit-quality tenants in our portfolio lowers the risk of not realizing these increases. IFRS requires that these increases be recorded on a straight-line basis over the life of the lease. For the year ended December 31, 2012, we recognized $8.0 million of straight-line rental revenue (compared to $12.8 million in 2011). The decrease over the prior year is primarily due to the expiry of free rent periods for the first generation tenants at Bay Adelaide Centre West Tower in Toronto.
Direct commercial property expenses, which include real estate taxes, utilities, insurance, repairs and maintenance, cleaning, and other property-related expenses, were $245.9 million for the year ended December 31, 2012 (compared to $210.8 million in 2011). The increase is primarily due to expenses generated from the Acquired Assets commencing December 1, 2011.
Substantially all of our leases are net leases, in which the lessee is required to pay its proportionate share of the property’s operating expenses such as utilities, repairs, insurance, and taxes. Consequently, leasing activity is the principal contributor to the change in same-property net operating income. Our total portfolio occupancy rate increased to 96.9% at December 31, 2012, up 70 basis points from year-end 2011. At December 31, 2012, average in-place net rent throughout the portfolio was $27 per square foot, compared with an average market net rent of $32 per square foot.
The following table shows the average lease term, in-place rents, and estimated current market rents for similar space in each of our markets as of December 31, 2012:
| | | Avg. | Avg. In-Place(1) | Avg. Market(2) |
| | Leasable Area | Lease Term | Net Rent | Net Rent |
| Region | (000's Sq. Ft.) | (Years) | ($ per Sq. Ft.) | ($ per Sq. Ft.) |
| Toronto, Ontario | 8,759 | 7.7 | 28 | 31 |
| Ottawa, Ontario | 1,745 | 1.3 | 18 | 21 |
| Calgary, Alberta | 5,639 | 11.2 | 28 | 36 |
| Vancouver, B.C. | 589 | 8.3 | 22 | 33 |
| Other | 3 | ¾ | ¾ | ¾ |
| Total | 16,735 | 8.3 | 27 | 32 |
(1) Average in-place net rent represents the annualized cash amount on a per square foot basis collected from tenants plus tenant expense reimbursements less the operating expenses being incurred for that space, excluding the impact of straight-lining rent escalations or amortizing free rent periods provided on in-place leases.
(2) Average market net rent represents management’s estimate of average rent per square foot for buildings of similar quality to our portfolio. However, it may not necessarily be representative of the specific space that is rolling in any specific year.
A summary of current and historical occupancy levels at December 31 for the past two years is as follows:
| | | Dec. 31, 2012 | | Dec. 31, 2011 |
| | Leasable | % | Leasable | % |
| (000’s Sq. Ft., except % leased data) | Area | Leased | Area | Leased |
| Toronto, Ontario | 8,759 | 94.5 | 8,759 | 93.5 |
| Ottawa, Ontario | 1,745 | 99.7 | 1,745 | 99.7 |
| Calgary, Alberta | 5,639 | 99.6 | 5,639 | 99.4 |
| Vancouver, B.C. | 589 | 97.7 | 589 | 96.5 |
| Other | 3 | 100.0 | 3 | 100.0 |
| Total | 16,735 | 96.9 | 16,735 | 96.2 |
During 2012, we leased 1,341,000 square feet of space, which included 556,000 square feet of new leasing and 785,000 square feet of renewals, compared to expiries of 864,000 square feet and accelerated expiries of 370,000. The average leasing net rent was $33 per square foot, which is an increase of 17.9% over the average expiring net rent of $28 per square foot.
The details of our leasing activity for the year ended December 31, 2012, are as follows:
| | Dec. 31, 2011 | Activities during the year ended Dec. 31, 2012 | Dec. 31, 2012 |
| | Total | | | | Average(1) | | Year One(2) | Average(3) | | Total | |
| | Leasable | | | | Expiring | | Leasing | Leasing | | Leasable | |
| (000's Sq. Ft.) | Area | Leased | | Expiries | Net Rent | Leasing | Net Rent | Net Rent | | Area | Leased |
| Toronto, Ontario | 8,759 | 8,190 | | (711) | $ 27 | 796 | $ 29 | $ 30 | | 8,759 | 8,275 |
| Ottawa, Ontario | 1,745 | 1,740 | | (17) | 21 | 17 | 23 | 24 | | 1,745 | 1,740 |
| Calgary, Alberta | 5,639 | 5,604 | | (332) | 36 | 347 | 39 | 40 | | 5,639 | 5,619 |
| Vancouver, B.C. | 589 | 568 | | (174) | 23 | 181 | 30 | 31 | | 589 | 575 |
| Other | 3 | 3 | | ¾ | ¾ | ¾ | ¾ | ¾ | | 3 | 3 |
| Total Leasing | 16,735 | 16,105 | | (1,234) | $ 28 | 1,341 | $ 32 | $ 33 | | 16,735 | 16,212 |
(1) Represents net rent in the final year.
(2) Represents net rent in the first year.
(3) Represents average net rent over lease term.
Additionally, during the year ended December 31, 2012, tenant improvements and leasing costs related to leasing activity that occurred averaged $10.11 per square foot, compared to $22.43 per square foot during 2011.
INVESTMENT AND OTHER INCOME
Investment and other income totaled $nil in 2012 (compared to $1.3 million in 2011). The amounts primarily include interest earned on cash balances and other income.
INTEREST EXPENSE
Interest expense totaled $109.3 million in 2012 (compared to $91.9 million in 2011). The increase is due to the up-financings at Queen’s Quay Terminal and Fifth Avenue Place which occurred during the first and third quarters of 2011, respectively, the acquisition of the Canadian Office Fund portfolio in the fourth quarter of 2011, coupled with additional interest incurred on the revolving corporate credit facility that was drawn in December 2011 and the fixed-rate permanent financing placed on Bay Adelaide Centre West Tower at the end of 2011.
GENERAL AND ADMINISTRATIVE EXPENSES
General and administrative expenses were $20.9 million in 2012 (compared to $17.0 million in 2011). The increase is primarily due to an increase in asset management fees during the year.
TRANSACTION COSTS
Transaction costs were $nilin 2012(compared to $0.9 million in 2011).Costs incurred during 2011 related to consulting and legal services in connection with the Acquisition.
INCOME TAX EXPENSE
The Trust is a “mutual fund trust” pursuant to theIncome Tax Act (Canada). The Trust distributes or designates all taxable earnings to unitholders, and as such, under current legislation, the obligation to pay tax rests with each unitholder. No current and deferred tax provisions are required on the Trust’s income.
FAIR VALUE GAINS
During the year ended December 31, 2012, the Trust recognized fair value gains of $388.5 million (compared to $229.3 million in 2011). Fair value adjustments are determined based on the movement of various parameters on a quarterly basis, including changes in projected cash flows as a result of leasing and timing, discount rates, and terminal capitalization rates. The increase is primarily due to a change in terminal capitalization rates and discount rates resulting from improved market conditions and recent market activities in Toronto and Calgary.
RECONCILIATION OF NET INCOME TO FUNDS FROM OPERATIONS
Funds from operations was $1.49 per unit during the year ended December 31, 2012 (compared to $1.36 per unit in 2011).
| | | | | | | | | | | |
| (Millions, except per unit amounts) | | | | | | 2012 | | 2011 | |
| Net income | | | | | $ | 527.5 | $ | 355.4 | |
| Add (deduct): | | | | | | | | | |
| Fair value gains | | | | | | (388.5) | | (229.3) | |
| Transaction costs | | | | | | ¾ | | 0.9 | |
| Funds from operations | | | | | $ | 139.0 | $ | 127.0 | |
| Funds from operations attributable to unitholders | | | | | | 38.9 | | 35.6 | |
| Funds from operationsattributable to non-controlling interest | | | | | | 100.1 | | 91.4 | |
| | | | | | $ | 139.0 | $ | 127.0 | |
| Weighted average Trust Units outstanding | | | | | | 26.1 | | 26.1 | |
| Funds from operations per Trust unit | | | | | $ | 1.49 | $ | 1.36 | |
| | | | | | | | | | | | | | | | | | | |
RECONCILIATION OF FUNDS FROM OPERATIONS TO ADJUSTED FUNDS FROM OPERATIONS
Adjusted funds from operations totaled $1.15 per unit during the year ended December 31, 2012 (compared to $1.02 per unit in 2011).
| | | | | | | | | | | |
| | (Millions, except per unit amounts) | | | | | | 2012 | | 2011 | |
| | Funds from operations Deduct: | | | | | $ | 139.0 | $ | 127.0 | |
| | Straight-line rental income | | | | | | (8.0) | | (12.8) | |
| | Normalized second-generation leasing commissions and tenant improvements(1) | | | | | | (18.0) | | (15.2) | |
| | Normalized sustaining capital expenditures(1) | | | | | | (5.6) | | (3.6) | |
| | Adjusted funds from operations | | | | | $ | 107.4 | $ | 95.4 | |
| | Adjusted funds from operations attributable to unitholders | | | | | | 30.1 | | 26.7 | |
| | Adjusted funds from operations attributable to non-controlling interest | | | | | | 77.3 | | 68.7 | |
| | | | | | | $ | 107.4 | $ | 95.4 | |
| | Weighted average Trust Units outstanding | | | | | | 26.1 | | 26.1 | |
| | Adjusted funds from operations per Trust unit | | | | | $ | 1.15 | $ | 1.02 | |
| | Trust unit distributions declared | | | | | $ | 1.11 | $ | 1.08 | |
| | Distribution ratio | | | | | | 97% | | 106% | |
| | | | | | | | | | | | | | | | | | | | |
(1) As the components used in calculating adjusted funds from operations vary period to period, a normalized level of activity is estimated based on historical spend levels as well as anticipated spend levels over the next few years. Sustaining capital expenditures relate to capital items that are required to maintain the properties in their current operating state and exclude projects that are considered to add productive capacity.
Adjusted funds from operations is calculated by adjusting funds from operations for straight-line rental income, normalized second-generation leasing commissions and tenant improvements, and sustaining capital expenditures for maintaining the infrastructure and current rental revenues of our properties. There is no standard industry defined measure of adjusted funds from operations; therefore, our methodology of calculating adjusted funds from operations will differ from other entities and may not be comparable to similar measures presented by other entities.
RECONCILIATION OF CASH FROM OPERATING ACTIVITIES TO ADJUSTED FUNDS FROM OPERATIONS
| (Millions) | | | | | | 2012 | | 2011 |
Cash generated from operating activities Add (deduct): | | | | | $ | 125.6 | $ | 117.5 |
| Working capital and other | | | | | | (2.7) | | (21.7) |
| Leasing commissions and tenant inducements | | | | | | 10.4 | | 19.6 |
| Amortization of deferred financing costs | | | | | | (2.3) | | (2.1) |
| Transaction costs | | | | | | ¾ | | 0.9 |
| Normalized second-generation leasing commissions and tenant improvements | | | | | | (18.0) | | (15.2) |
| Normalized sustaining capital expenditures | | | | | | (5.6) | | (3.6) |
| Adjusted funds from operations | | | | | $ | 107.4 | $ | 95.4 |
QUARTERLY RESULTS
The results by quarter are as follows:
| | 2012 | 2011 |
| (Millions, except per unit amounts) | Q4 | | Q3 | | Q2 | | Q1 | | Q4 | | Q3 | | Q2 | | Q1 |
| Revenue | $ | 137.8 | $ | 128.1 | $ | 124.0 | $ | 125.2 | $ | 120.1 | $ | 109.1 | $ | 109.8 | $ | 107.7 |
| Commercial property net operating income | | 68.5 | | 67.9 | | 66.8 | | 66.0 | | 63.0 | | 57.0 | | 58.9 | | 57.0 |
| Interest expense | | 27.2 | | 27.1 | | 27.5 | | 27.5 | | 24.7 | | 23.1 | | 22.3 | | 21.8 |
| Funds from operations | | 35.9 | | 35.5 | | 34.1 | | 33.5 | | 33.1 | | 30.0 | | 32.5 | | 31.4 |
| Adjusted funds from operations | | 28.0 | | 27.4 | | 26.3 | | 25.7 | | 25.5 | | 23.6 | | 23.9 | | 22.4 |
| Net income | | 165.6 | | 75.1 | | 134.4 | | 152.4 | | 216.9 | | 50.7 | | 47.5 | | 40.3 |
| Net income per Trust unit | $ | 1.78 | $ | 0.81 | $ | 1.44 | $ | 1.63 | $ | 2.33 | $ | 0.54 | $ | 0.51 | $ | 0.43 |
In the fourth quarter of 2012, revenues increased as a result of new leases and renewals at market rents. Net income increased in the fourth quarter of 2012, when compared with the third quarter due to higher fair value gains on investment properties.
PART III – RISKS AND UNCERTAINTIES
BOX’s financial results are affected by the performance of our operations and various external factors influencing the specific sectors and geographic locations in which we operate, as well as macroeconomic factors such as economic growth, inflation, interest rates, regulatory requirements and initiatives, and litigation and claims that arise in the normal course of business.
Our strategy is to invest in premier assets that generate sustainable streams of cash flow. Although high-quality assets may initially generate lower returns on capital, we believe that the sustainability and future growth of their cash flows is more assured over the long term and, as a result, warrant higher valuation levels. We also believe that the high quality of our asset base protects the Trust against future uncertainty and enables us to invest with confidence when opportunities arise.
The following is a review of the material factors and the potential impact these factors may have on our business operations. A more detailed description of our business environment and risks is contained in our Annual Information Form, which is posted on our web site atwww.brookfieldcanadareit.com or at www.sedar.com or www.sec.gov.
PROPERTY-RELATED RISKS
Our strategy is to invest in high-quality office properties as defined by the physical characteristics of the asset and, more important, the certainty of receiving rental payments from large corporate tenants (with investment-grade credit ratings – see “Credit Risk” below) that these properties attract. Nonetheless, we remain exposed to certain risks inherent in the core office-property business.
Commercial property investments are generally subject to varying degrees of risk depending on the nature of the property. These risks include changes in general economic conditions (such as the availability and costs of mortgage funds), local conditions (such as an oversupply of space or a reduction in demand for real estate in the markets in which we operate), the attractiveness of the properties to tenants, competition from other landlords with competitive space, and our ability to provide adequate maintenance at an economical cost.
Certain significant expenditures, including property taxes, maintenance costs, mortgage payments, insurance costs, and related charges, must be made regardless of whether a property is producing sufficient income to service these expenses. Our office properties are subject to mortgages that require substantial debt service payments. If we become unable or unwilling to meet mortgage payments on any property, losses could be sustained as a result of the mortgagee’s exercise of its rights of foreclosure or of sale. We believe the stability and long-term nature of our contractual revenues effectively mitigates these risks.
As owners of premier office properties, lease rollovers also present a risk, as continued growth of rental income is dependent on strong leasing markets to ensure expiring leases are renewed and new tenants are found promptly to fill vacancies. Refer to “Lease Rollover Risk” on page 23 of this MD&A for further details.
INTEREST RATE AND FINANCING RISK
We attempt to stagger the maturities of our mortgage portfolio evenly over a 10-year time horizon. We believe that this strategy will most effectively manage interest rate risk.
As outlined under “Capital Resources and Liquidity,” on page 15 of this MD&A, we have an ongoing need to access debt markets to refinance maturing debt as it comes due. There is a risk that lenders will not refinance such maturing debt on terms and conditions acceptable to us or on any terms at all. Our strategy to stagger the maturities of our mortgage portfolio attempts to mitigate our exposure to excessive amounts of debt maturing in any one year.
Approximately 3.8% of our outstanding commercial property and corporate debt at December 31, 2012 is floating-rate debt (December 31, 2011 – 6.0%) and subject to fluctuations in interest rates. The effect of a 100-basis point increase in interest rates on interest expense relating to our floating-rate debt, all else being equal, is an increase in interest expense of $0.8 million on an annual basis or approximately $0.01 per unit. In addition, there is interest rate risk associated with the Trust’s fixed rate debt due to the expected requirement to refinance such debts in the year of maturity. The effect of a 100 basis-point increase in interest rates on interest expense relating to fixed rate debt maturing within one year, all else being equal, is an increase in interest expense of $5.9 million on an annual basis or approximately $0.06 per unit.
The analysis does not reflect the impact a changing interest rate environment could have on our overall performance and, as a result, it does not reflect the actions management may take in such an environment.
We currently have a level of indebtedness for the Trust of 39.5% of the fair market value of our investment properties based on December 31, 2012 investment property valuations. This level of indebtedness is considered by the Trust to be conservative and, based on this, the Trust believes that all debts will be financed or refinanced as they come due in the foreseeable future.
CREDIT RISK
Credit risk arises from the possibility that tenants may be unable to fulfill their lease commitments. We mitigate this risk by ensuring that our tenant mix is diversified and by limiting our exposure to any one tenant. We also maintain a portfolio that is diversified by property type so that exposure to a business sector is lessened. Currently, no single tenant represents more than 13.8% of total leasable area and 6.4% of commercial property revenue.
We attempt to mitigate our credit risk by signing long-term leases with tenants who have investment-grade credit ratings.
The following list shows our top 20 largest tenants by leasable area in our portfolio and their respective lease commitments:
| | | | | | 000’s Sq. Ft.(2) | |
| | Tenant | Primary Location | Credit Rating(1) | Year of Expiry | 2013 | 2014 | 2015 | 2016 | 2017 | Beyond | Total | % of Sq. Ft.(2) |
| 1 | Government and related agencies | Toronto, Ottawa, Calgary | AAA | Various | 1,159 | 36 | 594 | 204 | | 310 | 2,303 | 13.8% |
| 2 | Suncor Energy Inc. | Calgary | BBB+ | 2028 | | | | | | 1,356 | 1,356 | 8.1% |
| 3 | Bank of Montreal | Toronto, Calgary | A+ | Various | 51 | | | 17 | | 1,101 | 1,169 | 7.0% |
| 4 | Imperial Oil | Calgary | AAA | 2016 | | | | 717 | | | 717 | 4.3% |
| 5 | Talisman Energy | Calgary | BBB | 2025 | | | | | | 527 | 527 | 3.1% |
| 6 | Royal Bank | Toronto, Calgary, Vancouver | AA- | Various | 71 | | 12 | 16 | 52 | 339 | 490 | 2.9% |
| 7 | Enbridge Inc. | Calgary | A- | 2028 | | | | | | 333 | 333 | 2.0% |
| 8 | Deloitte LLP | Toronto, Calgary | Not Rated | Various | | | 98 | 49 | | 177 | 324 | 1.9% |
| 9 | Bennett Jones | Toronto, Calgary | Not Rated | 2021/2027 | | | | | | 318 | 318 | 1.9% |
| 10 | KPMG Management Services LP | Toronto | Not Rated | 2025 | | | | | | 297 | 297 | 1.8% |
| 11 | Canadian Natural Resources | Calgary | BBB+ | 2026 | | | | | | 290 | 290 | 1.7% |
| 12 | CIBC | Toronto, Calgary | A+ | 2020/2053 | | | | | | 288 | 288 | 1.7% |
| 13 | EnCana Corporation | Calgary | BBB | 2015 | | | 241 | | | | 241 | 1.4% |
| 14 | Osler, Hoskin & Harcourt | Toronto | Not Rated | 2015/2030 | | | 29 | | | 198 | 227 | 1.4% |
| 15 | McMillan LLP | Toronto, Vancouver | Not Rated | Various | 5 | | 3 | | | 208 | 216 | 1.3% |
| 16 | Goodmans LLP | Toronto | Not Rated | 2026 | | | | | | 182 | 182 | 1.1% |
| 17 | The Bay | Toronto | Not Rated | 2019/2020 | | | | | | 179 | 179 | 1.1% |
| 18 | Gowlings Canada Inc. | Toronto | Not Rated | 2020 | | | | | | 170 | 170 | 1.0% |
| 19 | The Manufacturers Life Insurance | Toronto | AA- | 2022 | | | | | | 169 | 169 | 1.0% |
| 20 | Spectra Energy (formerly Westcoast Energy) | Calgary, Vancouver | BBB+ | 2020/2022 | | | | | | 165 | 165 | 1.0% |
| | Total | | | | 1,286 | 36 | 977 | 1,003 | 52 | 6,607 | 9,961 | 59.5% |
| | Total % | | | | 12.9% | 0.4% | 9.8% | 10.1% | 0.5% | 66.3% | 100.0% | |
(1)From Standard & Poor’s.
(2) Percentage of total leasable area, prior to considering partnership interests in partially owned properties; excludes parking.
LEASE ROLLOVER RISK
Lease roll-over risk arises from the possibility that we may experience difficulty renewing leases as they expire or in re-leasing space vacated by tenants upon early lease expiry. We attempt to stagger our lease-expiry profile so that we are not faced with disproportionate amounts of space expiring in any one year. Approximately 6.9% of our leases mature annually up to 2017. Our portfolio has a weighted-average lease life of eight years. We further mitigate this risk by maintaining a diversified portfolio mix by geographic location and by proactively leasing space in advance of its contractual expiry.
The following table sets out lease expiries, by square footage, for our portfolio at December 31, 2012:
| | Currently | | | | | | | | 2020 | | | |
| (000’s Sq. Ft.) | Available | 2013 | 2014 | 2015 | 2016 | 2017 | 2018 | 2019 | & Beyond | Leasable | Parking | Total |
| Toronto, Ontario | 484 | 405 | 249 | 508 | 793 | 553 | 431 | 596 | 4,740 | 8,759 | 1,790 | 10,549 |
| Ottawa, Ontario | 5 | 1,153 | 9 | 546 | 4 | 8 | ¾ | ¾ | 20 | 1,745 | 1,030 | 2,775 |
| Calgary, Alberta | 20 | 37 | 52 | 397 | 756 | 65 | 225 | 89 | 3,998 | 5,639 | 897 | 6,536 |
| Vancouver, B.C. | 14 | 100 | 11 | 35 | 77 | 19 | 23 | 35 | 275 | 589 | 264 | 853 |
| Other | ¾ | 1 | ¾ | ¾ | ¾ | ¾ | ¾ | 2 | ¾ | 3 | ¾ | 3 |
| Total | 523 | 1,696 | 321 | 1,486 | 1,630 | 645 | 679 | 722 | 9,033 | 16,735 | 3,981 | 20,716 |
| % of total | 3.1% | 10.1% | 1.9% | 8.9% | 9.7% | 3.9% | 4.1% | 4.3% | 54.0% | 100.0% | ¾ | 100.0% |
ENVIRONMENTAL RISKS
As an owner of real property, we are subject to various laws relating to environmental matters. These laws could hold us liable for the costs of removal and remediation of certain hazardous substances or waste present in our buildings, released or deposited on or in our properties or disposed of at other locations. These costs could be significant and would reduce cash available for our business. The failure to remove or remediate such substances could adversely affect our ability to sell or our ability to borrow using such real estate as collateral and could potentially result in claims against us. We are not aware of any material non-compliance with environmental laws at any of our properties nor are we aware of any pending or threatened investigations or actions by environmental regulatory authorities in connection with any of our properties or any pending or threatened claims relating to environmental conditions at our properties.
We will continue to make the necessary capital and operating expenditures to ensure that we are compliant with environmental laws and regulations. Although there can be no assurances, we do not believe that costs relating to environmental matters will have a material effect on our business, financial condition or results of operations. However, environmental laws and regulations can change rapidly and we may become subject to more stringent environmental laws and regulations in the future. Compliance with more stringent environmental laws and regulations could have an adverse effect on our business, financial condition, or results of operations.
OTHER RISKS AND UNCERTAINTIES
Real estate is relatively illiquid. Such illiquidity may limit our ability to vary our portfolio promptly in response to changing economic or investment conditions. Also, financial difficulties of other property owners resulting in distressed sales could depress real estate values in the markets in which we operate.
Our investment properties generate a relatively stable source of income from contractual tenant rent payments. Continued growth of rental income is dependent on strong leasing markets to ensure expiring leases are renewed and new tenants are found promptly to fill vacancies.
We are substantially protected against short-term market conditions, as most of our leases are long-term in nature with an average term of eight years.
INSURANCE RISKS
We maintain insurance on our commercial properties in amounts and with deductibles that we believe are in line with what owners of similar properties carry. We maintain all risk property insurance and rental value coverage (including coverage for the perils of flood, earthquake and windstorm). Our all risk policy limit is $1.5 billion per occurrence. Our earthquake limit is $500 million per occurrence and in the annual aggregate. This coverage is subject to a $100,000 (dollars) deductible for all locations except for British Columbia where the deductible is 3% of the values for all locations where the physical loss, damage or destruction occurred. The flood limit is $500 million per occurrence and in the annual aggregate, and is subject to a deductible of $25,000 (dollars) for all losses arising from the same occurrence.
With respect to our commercial properties, we purchase an insurance policy that covers acts of terrorism for limits up to $1.2 billion.
PART IV – CRITICAL ACCOUNTING POLICIES AND ESTIMATES
Future accounting policy changes
Financial instruments
IFRS 9, “Financial Instruments” is a multi-phase project to replace IAS 39, “Financial Instruments: Recognition and Measurement”. IFRS 9 introduces new requirements for classifying and measuring financial assets. In October 2010, the International Accounting Standards Board (“IASB”) reissued IFRS 9, incorporating new requirements on accounting for financial liabilities and carrying over from IAS 39 the requirements for de-recognition of financial assets and financial liabilities. In December 2011, the IASB issued “Mandatory Effective Date of IFRS 9 and Transition Disclosures”, which amended the effective date of IFRS 9 to annual periods beginning on or after January 1, 2015, and modified the relief from restating comparative periods and the associated disclosures in IFRS 7, “Financial Instruments: Disclosures”. Early adoption is permitted. The IASB intends to expand IFRS 9 to add new requirements for impairment of financial assets measured at amortized cost and hedge accounting. On completion of these various phases, IFRS 9 will be a complete replacement of IAS 39.
Consolidated Financial Statements
IFRS 10, “Consolidated Financial Statements” establishes principles for the preparation of financial statements when an entity controls one or more other entities. The standard defines the principle of control and establishes control as the basis for determining which entities are consolidated in the financial statements of the reporting entity. The standard also sets out the accounting requirements for the preparation of consolidated financial statements.
Joint Arrangements
IFRS 11, “Joint Arrangements” replaces the existing IAS 31, “Interests in Joint Ventures”. The standard requires that an entity consider whether a joint arrangement is structured through a separate vehicle, as well as the terms of the contractual arrangement and other relevant facts and circumstances, to assess whether the venture is entitled to only the net assets of the joint arrangement (a “joint venture”) or to its share of the assets and liabilities of the joint arrangement (a “joint operation”). Joint ventures are accounted for using the equity method, whereas joint operations are accounted for by recording the Trust’s share of assets, liabilities, revenue and expenses.
Disclosure of Interests in Other Entities
IFRS 12, “Disclosure of Interests in Other Entities” applies to entities that have an interest in a subsidiary, a joint arrangement, an associate or an unconsolidated structured entity. The standard requires the reporting entity to disclose information that enables users of financial statements to evaluate (i) the nature of, and risks associated with, the reporting entity’s interests in other entities and (ii) the effects of those interests on the reporting entity’s financial position, financial performance and cash flows.
Fair Value Measurement
IFRS 13, “Fair Value Measurement” replaces the current guidance on fair value measurement in IFRS with a single standard. The standard defines fair value, provides guidance on its determination and requires disclosures about fair value measurements but does not change the requirements about the items that should be measured and disclosed at fair value.
Financial Statement Presentation
The IASB issued amendments to IAS 1, “Presentation of Financial Statements” which requires items within other comprehensive income (“OCI”) that will be reclassified to profit and loss to be grouped separately from those that will not.
Each of the above are effective for annual periods beginning on or after January 1, 2013, except for IFRS 9 which is effective for annual periods beginning on or after January 1, 2015. Earlier application is permitted for each standard. We anticipate adopting each of the above in the first quarter of the year for which the standard is applicable and is currently evaluating the impact of each to its consolidated financial statements.
critical accounting policies
Our critical accounting policies are those that we believe are the most important in portraying our financial condition and results of operations, and require the most subjective judgment and estimates on the part of management.
Investment Properties
Investment properties include commercial properties held to earn rental income. Commercial properties are recorded at fair value, determined based on available market evidence, at the balance sheet date. We determine the fair value of each investment property based upon, among other things, rental income from current leases and assumptions about rental income from future leases reflecting market conditions at the balance sheet date, less future cash flows in respect of such leases. Fair values are primarily determined by discounting the expected future cash flows, generally over a weighted-average term of 11 years, including a terminal value based on the application of a capitalization rate to estimated year 12 cash flows.
Tax
The Trust is a “mutual fund trust” pursuant to theIncome Tax Act (Canada). The Trust distributes or designates all taxable earnings to unitholders, and as such, under current legislation, the obligation to pay tax rests with each unitholder. Deferred income taxes are not recognized in the Trust’s financial statements on the basis that the Trust can deduct distributions paid such that its liability for income taxes is substantially reduced or eliminated for the year, and the Trust intends to continue to distribute its taxable income and continue to qualify as a real estate investment trust for the foreseeable future.
Revenue Recognition
We account for our leases with tenants as operating leases as we have retained substantially all of the risks and benefits of ownership of our investment properties. Revenue recognition under a lease commences when the tenant has a right to use the leased asset. Generally, this occurs on the lease commencement date or, where we are required to make additions to the property in the form of tenant improvements that enhance the value of the property, upon substantial completion of those improvements. The total amount of contractual rent to be received from operating leases is recognized on a straight-line basis over the term of the lease; a straight-line rent or free-rent receivable, which is included in the carrying amount of investment property, is recorded for the difference between the rental revenue recorded and the contractual amount received. An allowance for doubtful accounts is recorded, if necessary, for estimated losses resulting from the inability of tenants to make required rent payments. The computation of this allowance is based on the tenants’ payment history and current credit status as well as certain industry-specific or geography-specific credit considerations. We also make judgments with respect to whether tenant improvements provided in connection with a lease enhance the value of the leased property, which determines whether such amounts are treated as additions to investment property as well as the point in time at which revenue recognition under the lease commences. In addition, where a lease allows a tenant to elect to take all or a portion of any unused tenant improvement allowance as a rent abatement, we must exercise judgment in determining the extent to which the allowance represents an inducement that is amortized as a reduction of lease revenue over the term of the lease.
Rental revenue also includes percentage participating rents and recoveries of operating expenses, including property taxes. Percentage participating rents are recognized when tenants’ specified sales targets have been met. Operating expense recoveries are recognized in the period that recoverable costs are chargeable to tenants.
Common Control Transactions
IFRS does not include specific measurement guidance for transfers of businesses or subsidiaries between entities under common control. Accordingly, the Trust has developed a policy to account for such transactions taking into consideration other guidance in the IFRS framework and pronouncements of other standard-setting bodies. The Trust’s policy is to record assets and liabilities recognized as a result of transfers of businesses or subsidiaries between entities under common control at the carrying value on the transferor’s financial statements. Differences between the carrying amount of the consideration paid or received, where the Trust is the transferor, and the carrying amount of the assets and liabilities transferred are recorded directly in equity.
USE OF ESTIMATES
The preparation of our annual financial statements requires management to make judgments, estimates, and assumptions that affect the reported amounts of assets and liabilities, disclosure of contingent assets and liabilities at the date of the consolidated financial statements, and the reported amounts of revenues and expenses during the reporting period. Our estimates are based on historical experience and on various other assumptions that are believed to be reasonable under the circumstances. The result of our ongoing evaluation of these estimates forms the basis for making judgments about the carrying values of assets and liabilities and the reported amounts of revenues and expenses that are not readily apparent from other sources. Actual results may differ from these estimates under different assumptions.
RELATED-PARTY TRANSACTIONS
In the normal course of operations, the Trust enters into various transactions on market terms with related parties that have been measured at exchange value and are recognized in the consolidated financial statements.
The Trust has entered into two service-support agreements with Brookfield Properties Management Corporation (“BPMC”), a subsidiary of BPP, dated May 1, 2010, for the provision of property management, leasing, construction, and asset management services. The purpose of the agreements is to provide the services of certain personnel and consultants as are necessary to help the Trust operate and manage its assets and tenant base; it also includes a cost-recovery for administrative and regulatory compliance services provided. The fees paid to BPMC are calculated in accordance with the terms of the agreements. Included in direct commercial property expense during the year ended December 31, 2012, are amounts paid to BPMC for property management services of $13.8 million (compared to $12.4 million in 2011). Included in investment properties during the year ended December 31, 2012, are amounts paid to BPMC for leasing and construction services of $3.1 million (compared to $6.9 million in 2011). Included in general and administrative expenses during the year ended December 31, 2012, are amounts paid to BPMC for asset management and administrative and regulatory compliance services of $16.2 million (compared to $12.6 million in 2011).
Included in rental revenues during the year ended December 31, 2012, are amounts received from Brookfield Asset Management Inc., the ultimate parent of BPP, and its affiliates of $5.9 million (compared to $4.7 million in 2011).
PART V – BUSINESS ENVIRONMENT AND OUTLOOK
OPERATING ENVIRONMENT AND OUTLOOK
2012 was another successful year for BOX as we successfully integrated our newest properties in Toronto and Ottawa which were acquired in the prior year and increased our annual distribution to unitholders by 8%. Our performance over the past year reiterates our belief that BOX offers institutional investors and individual shareholders alike the best option to invest in the most prestigious office properties in Canada. On the leasing front, BOX achieved a full-year leasing total of 1.3 million square feet and our occupancy rate finished the year at 96.9%, an increase of 70 basis points from year-end 2011. We also celebrated the completion of the large-scale three year rejuvenation project at First Canadian Place that transformed the 72-storey, 2.8-million-square-foot building into a spectacular, energy-conscious centre for business, retail and leisure.
Our priorities for 2013 include focusing on leasing objectives, as we continue our strategy of being proactive and maintaining an above-market occupancy rate. Since the beginning of 2013, we have seen an improvement in leasing activity and deal flow in the market. We are also focused on generating and preserving capital through refinancing and seeking out opportunistic re-financings in advance of our maturity dates given the continued low interest rate environment. We achieved significant success in this area during 2012 and as a result we have built up our cash reserves. We will continue to look for opportunities to deploy the cash generated from recent up-financings. Lastly, we strive to complete our sustainability initiatives, as 72% of our properties are LEED Gold-certified. We are targeting to certify to LEED Gold our Royal Centre property in Vancouver.
We ended 2012 with $3.0 billion in net assets at a value per unit of $32.57, which represents a 16% increase over the course of the year. Attributing to this increase was the growth in our funds from operations and the increase in value of our investment properties.
Looking to the upcoming year, with a strong balance sheet offering financial flexibility, a well-leased portfolio with below-market net rents, and strong fundamentals in our markets, BOX is well positioned to deliver on its commitment to unitholders in 2013.
disclosure controls and procedures
Management, including the Chief Executive Officer and Chief Financial Officer, has evaluated the effectiveness of our disclosure controls and procedures (as defined in the applicable Canadian and U.S. securities law) as of December 31, 2012. Based on that evaluation, the Chief Executive Officer and Chief Financial Officer concluded that such disclosure controls and procedures as of December 31, 2012, are effective in providing reasonable assurance that material information relating to the Trust would be made known to us by others within those entities.
Internal Controls over Financial Reporting
There was no change in the Trust’s internal control over financial reporting that occurred during 2012 that has materially affected, or is reasonably likely to materially affect, the Trust’s internal control over financial reporting. Management has also evaluated the effectiveness of the Trust’s internal control over financial reporting as of December 31, 2012, and based on that assessment concluded that the Trust’s internal control over financial reporting was effective. Refer to Management’s Report on Internal Control over Financial Reporting on page 32 of this annual report.

Bryan K. Davis
Chief Financial Officer
March 1, 2013
DISTRIBUTIONS
Trust distributions declared for the year ended December 31, 2012 and December 31, 2011 are as follows:
| (Millions, except per unit amounts) | | | 2012 | | 2011 |
| Paid in cash or DRIP | | | | | $ | 26.4 | $ | 25.8 |
| Payable atDecember 31 | | | | | | 2.6 | | 2.4 |
| Total | | | | | | 29.0 | | 28.2 |
| Per unit | | | | | $ | 1.11 | $ | 1.08 |
Management’s Responsibility for the Financial Statements
The consolidated financial statements and management’s financial analysis and review contained in this annual report are the responsibility of the management of the Trust. To fulfill this responsibility, the Trust maintains a system of internal controls to ensure that its reporting practices and accounting and administrative procedures are appropriate and provide assurance that relevant and reliable financial information is produced. The consolidated financial statements have been prepared in conformity with International Financial Reporting Standards as issued by the International Accounting Standards Board and, where appropriate, reflect estimates based on management’s best judgment in the circumstances. The financial information presented throughout this annual report is consistent with the information contained in the consolidated financial statements.
Deloitte LLP, the independent auditors appointed by the unitholders, have audited the consolidated financial statements in accordance with Canadian generally accepted auditing standards and the standards of the Public Company Accounting Oversight Board (United States) to enable them to express to the Board of Trustees and unitholders their opinion on the consolidated financial statements. Their report as independent registered chartered accountants is set out on the following page.
The consolidated financial statements have been further examined by the Board of Trustees and by its Audit Committee, which meets with the auditors and management to review the activities of each and reports to the Board of Trustees. The auditors have direct and full access to the Audit Committee and meet with the committee both with and without management present. The Board of Trustees, directly and through its Audit Committee, oversees management’s responsibilities and is responsible for reviewing and approving the consolidated financial statements.
 |  |
| | |
| Jan Sucharda | Bryan K. Davis |
| President and Chief Executive Officer | Chief Financial Officer |
| March 1, 2013 | |
Report of Independent Registered Chartered Accountants
To the Board of Trustees and Unitholders of Brookfield Canada Office Properties
We have audited the accompanying consolidated financial statements of Brookfield Canada Office Properties, and subsidiaries (the “Trust”), which comprise the consolidated balance sheets as at December 31, 2012 and December 31, 2011, and the consolidated statements of income and comprehensive income, statements of changes in equity and statements of cash flows for the years then ended, and the notes to the consolidated financial statements.
Management's Responsibility for the Consolidated Financial Statements
Management is responsible for the preparation and fair presentation of these consolidated financial statements in accordance with International Financial Reporting Standards as issued by the International Accounting Standards Board, and for such internal control as management determines is necessary to enable the preparation of consolidated financial statements that are free from material misstatement, whether due to fraud or error.
Auditor's Responsibility
Our responsibility is to express an opinion on these consolidated financial statements based on our audits. We conducted our audits in accordance with Canadian generally accepted auditing standards and the standards of the Public Company Accounting Oversight Board (United States). Those standards require that we comply with ethical requirements and plan and perform the audit to obtain reasonable assurance about whether the consolidated financial statements are free from material misstatement.
An audit involves performing procedures to obtain audit evidence about the amounts and disclosures in the consolidated financial statements. The procedures selected depend on the auditor's judgment, including the assessment of the risks of material misstatement of the consolidated financial statements, whether due to fraud or error. In making those risk assessments, the auditor considers internal control relevant to the entity's preparation and fair presentation of the consolidated financial statements in order to design audit procedures that are appropriate in the circumstances. An audit also includes evaluating the appropriateness of accounting policies used and the reasonableness of accounting estimates made by management, as well as evaluating the overall presentation of the consolidated financial statements.
We believe that the audit evidence we have obtained in our audits is sufficient and appropriate to provide a basis for our audit opinion.
Opinion
In our opinion, the consolidated financial statements present fairly, in all material respects, the financial position of the Trust as at December 31, 2012 and December 31, 2011 and its financial performance and cash flows for the years then ended in accordance with International Financial Reporting Standards as issued by the International Accounting Standards Board.
Other Matters
We have also audited, in accordance with the standards of the Public Company Accounting Oversight Board (United States), the Trust’s internal control over financial reporting as of December 31, 2012, based on the criteria established inInternal Control — Integrated Framework issued by the Committee of Sponsoring Organizations of the Treadway Commission and our report dated March 1, 2013 expressed an unqualified opinion on the Trust’s internal control over financial reporting.

Independent Registered Chartered Accountants
Licensed Public Accountants
March 1, 2013
Toronto, Canada
Management’s Report on Internal Control over Financial Reporting
Management of Brookfield Canada Office Properties is responsible for establishing and maintaining adequate internal control over financial reporting. Internal control over financial reporting is a process designed by, or under the supervision of, the Chief Executive Officer and the Chief Financial Officer and effected by the Board of Trustees, management and other personnel to provide reasonable assurance regarding the reliability of financial reporting and the preparation of financial statements for external purposes in accordance with International Financial Reporting Standards as issued by the International Accounting Standards Board.
Due to its inherent limitations, internal control over financial reporting may not prevent or detect misstatements on a timely basis. Also, projections of any evaluation to the effectiveness of internal control over the financial reporting to future periods are subject to the risk that the controls may become inadequate because of changes in conditions, or that the degree of compliance with the policies or procedures may deteriorate.
Management assessed the effectiveness of Brookfield Canada Office Properties’ internal control over financial reporting as of December 31, 2012, based on criteria established in Internal Control—Integrated Framework issued by the Committee of Sponsoring Organizations of the Treadway Commission. Based on this assessment, management concluded that, as at December 31, 2012, Brookfield Canada Office Properties’ internal control over financial reporting is effective. There are no material weaknesses that have been identified by Management.
Brookfield Canada Office Properties' internal control over financial reporting as of December 31, 2012 has been audited by Deloitte LLP, Independent Registered Chartered Accountants, who also audited Brookfield Canada Office Properties’ consolidated financial statements for the year ended December 31, 2012, and as stated in the Report of Independent Registered Chartered Accountants, Deloitte LLP, expressed an unqualified opinion on the effectiveness of Brookfield Canada Office Properties' internal control over financial reporting.
| | |
| | |
| Jan Sucharda | Bryan K. Davis |
| President and Chief Executive Officer | Chief Financial Officer |
| March 1, 2013 | |
Report of Independent Registered Chartered Accountants
To the Board of Trustees and Unitholders of Brookfield Canada Office Properties
We have audited the internal control over financial reporting of Brookfield Canada Office Properties, and subsidiaries (the “Trust”)as of December 31, 2012, based onthe criteria established inInternal Control—Integrated Framework issued by the Committee of Sponsoring Organizations of the Treadway Commission. The Trust's management is responsible for maintaining effective internal control over financial reporting and for its assessment of the effectiveness of internal control over financial reporting, included in the accompanying Management’s Report on Internal Control over Financial Reporting. Our responsibility is to express an opinion on the Trust's internal control over financial reporting based on our audit.
We conducted our audit in accordance with the standards of the Public Company Accounting Oversight Board (United States). Those standards require that we plan and perform the audit to obtain reasonable assurance about whether effective internal control over financial reporting was maintained in all material respects. Our audit included obtaining an understanding of internal control over financial reporting, assessing the risk that a material weakness exists, testing and evaluating the design and operating effectiveness of internal control based on the assessed risk, and performing such other procedures as we considered necessary in the circumstances. We believe that our audit provides a reasonable basis for our opinion.
A company's internal control over financial reporting is a process designed by, or under the supervision of, the company's principal executive and principal financial officers, or persons performing similar functions, and effected by the company's board of directors, management, and other personnel to provide reasonable assurance regarding the reliability of financial reporting and the preparation of financial statements for external purposes in accordance with generally accepted accounting principles. A company's internal control over financial reporting includes those policies and procedures that (1) pertain to the maintenance of records that, in reasonable detail, accurately and fairly reflect the transactions and dispositions of the assets of the company; (2) provide reasonable assurance that transactions are recorded as necessary to permit preparation of financial statements in accordance with generally accepted accounting principles, and that receipts and expenditures of the company are being made only in accordance with authorizations of management and directors of the company; and (3) provide reasonable assurance regarding prevention or timely detection of unauthorized acquisition, use, or disposition of the company's assets that could have a material effect on the financial statements.
Because of the inherent limitations of internal control over financial reporting, including the possibility of collusion or improper management override of controls, material misstatements due to error or fraud may not be prevented or detected on a timely basis. Also, projections of any evaluation of the effectiveness of the internal control over financial reporting to future periods are subject to the risk that the controls may become inadequate because of changes in conditions, or that the degree of compliance with the policies or procedures may deteriorate.
In our opinion, the Trust maintained, in all material respects, effective internal control over financial reporting as of December 31, 2012, based on the criteria established inInternal Control — Integrated Frameworkissued by the Committee of Sponsoring Organizations of the Treadway Commission.
We have also audited, in accordance with Canadian generally accepted auditing standards and the standards of the Public Company Accounting Oversight Board (United States), the consolidated financial statements as of and for the year ended December 31, 2012 of the Trust and our report dated March 1, 2013 expressed an unqualified opinion on those financial statements.

Independent Registered Chartered Accountants
Licensed Public Accountants
March 1, 2013
Toronto, Canada
Consolidated Balance Sheets
| (Millions) (CDN$) | Note | Dec. 31, 2012 | Dec. 31, 2011 |
| Assets | | | | | |
| Non-current assets | | | | | |
| Investment properties | 4 | $ | 5,090.2 | $ | 4,637.9 |
| | | | | | |
| Current assets | | | | | |
| Tenant and other receivables | 6 | | 25.4 | | 17.5 |
| Other assets | 7 | | 7.0 | | 7.2 |
| Cash and cash equivalents | 8 | | 41.0 | | 35.5 |
| | | | 73.4 | | 60.2 |
| Total assets | | $ | 5,163.6 | $ | 4,698.1 |
| | | | | | |
| Liabilities | | | | | |
| Non-current liabilities | | | | | |
| Commercial property and corporate debt | 9 | $ | 1,396.6 | $ | 1,748.2 |
| | | | | | |
| Current liabilities | | | | | |
| Commercial property and corporate debt | 9 | | 616.4 | | 232.1 |
| Accounts payable and other liabilities | 10 | | 115.0 | | 106.9 |
| | | | 731.4 | | 339.0 |
| Total liabilities | | | 2,128.0 | | 2,087.2 |
| | | | | | |
| Equity | 12 | | | | |
| Unitholders’ equity | | | 838.1 | | 718.8 |
| Non-controlling interest | | | 2,197.5 | | 1,892.1 |
| Total equity | | | 3,035.6 | | 2,610.9 |
| Total liabilities and equity | | $ | 5,163.6 | $ | 4,698.1 |
See accompanying notes to the consolidated financial statements.
On behalf of the Trust,
 |  |
| | |
| Thomas F. Farley | Jan Sucharda |
| Chairman | President and Chief Executive Officer |
Consolidated Statements of Income and Comprehensive Income
| Years ended December 31 | | | | |
| (Millions, except per unit amounts) (CDN$) | Note | | | | | 2012 | 2011 |
| Commercial property revenue | | | | 13 | | | | | $ | 515.1 | $ | 445.4 |
| Direct commercial property expense | | | | | | | | | | 245.9 | | 210.8 |
| Investment and other income | | | | 13 | | | | | | ¾ | | 1.3 |
| Interest expense | | | | | | | | | | | 109.3 | | 91.9 |
| General and administrative expense | | | | 16 | | | | | | 20.9 | | 17.0 |
| Transaction costs | | | | | ¾ | | 0.9 |
| Income before fair value gains | | | | | 139.0 | | 126.1 |
| Fair value gains | | | | | | | | | | 388.5 | | 229.3 |
| Net income and comprehensive income | | | | | $ | 527.5 | $ | 355.4 |
| | | | | | | | | | | |
| Net income and comprehensive income attributable to: | | | | | | | |
| Unitholders | | | | | | | $ | 147.7 | $ | 99.5 |
| Non-controlling interest | | | | | | | 379.8 | | 255.9 |
| | | | | | $ | 527.5 | $ | 355.4 |
| Net incomeper Trust unit – basic and diluted | | | | | $ | 5.66 | $ | 3.81 |
| | | | | | | | | | | | | | | | | | | |
See accompanying notes to the consolidated financial statements.
Consolidated Statements of Changes in Equity
| Years ended December 31 (Millions) (CDN$) | Note | | | 2012 | 2011 |
| Trust Units | | | | | | | | | |
| Balance at beginning of year | | | | | | $ | 550.5 | $ | 550.2 |
| Issuance of Trust Units under Distribution Reinvestment Plan (“DRIP”) | 11 | | | | | | 0.6 | | 0.3 |
| Balance at end of year | | | | | | | 551.1 | | 550.5 |
| Contributed surplus | | | | | | | | | |
| Balance at beginning of year | | | | | | | 3.1 | | ¾ |
| Acquisition of investment properties | | | | | | | ¾ | | 3.1 |
| Balance at end of year | | | | | | | 3.1 | | 3.1 |
| Retained earnings | | | | | | | | | |
| Balance at beginning of year | | | | | | | 165.2 | | 93.9 |
| Net income | | | | | | | 147.7 | | 99.5 |
| Distributions | 11 | | | | | | (29.0) | | (28.2) |
| Balance at end of year | | | | | | | 283.9 | | 165.2 |
| Total unitholders’ equity | | | | | | $ | 838.1 | $ | 718.8 |
| | | | | | | | | | |
| Non-controlling interest | | | | | | | | | |
| Balance at beginning of year | | | | | | $ | 1,892.1 | $ | 1,700.8 |
| Net income | | | | | | | 379.8 | | 255.9 |
| Distributions | 11 | | | | | | (74.4) | | (72.5) |
| Acquisition of investment properties | | | | | | | ¾ | | 7.9 |
| Balance at end of year | | | | | | | 2,197.5 | | 1,892.1 |
| Total equity | | | | | | $ | 3,035.6 | $ | 2,610.9 |
See accompanying notes to the consolidated financial statements.
Consolidated Statements of Cash Flows
| Years ended December 31 (Millions) (CDN$) | Note | | | 2012 | 2011 |
| Operating activities | | | | | | | | | |
| Net income | | | | | | $ | 527.5 | $ | 355.4 |
| Add (deduct): | | | | | | | | | |
| Straight-line rental income | | | | | | | (8.0) | | (12.8) |
| Amortization of deferred financing costs | | | | | | | 2.3 | | 2.1 |
| Leasing commissions and tenant inducements | | | | | | | (10.4) | | (19.6) |
| Fair value gains | | | | | | | (388.5) | | (229.3) |
| Other working capital | | | | | | | 2.7 | | 21.7 |
| Cash flows provided by operating activities | | | | | | | 125.6 | | 117.5 |
| | | | | | | | | | |
| Investing activities | | | | | | | | | |
| Capital expenditures | | | | | | | (48.4) | | (38.6) |
| Acquisition of investment properties | | | | | | | ¾ | | (220.1) |
| Cash flows used in investing activities | | | | | | | (48.4) | | (258.7) |
| | | | | | | | | | |
| Financing activities | | | | | | | | | |
| Commercial property debt arranged | | | | | | | 310.6 | | 666.3 |
| Commercial property debt repayments | | | | | | | (186.4) | | (502.0) |
| Commercial property debt amortization | | | | | | | (41.8) | | (28.6) |
| Corporate debt arranged | | | | | | | 106.0 | | 120.0 |
| Corporate debt repayments | | | | | | | (158.0) | | ¾ |
| Trust unit distributions paid | | | | | | | (28.2) | | (27.6) |
| Class B LP unit distributions paid | | | | | | | (73.9) | | (71.8) |
| Cash flows (used in) provided by financing activities | | | | | | | (71.7) | | 156.3 |
| Increase in cash and cash equivalents | | | | | | | 5.5 | | 15.1 |
| Cash and cash equivalents, beginning of year | | | | | | | 35.5 | | 20.4 |
| Cash and cash equivalents, end of year | 8,18 | | | | | $ | 41.0 | $ | 35.5 |
| | | | | | | | | | | | | |
See accompanying notes to the consolidated financial statements.
Notes to the Consolidated Financial Statements
NOTE 1: NATURE AND DESCRIPTION OF THE TRUST
Brookfield Canada Office Properties (the “Trust” or “BOX”) is an unincorporated, closed-end real estate investment trust (“REIT”) established under and governed by the laws of the Province of Ontario, Canada and created pursuant to a declaration of trust dated March 19, 2010 and amended February 24, 2012. Although it is intended that BOX qualifies as a “mutual fund trust” pursuant to theIncome Tax Act (Canada), BOX is not a mutual fund under applicable securities laws.
The Trust is a subsidiary of BPO Properties Ltd. (“BPP”), which owns an aggregate equity interest in the Trust of 83.3% as of December 31, 2012 consisting of 40.5% of the issued and outstanding units of BOX (“Trust Units”) and 100% of the issued and outstanding Class B limited partnership units (“Class B LP Units”) of Brookfield Office Properties Canada LP (“BOPC LP”), a subsidiary of BOX that owns direct interests in the Trust’s investment properties. BOX primarily invests in and operates commercial office properties in Toronto, Ottawa, Calgary, and Vancouver. The registered and operating office of the Trust is Brookfield Place, 181 Bay Street, Suite 330, Toronto, Ontario, M5J 2T3.
The Trust was formed in connection with the reorganization of BPP on May 1, 2010, in which BPP’s directly owned office assets were transferred to the Trust. In connection with the reorganization, the Trust also acquired the interests of Brookfield Office Properties Inc. (“BPO” or “Brookfield Office Properties”) in Brookfield Place, which includes Bay Wellington Tower and partial interests in the retail concourse and parking operations.
Pursuant to the Arrangement, holders of BPP’s common shares, other than BPO, received one Trust Unit for each common share held.
On December 1, 2011, the Trust acquired from its parent company, BPP, a 25% interest in nine office assets from BPP’s Canadian Office Fund portfolio totaling 6.5 million square feet in Toronto and Ottawa (the “Acquired Assets” or the “Acquisition”).
NOTE 2: SIGNIFICANT ACCOUNTING POLICIES
| (a) | Statement of compliance |
The consolidated financial statements have been prepared in accordance with International Financial Reporting Standards as issued by the International Accounting Standards Board (“IFRS”).
The financial statements are prepared on a going concern basis and have been presented in Canadian dollars rounded to the nearest million. The accounting policies set out below have been applied consistently in all material respects. Standards and guidelines not effective for the current accounting period are described in Note 3.
| (c) | Basis of consolidation |
The consolidated financial statements include the accounts of the Trust and its consolidated subsidiaries consisting of BOPC GP Inc. and BOPC LP, which are the entities over which the Trust has control. Control exists when the Trust has the power, directly or indirectly, to govern the financial and operating policies of an entity so as to obtain benefit from its activities. The Trust holds all of the Class A Limited Partnership Units of BOPC LP (“Class A LP Units”). The holders of the Class A LP Units are entitled to vote at all meetings of the partners of BOPC LP. In addition, BOX is the sole shareholder of BOPC GP Inc., the general partner of BOPC LP, which has full power and exclusive authority to administer, manage, control and operate the business and affairs of BOPC LP. Non-controlling interests in the equity and results of the Trust are shown separately in equity on the consolidated balance sheets.
| (d) | Interests in joint ventures |
A joint venture is a contractual arrangement pursuant to which the Trust and other parties undertake an economic activity that is subject to joint control whereby the strategic financial and operating policy decisions relating to the activities of the joint venture require the unanimous consent of the parties sharing control.
The Trust undertakes its activities under joint venture arrangements through direct interests in the joint venture’s assets, rather than through the establishment of a separate entity. Accordingly, the Trust’s proportionate share of jointly controlled assets, liabilities, revenues and expenses are recognized in the consolidated financial statements and classified according to their nature.
Investment properties include commercial properties held to earn rental income. Commercial properties are recorded at fair value, determined based on available market evidence, as at the consolidated balance sheet date. Related fair value gains and losses are recorded in net income in the period in which they arise.
Initial direct leasing costs incurred by the Trust in negotiating and arranging tenant leases are added to the carrying amount of investment properties.
Non-current assets and groups of assets and liabilities that comprise disposal groups are categorized as assets held for sale where the asset or disposal group is available for sale in its present condition and the sale is highly probable. For this purpose, a sale is highly probable if management is committed to a plan to achieve the sale, there is an active program to find a buyer, the non-current asset or disposal group is being actively marketed at a reasonable price, the sale is anticipated to be completed within one year from the date of classification, and it is unlikely there will be changes to the plan. Where an asset or disposal group is acquired with a view to resale, it is classified as a non-current asset held for sale if the disposal is expected to take place within one year of the acquisition and it is highly likely that the other conditions referred to above will be met within a short period following the acquisition. Non-current assets held for sale and disposal groups are carried at the lesser of carrying amount and fair value less costs to sell. The profit or loss arising on re-classification or sale of a disposal group is recognized as discontinued operations.
A provision is a liability of uncertain timing or amount. Provisions are recognized when the Trust has a present legal or constructive obligation as a result of past events, it is probable that an outflow of resources will be required to settle the obligation, and the amount can be reliably estimated. Provisions are not recognized for future operating losses. Provisions are measured at the present value of the expenditures expected to be required to settle the obligation using a discount rate that reflects current market assessments of the time value of money and the risks specific to the obligation. Provisions are remeasured at each balance sheet date using the current discount rate. The increase in the provision due to the passage of time is recognized as interest expense.
The Trust has retained substantially all of the risks and benefits of ownership of its investment properties and therefore accounts for leases with its tenants as operating leases. Revenue recognition under a lease commences when the tenant has a right to use the leased asset. Generally, this occurs on the lease inception date or, where the Trust is required to make additions to the property in the form of tenant improvements that enhance the value of the property, upon substantial completion of those improvements. The total amount of contractual rent to be received from operating leases is recognized on a straight-line basis over the term of the lease; a straight-line rent receivable, which is included in the carrying amount of investment property, is recorded for the difference between the rental revenue recorded and the contractual amount received.
Rental revenue also includes percentage participating rents and recoveries of operating expenses, including property and capital taxes. Percentage participating rents are recognized when tenants’ specified sales targets have been met. Operating expense recoveries are recognized in the period that recoverable costs are chargeable to tenants.
| (i) | Financial instruments and derivatives |
Derivative instruments are recorded on the consolidated balance sheets at fair value, including those derivatives that are embedded in financial or non-financial contracts and that are not closely related to the host contract, and gains and losses arising from changes in fair value of derivative instruments are recognized in net income in the period the changes occur.
The following summarizes the Trust’s classification and measurement of financial instruments:
| | | | |
| Financial assets and liabilities | | Classification | Measurement |
| Cash and cash equivalents | | Loans and receivables | Amortized cost |
| Tenant receivables | | Loans and receivables | Amortized cost |
| Commercial property and corporate debt | | Other liabilities | Amortized cost |
| Accounts payable and other liabilities | | Other liabilities | Amortized cost |
| (j) | Cash and cash equivalents |
Cash and cash equivalents include cash and short-term investments with original maturities of three months or less.
| (k) | Non-controlling interest |
Class B LP Units are classified as non-controlling interest and are presented as a component of equity as they represent equity interests in BOPC LP not attributable, directly or indirectly, to the Trust.
The Trust is a “mutual fund trust” pursuant to the Income Tax Act (Canada). The Trust intends to distribute or designates all taxable earnings to unitholders and, under current legislation, the obligation to pay tax rests with each unitholder. No current or deferred tax provision is recognized in the Trust’s financial statements on the Trust’s income.
| (m) | Critical judgments in applying accounting policies |
The following are the critical judgments that have been made in applying the Trust’s accounting policies and that have the most significant effect on the amounts in the consolidated financial statements:
(i) Leases
| | The Trust’s policy for revenue recognition on investment properties is described in Note 2(h). In applying this policy, the Trust makes judgments with respect to whether tenant improvements provided in connection with a lease enhance the value of the leased property, which determines whether such amounts are treated as additions to investment property as well as the point in time at which revenue recognition under the lease commences. In addition, where a lease allows a tenant to elect to take all or a portion of any unused tenant improvement allowance as a rent abatement, the Trust must exercise judgment in determining the extent to which the allowance represents an inducement that is amortized as a reduction of lease revenue over the term of the lease. |
| | The Trust also makes judgments in determining whether certain leases, in particular those tenant leases with long contractual terms where the lessee is the sole tenant in a property and long-term ground leases where the Trust is lessor, are operating or finance leases. The Trust has determined that all of its leases are operating leases. |
(ii) Investment property
The Trust’s accounting policies relating to investment property are described in Note 2(e). In applying this policy, judgment is applied in determining whether certain costs are additions to the carrying amount of the property. Judgment is also applied in determining the extent and frequency of independent appraisals.
(iii) Income taxes
Deferred income taxes are not recognized in the Trust’s financial statements on the basis that the Trust can deduct distributions paid such that its liability for income taxes is substantially reduced or eliminated for the year, and the Trust intends to continue to distribute its taxable income and continue to qualify as a real estate investment trust for the foreseeable future.
(iv) Common control transactions
| | IFRS does not include specific measurement guidance for transfers of businesses or subsidiaries between entities under common control. Accordingly, the Trust has developed a policy to account for such transactions taking into consideration other guidance in the IFRS framework and pronouncements of other standard-setting bodies. The Trust’s policy is to record assets and liabilities recognized as a result of transfers of businesses or subsidiaries between entities under common control at the carrying value on the transferor’s financial statements. Differences between the carrying amount of the consideration paid or received, where the Trust is the transferor, and the carrying amount of the assets and liabilities transferred are recorded directly in equity. |
| (n) | Critical Accounting Estimates and Assumptions |
The Trust makes estimates and assumptions that affect the carrying amounts of assets and liabilities, disclosure of contingent assets and liabilities, and the reported amount of earnings for the period. Actual results could differ from estimates. The estimates and assumptions that are critical to the determination of the amounts reported in the consolidated financial statements relate to the following:
The critical estimates and assumptions underlying the valuation of investment properties are set out in Note 4.
NOTE 3: Future accounting policy changes
IFRS 9, “Financial Instruments” is a multi-phase project to replace IAS 39, “Financial Instruments: Recognition and Measurement”. IFRS 9 introduces new requirements for classifying and measuring financial assets. In October 2010, the International Accounting Standards Board (“IASB”) reissued IFRS 9, incorporating new requirements on accounting for financial liabilities and carrying over from IAS 39 the requirements for de-recognition of financial assets and financial liabilities. In December 2011, the IASB issued “Mandatory Effective Date of IFRS 9 and Transition Disclosures”, which amended the effective date of IFRS 9 to annual periods beginning on or after January 1, 2015, and modified the relief from restating comparative periods and the associated disclosures in IFRS 7, “Financial Instruments: Disclosures”. Early adoption is permitted. The IASB intends to expand IFRS 9 to add new requirements for impairment of financial assets measured at amortized cost and hedge accounting. On completion of these various phases, IFRS 9 will be a complete replacement of IAS 39.
| (b) | Consolidated Financial Statements |
IFRS 10, “Consolidated Financial Statements” establishes principles for the preparation of financial statements when an entity controls one or more other entities. The standard defines the principle of control and establishes control as the basis for determining which entities are consolidated in the financial statements of the reporting entity. The standard also sets out the accounting requirements for the preparation of consolidated financial statements.
IFRS 11, “Joint Arrangements” replaces the existing IAS 31, “Interests in Joint Ventures”. The standard requires that an entity consider whether a joint arrangement is structured through a separate vehicle, as well as the terms of the contractual arrangement and other relevant facts and circumstances, to assess whether the venture is entitled to only the net assets of the joint arrangement (a “joint venture”) or to its share of the assets and liabilities of the joint arrangement (a “joint operation”). Joint ventures are accounted for using the equity method, whereas joint operations are accounted for by recording the Trust’s share of assets, liabilities, revenue and expenses.
| (d) | Disclosure of Interests in Other Entities |
IFRS 12, “Disclosure of Interests in Other Entities” applies to entities that have an interest in a subsidiary, a joint arrangement, an associate or an unconsolidated structured entity. The standard requires the reporting entity to disclose information that enables users of financial statements to evaluate (i) the nature of, and risks associated with, the reporting entity’s interests in other entities and (ii) the effects of those interests on the reporting entity’s financial position, financial performance and cash flows.
| (e) | Fair Value Measurement |
IFRS 13, “Fair Value Measurement” replaces the current guidance on fair value measurement in IFRS with a single standard. The standard defines fair value, provides guidance on its determination and requires disclosures about fair value measurements but does not change the requirements about the items that should be measured and disclosed at fair value.
| (f) | Financial Statement Presentation |
The IASB issued amendments to IAS 1, “Presentation of Financial Statements” which requires items within other comprehensive income (“OCI”) that will be reclassified to profit and loss to be grouped separately from those that will not.
Each of the above are effective for annual periods beginning on or after January 1, 2013, except for IFRS 9 which is effective for annual periods beginning on or after January 1, 2015. Earlier application is permitted for each standard. The Trust anticipates adopting each of the above in the first quarter of the year for which the standard is applicable and is currently evaluating the impact of each to its consolidated financial statements.
NOTE 4: Investment properties
| (Millions) | | Dec. 31, 2012 | Dec. 31, 2011 |
| Balance at beginning of year | | | $ 4,637.9 | $ 3,965.0 |
| Additions: | | | | |
| Investment property acquisitions | | | ¾ | 362.1 |
| Capital expenditures and tenant improvements | | | 47.8 | 43.1 |
| Leasing commissions | | | 5.8 | 15.6 |
| Tenant inducements | | | 2.2 | 10.0 |
| Fair value gains | | | 388.5 | 229.3 |
| Other changes | | | 8.0 | 12.8 |
| Balance at end of year | | | $ 5,090.2 | $ 4,637.9 |
Other changes represent net straight-line rent recognized in accordance with IAS 17, “Leases” that is implied within the fair value of investment properties.
The Trust determined the fair value of each investment property based upon, among other things, rental income from current leases and assumptions about rental income from future leases reflecting market conditions at the applicable balance sheet dates, less future cash outflows with respect to such leases. Fair values were primarily determined by discounting the expected future cash flows, generally over a weighted-average term of 11 years, including a terminal value based on the application of a capitalization rate to estimated year 12 cash flows. In accordance with its policy, the Trust measures its investment properties using valuations prepared by management. The Trust does not measure its investment properties based on valuations prepared by external valuation professionals.
The key valuation metrics for the Trust’s investment properties are set out in the following tables:
| | December 31, 2012 | December 31, 2011 |
| | | Discount Rate | Terminal Cap Rate | Hold Period (yrs) | Discount Rate | Terminal Cap Rate | Hold Period (yrs) |
| Eastern region | | | 6.4% | 5.6% | 11 | 6.6% | 6.1% | 11 |
| Western region | | | 6.4% | 5.7% | 10 | 6.8% | 6.3% | 10 |
| Average | | | 6.4% | 5.6% | 11 | 6.7% | 6.2% | 11 |
Values are most sensitive to changes in discount rates and timing or variability of cash flows.
Included in investment properties is $94.4 million (compared to $102.4 million at December 31, 2011) of net straight-line rent receivables arising from the recognition of rental revenue on a straight-line basis over the lease term in accordance with IAS 17, “Leases.”
Investment properties with a fair value of approximately $924.4 million (compared to $825.2 million at December 31, 2011) are situated on land held under leases or other agreements largely expiring after the year 2023. Investment properties do not include any properties held under operating leases.
Investment properties with a fair value of $4,681.0 million (compared to $4,253.9 million at December 31, 2011) are pledged as security for commercial property and corporate debt.
NOTE 5: INVESTMENT IN JOINTLY CONTROLLED ASSETS
The Trust’s interests in the following properties are subject to joint control and, accordingly, the Trust has recorded its share of the related assets, liabilities, revenue, and expenses of the properties:
| | Proportionate Ownership Interest |
| Jointly controlled assets | | Dec. 31, 2012 | Dec. 31, 2011 |
| Exchange Tower | | 50% | 50% |
| Fifth Avenue Place | | 50% | 50% |
| Bankers Hall | | 50% | 50% |
| Bankers Court | | 50% | 50% |
| Suncor Energy Centre | | 50% | 50% |
| Brookfield Place Retail | | 50% | 50% |
| Brookfield Place Parking | | 56% | 56% |
| First Canadian Place(1) | | 25% | 25% |
| 2 Queen St. E.(1) | | 25% | 25% |
| 151 Yonge St.(1) | | 25% | 25% |
| Place de Ville I(1) | | 25% | 25% |
| Place de Ville II(1) | | 25% | 25% |
| Jean Edmonds Towers(1) | | 25% | 25% |
(1)On December 1, 2011, the Trust acquired a 25% interest in nine office assets from BPP’s Canadian Office Fund portfolio (the “Acquired Assets”).
First Canadian Place is subject to a land lease with respect to 50% of the land on which the property is situated. The land lease will expire on December 1, 2023 subject to an extension under certain circumstances. At the expiry of the land lease, the other land owner will have the option to acquire, for a nominal amount, an undivided 50% beneficial interest in the office tower.
Summarized financial information in respect of the Trust’s interest in jointly controlled assets is set out below:
| (Millions) | | Dec. 31, 2012 | Dec. 31, 2011 |
| Non-current assets | | $ 2,399.8 | $ 2,159.6 |
| Current assets | | 33.9 | 34.5 |
| Total assets | | 2,433.7 | 2,194.1 |
| | | | |
| Non-current liabilities | | 619.3 | 663.5 |
| Current liabilities | | 210.3 | 124.3 |
| Total liabilities | | 829.6 | 787.8 |
| Net assets | | $ 1,604.1 | $ 1,406.3 |
| (Millions) | | 2012 | 2011 |
| Revenue | | $ 246.8 | $ 186.0 |
| Expenses | | 145.5 | 112.4 |
| | | 101.3 | 73.6 |
| Fair value gains | | 207.1 | 48.5 |
| Net income | | $ 308.4 | $ 122.1 |
In the period from the acquisition date to December 31, 2011, the Trust recorded rental revenues and net income in connection with the Acquired Assets of $5.9 million and $2.8 million, respectively. If the acquisition had been as of January 1, 2011, the rental revenues and net income of the Trust would have been $60.8 million and $7.9 million, respectively, for the year ended December 31, 2011. These amounts do not include certain ground rent expenditures, which are expected to be incurred commencing in 2014. In connection with this acquisition, the Trust recognized acquisition-related costs of $0.9 million, which was recorded through transaction costs.
NOTE 6: TENANT AND OTHER RECEIVABLES
As of December 31, 2012, the Trust recorded $0.2 million as a reserve against uncollectible tenant receivables, which is consistent with the amount at December 31, 2011.
As of December 31, 2012, $0.2 million of the Trust’s balance of accounts receivables is over 90 days past due (compared to $0.8 million at December 31, 2011).
The Trust’s maximum exposure to credit risk associated with tenant and other receivables is equivalent to its carrying value. Credit risk related to tenant receivables arises from the possibility that tenants may be unable to fulfill their lease commitments. The Trust manages this risk by attempting to ensure that its tenant mix is diversified and by limiting its exposure to any one tenant. The Trust maintains a portfolio that is diversified by property type so that exposure to a business sector is lessened. Currently no one tenant represents more than 6.4% of commercial property revenue. This risk is further managed by signing long-term leases with tenants who have investment grade credit ratings.
NOTE 7: OTHER ASSETS
| (Millions) | | Dec. 31, 2012 | Dec. 31, 2011 |
| Prepaid expenses and other assets | $ | 6.2 | $ | 6.4 |
| Restricted cash | | 0.8 | | 0.8 |
| Total | $ | 7.0 | $ | 7.2 |
| | | | | | |
NOTE 8: CASH AND CASH EQUIVALENTS
At December 31, 2012, the Trust had $nil of cash placed in term deposits, which is consistent with the amount at December 31, 2011. For the year ended December 31, 2012, interest income of $nil was recorded on cash and cash equivalents, compared with $0.6 million in 2011.
Note9:Commercial property and corporate debt
| | Dec. 31, 2012 | Dec. 31, 2011 |
| | Weighted | | Weighted | |
| (Millions) | Average Rate | Debt Balance | Average Rate | Debt Balance |
| Commercial property debt – fixed rate | 5.3% | $ 1,935.7 | 5.6% | $ 1,860.6 |
| Commercial property and corporate debt – floating rate | 3.2% | 77.3 | 3.3% | 119.7 |
| Total commercial property and corporate debt | 5.2% | $ 2,013.0 | 5.5% | $ 1,980.3 |
| | | | | |
| Current | | $ 616.4 | | $ 232.1 |
| Non-current | | 1,396.6 | | 1,748.2 |
| Totaldebt | | $ 2,013.0 | | $ 1,980.3 |
| | | | | | |
The Trust’s secured commercial property and corporate debt is non-recourse to the Trust with the exception of $103.9 million (compared to $106.1 million at December 31, 2011) which has limited recourse to the Trust’s parent, BPP and $67.7 million (compared to $119.7 million at December 31, 2011) which has recourse to the Trust.
Commercial property and corporate debt maturities for the next five years and thereafter are as follows:
| | | | | | Weighted-Average |
| | | Scheduled | | | Interest Rate (%) at |
| | (Millions, except interest data) | Amortization | Maturities | Total | Dec. 31, 2012 |
| 2013 | $ | 32.3 | $ | 584.1 | $ | 616.4 | 6.4% |
| 2014 | | 26.3 | | 345.6 | | 371.9 | 5.5% |
| 2015 | | 21.4 | | 137.8 | | 159.2 | 3.3% |
| 2016 | | 20.3 | | ¾ | | 20.3 | ¾% |
| 2017 | | 21.3 | | 28.6 | | 49.9 | 5.6% |
| 2018 and thereafter | | 94.6 | | 700.7 | | 795.3 | 4.6% |
| Total | $ | 216.2 | $ | 1,796.8 | $ | 2,013.0 | 5.2% |
| | | | | | | | | | | |
For the year ended December 31, 2012, interest of $109.3 million (compared to $91.9 million in 2011) was recorded on commercial property and corporate debt.
Approximately 3.8% of the Trust’s outstanding commercial property and corporate debt at December 31, 2012, is floating rate debt (compared to 6.0% at December 31, 2011). The effect of a 100 basis-point increase in interest rates on interest expense relating to floating rate debt, all else being equal, is an increase in interest expense of $0.8 million on an annual basis. In addition, there is interest rate risk associated with the Trust’s fixed rate debt due to the expected requirement to refinance such debts in the year of maturity. The effect of a 100 basis-point increase in interest rates on interest expense relating to fixed rate debt maturing within one year, all else being equal, is an increase in interest expense of $5.9 million on an annual basis.
The fair value of commercial property and corporate debt is determined by discounting contractual principal and interest payments at estimated current market interest rates for the instrument. Current market interest rates are determined with reference to current benchmark rates for a similar term and current credit spreads for debt with similar terms and risks. As of December 31, 2012, the fair value of commercial property and corporate debt exceeds the principal loan value of these obligations by $71.3 million (compared to an excess of $72.5 million at December 31, 2011).
Interest rate risk arises when the fair value or future cash flows of commercial property and corporate debt fluctuate because of changes in market interest rates. Financing risk arises when lenders will not refinance maturing debt on terms and conditions acceptable to the Trust, or on any terms at all. The Trust attempts to stagger the maturities of its borrowings, as well as obtain fixed-rate debt as the means of managing interest rate risk. The Trust has an ongoing need to access debt markets to refinance maturing debt as it comes due. The Trust’s strategy to stagger its borrowing maturities attempts to mitigate the Trust’s exposure to excessive amounts of debt maturing in any one year. The Trust has debt totaling $584.1 million maturing in 2013, representing 29.0% of the Trust’s total debt outstanding at December 31, 2012, of which $20.6 million, $410.1 million, $nil and $153.4 million matures in the first, second, third and fourth quarter of 2013, respectively. Refer to Note 19 for details relating to the early re-financing of Bay Wellington Tower that was completed subsequent to December 31, 2012.
During the first quarter of 2012 the Trust increased its revolving corporate credit facility by $75.0 million to $200.0 million with the same five Canadian chartered banks. No changes were made to the terms of the original facility. As of December 31, 2012, $68.0 million was drawn on the revolving corporate credit facility (compared to $120.0 million at December 31, 2011).
The details of the financing transactions completed in 2012 are as follows:
| (Millions) | | | New Proceeds | Net Proceeds Generated (1) | Interest Rate (%) | Mortgage Detail | Maturity |
| Exchange Tower | Q2 | Refinancing | $ | 120.0 | $ | 64.3 | 4.031% | Non-recourse | April 2022 |
| Royal Centre | Q2 | Refinancing | | 150.0 | | 39.0 | 3.325% | Non-recourse | June 2015 |
| 151 Yonge St. | Q3 | Extension | | ¾ | | ¾ | BA + 170 basis points | Non-recourse | July 2014 |
| HSBC Building | Q4 | Refinancing | | 44.5 | | 24.7 | 4.056% | Non-recourse | January 2023 |
(1)Excludes financing costs.
NOTE 10: ACCOUNTS PAYABLE AND OTHER LIABILITIES
The components of the Trust’s accounts payable and other liabilities are as follows:
| (Millions) | Dec. 31, 2012 | Dec. 31, 2011 |
| Accounts payable and accrued liabilities | $ | 102.3 | $ | 93.1 |
| Accrued interest | | 12.7 | | 13.8 |
| Total | $ | 115.0 | $ | 106.9 |
NOTE 11: DISTRIBUTIONS
The following tables present distributions declared for the year ended December 31, 2012 and December 31, 2011:
| | | | | 2012 |
| (Millions, except per unit amounts) | | | | Trust Units | Class B LP Units |
| Paid in cash or DRIP | | | | | $ | 26.4 | $ 67.9 |
| Payable as of December 31, 2012 | | | | | | 2.6 | 6.5 |
| Total | | | | | �� | 29.0 | 74.4 |
| Per unit | | | | | $ | 1.11 | $ 1.11 |
| | | 2011 |
| (Millions, except per unit amounts) | | | | Trust Units | Class B LP Units |
| Paid in cash or DRIP | | | | | $ | 25.8 | $ 66.5 |
| Payable as of December 31, 2011 | | | | | | 2.4 | 6.0 |
| Total | | | | | | 28.2 | 72.5 |
| Per unit | | | | | $ | 1.08 | $ 1.08 |
The Trust has implemented a distribution reinvestment plan (“DRIP”), which allows certain Canadian resident unitholders to elect to have their distributions reinvested in additional Trust Units. No brokerage commissions or service charges are payable in connection with the purchase of Trust Units under the DRIP and the Trust will pay all administrative costs. The automatic reinvestment of distributions under the DRIP does not relieve holders of Trust Units of any income tax applicable to such distributions. For the year ended December 31, 2012, $610,349 (dollars) or 22,322 Trust Units were paid through the DRIP, compared to $332,231 (dollars), or 14,957 Trust Units in 2011.
NOTE 12: EQUITY
The components of equity are as follows:
| (Millions) | Dec. 31, 2012 | Dec. 31, 2011 |
| Trust Units | $ | 551.1 | $ | 550.5 |
| Contributed surplus | | 3.1 | | 3.1 |
| Retained earnings | | 283.9 | | 165.2 |
| Unitholders’ equity | | 838.1 | | 718.8 |
| Non-controlling interest | | 2,197.5 | | 1,892.1 |
| Total | $ | 3,035.6 | $ | 2,610.9 |
Authorized Capital and Outstanding Securities
The Trust is authorized to issue an unlimited number of two classes of units: Trust Units and Special Voting Units. Special Voting Units are only issued in tandem with the issuance of Class B LP Units. As of December 31, 2012, the Trust had a total of 26,132,882 Trust Units outstanding and 67,088,022 Class B LP Units outstanding (and a corresponding number of Special Voting Units).
The following tables summarize the changes in the units outstanding during the year ended December 31, 2012 and December 31, 2011:
| | | 2012 |
| | | | Trust Units | Class B LP Units |
| Units issued and outstanding at beginning of year | | | 26,110,560 | 67,088,022 |
| Units issued pursuant to DRIP | | | 22,322 | ¾ |
| Total units outstanding at December 31, 2012 | | | 26,132,882 | 67,088,022 |
| | | 2011 |
| | | | Trust Units | Class B LP Units |
| Units issued and outstanding at beginning of year | | | 26,095,603 | 67,088,022 |
| Units issued pursuant to DRIP | | | 14,957 | ¾ |
| Total units outstanding at December 31, 2011 | | | 26,110,560 | 67,088,022 |
At December 31, 2012, the weighted average number of Trust Units outstanding was 26,121,860 (compared to 26,101,811 at December 31, 2011).
In November 2012, the Trust renewed its normal course issuer bid for its Trust Units for a further one-year period. During the twelve-month period commencing November 7, 2012, and ending November 6, 2013, the Trust may purchase on the Toronto Stock Exchange and/or the New York Stock Exchange up to 1,306,448 Trust Units, representing approximately 5% of its issued and outstanding Trust Units. No Trust Units were repurchased by the Trust under its normal course issuer bid for the year ended December 31, 2012.
Trust Units
Each Trust Unit is transferable and represents an equal, undivided, beneficial interest in BOX and any distributions, whether of net income, net realized capital gains, or other amounts, and in the event of the termination or winding-up of the Trust, in the Trust’s net assets remaining after satisfaction of all liabilities. All Trust Units rank among themselves equally and ratably without discrimination, preference, or priority. Each Trust Unit entitles the holder thereof to one vote at all meetings of unitholders or with respect to any written resolution of unitholders. The Trust Units have no conversion, retraction, or redemption rights.
Special Voting Units
Special Voting Units are only issued in tandem with Class B LP Units of BOPC LP and are not transferable separately from the Class B LP Units to which they relate. Upon any transfer of Class B LP Units, such Special Voting Units will automatically be transferred to the transferee of the Class B LP Units. As Class B LP Units are exchanged for Trust Units or purchased for cancellation, the corresponding Special Voting Units will be cancelled for no consideration.
Each Special Voting Unit entitles the holder thereof to one vote at all meetings of unitholders or with respect to any resolution in writing of unitholders. Except for the right to attend and vote at meetings of the unitholders or with respect to written resolutions of the unitholders, Special Voting Units do not confer upon the holders thereof any other rights. A Special Voting Unit does not entitle its holder to any economic interest in BOX, or to any interest or share in BOX, or to any interest in any distributions (whether of net income, net realized capital gains, or other amounts), or to any interest in any net assets in the event of termination or winding-up.
Non-Controlling interest
The Trust classifies the outstanding Class B LP Units as non-controlling interest for financial statement purposes in accordance with IFRS. The Class B LP Units are exchangeable on a one-for-one basis (subject to customary anti-dilution provisions) for Trust Units at the option of the holder. Each Class B LP Unit is accompanied by a Special Voting Unit that entitles the holder thereof to receive notice of, to attend, and to vote at all meetings of unitholders of BOX. The holders of Class B LP Units are entitled to receive distributions when declared by BOPC LP equal to the per unit amount of distributions payable to each holder of Trust Units. However, the Class B LP Units have limited voting rights over BOPC LP.
NOTE 13: REVENUEAND Expenses
(a) Commercial property revenue
The components of revenue are as follows:
| (Millions) | | | | 2012 | | 2011 |
| Rental revenue | | | | | $ | 505.8 | $ | 430.5 |
| Straight-line rental income | | | | | | 8.0 | | 12.8 |
| Lease termination and other income | | | | | | 1.3 | | 2.1 |
| Commercial property revenue | | | | | $ | 515.1 | $ | 445.4 |
The Trust generally leases investment properties under operating leases with lease terms between five and 10 years, with options to extend up to five additional years.
Future minimum rental commitments on non-cancellable tenant operating leases are as follows:
| (Millions) | | 2012 | | 2011 |
| Not later than 1 year | $ | 246.1 | $ | 234.4 |
| Later than 1 year and not longer than 5 years | | 862.6 | | 754.5 |
| Later than 5 years | | 1,136.9 | | 1,012.7 |
| | $ | 2,245.6 | $ | 2,001.6 |
(b) Expenses
The following represents an analysis of the nature of the expense included in direct commercial property expense, interest expense, and administrative expense:
| (Millions) | | | | | 2012 | 2011 |
| Employee benefits | | | | | $ | 18.4 | $ | 15.5 |
| Interest expense | | | | | | 109.3 | | 91.9 |
| Property maintenance | | | | | | 114.1 | | 99.4 |
| Real estate taxes | | | | | | 107.5 | | 93.2 |
| Ground rents | | | | | | 7.2 | | 4.0 |
| Asset management fees and other | | | | | | 19.6 | | 15.7 |
| Total expenses | | | | | $ | 376.1 | $ | 319.7 |
Operating expenses include ground rent expenses for the year ended December 31, 2012, of $7.2 million (compared to $4.0 million in 2011) representing rent expense associated with operating leases for land on which certain of the Trust’s investment properties are situated. These leases have remaining terms of between 11 and 102 years. The Trust does not have an option to purchase the leased land at the expiry of the lease periods.
Future minimum lease payments under these arrangements are as follows:
| (Millions) | | 2012 | | 2011 |
| Not later than 1 year | $ | 7.0 | $ | 7.5 |
| Later than 1 year and not longer than 5 years | | 28.0 | | 30.2 |
| Later than 5 years | | 464.7 | | 512.5 |
| | $ | 499.7 | $ | 550.2 |
(c) Investment and other income
Investment and other income was $nil for the year ended December 31, 2012 (compared to $1.3 million in 2011). The amounts primarily include interest earned on cash balances and other income.
NOTE 14: GUARANTEES, CONTINGENCIES, AND OTHER
(a) In the normal course of operations, the Trust and its consolidated subsidiaries execute agreements that provide for indemnification and guarantees to third parties in transactions such as business dispositions, business acquisitions, lease-up of development properties, sales of assets, and sales of services.
(b) The Trust and its operating subsidiaries are contingently liable with respect to litigation and claims that arise from time to time in the normal course of business or otherwise. A specific litigation is being pursued against one of the Trust’s subsidiaries related to security on a defaulted loan. At this time, the amount of contingent cash outflow related to the litigation and claims currently being pursued against the Trust is uncertain but could be up to $65.0 million ($63.0 million Australian dollars) in the event the Trust is completely unsuccessful in defending the claims. During the year ended December 31, 2012, the amount of the contingent cash outflow increased by $19.6 million ($19.0 million Australian dollars) due to a change in the methodology of determining the amount of the claim that was adopted by the Courts.
(c) The Trust has currently guaranteed up to $200.0 million related to its revolving corporate credit facility. As of December 31, 2012 the Trust has issued letters of credit of $33.7 million related to its revolving corporate credit facility.
(d) The Trust maintains insurance on its commercial properties in amounts and with deductibles that the Trust believes are in line with what owners of similar properties carry. The Trust maintains all risk property insurance and rental value coverage (including coverage for the perils of flood, earthquake and windstorm). The Trust’s all risk policy limit is $1.5 billion per occurrence. The Trust’s earthquake limit is $500 million per occurrence and in the annual aggregate. This coverage is subject to a $100,000 (dollars) deductible for all locations except for British Columbia where the deductible is 3% of the values for all locations where the physical loss, damage or destruction occurred. The flood limit is $500 million per occurrence and in the annual aggregate, and is subject to a deductible of $25,000 (dollars) for all losses arising from the same occurrence.
With respect to its commercial properties, the Trust purchases an insurance policy that covers acts of terrorism for limits up to $1.2 billion.
NOTE 15: SEGMENTED INFORMATION
The Trust has only one business segment: the ownership and operation of investment properties in Canada.
NOTE 16: RELATED-PARTY TRANSACTIONS
In the normal course of operations, the Trust enters into various transactions on market terms with related parties that have been measured at exchange value and are recognized in the consolidated financial statements.
The Trust has entered into two service-support agreements with Brookfield Properties Management Corporation (“BPMC”), a subsidiary of BPP, dated May 1, 2010, for the provision of property management, leasing, construction, and asset management services. The purpose of the agreements is to provide the services of certain personnel and consultants as are necessary to help the Trust operate and manage its assets and tenant base; it also includes a cost-recovery for administrative and regulatory compliance services provided. The fees paid to BPMC are calculated in accordance with the terms of the agreements. Included in direct commercial property expense during the year ended December 31, 2012, are amounts paid to BPMC for property management services of $13.8 million (compared to $12.4 million in 2011). Included in investment properties during the year ended December 31, 2012, are amounts paid to BPMC for leasing and construction services of $3.1 million (compared to $6.9 million in 2011). Included in general and administrative expenses during the year ended December 31, 2012, are amounts paid to BPMC for asset management and administrative and regulatory compliance services of $16.2 million (compared to $12.6 million in 2011).
Included in rental revenues during the year ended December 31, 2012, are amounts received from Brookfield Asset Management Inc., the ultimate parent of BPP, and its affiliates of $5.9 million (compared to $4.7 million in 2011).
Compensation of Independent Trustees
The remuneration of independent trustees during the year ended December 31, 2012 and 2011 was as follows:
| (Millions) | | 2012 | | 2011 |
| Cash compensation | $ | 0.2 | $ | 0.2 |
| Unit-based awards | | 0.2 | | 0.2 |
| | $ | 0.4 | $ | 0.4 |
The remuneration of independent trustees is determined by the Trust’s Governance and Nominating Committee having regard to the complexity of the Trust’s operations, the risks and responsibilities involved in being a trustee of the Trust, the requirement to participate in scheduled and special board meetings, expected participation on the board’s standing committees and compensation paid to trustees of comparable entities.
NOTE 17: CAPITAL MANAGEMENT AND LIQUIDITY
The Trust employs a broad range of financing strategies to facilitate growth and manage financial risk.
The Trust continually strives to reduce its weighted-average cost of capital and improve unitholders’ equity returns through value-enhancement initiatives and the consistent monitoring of the balance between debt and equity financing. As of December 31, 2012, the weighted-average cost of capital, assuming a long-term 9.0% return on equity, was 7.4%, which is consistent with December 31, 2011.
The following schedule details the capitalization of the Trust and the related costs thereof:
| | Cost of Capital(1) | Underlying Value(2) |
| (Millions, except cost of capital data) | Dec. 31, 2012 | Dec. 31, 2011 | Dec. 31, 2012 | Dec. 31, 2011 |
| Liabilities | | | | | | |
| Commercial property and corporate debt | 5.2% | 5.5% | $ | 2,013.0 | $ | 1,980.3 |
| Unitholders’ equity | | | | | | |
| Trust Units(3) | 9.0% | 9.0% | | 764.0 | | 634.7 |
| Other equity | | | | | | |
| Non-controlling interest(3) | 9.0% | 9.0% | | 1,964.0 | | 1,631.9 |
| Total | 7.4% | 7.4% | $ | 4,741.0 | $ | 4,246.9 |
| | | | | | | | |
(1) Total weighted-average cost of capital is calculated on the weighted average of underlying value.
| (2) | Underlying value of liabilities presents the cost to retire debt on maturity. Underlying value of unitholders’ equity and other equity is based on the closing unit price of BOX on the TSX. |
(3)Assumes a long-term 9.0% return on equity for December 31, 2012 and December 31, 2011.
Commercial property and corporate debt
The Trust’s commercial property and corporate debt is primarily fixed-rate and non-recourse to the Trust, thereby reducing the overall financial risk to the Trust. These financings are typically structured on a loan-to-appraised value basis of between 50% and 65% when the market permits. In addition, in certain circumstances where a building is leased almost exclusively to a high-credit quality tenant, a higher loan-to-value financing, based on the tenant’s credit quality, is put in place at rates commensurate with the cost of funds for the tenant. This reduces equity requirements to finance investment property and enhances equity returns.
The Trust is subject to certain covenants on its borrowings, including debt service coverage and loan-to-value thresholds. As of December 31, 2012, the Trust was in compliance with all of its covenants.
The Trust’s strategy is to satisfy its liquidity needs using cash on hand, cash flows generated from operating activities, and cash provided by financing activities. Rental revenue, recoveries from tenants, interest and other income, available cash balances, draws on credit facilities, and refinancings, including upward refinancings, of maturing indebtedness are the Trust’s principal sources of capital used to pay operating expenses, distributions, debt service, and recurring capital and leasing costs in its investment property portfolio.
The principal liquidity needs for periods beyond the next year are for unit distributions, scheduled debt maturities, and capital expenditures. The Trust’s strategy is to meet these needs with one or more of the following:
| • | cash flow from operations; and |
| • | refinancing opportunities. |
The Trust attempts to match the maturity of its commercial property and corporate debt portfolio with the average lease terms of its properties. At December 31, 2012, the average term to maturity of the Trust’s commercial property and corporate debt portfolio was five years and the Trust’s average lease term of its properties was approximately eight years. The Trust will continue to make efforts to match the maturity of the commercial property and corporate debt portfolio with the average lease term of its properties.
The following table presents the contractual maturities of the Trust’s financial liabilities:
| | | Payments Due By Period | |
| (Millions) | | Total | 1 year | 2-3 years | 4 – 5 Years | After 5 Years |
| Commercial property and corporate debt(1) | | $ | 2,414.4 | $ | 703.0 | $ | 630.4 | $ | 148.6 | $ | 932.4 |
| Accounts payable and other liabilities | 115.0 | | 115.0 | | ― | | ― | | ― |
| | | | | | | | | | | | | | | | |
(1) Includes repayment of principal and interest.
NOTE 18: OTHER INFORMATION
Supplemental cash flow information:
| (Millions) | | | 2012 | 2011 |
| Cash interest paid | | | | | $ | 108.1 | $ | 86.3 |
| | | | | | | | | |
NOTE 19: SUBSEQUENT EVENT
Subsequent to year end, on January 9, 2013, the Trust completed the early re-financing of Bay Wellington Tower for $525.0 million. The new financing has a 7-year term with a fixed interest rate of 3.244% per annum. After repayment of the previous mortgage, the Trust generated net proceeds of $213.0 million. No break costs were incurred on the early re-financing.
On February 1, 2013, the Trust repaid the debt at 105 Adelaide St. West in Toronto for $20.7 million.
Note 20: APPROVAL OF ANNUAL FINANCIAL STATEMENTS
The annual financial statements were approved by the Trust’s Board of Trustees and authorized for issue on January 28, 2013.
Unitholder Information
DISTRIBUTION PAYMENT DATES
| | | | 2013 | 2012 | 2011 |
| (Dollars) | | | Trust Units | Class B LP Units | Trust Units | Class B LP Units | Trust Units | Class B LP Units |
| January 15 | | | $ 0.0975 | $ 0.0975 | $ 0.09 | $ 0.09 | $ 0.08 | $ 0.08 |
| February 15 | | | 0.0975 | 0.0975 | 0.09 | 0.09 | 0.09 | 0.09 |
| March 15 | | | 0.0975 | 0.0975 | 0.09 | 0.09 | 0.09 | 0.09 |
| April 15 | | | | | 0.09 | 0.09 | 0.09 | 0.09 |
| May 15 | | | | | 0.09 | 0.09 | 0.09 | 0.09 |
| June 15 | | | | | 0.09 | 0.09 | 0.09 | 0.09 |
| July 15 | | | | | 0.09 | 0.09 | 0.09 | 0.09 |
| August 15 | | | | | 0.09 | 0.09 | 0.09 | 0.09 |
| September 15 | | | | | 0.09 | 0.09 | 0.09 | 0.09 |
| October 15 | | | | | 0.0975 | 0.0975 | 0.09 | 0.09 |
| November 15 | | | | | 0.0975 | 0.0975 | 0.09 | 0.09 |
| December 15 | | | | | 0.0975 | 0.0975 | 0.09 | 0.09 |
Selected Financial and Operational Information
| December 31 (Millions, except per-unit and operating information) | | 2012 | 2011 | 2010 |
| Financial results | | | | |
| Commercial property net operating income | | $ 269.2 | $ 234.6 | $ 219.5 |
| Funds from operations | | 139.0 | 127.0 | 119.2 |
| Adjusted funds from operations | | 107.4 | 95.4 | 82.3 |
| Distributions | | 103.4 | 100.7 | 59.6 |
| Net income | | 527.5 | 355.4 | 329.0 |
| Total assets | | 5,163.6 | 4,698.1 | 4,007.2 |
| Unitholders’ equity | | 838.1 | 718.8 | 644.1 |
| | | | | |
| Per Trust unit | | | | |
| Trust Units outstanding | | 26,132,882 | 26,110,560 | 26,095,603 |
| Class B LP Units outstanding | | 67,088,022 | 67,088,022 | 67,088,022 |
| Funds from operations | | 1.49 | 1.36 | 1.28 |
| Adjusted funds from operations | | 1.15 | 1.02 | 0.88 |
| Distributions | | 1.11 | 1.08 | 0.64 |
| Unitholders value | | 32.57 | 28.01 | 25.16 |
| | | | | |
| Operating data | | | | |
| Number of commercial properties | | 28 | 28 | 19 |
| Total area (000’s of sq. ft.) | | 20,716 | 20,716 | 14,402 |
| Owned interest (000’s of sq. ft.) | | 11,685 | 11,685 | 10,226 |
| Average occupancy (%) | | 96.9 | 96.2 | 97.1 |
Board of Trustees Thomas F. Farley Chairman of the Board President and Global Chief Operating Officer
Brookfield Office Properties Inc. T. Jan Sucharda President and Chief Executive Officer Brookfield Canada Office Properties Dennis H. Friedrich Chief Executive Officer Brookfield Office Properties Inc. Paul D. McFarlane Corporate Director Colum Bastable Chairman, Cushman & Wakefield Ltd. Michael F.B. Nesbitt President, Montrose Mortgage Co. Ltd. Roderick D. Fraser, Ph.D., O.C. Officer, Order of Canada | Officers T. Jan Sucharda President and Chief Executive Officer Bryan K. Davis Chief Financial Officer Stefan Dembinski Senior Vice President, Asset Management, Eastern Ian Parker Senior Vice President, Asset Management, Western Deborah R. Rogers Senior Vice President, Legal Counsel, Secretary Ryk Stryland Senior Vice President, Development T. Nga Trinh Senior Vice President, Investments D. Cameron Black Vice President, Legal Counsel, Western Melissa Coley Vice President, Investor Relations and Communications Elliott S. Feintuch Vice President, Legal Counsel, Eastern Michael Yam Vice President & Controller Brett M. Fox Assistant Secretary Michelle L. Campbell Assistant Secretary |
BROOKFIELD CANADA OFFICE PROPERTIES CORPORATE INFORMATION
HEAD OFFICE
181 Bay Street, Suite 330
Toronto, Ontario M5J 2T3
Tel: 416.359.8555
Fax: 416.359.8596
www.brookfieldcanadareit.com
TRANSFER AGENT
CIBC Mellon Trust Company
P.O. Box 700Station B
Montreal, Quebec H3B 3K3
Tel: 416.682.3860 / 800.387.0825
Fax: 888.249.6189
Website: www.canstockta.com
E-mail: inquiries@canstockta.com
STOCK EXCHANGE LISTING
| Series | Stock Symbol | Exchange | Record Date | Payment Date |
| Trust Units | BOX.UN, BOXC | TSX, NYSE | Last business day of each month | Fifteenth day of each month |
UNITHOLDER INFORMATION
Brookfield Canada Office Properties welcomes inquiries from unitholders, analysts, media representatives and other interested parties. Questions relating to investor relations or media inquiries can be directed to Matthew Cherry, Director, Investor Relations and Communications at 416.359.8593 or via e-mail at matthew.cherry@brookfield.com. Inquiries regarding financial results should be directed to Bryan Davis, Chief Financial Officer at 416.359.8612 or via e-mail at bryan.davis@brookfield.com.
Unitholder questions relating to distributions, address changes and unit certificates should be directed to the Trust's Transfer Agent, CIBC Mellon Trust, as listed above.
ANNUAL MEETING OF UNITHOLDERS
The Annual Meeting of Unitholders will be held in Toronto at the Hockey Hall of Fame at Brookfield Place, 30 Yonge St., at 1:30 pm on April 22, 2013. Unitholders may also participate in the meeting by webcast on brookfieldcanadareit.com
Brookfield Canada Office Properties
181 Bay Street, Suite 330
Toronto, Ontario M5J 2T3
Tel: 416.359.8555
Fax: 416.359.8596
www.brookfieldcanadareit.com