Exhibit 99.2

Portfolio by City
Brookfield Canada Office Properties’ portfolio is composed of interests in 27 premier office properties totaling 21.1 million square feet, including 4.0 million square feet of parking and other. Landmark properties include Brookfield Place Toronto, Bay Adelaide Centre, and First Canadian Place in Toronto and Bankers Hall in Calgary. Our development portfolio consists of 1.4 million square feet in the downtown core of Calgary.
| | | Number of | | | Leased | | | | | | | | | Leasable | | | Parking | | | | | | Ownership | | | Owned | |
| (Square feet in 000’s) | | Properties | | | % | | | Office | | | Retail | | | Area | | | and Other | | | Total | | | Interest % | | | Interest | |
| TORONTO | | | | | | | | | | | | | | | | | | | | | | | | | | | | | | | | | | | | |
| Brookfield Place Toronto | | | | | | | | | | | | | | | | | | | | | | | | | | | | | | | | | | | | |
| Bay Wellington Tower | | | 1 | | | | 92.3 | % | | | 1,297 | | | | 44 | | | | 1,341 | | | | 68 | | | | 1,409 | | | | 100 | % | | | 1,409 | |
| Retail & Parking(1) | | | 1 | | | | 97.2 | % | | | — | | | | 52 | | | | 52 | | | | 503 | | | | 555 | | | | 56 | % | | | 308 | |
| First Canadian Place | | | 1 | | | | 93.3 | % | | | 2,383 | | | | 229 | | | | 2,612 | | | | 220 | | | | 2,832 | | | | 25 | % | | | 708 | |
| Bay Adelaide West | | | 1 | | | | 95.3 | % | | | 1,157 | | | | 32 | | | | 1,189 | | | | 266 | | | | 1,455 | | | | 100 | % | | | 1,455 | |
| Bay Adelaide East(2) | | | 1 | | | | 95.0 | % | | | 980 | | | | — | | | | 980 | | | | 143 | | | | 1,123 | | | | 100 | % | | | 1,123 | |
| Exchange Tower | | | 1 | | | | 96.8 | % | | | 961 | | | | 66 | | | | 1,027 | | | | 203 | | | | 1,230 | | | | 50 | % | | | 615 | |
| Hudson’s Bay Centre | | | 1 | | | | 97.4 | % | | | 532 | | | | 213 | | | | 745 | | | | 175 | | | | 920 | | | | 100 | % | | | 920 | |
| 2 Queen St. East | | | 1 | | | | 99.7 | % | | | 448 | | | | 16 | | | | 464 | | | | 71 | | | | 535 | | | | 25 | % | | | 134 | |
| Queen’s Quay Terminal | | | 1 | | | | 97.4 | % | | | 429 | | | | 54 | | | | 483 | | | | 28 | | | | 511 | | | | 100 | % | | | 511 | |
| 105 Adelaide St. West | | | 1 | | | | 99.9 | % | | | 177 | | | | 7 | | | | 184 | | | | 31 | | | | 215 | | | | 100 | % | | | 215 | |
| 22 Front St. West | | | 1 | | | | 99.9 | % | | | 136 | | | | 7 | | | | 143 | | | | 1 | | | | 144 | | | | 100 | % | | | 144 | |
| | | | 11 | | | | 95.1 | % | | | 8,500 | | | | 720 | | | | 9,220 | | | | 1,709 | | | | 10,929 | | | | | | | | 7,542 | |
| OTTAWA | | | | | | | | | | | | | | | | | | | | | | | | | | | | | | | | | | | | |
| Place de Ville I | | | 2 | | | | 91.6 | % | | | 571 | | | | 11 | | | | 582 | | | | 364 | | | | 946 | | | | 25 | % | | | 237 | |
| Place de Ville II | | | 2 | | | | 94.7 | % | | | 587 | | | | 7 | | | | 594 | | | | 330 | | | | 924 | | | | 25 | % | | | 231 | |
| Jean Edmonds Towers | | | 2 | | | | 99.8 | % | | | 544 | | | | 10 | | | | 554 | | | | 108 | | | | 662 | | | | 25 | % | | | 166 | |
| | | | 6 | | | | 95.3 | % | | | 1,702 | | | | 28 | | | | 1,730 | | | | 802 | | | | 2,532 | | | | | | | | 634 | |
| CALGARY | | | | | | | | | | | | | | | | | | | | | | | | | | | | | | | | | | | | |
| Bankers Hall | | | 3 | | | | 94.0 | % | | | 1,940 | | | | 222 | | | | 2,162 | | | | 481 | | | | 2,643 | | | | 50 | % | | | 1,322 | |
| Bankers Court | | | 1 | | | | 99.8 | % | | | 256 | | | | 7 | | | | 263 | | | | 70 | | | | 333 | | | | 50 | % | | | 167 | |
| Suncor Energy Centre | | | 2 | | | | 100.0 | % | | | 1,708 | | | | 25 | | | | 1,733 | | | | 349 | | | | 2,082 | | | | 50 | % | | | 1,041 | |
| Fifth Avenue Place | | | 2 | | | | 98.4 | % | | | 1,428 | | | | 49 | | | | 1,477 | | | | 294 | | | | 1,771 | | | | 50 | % | | | 886 | |
| | | | 8 | | | | 97.3 | % | | | 5,332 | | | | 303 | | | | 5,635 | | | | 1,194 | | | | 6,829 | | | | | | | | 3,416 | |
| VANCOUVER | | | | | | | | | | | | | | | | | | | | | | | | | | | | | | | | | | | | |
| Royal Centre | | | 1 | | | | 93.7 | % | | | 488 | | | | 93 | | | | 581 | | | | 260 | | | | 841 | | | | 100 | % | | | 841 | |
| OTHER | | | | | | | | | | | | | | | | | | | | | | | | | | | | | | | | �� | | | | |
| Merivale Place, Nepean | | | 1 | | | | 100.0 | % | | | — | | | | 3 | | | | 3 | | | | — | | | | 3 | | | | 100 | % | | | 3 | |
| TOTAL COMMERCIAL PROPERTIES | | | 27 | | | | 95.8 | % | | | 16,022 | | | | 1,147 | | | | 17,169 | | | | 3,965 | | | | 21,134 | | | | | | | | 12,436 | |
| | | | | | | | | | | | | | | | | | | | | | | | | | | | | | | | | | | | | |
| DEVELOPMENT | | | | | | | | | | | | | | | | | | | | | | | | | | | | | | | | | | | | |
| Brookfield Place Calgary East(3) | | | 1 | | | | 71.4 | % | | | 1,400 | | | | — | | | | 1,400 | | | | — | | | | 1,400 | | | | 100 | % | | | 1,400 | |
| | | | | | | | | | | | | | | | | | | | | | | | | | | | | | | | | | | | | |
| TOTAL PORTFOLIO | | | 28 | | | | | | | | 17,422 | | | | 1,147 | | | | 18,569 | | | | 3,965 | | | | 22,534 | | | | | | | | 13,836 | |
| (1) | Brookfield Canada Office Properties owns a 50% interest in the retail operations and is entitled to a 56% interest in the parking operations. |
| (2) | 95.0% occupancy includes Brookfield Office Properties Inc. headlease. Occupancy excluding Brookfield Office Properties Inc. headlease is 71.3%. Refer to Related-Party Transactions section on page 30 of the MD&A. |
| (3) | The development was acquired on an “as-if-completed-and-stabilized basis” as described on page 10 of the MD&A under Commercial Developments. |
| Brookfield Canada Office Properties | 1 |
| Contents | |
| | |
| MANAGEMENT’S DISCUSSION AND ANALYSIS OF FINANCIAL RESULTS | |
| | |
| PART I – OBJECTIVES AND FINANCIAL HIGHLIGHTS | 4 |
| | |
| PART II – FINANCIAL STATEMENT ANALYSIS | 8 |
| | |
| PART III – RISKS AND UNCERTAINTIES | 25 |
| | |
| PART IV – CRITICAL ACCOUNTING POLICIES AND ESTIMATES | 28 |
| | |
| PART V – BUSINESS ENVIRONMENT AND OUTLOOK | 31 |
| | |
| MANAGEMENT’S RESPONSIBILITY FOR THE FINANCIAL STATEMENTS | 32 |
| | |
| REPORT OF INDEPENDENT REGISTERED PUBLIC ACCOUNTING FIRM | 33 |
| | |
| MANAGEMENT’S REPORT ON INTERNAL CONTROL OVER FINANCIAL REPORTING | 34 |
| | |
| REPORT OF INDEPENDENT REGISTERED PUBLIC ACCOUNTING FIRM | 35 |
| | |
| CONSOLIDATED FINANCIAL STATEMENTS | 36 |
| | |
| NOTES TO THE CONSOLIDATED FINANCIAL STATEMENTS | 40 |
| | |
| UNITHOLDER INFORMATION | 53 |
| | |
| SELECTED FINANCIAL AND OPERATIONAL INFORMATION | 54 |
| | |
| BOARD OF TRUSTEES AND OFFICERS | 55 |
FORWARD-LOOKING STATEMENTS
This annual report to unitholders, particularly the section entitled Management’s Discussion and Analysis of Financial Results, contains “forward-looking information” within the meaning of Canadian provincial securities laws and applicable regulations and “forward-looking statements” within the meaning of “safe harbor” provisions of the United States Private Securities Litigation Reform Act of 1995. Forward-looking statements include statements that are predictive in nature, depend upon or refer to future events or conditions, include statements regarding the Trust’s operations, business, financial condition, expected financial results, performance, prospects, opportunities, priorities, targets, goals, ongoing objectives, strategies and outlook, as well as the outlook for the Canadian economy for the current fiscal year and subsequent periods, and include words such as “expects”, “anticipates”, “plans”, “believes”, “estimates”, “seeks”, “intends”, “targets”, “projects”, “forecasts”, “likely”, or negative versions thereof and other similar expressions, or future or conditional verbs such as “may”, “will”, “should”, “would” and “could”.
Although the Trust believes that the anticipated future results, performance or achievements expressed or implied by the forward-looking statements and information are based upon reasonable assumptions and expectations, the reader should not place undue reliance on forward-looking statements and information because they involve known and unknown risks, uncertainties and other factors, many of which are beyond the control of the Trust, which may cause the actual results, performance or achievements of the Trust to differ materially from anticipated future results, performance or achievement expressed or implied by such forward-looking statements and information.
Factors that could cause actual results to differ materially from those contemplated or implied by forward-looking statements include, but are not limited to: risks incidental to the ownership and operation of real estate properties including local real estate conditions; the impact or unanticipated impact of general economic, political and market factors in Canada; the ability to enter into new leases or renew leases on favourable terms; business competition; dependence on tenants’ financial condition; the use of debt to finance the Trust’s business; the behavior of financial markets, including fluctuations in interest rates; equity and capital markets and the availability of equity and debt financing and refinancing within these markets; risks relating to the Trust’s insurance coverage; the possible impact of international conflicts and other developments including terrorist acts; potential environmental liabilities; changes in tax laws and other tax related risks; dependence on management personnel; illiquidity of investments; the ability to complete and effectively integrate acquisitions into existing operations and the ability to attain expected benefits therefrom; operational and reputational risks; catastrophic events, such as earthquakes and hurricanes; and other risks and factors detailed from time to time in the Trust’s documents filed with the securities regulators in Canada and the United States.
Caution should be taken that the foregoing list of important factors that may affect future results is not exhaustive. When relying on the Trust’s forward-looking statements or information, investors and others should carefully consider the foregoing factors and other uncertainties and potential events. Except as required by law, the Trust undertakes no obligation to publicly update or revise any forward-looking statements or information, whether written or oral, that may be as a result of new information, future events or otherwise.
| Brookfield Canada Office Properties | 3 |
Management’s Discussion and Analysis of Financial Results
February 24, 2016
PART I – OBJECTIVES AND FINANCIAL HIGHLIGHTS
BASIS OF PRESENTATION
Financial data included in this Management’s Discussion and Analysis (“MD&A”) for the year ended December 31, 2015, includes material information up to February 24, 2016. Financial data provided has been prepared in accordance with International Financial Reporting Standards as issued by the International Accounting Standards Board (“IFRS”). All dollar references, unless otherwise stated, are in millions of Canadian dollars except per unit amounts. Amounts in U.S. dollars are identified as “US$.”
Brookfield Canada Office Properties (“BOX,” the “Trust,” “we”, “our” or “us” ) was formed in connection with the reorganization of BPO Properties Ltd. (“BPP”), a former wholly-owned subsidiary of Brookfield Office Properties Inc. (“BOPI”), on May 1, 2010, in which BPP’s directly owned office assets were transferred to the Trust. In connection with the reorganization, the Trust also acquired BOPI’s interest in Brookfield Place Toronto, which includes Bay Wellington Tower and partial interests in the retail concourse and parking operations.
On December 1, 2011, we acquired from BOPI, a 25% interest in nine office assets from its Canadian Office Fund portfolio totaling 6.5 million square feet in Toronto and Ottawa. On July 11, 2013, we acquired Bay Adelaide East from BOPI totaling 980,000 square feet in Toronto and on October 14, 2014, we acquired Brookfield Place Calgary East from BOPI totaling 1.4 million square feet in Calgary.
The following discussion and analysis is intended to provide readers with an assessment of the performance of BOX over the past two years as well as our financial position and future prospects. It should be read in conjunction with the consolidated financial statements and appended notes, which begin on page 36 of this report. In Part II – Financial Statement Analysis, we review our operating performance and financial position as presented in our financial statements prepared in accordance with IFRS.
We included our discussion of operating performance on an IFRS basis beginning on page 18 of the MD&A followed by a discussion of non-IFRS measures. Included in non-IFRS measures are commercial property net operating income, funds from operations, and adjusted funds from operations on a total and per-unit basis. Commercial property net operating income, funds from operations and adjusted funds from operations do not have any standardized meaning prescribed by IFRS and therefore may not be comparable to similar measures presented by other companies. We define commercial property net operating income as income from commercial property operations after direct property operating expenses, including property administration costs, have been deducted but prior to deducting or including interest expense, general and administrative expenses, and fair value gains (losses). We define funds from operations as net income prior to transaction costs, fair value gains (losses), and certain other non-cash items. Adjusted funds from operations is defined by us as funds from operations net of second-generation leasing commissions and tenant improvements, maintaining value capital expenditures, and straight-line rental income.
Commercial property net operating income is an important measure that both investors and management use to assess operating performance of our commercial properties, and funds from operations is a widely used measure in analyzing the performance of real estate. Adjusted funds from operations is a measure used to assess an entity’s ability to pay distributions. We provide the components of commercial property net operating income, a reconciliation of net income to commercial property net operating income, a full reconciliation of net income to funds from operations and adjusted funds from operations, and a reconciliation of cash generated from operating activities to adjusted funds from operations beginning on page 22.
Additional information, including our Annual Information Form, is available on our Web site at www.brookfieldcanadareit.com or at www.sedar.com or www.sec.gov.
OVERVIEW OF THE BUSINESS
BOX is a publicly traded, real estate investment trust listed on the Toronto and New York stock exchanges under the symbol BOX.UN and BOXC, respectively.
The Trust invests, develops and operates commercial office properties in Toronto, Ottawa, Calgary, and Vancouver.
At December 31, 2015, the carrying value of BOX’s total assets was $6,356.5 million. During the year ended December 31, 2015, we generated $351.4 million of net income ($3.76 per unit), $145.8 million of funds from operations ($1.56 per unit), and $94.6 million of adjusted funds from operations ($1.01 per unit).
FINANCIAL HIGHLIGHTS
BOX’s financial results are as follows:
| (Millions, except per-unit amounts) | | 2015 | | | 2014 | | | 2013 | |
| Results of operations | | | | | | | | | | | | |
| Commercial property revenue | | $ | 516.9 | | | $ | 517.2 | | | $ | 521.9 | |
| Net income | | | 351.4 | | | | 116.1 | | | | 164.8 | |
| Funds from operations(1) | | | 145.8 | | | | 158.2 | | | | 144.7 | |
| Adjusted funds from operations(1)(2) | | | 94.6 | | | | 121.5 | | | | 110.1 | |
| Distributions | | | 115.5 | | | | 113.4 | | | | 109.1 | |
| Per unit amounts – attributable to unitholders | | | | | | | | | | | | |
| Net income | | | 3.76 | | | | 1.24 | | | | 1.77 | |
| Funds from operations(1) | | | 1.56 | | | | 1.70 | | | | 1.55 | |
| Adjusted funds from operations(1)(2) | | | 1.01 | | | | 1.30 | | | | 1.18 | |
| Distributions | | | 1.24 | | | | 1.21 | | | | 1.17 | |
| (Millions, except per-unit amounts) | | Dec. 31, 2015 | | | Dec. 31, 2014 | | | Dec. 31, 2013 | |
| Balance sheet data | | | | | | | | | | | | |
| Total assets | | $ | 6,356.5 | | | $ | 5,943.4 | | | $ | 5,608.8 | |
| Investment properties | | | 6,267.8 | | | | 5,802.4 | | | | 5,390.2 | |
| Investment property and corporate debt | | | 2,838.5 | | | | 2,649.7 | | | | 2,354.9 | |
| Total equity | | | 3,333.0 | | | | 3,096.3 | | | | 3,092.3 | |
| Total equity per unit | | | 35.72 | | | | 33.19 | | | | 33.18 | |
| (1) | Non-IFRS measure. Refer to description of non-IFRS measures and reference to reconciliation to comparable IFRS measures beginning on page 20. |
| (2) | Based on actual leasing commissions, tenant improvements and maintaining value capital expenditures incurred. |
COMMERCIAL PROPERTY OPERATIONS
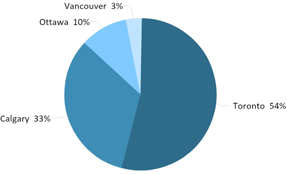
Our strategy to own premier properties in high-growth, and in many instances supply-constrained markets with high barriers to entry, has created one of Canada’s most distinguished portfolios of office properties. Our commercial-property portfolio consists of interests in 27 properties totaling 21.1 million square feet, including 4.0 million square feet of parking and other. Our development portfolio consists of the Brookfield Place Calgary East development site totaling 1.4 million square feet in Calgary. Our markets are the financial, government and energy sectors primarily located in the cities of Toronto and Calgary. Our strategy is concentrating operations within a select number of Canadian gateway cities with attractive tenant bases in order to maintain a meaningful presence and build on the strength of our tenant relationships within these markets.
| Gross Leasable Area by City | Gross Leasable Area by Tenant Base |
| as of December 31, 2015 | as of December 31, 2015 |
| | |
 |  |
We remain focused on the following strategic priorities:
| • | Realizing value from our investment properties through proactive leasing initiatives; |
| • | Prudent capital management, including the refinancing of mature investment properties; and |
| • | Acquiring high-quality investment properties in our primary markets for value when opportunities arise. |
| Brookfield Canada Office Properties | 5 |
The following table summarizes our commercial property portfolio by region as at December 31, 2015:
| | | | | | | | | BOX’s | | | | | | | | | | | | Net Book | |
| | | Number of | | | Total Area | | | Owned Interest | | | Fair Value | | | Fair Value | | | Debt(1) | | | Equity(2) | |
| Region | | Properties | | | (000’s Sq. Ft.) | | | (000’s Sq. Ft.) | | | (Millions) | | | Per Sq. Ft. | | | (Millions) | | | (Millions) | |
| Commercial properties | | | | | | | | | | | | | | | | | | | | | | | | | | | | |
| Eastern region | | | 18 | | | | 13,464 | | | | 8,179 | | | $ | 3,723.0 | | | $ | 455 | | | $ | 1,632.7 | | | $ | 2,090.3 | |
| Western region | | | 9 | | | | 7,670 | | | | 4,257 | | | | 2,082.1 | | | | 489 | | | | 886.4 | | | | 1,195.7 | |
| Total | | | 27 | | | | 21,134 | | | | 12,436 | | | $ | 5,805.1 | | | $ | 467 | | | $ | 2,519.1 | | | $ | 3,286.0 | |
| (1) | Excludes debt associated with our development properties and corporate debt. |
| (2) | Represents fair value less debt and excludes working capital and is a non-IFRS measure. |
An important characteristic of our portfolio is the strong credit quality of our tenants. We direct special attention to credit quality, particularly in the current economic environment, in order to ensure the long-term sustainability of rental revenues through economic cycles. Major tenants with over 500,000 square feet of space in the portfolio include government and related agencies, Suncor Energy Inc., Bank of Montreal, Deloitte LLP, and Canadian Natural Resources. A detailed list of major tenants is included in Part III (“Risks and Uncertainties”) of this MD&A, beginning on page 25.
Our strategy is to sign long-term leases in order to mitigate risk and reduce our overall re-tenanting costs. We typically commence discussions with tenants regarding their space requirements well in advance of the contractual expiration, and although each market is different, the majority of our leases, when signed, extend between five and 10-year terms. As a result of this strategy, approximately 4.9% of our leases, on average, mature annually up to and including 2020. Our average lease term is eight years.
The following is a breakdown of lease maturities by region with associated in-place rental rates on our commercial properties:
| | | Total Portfolio | | | Toronto, Ontario | | | Ottawa, Ontario | |
| | | | | | | | | Net Rent | | | | | | | | | Net Rent | | | | | | | | | Net Rent | |
| | | 000's | | | | | | per | | | 000's | | | | | | per | | | 000's | | | | | | Per | |
| Year of Expiry | | Sq. Ft. | | | % | | | Sq. Ft.(1) | | | Sq. Ft. | | | % | | | Sq. Ft.(1) | | | Sq. Ft. | | | % | | | Sq. Ft.(1) | |
| Currently available | | | 724 | | | | 4.2 | | | | | | | | 452 | | | | 4.9 | | | | | | | | 82 | | | | 4.7 | | | | | |
| 2016 | | | 685 | | | | 4.0 | | | $ | 22 | | | | 276 | | | | 3.0 | | | $ | 20 | | | | 22 | | | | 1.3 | | | $ | 17 | |
| 2017 | | | 463 | | | | 2.7 | | | | 32 | | | | 352 | | | | 3.8 | | | | 35 | | | | 35 | | | | 2.0 | | | | 18 | |
| 2018 | | | 746 | | | | 4.3 | | | | 35 | | | | 571 | | | | 6.2 | | | | 33 | | | | 3 | | | | 0.2 | | | | 20 | |
| 2019 | | | 878 | | | | 5.1 | | | | 28 | | | | 670 | | | | 7.3 | | | | 28 | | | | 86 | | | | 5.0 | | | | 23 | |
| 2020 | | | 1,415 | | | | 8.2 | | | | 35 | | | | 1,066 | | | | 11.6 | | | | 33 | | | | 9 | | | | 0.5 | | | | 27 | |
| 2021 | | | 1,287 | | | | 7.5 | | | | 30 | | | | 587 | | | | 6.4 | | | | 35 | | | | 566 | | | | 32.7 | | | | 23 | |
| 2022 | | | 1,201 | | | | 7.0 | | | | 31 | | | | 729 | | | | 7.9 | | | | 30 | | | | 20 | | | | 1.2 | | | | 13 | |
| 2023 and beyond | | | 9,770 | | | | 57.0 | | | | 30 | | | | 4,517 | | | | 48.9 | | | | 29 | | | | 907 | | | | 52.4 | | | | 19 | |
| Parking and other | | | 3,965 | | | | — | | | | — | | | | 1,709 | | | | — | | | | — | | | | 802 | | | | — | | | | — | |
| Total | | | 21,134 | | | | 100.0 | % | | | | | | | 10,929 | | | | 100.0 | | | | | | | | 2,532 | | | | 100.0 | | | | | |
| Average market net rent(2) (3) | | | | | | | | | | $ | 28 | | | | | | | | | | | $ | 32 | | | | | | | | | | | $ | 18 | |
| | | Calgary, Alberta | | | Vancouver, B.C. | | | Other | |
| | | | | | | | | Net Rent | | | | | | | | | Net Rent | | | | | | | | | Net Rent | |
| | | 000's | | | | | | per | | | 000’s | | | | | | per | | | 000’s | | | | | | Per | |
| Year of Expiry | | Sq. Ft. | | | % | | | Sq. Ft.(1) | | | Sq. Ft. | | | % | | | Sq. Ft.(1) | | | Sq. Ft. | | | % | | | Sq. Ft.(1) | |
| Currently available | | | 154 | | | | 2.7 | | | | | | | | 36 | | | | 6.3 | | | | | | | | — | | | | — | | | | | |
| 2016 | | | 355 | | | | 6.3 | | | $ | 24 | | | | 32 | | | | 5.5 | | | $ | 27 | | | | — | | | | — | | | $ | — | |
| 2017 | | | 63 | | | | 1.1 | | | | 28 | | | | 13 | | | | 2.2 | | | | 29 | | | | — | | | | — | | | | — | |
| 2018 | | | 142 | | | | 2.5 | | | | 42 | | | | 30 | | | | 5.2 | | | | 34 | | | | — | | | | — | | | | — | |
| 2019 | | | 80 | | | | 1.4 | | | | 42 | | | | 41 | | | | 7.1 | | | | 26 | | | | 1 | | | | 33.3 | | | | — | |
| 2020 | | | 272 | | | | 4.8 | | | | 43 | | | | 68 | | | | 11.7 | | | | 32 | | | | — | | | | — | | | | 28 | |
| 2021 | | | 108 | | | | 1.9 | | | | 43 | | | | 26 | | | | 4.5 | | | | 40 | | | | — | | | | — | | | | — | |
| 2022 | | | 374 | | | | 6.6 | | | | 34 | | | | 78 | | | | 13.4 | | | | 29 | | | | — | | | | — | | | | — | |
| 2023 and beyond | | | 4,087 | | | | 72.7 | | | | 34 | | | | 257 | | | | 44.1 | | | | 17 | | | | 2 | | | | 66.7 | | | | 26 | |
| Parking and other | | | 1,194 | | | | — | | | | — | | | | 260 | | | | — | | | | — | | | | — | | | | — | | | | — | |
| Total | | | 6,829 | | | | 100.0 | | | | | | | | 841 | | | | 100.0 | | | | | | | | 3 | | | | 100.0 | | | | | |
| Average market net rent(2) | | | | | | | | | | $ | 26 | | | | | | | | | | | $ | 25 | | | | | | | | | | | $ | — | |
| (1) | Net rent at expiration of lease. |
| (2) | Average market net rent represents management’s estimate of average rent per square foot for buildings of similar quality to our portfolio. However, it may not necessarily be representative of the specific space that is rolling in any specific year. Included on page 20 is the average leasing net rent achieved on our year-to-date leasing as compared to the average expiring net rent. |
| (3) | Average market net rent for Toronto reflects higher market rents for Brookfield Place Toronto and Bay Adelaide West, which comprise 28% of BOX’s exposure in Toronto. |
COMMERCIAL DEVELOPMENTS
The following table summarizes our development projects at December 31, 2015:
| | | | | | | Number of | | | Owned | | | Leasable Area | |
| | | Region | | Location | | Sites | | | Interest | | | (000's Sq. Ft.) | |
| Brookfield Place Calgary East | | Calgary | | Within one block of Fifth Avenue Place, | | | 1 | | | | 100 | % | | | 1,400 | |
| | | | | Bankers Hall and Suncor Energy Centre | | | | | | | | | | | | |
Brookfield Place Calgary East is currently 71.4% pre-leased to anchor tenant Cenovus and is on target to be completed in late 2017.
On November 30, 2015, Bay Adelaide East was transferred into commercial property upon substantial completion with its first lease commencing in December 2015.
PERFORMANCE MEASUREMENT
The key indicators by which we measure our performance are:
| • | Commercial property net operating income; |
| • | Funds from operations per unit; |
| • | Adjusted funds from operations per unit; |
| • | Overall indebtedness level; |
| • | Weighted-average cost of debt; and |
Although we monitor and analyze our financial performance using a number of indicators, our primary business objective of generating reliable and growing cash flow is monitored and analyzed using net income, commercial property net operating income, funds from operations, and adjusted funds from operations. Although net income is calculated in accordance with IFRS, IFRS does not prescribe standardized meanings for commercial property net operating income, funds from operations, and adjusted funds from operations; therefore, they are unlikely to be comparable to similar measures presented by other entities. We provide the components of commercial property net operating income, a reconciliation of net income to commercial property net operating income and a full reconciliation of net income to funds from operations and adjusted funds from operations beginning on page 22 of this MD&A.
Net Income
Net income is calculated in accordance with IFRS. Net income is used as a key indicator in assessing the profitability of the Trust.
KEY PERFORMANCE DRIVERS
In addition to monitoring and analyzing performance in terms of net income, we consider the following items to be important drivers of our current and anticipated financial performance:
| • | Increases in occupancies by leasing vacant space; |
| • | Increases in rental rates through maintaining or enhancing the quality of our assets and as market conditions permit; and |
| • | Reduction in operating costs through achieving economies of scale and diligently managing contracts. |
We also believe that the key external performance drivers include the availability of:
| • | Debt capital at a cost and on terms conducive to our goals; |
| • | Equity capital at a reasonable cost; |
| • | New property acquisitions that fit into our strategic plan; and |
| • | Investors for dispositions of peak value or non-core assets. |
| Brookfield Canada Office Properties | 7 |
PART II – FINANCIAL STATEMENT ANALYSIS
ASSET PROFILE
Our total asset carrying value was $6,356.5 million at December 31, 2015 (compared to $5,943.4 million at December 31, 2014). The following is a summary of our assets:
| (Millions) | | Dec. 31, 2015 | | | Dec. 31, 2014 | |
| Non-current assets | | | | | | | | |
| Investment properties | | | | | | | | |
| Commercial properties | | $ | 5,805.1 | | | $ | 5,131.7 | |
| Commercial developments | | | 462.7 | | | | 670.7 | |
| | | | 6,267.8 | | | | 5,802.4 | |
| Current assets | | | | | | | | |
| Tenant and other receivables | | | 23.8 | | | | 34.3 | |
| Other assets | | | 7.3 | | | | 8.9 | |
| Cash and cash equivalents | | | 57.6 | | | | 58.9 | |
| | | | 88.7 | | | | 102.1 | |
| Assets held for sale | | | — | | | | 38.9 | |
| Total | | $ | 6,356.5 | | | $ | 5,943.4 | |
COMMERCIAL PROPERTIES
Commercial properties comprise of our direct interests in wholly owned commercial properties and our proportionate share of the related assets, liabilities, revenue and expenses in our jointly controlled commercial properties.
The fair value of our commercial properties was $5,805.1 million as at December 31, 2015 (compared to $5,131.7 million at December 31, 2014). The increase in value of commercial properties is primarily attributable to the transfer of Bay Adelaide East to commercial properties upon substantial completion and increases across the Eastern portfolio due to capital expenditures, leasing costs and recognition of fair value gains as a result of favourable market conditions, improvements to tenant profiles, and rental curves related to new leases and renewals; offset by the disposition of HSBC Building in Toronto.
A breakdown of our commercial properties is as follows:
| | | | | | | | | BOX’s | | | | | | | |
| | | | | | | | | Owned | | | Fair Value | | | Fair Value | |
| | | Number of | | | Total Area | | | Interest | | | Dec. 31, 2015 | | | Dec. 31, 2014 | |
| | | Properties | | | (000's Sq. Ft.) | | | (000's Sq. Ft.) | | | (Millions) | | | (Millions) | |
| Eastern region | | | 18 | | | | 13,464 | | | | 8,179 | | | $ | 3,723.0 | | | $ | 3,145.7 | |
| Western region | | | 9 | | | | 7,670 | | | | 4,257 | | | | 2,082.1 | | | | 1,986.0 | |
| Total commercial properties | | | 27 | | | | 21,134 | | | | 12,436 | | | $ | 5,805.1 | | | $ | 5,131.7 | |
| Fair value per Sq. Ft. | | | | | | | | | | | | | | $ | 467 | | | $ | 439 | |
The key valuation metrics for our commercial properties are as follows:
| | | December 31, 2015 | | | December 31, 2014 | |
| | | | | | | | | Weighted | | | | | | | | | Weighted | |
| | | Maximum | | | Minimum | | | Average | | | Maximum | | | Minimum | | | Average | |
| Eastern region | | | | | | | | | | | | | | | | | | | | | | | | |
| Discount rate | | | 7.00 | % | | | 6.00 | % | | | 6.13 | % | | | 7.00 | % | | | 6.00 | % | | | 6.34 | % |
| Terminal cap rate | | | 6.50 | % | | | 5.25 | % | | | 5.51 | % | | | 6.50 | % | | | 5.25 | % | | | 5.63 | % |
| Hold period (yrs) | | | 15 | | | | 10 | | | | 11 | | | | 15 | | | | 10 | | | | 11 | |
| Western region | | | | | | | | | | | | | | | | | | | | | | | | |
| Discount rate | | | 6.75 | % | | | 4.75 | % | | | 6.01 | % | | | 6.75 | % | | | 6.00 | % | | | 6.32 | % |
| Terminal cap rate | | | 6.25 | % | | | 3.53 | % | | | 5.46 | % | | | 6.00 | % | | | 5.50 | % | | | 5.63 | % |
| Hold period (yrs) | | | 11 | | | | 10 | | | | 10 | | | | 11 | | | | 10 | | | | 10 | |
Fair values are most sensitive to changes in discount rates and timing or variability of cash flows. A 25 basis-point decrease in the discount and terminal capitalization rates will impact the fair value of commercial properties by $103.2 million and $160.3 million, or 1.8% and 2.8%, respectively, at December 31, 2015.
Upon the signing of the majority of our leases, we provide a capital allowance for tenant improvements or tenant inducements for leased space in order to accommodate the specific space requirements of the tenant. In addition to these allowances, leasing commissions are paid to third-party brokers and Brookfield Office Properties Management LP (“BOPM LP”), a subsidiary of BOPI. We may experience a delay between lease commencement and the payment of leasing costs due to timing of the tenant installation and the required inspections and certifications. For the year ended December 31, 2015, such expenditures totaled $43.8 million (compared to $29.7 million in 2014). The increase is primarily related to tenant installation costs incurred on the lease-up of space at Brookfield Place Toronto, Bay Adelaide East, Bankers Hall, Fifth Avenue Place, and Royal Centre.
We also invest in ongoing maintenance and capital improvement projects to sustain the high quality of the infrastructure and tenant service amenities in our properties. Capital expenditures for the year ended December 31, 2015 totaled $20.6 million (compared to $22.8 million in 2014). These expenditures exclude repairs and maintenance costs. Fluctuations in our capital expenditures vary period over period based on required and planned expenditures on our commercial properties.
Capital expenditures include maintaining value expenditures, which are those required in order to maintain the properties in their current operating state. Capital expenditures also include projects which represent improvements to an asset or reconfiguration of space that adds productive capacity in order to increase rentable area or increase current rental rates. For the year ended December 31, 2015, maintaining value capital expenditures totaled $8.7 million (compared with $7.9 million in 2014), while the remaining capital expenditures of $11.9 million (compared with $14.9 million in 2014) primarily consist of exterior plaza and common area upgrades at Fifth Avenue Place, food court renovation and the floor conversion project at First Canadian Place, and washroom upgrades at Exchange Tower and Brookfield Place Toronto. Capital expenditures are recoverable in some cases through contractual tenant cost-recovery payments. During the year ended December 31, 2015, $17.4 million, of our total capital expenditures were recoverable (compared with $20.8 million in 2014).
The following table summarizes the second-generation leasing commissions and tenant improvements, and maintaining value capital expenditures recorded on our commercial properties during the year ended December 31, 2015. “Second-generation” leasing commissions and tenant improvements includes both new and renewal tenants for all of our commercial properties and vary with the timing of renewals, vacancies and tenant mix. These costs historically have been lower for renewals of existing tenants compared to new tenants.
For the year ended December 31, 2015, second-generation leasing commissions and tenant improvements consisted primarily of leasing commissions incurred at Brookfield Place Toronto, and Bankers Hall, and tenant improvements at Brookfield Place Toronto, Bankers Hall, Fifth Avenue Place and Royal Centre related to tenant build-outs.
| (Millions) | | 2015 | | | 2014 | |
| Second-generation leasing commissions and tenant improvements | | $ | 39.5 | | | $ | 28.0 | |
| Maintaining value capital expenditures | | | 8.7 | | | | 7.9 | |
| Total | | $ | 48.2 | | | $ | 35.9 | |
The following table summarizes the changes in value of our commercial properties during the year ended December 31, 2015:
| (Millions) | | Dec. 31, 2015 | |
| Balance at beginning of year | | $ | 5,131.7 | |
| Additions: | | | | |
| Capital expenditures and tenant improvements | | | 48.6 | |
| Leasing commissions | | | 15.1 | |
| Tenant inducements | | | 0.7 | |
| Reclassification of commercial development, net | | | 508.9 | |
| Investment property disposition | | | (108.8 | ) |
| Fair value gains | | | 207.9 | |
| Other changes | | | 1.0 | |
| Balance at end of year | | $ | 5,805.1 | |
| Brookfield Canada Office Properties | 9 |
COMMERCIAL DEVELOPMENTS
Commercial developments consist of Brookfield Place Calgary East which is a high quality, centrally located development site acquired from our parent company, BOPI for an aggregate total investment of $966.3 million. The building was purchased on an “as-if-completed-and-stabilized basis,” and as such, BOPI retains the development obligations including construction, lease-up and financing.
On November 30, 2015, Bay Adelaide East was transferred into commercial property upon substantial completion with its first lease commencing in December 2015.
The following table summarizes the details of the transactions and operational information as at December 31, 2015:
| | | | | | Brookfield Place | |
| (Millions, except Operational Information) | | Bay Adelaide East | | | Calgary East | |
| Initial acquisition price | | $ | 169.9 | | | $ | 245.5 | |
| Up-front equity commitment | | | 26.0 | | | | 81.8 | |
| First mortgage construction loan | | | 350.0 | | | | 575.0 | |
| Final payment due to BOPI on stabilization(1) | | | 56.0 | | | | 64.0 | |
| Aggregate total investment | | $ | 601.9 | | | $ | 966.3 | |
| | | | | | | | | |
| Operational Information | | | | | | | | |
| Total Leasable Area (000's Sq. Ft.) | | | 980 | | | | 1,400 | |
| Leased %(2) | | | 95.0 | % | | | 71.4 | % |
| Target Completion Date | | | Completed Nov 2015 | | | | Late 2017 | |
| (1) | Subject to achieving stabilized net operating income and targeted permanent financing, which is expected to occur in 2017 for Bay Adelaide East and 2018 for Brookfield Place Calgary East. |
| (2) | 95.0% occupancy includes BOPI headlease. Occupancy excluding BOPI headlease is 71.3% |
Commercial developments under active development are measured using a discounted cash flow model, net of costs to complete, as of the balance sheet date. The total fair value of development land and infrastructure was $462.7 million at December 31, 2015.
The details of development expenditures are as follows:
| (Millions) | | 2015 | | | 2014 | |
| Construction costs | | $ | 261.2 | | | $ | 173.3 | |
| Property taxes and other related costs | | | 12.7 | | | | 6.3 | |
| Borrowing costs capitalized | | | 27.0 | | | | 13.6 | |
| Total | | $ | 300.9 | | | $ | 193.2 | |
The following table summarizes the changes in value of our commercial developments during the year ended December 31, 2015:
| (Millions) | | Dec. 31, 2015 | |
| Balance at beginning of year | | $ | 670.7 | |
| Additions (Deductions): | | | | |
| Development expenditures | | | 300.9 | |
| Transfer into commercial properties | | $ | (508.9 | ) |
| Balance at end of year | | $ | 462.7 | |
INVESTMENT PROPERTY DISPOSITIONS AND HELD FOR SALE
During the year, we completed the sale of our 100% interest in HSBC Building and 25% interest in 151 Yonge St. We generated net proceeds of $105.7 million. During the fourth quarter of 2014, we reclassified our 25% interest in 151 Yonge St. in Toronto to assets held for sale for $38.8 million. The related receivables and liabilities were $0.1 million and $0.5 million, respectively.
| (Millions) | | HSBC Building | | | 151 Yonge St. | | | Total | |
| Sale proceeds | | $ | 110 | | | $ | 38.5 | | | $ | 148.5 | |
| Selling costs | | | (1.2 | ) | | | (0.1 | ) | | | (1.3 | ) |
| Investment property disposition | | | 108.8 | | | | 38.4 | | | | 147.2 | |
| Assumption of mortgage by purchaser | | | (41.5 | ) | | $ | — | | | | (41.5 | ) |
| Net sale proceeds | | $ | 67.3 | | | | 38.4 | | | $ | 105.7 | |
During the fourth quarter, we commenced marketing the sale of our 100% interest in Royal Centre in Vancouver. Subsequently, we entered into an agreement to sell the property, which is anticipated to close during the first quarter of 2016.
TENANT AND OTHER RECEIVABLES
Tenant and other receivables decreased to $23.8 million at December 31, 2015, from $34.3 million at December 31, 2014 mainly due to receipt of realty tax refunds at Bay Adelaide West.
OTHER ASSETS
At December 31, 2015, the balance of other assets is comprised of prepaid expenses and other assets of $7.3 million (compared to $8.9 million at December 31, 2014).
CASH AND CASH EQUIVALENTS
We endeavor to maintain high levels of liquidity to ensure that we can meet distribution requirements and react quickly to potential investment opportunities. At December 31, 2015, cash balances were $57.6 million (compared to $58.9 million at December 31, 2014).
LIABILITIES AND EQUITY
Our asset base of $6,356.5 million is financed with a combination of debt and equity. The components of our liabilities and equity are as follows:
| (Millions) | | Dec. 31, 2015 | | | Dec. 31, 2014 | |
| Liabilities | | | | | | | | |
| Non-current liabilities | | | | | | | | |
| Investment property and corporate debt | | $ | 2,560.1 | | | $ | 2,368.4 | |
| Current liabilities | | | | | | | | |
| Investment property and corporate debt | | | 278.4 | | | | 281.3 | |
| Accounts payable and other liabilities | | | 185.0 | | | | 196.9 | |
| | | | 463.4 | | | | 478.2 | |
| Liabilities associated with assets held for sale | | | — | | | | 0.5 | |
| | | | 3,023.5 | | | | 2,847.1 | |
| Equity | | | | | | | | |
| Unitholders’ equity | | | 923.8 | | | | 856.7 | |
| Non-controlling interest | | | 2,409.2 | | | | 2,239.6 | |
| | | | 3,333.0 | | | | 3,096.3 | |
| Total liabilities and equity | | $ | 6,356.5 | | | $ | 5,943.4 | |
| Brookfield Canada Office Properties | 11 |
INVESTMENT PROPERTY AND CORPORATE DEBT
Investment property and corporate debt (current and non-current) totaled $2,838.5 million at December 31, 2015 (compared to $2,649.7 million at December 31, 2014). Investment property and corporate debt at December 31, 2015 had a weighted-average interest rate of 3.76%. Debt on our investment properties is mainly non-recourse, thereby reducing overall financial risk to the Trust.
We attempt to match the maturity of our investment property debt portfolio with the average lease term of our properties. At December 31, 2015, the average term to maturity of our investment property debt was seven years, compared to our average lease term of eight years.
The details of the financing transactions completed during 2015 are as follows:
| | | | | | | New | | | Net Proceeds | | | Interest | | | | |
| (Millions) | | | | | | Proceeds(1) | | | Generated(1) | | | Rate (%) | | Mortgage Detail | | Maturity |
| Hudson's Bay Centre | | Q2 | | Extension | | $ | — | | | $ | — | | | BA + 140 bps | | Limited recourse | | May 2016 |
| Royal Centre | | Q2 | | Extension | | | — | | | | — | | | BA + 150 bps | | Non-recourse | | June 2016 |
| Place de Ville I | | Q2 | | New | | | 21.0 | | | | 21.0 | | | 3.752 | % | Non-recourse | | June 2025 |
| Place de Ville II | | Q2 | | New | | | 22.8 | | | | 22.8 | | | 3.752 | % | Non-recourse | | June 2025 |
| (1) | Excludes financing costs. |
During the second quarter of 2015, we upsized our revolving corporate credit facility by $70.0 million to $350.0 million.
During the third quarter of 2015, we extended our revolving corporate credit facility for an additional two years under the existing financial terms, maturing August 29, 2020. As of December 31, 2015, $194.0 million was drawn on the revolving corporate credit facility.
The details of investment property and corporate debt at December 31, 2015, are as follows:
| | | | | Interest | | | Maturity | | BOX’s Share | | | |
| | | Location | | Rate % | | | Date | | (Millions) | | | Mortgage Details |
| Income Producing | | | | | | | | | | | | | | |
| Hudson's Bay Centre(1) | | Toronto | | | 2.24 | % | | May 2016 | | $ | 97.3 | | | Limited recourse - floating rate |
| Royal Centre | | Vancouver | | | 2.33 | % | | June 2016 | | | 137.8 | | | Non-recourse - floating rate |
| Bay Adelaide East(2) | | Toronto | | | 2.75 | % | | December 2017 | | | 260.5 | | | Limited recourse - floating rate |
| 2 Queen St. East | | Toronto | | | 5.64 | % | | December 2017 | | | 28.6 | | | Non-recourse - fixed rate |
| Brookfield Place Toronto | | Toronto | | | 3.24 | % | | January 2020 | | | 497.9 | | | Non-recourse - fixed rate |
| 22 Front St. West | | Toronto | | | 6.24 | % | | October 2020 | | | 16.9 | | | Non-recourse - fixed rate |
| Bankers Court | | Calgary | | | 4.96 | % | | November 2020 | | | 42.3 | | | Non-recourse - fixed rate |
| Queen's Quay Terminal | | Toronto | | | 5.40 | % | | April 2021 | | | 80.9 | | | Non-recourse - fixed rate |
| Fifth Avenue Place | | Calgary | | | 4.71 | % | | August 2021 | | | 158.7 | | | Non-recourse - fixed rate |
| Bay Adelaide West | | Toronto | | | 4.43 | % | | December 2021 | | | 376.5 | | | Non-recourse - fixed rate |
| Exchange Tower | | Toronto | | | 4.03 | % | | April 2022 | | | 109.0 | | | Non-recourse - fixed rate |
| 105 Adelaide St. West | | Toronto | | | 3.87 | % | | May 2023 | | | 35.1 | | | Non-recourse - fixed rate |
| Bankers Hall | | Calgary | | | 4.38 | % | | November 2023 | | | 289.8 | | | Non-recourse - fixed rate |
| First Canadian Place | | Toronto | | | 3.56 | % | | December 2023 | | | 76.8 | | | Non-recourse - fixed rate |
| Jean Edmonds Towers | | Ottawa | | | 6.79 | % | | January 2024 | | | 15.6 | | | Non-recourse - fixed rate |
| Place de Ville I | | Ottawa | | | 3.75 | % | | June 2025 | | | 21.0 | | | Non-recourse - fixed rate |
| Place de Ville II | | Ottawa | | | 3.75 | % | | June 2025 | | | 22.8 | | | Non-recourse - fixed rate |
| Suncor Energy Centre | | Calgary | | | 5.19 | % | | August 2033 | | | 263.6 | | | Non-recourse - fixed rate |
| | | | | | | | | | | | | | | |
| Development | | | | | | | | | | | | | | |
| Brookfield Place Calgary East(3) | | Calgary | | | 2.61 | % | | November 2017 | | | 126.2 | | | Limited recourse - floating rate |
| | | | | | | | | | | | | | | |
| Corporate | | | | | | | | | | | | | | |
| $350M Corporate Revolver | | - | �� | | 2.29 | % | | August 2020 | | | 194.0 | | | Recourse - floating rate |
| | | | | | 3.76 | % | | | | | 2,851.3 | | | |
| Premium on assumed mortgages | | | | | | | | | | | 1.0 | | | |
| Deferred financing costs | | | | | | | | | | | (13.8 | ) | | |
| Total | | | | | 3.76 | % | | | | $ | 2,838.5 | | | |
| (1) | This loan has limited recourse to the Trust for up to $15.0 million. |
| (2) | This loan has a three year term from the date of the initial advance, and has limited recourse to the Trust for up to $50.0 million. Two one-year extension options are available provided certain leasing thresholds have been met and no material defaults have occurred. The criteria for the first option to extend the maturity to 2017 has been met as of December 31, 2015. |
| (3) | This loan has limited recourse to the Trust for up to $80.0 million. A one-year extension option is available provided certain leasing thresholds have been met and no material defaults have occurred. |
Investment property and corporate debt maturities for the next five years and thereafter are as follows:
| | | | | | | | | | | | Weighted-Average | |
| | | Scheduled | | | | | | | | | Interest Rate (%) at | |
| (Millions, except interest data) | | Amortization(1) | | | Maturities | | | Total(1) | | | Dec. 31, 2015 | |
| 2016 | | $ | 43.3 | | | $ | 235.1 | | | $ | 278.4 | | | | 2.29 | % |
| 2017 | | | 46.6 | | | | 415.3 | | | | 461.9 | | | | 2.90 | % |
| 2018 | | | 49.4 | | | | — | | | | 49.4 | | | | — | % |
| 2019 | | | 51.7 | | | | — | | | | 51.7 | | | | — | % |
| 2020 | | | 41.3 | | | | 693.3 | | | | 734.6 | | | | 3.16 | % |
| 2021 and thereafter | | | 193.1 | | | | 1,069.4 | | | | 1,262.5 | | | | 4.56 | % |
| Total | | $ | 425.4 | | | $ | 2,413.1 | | | $ | 2,838.5 | | | | 3.76 | % |
| (1) | Net of transaction costs. |
| Brookfield Canada Office Properties | 13 |
CONTRACTUAL OBLIGATIONS
The following table presents our contractual obligations over the next five years and beyond:
| | | Payments Due By Period | |
| (Millions) | | Total | | | 1 year | | | 2 – 3 years | | | 4 – 5 Years | | | After 5 Years | |
| Investment property and corporate debt(1) | | $ | 2,851.3 | | | $ | 281.2 | | | $ | 515.2 | | | $ | 789.3 | | | $ | 1,265.6 | |
| Interest expense – investment property and corporate debt(2) | | | 588.2 | | | | 86.0 | | | | 164.3 | | | | 146.4 | | | | 191.5 | |
| Minimum rental payments - ground leases(3) | | | 486.9 | | | | 7.4 | | | | 14.9 | | | | 14.9 | | | | 449.7 | |
| | | $ | 3,926.4 | | | $ | 374.6 | | | $ | 694.4 | | | $ | 950.6 | | | $ | 1,906.8 | |
| (1) | Net of transaction costs. |
| (2) | Represents aggregate interest expense expected to be paid over the term of the debt, on an undiscounted basis, based at current interest rates. |
| (3) | Represents minimum rental payments, on an undiscounted basis, on land leases or other agreements. |
CREDIT RATINGS
Our access to financing depends on, among other things, suitable market conditions and the maintenance of suitable long-term credit ratings. Our credit ratings may be adversely affected by various factors, including increased debt levels, decreased earnings, declines in tenant demand, increased competition, a further deterioration in general economic and business conditions and adverse publicity. Any downgrades in our credit ratings may impede our access to capital markets or raise our borrowing rates.
We are currently rated by Dominion Bond Rating Service Inc. (“DBRS”) and Standard & Poor’s (“S&P”). Our credit ratings at December 31, 2015, and at the date of this report were:
| | | DBRS | | S&P |
| Issuer Rating | | BBB (stable) | | BBB (stable) |
We are committed to arranging our affairs to maintain these ratings and improve them over time.
Credit ratings are intended to provide investors with an independent measure of the credit quality of an issue of securities. The credit ratings presented are not a recommendation to purchase, hold or sell our Trust Units, as such ratings do not comment as to market price or suitability for a particular investor. There is no assurance that any rating will remain in effect for any given period or that any rating will not be revised or withdrawn entirely by the rating agency in the future if, in its judgment, circumstances so warrant.
CORPORATE GUARANTEES AND CONTINGENT OBLIGATIONS
We and our operating subsidiaries may be contingently liable with respect to litigation and claims that arise from time to time in the normal course of business or otherwise. In addition, we may execute agreements that provide for indemnifications and guarantees to third parties. Disclosure of commitments, guarantees, and contingencies can be found in Note 15 of the consolidated financial statements.
INCOME TAXES
The Trust is a “mutual fund trust” pursuant to theIncome Tax Act (Canada). The Trust distributes or designates all taxable earnings to unitholders, and as such, under current legislation, the obligation to pay tax rests with each unitholder. No current and deferred tax provisions are required on the Trust’s income.
ACCOUNTS PAYABLE AND OTHER LIABILITIES
Accounts payable and other liabilities totaled $185.0 million at December 31, 2015 (compared to $196.9 million at December 31, 2014).
A summary of the components of accounts payable and other liabilities is as follows:
| (Millions) | | Dec. 31, 2015 | | | Dec. 31, 2014 | |
| Accounts payable and accrued liabilities | | $ | 165.9 | | | $ | 177.0 | |
| Accrued interest | | | 19.1 | | | | 19.9 | |
| Total | | $ | 185.0 | | | $ | 196.9 | |
EQUITY
The components of equity are as follows:
| (Millions) | | Dec. 31, 2015 | | | Dec. 31, 2014 | |
| Trust Units | | $ | 554.4 | | | $ | 553.4 | |
| Contributed surplus | | | 2.9 | | | | 3.1 | |
| Retained earnings | | | 366.5 | | | | 300.2 | |
| Unitholders’ equity | | | 923.8 | | | | 856.7 | |
| Non-controlling interest | | | 2,409.2 | | | | 2,239.6 | |
| Total | | $ | 3,333.0 | | | $ | 3,096.3 | |
The following tables summarize the changes in the units outstanding during the year ended December 31, 2015 and December 31, 2014:
| | | 2015 | |
| | | Trust Units | | | Class B LP Units | |
| Units issued and outstanding at beginning of year | | | 26,218,183 | | | | 67,088,022 | |
| Units repurchased | | | (37,053 | ) | | | — | |
| Units issued pursuant to Distribution Reinvestment Plan | | | 69,214 | | | | — | |
| Total units outstanding at December 31, 2015 | | | 26,250,344 | | | | 67,088,022 | |
| | | 2014 | |
| | | Trust Units | | | Class B LP Units | |
| Units issued and outstanding at beginning of year | | | 26,167,835 | | | | 67,088,022 | |
| Units issued pursuant to Distribution Reinvestment Plan | | | 50,348 | | | | — | |
| Total units outstanding at December 31, 2014 | | | 26,218,183 | | | | 67,088,022 | |
At December 31, 2015, the weighted average number of Trust Units outstanding was 26,246,958 (compared to 26,191,933 at December 31, 2014).
In November 2015, we renewed our normal course issuer bid for our Trust Units for a further one-year period. During the twelve-month period commencing November 12, 2015, and ending November 11, 2016, we may purchase on the Toronto Stock Exchange ("TSX"), the New York Stock Exchange and any alternative Canadian trading system up to 1,566,602 Trust Units, representing approximately 10% of our public float. During the year, we purchased 37,053 Trust Units through open market purchases. The weighted average price that we paid per Trust Units acquired under this bid was $25.95. A copy of the Notice of Intention relating to our normal course issuer bid may be requested without charge.
Trust Units
Each Trust Unit is transferable and represents an equal, undivided, beneficial interest in BOX and in any distributions, whether of net income, net realized capital gains, or other amounts, and in the event of the termination or winding-up of the Trust, in the Trust’s net assets remaining after satisfaction of all liabilities. All Trust Units rank among themselves equally and ratably without discrimination, preference, or priority. Each Trust Unit entitles the holder thereof to one vote at all meetings of unitholders or with respect to any written resolution of unitholders. The Trust Units have no conversion, retraction, or redemption rights.
Special Voting Units
Special Voting Units are only issued in tandem with Class B limited partnership units (“Class B LP Units”) of Brookfield Office Properties Canada LP (“BOPC LP”) and are not transferable separately from the Class B LP Units to which they relate and upon any transfer of Class B LP Units, such Special Voting Units will automatically be transferred to the transferee of the Class B LP Units. As Class B LP Units are exchanged for Trust Units or purchased for cancellation, the corresponding Special Voting Units will be cancelled for no consideration.
Each Special Voting Unit entitles the holder thereof to one vote at all meetings of unitholders or with respect to any resolution in writing of unitholders. Except for the right to attend and vote at meetings of the unitholders or with respect to written resolutions of the unitholders, Special Voting Units do not confer upon the holders thereof any other rights. A Special Voting Unit does not entitle its holder to any economic interest in BOX, or to any interest or share in BOX, or to any interest in any distributions (whether of net income, net realized capital gains, or other amounts), or to any interest in any net assets in the event of termination or winding-up.
Non-Controlling interest
We classify the outstanding Class B LP Units as non-controlling interest for financial statement purposes in accordance with IFRS. The Class B LP Units are exchangeable on a one-for-one basis (subject to customary anti-dilution provisions) for Trust Units at the option of the holder. Each Class B LP Unit is accompanied by a Special Voting Unit that entitles the holder thereof to receive notice of, to attend, and to vote at all meetings of unitholders of BOX. The holders of Class B LP Units are entitled to receive distributions when declared by BOPC LP equal to the per-unit amount of distributions payable to each holder of Trust Units. However, the Class B LP Units have limited voting rights over BOPC LP.
| Brookfield Canada Office Properties | 15 |
The following tables present distributions declared to Trust unitholders and non-controlling interest for the year ended December 31, 2015 and December 31, 2014.
| | 2015 |
| (Millions, except per unit amounts) | | Trust Units | | | Class B LP Units | |
| Paid in cash or DRIP | | $ | 29.6 | | | $ | 76.3 | |
| Payable as of December 31, 2015 | | | 2.7 | | | | 6.9 | |
| Total | | | 32.3 | | | | 83.2 | |
| Per unit | | $ | 1.24 | | | $ | 1.24 | |
| | 2014 |
| (Millions, except per unit amounts) | | Trust Units | | | Class B LP Units | |
| Paid in cash or DRIP | | $ | 29.1 | | | $ | 74.7 | |
| Payable as of December 31, 2014 | | | 2.7 | | | | 6.9 | |
| Total | | | 31.8 | | | | 81.6 | |
| Per unit | | $ | 1.21 | | | $ | 1.21 | |
We determine annual distributions to unitholders by looking at forward-looking cash flow information, including forecasts and budgets and the future business prospects of the Trust. We do not consider periodic cash flow fluctuations resulting from items such as the timing of property operating costs, property tax installments, or semi-annual debenture and mortgage payable interest payments in determining the level of distributions to unitholders. To determine the level of cash distributions made to unitholders, we consider the impact of, among other items, the future growth in the income-producing portfolio, future acquisitions and dispositions, and leasing related to the income-producing portfolio. Annual distributions to unitholders are expected to continue to be funded by cash flows generated from our portfolio.
CAPITAL RESOURCES AND LIQUIDITY
We employ a broad range of financing strategies to facilitate growth and manage financial risk, with particular emphasis on the overall reduction of the weighted-average cost of capital, in order to enhance returns for unitholders. Our principal liquidity needs for the next twelve months are to:
| • | fund recurring expenses; |
| • | meet debt service requirements; |
| • | fund those capital expenditures deemed mandatory, including tenant improvements; |
| • | fund current development costs not covered by construction loans; and |
| • | fund investing activities, which could include: |
| • | discretionary capital expenditures; |
| • | property acquisitions; and |
| • | repurchases of our units. |
We believe that our liquidity needs will be satisfied using cash on hand and cash flows generated from operating, investing, and financing activities. Rental revenue, recoveries from tenants, interest and other income, available cash balances, divestiture of non-core assets, draws on our credit facilities and refinancings (including upward refinancings) of maturing indebtedness are our principal sources of capital used to pay operating expenses, distributions, debt service, capital expenditures, and leasing costs in our commercial-property portfolio. We seek to increase income from our existing properties by controlling operating expenses and by maintaining quality standards for our properties that promote high occupancy rates and support increases in rental rates while reducing tenant turnover. We believe our revenue, along with proceeds from financing activities, will continue to provide the necessary funds for our short-term liquidity needs and to fund anticipated ongoing distributions. However, material changes in these factors may adversely affect our net cash flows.
Our principal liquidity needs for periods beyond the next year are for scheduled debt maturities, unit distributions, development costs and capital expenditures. We plan to meet these needs with one or more of the following:
| • | cash flow from operating activities; |
| • | credit facilities and refinancing opportunities; |
| • | divestiture of commercial properties. |
Our investment property and corporate debt is primarily fixed-rate and non-recourse to the Trust. These investment-grade financings are typically structured on a loan-to-appraised-value basis of between 50% and 65% as market conditions permit. In addition, in certain circumstances where a building is leased almost exclusively to a high-credit-quality tenant, a higher loan-to-value financing, based on the tenant’s credit quality, is put in place at rates commensurate with the cost of funds for the tenant. This reduces our equity requirements to finance investment property and enhances equity returns.
Most of our borrowings are in the form of long-term property-specific financings with recourse only to the specific assets. Limiting recourse to specific assets ensures that poor performance within one area does not compromise our ability to finance the balance of our operations. Our maturity schedule is fairly diversified so that financing requirements in any given year are manageable.
Our focus on structuring financings with investment-grade characteristics ensures that debt levels on any particular asset can typically be maintained throughout a business cycle. This enables us to limit covenants and other performance requirements, thereby reducing the risk of early payment requirements or restrictions on the distribution of cash from the assets being financed.
To help ensure we are able to react to investment opportunities quickly and on a value basis, we attempt to maintain a high level of liquidity. Our primary sources of liquidity consist of cash and undrawn committed credit facilities. In addition, we structure our affairs to facilitate monetization of longer-duration assets through financings, co-investor participations, or refinancings.
At December 31, 2015, our available liquidity consists of $57.6 million of cash on hand, and $156.0 million of undrawn capacity on our corporate credit facility.
Cost of Capital
We continually strive to reduce our weighted-average cost of capital and improve unitholders’ equity returns through value-enhancement initiatives and the consistent monitoring of the balance between debt and equity financing.
As of December 31, 2015, our weighted-average cost of capital, assuming a long-term 9.0% return on equity, was 6.2%. Our cost of capital is lower than many of our peers because of the greater amount of investment-grade financing that can be placed on our assets, which is a function of the high-quality nature of both the assets and the tenant base that composes our portfolio. In determining the long-term 9.0% return on equity, management considers various factors including a review of various financial models such as dividend growth model and capital asset pricing model, as well as examination of market returns. Based on the calculations of the financial models, market returns and historic returns achieved by the Trust, management believes that the long-term 9.0% return is an appropriate benchmark.
The following schedule details the capitalization of the Trust and the related costs thereof:
| | | Cost of Capital(1) | | | Underlying Value(2) | |
| (Millions, except cost of capital data) | | Dec. 31, 2015 | | | Dec. 31, 2014 | | | Dec. 31, 2015 | | | Dec. 31, 2014 | |
| Liabilities | | | | | | | | | | | | | | | | |
| Investment property and corporate debt | | | 3.8 | % | | | 4.0 | % | | $ | 2,838.5 | | | $ | 2,649.7 | |
| Unitholders’ equity | | | | | | | | | | | | | | | | |
| Trust Units(3) | | | 9.0 | % | | | 9.0 | % | | | 682.8 | | | | 706.4 | |
| Other equity | | | | | | | | | | | | | | | | |
| Non-controlling interest(3) | | | 9.0 | % | | | 9.0 | % | | | 1,748.6 | | | | 1,809.0 | |
| Total | | | 6.2 | % | | | 6.4 | % | | $ | 5,269.9 | | | $ | 5,165.1 | |
| (1) | Total weighted-average cost of capital is calculated on the weighted average of underlying value. |
| (2) | Underlying value of liabilities presents the cost to retire debt on maturity. Underlying value of unitholders’ equity and other equity is based on the closing unit price of BOX on the Toronto Stock Exchange. |
| (3) | Assumes a long-term 9.0% return on equity for December 31, 2015 and December 31, 2014. |
| Brookfield Canada Office Properties | 17 |
OPERATING RESULTS
Included on the following pages is a discussion of the various components of our operating results in accordance with IFRS followed by a discussion of non-IFRS measures and corresponding reconciliations to comparable IFRS measures.
| (Millions, except per unit amounts) | | 2015 | | | 2014 | |
| Commercial property revenue | | $ | 516.9 | | | $ | 517.2 | |
| Direct commercial property expense | | | 265.6 | | | | 247.9 | |
| | | | 251.3 | | | | 269.3 | |
| Investment and other income | | | — | | | | 1.1 | |
| Interest expense | | | 84.3 | | | | 91.9 | |
| General and administrative expense | | | 23.1 | | | | 23.6 | |
| Income before fair value gains (losses) | | | 143.9 | | | | 154.9 | |
| Fair value gains (losses) | | | 207.5 | | | | (38.8 | ) |
| Net income and comprehensive income | | $ | 351.4 | | | $ | 116.1 | |
| Net income and comprehensive income attributable to: | | | | | | | | |
| Unitholders | | $ | 98.6 | | | $ | 32.5 | |
| Non-controlling interest | | | 252.8 | | | | 83.6 | |
| | | $ | 351.4 | | | $ | 116.1 | |
| Net income per Trust unit | | $ | 3.76 | | | $ | 1.24 | |
COMMERCIAL PROPERTY REVENUE
Revenue from commercial properties includes rental revenues earned from tenant leases, straight-line rent, percentage rent, and additional rent from the recovery of operating costs and property taxes. Revenue from investment properties totaled $516.9 million for the year ended December 31, 2015 (compared to $517.2 million in 2014). The decrease is primarily due to lower rents and recoveries related to the dissolution of a tenant at Bay Adelaide West in the prior year and lower rent and recoveries at Bankers Hall due to an early expiry; offset by incremental rent and recoveries from Bay Adelaide East and higher rent and recoveries at Exchange Tower and 105 Adelaide St. West due to lease ups.
The components of revenue are as follows:
| (Millions) | | 2015 | | | 2014 | |
| Rental revenue | | $ | 513.5 | | | $ | 507.9 | |
| Non-cash rental revenue (expense) | | | 1.1 | | | | (1.4 | ) |
| Lease termination and other income | | | 2.3 | | | | 10.7 | |
| Commercial property revenue | | $ | 516.9 | | | $ | 517.2 | |
Our strategy of owning premier properties in high-growth, and, in many instances, supply-constrained markets with high barriers to entry, along with our focus on executing long-term leases with strong credit-rated tenants, has created one of Canada’s most distinguished portfolios of office properties. In the past, this strategy has reduced our exposure to the cyclical nature of the real estate business. We feel confident with our current rollover exposure, which is the percentage of our total managed space currently scheduled to expire, and are focused on working toward renewals on expiries and backfilling vacant spaces in the upcoming months, as well as continuing to manage our rollover exposure in the future years.
Our leases generally have clauses that provide for the collection of rental revenues in amounts that increase every few years, with these increases negotiated at the signing of the lease. During the year ended December 31, 2015, approximately 59% of our leases executed had rent escalation clauses. On average, these escalation clauses will increase rent annually by 1.1% over the terms of the respective leases. The large number of high-credit-quality tenants in our portfolio lowers the risk of not realizing these increases. IFRS requires that these increases be recorded on a straight-line basis over the life of the lease. For the year ended December 31, 2015, we recognized $1.1 million of non-cash rental revenue (compared to $1.4 million of non-cash rental expense in 2014). Direct commercial property expenses, which include real estate taxes, utilities, insurance, repairs and maintenance, cleaning, and other property-related expenses, were $265.6 million for the year ended December 31, 2015 (compared to $247.9 million in 2014).
Substantially all of our leases are net leases, in which the lessee is required to pay its proportionate share of the property’s operating expenses such as utilities, repairs, insurance, and taxes. Consequently, leasing activity is the principal contributor to the change in same-property net operating income. Our total portfolio occupancy rate ended the quarter at 95.8%. At December 31, 2015, average in-place net rent throughout the portfolio was $29 per square foot, compared with an average market net rent of $28 per square foot.
The following table shows the average lease term, in-place rents, and estimated current market rents for similar space in each of our markets as of December 31, 2015:
| | | | | | Avg. | | | Avg. In-Place(1) | | | Avg. Market(2) | |
| | | Leasable Area | | | Lease Term | | | Net Rent | | | Net Rent | |
| Region | | (000's Sq. Ft.) | | | (Years) | | | ($ per Sq. Ft.) | | | ($ per Sq. Ft.) | |
| Toronto, Ontario | | | 9,220 | | | | 7.2 | | | | 29 | | | | 32 | |
| Ottawa, Ontario | | | 1,730 | | | | 7.8 | | | | 20 | | | | 18 | |
| Calgary, Alberta | | | 5,635 | | | | 10.2 | | | | 32 | | | | 26 | |
| Vancouver, B.C. | | | 581 | | | | 9.0 | | | | 24 | | | | 25 | |
| Other | | | 3 | | | | — | | | | — | | | | — | |
| Total | | | 17,169 | | | | 8.3 | | | | 29 | | | | 28 | |
| (1) | Average in-place net rent represents the annualized cash amount on a per square foot basis collected from tenants plus tenant expense reimbursements less the operating expenses being incurred for that space, excluding the impact of straight-lining rent escalations or amortizing free rent periods provided on in-place leases. |
| (2) | Average market net rent represents management’s estimate of average rent per square foot for buildings of similar quality to our portfolio. However, it may not necessarily be representative of the specific space that is rolling in any specific year. |
A summary of current and historical occupancy levels at December 31 for the past two years is as follows:
| | | Dec. 31, 2015 | | | Dec. 31, 2014 | |
| | | Leasable | | | % | | | Leasable | | | % | |
| (000’s Sq. Ft., except % leased data) | | Area | | | Leased | | | Area | | | Leased | |
| Toronto, Ontario | | | 9,220 | | | | 95.1 | | | | 8,747 | | | | 93.1 | |
| Ottawa, Ontario | | | 1,730 | | | | 95.3 | | | | 1,743 | | | | 93.3 | |
| Calgary, Alberta | | | 5,635 | | | | 97.3 | | | | 5,634 | | | | 99.4 | |
| Vancouver, B.C. | | | 581 | | | | 93.7 | | | | 582 | | | | 97.0 | |
| Other | | | 3 | | | | 100.0 | | | | 3 | | | | 100.0 | |
| Total | | | 17,169 | | | | 95.8 | | | | 16,709 | | | | 95.4 | |
During 2015, we leased 2,062,000 square feet of space, which included 818,000 square feet of new leasing, and 1,244,000 square feet of renewals, compared to expiries of 1,587,000 square feet and accelerated expiries of 420,000 square feet. The overall average leasing net rent was $27 per square foot, compared to an average expiring net rent of $25 per square foot. At December 31, 2015, the average leasing net rent related to new and renewed leases was $32 per square foot and $24 per square foot, respectively.
Leasing highlights from the fourth quarter include:
| • | 528,000 square feet in Toronto |
| - | A seven-year, 82,000-square-foot renewal and expansion with Thomson Reuters Corporation at Bay Adelaide West |
| - | A 10-year, 62,000-square-foot renewal and expansion with Royal Bank of Canada at Brookfield Place Toronto |
| - | A 12-year, 58,000-square-foot renewal with Labatt Brewing Company Limited at Queen's Quay Terminal |
| - | A 10-year, 47,000-square-foot new lease with Aviva Canada Inc. at First Canadian Place |
| - | A five-year, 37,000-square-foot renewal and expansion with Liberty Mutual Insurance Co. at Brookfield Place Toronto |
| - | A four-year, 25,000-square-foot expansion with Air Canada at 2 Queen St. East |
| - | A five-year, 25,000-square-foot renewal with The Bank of Nova Scotia at Exchange Tower |
| - | A 10-year, 19,000-square-foot new lease with New Gold at Brookfield Place Toronto |
| - | A 10-year, 13,000-square-foot new lease with Eagle Professional Resources at 2 Queen St. East |
| • | 28,000 square feet in Ottawa |
| - | A one-year, 28,000-square-foot renewal with Public Works and Government Services Canada at Place de Ville I |
| • | 19,000 square feet in Vancouver |
| - | A 10-year, 13,000-square-foot new lease with Western Forest Products Inc. at Royal Centre |
| Brookfield Canada Office Properties | 19 |
The details of our leasing activity for the year ended December 31, 2015, are as follows:
| | | | | | Activities during the year ended December 31, 2015 | | | | |
| | | | | | | | | Average(2) | | | | | | Year One(3) | | | Average(4) | | | | | | | |
| | | Dec. 31, 2014 | | | | | | Expiring | | | Leasing | | | Leasing | | | Leasing | | | Transfer/ | | | Dec. 31, 2015 | |
| (000's Sq. Ft.) | | Leased(1) | | | Expiries | | | Net Rent | | | New | | | Renewal | | | Net Rent | | | Net Rent | | | Disposition | | | Leased | |
| Toronto, Ontario | | | 8,142 | | | | (1,014 | ) | | $ | 28 | | | | 566 | | | | 622 | | | $ | 30 | | | $ | 31 | | | | 452 | | | | 8,768 | |
| Ottawa, Ontario | | | 1,628 | | | | (593 | ) | | | 17 | | | | 35 | | | | 580 | | | | 16 | | | | 16 | | | | (2 | ) | | | 1,648 | |
| Calgary, Alberta | | | 5,603 | | | | (322 | ) | | | 29 | | | | 187 | | | | 13 | | | | 37 | | | | 37 | | | | — | | | | 5,481 | |
| Vancouver, B.C. | | | 564 | | | | (78 | ) | | | 26 | | | | 30 | | | | 29 | | | | 28 | | | | 29 | | | | — | | | | 545 | |
| Other | | | 3 | | | | — | | | | — | | | | — | | | | — | | | | — | | | | — | | | | — | | | | 3 | |
| Total Leasing | | | 15,940 | | | | (2,007 | ) | | $ | 25 | | | | 818 | | | | 1,244 | | | | 27 | | | | 27 | | | | 450 | | | | 16,445 | |
| Development | | | 1,909 | | | | — | | | | — | | | | 22 | | | | — | | | | — | | | | — | | | | (931 | ) | | | 1,000 | |
| (1) | Restated for re-measurements |
| (2) | Represents net rent in the final year. |
| (3) | Year one leasing net rent is the rent at the commencement of the lease term on a per square foot basis including tenant expense reimbursements, less operating expenses being incurred for that space, but excluding the impact of straight-lining rent escalations or amortization of free rent periods. |
| (4) | Average leasing net rent is the average rent over the lease term on a per square foot basis including tenant expense reimbursements, less operating expenses being incurred for that space, but including the impact of straight-lining rent escalations or amortization of free rent periods. |
Additionally, during the year ended December 31, 2015, tenant improvements and leasing costs related to leasing activity that occurred averaged $6.65 per square foot, of which $11.15 per square foot and $3.61 per square foot related to new and renewed leases, respectively, compared to $10.65 per square foot during the same prior year period.
INVESTMENT AND OTHER INCOME
Investment and other income totaled $nil during the year ended December 31, 2015 (compared to $1.1 million in 2014). The prior year amounts primarily included interest earned on cash balances and cash settlements on legal matters.
INTEREST EXPENSE
Interest expense totaled $84.3 million during the year ended December 31, 2015 (compared to $91.9 million in 2014). The decrease was due to the lower average costs of borrowing of 3.76%, compared to 4.01% in 2014, coupled with an increase in capitalized imputed interest on our development properties; offset by higher debt balances.
GENERAL AND ADMINISTRATIVE EXPENSES
General and administrative expenses were $23.1 million during the year ended December 31, 2015 (compared to $23.6 million in 2014).
INCOME TAX EXPENSE
The Trust is a “mutual fund trust” pursuant to theIncome Tax Act (Canada). The Trust distributes or designates all taxable earnings to unitholders, and as such, under current legislation, the obligation to pay tax rests with each unitholder. No current and deferred tax provisions are required on the Trust’s income.
FAIR VALUE GAINS (LOSSES)
During the year ended December 31, 2015, the Trust recognized fair value gains of $207.5 million (compared to $38.8 million of fair value losses in 2014). Fair value adjustments are determined based on the movement of various parameters on a quarterly basis, including changes in projected cash flows as a result of leasing and timing, discount rates, and terminal capitalization rates. Our investment property valuations have increased from December 31, 2014 due to improved tenant profiles and higher rental rates and decreases in downtime as a result of new leases and renewals, as well as improvements in our valuation metrics.
TOTAL EQUITY PER UNIT
Total equity per unit represents the book value of our total equity divided by total units outstanding. We believe that total equity per unit is the best indicator of our current financial position because it reflects our total equity adjusted for all inflows and outflows, including FFO and changes in the value of our investment properties.
NON-IFRS MEASURES
Although we monitor and analyze our financial performance using a number of indicators, our primary business objective of generating reliable and growing cash flow is monitored and analyzed using net income, commercial property net operating income, funds from operations, and adjusted funds from operations. Although net income is calculated in accordance with IFRS, IFRS does not prescribe standardized meanings for commercial property net operating income, funds from operations, and adjusted funds from operations; therefore, they are unlikely to be comparable to similar measures presented by other entities.
Commercial property net operating income
Commercial property net operating income is defined by us as income from commercial property operations after direct property operating expenses, including property administration costs, have been deducted but prior to deducting interest expense, general and administrative expenses, and fair value gains (losses). Commercial property net operating income is used as a key indicator of performance, as it represents a measure over which management of our commercial property operations has control.
Funds from Operations
Our definition of funds from operations or “FFO” includes all of the adjustments that are outlined in the National Association of Real Estate Investment Trusts (“NAREIT”) definition of FFO including the exclusion of gains (or losses) from the sale of real estate property and the add back of any depreciation and amortization related to real estate assets. In addition to the adjustments prescribed by NAREIT, we also make adjustments to exclude any unrealized fair value gains (or losses) that arise as a result of reporting under IFRS. These additional adjustments result in an FFO measure that would be similar to that which would result if the Trust determined net income in accordance with U.S. GAAP and is also consistent with the Real Property Association of Canada (“REALPAC”) white paper on funds from operations for IFRS issued November 2012. Our FFO measure will differ from other organizations applying the NAREIT definition to the extent of certain differences between the IFRS and U.S. GAAP reporting frameworks, principally related to the recognition of lease termination income and fair value gains (or losses), which does not have a significant impact on the FFO measure reported.
Adjusted Funds from Operations
Adjusted funds from operations or “AFFO” is defined by us as FFO net of actual second-generation leasing commissions and tenant improvements, actual maintaining value capital expenditures, and straight-line rental income. AFFO is a widely used measure used to assess an entity’s ability to pay distributions.
COMMERCIAL PROPERTY NET OPERATING INCOME
Commercial Property NOI by City
for the year ended December 31, 2015 (in $millions)
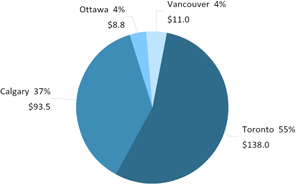
Commercial property net operating income includes commercial property revenue less direct commercial property expense and is a key indicator of performance as it represents a measure over which management of the commercial property operations has control. One of the ways in which we evaluate performance is by comparing the performance of the commercial property portfolio on a same property basis. Same property commercial property net operating income is defined as properties included in our consolidated results that we own and operate throughout both the current and prior period. Accordingly, same property results would exclude properties acquired or sold during each period, as well as significant lease termination and other income (charges) amounts that are non-recurring.
Our commercial property net operating income for the year ended December 31, 2015, was $251.3 million (compared to $269.3 million in 2014). The decrease is primarily due to a favourable realty tax recovery at Bay Adelaide West and parking settlement at Brookfield Place Toronto recognized in the prior year, one-time retroactive adjustment of ground rent at Hudson’s Bay Centre as a result of an unfavourable arbitration settlement and higher ground rent expense at First Canadian Place; offset by incremental net operating income at Bay Adelaide East and higher rent and recoveries related to new deals at Exchange Tower and 105 Adelaide St. West.
| Brookfield Canada Office Properties | 21 |
The components of commercial property net operating income are as follows:
| (Millions) | | 2015 | | | 2014 | |
| Commercial property revenue | | $ | 516.9 | | | $ | 517.2 | |
| Direct commercial property expense | | | 265.6 | | | | 247.9 | |
| Total | | $ | 251.3 | | | $ | 269.3 | |
Same commercial property operation highlights are as follows:
| (Millions) | | 2015 | | | 2014 | |
| Commercial property net operating income – same property | | $ | 249.3 | | | $ | 251.6 | |
| Commercial property net operating income – development transferred | | | 2.6 | | | | — | |
| Commercial property net operating income – property sold during period(1) | | | 3.5 | | | | 5.9 | |
| Lease termination and other (charges) income | | | (4.1 | ) | | | 11.8 | |
| Total | | $ | 251.3 | | | $ | 269.3 | |
| | | Dec. 31, 2015 | | | Dec. 31, 2014 | |
| Same property average in-place net rent | | $ | 29.0 | | | $ | 28 | |
| Same property occupancy | | | 95.8 | % | | | 95.3 | % |
| (1) | 151 Yonge St. and HSBC building in Toronto sold in Q1 and Q3 2015, respectively. |
RECONCILIATION OF COMMERCIAL PROPERTY NET OPERATING INCOME TO NET INCOME
| (Millions, except per unit amounts) | | 2015 | | | 2014 | |
| Commercial property net operating income | | $ | 251.3 | | | $ | 269.3 | |
| Add (deduct): | | | | | | | | |
| Fair value gains (losses) | | | 207.5 | | | | (38.8 | ) |
| General and administrative expense | | | (23.1 | ) | | | (23.6 | ) |
| Interest expense | | | (84.3 | ) | | | (91.9 | ) |
| Investment and other income | | | — | | | | 1.1 | |
| Net income | | $ | 351.4 | | | $ | 116.1 | |
RECONCILIATION OF NET INCOME TO FUNDS FROM OPERATIONS
Funds from operations was $1.56 per unit during the year ended December 31, 2015, respectively (compared to $1.70 per unit in 2014).
| (Millions, except per unit amounts) | | 2015 | | | 2014 | |
| Net income | | $ | 351.4 | | | $ | 116.1 | |
| Add (deduct): | | | | | | | | |
| Fair value (gains) losses | | | (207.5 | ) | | | 38.8 | |
| Amortization of lease incentives | | | 1.9 | | | | 2.2 | |
| Foreign exchange losses | | | — | | | | 1.1 | |
| Funds from operations | | $ | 145.8 | | | $ | 158.2 | |
| Funds from operations attributable to unitholders | | | 40.8 | | | | 44.3 | |
| Funds from operations attributable to non-controlling interest | | | 105.0 | | | | 113.9 | |
| | | $ | 145.8 | | | $ | 158.2 | |
| Weighted average Trust Units outstanding | | | 26.2 | | | | 26.2 | |
| Funds from operations per Trust unit | | $ | 1.56 | | | $ | 1.70 | |
RECONCILIATION OF FUNDS FROM OPERATIONS TO ADJUSTED FUNDS FROM OPERATIONS
Adjusted funds from operations totaled $1.01 per unit during the year ended December 31, 2015, respectively (compared to $1.30 per unit in 2014).
| (Millions, except per unit amounts) | | 2015 | | | 2014 | |
| Funds from operations | | $ | 145.8 | | | $ | 158.2 | |
| Deduct: | | | | | | | | |
| Straight-line rental income | | | (3.0 | ) | | | (0.8 | ) |
| Second-generation leasing commissions and tenant improvements | | | (39.5 | ) | | | (28.0 | ) |
| Maintaining value capital expenditures | | | (8.7 | ) | | | (7.9 | ) |
| Adjusted funds from operations | | $ | 94.6 | | | $ | 121.5 | |
| Adjusted funds from operations attributable to unitholders | | | 26.5 | | | | 34.0 | |
| Adjusted funds from operations attributable to non-controlling interest | | | 68.1 | | | | 87.5 | |
| | | $ | 94.6 | | | $ | 121.5 | |
| Weighted average Trust Units outstanding | | | 26.2 | | | | 26.2 | |
| Adjusted funds from operations per Trust Unit | | $ | 1.01 | | | $ | 1.30 | |
| Trust unit distribution declared | | $ | 1.24 | | | $ | 1.21 | |
| Distribution ratio | | | 123 | % | | | 93 | % |
AFFO is calculated by adjusting FFO for straight-line rental income, actual second-generation leasing commissions and tenant improvements, and actual maintaining value capital expenditures for maintaining the infrastructure and current rental revenues of our properties. Actual expenditures will vary from period to period and at times could be materially different depending on the timing of leasing activities and capital plans. As a result, AFFO will experience volatility when comparing period-over-period results. Due to the volatile nature of AFFO, we believe that it is important to compare the actual results with historic and projected averages of leasing costs and maintaining value capital expenditures in order to determine the effects of a full office leasing cycle. Our 5-year historic average reflects the actual leasing activities completed, while the 10-year average projections reflect our leasing expiry profile. We also believe that these averages will provide insight to determining the normalized distribution payout ratio and growth in adjusted funds from operations.
The historic and projected averages are as follows:
| | | Annual amount | |
| | | 5-year | | | 10-year | |
| (Millions) | | historical coverage | | | average plan | |
| Second generation | | | | | | | | |
| Leasing commissions | | $ | 8.0 | | | $ | 6.5 | |
| Tenant improvements | | | 16.0 | | | | 16.3 | |
| Maintaining value capital expenditures | | | 5.6 | | | | 7.9 | |
There is no standard industry defined measure of AFFO; therefore, our methodology of calculating AFFO will differ from other entities and may not be comparable to similar measures presented by other entities.
RECONCILIATION OF CASH FLOWS PROVIDED BY OPERATING ACTIVITIES TO ADJUSTED FUNDS FROM OPERATIONS
| (Millions) | | 2015 | | | 2014 | |
| Cash flows provided by operating activities | | $ | 115.0 | | | $ | 136.2 | |
| Add (deduct): | | | | | | | | |
| Working capital and other | | | 17.2 | | | | 14.4 | |
| Leasing commissions and tenant inducements | | | 13.9 | | | | 8.8 | |
| Foreign exchange losses | | | — | | | | 1.1 | |
| Amortization of deferred financing costs | | | (3.3 | ) | | | (3.1 | ) |
| Second-generation leasing commissions and tenant improvements | | | (39.5 | ) | | | (28.0 | ) |
| Maintaining value capital expenditures | | | (8.7 | ) | | | (7.9 | ) |
| Adjusted funds from operations | | $ | 94.6 | | | $ | 121.5 | |
| Brookfield Canada Office Properties | 23 |
QUARTERLY RESULTS
The results by quarter are as follows:
| | | 2015 | | | 2014 | |
| (Millions, except per unit amounts) | | Q4 | | | Q3 | | | Q2 | | | Q1 | | | Q4 | | | Q3 | | | Q2 | | | Q1 | |
| Revenue | | $ | 134.7 | | | $ | 128.3 | | | $ | 126.3 | | | $ | 127.6 | | | $ | 134.8 | | | $ | 131.9 | | | $ | 124.9 | | | $ | 125.6 | |
| Commercial property net operating income | | | 64.8 | | | | 59.5 | | | | 63.2 | | | | 63.8 | | | | 67.9 | | | | 66.4 | | | | 66.4 | | | | 68.6 | |
| Interest expense | | | 21.4 | | | | 21.0 | | | | 20.8 | | | | 21.1 | | | | 22.0 | | | | 23.5 | | | | 23.3 | | | | 23.1 | |
| Funds from operations | | | 38.5 | | | | 33.4 | | | | 36.8 | | | | 37.1 | | | | 40.6 | | | | 38.1 | | | | 38.6 | | | | 40.9 | |
| Adjusted funds from operations | | | 19.6 | | | | 25.0 | | | | 21.4 | | | | 28.6 | | | | 21.7 | | | | 28.6 | | | | 31.5 | | | | 39.7 | |
| Net income | | | 158.8 | | | | 50.3 | | | | 83.6 | | | | 58.7 | | | | 25.8 | | | | 9.0 | | | | 39.2 | | | | 42.1 | |
| Net income per Trust unit | | $ | 1.70 | | | $ | 0.54 | | | $ | 0.90 | | | $ | 0.63 | | | $ | 0.28 | | | $ | 0.10 | | | $ | 0.42 | | | $ | 0.44 | |
PART III – RISKS AND UNCERTAINTIES
BOX’s financial results are affected by the performance of our operations and various external factors influencing the specific sectors and geographic locations in which we operate, as well as macroeconomic factors such as economic growth, inflation, interest rates, regulatory requirements and initiatives, and litigation and claims that arise in the normal course of business.
Our strategy is to invest in premier assets that generate sustainable streams of cash flow. Although high-quality assets may initially generate lower returns on capital, we believe that the sustainability and future growth of their cash flows is more assured over the long term and, as a result, warrant higher valuation levels. We also believe that the high quality of our asset base protects the Trust against future uncertainty and enables us to invest with confidence when opportunities arise.
The following is a review of the material factors and the potential impact these factors may have on our business operations. A more detailed description of our business environment and risks is contained in our Annual Information Form, which is posted on our web site at www.brookfieldcanadareit.com or at www.sedar.com or www.sec.gov.
PROPERTY-RELATED RISKS
Our strategy is to invest in high-quality office properties as defined by the physical characteristics of the asset and, more important, the certainty of receiving rental payments from large corporate tenants (with investment-grade credit ratings – see “Credit Risk” on page 26) that these properties attract. Nonetheless, we remain exposed to certain risks inherent in the core office-property business.
Commercial property investments are generally subject to varying degrees of risk depending on the nature of the property. These risks include changes in general economic conditions (such as the availability and costs of mortgage funds), local conditions (such as an oversupply of space or a reduction in demand for real estate in the markets in which we operate), the attractiveness of the properties to tenants, competition from other landlords with competitive space, and our ability to provide adequate maintenance at an economical cost.
Certain significant expenditures, including property taxes, maintenance costs, mortgage payments, insurance costs, and related charges, must be made regardless of whether a property is producing sufficient income to service these expenses. Our office properties are subject to mortgages that require substantial debt service payments. If we become unable or unwilling to meet mortgage payments on any property, losses could be sustained as a result of the mortgagee’s exercise of its rights of foreclosure or of sale. We believe the stability and long-term nature of our contractual revenues effectively mitigates these risks.
As owners of premier office properties, lease rollovers also present a risk, as continued growth of rental income is dependent on strong leasing markets to ensure expiring leases are renewed and new tenants are found promptly to fill vacancies. Refer to “Lease Rollover Risk” on page 26 of this MD&A for further details.
INTEREST RATE AND FINANCING RISK
We attempt to stagger the maturities of our mortgage portfolio evenly over a 10-year time horizon. We believe that this strategy will most effectively manage interest rate risk.
As outlined under “Capital Resources and Liquidity,” beginning on page 16 of this MD&A, we have an ongoing need to access debt markets to refinance maturing debt as it comes due. There is a risk that lenders will not refinance such maturing debt on terms and conditions acceptable to us or on any terms at all. Our strategy to stagger the maturities of our mortgage portfolio attempts to mitigate our exposure to excessive amounts of debt maturing in any one year.
Approximately 28.7% of our outstanding investment property and corporate debt at December 31, 2015 is floating-rate debt (December 31, 2014 – 13.1%) and subject to fluctuations in interest rates. The effect of a 100-basis point increase in interest rates on interest expense relating to our floating-rate debt, all else being equal, is an increase in interest expense of $8.1 million on an annual basis or $0.09 per unit. In addition, there is interest rate risk associated with the Trust’s fixed rate debt due to the expected requirement to refinance such debt in the year of maturity. There is no fixed rate debt maturing within one year.
The analysis does not reflect the impact a changing interest rate environment could have on our overall performance and, as a result, it does not reflect the actions management may take in such an environment.
We currently have a level of indebtedness for the Trust of 45.3% of the fair market value of our commercial and development properties. This level of indebtedness is considered by the Trust to be conservative and, based on this, the Trust believes that all debts will be financed or refinanced as they come due in the foreseeable future.
| Brookfield Canada Office Properties | 25 |
CREDIT RISK
Credit risk arises from the possibility that tenants may be unable to fulfill their lease commitments. We mitigate this risk by ensuring that our tenant mix is diversified and by limiting our exposure to any one tenant. We also maintain a portfolio that is diversified by industry type so that exposure to a business sector is lessened. Currently, no single tenant represents more than 10.8% of total leasable area and 7.4% of commercial property revenue.
We attempt to mitigate our credit risk by signing long-term leases with tenants who have investment-grade credit ratings. The Trust directs special attention to the credit quality of our tenants in order to ensure the long-term sustainability of rental revenues through economic cycles. Once a lease has been signed, the Trust proactively monitors the financial performance of significant tenants on a regular basis and reviews the status of arrears. The Trust regularly monitors indicators of increased risk within its tenant portfolio and maintains a formalized tenant credit report to identify natural changes in credit quality.
The following list shows our top 20 largest tenants by leasable area in our commercial properties portfolio and their respective lease commitments:
| | | | | | | Credit | | 000’s Sq. Ft.(2) | | Year of | | | | % of | |
| | | Tenant | | Primary Location | | Rating(1) | | 2016 | | 2017 | | 2018 | | 2019 | | 2020 | | 2021 | | Beyond | | Expiry(2) | | Total | | Sq. Ft.(3) | |
| 1 | | Government and Related | | Toronto, Ottawa | | AAA | | 11 | | 28 | | 264 | | 89 | | | | 562 | | 903 | | 2023/2029 | | 1,857 | | 10.8 | % |
| | | Agencies | | | | | | | | | | | | | | | | | | | | | | | | | |
| 2 | | Suncor Energy Inc. | | Calgary | | A- | | | | | | | | | | | | | | 1,332 | | 2028 | | 1,332 | | 7.7 | % |
| 3 | | Bank of Montreal | | Toronto, Calgary | | A+ | | 27 | | | | 27 | | | | | | 5 | | 1,071 | | 2023/2024 | | 1,130 | | 6.6 | % |
| 4 | | Deloitte LLP | | Toronto, Calgary | | Not Rated | | 146 | | | | | | | | | | | | 578 | | Various | | 724 | | 4.2 | % |
| 5 | | Canadian Natural Resources | | Calgary | | BBB+ | | | | | | | | | | | | | | 531 | | 2026 | | 531 | | 3.1 | % |
| 6 | | Imperial Oil | | Calgary | | AAA | | 514 | | | | | | | | | | | | | | | | 514 | | 3.0 | % |
| | | | | | | | | | | | | | | | | | | | | | | | | | | | |
| 7 | | Royal Bank | | Toronto, Calgary, | | AA- | | 12 | | | | 1 | | 17 | | 3 | | 37 | | 405 | | Various | | 475 | | 2.8 | % |
| | | | | Vancouver | | | | | | | | | | | | | | | | | | | | | | | |
| 8 | | Talisman Energy | | Calgary | | BBB- | | | | | | | | | | | | | | 446 | | 2025 | | 446 | | 2.6 | % |
| 9 | | Enbridge Inc. | | Calgary | | BBB+ | | | | | | | | | | | | | | 401 | | 2028 | | 401 | | 2.3 | % |
| 10 | | Bennett Jones | | Toronto, Calgary | | Not Rated | | | | | | | | | | | | 150 | | 173 | | 2027 | | 323 | | 1.9 | % |
| 11 | | CIBC | | Toronto, Calgary | | A+ | | | | | | | | | | 160 | | | | 151 | | 2026/2053 | | 311 | | 1.8 | % |
| | | | | | | | | | | | | | | | | | | | | | | | | | | | |
| 12 | | KPMG Management | | Toronto | | Not Rated | | | | | | | | | | | | | | 297 | | 2025 | | 297 | | 1.7 | % |
| | | Services LP | | | | | | | | | | | | | | | | | | | | | | | | | |
| 13 | | Osler, Hoskin & Harcourt | | Toronto | | Not Rated | | | | | | | | | | | | | | 199 | | 2030 | | 199 | | 1.1 | % |
| 14 | | Westcoast Energy | | Calgary, Vancouver | | BBB | | | | | | | | | | 40 | | | | 147 | | 2022 | | 187 | | 1.1 | % |
| 15 | | Toronto Stock Exchange | | Toronto | | Not Rated | | | | | | 143 | | | | | | | | 42 | | 2023 | | 185 | | 1.1 | % |
| 16 | | Goodmans LLP | | Toronto | | Not Rated | | | | | | | | | | | | | | 182 | | 2026 | | 182 | | 1.1 | % |
| 17 | | The Bay | | Toronto | | B+ | | | | | | | | 164 | | 15 | | | | | | | | 179 | | 1.0 | % |
| 18 | | Gowlings Canada Inc. | | Toronto | | Not Rated | | | | | | | | | | 170 | | | | | | | | 170 | | 1.0 | % |
| 19 | | The Manufacturers Life | | Toronto | | AA- | | | | | | | | | | | | | | 169 | | 2022 | | 169 | | 1.0 | % |
| | | Insurance | | | | | | | | | | | | | | | | | | | | | | | | | |
| 20 | | McMillan LLP | | Toronto, Vancouver | | Not Rated | | | | 1 | | | | 109 | | | | | | 56 | | 2022 | | 166 | | 1.0 | % |
| | | Total | | | | | | 710 | | 29 | | 435 | | 379 | | 388 | | 754 | | 7,083 | | | | 9,778 | | 56.9 | % |
| | | Total % | | | | | | 7.3 | % | 0.3 | % | 4.4 | % | 3.9 | % | 4.0 | % | 7.7 | % | 72.4 | % | | | 100.0 | % | | |
| (2) | Reflects the year of maturity related to lease(s) included in the ‘Beyond’ column. |
| (3) | Percentage of total leasable area of commercial properties, prior to considering partnership interests in partially owned properties; excludes parking. |
LEASE ROLLOVER RISK
Lease roll-over risk arises from the possibility that we may experience difficulty renewing leases as they expire or in re-leasing space vacated by tenants upon early lease expiry. We attempt to stagger our lease-expiry profile so that we are not faced with disproportionate amounts of space expiring in any one year. Approximately 4.9% of our leases mature annually up to and including 2020. Our portfolio has a weighted-average lease life of eight years. We further mitigate this risk by maintaining a diversified portfolio mix by geographic location and by proactively leasing space in advance of its contractual expiry.
The following table sets out lease expiries, by square footage, for our portfolio at December 31, 2015.
| | | Currently | | | | | | | | | | | | | | | | | | | | | | | | 2023 | | | | | | | | | | |
| (000’s Sq. Ft.) | | Available | | | 2016 | | | 2017 | | | 2018 | | | 2019 | | | 2020 | | | 2021 | | | 2022 | | | & Beyond | | | Leasable | | | Parking | | | Total | |
| Toronto, Ontario | | | 452 | | | | 276 | | | | 352 | | | | 571 | | | | 670 | | | | 1,066 | | | | 587 | | | | 729 | | | | 4,517 | | | �� | 9,220 | | | | 1,709 | | | | 10,929 | |
| Ottawa, Ontario | | | 82 | | | | 22 | | | | 35 | | | | 3 | | | | 86 | | | | 9 | | | | 566 | | | | 20 | | | | 907 | | | | 1,730 | | | | 802 | | | | 2,532 | |
| Calgary, Alberta | | | 154 | | | | 355 | | | | 63 | | | | 142 | | | | 80 | | | | 272 | | | | 108 | | | | 374 | | | | 4,087 | | | | 5,635 | | | | 1,194 | | | | 6,829 | |
| Vancouver, B.C. | | | 36 | | | | 32 | | | | 13 | | | | 30 | | | | 41 | | | | 68 | | | | 26 | | | | 78 | | | | 257 | | | | 581 | | | | 260 | | | | 841 | |
| Other | | | — | | | | — | | | | — | | | | — | | | | 1 | | | | — | | | | — | | | | — | | | | 2 | | | | 3 | | | | — | | | | 3 | |
| Total | | | 724 | | | | 685 | | | | 463 | | | | 746 | | | | 878 | | | | 1,415 | | | | 1,287 | | | | 1,201 | | | | 9,770 | | | | 17,169 | | | | 3,965 | | | | 21,134 | |
| % of total | | | 4.2 | % | | | 4.0 | % | | | 2.7 | % | | | 4.3 | % | | | 5.1 | % | | | 8.2 | % | | | 7.5 | % | | | 7.0 | % | | | 57.0 | % | | | 100.0 | % | | | — | % | | | 100.0 | % |
ENVIRONMENTAL RISKS
As an owner of real property, we are subject to various laws relating to environmental matters. These laws could hold us liable for the costs of removal and remediation of certain hazardous substances or waste present in our buildings, released or deposited on or in our properties or disposed of at other locations. These costs could be significant and would reduce cash available for our business. The failure to remove or remediate such substances could adversely affect our ability to sell or our ability to borrow using such real estate as collateral and could potentially result in claims against us. We are not aware of any material non-compliance with environmental laws at any of our properties nor are we aware of any pending or threatened investigations or actions by environmental regulatory authorities in connection with any of our properties or any pending or threatened claims relating to environmental conditions at our properties.
We will continue to make the necessary capital and operating expenditures to ensure that we are compliant with environmental laws and regulations. Although there can be no assurances, we do not believe that costs relating to environmental matters will have a material effect on our business, financial condition or results of operations. However, environmental laws and regulations can change rapidly and we may become subject to more stringent environmental laws and regulations in the future. Compliance with more stringent environmental laws and regulations could have an adverse effect on our business, financial condition, or results of operations.
OTHER RISKS AND UNCERTAINTIES
Real estate is relatively illiquid. Such illiquidity may limit our ability to vary our portfolio promptly in response to changing economic or investment conditions. Also, financial difficulties of other property owners resulting in distressed sales could depress real estate values in the markets in which we operate.
Our investment properties generate a relatively stable source of income from contractual tenant rent payments. Continued growth of rental income is dependent on strong leasing markets to ensure expiring leases are renewed and new tenants are found promptly to fill vacancies at attractive rental rates. With leasing markets performance being impacted by the strength of the economies in which we operate, it is possible we could see downward pressure on overall occupancy levels and net effective rents if economic recovery slows or stalls. We are, however, substantially protected against short-term market conditions, as most of our leases are long-term in nature with an average term of eight years.
INSURANCE RISKS
We maintain insurance on our commercial properties in amounts and with deductibles that we believe are in line with what owners of similar properties carry. We maintain all risk property insurance and rental value coverage (including coverage for the perils of flood, earthquake and windstorm). Our all risk policy limit is $1.5 billion per occurrence. Our earthquake limit is $500 million per occurrence and in the annual aggregate. This coverage is subject to a $100,000 (dollars) deductible for all locations except for British Columbia where the deductible is 3% of the values for all locations where the physical loss, damage or destruction occurred subject to a minimum $250,000 (dollars) deductible. The flood limit is $500 million per occurrence and in the annual aggregate, and is subject to a deductible of $25,000 (dollars) for all losses arising from the same occurrence. Windstorm is included under the all risk coverage limit of $1.5 billion.
With respect to our commercial properties, we purchase an insurance policy that covers acts of terrorism for limits up to $1.5 billion.
| Brookfield Canada Office Properties | 27 |
PART IV – CRITICAL ACCOUNTING POLICIES AND ESTIMATES
FUTURE ACCOUNTING POLICY CHANGES
The following are the accounting policies that the Trust expects to adopt in the future:
Leases
On January 13, 2016, the IASB published a new Standard, IFRS 16, "Leases". The new Standard sets out the principles for the recognition, measurement, presentation and disclosure of leases, with the objective of ensuring that lessees and lessors provide relevant information that faithfully represent those transactions. IFRS 16 supersedes IAS 17 "Leases" and related interpretations and is effective for periods beginning on or after January 1, 2019, with earlier adoption permitted if IFRS 15 "Revenue from Contracts with Customers" has also been applied. The Trust is currently evaluating the impact to the consolidated financial statements.
Financial Instruments
On July 25, 2014, the IASB issued its final version of IFRS 9, “Financial Instruments”. IFRS 9, as amended, introduces a logical approach for the classification of financial assets, which is driven by cash flow characteristics and the business model in which an asset is held. This single, principle-based approach replaces existing rule-based requirements that are generally considered to be overly complex and difficult to apply. The new model results in a single impairment model being applied to all financial instruments, thereby removing a source of complexity associated with previous accounting requirements. It also introduces a new, expected-loss impairment model that will require more timely recognition of expected credit losses. IFRS 9 is effective for annual periods beginning on or after January 1, 2018 and should be applied retrospectively. The Trust is currently evaluating the impact to the consolidated financial statements.
Joint Arrangements
In May 2014, the IASB issued Amendments to IFRS 11, “Joint Arrangements: Accounting for Acquisitions of Interests in Joint Operations”. The objective of the amendments is to add new guidance to IFRS 11 on accounting for the acquisition of an interest in a joint operation in which the activity of the joint operation constitutes a business, as defined in IFRS 3, “Business Combinations”. Acquirers of such interests are to apply the relevant principles on business combination accounting in IFRS 3 and other standards, as well as disclosing the relevant information specified in these standards for business combinations. This amendment to IFRS 11 is effective for annual periods beginning on or after January 1, 2016 and should be applied prospectively. The Trust is currently evaluating the impact to the consolidated financial statements.
Revenue from Contracts with Customers
In May 2014, the IASB issued its new revenue standard, IFRS 15, “Revenue from Contracts with Customers”. IFRS 15 specifies how and when revenue should be recognized as well as requiring more informative and relevant disclosures. IFRS 15 supersedes IAS 18, “Revenue Recognition”, IAS 11, “Construction Contracts” and a number of revenue-related interpretations. Application of the standard is mandatory and it applies to nearly all contracts with customers: the main exceptions are leases, financial instruments and insurance contracts. IFRS 15 is effective for annual periods on or after January 1, 2018 and should be applied retrospectively. The Trust is currently evaluating the impact to the consolidated financial statements.
CRITICAL ACCOUNTING POLICIES
Our critical accounting policies are those that we believe are the most important in portraying our financial condition and results of operations, and require the most subjective judgment and estimates on the part of management.
Investment Properties
Investment properties include commercial properties held to earn rental income and properties that are being constructed or developed for future use as investment properties. Commercial properties and commercial developments are recorded at fair value, determined based on available market evidence, at the balance sheet date. We determine the fair value of each investment property based upon, among other things, rental income from current leases and assumptions about rental income from future leases reflecting market conditions at the balance sheet date, less future cash flows in respect of such leases. Fair values are primarily determined by discounting the expected future cash flows, generally over a term of 11 years including a terminal value based on the application of a capitalization rate to estimated year 12 cash flows. Commercial developments under active development are measured using a discounted cash flow model, net of costs to complete, as of the balance sheet date. Valuations of investment properties are most sensitive to changes in the discount rate and timing or variability of cash flows.
The cost of commercial developments includes direct development costs, realty taxes and borrowing costs directly attributable to the development. Borrowing costs associated with direct expenditures on properties under development are capitalized. The amount of borrowing costs capitalized is determined first by reference to borrowings specific to the project, where relevant, and otherwise by applying a weighted average cost of borrowings to eligible expenditures after adjusting for borrowings associated with other specific developments. Where borrowings are associated with specific developments, the amount capitalized is the gross cost incurred on those borrowings less any investment income arising on their temporary investment. Borrowing costs are capitalized from the commencement of the development until the date of practical completion. The capitalization of borrowing costs is suspended if there are prolonged periods when development activity is interrupted. We consider practical completion to have occurred when the property is capable of operating in the manner intended by management. Generally this occurs upon completion of construction and receipt of all necessary occupancy and other material permits. Where we have pre-leased space as of or prior to the start of the development and the lease requires us to construct tenant improvements which enhance the value of the property, practical completion is considered to occur on completion of such improvements.
Initial direct leasing costs we incur in negotiating and arranging tenant leases are added to the carrying amount of investment properties.
Tax
The Trust is a “mutual fund trust” pursuant to theIncome Tax Act (Canada). The Trust distributes or designates all taxable earnings to unitholders, and as such, under current legislation, the obligation to pay tax rests with each unitholder. Deferred income taxes are not recognized in the Trust’s financial statements on the basis that the Trust can deduct distributions paid such that its liability for income taxes is substantially reduced or eliminated for the year, and the Trust intends to continue to distribute its taxable income and continue to qualify as a real estate investment trust for the foreseeable future.
Revenue Recognition
We account for our leases with tenants as operating leases as we have retained substantially all of the risks and benefits of ownership of our investment properties. Revenue recognition under a lease commences when the tenant has a right to use the leased asset. Generally, this occurs on the lease commencement date or, where we are required to make additions to the property in the form of tenant improvements that enhance the value of the property, upon substantial completion of those improvements. The total amount of contractual rent to be received from operating leases is recognized on a straight-line basis over the term of the lease; a straight-line rent or free-rent receivable, which is included in the carrying amount of investment property, is recorded for the difference between the rental revenue recorded and the contractual amount received.
An allowance for doubtful accounts is recorded, if necessary, for estimated losses resulting from the inability of tenants to make required rent payments. The computation of this allowance is based on the tenants’ payment history and current credit status as well as certain industry-specific or geography-specific credit considerations. We also make judgments with respect to whether tenant improvements provided in connection with a lease enhance the value of the leased property, which determines whether such amounts are treated as additions to investment property as well as the point in time at which revenue recognition under the lease commences. In addition, where a lease allows a tenant to elect to take all or a portion of any unused tenant improvement allowance as a rent abatement, we must exercise judgment in determining the extent to which the allowance represents an inducement that is amortized as a reduction of lease revenue over the term of the lease.
Rental revenue also includes percentage participating rents and recoveries of operating expenses, including property taxes. Percentage participating rents are recognized when tenants’ specified sales targets have been met. Operating expense recoveries are recognized in the period that recoverable costs are chargeable to tenants.
Critical judgments in applying accounting policies
The critical judgments that have been made in applying our accounting policies and that have the most significant effect on the amounts in the consolidated financial statements are described in Note 2(n) in the consolidated financial statements.
USE OF ESTIMATES
The preparation of our consolidated financial statements requires management to make judgments, estimates, and assumptions that affect the reported amounts of assets and liabilities, disclosure of contingent assets and liabilities at the date of the consolidated financial statements, and the reported amounts of revenues and expenses during the reporting period. Our estimates are based on historical experience and on various other assumptions that are believed to be reasonable under the circumstances. The result of our ongoing evaluation of these estimates forms the basis for making judgments about the carrying values of assets and liabilities and the reported amounts of revenues and expenses that are not readily apparent from other sources. Actual results may differ from these estimates under different assumptions.
| Brookfield Canada Office Properties | 29 |
RELATED-PARTY TRANSACTIONS
In the normal course of operations, the Trust enters into various transactions with related parties that have been measured at exchange value and are recognized in the consolidated financial statements.
The Trust has entered into two service-support agreements with BOPM LP, dated May 1, 2010, for the provision of property management, leasing, construction, and asset management services. The purpose of the agreements is to provide the services of certain personnel and consultants as are necessary to help the Trust operate and manage its assets and tenant base; it also includes a cost-recovery for administrative and regulatory compliance services provided. The fees paid to BOPM LP are calculated in accordance with the terms of the agreements. Included in direct commercial property expense during the year ended December 31, 2015, are amounts paid to BOPM LP for property management services of $13.7 million (compared to $14.1 million in 2014). Included in investment properties during the year ended December 31, 2015, are amounts paid to BOPM LP for leasing and construction services of $8.3 million (compared to $3.2 million in 2014). Included in general and administrative expenses during the year ended December 31, 2015, are amounts paid to BOPM LP for asset management and administrative and regulatory compliance services of $19.5 million (compared to $19.0 million in 2014).
Included in fair value gains (losses) is $1.2 million paid to a subsidiary of BAM for services provided for the dispositions of 151 Yonge St. and HSBC Building during the year ended December 31, 2015.
The Trust entered into a long-term lease with BOPI at Bay Adelaide East and total rent received was $2.6 million for the year ended December 31, 2015.
Included in rental revenues during the year ended December 31, 2015, are amounts received from Brookfield Asset Management Inc., the ultimate parent of BOPI, and its affiliates of $9.8 million (compared to $6.9 million in 2014). Included in commercial developments during the year ended December 31, 2015, are amounts paid to a subsidiary of Brookfield Asset Management Inc. of $83.3 million (compared to $151.9 million in 2014) pursuant to a contract to construct Bay Adelaide East.
PART V – BUSINESS ENVIRONMENT AND OUTLOOK
OPERATING ENVIRONMENT AND OUTLOOK
We closed out 2015 with stable operational and financial results and improvements in the Toronto region. Key highlights for the year included 2.1 million square feet of leasing, capital generation through dispositions of investment properties and new financings, on-target completion of Bay Adelaide East development, and annual distribution increase of 5.7% subsequent to year-end. Our performance over the past year reiterates our belief that BOX offers institutional investors and individual shareholders alike the best option to invest in the most prestigious office properties in Canada. On the leasing front, BOX achieved leasing volume that was consistent with the last 3 years; as well, our portfolio occupancy rate increased by 0.4% over the year to 95.8%, which compared favourably with the Canadian national average of 89.6%. Despite the erosion in the Calgary economy and the associated delays in lease-ups that we experienced during the year, BOX maintained a sub-5% overall vacancy in our portfolio. We also improved our 5-year rollover exposure up to 2019 by 9.3%. With respect to capital, we divested two investment properties in Toronto at peak values and repatriated $107 million. In terms of financing initiatives, we completed new financings at Place de Ville I & II which generated net proceeds of $43.8 million. We also increased our borrowing capacity by $70 million through upsizing of the corporate revolver. In development, we achieved a major milestone by delivering the second office tower at Bay Adelaide Centre. The East tower contributed to net operating income immediately upon completion and commenced tenant occupancy in January 2016. Lastly, with the transition of Bay Adelaide East into income producing properties, the Trust raised its unit distribution by 5.7% to $1.31 annually as we look for ways to add investment value to our unitholders.
Our first priority for 2016 is focusing on leasing objectives as we continue to backfill existing voids and reduce vacancy exposure and maintaining an above-market occupancy rate. We had seen occupancy levels improved for the second consecutive quarter in Toronto after several quarters of negative absorption. In contrast, we are experiencing downward momentum in Calgary which will likely continue in 2016. The decline in global oil prices has put substantial pressure on Calgary’s energy sector. Companies continue to cut capital budgets, lower operational expectations and reduce work forces. Our exposure to the energy sector is approximately 26% of our overall portfolio. However, our tenants represent many of the strongest players in the oil & gas sector and our average remaining lease term in Calgary is 10 years. We believe that our portfolio will continue to maintain an above market occupancy rate in 2016. Second, we will manage the integration of operations and the completion of the remaining construction activities at Bay Adelaide East. As well, we continue to advance and actively manage the development of Brookfield Place Calgary East and the lease-ups of both properties. Third, we plan to divest additional investment properties, including Royal Centre in Vancouver, given the favourable market conditions and strong demand for high quality assets.
We ended 2015 with $3.3 billion in net assets at a value per unit of $35.72. In addition, we ended the year with $214 million of liquidity and we will continue to look for opportunities to deploy this cash at attractive returns to unitholders.
With a strong balance sheet offering financial flexibility and a well-leased portfolio, BOX is well positioned to weather the economic downturn in Calgary and to deliver on its commitment to unitholders in 2016.
DISCLOSURE CONTROLS AND PROCEDURES
Management, including the Chief Executive Officer and Chief Financial Officer, has evaluated the effectiveness of our disclosure controls and procedures (as defined in the applicable Canadian and U.S. securities law) as of December 31, 2015. Based on that evaluation, the Chief Executive Officer and Chief Financial Officer concluded that such disclosure controls and procedures were effective as of December 31, 2015.
INTERNAL CONTROLS OVER FINANCIAL REPORTING
There was no change in the Trust’s internal control over financial reporting that occurred during 2015 that has materially affected, or is reasonably likely to materially affect, the Trust’s internal control over financial reporting. Management has also evaluated the effectiveness of the Trust’s internal control over financial reporting as of December 31, 2015, and based on that assessment concluded that the Trust’s internal control over financial reporting was effective. Refer to Management’s Report on Internal Control over Financial Reporting on page 34 of this annual report.

Bryan K. Davis
Chief Financial Officer
February 24, 2016
| Brookfield Canada Office Properties | 31 |
Management's Responsibility for the Financial Statements
The consolidated financial statements and management’s financial analysis and review contained in this annual report are the responsibility of the management of the Trust. To fulfill this responsibility, the Trust maintains a system of internal controls to ensure that its reporting practices and accounting and administrative procedures are appropriate and provide assurance that relevant and reliable financial information is produced. The consolidated financial statements have been prepared in conformity with International Financial Reporting Standards as issued by the International Accounting Standards Board and, where appropriate, reflect estimates based on management’s best judgment in the circumstances. The financial information presented throughout this annual report is consistent with the information contained in the consolidated financial statements.
Deloitte LLP, the independent auditors appointed by the unitholders, have audited the consolidated financial statements in accordance with Canadian generally accepted auditing standards and the standards of the Public Company Accounting Oversight Board (United States). Their report as Independent Registered Public Accounting Firm is set out on the following page.
The consolidated financial statements have been further examined by the Board of Trustees and by its Audit Committee, which meets with the auditors and management to review the activities of each and reports to the Board of Trustees. The auditors have direct and full access to the Audit Committee and meet with the committee both with and without management present. The Board of Trustees, directly and through its Audit Committee, oversees management’s responsibilities and is responsible for reviewing and approving the consolidated financial statements.
 | |
| | |
| Jan Sucharda | Bryan K. Davis |
| President and Chief Executive Officer | Chief Financial Officer |
| February 24, 2016 | |
Report of Independent Registered Public Accounting Firm
To the Board of Trustees and Unitholders of Brookfield Canada Office Properties
We have audited the accompanying consolidated financial statements of Brookfield Canada Office Properties and subsidiaries (the “Trust”), which comprise the consolidated balance sheets as at December 31, 2015 and December 31, 2014, and the consolidated statements of income and comprehensive income, consolidated statements of changes in equity and consolidated statements of cash flows for the years then ended, and the notes to the consolidated financial statements.
Management's Responsibility for the Consolidated Financial Statements
Management is responsible for the preparation and fair presentation of these consolidated financial statements in accordance with International Financial Reporting Standards as issued by the International Accounting Standards Board, and for such internal control as management determines is necessary to enable the preparation of consolidated financial statements that are free from material misstatement, whether due to fraud or error.
Auditor's Responsibility
Our responsibility is to express an opinion on these consolidated financial statements based on our audits. We conducted our audits in accordance with Canadian generally accepted auditing standards and the standards of the Public Company Accounting Oversight Board (United States). Those standards require that we comply with ethical requirements and plan and perform the audit to obtain reasonable assurance about whether the consolidated financial statements are free from material misstatement.
An audit involves performing procedures to obtain audit evidence about the amounts and disclosures in the consolidated financial statements. The procedures selected depend on the auditor's judgment, including the assessment of the risks of material misstatement of the consolidated financial statements, whether due to fraud or error. In making those risk assessments, the auditor considers internal control relevant to the entity's preparation and fair presentation of the consolidated financial statements in order to design audit procedures that are appropriate in the circumstances. An audit also includes evaluating the appropriateness of accounting policies used and the reasonableness of accounting estimates made by management, as well as evaluating the overall presentation of the consolidated financial statements.
We believe that the audit evidence we have obtained in our audits is sufficient and appropriate to provide a basis for our audit opinion.
Opinion
In our opinion, the consolidated financial statements present fairly, in all material respects, the financial position of the Trust and subsidiaries as at December 31, 2015 and December 31, 2014, and their financial performance and their cash flows for the years then ended in accordance with International Financial Reporting Standards as issued by the International Accounting Standards Board.
Other Matter
We have also audited, in accordance with the standards of the Public Company Accounting Oversight Board (United States), the Trust’s internal control over financial reporting as of December 31, 2015, based on the criteria established inInternal Control - Integrated Framework (2013) issued by the Committee of Sponsoring Organizations of the Treadway Commission and our report dated February 24, 2016 expressed an unqualified opinion on the Trust's internal control over financial reporting.

Chartered Professional Accountants
Licensed Public Accountants
February 24, 2016
Toronto, Canada
| Brookfield Canada Office Properties | 33 |
Management's Report on Internal Control over Financial Reporting
Management of Brookfield Canada Office Properties is responsible for establishing and maintaining adequate internal control over financial reporting. Internal control over financial reporting is a process designed by, or under the supervision of, the Chief Executive Officer and the Chief Financial Officer and effected by the Board of Trustees, management and other personnel to provide reasonable assurance regarding the reliability of financial reporting and the preparation of financial statements for external purposes in accordance with International Financial Reporting Standards as issued by the International Accounting Standards Board.
Due to its inherent limitations, internal control over financial reporting may not prevent or detect misstatements on a timely basis. Also, projections of any evaluation to the effectiveness of internal control over the financial reporting to future periods are subject to the risk that the controls may become inadequate because of changes in conditions, or that the degree of compliance with the policies or procedures may deteriorate.
Management assessed the effectiveness of Brookfield Canada Office Properties’ internal control over financial reporting as of December 31, 2015, based on criteria established in Internal Control-Integrated Framework (2013) issued by the Committee of Sponsoring Organizations of the Treadway Commission. Based on this assessment, management concluded that, as at December 31, 2015, Brookfield Canada Office Properties’ internal control over financial reporting is effective. There are no material weaknesses that have been identified by Management.
Brookfield Canada Office Properties' internal control over financial reporting as of December 31, 2015 has been audited by Deloitte LLP, Independent Registered Public Accounting Firm, who also audited Brookfield Canada Office Properties’ consolidated financial statements for the year ended December 31, 2015, and as stated in the Report of Independent Registered Public Accounting Firm, Deloitte LLP expressed an unqualified opinion on the effectiveness of Brookfield Canada Office Properties' internal control over financial reporting.
| | |
| | |
| Jan Sucharda | Bryan K. Davis |
| President and Chief Executive Officer | Chief Financial Officer |
| February 24, 2016 | |
Report of Independent Registered Public Accounting Firm
To the Board of Trustees and Unitholders of Brookfield Canada Office Properties
We have audited the internal control over financial reporting of Brookfield Canada Office Properties and subsidiaries (the “Trust”) as of December 31, 2015, based onthe criteria established inInternal Control-Integrated Framework (2013) issued by the Committee of Sponsoring Organizations of the Treadway Commission. The Trust's management is responsible for maintaining effective internal control over financial reporting and for its assessment of the effectiveness of internal control over financial reporting, included in the accompanying Management’s Report on Internal Control over Financial Reporting. Our responsibility is to express an opinion on the Trust's internal control over financial reporting based on our audit.
We conducted our audit in accordance with the standards of the Public Company Accounting Oversight Board (United States). Those standards require that we plan and perform the audit to obtain reasonable assurance about whether effective internal control over financial reporting was maintained in all material respects. Our audit included obtaining an understanding of internal control over financial reporting, assessing the risk that a material weakness exists, testing and evaluating the design and operating effectiveness of internal control based on the assessed risk, and performing such other procedures as we considered necessary in the circumstances. We believe that our audit provides a reasonable basis for our opinion.
A company's internal control over financial reporting is a process designed by, or under the supervision of, the company's principal executive and principal financial officers, or persons performing similar functions, and effected by the company's board of directors, management, and other personnel to provide reasonable assurance regarding the reliability of financial reporting and the preparation of financial statements for external purposes in accordance with International Financial Reporting Standards as issued by the International Accounting Standards Board. A company's internal control over financial reporting includes those policies and procedures that (1) pertain to the maintenance of records that, in reasonable detail, accurately and fairly reflect the transactions and dispositions of the assets of the company; (2) provide reasonable assurance that transactions are recorded as necessary to permit preparation of financial statements in accordance with International Financial Reporting Standards as issued by the International Accounting Standards Board, and that receipts and expenditures of the company are being made only in accordance with authorizations of management and directors of the company; and (3) provide reasonable assurance regarding prevention or timely detection of unauthorized acquisition, use, or disposition of the company's assets that could have a material effect on the financial statements.
Because of the inherent limitations of internal control over financial reporting, including the possibility of collusion or improper management override of controls, material misstatements due to error or fraud may not be prevented or detected on a timely basis. Also, projections of any evaluation of the effectiveness of the internal control over financial reporting to future periods are subject to the risk that the controls may become inadequate because of changes in conditions, or that the degree of compliance with the policies or procedures may deteriorate.
In our opinion, the Trust maintained, in all material respects, effective internal control over financial reporting as of December 31, 2015, based on the criteria established inInternal Control - Integrated Framework (2013)issued by the Committee of Sponsoring Organizations of the Treadway Commission.
We have also audited, in accordance with Canadian generally accepted auditing standards and the standards of the Public Company Accounting Oversight Board (United States), the consolidated financial statements as of and for the year ended December 31, 2015 of the Trust and our report dated February 24, 2016 expressed an unqualified opinion on those financial statements.
Chartered Professional Accountants
Licensed Public Accountants
February 24, 2016
Toronto, Canada
| Brookfield Canada Office Properties | 35 |
Consolidated Balance Sheets
| (Millions) (CDN$) | | Note | | | Dec. 31, 2015 | | | Dec. 31, 2014 | |
| Assets | | | | | | | | | | | | |
| Non-current assets | | | | | | | | | | | | |
| Investment properties | | | | | | | | | | | | |
| Commercial properties | | | 4 | | | $ | 5,805.1 | | | $ | 5,131.7 | |
| Commercial developments | | | 4 | | | | 462.7 | | | | 670.7 | |
| | | | | | | | 6,267.8 | | | | 5,802.4 | |
| Current assets | | | | | | | | | | | | |
| Tenant and other receivables | | | 7 | | | | 23.8 | | | | 34.3 | |
| Other assets | | | 8 | | | | 7.3 | | | | 8.9 | |
| Cash and cash equivalents | | | 9 | | | | 57.6 | | | | 58.9 | |
| | | | | | | | 88.7 | | | | 102.1 | |
| Assets held for sale | | | 5 | | | | — | | | | 38.9 | |
| Total assets | | | | | | $ | 6,356.5 | | | $ | 5,943.4 | |
| | | | | | | | | | | | | |
| Liabilities | | | | | | | | | | | | |
| Non-current liabilities | | | | | | | | | | | | |
| Investment property and corporate debt | | | 10 | | | $ | 2,560.1 | | | $ | 2,368.4 | |
| Current liabilities | | | | | | | | | | | | |
| Investment property and corporate debt | | | 10 | | | | 278.4 | | | | 281.3 | |
| Accounts payable and other liabilities | | | 11 | | | | 185.0 | | | | 196.9 | |
| | | | | | | | 463.4 | | | | 478.2 | |
| Liabilities associated with assets held for sale | | | 5 | | | | — | | | | 0.5 | |
| Total liabilities | | | | | | | 3,023.5 | | | | 2,847.1 | |
| | | | | | | | | | | | | |
| Equity | | | 13 | | | | | | | | | |
| Unitholders’ equity | | | | | | | 923.8 | | | | 856.7 | |
| Non-controlling interest | | | | | | | 2,409.2 | | | | 2,239.6 | |
| Total equity | | | | | | | 3,333.0 | | | | 3,096.3 | |
| Total liabilities and equity | | | | | | $ | 6,356.5 | | | $ | 5,943.4 | |
See accompanying notes to the consolidated financial statements.
Consolidated Statements of Income and Comprehensive Income
| Years ended December 31 | | | | | | | | | |
| (Millions, except per unit amounts) (CDN$) | | Note | | | 2015 | | | 2014 | |
| Commercial property revenue | | | 14 (a) | | | $ | 516.9 | | | $ | 517.2 | |
| Direct commercial property expense | | | 14 (b) | | | | 265.6 | | | | 247.9 | |
| Investment and other income | | | 14 (c) | | | | — | | | | 1.1 | |
| Interest expense | | | 14 (b) | | | | 84.3 | | | | 91.9 | |
| General and administrative expense | | | 14 (b), 17 | | | | 23.1 | | | | 23.6 | |
| Income before fair value gains (losses) | | | | | | | 143.9 | | | | 154.9 | |
| Fair value gains (losses) | | | 4, 5 | | | | 207.5 | | | | (38.8 | ) |
| Net income and comprehensive income | | | | | | $ | 351.4 | | | $ | 116.1 | |
| | | | | | | | | | | | | |
| Net income and comprehensive income attributable to: | | | | | | | | | | | | |
| Unitholders | | | | | | $ | 98.6 | | | $ | 32.5 | |
| Non-controlling interest | | | | | | | 252.8 | | | | 83.6 | |
| | | | | | | $ | 351.4 | | | $ | 116.1 | |
| Net income per Trust unit – basic and diluted | | | | | | $ | 3.76 | | | $ | 1.24 | |
See accompanying notes to the consolidated financial statements.
| Brookfield Canada Office Properties | 37 |
Consolidated Statements of Changes in Equity
| Years ended December 31 (Millions) (CDN$) | | Note | | | 2015 | | | 2014 | |
| Trust Units | | | | | | | | | | | | |
| Balance at beginning of year | | | | | | $ | 553.4 | | | $ | 552.1 | |
| Repurchase of Trust Units | | | 13 | | | | (0.8 | ) | | | — | |
| Issuance of Trust Units under Distribution Reinvestment Plan (“DRIP”) | | | 12 | | | | 1.8 | | | | 1.3 | |
| Balance at end of year | | | | | | | 554.4 | | | | 553.4 | |
| Contributed surplus | | | | | | | | | | | | |
| Balance at beginning of year | | | | | | | 3.1 | | | | 3.1 | |
| Repurchase of Trust Units | | | 13 | | | | (0.2 | ) | | | — | |
| Balance at end of year | | | | | | | 2.9 | | | | 3.1 | |
| Retained earnings | | | | | | | | | | | | |
| Balance at beginning of year | | | | | | | 300.2 | | | | 299.5 | |
| Net income and comprehensive income | | | | | | | 98.6 | | | | 32.5 | |
| Distributions | | | 12 | | | | (32.3 | ) | | | (31.8 | ) |
| Balance at end of year | | | | | | | 366.5 | | | | 300.2 | |
| Total unitholders’ equity | | | | | | $ | 923.8 | | | $ | 856.7 | |
| | | | | | | | | | | | | |
| Non-controlling interest | | | | | | | | | | | | |
| Balance at beginning of year | | | | | | $ | 2,239.6 | | | $ | 2,237.6 | |
| Net income and comprehensive income | | | | | | | 252.8 | | | | 83.6 | |
| Distributions | | | 12 | | | | (83.2 | ) | | | (81.6 | ) |
| Balance at end of year | | | | | | | 2,409.2 | | | | 2,239.6 | |
| Total equity | | | | | | $ | 3,333.0 | | | $ | 3,096.3 | |
See accompanying notes to the consolidated financial statements.
Consolidated Statements of Cash Flows
| Years ended December 31 (Millions) (CDN$) | | Note | | | 2015 | | | 2014 | |
| Operating activities | | | | | | | | | | | | |
| Net income | | | | | | $ | 351.4 | | | $ | 116.1 | |
| Add (deduct): | | | | | | | | | | | | |
| Non-cash rental (revenue) expense | | | 14(a) | | | | (1.1 | ) | | | 1.4 | |
| Amortization of deferred financing costs | | | | | | | 3.3 | | | | 3.1 | |
| Leasing commissions and tenant inducements | | | | | | | (13.9 | ) | | | (8.8 | ) |
| Fair value (gains) losses | | | 4, 5 | | | | (207.5 | ) | | | 38.8 | |
| Interest expense | | | | | | | 84.3 | | | | 91.9 | |
| Interest paid | | | | | | | (108.6 | ) | | | (102.9 | ) |
| Other working capital | | | | | | | 7.1 | | | | (3.4 | ) |
| Cash flows provided by operating activities | | | | | | | 115.0 | | | | 136.2 | |
| | | | | | | | | | | | | |
| Investing activities | | | | | | | | | | | | |
| Acquisition of commercial developments | | | 4 | | | | — | | | | (235.3 | ) |
| Disposition of commercial property | | | 5 | | | | 105.7 | | | | — | |
| Capital expenditures – commercial properties | | | | | | | (59.0 | ) | | | (37.2 | ) |
| Capital expenditures – commercial developments | | | | | | | (275.3 | ) | | | (179.7 | ) |
| Cash flows used in investing activities | | | | | | | (228.6 | ) | | | (452.2 | ) |
| | | | | | | | | | | | | |
| Financing activities | | | | | | | | | | | | |
| Investment property debt arranged | | | | | | | 267.4 | | | | 235.8 | |
| Investment property debt repayments | | | | | | | (0.3 | ) | | | (78.1 | ) |
| Investment property debt amortization | | | | | | | (49.1 | ) | | | (51.0 | ) |
| Corporate debt arranged | | | | | | | 119.0 | | | | 185.0 | |
| Corporate debt repayments | | | | | | | (110.0 | ) | | | — | |
| Repurchase of Trust units | | | 13 | | | | (1.0 | ) | | | — | |
| Trust unit distributions paid | | | 19 | | | | (30.5 | ) | | | (30.4 | ) |
| Class B LP unit distributions paid | | | 19 | | | | (83.2 | ) | | | (81.2 | ) |
| Cash flows provided by financing activities | | | | | | | 112.3 | | | | 180.1 | |
| Decrease in cash and cash equivalents | | | | | | | (1.3 | ) | | | (135.9 | ) |
| Cash and cash equivalents, beginning of year | | | | | | | 58.9 | | | | 194.8 | |
| Cash and cash equivalents, end of year | | | | | | $ | 57.6 | | | $ | 58.9 | |
See accompanying notes to the consolidated financial statements.
| Brookfield Canada Office Properties | 39 |
Notes to the Consolidated Financial Statements
NOTE 1: NATURE AND DESCRIPTION OF THE TRUST
Brookfield Canada Office Properties (the “Trust” or “BOX”) is an unincorporated, closed-end real estate investment trust (“REIT”) established under and governed by the laws of the Province of Ontario, Canada and created pursuant to a declaration of trust dated March 19, 2010 and amended and restated February 24, 2012. Although it is intended that BOX qualifies as a “mutual fund trust” pursuant to theIncome Tax Act (Canada), BOX is not a mutual fund under applicable securities laws.
The Trust is a subsidiary of Brookfield Office Properties Inc. (“BOPI”), which owns an aggregate equity interest in the Trust of 57.2% as of December 31, 2015 consisting of 79.5% of the issued and outstanding Class B limited partnership units (“Class B LP Units”) of Brookfield Office Properties Canada LP (“BOPC LP”), a subsidiary of BOX that owns direct interests in the Trust’s investment properties. In addition, BOPI’s parent company, Brookfield Property Partners LP (“BPY”), directly owns an aggregate equity interest in the Trust of 26.0% consisting of 40.3% of the issued and outstanding units of BOX (“Trust Units”) and 20.5% of the Class B LP Units. BOX primarily invests in and operates commercial office properties in Toronto, Ottawa, Calgary, and Vancouver. The registered and operating office of the Trust is Brookfield Place Toronto, 181 Bay Street, Suite 330, Toronto, Ontario, M5J 2T3.
NOTE 2: SIGNIFICANT ACCOUNTING POLICIES
| (a) | Statement of compliance |
The consolidated financial statements have been prepared in accordance with International Financial Reporting Standards as issued by the International Accounting Standards Board (“IFRS”).
The financial statements have been prepared on a going concern basis and have been presented in Canadian dollars rounded to the nearest million. The accounting policies set out below have been applied consistently in all material respects. New and revised standards not effective for the current accounting year are described in Note 3.
| (c) | Basis of consolidation |
The consolidated financial statements include the accounts of the Trust and its subsidiaries consisting of BOPC GP Inc. and BOPC LP, which are the entities over which the Trust has control. Control is achieved when the Trust has power over an entity; is exposed, or has rights, to variable returns from its involvement with the investee; and has the ability to use its power to affect its returns. The Trust holds all of the Class A Limited Partnership Units of BOPC LP (“Class A LP Units”). The holders of the Class A LP Units are entitled to vote at all meetings of the partners of BOPC LP. In addition, BOX is the sole shareholder of BOPC GP Inc., the general partner of BOPC LP, which has full power and exclusive authority to administer, manage, control and operate the business and affairs of BOPC LP. The Trust reassesses whether or not it controls an investee if facts and circumstances indicate that there are changes to one or more of the three elements of control.
Non-controlling interests in the equity and results of the Trust are shown separately in equity on the consolidated balance sheets.
All intercompany assets, liabilities, equity, income, expenses and cash flows relating to transactions between members of the Trust are eliminated on consolidation.
| (d) | Interests in joint operations |
A joint operation is a joint arrangement whereby the parties that have joint control of the arrangement have rights to the assets, and obligations for the liabilities, relating to the arrangement. This usually results through a direct interest in the assets rather than through the establishment of a separate entity. Joint control is the contractually agreed sharing of control of an arrangement, which exists only when decisions about the relevant activities require unanimous consent of the parties sharing control. The Trust has determined that its joint arrangements are all joint operations.
Where the Trust undertakes its activities under joint operations, the Trust recognizes its proportionate share of jointly controlled assets, liabilities, revenues and expenses in the consolidated financial statements, which are classified according to their nature.
| (e) | Fair value measurement |
The Trust measures its non-financial assets such as investment properties, at fair value at each balance sheet date. Fair values of financial instruments measured at amortized cost are described in Note 2(j).
Fair value is the price that would be received to sell an asset or paid to transfer a liability in an orderly transaction between market participants at the measurement date, regardless of whether that price is directly observable or estimated using another valuation technique. In estimating the fair value of an asset or liability, the Trust takes into account the characteristics of the asset or liability and available market evidence at the measurement date.
In addition, for financial reporting purposes, fair value measurements are categorized into Level 1, 2 or 3 based on the degree to which the inputs to the fair value measurements are observable and the significance of the inputs to the fair value measurement in its entirety, which are described as follows:
| • | Level 1 inputs are quoted prices (unadjusted) in active markets for identical assets or liabilities that the Trust can access at the measurement date; |
| • | Level 2 inputs are inputs, other than quoted prices included within Level 1, that are observable for the asset or liability, either directly or indirectly; and |
| • | Level 3 inputs are unobservable inputs for the asset or liability. |
Investment properties include commercial properties held to earn rental income and properties that are being constructed or developed for future use as investment properties. Commercial properties and commercial developments are recorded at fair value, determined based on available market evidence, at the balance sheet date. The Trust determines the fair value of each investment property based upon, among other things, rental income from current leases and assumptions about rental income from future leases reflecting market conditions at the balance sheet date, less future cash flows in respect of such leases. Fair values are primarily determined by discounting the expected future cash flows, generally over a weighted-average term of 11 years, including a terminal value based on the application of a capitalization rate to estimated year 12 cash flows. Commercial developments under active development are measured using a discounted cash flow model, net of costs to complete, as of the balance sheet date. Valuations of investment properties are most sensitive to changes in the discount rate and timing or variability of cash flows.
The cost of commercial development includes direct development costs, realty taxes and borrowing costs directly attributable to the development. Borrowing costs associated with direct expenditures on properties under development are capitalized. The amount of borrowing costs capitalized is determined first by reference to borrowings specific to the project, where relevant, and otherwise by applying a weighted average cost of borrowings to eligible expenditures after adjusting for borrowings associated with other specific developments. Where borrowings are associated with specific developments, the amount capitalized is the gross cost incurred on those borrowings less any investment income arising on their temporary investment. Borrowing costs are capitalized from the commencement of the development until the date of practical completion. The capitalization of borrowing costs is suspended if there are prolonged periods when development activity is interrupted. The Trust considers practical completion to have occurred when the property is capable of operating in the manner intended by management. Generally this occurs upon completion of construction and receipt of all necessary occupancy and other material permits. Where the Trust has pre-leased space as of or prior to the start of the development and the lease requires the Trust to construct tenant improvements which enhance the value of the property, practical completion is considered to occur on completion of such improvements.
Initial direct leasing costs we incur in negotiating and arranging tenant leases are added to the carrying amount of investment properties.
Non-current assets and groups of assets and liabilities that comprise disposal groups are categorized as assets held for sale where the asset or disposal group is available for sale in its present condition and the sale is highly probable. For this purpose, a sale is highly probable if management is committed to a plan to achieve the sale, there is an active program to find a buyer, the non-current asset or disposal group is being actively marketed at a reasonable price, the sale is anticipated to be completed within one year from the date of classification, and it is unlikely there will be changes to the plan. Where an asset or disposal group is acquired with a view to resale, it is classified as a non-current asset held for sale if the disposal is expected to take place within one year of the acquisition and it is highly likely that the other conditions referred to above will be met within a short period following the acquisition. Non-current assets held for sale and disposal groups are measured at fair value as described in Note 2(e).
A provision is a liability of uncertain timing or amount. Provisions are recognized when the Trust has a present legal or constructive obligation as a result of past events, it is probable that an outflow of resources will be required to settle the obligation, and the amount can be reliably estimated. Provisions are not recognized for future operating losses. Provisions are measured at the present value of the expenditures expected to be required to settle the obligation using a discount rate that reflects current market assessments of the time value of money and the risks specific to the obligation. Provisions are remeasured at each balance sheet date using the current discount rate. The increase in the provision due to the passage of time is recognized as interest expense.
The Trust has retained substantially all of the risks and benefits of ownership of its investment properties and therefore accounts for leases with its tenants as operating leases. Revenue recognition under a lease commences when the tenant has a right to use the leased asset. Generally, this occurs on the lease inception date or, where the Trust is required to make additions to the property in the form of tenant improvements that enhance the value of the property, upon substantial completion of those improvements. The total amount of contractual rent to be received from operating leases is recognized on a straight-line basis over the term of the lease; a straight-line rent receivable, which is included in the carrying amount of investment property, is recorded for the difference between the rental revenue recorded and the contractual amount received.
| Brookfield Canada Office Properties | 41 |
Rental revenue also includes percentage participating rents and recoveries of operating expenses, including property and capital taxes. Percentage participating rents are recognized when tenants’ specified sales targets have been met. Operating expense recoveries are recognized in the period that recoverable costs are chargeable to tenants.
| (j) | Financial instruments and derivatives |
Derivative instruments are recorded on the consolidated balance sheets at fair value, including those derivatives that are embedded in financial or non-financial contracts and that are not closely related to the host contract, and gains and losses arising from changes in fair value of derivative instruments are recognized in net income in the period the changes occur.
The following summarizes the Trust’s classification and measurement of financial instruments:
| Financial assets and liabilities | | Classification | | Measurement |
| Cash and cash equivalents | | Loans and receivables | | Amortized cost |
| Tenant receivables | | Loans and receivables | | Amortized cost |
| Investment property and corporate debt | | Other liabilities | | Amortized cost |
| Accounts payable and other liabilities | | Other liabilities | | Amortized cost |
With the exception of Investment property and corporate debt, the carrying amounts of these financial assets and liabilities approximate fair value. The fair value of investment property and corporate debt is determined by discounting contractual principal and interest payments at estimated current market interest rates for the instrument. Current market interest rates are determined with reference to current benchmark rates for a similar term and current credit spreads for debt with similar terms and risks.
| (k) | Cash and cash equivalents |
Cash and cash equivalents include cash and short-term investments with original maturities of three months or less.
| (l) | Non-controlling interest |
Class B LP Units are classified as non-controlling interest and are presented as a component of equity as they represent equity interests in BOPC LP not attributable, directly or indirectly, to the Trust.
The Trust is a “mutual fund trust” pursuant to theIncome Tax Act (Canada). The Trust intends to distribute or designate all taxable earnings to unitholders and, under current legislation, the obligation to pay tax rests with each unitholder. No current or deferred tax provision is recognized in the Trust’s financial statements on the Trust’s income.
| (n) | Critical judgments in applying accounting policies |
The following are the critical judgments that have been made in applying the Trust’s accounting policies and that have the most significant effect on the amounts in the consolidated financial statements:
The Trust’s policy for revenue recognition on investment properties is described in Note 2(i). In applying this policy, the Trust makes judgments with respect to whether tenant improvements provided in connection with a lease enhance the value of the leased property, which determines whether such amounts are treated as additions to investment property as well as the point in time at which revenue recognition under the lease commences. In addition, where a lease allows a tenant to elect to take all or a portion of any unused tenant improvement allowance as a rent abatement, the Trust must exercise judgment in determining the extent to which the allowance represents an inducement that is amortized as a reduction of lease revenue over the term of the lease.
The Trust also makes judgments in determining whether certain leases, in particular those tenant leases with long contractual terms where the lessee is the sole tenant in a property and long-term ground leases where the Trust is lessor, are operating or finance leases. The Trust has determined that all of its leases are operating leases.
The Trust’s accounting policies relating to investment property are described in Note 2(f). In applying this policy, judgment is applied in determining whether certain costs are additions to the carrying amount of the property and, for properties under development, identifying the point at which practical completion of the property occurs and identifying the directly attributable borrowing costs to be included in the carrying value of the development property.
Deferred income taxes are not recognized in the Trust’s financial statements on the basis that the Trust can deduct distributions paid such that its liability for income taxes is substantially reduced or eliminated for the year, and the Trust intends to continue to distribute its taxable income and continue to qualify as a real estate investment trust for the foreseeable future.
The Trust’s accounting policies relating to assets held for sale are described in Note 2(g). In applying this policy, judgment is applied in determining whether sale of certain assets is highly probable, which is a necessary condition for being presented within assets held for sale. Also, judgment is applied in determining whether disposal groups represent a component of the entity, the results of which should be recorded in discontinued operations on the consolidated statements of income.
| (v) | Common control transactions |
IFRS does not include specific measurement guidance for transfers of businesses or subsidiaries between entities under common control. Accordingly, the Trust has developed a policy to account for such transactions taking into consideration other guidance in the IFRS framework and pronouncements of other standard-setting bodies. The Trust’s policy is to record assets and liabilities recognized as a result of transfers of businesses or subsidiaries between entities under common control at the carrying value on the transferor’s financial statements. Differences between the carrying amount of the consideration paid or received, where the Trust is the transferor, and the carrying amount of the assets and liabilities transferred are recorded directly in equity.
| (vi) | Consolidated financial statements |
The Trust’s accounting policies relating to consolidation are described in Note 2(c). In applying this policy, judgment is applied in determining whether the Trust has control over the entity and if facts or circumstances indicate that there are changes to one or more of the elements of control.
| (o) | Critical Accounting Estimates and Assumptions |
The Trust makes estimates and assumptions that affect the carrying amounts of assets and liabilities, disclosure of contingent assets and liabilities, and the reported amount of earnings for the period. Actual results could differ from estimates. The estimates and assumptions that are critical to the determination of the amounts reported in the consolidated financial statements relate to investment property. The critical estimates and assumptions underlying the valuation of investment properties are set out in Note 4.
NOTE 3: FUTURE ACCOUNTING POLICY CHANGES
On January 13, 2016, the IASB published a new Standard, IFRS 16, "Leases". The new Standard sets out the principles for the recognition, measurement, presentation and disclosure of leases, with the objective of ensuring that lessees and lessors provide relevant information that faithfully represent those transactions. IFRS 16 supersedes IAS 17 "Leases" and related interpretations and is effective for periods beginning on or after January 1, 2019, with earlier adoption permitted if IFRS 15 "Revenue from Contracts with Customers" has also been applied. The Trust is currently evaluating the impact to the consolidated financial statements.
On July 25, 2014, the IASB issued its final version of IFRS 9, “Financial Instruments”. IFRS 9, as amended, introduces a logical approach for the classification of financial assets, which is driven by cash flow characteristics and the business model in which an asset is held. This single, principle-based approach replaces existing rule-based requirements that are generally considered to be overly complex and difficult to apply. The new model results in a single impairment model being applied to all financial instruments, thereby removing a source of complexity associated with previous accounting requirements. It also introduces a new, expected-loss impairment model that will require more timely recognition of expected credit losses. IFRS 9 is effective for annual periods beginning on or after January 1, 2018 and should be applied retrospectively. The Trust is currently evaluating the impact to the consolidated financial statements.
In May 2014, the IASB issued Amendments to IFRS 11, “Joint Arrangements: Accounting for Acquisitions of Interests in Joint Operations”. The objective of the amendments is to add new guidance to IFRS 11 on accounting for the acquisition of an interest in a joint operation in which the activity of the joint operation constitutes a business, as defined in IFRS 3, “Business Combinations”. Acquirers of such interests are to apply the relevant principles on business combination accounting in IFRS 3 and other standards, as well as disclosing the relevant information specified in these standards for business combinations. This amendment to IFRS 11 is effective for annual periods beginning on or after January 1, 2016 and should be applied prospectively. The Trust is currently evaluating the impact to the consolidated financial statements.
| (d) | Revenue from Contracts with Customers |
In May 2014, the IASB issued its new revenue standard, IFRS 15, “Revenue from Contracts with Customers”. IFRS 15 specifies how and when revenue should be recognized as well as requiring more informative and relevant disclosures. IFRS 15 supersedes IAS 18, “Revenue Recognition”, IAS 11, “Construction Contracts” and a number of revenue-related interpretations. Application of the standard applies to nearly all contracts with customers: the main exceptions are leases, financial instruments and insurance contracts. IFRS 15 is effective for annual periods on or after January 1, 2018 and should be applied retrospectively. The Trust is currently evaluating the impact to the consolidated financial statements.
| Brookfield Canada Office Properties | 43 |
NOTE 4: INVESTMENT PROPERTIES
| | | Dec 31, 2015 | | | Dec 31, 2014 | |
| | | Commercial | | | Commercial | | | Commercial | | | Commercial | |
| (Millions) | | properties | | | developments | | | properties | | | developments | |
| Balance at beginning of year | | $ | 5,131.7 | | | $ | 670.7 | | | $ | 5,158.2 | | | $ | 232.0 | |
| Additions: | | | | | | | | | | | | | | | | |
| Acquisition | | | — | | | | — | | | | — | | | | 245.5 | |
| Capital expenditures and tenant improvements | | | 48.6 | | | | 300.3 | | | | 45.4 | | | | 193.0 | |
| Leasing commissions | | | 15.1 | | | | 0.6 | | | | 6.2 | | | | 0.2 | |
| Tenant inducements | | | 0.7 | | | | — | | | | 0.9 | | | | — | |
| Reclassification of assets held for sale | | | — | | | | — | | | | (38.8 | ) | | | — | |
| Reclassification of commercial development, net | | | 508.9 | | | | (508.9 | ) | | | — | | | | — | |
| Investment property disposition | | | (108.8 | ) | | | — | | | | — | | | | — | |
| Fair value gains (losses) | | | 207.9 | | | | — | | | | (38.8 | ) | | | — | |
| Other changes | | | 1.0 | | | | — | | | | (1.4 | ) | | | — | |
| Balance at end of year | | $ | 5,805.1 | | | $ | 462.7 | | | $ | 5,131.7 | | | $ | 670.7 | |
| (a) | Fair value of investment properties |
The Trust determined the fair value of each investment property based upon, among other things, rental income from current leases and assumptions about rental income from future leases reflecting market conditions at the applicable balance sheet dates, less future cash outflows with respect to such leases. Fair values were primarily determined by discounting the expected future cash flows, generally over a weighted-average term of 11 years, including a terminal value based on the application of a capitalization rate to estimated year 12 cash flows. Commercial developments under active development are measured using a discounted cash flow model, net of costs to complete, as of the balance sheet date. In accordance with its policy, the Trust measures its investment properties using valuations prepared by management. The Trust does not measure its investment properties based on valuations prepared by external valuation professionals.
The key valuation metrics for the Trust’s investment properties are set out in the following tables:
| | | December 31, 2015 | | | December 31, 2014 | |
| | | Maximum | | | Minimum | | | Weighted Average | | | Maximum | | | Minimum | | | Weighted
Average | |
| Eastern region | | | | | | | | | | | | | | | | | | | | | | | | |
| Discount rate | | | 7.00 | % | | | 6.00 | % | | | 6.13 | % | | | 7.00 | % | | | 6.00 | % | | | 6.34 | % |
| Terminal cap rate | | | 6.50 | % | | | 5.25 | % | | | 5.51 | % | | | 6.50 | % | | | 5.25 | % | | | 5.63 | % |
| Hold period (yrs) | | | 15 | | | | 10 | | | | 11 | | | | 15 | | | | 10 | | | | 11 | |
| | | | | | | | | | | | | | | | | | | | | | | | | |
| Western region | | | | | | | | | | | | | | | | | | | | | | | | |
| Discount rate | | | 6.75 | % | | | 4.75 | % | | | 6.01 | % | | | 6.75 | % | | | 6.00 | % | | | 6.32 | % |
| Terminal cap rate | | | 6.25 | % | | | 3.53 | % | | | 5.46 | % | | | 6.00 | % | | | 5.50 | % | | | 5.63 | % |
| Hold period (yrs) | | | 11 | | | | 10 | | | | 10 | | | | 11 | | | | 10 | | | | 10 | |
A 25 basis-point decrease in the discount and terminal capitalization rates will impact the fair value of commercial properties by $103.2 million and $160.3 million or 1.8% and 2.8%, respectively at December 31, 2015.
Investment properties with a fair value of approximately $925.9 million at December 31, 2015 (compared to $971.3 million in 2014) are situated on land held under leases or other agreements largely expiring after the year 2023. Investment properties do not include any properties held under operating leases.
Investment properties with a fair value of $4,874.9 million at December 31, 2015 (compared to $4,679.9 million in 2014) are pledged as security for investment property and corporate debt.
| (b) | Development activities |
During the third quarter of 2013 and the fourth quarter of 2014, the Trust acquired Bay Adelaide East and Brookfield Place Calgary East, respectively, from its parent company, BOPI, for an aggregate total investment of $601.9 million and $966.3 million, respectively. The buildings were purchased on an “as-if-completed-and-stabilized basis,” and as such, BOPI retains the development obligations including construction, lease-up and financing. As part of the acquisitions, the Trust formed an independent committee and engaged third-party advisors to evaluate the fairness of the transactions. The assets, liabilities and earnings from Bay Adelaide East and Brookfield Place Calgary East have been included in the consolidated financial statements commencing from July 11, 2013, and October 14, 2014, respectively.
The following table summarizes the details of the transactions:
| | | | | | Brookfield Place | |
| (Millions) | | Bay Adelaide East | | | Calgary East | |
| Initial acquisition price | | $ | 169.9 | | | $ | 245.5 | |
| Up-front equity commitment | | | 26.0 | | | | 81.8 | |
| First mortgage construction loan | | | 350.0 | | | | 575.0 | |
| Final payment due to BOPI on stabilization(1) | | | 56.0 | | | | 64.0 | |
| Aggregate total investment | | $ | 601.9 | | | $ | 966.3 | |
| (1) | Subject to achieving stabilized net operating income and targeted permanent financing, which is expected to occur in 2017 for Bay Adelaide East and 2018 for Brookfield Place Calgary East. |
As part of the Brookfield Place Calgary East acquisition, the title to Brookfield Place Calgary West ("BPCW") was also transferred to the Trust because the development site is currently under one legal title. However, the acquisition agreements provide that all economic benefits and obligations of BPCW remain with BOPI. BOPI has also agreed to indemnify the Trust for all current liabilities, future costs and obligations in respect of BPCW. As part of the transaction, the Trust entered into a separate agreement to sell BPCW back to BOPI upon the City of Calgary approving the severance of the east and west parcels, which is anticipated to occur by the end of 2016. Accordingly, the Trust has not reflected the value of the BPCW site and related debt of the same amount in the financial statements.
On November 30, 2015, Bay Adelaide East was transferred into commercial property upon substantial completion with its first lease commencing in December 2015.
During the year ended December 31, 2015, the Trust capitalized a total of $300.9 million (compared to $193.2 million in 2014) of costs related to commercial developments. Included in this amount during the year ended December 31, 2015, is $12.7 million (compared to $6.3 million in 2014) of property taxes and other related costs and $27.0 million (compared to $13.6 million in 2014) of capitalized borrowing costs. The weighted average capitalization rate used for capitalization of borrowing costs on commercial developments was 3.9%. Included in construction and related costs for the year ended December 31, 2015, are amounts paid to a subsidiary of Brookfield Asset Management Inc. (“BAM”), the ultimate parent of BOPI, of $83.3 million (compared to $151.9 million in 2014) pursuant to a contract to construct Bay Adelaide East.
NOTE 5: INVESTMENT PROPERTY DISPOSITIONS AND HELD FOR SALE
During the year, the Trust completed the sale of its 100% interest in HSBC Building and 25% interest in 151 Yonge St. The Trust generated net proceeds of $105.7 million. During the fourth quarter of 2014, the Trust reclassified its 25% interest in 151 Yonge St. in Toronto to assets held for sale for $38.8 million. The related receivables and liabilities were $0.1 million and $0.5 million, respectively.
| (Millions) | | HSBC Building | | | 151 Yonge St. | | | Total | |
| Sale proceeds | | $ | 110 | | | $ | 38.5 | | | $ | 148.5 | |
| Selling costs | | | (1.2 | ) | | | (0.1 | ) | | | (1.3 | ) |
| Investment property disposition | | | 108.8 | | | | 38.4 | | | | 147.2 | |
| Assumption of mortgage by purchaser | | | (41.5 | ) | | | — | | | | (41.5 | ) |
| Net sale proceeds | | $ | 67.3 | | | $ | 38.4 | | | $ | 105.7 | |
During the fourth quarter, the Trust commenced marketing of the sale of its 100% interest in Royal Centre in Vancouver. Subsequently, the Trust entered into an agreement to sell the property, which is anticipated to close during the first quarter of 2016.
| Brookfield Canada Office Properties | 45 |
NOTE 6: INVESTMENT IN JOINTLY CONTROLLED OPERATIONS
The Trust undertakes its activities under jointly controlled operations through direct interests in assets, rather than through the establishment of a separate entity. The Trust’s interests in the following properties are classified as joint operations and, accordingly, the Trust has recognized its share of the related assets, liabilities, revenues and expenses for the following properties:
| | | | | Principal place of business/ | | Ownership interest and voting rights | |
| Jointly controlled assets | | Nature | | Incorporation | | Dec. 31, 2015 | | | Dec. 31, 2014 | |
| Exchange Tower | | Commercial office property | | Toronto, Ontario | | | 50 | % | | | 50 | % |
| Fifth Avenue Place | | Commercial office property | | Calgary, Alberta | | | 50 | % | | | 50 | % |
| Bankers Hall | | Commercial office property | | Calgary, Alberta | | | 50 | % | | | 50 | % |
| Bankers Court | | Commercial office property | | Calgary, Alberta/Toronto, Ontario | | | 50 | % | | | 50 | % |
| Suncor Energy Centre | | Commercial office property | | Calgary, Alberta | | | 50 | % | | | 50 | % |
| Brookfield Place Retail | | Commercial office property | | Toronto, Ontario | | | 50 | % | | | 50 | % |
| Brookfield Place Parking | | Commercial office property | | Toronto, Ontario | | | 56 | % | | | 56 | % |
| First Canadian Place | | Commercial office property | | Toronto, Ontario | | | 25 | % | | | 25 | % |
| 2 Queen St. East | | Commercial office property | | Toronto, Ontario | | | 25 | % | | | 25 | % |
| Place de Ville I | | Commercial office property | | Toronto, Ontario | | | 25 | % | | | 25 | % |
| Place de Ville II | | Commercial office property | | Toronto, Ontario | | | 25 | % | | | 25 | % |
| Jean Edmonds Towers | | Commercial office property | | Toronto, Ontario | | | 25 | % | | | 25 | % |
| (1) | First Canadian Place is subject to a land lease with respect to 50% of the land on which the property is situated. The land lease will expire on December 1, 2023 subject to an extension under certain circumstances. At the expiry of the land lease, the other land owner will have the option to acquire, for a nominal amount, an undivided 50% beneficial interest in the office tower. |
NOTE 7: TENANT AND OTHER RECEIVABLES
As of December 31, 2015, $0.2 million of the Trust’s balance of accounts receivable is over 90 days past due (compared to $0.7 million at December 31, 2014).
The Trust’s maximum exposure to credit risk associated with tenant and other receivables is equivalent to its carrying value. Credit risk related to tenant receivables arises from the possibility that tenants may be unable to fulfill their lease commitments. The Trust manages this risk by attempting to ensure that its tenant mix is diversified and by limiting its exposure to any one tenant. The Trust maintains a portfolio that is diversified by industry type so that exposure to a particular sector is lessened. Currently no one tenant represents more than 7.4% of commercial property revenue. This risk is further managed by attempting to sign long-term leases with tenants who have investment grade credit ratings.
NOTE 8: OTHER ASSETS
At December 31, 2015, the Trust’s balance of other assets is comprised of prepaid expenses and other assets of $7.3 million (compared to $8.9 million at December 31, 2014).
NOTE 9: CASH AND CASH EQUIVALENTS
At December 31, 2015, the Trust had $nil of cash placed in term deposits, which is consistent with the amount at December 31, 2014. For the year ended December 31, 2015, interest income of $nil was recorded on cash and cash equivalents (compared to $1.1 million in 2014).
NOTE 10: INVESTMENT PROPERTY AND CORPORATE DEBT
| | | Dec. 31, 2015 | | | Dec. 31, 2014 | |
| | | Weighted | | | | | | Weighted | | | | |
| (Millions) | | Average Rate | | | Debt Balance | | | Average Rate | | | Debt Balance | |
| Investment property debt – fixed rate | | | 4.27 | % | | $ | 2,024.1 | | | | 4.17 | % | | $ | 2,303.7 | |
| Investment property and corporate debt – floating rate | | | 2.49 | % | | | 814.4 | | | | 2.93 | % | | | 346.0 | |
| Total investment property and corporate debt | | | 3.76 | % | | $ | 2,838.5 | | | | 4.01 | % | | $ | 2,649.7 | |
| | | | | | | | | | | | | | | | | |
| Current | | | | | | $ | 278.4 | | | | | | | $ | 281.3 | |
| Non-current | | | | | | | 2,560.1 | | | | | | | | 2,368.4 | |
| Total debt | | | | | | $ | 2,838.5 | | | | | | | $ | 2,649.7 | |
The Trust’s secured investment property and corporate debt is non-recourse to the Trust with the exception of $97.3 million at December 31, 2015 (compared to $98.5 million at December 31, 2014) which has limited recourse to the Trust and guarantees as discussed in Note 15(d).
Investment property and corporate debt maturities for the next five years and thereafter are as follows:
| | | | | | | | | | | | Weighted-Average | |
| | | Scheduled | | | | | | | | | Interest Rate (%) at | |
| (Millions, except interest data) | | Amortization(1) | | | Maturities | | | Total(1) | | | Dec. 31, 2015 | |
| 2016 | | $ | 43.3 | | | $ | 235.1 | | | $ | 278.4 | | | | 2.29 | % |
| 2017 | | | 46.6 | | | | 415.3 | | | | 461.9 | | | | 2.90 | % |
| 2018 | | | 49.4 | | | | — | | | | 49.4 | | | | — | % |
| 2019 | | | 51.7 | | | | — | | | | 51.7 | | | | — | % |
| 2020 | | | 41.3 | | | | 693.3 | | | | 734.6 | | | | 3.16 | % |
| 2021 and thereafter | | | 193.1 | | | | 1,069.4 | | | | 1,262.5 | | | | 4.56 | % |
| Total | | $ | 425.4 | | | $ | 2,413.1 | | | $ | 2,838.5 | | | | 3.76 | % |
For the year ended December 31, 2015, interest of $84.3 million (compared to $91.9 million in 2014) was expensed relating to investment property and corporate debt.
Approximately 28.7% of the Trust's outstanding investment property and corporate debt at December 31, 2015 is floating-rate debt (December 31, 2014 – 13.1%). The effect of a 100-basis point increase in interest rates on interest expense relating to our floating-rate debt, all else being equal, is an increase in interest expense of $8.1 million on an annual basis. In addition there is interest rate risk associated with the Trust’s fixed rate debt due to the expected requirement to refinance such debt in the year of maturity. There is no fixed rate debt maturing within one year.
The fair value of investment property and corporate debt is determined by discounting contractual principal and interest payments at estimated current market interest rates for the instrument. Current market interest rates are determined with reference to current benchmark rates for a similar term and current credit spreads for debt with similar terms and risks. As of December 31, 2015, the fair value of investment property and corporate debt exceeds the principal loan value of these obligations by $160.3 million (compared to an excess of $114.3 million at December 31, 2014).
Interest rate risk arises when the fair value or future cash flows of commercial property and corporate debt fluctuate because of changes in market interest rates. Financing risk arises when lenders will not refinance maturing debt on terms and conditions acceptable to the Trust, or on any terms at all. The Trust attempts to stagger the maturities of its borrowings, as well as obtain fixed-rate debt as the means of managing interest rate risk. The Trust has an ongoing need to access debt markets to refinance maturing debt as it comes due. The Trust’s strategy to stagger its borrowing maturities attempts to mitigate the Trust’s exposure to excessive amounts of debt maturing in any one year.
The details of the financing transactions completed during 2015 are as follows.
| | | | | | | | | New | | | Net Proceeds | | | Interest | | | | | | |
| (Millions) | | | | | | | | Proceeds(1) | | | Generated(1) | | | Rate (%) | | | Mortgage Detail | | Maturity | |
| Hudson's Bay Centre | | | Q2 | | | | Extension | | | $ | — | | | $ | — | | | | BA + 140 bps | | | Limited recourse | | | May 2016 | |
| Royal Centre | | | Q2 | | | | Extension | | | | — | | | | — | | | | BA + 150 bps | | | Non-recourse | | | June 2016 | |
| Place de Ville I | | | Q2 | | | | New | | | | 21.0 | | | | 21.0 | | | | 3.752 | % | | Non-recourse | | | June 2025 | |
| Place de Ville II | | | Q2 | | | | New | | | | 22.8 | | | | 22.8 | | | | 3.752 | % | | Non-recourse | | | June 2025 | |
| (1) | Excludes financing costs. |
During the second quarter of 2015, the Trust upsized its revolving corporate credit facility by $70.0 million to $350.0 million.
During the third quarter of 2015, the Trust extended its revolving corporate credit facility for an additional two years under the existing financial terms, maturing August 29, 2020. As of December 31, 2015, $194.0 million was drawn on the revolving corporate credit facility.
NOTE 11: ACCOUNTS PAYABLE AND OTHER LIABILITIES
The components of the Trust’s accounts payable and other liabilities are as follows:
| (Millions) | | Dec. 31, 2015 | | | Dec. 31, 2014 | |
| Accounts payable and accrued liabilities | | $ | 165.9 | | | $ | 177.0 | |
| Accrued interest | | | 19.1 | | | | 19.9 | |
| Total | | $ | 185.0 | | | $ | 196.9 | |
| Brookfield Canada Office Properties | 47 |
NOTE 12: DISTRIBUTIONS
The following tables present distributions declared for the years ended December 31, 2015 and December 31, 2014:
| | | 2015 | |
| (Millions, except per unit amounts) | | Trust Units | | | Class B LP Units | |
| Paid in cash or DRIP | | $ | 29.6 | | | $ | 76.3 | |
| Payable as of December 31, 2015 | | | 2.7 | | | | 6.9 | |
| Total | | $ | 32.3 | | | $ | 83.2 | |
| Per unit | | $ | 1.24 | | | $ | 1.24 | |
| | | 2014 | |
| (Millions, except per unit amounts) | | Trust Units | | | Class B LP Units | |
| Paid in cash or DRIP | | $ | 29.1 | | | $ | 74.7 | |
| Payable as of December 31, 2014 | | | 2.7 | | | | 6.9 | |
| Total | | $ | 31.8 | | | $ | 81.6 | |
| Per unit | | $ | 1.21 | | | $ | 1.21 | |
The Trust has implemented a distribution reinvestment plan (“DRIP”), which allows certain Canadian resident unitholders to elect to have their distributions reinvested in additional Trust Units. No brokerage commissions or service charges are payable in connection with the purchase of Trust Units under the DRIP and the Trust will pay all administrative costs. The automatic reinvestment of distributions under the DRIP does not relieve holders of Trust Units of any income tax applicable to such distributions. For the year ended December 31, 2015, $1,859,505 (dollars) or 69,214 Trust Units were issued through the DRIP, compared to $1,359,047 (dollars), or 50,348 Trust Units during the same period in 2014.
NOTE 13: EQUITY
The components of equity are as follows:
| (Millions) | | Dec. 31, 2015 | | | Dec. 31, 2014 | |
| Trust Units | | $ | 554.4 | | | $ | 553.4 | |
| Contributed surplus | | | 2.9 | | | | 3.1 | |
| Retained earnings | | | 366.5 | | | | 300.2 | |
| Unitholders’ equity | | | 923.8 | | | | 856.7 | |
| Non-controlling interest | | | 2,409.2 | | | | 2,239.6 | |
| Total | | $ | 3,333.0 | | | $ | 3,096.3 | |
Authorized Capital and Outstanding Securities
The Trust is authorized to issue an unlimited number of two classes of units: Trust Units and Special Voting Units. Special Voting Units are only issued in tandem with the issuance of Class B LP Units. As of December 31, 2015, the Trust had a total of 26,250,344 Trust Units outstanding and 67,088,022 Class B LP Units outstanding (and a corresponding number of Special Voting Units).
The following tables summarize the changes in the units outstanding during the year ended December 31, 2015 and December 31, 2014:
| | | 2015 | |
| | | Trust Units | | | Class B LP Units | |
| Units issued and outstanding at beginning of year | | | 26,218,183 | | | | 67,088,022 | |
| Units repurchased | | | (37,053 | ) | | | — | |
| Units issued pursuant to DRIP | | | 69,214 | | | | — | |
| Total units outstanding at December 31, 2015 | | | 26,250,344 | | | | 67,088,022 | |
| | | 2014 | |
| | | Trust Units | | | Class B LP Units | |
| Units issued and outstanding at beginning of year | | | 26,167,835 | | | | 67,088,022 | |
| Units issued pursuant to DRIP | | | 50,348 | | | | — | |
| Total units outstanding at December 31, 2014 | | | 26,218,183 | | | | 67,088,022 | |
For the year ended December 31, 2015, the weighted average number of Trust Units outstanding was 26,246,958 (compared to 26,191,933 at December 31, 2014).
In November 2015, the Trust renewed its normal course issuer bid for its Trust Units for a further one-year period. During the twelve-month period commencing November 12, 2015, and ending November 11, 2016, the Trust may purchase on the Toronto Stock Exchange ("TSX"), the New York Stock Exchange and any alternative Canadian trading system up to 1,566,602 Trust Units, representing approximately 10% of its public float. During the year, the Trust purchased 37,053 Trust Units through open market purchases. The weighted average price that the Trust paid per Trust Units acquired under this bid was $25.94.
Trust Units
Each Trust Unit is transferable and represents an equal, undivided, beneficial interest in BOX and in any distributions, whether of net income, net realized capital gains, or other amounts, and in the event of the termination or winding-up of the Trust, in the Trust’s net assets remaining after satisfaction of all liabilities. All Trust Units rank among themselves equally and ratably without discrimination, preference, or priority. Each Trust Unit entitles the holder thereof to one vote at all meetings of unitholders or with respect to any written resolution of unitholders. The Trust Units have no conversion, retraction, or redemption rights.
Special Voting Units
Special Voting Units are only issued in tandem with Class B LP Units of BOPC LP and are not transferable separately from the Class B LP Units to which they relate and upon any transfer of Class B LP Units, such Special Voting Units will automatically be transferred to the transferee of the Class B LP Units. As Class B LP Units are exchanged for Trust Units or purchased for cancellation, the corresponding Special Voting Units will be cancelled for no consideration.
Each Special Voting Unit entitles the holder thereof to one vote at all meetings of unitholders or with respect to any resolution in writing of unitholders. Except for the right to attend and vote at meetings of the unitholders or with respect to written resolutions of the unitholders, Special Voting Units do not confer upon the holders thereof any other rights. A Special Voting Unit does not entitle its holder to any economic interest in BOX, or to any interest or share in BOX, or to any interest in any distributions (whether of net income, net realized capital gains, or other amounts), or to any interest in any net assets in the event of termination or winding-up.
Non-Controlling interest
The Trust classifies the outstanding Class B LP Units as non-controlling interest for financial statement purposes in accordance with IFRS. The Class B LP Units are exchangeable on a one-for-one basis (subject to customary anti-dilution provisions) for Trust Units at the option of the holder. Each Class B LP Unit is accompanied by a Special Voting Unit that entitles the holder thereof to receive notice of, to attend, and to vote at all meetings of unitholders of BOX. The holders of Class B LP Units are entitled to receive distributions when declared by BOPC LP equal to the per-unit amount of distributions payable to each holder of Trust Units. However, the Class B LP Units have limited voting rights over BOPC LP.
BOPC LP is a subsidiary of BOX, which owns 100% of the issued and outstanding Class A LP Units of BOPC LP. Summarized financial information for BOPC LP has not been disclosed as all the investment properties are held in BOPC LP and as such BOPC LP is substantially the same as BOX.
NOTE 14: REVENUE AND EXPENSES
(a) Commercial property revenue
The components of revenue are as follows:
| (Millions) | | 2015 | | | 2014 | |
| Rental revenue | | $ | 513.5 | | | $ | 507.9 | |
| Non-cash rental revenue (expense) | | | 1.1 | | | | (1.4 | ) |
| Lease termination and other income | | | 2.3 | | | | 10.7 | |
| Commercial property revenue | | $ | 516.9 | | | $ | 517.2 | |
The Trust generally leases investment properties under operating leases with lease terms between five and 10 years, with options to extend up to five additional years.
Future minimum rental commitments on non-cancellable tenant operating leases are as follows:
| (Millions) | | 2015 | | | 2014 | |
| Not later than 1 year | | $ | 262.6 | | | $ | 252.1 | |
| Later than 1 year and not longer than 5 years | | | 1,111.7 | | | | 973.5 | |
| Later than 5 years | | | 2,024.0 | | | | 2,165.3 | |
| | | $ | 3,398.3 | | | $ | 3,390.9 | |
| Brookfield Canada Office Properties | 49 |
The following represents an analysis of the nature of the expense included in direct commercial property expense, interest expense, and general and administrative expense:
| (Millions) | | 2015 | | | 2014 | |
| Employee benefits(1) | | $ | 19.2 | | | $ | 18.6 | |
| Interest expense | | | 84.3 | | | | 91.9 | |
| Property maintenance | | | 124.1 | | | | 124.0 | |
| Real estate taxes | | | 107.5 | | | | 98.0 | |
| Ground rents | | | 16.6 | | | | 8.5 | |
| Asset management fees and other | | | 21.3 | | | | 22.4 | |
| Total expenses | | $ | 373.0 | | | $ | 363.4 | |
| 1) | Includes $18.5 million paid to a subsidiary of BAM for payroll services during 2015 (2014 - $17.9 million) |
Operating expenses include ground rent expenses for the year ended December 31, 2015, of $16.6 million (compared to $8.5 million in 2014) representing rent expense associated with operating leases for land on which certain of the Trust's investment properties are situated. These leases have remaining terms of between eight and 99 years. The Trust does not have an option to purchase the leased land at the expiry of the lease periods.
Future minimum lease payments under these arrangements are as follows:
| (Millions) | | 2015 | | | 2014 | |
| Not later than 1 year | | $ | 7.4 | | | $ | 7.1 | |
| Later than 1 year and not longer than 5 years | | | 29.8 | | | | 28.6 | |
| Later than 5 years | | | 449.7 | | | | 450.1 | |
| | | $ | 486.9 | | | $ | 485.8 | |
| (c) | Investment and other income |
Investment and other income was $nil for the year ended December 31, 2015 (compared to $1.1 million in 2014). The prior year amounts primarily include interest earned on cash balances and cash settlements on legal matters.
NOTE 15: GUARANTEES, CONTINGENCIES, AND OTHER
(a) In the normal course of operations, the Trust and its consolidated subsidiaries execute agreements that provide for indemnification and guarantees to third parties in transactions such as business dispositions, business acquisitions, lease-up of development properties, sales of assets, and sales of services.
(b) As of December 31, 2015, the Trust had commitments totaling $274.2 million for Brookfield Place Calgary East development costs to third parties and $43.4 million for Bay Adelaide East construction payment holdbacks and remaining construction costs, of which $37.4 million were with third parties.
(c) As of December 31, 2015, the Trust has guaranteed up to $350.0 million related to its revolving corporate credit facility, up to $50.0 million related to the construction loan on Bay Adelaide East and up to $80.0 million related to the construction loan on Brookfield Place Calgary East. As of December 31, 2015, the Trust has issued letters of credit of $0.9 million related to its revolving corporate credit facility.
(d) The Trust maintains insurance on its commercial properties in amounts and with deductibles that the Trust believes are in line with what owners of similar properties carry. The Trust maintains all risk property insurance and rental value coverage (including coverage for the perils of flood, earthquake and windstorm). The Trust’s all risk policy limit is $1.5 billion per occurrence. The Trust’s earthquake limit is $500 million per occurrence and in the annual aggregate. This coverage is subject to a $100,000 (dollars) deductible for all locations except for British Columbia where the deductible is 3% of the values for all locations where the physical loss, damage or destruction occurred subject to a minimum $250,000 (dollars) deductible. The flood limit is $500 million per occurrence and in the annual aggregate, and is subject to a deductible of $25,000 (dollars) for all losses arising from the same occurrence. Windstorm is included under the all risk coverage limit of $1.5 billion. With respect to its commercial properties, the Trust purchases an insurance policy that covers acts of terrorism for limits up to $1.5 billion.
NOTE 16: SEGMENTED INFORMATION
The Trust has only one business segment: the ownership and operation of investment properties in Canada. The Trust identifies each investment property as an individual segment and has aggregated them into a single segment based on similarity in the nature of the product, tenants and operational processes.
NOTE 17: RELATED-PARTY TRANSACTIONS
In the normal course of operations, the Trust enters into various transactions with related parties that have been measured at exchange value and are recognized in the consolidated financial statements.
The Trust has entered into two service-support agreements with Brookfield Office Properties Management LP (“BOPM LP”), a subsidiary of BOPI, for the provision of property management, leasing, construction, and asset management services. The purpose of the agreements is to provide the services of certain personnel and consultants as are necessary to help the Trust operate and manage its assets and tenant base; it also includes a cost-recovery for administrative and regulatory compliance services provided. The fees paid to BOPM LP are calculated in accordance with the terms of the agreements. Included in direct commercial property expense during the year ended December 31, 2015, are amounts paid to BOPM LP for property management services of $13.7 million (compared to $14.1 million in 2014). Included in investment properties during the year ended December 31, 2015, are amounts paid to BOPM LP for leasing and construction services of $8.3 million (compared to $3.2 million in 2014). Included in general and administrative expenses during the year ended December 31, 2015, are amounts paid to BOPM LP for asset management and administrative and regulatory compliance services of $19.5 million (compared to $19.0 million in 2014).
Included in fair value gains (losses) is $1.2 million paid to a subsidiary of BAM for services provided for the dispositions of 151 Yonge St. and HSBC Building during the year ended December 31, 2015.
The Trust entered into a long-term lease with BOPI at Bay Adelaide East and total rent received was $2.6 million for the year ended December 31, 2015.
Included in rental revenues during the year ended December 31, 2015, are amounts received from BAM and its affiliates of $9.8 million (compared to $6.9 million in 2014).
Refer to Note 4, Investment Properties, for information on the acquisition of the Bay Adelaide East and Brookfield Place Calgary East developments from BOPI as well as details of construction and related costs paid to a subsidiary of BAM pursuant to a contract to construct Bay Adelaide East.
Compensation of Independent Trustees
The remuneration of independent trustees during the year ended December 31, 2015 and 2014 was as follows:
| (Millions) | | 2015 | | | 2014 | |
| Cash compensation | | $ | 0.4 | | | $ | 0.3 | |
| Unit-based awards | | | 0.3 | | | | 0.3 | |
| | | $ | 0.7 | | | $ | 0.6 | |
The remuneration of independent trustees is determined by the Trust's Governance and Nominating Committee having regard to the complexity of the Trust's operations, the risks and responsibilities involved in being a trustee of the Trust, the requirement to participate in scheduled and special board meetings, expected participation on the board's standing committees and compensation paid to trustees of comparable entities.
NOTE 18: CAPITAL MANAGEMENT AND LIQUIDITY
The Trust employs a broad range of financing strategies to facilitate growth and manage financial risk.
The Trust continually strives to reduce its weighted-average cost of capital and improve unitholders’ equity returns through value-enhancement initiatives and the consistent monitoring of the balance between debt and equity financing. As of December 31, 2015, the weighted-average cost of capital, assuming a long-term 9.0% return on equity, was 6.2% (compared to 6.4% in 2014).
The following schedule details the capitalization of the Trust and the related costs thereof:
| | | Cost of Capital(1) | | | Underlying Value(2) | |
| (Millions, except cost of capital data) | | Dec. 31, 2015 | | | Dec. 31, 2014 | | | Dec. 31, 2015 | | | Dec. 31, 2014 | |
| Liabilities | | | | | | | | | | | | | | | | |
| Investment property and corporate debt | | | 3.8 | % | | | 4.0 | % | | $ | 2,838.5 | | | $ | 2,649.7 | |
| Unitholders’ equity | | | | | | | | | | | | | | | | |
| Trust Units(3) | | | 9.0 | % | | | 9.0 | % | | | 682.8 | | | | 706.4 | |
| Other equity | | | | | | | | | | | | | | | | |
| Non-controlling interest(3) | | | 9.0 | % | | | 9.0 | % | | | 1,748.6 | | | | 1,809.0 | |
| Total | | | 6.2 | % | | | 6.4 | % | | $ | 5,269.9 | | | $ | 5,165.1 | |
| (1) | Total weighted-average cost of capital is calculated on the weighted average of underlying value. |
| (2) | Underlying value of liabilities presents the cost to retire debt on maturity. Underlying value of unitholders’ equity and other equity is based on the closing unit price of BOX on the TSX. |
| (3) | Assumes a long-term 9.0% return on equity for December 31, 2015 and December 31, 2014. |
| Brookfield Canada Office Properties | 51 |
Investment property and corporate debt
The Trust’s investment property and corporate debt is primarily fixed-rate and non-recourse to the Trust, thereby reducing the overall financial risk to the Trust. These financings are typically structured on a loan-to-appraised value basis of between 50% and 65% when the market permits. In addition, in certain circumstances where a building is leased almost exclusively to a high-credit quality tenant, a higher loan-to-value financing, based on the tenant’s credit quality, is put in place at rates commensurate with the cost of funds for the tenant. This reduces equity requirements to finance investment property and enhances equity returns.
The Trust is subject to certain covenants on its borrowings, including debt service coverage and loan-to-value thresholds. As of December 31, 2015, the Trust was in compliance with all of its covenants.
The Trust’s strategy is to satisfy its liquidity needs using cash on hand, cash flows generated from operating activities, and cash provided by financing activities. Rental revenue, recoveries from tenants, interest and other income, available cash balances, draws on credit facilities, and refinancings, including upward refinancings, of maturing indebtedness are the Trust’s principal sources of capital used to pay operating expenses, distributions, debt service, and recurring capital and leasing costs in its investment property portfolio.
The principal liquidity needs for periods beyond the next year are for unit distributions, scheduled debt maturities, recurring and non-recurring capital expenditures, and development costs. The Trust’s strategy is to meet these needs with one or more of the following:
| • | cash flow from operations; |
| • | credit facilities and refinancing opportunities; and |
| • | divestiture of investment properties. |
The Trust attempts to match the maturity of its commercial property and corporate debt portfolio with the average lease terms of its properties. At December 31, 2015, the average term to maturity of the Trust’s investment property and corporate debt portfolio was seven years and the Trust’s average lease term of its properties was approximately eight years. The Trust will continue to make efforts to match the maturity of the investment property and corporate debt portfolio with the average lease term of its properties.
The following table presents the contractual maturities of the Trust’s financial liabilities:
| | | Payments Due By Period | |
| (Millions) | | Total | | | 1 year | | | 2 – 3 years | | | 4 – 5 Years | | | After 5 Years | |
| Investment property and corporate debt(1) | | $ | 3,439.5 | | | $ | 367.2 | | | $ | 679.5 | | | $ | 935.7 | | | $ | 1,457.1 | |
| Accounts payable and other liabilities | | | 185.0 | | | | 185.0 | | | | — | | | | — | | | | — | |
(1) Includes repayment of principal and interest.
NOTE 19: OTHER INFORMATION
Supplemental cash flow information:
| | | 2015 | | | 2014 | |
| (Millions) | | Trust Units | | | Class B LP Units | | | Trust Units | | | Class B LP Units | |
| Distributions declared to unitholders | | $ | 32.3 | | | $ | 83.2 | | | $ | 31.8 | | | $ | 81.6 | |
| Add: Distributions payable at the beginning of the year | | | 2.7 | | | | 6.9 | | | | 2.6 | | | | 6.5 | |
| Less: Distributions payable at the end of the year | | | (2.7 | ) | | | (6.9 | ) | | | (2.7 | ) | | | (6.9 | ) |
| Less: Distributions to participants in DRIP | | | (1.8 | ) | | | — | | | | (1.3 | ) | | | — | |
| Cash distributions paid | | $ | 30.5 | | | $ | 83.2 | | | $ | 30.4 | | | $ | 81.2 | |
NOTE 20: SUBSEQUENT EVENTS
On February 18, 2016, the Ontario Ministry of Finance published amendments to regulation 70/91 to the Land Transfer Act (Ontario) that may impact the transfers of partnership interests in prior fiscal years. The Trust is currently evaluating the impact of the amendments to its consolidated financial statements.
NOTE 21: APPROVAL OF ANNUAL FINANCIAL STATEMENTS
The annual financial statements were approved by the Trust’s Board of Trustees and authorized for issue on January 25, 2016.
Unitholder Information
DISTRIBUTION PAYMENT DATES
| | | 2016 | | | 2015 | | | 2014 | |
| | | | | | | | | | |
| (Dollars) | | Trust Units | | | Class B LP Units | | | Trust Units | | | Class B LP Units | | | Trust Units | | | Class B LP Units | |
| January 15 | | $ | 0.1033 | | | $ | 0.1033 | | | $ | 0.1033 | | | $ | 0.1033 | | | $ | 0.0975 | | | $ | 0.0975 | |
| February 15 | | | 0.1033 | | | | 0.1033 | | | | 0.1033 | | | | 0.1033 | | | | 0.0975 | | | | 0.0975 | |
| March 15 | | | 0.1033 | | | | 0.1033 | | | | 0.1033 | | | | 0.1033 | | | | 0.0975 | | | | 0.0975 | |
| April 15 | | | | | | | | | | | 0.1033 | | | | 0.1033 | | | | 0.0975 | | | | 0.0975 | |
| May 15 | | | | | | | | | | | 0.1033 | | | | 0.1033 | | | | 0.0975 | | | | 0.0975 | |
| June 15 | | | | | | | | | | | 0.1033 | | | | 0.1033 | | | | 0.1033 | | | | 0.1033 | |
| July 15 | | | | | | | | | | | 0.1033 | | | | 0.1033 | | | | 0.1033 | | | | 0.1033 | |
| August 15 | | | | | | | | | | | 0.1033 | | | | 0.1033 | | | | 0.1033 | | | | 0.1033 | |
| September 15 | | | | | | | | | | | 0.1033 | | | | 0.1033 | | | | 0.1033 | | | | 0.1033 | |
| October 15 | | | | | | | | | | | 0.1033 | | | | 0.1033 | | | | 0.1033 | | | | 0.1033 | |
| November 15 | | | | | | | | | | | 0.1033 | | | | 0.1033 | | | | 0.1033 | | | | 0.1033 | |
| December 15 | | | | | | | | | | | 0.1033 | | | | 0.1033 | | | | 0.1033 | | | | 0.1033 | |
| Brookfield Canada Office Properties | 53 |
Selected Financial and Operational Information
| December 31 (Millions, except per-unit and operating information) | | 2015 | | | 2014 | | | 2013 | |
| Financial results | | | | | | | | | | | | |
| Commercial property net operating income | | $ | 251.3 | | | $ | 269.3 | | | $ | 271.9 | |
| Funds from operations | | | 145.8 | | | | 158.2 | | | | 144.7 | |
| Adjusted funds from operations | | | 94.6 | | | | 121.5 | | | | 110.1 | |
| Distributions | | | 115.5 | | | | 113.4 | | | | 109.1 | |
| Net income | | | 351.4 | | | | 116.1 | | | | 164.8 | |
| Total assets | | | 6,356.5 | | | | 5,943.4 | | | | 5,608.8 | |
| Unitholders’ equity | | | 923.8 | | | | 856.7 | | | | 854.7 | |
| | | | | | | | | | | | | |
| Per Trust unit | | | | | | | | | | | | |
| Trust Units outstanding | | | 26,250,344 | | | | 26,218,183 | | | | 26,167,835 | |
| Class B LP Units outstanding | | | 67,088,022 | | | | 67,088,022 | | | | 67,088,022 | |
| Funds from operations | | | 1.56 | | | | 1.70 | | | | 1.55 | |
| Adjusted funds from operations | | | 1.01 | | | | 1.30 | | | | 1.18 | |
| Distributions | | | 1.24 | | | | 1.21 | | | | 1.17 | |
| Unitholders value | | | 35.72 | | | | 33.19 | | | | 33.18 | |
| | | | | | | | | | | | | |
| Operating data | | | | | | | | | | | | |
| Number of commercial properties | | | 27 | | | | 27 | | | | 28 | |
| Total area (000’s of sq. ft.) | | | 21,134 | | | | 20,403 | | | | 20,821 | |
| Owned interest (000’s of sq. ft.) | | | 12,436 | | | | 11,688 | | | | 11,796 | |
| Average occupancy (%)(1) | | | 95.8 | | | | 95.4 | | | | 96.0 | |
(1)95.8% occupancy includes BOPI headlease at Bay Adelaide East.
| Board of Trustees | Officers |
| | |
| Thomas F. Farley | T. Jan Sucharda |
| Chairman of the Board | President and Chief Executive Officer |
| | |
| T. Jan Sucharda | Bryan K. Davis |
| President and Chief Executive Officer | Chief Financial Officer |
| Brookfield Canada Office Properties | |
| | Ian Parker |
| Mark Brown | Chief Operating Officer |
| Global Chief Investment Officer | |
| Brookfield Office Properties Inc. | Deborah R. Rogers |
| | Senior Vice President, Legal Counsel and Secretary |
| Paul D. McFarlane | |
| Corporate Director | Ryk Stryland |
| | Senior Vice President, Development |
| Colum Bastable | |
| Chairman, Cushman & Wakefield Ltd. | T. Nga Gilgan |
| | Senior Vice President, Investments |
| Roderick D. Fraser, Ph.D., O.C. | |
| Officer, Order of Canada | Matthew Cherry |
| | Vice President, Investor Relations and Communications |
| Susan Riddell Rose | |
| President, Perpetual Energy Inc. | Elliott S. Feintuch |
| | Vice President, Legal, Eastern |
| | |
| | Robert Kiddine |
| | Vice President, Legal Counsel, Western |
| | |
| | Amelia Nasrallah-Pumilia |
| | Vice President, Legal, Eastern |
| | |
| | Elizabeth Phalen |
| | Vice President, Legal, Eastern |
| | |
| | Keith Hyde |
| | Vice President, Taxation |
| | |
| | Michael Yam |
| | Vice President & Controller |
| | |
| | Michelle L. Campbell |
| | Assistant Secretary |
| Brookfield Canada Office Properties | 55 |
Information
PROFILE
Brookfield Canada Office Properties is a Canadian real estate investment trust, focusing on the ownership and value enhancement of premier office properties. The current property portfolio is comprised of interests in 27 premier office properties totaling 21.1 million square feet and 1 development property totaling 1.4 million square feet. Landmark properties include Brookfield Place Toronto and First Canadian Place in Toronto and Bankers Hall in Calgary.
BROOKFIELD CANADA OFFICE PROPERTIES
Brookfield Place, Bay Wellington Tower
181 Bay Street, Suite 330
Toronto, Ontario M5J 2T3
Tel: 416.359.8555
Fax: 416.359.8596
www.brookfieldcanadareit.com
UNITHOLDER INQUIRIES
Brookfield Canada Office Properties welcomes inquiries from unitholders, analysts, media representatives and other interested parties. Questions relating to investor relations or media inquiries can be directed to Sherif El-Azzazi, Manager Investor Relations and Communications at 416.359.8593 or via e-mail at sherif.elazzazi@brookfield.com. Inquiries regarding financial results should be directed to Bryan Davis, Chief Financial Officer at 416.359.8612 or via e-mail at bryan.davis@brookfield.com.
Unitholder questions relating to distributions, address changes and unit certificates should be directed to the Trust’s Transfer Agent:
CST TRUST COMPANY
P.O. Box 700
Station B
Montreal, Quebec H3B 3K3
Tel: 416.682.3860 / 800.387.0825
Fax: 888.249.6189
Website: www.canstockta.com
E-mail: inquiries@canstockta.com
COMMUNICATIONS
We strive to keep our unitholders updated on our progress through a comprehensive annual report, quarterly interim reports, periodic press releases and quarterly conference calls.
Brookfield Canada Office Properties maintains a Web site, www.brookfieldcanadareit.com, which provides access to our published reports, press releases, statutory filings, supplementary information and trust and distribution information as well as summary information on the Trust.