Exhibit 99.1

| FIRST QUARTER REPORT | MARCH 31, 2017 |
Dear Unitholders:
Net income for the three months ended March 31, 2017 was $59.4 million ($0.64 per unit), compared to net income of $11.0 million ($0.12 per unit) during the same period in 2016.
Revaluation gain for the three months ended March 31, 2017 was $20.3 million, compared to a revaluation loss of $27.6 million during the same period in 2016. The value per unit was $34.14 at the end of the first quarter, an increase over the $33.82 per unit reported at the end of 2016.
Trust funds from operations for the three months ended March 31, 2017 was $39.4 million ($0.42 per unit), compared to $39.0 million ($0.42 per unit) during the same period in 2016. Adjusted funds from operations for the three months ended March 31, 2017 was $31.1 million ($0.33 per unit), compared to $33.1 million ($0.35 per unit) during the same period in 2016.
Commercial property net operating income for the three months ended March 31, 2017 was $68.7 million, which was consistent with the same period in 2016. Same property commercial property net operating income for the three months ended March 31, 2017 was $68.3 million compared to $66.9 million during the same period in 2016.
FIRST QUARTER HIGHLIGHTS
Brookfield Canada Office Properties (the “Trust” or “BOX”) leased 195,000 square feet of space, at an average net rent of $34 per square foot compared to an average expiring net rent of $30 per square foot. The Trust’s occupancy rate finished the quarter at 94.7%, consistent with the prior quarter. This rate compares favourably with the Canadian national average of 88.3%.
Leasing highlights from the first quarter include:
| • | A 15-year, 57,000-square foot new lease with Harlequin Enterprises Limited at Bay Adelaide East |
| • | A seven-year, 34,000-square foot renewal with Public Works & Government Services Canada at Exchange Tower |
| • | A six-year, 21,000-square foot new lease with EventMobi at Queen's Quay Terminal |
Construction continues on schedule at Brookfield Place Calgary East. The pavilion and lobby finishes are well underway and commissioning and testing of base building systems has commenced. The project is currently 81% pre-leased to Cenovus and The Bank of Nova Scotia. Completion remains on target for late 2017.
DISTRIBUTION DECLARATION
The Board of Trustees of Brookfield Canada Office Properties announced a distribution of $0.1092 per Trust unit payable on June 15, 2017 to holders of Trust units of record at the close of business on May 31, 2017.
OUTLOOK
“The revaluation gain recognized in the first quarter of 2017 compared to a loss from a year ago speaks to the strength of the Toronto market,” said Jan Sucharda, president and chief executive officer. “In addition, our Brookfield Place Calgary East development project has entered its final stages and the tower remains on schedule for delivery in late 2017.”

Jan Sucharda
President and Chief Executive Officer
April 24, 2017
Portfolio by City
Brookfield Canada Office Properties’ portfolio is composed of interests in 26 premier office properties totaling 20.5 million square feet, including 3.7 million square feet of parking and other. Landmark properties include Brookfield Place Toronto, Bay Adelaide Centre, and First Canadian Place in Toronto and Bankers Hall in Calgary. Our development portfolio consists of 1.4 million square feet in the downtown core of Calgary.
| (Square feet in 000’s) | | Number of
Properties | | | Leased
% | | | Office | | | Retail | | | Leasable
Area | | | Parking
and Other | | | Total | | | Ownership
Interest % | | | Owned
Interest | |
| TORONTO | | | | | | | | | | | | | | | | | | | | | | | | | | | | | | | | | | | | |
| Brookfield Place Toronto | | | | | | | | | | | | | | | | | | | | | | | | | | | | | | | | | | | | |
| Bay Wellington Tower | | | 1 | | | | 89.8 | % | | | 1,297 | | | | 43 | | | | 1,340 | | | | 68 | | | | 1,408 | | | | 100 | % | | | 1,408 | |
| Retail & Parking(1) | | | 1 | | | | 100.0 | % | | | — | | | | 51 | | | | 51 | | | | 505 | | | | 556 | | | | 56 | % | | | 309 | |
| First Canadian Place | | | 1 | | | | 95.4 | % | | | 2,377 | | | | 225 | | | | 2,602 | | | | 218 | | | | 2,820 | | | | 25 | % | | | 705 | |
| Bay Adelaide West | | | 1 | | | | 96.2 | % | | | 1,156 | | | | 4 | | | | 1,160 | | | | 220 | | | | 1,380 | | | | 100 | % | | | 1,380 | |
| Bay Adelaide East(2) | | | 1 | | | | 95.0 | % | | | 1,014 | | | | 12 | | | | 1,026 | | | | 214 | | | | 1,240 | | | | 100 | % | | | 1,240 | |
| Bay Adelaide Retail | | | | | | | 91.8 | % | | | — | | | | 31 | | | | 31 | | | | 2 | | | | 33 | | | | 100 | % | | | 33 | |
| Exchange Tower | | | 1 | | | | 96.9 | % | | | 961 | | | | 66 | | | | 1,027 | | | | 205 | | | | 1,232 | | | | 50 | % | | | 616 | |
| Hudson's Bay Centre | | | 1 | | | | 97.0 | % | | | 532 | | | | 213 | | | | 745 | | | | 175 | | | | 920 | | | | 100 | % | | | 920 | |
| 2 Queen St. East | | | 1 | | | | 100.0 | % | | | 448 | | | | 16 | | | | 464 | | | | 71 | | | | 535 | | | | 25 | % | | | 134 | |
| Queen’s Quay Terminal | | | 1 | | | | 98.9 | % | | | 429 | | | | 52 | | | | 481 | | | | 27 | | | | 508 | | | | 100 | % | | | 508 | |
| 105 Adelaide St. West | | | 1 | | | | 100.0 | % | | | 177 | | | | 6 | | | | 183 | | | | 31 | | | | 214 | | | | 100 | % | | | 214 | |
| 22 Front St. West | | | 1 | | | | 100.0 | % | | | 136 | | | | 7 | | | | 143 | | | | 1 | | | | 144 | | | | 100 | % | | | 144 | |
| | | | 11 | | | | 95.5 | % | | | 8,527 | | | | 726 | | | | 9,253 | | | | 1,737 | | | | 10,990 | | | | | | | | 7,611 | |
| OTTAWA | | | | | | | | | | | | | | | | | | | | | | | | | | | | | | | | | | | | |
| Place de Ville I | | | 2 | | | | 89.9 | % | | | 571 | | | | 11 | | | | 582 | | | | 364 | | | | 946 | | | | 25 | % | | | 237 | |
| Place de Ville II | | | 2 | | | | 95.3 | % | | | 588 | | | | 7 | | | | 595 | | | | 331 | | | | 926 | | | | 25 | % | | | 232 | |
| Jean Edmonds Towers | | | 2 | | | | 100.0 | % | | | 544 | | | | 10 | | | | 554 | | | | 109 | | | | 663 | | | | 25 | % | | | 166 | |
| | | | 6 | | | | 95.0 | % | | | 1,703 | | | | 28 | | | | 1,731 | | | | 804 | | | | 2,535 | | | | | | | | 635 | |
| CALGARY | | | | | | | | | | | | | | | | | | | | | | | | | | | | | | | | | | | | |
| Bankers Hall | | | 3 | | | | 92.5 | % | | | 1,941 | | | | 222 | | | | 2,163 | | | | 481 | | | | 2,644 | | | | 50 | % | | | 1,322 | |
| Bankers Court | | | 1 | | | | 99.8 | % | | | 256 | | | | 7 | | | | 263 | | | | 70 | | | | 333 | | | | 50 | % | | | 167 | |
| Suncor Energy Centre | | | 2 | | | | 99.7 | % | | | 1,708 | | | | 24 | | | | 1,732 | | | | 349 | | | | 2,081 | | | | 50 | % | | | 1,041 | |
| Fifth Avenue Place | | | 2 | | | | 86.2 | % | | | 1,526 | | | | 54 | | | | 1,580 | | | | 294 | | | | 1,874 | | | | 50 | % | | | 937 | |
| | | | 8 | | | | 93.3 | % | | | 5,431 | | | | 307 | | | | 5,738 | | | | 1,194 | | | | 6,932 | | | | | | | | 3,467 | |
| OTHER | | | | | | | | | | | | | | | | | | | | | | | | | | | | | | | | | | | | |
| Merivale Place, Nepean | | | 1 | | | | 100.0 | % | | | — | | | | 3 | | | | 3 | | | | — | | | | 3 | | | | 100 | % | | | 3 | |
| TOTAL COMMERCIAL PROPERTIES | | | 26 | | | | 94.7 | % | | | 15,661 | | | | 1,064 | | | | 16,725 | | | | 3,735 | | | | 20,460 | | | | | | | | 11,716 | |
| | | | | | | | | | | | | | | | | | | | | | | | | | | | | | | | | | | | | |
| DEVELOPMENT | | | | | | | | | | | | | | | | | | | | | | | | | | | | | | | | | | | | |
| Brookfield Place Calgary East(3) | | | 1 | | | | 81.4 | % | | | 1,400 | | | | — | | | | 1,400 | | | | — | | | | 1,400 | | | | 100 | % | | | 1,400 | |
| | | | | | | | | | | | | | | | | | | | | | | | | | | | | | | | | | | | | |
| TOTAL PORTFOLIO | | | 27 | | | | | | | | 17,061 | | | | 1,064 | | | | 18,125 | | | | 3,735 | | | | 21,860 | | | | | | | | 13,116 | |
| (1) | Brookfield Canada Office Properties owns a 50% interest in the retail operations and is entitled to a 56% interest in the parking operations. |
| (2) | 95.0% occupancy includes Brookfield Office Properties Inc. headlease. Occupancy excluding Brookfield Office Properties Inc. headlease is 89.0%. Refer to Related-Party Transactions section on page 32 of the MD&A. |
| (3) | The development was acquired on an “as-if-completed-and-stabilized basis” as described on page 10 of the MD&A under Commercial Development. |
| Brookfield Canada Office Properties | 3 |
Contents
| MANAGEMENT’S DISCUSSION AND ANALYSIS OF FINANCIAL RESULTS | |
| | |
| PART I – OBJECTIVES AND FINANCIAL HIGHLIGHTS | 6 |
| | |
| PART II – FINANCIAL STATEMENT ANALYSIS | 14 |
| | |
| PART III – RISKS AND UNCERTAINTIES | 35 |
| | |
| PART IV – CRITICAL ACCOUNTING POLICIES AND ESTIMATES | 39 |
| | |
| CONDENSED CONSOLIDATED INTERIM FINANCIAL STATEMENTS | 41 |
| | |
| NOTES TO THE CONDENSED CONSOLIDATED INTERIM FINANCIAL STATEMENTS | 45 |
| | |
| UNITHOLDER INFORMATION | 53 |
FORWARD-LOOKING STATEMENTS
This interim report to unitholders, particularly the section entitled Management’s Discussion and Analysis of Financial Results, contains “forward-looking information” within the meaning of Canadian provincial securities laws and applicable regulations and “forward-looking statements” within the meaning of “safe harbor” provisions of the United States Private Securities Litigation Reform Act of 1995. Forward-looking statements include statements that are predictive in nature, depend upon or refer to future events or conditions, include statements regarding the Trust’s operations, business, financial condition, expected financial results, performance, prospects, opportunities, priorities, targets, goals, ongoing objectives, strategies and outlook, as well as the outlook for the Canadian economy for the current fiscal year and subsequent periods, and include words such as “expects”, “anticipates”, “plans”, “believes”, “estimates”, “seeks”, “intends”, “targets”, “projects”, “forecasts”, “likely”, or negative versions thereof and other similar expressions, or future or conditional verbs such as “may”, “will”, “should”, “would” and “could”.
Although the Trust believes that the anticipated future results, performance or achievements expressed or implied by the forward-looking statements and information are based upon reasonable assumptions and expectations, the reader should not place undue reliance on forward-looking statements and information because they involve known and unknown risks, uncertainties and other factors, many of which are beyond the control of the Trust, which may cause the actual results, performance or achievements of the Trust to differ materially from anticipated future results, performance or achievement expressed or implied by such forward-looking statements and information.
Factors that could cause actual results to differ materially from those contemplated or implied by forward-looking statements include, but are not limited to: risks incidental to the ownership and operation of real estate properties including local real estate conditions; the impact or unanticipated impact of general economic, political and market factors in Canada; the ability to enter into new leases or renew leases on favourable terms; business competition; dependence on tenants’ financial condition; the use of debt to finance the Trust’s business; the behavior of financial markets, including fluctuations in interest rates; equity and capital markets and the availability of equity and debt financing and refinancing within these markets; risks relating to the Trust’s insurance coverage; the possible impact of international conflicts and other developments including terrorist acts; potential environmental liabilities; changes in tax laws and other tax related risks; dependence on management personnel; illiquidity of investments; the ability to complete and effectively integrate acquisitions into existing operations and the ability to attain expected benefits therefrom; operational and reputational risks; catastrophic events, such as earthquakes and hurricanes; and other risks and factors detailed from time to time in the Trust’s documents filed with the securities regulators in Canada and the United States.
Caution should be taken that the foregoing list of important factors that may affect future results is not exhaustive. When relying on the Trust’s forward-looking statements or information, investors and others should carefully consider the foregoing factors and other uncertainties and potential events. Except as required by law, the Trust undertakes no obligation to publicly update or revise any forward-looking statements or information, whether written or oral, that may be as a result of new information, future events or otherwise.
| Brookfield Canada Office Properties | 5 |
Management’s Discussion and Analysis of Financial Results
April 24, 2017
PART I – OBJECTIVES AND FINANCIAL HIGHLIGHTS
BASIS OF PRESENTATION
Financial data included in this Management’s Discussion and Analysis (“MD&A”) for the three months ended March 31, 2017, includes material information up to April 24, 2017. Financial data provided has been prepared in accordance with International Financial Reporting Standards as issued by the International Accounting Standards Board (“IFRS”). All dollar references, unless otherwise stated, are in millions of Canadian dollars except per unit amounts. Amounts in U.S. dollars are identified as “US$.”
Brookfield Canada Office Properties (“BOX,” the “Trust,” “we”, “our” or “us”) was formed in connection with the reorganization of BPO Properties Ltd. (“BPP”), a former wholly-owned subsidiary of Brookfield Office Properties Inc. (“BOPI”), on May 1, 2010, in which BPP’s directly owned office assets were transferred to the Trust. In connection with the reorganization, the Trust also acquired BOPI’s interest in Brookfield Place Toronto, which includes Bay Wellington Tower and partial interests in the retail concourse and parking operations.
On December 1, 2011, we acquired from BOPI, a 25% interest in nine office assets from its Canadian Office Fund portfolio totaling 6.5 million square feet in Toronto and Ottawa. On July 11, 2013, we acquired Bay Adelaide East from BOPI totaling 1.2 million square feet in Toronto and on October 14, 2014, we acquired Brookfield Place Calgary East from BOPI totaling 1.4 million square feet in Calgary.
The following discussion and analysis is intended to provide readers with an assessment of the performance of BOX over the past three months as well as our financial position and future prospects. It should be read in conjunction with the condensed consolidated interim financial statements and appended notes, which begin on page 33 of this report. In Part II – Financial Statement Analysis, we review our operating performance and financial position as presented in our financial statements prepared in accordance with IFRS.
We included our discussion of operating performance on an IFRS basis beginning on page 20 of the MD&A followed by a discussion of non-IFRS measures. Included in non-IFRS measures are commercial property net operating income, same property net operating income ("Same property NOI"), Trust funds from operations ("Trust FFO"), adjusted funds from operations ("AFFO"), total equity per unit, adjusted commercial property revenue and revaluation gain (loss) on a per-unit and/or total basis. Commercial property net operating income, same property net operating income, Trust funds from operations, adjusted funds from operations, total equity per unit, adjusted commercial property revenue and revaluation gain (loss) do not have any standardized meaning prescribed by IFRS and therefore may not be comparable to similar measures presented by other companies. We define commercial property net operating income as adjusted commercial property revenue net of direct property operating expenses, including property administration costs that have been deducted, but prior to deducting interest expense, general and administrative expenses and fair value gains (losses). Included in adjusted commercial property revenue and revaluation gain (loss) is the impact of rental payments received pursuant to a related party lease, which in accordance with IFRS, would be included in fair value gains (losses). We believe the inclusion of the rental lease payments, net of non-cash rental revenue, is important to help investors understand the contracted economics of the Bay Adelaide East acquisition on an "as-if-completed-and-stabilized basis" and the related recurring operating cash flows generated pursuant to that arrangement. "As-if-completed-and-stabilized basis" refers to BOPI retaining the development obligations including construction, lease-up and financing. Same property NOI is a subset of net operating income, which excludes net operating income that is earned from assets acquired, disposed of or developed during the periods presented, or not of a recurring nature. Trust FFO is defined as net income prior to transaction costs, revaluation gain (loss) which include the impact of rental payments received from the related party lease as described above, and certain other non-cash items, if any. Trust FFO does not represent or approximate cash generated from operating activities and is consistent with the definition of FFO per the Real Property Association of Canada ("REALPAC") FFO white paper, except that Trust FFO further includes the adjustment for the related party lease payments. AFFO is defined by us as Trust FFO net of actual second-generation leasing commissions and tenant improvements, actual maintaining value capital expenditures and straight-line rental income. Total equity per unit represents the book value of our total equity divided by total units outstanding.
Commercial property net operating income is an important measure that both investors and management use to assess operating performance of our commercial properties, and same property net operating income allows the Trust to segregate the performance of leasing and operating initiatives on the portfolio from the impact to performance from investing activities and non-recurring income (charges). Trust funds from operations is a widely used measure in analyzing the performance of real estate notwithstanding the variability of its fair value. Adjusted funds from operations is a measure used to assess an entity’s ability to pay distributions. Total equity per unit is an important measure of an entity's current financial position because it reflects its total equity adjusted for all inflows and outflows, including Trust FFO and changes in the value of its investment properties. We provide the components of commercial property net operating income, a reconciliation of adjusted commercial property revenue and revaluation gain (loss), a reconciliation of commercial property net operating income to net income, a full reconciliation of net income to Trust funds from operations and adjusted funds from operations, and a reconciliation of cash generated from operating activities to adjusted funds from operations beginning on page 23.
Additional information, including our Annual Information Form, is available on our Web site at www.brookfieldcanadareit.com or at www.sedar.com or www.sec.gov.
| Brookfield Canada Office Properties | 7 |
OVERVIEW OF THE BUSINESS
BOX is a publicly traded, real estate investment trust listed on the Toronto and New York stock exchanges under the symbol BOX.UN and BOXC, respectively.
The Trust invests, develops and operates commercial office properties in Toronto, Ottawa and Calgary.
At March 31, 2017, the carrying value of BOX’s total assets was $6,283.7 million. During the three months ended March 31, 2017, we generated a net income of $59.4 million ($0.64 per unit), $39.4 million of Trust funds from operations ($0.42 per unit), and $31.1 million of adjusted funds from operations ($0.33 per unit).
FINANCIAL HIGHLIGHTS
BOX’s financial results are as follows:
| | | Three months ended Mar. 31 | |
| (Millions, except per-unit amounts) | | 2017 | | | 2016 | |
| Results of operations | | | | | | | | |
| Adjusted commercial property revenue(1)(2) | | $ | 133.6 | | | $ | 135.6 | |
| Net income | | | 59.4 | | | | 11.0 | |
| Trust funds from operations(1)(2) | | | 39.4 | | | | 39.0 | |
| Adjusted funds from operations(1)(3) | | | 31.1 | | | | 33.1 | |
| Distributions | | | 30.7 | | | | 178.8 | |
| Per unit amounts – attributable to unitholders | | | | | | | | |
| Net income | | | 0.64 | | | | 0.12 | |
| Trust funds from operations(1)(2) | | | 0.42 | | | | 0.42 | |
| Adjusted funds from operations(1)(3) | | | 0.33 | | | | 0.35 | |
| Distributions | | | 0.33 | | | | 0.32 | |
| (Millions, except per-unit amounts) | | Mar. 31, 2017 | | | Dec. 31, 2016 | |
| Balance sheet data | | | | | | | | |
| Total assets | | $ | 6,283.7 | | | $ | 6,157.2 | |
| Investment properties | | | 6,200.4 | | | | 6,081.3 | |
| Investment property and corporate debt | | | 2,869.9 | | | | 2,828.0 | |
| Total equity | | | 3,191.7 | | | | 3,162.4 | |
| Total equity per unit(1) | | | 34.14 | | | | 33.82 | |
(1)Non-IFRS measure. Refer to description of non-IFRS measures and reference to reconciliation to comparable IFRS measures beginning on page 22.
(2)Refer to Reconciliation of adjusted commercial property revenue and revaluation gain (loss) on page 24.
(3)Based on actual leasing commissions, tenant improvements and maintaining value capital expenditures incurred.
COMMERCIAL PROPERTY OPERATIONS
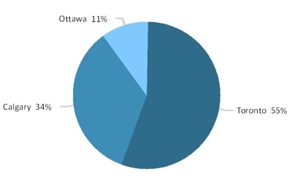
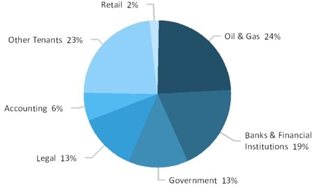
Our strategy to own premier properties in high-growth, and in many instances supply-constrained markets with high barriers to entry, has created one of Canada’s most distinguished portfolios of office properties. Our commercial-property portfolio consists of interests in 26 properties totaling 20.5 million square feet, including 3.7 million square feet of parking and other. Our development portfolio consists of the Brookfield Place Calgary East development site totaling 1.4 million square feet in Calgary. Our markets are the financial, government and energy sectors primarily located in the cities of Toronto and Calgary. Our strategy is concentrating operations within a select number of Canadian gateway cities with attractive tenant bases in order to maintain a meaningful presence and build on the strength of our tenant relationships within these markets.
Gross Leasable Area by City as of March 31, 2017 | Gross Leasable Area by Tenant Base as of March 31, 2017 |
| | |
 |  |
| Brookfield Canada Office Properties | 9 |
We remain focused on the following strategic priorities:
| • | Realizing value from our investment properties through proactive leasing initiatives; |
| • | Prudent capital management, including the refinancing of mature investment properties; and |
| • | Acquiring high-quality investment properties in our primary markets for value when opportunities arise. |
The following table summarizes our commercial property portfolio by region as at March 31, 2017:
| Region | | Number of
Properties | | | Total Area
(000’s Sq. Ft.) | | | BOX’s
Owned Interest
(000’s Sq. Ft.) | | | Fair Value
(Millions) | | | Fair Value
Per Sq. Ft. | | | Debt(1)
(Millions) | | | Net Book
Equity(2)
(Millions) | |
| Commercial properties | | | | | | | | | | | | | | | | | | | | | | | | | | | | |
| Eastern region | | | 18 | | | | 13,528 | | | | 8,249 | | | $ | 3,953.9 | | | $ | 479 | | | $ | 1,708.9 | | | $ | 2,245.0 | |
| Western region | | | 8 | | | | 6,932 | | | | 3,467 | | | | 1,532.2 | | | | 442 | | | | 726.4 | | | | 805.8 | |
| Total | | | 26 | | | | 20,460 | | | | 11,716 | | | $ | 5,486.1 | | | $ | 468 | | | $ | 2,435.3 | | | $ | 3,050.8 | |
(1)Excludes debt associated with our development property and corporate debt.
(2)Represents fair value less debt and excludes working capital, and is a non-IFRS measure.
An important characteristic of our portfolio is the strong credit quality of our tenants. We direct special attention to credit quality, particularly in the current economic environment, in order to ensure the long-term sustainability of rental revenues through economic cycles. Major tenants with over 500,000 square feet of space in the portfolio include government and related agencies, Suncor Energy Inc., Bank of Montreal, Deloitte LLP and Canadian Natural Resources. A detailed list of major tenants is included in Part III (“Risks and Uncertainties”) of this MD&A on page 29.
Our strategy is to sign long-term leases in order to mitigate risk and reduce our overall re-tenanting costs. We typically commence discussions with tenants regarding their space requirements well in advance of the contractual expiration, and although each market is different, the majority of our leases, when signed, extend between five and 10-year terms. As a result of this strategy, approximately 4.4% of our leases, on average, mature annually up to and including 2020. Our average lease term is eight years.
The following is a breakdown of lease maturities by region with associated in-place rental rates on our commercial properties:
| | | Total Portfolio | | | Toronto, Ontario | | | Ottawa, Ontario | |
| | | | | | | | | Net Rent | | | | | | | | | Net Rent | | | | | | | | | Net Rent | |
| | | 000's | | | | | | per | | | 000's | | | | | | per | | | 000's | | | | | | Per | |
| Year of Expiry | | Sq. Ft. | | | % | | | Sq. Ft.(1) | | | Sq. Ft. | | | % | | | Sq. Ft.(1) | | | Sq. Ft. | | | % | | | Sq. Ft.(1) | |
| Currently available | | | 887 | | | | 5.3 | | | | | | | | 416 | | | | 4.5 | | | | | | | | 87 | | | | 5.0 | | | | | |
| 2017 | | | 126 | | | | 0.8 | | | $ | 36 | | | | 76 | | | | 0.8 | | | $ | 39 | | | | 11 | | | | 0.6 | | | $ | 25 | |
| 2018 | | | 641 | | | | 3.8 | | | | 34 | | | | 475 | | | | 5.1 | | | | 34 | | | | 34 | | | | 2.0 | | | | 18 | |
| 2019 | | | 727 | | | | 4.3 | | | | 27 | | | | 558 | | | | 6.0 | | | | 26 | | | | 86 | | | | 5.0 | | | | 23 | |
| 2020 | | | 1,277 | | | | 7.6 | | | | 34 | | | | 982 | | | | 10.6 | | | | 32 | | | | 9 | | | | 0.5 | | | | 27 | |
| 2021 | | | 1,378 | | | | 8.2 | | | | 30 | | | | 677 | | | | 7.3 | | | | 35 | | | | 575 | | | | 33.2 | | | | 23 | |
| 2022 | | | 1,375 | | | | 8.2 | | | | 31 | | | | 962 | | | | 10.4 | | | | 31 | | | | 19 | | | | 1.1 | | | | 12 | |
| 2023 | | | 1,090 | | | | 6.5 | | | | 24 | | | | 721 | | | | 7.8 | | | | 25 | | | | 262 | | | | 15.1 | | | | 17 | |
| 2024 and beyond | | | 9,224 | | | | 55.3 | | | | 32 | | | | 4,386 | | | | 47.5 | | | | 32 | | | | 648 | | | | 37.5 | | | | 20 | |
| Parking and other | | | 3,735 | | | | — | | | | — | | | | 1,737 | | | | — | | | | — | | | | 804 | | | | — | | | | — | |
| Total | | | 20,460 | | | | 100.0 | % | | | | | | | 10,990 | | | | 100.0 | | | | | | | | 2,535 | | | | 100.0 | | | | | |
| Average market net rent(2) (3) | | | | | | | | | | $ | 28 | | | | | | | | | | | $ | 33 | | | | | | | | | | | $ | 18 | |
| | | Calgary, Alberta | | | Other | |
| | | | | | | | | Net Rent | | | | | | | | | Net Rent | |
| | | 000's | | | | | | per | | | 000’s | | | | | | Per | |
| Year of Expiry | | Sq. Ft. | | | % | | | Sq. Ft.(1) | | | Sq. Ft. | | | % | | | Sq. Ft.(1) | |
| Currently available | | | 384 | | | | 6.7 | | | | | | | | — | | | | — | | | | | |
| 2017 | | | 39 | | | | 0.7 | | | $ | 34 | | | | — | | | | — | | | $ | — | |
| 2018 | | | 132 | | | | 2.3 | | | | 40 | | | | — | | | | — | | | | — | |
| 2019 | | | 82 | | | | 1.4 | | | | 42 | | | | 1 | | | | 33.3 | | | | 28 | |
| 2020 | | | 286 | | | | 5.0 | | | | 42 | | | | — | | | | — | | | | — | |
| 2021 | | | 126 | | | | 2.2 | | | | 37 | | | | — | | | | — | | | | — | |
| 2022 | | | 394 | | | | 6.9 | | | | 31 | | | | — | | | | — | | | | — | |
| 2023 | | | 107 | | | | 1.9 | | | | 36 | | | | — | | | | — | | | | — | |
| 2024 and beyond | | | 4,188 | | | | 72.9 | | | | 34 | | | | 2 | | | | 66.7 | | | | 26 | |
| Parking and other | | | 1,194 | | | | — | | | | — | | | | — | | | | — | | | | — | |
| Total | | | 6,932 | | | | 100.0 | | | | | | | | 3 | | | | 100 | | | | | |
| Average market net rent(2) | | | | | | | | | | $ | 23 | | | | | | | | | | | $ | — | |
(1)Net rent at expiration of lease.
| Brookfield Canada Office Properties | 11 |
(2)Average market net rent represents management’s estimate of average rent per square foot for buildings of similar quality to our portfolio. However, it may not necessarily be representative of the specific space that is rolling in any specific year. Included on page 22 is the average leasing net rent achieved on our year-to-date leasing as compared to the average expiring net rent.
(3)Average market net rent for Toronto reflects higher market rents for Brookfield Place Toronto, Bay Adelaide West and Bay Adelaide East, which comprise 39% of BOX’s exposure in Toronto.
COMMERCIAL DEVELOPMENT
The following table summarizes our development project at March 31, 2017:
| | | Region | | Location | | Number of
Sites | | | Owned
Interest | | | Leasable Area
(000's Sq. Ft.) | |
| Brookfield Place Calgary East | | Calgary | | Within one block of Fifth Avenue Place, Bankers Hall and Suncor Energy Centre | | | 1 | | | | 100 | % | | | 1,400 | |
Brookfield Place Calgary East is currently 81.4% pre-leased to Cenovus and Bank of Nova Scotia. Completion remains on target for late 2017.
PERFORMANCE MEASUREMENT
The key indicators by which we measure our performance are:
| • | Commercial property net operating income(1); |
| • | Trust funds from operations per unit(1); |
| • | Adjusted funds from operations per unit(1); |
| • | Total equity per unit(1); |
| • | Overall indebtedness level; |
| • | Weighted-average cost of debt; and |
(1)Non IFRS-measure.
Although we monitor and analyze our financial performance using a number of indicators, our primary business objective of generating reliable and growing cash flow is monitored and analyzed using net income, commercial property net operating income, Trust funds from operations, and adjusted funds from operations. Although net income is calculated in accordance with IFRS, IFRS does not prescribe standardized meanings for commercial property net operating income, Trust funds from operations, and adjusted funds from operations; therefore, they are unlikely to be comparable to similar measures presented by other entities. We provide the components of commercial property net operating income, a reconciliation of adjusted commercial property revenue and revaluation gain (loss), a reconciliation of commercial property net operating income to net income and a full reconciliation of net income to Trust funds from operations and adjusted funds from operations beginning on page 23 of this MD&A.
Net Income
Net income is calculated in accordance with IFRS. Net income is used as a key indicator in assessing the profitability of the Trust.
KEY PERFORMANCE DRIVERS
In addition to monitoring and analyzing performance in terms of net income, we consider the following items to be important drivers of our current and anticipated financial performance:
| • | Increases in occupancies by leasing vacant space; |
| • | Increases in rental rates through maintaining or enhancing the quality of our assets and as market conditions permit; and |
| • | Reduction in operating costs through achieving economies of scale and diligently managing contracts. |
We also believe that the key external performance drivers include the availability of:
| • | Debt capital at a cost and on terms conducive to our goals; |
| • | Equity capital at a reasonable cost; |
| • | New property acquisitions that fit into our strategic plan; and |
| • | Investors for dispositions of peak value or non-core assets. |
| Brookfield Canada Office Properties | 13 |
PART II – FINANCIAL STATEMENT ANALYSIS
ASSET PROFILE
Our total asset carrying value was $6,283.7 million at March 31, 2017 (compared to $6,157.2 million at December 31, 2016). The following is a summary of our assets:
| (Millions) | | Mar. 31, 2017 | | | Dec. 31, 2016 | |
| Non-current assets | | | | | | | | |
| Investment properties | | | | | | | | |
| Commercial properties | | $ | 5,486.1 | | | $ | 5,397.0 | |
| Commercial development | | | 714.3 | | | | 684.3 | |
| | | | 6,200.4 | | | | 6,081.3 | |
| Current assets | | | | | | | | |
| Tenant and other receivables | | | 16.9 | | | | 15.8 | |
| Other assets | | | 7.2 | | | | 7.9 | |
| Cash and cash equivalents | | | 59.2 | | | | 52.2 | |
| | | | 83.3 | | | | 75.9 | |
| Total | | $ | 6,283.7 | | | $ | 6,157.2 | |
COMMERCIAL PROPERTIES
Commercial properties comprise of our direct interests in wholly owned commercial properties and our proportionate share of the related assets, liabilities, revenue and expenses in our jointly controlled commercial properties.
The fair value of our commercial properties was $5,486.1 million as at March 31, 2017 (compared to $5,397.0 million at December 31, 2016). The increase in value of commercial properties is primarily attributable to increases across the Eastern and Western region as a result of capital expenditures, leasing costs and rental rate increases due to improvements in tenant profiles and rental curves related to new leases and renewals.
A breakdown of our commercial properties is as follows:
| | | | | | | | | BOX’s | | | | | | | |
| | | | | | | | | Owned | | | Fair Value | | | Fair Value | |
| | | Number of | | | Total Area | | | Interest | | | Mar. 31, 2017 | | | Dec. 31, 2016 | |
| | | Properties | | | (000's Sq. Ft.) | | | (000's Sq. Ft.) | | | (Millions) | | | (Millions) | |
| Eastern region | | | 18 | | | | 13,528 | | | | 8,249 | | | $ | 3,953.9 | | | $ | 3,875.9 | |
| Western region | | | 8 | | | | 6,932 | | | | 3,467 | | | | 1,532.2 | | | | 1,521.1 | |
| Total commercial properties | | | 26 | | | | 20,460 | | | | 11,716 | | | $ | 5,486.1 | | | $ | 5,397.0 | |
| Fair value per Sq. Ft. | | | | | | | | | | | | | | $ | 468 | | | $ | 461 | |
The key valuation metrics for our commercial properties are as follows:
| | | March 31, 2017 | | | December 31, 2016 | |
| | | Maximum | | | Minimum | | | Weighted Average | | | Maximum | | | Minimum | | | Weighted
Average | |
| Eastern region | | | | | | | | | | | | | | | | | | | | | | | | |
| Discount rate | | | 7.00 | % | | | 6.00 | % | | | 6.08 | % | | | 7.00 | % | | | 6.00 | % | | | 6.08 | % |
| Terminal cap rate | | | 6.50 | % | | | 5.00 | % | | | 5.26 | % | | | 6.50 | % | | | 5.00 | % | | | 5.22 | % |
| Hold period (yrs) | | | 14 | | | | 10 | | | | 10 | | | | 14 | | | | 10 | | | | 10 | |
| Western region | | | | | | | | | | | | | | | | | | | | | | | | |
| Discount rate | | | 6.75 | % | | | 6.25 | % | | | 6.47 | % | | | 6.75 | % | | | 6.25 | % | | | 6.38 | % |
| Terminal cap rate | | | 6.25 | % | | | 6.00 | % | | | 6.07 | % | | | 6.25 | % | | | 6.00 | % | | | 6.07 | % |
| Hold period (yrs) | | | 10 | | | | 10 | | | | 10 | | | | 11 | | | | 10 | | | | 10 | |
Fair values are most sensitive to changes in discount rate assumptions and terminal capitalization rate assumptions. A 25 basis-point decrease in the discount and terminal capitalization rates will impact the fair value of commercial properties by $109.5 million and $169.8 million, or 2.0% and 3.1%, respectively, at March 31, 2017. Discount rates and terminal capitalization rates are inherently uncertain and may be impacted by, among other things, movements in interest rates in the markets in which the assets are located. Changes in estimates of discount and terminal capitalization rates across different markets are often independent of each other and do not necessarily move in the same direction or of the same magnitude.
Upon the signing of the majority of our leases, we provide a capital allowance for tenant improvements or tenant inducements for leased space in order to accommodate the specific space requirements of the tenant. In addition to these allowances, leasing commissions are paid to third-party brokers and Brookfield Office Properties Management LP (“BOPM LP”), a subsidiary of BOPI. We may experience a delay between lease commencement and the payment of leasing costs due to timing of the tenant installation and the required inspections and certifications. For the three months ended March 31, 2017, such expenditures totaled $10.4 million (compared to $5.9 million during the same period in 2016). The increase is primarily related to higher leasing commissions at Bay Adelaide East and higher tenant improvements at Fifth Avenue Place.
We also invest in ongoing maintenance and capital improvement projects to sustain the high quality of the infrastructure and tenant service amenities in our properties. Total capital expenditures for the three months ended March 31, 2017 totaled $2.4 million (compared to $8.5 million during the same period in 2016). These expenditures exclude repairs and maintenance costs. Fluctuations in our capital expenditures vary period over period based on required and planned expenditures on our commercial properties.
Capital expenditures include maintaining value expenditures, which are those required in order to maintain the properties in their current operating state. Capital expenditures also include projects which represent improvements to an asset or reconfiguration of space that adds productive capacity in order to increase rentable area or increase current rental rates. For the three months ended March 31, 2017, maintaining value capital expenditures totaled $0.7 million (compared with $0.4 million during the same period in 2016), enhancing capital expenditures totaled $0.7 million (compared with $0.6 million during the same period in 2016), while the remaining capital expenditures totaled $1.0 million (compared to $7.5 million during the same period in 2016) consist of remaining construction costs at Bay Adelaide East. Capital expenditures are recoverable in some cases through contractual tenant cost-recovery payments. During the three months ended March 31, 2017, $1.9 million of our total capital expenditures were recoverable (compared with $0.6 million during the same period in 2016).
The following table summarizes the second-generation leasing commissions and tenant improvements, and maintaining value capital expenditures recorded on our commercial properties during the three months ended March 31, 2017. “Second-generation” leasing commissions and tenant improvements includes both new and renewal tenants for all of our commercial properties and vary with the timing of renewals, vacancies and tenant mix. These costs historically have been lower for renewals of existing tenants compared to new tenants.
For the three months ended March 31, 2017, second-generation leasing commissions and tenant improvements of $7.6 million consisted primarily of leasing commissions incurred at Brookfield Place Toronto and Queen's Quay Terminal and tenant improvements incurred at Brookfield Place Toronto, Queen's Quay Terminal, Hudson's Bay Centre, First Canadian Place and Fifth Avenue Place related to tenant build-outs. Compared to the prior year of $5.4 million, the increase is primarily related to higher tenant improvement costs incurred at Brookfield Place Toronto and Fifth Avenue Place.
| | | Three months ended Mar. 31 | | | Normalized
quarterly
activities(1) | |
| (Millions) | | 2017 | | | 2016 | | | 2017 | |
| Second-generation leasing commissions and tenant improvements | | $ | 7.6 | | | $ | 5.4 | | | $ | 5.7 | |
| Maintaining value capital expenditures | | | 0.7 | | | | 0.4 | | | | 1.8 | |
| Total | | $ | 8.3 | | | $ | 5.8 | | | $ | 7.5 | |
(1)A normalized level of activity is estimated based on historical spend levels as well as anticipated levels over the next few years.
| Brookfield Canada Office Properties | 15 |
The following table summarizes the changes in value of our commercial properties during the three months ended March 31, 2017:
| (Millions) | | Mar. 31, 2017 | |
| Balance at beginning of period | | $ | 5,397.0 | |
| Additions: | | | | |
| Acquisition costs(1) | | | 56.0 | |
| Capital expenditures and tenant improvements | | | 9.4 | |
| Leasing commissions | | | 3.4 | |
| Tenant inducements | | | — | |
| Investment property disposition | | | — | |
| Revaluation gain(2) | | | 20.3 | |
| Other changes | | | — | |
| Balance at end of period | | $ | 5,486.1 | |
(1)Represents the recognition of the Bay Adelaide East $56.0 million stabilization payment to BOPI. Refer to Related-Party Transactions on page 32.
(2)Refer to Reconciliation of adjusted commercial property revenue and revaluation gain (loss) on page 24.
COMMERCIAL DEVELOPMENT
Commercial development consists of Brookfield Place Calgary East which is a high quality, centrally located development site acquired from our parent company, BOPI for an aggregate total investment of $966.3 million. The building was purchased on an “as-if-completed-and-stabilized basis,” and as such, BOPI retains the development obligations including construction, lease-up and financing.
The following table summarizes the details of the transaction and operational information as at March 31, 2017:
| (Millions, except Operational Information) | | Brookfield Place
Calgary East | |
| Initial acquisition price | | $ | 245.5 | |
| Up-front equity commitment | | | 81.8 | |
| First mortgage construction loan | | | 575.0 | |
| Final payment due to BOPI on stabilization(1) | | | 64.0 | |
| Aggregate total investment | | $ | 966.3 | |
| | | | | |
| Operational Information | | | | |
| Total Leasable Area (000's Sq. Ft.) | | | 1,400 | |
| Leased % | | | 81.4 | % |
| Target Completion Date | | | Late 2017 | |
(1)Subject to achieving stabilized net operating income and targeted permanent financing, which is expected to occur in 2018.
Commercial development under active development is measured using a discounted cash flow model, net of costs to complete, as of the balance sheet date. The total fair value of development land and infrastructure was $714.3 million at March 31, 2017.
The details of development expenditures are as follows:
| | | Three months ended Mar. 31 | |
| (Millions) | | 2017 | | | 2016 | |
| Construction costs | | $ | 23.0 | | | $ | 52.9 | |
| Property taxes and other related costs | | | 1.7 | | | | 1.9 | |
| Borrowing costs capitalized | | | 5.3 | | | | 3.8 | |
| Total | | $ | 30.0 | | | $ | 58.6 | |
The following table summarizes the changes in value of our commercial development during the three months ended March 31, 2017:
| (Millions) | | Mar. 31, 2017 | |
| Balance at beginning of period | | $ | 684.3 | |
| Additions: | | | | |
| Development expenditures | | | 30.0 | |
| Balance at end of period | | $ | 714.3 | |
TENANT AND OTHER RECEIVABLES
Tenant and other receivables increased to $16.9 million at March 31, 2017 from $15.8 million at December 31, 2016.
OTHER ASSETS
At March 31, 2017, the balance of other assets is comprised of prepaid expenses and other assets of $7.2 million (compared to $7.9 million at December 31, 2016).
| Brookfield Canada Office Properties | 17 |
CASH AND CASH EQUIVALENTS
We endeavor to maintain high levels of liquidity to ensure that we can meet distribution requirements and react quickly to potential investment opportunities. At March 31, 2017, cash balances were $59.2 million (compared to $52.2 million at December 31, 2016).
LIABILITIES AND EQUITY
Our asset base of $6,283.7 million is financed with a combination of debt and equity. The components of our liabilities and equity are as follows:
| (Millions) | | Mar. 31, 2017 | | | Dec. 31, 2016 | |
| Liabilities | | | | | | | | |
| Non-current liabilities | | | | | | | | |
| Investment property and corporate debt | | $ | 2,794.3 | | | $ | 2,753.6 | |
| Current liabilities | | | | | | | | |
| Investment property and corporate debt | | | 75.6 | | | | 74.4 | |
| Accounts payable and other liabilities | | | 222.1 | | | | 166.8 | |
| | | | 297.7 | | | | 241.2 | |
| | | | 3,092.0 | | | | 2,994.8 | |
| Equity | | | | | | | | |
| Unitholders’ equity | | | 887.5 | | | | 879.0 | |
| Non-controlling interest | | | 2,304.2 | | | | 2,283.4 | |
| | | | 3,191.7 | | | | 3,162.4 | |
| Total liabilities and equity | | $ | 6,283.7 | | | $ | 6,157.2 | |
INVESTMENT PROPERTY AND CORPORATE DEBT
Investment property and corporate debt (current and non-current) totaled $2,869.9 million at March 31, 2017 (compared to $2,828.0 million at December 31, 2016). Investment property and corporate debt at March 31, 2017 had a weighted-average interest rate of 3.75%. Debt on our investment properties is mainly non-recourse, thereby reducing overall financial risk to the Trust.
We attempt to match the maturity of our investment property debt portfolio with the average lease term of our properties. At March 31, 2017, the average term to maturity of our investment property debt was six years, compared to our average lease term of eight years.
The details of investment property and corporate debt at March 31, 2017, are as follows:
| | | Location | | Interest
Rate % | | | Maturity
Date | | BOX’s Share
(Millions) | | | Mortgage Details |
| Income Producing | | | | | | | | | | | | | | |
| 2 Queen St. East | | Toronto | | | 5.64 | % | | December 2017 | | $ | 28.6 | | | Non-recourse - fixed rate |
| Hudson's Bay Centre(1) | | Toronto | | | 2.39 | % | | May 2018 | | | 137.3 | | | Limited recourse - floating rate |
| Bay Adelaide East(2) | | Toronto | | | 2.76 | % | | December 2018 | | | 334.2 | | | Limited recourse - floating rate |
| Brookfield Place Toronto | | Toronto | | | 3.24 | % | | January 2020 | | | 480.7 | | | Non-recourse - fixed rate |
| 22 Front St. West | | Toronto | | | 6.24 | % | | October 2020 | | | 16.2 | | | Non-recourse - fixed rate |
| Bankers Court | | Calgary | | | 4.96 | % | | November 2020 | | | 40.7 | | | Non-recourse - fixed rate |
| Queen's Quay Terminal | | Toronto | | | 5.40 | % | | April 2021 | | | 78.1 | | | Non-recourse - fixed rate |
| Fifth Avenue Place | | Calgary | | | 4.71 | % | | August 2021 | | | 151.8 | | | Non-recourse - fixed rate |
| Bay Adelaide West | | Toronto | | | 4.43 | % | | December 2021 | | | 366.5 | | | Non-recourse - fixed rate |
| Exchange Tower | | Toronto | | | 4.03 | % | | April 2022 | | | 104.8 | | | Non-recourse - fixed rate |
| 105 Adelaide St. West | | Toronto | | | 3.87 | % | | May 2023 | | | 33.8 | | | Non-recourse - fixed rate |
| Bankers Hall | | Calgary | | | 4.38 | % | | November 2023 | | | 284.4 | | | Non-recourse - fixed rate |
| First Canadian Place | | Toronto | | | 3.56 | % | | December 2023 | | | 74.2 | | | Non-recourse - fixed rate |
| Jean Edmonds Towers | | Ottawa | | | 6.79 | % | | January 2024 | | | 15.6 | | | Non-recourse - fixed rate |
| Place de Ville I | | Ottawa | | | 3.75 | % | | June 2025 | | | 21.0 | | | Non-recourse - fixed rate |
| Place de Ville II | | Ottawa | | | 3.75 | % | | June 2025 | | | 22.8 | | | Non-recourse - fixed rate |
| Suncor Energy Centre | | Calgary | | | 5.19 | % | | August 2033 | | | 254.2 | | | Non-recourse - fixed rate |
| | | | | | | | | | | | | | | |
| Development | | | | | | | | | | | | | | |
| Brookfield Place Calgary East(3) | | Calgary | | | 2.62 | % | | November 2018 | | | 353.2 | | | Limited recourse - floating rate |
| | | | | | | | | | | | | | | |
| Corporate | | | | | | | | | | | | | | |
| $350M Corporate Revolver | | - | | | 2.34 | % | | August 2021 | | | 82.0 | | | Recourse - floating rate |
| | | | | | 3.75 | % | | | | | 2,880.1 | | | |
| Premium on assumed mortgages | | | | | | | | | | | 0.8 | | | |
| Deferred financing costs | | | | | | | | | | | (11.0 | ) | | |
| Total | | | | | 3.75 | % | | | | $ | 2,869.9 | | | |
(1)This loan has limited recourse to the Trust for up to $15.0 million.
(2)This loan has a three year term from the date of the initial advance maturing December 2016, and has limited recourse to the Trust for up to $50.0 million. Two one-year extension options are available provided certain leasing thresholds have been met and no material defaults have occurred. The second criteria to extend the maturity to 2018 has been met as of March 31, 2017.
(3)This loan has limited recourse to the Trust for up to $60.0 million. A one-year extension option is available provided certain leasing thresholds have been met and no material defaults have occurred. The criteria to extend the maturity to 2018 has been met as of March 31, 2017.
Investment property and corporate debt maturities for the next five years and thereafter are as follows:
| | | | | | | | | | | | Weighted-Average | |
| | | Scheduled | | | | | | | | | Interest Rate (%) at | |
| (Millions, except interest data) | | Amortization(1) | | | Maturities | | | Total(1) | | | Mar. 31, 2017 | |
| Remainder of 2017 | | $ | 30.4 | | | $ | 28.6 | | | $ | 59.0 | | | | 5.64 | % |
| 2018 | | | 49.3 | | | | 824.8 | | | | 874.1 | | | | 2.64 | % |
| 2019 | | | 51.7 | | | | — | | | | 51.7 | | | | — | % |
| 2020 | | | 41.3 | | | | 499.2 | | | | 540.5 | | | | 3.46 | % |
| 2021 | | | 39.4 | | | | 600.3 | | | | 639.7 | | | | 4.35 | % |
| 2022 and thereafter | | | 153.8 | | | | 551.1 | | | | 704.9 | | | | 4.50 | % |
| Total | | $ | 365.9 | | | $ | 2,504.0 | | | $ | 2,869.9 | | | | 3.75 | % |
(1)Net of transaction costs.
| Brookfield Canada Office Properties | 19 |
CONTRACTUAL OBLIGATIONS
The following table presents our contractual obligations over the next five years and beyond:
| | | Payments Due By Period | |
| (Millions) | | Total | | | 1 year | | | 2 – 3 years | | | 4 – 5 Years | | | After 5 Years | |
| Investment property and corporate debt(1) | | $ | 2,869.9 | | | $ | 75.6 | | | $ | 1,370.9 | | | $ | 724.8 | | | $ | 698.6 | |
| Interest expense – investment property and corporate debt(2) | | | 475.0 | | | | 82.9 | | | | 156.9 | | | | 106.2 | | | | 129.0 | |
| Minimum rental payments - ground leases(3) | | | 477.6 | | | | 7.4 | | | | 14.9 | | | | 14.9 | | | | 440.4 | |
| | | $ | 3,822.5 | | | $ | 165.9 | | | $ | 1,542.7 | | | $ | 845.9 | | | $ | 1,268.0 | |
(1)Net of transaction costs.
(2)Represents aggregate interest expense expected to be paid over the term of the debt, on an undiscounted basis, based at current interest rates.
(3)Represents minimum rental payments, on an undiscounted basis, on land leases or other agreements.
CREDIT RATINGS
Our access to financing depends on, among other things, suitable market conditions and the maintenance of suitable long-term credit ratings. Our credit ratings may be adversely affected by various factors, including increased debt levels, decreased earnings, declines in tenant demand, increased competition, a further deterioration in general economic and business conditions and adverse publicity. Any downgrades in our credit ratings may impede our access to capital markets or raise our borrowing rates.
We are currently rated by Dominion Bond Rating Service Inc. (“DBRS”) and Standard & Poor’s (“S&P”). Our credit ratings at March 31, 2017, and at the date of this report were:
| | | DBRS | | S&P |
| Issuer Rating | | BBB (stable) | | BBB (stable) |
We are committed to arranging our affairs to maintain these ratings and improve them over time.
Credit ratings are intended to provide investors with an independent measure of the credit quality of an issue of securities. The credit ratings presented are not a recommendation to purchase, hold or sell our Trust Units, as such ratings do not comment as to market price or suitability for a particular investor. There is no assurance that any rating will remain in effect for any given period or that any rating will not be revised or withdrawn entirely by the rating agency in the future if, in its judgment, circumstances so warrant.
CORPORATE GUARANTEES AND CONTINGENT OBLIGATIONS
We and our operating subsidiaries may be contingently liable with respect to litigation and claims that arise from time to time in the normal course of business or otherwise. In addition, we may execute agreements that provide for indemnifications and guarantees to third parties. Disclosure of commitments, guarantees, and contingencies can be found in Note 13 of the condensed consolidated interim financial statements.
INCOME TAXES
The Trust is a “mutual fund trust” pursuant to theIncome Tax Act (Canada). The Trust distributes or designates all taxable earnings to unitholders, and as such, under current legislation, the obligation to pay tax rests with each unitholder. No current and deferred tax provisions are required on the Trust’s income.
ACCOUNTS PAYABLE AND OTHER LIABILITIES
Accounts payable and other liabilities increased to $222.1 million at March 31, 2017, from $166.8 million at December 31, 2016 mainly due to the accrual of the Bay Adelaide East final stabilization payment of $56.0 million to BOPI.
A summary of the components of accounts payable and other liabilities is as follows:
| (Millions) | | Mar. 31, 2017 | | | Dec. 31, 2016 | |
| Accounts payable and accrued liabilities | | $ | 209.7 | | | $ | 148.2 | |
| Accrued interest | | | 12.4 | | | | 18.6 | |
| Total | | $ | 222.1 | | | $ | 166.8 | |
EQUITY
The components of equity are as follows:
| (Millions) | | Mar. 31, 2017 | | | Dec. 31, 2016 | |
| Trust Units | | $ | 559.6 | | | $ | 559.0 | |
| Contributed surplus | | | 2.9 | | | | 2.9 | |
| Retained earnings | | | 325.0 | | | | 317.1 | |
| Unitholders’ equity | | | 887.5 | | | | 879.0 | |
| Non-controlling interest | | | 2,304.2 | | | | 2,283.4 | |
| Total | | $ | 3,191.7 | | | $ | 3,162.4 | |
The following tables summarize the changes in the units outstanding during the three months ended March 31, 2017 and March 31, 2016:
| | | Three months ended Mar. 31, 2017 | |
| | | Trust Units | | | Class B LP Units | |
| Units issued and outstanding at beginning of period | | | 26,413,171 | | | | 67,088,022 | |
| Units issued pursuant to Distribution Reinvestment Plan | | | 19,552 | | | | — | |
| Total units outstanding at March 31, 2017 | | | 26,432,723 | | | | 67,088,022 | |
| | | Three months ended Mar. 31, 2016 | |
| | | Trust Units | | | Class B LP Units | |
| Units issued and outstanding at beginning of period | | | 26,250,344 | | | | 67,088,022 | |
| Units issued pursuant to Distribution Reinvestment Plan | | | 13,618 | | | | — | |
| Total units outstanding at March 31, 2016 | | | 26,263,962 | | | | 67,088,022 | |
For the three months ended March 31, 2017, the weighted average number of Trust Units outstanding was 26,423,467 (compared to 26,346,054 for the year ended December 31, 2016).
Trust Units
Each Trust Unit is transferable and represents an equal, undivided, beneficial interest in BOX and in any distributions, whether of net income, net realized capital gains, or other amounts, and in the event of the termination or winding-up of the Trust, in the Trust’s net assets remaining after satisfaction of all liabilities. All Trust Units rank among themselves equally and ratably without discrimination, preference, or priority. Each Trust Unit entitles the holder thereof to one vote at all meetings of unitholders or with respect to any written resolution of unitholders. The Trust Units have no conversion, retraction or redemption rights.
Special Voting Units
Special Voting Units are only issued in tandem with Class B limited partnership units (“Class B LP Units”) of Brookfield Office Properties Canada LP (“BOPC LP”) and are not transferable separately from the Class B LP Units to which they relate and upon any transfer of Class B LP Units, such Special Voting Units will automatically be transferred to the transferee of the Class B LP Units. As Class B LP Units are exchanged for Trust Units or purchased for cancellation, the corresponding Special Voting Units will be cancelled for no consideration.
Each Special Voting Unit entitles the holder thereof to one vote at all meetings of unitholders or with respect to any resolution in writing of unitholders. Except for the right to attend and vote at meetings of the unitholders or with respect to written resolutions of the unitholders, Special Voting Units do not confer upon the holders thereof any other rights. A Special Voting Unit does not entitle its holder to any economic interest in BOX, or to any interest or share in BOX, or to any interest in any distributions (whether of net income, net realized capital gains, or other amounts), or to any interest in any net assets in the event of termination or winding-up.
| Brookfield Canada Office Properties | 21 |
Non-Controlling interest
We classify the outstanding Class B LP Units as non-controlling interest for financial statement purposes in accordance with IFRS. The Class B LP Units are exchangeable on a one-for-one basis (subject to customary anti-dilution provisions) for Trust Units at the option of the holder. Each Class B LP Unit is accompanied by a Special Voting Unit that entitles the holder thereof to receive notice of, to attend, and to vote at all meetings of unitholders of BOX. The holders of Class B LP Units are entitled to receive distributions when declared by BOPC LP equal to the per-unit amount of distributions payable to each holder of Trust Units. However, the Class B LP Units have limited voting rights over BOPC LP.
The following tables present distributions declared to Trust unitholders and non-controlling interest for the three months ended March 31, 2017 and March 31, 2016.
| | | Three months ended Mar. 31, 2017 | |
| (Millions, except per unit amounts) | | Trust Units | | | Class B LP Units | |
| Paid in cash or DRIP | | $ | 5.8 | | | $ | 14.7 | |
| Payable as of March 31, 2017 | | | 2.9 | | | | 7.3 | |
| Total | | | 8.7 | | | | 22.0 | |
| Per unit | | $ | 0.33 | | | $ | 0.33 | |
| | | Three months ended Mar. 31, 2016 | |
| (Millions, except per unit amounts) | | Trust Units | | | Class B LP Units | |
| Paid in cash or DRIP | | $ | 5.4 | | | $ | 13.9 | |
| Payable as of March 31, 2016 | | | 44.9 | | | | 114.6 | |
| Total | | | 50.3 | | | | 128.5 | |
| Per unit(1) | | $ | 0.32 | | | $ | 0.32 | |
(1)Excludes special distribution of $149.3 million or $1.60 per Trust unit, paid out on April 19, 2016 to holders of record at the close of business on April 5, 2016.
We determine annual distributions to unitholders by looking at forward-looking cash flow information, including forecasts and budgets and the future business prospects of the Trust. We do not consider periodic cash flow fluctuations resulting from items such as the timing of property operating costs, property tax installments, or semi-annual debenture and mortgage payable interest payments in determining the level of distributions to unitholders. To determine the level of cash distributions made to unitholders, we consider the impact of, among other items, the future growth in the income-producing portfolio, future acquisitions and dispositions, and leasing related to the income-producing portfolio. Annual distributions to unitholders are expected to continue to be funded by cash flows generated from our portfolio.
CAPITAL RESOURCES AND LIQUIDITY
We employ a broad range of financing strategies to facilitate growth and manage financial risk, with particular emphasis on the overall reduction of the weighted-average cost of capital, in order to enhance returns for unitholders. Our principal liquidity needs for the next twelve months are to:
| • | fund recurring expenses; |
| • | meet debt service requirements; |
| • | fund those capital expenditures deemed mandatory, including tenant improvements; |
| • | fund current development costs not covered by construction loans; and |
| • | fund investing activities, which could include: |
| ▪ | discretionary capital expenditures; |
| ▪ | property acquisitions; and |
| ▪ | repurchases of our units. |
We believe that our liquidity needs will be satisfied using cash on hand and cash flows generated from operating, investing, and financing activities. Rental revenue, recoveries from tenants, interest and other income, available cash balances, divestiture of non-core assets, draws on our credit facilities and refinancings (including upward refinancings) of maturing indebtedness are our principal sources of capital used to pay operating expenses, distributions, debt service, capital expenditures, and leasing costs in our commercial-property portfolio. We seek to increase income from our existing properties by controlling operating expenses and by maintaining quality standards for our properties that promote high occupancy rates and support increases in rental rates while reducing tenant turnover. We believe our revenue, along with proceeds from financing activities, will continue to provide the necessary funds for our short-term liquidity needs and to fund anticipated ongoing distributions. However, material changes in these factors may adversely affect our net cash flows.
Our principal liquidity needs for periods beyond the next year are for scheduled debt maturities, unit distributions, development costs and capital expenditures. We plan to meet these needs with one or more of the following:
| • | cash flow from operating activities; |
| • | credit facilities and refinancing opportunities; |
| • | divestiture of commercial properties. |
Our investment property and corporate debt is primarily fixed-rate and non-recourse to the Trust. These investment-grade financings are typically structured on a loan-to-appraised-value basis of between 50% and 65% as market conditions permit. In addition, in certain circumstances where a building is leased almost exclusively to a high-credit-quality tenant, a higher loan-to-value financing, based on the tenant’s credit quality, is put in place at rates commensurate with the cost of funds for the tenant. This reduces our equity requirements to finance investment property and enhances equity returns.
Most of our borrowings are in the form of long-term property-specific financings with recourse only to the specific assets. Limiting recourse to specific assets ensures that poor performance within one area does not compromise our ability to finance the balance of our operations. Our maturity schedule is fairly diversified so that financing requirements in any given year are manageable.
Our focus on structuring financings with investment-grade characteristics ensures that debt levels on any particular asset can typically be maintained throughout a business cycle. This enables us to limit covenants and other performance requirements, thereby reducing the risk of early payment requirements or restrictions on the distribution of cash from the assets being financed.
To help ensure we are able to react to investment opportunities quickly and on a value basis, we attempt to maintain a high level of liquidity. Our primary sources of liquidity consist of cash and undrawn committed credit facilities. In addition, we structure our affairs to facilitate monetization of longer-duration assets through financings, co-investor participations, or refinancings.
At March 31, 2017, our available liquidity consists of $59.2 million of cash on hand, and $268.0 million of undrawn capacity on our corporate credit facility.
Cost of Capital
We continually strive to reduce our weighted-average cost of capital and improve unitholders’ equity returns through value-enhancement initiatives and the consistent monitoring of the balance between debt and equity financing.
As of March 31, 2017, our weighted-average cost of capital, assuming a long-term 9.0% return on equity, was 6.4%. Our cost of capital is lower than many of our peers because of the greater amount of investment-grade financing that can be placed on our assets, which is a function of the high-quality nature of both the assets and the tenant base that composes our portfolio. In determining the long-term 9.0% return on equity, management considers various factors including a review of various financial models such as dividend growth model and capital asset pricing model, as well as examination of market returns. Based on the calculations of the financial models, market returns and historic returns achieved by the Trust, management believes that the long-term 9.0% return is an appropriate benchmark.
| Brookfield Canada Office Properties | 23 |
The following schedule details the capitalization of the Trust and the related costs thereof:
| | | Cost of Capital(1) | | | Underlying Value(2) | |
| (Millions, except cost of capital data) | | Mar. 31, 2017 | | | Dec. 31, 2016 | | | Mar. 31, 2017 | | | Dec. 31, 2016 | |
| Liabilities | | | | | | | | | | | | | | | | |
| Investment property and corporate debt | | | 3.8 | % | | | 3.8 | % | | $ | 2,869.9 | | | $ | 2,828.0 | |
| Unitholders’ equity | | | | | | | | | | | | | | | | |
| Trust Units(3) | | | 9.0 | % | | | 9.0 | % | | | 825.0 | | | | 692.5 | |
| Other equity | | | | | | | | | | | | | | | | |
| Non-controlling interest(3) | | | 9.0 | % | | | 9.0 | % | | | 2,096.9 | | | | 1,760.0 | |
| Total | | | 6.4 | % | | | 6.2 | % | | $ | 5,791.8 | | | $ | 5,280.5 | |
(1)Total weighted-average cost of capital is calculated on the weighted average of underlying value.
(2)Underlying value of liabilities presents the cost to retire debt on maturity. Underlying value of unitholders’ equity and other equity is based on the closing unit price of BOX on the Toronto Stock Exchange.
(3)Assumes a long-term 9.0% return on equity for March 31, 2017 and December 31, 2016.
OPERATING RESULTS
Included on the following pages is a discussion of the various components of our operating results in accordance with IFRS followed by a discussion of non-IFRS measures and corresponding reconciliations to comparable IFRS measures.
The following table represents operating results in accordance with IFRS:
| | | Three months ended Mar. 31 | |
| (Millions, except per unit amounts) | | 2017 | | | 2016 | |
| Commercial property revenue | | $ | 131.2 | | | $ | 129.3 | |
| Direct commercial property expense | | | 64.9 | | | | 66.9 | |
| | | | 66.3 | | | | 62.4 | |
| Interest expense | | | 22.5 | | | | 23.8 | |
| General and administrative expense | | | 7.1 | | | | 6.3 | |
| Income before fair value gains (losses) | | | 36.7 | | | | 32.3 | |
| Fair value gains (losses) | | | 22.7 | | | | (21.3 | ) |
| Net income and comprehensive income | | $ | 59.4 | | | $ | 11.0 | |
| Net income and comprehensive income attributable to: | | | | | | | | |
| Unitholders | | $ | 16.6 | | | $ | 3.1 | |
| Non-controlling interest | | | 42.8 | | | | 7.9 | |
| | | $ | 59.4 | | | $ | 11.0 | |
| Net income per Trust unit | | $ | 0.64 | | | $ | 0.12 | |
COMMERCIAL PROPERTY REVENUE
Revenue from commercial properties includes rental revenues earned from tenant leases, straight-line rent, percentage rent, and additional rent from the recovery of operating costs and property taxes. Revenue from investment properties totaled $131.2 million for the three months ended March 31, 2017 (compared to $129.3 million during the same period in 2016). The increase is primarily due to higher base rents and recoveries related to new deals and expansions at Brookfield Place Toronto; offset by lower base rents and recoveries as a result of the sale of Royal Centre in the first quarter of 2016 and expiries at Fifth Avenue Place.
The components of revenue are as follows:
| | | Three months ended Mar. 31 | |
| (Millions) | | 2017 | | | 2016 | |
| Rental revenue | | $ | 128.5 | | | $ | 128.0 | |
| Non-cash rental revenue | | | 2.3 | | | | 0.9 | |
| Lease termination and other income | | | 0.4 | | | | 0.4 | |
| Commercial property revenue | | $ | 131.2 | | | $ | 129.3 | |
Our strategy of owning premier properties in high-growth, and, in many instances, supply-constrained markets with high barriers to entry, along with our focus on executing long-term leases with strong credit-rated tenants, has created one of Canada’s most distinguished portfolios of office properties. In the past, this strategy has reduced our exposure to the cyclical nature of the real estate business. We feel confident with our current rollover exposure, which is the percentage of our total managed space currently scheduled to expire, and are focused on working toward renewals on expiries and backfilling vacant spaces in the upcoming months, as well as continuing to manage our rollover exposure in the future years.
Our leases generally have clauses that provide for the collection of rental revenues in amounts that increase every few years, with these increases negotiated at the signing of the lease. During the three months ended March 31, 2017, approximately 37.0% of our leases executed had rent escalation clauses. On average, these escalation clauses will increase rent annually by 1.2% over the terms of the respective leases. The large number of high-credit-quality tenants in our portfolio lowers the risk of not realizing these increases. IFRS requires that these increases be recorded on a straight-line basis over the life of the lease. For the three months ended March 31, 2017, we recognized $2.3 million of non-cash rental revenue (compared to $0.9 million of non-cash rental expense during the same period in 2016). Direct commercial property expenses, which include real estate taxes, utilities, insurance, repairs and maintenance, cleaning, and other property-related expenses were $64.9 million for the three months ended March 31, 2017 (compared to $66.9 million during the same period in 2016).
Substantially all of our leases are net leases, in which the lessee is required to pay its proportionate share of the property’s operating expenses such as utilities, repairs, insurance, and taxes. Consequently, leasing activity is the principal contributor to the change in same-property net operating income. Our total portfolio occupancy rate ended the quarter at 94.7%. At March 31, 2017, average in-place net rent throughout the portfolio was $30 per square foot, compared with an average market net rent of $28 per square foot.
The following table shows the average lease term, in-place rents, and estimated current market rents for similar space in each of our markets as of March 31, 2017:
| | | | | | Avg. | | | Avg. In-Place(1) | | | Avg. Market(2) | |
| | | Leasable Area | | | Lease Term | | | Net Rent | | | Net Rent | |
| Region | | (000's Sq. Ft.) | | | (Years) | | | ($ per Sq. Ft.) | | | ($ per Sq. Ft.) | |
| Toronto, Ontario | | | 9,253 | | | | 7.0 | | | | 30 | | | | 33 | |
| Ottawa, Ontario | | | 1,731 | | | | 6.6 | | | | 20 | | | | 18 | |
| Calgary, Alberta | | | 5,738 | | | | 9.7 | | | | 31 | | | | 23 | |
| Other | | | 3 | | | | — | | | | — | | | | — | |
| Total | | | 16,725 | | | | 7.9 | | | | 30 | | | | 28 | |
(1)Average in-place net rent represents the annualized cash amount on a per square foot basis collected from tenants plus tenant expense reimbursements less the operating expenses being incurred for that space, excluding the impact of straight-lining rent escalations or amortizing free rent periods provided on in-place leases.
(2)Average market net rent represents management’s estimate of average rent per square foot for buildings of similar quality to our portfolio. However, it may not necessarily be representative of the specific space that is rolling in any specific year.
| Brookfield Canada Office Properties | 25 |
A summary of current and historical occupancy levels at March 31 for the past two years is as follows:
| | | Mar. 31, 2017 | | | Mar. 31, 2016 | |
| | | Leasable | | | % | | | Leasable | | | % | |
| (000’s Sq. Ft., except % leased data) | | Area | | | Leased | | | Area | | | Leased | |
| Toronto, Ontario | | | 9,253 | | | | 95.5 | | | | 9,264 | | | | 94.4 | |
| Ottawa, Ontario | | | 1,731 | | | | 95.0 | | | | 1,730 | | | | 94.7 | |
| Calgary, Alberta | | | 5,738 | | | | 93.3 | | | | 5,633 | | | | 96.8 | |
| Other | | | 3 | | | | 100.0 | | | | 3 | | | | 100.0 | |
| Total | | | 16,725 | | | | 94.7 | | | | 16,630 | | | | 95.2 | |
During the first quarter of 2017, we leased 195,000 square feet of space, which included 165,000 square feet of new leasing, and 30,000 square feet of renewals, compared to expiries of 196,000 square feet and accelerated expiries of 4,000 square feet. The overall average leasing net rent was $34 per square foot, compared to an average expiring net rent of $30 per square foot. At March 31, 2017, the average leasing net rent related to new and renewed leases was $34 per square foot and $36 per square foot, respectively.
Leasing highlights from the first quarter include:
| • | A 15-year, 57,000-square foot new lease with Harlequin Enterprises Limited at Bay Adelaide East |
| • | A seven-year, 34,000-square foot renewal with Public Works & Government Services Canada at Exchange Tower |
| • | A six-year, 21,000-square foot new lease with EventMobi at Queen's Quay Terminal |
The details of our leasing activity for the three months ended March 31, 2017, are as follows:
| | | | | | Activities during the three months ended March 31, 2017 | | | | |
| | | | | | | | | Average(2) | | | | | | | | | Year One(3) | | | Average(4) | | | | |
| | | Dec. 31, 2016 | | | | | | Expiring | | | Leasing | | | Leasing | | | Leasing | | | Mar. 31, 2017 | |
| (000's Sq. Ft.) | | Leased(1) | | | Expiries | | | Net Rent | | | New | | | Renewal | | | Net Rent | | | Net Rent | | | Leased | |
| Toronto, Ontario | | | 8,840 | | | | (193 | ) | | $ | 31 | | | | 163 | | | | 27 | | | $ | 34 | | | $ | 35 | | | | 8,837 | |
| Ottawa, Ontario | | | 1,644 | | | | — | | | | — | | | | — | | | | — | | | | — | | | | — | | | | 1,644 | |
| Calgary, Alberta | | | 5,356 | | | | (7 | ) | | | 29 | | | | 2 | | | | 3 | | | | 20 | | | | 20 | | | | 5,354 | |
| Other | | | 3 | | | | — | | | | — | | | | — | | | | — | | | | — | | | | — | | | | 3 | |
| Total Leasing | | | 15,843 | | | | (200 | ) | | $ | 30 | | | | 165 | | | | 30 | | | | 33 | | | | 34 | | | | 15,838 | |
| | | | | | | | | | | | | | | | | | | | | | | | | | | | | | | | | |
| Development | | | 1,140 | | | | — | | | | — | | | | — | | | | — | | | | — | | | | — | | | | 1,140 | |
(1)Restated for re-measurements.
(2)Represents net rent in the final year.
(3)Year one leasing net rent is the rent at the commencement of the lease term on a per square foot basis including tenant expense reimbursements, less operating expenses being incurred for that space, but excluding the impact of straight-lining rent escalations or amortization of free rent periods.
(4)Average leasing net rent is the average rent over the lease term on a per square foot basis including tenant expense reimbursements, less operating expenses being incurred for that space, but including the impact of straight-lining rent escalations or amortization of free rent periods.
Additionally, during the three months ended March 31, 2017, tenant improvements and leasing costs related to leasing activity that occurred averaged $18.40 per square foot, of which $21.18 per square foot and $3.33 per square foot related to new and renewed leases, respectively, compared to $10.08 per square foot during the same prior year period. The increase from the prior year period is primarily related to the higher tenant improvements and leasing commissions incurred at Brookfield Place Toronto, Bay Adelaide East and Queen's Quay Terminal.
INTEREST EXPENSE
Interest expense totaled $22.5 million during the three months ended March 31, 2017 (compared to $23.8 million during the same period in 2016). The decrease is due to the reduction of interest as a result of the sale of Royal Centre in the first quarter of 2016 and a lower outstanding balance on the revolving corporate facility.
GENERAL AND ADMINISTRATIVE EXPENSES
General and administrative expenses were $7.1 million during the three months ended March 31, 2017 (compared to $6.3 million during the same period in 2016).
INCOME TAX EXPENSE
The Trust is a “mutual fund trust” pursuant to theIncome Tax Act (Canada). The Trust distributes or designates all taxable earnings to unitholders, and as such, under current legislation, the obligation to pay tax rests with each unitholder. No current and deferred tax provisions are required on the Trust’s income.
FAIR VALUE GAINS (LOSSES)
During the three months ended March 31, 2017, the Trust recognized a fair value gain of $22.7 million (compared to $21.3 million of fair value losses during the same period in 2016). Fair value adjustments are determined based on the movement of various parameters on a quarterly basis, including changes in projected cash flows as a result of leasing and timing, discount rates, and terminal capitalization rates. Our investment property valuations have increased from December 31, 2016, resulting from decreased downtime on major tenants and changes in leasing assumptions across the portfolio.
| Brookfield Canada Office Properties | 27 |
NON-IFRS MEASURES
Although we monitor and analyze our financial performance using a number of indicators, our primary business objective of generating reliable and growing cash flow is monitored and analyzed using net income (an IFRS measure), commercial property net operating income, same property net operating income, Trust funds from operations, adjusted funds from operations and total equity per unit. Although net income is calculated in accordance with IFRS, IFRS does not prescribe standardized meanings for commercial property net operating income, Trust funds from operations, adjusted funds from operations and total equity per unit; therefore, they are unlikely to be comparable to similar measures presented by other entities.
Commercial property net operating income
Commercial property net operating income is defined by us as adjusted commercial property revenue net of direct property operating expenses, including property administration costs that have been deducted but prior to deducting interest expense, general and administrative expenses, and fair value gains (losses). Included in adjusted commercial property revenue and revaluation gain (loss) is the impact of rental payments received pursuant to a related party lease, which in accordance with IFRS, would be included in fair value gains (losses). Commercial property net operating income is used as a key indicator of performance, as it represents a measure over which management of our commercial property operations has control.
Same property net operating income
Same property net operating income or "Same property NOI" is a subset of net operating income, which excludes net operating income that is earned from assets acquired, disposed of or developed during the periods presented, or not of a recurring nature. Same property NOI allows the Trust to segregate the performance of leasing and operating initiatives of the portfolio from the impact to performance from investing activities and non-recurring income (charges), which for the historical periods presented consist primarily of lease termination income.
Trust Funds from Operations
Trust funds from operations or "Trust FFO" is defined by us as net income prior to transaction costs, revaluation gain (loss) which include the impact of rental payments received from the related party lease as described below, and certain other non-cash items, if any. Trust FFO does not represent or approximate cash generated from operating activities and is determined in accordance with the REALPAC FFO white paper, except for the inclusion of the rental lease payments. It further includes all adjustments that are outlined in the NAREIT definition of FFO.
Adjusted Funds from Operations
Adjusted funds from operations or “AFFO” is defined by us as Trust FFO net of actual second-generation leasing commissions and tenant improvements, actual maintaining value capital expenditures, and straight-line rental income. AFFO is a widely used measure used to assess an entity’s ability to pay distributions.
Total Equity per Unit
Total equity per unit represents the book value of our total equity divided by total units outstanding. We believe that total equity per unit is an important measure of our current financial position because it reflects our total equity adjusted for all inflows and outflows, including Trust FFO and changes in the value of our investment properties.
RECONCILIATION OF ADJUSTED COMMERCIAL PROPERTY REVENUE AND REVALUATION GAIN (LOSS)
As part of the Trust’s acquisition of Bay Adelaide East from BOPI on an “as-if-completed-and-stabilized basis”, the parties entered into a lease arrangement, whereby the Trust would receive supplemental payments as part of a related party lease arrangement with BOPI that would result in the Trust receiving the net operating cash flows reflective of stabilized 95% occupancy at the property, which is expected to occur in 2017.
Management has adjusted commercial property revenue and revaluation gain (loss) to reflect the impact of rental payments received pursuant to the related party lease of $2.4 million during the three months ended March 31, 2017 (compared to $6.3 million during the same period in 2016), net of the non-cash straight-line rental revenue recognized in accordance with IFRS.
The Trust has received rental payments of $5.0 million during the three months ended March 31, 2017 (compared to $7.5 million during the same period in 2016 from BOPI), with respect to the leaseable area of Bay Adelaide East that is not currently generating third-party cash rental income.
Under IFRS, the rental payments received from BOPI are accounted for as a reduction to the carrying value of investment property as they were agreed to in connection with the initial acquisition of the property from BOPI. The rental payments receivable from BOPI in this arrangement are inherently reflected in the fair value of the investment property as part of the expected future cash flows in the Trust’s discounted cash flow model. When the property is subsequently measured at fair value at year-end, the impact of the reduction to carrying value of the investment property as a result of the rental payments received impacts the measurement of the fair value gains (losses) inherent in the reconciliation of investment properties disclosed in accordance with International Accounting Standard ("IAS") 40, "Investment Property".
| Brookfield Canada Office Properties | 29 |
In accordance with IAS 17, "Leases", the Trust recognizes any third-party lease revenue on a straight-line basis over the lease term. As a result, the Trust has recognized non-cash straight-line rental revenue related to leases with third-party tenants that are not yet making cash payments of $2.6 million during three months ended March 31, 2017 (compared to $1.2 million during the same period in 2016), but for which the Trust still receives cash rental payments pursuant to the related party lease.
The adjustment to commercial property revenue presents the rental payments received from BOPI, net of the non-cash revenue currently recognized under IFRS, as though they were received pursuant to a third-party lease and recorded as rental revenue. As a result, there is a corresponding adjustment to reverse the impact of recording the payments as the reduction to the carrying value of the investment property, which results in an offsetting adjustment to fair value gains (losses).
The net impact during the three months ended March 31, 2017 of this adjustment is $2.4 million (compared to $6.3 million during the same period in 2016).
The Trust believes the inclusion of the rental lease payments, net of non-cash rental revenue, is important to help investors understand the contracted economics of the Bay Adelaide East acquisition on an “as-if-completed-and-stabilized basis” and the resulting recurring operating cash flows generated pursuant to that arrangement.
The following table is a reconciliation of the adjusted commercial property revenue and revaluation gain (loss).
| | | Three months ended Mar. 31 | |
| (Millions, except per unit amounts) | | 2017 | | | 2016 | |
| Commercial property revenue per IFRS | | $ | 131.2 | | | $ | 129.3 | |
| Add: | | | | | | | | |
| Impact of rental payments received from related party lease | | | 2.4 | | | | 6.3 | |
| Adjusted commercial property revenue | | | 133.6 | | | | 135.6 | |
| | | | | | | | | |
| Fair value gains (losses) per IFRS | | | 22.7 | | | | (21.3 | ) |
| Deduct: | | | | | | | | |
| Impact of rental payments received from related party lease | | | (2.4 | ) | | | (6.3 | ) |
| Revaluation gain (loss) | | $ | 20.3 | | | $ | (27.6 | ) |
COMMERCIAL PROPERTY NET OPERATING INCOME Commercial Property NOI by City for the three months ended March 31, 2017 (in $millions) | | 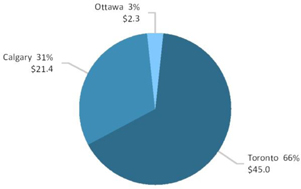 |
Commercial property net operating income includes adjusted commercial property revenue less direct commercial property expense and is a key indicator of performance as it represents a measure over which management of the commercial property operations has control. One of the ways in which we evaluate performance is by comparing the performance of the commercial property portfolio on a same property basis. Same property commercial property net operating income is defined as properties included in our consolidated results that we own and operate throughout both the current and prior period. Accordingly, same property results would exclude properties acquired or sold during each period, as well as significant lease termination and other income (charges) amounts that are non-recurring.
Our commercial property net operating income for the three months ended March 31, 2017, was $68.7 million (compared to $68.7 million during the same period in 2016). Commercial property net operating income for the first quarter of 2017 was primarily driven by higher base rents and recoveries related to new deals and expansions at Brookfield Place Toronto; offset by loss of net operating income due to the sale of Royal Centre in the first quarter of 2016 and lower base rents and recoveries related to expiries at Fifth Avenue Place.
The components of commercial property net operating income are as follows:
| | | Three months ended Mar. 31 | |
| (Millions) | | 2017 | | | 2016 | |
| Adjusted commercial property revenue(1) | | $ | 133.6 | | | $ | 135.6 | |
| Direct commercial property expense | | | 64.9 | | | | 66.9 | |
| Total | | $ | 68.7 | | | $ | 68.7 | |
(1)Refer to Reconciliation of adjusted commercial property revenue and revaluation gain (loss)above.
Same commercial property operation highlights are as follows:
| | | Three months ended Mar. 31 | |
| (Millions) | | 2017 | | | 2016 | |
| Commercial property net operating income – same property | | $ | 68.3 | | | $ | 66.9 | |
| Commercial property net operating income – property sold during period(1) | | | — | | | | 1.5 | |
| Lease termination and other income | | | 0.4 | | | | 0.3 | |
| Total | | $ | 68.7 | | | $ | 68.7 | |
(1)Royal Centre in Vancouver sold in Q1 2016.
RECONCILIATION OF NET INCOME TO COMMERCIAL PROPERTY NET OPERATING INCOME
| | | Three months ended Mar. 31 | |
| (Millions, except per unit amounts) | | 2017 | | | 2016 | |
| Net income | | $ | 59.4 | | | $ | 11.0 | |
| Add (deduct): | | | | | | | | |
| Revaluation (gain) loss(1) | | | (20.3 | ) | | | 27.6 | |
| General and administrative expense | | | 7.1 | | | | 6.3 | |
| Interest expense | | | 22.5 | | | | 23.8 | |
| Commercial property net operating income | | $ | 68.7 | | | $ | 68.7 | |
(1)Refer to Reconciliation of adjusted commercial property revenue and revaluation gain (loss) on page 24.
RECONCILIATION OF NET INCOME TO TRUST FUNDS FROM OPERATIONS
Trust funds from operations was $0.42 per unit during the three months ended March 31, 2017 (compared to $0.42 per unit during the same period in 2016).
| Brookfield Canada Office Properties | 31 |
| | | Three months ended Mar. 31 | |
| (Millions, except per unit amounts) | | 2017 | | | 2016 | |
| Net income | | $ | 59.4 | | | $ | 11.0 | |
| Add (deduct): | | | | | | | | |
| Revaluation (gain) loss(1) | | | (20.3 | ) | | | 27.6 | |
| Amortization of lease incentives | | | 0.3 | | | | 0.4 | |
| Trust funds from operations | | $ | 39.4 | | | $ | 39.0 | |
| Trust funds from operations attributable to unitholders | | | 11.0 | | | | 10.9 | |
| Trust funds from operations attributable to non-controlling interest | | | 28.4 | | | | 28.1 | |
| | | $ | 39.4 | | | $ | 39.0 | |
| Weighted average Trust Units outstanding | | | 26.4 | | | | 26.3 | |
| Trust funds from operations per Trust unit | | $ | 0.42 | | | $ | 0.42 | |
(1)Refer to Reconciliation of adjusted commercial property revenue and revaluation gain (loss) on page 24.
RECONCILIATION OF TRUST FUNDS FROM OPERATIONS TO ADJUSTED FUNDS FROM OPERATIONS
Adjusted funds from operations totaled $0.33 per unit during the three months ended March 31, 2017 (compared to $0.35 per unit during the same period in 2016).
| | | Three months ended Mar. 31 | |
| (Millions, except per unit amounts) | | 2017 | | | 2016 | |
| Trust funds from operations | | $ | 39.4 | | | $ | 39.0 | |
| Deduct: | | | | | | | | |
| Straight-line rental (income) expense | | | — | | | | (0.1 | ) |
| Second-generation leasing commissions and tenant improvements | | | (7.6 | ) | | | (5.4 | ) |
| Maintaining value capital expenditures | | | (0.7 | ) | | | (0.4 | ) |
| Adjusted funds from operations | | $ | 31.1 | | | $ | 33.1 | |
| Adjusted funds from operations attributable to unitholders | | | 8.7 | | | | 9.3 | |
| Adjusted funds from operations attributable to non-controlling interest | | | 22.4 | | | | 23.8 | |
| | | $ | 31.1 | | | $ | 33.1 | |
| Weighted average Trust Units outstanding | | | 26.4 | | | | 26.3 | |
| Adjusted funds from operations per Trust Unit | | $ | 0.33 | | | $ | 0.35 | |
| Trust unit distribution declared | | $ | 0.33 | | | $ | 0.32 | |
| Distribution ratio | | | 100 | % | | | 91 | % |
AFFO is calculated by adjusting Trust FFO for straight-line rental income, actual second-generation leasing commissions and tenant improvements, and actual maintaining value capital expenditures for maintaining the infrastructure and current rental revenues of our properties. Actual expenditures will vary from period to period and at times could be materially different depending on the timing of leasing activities and capital plans. As a result, AFFO will experience volatility when comparing period-over-period results. Due to the volatile nature of AFFO, we believe that it is important to compare the actual results with historic and projected averages of leasing costs and maintaining value capital expenditures in order to determine the effects of a full office leasing cycle. Our 5-year historic average reflects the actual leasing activities completed, while the 10-year average projections reflect our leasing expiry profile. We also believe that these averages will provide insight to determining the normalized distribution payout ratio and growth in adjusted funds from operations.
The historic and projected averages are as follows:
| | | Annual amount | |
| | | 5-year | | | 10-year | |
| (Millions) | | historical average | | | average plan | |
| Second generation | | | | | | | | |
| Leasing commissions | | $ | 5.8 | | | $ | 6.3 | |
| Tenant improvements | | | 21.3 | | | | 14.0 | |
| Maintaining value capital expenditures | | | 7.2 | | | | 7.2 | |
RECONCILIATION OF CASH FLOWS PROVIDED BY OPERATING ACTIVITIES TO ADJUSTED FUNDS FROM OPERATIONS
| | | Three months ended Mar. 31 | |
| (Millions) | | 2017 | | | 2016 | |
| Cash flows provided by operating activities | | $ | 35.8 | | | $ | 44.8 | |
| Add (deduct): | | | | | | | | |
| Working capital and other | | | 0.7 | | | | (7.6 | ) |
| Leasing commissions and tenant inducements | | | 3.5 | | | | 2.6 | |
| Amortization of deferred financing costs | | | (0.6 | ) | | | (0.9 | ) |
| Second-generation leasing commissions and tenant improvements | | | (7.6 | ) | | | (5.4 | ) |
| Maintaining value capital expenditures | | | (0.7 | ) | | | (0.4 | ) |
| Adjusted funds from operations | | $ | 31.1 | | | $ | 33.1 | |
| Brookfield Canada Office Properties | 33 |
QUARTERLY RESULTS
The results by quarter are as follows:
| | | 2017 | | | 2016 | | | 2015 | |
| (Millions, except per unit amounts) | | Q1 | | | Q4 | | | Q3 | | | Q2 | | | Q1 | | | Q4 | | | Q3 | | | Q2 | |
| Adjusted commercial property revenue(1) | | $ | 133.6 | | | $ | 139.3 | | | $ | 131.4 | | | $ | 131.3 | | | $ | 135.6 | | | $ | 134.7 | | | $ | 128.3 | | | $ | 126.3 | |
| Commercial property net operating income | | | 68.7 | | | | 67.6 | | | | 66.8 | | | | 68.8 | | | | 68.7 | | | | 64.8 | | | | 59.5 | | | | 63.2 | |
| Interest expense | | | 22.5 | | | | 22.8 | | | | 22.6 | | | | 22.4 | | | | 23.8 | | | | 21.4 | | | | 21.0 | | | | 20.8 | |
| Trust funds from operations | | | 39.4 | | | | 39.2 | | | | 38.5 | | | | 40.2 | | | | 39.0 | | | | 38.5 | | | | 33.4 | | | | 36.8 | |
| Adjusted funds from operations | | | 31.1 | | | | 25.6 | | | | 32.3 | | | | 30.1 | | | | 33.1 | | | | 19.6 | | | | 25.0 | | | | 21.4 | |
| Net income (loss) | | | 59.4 | | | | 64.2 | | | | (25.5 | ) | | | 45.8 | | | | 11.0 | | | | 158.8 | | | | 50.3 | | | | 83.6 | |
| Net income (loss) per Trust unit | | $ | 0.64 | | | $ | 0.69 | | | $ | (0.27 | ) | | $ | 0.49 | | | $ | 0.12 | | | $ | 1.70 | | | $ | 0.54 | | | $ | 0.90 | |
(1)Refer to Reconciliation of adjusted commercial property revenue and revaluation gain (loss) on page 24.
PART III – RISKS AND UNCERTAINTIES
BOX’s financial results are affected by the performance of our operations and various external factors influencing the specific sectors and geographic locations in which we operate, as well as macroeconomic factors such as economic growth, inflation, interest rates, regulatory requirements and initiatives, and litigation and claims that arise in the normal course of business.
Our strategy is to invest in premier assets that generate sustainable streams of cash flow. Although high-quality assets may initially generate lower returns on capital, we believe that the sustainability and future growth of their cash flows is more assured over the long term and, as a result, warrant higher valuation levels. We also believe that the high quality of our asset base protects the Trust against future uncertainty and enables us to invest with confidence when opportunities arise.
The following is a review of the material factors and the potential impact these factors may have on our business operations. A more detailed description of our business environment and risks is contained in our Annual Information Form, which is posted on our web site at www.brookfieldcanadareit.com or at www.sedar.com or www.sec.gov.
PROPERTY-RELATED RISKS
Our strategy is to invest in high-quality office properties as defined by the physical characteristics of the asset and, more important, the certainty of receiving rental payments from large corporate tenants (with investment-grade credit ratings – see “Credit Risk” on page 29) that these properties attract. Nonetheless, we remain exposed to certain risks inherent in the core office-property business.
Commercial property investments are generally subject to varying degrees of risk depending on the nature of the property. These risks include changes in general economic conditions (such as the availability and costs of mortgage funds), local conditions (such as an oversupply of space or a reduction in demand for real estate in the markets in which we operate), the attractiveness of the properties to tenants, competition from other landlords with competitive space, and our ability to provide adequate maintenance at an economical cost.
Certain significant expenditures, including property taxes, maintenance costs, mortgage payments, insurance costs, and related charges, must be made regardless of whether a property is producing sufficient income to service these expenses. Our office properties are subject to mortgages that require substantial debt service payments. If we become unable or unwilling to meet mortgage payments on any property, losses could be sustained as a result of the mortgagee’s exercise of its rights of foreclosure or of sale. We believe the stability and long-term nature of our contractual revenues effectively mitigates these risks.
As owners of premier office properties, lease rollovers also present a risk, as continued growth of rental income is dependent on strong leasing markets to ensure expiring leases are renewed and new tenants are found promptly to fill vacancies. Refer to “Lease Rollover Risk” on page 29 of this MD&A for further details.
INTEREST RATE AND FINANCING RISK
We attempt to stagger the maturities of our mortgage portfolio evenly over a 10-year time horizon. We believe that this strategy will most effectively manage interest rate risk.
As outlined under “Capital Resources and Liquidity,” on page 18 of this MD&A, we have an ongoing need to access debt markets to refinance maturing debt as it comes due. There is a risk that lenders will not refinance such maturing debt on terms and conditions acceptable to us or on any terms at all. Our strategy to stagger the maturities of our mortgage portfolio attempts to mitigate our exposure to excessive amounts of debt maturing in any one year.
Approximately 31.5% of our outstanding investment property and corporate debt at March 31, 2017 is floating-rate debt (December 31, 2016 – 30.0%) and subject to fluctuations in interest rates. The effect of a 25-basis point increase in interest rates on interest expense relating to our floating-rate debt, all else being equal, is an increase in interest expense of $2.3 million on an annual basis or $0.02 per unit. In addition, there is interest rate risk associated with the Trust’s fixed rate debt due to the expected requirement to refinance such debt in the year of maturity. The effect of a 25-basis point increase in interest rates on interest expense relating to fixed rate debt maturing within one year, all else being equal, is an increase in interest expense of $0.1 million on an annual basis or approximately $nil per unit.
The analysis does not reflect the impact a changing interest rate environment could have on our overall performance and, as a result, it does not reflect the actions management may take in such an environment.
| Brookfield Canada Office Properties | 35 |
We currently have a level of indebtedness for the Trust of 46.3% of the fair market value of our commercial and development properties. This level of indebtedness is considered by the Trust to be conservative and, based on this, the Trust believes that all debts will be financed or refinanced as they come due in the foreseeable future.
CREDIT RISK
Credit risk arises from the possibility that tenants may be unable to fulfill their lease commitments. We mitigate this risk by ensuring that our tenant mix is diversified and by limiting our exposure to any one tenant. We also maintain a portfolio that is diversified by industry type so that exposure to a business sector is lessened. Currently, no single tenant represents more than 11.0% of total leasable area and 7.3% of commercial property revenue.
We attempt to mitigate our credit risk by signing long-term leases with tenants who have investment-grade credit ratings. The Trust directs special attention to the credit quality of our tenants in order to ensure the long-term sustainability of rental revenues through economic cycles. Once a lease has been signed, the Trust proactively monitors the financial performance of significant tenants on a regular basis and reviews the status of arrears. The Trust regularly monitors indicators of increased risk within its tenant portfolio and maintains a formalized tenant credit report to identify natural changes in credit quality.
The following list shows our top 20 largest tenants by leasable area in our commercial properties portfolio and their respective lease commitments:
| | | | | | | | | 000’s Sq. Ft.(2) | | | | | | | | | |
| | | Tenant | | Primary Location | | Credit Rating(1) | | 2017 | | | 2018 | | | 2019 | | | 2020 | | | 2021 | | | 2022 | | | Beyond | | | Year of
Expiry(2) | | Total | | | % of
Sq. Ft.(3) | |
| 1 | | Government and Related Agencies | | Toronto, Ottawa | | AAA | | | | | | | 225 | | | | 122 | | | | | | | | 562 | | | | 6 | | | | 931 | | | 2023/2029 | | | 1,846 | | | | 11.0 | % |
| 2 | | Suncor Energy Inc. | | Calgary | | A- | | | | | | | | | | | | | | | | | | | | | | | | | | | 1,332 | | | 2028 | | | 1,332 | | | | 8.0 | % |
| 3 | | Bank of Montreal | | Toronto, Calgary | | A+ | �� | | | | | | 20 | | | | | | | | | | | | 5 | | | | | | | | 1,078 | | | 2023/2024 | | | 1,103 | | | | 6.5 | % |
| 4 | | Deloitte LLP | | Toronto, Calgary | | Not Rated | | | | | | | | | | | | | | | | | | | | | | | | | | | 575 | | | Various | | | 575 | | | | 3.4 | % |
| 5 | | Canadian Natural Resources | | Calgary | | BBB+ | | | | | | | | | | | | | | | | | | | | | | | | | | | 531 | | | 2026 | | | 531 | | | | 3.2 | % |
| 6 | | Repsol Oil & Gas (Talisman Energy) | | Calgary | | BBB- | | | | | | | | | | | | | | | | | | | | | | | | | | | 446 | | | 2025 | | | 446 | | | | 2.7 | % |
| 7 | | Enbridge Inc. | | Calgary | | BBB+ | | | | | | | | | | | | | | | | | | | | | | | | | | | 401 | | | 2028 | | | 401 | | | | 2.4 | % |
| 8 | | Bennett Jones | | Toronto, Calgary | | Not Rated | | | | | | | | | | | | | | | | | | | 150 | | | | | | | | 173 | | | 2027 | | | 323 | | | | 1.9 | % |
| 9 | | CIBC | | Toronto, Calgary | | A+ | | | | | | | | | | | | | | | 160 | | | | | | | | | | | | 151 | | | 2026/2053 | | | 311 | | | | 1.9 | % |
| 10 | | KPMG Management Services LP | | Toronto | | Not Rated | | | | | | | | | | | | | | | | | | | | | | | | | | | 297 | | | 2025 | | | 297 | | | | 1.8 | % |
| 11 | | Royal Bank | | Toronto, Calgary | | AA- | | | | | | | | | | | 17 | | | | 3 | | | | 37 | | | | 39 | | | | 196 | | | Various | | | 292 | | | | 1.7 | % |
| 12 | | Osler, Hoskin & Harcourt | | Toronto | | Not Rated | | | | | | | | | | | | | | | | | | | | | | | | | | | 199 | | | 2030 | | | 199 | | | | 1.2 | % |
| 13 | | Goodmans LLP | | Toronto | | Not Rated | | | | | | | | | | | | | | | | | | | | | | | | | | | 182 | | | 2026 | | | 182 | | | | 1.1 | % |
| 14 | | Toronto Stock Exchange | | Toronto | | Not Rated | | | | | | | 131 | | | | | | | | 7 | | | | | | | | | | | | 42 | | | 2023 | | | 180 | | | | 1.1 | % |
| 15 | | The Bay | | Toronto | | B+ | | | | | | | | | | | 164 | | | | 15 | | | | | | | | | | | | | | | | | | 179 | | | | 1.1 | % |
| 16 | | Borden Ladner Gervais LLP | | Toronto | | Not Rated | | | | | | | | | | | | | | | | | | | | | | | | | | | 177 | | | 2032 | | | 177 | | | | 1.1 | % |
| 17 | | Gowlings Canada Inc. | | Toronto | | Not Rated | | | | | | | | | | | | | | | 170 | | | | | | | | | | | | | | | | | | 170 | | | | 1.0 | % |
| 18 | | The Manufacturers Life Insurance | | Toronto | | AA- | | | | | | | | | | | | | | | | | | | | | | | 169 | | | | | | | 2022 | | | 169 | | | | 1.0 | % |
| 19 | | Fasken Marteneau | | Toronto | | Not Rated | | | | | | | | | | | | | | | | | | | | | | | | | | | 165 | | | 2030 | | | 165 | | | | 1.0 | % |
| 20 | | Cenovus | | Calgary | | BBB | | | | | | | | | | | | | | | 163 | | | | | | | | | | | | | | | | | | 163 | | | | 1.0 | % |
| | | Total | | | | | | | — | | | | 376 | | | | 303 | | | | 518 | | | | 754 | | | | 214 | | | | 6,876 | | | | | | 9,041 | | | | 54.1 | % |
| | | Total % | | | | | | | — | % | | | 4.2 | % | | | 3.4 | % | | | 5.7 | % | | | 8.3 | % | | | 2.4 | % | | | 76.0 | % | | | | | 100.0 | % | | | | |
(1)From S&P.
(2)Reflects the year of maturity related to lease(s) included in the ‘Beyond’ column.
(3)Percentage of total leasable area of commercial properties, prior to considering partnership interests in partially owned properties; excludes parking.
LEASE ROLLOVER RISK
Lease roll-over risk arises from the possibility that we may experience difficulty renewing leases as they expire or in re-leasing space vacated by tenants upon early lease expiry. We attempt to stagger our lease-expiry profile so that we are not faced with disproportionate amounts of space expiring in any one year. Approximately 4.4%, on average, of our leases mature annually up to and including 2020. Our portfolio has a weighted-average lease life of eight years. We further mitigate this risk by maintaining a diversified portfolio mix by geographic location and by proactively leasing space in advance of its contractual expiry.
The following table sets out lease expiries, by square footage, for our portfolio at March 31, 2017.
| (000’s Sq. Ft.) | | Currently
Available | | | 2017 | | | 2018 | | | 2019 | | | 2020 | | | 2021 | | | 2022 | | | 2023 | | | 2024
& Beyond | | | Leasable | | | Parking | | | Total | |
| Toronto, Ontario | | | 416 | | | | 76 | | | | 475 | | | | 558 | | | | 982 | | | | 677 | | | | 962 | | | | 721 | | | | 4,386 | | | | 9,253 | | | | 1,737 | | | | 10,990 | |
| Ottawa, Ontario | | | 87 | | | | 11 | | | | 34 | | | | 86 | | | | 9 | | | | 575 | | | | 19 | | | | 262 | | | | 648 | | | | 1,731 | | | | 804 | | | | 2,535 | |
| Calgary, Alberta | | | 384 | | | | 39 | | | | 132 | | | | 82 | | | | 286 | | | | 126 | | | | 394 | | | | 107 | | | | 4,188 | | | | 5,738 | | | | 1,194 | | | | 6,932 | |
| Other | | | — | | | | — | | | | — | | | | 1 | | | | — | | | | — | | | | — | | | | — | | | | 2 | | | | 3 | | | | — | | | | 3 | |
| Total | | | 887 | | | | 126 | | | | 641 | | | | 727 | | | | 1,277 | | | | 1,378 | | | | 1,375 | | | | 1,090 | | | | 9,224 | | | | 16,725 | | | | 3,735 | | | | 20,460 | |
| % of total | | | 5.3 | % | | | 0.8 | % | | | 3.8 | % | | | 4.3 | % | | | 7.6 | % | | | 8.2 | % | | | 8.2 | % | | | 6.5 | % | | | 55.3 | % | | | 100.0 | % | | | — | % | | | 100.0 | % |
| Brookfield Canada Office Properties | 37 |
ENVIRONMENTAL RISKS
As an owner of real property, we are subject to various laws relating to environmental matters. These laws could hold us liable for the costs of removal and remediation of certain hazardous substances or waste present in our buildings, released or deposited on or in our properties or disposed of at other locations. These costs could be significant and would reduce cash available for our business. The failure to remove or remediate such substances could adversely affect our ability to sell or our ability to borrow using such real estate as collateral and could potentially result in claims against us. We are not aware of any material non-compliance with environmental laws at any of our properties nor are we aware of any pending or threatened investigations or actions by environmental regulatory authorities in connection with any of our properties or any pending or threatened claims relating to environmental conditions at our properties.
We will continue to make the necessary capital and operating expenditures to ensure that we are compliant with environmental laws and regulations. Although there can be no assurances, we do not believe that costs relating to environmental matters will have a material effect on our business, financial condition or results of operations. However, environmental laws and regulations can change rapidly and we may become subject to more stringent environmental laws and regulations in the future. Compliance with more stringent environmental laws and regulations could have an adverse effect on our business, financial condition, or results of operations.
OTHER RISKS AND UNCERTAINTIES
Real estate is relatively illiquid. Such illiquidity may limit our ability to vary our portfolio promptly in response to changing economic or investment conditions. Also, financial difficulties of other property owners resulting in distressed sales could depress real estate values in the markets in which we operate.
Our investment properties generate a relatively stable source of income from contractual tenant rent payments. Continued growth of rental income is dependent on strong leasing markets to ensure expiring leases are renewed and new tenants are found promptly to fill vacancies at attractive rental rates. With leasing markets performance being impacted by the strength of the economies in which we operate, it is possible we could see downward pressure on overall occupancy levels and net effective rents if economic recovery slows or stalls. We are, however, substantially protected against short-term market conditions, as most of our leases are long-term in nature with an average term of eight years.
INSURANCE RISKS
We maintain insurance on our commercial properties in amounts and with deductibles that we believe are in line with what owners of similar properties carry. We maintain all risk property insurance and rental value coverage (including coverage for the perils of flood, earthquake and windstorm). Our all risk policy limit is $1.5 billion per occurrence. Our earthquake limit is $500 million per occurrence and in the annual aggregate. This coverage is subject to a $100,000 (dollars) deductible for all locations. The flood limit is $500 million per occurrence and in the annual aggregate, and is subject to a deductible of $25,000 (dollars) for all losses arising from the same occurrence. Windstorm is included under the all risk coverage limit of $1.65 billion.
With respect to our commercial properties, we purchase an insurance policy that covers acts of terrorism for limits up to $1.5 billion.
PART IV – CRITICAL ACCOUNTING POLICIES AND ESTIMATES
CRITICAL ACCOUNTING POLICIES
The financial statements have been prepared using the same accounting policies and methods as those used in the consolidated financial statements for the year ended December 31, 2016, except for the adoption of the amendment to the statement of cash flows as discussed below.
ADOPTION OF ACCOUNTING STANDARD
The Trust adopted Amendments to IAS 7, "Statement of Cash Flows", effective for annual periods beginning January 1, 2017. The amendments to IAS 7 require that the following changes in liabilities arising from financing activities are disclosed (to the extent necessary): (i) changes from financing cash flows; (ii) changes arising from obtaining or losing control of subsidiaries or other businesses; (iii) the effect of changes in foreign exchange rates; (iv) changes in fair values; and (v) other changes. Since the amendments were issued less than one year before the effective date, the Trust is not required to provide comparative information on the application of the amendments. The Trust has evaluated the impact to the condensed consolidated interim financial statements and has provided incremental disclosure in Note 16(b) of the financial statements, and such application had no material effect on our financial performance or disclosure.
FUTURE ACCOUNTING POLICY CHANGES
The following are the accounting policies that the Trust expects to adopt in the future:
Revenue from Contracts with Customers
In May 2014, the IASB issued its new revenue standard, IFRS 15, “Revenue from Contracts with Customers”. IFRS 15 specifies how and when revenue should be recognized as well as requiring more informative and relevant disclosures. IFRS 15 supersedes IAS 18, “Revenue”, IAS 11, “Construction Contracts” and a number of revenue-related interpretations. Application of the standard is mandatory and it applies to nearly all contracts with customers: the main exceptions are leases, financial instruments and insurance contracts. IFRS 15 is effective for annual periods on or after January 1, 2018 with early adoption permitted and will be applied retrospectively. The Trust is currently evaluating the impact to the condensed consolidated interim financial statements.
Financial Instruments
On July 25, 2014, the IASB issued its final version of IFRS 9, “Financial Instruments” which will replace IAS 39, "Financial Instruments: Recognition and Measurement". IFRS 9, as amended, introduces a logical approach for the classification of financial assets, which is driven by cash flow characteristics and the business model in which an asset is held. This single, principle-based approach replaces existing rule-based requirements that are generally considered to be overly complex and difficult to apply. The new model results in a single impairment model being applied to all financial instruments, thereby removing a source of complexity associated with previous accounting requirements. It also introduces a new, expected-loss impairment model that will require more timely recognition of expected credit losses. IFRS 9 is effective for annual periods beginning on or after January 1, 2018, with early adoption permitted and will be applied retrospectively. The Trust is currently evaluating the impact to the condensed consolidated interim financial statements.
Leases
On January 13, 2016, the IASB published a new standard, IFRS 16, "Leases". The new standard will bring most leases on-balance sheet for lessees under a single model, eliminating the distinction between operating and finance leases. Lessor accounting, however, remains largely unchanged and the distinction between operating and finance leases is retained. Under IFRS 16 a lessee recognizes a right-of-use asset and a lease liability. The right-of-use asset is treated similarly to other non-financial assets and depreciated accordingly and the liability accrues interest. This will typically produce a front-loaded expense profile (whereas operating leases under IAS 17, "Leases", would typically have had a straight-line expenses) as an assumed linear depreciation of the right-of-use asset and decreasing interest on the liability will lead to an overall decrease of expense over the reporting period. IFRS 16 supersedes IAS 17 "Leases" and related interpretations and is effective for periods beginning on or after January 1, 2019, with earlier adoption permitted if IFRS 15 "Revenue from Contracts with Customers" has also been applied. The Trust is currently evaluating the impact to the condensed consolidated interim financial statements.
| Brookfield Canada Office Properties | 39 |
USE OF ESTIMATES
The preparation of our condensed consolidated interim financial statements requires management to make judgments, estimates, and assumptions that affect the reported amounts of assets and liabilities, disclosure of contingent assets and liabilities at the date of the condensed consolidated interim financial statements, and the reported amounts of revenues and expenses during the reporting period. Our estimates are based on historical experience and on various other assumptions that are believed to be reasonable under the circumstances. The result of our ongoing evaluation of these estimates forms the basis for making judgments about the carrying values of assets and liabilities and the reported amounts of revenues and expenses that are not readily apparent from other sources. Actual results may differ from these estimates under different assumptions.
On February 18, 2016, the Ontario Ministry of Finance published amendments to regulation 70/91 to theLand Transfer Act (Ontario) that may impact the transfers of partnership interests in prior fiscal years. The Trust is currently evaluating the impact of the amendments to its condensed consolidated interim financial statements.
RELATED-PARTY TRANSACTIONS
In the normal course of operations, the Trust enters into various transactions with related parties that have been measured at exchange value and are recognized in the condensed consolidated interim financial statements.
The Trust has entered into two service-support agreements with BOPM LP, dated May 1, 2010, for the provision of property management, leasing, construction, and asset management services. The purpose of the agreements is to provide the services of certain personnel and consultants as are necessary to help the Trust operate and manage its assets and tenant base; it also includes a cost-recovery for administrative and regulatory compliance services provided. The fees paid to BOPM LP are calculated in accordance with the terms of the agreements. Included in direct commercial property expense during the three months ended March 31, 2017, are amounts paid to BOPM LP for property management services of $3.6 million (compared to $3.6 million during the same period in 2016). Included in investment properties during the three months ended March 31, 2017, are amounts paid to BOPM LP for leasing and construction services of $1.3 million (compared to $0.9 million during the same period in 2016). Included in general and administrative expenses during the three months ended March 31, 2017, are amounts paid to BOPM LP for asset management and administrative and regulatory compliance services of $5.8 million (compared to $5.2 million during the same period in 2016). Effective November 1, 2016, BOPM LP assigned all of its right, title, interest in and obligations under the asset management agreement with respect to the provision of investment advisory services (“Investment Advisory Services”) to Brookfield Asset Management Private Institutional Capital Adviser US, LLC (“BAM PIC”), a wholly-owned subsidiary of Brookfield Asset Management Inc. ("BAM"). Included in general and administrative expenses during the three months ended March 31, 2017, are amounts paid to BAM PIC for Investment Advisory Services of $0.3 million (compared to $nil during the same period in 2016).
As part of the Trust's acquisition of Bay Adelaide East from BOPI on an "as-if-completed-and-stabilized basis", the Trust entered into a lease arrangement with BOPI where during the three months ended March 31, 2017, rental payments, net of non-cash revenue recognized under IFRS of $2.4 million were received pursuant to the related party lease (compared to $6.3 million during the same period in 2016). Refer to "Reconciliation of adjusted commercial property revenue and revaluation gain (loss)" on page 24 of the MD&A for details. Further, as part of the Bay Adelaide East development agreement, the Trust will make a final stabilization payment to BOPI of $56.0 million, subject to achieving stabilized net operating income and targeted permanent financing. This final payment is capitalized as a cost within the aggregate total investment of Bay Adelaide East of $601.9 million as BOPI retained the development obligations as part of the acquisition. As of March 31, 2017, the Trust has accrued the final payment of $56.0 million to BOPI as stabilization is expected to occur in the current year.
Included in fair value gains (losses) during the three months ended March 31, 2017 is $nil (compared to $0.7 million during the same period in 2016), paid to a subsidiary of BAM for services provided for the disposition of Royal Centre during the first quarter of 2016.
Included in rental revenues during the three months ended March 31, 2017, are amounts received from BAM, the ultimate parent of BOPI, and its affiliates of $2.9 million (compared to $2.8 million during the same period in 2016). Included in investment properties during the three months ended March 31, 2017, are amounts paid to a subsidiary of BAM of $1.2 million (compared to $7.8 million included in commercial developments during the same period in 2016) pursuant to a contract to construct Bay Adelaide East.
During the three months ended March 31, 2017, the Trust paid $0.5 million (compared to $0.5 million during the same period in 2016) to subsidiaries of BAM for its all-risk property insurance and rental value coverage, and acts of terrorism coverage as well as sustainable energy services.
Condensed Consolidated Interim Balance Sheets
| (Unaudited) | | | | | | | | |
| (Millions) (CDN$) | | Note | | Mar 31, 2017 | | | Dec 31, 2016 | |
| Assets | | | | | | | | | | |
| Non-current assets | | | | | | | | | | |
| Investment properties | | | | | | | | | | |
| Commercial properties | | 5 | | $ | 5,486.1 | | | $ | 5,397.0 | |
| Commercial development | | 5 | | | 714.3 | | | | 684.3 | |
| | | | | | 6,200.4 | | | | 6,081.3 | |
| Current assets | | | | | | | | | | |
| Tenant and other receivables | | 6 | | | 16.9 | | | | 15.8 | |
| Other assets | | 7 | | | 7.2 | | | | 7.9 | |
| Cash and cash equivalents | | | | | 59.2 | | | | 52.2 | |
| | | | | | 83.3 | | | | 75.9 | |
| Total assets | | | | $ | 6,283.7 | | | $ | 6,157.2 | |
| | | | | | | | | | | |
| Liabilities | | | | | | | | | | |
| Non-current liabilities | | | | | | | | | | |
| Investment property and corporate debt | | 8 | | $ | 2,794.3 | | | $ | 2,753.6 | |
| Current liabilities | | | | | | | | | | |
| Investment property and corporate debt | | 8 | | | 75.6 | | | | 74.4 | |
| Accounts payable and other liabilities | | 9 | | | 222.1 | | | | 166.8 | |
| | | | | | 297.7 | | | | 241.2 | |
| Total liabilities | | | | | 3,092.0 | | | | 2,994.8 | |
| | | | | | | | | | | |
| Equity | | 11 | | | | | | | | |
| Unitholders’ equity | | | | | 887.5 | | | | 879.0 | |
| Non-controlling interest | | | | | 2,304.2 | | | | 2,283.4 | |
| Total equity | | | | | 3,191.7 | | | | 3,162.4 | |
| Total liabilities and equity | | | | $ | 6,283.7 | | | $ | 6,157.2 | |
See accompanying notes to the condensed consolidated interim financial statements.
| Brookfield Canada Office Properties | 41 |
Condensed Consolidated Interim Statements of Income and Comprehensive Income
| (Unaudited) | | | | Three months ended Mar. 31 | |
| (Millions, except per unit amounts) (CDN$) | | Note | | 2017 | | | 2016 | |
| Commercial property revenue | | 12 (a) | | $ | 131.2 | | | $ | 129.3 | |
| Direct commercial property expense | | 12 (b), 15 | | | 64.9 | | | | 66.9 | |
| Interest expense | | 12 (b) | | | 22.5 | | | | 23.8 | |
| General and administrative expense | | 12 (b), 15 | | | 7.1 | | | | 6.3 | |
| Income before fair value gains (losses) | | | | | 36.7 | | | | 32.3 | |
| Fair value gains (losses) | | 5, 15 | | | 22.7 | | | | (21.3 | ) |
| Net income and comprehensive income | | | | $ | 59.4 | | | $ | 11.0 | |
| | | | | | | | | | | |
| Net income and comprehensive income attributable to: | | | | | | | | | | |
| Unitholders | | | | $ | 16.6 | | | $ | 3.1 | |
| Non-controlling interest | | | | | 42.8 | | | | 7.9 | |
| | | | | $ | 59.4 | | | $ | 11.0 | |
| Net income per Trust unit – basic and diluted | | | | $ | 0.64 | | | $ | 0.12 | |
See accompanying notes to the condensed consolidated interim financial statements.
Condensed Consolidated Interim Statements of Changes in Equity
| (Unaudited) | | | | Three months ended Mar. 31 | |
| (Millions) (CDN$) | | Note | | 2017 | | | 2016 | |
| Trust Units | | | | | | | | | | |
| Balance at beginning of period | | | | $ | 559.0 | | | $ | 554.4 | |
| Issuance of Trust Units under Distribution Reinvestment Plan (“DRIP”) | | 10 | | | 0.6 | | | | 0.4 | |
| Balance at end of period | | | | | 559.6 | | | | 554.8 | |
| Contributed surplus | | | | | | | | | | |
| Balance at beginning and end of period | | | | | 2.9 | | | | 2.9 | |
| Retained earnings | | | | | | | | | | |
| Balance at beginning of period | | | | | 317.1 | | | | 366.5 | |
| Net income and comprehensive income | | | | | 16.6 | | | | 3.1 | |
| Distributions | | 10 | | | (8.7 | ) | | | (50.3 | ) |
| Balance at end of period | | | | | 325.0 | | | | 319.3 | |
| Total unitholders’ equity | | | | $ | 887.5 | | | $ | 877.0 | |
| | | | | | | | | | | |
| Non-controlling interest | | | | | | | | | | |
| Balance at beginning of period | | | | $ | 2,283.4 | | | $ | 2,409.2 | |
| Net income and comprehensive income | | | | | 42.8 | | | | 7.9 | |
| Distributions | | 10 | | | (22.0 | ) | | | (128.5 | ) |
| Balance at end of period | | | | | 2,304.2 | | | | 2,288.6 | |
| Total equity | | | | $ | 3,191.7 | | | $ | 3,165.6 | |
See accompanying notes to the condensed consolidated interim financial statements.
| Brookfield Canada Office Properties | 43 |
Condensed Consolidated Interim Statements of Cash Flows
| (Unaudited) | | | | Three months ended Mar. 31 | |
| (Millions) (CDN$) | | Note | | 2017 | | | 2016 | |
| Operating activities | | | | | | | | | | |
| Net income | | | | $ | 59.4 | | | $ | 11.0 | |
| Add (deduct): | | | | | | | | | | |
| Non-cash rental revenue | | 12 (a) | | | (2.3 | ) | | | (0.9 | ) |
| Amortization of deferred financing costs | | | | | 0.6 | | | | 0.9 | |
| Leasing commissions and tenant inducements | | | | | (3.5 | ) | | | (2.6 | ) |
| Fair value (gains) losses | | 5, 15 | | | (22.7 | ) | | | 21.3 | |
| Interest expense | | | | | 22.5 | | | | 23.8 | |
| Interest paid | | | | | (33.3 | ) | | | (33.3 | ) |
| Other working capital | | | | | 15.1 | | | | 24.6 | |
| Cash flows provided by operating activities | | | | | 35.8 | | | | 44.8 | |
| | | | | | | | | | | |
| Investing activities | | | | | | | | | | |
| Disposition of commercial property | | | | | — | | | | 422.4 | |
| Capital expenditures – commercial properties | | | | | (9.5 | ) | | | (15.0 | ) |
| Capital expenditures – commercial development | | | | | (30.5 | ) | | | (80.7 | ) |
| Cash flows (used in) provided by investing activities | | | | | (40.0 | ) | | | 326.7 | |
| | | | | | | | | | | |
| Financing activities | | | | | | | | | | |
| Investment and development property debt arranged | | | | | 35.1 | | | | 92.3 | |
| Investment property debt repayments | | | | | — | | | | (137.8 | ) |
| Investment property debt amortization | | | | | (15.8 | ) | | | (15.6 | ) |
| Corporate debt arranged | | | | | 22.0 | | | | — | |
| Corporate debt repayments | | | | | — | | | | (194.0 | ) |
| Trust unit distributions paid | | 16 (a) | | | (8.1 | ) | | | (7.7 | ) |
| Class B LP unit distributions paid | | 16 (a) | | | (22.0 | ) | | | (20.8 | ) |
| Cash flows provided by (used in) financing activities | | | | | 11.2 | | | | (283.6 | ) |
| Increase in cash and cash equivalents | | | | | 7.0 | | | | 87.9 | |
| Cash and cash equivalents, beginning of period | | | | | 52.2 | | | | 57.6 | |
| Cash and cash equivalents, end of period | | | | $ | 59.2 | | | $ | 145.5 | |
See accompanying notes to the condensed consolidated interim financial statements.
Notes to the Condensed Consolidated Interim Financial Statements
NOTE 1: NATURE AND DESCRIPTION OF THE TRUST
Brookfield Canada Office Properties (the “Trust” or “BOX”) is an unincorporated, closed-end real estate investment trust (“REIT”) established under and governed by the laws of the Province of Ontario, Canada and created pursuant to a declaration of trust dated March 19, 2010 and amended and restated February 24, 2012. Although it is intended that BOX qualifies as a “mutual fund trust” pursuant to theIncome Tax Act (Canada), BOX is not a mutual fund under applicable securities laws.
The Trust is a subsidiary of Brookfield Office Properties Inc. (“BOPI”), which owns an aggregate equity interest in the Trust of 52.4% as of March 31, 2017 consisting of 73.0% of the issued and outstanding Class B limited partnership units (“Class B LP Units”) of Brookfield Office Properties Canada LP (“BOPC LP”), a subsidiary of BOX that owns direct interests in the Trust’s investment properties. In addition, BOPI’s parent company, Brookfield Property Partners LP (“BPY”), directly owns an aggregate equity interest in the Trust of 30.7% consisting of 40.0% of the issued and outstanding units of BOX (“Trust Units”) and 27.0% of the Class B LP Units. BOX primarily invests in and operates commercial office properties in Toronto, Ottawa, and Calgary. The registered and operating office of the Trust is Brookfield Place Toronto, 181 Bay Street, Suite 330, Toronto, Ontario, M5J 2T3.
NOTE 2: SIGNIFICANT ACCOUNTING POLICIES
The condensed consolidated interim financial statements have been prepared in accordance with International Accounting Standard (“IAS”) 34, “Interim Financial Reporting”, as issued by the International Accounting Standards Board (“IASB”). Accordingly, certain information and footnote disclosure normally included in annual financial statements prepared in accordance with International Financial Reporting Standards (“IFRS”), as issued by the IASB, have been omitted or condensed.
The financial statements have been prepared using the same accounting policies and methods as those used in the consolidated financial statements for the year ended December 31, 2016, except for the adoption of the amendments to the statement of cash flows as discussed below. The financial statements have been presented in Canadian dollars rounded to the nearest million unless otherwise indicated. These interim financial statements should be read in conjunction with the Trust’s consolidated financial statements for the year ended December 31, 2016.
The preparation of the financial statements in accordance with IAS 34 requires the use of certain critical accounting estimates. It also requires management to exercise judgment in applying the Trust’s accounting policies. The critical accounting estimates and judgments have been set out in Note 2 to the Trust’s consolidated financial statements for the year ended December 31, 2016.
On February 18, 2016, the Ontario Ministry of Finance published amendments to regulation 70/91 to the Land Transfer Act (Ontario) that may impact the transfers of partnership interests in prior fiscal years. The Trust is currently evaluating the impact of the amendments to its condensed consolidated interim financial statements.
NOTE 3: ADOPTION OF ACCOUNTING STANDARD
The Trust adopted Amendments to IAS 7, "Statement of Cash Flows", effective for annual periods beginning January 1, 2017. The amendments to IAS 7 require that the following changes in liabilities arising from financing activities are disclosed (to the extent necessary): (i) changes from financing cash flows; (ii) changes arising from obtaining or losing control of subsidiaries or other businesses; (iii) the effect of changes in foreign exchange rates; (iv) changes in fair values; and (v) other changes. Since the amendments were issued less than one year before the effective date, the Trust is not required to provide comparative information on the application of the amendments. The Trust has evaluated the impact to the condensed consolidated interim financial statements and has provided incremental disclosure in Note 16(b) of the financial statements, and such application had no material effect on our financial performance or disclosure.
NOTE 4: FUTURE ACCOUNTING POLICY CHANGES
| (a) | Revenue from Contracts with Customers |
In May 2014, the IASB issued its new revenue standard, IFRS 15, “Revenue from Contracts with Customers”. IFRS 15 specifies how and when revenue should be recognized as well as requiring more informative and relevant disclosures. IFRS 15 supersedes IAS 18, “Revenue”, IAS 11, “Construction Contracts” and a number of revenue-related interpretations. Application of the standard is mandatory and it applies to nearly all contracts with customers: the main exceptions are leases, financial instruments and insurance contracts. IFRS 15 is effective for annual periods on or after January 1, 2018 with early adoption permitted and will be applied retrospectively. The Trust is currently evaluating the impact to the condensed consolidated interim financial statements.
| Brookfield Canada Office Properties | 45 |
On July 25, 2014, the IASB issued its final version of IFRS 9, “Financial Instruments” which will replace IAS 39, "Financial Instruments: Recognition and Measurement". IFRS 9, as amended, introduces a logical approach for the classification of financial assets, which is driven by cash flow characteristics and the business model in which an asset is held. This single, principle-based approach replaces existing rule-based requirements that are generally considered to be overly complex and difficult to apply. The new model results in a single impairment model being applied to all financial instruments, thereby removing a source of complexity associated with previous accounting requirements. It also introduces a new, expected-loss impairment model that will require more timely recognition of expected credit losses. IFRS 9 is effective for annual periods beginning
on or after January 1, 2018, with early adoption permitted and will be applied retrospectively. The Trust is currently evaluating the impact to the condensed consolidated interim financial statements.
On January 13, 2016, the IASB published a new standard, IFRS 16, "Leases". The new standard will bring most leases on-balance sheet for lessees under a single model, eliminating the distinction between operating and finance leases. Lessor accounting, however, remains largely unchanged and the distinction between operating and finance leases is retained. Under IFRS 16 a lessee recognizes a right-of-use asset and a lease liability. The right-of-use asset is treated similarly to other non-financial assets and depreciated accordingly and the liability accrues interest. This will typically produce a front-loaded expense profile (whereas operating leases under IAS 17, "Leases", would typically have had a straight-line expenses) as an assumed linear depreciation of the right-of-use asset and decreasing interest on the liability will lead to an overall decrease of expense over the reporting period. IFRS 16 supersedes IAS 17 "Leases" and related interpretations and is effective for periods beginning on or after January 1, 2019, with earlier adoption permitted if IFRS 15 "Revenue from Contracts with Customers" has also been applied. The Trust is currently evaluating the impact to the condensed consolidated interim financial statements.
NOTE 5: INVESTMENT PROPERTIES
| | | March 31, 2017 | | | December 31, 2016 | |
| (Millions) | | Commercial
properties | | | Commercial
development | | | Commercial
properties | | | Commercial
development | |
| Balance at beginning of period | | $ | 5,397.0 | | | $ | 684.3 | | | $ | 5,805.1 | | | $ | 462.7 | |
| Additions: | | | | | | | | | | | | | | | | |
| Acquisition costs(1) | | | 56.0 | | | | — | | | | — | | | | — | |
| Capital expenditures and tenant improvements | | | 9.4 | | | | 30.0 | | | | 63.3 | | | | 221.6 | |
| Leasing commissions | | | 3.4 | | | | — | | | | 8.1 | | | | — | |
| Tenant inducements | | | — | | | | — | | | | 0.2 | | | | — | |
| Investment property disposition | | | — | | | | — | | | | (422.4 | ) | | | — | |
| Fair value gains (losses) | | | 22.7 | | | | — | | | | (44.9 | ) | | | — | |
| Other changes(2) | | | (2.4 | ) | | | — | | | | (12.4 | ) | | | — | |
| Balance at end of period | | $ | 5,486.1 | | | $ | 714.3 | | | $ | 5,397.0 | | | $ | 684.3 | |
(1)Represents the recognition of the Bay Adelaide East $56.0 million stabilization payment to BOPI. Refer to Note 15-Related-Party Transactions for details.
(2)Included in other changes for the three months ended ended March 31, 2017 is $5.0 million (compared to $7.5 million during the same period in 2016) of rental payments received from a related party lease. Refer to Note 15-Related-Party Transactions for details.
(a) Fair value of investment properties
In accordance with its policy, the Trust measures and records investment properties using internally prepared valuations. The Trust does not measure its investment properties based on valuations prepared by external valuation professionals. Fair values are most sensitive to changes in discount rate assumptions and terminal capitalization rate assumptions. The Trust determines the fair value of each commercial property by undertaking the discounted cash flow model whereby expected future cash flows are discounted, generally over a 10 year hold period, including a terminal value based on the application of a terminal capitalization rate to estimated year 11 cash flows. Commercial developments under active development are measured using a discounted cash flow model, net of costs to complete, as of the balance sheet date. The Trust prepares these valuations considering asset and market specific factors, as well as observable transactions for similar assets.
The determination of fair value requires the use of estimates, which the Trust determines using external information and observable conditions, where possible, in conjunction with internal analysis. There are currently no known trends, events or uncertainties that the Trust reasonably believes could have a sufficiently pervasive impact across the Trust’s businesses to materially affect the methodologies or assumptions utilized to determine the estimated fair values. Discount rates and terminal capitalization rates are inherently uncertain and may be impacted by, among other things, movements in interest rates in the markets in which the assets are located. Changes in estimates of discount and terminal capitalization rates across different markets are often independent of each other and do not necessarily move in the same direction or of the same magnitude. Further, impacts to the Trust’s fair values of investment properties from changes in discount or terminal capitalization rates and expected cash flows are usually inversely correlated. Decreases (increases) in the discount rate or terminal capitalization rate result in increases (decreases) of fair value. Such decreases (increases) may be mitigated by decreases (increases) in expected future cash flows included in the valuation analysis, as circumstances that typically give rise to increased interest rates (e.g., strong economic growth, inflation) usually give rise to increased cash flows at the asset level.
| Brookfield Canada Office Properties | 47 |
The key valuation metrics for the Trust’s investment properties are set out in the following tables:
| | | March 31, 2017 | | | December 31, 2016 | |
| | | Maximum | | | Minimum | | | Weighted
Average | | | Maximum | | | Minimum | | | Weighted
Average | |
| Eastern region | | | | | | | | | | | | | | | | | | | | | | | | |
| Discount rate | | | 7.00 | % | | | 6.00 | % | | | 6.08 | % | | | 7.00 | % | | | 6.00 | % | | | 6.08 | % |
| Terminal cap rate | | | 6.50 | % | | | 5.00 | % | | | 5.26 | % | | | 6.50 | % | | | 5.00 | % | | | 5.22 | % |
| Hold period (yrs) | | | 14 | | | | 10 | | | | 10 | | | | 14 | | | | 10 | | | | 10 | |
| | | | | | | | | | | | | | | | | | | | | | | | | |
| Western region | | | | | | | | | | | | | | | | | | | | | | | | |
| Discount rate | | | 6.75 | % | | | 6.25 | % | | | 6.47 | % | | | 6.75 | % | | | 6.25 | % | | | 6.38 | % |
| Terminal cap rate | | | 6.25 | % | | | 6.00 | % | | | 6.07 | % | | | 6.25 | % | | | 6.00 | % | | | 6.07 | % |
| Hold period (yrs) | | | 10 | | | | 10 | | | | 10 | | | | 11 | | | | 10 | | | | 10 | |
A 25 basis-point decrease in the discount and terminal capitalization rates will impact the fair value of commercial properties by $109.5 million and $169.8 million or 2.0% and 3.1%, respectively, at March 31, 2017.
(b) Development activities
During the fourth quarter of 2014, the Trust acquired Brookfield Place Calgary East ("BPCE") from its parent company, BOPI, for an aggregate total investment of $966.3 million. The building was purchased on an “as-if-completed-and-stabilized basis,” and as such, BOPI retains the development obligations including construction, lease-up and financing. As part of the acquisition, the Trust formed an independent committee and engaged third-party advisors to evaluate the fairness of the transaction.
The following table summarizes the details of the transaction:
| (Millions) | | Brookfield Place
Calgary East | |
| Initial acquisition price | | $ | 245.5 | |
| Up-front equity commitment | | | 81.8 | |
| First mortgage construction loan | | | 575.0 | |
| Final payment due to BOPI on stabilization(1) | | | 64.0 | |
| Aggregate total investment | | $ | 966.3 | |
(1)Subject to achieving stabilized net operating income and targeted permanent financing, which is expected to occur in 2018.
As part of the BPCE acquisition, the title to Brookfield Place Calgary West ("BPCW") was also transferred to the Trust because the development site is currently under one legal title. However, the acquisition agreements provide that all economic benefits and obligations of BPCW remain with BOPI. BOPI has also agreed to indemnify the Trust for all current liabilities, future costs and obligations in respect of BPCW. As part of the transaction, the Trust entered into a separate agreement to sell BPCW back to BOPI upon the City of Calgary approving the severance of the east and west parcels, which is anticipated to occur by the end of 2017. Accordingly, the Trust has not reflected the value of the BPCW site and related debt of the same amount in the interim financial statements.
During the three months ended March 31, 2017, the Trust capitalized a total of $30.0 million (compared to $58.6 million during the same period in 2016) of costs related to commercial developments. Included in this amount during the three months ended March 31, 2017, is $1.7 million (compared to $1.9 million during the same period in 2016) of property taxes and other related costs and $5.3 million (compared to $3.8 million during the same period in 2016) of capitalized borrowing costs. The weighted average capitalization rate used for capitalization of borrowing costs on commercial developments was 3.9%.
NOTE 6: TENANT AND OTHER RECEIVABLES
As of March 31, 2017, $1.4 million of the Trust’s balance of accounts receivable is over 90 days past due (compared to $0.7 million at December 31, 2016).
The Trust’s maximum exposure to credit risk associated with tenant and other receivables is equivalent to its carrying value. Credit risk related to tenant receivables arises from the possibility that tenants may be unable to fulfill their lease commitments. The Trust manages this risk by attempting to ensure that its tenant mix is diversified and by limiting its exposure to any one tenant. The Trust maintains a portfolio that is diversified by industry type so that exposure to a particular sector is lessened. Currently no one tenant represents more than 7.3% of commercial property revenue. This risk is further managed by attempting to sign long-term leases with tenants who have investment grade credit ratings.
NOTE 7: OTHER ASSETS
At March 31, 2017, the Trust’s balance of other assets is comprised of prepaid expenses and other assets of $7.2 million (compared to $7.9 million at December 31, 2016).
NOTE 8: INVESTMENT PROPERTY AND CORPORATE DEBT
| | | Mar. 31, 2017 | | | Dec. 31, 2016 | |
| | | Weighted | | | | | | Weighted | | | | |
| (Millions) | | Average Rate | | | Debt Balance | | | Average Rate | | | Debt Balance | |
| Investment property debt – fixed rate | | | 4.27 | % | | $ | 1,964.5 | | | | 4.27 | % | | $ | 1,979.8 | |
| Investment property and corporate debt – floating rate | | | 2.61 | % | | | 905.4 | | | | 2.60 | % | | | 848.2 | |
| Total investment property and corporate debt | | | 3.75 | % | | $ | 2,869.9 | | | | 3.77 | % | | $ | 2,828.0 | |
| | | | | | | | | | | | | | | | | |
| Current | | | | | | $ | 75.6 | | | | | | | $ | 74.4 | |
| Non-current | | | | | | | 2,794.3 | | | | | | | | 2,753.6 | |
| Total debt | | | | | | $ | 2,869.9 | | | | | | | $ | 2,828.0 | |
The Trust’s secured investment property and corporate debt is non-recourse to the Trust with the exception of $137.3 million at March 31, 2017 (compared to $137.3 million at December 31, 2016) which has limited recourse to the Trust and guarantees as discussed in Note 13(c).
The fair value of investment property and corporate debt is determined by discounting contractual principal and interest payments at estimated current market interest rates for the instrument. Current market interest rates are determined with reference to current benchmark rates for a similar term and current credit spreads for debt with similar terms and risks. As of March 31, 2017, the fair value of investment property and corporate debt exceeds the principal loan value of these obligations by $106.6 million (compared to an excess of $109.4 million at December 31, 2016).
NOTE 9: ACCOUNTS PAYABLE AND OTHER LIABILITIES
The components of the Trust’s accounts payable and other liabilities are as follows:
| (Millions) | | Mar. 31, 2017 | | | Dec. 31, 2016 | |
| Accounts payable and accrued liabilities | | $ | 209.7 | | | $ | 148.2 | |
| Accrued interest | | | 12.4 | | | | 18.6 | |
| Total | | $ | 222.1 | | | $ | 166.8 | |
NOTE 10: DISTRIBUTIONS
The following tables present distributions declared for the three months ended March 31, 2017 and March 31, 2016:
| | | Three months ended March 31, 2017 | |
| (Millions, except per unit amounts) | | Trust Units | | | Class B LP Units | |
| Paid in cash or DRIP | | $ | 5.8 | | | $ | 14.7 | |
| Payable as of March 31, 2017 | | | 2.9 | | | | 7.3 | |
| Total | | $ | 8.7 | | | $ | 22.0 | |
| Per unit(1) | | $ | 0.33 | | | $ | 0.33 | |
(1)Excludes special distribution of $149.3 million or $1.60 per Trust unit, paid out on April 19, 2016 to holders of record at the close of business on April 5, 2016.
| | | Three months ended March 31, 2016 | |
| (Millions, except per unit amounts) | | Trust Units | | | Class B LP Units | |
| Paid in cash or DRIP | | $ | 5.4 | | | $ | 13.9 | |
| Payable as of March 31, 2016 | | | 44.9 | | | | 114.6 | |
| Total | | $ | 50.3 | | | $ | 128.5 | |
| Per unit | | $ | 0.32 | | | $ | 0.32 | |
The Trust has implemented a distribution reinvestment plan (“DRIP”), which allows certain Canadian resident unitholders to elect to have their distributions reinvested in additional Trust Units. No brokerage commissions or service charges are payable in connection with the purchase of Trust Units under the DRIP and the Trust will pay all administrative costs. The automatic reinvestment of distributions under the DRIP does not relieve holders of Trust Units of any income tax applicable to such distributions. For the three months ended March 31, 2017, $579,597 dollars or 19,552 Trust Units were issued through the DRIP, compared to $365,975 dollars, or 13,618 Trust Units during the same period in 2016.
| Brookfield Canada Office Properties | 49 |
NOTE 11: EQUITY
The components of equity are as follows:
| (Millions) | | Mar. 31, 2017 | | | Dec. 31, 2016 | |
| Trust Units | | $ | 559.6 | | | $ | 559.0 | |
| Contributed surplus | | | 2.9 | | | | 2.9 | |
| Retained earnings | | | 325.0 | | | | 317.1 | |
| Unitholders’ equity | | | 887.5 | | | | 879.0 | |
| Non-controlling interest | | | 2,304.2 | | | | 2,283.4 | |
| Total | | $ | 3,191.7 | | | $ | 3,162.4 | |
Authorized Capital and Outstanding Securities
The Trust is authorized to issue an unlimited number of two classes of units: Trust Units and Special Voting Units. Special Voting Units are only issued in tandem with the issuance of Class B LP Units. As of March 31, 2017, the Trust had a total of 26,432,723 Trust Units outstanding and 67,088,022 Class B LP Units outstanding (and a corresponding number of Special Voting Units).
The following tables summarize the changes in the units outstanding during the three months ended March 31, 2017 and March 31, 2016:
| | | Three months ended March 31, 2017 | |
| | | Trust Units | | | Class B LP Units | |
| Units issued and outstanding at beginning of period | | | 26,413,171 | | | | 67,088,022 | |
| Units issued pursuant to DRIP | | | 19,552 | | | | — | |
| Total units outstanding at March 31, 2017 | | | 26,432,723 | | | | 67,088,022 | |
| | | Three months ended March 31, 2016 | |
| | | Trust Units | | | Class B LP Units | |
| Units issued and outstanding at beginning of period | | | 26,250,344 | | | | 67,088,022 | |
| Units issued pursuant to DRIP | | | 13,618 | | | | — | |
| Total units outstanding at March 31, 2016 | | | 26,263,962 | | | | 67,088,022 | |
For the three months ended March 31, 2017, the weighted average number of Trust Units outstanding was 26,423,467 (compared to 26,346,054 for the year ended December 31, 2016).
NOTE 12: REVENUE AND EXPENSES
| (a) | Commercial property revenue |
The components of revenue are as follows:
| | | Three months ended Mar. 31 | |
| (Millions) | | 2017 | | | 2016 | |
| Rental revenue | | $ | 128.5 | | | $ | 128.0 | |
| Non-cash rental revenue | | | 2.3 | | | | 0.9 | |
| Lease termination and other income | | | 0.4 | | | | 0.4 | |
| Commercial property revenue | | $ | 131.2 | | | $ | 129.3 | |
The Trust generally leases investment properties under operating leases with lease terms between five and 10 years, with options to extend up to five additional years.
The following represents an analysis of the nature of the expense included in direct commercial property expense, interest expense, and general and administrative expense:
| | | Three months ended Mar. 31 | |
| (Millions) | | 2017 | | | 2016 | |
| Employee benefits(1) | | $ | 5.4 | | | $ | 5.0 | |
| Interest expense | | | 22.5 | | | | 23.8 | |
| Property maintenance | | | 27.9 | | | | 29.2 | |
| Real estate taxes | | | 28.9 | | | | 29.8 | |
| Ground rents | | | 3.2 | | | | 3.3 | |
| Asset management fees and other | | | 6.6 | | | | 5.9 | |
| Total expenses | | $ | 94.5 | | | $ | 97.0 | |
(1)Represent amounts paid to a subsidiary of Brookfield Asset Management Inc. ("BAM") for payroll services.
NOTE 13: GUARANTEES, CONTINGENCIES, AND OTHER
(a) In the normal course of operations, the Trust and its consolidated subsidiaries execute agreements that provide for indemnification and guarantees to third parties in transactions such as business dispositions, business acquisitions, lease-up of development properties, sales of assets, and sales of services.
(b) As of March 31, 2017, the Trust had commitments totaling $64.9 million for BPCE development costs to third parties.
(c) As of March 31, 2017, the Trust has guaranteed up to $350.0 million related to its revolving corporate credit facility, up to $50.0 million related to the construction loan on Bay Adelaide East and up to $60.0 million related to the construction loan on BPCE. As of March 31, 2017, the Trust has issued letters of credit of $3.4 million related to its revolving corporate credit facility.
(d) The Trust maintains insurance on its commercial properties in amounts and with deductibles that the Trust believes are in line with what owners of similar properties carry. The Trust maintains all risk property insurance and rental value coverage (including coverage for the perils of flood, earthquake and windstorm). The Trust’s all risk policy limit is $1.5 billion per occurrence. The Trust’s earthquake limit is $500 million per occurrence and in the annual aggregate. This coverage is subject to a $100,000 (dollars) deductible for all locations. The flood limit is $500 million per occurrence and in the annual aggregate, and is subject to a deductible of $25,000 (dollars) for all losses arising from the same occurrence. Windstorm is included under the all risk coverage limit of $1.5 billion. With respect to its commercial properties, the Trust purchases an insurance policy that covers acts of terrorism for limits up to $1.65 billion.
NOTE 14: SEGMENTED INFORMATION
The Trust has only one business segment: the ownership and operation of investment properties in Canada. The Trust identifies each investment property as an individual segment and has aggregated them into a single reportable segment based on similarity in the nature of the product, tenants and individual operational processes.
NOTE 15: RELATED-PARTY TRANSACTIONS
In the normal course of operations, the Trust enters into various transactions with related parties that have been measured at exchange value and are recognized in the condensed consolidated interim financial statements.
| Brookfield Canada Office Properties | 51 |
The Trust has entered into two service-support agreements with Brookfield Office Properties Management LP (“BOPM LP”), a subsidiary of BOPI, for the provision of property management, leasing, construction, and asset management services. The purpose of the agreements is to provide the services of certain personnel and consultants as are necessary to help the Trust operate and manage its assets and tenant base; it also includes a cost-recovery for administrative and regulatory compliance services provided. The fees paid to BOPM LP are calculated in accordance with the terms of the agreements. Included in direct commercial property expense during the three months ended March 31, 2017, are amounts paid to BOPM LP for property management services of $3.6 million (compared to $3.6 million during the same period in 2016). Included in investment properties during the three months ended March 31, 2017, are amounts paid to BOPM LP for leasing and construction services of $1.3 million (compared to $0.9 million during the same period in 2016). Included in general and administrative expenses during the three months ended March 31, 2017, are amounts paid to BOPM LP for asset management and administrative and regulatory compliance services of $5.8 million (compared to $5.2 million during the same period in 2016). Effective November 1, 2016, BOPM LP assigned all of its right, title, interest in and obligations under the asset management agreement with respect to the provision of investment advisory services (“Investment Advisory Services”) to Brookfield Asset Management Private Institutional Capital Adviser US, LLC (“BAM PIC”), a wholly-owned subsidiary of BAM. Included in general and administrative expenses during the three months ended March 31, 2017, are amounts paid to BAM PIC for Investment Advisory Services of $0.3 million (compared to $nil during the same period in 2016).
As part of the Trust’s acquisition of Bay Adelaide East from BOPI on an "as-if-completed-and-stabilized basis", wherein BOPI retains the development obligations including construction, lease-up and financing, the parties entered into a lease arrangement, whereby the Trust would receive supplemental payments from BOPI to support an agreed upon net operating income target until achieving stabilized net operating income, which is expected to occur in 2017. During the three months ended March 31, 2017 rental payments of $5.0 million were received pursuant to the related party lease (compared to $7.5 million during the same period in 2016), which have been recognized as a reduction of the carrying value of the building. Further, as part of the development agreement, the Trust will make a final stabilization payment to BOPI of $56.0 million, subject to achieving stabilized net operating income and targeted permanent financing. This final payment is capitalized as a cost within the aggregate total investment of Bay Adelaide East of $601.9 million as BOPI retained the development obligations as part of the acquisition. As of March 31, 2017 the Trust has accrued the final payment of $56.0 million to BOPI as stabilization is expected to occur in the current year.
Included in fair value gains (losses) during the three months ended March 31, 2017 is $nil (compared to $0.7 million during the same period in 2016) paid to a subsidiary of BAM for services provided for the disposition of Royal Centre during the first quarter of 2016.
Included in rental revenues during the three months ended March 31, 2017, are amounts received from BAM and its affiliates of $2.9 million (compared to $2.8 million during the same period in 2016).
During the three months ended March 31, 2017, the Trust paid $0.5 million (compared to $0.5 million during the same period in 2016) to subsidiaries of BAM for its all-risk property insurance and rental value coverage, acts of terrorism coverage, and sustainable energy services.
Refer to Note 5, Investment Properties, for information on the acquisition of BPCE development from BOPI. Included in investment properties during the three months ended March 31, 2017 are amounts paid to a subsidiary of BAM of $1.2 million (compared to $7.8 million during the same period in 2016) for commercial developments pursuant to a contract to construct Bay Adelaide East.
NOTE 16: OTHER INFORMATION
Supplemental cash flow information:
| (a) | Cash distributions paid: |
| | | Three months ended March 31, 2017 | | | Three months ended March 31, 2016 | |
| (Millions) | | Trust Units | | | Class B LP Units | | | Trust Units | | | Class B LP Units | |
| Distributions declared to unitholders(1) | | $ | 8.7 | | | $ | 22.0 | | | $ | 50.3 | | | $ | 128.5 | |
| Add: Distributions payable at the beginning of the period | | | 2.9 | | | | 7.3 | | | | 2.7 | | | | 6.9 | |
| Less: Distributions payable at the end of the period | | | (2.9 | ) | | | (7.3 | ) | | | (44.9 | ) | | | (114.6 | ) |
| Less: Distributions to participants in DRIP | | | (0.6 | ) | | | — | | | | (0.4 | ) | | | — | |
| Cash distributions paid | | $ | 8.1 | | | $ | 22.0 | | | $ | 7.7 | | | $ | 20.8 | |
(1)Included for the three months ended March 31, 2016, is a special distribution of $149.3 million or $1.60 per Trust Unit, paid out on April 19, 2016 to holders of record at the close of business on April 5, 2016.
(b) Changes in liabilities arising from financing activities:
| | | | | | Statement of Cash Flows | | | Non-cash
changes | | | | |
| (Millions) | | Jan 1, 2017 | | | Debt Arranged | | | Debt Repayments | | | Amortization | | | Other | | | Mar. 31, 2017 | |
| Investment property debt | | $ | 2,442.4 | | | $ | 7.5 | | | $ | — | | | $ | (15.8 | ) | | $ | 0.5 | | | $ | 2,434.6 | |
| Development property debt | | | 325.6 | | | | 27.6 | | | | — | | | | — | | | | — | | | | 353.2 | |
| Corporate debt | | | 60.0 | | | | 22.0 | | | | — | | | | — | | | | 0.1 | | | | 82.1 | |
| Total liabilities from financing activities | | $ | 2,828.0 | | | $ | 57.1 | | | $ | — | | | $ | (15.8 | ) | | $ | 0.6 | | | $ | 2,869.9 | |
| | | | | | Statement of Cash Flows | | | Non-cash
changes | | | | |
| (Millions) | | Jan 1, 2016 | | | Debt Arranged | | | Debt Repayments | | | Amortization | | | Other | | | Mar. 31, 2016 | |
| Investment property debt | | $ | 2,518.5 | | | $ | 45.7 | | | $ | (137.8 | ) | | $ | (15.6 | ) | | $ | 0.8 | | | $ | 2,411.6 | |
| Development property debt | | | 126.0 | | | | 46.6 | | | | — | | | | — | | | | — | | | | 172.6 | |
| Corporate debt | | | 194.0 | | | | — | | | | (194.0 | ) | | | — | | | | 0.1 | | | | 0.1 | |
| Total liabilities from financing activities | | $ | 2,838.5 | | | $ | 92.3 | | | $ | (331.8 | ) | | $ | (15.6 | ) | | $ | 0.9 | | | $ | 2,584.3 | |
NOTE 17: SUBSEQUENT EVENTS
Subsequent to quarter end, on April 20, 2017, the Trust entered into a definitive agreement with BPY pursuant to which BPY would effectively acquire the approximately 17% equity interest in BOX that it or its subsidiaries do not own for $32.50 cash per unit.
NOTE 18: APPROVAL OF INTERIM FINANCIAL STATEMENTS
The interim financial statements were approved by the Trust’s Board of Trustees and authorized for issue on April 24, 2017.
Unitholder Information
DISTRIBUTION PAYMENT DATES
| | | 2017 | | | 2016 | | | 2015 | |
(unaudited)
(Dollars) | | Trust Units | | | Class B LP Units | | | Trust Units | | | Class B LP Units | | | Trust Units | | | Class B LP Units | |
| January 15 | | $ | 0.1092 | | | $ | 0.1092 | | | $ | 0.1033 | | | $ | 0.1033 | | | $ | 0.1033 | | | $ | 0.1033 | |
| February 15 | | | 0.1092 | | | | 0.1092 | | | | 0.1033 | | | | 0.1033 | | | | 0.1033 | | | | 0.1033 | |
| March 15 | | | 0.1092 | | | | 0.1092 | | | | 0.1033 | | | | 0.1033 | | | | 0.1033 | | | | 0.1033 | |
| April 15 | | | 0.1092 | | | | 0.1092 | | | | 0.1092 | | | | 0.1092 | | | | 0.1033 | | | | 0.1033 | |
| May 15 | | | 0.1092 | | | | 0.1092 | | | | 0.1092 | | | | 0.1092 | | | | 0.1033 | | | | 0.1033 | |
| June 15 | | | 0.1092 | | | | 0.1092 | | | | 0.1092 | | | | 0.1092 | | | | 0.1033 | | | | 0.1033 | |
| July 15 | | | | | | | | | | | 0.1092 | | | | 0.1092 | | | | 0.1033 | | | | 0.1033 | |
| August 15 | | | | | | | | | | | 0.1092 | | | | 0.1092 | | | | 0.1033 | | | | 0.1033 | |
| September 15 | | | | | | | | | | | 0.1092 | | | | 0.1092 | | | | 0.1033 | | | | 0.1033 | |
| October 15 | | | | | | | | | | | 0.1092 | | | | 0.1092 | | | | 0.1033 | | | | 0.1033 | |
| November 15 | | | | | | | | | | | 0.1092 | | | | 0.1092 | | | | 0.1033 | | | | 0.1033 | |
| December 15 | | | | | | | | | | | 0.1092 | | | | 0.1092 | | | | 0.1033 | | | | 0.1033 | |
The Trust paid a special distribution of $149.3 million or $1.60 per Trust Unit, on April 19, 2016 to holders of record at the close of business on April 5, 2016.
| Brookfield Canada Office Properties | 53 |
Information
PROFILE
Brookfield Canada Office Properties is a Canadian real estate investment trust, focusing on the ownership and value enhancement of premier office properties. The current property portfolio is comprised of interests in 26 premier office properties totaling 20.5 million square feet and one development property totaling 1.4 million square feet. Landmark properties include Brookfield Place Toronto, Bay Adelaide Centre, and First Canadian Place in Toronto and Bankers Hall in Calgary.
BROOKFIELD CANADA OFFICE PROPERTIES
Brookfield Place, Bay Wellington Tower
181 Bay Street, Suite 330
Toronto, Ontario M5J 2T3
Tel: 416.359.8555
Fax: 416.359.8596
www.brookfieldcanadareit.com
UNITHOLDER ENQUIRIES
Brookfield Canada Office Properties welcomes enquiries from unitholders, analysts, media representatives and other interested parties. Questions relating to investor relations or media enquiries can be directed to Sherif El-Azzazi, Director Investor Relations at 416.359.8593 or via e-mail at sherif.elazzazi@brookfield.com. Enquiries regarding financial results should be directed to Bryan Davis, Chief Financial Officer at 416.359.8612 or via e-mail at bryan.davis@brookfield.com.
Unitholder questions relating to distributions, address changes and unit certificates should be directed to the Trust’s Transfer Agent:
CST TRUST COMPANY
P.O. Box 700
Station B
Montreal, Quebec H3B 3K3
| Tel: | 416.682.3860 / 800.387.0825 |
| Fax: | 888.249.6189 |
Website: www.canstockta.com
E-mail: inquiries@canstockta.com
COMMUNICATIONS
We strive to keep our unitholders updated on our progress through a comprehensive annual report, quarterly interim reports, periodic press releases and quarterly conference calls.
Brookfield Canada Office Properties maintains a Web site, www.brookfieldcanadareit.com, which provides access to our published reports, press releases, statutory filings, supplementary information and trust and distribution information as well as summary information on the Trust.