UNITED STATES
SECURITIES AND EXCHANGE COMMISSION
Washington, D.C. 20549
FORM N-CSR
Certified Shareholder Report of
Registered Management Investment Companies
Investment Company Act File Number: 811-22656
American Funds Portfolio Series
(Exact Name of Registrant as Specified in Charter)
6455 Irvine Center Drive
Irvine, California 92618
(Address of Principal Executive Offices)
Registrant's telephone number, including area code: (213) 486-9200
Date of fiscal year end: October 31
Date of reporting period: October 31, 2016
Steven I. Koszalka
American Funds Portfolio Series
333 South Hope Street
Los Angeles, California 90071
(Name and Address of Agent for Service)
ITEM 1 – Reports to Stockholders
![]()
Invest in portfolios
designed to pursue
real-life objectives.
 | American Funds
Annual report |
American Funds Portfolio Series seeks to help investors meet a wide range of investment goals, including preservation of capital, income, balance and growth. Each fund in the series is an objective-based portfolio of actively managed American Funds.
American Funds, from Capital Group, is one of the nation’s largest mutual fund families. For 85 years, Capital has invested with a long-term focus based on thorough research and attention to risk.
Fund results shown in this report, unless otherwise indicated, are for Class A shares at net asset value. If a sales charge had been deducted, the results would have been lower. Results are for past periods and are not predictive of results for future periods. Current and future results may be lower or higher than those shown. Share prices and returns will vary, so investors may lose money. Investing for short periods makes losses more likely. Investments are not FDIC-insured, nor are they deposits of or guaranteed by a bank or any other entity, so they may lose value. For current information and month-end results, visit americanfunds.com.
Here are the total returns on a $1,000 investment with all distributions reinvested for periods ended September 30, 2016 (the most recent calendar quarter-end). Also shown are the expense ratios as of the series prospectus dated January 1, 2017 (unaudited):
| Cumulative total returns | Average annual total returns | |||||||||||
| Class A shares | 1 year | Lifetime (since 5/18/12) | Expense ratio | |||||||||
| Reflecting 5.75% maximum initial sales charge: | ||||||||||||
| American Funds Global Growth PortfolioSM | 4.79 | % | 9.70 | % | 0.82 | % | ||||||
| American Funds Growth PortfolioSM | 6.34 | 11.53 | 0.76 | |||||||||
| American Funds Growth and Income PortfolioSM | 6.31 | 9.19 | 0.71 | |||||||||
| American Funds Balanced PortfolioSM | 3.99 | 8.19 | 0.73 | |||||||||
| American Funds Income PortfolioSM | 4.84 | 6.18 | 0.65 | |||||||||
| Reflecting 3.75% maximum initial sales charge: | ||||||||||||
| American Funds Tax-Advantaged Income PortfolioSM | 6.11 | 7.80 | 0.78 | |||||||||
| Reflecting 2.50% maximum initial sales charge: | ||||||||||||
| American Funds Preservation PortfolioSM | –0.47 | 0.60 | 0.71 | |||||||||
| American Funds Tax-Exempt Preservation PortfolioSM | 0.51 | 1.74 | 0.74 | |||||||||
Investment results assume all distributions are reinvested and reflect applicable fees and expenses.
The portfolio series funds invest in Class R-6 shares of the underlying funds. Expense ratios are as of each fund’s prospectus available at the time of publication and include the weighted average expenses of the underlying funds.
For other share class results, visit americanfunds.com and americanfundsretirement.com.
Investment allocations may not achieve fund objectives. There are expenses associated with the underlying funds in addition to fund of funds expenses. The funds’ risks are directly related to the risks of the underlying funds. Refer to the series prospectus and the Risk Factors section of this report for more information on these and other risks associated with investing in the series.

Contents
| 1 | Letter to investors |
| 4 | The value of a $10,000 investment |
| 6 | A look inside the funds |
| 10 | Investment portfolios |
| 18 | Financial statements |
| 74 | Board of trustees and other officers |
We are pleased to present the annual report for the American Funds Portfolio Series, for the period ended October 31, 2016. The reporting period saw much volatility, including dramatic reactions to the U.K.’s surprise decision to leave the European Union in June, and uncertainty amid the U.S. presidential campaign. Despite these conditions, all the funds within the series returned positive results. Returns ranged from 5.30% (for American Funds Income Portfolio) to 1.86% (for American Funds Global Growth Portfolio, which invests significantly in issuers outside the U.S.).
The U.S. stock market did well despite increased volatility. U.S. stocks saw modest gains overall midyear, despite weakening economic data and the turmoil caused by the U.K.’s vote to exit the European Union. By the end of the fiscal year, U.S. stocks weakened somewhat amid interest rate worries and disappointing earnings from several companies. Fixed income funds advanced over most of the year, while in the last quarter, those with higher credit exposures fared the best. The euro zone quickly rebounded from the selloff that followed the U.K.’s exit from the European Union. Generally, funds with an income focus, which are more heavily weighted in the higher yielding telecommunications and utilities sectors, tended to outpace those with a growth objective. This trend continued until the last quarter of the year, when these companies’ yields weakened a bit.
As always, we encourage investors to keep short-term results in their proper perspective, especially during periods of market and political volatility.
About the series
The American Funds Portfolio Series consists of eight funds of funds that are designed to help investors pursue real-life goals, both long- and short-term, within a framework of three common objectives: preservation, balance and growth. These funds of funds can be used individually or in combination, based on an investor’s needs, risk tolerance and time horizon (the total length of time that an investor expects to hold a security or portfolio, before it will be used to fund retirement or college, for example).
The series was created by the American Funds Portfolio Oversight Committee, a group of seasoned investment professionals with varied backgrounds, diverse investment approaches and decades of experience. The Committee regularly monitors the Portfolio Series funds.
The economy
The U.S. economy grew at a modest pace over the first half of the fiscal year. However, by the end of the period, real gross domestic product increased at an annual rate of 3.2%, the biggest gain since 2014, and this on top of the previous quarter’s 1.4% gain. This result reflects an increase in personal consumption expenditures (PCE), exports and private inventory investment, among other factors. The U.S. consumer appears in relatively good shape with household debt near 30-year-lows, unemployment levels down and the emergence of the first signs of wage growth.
The stock market
U.S. stocks advanced at the end of the period, having recovered from earlier volatility. Information technology stocks lifted the Standard & Poor’s 500 Composite Index* (a market capitalization-weighted index based on the results of 500 widely held common stocks) to 4.51%. The increase was buoyed by the Federal Reserve’s decision to let interest rates stand at its July and September meetings.
International markets showed mixed results early on, but advanced later. The
| American Funds Portfolio Series | 1 |

Andrew Suzman
Principal investment officer
American Funds
Portfolio Series
“We created the portfolio series to provide investors with a core of high-quality, actively managed investments that can help them with savings goals like college and retirement. Our approach requires a meticulous examination and selection of the underlying funds. We feel the series simplifies investment complexity for ordinary individuals and families.”
MSCI All Country World ex USA Index*, a leading benchmark for developed and developing markets outside the U.S., registered 0.22% for the period. Japanese companies rebounded from earlier losses, and non-Japan Pacific companies rallied. Companies domiciled in the euro zone rebounded from the selloff that occurred following the Brexit referendum in June, but fell by the end of the year amid continued uncertainty. U.K.-listed companies lagged their euro zone counterparts, in part due to the currency weakness.
The bond market
U.S. bonds were volatile during late 2015, with yields trending higher immediately following the Fed rate hike. By the end of the fiscal year the Bloomberg Barclays U.S. Aggregate Index* (a measure of the broad fixed income investment-grade market of bonds rated BBB/Baa and above) gained 4.37%.
In October 2016, the yield on the bellwether 10-year Treasury note rose 24 basis points to 1.84%. Higher yields across the Treasury curve hurt bond prices in most sectors. Investment-grade corporates declined by 0.81%, while high-yield corporates rose 0.39%. Investment-grade corporate spreads to Treasuries tightened six basis points to end the month at 132 basis points.
Inflation expectations have crept higher over the past few months. Yet Treasury Inflation Protected Securities prices ended October 0.40% lower, due largely to the impact of higher government bond yields. Municipal bonds lost 1.05% in a month of record-setting issuance; the increased supply, in combination with rising Treasury yields, put downward pressure on muni bond prices.
Inside the series
As the eight portfolios in the series are combinations of individual funds, the results of the underlying funds are a primary driver of the series results. Within fixed income, funds with higher credit exposures fared the best.
All equity funds within the series delivered positive results. Toward the end of the fiscal year, higher yielding companies, such as those in the consumer telecommunications and utilities sectors, slightly weakened from earlier advances. This was a drag on the returns of funds with an income focus.
Bond funds experienced the greatest returns and were strengthened by holdings in such underlying funds as American High-Income Trust®, which led with a gain of 8.36%. Also benefitting the fixed income category was American High-Income Municipal Bond Fund®, which seeks high-yield, tax-exempt income through bonds and notes, with a gain of 6.72%. American Mutual Fund®, an equity fund which aims for conservation of capital, also saw a gain of 6.33%. The funds in the series geared toward preservation posted more modest gains, such as The Bond Fund of America®, at 4.21%.
The table on page 3 shows the lifetime results for the funds (since May 18, 2012). We include in this table the indexes we use to compare our funds to their markets. This year we changed and/or added certain benchmark indexes (indicated with footnote symbols 3 and 4), as we deemed them more representative of the funds’ objectives.
Please keep in mind that this four-and-a-half-year period is still a relatively brief investment time frame. We also encourage investors to bear in mind that the funds in the series are designed as long-term investments.
Moving forward
Strong employment and wage growth are currently supporting consumer health as construction and housing gain momentum. But given that companies in many areas of the market are fully valued, selectivity is important. As always, we take a long-term, research driven approach to investing that has served clients for more than 80 years.
We thank you for your continued interest in the American Funds Portfolio Series and look forward to reporting to you again in six months.
Cordially,

Bradley J. Vogt
Vice Chairman of the Board

Walter R. Burkley
President
December 12, 2016
For current information about the series, visit americanfunds.com.
| * | Sources: Bloomberg Index Services Ltd., MSCI and S&P Dow Jones Indices LLC. The market indexes are unmanaged and, therefore, have no expenses. Investors cannot invest directly in an index. |
| 2 | American Funds Portfolio Series |
Results at a glance
For periods ended October 31, 2016, with all distributions reinvested for Class A shares
| Cumulative total returns | Average annual total returns | |||||||
| 1 year | Lifetime (since 5/18/12) | |||||||
| American Funds Global Growth Portfolio | 1.86 | % | 10.49 | % | ||||
| MSCI All Country World Index1,2 | 2.05 | 9.70 | ||||||
| Lipper Global Funds Index | 1.67 | 10.29 | ||||||
| American Funds Growth Portfolio | 3.41 | 12.25 | ||||||
| Standard & Poor’s 500 Composite Index1 | 4.51 | 14.17 | ||||||
| MSCI All Country World ex USA Index1,2,3 | 0.22 | 6.07 | ||||||
| Lipper Growth Funds Index | 2.38 | 13.65 | ||||||
| American Funds Growth and Income Portfolio | 3.98 | 9.95 | ||||||
| Standard & Poor’s 500 Composite Index1 | 4.51 | 14.17 | ||||||
| MSCI All Country World ex USA Index1,2,3 | 0.22 | 6.07 | ||||||
| Bloomberg Barclays Global Aggregate Index1,3 | 5.59 | 0.97 | ||||||
| Lipper Growth and Income Funds Index | 3.96 | 11.31 | ||||||
| American Funds Balanced Portfolio | 3.45 | 9.12 | ||||||
| Standard & Poor’s 500 Composite Index1 | 4.51 | 14.17 | ||||||
| MSCI All Country World ex USA Index1,2,3 | 0.22 | 6.07 | ||||||
| Bloomberg Barclays U.S. Aggregate Index1,3 | 4.37 | 2.59 | ||||||
| Lipper Balanced Funds Index | 3.56 | 8.29 | ||||||
| American Funds Income Portfolio | 5.30 | 7.15 | ||||||
| Standard & Poor’s 500 Composite Index1 | 4.51 | 14.17 | ||||||
| MSCI All Country World ex USA Index1,2,3 | 0.22 | 6.07 | ||||||
| Bloomberg Barclays U.S. Aggregate Index1,3 | 4.37 | 2.59 | ||||||
| Lipper Income Funds Index | 4.08 | 5.93 | ||||||
| American Funds Tax-Advantaged Income Portfolio | 4.52 | 8.27 | ||||||
| Standard & Poor’s 500 Composite Index1,3 | 4.51 | 14.17 | ||||||
| MSCI All Country World ex USA Index1,2,3 | 0.22 | 6.07 | ||||||
| Bloomberg Barclays Municipal Bond Index1 | 4.06 | 3.45 | ||||||
| Lipper Income Funds Index | 4.08 | 5.93 | ||||||
| American Funds Preservation Portfolio | 1.90 | 1.14 | ||||||
| Bloomberg Barclays 1-5 Year U.S. Government/Credit A+ Index1,3 | 1.75 | 1.28 | ||||||
| Bloomberg Barclays U.S. Government/Credit 1-7 Years ex BBB Index1,4 | 2.22 | 1.55 | ||||||
| Lipper Short-Intermediate Investment-Grade Debt Funds Index | 2.97 | 1.93 | ||||||
| American Funds Tax-Exempt Preservation Portfolio | 2.08 | 2.18 | ||||||
| Bloomberg Barclays Municipal Short-Intermediate 1-10 Years Index1 | 2.01 | 2.07 | ||||||
| Lipper Intermediate Municipal Debt Funds Index | 3.40 | 2.67 | ||||||
| 1 | Sources: Bloomberg Index Services Ltd., MSCI and S&P Dow Jones Indices LLC. The market indexes are unmanaged and, therefore, have no expenses. Investors cannot invest directly in an index. |
| 2 | Results reflect dividends net of withholding taxes. |
| 3 | This index was added as a benchmark for the fund, as it is more representative of the fund’s objective. |
| 4 | This index is being replaced by the Bloomberg Barclays 1-5 Year U.S. Government/Credit A+ Index, which is more representative of the fund’s objective. |
The MSCI ACWI is a free float-adjusted market capitalization-weighted index that is designed to measure results of more than 40 developed and emerging equity markets. MSCI All Country World ex USA Index is a free float-adjusted market capitalization weighted index that is designed to measure equity market results of more than 40 global developed and emerging markets, excluding the United States. The S&P 500 is a market capitalization-weighted index based on the average weighted results of 500 widely held common stocks.
Lipper Global Funds Index is an equally weighted index of funds that invest at least 25% of their portfolios in securities traded outside of the U.S. and may own U.S. securities as well. Lipper Growth Funds Index is an equally weighted index of growth funds. Lipper Growth and Income Funds Index is an equally weighted index of funds that combine a growth-of-earnings orientation and an income requirement for level and/or rising dividends. Lipper Balanced Funds Index is an equally weighted index of funds that seek to conserve principal by maintaining a balanced portfolio of both stocks and bonds. Lipper Income Funds Index is an equally weighted index of funds that normally seek a high level of current income through investing in income-producing stocks, bonds and money market instruments. Lipper Short-Intermediate Investment-Grade Debt Funds Index is an equally weighted index of funds that invest primarily in investment-grade debt issues (rated BBB/Baa and above) with dollar-weighted average maturities of one to five years. Lipper Intermediate Municipal Debt Funds Index is an equally weighted index of funds that invest in municipal debt issues with dollar-weighted average maturities of five to 10 years. Lipper indexes track the largest mutual funds (no more than 30), represented by one share class per fund, in the corresponding Lipper category.
Bloomberg Barclays Municipal Bond Index is a market-value-weighted index designed to represent the long-term investment-grade tax-exempt bond market. Bloomberg Barclays U.S. Government/Credit 1-7 Years ex BBB Index is a market-value-weighted index that tracks the total return results of fixed-rate, publicly placed, dollar-denominated obligations issued by the U.S. Treasury, U.S. government agencies, quasi-federal corporations, corporate or foreign debt guaranteed by the U.S. government, and U.S. corporate and foreign debentures and secured notes that meet specified maturity, liquidity and quality requirements, with maturities of one to seven years, excluding BBB-rated securities. Bloomberg Barclays Municipal Short-Intermediate 1–10 Years Index is a market-value-weighted index that includes investment-grade tax-exempt bonds with maturities of one to 10 years. Bloomberg Barclays Global Aggregate Index represents the global investment-grade fixed income markets. Bloomberg Barclays U.S. Aggregate Index represents the U.S. investment-grade fixed-rate bond market. Bloomberg Barclays 1-5 Year U.S. Government/ Credit A+ Index is a market-value weighted index that tracks the total return results of fixed-rate, publicly placed, dollar-denominated obligations issued by the U.S. Treasury, U.S. government agencies, quasi-federal corporations, corporate or foreign debt guaranteed by the U.S. government, and U.S. corporate and foreign debentures and secured notes that meet specified maturity, liquidity and quality requirements, with maturities of one to five years, including A-rated securities and above.
| American Funds Portfolio Series | 3 |
The value of a $10,000 investment
(for periods ended October 31, 2016, with all distributions reinvested)
Fund results shown are for Class A shares and reflect deduction of the maximum sales charge on the $10,000 investment: 5.75% (for Global Growth Portfolio, Growth Portfolio, Growth and Income Portfolio, Balanced Portfolio and Income Portfolio) 1; 3.75% (for Tax-Advantaged Income Portfolio)2; and 2.50% (for Preservation Portfolio and Tax-Exempt Preservation Portfolio).3
Global Growth Portfolio
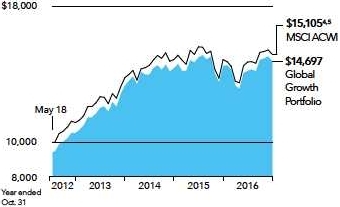
Average annual total returns6 based on a $1,000 investment
(for periods ended October 31, 2016)*
| 1 year | Lifetime (since 5/18/12) | |||
| Class A shares | –4.00% | 9.03% |
| * | Assumes reinvestment of all distributions and payment of the maximum 5.75% sales charge. |
Growth Portfolio
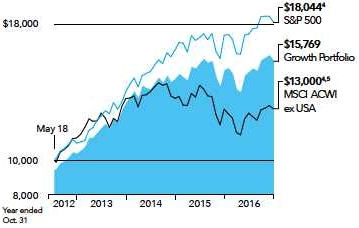
Average annual total returns6 based on a $1,000 investment
(for periods ended October 31, 2016)*
| 1 year | Lifetime (since 5/18/12) | |||
| Class A shares | –2.54% | 10.77% |
| * | Assumes reinvestment of all distributions and payment of the maximum 5.75% sales charge. |
Growth and Income Portfolio
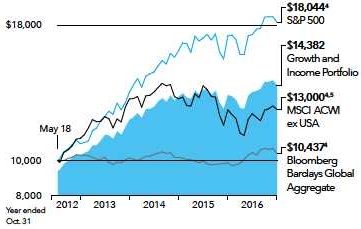
Average annual total returns6 based on a $1,000 investment
(for periods ended October 31, 2016)*
| 1 year | Lifetime (since 5/18/12) | |||
| Class A shares | –2.00% | 8.50% |
| * | Assumes reinvestment of all distributions and payment of the maximum 5.75% sales charge. |
Balanced Portfolio
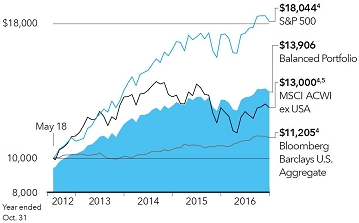
Average annual total returns6 based on a $1,000 investment
(for periods ended October 31, 2016)*
| 1 year | Lifetime (since 5/18/12) | |||
| Class A shares | –2.51% | 7.68% |
| * | Assumes reinvestment of all distributions and payment of the maximum 5.75% sales charge. |
| 1 | As outlined in the prospectus, the sales charge is reduced for accounts (and aggregated investments) of $25,000 or more and is eliminated for purchases of $1 million or more. |
| 2 | As outlined in the prospectus, the sales charge is reduced for accounts (and aggregated investments) of $100,000 or more and is eliminated for purchases of $1 million or more. |
| 3 | As outlined in the prospectus, the sales charge is reduced for accounts (and aggregated investments) of $500,000 or more and is eliminated for purchases of $1 million or more. |
| 4 | Sources: Bloomberg Index Services Ltd., MSCI and S&P Dow Jones Indices LLC. The market indexes are unmanaged and, therefore, have no expenses. Investors cannot invest directly in an index. |
| 4 | American Funds Portfolio Series |
Thus, the net amount invested was $9,425, $9,625 and $9,750, respectively. Results are for past periods and are not predictive of results for future periods. Current and future results may be lower or higher than those shown. Share prices and returns will vary, so investors may lose money. For current information and month-end results, visit americanfunds.com.
Income Portfolio
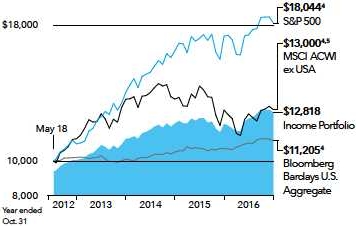
Average annual total returns6 based on a $1,000 investment
(for periods ended October 31, 2016)*
| 1 year | Lifetime (since 5/18/12) | |||
| Class A shares | –0.71% | 5.73% |
| * | Assumes reinvestment of all distributions and payment of the maximum 5.75% sales charge. |
Tax-Advantaged Income Portfolio
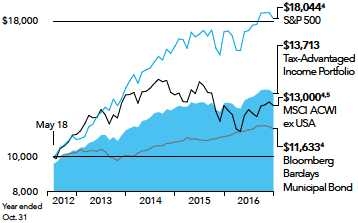
Average annual total returns6 based on a $1,000 investment
(for periods ended October 31, 2016)*
| 1 year | Lifetime (since 5/18/12) | |||
| Class A shares | 0.62% | 7.34% |
| * | Assumes reinvestment of all distributions and payment of the maximum 3.75% sales charge. |
Preservation Portfolio
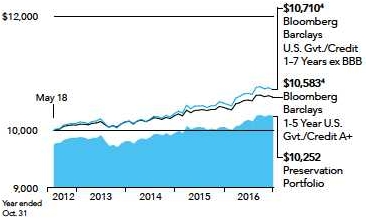
Average annual total returns6 based on a $1,000 investment
(for periods ended October 31, 2016)*
| 1 year | Lifetime (since 5/18/12) | |||
| Class A shares | –0.69% | 0.56% |
| * | Assumes reinvestment of all distributions and payment of the maximum 2.50% sales charge. |
Tax-Exempt Preservation Portfolio
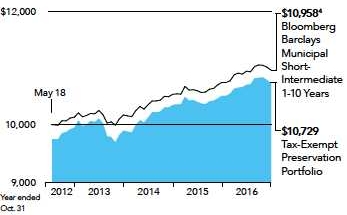
Average annual total returns6 based on a $1,000 investment
(for periods ended October 31, 2016)*
| 1 year | Lifetime (since 5/18/12) | |||
| Class A shares | –0.43% | 1.59% |
| * | Assumes reinvestment of all distributions and payment of the maximum 2.50% sales charge. |
| 5 | Results reflect dividends net of withholding taxes. |
| 6 | Investment results assume all distributions are reinvested and reflect applicable fees and expenses. The portfolio series funds invest in Class R-6 shares of the underlying funds. |
There is no sales charge on dividends or capital gain distributions that are reinvested in additional shares. The results shown are before taxes on fund distributions and sale of fund shares.
| American Funds Portfolio Series | 5 |
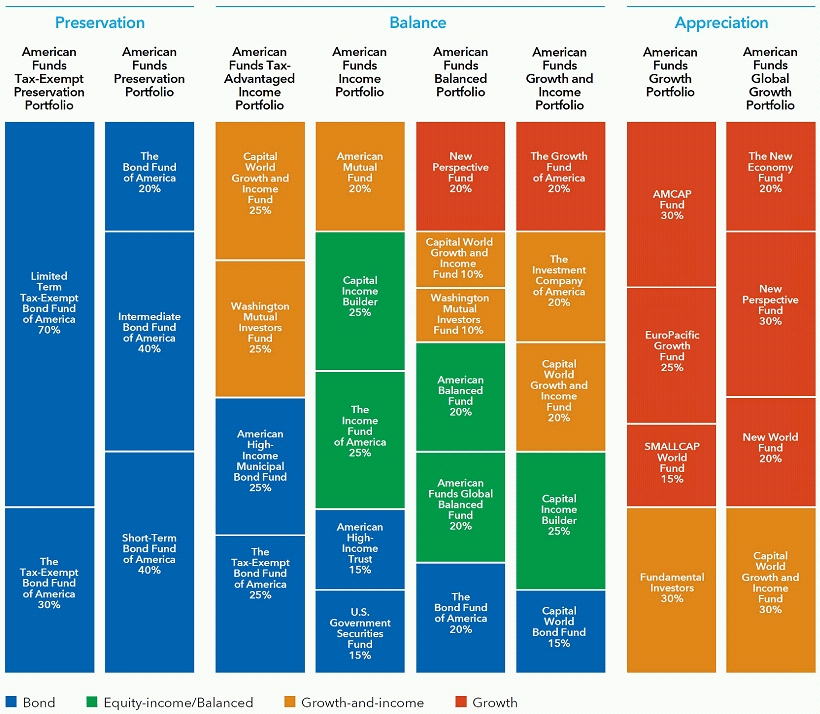
American Funds Portfolio Series was launched in May 2012 to help investors pursue preservation, income, balance and appreciation. Each of the eight funds in the series represents a blend of individual American Funds designed to help investors meet particular investment goals.
The members of the Portfolio Oversight Committee actively monitor the series to keep the portfolios aligned with their objectives.
The pages that follow describe the funds’ objectives and the key drivers of results during the reporting period. They also include a table showing the target allocations of the underlying funds.
| 6 | American Funds Portfolio Series |
American Funds Global Growth Portfolio
| Underlying funds: |
| 30% Capital World Growth and Income Fund® |
| 30% New Perspective Fund® |
| 20% New World Fund® |
| 20% The New Economy Fund® |
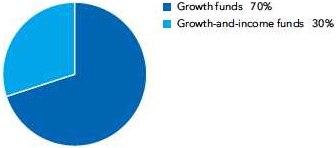
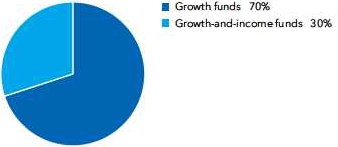
The fund’s investment objective is to provide long-term growth of capital. It will attempt to achieve its objective by investing in a mix of American Funds in different combinations and weightings. The underlying American Funds will primarily consist of growth funds and growth-and-income funds. The fund will invest at least 25% of its assets in underlying funds that invest significantly (under normal market conditions, at least 40%) in issuers outside the United States.
For the 12-month period ended October 31, 2016, the fund’s A shares had a return of 1.86%. Among the fund’s underlying funds, New World Fund contributed to results, while Capital World Growth and Income Fund, New Perspective Fund and The New Economy Fund lagged somewhat.
American Funds Growth Portfolio
| Underlying funds: |
| 30% AMCAP Fund® |
| 30% Fundamental Investors® |
| 25% EuroPacific Growth Fund® |
| 15% SMALLCAP World Fund® |
The fund’s investment objective is to provide long-term growth of capital. It will attempt to achieve its objective by investing in a mix of American Funds in different combinations and weightings. The underlying American Funds will primarily consist of growth funds and growth-and-income funds, which principally invest in equity securities and which may have significant holdings of issuers domiciled outside the United States.
For the 12-month period ended October 31, 2016, the fund’s A shares had a return of 3.41%. Among the fund’s underlying funds, Fundamental Investors and SMALLCAP World Fund contributed to results, while EuroPacific Growth Fund lagged with a small positive result.
American Funds Growth and Income Portfolio
| Underlying funds: |
| 25% Capital Income Builder® |
| 20% Capital World Growth and Income Fund® |
| 20% The Growth Fund of America® |
| 20% The Investment Company of America® |
| 15% Capital World Bond Fund® |
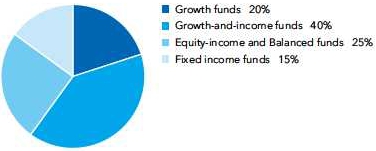
The fund’s investment objective is to provide long-term growth of capital while providing current income. It will attempt to achieve its objectives by investing in a mix of American Funds in different combinations and weightings. The underlying American Funds may represent a variety of fund categories such as growth funds, growth-and-income funds, equity-income funds, balanced funds and bond funds.
For the 12-month period ended October 31, 2016, the fund’s A shares had a return of 3.98%. Among the fund’s underlying funds, The Investment Company of America, Capital World Bond Fund and The Growth Fund of America contributed to results, while Capital Income Builder and Capital World Growth and Income Fund lagged somewhat.
| American Funds Portfolio Series | 7 |
American Funds Balanced Portfolio
| Underlying funds: |
| 20% American Balanced Fund® |
| 20% American Funds Global Balanced FundSM |
| 20% The Bond Fund of America® |
| 20% New Perspective Fund® |
| 10% Capital World Growth and Income Fund® |
| 10% Washington Mutual Investors FundSM |
The fund’s investment objective is to provide current income and long-term growth of capital and income. It will attempt to achieve its objectives by investing in a mix of American Funds in different combinations and weightings. The underlying American Funds may represent a variety of fund categories such as growth funds, growth-and-income funds, equity-income funds, balanced funds and bond funds. The fund will invest at least 45% of its assets in common stocks and other equity investments, and through its investments in the underlying funds, will invest at least 25% of the value of its assets in bonds and other debt securities (including money market instruments).
For the 12-month period ended October 31, 2016, the fund’s A shares had a return of 3.45%. Among the fund’s underlying funds, Washington Mutual Investors Fund, American Balanced Fund and The Bond Fund of America contributed to results, while New Perspective Fund and Capital World Growth and Income Fund lagged.
American Funds Income Portfolio
| Underlying funds: |
| 25% Capital Income Builder® |
| 25% The Income Fund of America® |
| 20% American Mutual Fund® |
| 15% American High-Income Trust® |
| 15% U.S. Government Securities Fund® |
The fund’s investment objective is to provide current income and, secondarily, long-term growth of capital. It will attempt to achieve its objectives by investing in a mix of American Funds in different combinations and weightings. The underlying American Funds may represent a variety of fund categories such as bond funds, balanced funds, equity-income funds, growth-and-income funds and growth funds.
For the 12-month period ended October 31, 2016, the fund’s A shares had a return of 5.30%. Among the fund’s underlying funds, American High-Income Trust, American Mutual Fund and The Income Fund of America contributed to results, while Capital Income Builder and U.S. Government Securities Fund lagged somewhat.
American Funds Tax-Advantaged Income Portfolio
| Underlying funds: |
| 25% Capital World Growth and Income Fund® |
| 25% Washington Mutual Investors FundSM |
| 25% American High-Income Municipal Bond Fund® |
| 25% The Tax-Exempt Bond Fund of America® |
The fund’s investment objective is to provide current income, a portion of which is exempt from regular federal income tax, while secondarily striving for long-term growth of capital. It will attempt to achieve its objectives by investing in a mix of American Funds in different combinations and weightings. The underlying American Funds may represent a variety of fund categories such as bond funds, balanced funds, equity income funds, growth-and-income funds and growth funds. The fund will seek to generate a material portion of its current income from underlying funds that invest in bonds that are exempt from regular income tax, such as municipal bonds.
For the 12-month period ended October 31, 2016, the fund’s A shares had a return of 4.52%. Among the underlying funds, all contributed to results, with American High-Income Municipal Bond Fund and Washington Mutual Investors Fund leading. Capital World Growth and Income Fund lagged somewhat..
| 8 | American Funds Portfolio Series |
American Funds Preservation Portfolio
| Underlying funds: |
| 40% Intermediate Bond Fund of America® |
| 40% Short-Term Bond Fund of America® |
| 20% The Bond Fund of America® |
The fund’s investment objective is to provide current income, consistent with preservation of capital. It will attempt to achieve its objective by investing in a mix of American Funds in different combinations and weightings. The fund principally invests in funds that seek current income through bond investments.
For the 12-month period ended October 31, 2016, the fund’s A shares had a return of 1.90%. All of the underlying funds contributed modestly to results, led by The Bond Fund of America. Short-Term Bond Fund of America lagged somewhat.
American Funds Tax-Exempt Preservation Portfolio
| Underlying funds: |
| 70% Limited Term Tax-Exempt Bond Fund of America® |
| 30% The Tax-Exempt Bond Fund of America® |
The fund’s investment objective is to provide current income that is exempt from regular federal income tax, consistent with preservation of capital. It will attempt to achieve its investment objective by investing in a mix of American Funds in different combinations and weightings. The fund principally invests in funds that seek current income through bond investments. The fund will strive to generate a material portion of its current income from underlying funds that invest in bonds that are exempt from regular income tax, such as municipal bonds.
For the 12-month period ended October 31, 2016, the fund’s A shares had a return of 2.08%. Both of the fund’s underlying funds modestly contributed to results, with The Tax-Exempt Bond Fund of America being the most additive.
The underlying fund allocations are as of 10/31/16. Portfolio Series funds are actively monitored, so allocations will vary over time.
| American Funds Portfolio Series | 9 |
American Funds Global Growth Portfolio
Investment portfolio, October 31, 2016
| Fund investments | Shares | Value (000) | ||||||
| Growth funds 70% | ||||||||
| New Perspective Fund, Class R-6 | 14,589,141 | $ | 535,422 | |||||
| New World Fund, Inc., Class R-6 | 6,638,363 | 357,343 | ||||||
| The New Economy Fund, Class R-6 | 9,801,754 | 356,392 | ||||||
| 1,249,157 | ||||||||
| Growth-and-income funds 30% | ||||||||
| Capital World Growth and Income Fund, Class R-6 | 12,022,428 | 536,199 | ||||||
| Total investment securities 100% (cost: $1,765,873,000) | 1,785,356 | |||||||
| Other assets less liabilities 0% | (717 | ) | ||||||
| Net assets 100% | $ | 1,784,639 | ||||||
See Notes to Financial Statements
| 10 | American Funds Portfolio Series |
American Funds Growth Portfolio
Investment portfolio, October 31, 2016
| Fund investments | Shares | Value (000) | ||||||
| Growth funds 70% | ||||||||
| AMCAP Fund, Class R-6 | 45,697,602 | $ | 1,229,723 | |||||
| EuroPacific Growth Fund, Class R-6 | 22,000,045 | 1,028,722 | ||||||
| SMALLCAP World Fund, Inc., Class R-6 | 13,300,802 | 614,763 | ||||||
| 2,873,208 | ||||||||
| Growth-and-income funds 30% | ||||||||
| Fundamental Investors, Class R-6 | 23,261,210 | 1,241,683 | ||||||
| Total investment securities 100% (cost: $4,015,298,000) | 4,114,891 | |||||||
| Other assets less liabilities 0% | (1,649 | ) | ||||||
| Net assets 100% | $ | 4,113,242 | ||||||
See Notes to Financial Statements
| American Funds Portfolio Series | 11 |
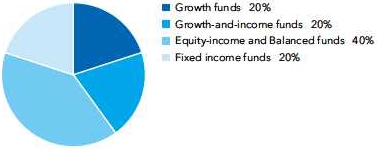
American Funds Growth and Income Portfolio
Investment portfolio, October 31, 2016
| Fund investments | Shares | Value (000) | ||||||
| Growth funds 20% | ||||||||
| The Growth Fund of America, Class R-6 | 27,420,032 | $ | 1,189,755 | |||||
| Growth-and-income funds 40% | ||||||||
| Capital World Growth and Income Fund, Class R-6 | 26,626,054 | 1,187,522 | ||||||
| The Investment Company of America, Class R-6 | 33,143,981 | 1,189,538 | ||||||
| 2,377,060 | ||||||||
| Equity-income and Balanced funds 25% | ||||||||
| Capital Income Builder, Class R-6 | 25,798,865 | 1,483,176 | ||||||
| Fixed income funds 15% | ||||||||
| Capital World Bond Fund, Class R-6 | 44,441,260 | 888,825 | ||||||
| Total investment securities 100% (cost: $5,802,405,000) | 5,938,816 | |||||||
| Other assets less liabilities 0% | (2,460 | ) | ||||||
| Net assets 100% | $ | 5,936,356 | ||||||
Investments in affiliates
This holding is an affiliate of the fund under the Investment Company Act of 1940 since the fund holds 5% or more of its outstanding voting shares. Further details on this holding and related transactions during the year ended October 31, 2016, appear below.
| Value of | ||||||||||||||||||||||||
| Dividend | affiliates at | |||||||||||||||||||||||
| Beginning | Ending | income | 10/31/2016 | |||||||||||||||||||||
| shares | Additions | Reductions | shares | (000) | (000) | |||||||||||||||||||
| Capital World Bond Fund, Class R-6 | 38,079,140 | 6,474,775 | 112,655 | 44,441,260 | $ | 15,548 | $ | 888,825 | ||||||||||||||||
See Notes to Financial Statements
| 12 | American Funds Portfolio Series |
American Funds Balanced Portfolio
Investment portfolio, October 31, 2016
| Fund investments | Shares | Value (000) | ||||||
| Growth funds 20% | ||||||||
| New Perspective Fund, Class R-6 | 28,072,116 | $ | 1,030,247 | |||||
| Growth-and-income funds 20% | ||||||||
| Capital World Growth and Income Fund, Class R-6 | 11,535,171 | 514,469 | ||||||
| Washington Mutual Investors Fund, Class R-6 | 12,829,539 | 516,260 | ||||||
| 1,030,729 | ||||||||
| Equity-income and Balanced funds 40% | ||||||||
| American Balanced Fund, Class R-6 | 41,690,248 | 1,032,251 | ||||||
| American Funds Global Balanced Fund, Class R-6 | 34,775,521 | 1,032,137 | ||||||
| 2,064,388 | ||||||||
| Fixed income funds 20% | ||||||||
| The Bond Fund of America, Class R-6 | 79,096,128 | 1,032,204 | ||||||
| Total investment securities 100% (cost: $4,967,125,000) | 5,157,568 | |||||||
| Other assets less liabilities 0% | (2,188 | ) | ||||||
| Net assets 100% | $ | 5,155,380 | ||||||
Investments in affiliates
This holding is an affiliate of the fund under the Investment Company Act of 1940 since the fund holds 5% or more of its outstanding voting shares. Further details on this holding and related transactions during the year ended October 31, 2016, appear below.
| Value of | ||||||||||||||||||||||||
| Dividend | affiliates at | |||||||||||||||||||||||
| Beginning | Ending | income | 10/31/2016 | |||||||||||||||||||||
| shares | Additions | Reductions | shares | (000) | (000) | |||||||||||||||||||
| American Funds Global Balanced Fund, Class R-6 | 26,894,799 | 7,887,806 | 7,084 | 34,775,521 | $ | 20,139 | $ | 1,032,137 | ||||||||||||||||
See Notes to Financial Statements
| American Funds Portfolio Series | 13 |
American Funds Income Portfolio
Investment portfolio, October 31, 2016

| Fund investments | Shares | Value (000) | ||||||
| Growth-and-income funds 20% | ||||||||
| American Mutual Fund, Class R-6 | 20,940,429 | $ | 755,740 | |||||
| Equity-income and Balanced funds 50% | ||||||||
| Capital Income Builder, Class R-6 | 16,460,614 | 946,321 | ||||||
| The Income Fund of America, Class R-6 | 44,664,865 | 947,788 | ||||||
| 1,894,109 | ||||||||
| Fixed income funds 30% | ||||||||
| American High-Income Trust, Class R-6 | 56,720,041 | 577,410 | ||||||
| U.S. Government Securities Fund, Class R-6 | 40,437,628 | 571,384 | ||||||
| 1,148,794 | ||||||||
| Total investment securities 100% (cost: $3,712,339,000) | 3,798,643 | |||||||
| Other assets less liabilities 0% | (1,499 | ) | ||||||
| Net assets 100% | $ | 3,797,144 | ||||||
Investments in affiliates
This holding is an affiliate of the fund under the Investment Company Act of 1940 since the fund holds 5% or more of its outstanding voting shares. Further details on this holding and related transactions during the year ended October 31, 2016, appear below.
| Value of | ||||||||||||||||||||||||
| Dividend | affiliates at | |||||||||||||||||||||||
| Beginning | Ending | income | 10/31/2016 | |||||||||||||||||||||
| shares | Additions | Reductions | shares | (000) | (000) | |||||||||||||||||||
| U.S. Government Securities Fund, Class R-6 | 43,703,109 | 8,575,667 | 11,841,148 | 40,437,628 | $ | 8,019 | $ | 571,384 | ||||||||||||||||
See Notes to Financial Statements
| 14 | American Funds Portfolio Series |
American Funds Tax-Advantaged Income Portfolio
Investment portfolio, October 31, 2016
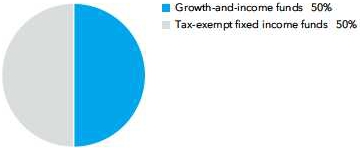
| Fund investments | Shares | Value (000) | ||||||
| Growth-and-income funds 50% | ||||||||
| Capital World Growth and Income Fund, Class R-6 | 6,390,276 | $ | 285,006 | |||||
| Washington Mutual Investors Fund, Class R-6 | 7,102,569 | 285,807 | ||||||
| 570,813 | ||||||||
| Tax-exempt fixed income funds 50% | ||||||||
| American High-Income Municipal Bond Fund, Class R-6 | 18,021,335 | 287,080 | ||||||
| The Tax-Exempt Bond Fund of America, Class R-6 | 21,830,714 | 287,074 | ||||||
| 574,154 | ||||||||
| Total investment securities 100% (cost: $1,109,170,000) | 1,144,967 | |||||||
| Other assets less liabilities 0% | (453 | ) | ||||||
| Net assets 100% | $ | 1,144,514 | ||||||
Investments in affiliates
This holding is an affiliate of the fund under the Investment Company Act of 1940 since the fund holds 5% or more of its outstanding voting shares. Further details on this holding and related transactions during the year ended October 31, 2016, appear below.
| Value of | ||||||||||||||||||||||||
| Dividend | affiliates at | |||||||||||||||||||||||
| Beginning | Ending | income | 10/31/2016 | |||||||||||||||||||||
| shares | Additions | Reductions | shares | (000) | (000) | |||||||||||||||||||
| American High-Income Municipal Bond Fund, Class R-6 | 12,970,358 | 5,077,990 | 27,013 | 18,021,335 | $ | 9,855 | $ | 287,080 | ||||||||||||||||
See Notes to Financial Statements
| American Funds Portfolio Series | 15 |
American Funds Preservation Portfolio
Investment portfolio, October 31, 2016

| Fund investments | Shares | Value (000) | ||||||
| Fixed income funds 100% | ||||||||
| Intermediate Bond Fund of America, Class R-6 | 36,468,769 | $ | 496,705 | |||||
| Short-Term Bond Fund of America, Class R-6 | 49,670,464 | 496,705 | ||||||
| The Bond Fund of America, Class R-6 | 19,030,829 | 248,352 | ||||||
| 1,241,762 | ||||||||
| Total investment securities 100% (cost: $1,237,965,000) | 1,241,762 | |||||||
| Other assets less liabilities 0% | (483 | ) | ||||||
| Net assets 100% | $ | 1,241,279 | ||||||
Investments in affiliates
This holding is an affiliate of the fund under the Investment Company Act of 1940 since the fund holds 5% or more of its outstanding voting shares. Further details on this holding and related transactions during the year ended October 31, 2016, appear below.
| Value of | ||||||||||||||||||||||||
| Dividend | affiliates at | |||||||||||||||||||||||
| Beginning | Ending | income | 10/31/2016 | |||||||||||||||||||||
| shares | Additions | Reductions | shares | (000) | (000) | |||||||||||||||||||
| Short-Term Bond Fund of America, Class R-6 | 35,637,520 | 14,736,691 | 703,747 | 49,670,464 | $ | 4,639 | $ | 496,705 | ||||||||||||||||
See Notes to Financial Statements
| 16 | American Funds Portfolio Series |
American Funds Tax-Exempt Preservation Portfolio
Investment portfolio, October 31, 2016

| Fund investments | Shares | Value (000) | ||||||
| Tax-exempt fixed income funds 100% | ||||||||
| Limited Term Tax-Exempt Bond Fund of America, Class R-6 | 19,754,313 | $ | 313,303 | |||||
| The Tax-Exempt Bond Fund of America, Class R-6 | 10,210,866 | 134,273 | ||||||
| 447,576 | ||||||||
| Total investment securities 100% (cost: $451,151,000) | 447,576 | |||||||
| Other assets less liabilities 0% | (120 | ) | ||||||
| Net assets 100% | $ | 447,456 | ||||||
Investments in affiliates
This holding is an affiliate of the fund under the Investment Company Act of 1940 since the fund holds 5% or more of its outstanding voting shares. Further details on this holding and related transactions during the year ended October 31, 2016, appear below.
| Value of | ||||||||||||||||||||||||
| Dividend | affiliates at | |||||||||||||||||||||||
| Beginning | Ending | income | 10/31/2016 | |||||||||||||||||||||
| shares | Additions | Reductions | shares | (000) | (000) | |||||||||||||||||||
| Limited Term Tax-Exempt Bond Fund of America, Class R-6 | 13,293,797 | 7,428,463 | 967,947 | 19,754,313 | $ | 6,107 | $ | 313,303 | ||||||||||||||||
See Notes to Financial Statements
| American Funds Portfolio Series | 17 |
Statements of assets and liabilities
at October 31, 2016
| Global Growth Portfolio | Growth Portfolio | Growth and Income Portfolio | ||||||||||
| Assets: | ||||||||||||
| Investment securities, at value: | ||||||||||||
| Unaffiliated issuers | $ | 1,785,356 | $ | 4,114,891 | $ | 5,049,991 | ||||||
| Affiliated issuers | — | — | 888,825 | |||||||||
| Receivables for: | ||||||||||||
| Sales of investments | 779 | — | 2,177 | |||||||||
| Sales of fund’s shares | 1,597 | 5,068 | 5,396 | |||||||||
| Dividends | — | — | — | |||||||||
| Total assets | 1,787,732 | 4,119,959 | 5,946,389 | |||||||||
| Liabilities: | ||||||||||||
| Payables for: | ||||||||||||
| Purchases of investments | — | 1,121 | — | |||||||||
| Repurchases of fund’s shares | 2,373 | 3,927 | 7,553 | |||||||||
| Services provided by related parties | 698 | 1,618 | 2,422 | |||||||||
| Trustees’ deferred compensation | 4 | 8 | 13 | |||||||||
| Other | 18 | 43 | 45 | |||||||||
| Total liabilities | 3,093 | 6,717 | 10,033 | |||||||||
| Net assets at October 31, 2016 | $ | 1,784,639 | $ | 4,113,242 | $ | 5,936,356 | ||||||
| Net assets consist of: | ||||||||||||
| Capital paid in on shares of beneficial interest | $ | 1,721,464 | $ | 3,879,491 | $ | 5,656,813 | ||||||
| (Distributions in excess of) undistributed net investment income | (4 | ) | (2,386 | ) | (13 | ) | ||||||
| Undistributed (accumulated) net realized gain (loss) | 43,696 | 136,544 | 143,145 | |||||||||
| Net unrealized appreciation (depreciation) | 19,483 | 99,593 | 136,411 | |||||||||
| Net assets at October 31, 2016 | $ | 1,784,639 | $ | 4,113,242 | $ | 5,936,356 | ||||||
| Investment securities, at cost: | ||||||||||||
| Unaffiliated issuers | $ | 1,765,873 | $ | 4,015,298 | $ | 4,899,820 | ||||||
| Affiliated issuers | — | — | 902,585 | |||||||||
See Notes to Financial Statements
| 18 | American Funds Portfolio Series |
(dollars in thousands)
| Balanced | Income | Tax-Advantaged Income | Preservation | Tax-Exempt Preservation | ||||||||||||||
| Portfolio | Portfolio | Portfolio | Portfolio | Portfolio | ||||||||||||||
| �� | ||||||||||||||||||
| $ | 4,125,431 | $ | 3,227,259 | $ | 857,887 | $ | 745,057 | $ | 134,273 | |||||||||
| 1,032,137 | 571,384 | 287,080 | 496,705 | 313,303 | ||||||||||||||
| 6,311 | — | 102 | — | — | ||||||||||||||
| 5,219 | 4,413 | 739 | 3,229 | 1,806 | ||||||||||||||
| 1,537 | 3,333 | 1,730 | 1,359 | 955 | ||||||||||||||
| 5,170,635 | 3,806,389 | 1,147,538 | 1,246,350 | 450,337 | ||||||||||||||
| 1,538 | 4,299 | 1,730 | 2,685 | 2,261 | ||||||||||||||
| 11,521 | 3,480 | 841 | 1,904 | 499 | ||||||||||||||
| 2,152 | 1,440 | 448 | 469 | 119 | ||||||||||||||
| 10 | 8 | 2 | 2 | 1 | ||||||||||||||
| 34 | 18 | 3 | 11 | 1 | ||||||||||||||
| 15,255 | 9,245 | 3,024 | 5,071 | 2,881 | ||||||||||||||
| $ | 5,155,380 | $ | 3,797,144 | $ | 1,144,514 | $ | 1,241,279 | $ | 447,456 | |||||||||
| $ | 4,857,893 | $ | 3,696,337 | $ | 1,096,843 | $ | 1,237,771 | $ | 453,757 | |||||||||
| 6,157 | 2,362 | 1,849 | 343 | 332 | ||||||||||||||
| 100,887 | 12,141 | 10,025 | (632 | ) | (3,058 | ) | ||||||||||||
| 190,443 | 86,304 | 35,797 | 3,797 | (3,575 | ) | |||||||||||||
| $ | 5,155,380 | $ | 3,797,144 | $ | 1,144,514 | $ | 1,241,279 | $ | 447,456 | |||||||||
| $ | 3,919,326 | $ | 3,147,784 | $ | 830,842 | $ | 740,466 | $ | 133,461 | |||||||||
| 1,047,799 | 564,555 | 278,328 | 497,499 | 317,690 | ||||||||||||||
| American Funds Portfolio Series | 19 |
Statements of assets and liabilities
at October 31, 2016
| Global Growth | Growth | Growth and Income | ||||||||||||
| Portfolio | Portfolio | Portfolio | ||||||||||||
| Shares of beneficial interest issued and outstanding (no stated par value) — unlimited shares authorized | ||||||||||||||
| Class A: | Net assets | $ | 1,074,102 | $ | 2,505,211 | $ | 3,924,266 | |||||||
| Shares outstanding | 75,174 | 164,710 | 293,826 | |||||||||||
| Net asset value per share | $ | 14.29 | $ | 15.21 | $ | 13.36 | ||||||||
| Class B: | Net assets | $ | 593 | $ | 1,372 | $ | 1,917 | |||||||
| Shares outstanding | 42 | 92 | 143 | |||||||||||
| Net asset value per share | $ | 14.16 | $ | 15.00 | $ | 13.35 | ||||||||
| Class C: | Net assets | $ | 227,418 | $ | 594,556 | $ | 922,852 | |||||||
| Shares outstanding | 16,185 | 39,800 | 69,501 | |||||||||||
| Net asset value per share | $ | 14.05 | $ | 14.94 | $ | 13.28 | ||||||||
| Class F-1: | Net assets | $ | 40,430 | $ | 60,316 | $ | 111,056 | |||||||
| Shares outstanding | 2,828 | 3,969 | 8,316 | |||||||||||
| Net asset value per share | $ | 14.30 | $ | 15.20 | $ | 13.35 | ||||||||
| Class F-2: | Net assets | $ | 104,943 | $ | 166,123 | $ | 203,354 | |||||||
| Shares outstanding | 7,316 | 10,877 | 15,205 | |||||||||||
| Net asset value per share | $ | 14.34 | $ | 15.27 | $ | 13.37 | ||||||||
| Class 529-A: | Net assets | $ | 146,644 | $ | 370,541 | $ | 328,585 | |||||||
| Shares outstanding | 10,276 | 24,391 | 24,611 | |||||||||||
| Net asset value per share | $ | 14.27 | $ | 15.19 | $ | 13.35 | ||||||||
| Class 529-B: | Net assets | $ | 128 | $ | 197 | $ | 321 | |||||||
| Shares outstanding | 9 | 13 | 24 | |||||||||||
| Net asset value per share | $ | 14.13 | $ | 14.96 | $ | 13.36 | ||||||||
| Class 529-C: | Net assets | $ | 55,561 | $ | 125,900 | $ | 128,329 | |||||||
| Shares outstanding | 3,959 | 8,428 | 9,657 | |||||||||||
| Net asset value per share | $ | 14.03 | $ | 14.94 | $ | 13.29 | ||||||||
| Class 529-E: | Net assets | $ | 5,471 | $ | 17,589 | $ | 16,650 | |||||||
| Shares outstanding | 385 | 1,166 | 1,249 | |||||||||||
| Net asset value per share | $ | 14.19 | $ | 15.09 | $ | 13.33 | ||||||||
| Class 529-F-1: | Net assets | $ | 10,056 | $ | 30,183 | $ | 24,371 | |||||||
| Shares outstanding | 702 | 1,979 | 1,824 | |||||||||||
| Net asset value per share | $ | 14.32 | $ | 15.25 | $ | 13.36 | ||||||||
| Class R-1: | Net assets | $ | 2,832 | $ | 7,030 | $ | 6,211 | |||||||
| Shares outstanding | 201 | 469 | 467 | |||||||||||
| Net asset value per share | $ | 14.08 | $ | 15.00 | $ | 13.30 | ||||||||
| Class R-2: | Net assets | $ | 46,693 | $ | 93,746 | $ | 90,585 | |||||||
| Shares outstanding | 3,329 | 6,272 | 6,826 | |||||||||||
| Net asset value per share | $ | 14.03 | $ | 14.95 | $ | 13.27 | ||||||||
| Class R-2E: | Net assets | $ | 970 | $ | 3,756 | $ | 3,719 | |||||||
| Shares outstanding | 68 | 249 | 279 | |||||||||||
| Net asset value per share | $ | 14.27 | $ | 15.08 | $ | 13.33 | ||||||||
| Class R-3: | Net assets | $ | 22,118 | $ | 54,690 | $ | 59,710 | |||||||
| Shares outstanding | 1,559 | 3,619 | 4,485 | |||||||||||
| Net asset value per share | $ | 14.19 | $ | 15.11 | $ | 13.31 | ||||||||
| Class R-4: | Net assets | $ | 10,270 | $ | 31,491 | $ | 55,318 | |||||||
| Shares outstanding | 720 | 2,074 | 4,144 | |||||||||||
| Net asset value per share | $ | 14.27 | $ | 15.18 | $ | 13.35 | ||||||||
| Class R-5E: | Net assets | $ | 10 | $ | 10 | $ | 10 | |||||||
| Shares outstanding | 1 | 1 | 1 | |||||||||||
| Net asset value per share | $ | 14.26 | $ | 15.18 | $ | 13.34 | ||||||||
| Class R-5: | Net assets | $ | 4,228 | $ | 9,816 | $ | 6,562 | |||||||
| Shares outstanding | 293 | 640 | 490 | |||||||||||
| Net asset value per share | $ | 14.40 | $ | 15.33 | $ | 13.40 | ||||||||
| Class R-6: | Net assets | $ | 32,172 | $ | 40,715 | $ | 52,540 | |||||||
| Shares outstanding | 2,229 | 2,661 | 3,927 | |||||||||||
| Net asset value per share | $ | 14.43 | $ | 15.30 | $ | 13.38 | ||||||||
See Notes to Financial Statements
| 20 | American Funds Portfolio Series |
(dollars and shares in thousands, except per-share amounts)
| Balanced | Income | Tax-Advantaged Income | Preservation | Tax-Exempt Preservation | ||||||||||||||
| Portfolio | Portfolio | Portfolio | Portfolio | Portfolio | ||||||||||||||
| $ | 3,209,073 | $ | 2,655,282 | $ | 888,969 | $ | 802,605 | $ | 338,443 | |||||||||
| 239,834 | 227,013 | 70,915 | 80,019 | 34,178 | ||||||||||||||
| $ | 13.38 | $ | 11.70 | $ | 12.54 | $ | 10.03 | $ | 9.90 | |||||||||
| $ | 1,708 | $ | 1,099 | $ | 42 | $ | 373 | $ | 21 | |||||||||
| 128 | 94 | 3 | 37 | 2 | ||||||||||||||
| $ | 13.37 | $ | 11.71 | $ | 12.58 | $ | 10.04 | $ | 9.93 | |||||||||
| $ | 866,379 | $ | 626,472 | $ | 154,541 | $ | 175,252 | $ | 64,626 | |||||||||
| 65,124 | 53,837 | 12,401 | 17,500 | 6,537 | ||||||||||||||
| $ | 13.30 | $ | 11.64 | $ | 12.46 | $ | 10.01 | $ | 9.89 | |||||||||
| $ | 136,659 | $ | 83,410 | $ | 38,912 | $ | 27,564 | $ | 10,693 | |||||||||
| 10,215 | 7,128 | 3,105 | 2,748 | 1,080 | ||||||||||||||
| $ | 13.38 | $ | 11.70 | $ | 12.53 | $ | 10.03 | $ | 9.90 | |||||||||
| $ | 221,548 | $ | 174,405 | $ | 62,050 | $ | 49,029 | $ | 33,673 | |||||||||
| 16,537 | 14,891 | 4,944 | 4,888 | 3,400 | ||||||||||||||
| $ | 13.40 | $ | 11.71 | $ | 12.55 | $ | 10.03 | $ | 9.90 | |||||||||
| $ | 213,369 | $ | 80,618 | $ | 76,862 | |||||||||||||
| 15,950 | 6,894 | 7,665 | ||||||||||||||||
| $ | 13.38 | $ | 11.69 | $ | 10.03 | |||||||||||||
| $ | 241 | $ | 105 | $ | 111 | |||||||||||||
| 18 | 9 | 11 | ||||||||||||||||
| $ | 13.38 | $ | 11.71 | $ | 10.04 | |||||||||||||
| $ | 102,302 | $ | 46,600 | $ | 34,342 | |||||||||||||
| 7,681 | 4,002 | 3,428 | ||||||||||||||||
| $ | 13.32 | $ | 11.64 | $ | 10.02 | |||||||||||||
| $ | 9,483 | $ | 5,921 | $ | 3,154 | |||||||||||||
| 710 | 507 | 315 | ||||||||||||||||
| $ | 13.36 | $ | 11.69 | $ | 10.02 | |||||||||||||
| $ | 22,313 | $ | 9,219 | $ | 13,906 | |||||||||||||
| 1,666 | 788 | 1,386 | ||||||||||||||||
| $ | 13.39 | $ | 11.70 | $ | 10.03 | |||||||||||||
| $ | 10,205 | $ | 1,803 | $ | 1,625 | |||||||||||||
| 766 | 155 | 162 | ||||||||||||||||
| $ | 13.33 | $ | 11.65 | $ | 10.02 | |||||||||||||
| $ | 75,078 | $ | 26,435 | $ | 16,928 | |||||||||||||
| 5,639 | 2,270 | 1,692 | ||||||||||||||||
| $ | 13.31 | $ | 11.64 | $ | 10.00 | |||||||||||||
| $ | 2,913 | $ | 324 | $ | 2,924 | |||||||||||||
| 218 | 28 | 292 | ||||||||||||||||
| $ | 13.36 | $ | 11.69 | $ | 10.02 | |||||||||||||
| $ | 79,751 | $ | 25,307 | $ | 14,690 | |||||||||||||
| 5,974 | 2,167 | 1,466 | ||||||||||||||||
| $ | 13.35 | $ | 11.68 | $ | 10.02 | |||||||||||||
| $ | 55,066 | $ | 30,951 | $ | 9,920 | |||||||||||||
| 4,116 | 2,646 | 989 | ||||||||||||||||
| $ | 13.38 | $ | 11.70 | $ | 10.03 | |||||||||||||
| $ | 26 | $ | 84 | $ | 10 | |||||||||||||
| 2 | 7 | 1 | ||||||||||||||||
| $ | 13.38 | $ | 11.69 | $ | 10.04 | |||||||||||||
| $ | 11,727 | $ | 4,254 | $ | 1,201 | |||||||||||||
| 875 | 363 | 120 | ||||||||||||||||
| $ | 13.41 | $ | 11.72 | $ | 10.03 | |||||||||||||
| $ | 137,539 | $ | 24,855 | $ | 10,783 | |||||||||||||
| 10,261 | 2,121 | 1,075 | ||||||||||||||||
| $ | 13.40 | $ | 11.72 | $ | 10.03 | |||||||||||||
| American Funds Portfolio Series | 21 |
Statements of operations
for the year ended October 31, 2016
| Global Growth | Growth | Growth and Income | ||||||||||
| Portfolio | Portfolio | Portfolio | ||||||||||
| Investment income: | ||||||||||||
| Income: | ||||||||||||
| Dividends: | ||||||||||||
| Unaffiliated issuers | $ | 24,012 | $ | 36,705 | $ | 112,425 | ||||||
| Affiliated issuers | — | — | 15,548 | |||||||||
| 24,012 | 36,705 | 127,973 | ||||||||||
| Fees and expenses*: | ||||||||||||
| Investment advisory services | 267 | 555 | 826 | |||||||||
| Distribution services | 5,621 | 12,827 | 19,658 | |||||||||
| Transfer agent services | 1,768 | 3,841 | 5,603 | |||||||||
| Reports to shareholders | 102 | 218 | 327 | |||||||||
| Registration statement and prospectus | 352 | 581 | 662 | |||||||||
| Trustees’ compensation | 9 | 20 | 30 | |||||||||
| Auditing and legal | 11 | 20 | 28 | |||||||||
| Custodian | 11 | 11 | 11 | |||||||||
| Other | 172 | 392 | 386 | |||||||||
| Total fees and expenses before waivers/ reimbursements | 8,313 | 18,465 | 27,531 | |||||||||
| Less waivers/reimbursements of fees and expenses: | ||||||||||||
| Investment advisory services waivers | 267 | 555 | 826 | |||||||||
| Miscellaneous fee reimbursements | — | — | — | |||||||||
| Total waivers/reimbursements of fees and expenses | 267 | 555 | 826 | |||||||||
| Total fees and expenses after waivers/reimbursements | 8,046 | 17,910 | 26,705 | |||||||||
| Net investment income | 15,966 | 18,795 | 101,268 | |||||||||
| Net realized gain (loss) and unrealized (depreciation)appreciation: | ||||||||||||
| Net realized (loss) gain on sale of investments: | ||||||||||||
| Unaffiliated issuers | (1,982 | ) | (1,259 | ) | (1,319 | ) | ||||||
| Affiliated issuers | — | — | (29 | ) | ||||||||
| Capital gain distributions received | 49,505 | 153,368 | 152,731 | |||||||||
| Net realized gain (loss) | 47,523 | 152,109 | 151,383 | |||||||||
| Net unrealized (depreciation) appreciation | (27,474 | ) | (26,463 | ) | (29,360 | ) | ||||||
| Net realized gain (loss) and unrealized (depreciation) appreciation | 20,049 | 125,646 | 122,023 | |||||||||
| Net increase in net assets resulting from operations | $ | 36,015 | $ | 144,441 | $ | 223,291 | ||||||
| * | Additional information related to class-specific fees and expenses is included in the Notes to Financial Statements. |
See Notes to Financial Statements
| 22 | American Funds Portfolio Series |
(dollars in thousands)
| Balanced | Income | Tax-Advantaged Income | Preservation | Tax-Exempt Preservation | ||||||||||||||
| Portfolio | Portfolio | Portfolio | Portfolio | Portfolio | ||||||||||||||
| $ | 68,502 | $ | 111,573 | $ | 20,305 | $ | 10,922 | $ | 3,668 | |||||||||
| 20,139 | 8,019 | 9,855 | 4,639 | 6,107 | ||||||||||||||
| 88,641 | 119,592 | 30,160 | 15,561 | 9,775 | ||||||||||||||
| 683 | 527 | 138 | 151 | 52 | ||||||||||||||
| 17,426 | 12,475 | 3,565 | 4,205 | 1,421 | ||||||||||||||
| 4,716 | 3,480 | 952 | 1,104 | 362 | ||||||||||||||
| 276 | 207 | 58 | 65 | 23 | ||||||||||||||
| 618 | 498 | 228 | 324 | 168 | ||||||||||||||
| 26 | 19 | 5 | 6 | 2 | ||||||||||||||
| 23 | 19 | 8 | 8 | 5 | ||||||||||||||
| 11 | 11 | 11 | 11 | 11 | ||||||||||||||
| 272 | 115 | 2 | 90 | 1 | ||||||||||||||
| 24,051 | 17,351 | 4,967 | 5,964 | 2,045 | ||||||||||||||
| 683 | 527 | 138 | 151 | 52 | ||||||||||||||
| — | — | — | — | 60 | ||||||||||||||
| 683 | 527 | 138 | 151 | 112 | ||||||||||||||
| 23,368 | 16,824 | 4,829 | 5,813 | 1,933 | ||||||||||||||
| 65,273 | 102,768 | 25,331 | 9,748 | 7,842 | ||||||||||||||
| (108 | ) | (21,035 | ) | (110 | ) | 66 | 16 | |||||||||||
| (3 | ) | (5,117 | ) | 15 | (4 | ) | (405 | ) | ||||||||||
| 114,977 | 46,916 | 11,697 | 1,557 | — | ||||||||||||||
| 114,866 | 20,764 | 11,602 | 1,619 | (389 | ) | |||||||||||||
| (11,645 | ) | 52,084 | 4,924 | 7,953 | (973 | ) | ||||||||||||
| 103,221 | 72,848 | 16,526 | 9,572 | (1,362 | ) | |||||||||||||
| $ | 168,494 | $ | 175,616 | $ | 41,857 | $ | 19,320 | $ | 6,480 | |||||||||
| American Funds Portfolio Series | 23 |
Statements of changes in net assets
| Global Growth | Growth | Growth and Income | ||||||||||||||||||||||
| Portfolio | Portfolio | Portfolio | ||||||||||||||||||||||
| Year ended October 31 | Year ended October 31 | Year ended October 31 | ||||||||||||||||||||||
| 2016 | 2015 | 2016 | 2015 | 2016 | 2015 | |||||||||||||||||||
| Operations: | ||||||||||||||||||||||||
| Net investment income | $ | 15,966 | $ | 12,245 | $ | 18,795 | $ | 13,176 | $ | 101,268 | $ | 78,392 | ||||||||||||
| Net realized gain (loss) | 47,523 | 49,384 | 152,109 | 142,693 | 151,383 | 142,377 | ||||||||||||||||||
| Net unrealized (depreciation) appreciation | (27,474 | ) | (60,174 | ) | (26,463 | ) | (86,586 | ) | (29,360 | ) | (202,565 | ) | ||||||||||||
| Net increase (decrease) in net assets resulting from operations | 36,015 | 1,455 | 144,441 | 69,283 | 223,291 | 18,204 | ||||||||||||||||||
| Dividends and distributions paid to shareholders: | ||||||||||||||||||||||||
| Dividends from net investment income | (12,486 | ) | (10,086 | ) | (19,413 | ) | (14,893 | ) | (91,948 | ) | (77,710 | ) | ||||||||||||
| Distributions from net realized gain on investments | (47,394 | ) | (18,251 | ) | (132,451 | ) | (51,426 | ) | (131,752 | ) | (51,739 | ) | ||||||||||||
| Total dividends and distributions paid to shareholders | (59,880 | ) | (28,337 | ) | (151,864 | ) | (66,319 | ) | (223,700 | ) | (129,449 | ) | ||||||||||||
| Net capital share transactions | 228,222 | 451,959 | 869,507 | 1,166,265 | 1,004,406 | 1,384,310 | ||||||||||||||||||
| Total increase in net assets | 204,357 | 425,077 | 862,084 | 1,169,229 | 1,003,997 | 1,273,065 | ||||||||||||||||||
| Net assets: | ||||||||||||||||||||||||
| Beginning of year | 1,580,282 | 1,155,205 | 3,251,158 | 2,081,929 | 4,932,359 | 3,659,294 | ||||||||||||||||||
| End of year | $ | 1,784,639 | $ | 1,580,282 | $ | 4,113,242 | $ | 3,251,158 | $ | 5,936,356 | $ | 4,932,359 | ||||||||||||
| (Distributions in excess of) undistributed net investment income | $ | (4 | ) | $ | (3 | ) | $ | (2,386 | ) | $ | (1,753 | ) | $ | (13 | ) | $ | (6 | ) | ||||||
See Notes to Financial Statements
| 24 | American Funds Portfolio Series |
(dollars in thousands)
| Balanced | Income | Tax-Advantaged Income | Preservation | Tax-Exempt Preservation | ||||||||||||||||||||||||||||||||||
| Portfolio | Portfolio | Portfolio | Portfolio | Portfolio | ||||||||||||||||||||||||||||||||||
| Year ended October 31 | Year ended October 31 | Year ended October 31 | Year ended October 31 | Year ended October 31 | ||||||||||||||||||||||||||||||||||
| 2016 | 2015 | 2016 | 2015 | 2016 | 2015 | 2016 | 2015 | 2016 | 2015 | |||||||||||||||||||||||||||||
| $ | 65,273 | $ | 45,530 | $ | 102,768 | $ | 91,336 | $ | 25,331 | $ | 17,783 | $ | 9,748 | $ | 7,085 | $ | 7,842 | $ | 5,995 | |||||||||||||||||||
| 114,866 | 94,059 | 20,764 | 16,753 | 11,602 | 6,470 | 1,619 | 150 | (389 | ) | (77 | ) | |||||||||||||||||||||||||||
| (11,645 | ) | (59,544 | ) | 52,084 | (125,346 | ) | 4,924 | (11,403 | ) | 7,953 | (966 | ) | (973 | ) | (2,154 | ) | ||||||||||||||||||||||
| 168,494 | 80,045 | 175,616 | (17,257 | ) | 41,857 | 12,850 | 19,320 | 6,269 | 6,480 | 3,764 | ||||||||||||||||||||||||||||
| (63,958 | ) | (41,329 | ) | (113,238 | ) | (85,492 | ) | (24,858 | ) | (17,083 | ) | (10,176 | ) | (7,166 | ) | (7,712 | ) | (5,845 | ) | |||||||||||||||||||
| (86,331 | ) | (18,862 | ) | (14,453 | ) | (8,168 | ) | (5,812 | ) | (1,238 | ) | — | — | — | — | |||||||||||||||||||||||
| (150,289 | ) | (60,191 | ) | (127,691 | ) | (93,660 | ) | (30,670 | ) | (18,321 | ) | (10,176 | ) | (7,166 | ) | (7,712 | ) | (5,845 | ) | |||||||||||||||||||
| 1,137,336 | 1,224,740 | 594,707 | 826,949 | 326,999 | 304,845 | 342,419 | 236,639 | 145,870 | 88,416 | |||||||||||||||||||||||||||||
| 1,155,541 | 1,244,594 | 642,632 | 716,032 | 338,186 | 299,374 | 351,563 | 235,742 | 144,638 | 86,335 | |||||||||||||||||||||||||||||
| 3,999,839 | 2,755,245 | 3,154,512 | 2,438,480 | 806,328 | 506,954 | 889,716 | 653,974 | 302,818 | 216,483 | |||||||||||||||||||||||||||||
| $ | 5,155,380 | $ | 3,999,839 | $ | 3,797,144 | $ | 3,154,512 | $ | 1,144,514 | $ | 806,328 | $ | 1,241,279 | $ | 889,716 | $ | 447,456 | $ | 302,818 | |||||||||||||||||||
| $ | 6,157 | $ | 4,865 | $ | 2,362 | $ | 8,315 | $ | 1,849 | $ | 1,379 | $ | 343 | $ | 180 | $ | 332 | $ | 203 | |||||||||||||||||||
| American Funds Portfolio Series | 25 |
Notes to financial statements
1. Organization
American Funds Portfolio Series (the “series”) is registered under the Investment Company Act of 1940 as an open-end, diversified management investment company. The series consists of eight funds (the “funds”). The assets of each fund are segregated, with each fund accounted for separately. The funds’ investment objectives are as follows:
| American Funds Global Growth Portfolio | Seeks long-term growth of capital. | |
| American Funds Growth Portfolio | Seeks long-term growth of capital. | |
| American Funds Growth and Income Portfolio | Seeks long-term growth of capital while providing current income. | |
| American Funds Balanced Portfolio | Seeks current income and long-term growth of capital and income. | |
| American Funds Income Portfolio | Seeks current income and, secondarily, long-term growth of capital. | |
| American Funds Tax-Advantaged Income Portfolio | Seeks current income, a portion of which is exempt from regular federal income tax, while secondarily striving for long-term growth of capital. | |
| American Funds Preservation Portfolio | Seeks current income, consistent with preservation of capital. | |
| American Funds Tax-Exempt Preservation Portfolio | Seeks current income that is exempt from regular federal income tax, consistent with preservation of capital. |
Each fund will attempt to achieve its investment objectives by investing in a mix of American Funds (the “underlying funds”) in different combinations and weightings. Capital Research and Management Company (“CRMC”), the series’ investment adviser, is also the investment adviser to the underlying funds.
The Global Growth Portfolio, Growth Portfolio, Growth and Income Portfolio, Balanced Portfolio, Income Portfolio and Preservation Portfolio each have 18 share classes consisting of five retail share classes (Classes A, B and C, as well as two F share classes, F-1 and F-2), five 529 college savings plan share classes (Classes 529-A, 529-B, 529-C, 529-E and 529-F-1) and eight retirement plan share classes (Classes R-1, R-2, R-2E, R-3, R-4, R-5E, R-5 and R-6). The 529 college savings plan share classes can be used to save for college education. The retirement plan share classes are generally offered only through eligible employer-sponsored retirement plans. The Tax-Advantaged Income Portfolio and Tax-Exempt Preservation Portfolio each have five retail share classes (Classes A, B and C, as well as two F share classes, F-1 and F-2). The funds’ share classes are described further in the following table:
| Share class | Initial sales charge | Contingent deferred sales charge upon redemption | Conversion feature | |||
| Classes A and 529-A | Up to 2.50% for Preservation Portfolio and Tax-Exempt Preservation Portfolio; up to 3.75% for Tax-Advantaged Income Portfolio; up to 5.75% for all other funds | None (except 1% for certain redemptions within one year of purchase without an initial sales charge) | None | |||
| Classes B and 529-B* | None | Declines from 5% to 0% for redemptions within six years of purchase | Classes B and 529-B convert to Classes A and 529-A, respectively, after eight years | |||
| Class C | None | 1% for redemptions within one year of purchase | Class C converts to Class F-1 after 10 years | |||
| Class 529-C | None | 1% for redemptions within one year of purchase | None | |||
| Class 529-E | None | None | None | |||
| Classes F-1, F-2 and 529-F-1 | None | None | None | |||
| Classes R-1, R-2, R-2E, R-3, R-4, R-5E, R-5 and R-6 | None | None | None |
| * | Class B and 529-B shares of each fund are not available for purchase. |
On November 20, 2015, each fund in the series made an additional retirement plan share class (Class R-5E) available for sale pursuant to an amendment to the series’ registration statement filed with the U.S. Securities and Exchange Commission. Refer to the series’ prospectus for more details.
Holders of all share classes of each fund have equal pro rata rights to the assets, dividends and liquidation proceeds of each fund held. Each share class of each fund has identical voting rights, except for the exclusive right to vote on matters affecting only its class. Share classes have different fees and expenses (“class-specific fees and expenses”), primarily due to different arrangements for distribution and
| 26 | American Funds Portfolio Series |
transfer agent services. Differences in class-specific fees and expenses will result in differences in net investment income and, therefore, the payment of different per-share dividends by each share class of each fund.
2. Significant accounting policies
Each fund in the series is an investment company that applies the accounting and reporting guidance issued in Topic 946 by the U.S. Financial Accounting Standards Board. Each fund’s financial statements have been prepared to comply with U.S. generally accepted accounting principles (“U.S. GAAP”). These principles require the series’ investment adviser to make estimates and assumptions that affect reported amounts and disclosures. Actual results could differ from those estimates. Subsequent events, if any, have been evaluated through the date of issuance in the preparation of the financial statements. The funds follow the significant accounting policies in this section, as well as the valuation policies described in the next section on valuation.
Security transactions and related investment income — Security transactions are recorded by the funds as of the date the trades are executed. Realized gains and losses from security transactions are determined based on the specific identified cost of the securities. Dividend income is recognized on the ex-dividend date.
Fees and expenses — The fees and expenses of the underlying funds are not included in the fees and expenses reported for each of the funds; however, they are indirectly reflected in the valuation of each of the underlying funds. These fees are included in the net effective expense ratios that are provided as supplementary information in the Financial Highlights tables on pages 48 to 62.
Class allocations — Income, fees and expenses (other than class-specific fees and expenses) and realized and unrealized gains and losses are allocated daily among the various share classes of each fund based on their relative net assets. Class-specific fees and expenses, such as distribution, transfer agent and administrative services, are charged directly to the respective share class of each fund.
Dividends and distributions to shareholders — Dividends and distributions to shareholders are recorded on each fund’s ex-dividend date.
3. Valuation
Security valuation — The net asset value of each share class of each fund is calculated based on the reported net asset values of the underlying funds in which each fund invests. The net asset value of each underlying fund is calculated based on the policies and procedures of the underlying fund contained in each underlying fund’s statement of additional information. Generally, the funds and the underlying funds determine the net asset value of each share class as of approximately 4:00 p.m. New York time each day the New York Stock Exchange is open.
Processes and structure — The series’ board of trustees has delegated authority to the series’ investment adviser to make fair value determinations, subject to board oversight. The investment adviser has established a Joint Fair Valuation Committee (the “Fair Valuation Committee”) to administer, implement and oversee the fair valuation process, and to make fair value decisions. The Fair Valuation Committee regularly reviews its own fair value decisions, as well as decisions made under its standing instructions to the investment adviser’s valuation teams. The Fair Valuation Committee reviews changes in fair value measurements from period to period and may, as deemed appropriate, update the fair valuation guidelines to better reflect the results of back testing and address new or evolving issues. The Fair Valuation Committee reports any changes to the fair valuation guidelines to the board of trustees with supplemental information to support the changes. The series’ board and audit committee also regularly review reports that describe fair value determinations and methods. Pricing decisions, processes and controls over security valuation are also subject to additional internal reviews, including an annual control self-evaluation program facilitated by the investment adviser’s compliance group.
Classifications — The series’ investment adviser classifies each fund’s assets and liabilities into three levels based on the method used to value the assets or liabilities. Level 1 values are based on quoted prices in active markets for identical securities. Level 2 values are based on significant observable market inputs, such as quoted prices for similar securities and quoted prices in inactive markets. Level 3 values are based on significant unobservable inputs that reflect the investment adviser’s determination of assumptions that market participants might reasonably use in valuing the securities. The valuation levels are not necessarily an indication of the risk or liquidity associated with the underlying investment. At October 31, 2016, all of the investment securities held by each fund were classified as Level 1.
| American Funds Portfolio Series | 27 |
4. Risk factors
Investing in the funds may involve certain risks including, but not limited to, those described below.
Allocation risk — Investments in the fund are subject to risks related to the investment adviser’s allocation choices. The selection of the underlying funds and the allocation of the fund’s assets could cause the fund to lose value or its results to lag relevant benchmarks or other funds with similar objectives.
Fund structure — The fund invests in underlying funds and incurs expenses related to the underlying funds. In addition, investors in the fund will incur fees to pay for certain expenses related to the operations of the fund. An investor holding the underlying funds directly and in the same proportions as the fund would incur lower overall expenses but would not receive the benefit of the portfolio management and other services provided by the fund.
Underlying fund risks — Because the fund’s investments consist of underlying funds, the fund’s risks are directly related to the risks of the underlying funds. For this reason, it is important to understand the risks associated with investing in the underlying funds, as described below.
Market conditions — The prices of, and the income generated by, the common stocks, bonds and other securities held by the underlying funds may decline — sometimes rapidly or unpredictably — due to various factors, including events or conditions affecting the general economy or particular industries; overall market changes; local, regional or global political, social or economic instability; governmental or governmental agency responses to economic conditions; and currency exchange rate, interest rate and commodity price fluctuations.
Issuer risks — The prices of, and the income generated by, securities held by the underlying funds may decline in response to various factors directly related to the issuers of such securities, including reduced demand for an issuer’s goods or services, poor management performance and strategic initiatives such as mergers, acquisitions or dispositions and the market response to any such initiatives.
Investing in stocks — Investing in stocks may involve larger price swings and greater potential for loss than other types of investments. As a result, the value of the underlying funds may be subject to sharp, short-term declines in value. Income provided by an underlying fund may be reduced by changes in the dividend policies of, and the capital resources available at, the companies in which the underlying fund invests.
Investing in debt instruments — The prices of, and the income generated by, bonds and other debt securities held by an underlying fund may be affected by changing interest rates and by changes in the effective maturities and credit ratings of these securities.
Rising interest rates will generally cause the prices of bonds and other debt securities to fall. Falling interest rates may cause an issuer to redeem, call or refinance a debt security before its stated maturity, which may result in the fund having to reinvest the proceeds in lower yielding securities. Longer maturity debt securities generally have greater sensitivity to changes in interest rates and may be subject to greater price fluctuations than shorter maturity debt securities.
Bonds and other debt securities are also subject to credit risk, which is the possibility that the credit strength of an issuer will weaken and/or an issuer of a debt security will fail to make timely payments of principal or interest and the security will go into default. Credit risk is gauged, in part, by the credit ratings of the debt securities in which the underlying fund invests. However, ratings are only the opinions of the rating agencies issuing them and are not guarantees as to credit quality or an evaluation of market risk. The underlying funds’ investment adviser relies on its own credit analysts to research issuers and issues in seeking to mitigate various credit and default risks.
Investing in lower rated debt instruments — Lower rated bonds and other lower rated debt securities generally have higher rates of interest and involve greater risk of default or price declines due to changes in the issuer’s creditworthiness than those of higher quality debt securities. The market prices of these securities may fluctuate more than the prices of higher quality debt securities and may decline significantly in periods of general economic difficulty. These risks may be increased with respect to investments in junk bonds.
Investing in small companies — Investing in smaller companies may pose additional risks. For example, it is often more difficult to value or dispose of small company stocks and more difficult to obtain information about smaller companies than about larger companies. Furthermore, smaller companies often have limited product lines, operating histories, markets and/or financial resources, may be dependent on one or a few key persons for management, and can be more susceptible to losses. Moreover, the prices of their stocks may be more volatile than stocks of larger, more established companies.
| 28 | American Funds Portfolio Series |
Investing outside the U.S. — Securities of issuers domiciled outside the U.S., or with significant operations or revenues outside the U.S., may lose value because of adverse political, social, economic or market developments (including social instability, regional conflicts, terrorism and war) in the countries or regions in which the issuers operate or generate revenue. These securities may also lose value due to changes in foreign currency exchange rates against the U.S. dollar and/or currencies of other countries. Issuers of these securities may be more susceptible to actions of foreign governments, such as the imposition of price controls or punitive taxes, that could adversely impact the value of these securities. Securities markets in certain countries may be more volatile and/or less liquid than those in the U.S. Investments outside the U.S. may also be subject to different accounting practices and different regulatory, legal and reporting standards and practices, and may be more difficult to value, than those in the U.S. In addition, the value of investments outside the U.S. may be reduced by foreign taxes, including foreign withholding taxes on interest and dividends. Further, there may be increased risks of delayed settlement of securities purchased or sold by an underlying fund. The risks of investing outside the U.S. may be heightened in connection with investments in emerging markets.
Investing in emerging markets — Investing in emerging markets may involve risks in addition to and greater than those generally associated with investing in the securities markets of developed countries. For instance, developing countries may have less developed legal and accounting systems than those in developed countries. The governments of these countries may be less stable and more likely to impose capital controls, nationalize a company or industry, place restrictions on foreign ownership and on withdrawing sale proceeds of securities from the country, and/or impose punitive taxes that could adversely affect the prices of securities. In addition, the economies of these countries may be dependent on relatively few industries that are more susceptible to local and global changes. Securities markets in these countries can also be relatively small and have substantially lower trading volumes. As a result, securities issued in these countries may be more volatile and less liquid, and may be more difficult to value, than securities issued in countries with more developed economies and/or markets. Less certainty with respect to security valuations may lead to additional challenges and risks in calculating the underlying fund’s net asset value. Additionally, there may be increased settlement risks for transactions in local securities.
Investing in securities backed by the U.S. government — Securities backed by the U.S. Treasury or the full faith and credit of the U.S. government are guaranteed only as to the timely payment of interest and principal when held to maturity. Accordingly, the current market values for these securities will fluctuate with changes in interest rates. Securities issued by government-sponsored entities and federal agencies and instrumentalities that are not backed by the full faith and credit of the U.S. government are neither issued nor guaranteed by the U.S. government.
Investing in mortgage-related and other asset-backed securities — Mortgage-related securities, such as mortgage-backed securities, and other asset-backed securities, include debt obligations that represent interests in pools of mortgages or other income-bearing assets, such as consumer loans or receivables. Such securities often involve risks that are different from or more acute than the risks associated with investing in other types of debt securities. Mortgage-backed and other asset-backed securities are subject to changes in the payment patterns of borrowers of the underlying debt. When interest rates fall, borrowers are more likely to refinance or prepay their debt before its stated maturity. This may result in the underlying fund having to reinvest the proceeds in lower yielding securities, effectively reducing the fund’s income. Conversely, if interest rates rise and borrowers repay their debt more slowly than expected, the time in which the mortgage-backed and other asset-backed securities are paid off could be extended, reducing the underlying fund’s cash available for reinvestment in higher yielding securities.
Liquidity risk — Certain fund holdings may be deemed to be less liquid or illiquid because they cannot be readily sold without significantly impacting the value of the holdings. Liquidity risk may result from the lack of an active market for a holding, legal or contractual restrictions on resale or the reduced number and capacity of market participants to make a market in such holding. Market prices for less liquid or illiquid holdings may be volatile, and reduced liquidity may have an adverse impact on the market price of such holdings. Additionally, the sale of less liquid or illiquid holdings may involve substantial delays (including delays in settlement) and additional costs and the fund may be unable to sell such holdings when necessary to meet its liquidity needs.
Credit and liquidity support — Changes in the credit quality of banks and financial institutions providing credit and liquidity support features with respect to securities held by the underlying fund could cause the values of these securities to decline.
Investing in similar municipal bonds — Investing significantly in municipal obligations of issuers in the same state or backed by revenues of similar types of projects or industries may make an underlying fund more susceptible to certain economic, political or regulatory occurrences. As a result, the potential for fluctuations in the underlying fund’s share price may increase.
Investing in derivatives — The use of derivatives involves a variety of risks, which may be different from, or greater than, the risks associated with investing in traditional cash securities, such as stocks and bonds. Changes in the value of a derivative may not correlate perfectly with, and may be more sensitive to market events than, the underlying asset, rate or index, and a derivative instrument may expose the underlying fund to losses in excess of its initial investment. Derivatives may be difficult for the underlying fund to buy or sell at an opportune time or price and may be difficult to terminate or otherwise offset. The underlying fund’s use of
| American Funds Portfolio Series | 29 |
derivatives may result in losses to the underlying fund, and investing in derivatives may reduce the underlying fund’s returns and increase the underlying fund’s price volatility. The underlying fund’s counterparty to a derivative transaction (including, if applicable, the underlying fund’s clearing broker, the derivatives exchange or the clearinghouse) may be unable or unwilling to honor its financial obligations in respect of the transaction.
Management — The investment adviser to the fund and to the underlying funds actively manages each underlying fund’s investments. Consequently, the underlying funds are subject to the risk that the methods and analyses employed by the investment adviser in this process may not produce the desired results. This could cause an underlying fund to lose value or its investment results to lag relevant benchmarks or other funds with similar objectives.
5. Taxation and distributions
Federal income taxation — Each fund complies with the requirements under Subchapter M of the Internal Revenue Code applicable to mutual funds and each intends to distribute substantially all of its net income and net capital gains each year. The funds are not subject to income taxes to the extent taxable income and net capital gains are distributed.
As of and during the period ended October 31, 2016, none of the funds had a liability for any unrecognized tax benefits. Each fund recognizes interest and penalties, if any, related to unrecognized tax benefits as income tax expense in the statements of operations. During the period, none of the funds incurred any significant interest or penalties.
The series is not subject to examination by U.S. federal and state tax authorities for tax years before 2012, the year the series commenced operations.
Distributions — Distributions paid to shareholders are based on net investment income and net realized gains determined on a tax basis, which may differ from net investment income and net realized gains for financial reporting purposes. These differences are due primarily to different treatment for items such as short-term capital gains and losses; capital losses related to sales of certain securities within 30 days of purchase; cost of investments sold; and net capital losses. The fiscal year in which amounts are distributed may differ from the year in which the net investment income and net realized gains are recorded by the funds for financial reporting purposes. The funds may also designate a portion of the amount paid to redeeming shareholders as distributions for tax purposes.
| 30 | American Funds Portfolio Series |
As of October 31, 2016, the tax basis components of distributable earnings, unrealized appreciation (depreciation) and cost of investment securities for each fund were as follows (dollars in thousands):
| Global | Growth and | |||||||||||||||
| Growth | Growth | Income | Balanced | |||||||||||||
| Portfolio | Portfolio | Portfolio | Portfolio | |||||||||||||
| Undistributed ordinary income | $ | — | $ | — | $ | — | $ | 6,168 | ||||||||
| Late year ordinary loss deferral* | — | (2,378 | ) | — | — | |||||||||||
| Undistributed long-term capital gain | 45,351 | 138,158 | 144,446 | 102,348 | ||||||||||||
| Gross unrealized appreciation on investment securities | 29,632 | 97,980 | 150,335 | 204,647 | ||||||||||||
| Gross unrealized depreciation on investment securities | (11,803 | ) | — | (15,225 | ) | (15,664 | ) | |||||||||
| Net unrealized appreciation (depreciation) on investment securities | 17,829 | 97,980 | 135,110 | 188,983 | ||||||||||||
| Cost of investment securities | 1,767,527 | 4,016,911 | 5,803,706 | 4,968,585 | ||||||||||||
| Reclassification to capital paid in on shares of beneficial interest from undistributed/distributions in excess of net investment income | 3,481 | 15 | 9,327 | 23 | ||||||||||||
| Reclassification to capital paid in on shares of beneficial interest from undistributed net realized gain/accumulated net realized loss | 2,732 | 14,965 | 7,081 | 12,579 | ||||||||||||
| Tax-Advantaged | Tax-Exempt | |||||||||||||||
| Income | Income | Preservation | Preservation | |||||||||||||
| Portfolio | Portfolio | Portfolio | Portfolio | |||||||||||||
| Undistributed ordinary income | $ | 2,370 | $ | 739 | $ | 346 | $ | — | ||||||||
| Undistributed tax-exempt income | — | 1,113 | — | 333 | ||||||||||||
| Undistributed long-term capital gain | 15,829 | 10,549 | 673 | — | ||||||||||||
| Capital loss carryforward† | — | — | — | (2,004 | ) | |||||||||||
| Capital loss carryforward utilized | — | — | 14 | — | ||||||||||||
| Gross unrealized appreciation on investment securities | 132,482 | 35,273 | 4,011 | 813 | ||||||||||||
| Gross unrealized depreciation on investment securities | (49,866 | ) | — | (1,519 | ) | (5,442 | ) | |||||||||
| Net unrealized appreciation (depreciation) on investment securities | 82,616 | 35,273 | 2,492 | (4,629 | ) | |||||||||||
| Cost of investment securities | 3,716,027 | 1,109,694 | 1,239,270 | 452,205 | ||||||||||||
| Reclassification to (from) undistributed/distributions in excess of net investment income from (to) undistributed net realized gain/accumulated net realized loss | 4,535 | (2 | ) | 592 | — | |||||||||||
| Reclassification to capital paid in on shares of beneficial interest from undistributed/distributions in excess of net investment income | 18 | 1 | 1 | 1 | ||||||||||||
| Reclassification to capital paid in on shares of beneficial interest from undistributed net realized gain/accumulated net realized loss | 3,690 | 1,134 | 280 | 1 | ||||||||||||
| * | These deferrals are considered incurred in the subsequent year. |
| † | The capital loss carryforward will be used to offset any capital gains realized by the fund in future years. The fund will not make distributions from capital gains while a capital loss carryforward remains. |
| American Funds Portfolio Series | 31 |
The tax character of distributions paid to shareholders was as follows (dollars in thousands):
Global Growth Portfolio
| Year ended October 31, 2016 | Year ended October 31, 2015 | |||||||||||||||||||||||
| Total | Total | |||||||||||||||||||||||
| dividends and | dividends and | |||||||||||||||||||||||
| Ordinary | Long-term | distributions | Ordinary | Long-term | distributions | |||||||||||||||||||
| Share class | income | capital gains | paid | income | capital gains | paid | ||||||||||||||||||
| Class A | $ | 9,026 | $ | 29,527 | $ | 38,553 | $ | 7,104 | $ | 11,346 | $ | 18,450 | ||||||||||||
| Class B | — | 43 | 43 | 1 | 34 | 35 | ||||||||||||||||||
| Class C | 503 | 6,068 | 6,571 | 434 | 2,133 | 2,567 | ||||||||||||||||||
| Class F-1 | 300 | 1,177 | 1,477 | 374 | 647 | 1,021 | ||||||||||||||||||
| Class F-2 | 640 | 1,715 | 2,355 | 470 | 645 | 1,115 | ||||||||||||||||||
| Class 529-A | 1,081 | 3,780 | 4,861 | 883 | 1,497 | 2,380 | ||||||||||||||||||
| Class 529-B | — | 11 | 11 | — | 8 | 8 | ||||||||||||||||||
| Class 529-C | 59 | 1,613 | 1,672 | 131 | 669 | 800 | ||||||||||||||||||
| Class 529-E | 31 | 143 | 174 | 29 | 61 | 90 | ||||||||||||||||||
| Class 529-F-1 | 84 | 243 | 327 | 49 | 69 | 118 | ||||||||||||||||||
| Class R-1 | 5 | 73 | 78 | 5 | 25 | 30 | ||||||||||||||||||
| Class R-2 | 100 | 1,043 | 1,143 | 73 | 324 | 397 | ||||||||||||||||||
| Class R-2E | — | 1 | — | 1 | — | 1 | — | 1 | — | 1 | — | 1 | ||||||||||||
| Class R-3 | 102 | 519 | 621 | 85 | 200 | 285 | ||||||||||||||||||
| Class R-4 | 86 | 276 | 362 | 54 | 84 | 138 | ||||||||||||||||||
| Class R-5E2 | — | 1 | — | 1 | — | 1 | ||||||||||||||||||
| Class R-5 | 32 | 82 | 114 | 11 | 19 | 30 | ||||||||||||||||||
| Class R-6 | 437 | 1,081 | 1,518 | 383 | 490 | 873 | ||||||||||||||||||
| Total | $ | 12,486 | $ | 47,394 | $ | 59,880 | $ | 10,086 | $ | 18,251 | $ | 28,337 | ||||||||||||
Growth Portfolio
| Year ended October 31, 2016 | Year ended October 31, 2015 | |||||||||||||||||||||||
| Total | Total | |||||||||||||||||||||||
| dividends and | dividends and | |||||||||||||||||||||||
| Ordinary | Long-term | distributions | Ordinary | Long-term | distributions | |||||||||||||||||||
| Share class | income | capital gains | paid | income | capital gains | paid | ||||||||||||||||||
| Class A | $ | 14,693 | $ | 82,330 | $ | 97,023 | $ | 11,240 | $ | 33,060 | $ | 44,300 | ||||||||||||
| Class B | — | 141 | 141 | — | 122 | 122 | ||||||||||||||||||
| Class C | 446 | 19,249 | 19,695 | 515 | 6,534 | 7,049 | ||||||||||||||||||
| Class F-1 | 337 | 2,139 | 2,476 | 309 | 981 | 1,290 | ||||||||||||||||||
| Class F-2 | 981 | 4,384 | 5,365 | 557 | 1,394 | 1,951 | ||||||||||||||||||
| Class 529-A | 1,882 | 11,480 | 13,362 | 1,442 | 4,557 | 5,999 | ||||||||||||||||||
| Class 529-B | — | 36 | 36 | — | 27 | 27 | ||||||||||||||||||
| Class 529-C | — | 4,000 | 4,000 | 48 | 1,635 | 1,683 | ||||||||||||||||||
| Class 529-E | 65 | 585 | 650 | 60 | 273 | 333 | ||||||||||||||||||
| Class 529-F-1 | 160 | 815 | 975 | 96 | 252 | 348 | ||||||||||||||||||
| Class R-1 | — | 263 | 263 | 5 | 113 | 118 | ||||||||||||||||||
| Class R-2 | 38 | 2,584 | 2,622 | 56 | 868 | 924 | ||||||||||||||||||
| Class R-2E | 15 | 65 | 80 | — | 1 | — | 1 | — | 1 | |||||||||||||||
| Class R-3 | 137 | 1,429 | 1,566 | 118 | 536 | 654 | ||||||||||||||||||
| Class R-4 | 177 | 966 | 1,143 | 61 | 179 | 240 | ||||||||||||||||||
| Class R-5E2 | — | 1 | — | 1 | — | 1 | ||||||||||||||||||
| Class R-5 | 48 | 205 | 253 | 10 | 33 | 43 | ||||||||||||||||||
| Class R-6 | 434 | 1,780 | 2,214 | 376 | 862 | 1,238 | ||||||||||||||||||
| Total | $ | 19,413 | $ | 132,451 | $ | 151,864 | $ | 14,893 | $ | 51,426 | $ | 66,319 | ||||||||||||
| 32 | American Funds Portfolio Series |
Growth and Income Portfolio
| Year ended October 31, 2016 | Year ended October 31, 2015 | |||||||||||||||||||||||
| Total | Total | |||||||||||||||||||||||
| dividends and | dividends and | |||||||||||||||||||||||
| Ordinary | Long-term | distributions | Ordinary | Long-term | distributions | |||||||||||||||||||
| Share class | income | capital gains | paid | income | capital gains | paid | ||||||||||||||||||
| Class A | $ | 67,057 | $ | 89,249 | $ | 156,306 | $ | 57,879 | $ | 36,062 | $ | 93,941 | ||||||||||||
| Class B | 40 | 145 | 185 | 104 | 132 | 236 | ||||||||||||||||||
| Class C | 9,124 | 19,979 | 29,103 | 7,275 | 7,097 | 14,372 | ||||||||||||||||||
| Class F-1 | 1,732 | 2,279 | 4,011 | 1,403 | 916 | 2,319 | ||||||||||||||||||
| Class F-2 | 3,209 | 3,442 | 6,651 | 2,111 | 1,102 | 3,213 | ||||||||||||||||||
| Class 529-A | 5,233 | 7,325 | 12,558 | 4,691 | 3,067 | 7,758 | ||||||||||||||||||
| Class 529-B | 6 | 23 | 29 | 14 | 19 | 33 | ||||||||||||||||||
| Class 529-C | 1,209 | 3,033 | 4,242 | 1,163 | 1,299 | 2,462 | ||||||||||||||||||
| Class 529-E | 241 | 392 | 633 | 201 | 148 | 349 | ||||||||||||||||||
| Class 529-F-1 | 432 | 516 | 948 | 370 | 228 | 598 | ||||||||||||||||||
| Class R-1 | 76 | 188 | 264 | 88 | 94 | 182 | ||||||||||||||||||
| Class R-2 | 848 | 1,748 | 2,596 | 582 | 552 | 1,134 | ||||||||||||||||||
| Class R-2E | 18 | 6 | 24 | — | 1 | — | 1 | — | 1 | |||||||||||||||
| Class R-3 | 761 | 1,109 | 1,870 | 544 | 408 | 952 | ||||||||||||||||||
| Class R-4 | 846 | 1,091 | 1,937 | 417 | 153 | 570 | ||||||||||||||||||
| Class R-5E2 | — | 1 | — | 1 | — | 1 | ||||||||||||||||||
| Class R-5 | 90 | 86 | 176 | 44 | 20 | 64 | ||||||||||||||||||
| Class R-6 | 1,026 | 1,141 | 2,167 | 824 | 442 | 1,266 | ||||||||||||||||||
| Total | $ | 91,948 | $ | 131,752 | $ | 223,700 | $ | 77,710 | $ | 51,739 | $ | 129,449 | ||||||||||||
Balanced Portfolio
| Year ended October 31, 2016 | Year ended October 31, 2015 | |||||||||||||||||||||||
| Total | Total | |||||||||||||||||||||||
| dividends and | dividends and | |||||||||||||||||||||||
| Ordinary | Long-term | distributions | Ordinary | Long-term | distributions | |||||||||||||||||||
| Share class | income | capital gains | paid | income | capital gains | paid | ||||||||||||||||||
| Class A | $ | 44,752 | $ | 55,406 | $ | 100,158 | $ | 30,100 | $ | 12,343 | $ | 42,443 | ||||||||||||
| Class B | 23 | 89 | 112 | 35 | 43 | 78 | ||||||||||||||||||
| Class C | 6,207 | 14,303 | 20,510 | 3,451 | 2,895 | 6,346 | ||||||||||||||||||
| Class F-1 | 1,668 | 1,812 | 3,480 | 975 | 420 | 1,395 | ||||||||||||||||||
| Class F-2 | 2,876 | 2,641 | 5,517 | 1,276 | 453 | 1,729 | ||||||||||||||||||
| Class 529-A | 2,877 | 3,808 | 6,685 | 2,133 | 960 | 3,093 | ||||||||||||||||||
| Class 529-B | 3 | 12 | 15 | 4 | 6 | 10 | ||||||||||||||||||
| Class 529-C | 684 | 1,915 | 2,599 | 468 | 503 | 971 | ||||||||||||||||||
| Class 529-E | 104 | 156 | 260 | 69 | 36 | 105 | ||||||||||||||||||
| Class 529-F-1 | 325 | 363 | 688 | 212 | 80 | 292 | ||||||||||||||||||
| Class R-1 | 73 | 189 | 262 | 53 | 46 | 99 | ||||||||||||||||||
| Class R-2 | 501 | 1,145 | 1,646 | 280 | 247 | 527 | ||||||||||||||||||
| Class R-2E | 9 | — | 1 | 9 | — | 1 | — | 1 | — | 1 | ||||||||||||||
| Class R-3 | 865 | 1,304 | 2,169 | 530 | 258 | 788 | ||||||||||||||||||
| Class R-4 | 987 | 1,329 | 2,316 | 586 | 244 | 830 | ||||||||||||||||||
| Class R-5E2 | — | 1 | — | 1 | — | 1 | ||||||||||||||||||
| Class R-5 | 197 | 208 | 405 | 154 | 57 | 211 | ||||||||||||||||||
| Class R-6 | 1,807 | 1,651 | 3,458 | 1,003 | 271 | 1,274 | ||||||||||||||||||
| Total | $ | 63,958 | $ | 86,331 | $ | 150,289 | $ | 41,329 | $ | 18,862 | $ | 60,191 | ||||||||||||
See page 35 for footnotes.
| American Funds Portfolio Series | 33 |
Income Portfolio
| Year ended October 31, 2016 | Year ended October 31, 2015 | |||||||||||||||||||||||
| Total | Total | |||||||||||||||||||||||
| dividends and | dividends and | |||||||||||||||||||||||
| Ordinary | Long-term | distributions | Ordinary | Long-term | distributions | |||||||||||||||||||
| Share class | income | capital gains | paid | income | capital gains | paid | ||||||||||||||||||
| Class A | $ | 83,240 | $ | 10,212 | $ | 93,452 | $ | 64,213 | $ | 5,900 | $ | 70,113 | ||||||||||||
| Class B | 60 | 15 | 75 | 117 | 19 | 136 | ||||||||||||||||||
| Class C | 15,423 | 2,391 | 17,814 | 11,280 | 1,301 | 12,581 | ||||||||||||||||||
| Class F-1 | 2,615 | 322 | 2,937 | 2,157 | 205 | 2,362 | ||||||||||||||||||
| Class F-2 | 4,691 | 566 | 5,257 | 2,379 | 205 | 2,584 | ||||||||||||||||||
| Class 529-A | 2,465 | 314 | 2,779 | 2,040 | 200 | 2,240 | ||||||||||||||||||
| Class 529-B | 6 | 2 | 8 | 12 | 2 | 14 | ||||||||||||||||||
| Class 529-C | 1,155 | 192 | 1,347 | 1,000 | 130 | 1,130 | ||||||||||||||||||
| Class 529-E | 180 | 26 | 206 | 165 | 16 | 181 | ||||||||||||||||||
| Class 529-F-1 | 275 | 29 | 304 | 184 | 16 | 200 | ||||||||||||||||||
| Class R-1 | 44 | 7 | 51 | 41 | 5 | 46 | ||||||||||||||||||
| Class R-2 | 654 | 104 | 758 | 457 | 52 | 509 | ||||||||||||||||||
| Class R-2E | 1 | — | 1 | 1 | — | 1 | — | 1 | — | 1 | ||||||||||||||
| Class R-3 | 645 | 81 | 726 | 424 | 40 | 464 | ||||||||||||||||||
| Class R-4 | 892 | 103 | 995 | 463 | 33 | 496 | ||||||||||||||||||
| Class R-5E2 | 1 | — | 1 | 1 | ||||||||||||||||||||
| Class R-5 | 132 | 13 | 145 | 83 | 7 | 90 | ||||||||||||||||||
| Class R-6 | 759 | 76 | 835 | 477 | 37 | 514 | ||||||||||||||||||
| Total | $ | 113,238 | $ | 14,453 | $ | 127,691 | $ | 85,492 | $ | 8,168 | $ | 93,660 | ||||||||||||
Tax-Advantaged Income Portfolio
| Year ended October 31, 2016 | Year ended October 31, 2015 | |||||||||||||||||||||||
| Total | Total | |||||||||||||||||||||||
| dividends and | dividends and | |||||||||||||||||||||||
| Ordinary | Long-term | distributions | Ordinary | Long-term | distributions | |||||||||||||||||||
| Share class | income3 | capital gains | paid | income3 | capital gains | paid | ||||||||||||||||||
| Class A | $ | 20,163 | $ | 4,658 | $ | 24,821 | $ | 14,176 | $ | 1,011 | $ | 15,187 | ||||||||||||
| Class B | 2 | 1 | 3 | 4 | — | 1 | 4 | |||||||||||||||||
| Class C | 2,500 | 738 | 3,238 | 1,620 | 148 | 1,768 | ||||||||||||||||||
| Class F-1 | 812 | 159 | 971 | 489 | 34 | 523 | ||||||||||||||||||
| Class F-2 | 1,381 | 256 | 1,637 | 794 | 45 | 839 | ||||||||||||||||||
| Total | $ | 24,858 | $ | 5,812 | $ | 30,670 | $ | 17,083 | $ | 1,238 | $ | 18,321 | ||||||||||||
| 34 | American Funds Portfolio Series |
Preservation Portfolio
| Year ended October 31, 2016 | Year ended October 31, 2015 | |||||||||||||||||||||||
| Total | Total | |||||||||||||||||||||||
| Ordinary | Long-term | dividends | Ordinary | Long-term | dividends | |||||||||||||||||||
| Share class | income | capital gains | paid | income | capital gains | paid | ||||||||||||||||||
| Class A | $ | 7,507 | $ | — | $ | 7,507 | $ | 5,411 | $ | — | $ | 5,411 | ||||||||||||
| Class B | 2 | — | 2 | 5 | — | 5 | ||||||||||||||||||
| Class C | 581 | — | 581 | 419 | — | 419 | ||||||||||||||||||
| Class F-1 | 268 | — | 268 | 142 | — | 142 | ||||||||||||||||||
| Class F-2 | 453 | — | 453 | 201 | — | 201 | ||||||||||||||||||
| Class 529-A | 695 | — | 695 | 510 | — | 510 | ||||||||||||||||||
| Class 529-B | — | 1 | — | — | 1 | 1 | — | 1 | ||||||||||||||||
| Class 529-C | 85 | — | 85 | 70 | — | 70 | ||||||||||||||||||
| Class 529-E | 23 | — | 23 | 20 | — | 20 | ||||||||||||||||||
| Class 529-F-1 | 155 | — | 155 | 110 | — | 110 | ||||||||||||||||||
| Class R-1 | 6 | — | 6 | 4 | — | 4 | ||||||||||||||||||
| Class R-2 | 55 | — | 55 | 43 | — | 43 | ||||||||||||||||||
| Class R-2E | 11 | — | 11 | — | 1 | — | — | 1 | ||||||||||||||||
| Class R-3 | 108 | — | 108 | 82 | — | 82 | ||||||||||||||||||
| Class R-4 | 86 | — | 86 | 50 | — | 50 | ||||||||||||||||||
| Class R-5E2 | — | 1 | — | — | 1 | |||||||||||||||||||
| Class R-5 | 13 | — | 13 | 7 | — | 7 | ||||||||||||||||||
| Class R-6 | 128 | — | 128 | 91 | — | 91 | ||||||||||||||||||
| Total | $ | 10,176 | $ | — | $ | 10,176 | $ | 7,166 | $ | — | $ | 7,166 | ||||||||||||
Tax-Exempt Preservation Portfolio
| Year ended October 31, 2016 | Year ended October 31, 2015 | |||||||||||||||||||||||
| Total | Total | |||||||||||||||||||||||
| Ordinary | Long-term | dividends | Ordinary | Long-term | dividends | |||||||||||||||||||
| Share class | income3 | capital gains | paid | income3 | capital gains | paid | ||||||||||||||||||
| Class A | $ | 5,889 | $ | — | $ | 5,889 | $ | 4,517 | $ | — | $ | 4,517 | ||||||||||||
| Class B | — | 1 | — | — | 1 | 1 | — | 1 | ||||||||||||||||
| Class C | 862 | — | 862 | 777 | — | 777 | ||||||||||||||||||
| Class F-1 | 178 | — | 178 | 106 | — | 106 | ||||||||||||||||||
| Class F-2 | 783 | — | 783 | 444 | — | 444 | ||||||||||||||||||
| Total | $ | 7,712 | $ | — | $ | 7,712 | $ | 5,845 | $ | — | $ | 5,845 | ||||||||||||
| 1 | Amount less than one thousand. |
| 2 | Class R-5E shares were offered beginning November 20, 2015. |
| 3 | Ordinary income may include both taxable and tax-exempt income. |
6. Fees and transactions with related parties
CRMC, the series’ investment adviser, is the parent company of American Funds Distributors®, Inc. (“AFD”), the principal underwriter of the series’ shares, and American Funds Service Company® (“AFS”), the series’ transfer agent. CRMC, AFD and AFS are considered related parties to the series.
Investment advisory services — At the beginning of the reporting period, the series had an investment advisory and service agreement with CRMC that provided for monthly fees, accrued daily. These fees were based on an annual rate of 0.10% of daily net assets. CRMC waived these fees through December 31, 2015. Effective January 1, 2016, CRMC eliminated the management fee. Investment advisory services fees are presented in the statements of operations gross of the waiver from CRMC. CRMC receives fees from the underlying funds for investment advisory services. These fees are included in the net effective expense ratios that are provided as supplementary information in the Financial Highlights tables on pages 48 to 62.
Miscellaneous fee reimbursements — CRMC reimbursed a portion of the fees and expenses of Tax-Exempt Preservation Portfolio. Fees and expenses in Tax-Exempt Preservation Portfolio’s statement of operations are presented gross of the reimbursement from CRMC. The amounts reimbursed by CRMC are reflected as miscellaneous fee reimbursements.
| American Funds Portfolio Series | 35 |
Class-specific fees and expenses — Expenses that are specific to individual share classes are accrued directly to the respective share class. The principal class-specific fees and expenses are further described below:
Distribution services — The series has plans of distribution for all share classes, except Class F-2, R-5E, R-5 and R-6 shares. Under the plans, the board of trustees approves certain categories of expenses that are used to finance activities primarily intended to sell fund shares and service existing accounts. The plans provide for payments, based on an annualized percentage of average daily net assets, ranging from 0.30% to 1.00% as noted in this section. In some cases, the board of trustees has limited the amounts that may be paid to less than the maximum allowed by the plans. All share classes with a plan may use up to 0.25% of average daily net assets to pay service fees, or to compensate AFD for paying service fees, to firms that have entered into agreements with AFD to provide certain shareholder services. The remaining amounts available to be paid under each plan are paid to dealers to compensate them for their sales activities.
| Share class | Currently approved limits | Plan limits | ||||||
| Class A | 0.30 | % | 0.30 | % | ||||
| Class 529-A | 0.30 | 0.50 | ||||||
| Classes B and 529-B | 1.00 | 1.00 | ||||||
| Classes C, 529-C and R-1 | 1.00 | 1.00 | ||||||
| Class R-2 | 0.75 | 1.00 | ||||||
| Class R-2E | 0.60 | 0.85 | ||||||
| Classes 529-E and R-3 | 0.50 | 0.75 | ||||||
| Classes F-1, 529-F-1 and R-4 | 0.25 | 0.50 | ||||||
For Class A and 529-A shares, distribution-related expenses include the reimbursement of dealer and wholesaler commissions paid by AFD for certain shares sold without a sales charge. These share classes reimburse AFD for amounts billed within the prior 15 months but only to the extent that the overall annual expense limit of 0.30% is not exceeded. As of October 31, 2016, unreimbursed expenses subject to reimbursement for the funds’ Class A and 529-A shares were as follows (dollars in thousands):
| Class A | Class 529-A | |||||||
| Global Growth Portfolio | $ | — | $— | |||||
| Growth Portfolio | — | — | ||||||
| Growth and Income Portfolio | — | — | ||||||
| Balanced Portfolio | — | — | ||||||
| Income Portfolio | — | — | ||||||
| Tax-Advantaged Income Portfolio | — | Not applicable | ||||||
| Preservation Portfolio | — | — | ||||||
| Tax-Exempt Preservation Portfolio | 811 | Not applicable | ||||||
Transfer agent services — The series has a shareholder services agreement with AFS under which the funds compensate AFS for providing transfer agent services to all of the funds’ share classes. These services include recordkeeping, shareholder communications and transaction processing. In addition, the funds reimburse AFS for amounts paid to third parties for performing transfer agent services on behalf of fund shareholders.
Administrative services — The series has an administrative services agreement with CRMC for providing administrative services to all of the funds’ share classes. These services include, but are not limited to, coordinating, monitoring, assisting and overseeing third parties that provide services to fund shareholders. CRMC receives administrative services fees of 0.05% of average daily net assets from the Class R-6 shares of the underlying funds for administrative services provided to the series.
529 plan services — Each 529 share class is subject to service fees to compensate the Virginia College Savings Plan (“Virginia529”) for its oversight and administration of the 529 college savings plan. From November 1, 2015 to June 30, 2016, the quarterly fee was based on a series of decreasing annual rates beginning with 0.10% on the first $30 billion of the net assets invested in Class 529 shares of the American Funds and decreasing to 0.05% on such assets in excess of $70 billion. Effective July 1, 2016, the quarterly fee was amended to annual rates of 0.10% on the first $20 billion of the net assets invested in the Class 529 shares of the American Funds, 0.05% on such assets between $20 billion and $100 billion, and 0.03% on such assets over $100 billion. The fee for any given calendar quarter is accrued and calculated on the basis of the average net assets of Class 529 shares of the American Funds for the last month of the prior calendar quarter. The fee is included in other expenses in the fund’s statement of operations. Virginia529 is not considered a related party to the fund.
| 36 | American Funds Portfolio Series |
Class-specific expenses under the agreements described in this section for the year ended October 31, 2016, were as follows (dollars in thousands):
Global Growth Portfolio
| Distribution | Transfer agent | 529 plan | |||||
| Share class | services | services | services | ||||
| Class A | $2,107 | $1,015 | Not applicable | ||||
| Class B | 11 | 1 | Not applicable | ||||
| Class C | 2,129 | 211 | Not applicable | ||||
| Class F-1 | 97 | 47 | Not applicable | ||||
| Class F-2 | Not applicable | 81 | Not applicable | ||||
| Class 529-A | 239 | 143 | $111 | ||||
| Class 529-B | 2 | —* | —* | ||||
| Class 529-C | 559 | 58 | 46 | ||||
| Class 529-E | 26 | 3 | 4 | ||||
| Class 529-F-1 | — | 9 | 8 | ||||
| Class R-1 | 28 | 3 | Not applicable | ||||
| Class R-2 | 302 | 149 | Not applicable | ||||
| Class R-2E | —* | —* | Not applicable | ||||
| Class R-3 | 98 | 34 | Not applicable | ||||
| Class R-4 | 23 | 10 | Not applicable | ||||
| Class R-5E† | Not applicable | —* | Not applicable | ||||
| Class R-5 | Not applicable | 2 | Not applicable | ||||
| Class R-6 | Not applicable | 2 | Not applicable | ||||
| Total class-specific expenses | $5,621 | $1,768 | $169 |
Growth Portfolio
| Distribution | Transfer agent | 529 plan | |||||
| Share class | services | services | services | ||||
| Class A | $4,615 | $2,217 | Not applicable | ||||
| Class B | 26 | 3 | Not applicable | ||||
| Class C | 5,318 | 521 | Not applicable | ||||
| Class F-1 | 142 | 68 | Not applicable | ||||
| Class F-2 | Not applicable | 144 | Not applicable | ||||
| Class 529-A | 600 | 334 | $262 | ||||
| Class 529-B | 6 | 1 | —* | ||||
| Class 529-C | 1,084 | 111 | 89 | ||||
| Class 529-E | 79 | 9 | 13 | ||||
| Class 529-F-1 | — | 24 | 21 | ||||
| Class R-1 | 71 | 8 | Not applicable | ||||
| Class R-2 | 588 | 287 | Not applicable | ||||
| Class R-2E | 10 | 3 | Not applicable | ||||
| Class R-3 | 220 | 75 | Not applicable | ||||
| Class R-4 | 68 | 30 | Not applicable | ||||
| Class R-5E† | Not applicable | —* | Not applicable | ||||
| Class R-5 | Not applicable | 4 | Not applicable | ||||
| Class R-6 | Not applicable | 2 | Not applicable | ||||
| Total class-specific expenses | $12,827 | $3,841 | $385 |
Growth and Income Portfolio
| Distribution | Transfer agent | 529 plan | |||||
| Share class | services | services | services | ||||
| Class A | $8,055 | $3,579 | Not applicable | ||||
| Class B | 39 | 5 | Not applicable | ||||
| Class C | 8,331 | 820 | Not applicable | ||||
| Class F-1 | 243 | 115 | Not applicable | ||||
| Class F-2 | Not applicable | 172 | Not applicable | ||||
| Class 529-A | 662 | 314 | $245 | ||||
| Class 529-B | 6 | 1 | —* | ||||
| Class 529-C | 1,209 | 125 | 99 | ||||
| Class 529-E | 78 | 9 | 13 | ||||
| Class 529-F-1 | — | 22 | 18 | ||||
| Class R-1 | 71 | 8 | Not applicable | ||||
| Class R-2 | 584 | 288 | Not applicable | ||||
| Class R-2E | 10 | 3 | Not applicable | ||||
| Class R-3 | 253 | 86 | Not applicable | ||||
| Class R-4 | 117 | 51 | Not applicable | ||||
| Class R-5E† | Not applicable | —* | Not applicable | ||||
| Class R-5 | Not applicable | 3 | Not applicable | ||||
| Class R-6 | Not applicable | 2 | Not applicable | ||||
| Total class-specific expenses | $19,658 | $5,603 | $375 |
Balanced Portfolio
| Distribution | Transfer agent | 529 plan | |||||
| Share class | services | services | services | ||||
| Class A | $6,838 | $2,855 | Not applicable | ||||
| Class B | 32 | 4 | Not applicable | ||||
| Class C | 7,733 | 759 | Not applicable | ||||
| Class F-1 | 287 | 134 | Not applicable | ||||
| Class F-2 | Not applicable | 177 | Not applicable | ||||
| Class 529-A | 423 | 206 | $161 | ||||
| Class 529-B | 4 | 1 | —* | ||||
| Class 529-C | 969 | 100 | 79 | ||||
| Class 529-E | 42 | 5 | 7 | ||||
| Class 529-F-1 | — | 19 | 16 | ||||
| Class R-1 | 98 | 11 | Not applicable | ||||
| Class R-2 | 485 | 239 | Not applicable | ||||
| Class R-2E | 8 | 3 | Not applicable | ||||
| Class R-3 | 355 | 122 | Not applicable | ||||
| Class R-4 | 152 | 69 | Not applicable | ||||
| Class R-5E† | Not applicable | —* | Not applicable | ||||
| Class R-5 | Not applicable | 7 | Not applicable | ||||
| Class R-6 | Not applicable | 5 | Not applicable | ||||
| Total class-specific expenses | $17,426 | $4,716 | $263 |
See page 38 for footnotes.
| American Funds Portfolio Series | 37 |
Income Portfolio
| Distribution | Transfer agent | 529 plan | |||||
| Share class | services | services | services | ||||
| Class A | $5,494 | $2,390 | Not applicable | ||||
| Class B | 24 | 3 | Not applicable | ||||
| Class C | 5,757 | 570 | Not applicable | ||||
| Class F-1 | 194 | 93 | Not applicable | ||||
| Class F-2 | Not applicable | 125 | Not applicable | ||||
| Class 529-A | 162 | 78 | $60 | ||||
| Class 529-B | 2 | —* | —* | ||||
| Class 529-C | 443 | 46 | 37 | ||||
| Class 529-E | 29 | 4 | 5 | ||||
| Class 529-F-1 | — | 8 | 6 | ||||
| Class R-1 | 17 | 2 | Not applicable | ||||
| Class R-2 | 182 | 92 | Not applicable | ||||
| Class R-2E | —* | —* | Not applicable | ||||
| Class R-3 | 105 | 36 | Not applicable | ||||
| Class R-4 | 66 | 30 | Not applicable | ||||
| Class R-5E† | Not applicable | —* | Not applicable | ||||
| Class R-5 | Not applicable | 2 | Not applicable | ||||
| Class R-6 | Not applicable | 1 | Not applicable | ||||
| Total class-specific expenses | $12,475 | $3,480 | $108 |
Tax-Advantaged Income Portfolio
| Distribution | Transfer agent | ||||
| Share class | services | services | |||
| Class A | $2,230 | $743 | |||
| Class B | 1 | —* | |||
| Class C | 1,257 | 122 | |||
| Class F-1 | 77 | 36 | |||
| Class F-2 | Not applicable | 51 | |||
| Total class-specific expenses | $3,565 | $952 |
Preservation Portfolio
| Distribution | Transfer agent | 529 plan | |||||
| Share class | services | services | services | ||||
| Class A | $1,886 | $673 | Not applicable | ||||
| Class B | 8 | 1 | Not applicable | ||||
| Class C | 1,579 | 155 | Not applicable | ||||
| Class F-1 | 63 | 30 | Not applicable | ||||
| Class F-2 | Not applicable | 35 | Not applicable | ||||
| Class 529-A | 137 | 68 | $54 | ||||
| Class 529-B | 2 | —* | —* | ||||
| Class 529-C | 289 | 29 | 24 | ||||
| Class 529-E | 14 | 2 | 2 | ||||
| Class 529-F-1 | — | 12 | 10 | ||||
| Class R-1 | 16 | 2 | Not applicable | ||||
| Class R-2 | 114 | 60 | Not applicable | ||||
| Class R-2E | 9 | 3 | Not applicable | ||||
| Class R-3 | 69 | 24 | Not applicable | ||||
| Class R-4 | 19 | 9 | Not applicable | ||||
| Class R-5E† | Not applicable | —* | Not applicable | ||||
| Class R-5 | Not applicable | 1 | Not applicable | ||||
| Class R-6 | Not applicable | —* | Not applicable | ||||
| Total class-specific expenses | $4,205 | $1,104 | $90 |
Tax-Exempt Preservation Portfolio
| Distribution | Transfer agent | ||||
| Share class | services | services | |||
| Class A | $813 | $260 | |||
| Class B | 1 | —* | |||
| Class C | 587 | 58 | |||
| Class F-1 | 20 | 9 | |||
| Class F-2 | Not applicable | 35 | |||
| Total class-specific expenses | $1,421 | $362 |
| * | Amount less than one thousand. |
| † | Class R-5E shares were offered beginning November 20, 2015. |
| 38 | American Funds Portfolio Series |
Trustees’ deferred compensation — Trustees who are unaffiliated with CRMC may elect to defer the cash payment of part or all of their compensation. These deferred amounts, which remain as liabilities of the funds, are treated as if invested in shares of the American Funds. These amounts represent general, unsecured liabilities of the funds and vary according to the total returns of the selected American Funds. Trustees’ compensation, shown on the accompanying financial statements, reflects current fees (either paid in cash or deferred) and a net increase in the value of the deferred amounts as follows:
| Increase in value of | Total trustees’ | |||||||||||
| Current fees | deferred amounts | compensation | ||||||||||
| Global Growth Portfolio | $ | 9,218 | $250 | $ 9,468 | ||||||||
| Growth Portfolio | 20,045 | 453 | 20,498 | |||||||||
| Growth and Income Portfolio | 29,195 | 899 | 30,094 | |||||||||
| Balanced Portfolio | 25,000 | 667 | 25,667 | |||||||||
| Income Portfolio | 18,712 | 496 | 19,208 | |||||||||
| Tax-Advantaged Income Portfolio | 5,165 | 138 | 5,303 | |||||||||
| Preservation Portfolio | 5,754 | 142 | 5,896 | |||||||||
| Tax-Exempt Preservation Portfolio | 1,979 | 50 | 2,029 | |||||||||
Affiliated officers and trustees — Officers and certain trustees of the series are or may be considered to be affiliated with CRMC, AFD and AFS. No affiliated officers or trustees received any compensation directly from any of the funds in the series.
7. Investment transactions
The funds made purchases and sales of investment securities during the year ended October 31, 2016, as follows (dollars in thousands):
| Purchases | Sales | |||||||
| Global Growth Portfolio | $ | 264,211 | $ | 30,259 | ||||
| Growth Portfolio | 906,185 | 15,797 | ||||||
| Growth and Income Portfolio | 1,055,203 | 19,692 | ||||||
| Balanced Portfolio | 1,178,671 | 10,571 | ||||||
| Income Portfolio | 892,335 | 275,373 | ||||||
| Tax-Advantaged Income Portfolio | 336,059 | 2,665 | ||||||
| Preservation Portfolio | 359,799 | 16,099 | ||||||
| Tax-Exempt Preservation Portfolio | 168,824 | 22,795 | ||||||
| American Funds Portfolio Series | 39 |
8. Capital share transactions
Capital share transactions in the funds were as follows (dollars and shares in thousands):
Global Growth Portfolio
| Reinvestments of | Net increase | |||||||||||||||||||||||||||||||
| Sales1 | dividends and distributions | Repurchases1 | (decrease) | |||||||||||||||||||||||||||||
| Share class | Amount | Shares | Amount | Shares | Amount | Shares | Amount | Shares | ||||||||||||||||||||||||
| Year ended October 31, 2016 | ||||||||||||||||||||||||||||||||
| Class A | $ | 260,846 | 18,918 | $ | 38,436 | 2,743 | $ | (198,891 | ) | (14,351 | ) | $ | 100,391 | 7,310 | ||||||||||||||||||
| Class B | 124 | 9 | 43 | 3 | (1,127 | ) | (82 | ) | (960 | ) | (70 | ) | ||||||||||||||||||||
| Class C | 62,890 | 4,623 | 6,566 | 474 | (36,897 | ) | (2,702 | ) | 32,559 | 2,395 | ||||||||||||||||||||||
| Class F-1 | 18,621 | 1,358 | 1,476 | 105 | (18,156 | ) | (1,342 | ) | 1,941 | 121 | ||||||||||||||||||||||
| Class F-2 | 73,139 | 5,274 | 2,335 | 166 | (25,901 | ) | (1,881 | ) | 49,573 | 3,559 | ||||||||||||||||||||||
| Class 529-A | 32,891 | 2,383 | 4,861 | 348 | (15,743 | ) | (1,132 | ) | 22,009 | 1,599 | ||||||||||||||||||||||
| Class 529-B | 14 | 1 | 11 | — | 2 | (261 | ) | (19 | ) | (236 | ) | (18 | ) | |||||||||||||||||||
| Class 529-C | 11,681 | 859 | 1,672 | 121 | (10,127 | ) | (727 | ) | 3,226 | 253 | ||||||||||||||||||||||
| Class 529-E | 1,399 | 101 | 174 | 12 | (757 | ) | (54 | ) | 816 | 59 | ||||||||||||||||||||||
| Class 529-F-1 | 3,153 | 229 | 327 | 23 | (1,262 | ) | (92 | ) | 2,218 | 160 | ||||||||||||||||||||||
| Class R-1 | 1,168 | 88 | 76 | 5 | (787 | ) | (57 | ) | 457 | 36 | ||||||||||||||||||||||
| Class R-2 | 21,140 | 1,558 | 1,137 | 82 | (8,376 | ) | (609 | ) | 13,901 | 1,031 | ||||||||||||||||||||||
| Class R-2E | 961 | 67 | — | 2 | — | 2 | — | 2 | — | 2 | 961 | 67 | ||||||||||||||||||||
| Class R-3 | 8,421 | 613 | 621 | 44 | (5,058 | ) | (362 | ) | 3,984 | 295 | ||||||||||||||||||||||
| Class R-4 | 4,177 | 303 | 362 | 26 | (3,119 | ) | (228 | ) | 1,420 | 101 | ||||||||||||||||||||||
| Class R-5E3 | 10 | 1 | — | — | — | — | 10 | 1 | ||||||||||||||||||||||||
| Class R-5 | 2,259 | 165 | 114 | 8 | (945 | ) | (68 | ) | 1,428 | 105 | ||||||||||||||||||||||
| Class R-6 | 3,323 | 238 | 1,518 | 108 | (10,317 | ) | (732 | ) | (5,476 | ) | (386 | ) | ||||||||||||||||||||
| Total net increase (decrease) | $ | 506,217 | 36,788 | $ | 59,729 | 4,268 | $ | (337,724 | ) | (24,438 | ) | $ | 228,222 | 16,618 | ||||||||||||||||||
| Year ended October 31, 2015 | ||||||||||||||||||||||||||||||||
| Class A | $ | 379,782 | 25,714 | $ | 18,397 | 1,273 | $ | (114,558 | ) | (7,820 | ) | $ | 283,621 | 19,167 | ||||||||||||||||||
| Class B | 453 | 31 | 35 | 3 | (1,178 | ) | (81 | ) | (690 | ) | (47 | ) | ||||||||||||||||||||
| Class C | 91,150 | 6,247 | 2,564 | 179 | (25,798 | ) | (1,785 | ) | 67,916 | 4,641 | ||||||||||||||||||||||
| Class F-1 | 34,846 | 2,359 | 1,017 | 70 | (33,539 | ) | (2,342 | ) | 2,324 | 87 | ||||||||||||||||||||||
| Class F-2 | 34,994 | 2,365 | 1,103 | 76 | (21,860 | ) | (1,479 | ) | 14,237 | 962 | ||||||||||||||||||||||
| Class 529-A | 43,168 | 2,927 | 2,379 | 164 | (11,079 | ) | (754 | ) | 34,468 | 2,337 | ||||||||||||||||||||||
| Class 529-B | 56 | 4 | 8 | 1 | (225 | ) | (16 | ) | (161 | ) | (11 | ) | ||||||||||||||||||||
| Class 529-C | 15,584 | 1,071 | 800 | 56 | (4,146 | ) | (285 | ) | 12,238 | 842 | ||||||||||||||||||||||
| Class 529-E | 2,291 | 157 | 89 | 6 | (1,240 | ) | (88 | ) | 1,140 | 75 | ||||||||||||||||||||||
| Class 529-F-1 | 4,124 | 283 | 119 | 8 | (511 | ) | (34 | ) | 3,732 | 257 | ||||||||||||||||||||||
| Class R-1 | 1,230 | 85 | 29 | 2 | (376 | ) | (26 | ) | 883 | 61 | ||||||||||||||||||||||
| Class R-2 | 17,877 | 1,230 | 396 | 28 | (4,283 | ) | (295 | ) | 13,990 | 963 | ||||||||||||||||||||||
| Class R-2E | 1 | — | 2 | — | — | — | 2 | — | 2 | 1 | — | 2 | ||||||||||||||||||||
| Class R-3 | 7,694 | 526 | 285 | 20 | (2,147 | ) | (148 | ) | 5,832 | 398 | ||||||||||||||||||||||
| Class R-4 | 7,389 | 498 | 139 | 10 | (2,842 | ) | (194 | ) | 4,686 | 314 | ||||||||||||||||||||||
| Class R-5 | 1,939 | 129 | 30 | 2 | (372 | ) | (25 | ) | 1,597 | 106 | ||||||||||||||||||||||
| Class R-6 | 9,814 | 655 | 873 | 60 | (4,542 | ) | (307 | ) | 6,145 | 408 | ||||||||||||||||||||||
| Total net increase (decrease) | $ | 652,392 | 44,281 | $ | 28,263 | 1,958 | $ | (228,696 | ) | (15,679 | ) | $ | 451,959 | 30,560 | ||||||||||||||||||
| 40 | American Funds Portfolio Series |
Growth Portfolio
| Reinvestments of | Net increase | |||||||||||||||||||||||||||||||
| Sales1 | dividends and distributions | Repurchases1 | (decrease) | |||||||||||||||||||||||||||||
| Share class | Amount | Shares | Amount | Shares | Amount | Shares | Amount | Shares | ||||||||||||||||||||||||
| Year ended October 31, 2016 | ||||||||||||||||||||||||||||||||
| Class A | $ | 758,872 | 51,997 | $ | 96,699 | 6,574 | $ | (388,362 | ) | (26,355 | ) | $ | 467,209 | 32,216 | ||||||||||||||||||
| Class B | 301 | 21 | 141 | 10 | (2,789 | ) | (194 | ) | (2,347 | ) | (163 | ) | ||||||||||||||||||||
| Class C | 214,622 | 14,883 | 19,633 | 1,350 | (95,424 | ) | (6,581 | ) | 138,831 | 9,652 | ||||||||||||||||||||||
| Class F-1 | 32,830 | 2,252 | 2,471 | 168 | (26,095 | ) | (1,798 | ) | 9,206 | 622 | ||||||||||||||||||||||
| Class F-2 | 103,792 | 7,017 | 5,338 | 362 | (47,667 | ) | (3,241 | ) | 61,463 | 4,138 | ||||||||||||||||||||||
| Class 529-A | 100,435 | 6,855 | 13,362 | 909 | (22,810 | ) | (1,557 | ) | 90,987 | 6,207 | ||||||||||||||||||||||
| Class 529-B | 48 | 4 | 36 | 2 | (805 | ) | (57 | ) | (721 | ) | (51 | ) | ||||||||||||||||||||
| Class 529-C | 37,143 | 2,553 | 4,000 | 275 | (12,157 | ) | (842 | ) | 28,986 | 1,986 | ||||||||||||||||||||||
| Class 529-E | 4,345 | 299 | 649 | 44 | (1,601 | ) | (113 | ) | 3,393 | 230 | ||||||||||||||||||||||
| Class 529-F-1 | 12,178 | 831 | 974 | 66 | (2,980 | ) | (201 | ) | 10,172 | 696 | ||||||||||||||||||||||
| Class R-1 | 3,139 | 217 | 259 | 18 | (3,165 | ) | (214 | ) | 233 | 21 | ||||||||||||||||||||||
| Class R-2 | 45,116 | 3,148 | 2,619 | 180 | (15,755 | ) | (1,081 | ) | 31,980 | 2,247 | ||||||||||||||||||||||
| Class R-2E | 3,772 | 249 | 79 | 5 | (89 | ) | (6 | ) | 3,762 | 248 | ||||||||||||||||||||||
| Class R-3 | 27,278 | 1,872 | 1,532 | 105 | (11,039 | ) | (751 | ) | 17,771 | 1,226 | ||||||||||||||||||||||
| Class R-4 | 17,790 | 1,218 | 1,143 | 77 | (10,671 | ) | (729 | ) | 8,262 | 566 | ||||||||||||||||||||||
| Class R-5E3 | 10 | 1 | — | — | — | — | 10 | 1 | ||||||||||||||||||||||||
| Class R-5 | 6,672 | 451 | 254 | 17 | (2,036 | ) | (137 | ) | 4,890 | 331 | ||||||||||||||||||||||
| Class R-6 | 7,711 | 531 | 2,214 | 150 | (14,505 | ) | (990 | ) | (4,580 | ) | (309 | ) | ||||||||||||||||||||
| Total net increase (decrease) | $ | 1,376,054 | 94,399 | $ | 151,403 | 10,312 | $ | (657,950 | ) | (44,847 | ) | $ | 869,507 | 59,864 | ||||||||||||||||||
| Year ended October 31, 2015 | ||||||||||||||||||||||||||||||||
| Class A | $ | 859,489 | 55,673 | $ | 44,170 | 2,919 | $ | (209,748 | ) | (13,649 | ) | $ | 693,911 | 44,943 | ||||||||||||||||||
| Class B | 1,207 | 79 | 121 | 8 | (2,951 | ) | (193 | ) | (1,623 | ) | (106 | ) | ||||||||||||||||||||
| Class C | 237,543 | 15,566 | 7,036 | 469 | (45,423 | ) | (2,982 | ) | 199,156 | 13,053 | ||||||||||||||||||||||
| Class F-1 | 37,177 | 2,406 | 1,290 | 85 | (26,496 | ) | (1,725 | ) | 11,971 | 766 | ||||||||||||||||||||||
| Class F-2 | 62,599 | 4,043 | 1,943 | 128 | (17,872 | ) | (1,160 | ) | 46,670 | 3,011 | ||||||||||||||||||||||
| Class 529-A | 105,006 | 6,796 | 5,999 | 396 | (15,096 | ) | (975 | ) | 95,909 | 6,217 | ||||||||||||||||||||||
| Class 529-B | 155 | 10 | 27 | 2 | (467 | ) | (31 | ) | (285 | ) | (19 | ) | ||||||||||||||||||||
| Class 529-C | 37,845 | 2,476 | 1,682 | 112 | (6,615 | ) | (432 | ) | 32,912 | 2,156 | ||||||||||||||||||||||
| Class 529-E | 3,898 | 254 | 332 | 22 | (1,131 | ) | (75 | ) | 3,099 | 201 | ||||||||||||||||||||||
| Class 529-F-1 | 11,131 | 716 | 348 | 23 | (1,333 | ) | (85 | ) | 10,146 | 654 | ||||||||||||||||||||||
| Class R-1 | 4,169 | 272 | 116 | 8 | (2,062 | ) | (137 | ) | 2,223 | 143 | ||||||||||||||||||||||
| Class R-2 | 34,446 | 2,257 | 924 | 62 | (8,019 | ) | (528 | ) | 27,351 | 1,791 | ||||||||||||||||||||||
| Class R-2E | 7 | — | 2 | — | — | — | — | 7 | — | 2 | ||||||||||||||||||||||
| Class R-3 | 18,948 | 1,229 | 654 | 43 | (4,477 | ) | (293 | ) | 15,125 | 979 | ||||||||||||||||||||||
| Class R-4 | 20,645 | 1,357 | 240 | 16 | (4,724 | ) | (310 | ) | 16,161 | 1,063 | ||||||||||||||||||||||
| Class R-5 | 3,607 | 230 | 43 | 3 | (248 | ) | (16 | ) | 3,402 | 217 | ||||||||||||||||||||||
| Class R-6 | 16,856 | 1,073 | 1,238 | 81 | (7,964 | ) | (519 | ) | 10,130 | 635 | ||||||||||||||||||||||
| Total net increase (decrease) | $ | 1,454,728 | 94,437 | $ | 66,163 | 4,377 | $ | (354,626 | ) | (23,110 | ) | $ | 1,166,265 | 75,704 | ||||||||||||||||||
See page 47 for footnotes.
| American Funds Portfolio Series | 41 |
Growth and Income Portfolio
| Reinvestments of | Net increase | |||||||||||||||||||||||||||||||
| Sales1 | dividends and distributions | Repurchases1 | (decrease) | |||||||||||||||||||||||||||||
| Share class | Amount | Shares | Amount | Shares | Amount | Shares | Amount | Shares | ||||||||||||||||||||||||
| Year ended October 31, 2016 | ||||||||||||||||||||||||||||||||
| Class A | $ | 995,138 | 76,482 | $ | 155,209 | 11,956 | $ | (587,774 | ) | (44,798 | ) | $ | 562,573 | 43,640 | ||||||||||||||||||
| Class B | 442 | 34 | 184 | 14 | (4,740 | ) | (366 | ) | (4,114 | ) | (318 | ) | ||||||||||||||||||||
| Class C | 304,214 | 23,490 | 28,940 | 2,247 | (147,673 | ) | (11,354 | ) | 185,481 | 14,383 | ||||||||||||||||||||||
| Class F-1 | 54,989 | 4,211 | 3,920 | 302 | (31,725 | ) | (2,436 | ) | 27,184 | 2,077 | ||||||||||||||||||||||
| Class F-2 | 123,823 | 9,434 | 6,426 | 493 | (52,199 | ) | (3,979 | ) | 78,050 | 5,948 | ||||||||||||||||||||||
| Class 529-A | 72,529 | 5,546 | 12,556 | 968 | (31,360 | ) | (2,399 | ) | 53,725 | 4,115 | ||||||||||||||||||||||
| Class 529-B | 109 | 9 | 29 | 2 | (795 | ) | (61 | ) | (657 | ) | (50 | ) | ||||||||||||||||||||
| Class 529-C | 24,895 | 1,915 | 4,241 | 329 | (14,918 | ) | (1,140 | ) | 14,218 | 1,104 | ||||||||||||||||||||||
| Class 529-E | 3,261 | 250 | 633 | 49 | (1,575 | ) | (121 | ) | 2,319 | 178 | ||||||||||||||||||||||
| Class 529-F-1 | 8,900 | 684 | 948 | 73 | (4,350 | ) | (332 | ) | 5,498 | 425 | ||||||||||||||||||||||
| Class R-1 | 2,685 | 206 | 262 | 21 | (3,913 | ) | (297 | ) | (966 | ) | (70 | ) | ||||||||||||||||||||
| Class R-2 | 41,614 | 3,215 | 2,594 | 201 | (17,198 | ) | (1,318 | ) | 27,010 | 2,098 | ||||||||||||||||||||||
| Class R-2E | 3,949 | 302 | 24 | 2 | (335 | ) | (26 | ) | 3,638 | 278 | ||||||||||||||||||||||
| Class R-3 | 29,978 | 2,293 | 1,869 | 144 | (13,180 | ) | (999 | ) | 18,667 | 1,438 | ||||||||||||||||||||||
| Class R-4 | 31,925 | 2,434 | 1,894 | 146 | (13,734 | ) | (1,060 | ) | 20,085 | 1,520 | ||||||||||||||||||||||
| Class R-5E3 | 10 | 1 | — | — | — | — | 10 | 1 | ||||||||||||||||||||||||
| Class R-5 | 4,409 | 339 | 176 | 13 | (1,260 | ) | (100 | ) | 3,325 | 252 | ||||||||||||||||||||||
| Class R-6 | 15,982 | 1,248 | 2,167 | 166 | (9,789 | ) | (751 | ) | 8,360 | 663 | ||||||||||||||||||||||
| Total net increase (decrease) | $ | 1,718,852 | 132,093 | $ | 222,072 | 17,126 | $ | (936,518 | ) | (71,537 | ) | $ | 1,004,406 | 77,682 | ||||||||||||||||||
| Year ended October 31, 2015 | ||||||||||||||||||||||||||||||||
| Class A | $ | 1,161,900 | 85,594 | $ | 93,342 | 6,904 | $ | (379,576 | ) | (28,062 | ) | $ | 875,666 | 64,436 | ||||||||||||||||||
| Class B | 1,465 | 108 | 235 | 17 | (5,265 | ) | (389 | ) | (3,565 | ) | (264 | ) | ||||||||||||||||||||
| Class C | 332,505 | 24,616 | 14,292 | 1,058 | (85,166 | ) | (6,322 | ) | 261,631 | 19,352 | ||||||||||||||||||||||
| Class F-1 | 43,278 | 3,196 | 2,212 | 164 | (22,419 | ) | (1,658 | ) | 23,071 | 1,702 | ||||||||||||||||||||||
| Class F-2 | 79,853 | 5,869 | 3,158 | 233 | (28,446 | ) | (2,111 | ) | 54,565 | 3,991 | ||||||||||||||||||||||
| Class 529-A | 72,873 | 5,365 | 7,753 | 573 | (19,770 | ) | (1,462 | ) | 60,856 | 4,476 | ||||||||||||||||||||||
| Class 529-B | 278 | 20 | 33 | 2 | (795 | ) | (58 | ) | (484 | ) | (36 | ) | ||||||||||||||||||||
| Class 529-C | 33,473 | 2,476 | 2,459 | 182 | (11,790 | ) | (872 | ) | 24,142 | 1,786 | ||||||||||||||||||||||
| Class 529-E | 4,928 | 362 | 349 | 26 | (1,037 | ) | (77 | ) | 4,240 | 311 | ||||||||||||||||||||||
| Class 529-F-1 | 6,320 | 465 | 597 | 44 | (3,965 | ) | (293 | ) | 2,952 | 216 | ||||||||||||||||||||||
| Class R-1 | 3,979 | 293 | 182 | 13 | (3,277 | ) | (249 | ) | 884 | 57 | ||||||||||||||||||||||
| Class R-2 | 36,051 | 2,674 | 1,134 | 84 | (11,191 | ) | (837 | ) | 25,994 | 1,921 | ||||||||||||||||||||||
| Class R-2E | — | — | — | — | — | — | — | — | ||||||||||||||||||||||||
| Class R-3 | 18,976 | 1,404 | 952 | 71 | (5,742 | ) | (427 | ) | 14,186 | 1,048 | ||||||||||||||||||||||
| Class R-4 | 30,242 | 2,240 | 570 | 42 | (5,504 | ) | (411 | ) | 25,308 | 1,871 | ||||||||||||||||||||||
| Class R-5 | 1,980 | 147 | 64 | 5 | (192 | ) | (14 | ) | 1,852 | 138 | ||||||||||||||||||||||
| Class R-6 | 19,808 | 1,456 | 1,266 | 94 | (8,062 | ) | (594 | ) | 13,012 | 956 | ||||||||||||||||||||||
| Total net increase (decrease) | $ | 1,847,909 | 136,285 | $ | 128,598 | 9,512 | $ | (592,197 | ) | (43,836 | ) | $ | 1,384,310 | 101,961 | ||||||||||||||||||
| 42 | American Funds Portfolio Series |
Balanced Portfolio
| Reinvestments of | Net increase | |||||||||||||||||||||||||||||||
| Sales1 | dividends and distributions | Repurchases1 | (decrease) | |||||||||||||||||||||||||||||
| Share class | Amount | Shares | Amount | Shares | Amount | Shares | Amount | Shares | ||||||||||||||||||||||||
| Year ended October 31, 2016 | ||||||||||||||||||||||||||||||||
| Class A | $ | 949,538 | 72,537 | $ | 99,508 | 7,610 | $ | (435,771 | ) | (33,184 | ) | $ | 613,275 | 46,963 | ||||||||||||||||||
| Class B | 657 | 50 | 112 | 9 | (3,824 | ) | (292 | ) | (3,055 | ) | (233 | ) | ||||||||||||||||||||
| Class C | 320,188 | 24,635 | 20,395 | 1,571 | (136,184 | ) | (10,425 | ) | 204,399 | 15,781 | ||||||||||||||||||||||
| Class F-1 | 79,875 | 6,184 | 3,469 | 265 | (34,034 | ) | (2,598 | ) | 49,310 | 3,851 | ||||||||||||||||||||||
| Class F-2 | 152,469 | 11,583 | 5,355 | 408 | (41,795 | ) | (3,182 | ) | 116,029 | 8,809 | ||||||||||||||||||||||
| Class 529-A | 52,565 | 4,001 | 6,684 | 511 | (27,678 | ) | (2,106 | ) | 31,571 | 2,406 | ||||||||||||||||||||||
| Class 529-B | 101 | 8 | 15 | 1 | (509 | ) | (39 | ) | (393 | ) | (30 | ) | ||||||||||||||||||||
| Class 529-C | 27,570 | 2,108 | 2,595 | 200 | (19,812 | ) | (1,507 | ) | 10,353 | 801 | ||||||||||||||||||||||
| Class 529-E | 3,061 | 234 | 261 | 20 | (1,183 | ) | (89 | ) | 2,139 | 165 | ||||||||||||||||||||||
| Class 529-F-1 | 7,710 | 586 | 689 | 53 | (3,402 | ) | (258 | ) | 4,997 | 381 | ||||||||||||||||||||||
| Class R-1 | 4,784 | 367 | 262 | 20 | (4,148 | ) | (316 | ) | 898 | 71 | ||||||||||||||||||||||
| Class R-2 | 32,531 | 2,497 | 1,641 | 126 | (13,538 | ) | (1,032 | ) | 20,634 | 1,591 | ||||||||||||||||||||||
| Class R-2E | 3,173 | 243 | 9 | — | 2 | (344 | ) | (26 | ) | 2,838 | 217 | |||||||||||||||||||||
| Class R-3 | 33,543 | 2,567 | 2,165 | 166 | (19,021 | ) | (1,452 | ) | 16,687 | 1,281 | ||||||||||||||||||||||
| Class R-4 | 35,897 | 2,725 | 2,316 | 178 | (35,881 | ) | (2,724 | ) | 2,332 | 179 | ||||||||||||||||||||||
| Class R-5E3 | 26 | 2 | — | — | — | — | 26 | 2 | ||||||||||||||||||||||||
| Class R-5 | 5,116 | 397 | 405 | 31 | (4,621 | ) | (354 | ) | 900 | 74 | ||||||||||||||||||||||
| Class R-6 | 97,186 | 7,326 | 3,458 | 263 | (36,248 | ) | (2,737 | ) | 64,396 | 4,852 | ||||||||||||||||||||||
| Total net increase (decrease) | $ | 1,805,990 | 138,050 | $ | 149,339 | 11,432 | $ | (817,993 | ) | (62,321 | ) | $ | 1,137,336 | 87,161 | ||||||||||||||||||
| Year ended October 31, 2015 | ||||||||||||||||||||||||||||||||
| Class A | $ | 993,186 | 74,182 | $ | 42,191 | 3,167 | $ | (265,868 | ) | (19,887 | ) | $ | 769,509 | 57,462 | ||||||||||||||||||
| Class B | 1,287 | 97 | 78 | 6 | (3,887 | ) | (292 | ) | (2,522 | ) | (189 | ) | ||||||||||||||||||||
| Class C | 320,596 | 24,034 | 6,320 | 475 | (86,785 | ) | (6,523 | ) | 240,131 | 17,986 | ||||||||||||||||||||||
| Class F-1 | 40,031 | 2,988 | 1,392 | 104 | (18,182 | ) | (1,370 | ) | 23,241 | 1,722 | ||||||||||||||||||||||
| Class F-2 | 61,782 | 4,608 | 1,716 | 129 | (24,150 | ) | (1,796 | ) | 39,348 | 2,941 | ||||||||||||||||||||||
| Class 529-A | 53,121 | 3,958 | 3,091 | 232 | (19,522 | ) | (1,457 | ) | 36,690 | 2,733 | ||||||||||||||||||||||
| Class 529-B | 275 | 20 | 10 | 1 | (554 | ) | (41 | ) | (269 | ) | (20 | ) | ||||||||||||||||||||
| Class 529-C | 29,495 | 2,214 | 970 | 73 | (13,972 | ) | (1,045 | ) | 16,493 | 1,242 | ||||||||||||||||||||||
| Class 529-E | 3,062 | 228 | 105 | 8 | (1,123 | ) | (84 | ) | 2,044 | 152 | ||||||||||||||||||||||
| Class 529-F-1 | 7,282 | 542 | 293 | 22 | (2,783 | ) | (205 | ) | 4,792 | 359 | ||||||||||||||||||||||
| Class R-1 | 5,695 | 426 | 99 | 8 | (3,745 | ) | (281 | ) | 2,049 | 153 | ||||||||||||||||||||||
| Class R-2 | 28,593 | 2,145 | 524 | 39 | (10,781 | ) | (812 | ) | 18,336 | 1,372 | ||||||||||||||||||||||
| Class R-2E | — | — | — | — | — | — | — | — | ||||||||||||||||||||||||
| Class R-3 | 37,736 | 2,825 | 789 | 59 | (11,319 | ) | (848 | ) | 27,206 | 2,036 | ||||||||||||||||||||||
| Class R-4 | 23,800 | 1,772 | 829 | 62 | (12,176 | ) | (912 | ) | 12,453 | 922 | ||||||||||||||||||||||
| Class R-5 | 3,790 | 283 | 211 | 16 | (2,071 | ) | (157 | ) | 1,930 | 142 | ||||||||||||||||||||||
| Class R-6 | 50,760 | 3,800 | 1,274 | 95 | (18,725 | ) | (1,404 | ) | 33,309 | 2,491 | ||||||||||||||||||||||
| Total net increase (decrease) | $ | 1,660,491 | 124,122 | $ | 59,892 | 4,496 | $ | (495,643 | ) | (37,114 | ) | $ | 1,224,740 | 91,504 | ||||||||||||||||||
| American Funds Portfolio Series | 43 |
Income Portfolio
| Reinvestments of | Net increase | |||||||||||||||||||||||||||||||
| Sales1 | dividends and distributions | Repurchases1 | (decrease) | |||||||||||||||||||||||||||||
| Share class | Amount | Shares | Amount | Shares | Amount | Shares | Amount | Shares | ||||||||||||||||||||||||
| Year ended October 31, 2016 | ||||||||||||||||||||||||||||||||
| Class A | $ | 697,584 | 60,692 | $ | 91,671 | 7,997 | $ | (433,560 | ) | (37,835 | ) | $ | 355,695 | 30,854 | ||||||||||||||||||
| Class B | 502 | 44 | 74 | 7 | (3,125 | ) | (272 | ) | (2,549 | ) | (221 | ) | ||||||||||||||||||||
| Class C | 197,713 | 17,327 | 17,572 | 1,542 | (126,124 | ) | (11,042 | ) | 89,161 | 7,827 | ||||||||||||||||||||||
| Class F-1 | 37,817 | 3,294 | 2,881 | 251 | (30,277 | ) | (2,633 | ) | 10,421 | 912 | ||||||||||||||||||||||
| Class F-2 | 171,186 | 14,880 | 4,346 | 376 | (77,956 | ) | (7,021 | ) | 97,576 | 8,235 | ||||||||||||||||||||||
| Class 529-A | 24,082 | 2,089 | 2,778 | 242 | (17,963 | ) | (1,566 | ) | 8,897 | 765 | ||||||||||||||||||||||
| Class 529-B | 62 | 6 | 8 | 1 | (383 | ) | (34 | ) | (313 | ) | (27 | ) | ||||||||||||||||||||
| Class 529-C | 13,138 | 1,145 | 1,347 | 118 | (13,049 | ) | (1,138 | ) | 1,436 | 125 | ||||||||||||||||||||||
| Class 529-E | 724 | 63 | 206 | 18 | (1,366 | ) | (120 | ) | (436 | ) | (39 | ) | ||||||||||||||||||||
| Class 529-F-1 | 4,430 | 384 | 305 | 27 | (1,714 | ) | (148 | ) | 3,021 | 263 | ||||||||||||||||||||||
| Class R-1 | 612 | 54 | 50 | 4 | (404 | ) | (35 | ) | 258 | 23 | ||||||||||||||||||||||
| Class R-2 | 11,900 | 1,038 | 754 | 66 | (8,564 | ) | (748 | ) | 4,090 | 356 | ||||||||||||||||||||||
| Class R-2E | 318 | 27 | — | 2 | — | 2 | — | — | 318 | 27 | ||||||||||||||||||||||
| Class R-3 | 11,512 | 1,004 | 727 | 63 | (5,193 | ) | (455 | ) | 7,046 | 612 | ||||||||||||||||||||||
| Class R-4 | 16,804 | 1,462 | 995 | 87 | (6,679 | ) | (578 | ) | 11,120 | 971 | ||||||||||||||||||||||
| Class R-5E3 | 85 | 7 | 1 | — | 2 | — | — | 86 | 7 | |||||||||||||||||||||||
| Class R-5 | 2,169 | 189 | 145 | 13 | (958 | ) | (83 | ) | 1,356 | 119 | ||||||||||||||||||||||
| Class R-6 | 12,071 | 1,049 | 835 | 72 | (5,382 | ) | (466 | ) | 7,524 | 655 | ||||||||||||||||||||||
| Total net increase (decrease) | $ | 1,202,709 | 104,754 | $ | 124,695 | 10,884 | $ | (732,697 | ) | (64,174 | ) | $ | 594,707 | 51,464 | ||||||||||||||||||
| Year ended October 31, 2015 | ||||||||||||||||||||||||||||||||
| Class A | $ | 811,243 | 68,593 | $ | 68,847 | 5,877 | $ | (302,274 | ) | (25,738 | ) | $ | 577,816 | 48,732 | ||||||||||||||||||
| Class B | 1,322 | 111 | 136 | 12 | (3,808 | ) | (323 | ) | (2,350 | ) | (200 | ) | ||||||||||||||||||||
| Class C | 241,244 | 20,489 | 12,408 | 1,063 | (87,525 | ) | (7,490 | ) | 166,127 | 14,062 | ||||||||||||||||||||||
| Class F-1 | 32,198 | 2,738 | 2,319 | 198 | (21,841 | ) | (1,873 | ) | 12,676 | 1,063 | ||||||||||||||||||||||
| Class F-2 | 41,280 | 3,490 | 2,560 | 218 | (23,418 | ) | (1,995 | ) | 20,422 | 1,713 | ||||||||||||||||||||||
| Class 529-A | 23,319 | 1,974 | 2,239 | 191 | (14,235 | ) | (1,208 | ) | 11,323 | 957 | ||||||||||||||||||||||
| Class 529-B | 104 | 9 | 14 | 1 | (372 | ) | (32 | ) | (254 | ) | (22 | ) | ||||||||||||||||||||
| Class 529-C | 15,014 | 1,273 | 1,130 | 97 | (10,186 | ) | (868 | ) | 5,958 | 502 | ||||||||||||||||||||||
| Class 529-E | 2,442 | 205 | 181 | 16 | (931 | ) | (79 | ) | 1,692 | 142 | ||||||||||||||||||||||
| Class 529-F-1 | 3,260 | 274 | 200 | 17 | (1,633 | ) | (138 | ) | 1,827 | 153 | ||||||||||||||||||||||
| Class R-1 | 615 | 52 | 46 | 4 | (674 | ) | (57 | ) | (13 | ) | (1 | ) | ||||||||||||||||||||
| Class R-2 | 10,569 | 897 | 505 | 43 | (3,124 | ) | (269 | ) | 7,950 | 671 | ||||||||||||||||||||||
| Class R-2E | — | — | — | — | — | — | — | — | ||||||||||||||||||||||||
| Class R-3 | 9,191 | 780 | 463 | 39 | (2,375 | ) | (203 | ) | 7,279 | 616 | ||||||||||||||||||||||
| Class R-4 | 14,157 | 1,195 | 496 | 42 | (4,537 | ) | (383 | ) | 10,116 | 854 | ||||||||||||||||||||||
| Class R-5 | 1,447 | 122 | 89 | 8 | (689 | ) | (59 | ) | 847 | 71 | ||||||||||||||||||||||
| Class R-6 | 9,121 | 776 | 515 | 44 | (4,103 | ) | (348 | ) | 5,533 | 472 | ||||||||||||||||||||||
| Total net increase (decrease) | $ | 1,216,526 | 102,978 | $ | 92,148 | 7,870 | $ | (481,725 | ) | (41,063 | ) | $ | 826,949 | 69,785 | ||||||||||||||||||
| 44 | American Funds Portfolio Series |
Tax-Advantaged Income Portfolio
| Reinvestments of | Net increase | |||||||||||||||||||||||||||||||
| Sales1 | dividends and distributions | Repurchases1 | (decrease) | |||||||||||||||||||||||||||||
| Share class | Amount | Shares | Amount | Shares | Amount | Shares | Amount | Shares | ||||||||||||||||||||||||
| Year ended October 31, 2016 | ||||||||||||||||||||||||||||||||
| Class A | $ | 307,714 | 24,775 | $ | 24,557 | 1,976 | $ | (101,195 | ) | (8,169 | ) | $ | 231,076 | 18,582 | ||||||||||||||||||
| Class B | 38 | 3 | 2 | — | (186 | ) | (15 | ) | (146 | ) | (12 | ) | ||||||||||||||||||||
| Class C | 70,862 | 5,728 | 3,208 | 260 | (21,222 | ) | (1,721 | ) | 52,848 | 4,267 | ||||||||||||||||||||||
| Class F-1 | 20,656 | 1,678 | 967 | 78 | (5,590 | ) | (448 | ) | 16,033 | 1,308 | ||||||||||||||||||||||
| Class F-2 | 35,376 | 2,846 | 1,608 | 129 | (9,796 | ) | (792 | ) | 27,188 | 2,183 | ||||||||||||||||||||||
| Total net increase (decrease) | $ | 434,646 | 35,030 | $ | 30,342 | 2,443 | $ | (137,989 | ) | (11,145 | ) | $ | 326,999 | 26,328 | ||||||||||||||||||
| Year ended October 31, 2015 | ||||||||||||||||||||||||||||||||
| Class A | $ | 293,454 | 23,513 | $ | 15,025 | 1,217 | $ | (68,055 | ) | (5,486 | ) | $ | 240,424 | 19,244 | ||||||||||||||||||
| Class B | 94 | 8 | 5 | — | 2 | (205 | ) | (17 | ) | (106 | ) | (9 | ) | |||||||||||||||||||
| Class C | 54,518 | 4,389 | 1,749 | 142 | (15,347 | ) | (1,237 | ) | 40,920 | 3,294 | ||||||||||||||||||||||
| Class F-1 | 9,213 | 740 | 522 | 42 | (2,800 | ) | (225 | ) | 6,935 | 557 | ||||||||||||||||||||||
| Class F-2 | 22,531 | 1,802 | 828 | 67 | (6,687 | ) | (541 | ) | 16,672 | 1,328 | ||||||||||||||||||||||
| Total net increase (decrease) | $ | 379,810 | 30,452 | $ | 18,129 | 1,468 | $ | (93,094 | ) | (7,506 | ) | $ | 304,845 | 24,414 | ||||||||||||||||||
See page 47 for footnotes.
| American Funds Portfolio Series | 45 |
Preservation Portfolio
| Reinvestments of | Net increase | |||||||||||||||||||||||||||||||
| Sales1 | dividends | Repurchases1 | (decrease) | |||||||||||||||||||||||||||||
| Share class | Amount | Shares | Amount | Shares | Amount | Shares | Amount | Shares | ||||||||||||||||||||||||
| Year ended October 31, 2016 | ||||||||||||||||||||||||||||||||
| Class A | $ | 425,229 | 42,594 | $ | 7,445 | 746 | $ | (217,793 | ) | (21,809 | ) | $ | 214,881 | 21,531 | ||||||||||||||||||
| Class B | 361 | 36 | 2 | — | (1,232 | ) | (123 | ) | (869 | ) | (87 | ) | ||||||||||||||||||||
| Class C | 98,359 | 9,878 | 574 | 58 | (55,136 | ) | (5,533 | ) | 43,797 | 4,403 | ||||||||||||||||||||||
| Class F-1 | 23,208 | 2,328 | 264 | 27 | (16,681 | ) | (1,671 | ) | 6,791 | 684 | ||||||||||||||||||||||
| Class F-2 | 44,328 | 4,433 | 452 | 45 | (16,909 | ) | (1,691 | ) | 27,871 | 2,787 | ||||||||||||||||||||||
| Class 529-A | 38,996 | 3,905 | 695 | 70 | (19,166 | ) | (1,919 | ) | 20,525 | 2,056 | ||||||||||||||||||||||
| Class 529-B | 90 | 9 | — | — | (384 | ) | (38 | ) | (294 | ) | (29 | ) | ||||||||||||||||||||
| Class 529-C | 20,439 | 2,049 | 85 | 9 | (11,001 | ) | (1,103 | ) | 9,523 | 955 | ||||||||||||||||||||||
| Class 529-E | 1,658 | 166 | 22 | 2 | (1,100 | ) | (110 | ) | 580 | 58 | ||||||||||||||||||||||
| Class 529-F-1 | 6,605 | 661 | 155 | 15 | (2,937 | ) | (294 | ) | 3,823 | 382 | ||||||||||||||||||||||
| Class R-1 | 931 | 93 | 6 | 1 | (459 | ) | (46 | ) | 478 | 48 | ||||||||||||||||||||||
| Class R-2 | 10,454 | 1,050 | 55 | 5 | (7,644 | ) | (765 | ) | 2,865 | 290 | ||||||||||||||||||||||
| Class R-2E | 3,081 | 307 | 11 | 1 | (177 | ) | (17 | ) | 2,915 | 291 | ||||||||||||||||||||||
| Class R-3 | 7,110 | 713 | 108 | 11 | (5,184 | ) | (520 | ) | 2,034 | 204 | ||||||||||||||||||||||
| Class R-4 | 5,915 | 592 | 86 | 9 | (2,425 | ) | (244 | ) | 3,576 | 357 | ||||||||||||||||||||||
| Class R-5E3 | 10 | 1 | — | — | — | — | 10 | 1 | ||||||||||||||||||||||||
| Class R-5 | 660 | 66 | 13 | 1 | (177 | ) | (17 | ) | 496 | 50 | ||||||||||||||||||||||
| Class R-6 | 7,117 | 712 | 128 | 13 | (3,828 | ) | (383 | ) | 3,417 | 342 | ||||||||||||||||||||||
| Total net increase (decrease) | $ | 694,551 | 69,593 | $ | 10,101 | 1,013 | $ | (362,233 | ) | (36,283 | ) | $ | 342,419 | 34,323 | ||||||||||||||||||
| Year ended October 31, 2015 | ||||||||||||||||||||||||||||||||
| Class A | $ | 318,904 | 32,012 | $ | 5,359 | 538 | $ | (178,287 | ) | (17,897 | ) | $ | 145,976 | 14,653 | ||||||||||||||||||
| Class B | 878 | 88 | 5 | 1 | (1,352 | ) | (136 | ) | (469 | ) | (47 | ) | ||||||||||||||||||||
| Class C | 73,837 | 7,422 | 415 | 42 | (37,487 | ) | (3,768 | ) | 36,765 | 3,696 | ||||||||||||||||||||||
| Class F-1 | 14,656 | 1,471 | 138 | 14 | (3,099 | ) | (311 | ) | 11,695 | 1,174 | ||||||||||||||||||||||
| Class F-2 | 15,508 | 1,556 | 199 | 20 | (6,873 | ) | (689 | ) | 8,834 | 887 | ||||||||||||||||||||||
| Class 529-A | 26,598 | 2,669 | 509 | 51 | (14,828 | ) | (1,489 | ) | 12,279 | 1,231 | ||||||||||||||||||||||
| Class 529-B | 283 | 28 | 1 | — | 2 | (265 | ) | (27 | ) | 19 | 1 | |||||||||||||||||||||
| Class 529-C | 10,022 | 1,007 | 70 | 7 | (7,806 | ) | (785 | ) | 2,286 | 229 | ||||||||||||||||||||||
| Class 529-E | 1,120 | 113 | 20 | 2 | (926 | ) | (93 | ) | 214 | 22 | ||||||||||||||||||||||
| Class 529-F-1 | 4,805 | 483 | 110 | 11 | (2,665 | ) | (268 | ) | 2,250 | 226 | ||||||||||||||||||||||
| Class R-1 | 718 | 72 | 4 | — | 2 | (306 | ) | (30 | ) | 416 | 42 | |||||||||||||||||||||
| Class R-2 | 10,448 | 1,051 | 43 | 4 | (4,094 | ) | (412 | ) | 6,397 | 643 | ||||||||||||||||||||||
| Class R-2E | — | — | — | — | — | — | — | — | ||||||||||||||||||||||||
| Class R-3 | 9,569 | 962 | 82 | 8 | (4,489 | ) | (451 | ) | 5,162 | 519 | ||||||||||||||||||||||
| Class R-4 | 4,929 | 495 | 50 | 5 | (1,593 | ) | (160 | ) | 3,386 | 340 | ||||||||||||||||||||||
| Class R-5 | 631 | 63 | 7 | 1 | (457 | ) | (46 | ) | 181 | 18 | ||||||||||||||||||||||
| Class R-6 | 3,728 | 374 | 91 | 9 | (2,571 | ) | (258 | ) | 1,248 | 125 | ||||||||||||||||||||||
| Total net increase (decrease) | $ | 496,634 | 49,866 | $ | 7,103 | 713 | $ | (267,098 | ) | (26,820 | ) | $ | 236,639 | 23,759 | ||||||||||||||||||
| 46 | American Funds Portfolio Series |
Tax-Exempt Preservation Portfolio
| Reinvestments of | Net increase | |||||||||||||||||||||||||||||||
| Sales1 | dividends | Repurchases1 | (decrease) | |||||||||||||||||||||||||||||
| Share class | Amount | Shares | Amount | Shares | Amount | Shares | Amount | Shares | ||||||||||||||||||||||||
| Year ended October 31, 2016 | ||||||||||||||||||||||||||||||||
| Class A | $ | 186,764 | 18,722 | $ | 5,761 | 578 | $ | (75,982 | ) | (7,623 | ) | $ | 116,543 | 11,677 | ||||||||||||||||||
| Class B | 35 | 3 | — | — | (80 | ) | (8 | ) | (45 | ) | (5 | ) | ||||||||||||||||||||
| Class C | 29,007 | 2,911 | 843 | 85 | (16,352 | ) | (1,641 | ) | 13,498 | 1,355 | ||||||||||||||||||||||
| Class F-1 | 8,429 | 844 | 172 | 17 | (2,637 | ) | (264 | ) | 5,964 | 597 | ||||||||||||||||||||||
| Class F-2 | 30,985 | 3,111 | 768 | 77 | (21,843 | ) | (2,191 | ) | 9,910 | 997 | ||||||||||||||||||||||
| Total net increase (decrease) | $ | 255,220 | 25,591 | $ | 7,544 | 757 | $ | (116,894 | ) | (11,727 | ) | $ | 145,870 | 14,621 | ||||||||||||||||||
| Year ended October 31, 2015 | ||||||||||||||||||||||||||||||||
| Class A | $ | 125,006 | 12,577 | $ | 4,432 | 447 | $ | (63,866 | ) | (6,428 | ) | $ | 65,572 | 6,596 | ||||||||||||||||||
| Class B | 55 | 6 | 1 | — | 2 | (59 | ) | (6 | ) | (3 | ) | — | 2 | |||||||||||||||||||
| Class C | 22,636 | 2,282 | 757 | 76 | (13,747 | ) | (1,385 | ) | 9,646 | 973 | ||||||||||||||||||||||
| Class F-1 | 1,895 | 191 | 106 | 11 | (1,567 | ) | (158 | ) | 434 | 44 | ||||||||||||||||||||||
| Class F-2 | 17,075 | 1,721 | 440 | 44 | (4,748 | ) | (478 | ) | 12,767 | 1,287 | ||||||||||||||||||||||
| Total net increase (decrease) | $ | 166,667 | 16,777 | $ | 5,736 | 578 | $ | (83,987 | ) | (8,455 | ) | $ | 88,416 | 8,900 | ||||||||||||||||||
| 1 | Includes exchanges between share classes of the fund. |
| 2 | Amount less than one thousand. |
| 3 | Class R-5E shares were offered beginning November 20, 2015. |
| American Funds Portfolio Series | 47 |
Financial highlights
Global Growth Portfolio
| Income (loss) from investment operations1 | Dividends and distributions | Ratio of | Ratio of | |||||||||||||||||||||||||||||||||||||||||||||||||||||
| Period ended | Net asset value, beginning of period | Net investment income (loss) | Net gains (losses) on securities (both realized and unrealized) | Total from investment operations | Dividends (from net investment income) | Distri- butions (from capital gains) | Total dividends and distributions | Net asset value, end of period | Total return2,3 | Net assets, end of period (in millions) | expenses to average net assets before waivers/ reimburse- ments4 | expenses to average net assets after waivers/ reimburse- ments3,4 | Net effective expense ratio3,5 | Ratio of net income (loss) to average net assets3 | ||||||||||||||||||||||||||||||||||||||||||
| Class A: | ||||||||||||||||||||||||||||||||||||||||||||||||||||||||
| 10/31/16 | $ | 14.58 | $ | .15 | $ | .11 | $ | .26 | $ | (.13 | ) | $ | (.42 | ) | $ | (.55 | ) | $ | 14.29 | 1.86 | % | $ | 1,074 | .35 | % | .33 | % | .82 | % | 1.11 | % | |||||||||||||||||||||||||
| 10/31/15 | 14.82 | .15 | (.03 | ) | .12 | (.14 | ) | (.22 | ) | (.36 | ) | 14.58 | .85 | 990 | .45 | .35 | .84 | 1.02 | ||||||||||||||||||||||||||||||||||||||
| 10/31/14 | 13.92 | .14 | .92 | 1.06 | (.15 | ) | (.01 | ) | (.16 | ) | 14.82 | 7.71 | 722 | .44 | .34 | .83 | .96 | |||||||||||||||||||||||||||||||||||||||
| 10/31/13 | 11.17 | .11 | 2.79 | 2.90 | (.14 | ) | (.01 | ) | (.15 | ) | 13.92 | 26.18 | 377 | .50 | .40 | .90 | .85 | |||||||||||||||||||||||||||||||||||||||
| 10/31/126,7 | 10.00 | .03 | 1.14 | 1.17 | — | — | — | 11.17 | 11.70 | 8 | 53 | .25 | 8 | .20 | 8 | .71 | 8 | .29 | 8 | |||||||||||||||||||||||||||||||||||||
| Class B: | ||||||||||||||||||||||||||||||||||||||||||||||||||||||||
| 10/31/16 | 14.44 | .07 | .07 | .14 | — | (.42 | ) | (.42 | ) | 14.16 | 1.01 | 1 | 1.17 | 1.15 | 1.64 | .52 | ||||||||||||||||||||||||||||||||||||||||
| 10/31/15 | 14.66 | .06 | (.06 | ) | — | — | 9 | (.22 | ) | (.22 | ) | 14.44 | .05 | 2 | 1.23 | 1.13 | 1.62 | .41 | ||||||||||||||||||||||||||||||||||||||
| 10/31/14 | 13.81 | .03 | .90 | .93 | (.07 | ) | (.01 | ) | (.08 | ) | 14.66 | 6.82 | 2 | 1.25 | 1.15 | 1.64 | .23 | |||||||||||||||||||||||||||||||||||||||
| 10/31/13 | 11.13 | .02 | 2.78 | 2.80 | (.11 | ) | (.01 | ) | (.12 | ) | 13.81 | 25.32 | 2 | 1.28 | 1.18 | 1.68 | .13 | |||||||||||||||||||||||||||||||||||||||
| 10/31/126,7 | 10.00 | (.01 | ) | 1.14 | 1.13 | — | — | — | 11.13 | 11.30 | 8 | 1 | .56 | 8 | .51 | 8 | 1.02 | 8 | (.08 | )8 | ||||||||||||||||||||||||||||||||||||
| Class C: | ||||||||||||||||||||||||||||||||||||||||||||||||||||||||
| 10/31/16 | 14.37 | .04 | .09 | .13 | (.03 | ) | (.42 | ) | (.45 | ) | 14.05 | .99 | 227 | 1.14 | 1.13 | 1.62 | .30 | |||||||||||||||||||||||||||||||||||||||
| 10/31/15 | 14.63 | .03 | (.02 | ) | .01 | (.05 | ) | (.22 | ) | (.27 | ) | 14.37 | .06 | 198 | 1.22 | 1.12 | 1.61 | .22 | ||||||||||||||||||||||||||||||||||||||
| 10/31/14 | 13.79 | .02 | .93 | .95 | (.10 | ) | (.01 | ) | (.11 | ) | 14.63 | 6.92 | 134 | 1.24 | 1.14 | 1.63 | .14 | |||||||||||||||||||||||||||||||||||||||
| 10/31/13 | 11.13 | .01 | 2.78 | 2.79 | (.12 | ) | (.01 | ) | (.13 | ) | 13.79 | 25.27 | 62 | 1.26 | 1.16 | 1.66 | .04 | |||||||||||||||||||||||||||||||||||||||
| 10/31/126,7 | 10.00 | (.02 | ) | 1.15 | 1.13 | — | — | — | 11.13 | 11.30 | 8 | 8 | .56 | 8 | .51 | 8 | 1.02 | 8 | (.17 | )8 | ||||||||||||||||||||||||||||||||||||
| Class F-1: | ||||||||||||||||||||||||||||||||||||||||||||||||||||||||
| 10/31/16 | 14.58 | .15 | .10 | .25 | (.11 | ) | (.42 | ) | (.53 | ) | 14.30 | 1.77 | 40 | .42 | .40 | .89 | 1.08 | |||||||||||||||||||||||||||||||||||||||
| 10/31/15 | 14.82 | .15 | (.04 | ) | .11 | (.13 | ) | (.22 | ) | (.35 | ) | 14.58 | .77 | 39 | .50 | .40 | .89 | 1.01 | ||||||||||||||||||||||||||||||||||||||
| 10/31/14 | 13.92 | .13 | .93 | 1.06 | (.15 | ) | (.01 | ) | (.16 | ) | 14.82 | 7.69 | 39 | .51 | .41 | .90 | .92 | |||||||||||||||||||||||||||||||||||||||
| 10/31/13 | 11.17 | .08 | 2.82 | 2.90 | (.14 | ) | (.01 | ) | (.15 | ) | 13.92 | 26.23 | 23 | .53 | .43 | .93 | .59 | |||||||||||||||||||||||||||||||||||||||
| 10/31/126,7 | 10.00 | .03 | 1.14 | 1.17 | — | — | — | 11.17 | 11.70 | 8 | 2 | .19 | 8 | .14 | 8 | .65 | 8 | .28 | 8 | |||||||||||||||||||||||||||||||||||||
| Class F-2: | ||||||||||||||||||||||||||||||||||||||||||||||||||||||||
| 10/31/16 | 14.64 | .16 | .12 | .28 | (.16 | ) | (.42 | ) | (.58 | ) | 14.34 | 1.98 | 105 | .15 | .13 | .62 | 1.15 | |||||||||||||||||||||||||||||||||||||||
| 10/31/15 | 14.87 | .19 | (.04 | ) | .15 | (.16 | ) | (.22 | ) | (.38 | ) | 14.64 | 1.08 | 55 | .24 | .14 | .63 | 1.28 | ||||||||||||||||||||||||||||||||||||||
| 10/31/14 | 13.96 | .17 | .92 | 1.09 | (.17 | ) | (.01 | ) | (.18 | ) | 14.87 | 7.90 | 41 | .24 | .14 | .63 | 1.15 | |||||||||||||||||||||||||||||||||||||||
| 10/31/13 | 11.18 | .12 | 2.82 | 2.94 | (.15 | ) | (.01 | ) | (.16 | ) | 13.96 | 26.57 | 20 | .27 | .17 | .67 | .96 | |||||||||||||||||||||||||||||||||||||||
| 10/31/126,7 | 10.00 | .04 | 1.14 | 1.18 | — | — | — | 11.18 | 11.80 | 8 | 1 | .11 | 8 | .06 | 8 | .57 | 8 | .37 | 8 | |||||||||||||||||||||||||||||||||||||
| Class 529-A: | ||||||||||||||||||||||||||||||||||||||||||||||||||||||||
| 10/31/16 | 14.56 | .14 | .11 | .25 | (.12 | ) | (.42 | ) | (.54 | ) | 14.27 | 1.79 | 147 | .41 | .39 | .88 | 1.03 | |||||||||||||||||||||||||||||||||||||||
| 10/31/15 | 14.81 | .14 | (.04 | ) | .10 | (.13 | ) | (.22 | ) | (.35 | ) | 14.56 | .73 | 126 | .51 | .41 | .90 | .97 | ||||||||||||||||||||||||||||||||||||||
| 10/31/14 | 13.91 | .13 | .93 | 1.06 | (.15 | ) | (.01 | ) | (.16 | ) | 14.81 | 7.70 | 94 | .51 | .41 | .90 | .87 | |||||||||||||||||||||||||||||||||||||||
| 10/31/13 | 11.16 | .12 | 2.78 | 2.90 | (.14 | ) | (.01 | ) | (.15 | ) | 13.91 | 26.27 | 45 | .50 | .40 | .90 | .96 | |||||||||||||||||||||||||||||||||||||||
| 10/31/126,7 | 10.00 | .02 | 1.14 | 1.16 | — | — | — | 11.16 | 11.60 | 8 | 9 | .23 | 8 | .18 | 8 | .69 | 8 | .21 | 8 | |||||||||||||||||||||||||||||||||||||
| Class 529-B: | ||||||||||||||||||||||||||||||||||||||||||||||||||||||||
| 10/31/16 | 14.42 | .08 | .05 | .13 | — | (.42 | ) | (.42 | ) | 14.13 | .94 | — | 10 | 1.26 | 1.23 | 1.72 | .55 | |||||||||||||||||||||||||||||||||||||||
| 10/31/15 | 14.65 | .05 | (.06 | ) | (.01 | ) | — | (.22 | ) | (.22 | ) | 14.42 | (.04 | ) | — | 10 | 1.32 | 1.22 | 1.71 | .31 | ||||||||||||||||||||||||||||||||||||
| 10/31/14 | 13.80 | .03 | .90 | .93 | (.07 | ) | (.01 | ) | (.08 | ) | 14.65 | 6.79 | 1 | 1.33 | 1.23 | 1.72 | .21 | |||||||||||||||||||||||||||||||||||||||
| 10/31/13 | 11.14 | .03 | 2.75 | 2.78 | (.11 | ) | (.01 | ) | (.12 | ) | 13.80 | 25.11 | 1 | 1.38 | 1.28 | 1.78 | .21 | |||||||||||||||||||||||||||||||||||||||
| 10/31/126,7 | 10.00 | (.03 | ) | 1.17 | 1.14 | — | — | — | 11.14 | 11.40 | 8 | — | 10 | .59 | 8 | .54 | 8 | 1.05 | 8 | (.26 | )8 | |||||||||||||||||||||||||||||||||||
| Class 529-C: | ||||||||||||||||||||||||||||||||||||||||||||||||||||||||
| 10/31/16 | 14.34 | .03 | .10 | .13 | (.02 | ) | (.42 | ) | (.44 | ) | 14.03 | .92 | 56 | 1.23 | 1.21 | 1.70 | .22 | |||||||||||||||||||||||||||||||||||||||
| 10/31/15 | 14.61 | .03 | (.04 | ) | (.01 | ) | (.04 | ) | (.22 | ) | (.26 | ) | 14.34 | (.02 | ) | 53 | 1.31 | 1.21 | 1.70 | .18 | ||||||||||||||||||||||||||||||||||||
| 10/31/14 | 13.78 | — | 9 | .92 | .92 | (.08 | ) | (.01 | ) | (.09 | ) | 14.61 | 6.76 | 42 | 1.32 | 1.22 | 1.71 | (.03 | ) | |||||||||||||||||||||||||||||||||||||
| 10/31/13 | 11.12 | (.01 | ) | 2.80 | 2.79 | (.12 | ) | (.01 | ) | (.13 | ) | 13.78 | 25.23 | 16 | 1.36 | 1.26 | 1.76 | (.06 | ) | |||||||||||||||||||||||||||||||||||||
| 10/31/126,7 | 10.00 | (.02 | ) | 1.14 | 1.12 | — | — | — | 11.12 | 11.20 | 8 | 2 | .60 | 8 | .56 | 8 | 1.07 | 8 | (.18 | )8 | ||||||||||||||||||||||||||||||||||||
| Class 529-E: | ||||||||||||||||||||||||||||||||||||||||||||||||||||||||
| 10/31/16 | 14.50 | .10 | .10 | .20 | (.09 | ) | (.42 | ) | (.51 | ) | 14.19 | 1.45 | 6 | .68 | .67 | 1.16 | .75 | |||||||||||||||||||||||||||||||||||||||
| 10/31/15 | 14.75 | .10 | (.02 | ) | .08 | (.11 | ) | (.22 | ) | (.33 | ) | 14.50 | .55 | 5 | .78 | .68 | 1.17 | .69 | ||||||||||||||||||||||||||||||||||||||
| 10/31/14 | 13.88 | .08 | .93 | 1.01 | (.13 | ) | (.01 | ) | (.14 | ) | 14.75 | 7.33 | 4 | .79 | .69 | 1.18 | .55 | |||||||||||||||||||||||||||||||||||||||
| 10/31/13 | 11.16 | .06 | 2.80 | 2.86 | (.13 | ) | (.01 | ) | (.14 | ) | 13.88 | 25.89 | 2 | .82 | .72 | 1.22 | .49 | |||||||||||||||||||||||||||||||||||||||
| 10/31/126,7 | 10.00 | .01 | 1.15 | 1.16 | — | — | — | 11.16 | 11.60 | 8 | — | 10 | .33 | 8 | .29 | 8 | .80 | 8 | .08 | 8 | ||||||||||||||||||||||||||||||||||||
| 48 | American Funds Portfolio Series |
Global Growth Portfolio
| Income (loss) from investment operations1 | Dividends and distributions | Ratio of | Ratio of | |||||||||||||||||||||||||||||||||||||||||||||||||||||
| Period ended | Net asset value, beginning of period | Net investment income (loss) | Net gains (losses) on securities (both realized and unrealized) | Total from investment operations | Dividends (from net investment income) | Distri- butions (from capital gains) | Total dividends and distributions | Net asset value, end of period | Total return2,3 | Net assets, end of period (in millions) | expenses to average net assets before waivers/ reimburse- ments4 | expenses to average net assets after waivers/ reimburse- ments3,4 | Net effective expense ratio3,5 | Ratio of net income (loss) to average net assets3 | ||||||||||||||||||||||||||||||||||||||||||
| Class 529-F-1: | ||||||||||||||||||||||||||||||||||||||||||||||||||||||||
| 10/31/16 | $ | 14.61 | $ | .17 | $ | .11 | $ | .28 | $ | (.15 | ) | $ | (.42 | ) | $ | (.57 | ) | $ | 14.32 | 1.97 | % | $ | 10 | .22 | % | .21 | % | .70 | % | 1.19 | % | |||||||||||||||||||||||||
| 10/31/15 | 14.85 | .17 | (.03 | ) | .14 | (.16 | ) | (.22 | ) | (.38 | ) | 14.61 | .98 | 8 | .31 | .21 | .70 | 1.12 | ||||||||||||||||||||||||||||||||||||||
| 10/31/14 | 13.94 | .14 | .94 | 1.08 | (.16 | ) | (.01 | ) | (.17 | ) | 14.85 | 7.85 | 4 | .31 | .21 | .70 | .96 | |||||||||||||||||||||||||||||||||||||||
| 10/31/13 | 11.18 | .16 | 2.76 | 2.92 | (.15 | ) | (.01 | ) | (.16 | ) | 13.94 | 26.37 | 1 | .37 | .27 | .77 | 1.26 | |||||||||||||||||||||||||||||||||||||||
| 10/31/126,7 | 10.00 | .03 | 1.15 | 1.18 | — | — | — | 11.18 | 11.80 | 8 | — | 10 | .16 | 8 | .11 | 8 | .62 | 8 | .23 | 8 | ||||||||||||||||||||||||||||||||||||
| Class R-1: | ||||||||||||||||||||||||||||||||||||||||||||||||||||||||
| 10/31/16 | 14.39 | .03 | .11 | .14 | (.03 | ) | (.42 | ) | (.45 | ) | 14.08 | 1.03 | 3 | 1.15 | 1.14 | 1.63 | .24 | |||||||||||||||||||||||||||||||||||||||
| 10/31/15 | 14.65 | .02 | (.02 | ) | — | (.04 | ) | (.22 | ) | (.26 | ) | 14.39 | .03 | 2 | 1.23 | 1.13 | 1.62 | .17 | ||||||||||||||||||||||||||||||||||||||
| 10/31/14 | 13.81 | .02 | .92 | .94 | (.09 | ) | (.01 | ) | (.10 | ) | 14.65 | 6.86 | 2 | 1.25 | 1.15 | 1.64 | .13 | |||||||||||||||||||||||||||||||||||||||
| 10/31/13 | 11.14 | .02 | 2.78 | 2.80 | (.12 | ) | (.01 | ) | (.13 | ) | 13.81 | 25.28 | 1 | 1.25 | 1.15 | 1.65 | .13 | |||||||||||||||||||||||||||||||||||||||
| 10/31/126,7 | 10.00 | — | 9 | 1.14 | 1.14 | — | — | — | 11.14 | 11.40 | 8 | — | 10 | .51 | 8 | .47 | 8 | .98 | 8 | (.04 | )8 | |||||||||||||||||||||||||||||||||||
| Class R-2: | ||||||||||||||||||||||||||||||||||||||||||||||||||||||||
| 10/31/16 | 14.35 | .03 | .11 | .14 | (.04 | ) | (.42 | ) | (.46 | ) | 14.03 | 1.03 | 47 | 1.16 | 1.15 | 1.64 | .22 | |||||||||||||||||||||||||||||||||||||||
| 10/31/15 | 14.62 | .02 | (.02 | ) | — | (.05 | ) | (.22 | ) | (.27 | ) | 14.35 | .03 | 33 | 1.25 | 1.15 | 1.64 | .17 | ||||||||||||||||||||||||||||||||||||||
| 10/31/14 | 13.80 | — | 9 | .93 | .93 | (.10 | ) | (.01 | ) | (.11 | ) | 14.62 | 6.82 | 19 | 1.30 | 1.20 | 1.69 | .03 | ||||||||||||||||||||||||||||||||||||||
| 10/31/13 | 11.15 | (.02 | ) | 2.81 | 2.79 | (.13 | ) | (.01 | ) | (.14 | ) | 13.80 | 25.24 | 7 | 1.27 | 1.17 | 1.67 | (.18 | ) | |||||||||||||||||||||||||||||||||||||
| 10/31/126,7 | 10.00 | (.02 | ) | 1.17 | 1.15 | — | — | — | 11.15 | 11.50 | 8 | 1 | .47 | 8 | .42 | 8 | .93 | 8 | (.21 | )8 | ||||||||||||||||||||||||||||||||||||
| Class R-2E: | ||||||||||||||||||||||||||||||||||||||||||||||||||||||||
| 10/31/16 | 14.57 | (.05 | ) | .31 | .26 | (.14 | ) | (.42 | ) | (.56 | ) | 14.27 | 1.84 | 1 | .75 | .75 | 1.24 | (.42 | ) | |||||||||||||||||||||||||||||||||||||
| 10/31/15 | 14.82 | .17 | (.04 | ) | .13 | (.16 | ) | (.22 | ) | (.38 | ) | 14.57 | .94 | 11 | — | 10 | .38 | 11 | .27 | 11 | .76 | 11 | 1.18 | 11 | ||||||||||||||||||||||||||||||||
| 10/31/146,12 | 15.02 | .01 | (.21 | ) | (.20 | ) | — | — | — | 14.82 | (1.33 | )8,11 | — | 10 | .06 | 8,11 | .04 | 8,11 | .53 | 8,11 | .09 | 8,11 | ||||||||||||||||||||||||||||||||||
| Class R-3: | ||||||||||||||||||||||||||||||||||||||||||||||||||||||||
| 10/31/16 | 14.49 | .09 | .11 | .20 | (.08 | ) | (.42 | ) | (.50 | ) | 14.19 | 1.46 | 22 | .72 | .70 | 1.19 | .69 | |||||||||||||||||||||||||||||||||||||||
| 10/31/15 | 14.74 | .10 | (.03 | ) | .07 | (.10 | ) | (.22 | ) | (.32 | ) | 14.49 | .48 | 18 | .79 | .69 | 1.18 | .66 | ||||||||||||||||||||||||||||||||||||||
| 10/31/14 | 13.86 | .09 | .92 | 1.01 | (.12 | ) | (.01 | ) | (.13 | ) | 14.74 | 7.38 | 13 | .82 | .72 | 1.21 | .60 | |||||||||||||||||||||||||||||||||||||||
| 10/31/13 | 11.16 | .05 | 2.80 | 2.85 | (.14 | ) | (.01 | ) | (.15 | ) | 13.86 | 25.77 | 6 | .83 | .73 | 1.23 | .36 | |||||||||||||||||||||||||||||||||||||||
| 10/31/126,7 | 10.00 | .04 | 1.12 | 1.16 | — | — | — | 11.16 | 11.60 | 8 | — | 10 | .33 | 8 | .29 | 8 | .80 | 8 | .39 | 8 | ||||||||||||||||||||||||||||||||||||
| Class R-4: | ||||||||||||||||||||||||||||||||||||||||||||||||||||||||
| 10/31/16 | 14.57 | .15 | .10 | .25 | (.13 | ) | (.42 | ) | (.55 | ) | 14.27 | 1.81 | 10 | .41 | .39 | .88 | 1.08 | |||||||||||||||||||||||||||||||||||||||
| 10/31/15 | 14.82 | .15 | (.04 | ) | .11 | (.14 | ) | (.22 | ) | (.36 | ) | 14.57 | .81 | 9 | .47 | .37 | .86 | 1.00 | ||||||||||||||||||||||||||||||||||||||
| 10/31/14 | 13.93 | .12 | .93 | 1.05 | (.15 | ) | (.01 | ) | (.16 | ) | 14.82 | 7.62 | 4 | .48 | .38 | .87 | .81 | |||||||||||||||||||||||||||||||||||||||
| 10/31/13 | 11.18 | .14 | 2.77 | 2.91 | (.15 | ) | (.01 | ) | (.16 | ) | 13.93 | 26.27 | 1 | .49 | .39 | .89 | 1.11 | |||||||||||||||||||||||||||||||||||||||
| 10/31/126,7 | 10.00 | — | 9 | 1.18 | 1.18 | — | — | — | 11.18 | 11.80 | 8 | — | 10 | .21 | 8 | .16 | 8 | .67 | 8 | (.02 | )8 | |||||||||||||||||||||||||||||||||||
| Class R-5E: | ||||||||||||||||||||||||||||||||||||||||||||||||||||||||
| 10/31/166,13 | 14.71 | .17 | (.03 | ) | .14 | (.17 | ) | (.42 | ) | (.59 | ) | 14.26 | 1.03 | 8 | — | 10 | .27 | 14 | .25 | 14 | .74 | 14 | 1.32 | 14 | ||||||||||||||||||||||||||||||||
| Class R-5: | ||||||||||||||||||||||||||||||||||||||||||||||||||||||||
| 10/31/16 | 14.70 | .17 | .11 | .28 | (.16 | ) | (.42 | ) | (.58 | ) | 14.40 | 2.03 | 4 | .10 | .09 | .58 | 1.25 | |||||||||||||||||||||||||||||||||||||||
| 10/31/15 | 14.88 | .16 | — | 9 | .16 | (.12 | ) | (.22 | ) | (.34 | ) | 14.70 | 1.13 | 3 | .18 | .08 | .57 | 1.10 | ||||||||||||||||||||||||||||||||||||||
| 10/31/14 | 13.97 | .27 | .82 | 1.09 | (.17 | ) | (.01 | ) | (.18 | ) | 14.88 | 7.92 | 1 | .21 | .11 | .60 | 1.84 | |||||||||||||||||||||||||||||||||||||||
| 10/31/13 | 11.18 | .18 | 2.77 | 2.95 | (.15 | ) | (.01 | ) | (.16 | ) | 13.97 | 26.66 | 20 | .23 | .13 | .63 | 1.47 | |||||||||||||||||||||||||||||||||||||||
| 10/31/126,7 | 10.00 | .03 | 1.15 | 1.18 | — | — | — | 11.18 | 11.80 | 8 | 11 | .10 | 8 | .05 | 8 | .56 | 8 | .30 | 8 | |||||||||||||||||||||||||||||||||||||
| Class R-6: | ||||||||||||||||||||||||||||||||||||||||||||||||||||||||
| 10/31/16 | 14.72 | .21 | .09 | .30 | (.17 | ) | (.42 | ) | (.59 | ) | 14.43 | 2.13 | 32 | .05 | .03 | .52 | 1.47 | |||||||||||||||||||||||||||||||||||||||
| 10/31/15 | 14.95 | .20 | (.04 | ) | .16 | (.17 | ) | (.22 | ) | (.39 | ) | 14.72 | 1.15 | 39 | .14 | .04 | .53 | 1.36 | ||||||||||||||||||||||||||||||||||||||
| 10/31/14 | 14.02 | .14 | .98 | 1.12 | (.18 | ) | (.01 | ) | (.19 | ) | 14.95 | 8.07 | 33 | .14 | .04 | .53 | .96 | |||||||||||||||||||||||||||||||||||||||
| 10/31/13 | 11.17 | .10 | 2.85 | 2.95 | (.09 | ) | (.01 | ) | (.10 | ) | 14.02 | 26.57 | 3 | .18 | .08 | .58 | .79 | |||||||||||||||||||||||||||||||||||||||
| 10/31/126,7 | 10.00 | .05 | 1.12 | 1.17 | — | — | — | 11.17 | 11.70 | 8 | — | 10 | .13 | 8 | .08 | 8 | .59 | 8 | .52 | 8 | ||||||||||||||||||||||||||||||||||||
See page 62 for footnotes.
| American Funds Portfolio Series | 49 |
Financial highlights (continued)
Growth Portfolio
| Income (loss) from investment operations1 | Dividends and distributions | |||||||||||||||||||||||||||||||||||||||||||||||||||||||
| Period ended | Net asset value, beginning of period | Net investment income (loss) | Net gains (losses) on securities (both realized and unrealized) | Total from investment operations | Dividends (from net investment income) | Distri- butions (from capital gains) | Total dividends and distributions | Net asset value, end of period | Total return2,3 | Net assets, end of period (in millions) | Ratio of expenses to average net assets before waivers/ reimburse- ments4 | Ratio of expenses to average net assets after waivers/ reimburse- ments3,4 | Net effective expense ratio3,5 | Ratio of net income (loss) to average net assets3 | ||||||||||||||||||||||||||||||||||||||||||
| Class A: | ||||||||||||||||||||||||||||||||||||||||||||||||||||||||
| 10/31/16 | $ | 15.41 | $ | .10 | $ | .41 | $ | .51 | $ | (.11 | ) | $ | (.60 | ) | $ | (.71 | ) | $ | 15.21 | 3.41 | % | $ | 2,505 | .34 | % | .32 | % | .76 | % | .68 | % | |||||||||||||||||||||||||
| 10/31/15 | 15.36 | .10 | .43 | .53 | (.12 | ) | (.36 | ) | (.48 | ) | 15.41 | 3.48 | 2,042 | .42 | .32 | .75 | .65 | |||||||||||||||||||||||||||||||||||||||
| 10/31/14 | 14.02 | .07 | 1.39 | 1.46 | (.08 | ) | (.04 | ) | (.12 | ) | 15.36 | 10.46 | 1,345 | .42 | .32 | .75 | .47 | |||||||||||||||||||||||||||||||||||||||
| 10/31/13 | 11.02 | .09 | 3.02 | 3.11 | (.11 | ) | — | (.11 | ) | 14.02 | 28.45 | 646 | .45 | .35 | .79 | .67 | ||||||||||||||||||||||||||||||||||||||||
| 10/31/126,7 | 10.00 | .02 | 1.00 | 1.02 | — | — | — | 11.02 | 10.20 | 8 | 108 | .24 | 8 | .19 | 8 | .64 | 8 | .15 | 8 | |||||||||||||||||||||||||||||||||||||
| Class B: | ||||||||||||||||||||||||||||||||||||||||||||||||||||||||
| 10/31/16 | 15.23 | .02 | .35 | .37 | — | (.60 | ) | (.60 | ) | 15.00 | 2.50 | 1 | 1.17 | 1.14 | 1.58 | .12 | ||||||||||||||||||||||||||||||||||||||||
| 10/31/15 | 15.18 | — | 9 | .41 | .41 | — | (.36 | ) | (.36 | ) | 15.23 | 2.70 | 4 | 1.23 | 1.13 | 1.56 | .01 | |||||||||||||||||||||||||||||||||||||||
| 10/31/14 | 13.89 | (.04 | ) | 1.37 | 1.33 | — | (.04 | ) | (.04 | ) | 15.18 | 9.58 | 5 | 1.24 | 1.14 | 1.57 | (.28 | ) | ||||||||||||||||||||||||||||||||||||||
| 10/31/13 | 10.98 | — | 9 | 3.00 | 3.00 | (.09 | ) | — | (.09 | ) | 13.89 | 27.47 | 5 | 1.26 | 1.16 | 1.60 | (.04 | ) | ||||||||||||||||||||||||||||||||||||||
| 10/31/126,7 | 10.00 | (.02 | ) | 1.00 | .98 | — | — | — | 10.98 | 9.80 | 8 | 1 | .55 | 8 | .51 | 8 | .96 | 8 | (.23 | )8 | ||||||||||||||||||||||||||||||||||||
| Class C: | ||||||||||||||||||||||||||||||||||||||||||||||||||||||||
| 10/31/16 | 15.18 | (.02 | ) | .39 | .37 | (.01 | ) | (.60 | ) | (.61 | ) | 14.94 | 2.54 | 595 | 1.14 | 1.12 | 1.56 | (.13 | ) | |||||||||||||||||||||||||||||||||||||
| 10/31/15 | 15.16 | (.03 | ) | .44 | .41 | (.03 | ) | (.36 | ) | (.39 | ) | 15.18 | 2.69 | 458 | 1.21 | 1.11 | 1.54 | (.18 | ) | |||||||||||||||||||||||||||||||||||||
| 10/31/14 | 13.89 | (.05 | ) | 1.38 | 1.33 | (.02 | ) | (.04 | ) | (.06 | ) | 15.16 | 9.60 | 259 | 1.23 | 1.13 | 1.56 | (.35 | ) | |||||||||||||||||||||||||||||||||||||
| 10/31/13 | 10.98 | (.02 | ) | 3.02 | 3.00 | (.09 | ) | — | (.09 | ) | 13.89 | 27.52 | 108 | 1.24 | 1.14 | 1.58 | (.17 | ) | ||||||||||||||||||||||||||||||||||||||
| 10/31/126,7 | 10.00 | (.03 | ) | 1.01 | .98 | — | — | — | 10.98 | 9.80 | 8 | 14 | .55 | 8 | .50 | 8 | .95 | 8 | (.27 | )8 | ||||||||||||||||||||||||||||||||||||
| Class F-1: | ||||||||||||||||||||||||||||||||||||||||||||||||||||||||
| 10/31/16 | 15.40 | .09 | .40 | .49 | (.09 | ) | (.60 | ) | (.69 | ) | 15.20 | 3.32 | 60 | .41 | .39 | .83 | .63 | |||||||||||||||||||||||||||||||||||||||
| 10/31/15 | 15.35 | .09 | .43 | .52 | (.11 | ) | (.36 | ) | (.47 | ) | 15.40 | 3.42 | 51 | .49 | .39 | .82 | .61 | |||||||||||||||||||||||||||||||||||||||
| 10/31/14 | 14.01 | .06 | 1.40 | 1.46 | (.08 | ) | (.04 | ) | (.12 | ) | 15.35 | 10.44 | 40 | .50 | .40 | .83 | .41 | |||||||||||||||||||||||||||||||||||||||
| 10/31/13 | 11.02 | .08 | 3.02 | 3.10 | (.11 | ) | — | (.11 | ) | 14.01 | 28.41 | 19 | .51 | .41 | .85 | .64 | ||||||||||||||||||||||||||||||||||||||||
| 10/31/126,7 | 10.00 | .02 | 1.00 | 1.02 | — | — | — | 11.02 | 10.20 | 8 | 3 | .19 | 8 | .15 | 8 | .60 | 8 | .19 | 8 | |||||||||||||||||||||||||||||||||||||
| Class F-2: | ||||||||||||||||||||||||||||||||||||||||||||||||||||||||
| 10/31/16 | 15.47 | .12 | .41 | .53 | (.13 | ) | (.60 | ) | (.73 | ) | 15.27 | 3.58 | 166 | .14 | .13 | .57 | .81 | |||||||||||||||||||||||||||||||||||||||
| 10/31/15 | 15.41 | .13 | .43 | .56 | (.14 | ) | (.36 | ) | (.50 | ) | 15.47 | 3.68 | 104 | .23 | .13 | .56 | .82 | |||||||||||||||||||||||||||||||||||||||
| 10/31/14 | 14.05 | .10 | 1.40 | 1.50 | (.10 | ) | (.04 | ) | (.14 | ) | 15.41 | 10.69 | 57 | .24 | .14 | .57 | .66 | |||||||||||||||||||||||||||||||||||||||
| 10/31/13 | 11.03 | .08 | 3.06 | 3.14 | (.12 | ) | — | (.12 | ) | 14.05 | 28.75 | 31 | .26 | .16 | .60 | .64 | ||||||||||||||||||||||||||||||||||||||||
| 10/31/126,7 | 10.00 | .03 | 1.00 | 1.03 | — | — | — | 11.03 | 10.30 | 8 | 2 | .09 | 8 | .05 | 8 | .50 | 8 | .27 | 8 | |||||||||||||||||||||||||||||||||||||
| Class 529-A: | ||||||||||||||||||||||||||||||||||||||||||||||||||||||||
| 10/31/16 | 15.40 | .09 | .40 | .49 | (.10 | ) | (.60 | ) | (.70 | ) | 15.19 | 3.28 | 370 | .41 | .40 | .84 | .60 | |||||||||||||||||||||||||||||||||||||||
| 10/31/15 | 15.35 | .09 | .43 | .52 | (.11 | ) | (.36 | ) | (.47 | ) | 15.40 | 3.43 | 280 | .49 | .39 | .82 | .58 | |||||||||||||||||||||||||||||||||||||||
| 10/31/14 | 14.01 | .06 | 1.40 | 1.46 | (.08 | ) | (.04 | ) | (.12 | ) | 15.35 | 10.43 | 184 | .49 | .39 | .82 | .40 | |||||||||||||||||||||||||||||||||||||||
| 10/31/13 | 11.01 | .09 | 3.02 | 3.11 | (.11 | ) | — | (.11 | ) | 14.01 | 28.49 | 90 | .49 | .39 | .83 | .71 | ||||||||||||||||||||||||||||||||||||||||
| 10/31/126,7 | 10.00 | .01 | 1.00 | 1.01 | — | — | — | 11.01 | 10.10 | 8 | 21 | .23 | 8 | .18 | 8 | .63 | 8 | .09 | 8 | |||||||||||||||||||||||||||||||||||||
| Class 529-B: | ||||||||||||||||||||||||||||||||||||||||||||||||||||||||
| 10/31/16 | 15.20 | .03 | .33 | .36 | — | (.60 | ) | (.60 | ) | 14.96 | 2.44 | — | 10 | 1.26 | 1.23 | 1.67 | .18 | |||||||||||||||||||||||||||||||||||||||
| 10/31/15 | 15.17 | (.02 | ) | .41 | .39 | — | (.36 | ) | (.36 | ) | 15.20 | 2.56 | 1 | 1.31 | 1.21 | 1.64 | (.12 | ) | ||||||||||||||||||||||||||||||||||||||
| 10/31/14 | 13.89 | (.06 | ) | 1.38 | 1.32 | — | (.04 | ) | (.04 | ) | 15.17 | 9.51 | 1 | 1.32 | 1.22 | 1.65 | (.41 | ) | ||||||||||||||||||||||||||||||||||||||
| 10/31/13 | 10.98 | .01 | 2.97 | 2.98 | (.07 | ) | — | (.07 | ) | 13.89 | 27.33 | 1 | 1.36 | 1.26 | 1.70 | .04 | ||||||||||||||||||||||||||||||||||||||||
| 10/31/126,7 | 10.00 | (.02 | ) | 1.00 | .98 | — | — | — | 10.98 | 9.80 | 8 | 1 | .59 | 8 | .55 | 8 | 1.00 | 8 | (.23 | )8 | ||||||||||||||||||||||||||||||||||||
| Class 529-C: | ||||||||||||||||||||||||||||||||||||||||||||||||||||||||
| 10/31/16 | 15.18 | (.03 | ) | .39 | .36 | — | (.60 | ) | (.60 | ) | 14.94 | 2.44 | 126 | 1.22 | 1.21 | 1.65 | (.20 | ) | ||||||||||||||||||||||||||||||||||||||
| 10/31/15 | 15.15 | (.04 | ) | .44 | .40 | (.01 | ) | (.36 | ) | (.37 | ) | 15.18 | 2.64 | 98 | 1.31 | 1.21 | 1.64 | (.24 | ) | |||||||||||||||||||||||||||||||||||||
| 10/31/14 | 13.88 | (.06 | ) | 1.37 | 1.31 | — | 9 | (.04 | ) | (.04 | ) | 15.15 | 9.45 | 65 | 1.31 | 1.21 | 1.64 | (.41 | ) | |||||||||||||||||||||||||||||||||||||
| 10/31/13 | 10.98 | (.02 | ) | 3.00 | 2.98 | (.08 | ) | — | (.08 | ) | 13.88 | 27.35 | 33 | 1.34 | 1.24 | 1.68 | (.15 | ) | ||||||||||||||||||||||||||||||||||||||
| 10/31/126,7 | 10.00 | (.03 | ) | 1.01 | .98 | — | — | — | 10.98 | 9.80 | 8 | 8 | .60 | 8 | .55 | 8 | 1.00 | 8 | (.30 | )8 | ||||||||||||||||||||||||||||||||||||
| Class 529-E: | ||||||||||||||||||||||||||||||||||||||||||||||||||||||||
| 10/31/16 | 15.31 | .05 | .40 | .45 | (.07 | ) | (.60 | ) | (.67 | ) | 15.09 | 3.02 | 18 | .68 | .66 | 1.10 | .35 | |||||||||||||||||||||||||||||||||||||||
| 10/31/15 | 15.27 | .05 | .43 | .48 | (.08 | ) | (.36 | ) | (.44 | ) | 15.31 | 3.14 | 14 | .77 | .67 | 1.10 | .34 | |||||||||||||||||||||||||||||||||||||||
| 10/31/14 | 13.96 | .01 | 1.39 | 1.40 | (.05 | ) | (.04 | ) | (.09 | ) | 15.27 | 10.08 | 11 | .78 | .68 | 1.11 | .09 | |||||||||||||||||||||||||||||||||||||||
| 10/31/13 | 11.00 | .05 | 3.02 | 3.07 | (.11 | ) | — | (.11 | ) | 13.96 | 28.14 | 5 | .80 | .70 | 1.14 | .39 | ||||||||||||||||||||||||||||||||||||||||
| 10/31/126,7 | 10.00 | (.01 | ) | 1.01 | 1.00 | — | — | — | 11.00 | 10.00 | 8 | 1 | .35 | 8 | .30 | 8 | .75 | 8 | (.05 | )8 | ||||||||||||||||||||||||||||||||||||
| 50 | American Funds Portfolio Series |
Growth Portfolio
| Income (loss) from investment operations1 | Dividends and distributions | Ratio of | Ratio of | |||||||||||||||||||||||||||||||||||||||||||||||||||||
| Period ended | Net asset value, beginning of period | Net investment income (loss) | Net gains (losses) on securities (both realized and unrealized) | Total from investment operations | Dividends (from net investment income) | Distri- butions (from capital gains) | Total dividends and distributions | Net asset value, end of period | Total return2,3 | Net assets, end of period (in millions) | expenses to average net assets before waivers/ reimburse- ments4 | expenses to average net assets after waivers/ reimburse- ments3,4 | Net effective expense ratio3,5 | Ratio of net income (loss) to average net assets3 | ||||||||||||||||||||||||||||||||||||||||||
| Class 529-F-1: | ||||||||||||||||||||||||||||||||||||||||||||||||||||||||
| 10/31/16 | $ | 15.45 | $ | .11 | $ | .41 | $ | .52 | $ | (.12 | ) | $ | (.60 | ) | $ | (.72 | ) | $ | 15.25 | 3.47 | % | $ | 30 | .21 | % | .20 | % | .64 | % | .74 | % | |||||||||||||||||||||||||
| 10/31/15 | 15.39 | .11 | .45 | .56 | (.14 | ) | (.36 | ) | (.50 | ) | 15.45 | 3.64 | 20 | .30 | .20 | .63 | .70 | |||||||||||||||||||||||||||||||||||||||
| 10/31/14 | 14.04 | .09 | 1.39 | 1.48 | (.09 | ) | (.04 | ) | (.13 | ) | 15.39 | 10.60 | 10 | .31 | .21 | .64 | .59 | |||||||||||||||||||||||||||||||||||||||
| 10/31/13 | 11.03 | .11 | 3.02 | 3.13 | (.12 | ) | — | (.12 | ) | 14.04 | 28.73 | 4 | .34 | .24 | .68 | .90 | ||||||||||||||||||||||||||||||||||||||||
| 10/31/126,7 | 10.00 | .02 | 1.01 | 1.03 | — | — | — | 11.03 | 10.20 | 8 | 1 | .14 | 8 | .10 | 8 | .55 | 8 | .16 | 8 | |||||||||||||||||||||||||||||||||||||
| Class R-1: | ||||||||||||||||||||||||||||||||||||||||||||||||||||||||
| 10/31/16 | 15.22 | (.02 | ) | .40 | .38 | — | (.60 | ) | (.60 | ) | 15.00 | 2.57 | 7 | 1.15 | 1.13 | 1.57 | (.11 | ) | ||||||||||||||||||||||||||||||||||||||
| 10/31/15 | 15.19 | (.03 | ) | .44 | .41 | (.02 | ) | (.36 | ) | (.38 | ) | 15.22 | 2.66 | 7 | 1.22 | 1.12 | 1.55 | (.19 | ) | |||||||||||||||||||||||||||||||||||||
| 10/31/14 | 13.90 | (.05 | ) | 1.38 | 1.33 | — | (.04 | ) | (.04 | ) | 15.19 | 9.57 | 5 | 1.24 | 1.14 | 1.57 | (.34 | ) | ||||||||||||||||||||||||||||||||||||||
| 10/31/13 | 10.99 | .01 | 2.99 | 3.00 | (.09 | ) | — | (.09 | ) | 13.90 | 27.52 | 3 | 1.24 | 1.14 | 1.58 | .11 | ||||||||||||||||||||||||||||||||||||||||
| 10/31/126,7 | 10.00 | (.04 | ) | 1.03 | .99 | — | — | — | 10.99 | 9.90 | 8 | 1 | .56 | 8 | .51 | 8 | .96 | 8 | (.34 | )8 | ||||||||||||||||||||||||||||||||||||
| Class R-2: | ||||||||||||||||||||||||||||||||||||||||||||||||||||||||
| 10/31/16 | 15.18 | (.03 | ) | .41 | .38 | (.01 | ) | (.60 | ) | (.61 | ) | 14.95 | 2.57 | 94 | 1.15 | 1.14 | 1.58 | (.20 | ) | |||||||||||||||||||||||||||||||||||||
| 10/31/15 | 15.16 | (.03 | ) | .43 | .40 | (.02 | ) | (.36 | ) | (.38 | ) | 15.18 | 2.65 | 61 | 1.24 | 1.14 | 1.57 | (.21 | ) | |||||||||||||||||||||||||||||||||||||
| 10/31/14 | 13.90 | (.06 | ) | 1.39 | 1.33 | (.03 | ) | (.04 | ) | (.07 | ) | 15.16 | 9.55 | 34 | 1.29 | 1.19 | 1.62 | (.42 | ) | |||||||||||||||||||||||||||||||||||||
| 10/31/13 | 11.00 | (.03 | ) | 3.03 | 3.00 | (.10 | ) | — | (.10 | ) | 13.90 | 27.44 | 13 | 1.24 | 1.14 | 1.58 | (.22 | ) | ||||||||||||||||||||||||||||||||||||||
| 10/31/126,7 | 10.00 | (.03 | ) | 1.03 | 1.00 | — | — | — | 11.00 | 10.00 | 8 | 2 | .48 | 8 | .44 | 8 | .89 | 8 | (.27 | )8 | ||||||||||||||||||||||||||||||||||||
| Class R-2E: | ||||||||||||||||||||||||||||||||||||||||||||||||||||||||
| 10/31/16 | 15.38 | .03 | .41 | .44 | (.14 | ) | (.60 | ) | (.74 | ) | 15.08 | 2.94 | 4 | .82 | .81 | 1.25 | .23 | |||||||||||||||||||||||||||||||||||||||
| 10/31/15 | 15.36 | .07 | .45 | .52 | (.14 | ) | (.36 | ) | (.50 | ) | 15.38 | 3.43 | 11 | — | 10 | .52 | 11 | .42 | 11 | .85 | 11 | .48 | 11 | |||||||||||||||||||||||||||||||||
| 10/31/146,12 | 15.54 | .01 | (.19 | ) | (.18 | ) | — | — | — | 15.36 | (1.16 | )8,11 | — | 10 | .06 | 8,11 | .04 | 8,11 | .47 | 8,11 | .06 | 8,11 | ||||||||||||||||||||||||||||||||||
| Class R-3: | ||||||||||||||||||||||||||||||||||||||||||||||||||||||||
| 10/31/16 | 15.32 | .04 | .41 | .45 | (.06 | ) | (.60 | ) | (.66 | ) | 15.11 | 3.02 | 55 | .71 | .69 | 1.13 | .26 | |||||||||||||||||||||||||||||||||||||||
| 10/31/15 | 15.29 | .04 | .43 | .47 | (.08 | ) | (.36 | ) | (.44 | ) | 15.32 | 3.07 | 37 | .78 | .68 | 1.11 | .25 | |||||||||||||||||||||||||||||||||||||||
| 10/31/14 | 13.97 | .01 | 1.39 | 1.40 | (.04 | ) | (.04 | ) | (.08 | ) | 15.29 | 10.07 | 22 | .81 | .71 | 1.14 | .06 | |||||||||||||||||||||||||||||||||||||||
| 10/31/13 | 11.01 | .01 | 3.05 | 3.06 | (.10 | ) | — | (.10 | ) | 13.97 | 28.02 | 9 | .81 | .71 | 1.15 | .06 | ||||||||||||||||||||||||||||||||||||||||
| 10/31/126,7 | 10.00 | .02 | .99 | 1.01 | — | — | — | 11.01 | 10.10 | 8 | — | 10 | .32 | 8 | .27 | 8 | .72 | 8 | .19 | 8 | ||||||||||||||||||||||||||||||||||||
| Class R-4: | ||||||||||||||||||||||||||||||||||||||||||||||||||||||||
| 10/31/16 | 15.40 | .09 | .40 | .49 | (.11 | ) | (.60 | ) | (.71 | ) | 15.18 | 3.29 | 31 | .40 | .38 | .82 | .59 | |||||||||||||||||||||||||||||||||||||||
| 10/31/15 | 15.36 | .06 | .46 | .52 | (.12 | ) | (.36 | ) | (.48 | ) | 15.40 | 3.42 | 23 | .47 | .37 | .80 | .40 | |||||||||||||||||||||||||||||||||||||||
| 10/31/14 | 14.02 | .06 | 1.40 | 1.46 | (.08 | ) | (.04 | ) | (.12 | ) | 15.36 | 10.44 | 7 | .47 | .37 | .80 | .39 | |||||||||||||||||||||||||||||||||||||||
| 10/31/13 | 11.03 | .08 | 3.03 | 3.11 | (.12 | ) | — | (.12 | ) | 14.02 | 28.45 | 2 | .46 | .36 | .80 | .62 | ||||||||||||||||||||||||||||||||||||||||
| 10/31/126,7 | 10.00 | — | 9 | 1.03 | 1.03 | — | — | — | 11.03 | 10.30 | 8 | — | 10 | .18 | 8 | .13 | 8 | .58 | 8 | .04 | 8 | |||||||||||||||||||||||||||||||||||
| Class R-5E: | ||||||||||||||||||||||||||||||||||||||||||||||||||||||||
| 10/31/166,13 | 15.52 | .12 | .28 | .40 | (.14 | ) | (.60 | ) | (.74 | ) | 15.18 | 2.73 | 8 | — | 10 | .26 | 14 | .25 | 14 | .69 | 14 | .89 | 14 | |||||||||||||||||||||||||||||||||
| Class R-5: | ||||||||||||||||||||||||||||||||||||||||||||||||||||||||
| 10/31/16 | 15.53 | .13 | .41 | .54 | (.14 | ) | (.60 | ) | (.74 | ) | 15.33 | 3.62 | 10 | .10 | .08 | .52 | .85 | |||||||||||||||||||||||||||||||||||||||
| 10/31/15 | 15.42 | .10 | .47 | .57 | (.10 | ) | (.36 | ) | (.46 | ) | 15.53 | 3.76 | 5 | .17 | .07 | .50 | .66 | |||||||||||||||||||||||||||||||||||||||
| 10/31/14 | 14.06 | .15 | 1.35 | 1.50 | (.10 | ) | (.04 | ) | (.14 | ) | 15.42 | 10.72 | 1 | .20 | .10 | .53 | 1.03 | |||||||||||||||||||||||||||||||||||||||
| 10/31/13 | 11.03 | .14 | 3.01 | 3.15 | (.12 | ) | — | (.12 | ) | 14.06 | 28.84 | 20 | .20 | .10 | .54 | 1.12 | ||||||||||||||||||||||||||||||||||||||||
| 10/31/126,7 | 10.00 | .03 | 1.00 | 1.03 | — | — | — | 11.03 | 10.30 | 8 | 9 | .09 | 8 | .04 | 8 | .49 | 8 | .24 | 8 | |||||||||||||||||||||||||||||||||||||
| Class R-6: | ||||||||||||||||||||||||||||||||||||||||||||||||||||||||
| 10/31/16 | 15.50 | .16 | .39 | .55 | (.15 | ) | (.60 | ) | (.75 | ) | 15.30 | 3.66 | 41 | .05 | .03 | .47 | 1.05 | |||||||||||||||||||||||||||||||||||||||
| 10/31/15 | 15.43 | .16 | .42 | .58 | (.15 | ) | (.36 | ) | (.51 | ) | 15.50 | 3.83 | 46 | .13 | .03 | .46 | 1.00 | |||||||||||||||||||||||||||||||||||||||
| 10/31/14 | 14.07 | .09 | 1.41 | 1.50 | (.10 | ) | (.04 | ) | (.14 | ) | 15.43 | 10.75 | 36 | .13 | .03 | .46 | .59 | |||||||||||||||||||||||||||||||||||||||
| 10/31/13 | 11.03 | .07 | 3.08 | 3.15 | (.11 | ) | — | (.11 | ) | 14.07 | 28.84 | 4 | .15 | .05 | .49 | .52 | ||||||||||||||||||||||||||||||||||||||||
| 10/31/126,7 | 10.00 | .05 | .98 | 1.03 | — | — | — | 11.03 | 10.30 | 8 | — | 10 | .12 | 8 | .07 | 8 | .52 | 8 | .46 | 8 | ||||||||||||||||||||||||||||||||||||
See page 62 for footnotes.
| American Funds Portfolio Series | 51 |
Financial highlights (continued)
Growth and Income Portfolio
| Income (loss) from investment operations1 | Dividends and distributions | Ratio of | Ratio of | |||||||||||||||||||||||||||||||||||||||||||||||||||||
| Period ended | Net asset value, beginning of period | Net investment income | Net gains (losses) on securities (both realized and unrealized) | Total from investment operations | Dividends (from net investment income) | Distri- butions (from capital gains) | Total dividends and distributions | Net asset value, end of period | Total return2,3 | Net assets, end of period (in millions) | expenses to average net assets before waivers/ reimburse- ments4 | expenses to average net assets after waivers/ reimburse- ments3,4 | Net effective expense ratio3,5 | Ratio of net income to average net assets3 | ||||||||||||||||||||||||||||||||||||||||||
| Class A: | ||||||||||||||||||||||||||||||||||||||||||||||||||||||||
| 10/31/16 | $ | 13.44 | $ | .26 | $ | .25 | $ | .51 | $ | (.24 | ) | $ | (.35 | ) | $ | (.59 | ) | $ | 13.36 | 3.98 | % | $ | 3,924 | .35 | % | .34 | % | .71 | % | 2.02 | % | |||||||||||||||||||||||||
| 10/31/15 | 13.80 | .26 | (.17 | ) | .09 | (.27 | ) | (.18 | ) | (.45 | ) | 13.44 | .70 | 3,363 | .42 | .32 | .69 | 1.95 | ||||||||||||||||||||||||||||||||||||||
| 10/31/14 | 12.74 | .28 | 1.08 | 1.36 | (.29 | ) | (.01 | ) | (.30 | ) | 13.80 | 10.77 | 2,564 | .42 | .32 | .69 | 2.08 | |||||||||||||||||||||||||||||||||||||||
| 10/31/13 | 10.88 | .26 | 1.88 | 2.14 | (.28 | ) | — | (.28 | ) | 12.74 | 20.01 | 1,394 | .43 | .33 | .70 | 2.19 | ||||||||||||||||||||||||||||||||||||||||
| 10/31/126,7 | 10.00 | .09 | .87 | .96 | (.08 | ) | — | (.08 | ) | 10.88 | 9.63 | 8 | 300 | .23 | 8 | .18 | 8 | .56 | 8 | .89 | 8 | |||||||||||||||||||||||||||||||||||
| Class B: | ||||||||||||||||||||||||||||||||||||||||||||||||||||||||
| 10/31/16 | 13.42 | .17 | .22 | .39 | (.11 | ) | (.35 | ) | (.46 | ) | 13.35 | 3.05 | 2 | 1.16 | 1.14 | 1.51 | 1.27 | |||||||||||||||||||||||||||||||||||||||
| 10/31/15 | 13.77 | .17 | (.19 | ) | (.02 | ) | (.15 | ) | (.18 | ) | (.33 | ) | 13.42 | (.10 | ) | 6 | 1.22 | 1.12 | 1.49 | 1.25 | ||||||||||||||||||||||||||||||||||||
| 10/31/14 | 12.71 | .18 | 1.06 | 1.24 | (.17 | ) | (.01 | ) | (.18 | ) | 13.77 | 9.88 | 10 | 1.23 | 1.13 | 1.50 | 1.33 | |||||||||||||||||||||||||||||||||||||||
| 10/31/13 | 10.86 | .17 | 1.88 | 2.05 | (.20 | ) | — | (.20 | ) | 12.71 | 19.08 | 10 | 1.25 | 1.15 | 1.52 | 1.47 | ||||||||||||||||||||||||||||||||||||||||
| 10/31/126,7 | 10.00 | .06 | .87 | .93 | (.07 | ) | — | (.07 | ) | 10.86 | 9.30 | 8 | 4 | .55 | 8 | .50 | 8 | .88 | 8 | .59 | 8 | |||||||||||||||||||||||||||||||||||
| Class C: | ||||||||||||||||||||||||||||||||||||||||||||||||||||||||
| 10/31/16 | 13.37 | .16 | .25 | .41 | (.15 | ) | (.35 | ) | (.50 | ) | 13.28 | 3.16 | 923 | 1.13 | 1.12 | 1.49 | 1.23 | |||||||||||||||||||||||||||||||||||||||
| 10/31/15 | 13.74 | .15 | (.17 | ) | (.02 | ) | (.17 | ) | (.18 | ) | (.35 | ) | 13.37 | (.12 | ) | 737 | 1.21 | 1.11 | 1.48 | 1.14 | ||||||||||||||||||||||||||||||||||||
| 10/31/14 | 12.69 | .17 | 1.08 | 1.25 | (.19 | ) | (.01 | ) | (.20 | ) | 13.74 | 9.93 | 491 | 1.22 | 1.12 | 1.49 | 1.27 | |||||||||||||||||||||||||||||||||||||||
| 10/31/13 | 10.86 | .16 | 1.88 | 2.04 | (.21 | ) | — | (.21 | ) | 12.69 | 19.03 | 237 | 1.22 | 1.12 | 1.49 | 1.36 | ||||||||||||||||||||||||||||||||||||||||
| 10/31/126,7 | 10.00 | .06 | .87 | .93 | (.07 | ) | — | (.07 | ) | 10.86 | 9.30 | 8 | 40 | .54 | 8 | .50 | 8 | .88 | 8 | .53 | 8 | |||||||||||||||||||||||||||||||||||
| Class F-1: | ||||||||||||||||||||||||||||||||||||||||||||||||||||||||
| 10/31/16 | 13.44 | .26 | .24 | .50 | (.24 | ) | (.35 | ) | (.59 | ) | 13.35 | 3.86 | 111 | .40 | .39 | .76 | 1.96 | |||||||||||||||||||||||||||||||||||||||
| 10/31/15 | 13.80 | .26 | (.18 | ) | .08 | (.26 | ) | (.18 | ) | (.44 | ) | 13.44 | .64 | 84 | .48 | .38 | .75 | 1.90 | ||||||||||||||||||||||||||||||||||||||
| 10/31/14 | 12.74 | .27 | 1.08 | 1.35 | (.28 | ) | (.01 | ) | (.29 | ) | 13.80 | 10.70 | 63 | .49 | .39 | .76 | 2.00 | |||||||||||||||||||||||||||||||||||||||
| 10/31/13 | 10.88 | .26 | 1.88 | 2.14 | (.28 | ) | — | (.28 | ) | 12.74 | 19.98 | 33 | .49 | .39 | .76 | 2.16 | ||||||||||||||||||||||||||||||||||||||||
| 10/31/126,7 | 10.00 | .08 | .88 | .96 | (.08 | ) | — | (.08 | ) | 10.88 | 9.66 | 8 | 7 | .20 | 8 | .15 | 8 | .53 | 8 | .79 | 8 | |||||||||||||||||||||||||||||||||||
| Class F-2: | ||||||||||||||||||||||||||||||||||||||||||||||||||||||||
| 10/31/16 | 13.46 | .29 | .24 | .53 | (.27 | ) | (.35 | ) | (.62 | ) | 13.37 | 4.11 | 203 | .14 | .13 | .50 | 2.20 | |||||||||||||||||||||||||||||||||||||||
| 10/31/15 | 13.82 | .28 | (.16 | ) | .12 | (.30 | ) | (.18 | ) | (.48 | ) | 13.46 | .88 | 125 | .23 | .13 | .50 | 2.08 | ||||||||||||||||||||||||||||||||||||||
| 10/31/14 | 12.75 | .30 | 1.09 | 1.39 | (.31 | ) | (.01 | ) | (.32 | ) | 13.82 | 11.03 | 73 | .23 | .13 | .50 | 2.27 | |||||||||||||||||||||||||||||||||||||||
| 10/31/13 | 10.89 | .28 | 1.88 | 2.16 | (.30 | ) | — | (.30 | ) | 12.75 | 20.22 | 33 | .24 | .14 | .51 | 2.31 | ||||||||||||||||||||||||||||||||||||||||
| 10/31/126,7 | 10.00 | .11 | .87 | .98 | (.09 | ) | — | (.09 | ) | 10.89 | 9.81 | 8 | 4 | .09 | 8 | .04 | 8 | .42 | 8 | 1.06 | 8 | |||||||||||||||||||||||||||||||||||
| Class 529-A: | ||||||||||||||||||||||||||||||||||||||||||||||||||||||||
| 10/31/16 | 13.44 | .25 | .24 | .49 | (.23 | ) | (.35 | ) | (.58 | ) | 13.35 | 3.81 | 329 | .44 | .43 | .80 | 1.92 | |||||||||||||||||||||||||||||||||||||||
| 10/31/15 | 13.80 | .25 | (.17 | ) | .08 | (.26 | ) | (.18 | ) | (.44 | ) | 13.44 | .61 | 276 | .51 | .41 | .78 | 1.87 | ||||||||||||||||||||||||||||||||||||||
| 10/31/14 | 12.74 | .27 | 1.07 | 1.34 | (.27 | ) | (.01 | ) | (.28 | ) | 13.80 | 10.67 | 221 | .51 | .41 | .78 | 2.00 | |||||||||||||||||||||||||||||||||||||||
| 10/31/13 | 10.88 | .26 | 1.88 | 2.14 | (.28 | ) | — | (.28 | ) | 12.74 | 19.95 | 129 | .49 | .39 | .76 | 2.17 | ||||||||||||||||||||||||||||||||||||||||
| 10/31/126,7 | 10.00 | .09 | .87 | .96 | (.08 | ) | — | (.08 | ) | 10.88 | 9.61 | 8 | 36 | .26 | 8 | .22 | 8 | .60 | 8 | .84 | 8 | |||||||||||||||||||||||||||||||||||
| Class 529-B: | ||||||||||||||||||||||||||||||||||||||||||||||||||||||||
| 10/31/16 | 13.42 | .15 | .24 | .39 | (.10 | ) | (.35 | ) | (.45 | ) | 13.36 | 3.01 | — | 10 | 1.24 | 1.22 | 1.59 | 1.16 | ||||||||||||||||||||||||||||||||||||||
| 10/31/15 | 13.77 | .15 | (.18 | ) | (.03 | ) | (.14 | ) | (.18 | ) | (.32 | ) | 13.42 | (.19 | ) | 1 | 1.31 | 1.21 | 1.58 | 1.11 | ||||||||||||||||||||||||||||||||||||
| 10/31/14 | 12.71 | .16 | 1.07 | 1.23 | (.16 | ) | (.01 | ) | (.17 | ) | 13.77 | 9.79 | 2 | 1.32 | 1.22 | 1.59 | 1.21 | |||||||||||||||||||||||||||||||||||||||
| 10/31/13 | 10.86 | .17 | 1.87 | 2.04 | (.19 | ) | — | (.19 | ) | 12.71 | 18.99 | 1 | 1.34 | 1.24 | 1.61 | 1.45 | ||||||||||||||||||||||||||||||||||||||||
| 10/31/126,7 | 10.00 | .06 | .86 | .92 | (.06 | ) | — | (.06 | ) | 10.86 | 9.25 | 8 | 1 | .59 | 8 | .54 | 8 | .92 | 8 | .53 | 8 | |||||||||||||||||||||||||||||||||||
| Class 529-C: | ||||||||||||||||||||||||||||||||||||||||||||||||||||||||
| 10/31/16 | 13.38 | .15 | .24 | .39 | (.13 | ) | (.35 | ) | (.48 | ) | 13.29 | 3.05 | 128 | 1.22 | 1.20 | 1.57 | 1.15 | |||||||||||||||||||||||||||||||||||||||
| 10/31/15 | 13.74 | .15 | (.17 | ) | (.02 | ) | (.16 | ) | (.18 | ) | (.34 | ) | 13.38 | (.15 | ) | 114 | 1.30 | 1.20 | 1.57 | 1.08 | ||||||||||||||||||||||||||||||||||||
| 10/31/14 | 12.69 | .16 | 1.07 | 1.23 | (.17 | ) | (.01 | ) | (.18 | ) | 13.74 | 9.81 | 93 | 1.31 | 1.21 | 1.58 | 1.20 | |||||||||||||||||||||||||||||||||||||||
| 10/31/13 | 10.86 | .16 | 1.86 | 2.02 | (.19 | ) | — | (.19 | ) | 12.69 | 18.86 | 56 | 1.33 | 1.23 | 1.60 | 1.33 | ||||||||||||||||||||||||||||||||||||||||
| 10/31/126,7 | 10.00 | .05 | .88 | .93 | (.07 | ) | — | (.07 | ) | 10.86 | 9.29 | 8 | 15 | .59 | 8 | .54 | 8 | .92 | 8 | .49 | 8 | |||||||||||||||||||||||||||||||||||
| Class 529-E: | ||||||||||||||||||||||||||||||||||||||||||||||||||||||||
| 10/31/16 | 13.41 | .22 | .25 | .47 | (.20 | ) | (.35 | ) | (.55 | ) | 13.33 | 3.67 | 17 | .68 | .66 | 1.03 | 1.71 | |||||||||||||||||||||||||||||||||||||||
| 10/31/15 | 13.78 | .22 | (.18 | ) | .04 | (.23 | ) | (.18 | ) | (.41 | ) | 13.41 | .29 | 14 | .76 | .66 | 1.03 | 1.61 | ||||||||||||||||||||||||||||||||||||||
| 10/31/14 | 12.72 | .23 | 1.08 | 1.31 | (.24 | ) | (.01 | ) | (.25 | ) | 13.78 | 10.42 | 10 | .78 | .68 | 1.05 | 1.74 | |||||||||||||||||||||||||||||||||||||||
| 10/31/13 | 10.87 | .21 | 1.89 | 2.10 | (.25 | ) | — | (.25 | ) | 12.72 | 19.61 | 6 | .79 | .69 | 1.06 | 1.80 | ||||||||||||||||||||||||||||||||||||||||
| 10/31/126,7 | 10.00 | .07 | .88 | .95 | (.08 | ) | — | (.08 | ) | 10.87 | 9.52 | 8 | 1 | .34 | 8 | .30 | 8 | .68 | 8 | .63 | 8 | |||||||||||||||||||||||||||||||||||
| 52 | American Funds Portfolio Series |
Growth and Income Portfolio
| Income (loss) from investment operations1 | Dividends and distributions | Ratio of | Ratio of | |||||||||||||||||||||||||||||||||||||||||||||||||||||
| Period ended | Net asset value, beginning of period | Net investment income | Net gains (losses) on securities (both realized and unrealized) | Total from investment operations | Dividends (from net investment income) | Distri- butions (from capital gains) | Total dividends and distributions | Net asset value, end of period | Total return2,3 | Net assets, end of period (in millions) | expenses to average net assets before waivers/ reimburse- ments4 | expenses to average net assets after waivers/ reimburse- ments3,4 | Net effective expense ratio3,5 | Ratio of net income to average net assets3 | ||||||||||||||||||||||||||||||||||||||||||
| Class 529-F-1: | ||||||||||||||||||||||||||||||||||||||||||||||||||||||||
| 10/31/16 | $ | 13.45 | $ | .28 | $ | .24 | $ | .52 | $ | (.26 | ) | $ | (.35 | ) | $ | (.61 | ) | $ | 13.36 | 4.03 | % | $ | 24 | .21 | % | .20 | % | .57 | % | 2.12 | % | |||||||||||||||||||||||||
| 10/31/15 | 13.81 | .28 | (.17 | ) | .11 | (.29 | ) | (.18 | ) | (.47 | ) | 13.45 | .81 | 19 | .30 | .20 | .57 | 2.09 | ||||||||||||||||||||||||||||||||||||||
| 10/31/14 | 12.75 | .29 | 1.08 | 1.37 | (.30 | ) | (.01 | ) | (.31 | ) | 13.81 | 10.87 | 16 | .30 | .20 | .57 | 2.19 | |||||||||||||||||||||||||||||||||||||||
| 10/31/13 | 10.89 | .29 | 1.87 | 2.16 | (.30 | ) | — | (.30 | ) | 12.75 | 20.14 | 10 | .32 | .22 | .59 | 2.41 | ||||||||||||||||||||||||||||||||||||||||
| 10/31/126,7 | 10.00 | .10 | .87 | .97 | (.08 | ) | — | (.08 | ) | 10.89 | 9.78 | 8 | 1 | .14 | 8 | .09 | 8 | .47 | 8 | .89 | 8 | |||||||||||||||||||||||||||||||||||
| Class R-1: | ||||||||||||||||||||||||||||||||||||||||||||||||||||||||
| 10/31/16 | 13.39 | .16 | .24 | .40 | (.14 | ) | (.35 | ) | (.49 | ) | 13.30 | 3.08 | 6 | 1.15 | 1.13 | 1.50 | 1.23 | |||||||||||||||||||||||||||||||||||||||
| 10/31/15 | 13.75 | .15 | (.17 | ) | (.02 | ) | (.16 | ) | (.18 | ) | (.34 | ) | 13.39 | (.11 | ) | 7 | 1.22 | 1.12 | 1.49 | 1.12 | ||||||||||||||||||||||||||||||||||||
| 10/31/14 | 12.70 | .17 | 1.07 | 1.24 | (.18 | ) | (.01 | ) | (.19 | ) | 13.75 | 9.88 | 7 | 1.23 | 1.13 | 1.50 | 1.28 | |||||||||||||||||||||||||||||||||||||||
| 10/31/13 | 10.86 | .16 | 1.89 | 2.05 | (.21 | ) | — | (.21 | ) | 12.70 | 19.12 | 4 | 1.23 | 1.13 | 1.50 | 1.38 | ||||||||||||||||||||||||||||||||||||||||
| 10/31/126,7 | 10.00 | .08 | .85 | .93 | (.07 | ) | — | (.07 | ) | 10.86 | 9.28 | 8 | 1 | .54 | 8 | .50 | 8 | .88 | 8 | .79 | 8 | |||||||||||||||||||||||||||||||||||
| Class R-2: | ||||||||||||||||||||||||||||||||||||||||||||||||||||||||
| 10/31/16 | 13.37 | .16 | .24 | .40 | (.15 | ) | (.35 | ) | (.50 | ) | 13.27 | 3.08 | 91 | 1.15 | 1.14 | 1.51 | 1.20 | |||||||||||||||||||||||||||||||||||||||
| 10/31/15 | 13.74 | .15 | (.17 | ) | (.02 | ) | (.17 | ) | (.18 | ) | (.35 | ) | 13.37 | (.12 | ) | 63 | 1.24 | 1.14 | 1.51 | 1.09 | ||||||||||||||||||||||||||||||||||||
| 10/31/14 | 12.69 | .16 | 1.08 | 1.24 | (.18 | ) | (.01 | ) | (.19 | ) | 13.74 | 9.89 | 38 | 1.28 | 1.18 | 1.55 | 1.23 | |||||||||||||||||||||||||||||||||||||||
| 10/31/13 | 10.86 | .14 | 1.90 | 2.04 | (.21 | ) | — | (.21 | ) | 12.69 | 19.09 | 18 | 1.24 | 1.14 | 1.51 | 1.21 | ||||||||||||||||||||||||||||||||||||||||
| 10/31/126,7 | 10.00 | .06 | .87 | .93 | (.07 | ) | — | (.07 | ) | 10.86 | 9.38 | 8 | 1 | .48 | 8 | .43 | 8 | .81 | 8 | .52 | 8 | |||||||||||||||||||||||||||||||||||
| Class R-2E: | ||||||||||||||||||||||||||||||||||||||||||||||||||||||||
| 10/31/16 | 13.44 | .16 | .29 | .45 | (.21 | ) | (.35 | ) | (.56 | ) | 13.33 | 3.47 | 4 | .82 | .82 | 1.19 | 1.19 | |||||||||||||||||||||||||||||||||||||||
| 10/31/15 | 13.80 | .28 | (.18 | ) | .10 | (.28 | ) | (.18 | ) | (.46 | ) | 13.44 | .76 | 11 | — | 10 | .36 | 11 | .25 | 11 | .62 | 11 | 2.07 | 11 | ||||||||||||||||||||||||||||||||
| 10/31/146,12 | 13.91 | .06 | (.11 | ) | (.05 | ) | (.06 | ) | — | (.06 | ) | 13.80 | (.34 | )8,11 | — | 10 | .06 | 8,11 | .04 | 8,11 | .41 | 8,11 | .44 | 8,11 | ||||||||||||||||||||||||||||||||
| Class R-3: | ||||||||||||||||||||||||||||||||||||||||||||||||||||||||
| 10/31/16 | 13.41 | .22 | .23 | .45 | (.20 | ) | (.35 | ) | (.55 | ) | 13.31 | 3.51 | 60 | .70 | .69 | 1.06 | 1.66 | |||||||||||||||||||||||||||||||||||||||
| 10/31/15 | 13.77 | .22 | (.17 | ) | .05 | (.23 | ) | (.18 | ) | (.41 | ) | 13.41 | .36 | 41 | .78 | .68 | 1.05 | 1.59 | ||||||||||||||||||||||||||||||||||||||
| 10/31/14 | 12.72 | .22 | 1.08 | 1.30 | (.24 | ) | (.01 | ) | (.25 | ) | 13.77 | 10.31 | 28 | .80 | .70 | 1.07 | 1.68 | |||||||||||||||||||||||||||||||||||||||
| 10/31/13 | 10.87 | .21 | 1.89 | 2.10 | (.25 | ) | — | (.25 | ) | 12.72 | 19.67 | 13 | .80 | .70 | 1.07 | 1.79 | ||||||||||||||||||||||||||||||||||||||||
| 10/31/126,7 | 10.00 | .12 | .83 | .95 | (.08 | ) | — | (.08 | ) | 10.87 | 9.52 | 8 | 1 | .31 | 8 | .27 | 8 | .65 | 8 | 1.09 | 8 | |||||||||||||||||||||||||||||||||||
| Class R-4: | ||||||||||||||||||||||||||||||||||||||||||||||||||||||||
| 10/31/16 | 13.44 | .26 | .24 | .50 | (.24 | ) | (.35 | ) | (.59 | ) | 13.35 | 3.88 | 55 | .39 | .38 | .75 | 1.99 | |||||||||||||||||||||||||||||||||||||||
| 10/31/15 | 13.80 | .22 | (.13 | ) | .09 | (.27 | ) | (.18 | ) | (.45 | ) | 13.44 | .67 | 35 | .46 | .36 | .73 | 1.66 | ||||||||||||||||||||||||||||||||||||||
| 10/31/14 | 12.74 | .27 | 1.08 | 1.35 | (.28 | ) | (.01 | ) | (.29 | ) | 13.80 | 10.75 | 10 | .47 | .37 | .74 | 2.00 | |||||||||||||||||||||||||||||||||||||||
| 10/31/13 | 10.89 | .24 | 1.90 | 2.14 | (.29 | ) | — | (.29 | ) | 12.74 | 19.95 | 2 | .44 | .34 | .71 | 1.97 | ||||||||||||||||||||||||||||||||||||||||
| 10/31/126,7 | 10.00 | .11 | .86 | .97 | (.08 | ) | — | (.08 | ) | 10.89 | 9.78 | 8 | — | 10 | .16 | 8 | .11 | 8 | .49 | 8 | 1.02 | 8 | ||||||||||||||||||||||||||||||||||
| Class R-5E: | ||||||||||||||||||||||||||||||||||||||||||||||||||||||||
| 10/31/166,13 | 13.41 | .28 | .26 | .54 | (.26 | ) | (.35 | ) | (.61 | ) | 13.34 | 4.20 | 8 | — | 10 | .25 | 14 | .24 | 14 | .61 | 14 | 2.28 | 14 | |||||||||||||||||||||||||||||||||
| Class R-5: | ||||||||||||||||||||||||||||||||||||||||||||||||||||||||
| 10/31/16 | 13.48 | .30 | .25 | .55 | (.28 | ) | (.35 | ) | (.63 | ) | 13.40 | 4.23 | 7 | .09 | .08 | .45 | 2.24 | |||||||||||||||||||||||||||||||||||||||
| 10/31/15 | 13.84 | .29 | (.17 | ) | .12 | (.30 | ) | (.18 | ) | (.48 | ) | 13.48 | .94 | 3 | .17 | .07 | .44 | 2.16 | ||||||||||||||||||||||||||||||||||||||
| 10/31/14 | 12.76 | .35 | 1.03 | 1.38 | (.29 | ) | (.01 | ) | (.30 | ) | 13.84 | 10.99 | 1 | .19 | .09 | .46 | 2.65 | |||||||||||||||||||||||||||||||||||||||
| 10/31/13 | 10.89 | .30 | 1.88 | 2.18 | (.31 | ) | — | (.31 | ) | 12.76 | 20.35 | 20 | .18 | .08 | .45 | 2.58 | ||||||||||||||||||||||||||||||||||||||||
| 10/31/126,7 | 10.00 | .10 | .88 | .98 | (.09 | ) | — | (.09 | ) | 10.89 | 9.81 | 8 | 11 | .08 | 8 | .03 | 8 | .41 | 8 | .96 | 8 | |||||||||||||||||||||||||||||||||||
| Class R-6: | ||||||||||||||||||||||||||||||||||||||||||||||||||||||||
| 10/31/16 | 13.46 | .30 | .25 | .55 | (.28 | ) | (.35 | ) | (.63 | ) | 13.38 | 4.28 | 52 | .04 | .02 | .39 | 2.32 | |||||||||||||||||||||||||||||||||||||||
| 10/31/15 | 13.82 | .30 | (.17 | ) | .13 | (.31 | ) | (.18 | ) | (.49 | ) | 13.46 | .98 | 44 | .12 | .02 | .39 | 2.20 | ||||||||||||||||||||||||||||||||||||||
| 10/31/14 | 12.75 | .29 | 1.11 | 1.40 | (.32 | ) | (.01 | ) | (.33 | ) | 13.82 | 11.13 | 32 | .12 | .02 | .39 | 2.14 | |||||||||||||||||||||||||||||||||||||||
| 10/31/13 | 10.89 | .27 | 1.90 | 2.17 | (.31 | ) | — | (.31 | ) | 12.75 | 20.26 | 1 | .14 | .04 | .41 | 2.27 | ||||||||||||||||||||||||||||||||||||||||
| 10/31/126,7 | 10.00 | .11 | .86 | .97 | (.08 | ) | — | (.08 | ) | 10.89 | 9.78 | 8 | — | 10 | .14 | 8 | .10 | 8 | .48 | 8 | 1.02 | 8 | ||||||||||||||||||||||||||||||||||
See page 62 for footnotes.
| American Funds Portfolio Series | 53 |
Financial highlights (continued)
Balanced Portfolio
| Income (loss) from investment operations1 | Dividends and distributions | Ratio of | Ratio of | |||||||||||||||||||||||||||||||||||||||||||||||||||||
| Period ended | Net asset value, beginning of period | Net investment income | Net gains (losses) on securities (both realized and unrealized) | Total from investment operations | Dividends (from net investment income) | Distri- butions (from capital gains) | Total dividends and distributions | Net asset value, end of period | Total return2,3 | Net assets, end of period (in millions) | expenses to average net assets before waivers/ reimburse- ments4 | expenses to average net assets after waivers/ reimburse- ments3,4 | Net effective expense ratio3,5 | Ratio of net income to average net assets3 | ||||||||||||||||||||||||||||||||||||||||||
| Class A: | ||||||||||||||||||||||||||||||||||||||||||||||||||||||||
| 10/31/16 | $ | 13.41 | $ | .21 | $ | .24 | $ | .45 | $ | (.21 | ) | $ | (.27 | ) | $ | (.48 | ) | $ | 13.38 | 3.45 | % | $ | 3,209 | .37 | % | .35 | % | .73 | % | 1.57 | % | |||||||||||||||||||||||||
| 10/31/15 | 13.32 | .20 | .17 | .37 | (.19 | ) | (.09 | ) | (.28 | ) | 13.41 | 2.76 | 2,586 | .42 | .32 | .70 | 1.51 | |||||||||||||||||||||||||||||||||||||||
| 10/31/14 | 12.44 | .22 | .88 | 1.10 | (.22 | ) | — | (.22 | ) | 13.32 | 8.94 | 1,803 | .43 | .33 | .67 | 1.67 | ||||||||||||||||||||||||||||||||||||||||
| 10/31/13 | 10.80 | .21 | 1.64 | 1.85 | (.21 | ) | — | (.21 | ) | 12.44 | 17.29 | 1,010 | .45 | .35 | .69 | 1.76 | ||||||||||||||||||||||||||||||||||||||||
| 10/31/126,7 | 10.00 | .08 | .78 | .86 | (.06 | ) | — | (.06 | ) | 10.80 | 8.62 | 8 | 239 | .23 | 8 | .18 | 8 | .53 | 8 | .73 | 8 | |||||||||||||||||||||||||||||||||||
| Class B: | ||||||||||||||||||||||||||||||||||||||||||||||||||||||||
| 10/31/16 | 13.39 | .11 | .22 | .33 | (.08 | ) | (.27 | ) | (.35 | ) | 13.37 | 2.57 | 2 | 1.17 | 1.14 | 1.52 | .84 | |||||||||||||||||||||||||||||||||||||||
| 10/31/15 | 13.29 | .10 | .16 | .26 | (.07 | ) | (.09 | ) | (.16 | ) | 13.39 | 1.97 | 5 | 1.22 | 1.12 | 1.50 | .77 | |||||||||||||||||||||||||||||||||||||||
| 10/31/14 | 12.41 | .12 | .88 | 1.00 | (.12 | ) | — | (.12 | ) | 13.29 | 8.08 | 7 | 1.23 | 1.13 | 1.47 | .92 | ||||||||||||||||||||||||||||||||||||||||
| 10/31/13 | 10.78 | .12 | 1.63 | 1.75 | (.12 | ) | — | (.12 | ) | 12.41 | 16.38 | 7 | 1.25 | 1.15 | 1.49 | 1.03 | ||||||||||||||||||||||||||||||||||||||||
| 10/31/126,7 | 10.00 | .04 | .79 | .83 | (.05 | ) | — | (.05 | ) | 10.78 | 8.29 | 8 | 3 | .55 | 8 | .50 | 8 | .85 | 8 | .37 | 8 | |||||||||||||||||||||||||||||||||||
| Class C: | ||||||||||||||||||||||||||||||||||||||||||||||||||||||||
| 10/31/16 | 13.34 | .10 | .24 | .34 | (.11 | ) | (.27 | ) | (.38 | ) | 13.30 | 2.65 | 866 | 1.13 | 1.12 | 1.50 | .80 | |||||||||||||||||||||||||||||||||||||||
| 10/31/15 | 13.26 | .09 | .17 | .26 | (.09 | ) | (.09 | ) | (.18 | ) | 13.34 | 1.96 | 658 | 1.21 | 1.11 | 1.49 | .71 | |||||||||||||||||||||||||||||||||||||||
| 10/31/14 | 12.39 | .11 | .89 | 1.00 | (.13 | ) | — | (.13 | ) | 13.26 | 8.11 | 416 | 1.22 | 1.12 | 1.46 | .86 | ||||||||||||||||||||||||||||||||||||||||
| 10/31/13 | 10.78 | .11 | 1.64 | 1.75 | (.14 | ) | — | (.14 | ) | 12.39 | 16.32 | 197 | 1.23 | 1.13 | 1.47 | .96 | ||||||||||||||||||||||||||||||||||||||||
| 10/31/126,7 | 10.00 | .04 | .79 | .83 | (.05 | ) | — | (.05 | ) | 10.78 | 8.30 | 8 | 40 | .54 | 8 | .50 | 8 | .85 | 8 | .37 | 8 | |||||||||||||||||||||||||||||||||||
| Class F-1: | ||||||||||||||||||||||||||||||||||||||||||||||||||||||||
| 10/31/16 | 13.41 | .20 | .24 | .44 | (.20 | ) | (.27 | ) | (.47 | ) | 13.38 | 3.43 | 137 | .40 | .39 | .77 | 1.50 | |||||||||||||||||||||||||||||||||||||||
| 10/31/15 | 13.32 | .19 | .17 | .36 | (.18 | ) | (.09 | ) | (.27 | ) | 13.41 | 2.71 | 85 | .48 | .38 | .76 | 1.46 | |||||||||||||||||||||||||||||||||||||||
| 10/31/14 | 12.43 | .21 | .89 | 1.10 | (.21 | ) | — | (.21 | ) | 13.32 | 8.94 | 62 | .49 | .39 | .73 | 1.63 | ||||||||||||||||||||||||||||||||||||||||
| 10/31/13 | 10.80 | .19 | 1.65 | 1.84 | (.21 | ) | — | (.21 | ) | 12.43 | 17.20 | 40 | .50 | .40 | .74 | 1.61 | ||||||||||||||||||||||||||||||||||||||||
| 10/31/126,7 | 10.00 | .08 | .78 | .86 | (.06 | ) | — | (.06 | ) | 10.80 | 8.64 | 8 | 4 | .19 | 8 | .15 | 8 | .50 | 8 | .79 | 8 | |||||||||||||||||||||||||||||||||||
| Class F-2: | ||||||||||||||||||||||||||||||||||||||||||||||||||||||||
| 10/31/16 | 13.43 | .23 | .25 | .48 | (.24 | ) | (.27 | ) | (.51 | ) | 13.40 | 3.68 | 222 | .14 | .13 | .51 | 1.77 | |||||||||||||||||||||||||||||||||||||||
| 10/31/15 | 13.33 | .23 | .17 | .40 | (.21 | ) | (.09 | ) | (.30 | ) | 13.43 | 3.03 | 104 | .23 | .13 | .51 | 1.69 | |||||||||||||||||||||||||||||||||||||||
| 10/31/14 | 12.45 | .24 | .89 | 1.13 | (.25 | ) | — | (.25 | ) | 13.33 | 9.11 | 64 | .23 | .13 | .47 | 1.84 | ||||||||||||||||||||||||||||||||||||||||
| 10/31/13 | 10.81 | .23 | 1.64 | 1.87 | (.23 | ) | — | (.23 | ) | 12.45 | 17.51 | 29 | .25 | .15 | .49 | 1.96 | ||||||||||||||||||||||||||||||||||||||||
| 10/31/126,7 | 10.00 | .09 | .79 | .88 | (.07 | ) | — | (.07 | ) | 10.81 | 8.80 | 8 | 6 | .09 | 8 | .04 | 8 | .39 | 8 | .88 | 8 | |||||||||||||||||||||||||||||||||||
| Class 529-A: | ||||||||||||||||||||||||||||||||||||||||||||||||||||||||
| 10/31/16 | 13.41 | .20 | .24 | .44 | (.20 | ) | (.27 | ) | (.47 | ) | 13.38 | 3.38 | 213 | .44 | .42 | .80 | 1.50 | |||||||||||||||||||||||||||||||||||||||
| 10/31/15 | 13.32 | .19 | .17 | .36 | (.18 | ) | (.09 | ) | (.27 | ) | 13.41 | 2.66 | 182 | .52 | .42 | .80 | 1.42 | |||||||||||||||||||||||||||||||||||||||
| 10/31/14 | 12.43 | .21 | .89 | 1.10 | (.21 | ) | — | (.21 | ) | 13.32 | 8.92 | 144 | .52 | .42 | .76 | 1.59 | ||||||||||||||||||||||||||||||||||||||||
| 10/31/13 | 10.79 | .21 | 1.63 | 1.84 | (.20 | ) | — | (.20 | ) | 12.43 | 17.27 | 90 | .49 | .39 | .73 | 1.77 | ||||||||||||||||||||||||||||||||||||||||
| 10/31/126,7 | 10.00 | .07 | .78 | .85 | (.06 | ) | — | (.06 | ) | 10.79 | 8.51 | 8 | 34 | .27 | 8 | .23 | 8 | .58 | 8 | .66 | 8 | |||||||||||||||||||||||||||||||||||
| Class 529-B: | ||||||||||||||||||||||||||||||||||||||||||||||||||||||||
| 10/31/16 | 13.39 | .10 | .23 | .33 | (.07 | ) | (.27 | ) | (.34 | ) | 13.38 | 2.55 | — | 10 | 1.25 | 1.23 | 1.61 | .77 | ||||||||||||||||||||||||||||||||||||||
| 10/31/15 | 13.29 | .09 | .16 | .25 | (.06 | ) | (.09 | ) | (.15 | ) | 13.39 | 1.89 | 1 | 1.31 | 1.21 | 1.59 | .66 | |||||||||||||||||||||||||||||||||||||||
| 10/31/14 | 12.41 | .11 | .87 | .98 | (.10 | ) | — | (.10 | ) | 13.29 | 7.96 | 1 | 1.32 | 1.22 | 1.56 | .87 | ||||||||||||||||||||||||||||||||||||||||
| 10/31/13 | 10.78 | .11 | 1.63 | 1.74 | (.11 | ) | — | (.11 | ) | 12.41 | 16.23 | 1 | 1.34 | 1.24 | 1.58 | .91 | ||||||||||||||||||||||||||||||||||||||||
| 10/31/126,7 | 10.00 | .04 | .78 | .82 | (.04 | ) | — | (.04 | ) | 10.78 | 8.25 | 8 | — | 10 | .59 | 8 | .54 | 8 | .89 | 8 | .38 | 8 | ||||||||||||||||||||||||||||||||||
| Class 529-C: | ||||||||||||||||||||||||||||||||||||||||||||||||||||||||
| 10/31/16 | 13.35 | .09 | .24 | .33 | (.09 | ) | (.27 | ) | (.36 | ) | 13.32 | 2.61 | 102 | 1.22 | 1.21 | 1.59 | .72 | |||||||||||||||||||||||||||||||||||||||
| 10/31/15 | 13.27 | .09 | .16 | .25 | (.08 | ) | (.09 | ) | (.17 | ) | 13.35 | 1.84 | 92 | 1.30 | 1.20 | 1.58 | .64 | |||||||||||||||||||||||||||||||||||||||
| 10/31/14 | 12.40 | .10 | .89 | .99 | (.12 | ) | — | (.12 | ) | 13.27 | 7.98 | 75 | 1.31 | 1.21 | 1.55 | .78 | ||||||||||||||||||||||||||||||||||||||||
| 10/31/13 | 10.78 | .11 | 1.63 | 1.74 | (.12 | ) | — | (.12 | ) | 12.40 | 16.26 | 44 | 1.33 | 1.23 | 1.57 | .91 | ||||||||||||||||||||||||||||||||||||||||
| 10/31/126,7 | 10.00 | .04 | .78 | .82 | (.04 | ) | — | (.04 | ) | 10.78 | 8.25 | 8 | 14 | .59 | 8 | .55 | 8 | .90 | 8 | .33 | 8 | |||||||||||||||||||||||||||||||||||
| Class 529-E: | ||||||||||||||||||||||||||||||||||||||||||||||||||||||||
| 10/31/16 | 13.39 | .17 | .24 | .41 | (.17 | ) | (.27 | ) | (.44 | ) | 13.36 | 3.16 | 9 | .67 | .66 | 1.04 | 1.26 | |||||||||||||||||||||||||||||||||||||||
| 10/31/15 | 13.30 | .16 | .17 | .33 | (.15 | ) | (.09 | ) | (.24 | ) | 13.39 | 2.43 | 7 | .77 | .67 | 1.05 | 1.16 | |||||||||||||||||||||||||||||||||||||||
| 10/31/14 | 12.42 | .17 | .89 | 1.06 | (.18 | ) | — | (.18 | ) | 13.30 | 8.56 | 5 | .78 | .68 | 1.02 | 1.31 | ||||||||||||||||||||||||||||||||||||||||
| 10/31/13 | 10.79 | .17 | 1.63 | 1.80 | (.17 | ) | — | (.17 | ) | 12.42 | 16.89 | 3 | .80 | .70 | 1.04 | 1.44 | ||||||||||||||||||||||||||||||||||||||||
| 10/31/126,7 | 10.00 | .06 | .79 | .85 | (.06 | ) | — | (.06 | ) | 10.79 | 8.49 | 8 | 1 | .35 | 8 | .30 | 8 | .65 | 8 | .61 | 8 | |||||||||||||||||||||||||||||||||||
| 54 | American Funds Portfolio Series |
Balanced Portfolio
| Income (loss) from investment operations1 | Dividends and distributions | Ratio of | Ratio of | |||||||||||||||||||||||||||||||||||||||||||||||||||||
| Period ended | Net asset value, beginning of period | Net investment income | Net gains (losses) on securities (both realized and unrealized) | Total from investment operations | Dividends (from net investment income) | Distri- butions (from capital gains) | Total dividends and distributions | Net asset value, end of period | Total return2,3 | Net assets, end of period (in millions) | expenses to average net assets before waivers/ reimburse- ments4 | expenses to average net assets after waivers/ reimburse- ments3,4 | Net effective expense ratio3,5 | Ratio of net income to average net assets3 | ||||||||||||||||||||||||||||||||||||||||||
| Class 529-F-1: | ||||||||||||||||||||||||||||||||||||||||||||||||||||||||
| 10/31/16 | $ | 13.42 | $ | .23 | $ | .23 | $ | .46 | $ | (.22 | ) | $ | (.27 | ) | $ | (.49 | ) | $ | 13.39 | 3.60 | % | $ | 22 | .22 | % | .20 | % | .58 | % | 1.71 | % | |||||||||||||||||||||||||
| 10/31/15 | 13.33 | .22 | .16 | .38 | (.20 | ) | (.09 | ) | (.29 | ) | 13.42 | 2.89 | 17 | .30 | .20 | .58 | 1.64 | |||||||||||||||||||||||||||||||||||||||
| 10/31/14 | 12.44 | .24 | .89 | 1.13 | (.24 | ) | — | (.24 | ) | 13.33 | 9.12 | 12 | .30 | .20 | .54 | 1.83 | ||||||||||||||||||||||||||||||||||||||||
| 10/31/13 | 10.80 | .24 | 1.62 | 1.86 | (.22 | ) | — | (.22 | ) | 12.44 | 17.45 | 9 | .32 | .22 | .56 | 2.03 | ||||||||||||||||||||||||||||||||||||||||
| 10/31/126,7 | 10.00 | .09 | .77 | .86 | (.06 | ) | — | (.06 | ) | 10.80 | 8.67 | 8 | 1 | .14 | 8 | .09 | 8 | .44 | 8 | .85 | 8 | |||||||||||||||||||||||||||||||||||
| Class R-1: | ||||||||||||||||||||||||||||||||||||||||||||||||||||||||
| 10/31/16 | 13.36 | .10 | .24 | .34 | (.10 | ) | (.27 | ) | (.37 | ) | 13.33 | 2.66 | 10 | 1.15 | 1.13 | 1.51 | .78 | |||||||||||||||||||||||||||||||||||||||
| 10/31/15 | 13.27 | .09 | .18 | .27 | (.09 | ) | (.09 | ) | (.18 | ) | 13.36 | 1.99 | 9 | 1.22 | 1.12 | 1.50 | .70 | |||||||||||||||||||||||||||||||||||||||
| 10/31/14 | 12.40 | .12 | .87 | .99 | (.12 | ) | — | (.12 | ) | 13.27 | 8.06 | 7 | 1.23 | 1.13 | 1.47 | .89 | ||||||||||||||||||||||||||||||||||||||||
| 10/31/13 | 10.78 | .11 | 1.64 | 1.75 | (.13 | ) | — | (.13 | ) | 12.40 | 16.40 | 4 | 1.24 | 1.14 | 1.48 | .95 | ||||||||||||||||||||||||||||||||||||||||
| 10/31/126,7 | 10.00 | .04 | .79 | .83 | (.05 | ) | — | (.05 | ) | 10.78 | 8.32 | 8 | 1 | .55 | 8 | .50 | 8 | .85 | 8 | .36 | 8 | |||||||||||||||||||||||||||||||||||
| Class R-2: | ||||||||||||||||||||||||||||||||||||||||||||||||||||||||
| 10/31/16 | 13.35 | .10 | .24 | .34 | (.11 | ) | (.27 | ) | (.38 | ) | 13.31 | 2.63 | 75 | 1.16 | 1.14 | 1.52 | .76 | |||||||||||||||||||||||||||||||||||||||
| 10/31/15 | 13.27 | .09 | .17 | .26 | (.09 | ) | (.09 | ) | (.18 | ) | 13.35 | 1.92 | 54 | 1.24 | 1.14 | 1.52 | .67 | |||||||||||||||||||||||||||||||||||||||
| 10/31/14 | 12.40 | .10 | .89 | .99 | (.12 | ) | — | (.12 | ) | 13.27 | 8.04 | 36 | 1.28 | 1.18 | 1.52 | .79 | ||||||||||||||||||||||||||||||||||||||||
| 10/31/13 | 10.79 | .11 | 1.64 | 1.75 | (.14 | ) | — | (.14 | ) | 12.40 | 16.33 | 15 | 1.25 | 1.15 | 1.49 | .90 | ||||||||||||||||||||||||||||||||||||||||
| 10/31/126,7 | 10.00 | .04 | .81 | .85 | (.06 | ) | — | (.06 | ) | 10.79 | 8.50 | 8 | 3 | .48 | 8 | .44 | 8 | .79 | 8 | .40 | 8 | |||||||||||||||||||||||||||||||||||
| Class R-2E: | ||||||||||||||||||||||||||||||||||||||||||||||||||||||||
| 10/31/16 | 13.40 | .09 | .31 | .40 | (.17 | ) | �� | (.27 | ) | (.44 | ) | 13.36 | 3.09 | 3 | .82 | .82 | 1.20 | .73 | ||||||||||||||||||||||||||||||||||||||
| 10/31/15 | 13.31 | .22 | .16 | .38 | (.20 | ) | (.09 | ) | (.29 | ) | 13.40 | 2.82 | 11 | — | 10 | .35 | 11 | .25 | 11 | .63 | 11 | 1.61 | 11 | |||||||||||||||||||||||||||||||||
| 10/31/146,12 | 13.37 | .04 | (.05 | ) | (.01 | ) | (.05 | ) | — | (.05 | ) | 13.31 | (.10 | )8,11 | — | 10 | .06 | 8,11 | .04 | 8,11 | .38 | 8,11 | .31 | 8,11 | ||||||||||||||||||||||||||||||||
| Class R-3: | ||||||||||||||||||||||||||||||||||||||||||||||||||||||||
| 10/31/16 | 13.38 | .16 | .24 | .40 | (.16 | ) | (.27 | ) | (.43 | ) | 13.35 | 3.13 | 80 | .71 | .69 | 1.07 | 1.24 | |||||||||||||||||||||||||||||||||||||||
| 10/31/15 | 13.30 | .15 | .17 | .32 | (.15 | ) | (.09 | ) | (.24 | ) | 13.38 | 2.38 | 63 | .78 | .68 | 1.06 | 1.15 | |||||||||||||||||||||||||||||||||||||||
| 10/31/14 | 12.42 | .16 | .90 | 1.06 | (.18 | ) | — | (.18 | ) | 13.30 | 8.56 | 35 | .81 | .71 | 1.05 | 1.27 | ||||||||||||||||||||||||||||||||||||||||
| 10/31/13 | 10.79 | .16 | 1.64 | 1.80 | (.17 | ) | — | (.17 | ) | 12.42 | 16.86 | 18 | .80 | .70 | 1.04 | 1.36 | ||||||||||||||||||||||||||||||||||||||||
| 10/31/126,7 | 10.00 | .10 | .75 | .85 | (.06 | ) | — | (.06 | ) | 10.79 | 8.53 | 8 | 5 | .31 | 8 | .26 | 8 | .61 | 8 | .89 | 8 | |||||||||||||||||||||||||||||||||||
| Class R-4: | ||||||||||||||||||||||||||||||||||||||||||||||||||||||||
| 10/31/16 | 13.41 | .21 | .23 | .44 | (.20 | ) | (.27 | ) | (.47 | ) | 13.38 | 3.43 | 55 | .40 | .38 | .76 | 1.62 | |||||||||||||||||||||||||||||||||||||||
| 10/31/15 | 13.32 | .19 | .17 | .36 | (.18 | ) | (.09 | ) | (.27 | ) | 13.41 | 2.72 | 53 | .46 | .36 | .74 | 1.45 | |||||||||||||||||||||||||||||||||||||||
| 10/31/14 | 12.44 | .21 | .89 | 1.10 | (.22 | ) | — | (.22 | ) | 13.32 | 8.88 | 40 | .47 | .37 | .71 | 1.61 | ||||||||||||||||||||||||||||||||||||||||
| 10/31/13 | 10.80 | .20 | 1.65 | 1.85 | (.21 | ) | — | (.21 | ) | 12.44 | 17.33 | 24 | .43 | .33 | .67 | 1.71 | ||||||||||||||||||||||||||||||||||||||||
| 10/31/126,7 | 10.00 | .10 | .76 | .86 | (.06 | ) | — | (.06 | ) | 10.80 | 8.61 | 8 | 1 | .20 | 8 | .15 | 8 | .50 | 8 | .92 | 8 | |||||||||||||||||||||||||||||||||||
| Class R-5E: | ||||||||||||||||||||||||||||||||||||||||||||||||||||||||
| 10/31/166,13 | 13.44 | .20 | .23 | .43 | (.22 | ) | (.27 | ) | (.49 | ) | 13.38 | 3.38 | 8 | — | 10 | .26 | 14 | .25 | 14 | .63 | 14 | 1.60 | 14 | |||||||||||||||||||||||||||||||||
| Class R-5: | ||||||||||||||||||||||||||||||||||||||||||||||||||||||||
| 10/31/16 | 13.43 | .24 | .25 | .49 | (.24 | ) | (.27 | ) | (.51 | ) | 13.41 | 3.79 | 12 | .10 | .08 | .46 | 1.85 | |||||||||||||||||||||||||||||||||||||||
| 10/31/15 | 13.34 | .24 | .16 | .40 | (.22 | ) | (.09 | ) | (.31 | ) | 13.43 | 3.00 | 11 | .17 | .07 | .45 | 1.78 | |||||||||||||||||||||||||||||||||||||||
| 10/31/14 | 12.45 | .27 | .87 | 1.14 | (.25 | ) | — | (.25 | ) | 13.34 | 9.24 | 9 | .19 | .09 | .43 | 2.06 | ||||||||||||||||||||||||||||||||||||||||
| 10/31/13 | 10.81 | .24 | 1.63 | 1.87 | (.23 | ) | — | (.23 | ) | 12.45 | 17.56 | 15 | .18 | .08 | .42 | 2.06 | ||||||||||||||||||||||||||||||||||||||||
| 10/31/126,7 | 10.00 | .09 | .79 | .88 | (.07 | ) | — | (.07 | ) | 10.81 | 8.80 | 8 | 7 | .08 | 8 | .03 | 8 | .38 | 8 | .83 | 8 | |||||||||||||||||||||||||||||||||||
| Class R-6: | ||||||||||||||||||||||||||||||||||||||||||||||||||||||||
| 10/31/16 | 13.43 | .24 | .25 | .49 | (.25 | ) | (.27 | ) | (.52 | ) | 13.40 | 3.77 | 138 | .04 | .02 | .40 | 1.81 | |||||||||||||||||||||||||||||||||||||||
| 10/31/15 | 13.34 | .24 | .17 | .41 | (.23 | ) | (.09 | ) | (.32 | ) | 13.43 | 3.05 | 73 | .12 | .02 | .40 | 1.77 | |||||||||||||||||||||||||||||||||||||||
| 10/31/14 | 12.45 | .25 | .90 | 1.15 | (.26 | ) | — | (.26 | ) | 13.34 | 9.29 | 39 | .13 | .03 | .37 | 1.89 | ||||||||||||||||||||||||||||||||||||||||
| 10/31/13 | 10.81 | .24 | 1.64 | 1.88 | (.24 | ) | — | (.24 | ) | 12.45 | 17.57 | 10 | .14 | .04 | .38 | 2.01 | ||||||||||||||||||||||||||||||||||||||||
| 10/31/126,7 | 10.00 | .10 | .77 | .87 | (.06 | ) | — | (.06 | ) | 10.81 | 8.77 | 8 | — | 10 | .13 | 8 | .08 | 8 | .43 | 8 | .93 | 8 | ||||||||||||||||||||||||||||||||||
See page 62 for footnotes.
| American Funds Portfolio Series | 55 |
Financial highlights (continued)
Income Portfolio
| Income (loss) from investment operations1 | Dividends and distributions | Ratio of | Ratio of | |||||||||||||||||||||||||||||||||||||||||||||||||||||
| Period ended | Net asset value, beginning of period | Net investment income | Net gains (losses) on securities (both realized and unrealized) | Total from investment operations | Dividends (from net investment income) | Distri- butions (from capital gains) | Total dividends and distributions | Net asset value, end of period | Total return2,3 | Net assets, end of period (in millions) | expenses to average net assets before waivers/ reimburse- ments4 | expenses to average net assets after waivers/ reimburse- ments3,4 | Net effective expense ratio3,5 | Ratio of net income to average net assets3 | ||||||||||||||||||||||||||||||||||||||||||
| Class A: | ||||||||||||||||||||||||||||||||||||||||||||||||||||||||
| 10/31/16 | $ | 11.55 | $ | .36 | $ | .24 | $ | .60 | $ | (.40 | ) | $ | (.05 | ) | $ | (.45 | ) | $ | 11.70 | 5.30 | % | $ | 2,655 | .36 | % | .35 | % | .65 | % | 3.13 | % | |||||||||||||||||||||||||
| 10/31/15 | 11.98 | .40 | (.42 | ) | (.02 | ) | (.37 | ) | (.04 | ) | (.41 | ) | 11.55 | (.18 | ) | 2,265 | .44 | .34 | .64 | 3.35 | ||||||||||||||||||||||||||||||||||||
| 10/31/14 | 11.46 | .37 | .53 | .90 | (.37 | ) | (.01 | ) | (.38 | ) | 11.98 | 7.94 | 1,766 | .45 | .35 | .66 | 3.18 | |||||||||||||||||||||||||||||||||||||||
| 10/31/13 | 10.57 | .36 | .90 | 1.26 | (.37 | ) | — | (.37 | ) | 11.46 | 12.19 | 1,067 | .48 | .38 | .68 | 3.28 | ||||||||||||||||||||||||||||||||||||||||
| 10/31/126,7 | 10.00 | .16 | .52 | .68 | (.11 | ) | — | (.11 | ) | 10.57 | 6.84 | 8 | 307 | .23 | 8 | .18 | 8 | .49 | 8 | 1.54 | 8 | |||||||||||||||||||||||||||||||||||
| Class B: | ||||||||||||||||||||||||||||||||||||||||||||||||||||||||
| 10/31/16 | 11.53 | .26 | .25 | .51 | (.28 | ) | (.05 | ) | (.33 | ) | 11.71 | 4.50 | 1 | 1.17 | 1.14 | 1.44 | 2.28 | |||||||||||||||||||||||||||||||||||||||
| 10/31/15 | 11.96 | .31 | (.43 | ) | (.12 | ) | (.27 | ) | (.04 | ) | (.31 | ) | 11.53 | (1.02 | ) | 4 | 1.22 | 1.12 | 1.42 | 2.59 | ||||||||||||||||||||||||||||||||||||
| 10/31/14 | 11.43 | .28 | .53 | .81 | (.27 | ) | (.01 | ) | (.28 | ) | 11.96 | 7.17 | 6 | 1.23 | 1.13 | 1.44 | 2.40 | |||||||||||||||||||||||||||||||||||||||
| 10/31/13 | 10.55 | .28 | .90 | 1.18 | (.30 | ) | — | (.30 | ) | 11.43 | 11.35 | 6 | 1.25 | 1.15 | 1.45 | 2.51 | ||||||||||||||||||||||||||||||||||||||||
| 10/31/126,7 | 10.00 | .13 | .51 | .64 | (.09 | ) | — | (.09 | ) | 10.55 | 6.47 | 8 | 2 | .55 | 8 | .50 | 8 | .81 | 8 | 1.26 | 8 | |||||||||||||||||||||||||||||||||||
| Class C: | ||||||||||||||||||||||||||||||||||||||||||||||||||||||||
| 10/31/16 | 11.49 | .27 | .24 | .51 | (.31 | ) | (.05 | ) | (.36 | ) | 11.64 | 4.55 | 627 | 1.14 | 1.12 | 1.42 | 2.35 | |||||||||||||||||||||||||||||||||||||||
| 10/31/15 | 11.93 | .30 | (.41 | ) | (.11 | ) | (.29 | ) | (.04 | ) | (.33 | ) | 11.49 | (.98 | ) | 529 | 1.21 | 1.11 | 1.41 | 2.57 | ||||||||||||||||||||||||||||||||||||
| 10/31/14 | 11.41 | .28 | .54 | .82 | (.29 | ) | (.01 | ) | (.30 | ) | 11.93 | 7.19 | 381 | 1.22 | 1.12 | 1.43 | 2.41 | |||||||||||||||||||||||||||||||||||||||
| 10/31/13 | 10.54 | .28 | .90 | 1.18 | (.31 | ) | — | (.31 | ) | 11.41 | 11.35 | 214 | 1.23 | 1.13 | 1.43 | 2.51 | ||||||||||||||||||||||||||||||||||||||||
| 10/31/126,7 | 10.00 | .12 | .52 | .64 | (.10 | ) | — | (.10 | ) | 10.54 | 6.41 | 8 | 58 | .54 | 8 | .50 | 8 | .81 | 8 | 1.20 | 8 | |||||||||||||||||||||||||||||||||||
| Class F-1: | ||||||||||||||||||||||||||||||||||||||||||||||||||||||||
| 10/31/16 | 11.55 | .36 | .23 | .59 | (.39 | ) | (.05 | ) | (.44 | ) | 11.70 | 5.26 | 83 | .41 | .39 | .69 | 3.09 | |||||||||||||||||||||||||||||||||||||||
| 10/31/15 | 11.99 | .39 | (.42 | ) | (.03 | ) | (.37 | ) | (.04 | ) | (.41 | ) | 11.55 | (.30 | ) | 72 | .48 | .38 | .68 | 3.32 | ||||||||||||||||||||||||||||||||||||
| 10/31/14 | 11.46 | .37 | .53 | .90 | (.36 | ) | (.01 | ) | (.37 | ) | 11.99 | 7.97 | 62 | .49 | .39 | .70 | 3.15 | |||||||||||||||||||||||||||||||||||||||
| 10/31/13 | 10.57 | .37 | .89 | 1.26 | (.37 | ) | — | (.37 | ) | 11.46 | 12.17 | 42 | .51 | .41 | .71 | 3.31 | ||||||||||||||||||||||||||||||||||||||||
| 10/31/126,7 | 10.00 | .16 | .52 | .68 | (.11 | ) | — | (.11 | ) | 10.57 | 6.85 | 8 | 18 | .20 | 8 | .16 | 8 | .47 | 8 | 1.50 | 8 | |||||||||||||||||||||||||||||||||||
| Class F-2: | ||||||||||||||||||||||||||||||||||||||||||||||||||||||||
| 10/31/16 | 11.56 | .40 | .22 | .62 | (.42 | ) | (.05 | ) | (.47 | ) | 11.71 | 5.54 | 174 | .14 | .13 | .43 | 3.45 | |||||||||||||||||||||||||||||||||||||||
| 10/31/15 | 12.00 | .42 | (.42 | ) | — | (.40 | ) | (.04 | ) | (.44 | ) | 11.56 | (.06 | ) | 77 | .24 | .14 | .44 | 3.56 | |||||||||||||||||||||||||||||||||||||
| 10/31/14 | 11.46 | .40 | .54 | .94 | (.39 | ) | (.01 | ) | (.40 | ) | 12.00 | 8.32 | 59 | .23 | .13 | .44 | 3.39 | |||||||||||||||||||||||||||||||||||||||
| 10/31/13 | 10.57 | .39 | .90 | 1.29 | (.40 | ) | — | (.40 | ) | 11.46 | 12.44 | 36 | .25 | .15 | .45 | 3.50 | ||||||||||||||||||||||||||||||||||||||||
| 10/31/126,7 | 10.00 | .17 | .52 | .69 | (.12 | ) | — | (.12 | ) | 10.57 | 6.90 | 8 | 10 | .09 | 8 | .04 | 8 | .35 | 8 | 1.61 | 8 | |||||||||||||||||||||||||||||||||||
| Class 529-A: | ||||||||||||||||||||||||||||||||||||||||||||||||||||||||
| 10/31/16 | 11.54 | .35 | .23 | .58 | (.38 | ) | (.05 | ) | (.43 | ) | 11.69 | 5.21 | 81 | .44 | .43 | .73 | 3.05 | |||||||||||||||||||||||||||||||||||||||
| 10/31/15 | 11.98 | .38 | (.42 | ) | (.04 | ) | (.36 | ) | (.04 | ) | (.40 | ) | 11.54 | (.35 | ) | 71 | .55 | .45 | .75 | 3.25 | ||||||||||||||||||||||||||||||||||||
| 10/31/14 | 11.45 | .36 | .54 | .90 | (.36 | ) | (.01 | ) | (.37 | ) | 11.98 | 7.94 | 62 | .53 | .43 | .74 | 3.11 | |||||||||||||||||||||||||||||||||||||||
| 10/31/13 | 10.56 | .35 | .91 | 1.26 | (.37 | ) | — | (.37 | ) | 11.45 | 12.14 | 39 | .55 | .45 | .75 | 3.20 | ||||||||||||||||||||||||||||||||||||||||
| 10/31/126,7 | 10.00 | .16 | .51 | .67 | (.11 | ) | — | (.11 | ) | 10.56 | 6.72 | 8 | 13 | .25 | 8 | .20 | 8 | .51 | 8 | 1.56 | 8 | |||||||||||||||||||||||||||||||||||
| Class 529-B: | ||||||||||||||||||||||||||||||||||||||||||||||||||||||||
| 10/31/16 | 11.53 | .26 | .24 | .50 | (.27 | ) | (.05 | ) | (.32 | ) | 11.71 | 4.45 | — | 10 | 1.23 | 1.20 | 1.50 | 2.28 | ||||||||||||||||||||||||||||||||||||||
| 10/31/15 | 11.96 | .30 | (.43 | ) | (.13 | ) | (.26 | ) | (.04 | ) | (.30 | ) | 11.53 | (1.11 | ) | — | 10 | 1.31 | 1.21 | 1.51 | 2.51 | |||||||||||||||||||||||||||||||||||
| 10/31/14 | 11.43 | .27 | .54 | .81 | (.27 | ) | (.01 | ) | (.28 | ) | 11.96 | 7.10 | 1 | 1.32 | 1.22 | 1.53 | 2.34 | |||||||||||||||||||||||||||||||||||||||
| 10/31/13 | 10.55 | .27 | .90 | 1.17 | (.29 | ) | — | (.29 | ) | 11.43 | 11.23 | 1 | 1.34 | 1.24 | 1.54 | 2.45 | ||||||||||||||||||||||||||||||||||||||||
| 10/31/126,7 | 10.00 | .12 | .53 | .65 | (.10 | ) | — | (.10 | ) | 10.55 | 6.50 | 8 | — | 10 | .58 | 8 | .53 | 8 | .84 | 8 | 1.12 | 8 | ||||||||||||||||||||||||||||||||||
| Class 529-C: | ||||||||||||||||||||||||||||||||||||||||||||||||||||||||
| 10/31/16 | 11.50 | .26 | .23 | .49 | (.30 | ) | (.05 | ) | (.35 | ) | 11.64 | 4.35 | 47 | 1.22 | 1.20 | 1.50 | 2.27 | |||||||||||||||||||||||||||||||||||||||
| 10/31/15 | 11.93 | .29 | (.41 | ) | (.12 | ) | (.27 | ) | (.04 | ) | (.31 | ) | 11.50 | (1.01 | ) | 45 | 1.30 | 1.20 | 1.50 | 2.49 | ||||||||||||||||||||||||||||||||||||
| 10/31/14 | 11.41 | .27 | .53 | .80 | (.27 | ) | (.01 | ) | (.28 | ) | 11.93 | 7.06 | 40 | 1.31 | 1.21 | 1.52 | 2.33 | |||||||||||||||||||||||||||||||||||||||
| 10/31/13 | 10.54 | .27 | .89 | 1.16 | (.29 | ) | — | (.29 | ) | 11.41 | 11.23 | 29 | 1.33 | 1.23 | 1.53 | 2.42 | ||||||||||||||||||||||||||||||||||||||||
| 10/31/126,7 | 10.00 | .13 | .51 | .64 | (.10 | ) | — | (.10 | ) | 10.54 | 6.41 | 8 | 9 | .59 | 8 | .54 | 8 | .85 | 8 | 1.20 | 8 | |||||||||||||||||||||||||||||||||||
| Class 529-E: | ||||||||||||||||||||||||||||||||||||||||||||||||||||||||
| 10/31/16 | 11.53 | .32 | .25 | .57 | (.36 | ) | (.05 | ) | (.41 | ) | 11.69 | 5.05 | 6 | .68 | .66 | .96 | 2.81 | |||||||||||||||||||||||||||||||||||||||
| 10/31/15 | 11.97 | .35 | (.41 | ) | (.06 | ) | (.34 | ) | (.04 | ) | (.38 | ) | 11.53 | (.56 | ) | 6 | .77 | .67 | .97 | 3.00 | ||||||||||||||||||||||||||||||||||||
| 10/31/14 | 11.44 | .34 | .53 | .87 | (.33 | ) | (.01 | ) | (.34 | ) | 11.97 | 7.70 | 5 | .78 | .68 | .99 | 2.86 | |||||||||||||||||||||||||||||||||||||||
| 10/31/13 | 10.56 | .33 | .89 | 1.22 | (.34 | ) | — | (.34 | ) | 11.44 | 11.80 | 3 | .80 | .70 | 1.00 | 2.98 | ||||||||||||||||||||||||||||||||||||||||
| 10/31/126,7 | 10.00 | .15 | .52 | .67 | (.11 | ) | — | (.11 | ) | 10.56 | 6.69 | 8 | 1 | .35 | 8 | .30 | 8 | .61 | 8 | 1.47 | 8 | |||||||||||||||||||||||||||||||||||
| 56 | American Funds Portfolio Series |
Income Portfolio
| Income (loss) from investment operations1 | Dividends and distributions | Ratio of | Ratio of | |||||||||||||||||||||||||||||||||||||||||||||||||||||
| Period ended | Net asset value, beginning of period | Net investment income | Net gains (losses) on securities (both realized and unrealized) | Total from investment operations | Dividends (from net investment income) | Distri- butions (from capital gains) | Total dividends and distributions | Net asset value, end of period | Total return2,3 | Net assets, end of period (in millions) | expenses to average net assets before waivers/ reimburse- ments4 | expenses to average net assets after waivers/ reimburse- ments3,4 | Net effective expense ratio3,5 | Ratio of net income to average net assets3 | ||||||||||||||||||||||||||||||||||||||||||
| Class 529-F-1: | ||||||||||||||||||||||||||||||||||||||||||||||||||||||||
| 10/31/16 | $ | 11.55 | $ | .38 | $ | .23 | $ | .61 | $ | (.41 | ) | $ | (.05 | ) | $ | (.46 | ) | 11.70 | 5.45 | % | 9 | .21 | % | .20 | % | .50 | % | 3.26 | % | |||||||||||||||||||||||||||
| 10/31/15 | 11.99 | .41 | (.42 | ) | (.01 | ) | (.39 | ) | (.04 | ) | (.43 | ) | 11.55 | (.11 | ) | 6 | .30 | .20 | .50 | 3.50 | ||||||||||||||||||||||||||||||||||||
| 10/31/14 | 11.46 | .40 | .52 | .92 | (.38 | ) | (.01 | ) | (.39 | ) | 11.99 | 8.16 | 4 | .30 | .20 | .51 | 3.36 | |||||||||||||||||||||||||||||||||||||||
| 10/31/13 | 10.57 | .39 | .89 | 1.28 | (.39 | ) | — | (.39 | ) | 11.46 | 12.36 | 2 | .33 | .23 | .53 | 3.54 | ||||||||||||||||||||||||||||||||||||||||
| 10/31/126,7 | 10.00 | .17 | .52 | .69 | (.12 | ) | — | (.12 | ) | 10.57 | 6.89 | 8 | — | 10 | .14 | 8 | .09 | 8 | .40 | 8 | 1.63 | 8 | ||||||||||||||||||||||||||||||||||
| Class R-1: | ||||||||||||||||||||||||||||||||||||||||||||||||||||||||
| 10/31/16 | 11.50 | .27 | .24 | .51 | (.31 | ) | (.05 | ) | (.36 | ) | 11.65 | 4.50 | 2 | 1.15 | 1.13 | 1.43 | 2.33 | |||||||||||||||||||||||||||||||||||||||
| 10/31/15 | 11.94 | .30 | (.42 | ) | (.12 | ) | (.28 | ) | (.04 | ) | (.32 | ) | 11.50 | (1.03 | ) | 1 | 1.22 | 1.12 | 1.42 | 2.56 | ||||||||||||||||||||||||||||||||||||
| 10/31/14 | 11.42 | .27 | .55 | .82 | (.29 | ) | (.01 | ) | (.30 | ) | 11.94 | 7.20 | 2 | 1.23 | 1.13 | 1.44 | 2.34 | |||||||||||||||||||||||||||||||||||||||
| 10/31/13 | 10.55 | .28 | .90 | 1.18 | (.31 | ) | — | (.31 | ) | 11.42 | 11.36 | 1 | 1.23 | 1.13 | 1.43 | 2.57 | ||||||||||||||||||||||||||||||||||||||||
| 10/31/126,7 | 10.00 | .17 | .49 | .66 | (.11 | ) | — | (.11 | ) | 10.55 | 6.59 | 8 | — | 10 | .48 | 8 | .43 | 8 | .74 | 8 | 1.63 | 8 | ||||||||||||||||||||||||||||||||||
| Class R-2: | ||||||||||||||||||||||||||||||||||||||||||||||||||||||||
| 10/31/16 | 11.50 | .27 | .23 | .50 | (.31 | ) | (.05 | ) | (.36 | ) | 11.64 | 4.44 | 27 | 1.17 | 1.15 | 1.45 | 2.33 | |||||||||||||||||||||||||||||||||||||||
| 10/31/15 | 11.94 | .30 | (.41 | ) | (.11 | ) | (.29 | ) | (.04 | ) | (.33 | ) | 11.50 | (.99 | ) | 22 | 1.24 | 1.14 | 1.44 | 2.55 | ||||||||||||||||||||||||||||||||||||
| 10/31/14 | 11.42 | .27 | .54 | .81 | (.28 | ) | (.01 | ) | (.29 | ) | 11.94 | 7.10 | 15 | 1.29 | 1.19 | 1.50 | 2.35 | |||||||||||||||||||||||||||||||||||||||
| 10/31/13 | 10.56 | .27 | .90 | 1.17 | (.31 | ) | — | (.31 | ) | 11.42 | 11.26 | 10 | 1.25 | 1.15 | 1.45 | 2.44 | ||||||||||||||||||||||||||||||||||||||||
| 10/31/126,7 | 10.00 | .13 | .53 | .66 | (.10 | ) | — | (.10 | ) | 10.56 | 6.67` | 8 | 2 | .50 | 8 | .45 | 8 | .76 | 8 | 1.28 | 8 | |||||||||||||||||||||||||||||||||||
| Class R-2E: | ||||||||||||||||||||||||||||||||||||||||||||||||||||||||
| 10/31/16 | 11.54 | .19 | .42 | .61 | (.41 | ) | (.05 | ) | (.46 | ) | 11.69 | 5.39 | — | 10 | .68 | .67 | .97 | 1.65 | ||||||||||||||||||||||||||||||||||||||
| 10/31/15 | 11.98 | .41 | (.43 | ) | (.02 | ) | (.38 | ) | (.04 | ) | (.42 | ) | 11.54 | (.18 | )11 | — | 10 | .36 | 11 | .25 | 11 | .55 | 11 | 3.46 | 11 | |||||||||||||||||||||||||||||||
| 10/31/146,12 | 12.07 | .08 | (.07 | ) | .01 | (.10 | ) | — | (.10 | ) | 11.98 | .07 | 8,11 | — | 10 | .06 | 8,11 | .04 | 8,11 | .35 | 8,11 | .69 | 8,11 | |||||||||||||||||||||||||||||||||
| Class R-3: | ||||||||||||||||||||||||||||||||||||||||||||||||||||||||
| 10/31/16 | 11.53 | .32 | .24 | .56 | (.36 | ) | (.05 | ) | (.41 | ) | 11.68 | 4.98 | 25 | .71 | .69 | .99 | 2.79 | |||||||||||||||||||||||||||||||||||||||
| 10/31/15 | 11.97 | .35 | (.41 | ) | (.06 | ) | (.34 | ) | (.04 | ) | (.38 | ) | 11.53 | (.56 | ) | 18 | .78 | .68 | .98 | 2.99 | ||||||||||||||||||||||||||||||||||||
| 10/31/14 | 11.45 | .33 | .53 | .86 | (.33 | ) | (.01 | ) | (.34 | ) | 11.97 | 7.58 | 11 | .81 | .71 | 1.02 | 2.84 | |||||||||||||||||||||||||||||||||||||||
| 10/31/13 | 10.56 | .31 | .92 | 1.23 | (.34 | ) | — | (.34 | ) | 11.45 | 11.86 | 6 | .81 | .71 | 1.01 | 2.83 | ||||||||||||||||||||||||||||||||||||||||
| 10/31/126,7 | 10.00 | .19 | .48 | .67 | (.11 | ) | — | (.11 | ) | 10.56 | 6.75 | 8 | 2 | .31 | 8 | .26 | 8 | .57 | 8 | 1.85 | 8 | |||||||||||||||||||||||||||||||||||
| Class R-4: | ||||||||||||||||||||||||||||||||||||||||||||||||||||||||
| 10/31/16 | 11.55 | .35 | .24 | .59 | (.39 | ) | (.05 | ) | (.44 | ) | 11.70 | 5.28 | 31 | .40 | .38 | .68 | 3.07 | |||||||||||||||||||||||||||||||||||||||
| 10/31/15 | 11.99 | .38 | (.41 | ) | (.03 | ) | (.37 | ) | (.04 | ) | (.41 | ) | 11.55 | (.27 | ) | 19 | .46 | .36 | .66 | 3.26 | ||||||||||||||||||||||||||||||||||||
| 10/31/14 | 11.46 | .36 | .55 | .91 | (.37 | ) | (.01 | ) | (.38 | ) | 11.99 | 7.99 | 10 | .47 | .37 | .68 | 3.05 | |||||||||||||||||||||||||||||||||||||||
| 10/31/13 | 10.57 | .37 | .90 | 1.27 | (.38 | ) | — | (.38 | ) | 11.46 | 12.24 | 6 | .45 | .35 | .65 | 3.37 | ||||||||||||||||||||||||||||||||||||||||
| 10/31/126,7 | 10.00 | .23 | .46 | .69 | (.12 | ) | — | (.12 | ) | 10.57 | 6.89 | 8 | 1 | .18 | 8 | .14 | 8 | .45 | 8 | 2.21 | 8 | |||||||||||||||||||||||||||||||||||
| Class R-5E: | ||||||||||||||||||||||||||||||||||||||||||||||||||||||||
| 10/31/166,13 | 11.47 | .42 | .27 | .69 | (.42 | ) | (.05 | ) | (.47 | ) | 11.69 | 6.14 | 8 | — | 10 | .26 | 14 | .25 | 14 | .55 | 14 | 3.77 | 14 | |||||||||||||||||||||||||||||||||
| Class R-5: | ||||||||||||||||||||||||||||||||||||||||||||||||||||||||
| 10/31/16 | 11.57 | .39 | .24 | .63 | (.43 | ) | (.05 | ) | (.48 | ) | 11.72 | 5.56 | 4 | .10 | .08 | .38 | 3.35 | |||||||||||||||||||||||||||||||||||||||
| 10/31/15 | 12.00 | .42 | (.41 | ) | .01 | (.40 | ) | (.04 | ) | (.44 | ) | 11.57 | .09 | 3 | .18 | .08 | .38 | 3.58 | ||||||||||||||||||||||||||||||||||||||
| 10/31/14 | 11.47 | .42 | .51 | .93 | (.39 | ) | (.01 | ) | (.40 | ) | 12.00 | 8.24 | 2 | .19 | .09 | .40 | 3.58 | |||||||||||||||||||||||||||||||||||||||
| 10/31/13 | 10.57 | .39 | .91 | 1.30 | (.40 | ) | — | (.40 | ) | 11.47 | 12.58 | 9 | .19 | .09 | .39 | 3.54 | ||||||||||||||||||||||||||||||||||||||||
| 10/31/126,7 | 10.00 | .17 | .52 | .69 | (.12 | ) | — | (.12 | ) | 10.57 | 6.91 | 8 | 5 | .08 | 8 | .03 | 8 | .34 | 8 | 1.68 | 8 | |||||||||||||||||||||||||||||||||||
| Class R-6: | ||||||||||||||||||||||||||||||||||||||||||||||||||||||||
| 10/31/16 | 11.56 | .40 | .24 | .64 | (.43 | ) | (.05 | ) | (.48 | ) | 11.72 | 5.71 | 25 | .04 | .03 | .33 | 3.43 | |||||||||||||||||||||||||||||||||||||||
| 10/31/15 | 12.00 | .43 | (.42 | ) | .01 | (.41 | ) | (.04 | ) | (.45 | ) | 11.56 | .05 | 17 | .13 | .03 | .33 | 3.64 | ||||||||||||||||||||||||||||||||||||||
| 10/31/14 | 11.47 | .41 | .53 | .94 | (.40 | ) | (.01 | ) | (.41 | ) | 12.00 | 8.33 | 12 | .13 | .03 | .34 | 3.48 | |||||||||||||||||||||||||||||||||||||||
| 10/31/13 | 10.57 | .37 | .93 | 1.30 | (.40 | ) | — | (.40 | ) | 11.47 | 12.57 | 2 | .13 | .03 | .33 | 3.29 | ||||||||||||||||||||||||||||||||||||||||
| 10/31/126,7 | 10.00 | .19 | .50 | .69 | (.12 | ) | — | (.12 | ) | 10.57 | 6.89 | 8 | — | 10 | .14 | 8 | .09 | 8 | .40 | 8 | 1.79 | 8 | ||||||||||||||||||||||||||||||||||
See page 62 for footnotes.
| American Funds Portfolio Series | 57 |
Financial highlights (continued)
Tax-Advantaged Income Portfolio
| Income from investment operations1 | Dividends and distributions | Ratio of | Ratio of | |||||||||||||||||||||||||||||||||||||||||||||||||||||
| Period ended | Net asset value, beginning of period | Net investment income | Net gains (losses) on securities (both realized and unrealized) | Total from investment operations | Dividends (from net investment income) | Distri- butions (from capital gains) | Total dividends and distributions | Net asset value, end of period | Total return2,3 | Net assets, end of period (in millions) | expenses to average net assets before waivers/ reimburse- ments4 | expenses to average net assets after waivers/ reimburse- ments3,4 | Net effective expense ratio3,5 | Ratio of net income to average net assets3 | ||||||||||||||||||||||||||||||||||||||||||
| Class A: | ||||||||||||||||||||||||||||||||||||||||||||||||||||||||
| 10/31/16 | $ | 12.40 | $ | .33 | $ | .22 | $ | .55 | $ | (.33 | ) | $ | (.08 | ) | $ | (.41 | ) | $ | 12.54 | 4.52 | % | $ | 889 | .43 | % | .42 | % | .78 | % | 2.69 | % | |||||||||||||||||||||||||
| 10/31/15 | 12.48 | .34 | (.07 | ) | .27 | (.32 | ) | (.03 | ) | (.35 | ) | 12.40 | 2.22 | 649 | .53 | .43 | .79 | 2.74 | ||||||||||||||||||||||||||||||||||||||
| 10/31/14 | 11.54 | .34 | .94 | 1.28 | (.34 | ) | — | (.34 | ) | 12.48 | 11.25 | 413 | .54 | .44 | .81 | 2.85 | ||||||||||||||||||||||||||||||||||||||||
| 10/31/13 | 10.66 | .33 | .86 | 1.19 | (.30 | ) | (.01 | ) | (.31 | ) | 11.54 | 11.28 | 220 | .55 | .45 | .82 | 2.93 | |||||||||||||||||||||||||||||||||||||||
| 10/31/126,7 | 10.00 | .15 | .62 | .77 | (.11 | ) | — | (.11 | ) | 10.66 | 7.73 | 8 | 66 | .24 | 8 | .19 | 8 | .55 | 8 | 1.45 | 8 | |||||||||||||||||||||||||||||||||||
| Class B: | ||||||||||||||||||||||||||||||||||||||||||||||||||||||||
| 10/31/16 | 12.40 | .24 | .22 | .46 | (.20 | ) | (.08 | ) | (.28 | ) | 12.58 | 3.75 | — | 10 | 1.14 | 1.12 | 1.48 | 1.93 | ||||||||||||||||||||||||||||||||||||||
| 10/31/15 | 12.47 | .25 | (.07 | ) | .18 | (.22 | ) | (.03 | ) | (.25 | ) | 12.40 | 1.45 | — | 10 | 1.23 | 1.13 | 1.49 | 2.01 | |||||||||||||||||||||||||||||||||||||
| 10/31/14 | 11.52 | .26 | .94 | 1.20 | (.25 | ) | — | (.25 | ) | 12.47 | 10.55 | — | 10 | 1.25 | 1.15 | 1.52 | 2.16 | |||||||||||||||||||||||||||||||||||||||
| 10/31/13 | 10.66 | .25 | .85 | 1.10 | (.23 | ) | (.01 | ) | (.24 | ) | 11.52 | 10.38 | — | 10 | 1.28 | 1.18 | 1.55 | 2.24 | ||||||||||||||||||||||||||||||||||||||
| 10/31/126,7 | 10.00 | .12 | .63 | .75 | (.09 | ) | — | (.09 | ) | 10.66 | 7.51 | 8 | — | 10 | .52 | 8 | .48 | 8 | .84 | 8 | 1.20 | 8 | ||||||||||||||||||||||||||||||||||
| Class C: | ||||||||||||||||||||||||||||||||||||||||||||||||||||||||
| 10/31/16 | 12.34 | .24 | .21 | .45 | (.25 | ) | (.08 | ) | (.33 | ) | 12.46 | 3.70 | 155 | 1.14 | 1.13 | 1.49 | 1.97 | |||||||||||||||||||||||||||||||||||||||
| 10/31/15 | 12.43 | .25 | (.06 | ) | .19 | (.25 | ) | (.03 | ) | (.28 | ) | 12.34 | 1.50 | 101 | 1.23 | 1.13 | 1.49 | 2.04 | ||||||||||||||||||||||||||||||||||||||
| 10/31/14 | 11.50 | .26 | .93 | 1.19 | (.26 | ) | — | (.26 | ) | 12.43 | 10.49 | 60 | 1.24 | 1.14 | 1.51 | 2.14 | ||||||||||||||||||||||||||||||||||||||||
| 10/31/13 | 10.64 | .25 | .85 | 1.10 | (.23 | ) | (.01 | ) | (.24 | ) | 11.50 | 10.45 | 27 | 1.27 | 1.17 | 1.54 | 2.21 | |||||||||||||||||||||||||||||||||||||||
| 10/31/126,7 | 10.00 | .11 | .63 | .74 | (.10 | ) | — | (.10 | ) | 10.64 | 7.43 | 8 | 8 | .55 | 8 | .50 | 8 | .86 | 8 | 1.01 | 8 | |||||||||||||||||||||||||||||||||||
| Class F-1: | ||||||||||||||||||||||||||||||||||||||||||||||||||||||||
| 10/31/16 | 12.40 | .33 | .21 | .54 | (.33 | ) | (.08 | ) | (.41 | ) | 12.53 | 4.47 | 39 | .41 | .40 | .76 | 2.69 | |||||||||||||||||||||||||||||||||||||||
| 10/31/15 | 12.48 | .34 | (.06 | ) | .28 | (.33 | ) | (.03 | ) | (.36 | ) | 12.40 | 2.24 | 22 | .50 | .40 | .76 | 2.76 | ||||||||||||||||||||||||||||||||||||||
| 10/31/14 | 11.54 | .35 | .93 | 1.28 | (.34 | ) | — | (.34 | ) | 12.48 | 11.25 | 16 | .51 | .41 | .78 | 2.91 | ||||||||||||||||||||||||||||||||||||||||
| 10/31/13 | 10.66 | .33 | .86 | 1.19 | (.30 | ) | (.01 | ) | (.31 | ) | 11.54 | 11.31 | 11 | .53 | .43 | .80 | 2.92 | |||||||||||||||||||||||||||||||||||||||
| 10/31/126,7 | 10.00 | .14 | .63 | .77 | (.11 | ) | — | (.11 | ) | 10.66 | 7.79 | 8 | 3 | .19 | 8 | .15 | 8 | .51 | 8 | 1.30 | 8 | |||||||||||||||||||||||||||||||||||
| Class F-2: | ||||||||||||||||||||||||||||||||||||||||||||||||||||||||
| 10/31/16 | 12.42 | .37 | .20 | .57 | (.36 | ) | (.08 | ) | (.44 | ) | 12.55 | 4.72 | 62 | .15 | .14 | .50 | 2.95 | |||||||||||||||||||||||||||||||||||||||
| 10/31/15 | 12.50 | .37 | (.06 | ) | .31 | (.36 | ) | (.03 | ) | (.39 | ) | 12.42 | 2.49 | 34 | .25 | .15 | .51 | 3.01 | ||||||||||||||||||||||||||||||||||||||
| 10/31/14 | 11.54 | .37 | .96 | 1.33 | (.37 | ) | — | (.37 | ) | 12.50 | 11.71 | 18 | .24 | .14 | .51 | 3.09 | ||||||||||||||||||||||||||||||||||||||||
| 10/31/13 | 10.67 | .36 | .85 | 1.21 | (.33 | ) | (.01 | ) | (.34 | ) | 11.54 | 11.46 | 6 | .28 | .18 | .55 | 3.21 | |||||||||||||||||||||||||||||||||||||||
| 10/31/126,7 | 10.00 | .15 | .64 | .79 | (.12 | ) | — | (.12 | ) | 10.67 | 7.92 | 8 | 1 | .10 | 8 | .05 | 8 | .41 | 8 | 1.48 | 8 | |||||||||||||||||||||||||||||||||||
| 58 | American Funds Portfolio Series |
Preservation Portfolio
| Income (loss) from investment operations1 | ||||||||||||||||||||||||||||||||||||||||||||||||
| Period ended | Net asset value, beginning of period | Net investment income | Net gains (losses) on securities (both realized and unrealized) | Total from investment operations | Dividends (from net investment income) | Net asset value, end of period | Total return2,3 | Net assets, end of period (in millions) | Ratio of expenses to average net assets before waivers/ reimbursements4 | Ratio of expenses to average net assets after waivers/ reimbursements3,4 | Net effective expense ratio3,5 | Ratio of net income to average net assets3 | ||||||||||||||||||||||||||||||||||||
| Class A: | ||||||||||||||||||||||||||||||||||||||||||||||||
| 10/31/16 | $ | 9.95 | $ | .10 | $ | .09 | $ | .19 | $ | (.11 | ) | $ | 10.03 | 1.90 | % | $ | 803 | .42 | % | .41 | % | .71 | % | 1.05 | % | |||||||||||||||||||||||
| 10/31/15 | 9.95 | .11 | — | 9 | .11 | (.11 | ) | 9.95 | 1.08 | 582 | .51 | .41 | .71 | 1.09 | ||||||||||||||||||||||||||||||||||
| 10/31/14 | 9.91 | .10 | .04 | .14 | (.10 | ) | 9.95 | 1.44 | 436 | .50 | .39 | .69 | 1.01 | |||||||||||||||||||||||||||||||||||
| 10/31/13 | 10.08 | .11 | (.17 | ) | (.06 | ) | (.11 | ) | 9.91 | (.59 | ) | 333 | .53 | .41 | .71 | 1.13 | ||||||||||||||||||||||||||||||||
| 10/31/126,7 | 10.00 | .06 | .07 | .13 | (.05 | ) | 10.08 | 1.26 | 8 | 163 | .23 | 8 | .19 | 8 | .50 | 8 | .60 | 8 | ||||||||||||||||||||||||||||||
| Class B: | ||||||||||||||||||||||||||||||||||||||||||||||||
| 10/31/16 | 9.95 | .03 | .08 | �� | .11 | (.02 | ) | 10.04 | 1.15 | — | 10 | 1.19 | 1.16 | 1.46 | .29 | |||||||||||||||||||||||||||||||||
| 10/31/15 | 9.95 | .03 | — | 9 | .03 | (.03 | ) | 9.95 | .35 | 1 | 1.24 | 1.14 | 1.44 | .33 | ||||||||||||||||||||||||||||||||||
| 10/31/14 | 9.91 | .03 | .03 | .06 | (.02 | ) | 9.95 | .64 | 2 | 1.26 | 1.15 | 1.45 | .28 | |||||||||||||||||||||||||||||||||||
| 10/31/13 | 10.08 | .04 | (.17 | ) | (.13 | ) | (.04 | ) | 9.91 | (1.32 | ) | 2 | 1.28 | 1.17 | 1.47 | .38 | ||||||||||||||||||||||||||||||||
| 10/31/126,7 | 10.00 | .03 | .07 | .10 | (.02 | ) | 10.08 | .97 | 8 | 2 | .55 | 8 | .51 | 8 | .82 | 8 | .28 | 8 | ||||||||||||||||||||||||||||||
| Class C: | ||||||||||||||||||||||||||||||||||||||||||||||||
| 10/31/16 | 9.93 | .03 | .09 | .12 | (.04 | ) | 10.01 | 1.18 | 175 | 1.15 | 1.14 | 1.44 | .32 | |||||||||||||||||||||||||||||||||||
| 10/31/15 | 9.94 | .04 | (.01 | ) | .03 | (.04 | ) | 9.93 | .28 | 130 | 1.23 | 1.13 | 1.43 | .36 | ||||||||||||||||||||||||||||||||||
| 10/31/14 | 9.90 | .03 | .04 | .07 | (.03 | ) | 9.94 | .68 | 93 | 1.25 | 1.14 | 1.44 | .27 | |||||||||||||||||||||||||||||||||||
| 10/31/13 | 10.07 | .04 | (.17 | ) | (.13 | ) | (.04 | ) | 9.90 | (1.29 | ) | 67 | 1.27 | 1.15 | 1.45 | .39 | ||||||||||||||||||||||||||||||||
| 10/31/126,7 | 10.00 | .03 | .06 | .09 | (.02 | ) | 10.07 | .93 | 8 | 33 | .55 | 8 | .50 | 8 | .81 | 8 | .28 | 8 | ||||||||||||||||||||||||||||||
| Class F-1: | ||||||||||||||||||||||||||||||||||||||||||||||||
| 10/31/16 | 9.95 | .10 | .09 | .19 | (.11 | ) | 10.03 | 1.90 | 27 | .42 | .41 | .71 | 1.04 | |||||||||||||||||||||||||||||||||||
| 10/31/15 | 9.96 | .11 | (.01 | ) | .10 | (.11 | ) | 9.95 | 1.00 | 20 | .50 | .40 | .70 | 1.11 | ||||||||||||||||||||||||||||||||||
| 10/31/14 | 9.91 | .10 | .05 | .15 | (.10 | ) | 9.96 | 1.51 | 9 | .51 | .41 | .71 | 1.00 | |||||||||||||||||||||||||||||||||||
| 10/31/13 | 10.08 | .11 | (.17 | ) | (.06 | ) | �� | (.11 | ) | 9.91 | (.61 | ) | 6 | .54 | .42 | .72 | 1.13 | |||||||||||||||||||||||||||||||
| 10/31/126,7 | 10.00 | .06 | .07 | .13 | (.05 | ) | 10.08 | 1.33 | 8 | 7 | .20 | 8 | .15 | 8 | .46 | 8 | .63 | 8 | ||||||||||||||||||||||||||||||
| Class F-2: | ||||||||||||||||||||||||||||||||||||||||||||||||
| 10/31/16 | 9.95 | .13 | .08 | .21 | (.13 | ) | 10.03 | 2.18 | 49 | .15 | .14 | .44 | 1.31 | |||||||||||||||||||||||||||||||||||
| 10/31/15 | 9.95 | .13 | — | 9 | .13 | (.13 | ) | 9.95 | 1.33 | 21 | .25 | .15 | .45 | 1.34 | ||||||||||||||||||||||||||||||||||
| 10/31/14 | 9.91 | .12 | .04 | .16 | (.12 | ) | 9.95 | 1.67 | 12 | .25 | .15 | .45 | 1.25 | |||||||||||||||||||||||||||||||||||
| 10/31/13 | 10.08 | .14 | (.17 | ) | (.03 | ) | (.14 | ) | 9.91 | (.34 | ) | 6 | .28 | .17 | .47 | 1.37 | ||||||||||||||||||||||||||||||||
| 10/31/126,7 | 10.00 | .07 | .07 | .14 | (.06 | ) | 10.08 | 1.40 | 8 | 3 | .10 | 8 | .05 | 8 | .36 | 8 | .74 | 8 | ||||||||||||||||||||||||||||||
| Class 529-A: | ||||||||||||||||||||||||||||||||||||||||||||||||
| 10/31/16 | 9.94 | .10 | .09 | .19 | (.10 | ) | 10.03 | 1.97 | 77 | .45 | .43 | .73 | 1.03 | |||||||||||||||||||||||||||||||||||
| 10/31/15 | 9.95 | .10 | (.01 | ) | .09 | (.10 | ) | 9.94 | .93 | 56 | .57 | .47 | .77 | 1.03 | ||||||||||||||||||||||||||||||||||
| 10/31/14 | 9.91 | .09 | .04 | .13 | (.09 | ) | 9.95 | 1.36 | 44 | .56 | .45 | .75 | .96 | |||||||||||||||||||||||||||||||||||
| 10/31/13 | 10.08 | .11 | (.17 | ) | (.06 | ) | (.11 | ) | 9.91 | (.61 | ) | 33 | .56 | .44 | .74 | 1.09 | ||||||||||||||||||||||||||||||||
| 10/31/126,7 | 10.00 | .06 | .06 | .12 | (.04 | ) | 10.08 | 1.25 | 8 | 17 | .26 | 8 | .22 | 8 | .53 | 8 | .57 | 8 | ||||||||||||||||||||||||||||||
| Class 529-B: | ||||||||||||||||||||||||||||||||||||||||||||||||
| 10/31/16 | 9.95 | .02 | .09 | .11 | (.02 | ) | 10.04 | 1.08 | — | 10 | 1.27 | 1.25 | 1.55 | .22 | ||||||||||||||||||||||||||||||||||
| 10/31/15 | 9.96 | .03 | (.01 | ) | .02 | (.03 | ) | 9.95 | .17 | — | 10 | 1.33 | 1.23 | 1.53 | .26 | |||||||||||||||||||||||||||||||||
| 10/31/14 | 9.92 | .02 | .04 | .06 | (.02 | ) | 9.96 | .56 | — | 10 | 1.34 | 1.23 | 1.53 | .20 | ||||||||||||||||||||||||||||||||||
| 10/31/13 | 10.08 | .03 | (.16 | ) | (.13 | ) | (.03 | ) | 9.92 | (1.33 | ) | — | 10 | 1.38 | 1.26 | 1.56 | .29 | |||||||||||||||||||||||||||||||
| 10/31/126,7 | 10.00 | .02 | .07 | .09 | (.01 | ) | 10.08 | .89 | 8 | 1 | .59 | 8 | .55 | 8 | .86 | 8 | .25 | 8 | ||||||||||||||||||||||||||||||
| Class 529-C: | ||||||||||||||||||||||||||||||||||||||||||||||||
| 10/31/16 | 9.94 | .02 | .09 | .11 | (.03 | ) | 10.02 | 1.10 | 34 | 1.23 | 1.22 | 1.52 | .24 | |||||||||||||||||||||||||||||||||||
| 10/31/15 | 9.95 | .03 | (.01 | ) | .02 | (.03 | ) | 9.94 | .19 | 25 | 1.32 | 1.22 | 1.52 | .27 | ||||||||||||||||||||||||||||||||||
| 10/31/14 | 9.91 | .02 | .04 | .06 | (.02 | ) | 9.95 | .60 | 22 | 1.34 | 1.23 | 1.53 | .18 | |||||||||||||||||||||||||||||||||||
| 10/31/13 | 10.08 | .03 | (.17 | ) | (.14 | ) | (.03 | ) | 9.91 | (1.38 | ) | 17 | 1.37 | 1.25 | 1.55 | .29 | ||||||||||||||||||||||||||||||||
| 10/31/126,7 | 10.00 | .02 | .07 | .09 | (.01 | ) | 10.08 | .93 | 8 | 9 | .60 | 8 | .55 | 8 | .86 | 8 | .24 | 8 | ||||||||||||||||||||||||||||||
| Class 529-E: | ||||||||||||||||||||||||||||||||||||||||||||||||
| 10/31/16 | 9.94 | .08 | .08 | .16 | (.08 | ) | 10.02 | 1.64 | 3 | .69 | .68 | .98 | .78 | |||||||||||||||||||||||||||||||||||
| 10/31/15 | 9.95 | .08 | (.01 | ) | .07 | (.08 | ) | 9.94 | .70 | 3 | .79 | .69 | .99 | .81 | ||||||||||||||||||||||||||||||||||
| 10/31/14 | 9.91 | .07 | .04 | .11 | (.07 | ) | 9.95 | 1.12 | 2 | .80 | .70 | 1.00 | .71 | |||||||||||||||||||||||||||||||||||
| 10/31/13 | 10.07 | .08 | (.16 | ) | (.08 | ) | (.08 | ) | 9.91 | (.78 | ) | 2 | .83 | .71 | 1.01 | .83 | ||||||||||||||||||||||||||||||||
| 10/31/126,7 | 10.00 | .05 | .06 | .11 | (.04 | ) | 10.07 | 1.13 | 8 | 1 | .35 | 8 | .31 | 8 | .62 | 8 | .47 | 8 | ||||||||||||||||||||||||||||||
See page 62 for footnotes.
| American Funds Portfolio Series | 59 |
Financial highlights (continued)
Preservation Portfolio
| Income (loss) from investment operations1 | ||||||||||||||||||||||||||||||||||||||||||||||||
| Period ended | Net asset value, beginning of period | Net investment income | Net gains (losses) on securities (both realized and unrealized) | Total from investment operations | Dividends (from net investment income) | Net asset value, end of period | Total return2,3 | Net assets, end of period (in millions) | Ratio of expenses to average net assets before waivers/ reimbursements4 | Ratio of expenses to average net assets after waivers/ reimbursements3,4 | Net effective expense ratio3,5 | Ratio of net income to average net assets3 | ||||||||||||||||||||||||||||||||||||
| Class 529-F-1: | ||||||||||||||||||||||||||||||||||||||||||||||||
| 10/31/16 | $ | 9.94 | $ | .12 | $ | .10 | $ | .22 | $ | (.13 | ) | $ | 10.03 | 2.19 | % | $ | 14 | .23 | % | .22 | % | .52 | % | 1.24 | % | |||||||||||||||||||||||
| 10/31/15 | 9.95 | .13 | (.01 | ) | .12 | (.13 | ) | 9.94 | 1.17 | 10 | .32 | .22 | .52 | 1.28 | ||||||||||||||||||||||||||||||||||
| 10/31/14 | 9.91 | .12 | .04 | .16 | (.12 | ) | 9.95 | 1.59 | 8 | .33 | .22 | .52 | 1.18 | |||||||||||||||||||||||||||||||||||
| 10/31/13 | 10.08 | .13 | (.17 | ) | (.04 | ) | (.13 | ) | 9.91 | (.40 | ) | 6 | .35 | .24 | .54 | 1.28 | ||||||||||||||||||||||||||||||||
| 10/31/126,7 | 10.00 | .07 | .07 | .14 | (.06 | ) | 10.08 | 1.37 | 8 | 1 | .14 | 8 | .10 | 8 | .41 | 8 | .68 | 8 | ||||||||||||||||||||||||||||||
| Class R-1: | ||||||||||||||||||||||||||||||||||||||||||||||||
| 10/31/16 | 9.94 | .03 | .09 | .12 | (.04 | ) | 10.02 | 1.17 | 2 | 1.16 | 1.15 | 1.45 | .31 | |||||||||||||||||||||||||||||||||||
| 10/31/15 | 9.95 | .04 | (.01 | ) | .03 | (.04 | ) | 9.94 | .28 | 1 | 1.24 | 1.14 | 1.44 | .37 | ||||||||||||||||||||||||||||||||||
| 10/31/14 | 9.91 | .02 | .05 | .07 | (.03 | ) | 9.95 | .66 | 1 | 1.26 | 1.15 | 1.45 | .25 | |||||||||||||||||||||||||||||||||||
| 10/31/13 | 10.08 | .04 | (.17 | ) | (.13 | ) | (.04 | ) | 9.91 | (1.32 | ) | 1 | 1.27 | 1.15 | 1.45 | .39 | ||||||||||||||||||||||||||||||||
| 10/31/126,7 | 10.00 | .03 | .10 | .13 | (.05 | ) | 10.08 | 1.30 | 8 | — | 10 | .45 | 8 | .41 | 8 | .72 | 8 | .35 | 8 | |||||||||||||||||||||||||||||
| Class R-2: | ||||||||||||||||||||||||||||||||||||||||||||||||
| 10/31/16 | 9.93 | .03 | .08 | .11 | (.04 | ) | 10.00 | 1.07 | 17 | 1.20 | 1.18 | 1.48 | .27 | |||||||||||||||||||||||||||||||||||
| 10/31/15 | 9.94 | .04 | (.01 | ) | .03 | (.04 | ) | 9.93 | .28 | 14 | 1.25 | 1.15 | 1.45 | .36 | ||||||||||||||||||||||||||||||||||
| 10/31/14 | 9.90 | .02 | .04 | .06 | (.02 | ) | 9.94 | .62 | 8 | 1.33 | 1.22 | 1.52 | .19 | |||||||||||||||||||||||||||||||||||
| 10/31/13 | 10.07 | .04 | (.17 | ) | (.13 | ) | (.04 | ) | 9.90 | (1.30 | ) | 6 | 1.29 | 1.17 | 1.47 | .36 | ||||||||||||||||||||||||||||||||
| 10/31/126,7 | 10.00 | .03 | .08 | .11 | (.04 | ) | 10.07 | 1.11 | 8 | 1 | .47 | 8 | .42 | 8 | .73 | 8 | .33 | 8 | ||||||||||||||||||||||||||||||
| Class R-2E: | ||||||||||||||||||||||||||||||||||||||||||||||||
| 10/31/16 | 9.95 | .07 | .08 | .15 | (.08 | ) | 10.02 | 1.53 | 3 | .81 | .81 | 1.11 | .69 | |||||||||||||||||||||||||||||||||||
| 10/31/15 | 9.96 | .12 | (.01 | ) | .11 | (.12 | ) | 9.95 | 1.12 | 11 | — | 10 | .38 | 11 | .27 | 11 | .57 | 11 | 1.22 | 11 | ||||||||||||||||||||||||||||
| 10/31/146,12 | 9.96 | .02 | — | 9 | .02 | (.02 | ) | 9.96 | .16 | 8,11 | — | 10 | .06 | 8,11 | .04 | 8,11 | .34 | 8,11 | .17 | 8,11 | ||||||||||||||||||||||||||||
| Class R-3: | ||||||||||||||||||||||||||||||||||||||||||||||||
| 10/31/16 | 9.94 | .07 | .09 | .16 | (.08 | ) | 10.02 | 1.60 | 15 | .73 | .71 | 1.01 | .74 | |||||||||||||||||||||||||||||||||||
| 10/31/15 | 9.95 | .08 | (.01 | ) | .07 | (.08 | ) | 9.94 | .70 | 13 | .80 | .70 | 1.00 | .80 | ||||||||||||||||||||||||||||||||||
| 10/31/14 | 9.91 | .07 | .04 | .11 | (.07 | ) | 9.95 | 1.09 | 7 | .84 | .73 | 1.03 | .67 | |||||||||||||||||||||||||||||||||||
| 10/31/13 | 10.08 | .08 | (.17 | ) | (.09 | ) | (.08 | ) | 9.91 | (.85 | ) | 5 | .83 | .72 | 1.02 | .80 | ||||||||||||||||||||||||||||||||
| 10/31/126,7 | 10.00 | .05 | .07 | .12 | (.04 | ) | 10.08 | 1.19 | 8 | — | 10 | .33 | 8 | .29 | 8 | .60 | 8 | .51 | 8 | |||||||||||||||||||||||||||||
| Class R-4: | ||||||||||||||||||||||||||||||||||||||||||||||||
| 10/31/16 | 9.95 | .11 | .08 | .19 | (.11 | ) | 10.03 | 1.92 | 10 | .41 | .40 | .70 | 1.06 | |||||||||||||||||||||||||||||||||||
| 10/31/15 | 9.96 | .11 | (.01 | ) | .10 | (.11 | ) | 9.95 | 1.01 | 6 | .48 | .38 | .68 | 1.13 | ||||||||||||||||||||||||||||||||||
| 10/31/14 | 9.92 | .10 | .04 | .14 | (.10 | ) | 9.96 | 1.43 | 3 | .49 | .39 | .69 | 1.03 | |||||||||||||||||||||||||||||||||||
| 10/31/13 | 10.08 | .12 | (.17 | ) | (.05 | ) | (.11 | ) | 9.92 | (.45 | ) | 1 | .49 | .38 | .68 | 1.16 | ||||||||||||||||||||||||||||||||
| 10/31/126,7 | 10.00 | .06 | .08 | .14 | (.06 | ) | 10.08 | 1.36 | 8 | — | 10 | .17 | 8 | .13 | 8 | .44 | 8 | .63 | 8 | |||||||||||||||||||||||||||||
| Class R-5E: | ||||||||||||||||||||||||||||||||||||||||||||||||
| 10/31/166,13 | 9.91 | .11 | .13 | .24 | (.11 | ) | 10.04 | 2.48 | 8 | — | 10 | .28 | 14 | .27 | 14 | .57 | 14 | 1.19 | 14 | |||||||||||||||||||||||||||||
| Class R-5: | ||||||||||||||||||||||||||||||||||||||||||||||||
| 10/31/16 | 9.95 | .14 | .08 | .22 | (.14 | ) | 10.03 | 2.21 | 1 | .11 | .10 | .40 | 1.35 | |||||||||||||||||||||||||||||||||||
| 10/31/15 | 9.96 | .14 | (.01 | ) | .13 | (.14 | ) | 9.95 | 1.28 | 1 | .20 | .10 | .40 | 1.40 | ||||||||||||||||||||||||||||||||||
| 10/31/14 | 9.91 | .14 | .04 | .18 | (.13 | ) | 9.96 | 1.78 | 1 | .22 | .11 | .41 | 1.35 | |||||||||||||||||||||||||||||||||||
| 10/31/13 | 10.08 | .14 | (.17 | ) | (.03 | ) | (.14 | ) | 9.91 | (.28 | ) | 4 | .22 | .10 | .40 | 1.44 | ||||||||||||||||||||||||||||||||
| 10/31/126,7 | 10.00 | .07 | .07 | .14 | (.06 | ) | 10.08 | 1.42 | 8 | 3 | .08 | 8 | .04 | 8 | .35 | 8 | .75 | 8 | ||||||||||||||||||||||||||||||
| Class R-6: | ||||||||||||||||||||||||||||||||||||||||||||||||
| 10/31/16 | 9.95 | .14 | .08 | .22 | (.14 | ) | 10.03 | 2.27 | 11 | .06 | .04 | .34 | 1.41 | |||||||||||||||||||||||||||||||||||
| 10/31/15 | 9.96 | .14 | (.01 | ) | .13 | (.14 | ) | 9.95 | 1.34 | 7 | .15 | .05 | .35 | 1.45 | ||||||||||||||||||||||||||||||||||
| 10/31/14 | 9.91 | .13 | .05 | .18 | (.13 | ) | 9.96 | 1.76 | 6 | .14 | .04 | .34 | 1.31 | |||||||||||||||||||||||||||||||||||
| 10/31/13 | 10.08 | .15 | (.18 | ) | (.03 | ) | (.14 | ) | 9.91 | (.16 | ) | — | 10 | .20 | .08 | .38 | 1.45 | |||||||||||||||||||||||||||||||
| 10/31/126,7 | 10.00 | .07 | .06 | .13 | (.05 | ) | 10.08 | 1.34 | 8 | — | 10 | .13 | 8 | .08 | 8 | .39 | 8 | .72 | 8 | |||||||||||||||||||||||||||||
| 60 | American Funds Portfolio Series |
Tax-Exempt Preservation Portfolio
| Income (loss) from investment operations1 | ||||||||||||||||||||||||||||||||||||||||||||||||
| Period ended | Net asset value, beginning of period | Net investment income | Net (losses) gains on securities (both realized and unrealized) | Total from investment operations | Dividends (from net investment income) | Net asset value, end of period | Total return2,3 | Net assets, end of period (in millions) | Ratio of expenses to average net assets before waivers/ reimbursements4 | Ratio of expenses to average net assets after waivers/ reimbursements3,4 | Net effective expense ratio3,5 | Ratio of net income to average net assets3 | ||||||||||||||||||||||||||||||||||||
| Class A: | ||||||||||||||||||||||||||||||||||||||||||||||||
| 10/31/16 | $ | 9.91 | $ | .22 | $ | (.01 | ) | $ | .21 | $ | (.22 | ) | $ | 9.90 | 2.08 | % | $ | 338 | .47 | % | .44 | % | .74 | % | 2.21 | % | ||||||||||||||||||||||
| 10/31/15 | 9.99 | .24 | (.09 | ) | .15 | (.23 | ) | 9.91 | 1.55 | 223 | .55 | .44 | .75 | 2.43 | ||||||||||||||||||||||||||||||||||
| 10/31/14 | 9.81 | .26 | .18 | .44 | (.26 | ) | 9.99 | 4.50 | 159 | .56 | .44 | .75 | 2.59 | |||||||||||||||||||||||||||||||||||
| 10/31/13 | 10.11 | .25 | (.30 | ) | (.05 | ) | (.25 | ) | 9.81 | (.48 | ) | 123 | .58 | .45 | .76 | 2.54 | ||||||||||||||||||||||||||||||||
| 10/31/126,7 | 10.00 | .12 | .09 | .21 | (.10 | ) | 10.11 | 2.10 | 8 | 72 | .24 | 8 | .19 | 8 | .50 | 8 | 1.22 | 8 | ||||||||||||||||||||||||||||||
| Class B: | ||||||||||||||||||||||||||||||||||||||||||||||||
| 10/31/16 | 9.92 | .15 | (.01 | ) | .14 | (.13 | ) | 9.93 | 1.45 | 11 | — | 10 | 1.19 | 11 | 1.15 | 11 | 1.45 | 11 | 1.54 | 11 | ||||||||||||||||||||||||||||
| 10/31/15 | 10.00 | .17 | (.09 | ) | .08 | (.16 | ) | 9.92 | .81 | — | 10 | 1.26 | 1.15 | 1.46 | 1.72 | |||||||||||||||||||||||||||||||||
| 10/31/14 | 9.82 | .19 | .17 | .36 | (.18 | ) | 10.00 | 3.74 | — | 10 | 1.27 | 1.15 | 1.46 | 1.91 | ||||||||||||||||||||||||||||||||||
| 10/31/13 | 10.12 | .18 | (.30 | ) | (.12 | ) | (.18 | ) | 9.82 | (1.21 | ) | — | 10 | 1.29 | 1.16 | 1.47 | 1.83 | |||||||||||||||||||||||||||||||
| 10/31/126,7 | 10.00 | .09 | .09 | .18 | (.06 | ) | 10.12 | 1.84 | 8 | — | 10 | .53 | 8 | .49 | 8 | .80 | 8 | .92 | 8 | |||||||||||||||||||||||||||||
| Class C: | ||||||||||||||||||||||||||||||||||||||||||||||||
| 10/31/16 | 9.89 | .15 | — | 9 | .15 | (.15 | ) | 9.89 | 1.48 | 64 | 1.17 | 1.14 | 1.44 | 1.51 | ||||||||||||||||||||||||||||||||||
| 10/31/15 | 9.98 | .17 | (.09 | ) | .08 | (.17 | ) | 9.89 | .76 | 51 | 1.25 | 1.14 | 1.45 | 1.73 | ||||||||||||||||||||||||||||||||||
| 10/31/14 | 9.80 | .19 | .18 | .37 | (.19 | ) | 9.98 | 3.79 | 42 | 1.26 | 1.14 | 1.45 | 1.90 | |||||||||||||||||||||||||||||||||||
| 10/31/13 | 10.10 | .18 | (.30 | ) | (.12 | ) | (.18 | ) | 9.80 | (1.17 | ) | 39 | 1.28 | 1.15 | 1.46 | 1.85 | ||||||||||||||||||||||||||||||||
| 10/31/126,7 | 10.00 | .09 | .09 | .18 | (.08 | ) | 10.10 | 1.77 | 8 | 22 | .55 | 8 | .51 | 8 | .82 | 8 | .89 | 8 | ||||||||||||||||||||||||||||||
| Class F-1: | ||||||||||||||||||||||||||||||||||||||||||||||||
| 10/31/16 | 9.91 | .22 | (.01 | ) | .21 | (.22 | ) | 9.90 | 2.13 | 11 | .43 | .40 | .70 | 2.23 | ||||||||||||||||||||||||||||||||||
| 10/31/15 | 9.99 | .24 | (.08 | ) | .16 | (.24 | ) | 9.91 | 1.58 | 5 | .52 | .41 | .72 | 2.46 | ||||||||||||||||||||||||||||||||||
| 10/31/14 | 9.81 | .26 | .18 | .44 | (.26 | ) | 9.99 | 4.54 | 4 | .52 | .40 | .71 | 2.64 | |||||||||||||||||||||||||||||||||||
| 10/31/13 | 10.11 | .26 | (.31 | ) | (.05 | ) | (.25 | ) | 9.81 | (.49 | ) | 5 | .56 | .42 | .73 | 2.56 | ||||||||||||||||||||||||||||||||
| 10/31/126,7 | 10.00 | .12 | .09 | .21 | (.10 | ) | 10.11 | 2.13 | 8 | 9 | .20 | 8 | .16 | 8 | .47 | 8 | 1.24 | 8 | ||||||||||||||||||||||||||||||
| Class F-2: | ||||||||||||||||||||||||||||||||||||||||||||||||
| 10/31/16 | 9.91 | .25 | (.02 | ) | .23 | (.24 | ) | 9.90 | 2.37 | 34 | .18 | .15 | .45 | 2.50 | ||||||||||||||||||||||||||||||||||
| 10/31/15 | 9.99 | .27 | (.09 | ) | .18 | (.26 | ) | 9.91 | 1.83 | 24 | .27 | .16 | .47 | 2.71 | ||||||||||||||||||||||||||||||||||
| 10/31/14 | 9.81 | .29 | .18 | .47 | (.29 | ) | 9.99 | 4.81 | 11 | .26 | .15 | .46 | 2.89 | |||||||||||||||||||||||||||||||||||
| 10/31/13 | 10.11 | .28 | (.30 | ) | (.02 | ) | (.28 | ) | 9.81 | (.22 | ) | 8 | .30 | .16 | .47 | 2.82 | ||||||||||||||||||||||||||||||||
| 10/31/126,7 | 10.00 | .13 | .09 | .22 | (.11 | ) | 10.11 | 2.25 | 8 | 12 | .10 | 8 | .05 | 8 | .36 | 8 | 1.34 | 8 | ||||||||||||||||||||||||||||||
See page 62 for footnotes.
| American Funds Portfolio Series | 61 |
Financial highlights (continued)
| Year ended October 31 | |||||||||||||||||||||
| Portfolio turnover rate for all share classes | 2016 | 2015 | 2014 | 2013 | 20126,7,8,15 | ||||||||||||||||
| Global Growth Portfolio | 2 | % | 2 | % | — | %16 | — | %16 | 40 | % | |||||||||||
| Growth Portfolio | — | 16 | — | 16 | — | 16 | — | 16 | 24 | ||||||||||||
| Growth and Income Portfolio | — | 16 | — | 16 | — | 16 | — | 16 | 7 | ||||||||||||
| Balanced Portfolio | — | 16 | 13 | — | 16 | — | 16 | 9 | |||||||||||||
| Income Portfolio | 8 | — | 16 | — | 16 | — | 16 | 7 | |||||||||||||
| Tax-Advantaged Income Portfolio | — | 16 | 1 | 1 | 2 | 15 | 45 | ||||||||||||||
| Preservation Portfolio | 2 | 2 | 5 | 11 | 15 | 16 | |||||||||||||||
| Tax-Exempt Preservation Portfolio | 6 | 8 | 14 | 28 | 15 | 36 | |||||||||||||||
| 1 | Based on average shares outstanding. |
| 2 | Total returns exclude any applicable sales charges. |
| 3 | This column reflects the impact, if any, of certain waivers/reimbursements from CRMC. During the periods shown, CRMC reduced fees for investment advisory services. During the periods shown, CRMC also reimbursed other fees and expenses for Preservation Portfolio and Tax-Exempt Preservation Portfolio. |
| 4 | This column does not include expenses of the underlying funds in which each fund invests. |
| 5 | This column reflects the net effective expense ratios for each fund and class, which are unaudited. These ratios include each class’s expense ratio combined with the weighted average net expense ratio of the underlying funds for the periods presented. See Expense Example for further information regarding fees and expenses. |
| 6 | Based on operations for the period shown and, accordingly, is not representative of a full year. |
| 7 | For the period May 18, 2012, commencement of operations, through October 31, 2012. |
| 8 | Not annualized. |
| 9 | Amount less than $.01. |
| 10 | Amount less than $1 million. |
| 11 | All or a significant portion of assets in this class consisted of seed capital invested by CRMC and/or its affiliates. Fees for distribution services are not charged or accrued on these seed capital assets. If such fees were paid by the fund on seed capital assets, fund expenses would have been higher and net income and total return would have been lower. |
| 12 | Class R-2E shares were offered beginning August 29, 2014. |
| 13 | Class R-5E shares were offered beginning November 20, 2015. |
| 14 | Annualized. |
| 15 | Portfolio turnover rates reflect the redemption (or removal) of CRMC’s initial capital investment, without which the portfolio turnover rates would have been lower. |
| 16 | Amount is either less than 1% or there is no turnover. |
See Notes to Financial Statements
| 62 | American Funds Portfolio Series |
Report of Independent Registered Public Accounting Firm
To the Shareholders and Board of Trustees of the American Funds Portfolio Series:
We have audited the accompanying statements of assets and liabilities, including the investment portfolios, of the American Funds Portfolio Series comprising the American Funds Global Growth Portfolio, American Funds Growth Portfolio, American Funds Growth and Income Portfolio, American Funds Balanced Portfolio, American Funds Income Portfolio, American Funds Tax-Advantaged Income Portfolio, American Funds Preservation Portfolio and American Funds Tax-Exempt Preservation Portfolio (the “Series”), as of October 31, 2016, and the related statements of operations for the year then ended, the statements of changes in net assets for each of the two years in the period then ended, and the financial highlights for each of the periods presented. These financial statements and financial highlights are the responsibility of the Series’ management. Our responsibility is to express an opinion on these financial statements and financial highlights based on our audits.
We conducted our audits in accordance with the standards of the Public Company Accounting Oversight Board (United States). Those standards require that we plan and perform the audit to obtain reasonable assurance about whether the financial statements and financial highlights are free of material misstatement. The Series is not required to have, nor were we engaged to perform, an audit of its internal control over financial reporting. Our audits included consideration of internal control over financial reporting as a basis for designing audit procedures that are appropriate in the circumstances, but not for the purpose of expressing an opinion on the effectiveness of the Series’ internal control over financial reporting. Accordingly, we express no such opinion. An audit also includes examining, on a test basis, evidence supporting the amounts and disclosures in the financial statements, assessing the accounting principles used and significant estimates made by management, as well as evaluating the overall financial statement presentation. Our procedures included confirmation of investments owned as of October 31, 2016, by correspondence with the custodian and transfer agent; where replies were not received from the transfer agent, we performed other auditing procedures. We believe that our audits provide a reasonable basis for our opinion.
In our opinion, such financial statements and financial highlights referred to above present fairly, in all material respects, the financial position of each of the funds comprising the American Funds Portfolio Series as of October 31, 2016, the results of their operations for the year then ended, the changes in their net assets for each of the two years in the period then ended, and the financial highlights for each of the periods presented, in conformity with accounting principles generally accepted in the United States of America.
Deloitte & Touche LLP
Costa Mesa, California
December 12, 2016
| American Funds Portfolio Series | 63 |
| Tax information | unaudited |
We are required to advise you of the federal tax status of certain distributions received by shareholders during the fiscal year. The series hereby designates the following amounts for the year ended October 31, 2016:
| Global | Growth and | |||||||||||||||
| Growth | Growth | Income | Balanced | |||||||||||||
| Portfolio | Portfolio | Portfolio | Portfolio | |||||||||||||
| Long-term capital gains | $ | 50,126,000 | $ | 147,417,000 | $ | 138,835,000 | $ | 98,910,000 | ||||||||
| Foreign taxes (per share) | $ | 0.010 | $ | 0.004 | $ | 0.002 | $ | 0.005 | ||||||||
| Foreign source income (per share) | $ | 0.13 | $ | 0.05 | $ | 0.08 | $ | 0.07 | ||||||||
| Qualified dividend income | 100 | % | 100 | % | 100 | % | 100 | % | ||||||||
| Corporate dividends received deduction | $ | 13,534,000 | $ | 17,039,000 | $ | 67,358,000 | $ | 50,137,000 | ||||||||
| U.S. government income that may be exempt from state taxation | $ | 39,000 | $ | 51,000 | $ | 6,110,000 | $ | 5,904,000 | ||||||||
| Tax-Advantaged | Tax-Exempt | |||||||||||||||
| Income | Income | Preservation | Preservation | |||||||||||||
| Portfolio | Portfolio | Portfolio | Portfolio | |||||||||||||
| Long-term capital gains | $ | 18,144,000 | $ | 6,946,000 | $ | 280,000 | — | |||||||||
| Foreign taxes (per share) | — | $ | 0.002 | — | — | |||||||||||
| Foreign source income (per share) | — | $ | 0.05 | — | — | |||||||||||
| Qualified dividend income | $ | 77,043,000 | 100 | %* | $ | 31,000 | — | |||||||||
| Corporate dividends received deduction | $ | 53,007,000 | $ | 9,061,000 | $ | 21,000 | — | |||||||||
| Exempt interest dividends | — | $ | 14,746,000 | — | 100 | % | ||||||||||
| U.S. government income that may be exempt from state taxation | $ | 7,937,000 | $ | 19,000 | $ | 3,923,000 | — | |||||||||
| * | The percentage applies only to the taxable ordinary income that has been reported on Form 1099-DIV. |
Individual shareholders should refer to their Form 1099 or other tax information, which will be mailed in January 2017, to determine the calendar year amounts to be included on their 2016 tax returns. Shareholders should consult their tax advisors.
| 64 | American Funds Portfolio Series |
| Expense example | unaudited |
As a fund shareholder, you incur two types of costs: (1) transaction costs, such as initial sales charges on purchase payments and contingent deferred sales charges on redemptions (loads), and (2) ongoing costs, including management fees, distribution and service (12b-1) fees, and other expenses. This example is intended to help you understand your ongoing costs (in dollars) of investing in the fund so you can compare these costs with the ongoing costs of investing in other mutual funds. The examples are based on an investment of $1,000 invested at the beginning of the period and held for the entire six-month period (May 1, 2016, through October 31, 2016).
Actual expenses:
The first line of each share class in the tables on the following pages provides information about actual account values and actual expenses. You may use the information in this line, together with the amount you invested, to estimate the expenses that you paid over the period. Simply divide your account value by $1,000 (for example, an $8,600 account value divided by $1,000 = 8.6), then multiply the result by the number in the first line under the heading titled “Expenses paid during period” to estimate the expenses you paid on your account during this period.
Hypothetical example for comparison purposes:
The second line of each share class in the tables on the following pages provides information about hypothetical account values and hypothetical expenses based on the actual expense ratio for the share class and an assumed rate of return of 5.00% per year before expenses, which is not the actual return of the share class. The hypothetical account values and expenses may not be used to estimate the actual ending account balance or expenses you paid for the period. You may use this information to compare the ongoing costs of investing in the fund and other funds. To do so, compare this 5.00% hypothetical example with the 5.00% hypothetical examples that appear in the shareholder reports of the other funds.
Notes:
Retirement plan participants may be subject to certain fees charged by the plan sponsor, and Class F-1 and F-2 shareholders may be subject to fees charged by financial intermediaries, typically ranging from 0.75% to 1.50% of assets annually depending on services offered. You can estimate the impact of these fees by adding the amount of the fees to the total estimated expenses you paid on your account during the period as calculated above. In addition, your ending account value would be lower by the amount of these fees.
Note that the expenses shown in the tables on the following pages are meant to highlight your ongoing costs only and do not reflect any transactional costs, such as sales charges (loads). Therefore, the second line of each share class in the tables is useful in comparing ongoing costs only and will not help you determine the relative total costs of owning different funds. In addition, if these transactional costs were included, your costs would have been higher.
| American Funds Portfolio Series | 65 |
Global Growth Portfolio
| Beginning | Ending | Expenses | Effective | Effective | ||||||||||||||||||||
| account value | account value | paid during | Annualized | expenses paid | annualized | |||||||||||||||||||
| 5/1/2016 | 10/31/2016 | period1,2 | expense ratio2 | during period3 | expense ratio4 | |||||||||||||||||||
| Class A – actual return | $ | 1,000.00 | $ | 1,039.27 | $ | 1.59 | .31 | % | $ | 4.11 | .80 | % | ||||||||||||
| Class A – assumed 5% return | 1,000.00 | 1,023.64 | 1.58 | .31 | 4.08 | .80 | ||||||||||||||||||
| Class B – actual return | 1,000.00 | 1,035.08 | 5.80 | 1.13 | 8.31 | 1.62 | ||||||||||||||||||
| Class B – assumed 5% return | 1,000.00 | 1,019.51 | 5.75 | 1.13 | 8.24 | 1.62 | ||||||||||||||||||
| Class C – actual return | 1,000.00 | 1,035.37 | 5.69 | 1.11 | 8.21 | 1.60 | ||||||||||||||||||
| Class C – assumed 5% return | 1,000.00 | 1,019.61 | 5.65 | 1.11 | 8.13 | 1.60 | ||||||||||||||||||
| Class F-1 – actual return | 1,000.00 | 1,039.24 | 1.95 | .38 | 4.47 | .87 | ||||||||||||||||||
| Class F-1 – assumed 5% return | 1,000.00 | 1,023.29 | 1.94 | .38 | 4.43 | .87 | ||||||||||||||||||
| Class F-2 – actual return | 1,000.00 | 1,039.88 | .62 | .12 | 3.14 | .61 | ||||||||||||||||||
| Class F-2 – assumed 5% return | 1,000.00 | 1,024.60 | .61 | .12 | 3.11 | .61 | ||||||||||||||||||
| Class 529-A – actual return | 1,000.00 | 1,039.33 | 1.90 | .37 | 4.42 | .86 | ||||||||||||||||||
| Class 529-A – assumed 5% return | 1,000.00 | 1,023.34 | 1.89 | .37 | 4.38 | .86 | ||||||||||||||||||
| Class 529-B – actual return | 1,000.00 | 1,035.16 | 6.10 | 1.19 | 8.62 | 1.68 | ||||||||||||||||||
| Class 529-B – assumed 5% return | 1,000.00 | 1,019.21 | 6.06 | 1.19 | 8.54 | 1.68 | ||||||||||||||||||
| Class 529-C – actual return | 1,000.00 | 1,034.66 | 6.10 | 1.19 | 8.62 | 1.68 | ||||||||||||||||||
| Class 529-C – assumed 5% return | 1,000.00 | 1,019.21 | 6.06 | 1.19 | 8.54 | 1.68 | ||||||||||||||||||
| Class 529-E – actual return | 1,000.00 | 1,037.27 | 3.29 | .64 | 5.80 | 1.13 | ||||||||||||||||||
| Class 529-E – assumed 5% return | 1,000.00 | 1,021.98 | 3.26 | .64 | 5.75 | 1.13 | ||||||||||||||||||
| Class 529-F-1 – actual return | 1,000.00 | 1,039.95 | .98 | .19 | 3.50 | .68 | ||||||||||||||||||
| Class 529-F-1 – assumed 5% return | 1,000.00 | 1,024.25 | .97 | .19 | 3.47 | .68 | ||||||||||||||||||
| Class R-1 – actual return | 1,000.00 | 1,035.29 | 5.75 | 1.12 | 8.26 | 1.61 | ||||||||||||||||||
| Class R-1 – assumed 5% return | 1,000.00 | 1,019.56 | 5.70 | 1.12 | 8.19 | 1.61 | ||||||||||||||||||
| Class R-2 – actual return | 1,000.00 | 1,035.43 | 5.69 | 1.11 | 8.21 | 1.60 | ||||||||||||||||||
| Class R-2 – assumed 5% return | 1,000.00 | 1,019.61 | 5.65 | 1.11 | 8.13 | 1.60 | ||||||||||||||||||
| Class R-2E – actual return | 1,000.00 | 1,039.33 | 4.11 | .80 | 6.63 | 1.29 | ||||||||||||||||||
| Class R-2E – assumed 5% return | 1,000.00 | 1,021.17 | 4.08 | .80 | 6.56 | 1.29 | ||||||||||||||||||
| Class R-3 – actual return | 1,000.00 | 1,038.04 | 3.54 | .69 | 6.06 | 1.18 | ||||||||||||||||||
| Class R-3 – assumed 5% return | 1,000.00 | 1,021.73 | 3.52 | .69 | 6.01 | 1.18 | ||||||||||||||||||
| Class R-4 – actual return | 1,000.00 | 1,039.33 | 2.00 | .39 | 4.52 | .88 | ||||||||||||||||||
| Class R-4 – assumed 5% return | 1,000.00 | 1,023.24 | 1.99 | .39 | 4.48 | .88 | ||||||||||||||||||
| Class R-5E – actual return | 1,000.00 | 1,040.11 | 1.29 | .25 | 3.81 | .74 | ||||||||||||||||||
| Class R-5E – assumed 5% return | 1,000.00 | 1,023.95 | 1.28 | .25 | 3.77 | .74 | ||||||||||||||||||
| Class R-5 – actual return | 1,000.00 | 1,040.46 | .41 | .08 | 2.93 | .57 | ||||||||||||||||||
| Class R-5 – assumed 5% return | 1,000.00 | 1,024.80 | .41 | .08 | 2.91 | .57 | ||||||||||||||||||
| Class R-6 – actual return | 1,000.00 | 1,041.12 | .10 | .02 | 2.62 | .51 | ||||||||||||||||||
| Class R-6 – assumed 5% return | 1,000.00 | 1,025.10 | .10 | .02 | 2.60 | .51 | ||||||||||||||||||
| 66 | American Funds Portfolio Series |
Growth Portfolio
| Beginning | Ending | �� | Expenses | Effective | Effective | |||||||||||||||||||
| account value | account value | paid during | Annualized | expenses paid | annualized | |||||||||||||||||||
| 5/1/2016 | 10/31/2016 | period1,2 | expense ratio2 | during period3 | expense ratio4 | |||||||||||||||||||
| Class A – actual return | $ | 1,000.00 | $ | 1,041.78 | $ | 1.54 | .30 | % | $ | 3.81 | .74 | % | ||||||||||||
| Class A – assumed 5% return | 1,000.00 | 1,023.69 | 1.53 | .30 | 3.77 | .74 | ||||||||||||||||||
| Class B – actual return | 1,000.00 | 1,037.34 | 5.75 | 1.12 | 8.01 | 1.56 | ||||||||||||||||||
| Class B – assumed 5% return | 1,000.00 | 1,019.56 | 5.70 | 1.12 | 7.93 | 1.56 | ||||||||||||||||||
| Class C – actual return | 1,000.00 | 1,037.49 | 5.65 | 1.10 | 7.91 | 1.54 | ||||||||||||||||||
| Class C – assumed 5% return | 1,000.00 | 1,019.66 | 5.60 | 1.10 | 7.83 | 1.54 | ||||||||||||||||||
| Class F-1 – actual return | 1,000.00 | 1,041.81 | 1.96 | .38 | 4.22 | .82 | ||||||||||||||||||
| Class F-1 – assumed 5% return | 1,000.00 | 1,023.29 | 1.94 | .38 | 4.18 | .82 | ||||||||||||||||||
| Class F-2 – actual return | 1,000.00 | 1,042.31 | .62 | .12 | 2.88 | .56 | ||||||||||||||||||
| Class F-2 – assumed 5% return | 1,000.00 | 1,024.60 | .61 | .12 | 2.85 | .56 | ||||||||||||||||||
| Class 529-A – actual return | 1,000.00 | 1,041.12 | 1.90 | .37 | 4.17 | .81 | ||||||||||||||||||
| Class 529-A – assumed 5% return | 1,000.00 | 1,023.34 | 1.89 | .37 | 4.13 | .81 | ||||||||||||||||||
| Class 529-B – actual return | 1,000.00 | 1,036.73 | 6.11 | 1.19 | 8.37 | 1.63 | ||||||||||||||||||
| Class 529-B – assumed 5% return | 1,000.00 | 1,019.21 | 6.06 | 1.19 | 8.29 | 1.63 | ||||||||||||||||||
| Class 529-C – actual return | 1,000.00 | 1,037.49 | 6.06 | 1.18 | 8.32 | 1.62 | ||||||||||||||||||
| Class 529-C – assumed 5% return | 1,000.00 | 1,019.26 | 6.01 | 1.18 | 8.24 | 1.62 | ||||||||||||||||||
| Class 529-E – actual return | 1,000.00 | 1,039.97 | 3.29 | .64 | 5.55 | 1.08 | ||||||||||||||||||
| Class 529-E – assumed 5% return | 1,000.00 | 1,021.98 | 3.26 | .64 | 5.50 | 1.08 | ||||||||||||||||||
| Class 529-F-1 – actual return | 1,000.00 | 1,042.38 | .93 | .18 | 3.19 | .62 | ||||||||||||||||||
| Class 529-F-1 – assumed 5% return | 1,000.00 | 1,024.30 | .92 | .18 | 3.16 | .62 | ||||||||||||||||||
| Class R-1 – actual return | 1,000.00 | 1,038.06 | 5.75 | 1.12 | 8.01 | 1.56 | ||||||||||||||||||
| Class R-1 – assumed 5% return | 1,000.00 | 1,019.56 | 5.70 | 1.12 | 7.93 | 1.56 | ||||||||||||||||||
| Class R-2 – actual return | 1,000.00 | 1,038.19 | 5.70 | 1.11 | 7.96 | 1.55 | ||||||||||||||||||
| Class R-2 – assumed 5% return | 1,000.00 | 1,019.61 | 5.65 | 1.11 | 7.88 | 1.55 | ||||||||||||||||||
| Class R-2E – actual return | 1,000.00 | 1,039.28 | 4.37 | .85 | 6.63 | 1.29 | ||||||||||||||||||
| Class R-2E – assumed 5% return | 1,000.00 | 1,020.92 | 4.33 | .85 | 6.56 | 1.29 | ||||||||||||||||||
| Class R-3 – actual return | 1,000.00 | 1,039.92 | 3.50 | .68 | 5.76 | 1.12 | ||||||||||||||||||
| Class R-3 – assumed 5% return | 1,000.00 | 1,021.78 | 3.47 | .68 | 5.70 | 1.12 | ||||||||||||||||||
| Class R-4 – actual return | 1,000.00 | 1,041.15 | 1.96 | .38 | 4.22 | .82 | ||||||||||||||||||
| Class R-4 – assumed 5% return | 1,000.00 | 1,023.29 | 1.94 | .38 | 4.18 | .82 | ||||||||||||||||||
| Class R-5E – actual return | 1,000.00 | 1,041.86 | 1.29 | .25 | 3.55 | .69 | ||||||||||||||||||
| Class R-5E – assumed 5% return | 1,000.00 | 1,023.95 | 1.28 | .25 | 3.52 | .69 | ||||||||||||||||||
| Class R-5 – actual return | 1,000.00 | 1,042.85 | .41 | .08 | 2.68 | .52 | ||||||||||||||||||
| Class R-5 – assumed 5% return | 1,000.00 | 1,024.80 | .41 | .08 | 2.65 | .52 | ||||||||||||||||||
| Class R-6 – actual return | 1,000.00 | 1,042.94 | .10 | .02 | 2.37 | .46 | ||||||||||||||||||
| Class R-6 – assumed 5% return | 1,000.00 | 1,025.10 | .10 | .02 | 2.35 | .46 | ||||||||||||||||||
See page 73 for footnotes.
| American Funds Portfolio Series | 67 |
Growth and Income Portfolio
| Beginning | Ending | Expenses | Effective | Effective | ||||||||||||||||||||
| account value | account value | paid during | Annualized | expenses paid | annualized | |||||||||||||||||||
| 5/1/2016 | 10/31/2016 | period1,2 | expense ratio2 | during period3 | expense ratio4 | |||||||||||||||||||
| Class A – actual return | $ | 1,000.00 | $ | 1,026.93 | $ | 1.63 | .32 | % | $ | 3.53 | .69 | % | ||||||||||||
| Class A – assumed 5% return | 1,000.00 | 1,023.59 | 1.63 | .32 | 3.52 | .69 | ||||||||||||||||||
| Class B – actual return | 1,000.00 | 1,022.40 | 5.71 | 1.12 | 7.60 | 1.49 | ||||||||||||||||||
| Class B – assumed 5% return | 1,000.00 | 1,019.56 | 5.70 | 1.12 | 7.58 | 1.49 | ||||||||||||||||||
| Class C – actual return | 1,000.00 | 1,022.49 | 5.61 | 1.10 | 7.49 | 1.47 | ||||||||||||||||||
| Class C – assumed 5% return | 1,000.00 | 1,019.66 | 5.60 | 1.10 | 7.48 | 1.47 | ||||||||||||||||||
| Class F-1 – actual return | 1,000.00 | 1,025.95 | 1.94 | .38 | 3.83 | .75 | ||||||||||||||||||
| Class F-1 – assumed 5% return | 1,000.00 | 1,023.29 | 1.94 | .38 | 3.82 | .75 | ||||||||||||||||||
| Class F-2 – actual return | 1,000.00 | 1,027.18 | .61 | .12 | 2.50 | .49 | ||||||||||||||||||
| Class F-2 – assumed 5% return | 1,000.00 | 1,024.60 | .61 | .12 | 2.50 | .49 | ||||||||||||||||||
| Class 529-A – actual return | 1,000.00 | 1,025.68 | 2.14 | .42 | 4.03 | .79 | ||||||||||||||||||
| Class 529-A – assumed 5% return | 1,000.00 | 1,023.09 | 2.14 | .42 | 4.02 | .79 | ||||||||||||||||||
| Class 529-B – actual return | 1,000.00 | 1,021.88 | 6.06 | 1.19 | 7.95 | 1.56 | ||||||||||||||||||
| Class 529-B – assumed 5% return | 1,000.00 | 1,019.21 | 6.06 | 1.19 | 7.93 | 1.56 | ||||||||||||||||||
| Class 529-C – actual return | 1,000.00 | 1,022.00 | 6.01 | 1.18 | 7.90 | 1.55 | ||||||||||||||||||
| Class 529-C – assumed 5% return | 1,000.00 | 1,019.26 | 6.01 | 1.18 | 7.88 | 1.55 | ||||||||||||||||||
| Class 529-E – actual return | 1,000.00 | 1,025.41 | 3.27 | .64 | 5.16 | 1.01 | ||||||||||||||||||
| Class 529-E – assumed 5% return | 1,000.00 | 1,021.98 | 3.26 | .64 | 5.14 | 1.01 | ||||||||||||||||||
| Class 529-F-1 – actual return | 1,000.00 | 1,026.80 | .92 | .18 | 2.81 | .55 | ||||||||||||||||||
| Class 529-F-1 – assumed 5% return | 1,000.00 | 1,024.30 | .92 | .18 | 2.80 | .55 | ||||||||||||||||||
| Class R-1 – actual return | 1,000.00 | 1,022.01 | 5.71 | 1.12 | 7.59 | 1.49 | ||||||||||||||||||
| Class R-1 – assumed 5% return | 1,000.00 | 1,019.56 | 5.70 | 1.12 | 7.58 | 1.49 | ||||||||||||||||||
| Class R-2 – actual return | 1,000.00 | 1,022.63 | 5.66 | 1.11 | 7.55 | 1.48 | ||||||||||||||||||
| Class R-2 – assumed 5% return | 1,000.00 | 1,019.61 | 5.65 | 1.11 | 7.53 | 1.48 | ||||||||||||||||||
| Class R-2E – actual return | 1,000.00 | 1,023.78 | 4.34 | .85 | 6.22 | 1.22 | ||||||||||||||||||
| Class R-2E – assumed 5% return | 1,000.00 | 1,020.92 | 4.33 | .85 | 6.21 | 1.22 | ||||||||||||||||||
| Class R-3 – actual return | 1,000.00 | 1,024.66 | 3.47 | .68 | 5.36 | 1.05 | ||||||||||||||||||
| Class R-3 – assumed 5% return | 1,000.00 | 1,021.78 | 3.47 | .68 | 5.35 | 1.05 | ||||||||||||||||||
| Class R-4 – actual return | 1,000.00 | 1,026.03 | 1.94 | .38 | 3.83 | .75 | ||||||||||||||||||
| Class R-4 – assumed 5% return | 1,000.00 | 1,023.29 | 1.94 | .38 | 3.82 | .75 | ||||||||||||||||||
| Class R-5E – actual return | 1,000.00 | 1,026.61 | 1.28 | .25 | 3.17 | .62 | ||||||||||||||||||
| Class R-5E – assumed 5% return | 1,000.00 | 1,023.95 | 1.28 | .25 | 3.16 | .62 | ||||||||||||||||||
| Class R-5 – actual return | 1,000.00 | 1,028.14 | .36 | .07 | 2.25 | .44 | ||||||||||||||||||
| Class R-5 – assumed 5% return | 1,000.00 | 1,024.85 | .36 | .07 | 2.24 | .44 | ||||||||||||||||||
| Class R-6 – actual return | 1,000.00 | 1,028.43 | .10 | .02 | 1.99 | .39 | ||||||||||||||||||
| Class R-6 – assumed 5% return | 1,000.00 | 1,025.10 | .10 | .02 | 1.99 | .39 | ||||||||||||||||||
| 68 | American Funds Portfolio Series |
Balanced Portfolio
| Beginning | Ending | Expenses | Effective | Effective | ||||||||||||||||||||
| account value | account value | paid during | Annualized | expenses paid | annualized | |||||||||||||||||||
| 5/1/2016 | 10/31/2016 | period1,2 | expense ratio2 | during period3 | expense ratio4 | |||||||||||||||||||
| Class A – actual return | $ | 1,000.00 | $ | 1,023.85 | $ | 1.68 | .33 | % | $ | 3.62 | .71 | % | ||||||||||||
| Class A – assumed 5% return | 1,000.00 | 1,023.54 | 1.68 | .33 | 3.62 | .71 | ||||||||||||||||||
| Class B – actual return | 1,000.00 | 1,019.58 | 5.70 | 1.12 | 7.64 | 1.50 | ||||||||||||||||||
| Class B – assumed 5% return | 1,000.00 | 1,019.56 | 5.70 | 1.12 | 7.63 | 1.50 | ||||||||||||||||||
| Class C – actual return | 1,000.00 | 1,019.52 | 5.60 | 1.10 | 7.53 | 1.48 | ||||||||||||||||||
| Class C – assumed 5% return | 1,000.00 | 1,019.66 | 5.60 | 1.10 | 7.53 | 1.48 | ||||||||||||||||||
| Class F-1 – actual return | 1,000.00 | 1,023.74 | 1.94 | .38 | 3.88 | .76 | ||||||||||||||||||
| Class F-1 – assumed 5% return | 1,000.00 | 1,023.29 | 1.94 | .38 | 3.87 | .76 | ||||||||||||||||||
| Class F-2 – actual return | 1,000.00 | 1,024.95 | .61 | .12 | 2.55 | .50 | ||||||||||||||||||
| Class F-2 – assumed 5% return | 1,000.00 | 1,024.60 | .61 | .12 | 2.55 | .50 | ||||||||||||||||||
| Class 529-A – actual return | 1,000.00 | 1,023.52 | 2.09 | .41 | 4.03 | .79 | ||||||||||||||||||
| Class 529-A – assumed 5% return | 1,000.00 | 1,023.14 | 2.09 | .41 | 4.02 | .79 | ||||||||||||||||||
| Class 529-B – actual return | 1,000.00 | 1,019.22 | 6.11 | 1.20 | 8.04 | 1.58 | ||||||||||||||||||
| Class 529-B – assumed 5% return | 1,000.00 | 1,019.16 | 6.11 | 1.20 | 8.03 | 1.58 | ||||||||||||||||||
| Class 529-C – actual return | 1,000.00 | 1,019.75 | 6.01 | 1.18 | 7.94 | 1.56 | ||||||||||||||||||
| Class 529-C – assumed 5% return | 1,000.00 | 1,019.26 | 6.01 | 1.18 | 7.93 | 1.56 | ||||||||||||||||||
| Class 529-E – actual return | 1,000.00 | 1,022.41 | 3.26 | .64 | 5.20 | 1.02 | ||||||||||||||||||
| Class 529-E – assumed 5% return | 1,000.00 | 1,021.98 | 3.26 | .64 | 5.19 | 1.02 | ||||||||||||||||||
| Class 529-F-1 – actual return | 1,000.00 | 1,024.60 | .92 | .18 | 2.86 | .56 | ||||||||||||||||||
| Class 529-F-1 – assumed 5% return | 1,000.00 | 1,024.30 | .92 | .18 | 2.85 | .56 | ||||||||||||||||||
| Class R-1 – actual return | 1,000.00 | 1,019.98 | 5.70 | 1.12 | 7.64 | 1.50 | ||||||||||||||||||
| Class R-1 – assumed 5% return | 1,000.00 | 1,019.56 | 5.70 | 1.12 | 7.63 | 1.50 | ||||||||||||||||||
| Class R-2 – actual return | 1,000.00 | 1,019.53 | 5.65 | 1.11 | 7.58 | 1.49 | ||||||||||||||||||
| Class R-2 – assumed 5% return | 1,000.00 | 1,019.61 | 5.65 | 1.11 | 7.58 | 1.49 | ||||||||||||||||||
| Class R-2E – actual return | 1,000.00 | 1,021.55 | 4.33 | .85 | 6.27 | 1.23 | ||||||||||||||||||
| Class R-2E – assumed 5% return | 1,000.00 | 1,020.92 | 4.33 | .85 | 6.26 | 1.23 | ||||||||||||||||||
| Class R-3 – actual return | 1,000.00 | 1,022.37 | 3.47 | .68 | 5.40 | 1.06 | ||||||||||||||||||
| Class R-3 – assumed 5% return | 1,000.00 | 1,021.78 | 3.47 | .68 | 5.40 | 1.06 | ||||||||||||||||||
| Class R-4 – actual return | 1,000.00 | 1,023.68 | 1.94 | .38 | 3.88 | .76 | ||||||||||||||||||
| Class R-4 – assumed 5% return | 1,000.00 | 1,023.29 | 1.94 | .38 | 3.87 | .76 | ||||||||||||||||||
| Class R-5E – actual return | 1,000.00 | 1,024.37 | 1.28 | .25 | 3.21 | .63 | ||||||||||||||||||
| Class R-5E – assumed 5% return | 1,000.00 | 1,023.95 | 1.28 | .25 | 3.21 | .63 | ||||||||||||||||||
| Class R-5 – actual return | 1,000.00 | 1,025.91 | .36 | .07 | 2.30 | .45 | ||||||||||||||||||
| Class R-5 – assumed 5% return | 1,000.00 | 1,024.85 | .36 | .07 | 2.29 | .45 | ||||||||||||||||||
| Class R-6 – actual return | 1,000.00 | 1,025.42 | .10 | .02 | 2.04 | .40 | ||||||||||||||||||
| Class R-6 – assumed 5% return | 1,000.00 | 1,025.10 | .10 | .02 | 2.04 | .40 | ||||||||||||||||||
See page 73 for footnotes.
| American Funds Portfolio Series | 69 |
Income Portfolio
| Beginning | Ending | Expenses | Effective | Effective | ||||||||||||||||||||
| account value | account value | paid during | Annualized | expenses paid | annualized | |||||||||||||||||||
| 5/1/2016 | 10/31/2016 | period1,2 | expense ratio2 | during period3 | expense ratio4 | |||||||||||||||||||
| Class A – actual return | $ | 1,000.00 | $ | 1,027.47 | $ | 1.69 | .33 | % | $ | 3.22 | .63 | % | ||||||||||||
| Class A – assumed 5% return | 1,000.00 | 1,023.54 | 1.68 | .33 | 3.21 | .63 | ||||||||||||||||||
| Class B – actual return | 1,000.00 | 1,023.41 | 5.76 | 1.13 | 7.29 | 1.43 | ||||||||||||||||||
| Class B – assumed 5% return | 1,000.00 | 1,019.51 | 5.75 | 1.13 | 7.27 | 1.43 | ||||||||||||||||||
| Class C – actual return | 1,000.00 | 1,023.73 | 5.66 | 1.11 | 7.19 | 1.41 | ||||||||||||||||||
| Class C – assumed 5% return | 1,000.00 | 1,019.61 | 5.65 | 1.11 | 7.17 | 1.41 | ||||||||||||||||||
| Class F-1 – actual return | 1,000.00 | 1,027.17 | 1.94 | .38 | 3.47 | .68 | ||||||||||||||||||
| Class F-1 – assumed 5% return | 1,000.00 | 1,023.29 | 1.94 | .38 | 3.47 | .68 | ||||||||||||||||||
| Class F-2 – actual return | 1,000.00 | 1,028.51 | .56 | .11 | 2.10 | .41 | ||||||||||||||||||
| Class F-2 – assumed 5% return | 1,000.00 | 1,024.65 | .56 | .11 | 2.09 | .41 | ||||||||||||||||||
| Class 529-A – actual return | 1,000.00 | 1,026.18 | 2.09 | .41 | 3.63 | .71 | ||||||||||||||||||
| Class 529-A – assumed 5% return | 1,000.00 | 1,023.14 | 2.09 | .41 | 3.62 | .71 | ||||||||||||||||||
| Class 529-B – actual return | 1,000.00 | 1,023.30 | 5.92 | 1.16 | 7.45 | 1.46 | ||||||||||||||||||
| Class 529-B – assumed 5% return | 1,000.00 | 1,019.36 | 5.90 | 1.16 | 7.43 | 1.46 | ||||||||||||||||||
| Class 529-C – actual return | 1,000.00 | 1,022.41 | 5.96 | 1.17 | 7.49 | 1.47 | ||||||||||||||||||
| Class 529-C – assumed 5% return | 1,000.00 | 1,019.31 | 5.96 | 1.17 | 7.48 | 1.47 | ||||||||||||||||||
| Class 529-E – actual return | 1,000.00 | 1,025.80 | 3.27 | .64 | 4.80 | .94 | ||||||||||||||||||
| Class 529-E – assumed 5% return | 1,000.00 | 1,021.98 | 3.26 | .64 | 4.79 | .94 | ||||||||||||||||||
| Class 529-F-1 – actual return | 1,000.00 | 1,027.26 | .92 | .18 | 2.45 | .48 | ||||||||||||||||||
| Class 529-F-1 – assumed 5% return | 1,000.00 | 1,024.30 | .92 | .18 | 2.45 | .48 | ||||||||||||||||||
| Class R-1 – actual return | 1,000.00 | 1,023.56 | 5.71 | 1.12 | 7.24 | 1.42 | ||||||||||||||||||
| Class R-1 – assumed 5% return | 1,000.00 | 1,019.56 | 5.70 | 1.12 | 7.22 | 1.42 | ||||||||||||||||||
| Class R-2 – actual return | 1,000.00 | 1,022.84 | 5.71 | 1.12 | 7.24 | 1.42 | ||||||||||||||||||
| Class R-2 – assumed 5% return | 1,000.00 | 1,019.56 | 5.70 | 1.12 | 7.22 | 1.42 | ||||||||||||||||||
| Class R-2E – actual return | 1,000.00 | 1,026.74 | 3.78 | .74 | 5.31 | 1.04 | ||||||||||||||||||
| Class R-2E – assumed 5% return | 1,000.00 | 1,021.48 | 3.77 | .74 | 5.30 | 1.04 | ||||||||||||||||||
| Class R-3 – actual return | 1,000.00 | 1,025.88 | 3.47 | .68 | 5.00 | .98 | ||||||||||||||||||
| Class R-3 – assumed 5% return | 1,000.00 | 1,021.78 | 3.47 | .68 | 4.99 | .98 | ||||||||||||||||||
| Class R-4 – actual return | 1,000.00 | 1,027.20 | 1.99 | .39 | 3.53 | .69 | ||||||||||||||||||
| Class R-4 – assumed 5% return | 1,000.00 | 1,023.24 | 1.99 | .39 | 3.52 | .69 | ||||||||||||||||||
| Class R-5E – actual return | 1,000.00 | 1,027.36 | 1.33 | .26 | 2.86 | .56 | ||||||||||||||||||
| Class R-5E – assumed 5% return | 1,000.00 | 1,023.89 | 1.33 | .26 | 2.85 | .56 | ||||||||||||||||||
| Class R-5 – actual return | 1,000.00 | 1,028.65 | .41 | .08 | 1.94 | .38 | ||||||||||||||||||
| Class R-5 – assumed 5% return | 1,000.00 | 1,024.80 | .41 | .08 | 1.94 | .38 | ||||||||||||||||||
| Class R-6 – actual return | 1,000.00 | 1,028.95 | .10 | .02 | 1.64 | .32 | ||||||||||||||||||
| Class R-6 – assumed 5% return | 1,000.00 | 1,025.10 | .10 | .02 | 1.63 | .32 | ||||||||||||||||||
| 70 | American Funds Portfolio Series |
Tax-Advantaged Income Portfolio
| Beginning | Ending | Expenses | Effective | Effective | ||||||||||||||||||||
| account value | account value | paid during | Annualized | expenses paid | annualized | |||||||||||||||||||
| 5/1/2016 | 10/31/2016 | period1,2 | expense ratio2 | during period3 | expense ratio4 | |||||||||||||||||||
| Class A – actual return | $ | 1,000.00 | $ | 1,022.49 | $ | 2.04 | .40 | % | $ | 3.87 | .76 | % | ||||||||||||
| Class A – assumed 5% return | 1,000.00 | 1,023.19 | 2.04 | .40 | 3.87 | .76 | ||||||||||||||||||
| Class B – actual return | 1,000.00 | 1,018.39 | 5.24 | 1.03 | 7.07 | 1.39 | ||||||||||||||||||
| Class B – assumed 5% return | 1,000.00 | 1,020.01 | 5.24 | 1.03 | 7.07 | 1.39 | ||||||||||||||||||
| Class C – actual return | 1,000.00 | 1,017.68 | 5.65 | 1.11 | 7.48 | 1.47 | ||||||||||||||||||
| Class C – assumed 5% return | 1,000.00 | 1,019.61 | 5.65 | 1.11 | 7.48 | 1.47 | ||||||||||||||||||
| Class F-1 – actual return | 1,000.00 | 1,021.78 | 1.99 | .39 | 3.82 | .75 | ||||||||||||||||||
| Class F-1 – assumed 5% return | 1,000.00 | 1,023.24 | 1.99 | .39 | 3.82 | .75 | ||||||||||||||||||
| Class F-2 – actual return | 1,000.00 | 1,023.05 | .66 | .13 | 2.50 | .49 | ||||||||||||||||||
| Class F-2 – assumed 5% return | 1,000.00 | 1,024.55 | .66 | .13 | 2.50 | .49 | ||||||||||||||||||
See page 73 for footnotes.
| American Funds Portfolio Series | 71 |
Preservation Portfolio
| Beginning | Ending | Expenses | Effective | Effective | ||||||||||||||||||||
| account value | account value | paid during | Annualized | expenses paid | annualized | |||||||||||||||||||
| 5/1/2016 | 10/31/2016 | period1,2 | expense ratio2 | during period3 | expense ratio4 | |||||||||||||||||||
| Class A – actual return | $ | 1,000.00 | $ | 1,006.66 | $ | 1.87 | .37 | % | $ | 3.39 | .67 | % | ||||||||||||
| Class A – assumed 5% return | 1,000.00 | 1,023.34 | 1.89 | .37 | 3.41 | .67 | ||||||||||||||||||
| Class B – actual return | 1,000.00 | 1,002.94 | 5.76 | 1.14 | 7.27 | 1.44 | ||||||||||||||||||
| Class B – assumed 5% return | 1,000.00 | 1,019.46 | 5.80 | 1.14 | 7.32 | 1.44 | ||||||||||||||||||
| Class C – actual return | 1,000.00 | 1,002.88 | 5.60 | 1.11 | 7.12 | 1.41 | ||||||||||||||||||
| Class C – assumed 5% return | 1,000.00 | 1,019.61 | 5.65 | 1.11 | 7.17 | 1.41 | ||||||||||||||||||
| Class F-1 – actual return | 1,000.00 | 1,006.58 | 1.97 | .39 | 3.49 | .69 | ||||||||||||||||||
| Class F-1 – assumed 5% return | 1,000.00 | 1,023.24 | 1.99 | .39 | 3.52 | .69 | ||||||||||||||||||
| Class F-2 – actual return | 1,000.00 | 1,007.95 | .66 | .13 | 2.18 | .43 | ||||||||||||||||||
| Class F-2 – assumed 5% return | 1,000.00 | 1,024.55 | .66 | .13 | 2.19 | .43 | ||||||||||||||||||
| Class 529-A – actual return | 1,000.00 | 1,006.49 | 2.07 | .41 | 3.59 | .71 | ||||||||||||||||||
| Class 529-A – assumed 5% return | 1,000.00 | 1,023.14 | 2.09 | .41 | 3.62 | .71 | ||||||||||||||||||
| Class 529-B – actual return | 1,000.00 | 1,002.77 | 6.11 | 1.21 | 7.62 | 1.51 | ||||||||||||||||||
| Class 529-B – assumed 5% return | 1,000.00 | 1,019.11 | 6.16 | 1.21 | 7.68 | 1.51 | ||||||||||||||||||
| Class 529-C – actual return | 1,000.00 | 1,002.61 | 6.01 | 1.19 | 7.52 | 1.49 | ||||||||||||||||||
| Class 529-C – assumed 5% return | 1,000.00 | 1,019.21 | 6.06 | 1.19 | 7.58 | 1.49 | ||||||||||||||||||
| Class 529-E – actual return | 1,000.00 | 1,005.24 | 3.29 | .65 | 4.80 | .95 | ||||||||||||||||||
| Class 529-E – assumed 5% return | 1,000.00 | 1,021.93 | 3.31 | .65 | 4.84 | .95 | ||||||||||||||||||
| Class 529-F-1 – actual return | 1,000.00 | 1,007.58 | .96 | .19 | 2.48 | .49 | ||||||||||||||||||
| Class 529-F-1 – assumed 5% return | 1,000.00 | 1,024.25 | .97 | .19 | 2.50 | .49 | ||||||||||||||||||
| Class R-1 – actual return | 1,000.00 | 1,002.70 | 5.70 | 1.13 | 7.22 | 1.43 | ||||||||||||||||||
| Class R-1 – assumed 5% return | 1,000.00 | 1,019.51 | 5.75 | 1.13 | 7.27 | 1.43 | ||||||||||||||||||
| Class R-2 – actual return | 1,000.00 | 1,002.10 | 5.85 | 1.16 | 7.37 | 1.46 | ||||||||||||||||||
| Class R-2 – assumed 5% return | 1,000.00 | 1,019.36 | 5.90 | 1.16 | 7.43 | 1.46 | ||||||||||||||||||
| Class R-2E – actual return | 1,000.00 | 1,003.89 | 4.14 | .82 | 5.66 | 1.12 | ||||||||||||||||||
| Class R-2E – assumed 5% return | 1,000.00 | 1,021.07 | 4.18 | .82 | 5.70 | 1.12 | ||||||||||||||||||
| Class R-3 – actual return | 1,000.00 | 1,004.98 | 3.54 | .70 | 5.05 | 1.00 | ||||||||||||||||||
| Class R-3 – assumed 5% return | 1,000.00 | 1,021.68 | 3.57 | .70 | 5.09 | 1.00 | ||||||||||||||||||
| Class R-4 – actual return | 1,000.00 | 1,006.60 | 1.97 | .39 | 3.49 | .69 | ||||||||||||||||||
| Class R-4 – assumed 5% return | 1,000.00 | 1,023.24 | 1.99 | .39 | 3.52 | .69 | ||||||||||||||||||
| Class R-5E – actual return | 1,000.00 | 1,007.15 | 1.32 | .26 | 2.83 | .56 | ||||||||||||||||||
| Class R-5E – assumed 5% return | 1,000.00 | 1,023.89 | 1.33 | .26 | 2.85 | .56 | ||||||||||||||||||
| Class R-5 – actual return | 1,000.00 | 1,008.13 | .46 | .09 | 1.97 | .39 | ||||||||||||||||||
| Class R-5 – assumed 5% return | 1,000.00 | 1,024.75 | .46 | .09 | 1.99 | .39 | ||||||||||||||||||
| Class R-6 – actual return | 1,000.00 | 1,008.44 | .15 | .03 | 1.67 | .33 | ||||||||||||||||||
| Class R-6 – assumed 5% return | 1,000.00 | 1,025.05 | .15 | .03 | 1.68 | .33 | ||||||||||||||||||
| 72 | American Funds Portfolio Series |
Tax-Exempt Preservation Portfolio
| Beginning | Ending | Expenses | Effective | Effective | ||||||||||||||||||||
| account value | account value | paid during | Annualized | expenses paid | annualized | |||||||||||||||||||
| 5/1/2016 | 10/31/2016 | period1,2 | expense ratio2 | during period3 | expense ratio4 | |||||||||||||||||||
| Class A – actual return | $ | 1,000.00 | $ | 1,002.63 | $ | 2.12 | .42 | % | $ | 3.63 | .72 | % | ||||||||||||
| Class A – assumed 5% return | 1,000.00 | 1,023.09 | 2.14 | .42 | 3.67 | .72 | ||||||||||||||||||
| Class B – actual return | 1,000.00 | 999.12 | 5.59 | 1.11 | 7.10 | 1.41 | ||||||||||||||||||
| Class B – assumed 5% return | 1,000.00 | 1,019.61 | 5.65 | 1.11 | 7.17 | 1.41 | ||||||||||||||||||
| Class C – actual return | 1,000.00 | 999.08 | 5.64 | 1.12 | 7.16 | 1.42 | ||||||||||||||||||
| Class C – assumed 5% return | 1,000.00 | 1,019.56 | 5.70 | 1.12 | 7.22 | 1.42 | ||||||||||||||||||
| Class F-1 – actual return | 1,000.00 | 1,001.83 | 2.02 | .40 | 3.53 | .70 | ||||||||||||||||||
| Class F-1 – assumed 5% return | 1,000.00 | 1,023.19 | 2.04 | .40 | 3.57 | .70 | ||||||||||||||||||
| Class F-2 – actual return | 1,000.00 | 1,004.00 | .71 | .14 | 2.22 | .44 | ||||||||||||||||||
| Class F-2 – assumed 5% return | 1,000.00 | 1,024.50 | .71 | .14 | 2.24 | .44 | ||||||||||||||||||
| 1 | The “expenses paid during period” are equal to the “annualized expense ratio,” multiplied by the average account value over the period, multiplied by the number of days in the period, and divided by 365 (to reflect the one-half year period). |
| 2 | The “expenses paid during period” and “annualized expense ratio” do not include the expenses of the underlying funds in which each fund invests. |
| 3 | The “effective expenses paid during period” are equal to the “effective annualized expense ratio,” multiplied by the average account value over the period, multiplied by the number of days in the period, and divided by 365 (to reflect the one-half year period). |
| 4 | The “effective annualized expense ratio” reflects the net annualized expense ratio of the class plus the class’s pro-rata share of the weighted average expense ratio of the underlying funds in which it invests. The annualized weighted average expense ratio of the underlying funds for the period reflects the net actual expense ratio of each underlying fund for the period, annualized and weighted for the fund’s relative average investment therein during the period. |
| American Funds Portfolio Series | 73 |
Board of trustees and other officers
Independent trustees1
| Name and year of birth | Year first elected a trustee of the series2 | Principal occupation(s) during past five years | Number of portfolios in fund complex overseen by trustee | Other directorships3 held by trustee | ||||
| William H. Baribault, 1945 | 2012 | CEO and President, Richard Nixon Foundation; Chairman of the Board and CEO, Oakwood Enterprises (private investment and consulting) | 81 | General Finance Corporation | ||||
| James G. Ellis, 1947 | 2012 | Dean and Professor of Marketing, Marshall School of Business, University of Southern California | 81 | Mercury General Corporation | ||||
| Leonard R. Fuller, 1946 | 2012 | Private investor; former President and CEO, Fuller Consulting (financial management consulting) | 81 | None | ||||
| R. Clark Hooper, 1946 (Chairman of the Board Independent and Non-Executive) | 2012 | Private investor | 81 | None | ||||
| Merit E. Janow, 1958 | 2012 | Dean and Professor, Columbia University, School of International and Public Affairs | 80 | MasterCard Incorporated; Trimble Navigation Limited | ||||
| Laurel B. Mitchell, PhD, 1955 | 2012 | Distinguished Professor of Accounting, University of Redlands; former Director, Accounting Program, University of Redlands | 77 | None | ||||
| Frank M. Sanchez, 1943 | 2012 | Principal, The Sanchez Family Corporation dba McDonald’s Restaurants (McDonald’s licensee) | 77 | None | ||||
| Margaret Spellings, 1957 | 2012 | President, The University of North Carolina; former President, George W. Bush Foundation; former President and CEO, Margaret Spellings & Company (public policy and strategic consulting); former President, U.S. Chamber Foundation and Senior Advisor to the President and CEO, U.S. Chamber of Commerce | 82 | ClubCorp Holdings, Inc. | ||||
| Steadman Upham, PhD, 1949 | 2012 | President Emeritus and University Professor, The University of Tulsa | 80 | None |
Interested trustee4,5
| Name, year of birth and position with series | Year first elected a trustee or officer of the series2 | Principal occupation(s) during past five years and positions held with affiliated entities or the principal underwriter of the series | Number of portfolios in fund complex overseen by trustee | Other directorships3 held by trustee | ||||
| Bradley J. Vogt, 1965 Vice Chairman of the Board | 2012 | Chairman, Capital Research Company;6 Partner — Capital Research Global Investors, Capital Research and Management Company; Director, The Capital Group Companies, Inc.6 | 18 | None |
The series statement of additional information includes further details about the series trustees and is available without charge upon request by calling American Funds Service Company at (800) 421-4225 or by visiting the American Funds website at americanfunds.com. The address for all trustees and officers of the series is 333 South Hope Street, Los Angeles, CA 90071, Attention: Secretary.
| 74 | American Funds Portfolio Series |
Other officers5
| Name, year of birth and position with series | Year first elected an officer of the series2 | Principal occupation(s) during past five years and positions held with affiliated entities or the principal underwriter of the series | ||
| Walter R. Burkley, 1966 President | 2012 | Senior Vice President and Senior Counsel — Fund Business Management Group, Capital Research and Management Company; Director, Capital Research Company6 | ||
| Alan N. Berro, 1960 Senior Vice President | 2012 | Partner — Capital World Investors, Capital Research and Management Company; Director, Capital Research and Management Company | ||
| Joanna F. Jonsson, 1963 Senior Vice President | 2014 | Partner — Capital World Investors, Capital Research and Management Company; Director, Capital Research and Management Company; Partner — Capital World Investors, Capital Bank and Trust Company6 | ||
| James B. Lovelace, 1956 Senior Vice President | 2012 | Partner — Capital Research Global Investors, Capital Research and Management Company; Director, Capital Research and Management Company | ||
| Wesley K.-S. Phoa, 1966 Senior Vice President | 2012 | Partner — Capital Fixed Income Investors, Capital Research and Management Company; Partner — Capital Fixed Income Investors, Capital Bank and Trust Company;6 Vice President, Capital Strategy Research, Inc.6 | ||
| John H. Smet, 1956 Senior Vice President | 2012 | Partner — Capital Fixed Income Investors, Capital Research and Management Company; Director, Capital Research and Management Company | ||
| Andrew B. Suzman, 1967 Senior Vice President | 2012 | Partner — Capital World Investors, Capital Research and Management Company; Director, Capital Strategy Research, Inc.;6 Director, The Capital Group Companies, Inc.6 | ||
| Maria T. Manotok, 1974 Vice President | 2012 | Senior Vice President and Senior Counsel — Fund Business Management Group, Capital Research and Management Company; Director, Capital Guardian Trust Company6 | ||
| Steven I. Koszalka, 1964 Secretary | 2012 | Vice President — Fund Business Management Group, Capital Research and Management Company | ||
| Gregory F. Niland, 1971 Treasurer | 2012 | Vice President — Investment Operations, Capital Research and Management Company | ||
| Susan K. Countess, 1966 Assistant Secretary | 2014 | Associate — Fund Business Management Group, Capital Research and Management Company | ||
| Brian C. Janssen, 1972 Assistant Treasurer | 2015 | Vice President — Investment Operations, Capital Research and Management Company | ||
| Dori Laskin, 1951 Assistant Treasurer | 2012 | Vice President — Investment Operations, Capital Research and Management Company |
| 1 | The term independent trustee refers to a director who is not an “interested person” of the series within the meaning of the Investment Company Act of 1940. |
| 2 | Trustees and officers of the series serve until their resignation, removal or retirement. |
| 3 | This includes all directorships/trusteeships (other than those in the American Funds or other funds managed by Capital Research and Management Company or its affiliates) that are held by each trustee as a trustee or director of a public company or a registered investment company. |
| 4 | The term interested trustee refers to a trustee who is an “interested person” within the meaning of the Investment Company Act of 1940, on the basis of their affiliation with the series investment adviser, Capital Research and Management Company, or affiliated entities (including the series principal underwriter). |
| 5 | All of the directors/trustees and/or officers listed are officers and/or directors/trustees of one or more of the other funds for which Capital Research and Management Company serves as investment adviser. |
| 6 | Company affiliated with Capital Research and Management Company. |
| American Funds Portfolio Series | 75 |
Office of the series
6455 Irvine Center Drive
Irvine, CA 92618-4518
Investment adviser
Capital Research and Management Company
333 South Hope Street
Los Angeles, CA 90071-1406
Transfer agent for shareholder accounts
American Funds Service Company
(Write to the address near you.)
P.O. Box 6007
Indianapolis, IN 46206-6007
P.O. Box 2280
Norfolk, VA 23501-2280
Custodian of assets
JPMorgan Chase Bank
270 Park Avenue
New York, NY 10017-2070
Counsel
Morgan, Lewis & Bockius LLP
300 South Grand Avenue, 22nd Floor
Los Angeles, CA 90071-3132
Independent registered public accounting firm
Deloitte & Touche LLP
695 Town Center Drive
Suite 1200
Costa Mesa, CA 92626-7188
Principal underwriter
American Funds Distributors, Inc.
333 South Hope Street
Los Angeles, CA 90071-1406
| 76 | American Funds Portfolio Series |
Investors should carefully consider investment objectives, risks, charges and expenses. This and other important information is contained in the series prospectus and summary prospectuses, which can be obtained from your financial professional and should be read carefully before investing. You may also call American Funds Service Company (AFS) at (800) 421-4225 or visit the American Funds website at americanfunds.com.
“Proxy Voting Guidelines for American Funds Portfolio Series” — which describes how we vote proxies relating to the underlying funds held in the portfolios — is available on the American Funds website or upon request by calling AFS. The series files its proxy voting record with the U.S. Securities and Exchange Commission (SEC) for the 12 months ended June 30 by August 31. The proxy voting record is available free of charge on the SEC website at sec.gov and on the American Funds website.
Visit the American Funds website for more information on the securities held by the underlying funds in the American Funds Portfolio Series’ portfolios.
American Funds Portfolio Series files a complete list of its portfolio holdings with the SEC for the first and third quarters of each fiscal year on Form N-Q. This filing is available free of charge on the SEC website. You may also review or, for a fee, copy this filing at the SEC’s Public Reference Room in Washington, D.C. Additional information regarding the operation of the Public Reference Room may be obtained by calling the SEC’s Office of Investor Education and Advocacy at (800) SEC-0330. Additionally, the list of portfolio holdings is available by calling AFS.
This report is for the information of shareholders of American Funds Portfolio Series, but it also may be used as sales literature when preceded or accompanied by the current prospectus, which gives details about charges, expenses, investment objectives and operating policies of the series. If used as sales material after December 31, 2016, this report must be accompanied by an American Funds statistical update for the most recently completed calendar quarter.
Bloomberg® is a trademark of Bloomberg Finance L.P. (collectively with its affiliates, “Bloomberg”). Barclays® is a trademark of Barclays Bank Plc (collectively with its affiliates, “Barclays”), used under license. Neither Bloomberg nor Barclays approves or endorses this material, guarantees the accuracy or completeness of any information herein and, to the maximum extent allowed by law, neither shall have any liability or responsibility for injury or damages arising in connection therewith.
MSCI has not approved, reviewed or produced this report, makes no express or implied warranties or representations and is not liable whatsoever for any data in the report. You may not redistribute the MSCI data or use it as a basis for other indices or investment products.
The Standard and Poor’s 500 Composite Index (“Index”) is a product of S&P Dow Jones Indices LLC and/or its affiliates and has been licensed for use by Capital Group. Copyright© 2016 S&P Dow Jones Indices LLC, a division of S&P Global, and/or its affiliates. All rights reserved. Redistribution or reproduction in whole or in part are prohibited without written permission of S&P Dow Jones Indices LLC.
The American Funds Advantage®
Since 1931, American Funds, part of Capital Group, has helped investors pursue long-term investment success. Our consistent approach — in combination with The Capital SystemSM — has resulted in a superior long-term track record.
Aligned with investor success
We base our decisions on a long-term perspective, which we believe aligns our goals with the interests of our clients. Our portfolio managers average 27 years of investment experience, including 22 years at our company, reflecting a career commitment to our long-term approach.1
The Capital SystemSM
The Capital System combines individual accountability with teamwork. Funds using The Capital System are divided into portions that are managed independently by investment professionals with diverse backgrounds, ages and investment approaches. An extensive global research effort is the backbone of our system.
Superior long-term track record
Our equity funds have beaten their Lipper peer indexes in 91% of 10-year periods and 95% of 20-year periods. Our fixed income funds have beaten their Lipper indexes in 58% of 10-year periods and 58% of 20-year periods.2 Our fund management fees have been among the lowest in the industry.3
| 1 | Portfolio manager experience as of December 31, 2015. |
| 2 | Based on Class A share results for rolling periods through December 31, 2015. Periods covered are the shorter of the fund’s lifetime or since the comparable Lipper index inception date (except Capital Income Builder and SMALLCAP World Fund, for which the Lipper average was used). |
| 3 | On average, our management fees were in the lowest quintile 68% of the time, based on the 20-year period ended December 31, 2015, versus comparable Lipper categories, excluding funds of funds. |

ITEM 2 – Code of Ethics
The Registrant has adopted a Code of Ethics that applies to its Principal Executive Officer and Principal Financial Officer. The Registrant undertakes to provide to any person without charge, upon request, a copy of the Code of Ethics. Such request can be made to American Funds Service Company at 800/421-9225 or to the Secretary of the Registrant, 6455 Irvine Center Drive, Irvine, California 92618.
ITEM 3 – Audit Committee Financial Expert
The Registrant’s board has determined that Laurel B. Mitchell, a member of the Registrant’s audit committee, is an “audit committee financial expert” and "independent," as such terms are defined in this Item. This designation will not increase the designee’s duties, obligations or liability as compared to his or her duties, obligations and liability as a member of the audit committee and of the board, nor will it reduce the responsibility of the other audit committee members. There may be other individuals who, through education or experience, would qualify as "audit committee financial experts" if the board had designated them as such. Most importantly, the board believes each member of the audit committee contributes significantly to the effective oversight of the Registrant’s financial statements and condition.
ITEM 4 – Principal Accountant Fees and Services
Registrant:
a) Audit Fees:
2015 $62,000
2016 $81,000
b) Audit-Related Fees:
2015 $5,000
2016 $6,000
c) Tax Fees:
2015 $16,000
2016 $29,000
The tax fees consist of professional services relating to the preparation of the Registrant’s tax returns.
d) All Other Fees:
2015 None
2016 None
Adviser and affiliates (includes only fees for non-audit services billed to the adviser and affiliates for engagements that relate directly to the operations and financial reporting of the Registrant and were subject to the pre-approval policies described below):
a) Audit Fees:
Not Applicable
b) Audit-Related Fees:
2015 $1,143,000
2016 $1,138,000
The audit-related fees consist of assurance and related services relating to the examination of the Registrant’s transfer agent, principal underwriter and investment adviser conducted in accordance with Statement on Standards for Attestation Engagements Number 16 issued by the American Institute of Certified Public Accountants.
c) Tax Fees:
2015 None
2016 None
The tax fees consist of consulting services relating to the Registrant’s investments.
d) All Other Fees:
2015 $5,000
2016 $3,000
The other fees consist of subscription services related to an accounting research tool.
All audit and permissible non-audit services that the Registrant’s audit committee considers compatible with maintaining the independent registered public accounting firm’s independence are required to be pre-approved by the committee. The pre-approval requirement will extend to all non-audit services provided to the Registrant, the investment adviser, and any entity controlling, controlled by, or under common control with the investment adviser that provides ongoing services to the Registrant, if the engagement relates directly to the operations and financial reporting of the Registrant. The committee will not delegate its responsibility to pre-approve these services to the investment adviser. The committee may delegate to one or more committee members the authority to review and pre-approve audit and permissible non-audit services. Actions taken under any such delegation will be reported to the full committee at its next meeting. The pre-approval requirement is waived with respect to non-audit services if certain conditions are met. The pre-approval requirement was not waived for any of the non-audit services listed above provided to the Registrant, adviser and affiliates.
Aggregate non-audit fees paid to the Registrant’s auditors, including fees for all services billed to the Registrant, adviser and affiliates that provide ongoing services to the Registrant, were $1,445,000 for fiscal year 2015 and $1,228,000 for fiscal year 2016. The non-audit services represented by these amounts were brought to the attention of the committee and considered to be compatible with maintaining the auditors’ independence.
ITEM 5 – Audit Committee of Listed Registrants
Not applicable to this Registrant, insofar as the Registrant is not a listed issuer as defined in Rule 10A-3 under the Securities Exchange Act of 1934.
ITEM 6 – Schedule of Investments
Not applicable, insofar as the schedule is included as part of the report to shareholders filed under Item 1 of this Form.
ITEM 7 – Disclosure of Proxy Voting Policies and Procedures for Closed-End Management Investment Companies
Not applicable to this Registrant, insofar as the Registrant is not a closed-end management investment company.
ITEM 8 – Portfolio Managers of Closed-End Management Investment Companies
Not applicable to this Registrant, insofar as the Registrant is not a closed-end management investment company.
ITEM 9 – Purchases of Equity Securities by Closed-End Management Investment Company and Affiliated Purchasers
Not applicable to this Registrant, insofar as the Registrant is not a closed-end management investment company.
ITEM 10 – Submission of Matters to a Vote of Security Holders
There have been no material changes to the procedures by which shareholders may recommend nominees to the Registrant’s board of trustees since the Registrant last submitted a proxy statement to its shareholders. The procedures are as follows. The Registrant has a nominating and governance committee comprised solely of persons who are not considered ‘‘interested persons’’ of the Registrant within the meaning of the Investment Company Act of 1940, as amended. The committee periodically reviews such issues as the board’s composition, responsibilities, committees, compensation and other relevant issues, and recommends any appropriate changes to the full board of trustees. While the committee normally is able to identify from its own resources an ample number of qualified candidates, it will consider shareholder suggestions of persons to be considered as nominees to fill future vacancies on the board. Such suggestions must be sent in writing to the nominating and governance committee of the Registrant, c/o the Registrant’s Secretary, and must be accompanied by complete biographical and occupational data on the prospective nominee, along with a written consent of the prospective nominee for consideration of his or her name by the nominating and governance committee.
ITEM 11 – Controls and Procedures
| (a) | The Registrant’s Principal Executive Officer and Principal Financial Officer have concluded, based on their evaluation of the Registrant’s disclosure controls and procedures (as such term is defined in Rule 30a-3 under the Investment Company Act of 1940), that such controls and procedures are adequate and reasonably designed to achieve the purposes described in paragraph (c) of such rule. |
| (b) | There were no changes in the Registrant’s internal controls over financial reporting (as defined in Rule 30a-3(d) under the Investment Company Act of 1940) that occurred during the Registrant’s second fiscal quarter of the period covered by this report that has materially affected, or is reasonably likely to materially affect, the Registrant’s internal control over financial reporting. |
ITEM 12 – Exhibits
| (a)(1) | The Code of Ethics that is the subject of the disclosure required by Item 2 is attached as an exhibit hereto. |
| (a)(2) | The certifications required by Rule 30a-2 of the Investment Company Act of 1940 and Sections 302 and 906 of the Sarbanes-Oxley Act of 2002 are attached as exhibits hereto. |
SIGNATURES
Pursuant to the requirements of the Securities Exchange Act of 1934 and the Investment Company Act of 1940, the Registrant has duly caused this report to be signed on its behalf by the undersigned, thereunto duly authorized.
| AMERICAN FUNDS PORTFOLIO SERIES | |
| By /s/Walter R. Burkley | |
Walter R. Burkley, President and Principal Executive Officer | |
| Date: December 27, 2016 |
Pursuant to the requirements of the Securities Exchange Act of 1934 and the Investment Company Act of 1940, this report has been signed below by the following persons on behalf of the Registrant and in the capacities and on the dates indicated.
| By /s/Walter R. Burkley |
Walter R. Burkley, President and Principal Executive Officer |
| Date: December 27, 2016 |
| By _/s/ Gregory F. Niland____________________ |
Gregory F. Niland, Treasurer and Principal Financial Officer |
| Date: December 27, 2016 |