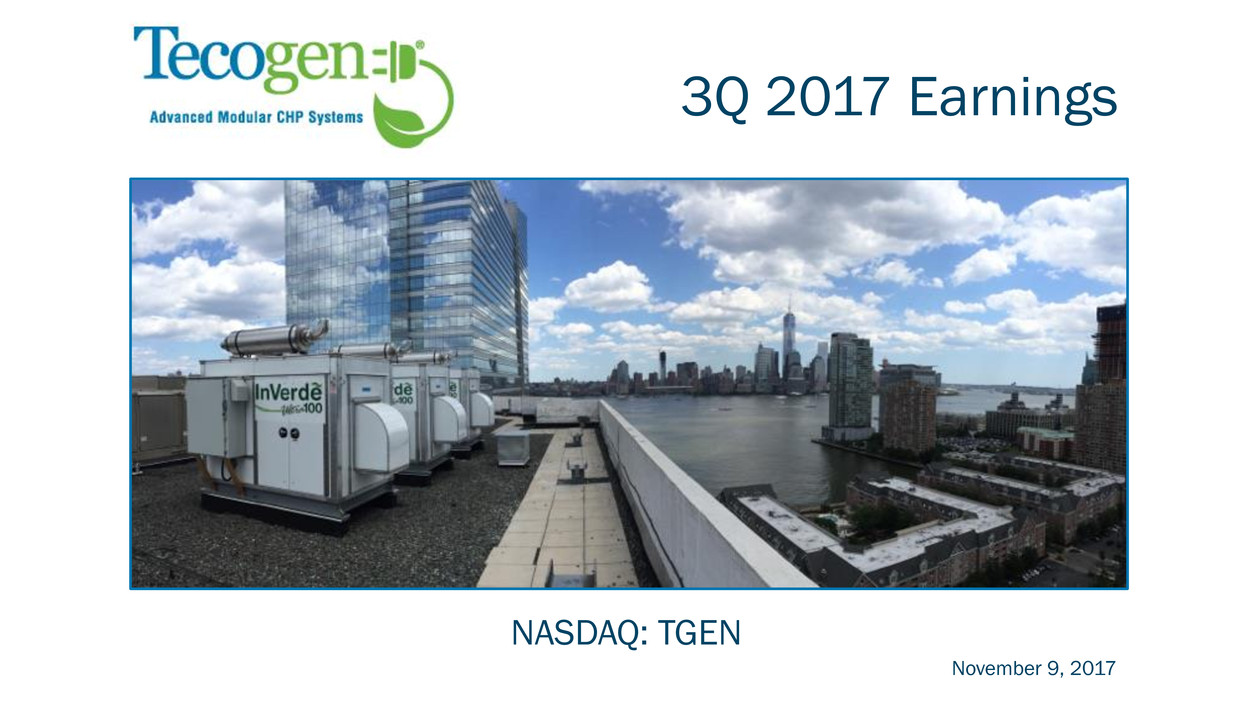
NASDAQ: TGEN 3Q 2017 Earnings November 9, 2017
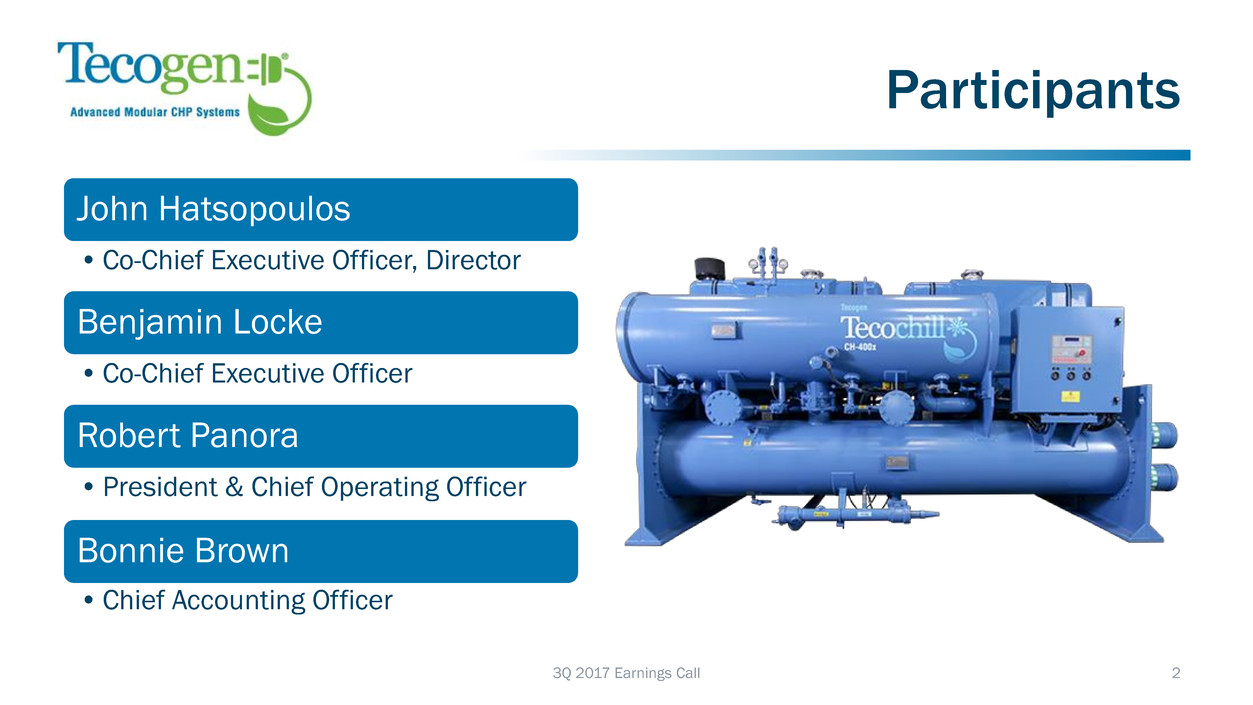
3Q 2017 Earnings Call 2 John Hatsopoulos •Co-Chief Executive Officer, Director Benjamin Locke •Co-Chief Executive Officer Robert Panora • President & Chief Operating Officer Bonnie Brown • Chief Accounting Officer Participants
3Q 2017 Earnings Call 3 This presentation This conference call and any accompanying documents, contain "forward-looking statements" within the meaning of the safe harbor provisions of the U.S. Private Securities Litigation Reform Act of 1995. Forward-looking statements can be identified by words such as: "anticipate," "intend," "plan," "goal," "seek," "believe," "project," "estimate," "expect," "strategy," "future," "likely," "may," "should," "will" and similar references to future periods. Examples of forward-looking statements include, among others, statements we make regarding: • Expected operating results, such as revenue growth, gross profit and backlog; and • Strategy for growth, product development, and market position. Forward-looking statements are neither historical facts nor assurances of future performance. Instead, they are based only on our current beliefs, expectations and assumptions regarding the future of our business, future plans and strategies, projections, anticipated events and trends, the economy and other future conditions. Because forward-looking statements relate to the future, they are subject to inherent uncertainties, risks and changes in circumstances that are difficult to predict and many of which are outside of our control. Our actual results and financial condition may differ materially from those indicated in the forward-looking statements. Therefore, you should not rely on any of these forward-looking statements. Important factors that could cause our actual results and financial condition to differ materially from those indicated in the forward-looking statements include, among others, the following: • Decrease in interest in our products. • The elimination of incentives and rebates related to our products. • Competing technological developments. • Issues in the research, development, and commercialization of new products. • Tecogen’s inability to obtain sufficient funding. AND • Such other factors as discussed throughout the "Risk Factors" section of Tecogen’s 10-K that was filed with the SEC on March 31, 2017 and can be found at www.sec.gov. Any forward-looking statement made by us in this conference call and any accompanying documents is based only on information currently available to us and speaks only as of the date on which it is made. We undertake no obligation to publicly update any forward-looking statement, whether written or oral, that may be made from time to time, whether as a result of new information, future developments or otherwise. Safe Harbor Statement
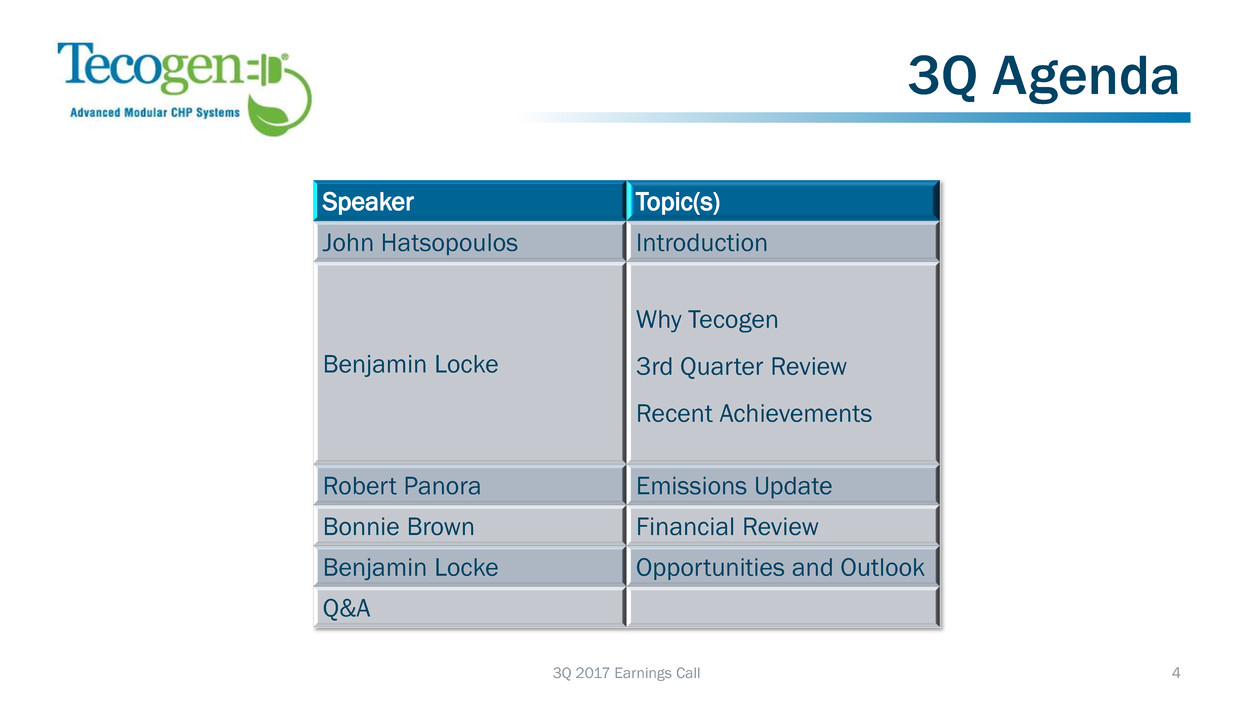
3Q 2017 Earnings Call 4 Speaker Topic(s) John Hatsopoulos Introduction Benjamin Locke Why Tecogen 3rd Quarter Review Recent Achievements Robert Panora Emissions Update Bonnie Brown Financial Review Benjamin Locke Opportunities and Outlook Q&A 3Q Agenda
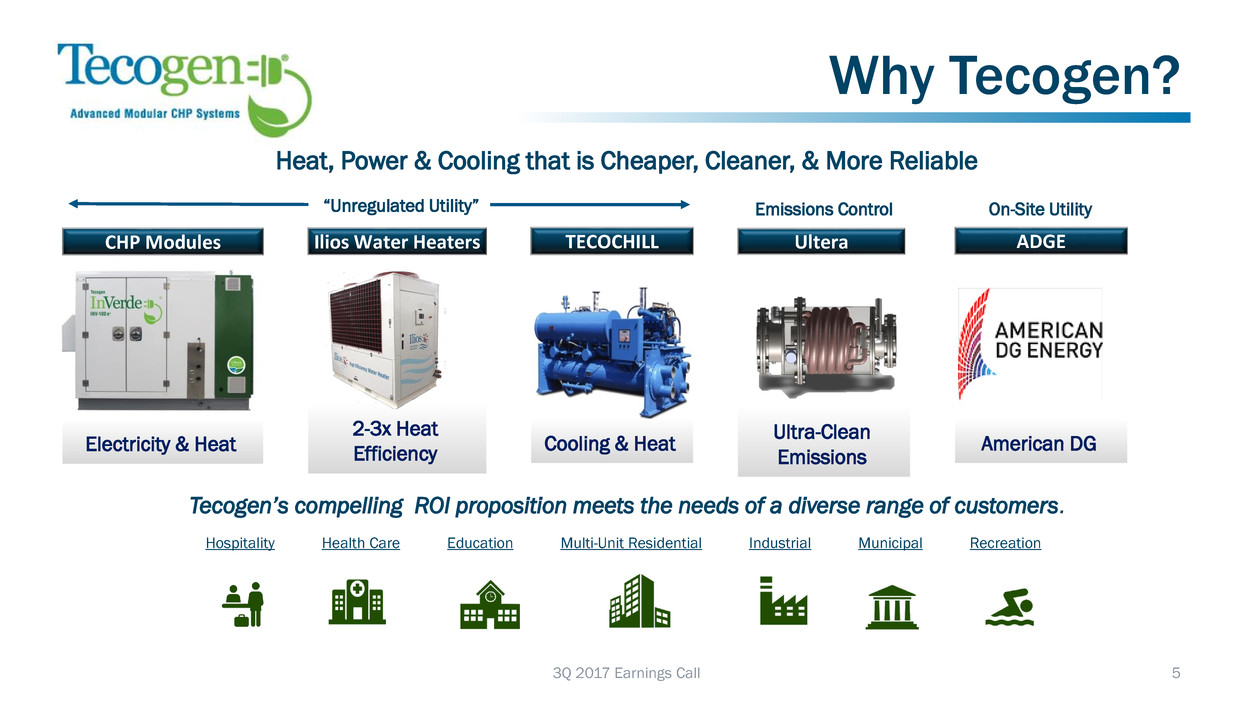
Heat, Power & Cooling that is Cheaper, Cleaner, & More Reliable Tecogen’s compelling ROI proposition meets the needs of a diverse range of customers. Hospitality Health Care Education Multi-Unit Residential Industrial Municipal Recreation “Unregulated Utility” CHP Modules Electricity & Heat Ilios Water Heaters 2-3x Heat Efficiency TECOCHILL Cooling & Heat Emissions Control Ultra-Clean Emissions Ultera On-Site Utility American DG ADGE 3Q 2017 Earnings Call 5 Why Tecogen?
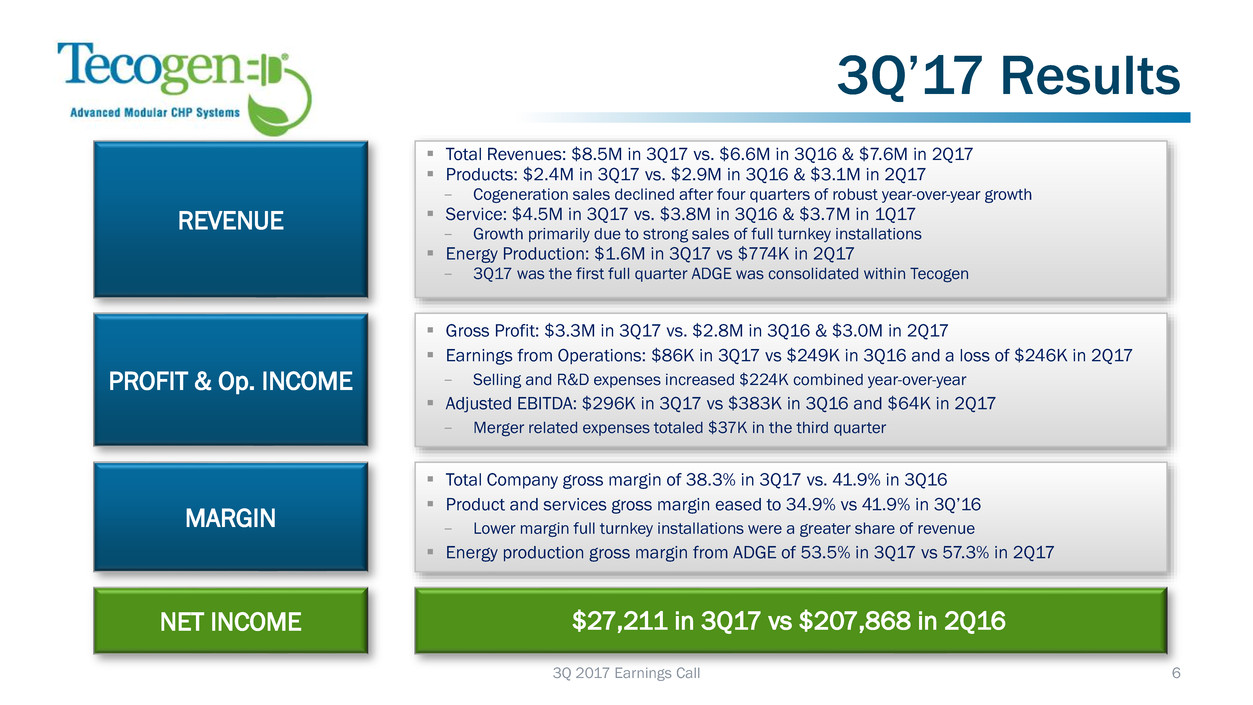
REVENUE ▪ Total Revenues: $8.5M in 3Q17 vs. $6.6M in 3Q16 & $7.6M in 2Q17 ▪ Products: $2.4M in 3Q17 vs. $2.9M in 3Q16 & $3.1M in 2Q17 − Cogeneration sales declined after four quarters of robust year-over-year growth ▪ Service: $4.5M in 3Q17 vs. $3.8M in 3Q16 & $3.7M in 1Q17 − Growth primarily due to strong sales of full turnkey installations ▪ Energy Production: $1.6M in 3Q17 vs $774K in 2Q17 − 3Q17 was the first full quarter ADGE was consolidated within Tecogen PROFIT & Op. INCOME ▪ Gross Profit: $3.3M in 3Q17 vs. $2.8M in 3Q16 & $3.0M in 2Q17 ▪ Earnings from Operations: $86K in 3Q17 vs $249K in 3Q16 and a loss of $246K in 2Q17 − Selling and R&D expenses increased $224K combined year-over-year ▪ Adjusted EBITDA: $296K in 3Q17 vs $383K in 3Q16 and $64K in 2Q17 − Merger related expenses totaled $37K in the third quarter MARGIN ▪ Total Company gross margin of 38.3% in 3Q17 vs. 41.9% in 3Q16 ▪ Product and services gross margin eased to 34.9% vs 41.9% in 3Q’16 − Lower margin full turnkey installations were a greater share of revenue ▪ Energy production gross margin from ADGE of 53.5% in 3Q17 vs 57.3% in 2Q17 NET INCOME $27,211 in 3Q17 vs $207,868 in 2Q16 3Q 2017 Earnings Call 6 3Q’17 Results
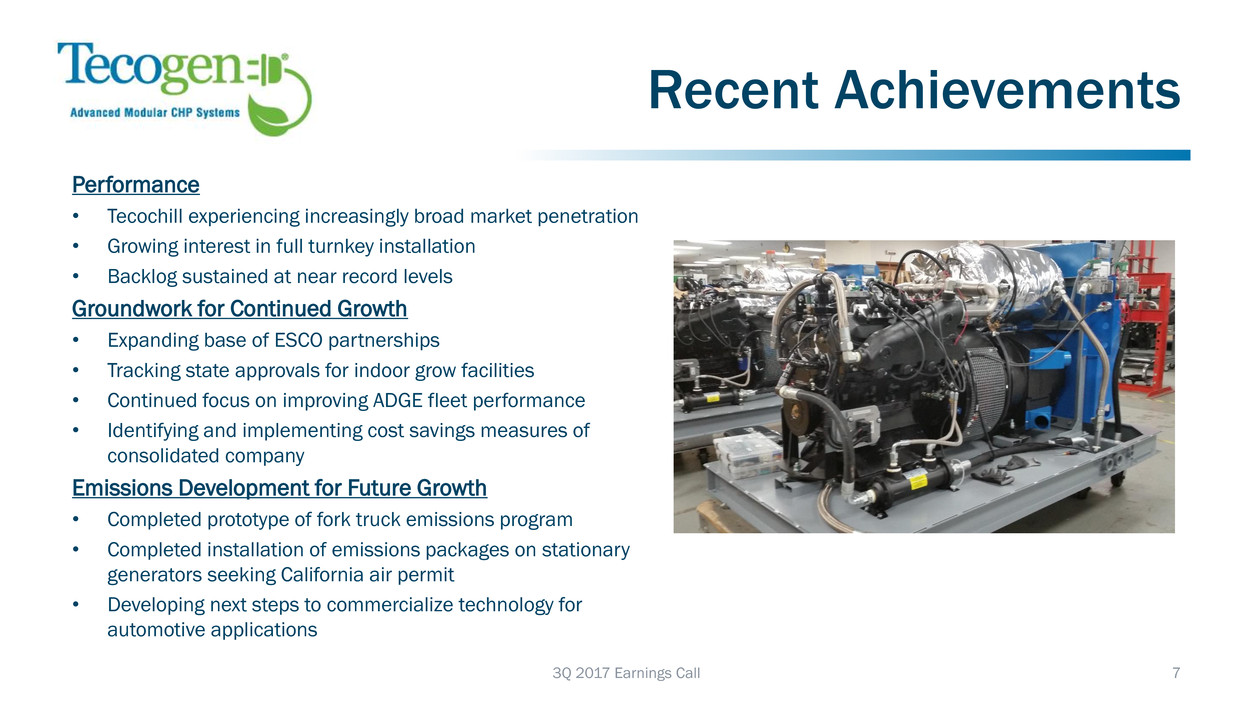
Performance • Tecochill experiencing increasingly broad market penetration • Growing interest in full turnkey installation • Backlog sustained at near record levels Groundwork for Continued Growth • Expanding base of ESCO partnerships • Tracking state approvals for indoor grow facilities • Continued focus on improving ADGE fleet performance • Identifying and implementing cost savings measures of consolidated company Emissions Development for Future Growth • Completed prototype of fork truck emissions program • Completed installation of emissions packages on stationary generators seeking California air permit • Developing next steps to commercialize technology for automotive applications 3Q 2017 Earnings Call 7 Recent Achievements
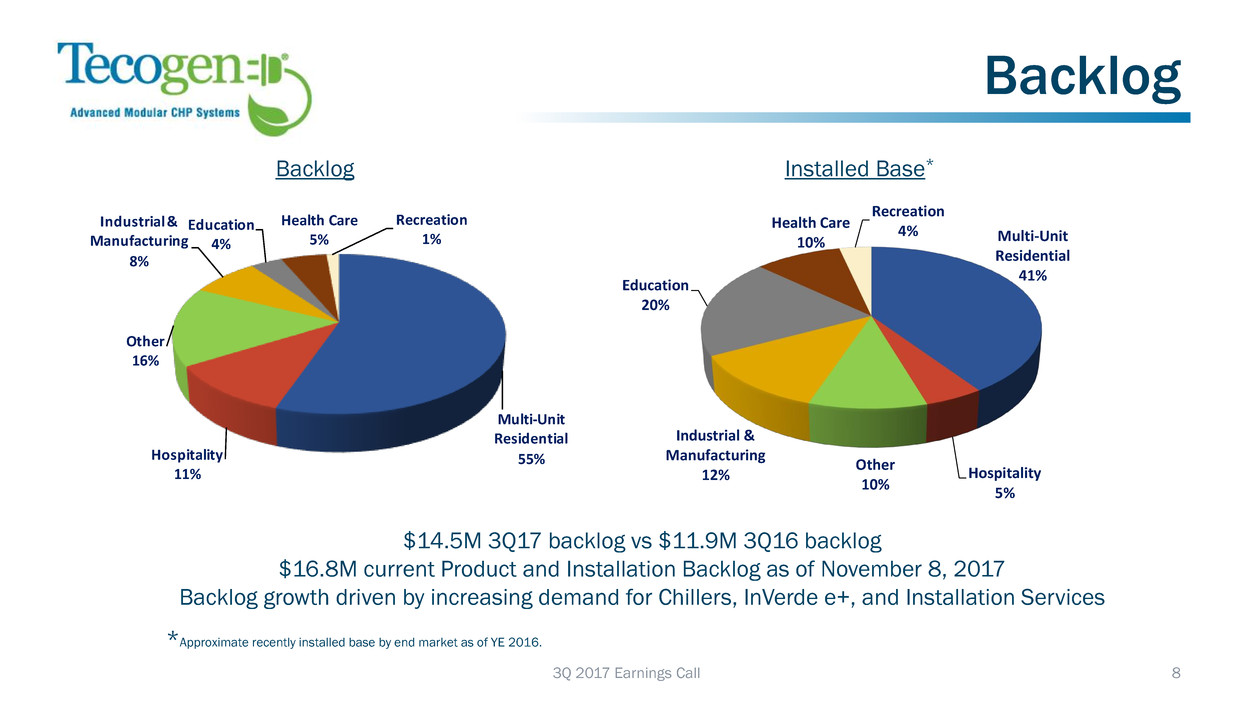
Installed Base* Backlog $14.5M 3Q17 backlog vs $11.9M 3Q16 backlog $16.8M current Product and Installation Backlog as of November 8, 2017 Backlog growth driven by increasing demand for Chillers, InVerde e+, and Installation Services *Approximate recently installed base by end market as of YE 2016. 3Q 2017 Earnings Call 8 Multi-Unit Residential 41% Hospitality 5% Other 10% Industrial & Manufacturing 12% Education 20% Health Care 10% Recreation 4% Multi-Unit Residential 55%Hospitality 11% Other 16% Industrial & Manufacturing 8% Education 4% Health Care 5% Recreation 1% Backlog
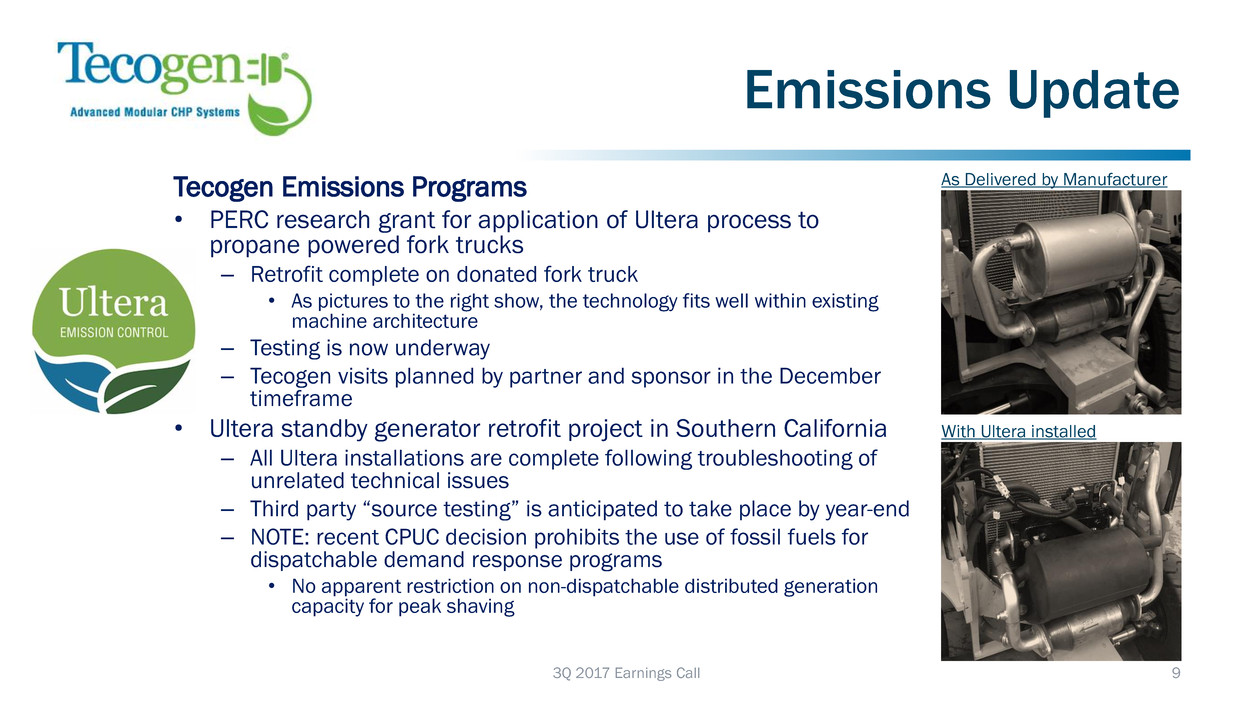
3Q 2017 Earnings Call 9 As Delivered by Manufacturer With Ultera installed Tecogen Emissions Programs • PERC research grant for application of Ultera process to propane powered fork trucks – Retrofit complete on donated fork truck • As pictures to the right show, the technology fits well within existing machine architecture – Testing is now underway – Tecogen visits planned by partner and sponsor in the December timeframe • Ultera standby generator retrofit project in Southern California – All Ultera installations are complete following troubleshooting of unrelated technical issues – Third party “source testing” is anticipated to take place by year-end – NOTE: recent CPUC decision prohibits the use of fossil fuels for dispatchable demand response programs • No apparent restriction on non-dispatchable distributed generation capacity for peak shaving Emissions Update
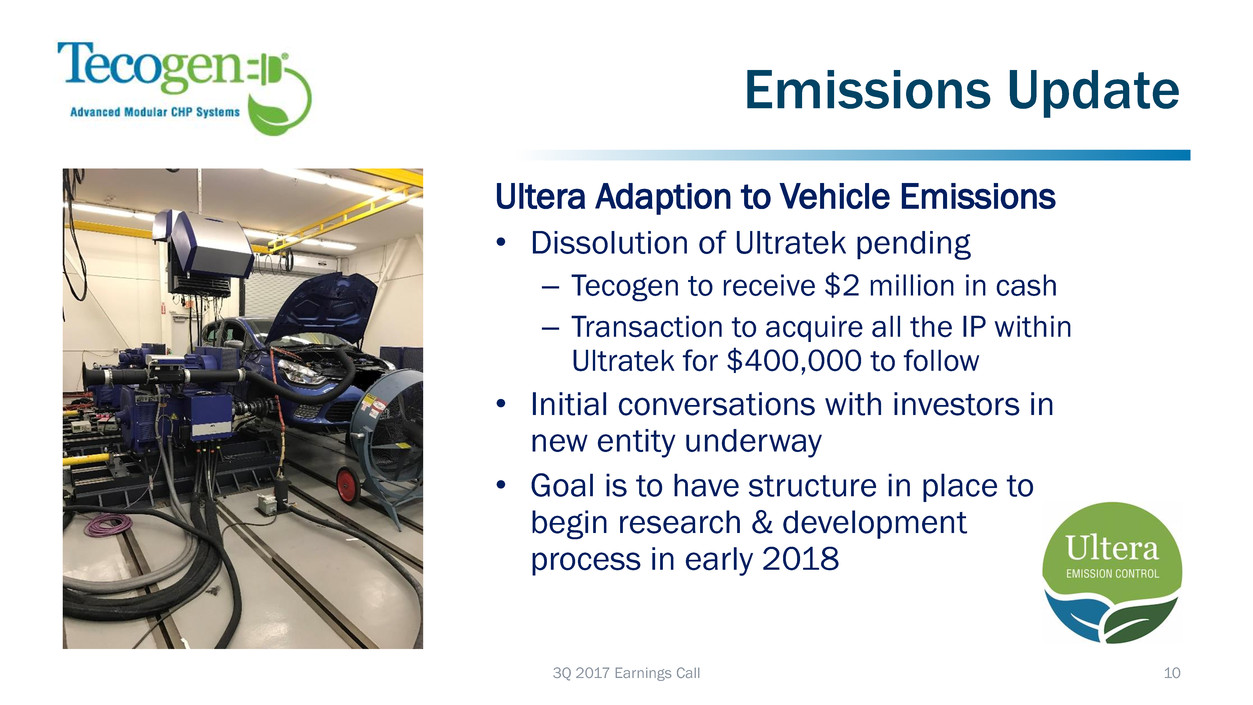
Ultera Adaption to Vehicle Emissions • Dissolution of Ultratek pending – Tecogen to receive $2 million in cash – Transaction to acquire all the IP within Ultratek for $400,000 to follow • Initial conversations with investors in new entity underway • Goal is to have structure in place to begin research & development process in early 2018 3Q 2017 Earnings Call 10 Emissions Update
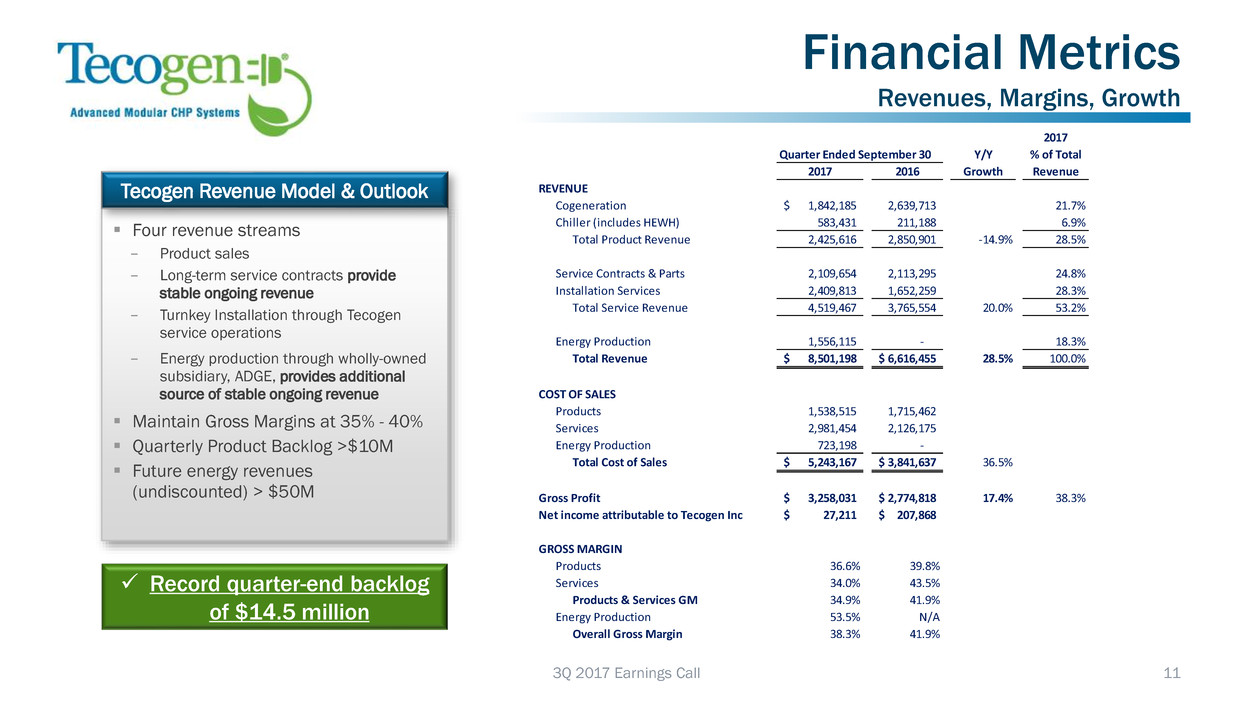
Financial Metrics Revenues, Margins, Growth ▪ Four revenue streams − Product sales − Long-term service contracts provide stable ongoing revenue − Turnkey Installation through Tecogen service operations − Energy production through wholly-owned subsidiary, ADGE, provides additional source of stable ongoing revenue ▪ Maintain Gross Margins at 35% - 40% ▪ Quarterly Product Backlog >$10M ▪ Future energy revenues (undiscounted) > $50M Tecogen Revenue Model & Outlook ✓ Record quarter-end backlog of $14.5 million 3Q 2017 Earnings Call 11 2017 Quarter Ended September 30 Y/Y % of Total 2017 2016 Growth Revenue REVENUE Cogeneration 1,842,185$ 2,639,713 21.7% Chiller (includes HEWH) 583,431 211,188 6.9% Total Product Revenue 2,425,616 2,850,901 -14.9% 28.5% Service Contracts & Parts 2,109,654 2,113,295 24.8% Installation Services 2,409,813 1,652,259 28.3% Total Service Revenue 4,519,467 3,765,554 20.0% 53.2% Energy Production 1,556,115 - 18.3% Total Revenue 8,501,198$ 6,616,455$ 28.5% 100.0% COST OF SALES Products 1,538,515 1,715,462 Services 2,981,454 2,126,175 Energy Production 723,198 - Total Cost of Sales 5,243,167$ 3,841,637$ 36.5% Gross Profit 3,258,031$ 2,774,818$ 17.4% 38.3% Net income attributable to Tecogen Inc 27,211$ 207,868$ GROSS MARGIN Products 36.6% 39.8% Services 34.0% 43.5% Products & Services GM 34.9% 41.9% Energy Production 53.5% N/A Overall Gross Margin 38.3% 41.9%
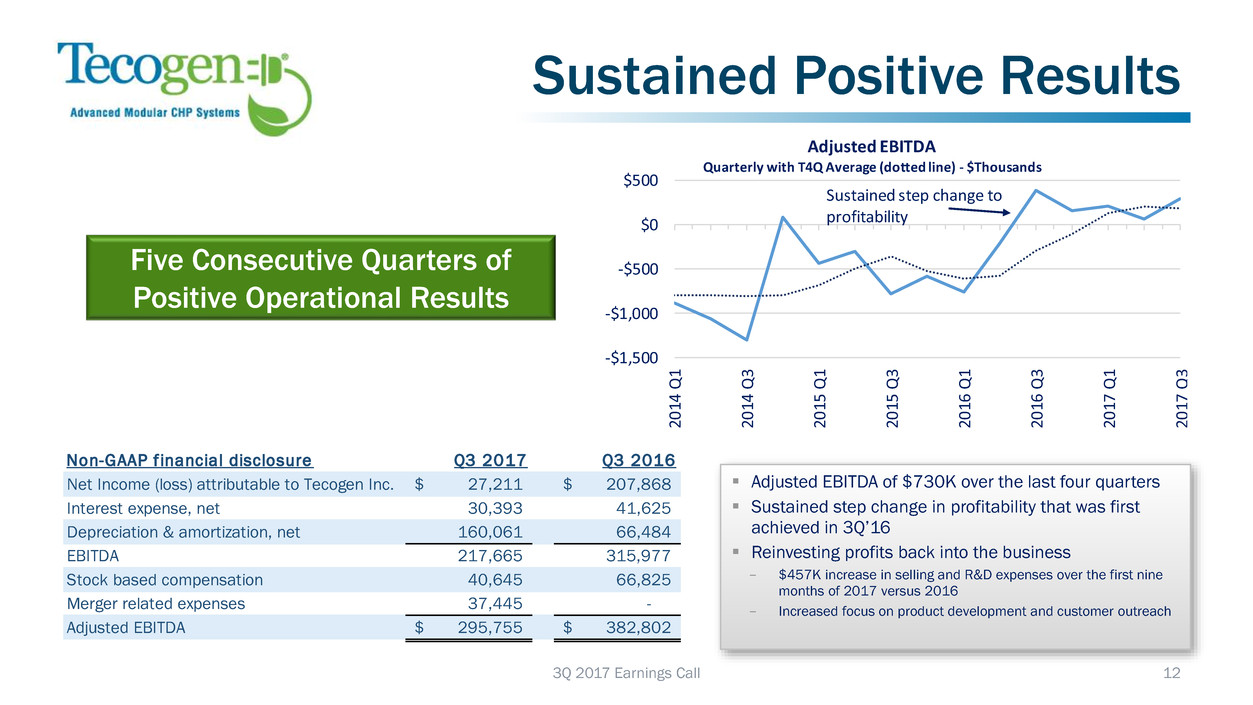
3Q 2017 Earnings Call 12 Sustained Positive Results Five Consecutive Quarters of Positive Operational Results ▪ Adjusted EBITDA of $730K over the last four quarters ▪ Sustained step change in profitability that was first achieved in 3Q’16 ▪ Reinvesting profits back into the business − $457K increase in selling and R&D expenses over the first nine months of 2017 versus 2016 − Increased focus on product development and customer outreach Non-GAAP f inancial disclosure Q3 2017 Q3 2016 Net Income (loss) attributable to Tecogen Inc. 27,211$ 207,868$ Interest expense, net 30,393 41,625 Depreciation & amortization, net 160,061 66,484 EBITDA 217,665 315,977 Stock based comp nsation 40,645 66,825 Merger related expense 37,445 - Adjusted EBITDA 295,755$ 382,802$ -$1,500 -$1,000 -$500 $0 $500 20 14 Q1 20 14 Q3 20 15 Q1 20 15 Q3 20 16 Q1 20 16 Q3 20 17 Q1 20 17 Q3 Adjusted EBITDA Quarterly with T4Q Average (dotted line) - $Thousands Sustained step change to profitability
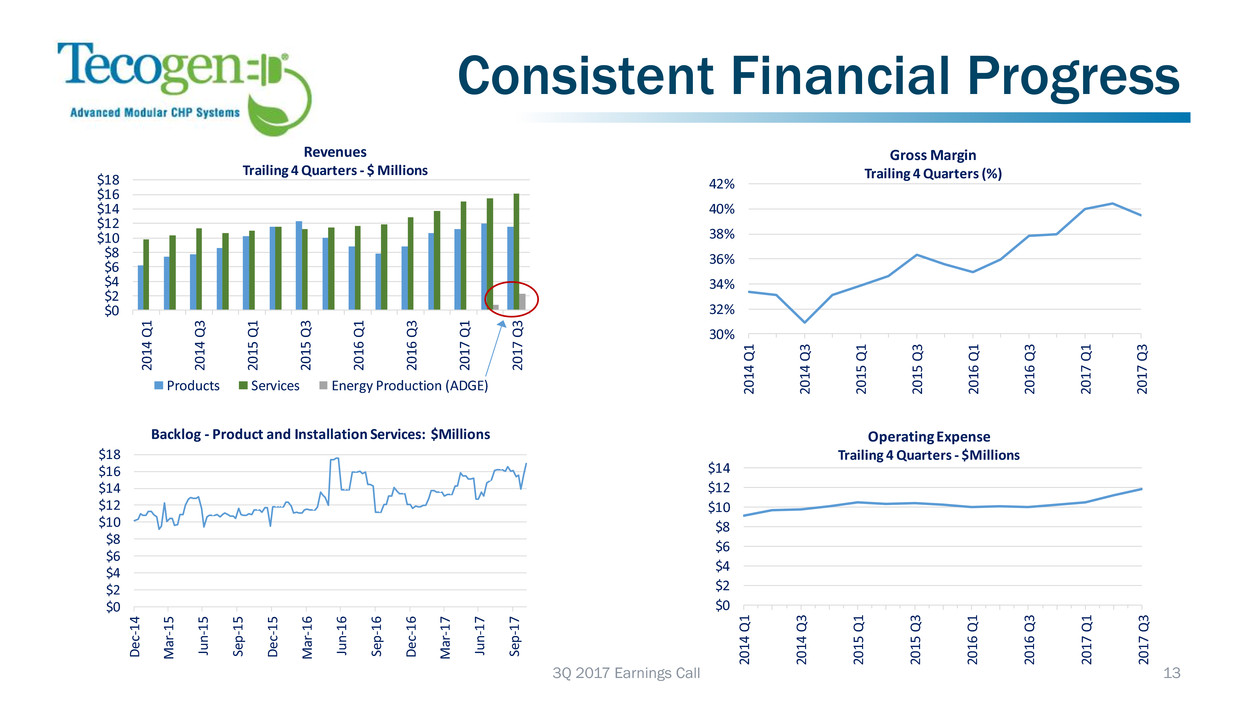
$0 $2 $4 $6 $8 $10 $12 $14 $16 $18 20 14 Q 1 20 14 Q 3 20 15 Q 1 20 15 Q 3 20 16 Q 1 20 16 Q 3 20 17 Q 1 20 17 Q 3 Revenues Trailing 4 Quarters - $ Millions Products Services Energy Production (ADGE) 3Q 2017 Earnings Call 13 Consistent Financial Progress 30% 32% 34% 36% 38% 40% 42% 20 14 Q 1 20 14 Q 3 20 15 Q 1 20 15 Q 3 20 16 Q 1 20 16 Q 3 20 17 Q 1 20 17 Q 3 Gross Margin Trailing 4 Quarters (%) $0 $2 $4 $6 $8 $10 $12 $14 $16 $18 De c-1 4 Ma r-1 5 Jun -15 Se p-1 5 De c-1 5 Ma r-1 6 Jun -16 Se p-1 6 De c-1 6 Ma r-1 7 Jun -17 Se p-1 7 Backlog - Product and Installation Services: $Millions $0 $2 $4 $6 $8 $10 $12 $14 20 14 Q 1 20 14 Q 3 20 15 Q 1 20 15 Q 3 20 16 Q 1 20 16 Q 3 20 17 Q 1 20 17 Q 3 Op ating Expense Trailing 4 Quarters - $Millions
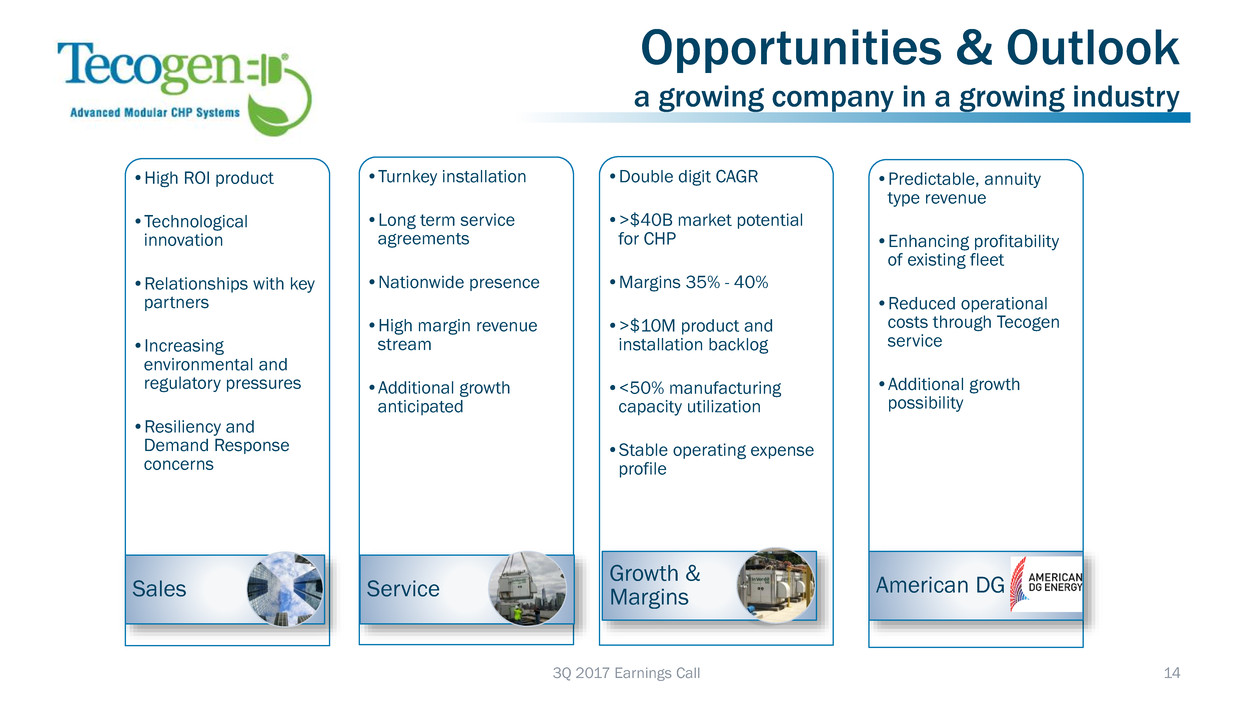
Opportunities & Outlook a growing company in a growing industry •High ROI product •Technological innovation •Relationships with key partners •Increasing environmental and regulatory pressures •Resiliency and Demand Response concerns Sales •Turnkey installation •Long term service agreements •Nationwide presence •High margin revenue stream •Additional growth anticipated Service •Predictable, annuity type revenue •Enhancing profitability of existing fleet •Reduced operational costs through Tecogen service •Additional growth possibility American DG •Double digit CAGR •>$40B market potential for CHP •Margins 35% - 40% •>$10M product and installation backlog •<50% manufacturing capacity utilization •Stable operating expense profile Growth & Margins 3Q 2017 Earnings Call 14
NASDAQ: TGEN 3Q 2017 Earnings Call 15 Q & A
Company Information Tecogen Inc. 45 First Avenue Waltham, MA 02451 www.tecogen.com Contact John Hatsopoulos, Co-CEO 781.622.1122 John.Hatsopoulos@tecogen.com Jeb Armstrong, Director of Capital Markets 781.466.6413 Jeb.Armstrong@tecogen.com 3Q 2017 Earnings Call 16 Contact Information


