KBW 2016 Community Bank Investor Conference August 2-3, 2016
Forward-Looking Statements This presentation includes “forward-looking statements” within the meaning of the Private Securities Litigation Reform Act of 1995. Such statements often include words such as “believe,” “expect,” “anticipate,” “estimate,” and “intend” or future or conditional verbs such as “will,” “would,” “should,” “could,” or “may.” Forward-looking statements are not historical facts but instead represent management’s current expectations and forecasts regarding future events many of which are inherently uncertain and outside of our control. Actual results may differ, possibly materially from those currently expected or projected in these forward-looking statements. Factors that could cause our actual results to differ materially from those described in the forward-looking statements, include increased competitive pressures; changes in the interest rate environment; changes in general economic conditions and conditions within the securities markets; legislative and regulatory changes; and other factors described in HomeTrust’s latest annual Report on Form 10-K and Quarterly Reports on Form 10-Q and other filings with the Securities and Exchange Commission-which are available on our website at www.hometrustbanking.com and on the SEC’s website at www.sec.gov. Any of the forward-looking statements that we make in this presentation or our SEC filings are based upon management’s beliefs and assumptions at the time they are made and may turn out to be wrong because of inaccurate assumptions we might make, because of the factors illustrated above or because of other factors that we cannot foresee. We do not undertake and specifically disclaim any obligation to revise any forward-looking statements to reflect the occurrence of anticipated or unanticipated events or circumstances after the date of such statements. These risks could cause our actual results for fiscal 2017 and beyond to differ materially from those expressed in any forward- looking statements by, or on behalf of, us and could negatively affect our operating and stock performance. 2
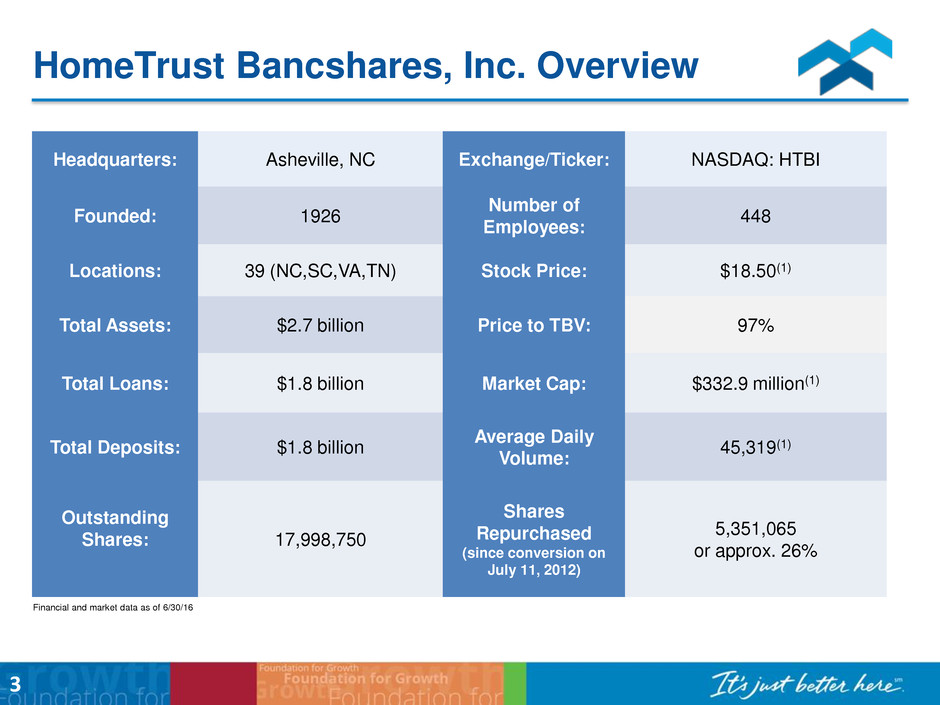
HomeTrust Bancshares, Inc. Overview Headquarters: Asheville, NC Exchange/Ticker: NASDAQ: HTBI Founded: 1926 Number of Employees: 448 Locations: 39 (NC,SC,VA,TN) Stock Price: $18.50(1) Total Assets: $2.7 billion Price to TBV: 97% Total Loans: $1.8 billion Market Cap: $332.9 million(1) Total Deposits: $1.8 billion Average Daily Volume: 45,319(1) Outstanding Shares: 17,998,750 Shares Repurchased (since conversion on July 11, 2012) 5,351,065 or approx. 26% Financial and market data as of 6/30/16 3
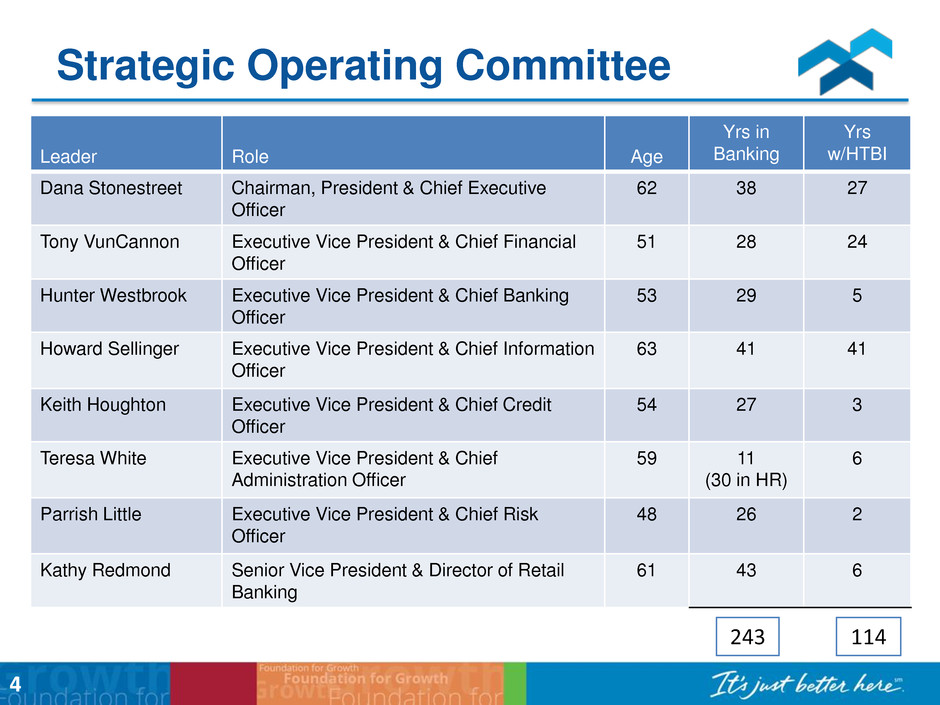
4 Leader Role Age Yrs in Banking Yrs w/HTBI Dana Stonestreet Chairman, President & Chief Executive Officer 62 38 27 Tony VunCannon Executive Vice President & Chief Financial Officer 51 28 24 Hunter Westbrook Executive Vice President & Chief Banking Officer 53 29 5 Howard Sellinger Executive Vice President & Chief Information Officer 63 41 41 Keith Houghton Executive Vice President & Chief Credit Officer 54 27 3 Teresa White Executive Vice President & Chief Administration Officer 59 11 (30 in HR) 6 Parrish Little Executive Vice President & Chief Risk Officer 48 26 2 Kathy Redmond Senior Vice President & Director of Retail Banking 61 43 6 243 114 Strategic Operating Committee
5 Converted to stock in July 2012 and raised $211.6 million Added 6 larger growing markets in NC, SC, VA and East TN 3 Acquisitions 2 New Commercial Loan Production Offices From “lift-outs” of existing commercial lending teams Purchased 10 Bank of America branches Added 22 new locations and $1 billion in assets Converted from thrift charter to a bank charter in August 2014 United 7 bank names to one brand – HomeTrust Bank in October 2014 Enhanced Commercial Credit Department to support growth in commercial lending Hired 23 new Commercial Market Presidents/Commercial Relationship Managers Increased core deposits(1) by over $780 million Hired a Director of Treasury Management and enhanced product offerings Added indirect auto lending as a line of business with a portfolio of over $100 million in 30 months Positioned to expand the mortgage line of business in our new markets Grown to the 6th largest community bank headquartered in NC Foundation for Building a High Performing Community Bank (1) Core deposits are defined as non-certificate or non-time deposit accounts.
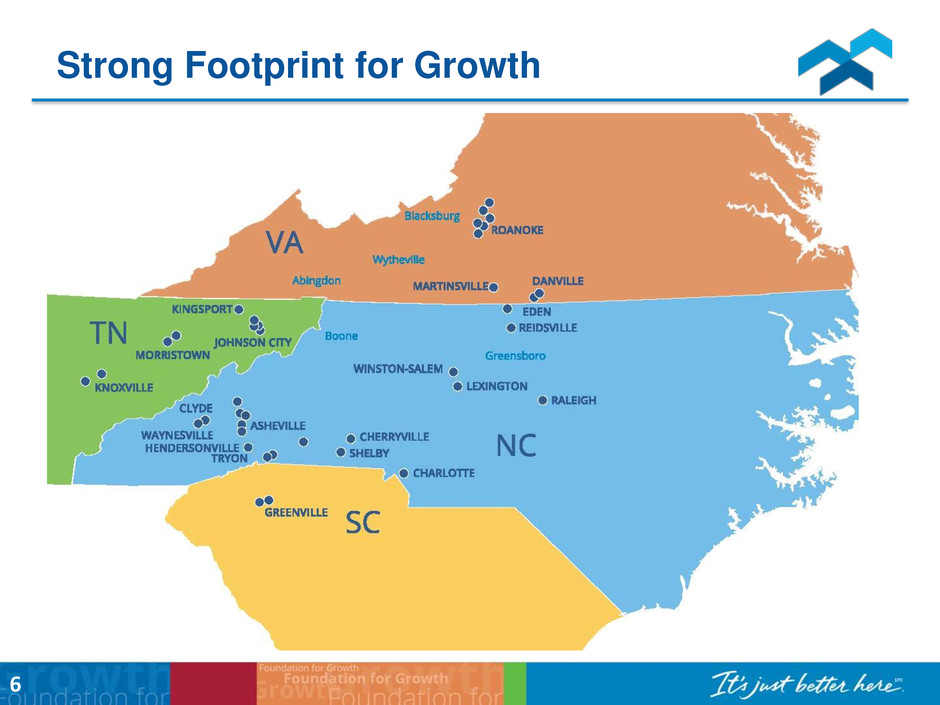
6 Strong Footprint for Growth
Market Demographics Markets Population Asheville, NC/MSA 442,531 5 other non-metro markets 448,320 6 Original NC Markets at June 30, 2012 890,851 New Markets Since Conversion July 2014 Charlotte, NC/Mecklenburg County 990,104 November 2014 Raleigh, NC/Wake County 978,065 July 2013 Greenville, SC/MSA 855,961 May 2014 Knoxville, TN/MSA 855,322 May 2014 Tri-Cities, TN/MSA 511,491 July 2014 Roanoke, VA/MSA 313,033 May/Nov 2014 3 other non-metro markets 231,072 9 Total New Markets 4,735,048 15 Grand Total 5,625,899 150% % Increase 532% 7

HomeTrust Growth Markets Asheville, NC MSA 2016 unemployment at 3.7% down from 4.6% in 2015 No. 3 out of 18 for the World’s Best Cities for Millennials, Matadornetwork.com, May 2016 No. 2 Best Startup City in America, Popular Mechanics, January 2015 No. 10 in Best Cities in the US and Canada, Travel & Leisure, July 2015 No. 34 for Best Places for Business & Careers, Forbes, November 2014 Greenville, SC MSA 2016 unemployment at 5.1% down from 5.7% in 2015 No. 6 list of America's Engineering Capitals, Forbes, 2014 No. 7 Best State for Business, Chief Executive Magazine, 2014 Best Cities for Jobs Fall 2013, Manpower Survey as reported in Forbes Magazine Charlotte, NC MSA 2016 unemployment at 4.5% down from 5.6% in 2015 No. 9 Fastest-Growing Cities, Jan. 2015 Forbes No. 2 Best States for Businesses and Careers, Forbes, October 2015 No. 6 Fastest Growing Economies, WalletHub.com, September 2015 Raleigh, NC MSA 2016 unemployment at 4.1% down from 4.8% in 2015 #3 Best Cities For Young Professionals, Forbes, March 2016 #3 Best Cities for Young Families, Value Penguin, February 2016 #2 Best Large Cities to Live in, WalletHub, September 2015 Knoxville, Kingsport, Bristol, Johnson City, TN MSA Areas Knoxville: 2016 unemployment at 3.5% down from 5.4% in 2015 Kingsport/Bristol: 2016 unemployment at 4.2% down from 5.8% in 2015 Johnson City: 2016 unemployment at 4.2% down from 6.2% in 2015 Tennessee: named the Forth Best State in the Country for Business, Chief Executive Magazine, 2016 Best & Worst States for Business list Knoxville in top five for 10 Best Cities for Small Businesses, CNN Money, August 2015 Tennessee: named 2014 State of the Year for economic development, Business Facilities, 2014 Roanoke, VA MSA 2016 unemployment at 3.5% down from 4.9% in 2015 Virginia ranked No. 3 for Business Friendliness, CNBC 2015 Virginia ranked No. 4 for Best State for Doing Business, Forbes, 2014 Source: U.S. Bureau of Labor Statistics, Chamber of Commerce of named cities, Tennessee Department of Economic & Community Development, Virginia Economic Development Partnership 8
Phase I: Created a Foundation For Growth Lines of Business – Infrastructure and Talent p Markets To Grow In p Phase II: Executing Our Strategic Plan with a Sense of Urgency Sound and Profitable Organic Growth Loans Deposits Lower our efficiency ratio Noninterest income growth Expense management Streamlining current processes Continue buying back undervalued shares Create value for shareholders Phase III: Consistently Improving Performance 9 Transitioning to a High Performing Community Bank

“De-Thrifting” the Balance Sheet Organic Loan Growth in Nonmortgage Loans: Commercial Commercial real estate (CRE) Commercial & industrial (C&I) Commercial Construction Indirect Auto Core Deposit Growth: Commercial checking Fee generation Planned runoff of higher rate, single service CD’s Increasing Noninterest Income: Mortgage banking income Deposit fees Treasury management 10

11 Loan Growth: Loan growth of 9% in FY 2016 ($148MM) Organic growth of 10% (excluding 1-4 residential) 107% growth in indirect auto loans ($56MM) 9% growth in commercial loans ($56MM - CRE, C&I, Commercial Construction) $72MM increase in unfunded construction loans to contribute to fiscal 2017 organic growth New Markets/Relationship Managers: Hired 23 new Commercial Market Presidents/Relationship Managers in the last 36 months 83% of fiscal 2016 commercial production was from new markets Product/Process Improvements: Enhanced auto finance onboarding and vehicle title process Added direct consumer lending products Implementing new consumer loan origination system Began to sell mortgages directly to FNMA to increase fee income Cross-selling deposit products to 10% of indirect auto customers Commercial loan process improvements Enhanced construction loan risk management Loan Highlights
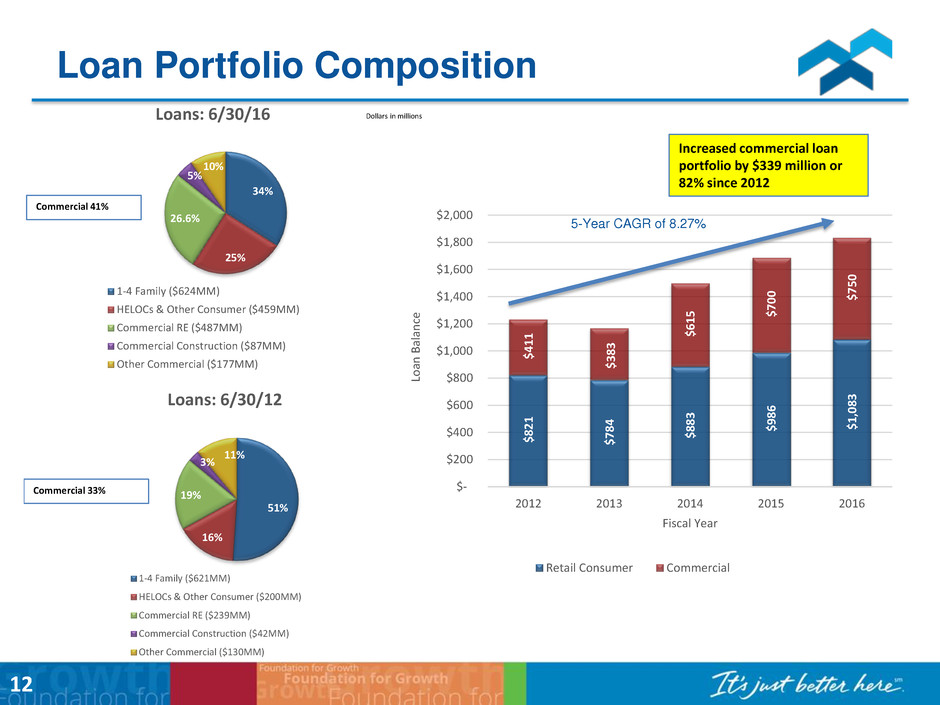
12 $ 8 2 1 $ 7 8 4 $ 8 8 3 $ 9 8 6 $1 ,083 $ 4 1 1 $ 3 8 3 $ 6 1 5 $ 7 0 0 $ 7 5 0 $- $200 $400 $600 $800 $1,000 $1,200 $1,400 $1,600 $1,800 $2,000 2012 2013 2014 2015 2016 Lo an B ala n ce Fiscal Year Retail Consumer Commercial 5-Year CAGR of 8.27% 34% 25% 26.6% 5% 10% Loans: 6/30/16 1-4 Family ($624MM) HELOCs & Other Consumer ($459MM) Commercial RE ($487MM) Commercial Construction ($87MM) Other Commercial ($177MM) Commercial 41% Dollars in millions 51% 16% 19% 3% 11% Loans: 6/30/12 1-4 Family ($621MM) HELOCs & Other Consumer ($200MM) Commercial RE ($239MM) Commercial Construction ($42MM) Other Commercial ($130MM) Commercial 33% Loan Portfolio Composition Increased commercial loan portfolio by $339 million or 82% since 2012
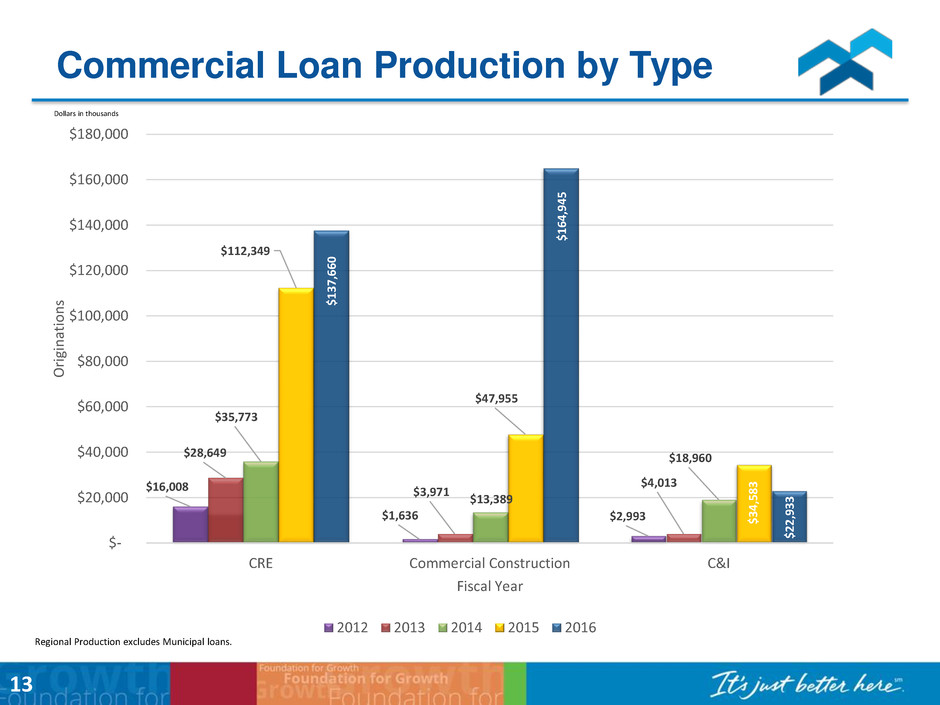
13 $16,008 $1,636 $2,993 $28,649 $3,971 $4,013 $35,773 $13,389 $18,960 $112,349 $47,955 $34,583 $13 7 ,660 $16 4 ,945 $22 ,933 $- $20,000 $40,000 $60,000 $80,000 $100,000 $120,000 $140,000 $160,000 $180,000 CRE Commercial Construction C&I Origi n at io n s Fiscal Year 2012 2013 2014 2015 2016 Dollars in thousands Commercial Loan Production by Type Regional Production excludes Municipal loans.
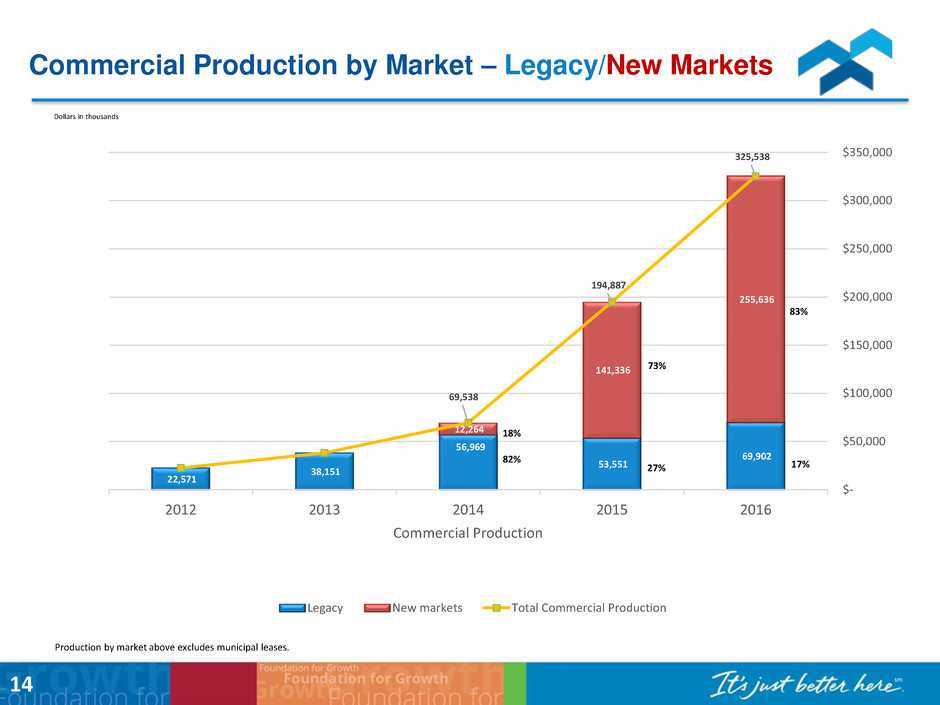
14 22,571 38,151 56,969 53,551 69,902 12,264 141,336 255,636 69,538 194,887 325,538 2012 2013 2014 2015 2016 $- $50,000 $100,000 $150,000 $200,000 $250,000 $300,000 $350,000 Commercial Production Legacy New markets Total Commercial Production 83% 73% 82% 27% 17% Production by market above excludes municipal leases. Dollars in thousands 18% Commercial Production by Market – Legacy/New Markets
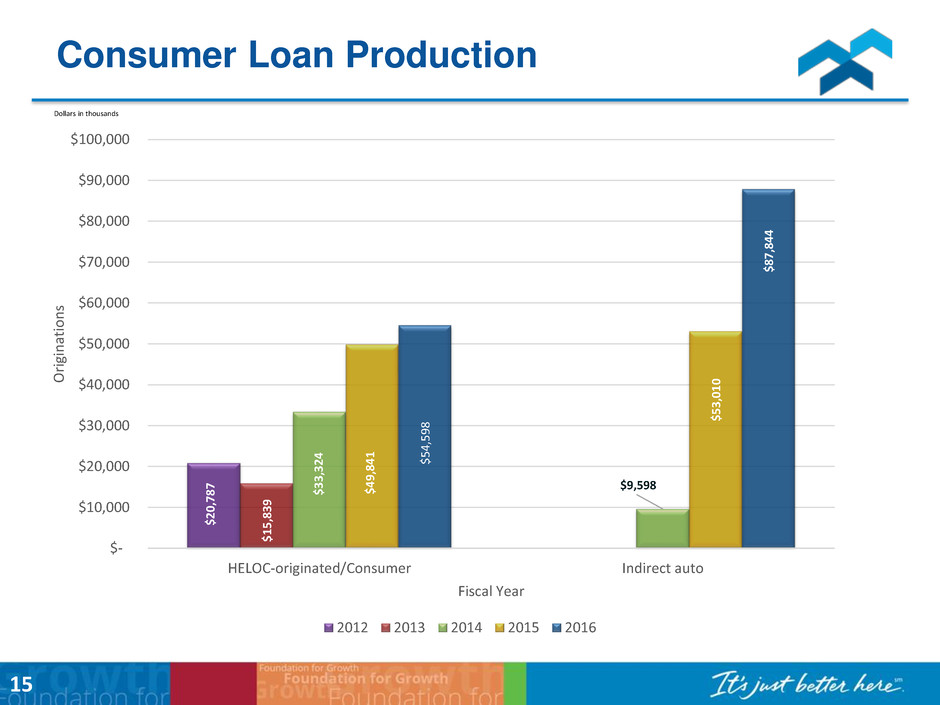
Consumer Loan Production 15 $20 ,787 $15 ,839 $33 ,324 $9,598 $49 ,841 $53 ,010 $54,598 $87 ,844 $- $10,000 $20,000 $30,000 $40,000 $50,000 $60,000 $70,000 $80,000 $90,000 $100,000 HELOC-originated/Consumer Indirect auto Origi n at io n s Fiscal Year 2012 2013 2014 2015 2016 Dollars in thousands
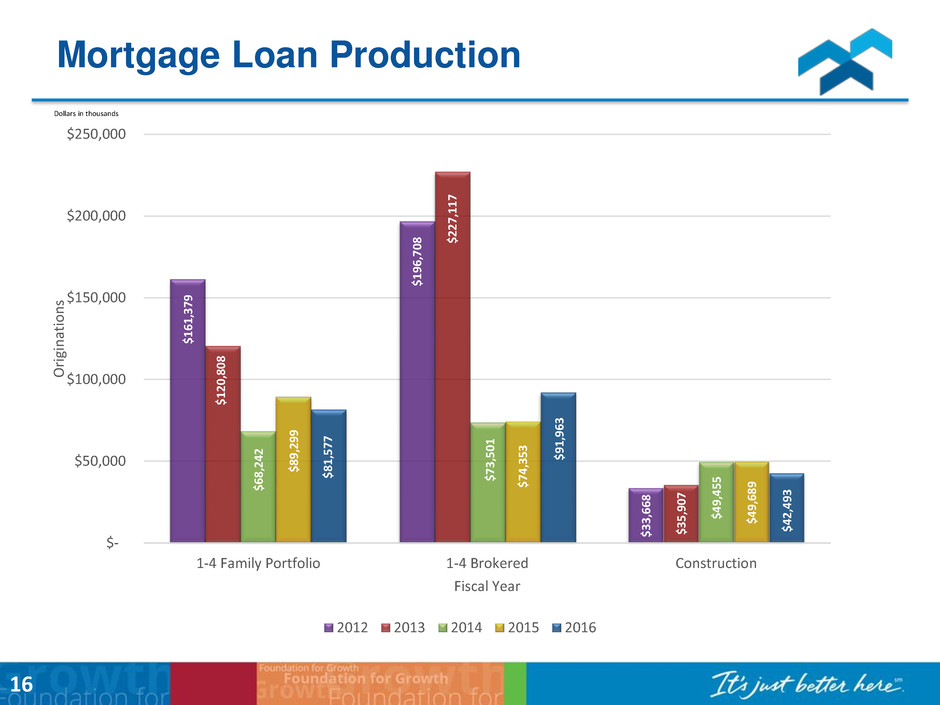
Mortgage Loan Production 16 $16 1 ,379 $19 6 ,708 $ 3 3 ,6 6 8 $12 0 ,808 $22 7 ,117 $35 ,907 $68 ,242 $73 ,501 $49 ,455 $ 8 9 ,2 9 9 $74 ,353 $49 ,689 $81 ,577 $91 ,963 $42 ,493 $- $50,000 $100,000 $150,000 $200,000 $250,000 1-4 Family Portfolio 1-4 Brokered Construction Origi n at io n s Fiscal Year 2012 2013 2014 2015 2016 Dollars in thousands
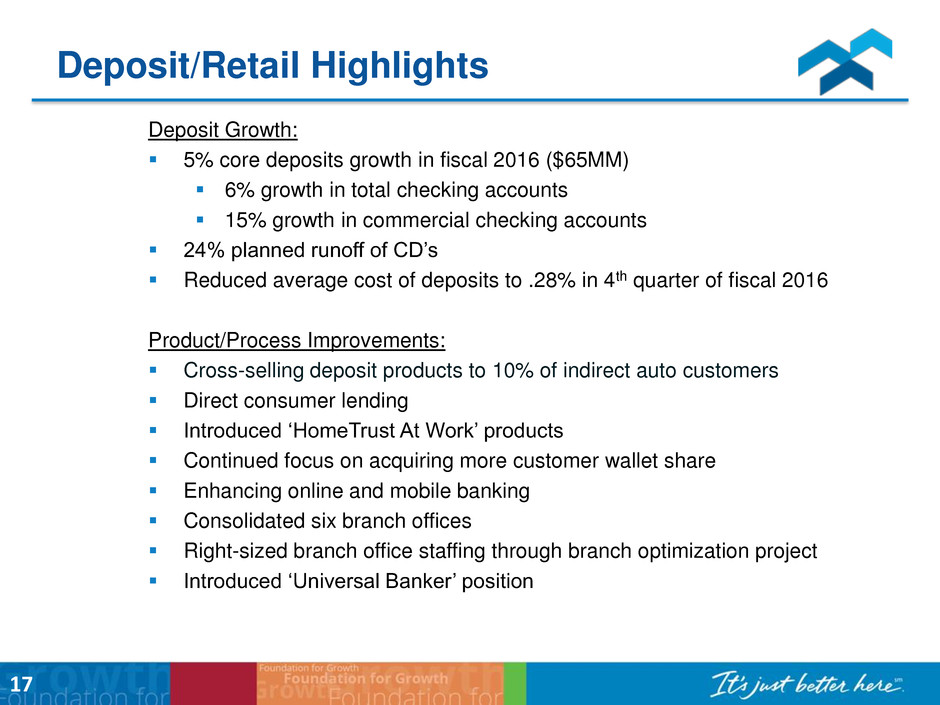
Deposit/Retail Highlights Deposit Growth: 5% core deposits growth in fiscal 2016 ($65MM) 6% growth in total checking accounts 15% growth in commercial checking accounts 24% planned runoff of CD’s Reduced average cost of deposits to .28% in 4th quarter of fiscal 2016 Product/Process Improvements: Cross-selling deposit products to 10% of indirect auto customers Direct consumer lending Introduced ‘HomeTrust At Work’ products Continued focus on acquiring more customer wallet share Enhancing online and mobile banking Consolidated six branch offices Right-sized branch office staffing through branch optimization project Introduced ‘Universal Banker’ position 17

18 2012 2013 2014 2015 2016 Time Deposits $629,958 $540,387 $634,154 $577,075 $442,649 Money Market/Savings $348,519 $357,876 $530,221 $703,622 $731,137 Checking Accounts $230,683 $256,486 $418,671 $591,429 $628,910 Core Deposits % (excludes time deposits) 47.90% 53.20% 59.94% 69.18% 75.45% 0% 10% 20% 30% 40% 50% 60% 70% 80% $- $100,000 $200,000 $300,000 $400,000 $500,000 $600,000 $700,000 $800,000Dollars in thousands 2012 MMDA/Saving excludes $264.2MM related to investor funds used to purchase Company stock for the July 11, 2012 IPO. Deposit Portfolio Mix

19 52.1% 46.8% 40.1% 30.8% 24.6% 28.8% 31.0% 33.5% 37.6% 40.6% 19.1% 22.2% 26.4% 31.6% 34.9% 0% 10% 20% 30% 40% 50% 60% 70% 80% 90% 100% 2012 2013 2014 2015 2016 Time Deposits Money Market/Savings Checking Accounts $442,649 $731,137 $628,910 Time Deposits Money Market/Savings Checking Accounts Dollars in thousands Deposit CompositionDeposit Migration 0.85% 0.63% 0.46% 0.30% 0.28% 0.00% 0.20% 0.40% 0.60% 0.80% 1.00% 2012 2013 2014 2015 2016 Cost of Funds 2012 MMDA/Saving excludes $264.2MM related to investor funds used to purchase Company stock for the July 11, 2012 IPO. Deposit Composition

Bank of America Branch Purchase Impact • November 2014 – Acquired $236 MM of low cost Core Deposits • Younger Customer Demographics • Growth in deposit accounts of 60% • Debit card growth of 170% • Internet banking growth of 110% • 5 Branch locations in Roanoke, VA to complement new Commercial LPO • Core deposits used to fund loan growth in Roanoke and other new growth markets 20
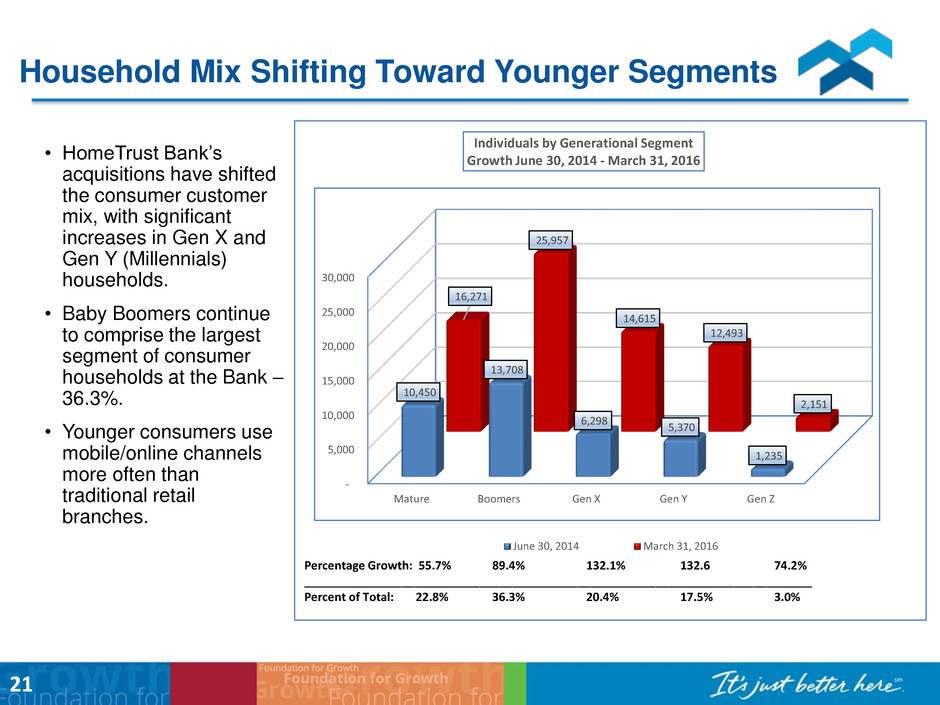
• HomeTrust Bank’s acquisitions have shifted the consumer customer mix, with significant increases in Gen X and Gen Y (Millennials) households. • Baby Boomers continue to comprise the largest segment of consumer households at the Bank – 36.3%. • Younger consumers use mobile/online channels more often than traditional retail branches. Household Mix Shifting Toward Younger Segments 21 - 5,000 10,000 15,000 20,000 25,000 30,000 Mature Boomers Gen X Gen Y Gen Z 10,450 13,708 6,298 5,370 1,235 16,271 25,957 14,615 12,493 2,151 Individuals by Generational Segment Growth June 30, 2014 - March 31, 2016 June 30, 2014 March 31, 2016 Percentage Growth: 55.7% 89.4% 132.1% 132.6 74.2% ______________________________________________________________________________ Percent of Total: 22.8% 36.3% 20.4% 17.5% 3.0%

Enhanced Treasury Management 22 Goal - Increase Noninterest Income Increased deposit product pricing January 2016 Deposit fees increased 8% in 4th quarter fiscal 2016 compared to 3rd quarter Added new/improved merchant services program Increased fee income from provider New purchase card program Bank receives larger share of debit card revenue Increased discipline and monitoring of fee waivers and refunds

Creating Efficiencies/Expense Management 23 October 2015 – consolidated six branches - $1.2MM in expected annual savings December 2015 – Converted from a national charter bank to a state chartered bank - $350,000 in expected annual savings May 2016 – Branch optimization staffing study - $375,000 in expected annual savings June 2016 – Changed health care insurance providers to avoid $700,000 expense increase for the coming fiscal year Summer 2016 – Efficiency study in process by Cornerstone Advisors
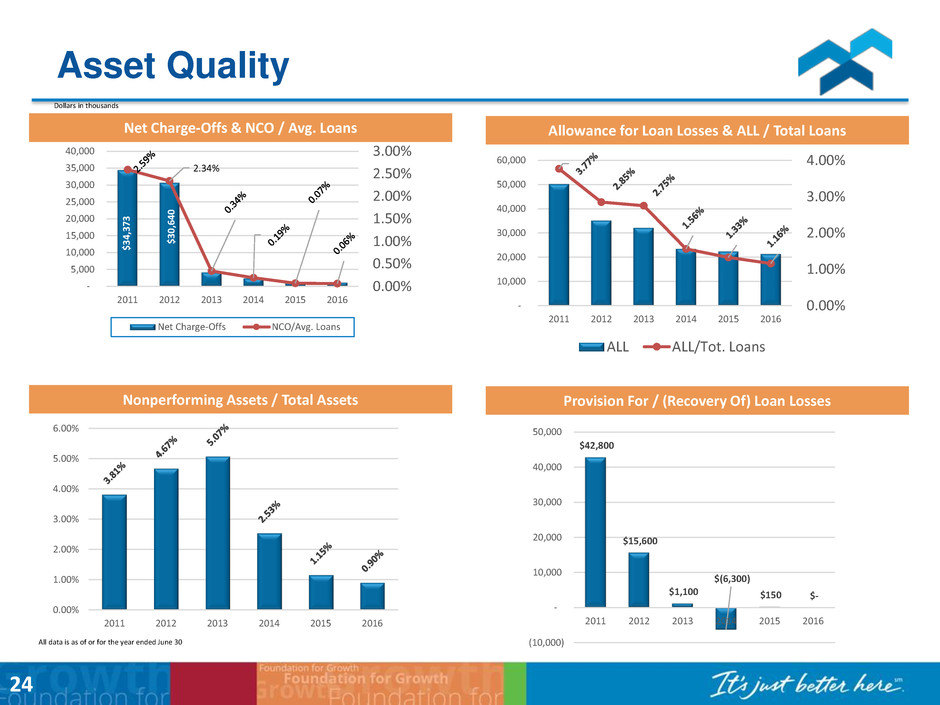
Nonperforming Assets / Total Assets Net Charge-Offs & NCO / Avg. Loans $34,373 $30,640 2.34% 0.00% 0.50% 1.00% 1.50% 2.00% 2.50% 3.00% - 5,000 10,000 15,000 20,000 25,000 30,000 35,000 40,000 2011 2012 2013 2014 2015 2016 Net Charge-Offs NCO/Avg. Loans 0.00% 1.00% 2.00% 3.00% 4.00% - 10,000 20,000 30,000 40,000 50,000 60,000 2011 2012 2013 2014 2015 2016 ALL ALL/Tot. Loans 0.00% 1.00% 2.00% 3.00% 4.00% 5.00% 6.00% 2011 2012 2013 2014 2015 2016 Dollars in thousands Provision For / (Recovery Of) Loan Losses $42,800 $15,600 $1,100 $(6,300) $150 $- (10,000) - 10,000 20,000 30,000 40,000 50,000 2011 2012 2013 2014 2015 2016 Allowance for Loan Losses & ALL / Total Loans Asset Quality 24 All data is as of or for the year ended June 30
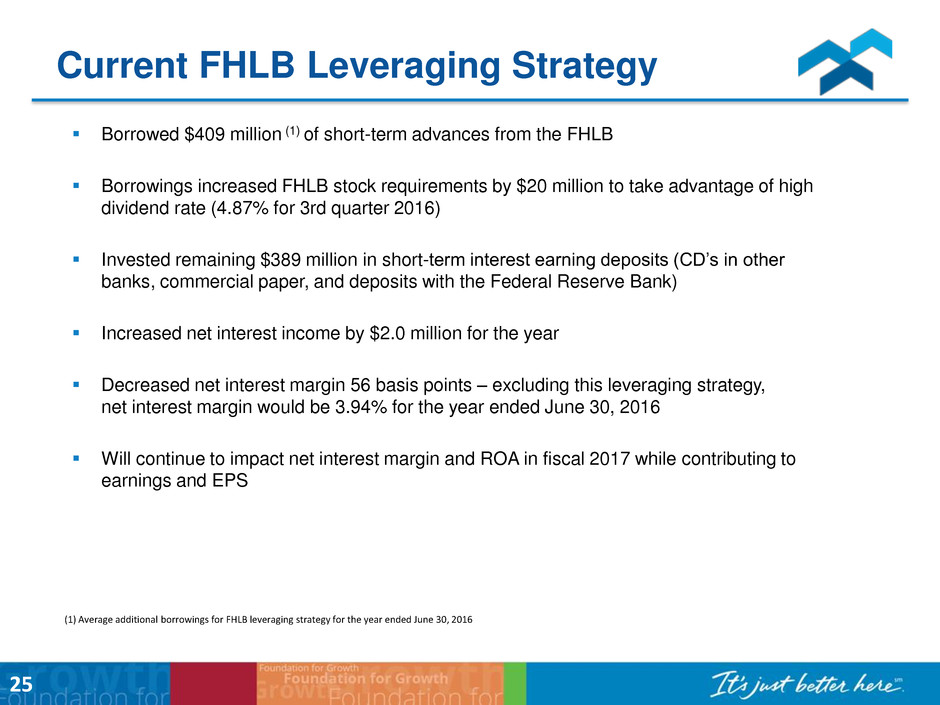
Borrowed $409 million (1) of short-term advances from the FHLB Borrowings increased FHLB stock requirements by $20 million to take advantage of high dividend rate (4.87% for 3rd quarter 2016) Invested remaining $389 million in short-term interest earning deposits (CD’s in other banks, commercial paper, and deposits with the Federal Reserve Bank) Increased net interest income by $2.0 million for the year Decreased net interest margin 56 basis points – excluding this leveraging strategy, net interest margin would be 3.94% for the year ended June 30, 2016 Will continue to impact net interest margin and ROA in fiscal 2017 while contributing to earnings and EPS (1) Average additional borrowings for FHLB leveraging strategy for the year ended June 30, 2016 Current FHLB Leveraging Strategy 25
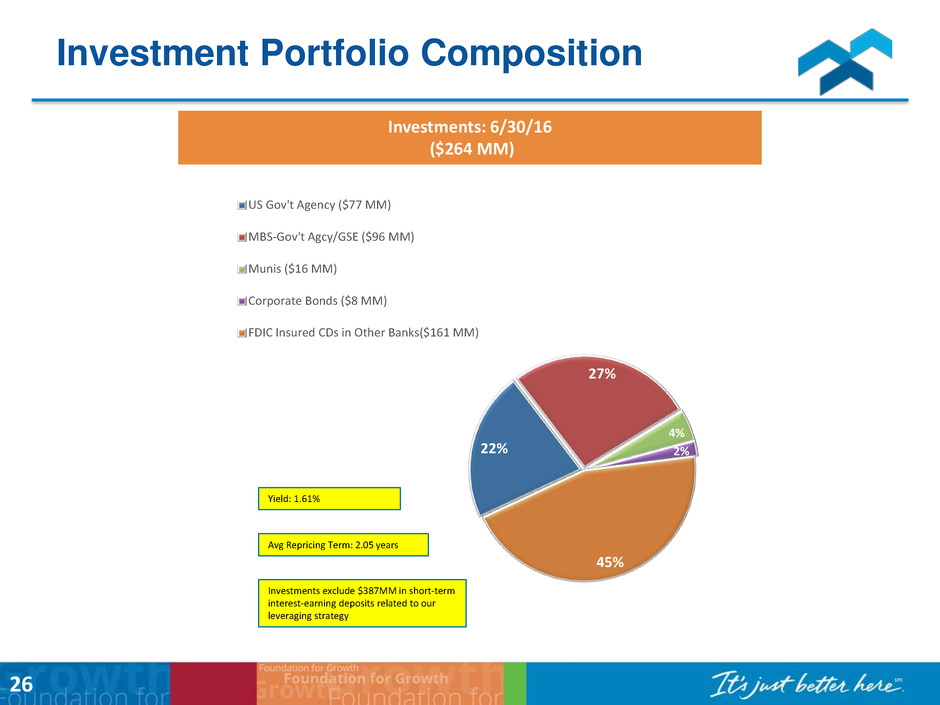
Investment Portfolio Composition Investments: 6/30/16 ($264 MM) 22% 27% 4% 2% 45% US Gov't Agency ($77 MM) MBS-Gov't Agcy/GSE ($96 MM) Munis ($16 MM) Corporate Bonds ($8 MM) FDIC Insured CDs in Other Banks($161 MM) Yield: 1.61% Avg Repricing Term: 2.05 years Investments exclude $387MM in short-term interest-earning deposits related to our leveraging strategy 26

(Dollars in thousands, except per share amounts) Source: Company documents previously filed with the SEC Percent Purchased Shares Total Cost Avg Cost / Share 1st Buy Back (completed 4/29/13) 4% 846,400 13,299$ 15.71$ 2nd Buy Back (completed 12/2/13) 5% 1,041,245 17,055$ 16.38$ 3rd Buy Back (completed 11/18/14) 5% 989,183 15,589$ 15.76$ 4th Buy Back (completed 8/5/15) 5% 1,023,266 16,298$ 15.93$ 5th Buy Back (completed on 1/20/16) 5% 971,271 18,089$ 18.62$ 6th Buy Back (approved on 12/15/15) 5% 479,700 8,634$ 18.00$ Total repurchased through June 30, 2016 29% 5,351,065 88,964$ 16.63$ Remaining Shares to be purchased through 6th Buy Back 443,155 Total Shares Repurchased / Authorized 5,794,220 27 Stock Buy Backs
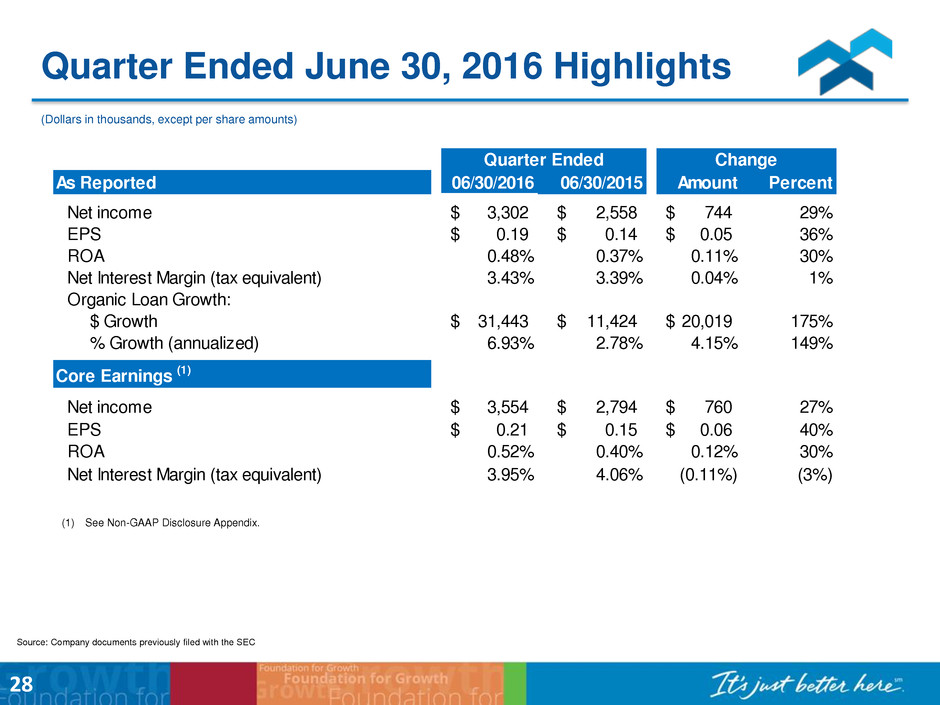
Quarter Ended June 30, 2016 Highlights (Dollars in thousands, except per share amounts) As Reported 06/30/2016 06/30/2015 Amount Percent Net income 3,302$ 2,558$ 744$ 29% EPS 0.19$ 0.14$ 0.05$ 36% ROA 0.48% 0.37% 0.11% 30% Net Interest Margin (tax equivalent) 3.43% 3.39% 0.04% 1% Organic Loan Growth: $ Growth 31,443$ 11,424$ 20,019$ 175% % Growth (annualized) 6.93% 2.78% 4.15% 149% Core Earnings (1) N t income 3,554$ 2,794$ 760$ 27% EPS 0.21$ 0.15$ 0.06$ 40% ROA 0.52% 0.40% 0.12% 30% Net Interest Margin (tax equivalent) 3.95% 4.06% (0.11%) (3%) Quarter Ended Change (1) See Non-GAAP Disclosure Appendix. 28 Source: Company documents previously filed with the SEC
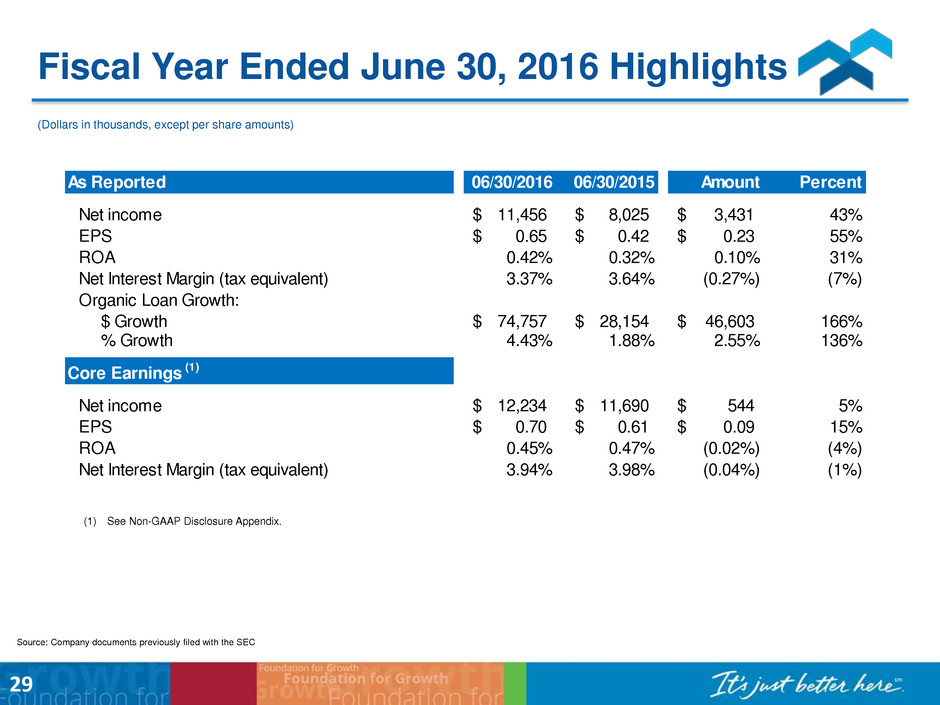
Fiscal Year Ended June 30, 2016 Highlights (Dollars in thousands, except per share amounts) As Reported 06/30/2016 06/30/2015 Amount Percent Net income 11,456$ 8,025$ 3,431$ 43% EPS 0.65$ 0.42$ 0.23$ 55% ROA 0.42% 0.32% 0.10% 31% Net Interest Margin (tax equivalent) 3.37% 3.64% (0.27%) (7%) Organic Loan Growth: $ Growth 74,757$ 28,154$ 46,603$ 166% % Growth 4.43% 1.88% 2.55% 136% Core Earnings (1) Net income 12,234$ 11,690$ 544$ 5% EPS 0.70$ 0.61$ 0.09$ 15% ROA 0.45% 0.47% (0.02%) (4%) Net Interest Margin (tax equivalent) 3.94% 3.98% (0.04%) (1%) 29 Source: Company documents previously filed with the SEC (1) See Non-GAAP Disclosure Appendix.
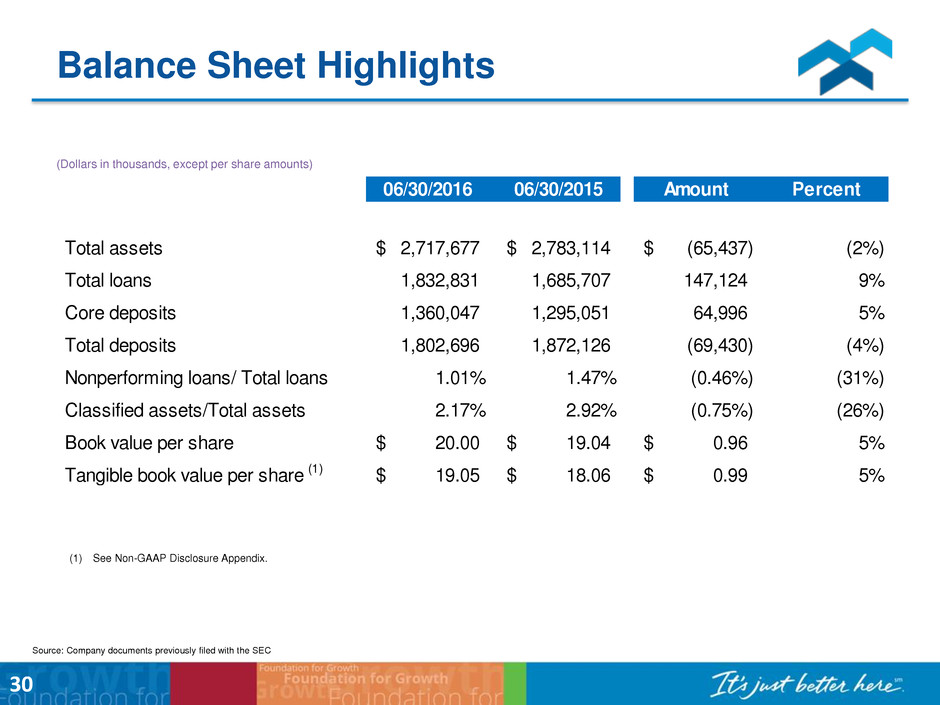
(Dollars in thousands, except per share amounts) 06/30/2016 06/30/2015 Amount Percent Total assets 2,717,677$ 2,783,114$ (65,437)$ (2%) Total loans 1,832,831 1,685,707 147,124 9% Core deposits 1,360,047 1,295,051 64,996 5% Total deposits 1,802,696 1,872,126 (69,430) (4%) Nonperforming loans/ Total loans 1.01% 1.47% (0.46%) (31%) Classified assets/Total assets 2.17% 2.92% (0.75%) (26%) Book value per share 20.00$ 19.04$ 0.96$ 5% Tangible book value per share (1) 19.05$ 18.06$ 0.99$ 5% Source: Company documents previously filed with the SEC Balance Sheet Highlights 30 (1) See Non-GAAP Disclosure Appendix.

100.0 110.0 120.0 130.0 140.0 150.0 160.0 170.0 180.0 07/11/12 12/31/12 06/30/13 12/31/13 06/30/14 12/31/14 06/30/15 12/31/2015 06/30/2016 Total Return Performance HomeTrust Bancshares, Inc. NASDAQ Bank NASDAQ Composite Total Shareholder Return 31
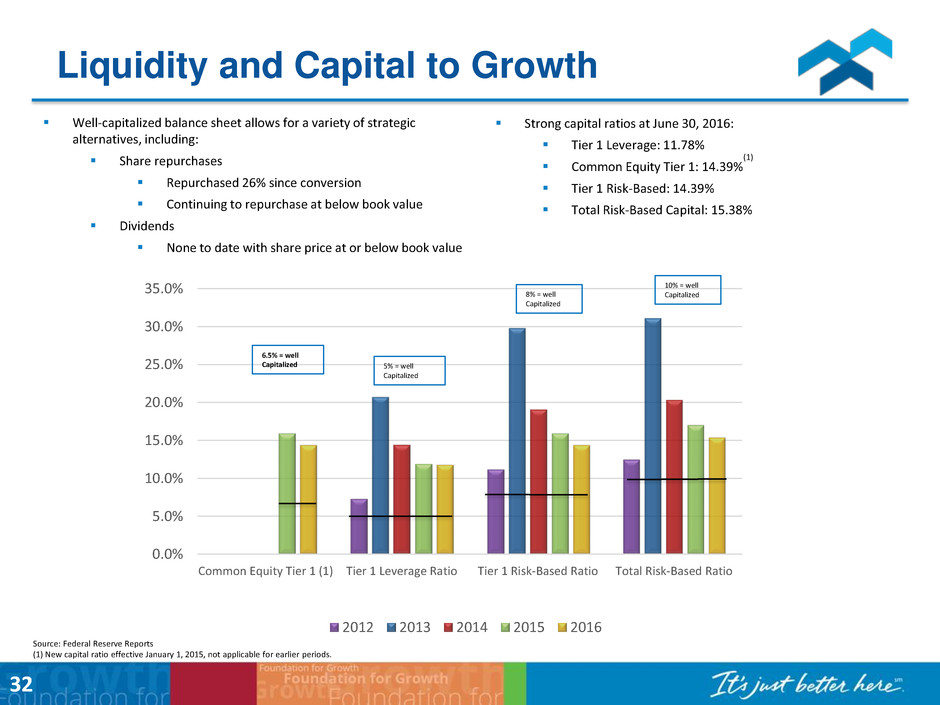
32 Well-capitalized balance sheet allows for a variety of strategic alternatives, including: Share repurchases Repurchased 26% since conversion Continuing to repurchase at below book value Dividends None to date with share price at or below book value Strong capital ratios at June 30, 2016: Tier 1 Leverage: 11.78% Common Equity Tier 1: 14.39% (1) Tier 1 Risk-Based: 14.39% Total Risk-Based Capital: 15.38% 0.0% 5.0% 10.0% 15.0% 20.0% 25.0% 30.0% 35.0% Common Equity Tier 1 (1) Tier 1 Leverage Ratio Tier 1 Risk-Based Ratio Total Risk-Based Ratio 2012 2013 2014 2015 2016 6.5% = well Capitalized 5% = well Capitalized 8% = well Capitalized 10% = well Capitalized Source: Federal Reserve Reports (1) New capital ratio effective January 1, 2015, not applicable for earlier periods. Liquidity and Capital to Growth
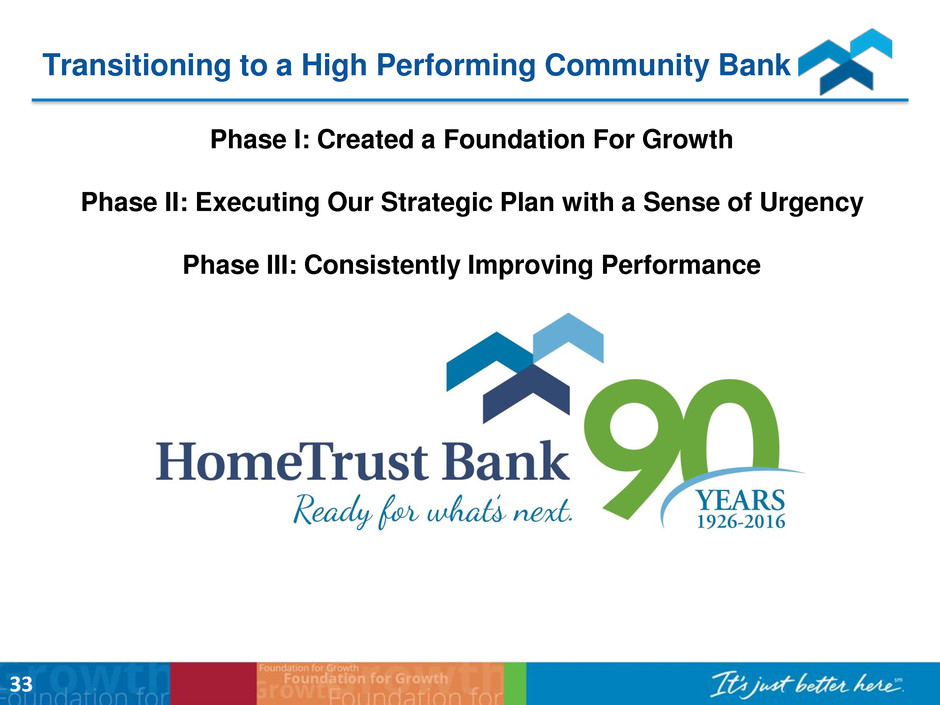
Phase I: Created a Foundation For Growth Phase II: Executing Our Strategic Plan with a Sense of Urgency Phase III: Consistently Improving Performance 33 Transitioning to a High Performing Community Bank
Investor Contacts Dana Stonestreet Chairman, President & CEO dana.stonestreet@hometrustbanking.com Hunter Westbrook EVP/Chief Banking Officer hunter.westbrook@hometrustbanking.com Tony VunCannon EVP/Chief Financial Officer/Treasurer tony.vuncannon@hometrustbanking.com 10 Woodfin Street Asheville, NC 28801 (828) 259-3939 www.hometrustbanking.com 34
35 Non-GAAP Disclosure Appendix

In addition to results presented in accordance with generally accepted accounting principles utilized in the United States ("GAAP"), this presentation contains certain non-GAAP financial measures, which include: tangible book value per share, net income excluding merger-related expenses, nonrecurring state tax expense, and impairment charges for branch consolidation; and return on assets ("ROA") and earnings per share ("EPS") excluding merger expenses, nonrecurring state tax expense, and impairment charges for branch consolidation. The Company believes these non-GAAP financial measures and ratios as presented are useful for both investors and management to understand the effects of certain items and provides an alternative view of the Company's performance over time and in comparison to the Company's competitors. Management elected to obtain additional FHLB borrowings beginning in November 2014 as part of a plan to increase net interest income. The Company believes that showing the effects of the additional borrowings on net interest income and net interest margins is useful to both management and investors as these measures are commonly used to measure financial institutions performance and performance against peers. The Company believes these measures facilitate comparison of the quality and composition of the Company's capital and earnings ability over time and in comparison to its competitors. These non-GAAP measures have inherent limitations, are not required to be uniformly applied and are not audited. They should not be considered in isolation or as a substitute for total stockholders' equity or operating results determined in accordance with GAAP. These non-GAAP measures may not be comparable to similarly titled measures reported by other companies. 36 Non-GAAP Disclosure Reconciliation
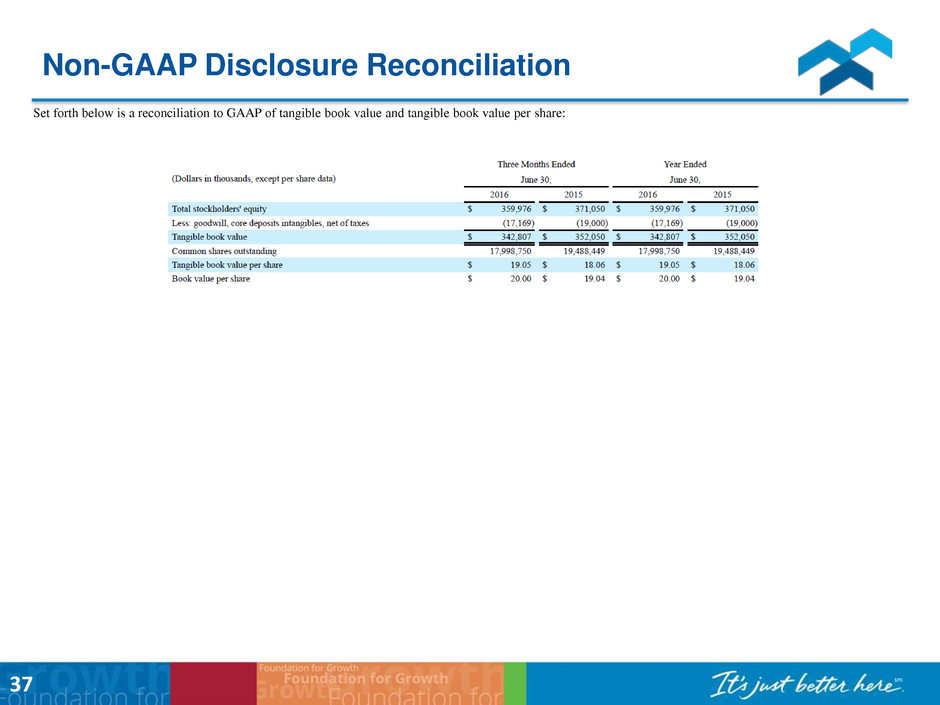
37 Non-GAAP Disclosure Reconciliation Set forth below is a reconciliation to GAAP of tangible book value and tangible book value per share:
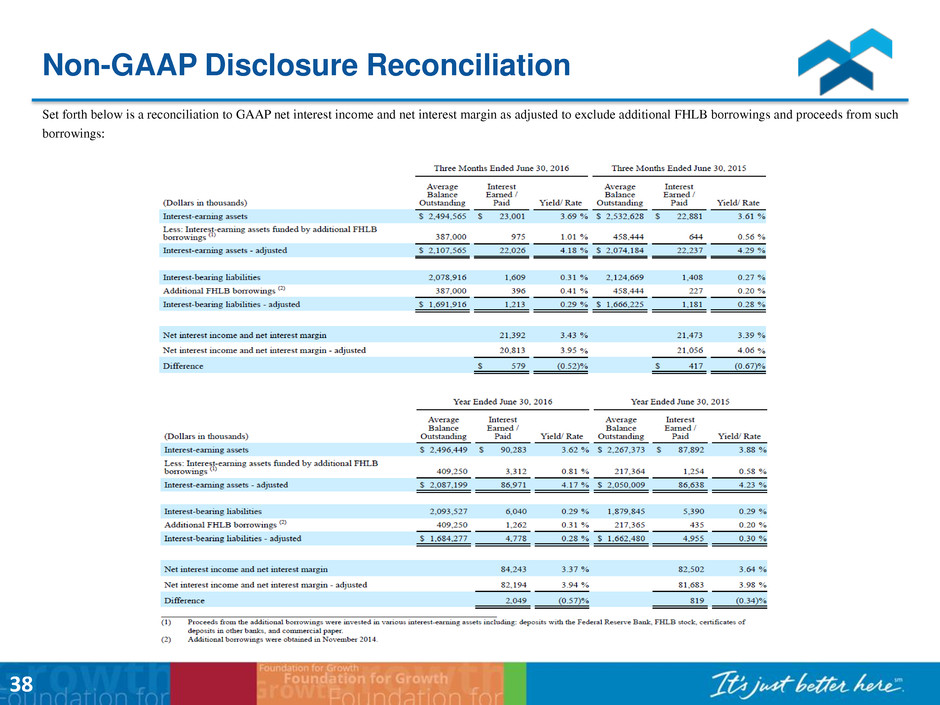
38 Non-GAAP Disclosure Reconciliation Set forth below is a reconciliation to GAAP net interest income and net interest margin as adjusted to exclude additional FHLB borrowings and proceeds from such borrowings:
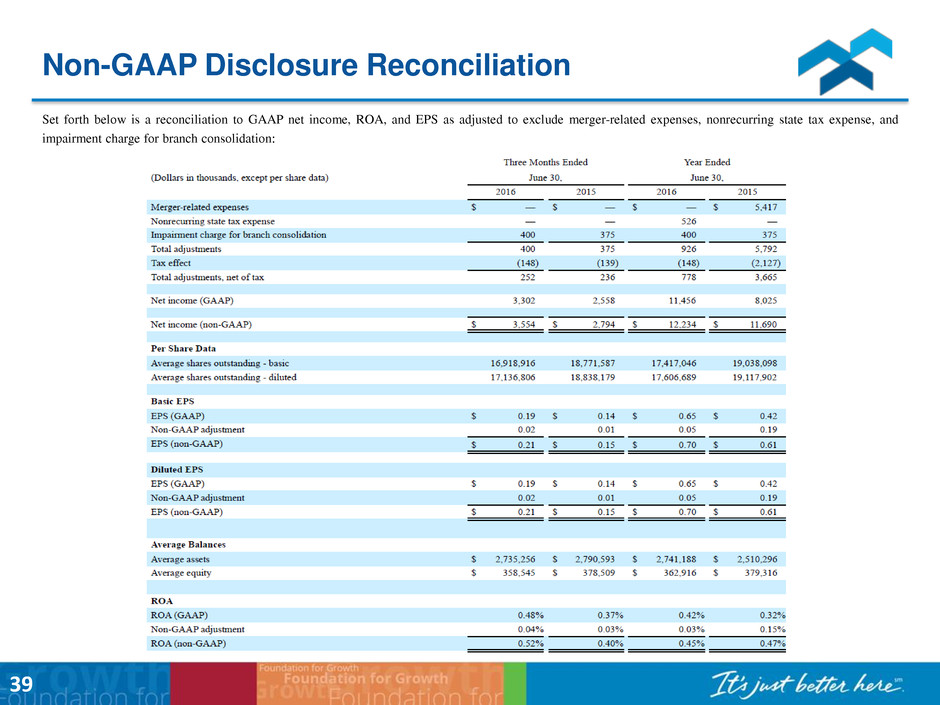
39 Non-GAAP Disclosure Reconciliation Set forth below is a reconciliation to GAAP net income, ROA, and EPS as adjusted to exclude merger-related expenses, nonrecurring state tax expense, and impairment charge for branch consolidation:


