
Luxoft Holding, Inc | Q2 FY2019 Call | November 15, 2018 Dmitry Loschinin, CEO & President Evgeny Fetisov, CFO www.luxoft.com
Disclaimer Safe Harbor Forward-Looking Statements Non-GAAP Financial Measures In addition to historical information, this presentation contains "forward-looking statements" within the To supplement our financial results presented in accordance with US GAAP, this presentation includes the meaning of the Private Securities Litigation Reform Act of 1995, Section 27A of the Securities Act of 1933, and following measures defined by the Securities and Exchange Commission as non-GAAP financial measures: Section 21E of the Securities Exchange Act of 1934. These forward-looking statements include information earnings before interest, tax, depreciation and amortization (EBITDA); adjusted EBITDA; non-GAAP net about possible or assumed future results of our business and financial condition, as well as the results of income; non-GAAP diluted Earnings per share (EPS) and Free Cash Flow (FCF). EBITDA is calculated as earnings operations, liquidity, plans and objectives. In some cases, you can identify forward-looking statements by before interest, tax, depreciation and amortization, where interest includes unwinding of the discount rate terminology such as "believe," "may," "estimate," "continue," "anticipate," "intend," "should," "plan," for contingent liabilities. Prior year amounts were amended accordingly. Non-GAAP net income and non- "expect," "predict," "potential," or the negative of these terms or other similar expressions. These statements GAAP EPS exclude stock-based compensation expense, amortization of fair value adjustments to intangible include, but are not limited to, statements regarding: the persistence and intensification of competition in the assets and impairment thereof and other acquisitions related costs that may include changes in the fair value IT industry; the future growth of spending in IT services outsourcing generally and in each of our industry of contingent consideration liabilities. Non-GAAP diluted EPS are calculated as non-GAAP net income divided verticals, application outsourcing and custom application development and offshore research and by weighted average number of diluted shares. Free Cash Flow is calculated as operating cash flow less development services; the level of growth of demand for our services from our clients; the level of increase in capital expenditure which consists of purchases of property, plant and equipment and intangible assets as revenues from our new clients; seasonal trends and the budget and work cycles of our clients; general defined in the cash flow statement. economic and business conditions in our locations, including geopolitical instability and social, economic or political uncertainties, particularly in Russia and Ukraine, and any potential sanctions, restrictions or We adjust our non-GAAP financial measures to exclude stock based compensation, because it is a non-cash responses to such conditions imposed by some of the locations in which we operate; the levels of our expense. We also adjust our non-GAAP financial measures to exclude the change in fair value of contingent concentration of revenues by vertical, geography, by client and by type of contract in the future; the expected consideration, because we believe these expenses are not indicative of what we consider to be normal timing of the increase in our corporate tax rate, or actual increases to our effective tax rate which we may course of operations. Our non-GAAP financial measures are adjusted to exclude amortization of purchased experience from time to time; our expectations with respect to the proportion of our fixed price contracts; intangible assets in order to allow management and investors to evaluate our results from operating activities our expectation that we will be able to integrate and manage the companies we acquire and that our as if these assets have been developed internally rather than acquired in a business combination. Finally, we acquisitions will yield the benefits we envision; the demands we expect our rapid growth to place on our adjust our non-GAAP financial measures to exclude acquisition-related costs, which comprise payments to management and infrastructure; the sufficiency of our current cash, cash flow from operations, and lines of consulting firms as well as fees paid upon successful completion of acquisition; as well as certain incentive credit to meet our anticipated cash needs; the high proportion of our cost of services comprised of personnel payments for members of management of the acquired companies as provided for in the acquisition salaries; our plans to introduce new products for commercial resale and licensing in addition to providing agreements. These payments are based on performance of the acquired businesses and are classified as part services; our anticipated joint venture with one of our clients; and our continued financial relationship with of management compensation rather than part of purchase consideration. These costs vary with the size and IBS Group Holding limited and its subsidiaries including expectations for the provision and purchase of complexity of each acquisition and are generally inconsistent in amount and frequency, and therefore, we services and purchase and lease of equipment; and other factors discussed under the heading "Risk Factors" believe that they may not be indicative of the size and volume of future acquisition-related costs. in the Annual Report on Form 20-F for the year ended March 31, 2018 and other documents filed with or furnished to the Securities and Exchange Commission. Except as required by law, we undertake no obligation We provide these non-GAAP financial measures because we believe that they present a better measure of to publicly update any forward-looking statements for any reason after the date of this presentation whether our core business and management uses them internally to evaluate our ongoing performance. Accordingly, as a result of new information, future events or otherwise. we believe that these non-GAAP measures are useful to investors in enhancing and understanding of our operating performance. These non-GAAP measures should be considered in addition to, and not as a The trademarks included in this presentation are the property of the owners thereof and are used for substitute for, comparable US GAAP measures. The non-GAAP results and a full reconciliation between US reference purposes only. Such use should not be construed as an endorsement of the products or services of GAAP and non-GAAP results are provided in the tables at the end of the press release issued by the Company Luxoft Holding, Inc. on November 15, 2018. Unless otherwise stated, all data in this presentation is as of September 30, 2018. www.luxoft.com 2
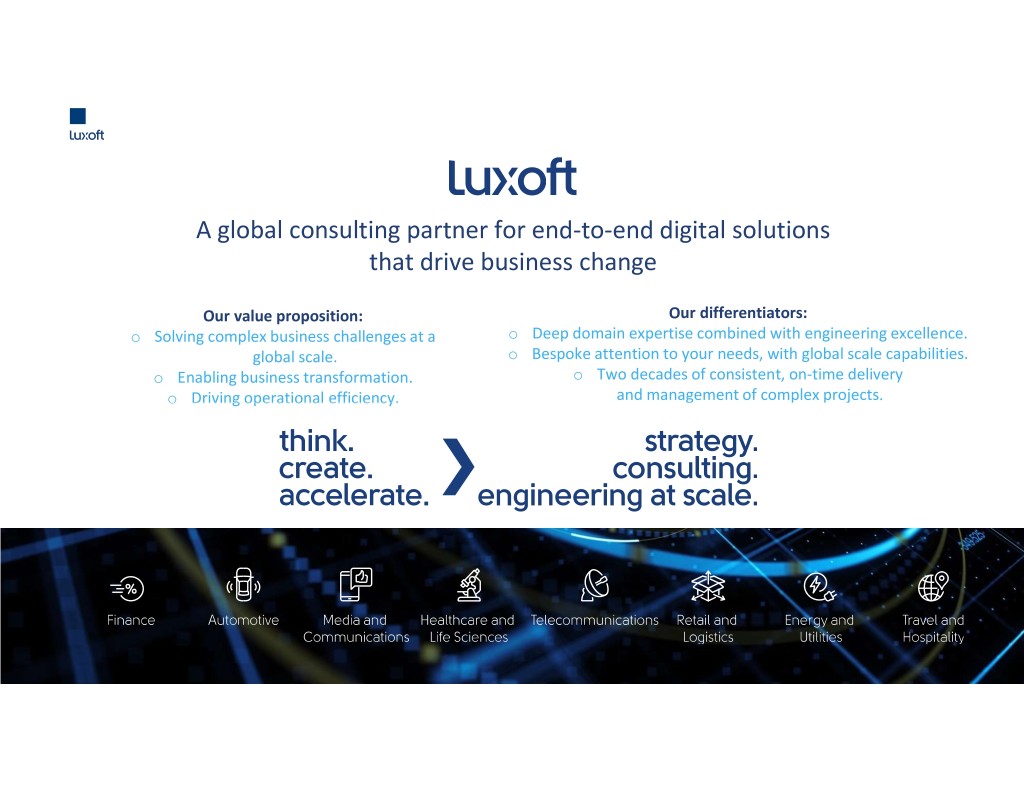
A global consulting partner for end-to-end digital solutions that drive business change Our value proposition: Our differentiators: o Solving complex business challenges at a o Deep domain expertise combined with engineering excellence. global scale. o Bespoke attention to your needs, with global scale capabilities. o Enabling business transformation. o Two decades of consistent, on-time delivery o Driving operational efficiency. and management of complex projects. www.luxoft.com
Dmitry Loschinin CEO, Luxoft Holding, Inc www.luxoft.com
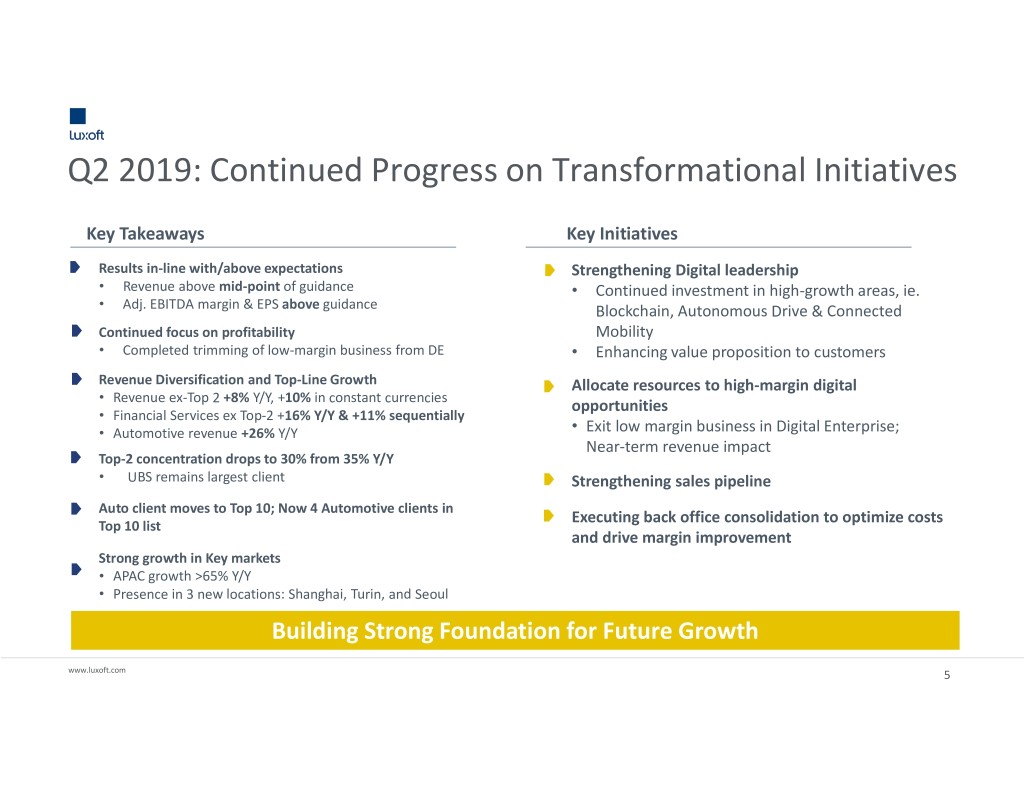
Q2 2019: Continued Progress on Transformational Initiatives Key Takeaways Key Initiatives Results in-line with/above expectations Strengthening Digital leadership • Revenue above mid-point of guidance • Continued investment in high-growth areas, ie. • Adj. EBITDA margin & EPS above guidance Blockchain, Autonomous Drive & Connected Continued focus on profitability Mobility • Completed trimming of low-margin business from DE • Enhancing value proposition to customers Revenue Diversification and Top-Line Growth Allocate resources to high-margin digital • Revenue ex-Top 2 +8% Y/Y, +10% in constant currencies opportunities • Financial Services ex Top-2 +16% Y/Y & +11% sequentially • Automotive revenue +26% Y/Y • Exit low margin business in Digital Enterprise; Near-term revenue impact Top-2 concentration drops to 30% from 35% Y/Y • UBS remains largest client Strengthening sales pipeline Auto client moves to Top 10; Now 4 Automotive clients in Executing back office consolidation to optimize costs Top 10 list and drive margin improvement Strong growth in Key markets • APAC growth >65% Y/Y • Presence in 3 new locations: Shanghai, Turin, and Seoul Building Strong Foundation for Future Growth www.luxoft.com 5

Continued Revenue Diversification • Automotive represents 22% of revenue, up from 12% 3 years ago • Meaningful Top 10 and 2 concentration decline y/y Client Concentration 23.1% 25.9% Digital Enterprise Top-10 62.3% 61.9% 17.5% Automotive 22% 57.5% 57.2% 56.3% 56.6% 54.3% Top-5 51.7% 50.7% 56.6% Financial Services 54.9% 46.7% 46.0% 46.8% 46.1% 43.4% Q2 2018 Q2 2019 Top-2 37.5% 35.4% 34.9% 34.4% 34.1% 4.4% 7.2% 31.7% 7.8% 5% 30.2% 22.9% 19.9% APAC Top-1 Russia 19.5% 29.8% 34.8% 18.3% UK 17.5% 17.8% 17.2% 17.7% 16.5% Europe (excl. U.K.) 34.6% 31.8% North America Q4 FY17 Q1 FY18 Q2 FY18 Q3 FY18 Q4 FY18 Q1 2019 Q2 2019 Q2 2018 Q2 2019 www.luxoft.com 6
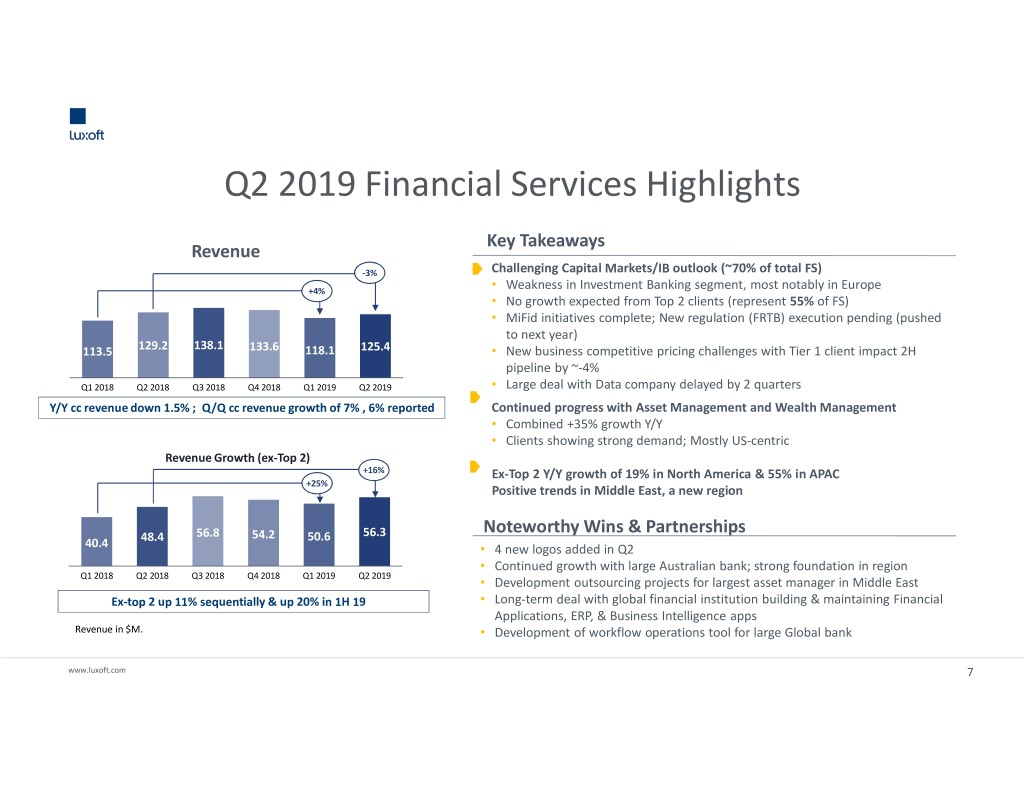
Q2 2019 Financial Services Highlights Key Takeaways Revenue -3% Challenging Capital Markets/IB outlook (~70% of total FS) • +4% Weakness in Investment Banking segment, most notably in Europe • No growth expected from Top 2 clients (represent 55% of FS) • MiFid initiatives complete; New regulation (FRTB) execution pending (pushed to next year) 113.5 129.2 138.1 133.6 118.1 125.4 • New business competitive pricing challenges with Tier 1 client impact 2H pipeline by ~-4% Q1 2018 Q2 2018Q3 2018 Q4 2018 Q1 2019 Q2 2019 • Large deal with Data company delayed by 2 quarters Y/Y cc revenue down 1.5% ; Q/Q cc revenue growth of 7% , 6% reported Continued progress with Asset Management and Wealth Management • Combined +35% growth Y/Y • Clients showing strong demand; Mostly US-centric Revenue Growth (ex-Top 2) +16% Ex-Top 2 Y/Y growth of 19% in North America & 55% in APAC +25% Positive trends in Middle East, a new region Noteworthy Wins & Partnerships 48.4 56.8 54.2 50.6 56.3 40.4 • 4 new logos added in Q2 • Continued growth with large Australian bank; strong foundation in region Q1 2018Q2 2018 Q3 2018 Q4 2018 Q1 2019 Q2 2019 • Development outsourcing projects for largest asset manager in Middle East Ex-top 2 up 11% sequentially & up 20% in 1H 19 • Long-term deal with global financial institution building & maintaining Financial Applications, ERP, & Business Intelligence apps Revenue in $M. • Development of workflow operations tool for large Global bank www.luxoft.com 7
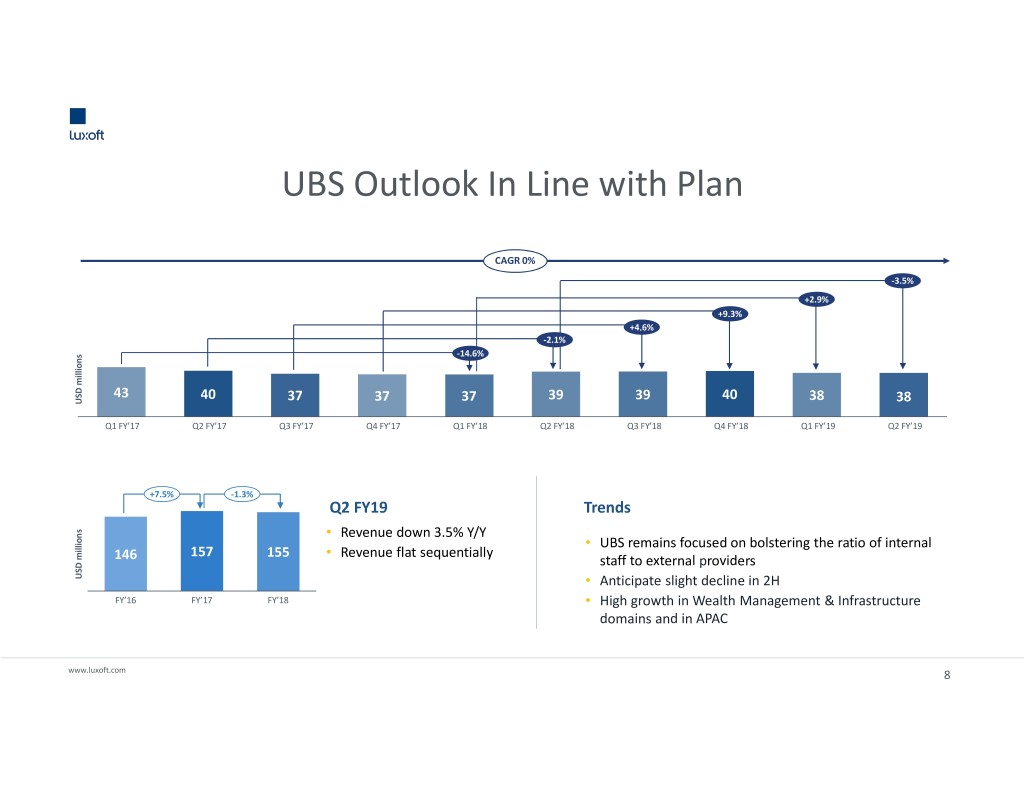
UBS Outlook In Line with Plan CAGR 0% -3.5% +2.9% +9.3% +4.6% -2.1% -14.6% 43 40 37 39 39 40 38 USDmillions 37 37 38 Q1 FY’17 Q2 FY’17Q3 FY’17 Q4 FY’17 Q1 FY’18 Q2 FY’18 Q3 FY’18 Q4 FY’18 Q1 FY’19 Q2 FY’19 +7.5% -1.3% Q2 FY19 Trends • Revenue down 3.5% Y/Y • UBS remains focused on bolstering the ratio of internal 157 155 • Revenue flat sequentially 146 staff to external providers USDmillions • Anticipate slight decline in 2H FY’16 FY’17 FY’18 • High growth in Wealth Management & Infrastructure domains and in APAC www.luxoft.com 8
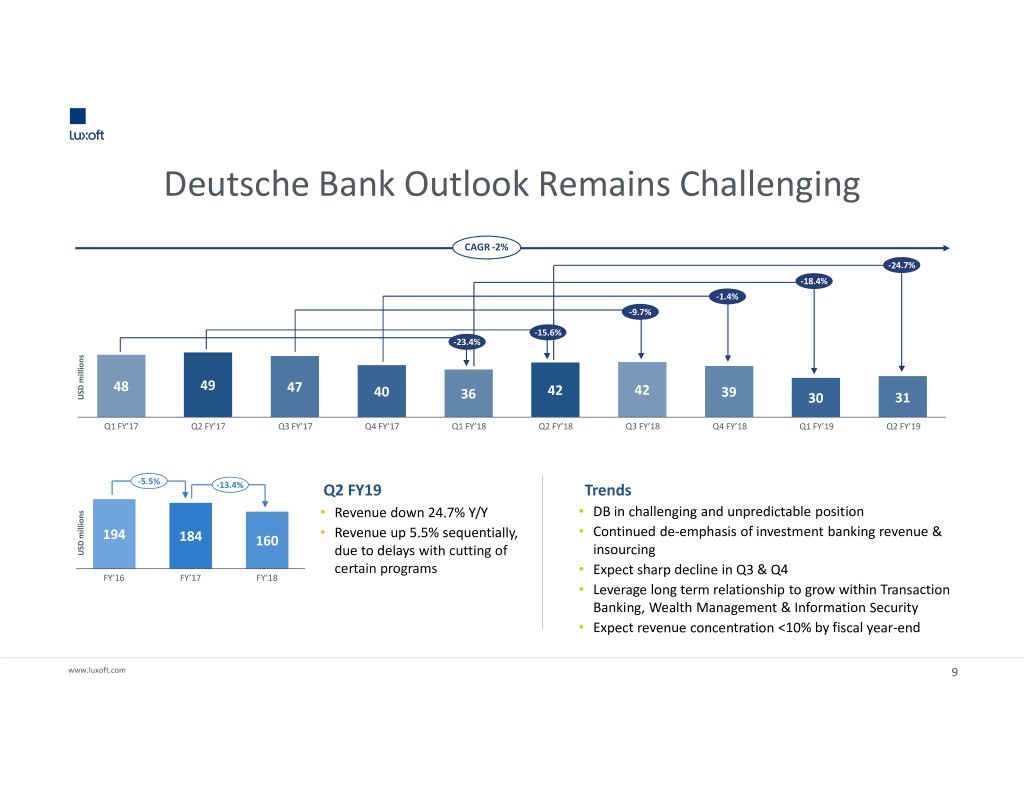
Deutsche Bank Outlook Remains Challenging CAGR -2% -24.7% -18.4% -1.4% -9.7% -15.6% -23.4% 48 49 47 42 42 USD USD millions 40 36 39 30 31 Q1 FY’17Q2 FY’17 Q3 FY’17 Q4 FY’17 Q1 FY’18 Q2 FY’18 Q3 FY’18Q4 FY’18 Q1 FY’19 Q2 FY’19 -5.5% -13.4% Q2 FY19 Trends • Revenue down 24.7% Y/Y • DB in challenging and unpredictable position • Revenue up 5.5% sequentially, • Continued de-emphasis of investment banking revenue & 194 184 160 USD USD millions due to delays with cutting of insourcing certain programs • Expect sharp decline in Q3 & Q4 FY’16FY’17 FY’18 • Leverage long term relationship to grow within Transaction Banking, Wealth Management & Information Security • Expect revenue concentration <10% by fiscal year-end www.luxoft.com 9
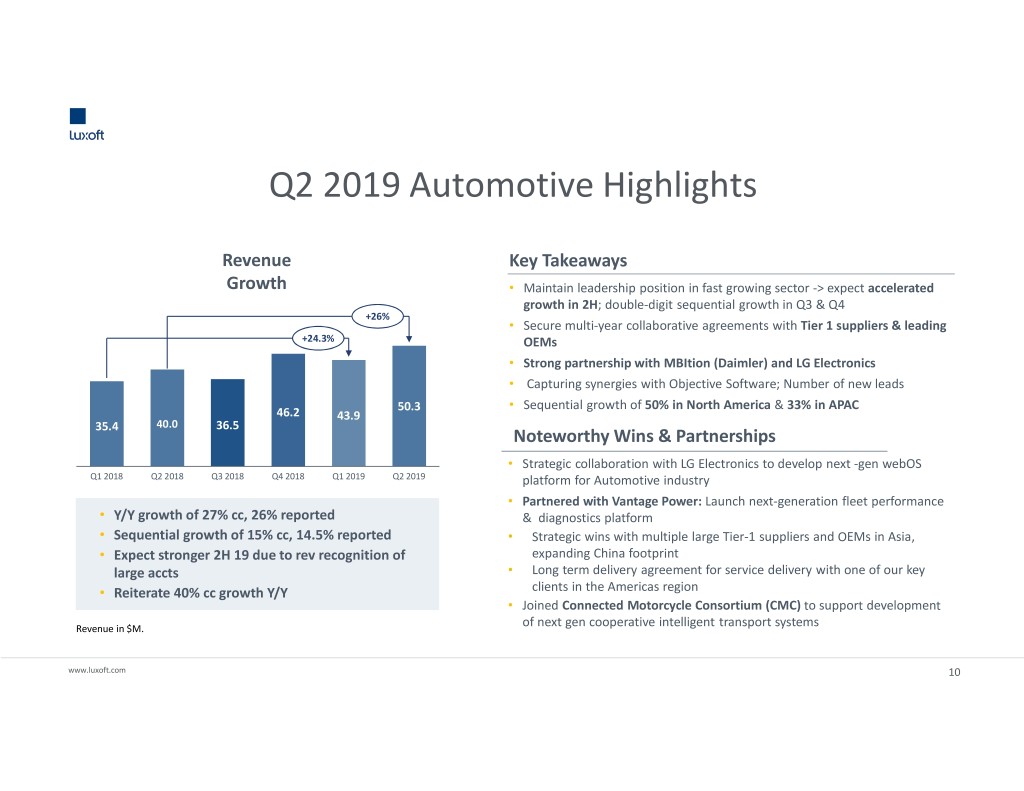
Q2 2019 Automotive Highlights Revenue Key Takeaways Growth • Maintain leadership position in fast growing sector -> expect accelerated growth in 2H; double-digit sequential growth in Q3 & Q4 +26% • Secure multi-year collaborative agreements with Tier 1 suppliers & leading +24.3% OEMs • Strong partnership with MBItion (Daimler) and LG Electronics • Capturing synergies with Objective Software; Number of new leads 50.3 • Sequential growth of 50% in North America & 33% in APAC 46.2 43.9 35.4 40.0 36.5 Noteworthy Wins & Partnerships • Strategic collaboration with LG Electronics to develop next -gen webOS Q1 2018 Q2 2018 Q3 2018Q4 2018 Q1 2019 Q2 2019 platform for Automotive industry • Partnered with Vantage Power: Launch next-generation fleet performance • Y/Y growth of 27% cc, 26% reported & diagnostics platform • Sequential growth of 15% cc, 14.5% reported • Strategic wins with multiple large Tier-1 suppliers and OEMs in Asia, • Expect stronger 2H 19 due to rev recognition of expanding China footprint large accts • Long term delivery agreement for service delivery with one of our key • Reiterate 40% cc growth Y/Y clients in the Americas region • Joined Connected Motorcycle Consortium (CMC) to support development Revenue in $M. of next gen cooperative intelligent transport systems www.luxoft.com 10
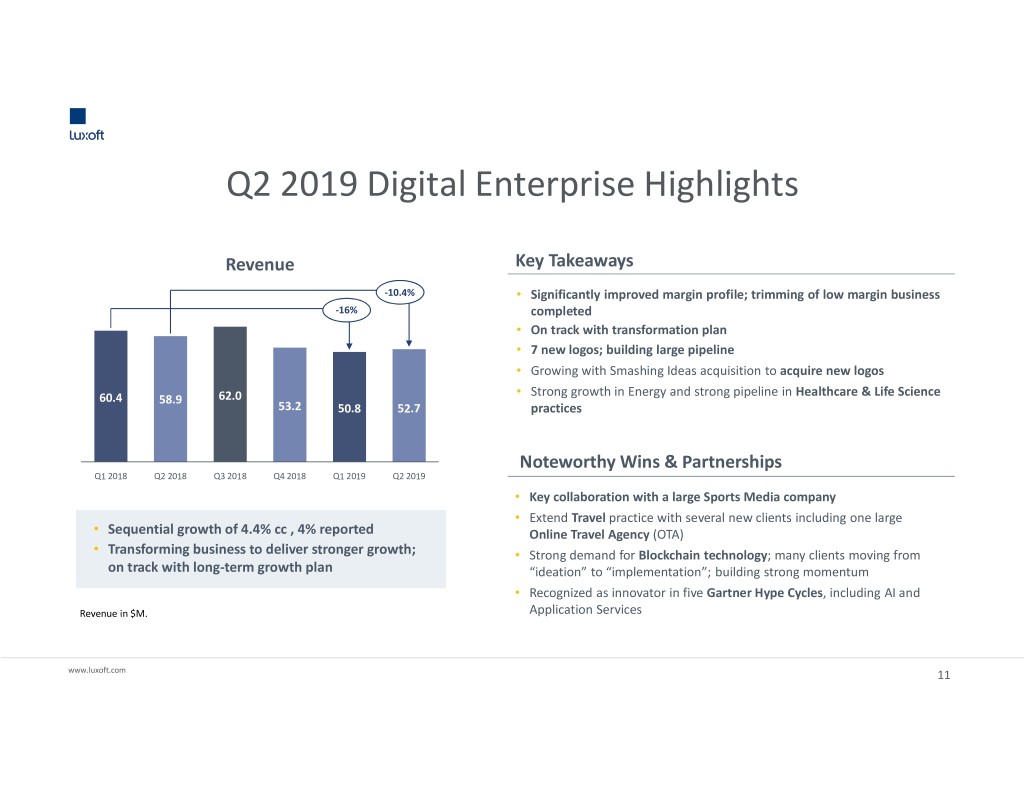
Q2 2019 Digital Enterprise Highlights Revenue Key Takeaways -10.4% • Significantly improved margin profile; trimming of low margin business -16% completed • On track with transformation plan • 7 new logos; building large pipeline • Growing with Smashing Ideas acquisition to acquire new logos • Strong growth in Energy and strong pipeline in Healthcare & Life Science 60.4 58.9 62.0 53.2 50.8 52.7 practices Noteworthy Wins & Partnerships Q1 2018Q2 2018 Q3 2018 Q4 2018 Q1 2019 Q2 2019 • Key collaboration with a large Sports Media company • Extend Travel practice with several new clients including one large • Sequential growth of 4.4% cc , 4% reported Online Travel Agency (OTA) • Transforming business to deliver stronger growth; • Strong demand for Blockchain technology; many clients moving from on track with long-term growth plan “ideation” to “implementation”; building strong momentum • Recognized as innovator in five Gartner Hype Cycles, including AI and Revenue in $M. Application Services www.luxoft.com 11
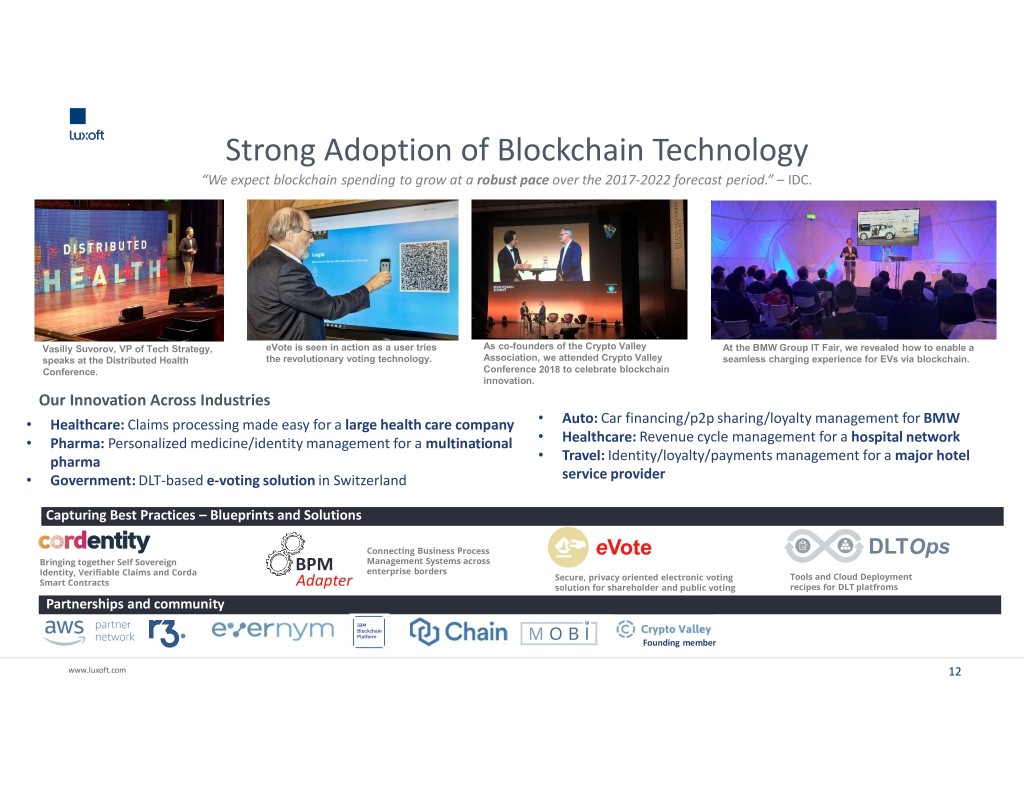
Strong Adoption of Blockchain Technology “We expect blockchain spending to grow at a robust pace over the 2017-2022 forecast period.” – IDC. Vasiliy Suvorov, VP of Tech Strategy, eVote is seen in action as a user tries As co-founders of the Crypto Valley At the BMW Group IT Fair, we revealed how to enable a speaks at the Distributed Health the revolutionary voting technology. Association, we attended Crypto Valley seamless charging experience for EVs via blockchain. Conference. Conference 2018 to celebrate blockchain innovation. Our Innovation Across Industries • Healthcare: Claims processing made easy for a large health care company • Auto: Car financing/p2p sharing/loyalty management for BMW • Pharma: Personalized medicine/identity management for a multinational • Healthcare: Revenue cycle management for a hospital network pharma • Travel: Identity/loyalty/payments management for a major hotel • Government: DLT-based e-voting solution in Switzerland service provider Capturing Best Practices – Blueprints and Solutions Connecting Business Process eVote DLTOps Bringing together Self Sovereign Management Systems across Identity, Verifiable Claims and Corda BPM enterprise borders Secure, privacy oriented electronic voting Tools and Cloud Deployment Smart Contracts Adapter solution for shareholder and public voting recipes for DLT platfroms Partnerships and community Founding member www.luxoft.com 12
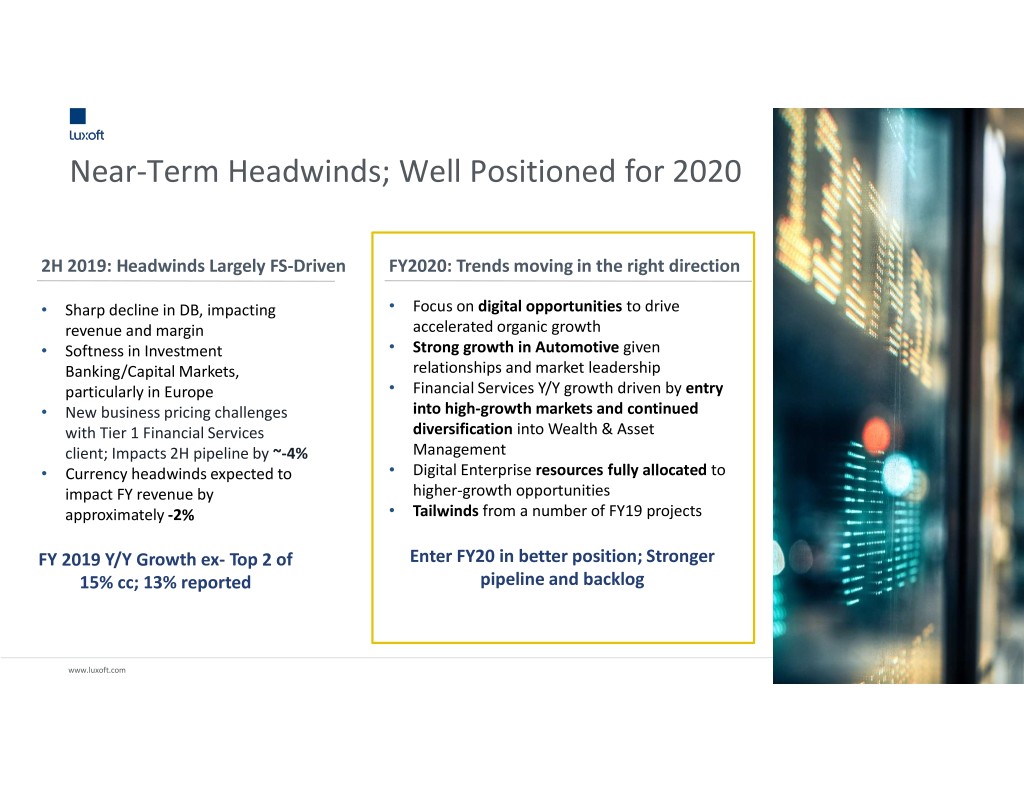
Near-Term Headwinds; Well Positioned for 2020 2H 2019: Headwinds Largely FS-Driven FY2020: Trends moving in the right direction • Sharp decline in DB, impacting • Focus on digital opportunities to drive revenue and margin accelerated organic growth • Softness in Investment • Strong growth in Automotive given Banking/Capital Markets, relationships and market leadership particularly in Europe • Financial Services Y/Y growth driven by entry • New business pricing challenges into high-growth markets and continued with Tier 1 Financial Services diversification into Wealth & Asset client; Impacts 2H pipeline by ~-4% Management • Currency headwinds expected to • Digital Enterprise resources fully allocated to impact FY revenue by higher-growth opportunities approximately -2% • Tailwinds from a number of FY19 projects FY 2019 Y/Y Growth ex- Top 2 of Enter FY20 in better position; Stronger 15% cc; 13% reported pipeline and backlog www.luxoft.com 13
Evgeny Fetisov CFO, Luxoft Holding, Inc www.luxoft.com
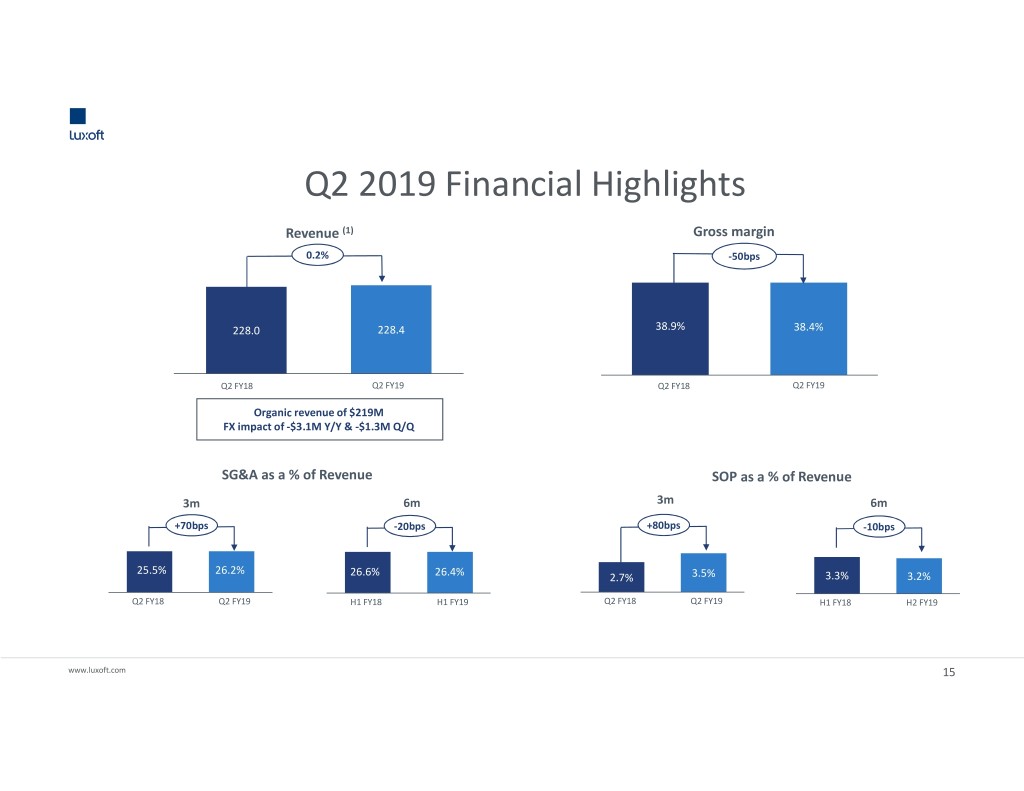
Q2 2019 Financial Highlights Revenue (1) Gross margin 0.2% -50bps 228.0 228.4 38.9% 38.4% Q2 FY18 Q2 FY19 Q2 FY18 Q2 FY19 Organic revenue of $219M FX impact of -$3.1M Y/Y & -$1.3M Q/Q SG&A as a % of Revenue SOP as a % of Revenue 3m 6m 3m 6m +70bps -20bps +80bps -10bps 25.5% 26.2% 26.6% 26.4% 2.7% 3.5% 3.3% 3.2% Q2 FY18 Q2 FY19 H1 FY18 H1 FY19 Q2 FY18 Q2 FY19 H1 FY18 H2 FY19 www.luxoft.com 15
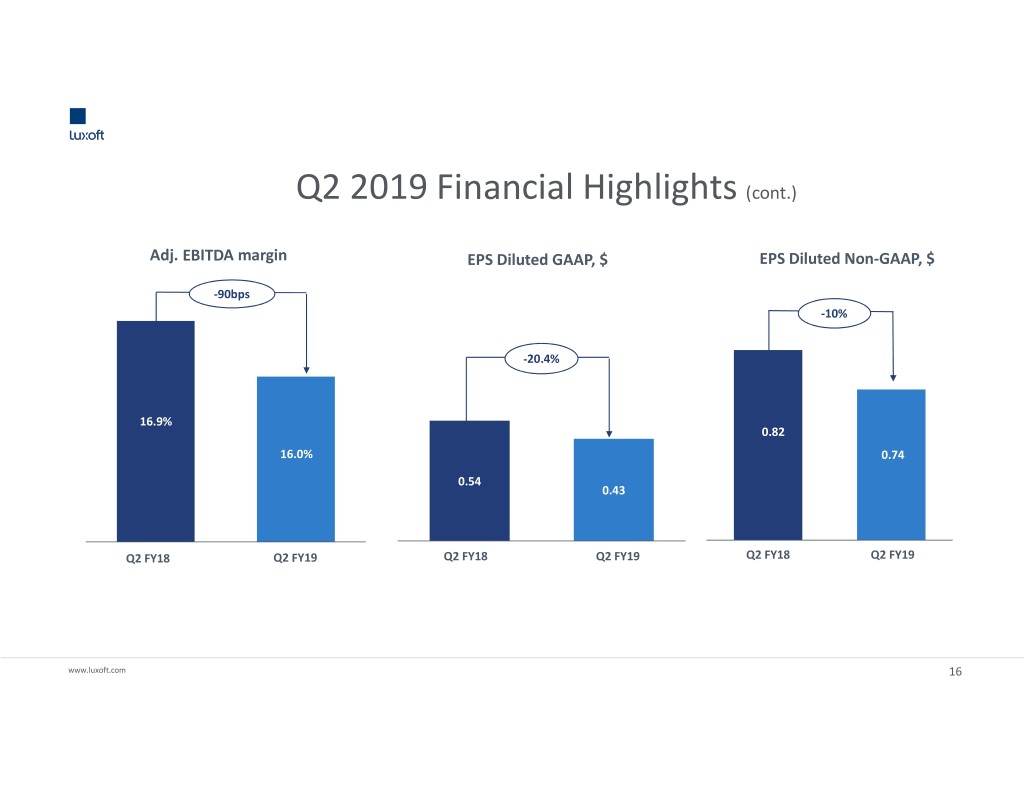
Q2 2019 Financial Highlights (cont.) Adj. EBITDA margin EPS Diluted GAAP, $ EPS Diluted Non-GAAP, $ -90bps -10% -20.4% 16.9% 0.82 16.0% 0.74 0.54 0.43 Q2 FY18 Q2 FY19 Q2 FY18 Q2 FY19 Q2 FY18 Q2 FY19 www.luxoft.com 16
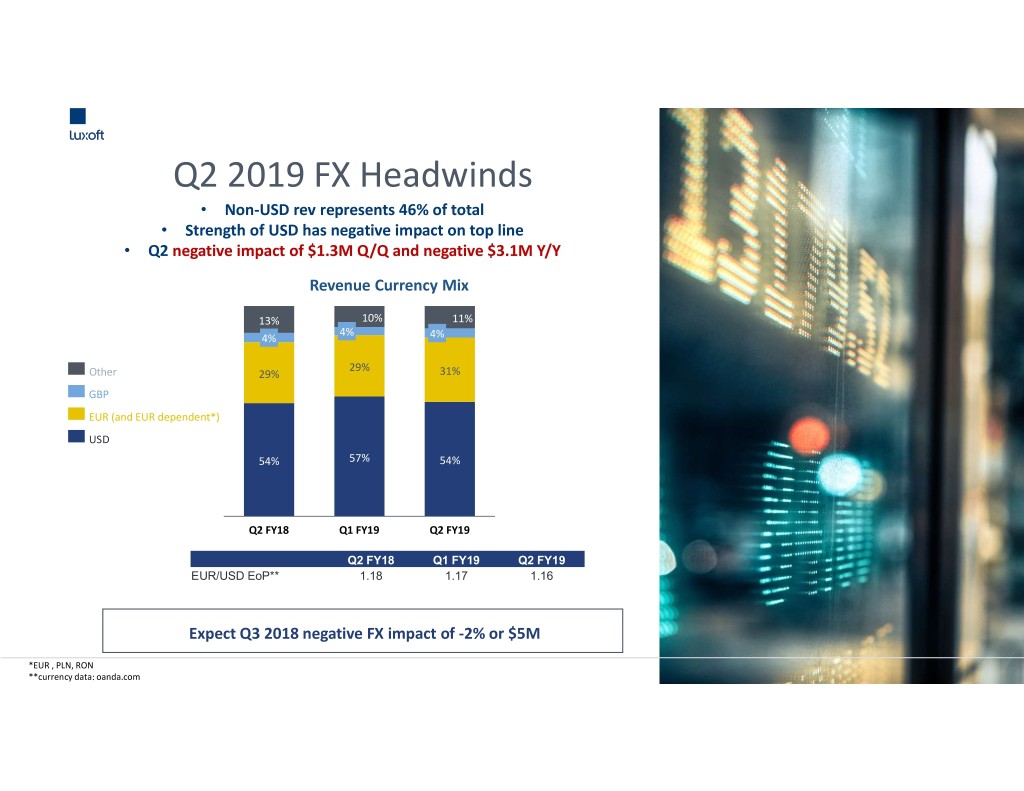
Q2 2019 FX Headwinds • Non-USD rev represents 46% of total • Strength of USD has negative impact on top line • Q2 negative impact of $1.3M Q/Q and negative $3.1M Y/Y Revenue Currency Mix 13% 10% 11% 4% 4% 4% 29% Other 29% 31% GBP EUR (and EUR dependent*) USD 54% 57% 54% Q2 FY18 Q1 FY19 Q2 FY19 Q2 FY18 Q1 FY19 Q2 FY19 EUR/USD EoP** 1.18 1.17 1.16 Expect Q3 2018 negative FX impact of -2% or $5M *EUR , PLN,www.luxoft.com RON **currency data: oanda.com
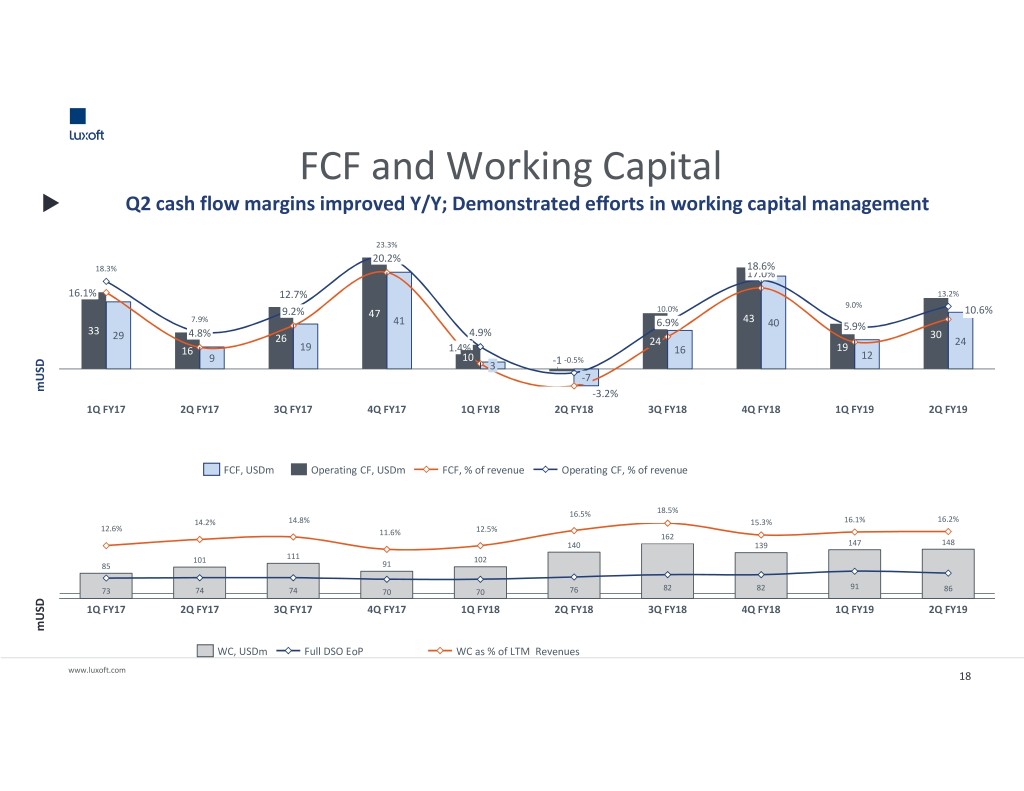
18 FCF and Working Capital Q2 cash flow margins improved Y/Y; Demonstrated efforts in working capital management 23.3% 20.2% 18.6% 18.3% 17.0% 16.1% 12.7% 13.2% 9.0% 9.2% 47 10.0% 10.6% 7.9% 43 41 6.9% 40 5.9% 33 29 4.8% 4.9% 30 26 24 24 16 19 1.4% 16 19 9 10 -0.5% 12 3 -1 -7 mUSD -3.2% 1Q FY17 2Q FY17 3Q FY17 4Q FY17 1Q FY18 2Q FY183Q FY18 4Q FY18 1Q FY19 2Q FY19 FCF, USDm Operating CF, USDm FCF, % of revenue Operating CF, % of revenue 16.5% 18.5% 14.2% 14.8% 15.3% 16.1% 16.2% 12.6% 12.5% 11.6% 162 140 139 147 148 101 111 102 85 91 82 82 91 73 74 74 70 70 76 86 1Q FY172Q FY17 3Q FY17 4Q FY17 1Q FY18 2Q FY18 3Q FY184Q FY18 1Q FY19 2Q FY19 mUSD WC, USDm Full DSO EoP WC as % of LTM Revenues www.luxoft.com 18
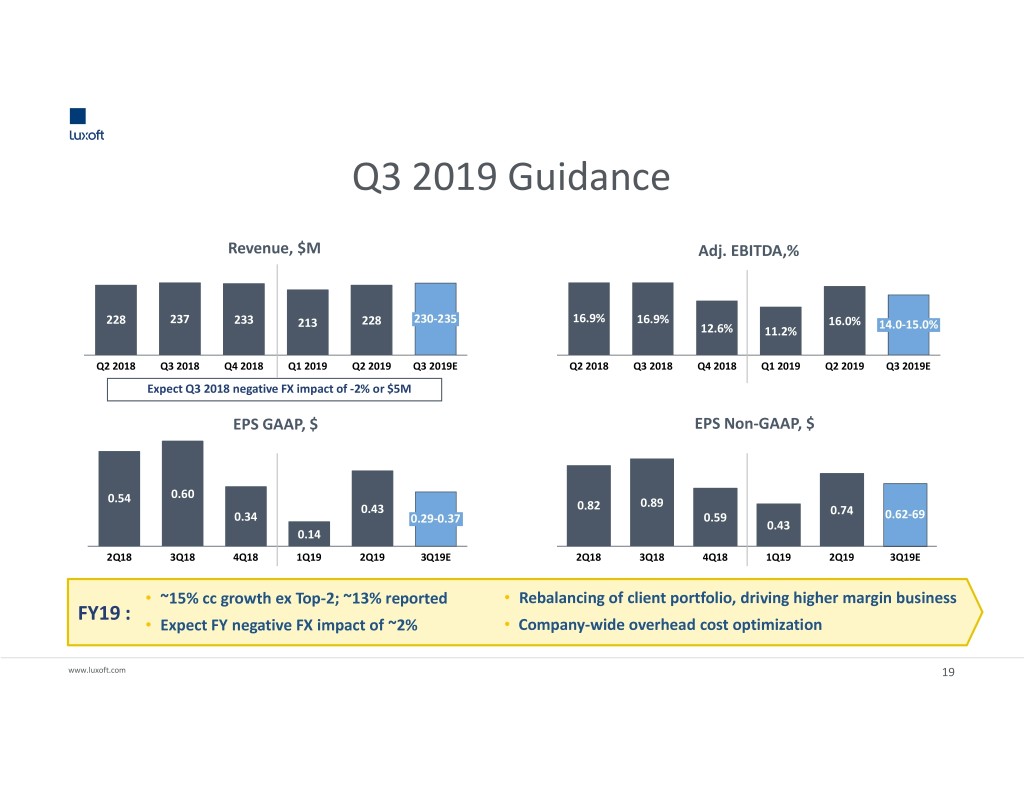
Q3 2019 Guidance Revenue, $M Adj. EBITDA,% 228 237 233 230-235 16.9% 16.9% 237 213227 228 16.0% 14.0-15.0% 220-225 16.9% 12.6% 11.2%16.0% 13-14% Q2 2018 Q3 2018 Q4 2018 Q1 2019 Q2 2019 Q3 2019E Q2 2018Q3 2018 Q4 2018 Q1 2019 Q2 2019 Q3 2019E Expect Q3 2018 negative FX impact of -2% or $5M EPS GAAP, $ EPS Non-GAAP, $ 0.60 0.54 0.89 0.43 0.82 0.74 0.34 0.29-0.37 0.59 0.62-69 0.43 0.14 0.53- 0.89 0.74 0.60 2Q18 3Q184Q18 1Q190.42 2Q19 3Q19E 2Q18 3Q18 4Q18 1Q19 2Q19 3Q19E • ~15% cc growth ex Top-2; ~13% reported • Rebalancing of client portfolio, driving higher margin business FY19 : • Expect FY negative FX impact of ~2% • Company-wide overhead cost optimization www.luxoft.com 19
Appendix www.luxoft.com
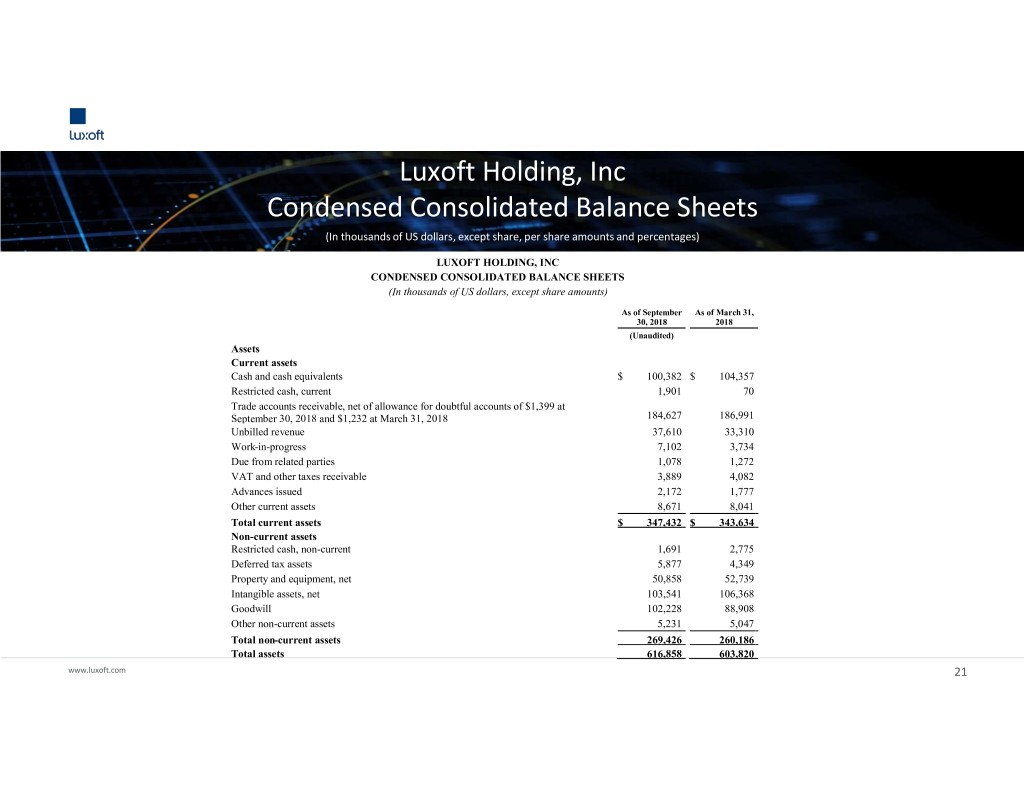
Luxoft Holding, Inc Condensed Consolidated Balance Sheets (In thousands of US dollars, except share, per share amounts and percentages) LUXOFT HOLDING, INC CONDENSED CONSOLIDATED BALANCE SHEETS (In thousands of US dollars, except share amounts) As of September As of March 31, 30, 2018 2018 (Unaudited) Assets Current assets Cash and cash equivalents $ 100,382 $ 104,357 Restricted cash, current 1,901 70 Trade accounts receivable, net of allowance for doubtful accounts of $1,399 at September 30, 2018 and $1,232 at March 31, 2018 184,627 186,991 Unbilled revenue 37,610 33,310 Work-in-progress 7,102 3,734 Due from related parties 1,078 1,272 VAT and other taxes receivable 3,889 4,082 Advances issued 2,172 1,777 Other current assets 8,671 8,041 Total current assets $ 347,432 $ 343,634 Non-current assets Restricted cash, non-current 1,691 2,775 Deferred tax assets 5,877 4,349 Property and equipment, net 50,858 52,739 Intangible assets, net 103,541 106,368 Goodwill 102,228 88,908 Other non-current assets 5,231 5,047 Total non-current assets 269,426 260,186 Total assets 616,858 603,820 www.luxoft.com 21
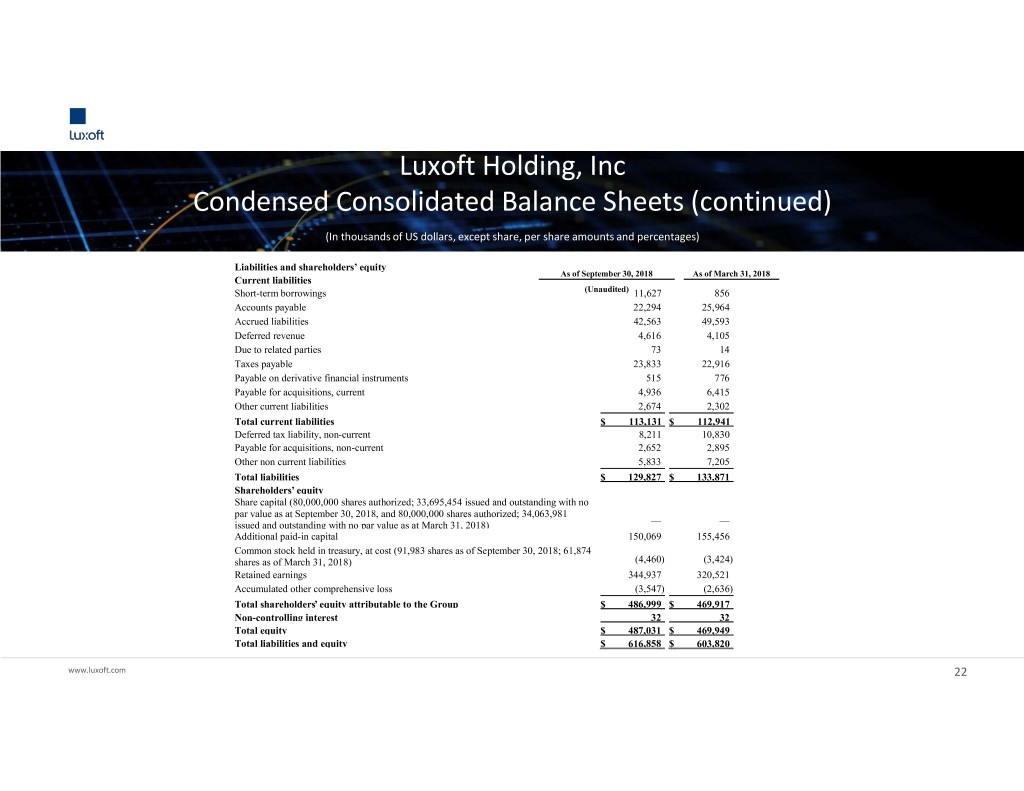
Luxoft Holding, Inc Condensed Consolidated Balance Sheets (continued) (In thousands of US dollars, except share, per share amounts and percentages) Liabilities and shareholders’ equity As of September 30, 2018 As of March 31, 2018 Current liabilities Short-term borrowings (Unaudited) 11,627 856 Accounts payable 22,294 25,964 Accrued liabilities 42,563 49,593 Deferred revenue 4,616 4,105 Due to related parties 73 14 Taxes payable 23,833 22,916 Payable on derivative financial instruments 515 776 Payable for acquisitions, current 4,936 6,415 Other current liabilities 2,674 2,302 Total current liabilities $ 113,131 $ 112,941 Deferred tax liability, non-current 8,211 10,830 Payable for acquisitions, non-current 2,652 2,895 Other non current liabilities 5,833 7,205 Total liabilities $ 129,827 $ 133,871 Shareholders’ equity Share capital (80,000,000 shares authorized; 33,695,454 issued and outstanding with no par value as at September 30, 2018, and 80,000,000 shares authorized; 34,063,981 issued and outstanding with no par value as at March 31, 2018) — — Additional paid-in capital 150,069 155,456 Common stock held in treasury, at cost (91,983 shares as of September 30, 2018; 61,874 shares as of March 31, 2018) (4,460) (3,424) Retained earnings 344,937 320,521 Accumulated other comprehensive loss (3,547) (2,636) Total shareholders’ equity attributable to the Group $ 486,999 $ 469,917 Non-controlling interest 32 32 Total equity $ 487,031 $ 469,949 Total liabilities and equity $ 616,858 $ 603,820 www.luxoft.com 22

Luxoft Holding, Inc Condensed Consolidated Statements Of Income (In thousands of US dollars, except share, per share amounts and percentages) For the three months ended For the six months ended September 30, September 30, 2018 2017 2018 2017 (Unaudited) (Unaudited) Sales of services $ 228,411 $ 228,030 $ 441,201 $ 437,272 Operating expenses Cost of services (exclusive of depreciation and amortization) 140,631 139,305 277,998 274,904 Selling, general and administrative expenses 59,864 58,199 116,573 116,262 Depreciation and amortization 10,969 9,915 21,739 20,645 Gain from revaluation of contingent liability (145) (870) (145) (2,090) Operating income 17,092 21,481 25,036 27,551 Other income and expenses 0 Interest income/ (loss), net (77) 42 (111) 59 Unwinding of discount for contingent liability, income/ (loss) (32) 103 (99) (698) Other income, net 433 457 1,131 946 Gain/ (loss) from derivative financial instruments 469 (3) 1,321 89 Net foreign exchange loss (836) (356) (4,290) 1,124 Income before income taxes 17,049 21,724 22,988 29,071 Income tax expense (2,638) (3,284) (3,879) (4,314) Net income $ 14,411 $ 18,440 $ 19,109 $ 24,757 Net income attributable to the non-controlling interest — — — — Net income attributable to the Group $ 14,411 $ 18,440 $ 19,109 $ 24,757 www.luxoft.com 23
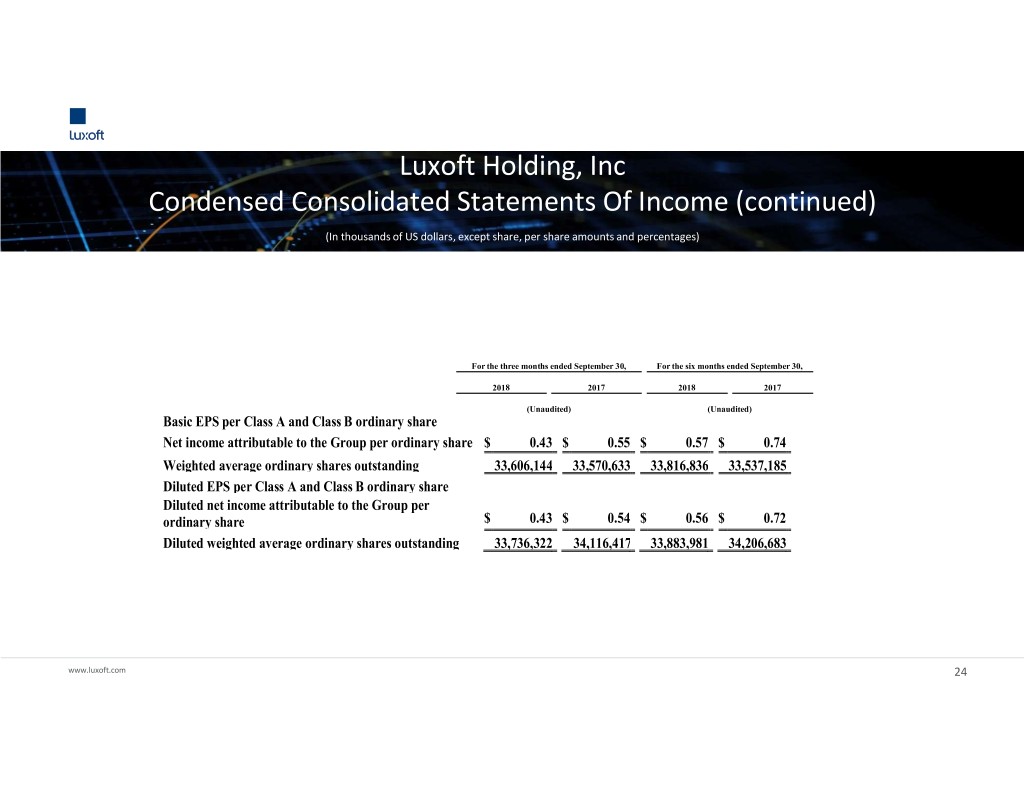
Luxoft Holding, Inc Condensed Consolidated Statements Of Income (continued) (In thousands of US dollars, except share, per share amounts and percentages) For the three months ended September 30, For the six months ended September 30, 2018 2017 2018 2017 (Unaudited) (Unaudited) Basic EPS per Class A and Class B ordinary share Net income attributable to the Group per ordinary share $ 0.43 $ 0.55 $ 0.57 $ 0.74 Weighted average ordinary shares outstanding 33,606,144 33,570,633 33,816,836 33,537,185 Diluted EPS per Class A and Class B ordinary share Diluted net income attributable to the Group per ordinary share $ 0.43 $ 0.54 $ 0.56 $ 0.72 Diluted weighted average ordinary shares outstanding 33,736,322 34,116,417 33,883,981 34,206,683 www.luxoft.com 24
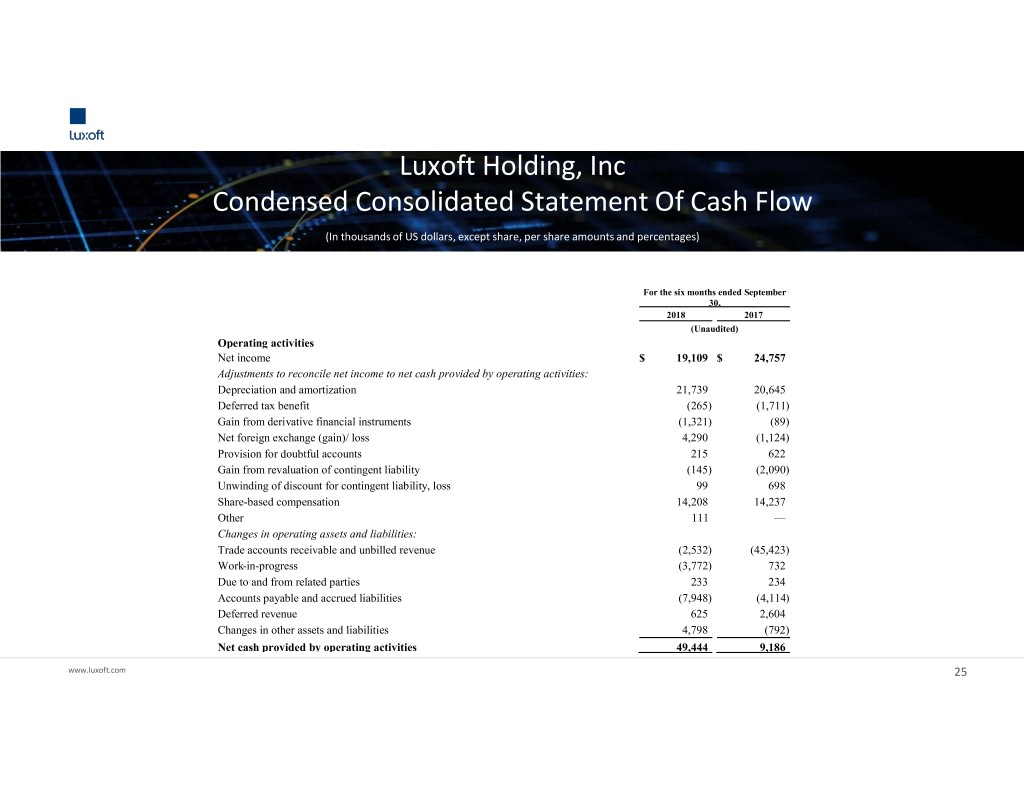
Luxoft Holding, Inc Condensed Consolidated Statement Of Cash Flow (In thousands of US dollars, except share, per share amounts and percentages) For the six months ended September 30, 2018 2017 (Unaudited) Operating activities Net income $ 19,109 $ 24,757 Adjustments to reconcile net income to net cash provided by operating activities: Depreciation and amortization 21,739 20,645 Deferred tax benefit (265) (1,711) Gain from derivative financial instruments (1,321) (89) Net foreign exchange (gain)/ loss 4,290 (1,124) Provision for doubtful accounts 215 622 Gain from revaluation of contingent liability (145) (2,090) Unwinding of discount for contingent liability, loss 99 698 Share-based compensation 14,208 14,237 Other 111 — Changes in operating assets and liabilities: Trade accounts receivable and unbilled revenue (2,532) (45,423) Work-in-progress (3,772) 732 Due to and from related parties 233 234 Accounts payable and accrued liabilities (7,948) (4,114) Deferred revenue 625 2,604 Changes in other assets and liabilities 4,798 (792) Net cash provided by operating activities 49,444 9,186 www.luxoft.com 25
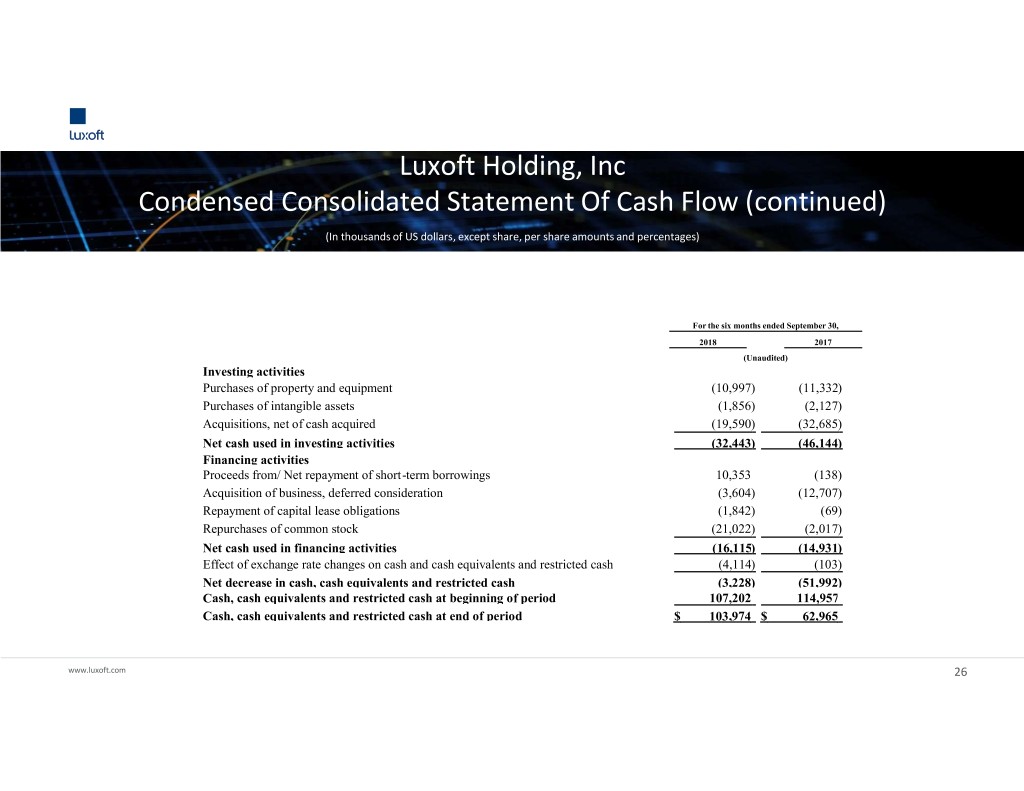
Luxoft Holding, Inc Condensed Consolidated Statement Of Cash Flow (continued) (In thousands of US dollars, except share, per share amounts and percentages) For the six months ended September 30, 2018 2017 (Unaudited) Investing activities Purchases of property and equipment (10,997) (11,332) Purchases of intangible assets (1,856) (2,127) Acquisitions, net of cash acquired (19,590) (32,685) Net cash used in investing activities (32,443) (46,144) Financing activities Proceeds from/ Net repayment of short-term borrowings 10,353 (138) Acquisition of business, deferred consideration (3,604) (12,707) Repayment of capital lease obligations (1,842) (69) Repurchases of common stock (21,022) (2,017) Net cash used in financing activities (16,115) (14,931) Effect of exchange rate changes on cash and cash equivalents and restricted cash (4,114) (103) Net decrease in cash, cash equivalents and restricted cash (3,228) (51,992) Cash, cash equivalents and restricted cash at beginning of period 107,202 114,957 Cash, cash equivalents and restricted cash at end of period $ 103,974 $ 62,965 www.luxoft.com 26
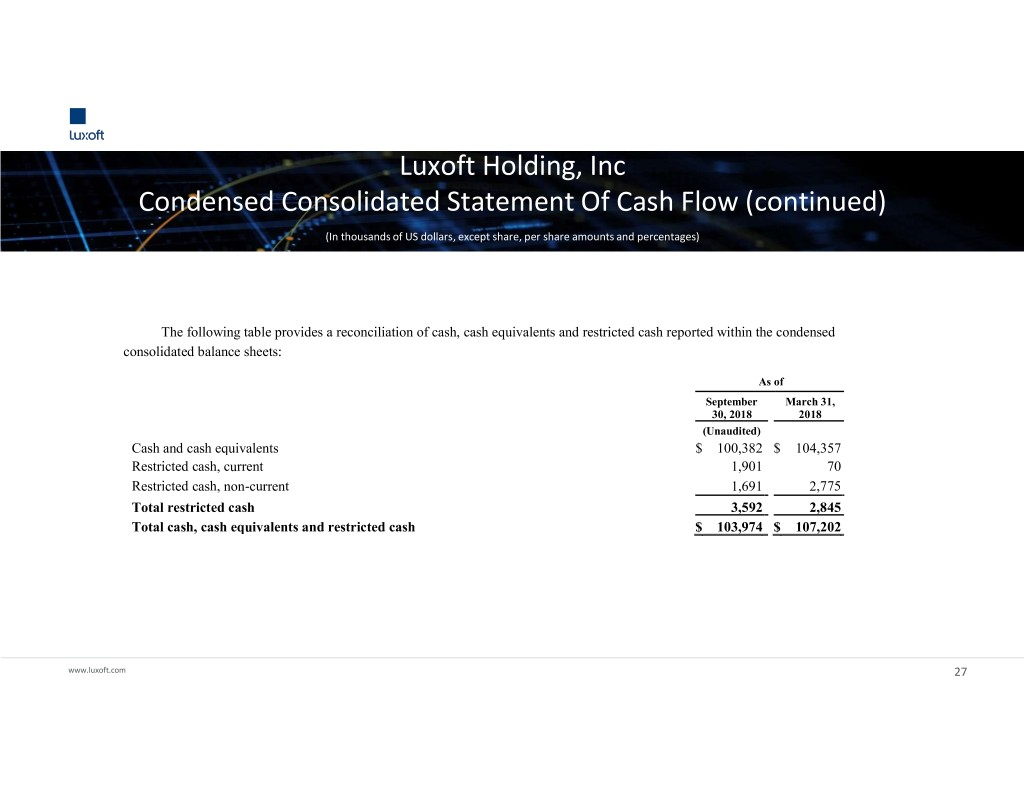
Luxoft Holding, Inc Condensed Consolidated Statement Of Cash Flow (continued) (In thousands of US dollars, except share, per share amounts and percentages) The following table provides a reconciliation of cash, cash equivalents and restricted cash reported within the condensed consolidated balance sheets: As of September March 31, 30, 2018 2018 (Unaudited) Cash and cash equivalents $ 100,382 $ 104,357 Restricted cash, current 1,901 70 Restricted cash, non-current 1,691 2,775 Total restricted cash 3,592 2,845 Total cash, cash equivalents and restricted cash $ 103,974 $ 107,202 www.luxoft.com 27
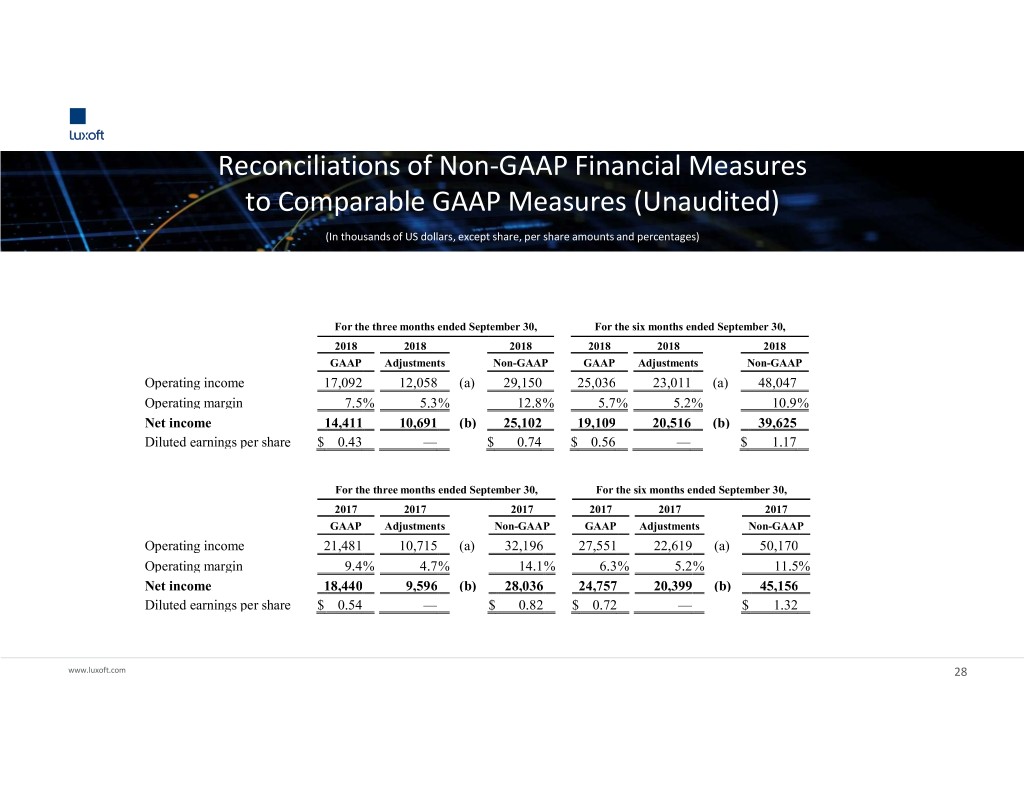
Reconciliations of Non-GAAP Financial Measures to Comparable GAAP Measures (Unaudited) (In thousands of US dollars, except share, per share amounts and percentages) For the three months ended September 30, For the six months ended September 30, 2018 2018 2018 2018 2018 2018 GAAP Adjustments Non-GAAP GAAP Adjustments Non-GAAP Operating income 17,092 12,058 (a) 29,150 25,036 23,011 (a) 48,047 Operating margin 7.5% 5.3% 12.8% 5.7% 5.2% 10.9% Net income 14,411 10,691 (b) 25,102 19,109 20,516 (b) 39,625 Diluted earnings per share $ 0.43 — $ 0.74 $ 0.56 — $ 1.17 For the three months ended September 30, For the six months ended September 30, 2017 2017 2017 2017 2017 2017 GAAP Adjustments Non-GAAP GAAP Adjustments Non-GAAP Operating income 21,481 10,715 (a) 32,196 27,551 22,619 (a) 50,170 Operating margin 9.4% 4.7% 14.1% 6.3% 5.2% 11.5% Net income 18,440 9,596 (b) 28,036 24,757 20,399 (b) 45,156 Diluted earnings per share $ 0.54 — $ 0.82 $ 0.72 — $ 1.32 www.luxoft.com 28
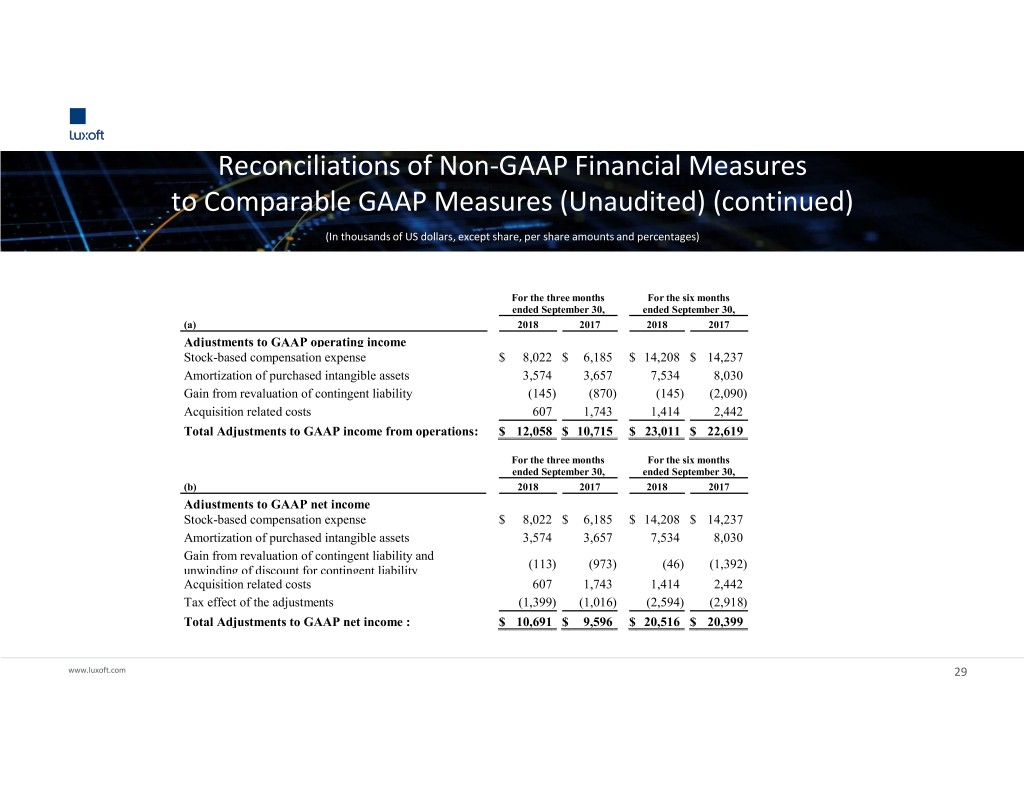
Reconciliations of Non-GAAP Financial Measures to Comparable GAAP Measures (Unaudited) (continued) (In thousands of US dollars, except share, per share amounts and percentages) For the three months For the six months ended September 30, ended September 30, (a) 2018 2017 2018 2017 Adjustments to GAAP operating income Stock-based compensation expense $ 8,022 $ 6,185 $ 14,208 $ 14,237 Amortization of purchased intangible assets 3,574 3,657 7,534 8,030 Gain from revaluation of contingent liability (145) (870) (145) (2,090) Acquisition related costs 607 1,743 1,414 2,442 Total Adjustments to GAAP income from operations: $ 12,058 $ 10,715 $ 23,011 $ 22,619 For the three months For the six months ended September 30, ended September 30, (b) 2018 2017 2018 2017 Adjustments to GAAP net income Stock-based compensation expense $ 8,022 $ 6,185 $ 14,208 $ 14,237 Amortization of purchased intangible assets 3,574 3,657 7,534 8,030 Gain from revaluation of contingent liability and (113) (973) (46) (1,392) unwinding of discount for contingent liability Acquisition related costs 607 1,743 1,414 2,442 Tax effect of the adjustments (1,399) (1,016) (2,594) (2,918) Total Adjustments to GAAP net income : $ 10,691 $ 9,596 $ 20,516 $ 20,399 www.luxoft.com 29
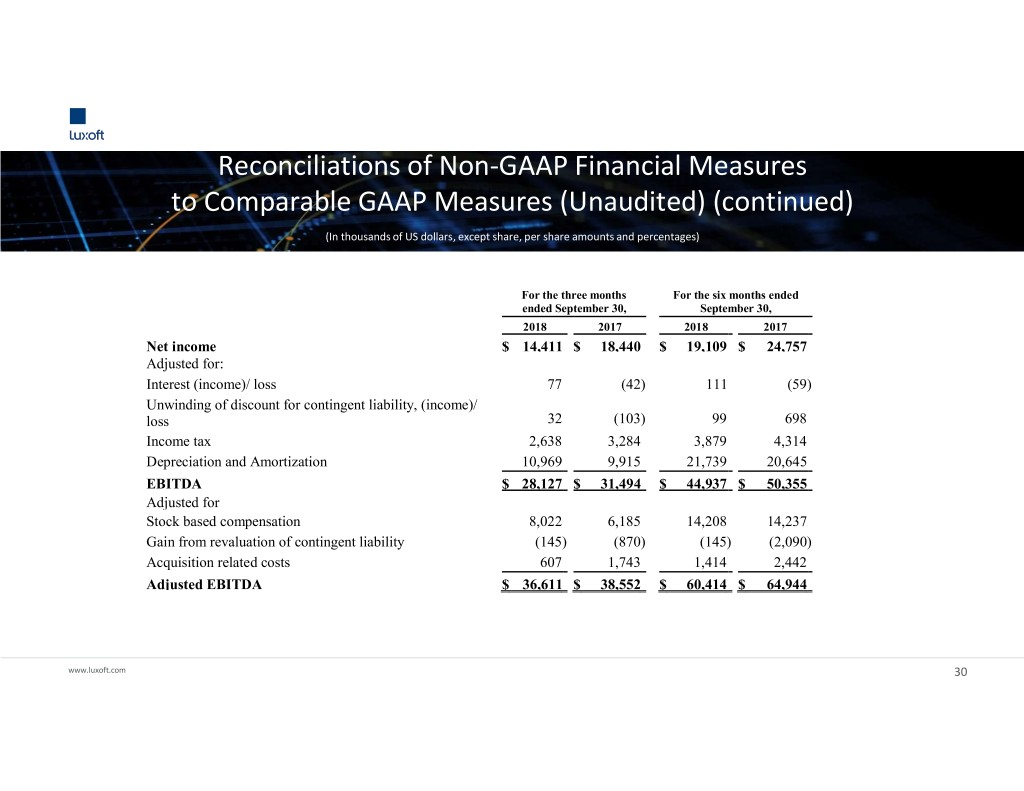
Reconciliations of Non-GAAP Financial Measures to Comparable GAAP Measures (Unaudited) (continued) (In thousands of US dollars, except share, per share amounts and percentages) For the three months For the six months ended ended September 30, September 30, 2018 2017 2018 2017 Net income $ 14,411 $ 18,440 $ 19,109 $ 24,757 Adjusted for: Interest (income)/ loss 77 (42) 111 (59) Unwinding of discount for contingent liability, (income)/ loss 32 (103) 99 698 Income tax 2,638 3,284 3,879 4,314 Depreciation and Amortization 10,969 9,915 21,739 20,645 EBITDA $ 28,127 $ 31,494 $ 44,937 $ 50,355 Adjusted for Stock based compensation 8,022 6,185 14,208 14,237 Gain from revaluation of contingent liability (145) (870) (145) (2,090) Acquisition related costs 607 1,743 1,414 2,442 Adjusted EBITDA $ 36,611 $ 38,552 $ 60,414 $ 64,944 www.luxoft.com 30
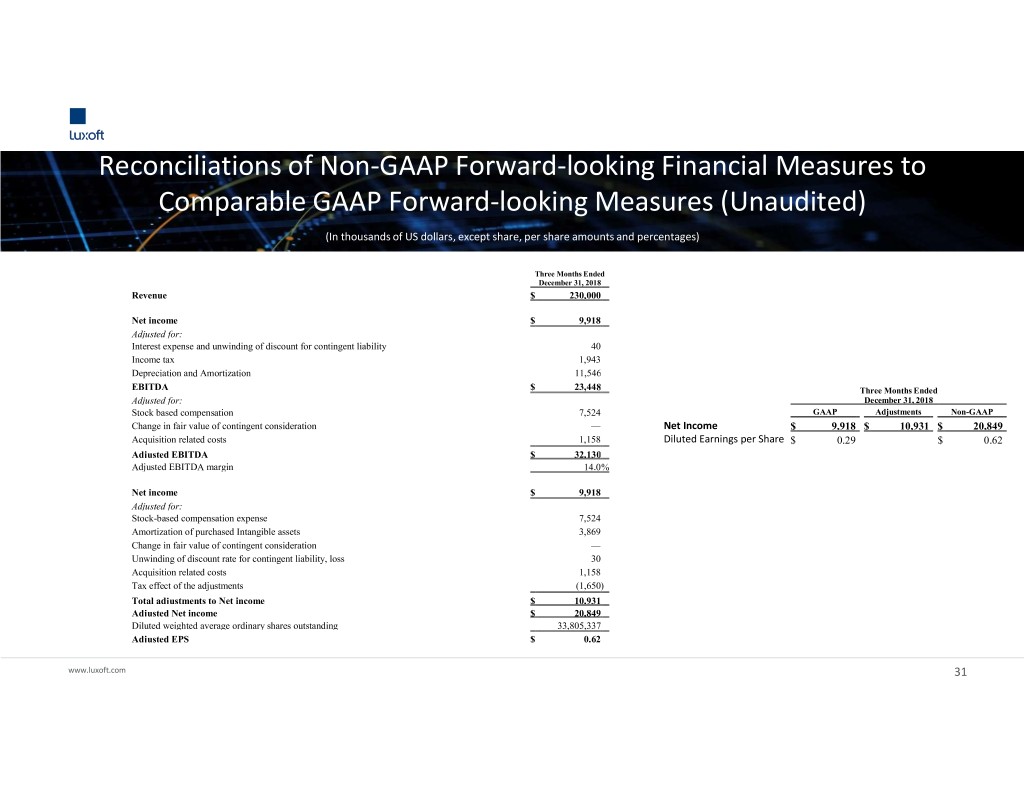
Reconciliations of Non-GAAP Forward-looking Financial Measures to Comparable GAAP Forward-looking Measures (Unaudited) (In thousands of US dollars, except share, per share amounts and percentages) Three Months Ended December 31, 2018 Revenue $ 230,000 Net income $ 9,918 Adjusted for: Interest expense and unwinding of discount for contingent liability 40 Income tax 1,943 Depreciation and Amortization 11,546 EBITDA $ 23,448 Three Months Ended Adjusted for: December 31, 2018 Stock based compensation 7,524 GAAP Adjustments Non-GAAP Change in fair value of contingent consideration — Net Income $ 9,918 $ 10,931 $ 20,849 Acquisition related costs 1,158 Diluted Earnings per Share $ 0.29 $ 0.62 Adjusted EBITDA $ 32,130 Adjusted EBITDA margin 14.0% Net income $ 9,918 Adjusted for: Stock-based compensation expense 7,524 Amortization of purchased Intangible assets 3,869 Change in fair value of contingent consideration — Unwinding of discount rate for contingent liability, loss 30 Acquisition related costs 1,158 Tax effect of the adjustments (1,650) Total adjustments to Net income $ 10,931 Adjusted Net income $ 20,849 Diluted weighted average ordinary shares outstanding 33,805,337 Adjusted EPS $ 0.62 www.luxoft.com 31
www.luxoft.com


