Exhibit 99.1
Highlights of continuing operations for the three months ended December 31, 2013 included:
| · | Gross customer additions of 345,000, the ninth successive quarter where additions exceeded 300,000. Net additions of 50,000 resulted in an ending customer base of 4.6 million, up 7% from a year earlier. |
| · | Gross margin of $162.8 million, up 16%. |
| · | Base EBITDA of $72.2 million, up 31%. |
| · | Base Funds from operations of $38.8 million, up 10%. |
| · | Earnings per share of $1.12, up from $0.30. Given that EPS is driven by non-cash mark to market earnings or losses on future commodity supply sold at fixed prices, Just Energy believes that Base EBITDA, Base Funds from operations and Embedded margin growth are better measures of operating performance. |
| · | Future embedded gross margin of $2.4 billion, up 9%. |
| · | Payout ratio on Base Funds from operations was 80% for the quarter versus 126% for the three months ended December 31, 2012. |
| · | Three and nine month results are consistent with published annual guidance of $220 million in fiscal 2014 Base EBITDA, up from the $175.1 million realized in fiscal 2013. |
Message from the Chief Executive Officer
Fellow Shareholders,
I am very pleased to report excellent third quarter results for Just Energy as we achieved 31% year over year Base EBITDA growth and reduced our payout ratio for the quarter to 80%. This puts us well on track to deliver upon our fiscal 2014 guidance for Base EBITDA of $220 million and a dividend payout ratio on Funds from continuing operations of less than 100%. Additionally, these results show the impact of our substantial customer base increase over the past two years coupled with our focused cost control efforts. This has bolstered our cash flow, which continues to support our steady dividend while providing excess free cash to fund debt reduction and growth efforts.
| For the three months ended December 31 | Fiscal 2014 | Fiscal 2013 |
| (Millions of dollars except where indicated and per share amounts) | ||
| Sales | $859.0 | $736.6 |
| Gross margin | 162.8 | 140.3 |
| Administrative expenses | 35.7 | 34.9 |
| Selling & marketing expenses | 48.6 | 49.9 |
| Finance costs | 23.0 | 18.2 |
| Profit from continuing operations | 160.2 | 41.8 |
| Profit (loss) from discontinued operations | 17.3 | (1.6) |
| Profit | 177.5 | 40.2 |
| Earnings per share from continuing operations - basic | 1.12 | 0.30 |
| Earnings per share from continuing operations - diluted | 0.96 | 0.28 |
| Dividends/distributions | 30.9 | 44.6 |
| Base EBITDA from continuing operations | 72.2 | 55.2 |
| Base Funds from continuing operations | 38.8 | 35.3 |
| Payout ratio on Base Funds from continuing operations | 80% | 126% |
2
| For the nine months ended December 31 | Fiscal 2014 | Fiscal 2013 |
| (Millions of dollars except where indicated and per share amounts) | ||
| Sales | $2,458.1 | $2,107.1 |
| Gross margin | 410.7 | 368.2 |
| Administrative expenses | 106.9 | 102.1 |
| Selling & marketing expenses | 148.9 | 158.8 |
| Finance costs | 67.9 | 52.9 |
| Profit from continuing operations | 6.0 | 398.3 |
| Profit (loss) from discontinued operations | 18.0 | (6.4) |
| Profit | 24.0 | 392.0 |
| Earnings per share from continuing operations - basic | 0.04 | 2.85 |
| Earnings per share from continuing operations - diluted | 0.04 | 2.46 |
| Dividends/distributions | 92.5 | 133.4 |
| Base EBITDA from continuing operations | 140.4 | 102.8 |
| Base Funds from continuing operations | 80.9 | 49.0 |
| Payout ratio on Base Funds from continuing operations | 114% | 272% |
| Embedded gross margin | 2,386.2 | 2,197.4 |
| Energy customers (RCEs) | 4,360,000 | 4,124,000 |
| Home Services customers (installed units) | 287,000 | 225,000 |
| Total customers (RCEs and installed units) | 4,647,000 | 4,349,000 |
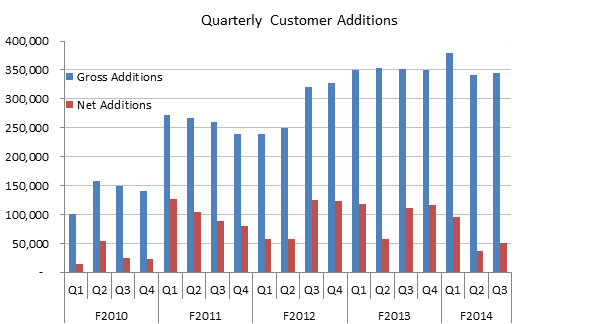
Customer Additions
Customer additions in the third quarter were 345,000, the ninth consecutive quarter where additions have exceeded 300,000. Prior to these nine quarters, the Company had never aggregated 300,000 customers in a quarter. These quarterly additions resulted in 50,000 net new customers, bringing the total Just Energy customer base to 4.6 million at quarter end, up 7% from a year earlier.
3
New additions were equally split between Consumer division customers (165,000) and Commercial division customers (168,000) as both units realized marketing success. The Home Services division experienced a 28% year over year growth in total installations, ending at 287,000 customers. This included 23,000 smart thermostats installed either in product bundles or on a stand-alone basis.
Energy customer additions in the quarter were affected by management’s decision to carefully monitor new customer margins with the intent of maintaining margins at historical level. The result was fewer short term net additions but greater long term profitability.
4
| Customer aggregation | ||||||||
| October 1, | Failed to | Dec. 31, | % increase | Dec. 31, | % increase | |||
| 2013 | Additions | Attrition | renew | 2013 | (decrease) | 2012 | (decrease) | |
| Consumer Energy | ||||||||
| Gas | 771,000 | 48,000 | (37,000) | (13,000) | 769,000 | 0% | 796,000 | (3)% |
| Electricity | 1,206,000 | 117,000 | (81,000) | (17,000) | 1,225,000 | 2% | 1,194,000 | 3% |
| Total Consumer RCEs | 1,977,000 | 165,000 | (118,000) | (30,000) | 1,994,000 | 1% | 1,990,000 | 0% |
| Commercial Energy | ||||||||
| Gas | 205,000 | 10,000 | (3,000) | (17,000) | 195,000 | (5)% | 207,000 | (6)% |
| Electricity | 2,140,000 | 158,000 | (34,000) | (93,000) | 2,171,000 | 1% | 1,927,000 | 13% |
| Total Commercial RCEs | 2,345,000 | 168,000 | (37,000) | (110,000) | 2,366,000 | 1% | 2,134,000 | 11% |
| Total Energy Marketing RCEs | 4,322,000 | 333,000 | (155,000) | (140,000) | 4,360,000 | 1% | 4,124,000 | 6% |
| Home Services | ||||||||
| Water heaters | 236,000 | 7,000 | - | - | 243,000 | 3% | 207,000 | 17% |
| Air conditioners / Furnaces | 20,000 | 1,000 | - | - | 21,000 | 5% | 15,000 | 40% |
Smart thermostats1 | 19,000 | 4,000 | - | - | 23,000 | 21% | 3,000 | 667% |
| Total installs | 275,000 | 12,000 | - | - | 287,000 | 4% | 225,000 | 28% |
| Combined RCEs and installs | 4,597,000 | 345,000 | (155,000) | (140,000) | 4,647,000 | 1% | 4,349,000 | 7% |
1Of the smart-thermostat installations as of December 31, 2013, 61% were bundled with energy or furnace contracts and the remaining 39% were sold as stand-alone units.
Traditional door-to-door marketing accounted for only 26% of third quarter additions, while non-door-to-door channels contributed the remaining 74% (Commercial brokers - 50%, Internet, Network and Telemarketing – 24%). Prior to the acquisition of Hudson Energy in fiscal 2011, the vast majority of new customers were signed door-to-door. As discussed in past quarters, the Company’s sales channel diversification continues to be successful. With the opening of new markets such as the U.K. in fiscal 2013, Just Energy has a full geographic range of sales opportunities. . The U.K. operation added 23,000 customers, the highest number of additions in Just Energy’s short history in this market.
The attrition rate was 14% on a trailing 12 month basis, up from 13% reported with the third quarter of fiscal 2013. There was an increase in Consumer attrition and a decline in Commercial attrition. The Consumer rise, similar to the increase in bad debt, is partly attributable to the normal increase in defaults by Texas residential customers after the summer cooling season.
Renewal rates were on target at 70% on a trailing 12-month basis, up from 69% seen a year earlier. Management believes that there is an opportunity for further improvement in overall renewal rates, however, commercial renewal rates tend to be volatile on a quarter to quarter basis.
5
Profitability
Operating profits rose sharply during the quarter. Gross margin for the quarter was $162.8 million, up 16% from $140.3 million in fiscal 2013. Base EBITDA was $72.2 million, up 31% from $55.2 million in the prior comparable period. Base Funds from operations were $38.8 million up 10% from $35.3 million a year earlier. With a nine month increase of 37% year over year, Base EBITDA remains well on track to meet the Company’s published guidance of $220 million for the year (which requires a 26% increase over fiscal 2013). The increase in Base Funds from operations is 65% year over year, consistent with the Company’s goal to reduce its payout ratio below 100% for fiscal 2014.
The following factors drove quarterly profitability:
| · | The 7% year over year growth in customers led to a 16% increase in gross margin. This disparity in growth rates is due to improved profitability of the gas book compared to fiscal 2013. |
| · | Despite the small increase in the Consumer customer base year over year, Consumer gross margin rose 23% as the Company benefited from high consumption due to much colder weather than was experienced in the comparable quarter of fiscal 2013. |
| · | Commercial Energy division’s gross margin declined 8% despite an 11% increase in customers. Competition remained strong for commercial customers in the United States and, as was seen in the first two quarters of the year, lower margins were required to win competitive bids. Further, unforeseen capacity costs in the Northeast U.S. reduced realized margins. Overall, the Commercial Energy division remains profitable as the lower cost to serve a larger customer offsets the lower gross margin per RCE. |
| · | Home Services division’s gross margin increased by 53% reflecting a 19% growth in water heaters, furnaces and air conditioner unit installs and a more profitable mix of customers. |
| · | Selling and marketing costs declined 3% to $48.6 million versus $49.9 million in the third quarter of fiscal 2013. Selling costs declined due to a 2% decline in gross additions and the growing use of lower cost aggregation channels. Only 26% of the customers added in the quarter came from traditional door-to-door sales. |
| · | Administrative costs were $35.7 million, up 2% from $34.9 million in Q3 of fiscal 2013. Quarterly administrative expenses were in line with the $35.2 million spent in the second quarter, the $36.0 million spent in the first quarter and $36.7 million spent in the fourth quarter of fiscal 2013. Combined, administrative and selling and marketing costs were down 1% for the quarter while gross margin was up 16%. |
| · | Bad debt amounted to 2.3% of relevant sales, up from 2.1% in the third quarter of fiscal 2013. More of the Company’s sales are subject to credit risk as high growth markets such as Texas require Just Energy to bill and collect from its customers. The bad debt remains in the target range of 2% to 3% that management builds into its selling price and financial planning. |
6
| · | Financing costs were $23.0 million for the quarter, up from $18.2 million in the prior comparable period. The increase reflects inclusion of the $105 million senior unsecured note and growth in non-recourse financing for the Home Services and Solar divisions. Following quarter end, on January 29, 2014, the Company completed a US$150 million offering of convertible debentures. The proceeds will be used to redeem the $90 million debt series due in September of 2014 and to repay other existing debt. |
| · | Just Energy maintained its position as a leader in sales of green energy in North America. 29% of new Consumer customers over the past year took green supply for an average of 83% of their annual consumption. Green supply now composes 19% of the Consumer division electricity portfolio and 10% of the Consumer division natural gas supply. |
Just Energy has focused on building long term value for its shareholders. Year to date operating results are in line with the forecasted 26% Base EBITDA growth included in the Company’s fiscal 2014 guidance. Looking longer term, embedded gross margin gives an indication of future margin growth. Embedded gross margin is an estimate of cash flow from existing contracts based on the spread between contract price and underlying supply.
The table below shows the change in this value over the quarter and the last year. Over the past 12 months, the amount is up 9% with a 3% growth seen in the last three months. This reflects the 7% growth in the customer base and the benefit of the recent appreciation of the U.S. dollar versus the Canadian dollar.
| EMBEDDED GROSS MARGIN | ||||||||||||||||||||
(millions of dollars) | ||||||||||||||||||||
| Management's estimate of the future embedded gross margin is as follows: | ||||||||||||||||||||
| As at | As at | Dec vs. | As at | 2013 vs. | ||||||||||||||||
Dec 31, | Sept. 30, | Sept. 2013 | Dec 31, | 2012 | ||||||||||||||||
| 2013 | 2013 | variance | 2012 | variance | ||||||||||||||||
Energy marketing1 | $ | 1696.5 | $ | 1,668.5 | 2 | % | $ | 1,623.4 | 5 | % | ||||||||||
| Home Services | 689.7 | 655.5 | 5 | % | 574.0 | 20 | % | |||||||||||||
| Total embedded gross margin | $ | 2,386.2 | $ | 2,324.0 | 3 | % | $ | 2,197.4 | 9 | % | ||||||||||
1Energy marketing also includes embedded gross margin related to Hudson Energy Solar.
Dividend Policy
Dividends were $0.21 per share in the quarter. The payout ratio on Base Funds from operations for the three months ended December 31, 2013 was 80%, down from 126% a year earlier. For the nine months ended December 31, 2013, the payout ratio on Base Funds from operations was 114%, a decrease from 272% reported for the nine months ended December 31, 2012. Based on results to date, management continues to believe that the payout ratio on Base Funds from operations will be less than 100% for fiscal 2014. As EBITDA has grown, the ratio of total debt to EBITDA has fallen, reaching 5.1 times at quarter end, down from 5.4 times a year ago. The Company expects to reduce its debt to EBITDA ratio to a target range of 3.5 to 4.0 times by the end of fiscal 2016.
7
Outlook
Just Energy continues to benefit from strong customer aggregation and the improving profitability of its customer base. Combining this with tight control of operating costs has resulted in Base EBITDA growth of 37% through nine months of fiscal 2014. While this is well ahead of the 26% necessary to realize the Company’s $220 million Base EBITDA guidance, the fourth quarter is traditionally the highest cash flow quarter of the year and we expect slower relative growth in that period. This should result in total fiscal 2014 Base EBITDA being consistent with our stated guidance of $220 million.
With this operating performance to date, we are comfortable that our dividend payout ratio, which was 184% last year, will be less than 100% this year. This payout ratio will be further reduced in the coming years through future growth. This will provide stability to our dividend as well as excess free cash to fund both growth and debt reduction.
I thank my fellow shareholders for their continued support.
Yours sincerely,
Ken Hartwick
Chief Executive Officer
8