Management’s discussion and analysis
(“MD&A”) – November 9, 2016
The following discussion and analysis is a review of the financial condition and operating results of Just Energy Group Inc. (“JE” or “Just Energy” or the “Company”) for the three and six months ended September 30, 2016. It has been prepared with all information available up to and including November 9, 2016. This analysis should be read in conjunction with the unaudited interim condensed consolidated financial statements of the Company for the three and six months ended September 30, 2016. The financial information contained herein has been prepared in accordance with International Financial Reporting Standards (“IFRS”), as issued by the International Accounting Standards Board (“IASB”). All dollar amounts are expressed in Canadian dollars. Quarterly reports, the annual report and supplementary information can be found on Just Energy’s corporate website at www.justenergygroup.com. Additional information can be found on SEDAR at www.sedar.com or on the U.S. Securities and Exchange Commission’s website at www.sec.gov. Information contained within the annual MD&A is not discussed if it remains substantially unchanged.
Company overview
Established under the laws of Canada, Just Energy is an energy management solutions provider specializing in electricity, natural gas, solar and renewable energy options. Currently operating in Canada, the United States and the United Kingdom, the Company offers a wide range of energy products and home energy management services including long-term fixed-price, variable-price, and flat-bill programs, smart thermostats, and residential solar panel installations. Just Energy’s margin or gross profit is derived from the difference between the commodity sale price to its customers and the related purchase price from its suppliers. Just Energy is the parent company of Amigo Energy, Commerce Energy, Green Star Energy, Hudson Energy, Just Energy Solar, Tara Energy and TerraPass.
For a more detailed description of Just Energy’s business operations, refer to the "Operations overview" section on page 5 of this MD&A.
Forward-looking information
This MD&A contains certain forward-looking information pertaining to customer additions and renewals, customer consumption levels, EBITDA, Base EBITDA, Funds from Operations, Base Funds from Operations and treatment under governmental regulatory regimes. These statements are based on current expectations that involve a number of risks and uncertainties, which could cause actual results to differ from those anticipated. These risks include, but are not limited to, levels of customer natural gas and electricity consumption, extreme weather conditions, rates of customer additions and renewals, customer attrition, fluctuations in natural gas and electricity prices, changes in regulatory regimes, decisions by regulatory authorities, competition, the results of litigation, and dependence on certain suppliers. Additional information on these and other factors that could affect Just Energy’s operations, financial results or dividend levels is included in the Annual Information Form and other reports on file with security regulatory authorities, which can be accessed on our corporate website at www.justenergygroup.com, or through the SEDAR website at www.sedar.com or at the U.S. Securities and Exchange Commission’s website at www.sec.gov.
Key terms
“$100m convertible debentures” refers to the $100 million in convertible debentures issued by the Company to finance the purchase of Fulcrum Retail Holdings, LLC, effective October 1, 2011. See “Debt and financing for operations” on page 26 for further details.
“$330m convertible debentures” refers to the $330 million in convertible debentures issued by Just Energy to finance the purchase of Hudson Energy Services, LLC, effective May 1, 2010. See “Debt and financing for operations” on page 26 for further details.
“$150m convertible bonds” refers to the US$150 million in convertible bonds issued in January 2014. Net proceeds were used to redeem Just Energy’s outstanding $90 million convertible debentures on March 19, 2014 and pay down Just Energy’s line of credit. See “Debt and financing for operations” on page 26 for further details.
“Attrition” means customers whose contracts were terminated prior to the end of the term either at the option of the customer or by Just Energy.
“Customer” does not refer to an individual customer but instead to an RCE (see key term below).
“Failed to renew” means customers who did not renew expiring contracts at the end of their term.
“Gross margin per RCE” refers to the energy gross margin realized on Just Energy’s customer base, including gains/losses from the sale of excess commodity supply.
“LDC” means a local distribution company; the natural gas or electricity distributor for a regulatory or governmentally defined geographic area.
“RCE” means residential customer equivalent, which is a unit of measurement equivalent to a customer using, as regards natural gas, 2,815 m3 (or 106 GJs or 1,000 Therms or 1,025 CCFs) of natural gas on an annual basis and, as regards electricity, 10 MWh (or 10,000 kWh) of electricity on an annual basis, which represents the approximate amount of gas and electricity, respectively, used by a typical household in Ontario, Canada.
Non-IFRS financial measures
Just Energy’s consolidated financial statements are prepared in compliance with IFRS. All non-IFRS financial measures do not have standardized meanings prescribed by IFRS and are therefore unlikely to be comparable to similar measures presented by other issuers.
EBITDA
“EBITDA” refers to earnings before finance costs, taxes, depreciation and amortization. This is a non-IFRS measure that reflects the operational profitability of the business.
BASE EBITDA
“Base EBITDA” refers to EBITDA adjusted to exclude the impact of mark to market gains (losses) arising from IFRS requirements for derivative financial instruments on future supply positions as well as reflecting an adjustment for share-based compensation. This measure reflects operational profitability as the non-cash share-based compensation expense is treated as an equity issuance for the purpose of this calculation, as it will be settled in shares and the mark to market gains (losses) are associated with supply already sold in the future at fixed prices.
Just Energy ensures that customer margins are protected by entering into fixed-price supply contracts. Under current IFRS, the customer contracts are not marked to market but there is a requirement to mark to market the future supply contracts. This creates unrealized gains (losses) depending upon current supply pricing. Management believes that these short-term mark to market non-cash gains (losses) do not impact the long-term financial performance of Just Energy and management has therefore excluded them from the Base EBITDA calculation.
FUNDS FROM OPERATIONS (“FFO”)
“Funds from Operations” refers to the cash flow generated by operations. Funds from Operations is calculated by Just Energy as gross margin adjusted for cash items including administrative expenses, selling and marketing expenses, bad debt expenses, finance costs, corporate taxes, capital taxes and other cash items. Funds from Operations also includes a seasonal adjustment for the gas markets in Ontario, Quebec, Manitoba and Michigan in order to include cash received from LDCs for gas not yet consumed by end customers.
BASE FUNDS FROM OPERATIONS (“BASE FFO”)
“Base Funds from Operations” refers to the Funds from Operations reduced by capital expenditures purchased to maintain productive capacity. Capital expenditures to maintain productive capacity represent the capital spend relating to capital and intangible assets.
BASE FUNDS FROM OPERATIONS PAYOUT RATIO
The payout ratio for Base Funds from Operations means dividends declared and paid as a percentage of Base Funds from Operations.
EMBEDDED GROSS MARGIN
“Embedded gross margin” is a rolling five-year measure of management’s estimate of future contracted energy gross margin. The energy marketing embedded gross margin is the difference between existing energy customer contract prices and the cost of supply for the remainder of the term, with appropriate assumptions for customer attrition and renewals. It is assumed that expiring contracts will be renewed at target margin renewal rates.
Embedded gross margin indicates the margin expected to be realized from existing customers. It is intended only as a directional measure for future gross margin. It is not discounted to present value nor is it intended to take into account administrative and other costs necessary to realize this margin.
| Financial highlights | |
| For the three months ended September 30 | | | |
| (thousands of dollars, except where indicated and per share amounts) | | | |
| | | | | | | | | |
| | | | | | % increase | | | |
| | | Fiscal 2017 | | | (decrease) | | Fiscal 2016 | |
| Sales | | $ | 992,828 | | | | (9)% | | $ | 1,087,256 | |
| Gross margin | | | 183,534 | | | | 10% | | | 167,155 | |
| Administrative expenses | | | 46,717 | | | | 16% | | | 40,294 | |
| Selling and marketing expenses | | | 59,454 | | | | (9)% | | | 65,248 | |
| Finance costs | | | 17,882 | | | | 1% | | | 17,641 | |
Loss1 | | | (161,608 | ) | | NMF 3 | | | (88,258 | ) |
| Loss per share available to shareholders - basic | | | (1.13 | ) | | | | | | (0.62 | ) |
| Loss per share available to shareholders - diluted | | | (1.13 | ) | | | | | | (0.62 | ) |
| Dividends/distributions | | | 18,814 | | | | 1% | | | 18,701 | |
Base EBITDA2 | | | 56,851 | | | | 24% | | | 45,685 | |
Base Funds from Operations2 | | | 52,561 | | | | 39% | | | 37,775 | |
Payout ratio on Base Funds from Operations2 | | | 36 | % | | | | | | 50 | % |
1 Loss includes the impact of unrealized gains (losses), which represents the mark to market of future commodity supply acquired to cover future customer demand. The supply has been sold to customers at fixed prices, minimizing any realizable impact of mark to market gains and losses.
2 See “Non-IFRS financial measures” on page 2.
3 Not a meaningful figure.
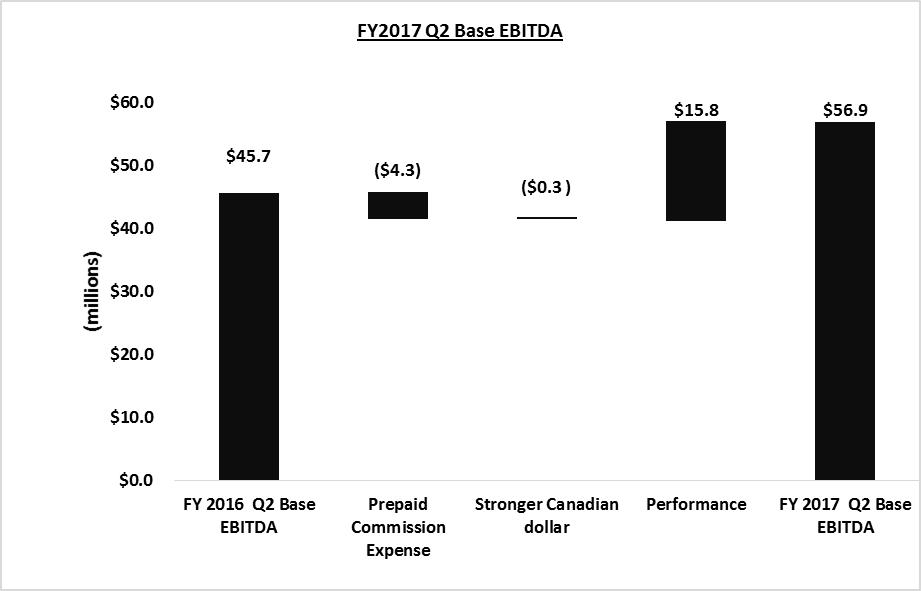
Just Energy delivered another quarter of strong operating and financial performance for the three months ended September 30, 2016 with gross margin of $183.5 million, 10% higher than the prior comparable quarter, and Base EBITDA of $56.9 million, 24% better than the second quarter of fiscal 2016. The Company’s reported Base EBITDA in the second quarter of fiscal 2017 includes $7.7 million of prepaid commission expense, an increase from $3.4 million included in the second quarter of fiscal 2016. Excluding this incremental $4.3 million of additional selling expense, Base EBITDA increased by 34% to $61.2 million in comparison to $45.7 million reported for the second quarter of fiscal 2016. The $15.5 million improvement in Base EBITDA was driven by $15.8 million of operational performance improvements offset by $0.3 million of foreign currency impact from the stronger Canadian dollar. The Company’s financial highlights for the three months ended September 30, 2016 are shown below.
| Financial highlights | |
| For the six months ended September 30 | | | | |
| (thousands of dollars, except where indicated and per share amounts) | | | | |
| | | | | | | | | | |
| | | | | | % increase | | | | |
| | | Fiscal 2017 | | | (decrease) | | | Fiscal 2016 | |
| Sales | | $ | 1,891,237 | | | | (6)% | | $ | 2,020,271 | |
| Gross margin | | | 346,206 | | | | 9% | | | 318,062 | |
| Administrative expenses | | | 91,418 | | | | 17% | | | 77,892 | |
| Selling and marketing expenses | | | 117,244 | | | | (8)% | | | 128,029 | |
| Finance costs | | | 35,855 | | | | 4% | | | 34,497 | |
Profit1 | | | 321,063 | | | NMF 3 | | | | 41,413 | |
| Profit per share available to shareholders - basic | | | 2.10 | | | | | | | | 0.24 | |
| Profit per share available to shareholders - diluted | | | 1.71 | | | | | | | | 0.23 | |
| Dividends/distributions | | | 37,607 | | | | 1% | | | 37,400 | |
Base EBITDA2 | | | 97,992 | | | | 16% | | | 84,560 | |
Base Funds from Operations2 | | | 78,230 | | | | 16% | | | 67,594 | |
Payout ratio on Base Funds from Operations2 | | | 48 | % | | | | | | | 55 | % |
Embedded gross margin2 | | | 1,894,600 | | | | (3)% | | | 1,957,000 | |
| Total customers (RCEs) | | | 4,311,000 | | | | (7)% | | | 4,613,000 | |
1 Profit includes the impact of unrealized gains (losses), which represents the mark to market of future commodity supply acquired to cover future customer demand. The supply has been sold to customers at fixed prices, minimizing any realizable impact of mark to market gains and losses.
2 See “Non-IFRS financial measures” on page 2.
3 Not a meaningful figure.
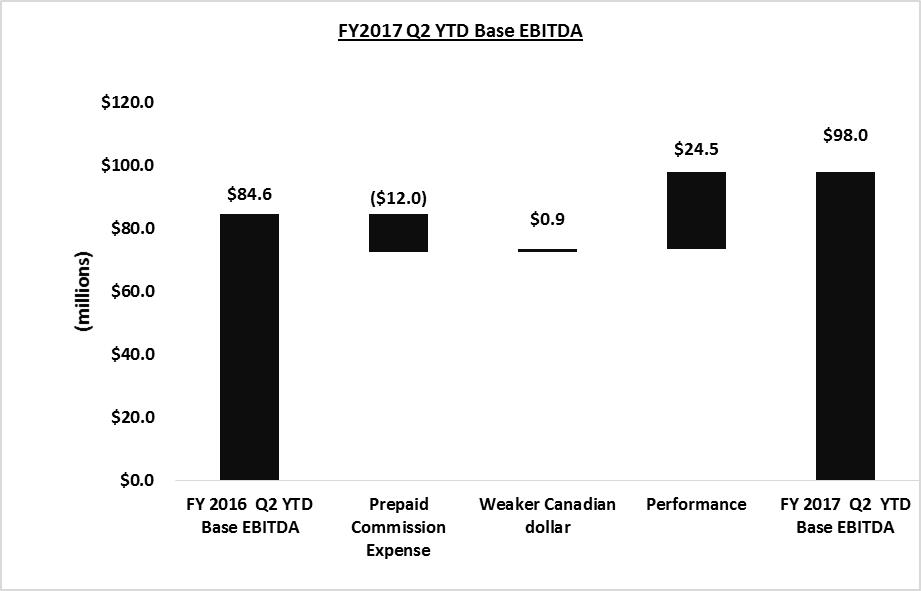
For the six months ended September 30, 2016, gross margin was $346.2 million, 9% higher than the prior comparable period, and Base EBITDA amounted to $98.0 million, 16% better than the first six months of fiscal 2016. The Company’s reported Base EBITDA for the six months ended September 30, 2016 includes $16.6 million of prepaid commission expense, an increase from $4.6 million included in the prior comparable period of fiscal 2016. Excluding this incremental $12.0 million of selling expense, Base EBITDA increased by 30% to $110.0 million in comparison to $84.6 million reported for the six months ended September 30, 2015. Of this $25.4 million improvement in Base EBITDA, $0.9 million was due to the foreign currency impact from the weaker Canadian dollar and $24.5 million was driven by operational performance improvements. The Company’s financial highlights for the six months ended September 30, 2016 are shown below.
Operations overview
CONSUMER DIVISION
The sale of gas and electricity to customers with annual consumption equivalent to 15 RCEs and less is undertaken by the Consumer division. Marketing of the energy products of this division is primarily done through online marketing, door-to-door marketing and telemarketing efforts. Consumer customers make up 42% of Just Energy’s customer base, which is currently focused on longer-term price-protected, flat-bill and variable rate product offerings as well as JustGreen products. To the extent that certain markets are better served by shorter-term or enhanced variable rate products, the Consumer division’s sales channels also offer these products.
As a conservation solution, smart thermostats are offered as a bundled product with commodity contracts, but were also sold previously as a stand-alone unit. The smart thermostats are manufactured and distributed by ecobee Inc. (“ecobee”), a company in which Just Energy holds a 10% fully diluted equity interest.
COMMERCIAL DIVISION
Customers with annual consumption equivalent to over 15 RCEs are served by the Commercial division. These sales are made through three main channels: brokers; door-to-door commercial independent contractors; and inside commercial sales representatives. Commercial customers make up 58% of Just Energy’s customer base. Products offered to Commercial customers can range from standard fixed-price offerings to “one off” offerings, which are tailored to meet the customer’s specific needs. These products can be either fixed or floating rates or a blend of the two, and normally have terms of less than five years. Gross margin per RCE for this division is lower than Consumer margins, but customer aggregation costs and ongoing customer care costs per RCE are lower as well. Commercial customers have significantly lower attrition rates than those of Consumer customers.
RESIDENTIAL SOLAR DIVISION
Just Energy entered into a partnership with Spruce Finance Inc. (“Spruce”), formerly Clean Power Finance, where Just Energy acts as an originator of residential solar deals that are financed and installed by Spruce. This agreement unites Just Energy’s strengths in customer acquisitions and service with Spruce’s solar finance and fulfillment capabilities. Spruce’s online platform allows Just Energy to sell residential solar finance products and connects the Company with a national network of qualified solar installation professionals. Just Energy is also able to sell complementary energy management solutions to solar customers.
Just Energy began marketing solar energy solutions in fiscal 2016 with the results of operations included in the Consumer division.
ABOUT THE ENERGY MARKETS
NATURAL GAS
Just Energy offers natural gas customers a variety of products ranging from month-to-month variable-price contracts to five-year fixed-price contracts. Gas supply is purchased from market counterparties based on forecasted Consumer and small Commercial RCEs. For larger Commercial customers, gas supply is generally purchased concurrently with the execution of a contract. Variable rate products allow customers to maintain competitive rates while retaining the ability to lock into a fixed price at their discretion. Flat-bill products allow predictability by removing the price and the volume risk from customers’ bills and guaranteeing the same price every month for their energy supply based on a maximum annual household usage.
The LDCs provide historical customer usage which, when normalized to average weather, enables Just Energy to purchase the expected normal customer load. Furthermore, Just Energy mitigates exposure to weather variations through active management of the gas portfolio, which involves, but is not limited to, the purchase of options including weather derivatives. Just Energy’s ability to successfully mitigate weather effects is limited by the degree to which weather conditions deviate from normal. To the extent that balancing requirements are outside the forecasted purchase, Just Energy bears the financial responsibility for fluctuations in customer usage. To the extent that supply balancing is not fully covered through active management or the options employed, Just Energy’s realized customer gross margin may be reduced or increased depending upon market conditions at the time of balancing.
| Territory | Gas delivery method |
| Ontario, Quebec, Manitoba and Michigan | The volumes delivered for a customer typically remain constant throughout the year. Sales are not recognized until the customer actually consumes the gas. During the winter months, gas is consumed at a rate that is greater than delivery and, in the summer months, deliveries to LDCs exceed customer consumption. Just Energy receives cash from the LDCs as the gas is delivered, which is even throughout the year. |
| Alberta, British Columbia, New York, Illinois, Indiana, Ohio, California, Georgia, New Jersey, Pennsylvania, Saskatchewan and the United Kingdom | The volume of gas delivered is based on the estimated consumption and storage requirements for each month. Therefore, the amount of gas delivered in the winter months is higher than in the spring and summer months. Consequently, cash flow received from these markets is greatest during the third and fourth (winter) quarters, as cash is normally received from the LDCs in the same period as customer consumption. |
ELECTRICITY
Just Energy services various territories in Canada, the U.S. and the U.K. with electricity. A variety of electricity solutions are offered, including fixed-price, flat-bill and variable-price products on both short-term and longer-term electricity contracts. Some of these products provide customers with price-protection programs for the majority of their electricity requirements. Just Energy uses historical usage data for all enrolled customers to predict future customer consumption and to help with long-term supply procurement decisions. The flat-bill product provides price and volume protection by guaranteeing the same price every month regardless of price fluctuations or changes in usage.
Just Energy purchases power supply from market counterparties for residential and small Commercial customers based on forecasted customer aggregation. Power supply is generally purchased concurrently with the execution of a contract for larger Commercial customers. Historical customer usage is obtained from LDCs, which, when normalized to average weather, provides Just Energy with an expected normal customer consumption. Furthermore, Just Energy mitigates exposure to weather variations through active management of the power portfolio, which involves, but is not limited to, the purchase of options, including weather derivatives.
The Company’s ability to successfully mitigate weather effects is limited by the degree to which weather conditions deviate from normal. To the extent that balancing power purchases are outside the acceptable forecast, Just Energy bears the financial responsibility for excess or short supply caused by fluctuations in customer usage. Any supply balancing not fully covered through customer pass-throughs, active management or the options employed may impact Just Energy’s gross margin depending upon market conditions at the time of balancing.
JUSTGREEN
Customers also have the ability to choose an appropriate JustGreen program to supplement their natural gas and electricity contracts, providing an effective method to offset their carbon footprint associated with the respective commodity consumption.
JustGreen programs for gas customers involve the purchase of carbon offsets from carbon capture and reduction projects. Via power purchase agreements and renewable energy certificates, JustGreen’s electricity product offers customers the option of having all or a portion of their electricity sourced from renewable green sources such as wind, solar, hydropower or biomass. Additional green products allow customers to offset their carbon footprint without buying energy commodity products and can be offered in all states and provinces without being dependent on energy deregulation.
The Company currently sells JustGreen gas and electricity in eligible markets across North America. Of all Consumer customers who contracted with Just Energy in the past 12 months, 30% took JustGreen for some or all of their energy needs. On average, these customers elected to purchase 91% of their consumption as green supply. For comparison, as reported for the trailing 12 months ended September 30, 2015, 34% of Consumer customers who contracted with Just Energy chose to include JustGreen for an average of 91% of their consumption. As of September 30, 2016, JustGreen now makes up 12% of the Consumer gas portfolio, compared with 13% a year ago. JustGreen makes up 20% of the Consumer electricity portfolio compared to 21% a year ago.
| EBITDA | |
| For the three months ended September 30 | |
| (thousands of dollars) | | | | | | |
| | | Fiscal 2017 | | | Fiscal 2016 | |
| Reconciliation to interim condensed consolidated statements of income (loss) | | | | | | |
| Loss for the period | | $ | (161,608 | ) | | $ | (88,258 | ) |
| Add (subtract): | | | | | | | | |
| Finance costs | | | 17,882 | | | | 17,641 | |
| Provision for (recovery of) income taxes | | | 4,881 | | | | (9,198 | ) |
| Amortization | | | 5,536 | | | | 10,801 | |
| EBITDA | | $ | (133,309 | ) | | $ | (69,014 | ) |
| Add (subtract): | | | | | | | | |
| Change in fair value of derivative instruments | | | 194,389 | | | | 116,786 | |
| Share-based compensation | | | 1,425 | | | | 1,376 | |
| Profit attributable to non-controlling interest | | | (5,654 | ) | | | (3,463 | ) |
| Base EBITDA | | $ | 56,851 | | | $ | 45,685 | |
| | | | | | | | | |
| | | | | | | | | |
| Gross margin per interim condensed consolidated financial statements | | $ | 183,534 | | | $ | 167,155 | |
| Add (subtract): | | | | | | | | |
| Administrative expenses | | | (46,717 | ) | | | (40,294 | ) |
| Selling and marketing expenses | | | (59,454 | ) | | | (65,248 | ) |
| Bad debt expense | | | (14,818 | ) | | | (18,597 | ) |
| Amortization included in cost of sales/ selling and marketing expenses | | | 735 | | | | 6,056 | |
| Other income (expenses) | | | (775 | ) | | | 76 | |
| Profit attributable to non-controlling interest | | | (5,654 | ) | | | (3,463 | ) |
| Base EBITDA | | $ | 56,851 | | | $ | 45,685 | |
| EBITDA | |
| For the six months ended September 30 | |
| (thousands of dollars) | | | | | | |
| | | Fiscal 2017 | | | Fiscal 2016 | |
| Reconciliation to interim condensed consolidated statements of income (loss) | | | | | | |
| Profit for the period | | $ | 321,063 | | | $ | 41,413 | |
| Add: | | | | | | | | |
| Finance costs | | | 35,855 | | | | 34,497 | |
| Provision for income taxes | | | 30,178 | | | | 12,649 | |
| Amortization | | | 10,033 | | | | 27,215 | |
| EBITDA | | $ | 397,129 | | | $ | 115,774 | |
| Add (subtract): | | | | | | | | |
| Change in fair value of derivative instruments | | | (290,948 | ) | | | (27,714 | ) |
| Share-based compensation | | | 2,902 | | | | 2,722 | |
| Profit attributable to non-controlling interest | | | (11,091 | ) | | | (6,222 | ) |
| Base EBITDA | | $ | 97,992 | | | $ | 84,560 | |
| | | | | | | | | |
| | | | | | | | | |
| Gross margin per interim condensed consolidated financial statements | | $ | 346,206 | | | $ | 318,062 | |
| Add (subtract): | | | | | | | | |
| Administrative expenses | | | (91,418 | ) | | | (77,892 | ) |
| Selling and marketing expenses | | | (117,244 | ) | | | (128,029 | ) |
| Bad debt expense | | | (28,388 | ) | | | (36,231 | ) |
| Amortization included in cost of sales/ selling and marketing expenses | | | 1,454 | | | | 16,726 | |
| Other expenses | | | (1,527 | ) | | | (1,854 | ) |
| Profit attributable to non-controlling interest | | | (11,091 | ) | | | (6,222 | ) |
| Base EBITDA | | $ | 97,992 | | | $ | 84,560 | |
For the three months ended September 30, 2016, Base EBITDA amounted to $56.9 million, an increase of 24% from $45.7 million in the prior comparable quarter. For the six months ended September 30, 2016, Base EBITDA amounted to $98.0 million, an increase of 16% from $84.6 million in the prior comparable period. The result for the three and six months ended September 30, 2016 includes the absorption of $4.3 million and $12.0 million, respectively, of additional deductions related to the change in classification of Commercial customer acquisition costs effective fiscal 2016. The exclusion of these additional expenses would have resulted in Base EBITDA growth of 34% and 30%, respectively, for the three and six months ended September 30, 2016, primarily as a result of operational improvements, including strong gross margin contribution from the U.S. and U.K. markets.
Sales decreased by 9% for the second quarter ended September 30, 2016, reflecting the 7% decrease in customer base and lower U.S. selling prices resulting from lower commodity market prices. Gross margin was up 10% as a result of higher realized margin per customer in the current period due to the continued disciplined pricing performance to achieve the Company’s desired target gross margin per customer throughout the Consumer and Commercial customer base. Gross margin for the three months ended September 30, 2016 decreased by $2.6 million over the prior quarter as a result of the stronger Canadian dollar, with the offset of $19.0 million in additional gross margin resulting from the aforementioned operational improvements.
Administrative expenses increased by 16% from $40.3 million to $46.7 million. The increase over the prior comparable quarter included higher costs required to support customer growth in the U.K., international expansion as well as efforts relating to new strategic initiatives.
Selling and marketing expenses for the three months ended September 30, 2016 were $59.5 million, a 9% decrease from $65.2 million reported in the prior comparable quarter. The decrease in selling and marketing expenses is due to lower commission costs associated with lower gross customer additions, as well as decreased residual commission expenses.
Effective fiscal 2016, newly capitalized commissions are classified as a current asset (prepaid expense) instead of a non-current asset (contract initiation costs). This change is a result of management’s effort to reduce the average term of capitalized commission to 12 months going forward, which will reduce the outlay of cash at the time of contract signing. The fiscal 2017 guidance includes deductions to Base EBITDA of $30.0 million to $35.0 million for prepaid commercial commissions, which would previously have been included as amortization within selling and marketing expenses. This represents a $12.0 million to $17.0 million increase in this expense over fiscal 2016, which Just Energy expects to offset with continued strong gross margin performance.
Bad debt expense was $14.8 million for the three months ended September 30, 2016, a decrease of 20% from $18.6 million recorded for the prior comparable quarter, resulting from fewer write-offs in the Consumer operations in Texas. For the six months ended September 30, 2016, the bad debt expense of $28.4 million represents approximately 1.9% of revenue in the jurisdictions where the Company bears the credit risk, down from the 2.6% of revenue reported for the six months ended September 30, 2015. Management anticipates that the bad debt as a percentage of sales will be within management’s targeted range of 2% to 3% for the full year fiscal 2017.
For the six months ended September 30, 2016, sales decreased by 6% primarily due to the 7% decrease in customer base while the gross margin increased by 9%, primarily as a result of the Company’s ongoing margin improvement initiative. For the six months ended September 30, 2016, administrative expenses increased by 17% from $77.9 million to $91.4 million. The increase over the prior comparable quarter included growth in the U.K., costs associated with international expansion and efforts relating to new strategic initiatives. For the six months ended September 30, 2016, selling and marketing expenses were $117.2 million, a decrease of 8% from $128.0 million in the prior comparable period, due to lower commission from lower gross additions in the current period as well as lower residual commission expenses.
For more information on the changes in the results from operations, please refer to “Gross margin” on page 19 and “Administrative expenses”, “Selling and marketing expenses”, “Bad debt expense” and “Finance costs”, which are further clarified on pages 21 through 23.
| EMBEDDED GROSS MARGIN | | | | |
| | | | | | |
| Management's estimate of the future embedded gross margin is as follows: |
| | | |
| (millions of dollars) | | | | | |
| | | | Sept. 30 vs. | | 2016 vs. |
| | As at | As at | June 30 | As at | 2015 |
| | Sept. 30, 2016 | June 30, 2016 | variance | Sept. 30, 2015 | variance |
| Energy marketing | $1,894.6 | $1,936.5 | (2)% | $1,957.0 | (3)% |
Management’s estimate of the future embedded gross margin within its customer contracts amounted to $1,894.6 million as of September 30, 2016, a decrease of 2% compared to the embedded gross margin as of June 30, 2016, and a decrease of 3% compared to a year ago. The decrease in customer base in the quarter led to the lower embedded gross margin compared with three months and a year ago.
Embedded gross margin indicates the margin expected to be realized over the next five years from existing customers. It is intended only as a directional measure for future gross margin. It is not discounted to present value nor is it intended to take into account administrative and other costs necessary to realize this margin. As our mix of customers continues to reflect a higher proportion of Commercial volume, the embedded gross margin may, depending on currency rates, grow at a slower pace than customer growth; however, the underlying costs necessary to realize this margin will also decline.
| Funds from Operations | |
| For the six months ended September 30 | |
| (thousands of dollars) | | | | |
| | | Fiscal 2017 | | | Fiscal 2016 | |
| Cash inflow from operations | | $ | 80,138 | | | $ | 69,691 | |
| Add (subtract): | | | | | | | | |
| Changes in non-cash working capital | | | 9,572 | | | | 7,250 | |
| Profit attributable to non-controlling interest | | | (11,091 | ) | | | (6,222 | ) |
| Tax adjustment | | | 7,138 | | | | 2,424 | |
| Funds from Operations | | $ | 85,757 | | | $ | 73,143 | |
| Less: Maintenance capital expenditures | | | (7,527 | ) | | | (5,549 | ) |
| Base Funds from Operations | | $ | 78,230 | | | $ | 67,594 | |
| | | | | | | | | |
| Gross margin from interim condensed consolidated financial statements | | $ | 346,206 | | | $ | 318,062 | |
| Add (subtract): | | | | | | | | |
| Adjustment required to reflect net cash receipts from gas sales | | | 19,525 | | | | 20,231 | |
| Administrative expenses | | | (91,418 | ) | | | (77,892 | ) |
| Selling and marketing expenses | | | (117,244 | ) | | | (128,029 | ) |
| Bad debt expense | | | (28,388 | ) | | | (36,231 | ) |
| Current income tax provision | | | (4,626 | ) | | | (4,340 | ) |
| Amortization included in cost of sales/selling and marketing expenses | | | 1,454 | | | | 16,726 | |
| Other expenses | | | (1,527 | ) | | | (1,854 | ) |
| Financing charges, non-cash | | | 8,901 | | | | 7,360 | |
| Finance costs | | | (35,855 | ) | | | (34,497 | ) |
| Other non-cash adjustments | | | (11,271 | ) | | | (6,393 | ) |
| Funds from Operations | | $ | 85,757 | | | $ | 73,143 | |
| Less: Maintenance capital expenditures | | | (7,527 | ) | | | (5,549 | ) |
| Base Funds from Operations | | $ | 78,230 | | | $ | 67,594 | |
| Base Funds from Operations payout ratio | | | 48 | % | | | 55 | % |
| Dividends/distributions | | | | | | | | |
| Dividends | | $ | 36,871 | | | $ | 36,697 | |
| Distributions for share-based awards | | | 736 | | | | 703 | |
| Total dividends/distributions | | $ | 37,607 | | | $ | 37,400 | |
Base FFO for the three months ended September 30, 2016 was $52.6 million, an increase of 39% compared with Base FFO of $37.8 million for the prior comparable quarter. The increase in Base FFO was higher than the increase in Base EBITDA due to the additional cash generated from gas deliveries compared with the prior period. For the six months ended September 30, 2016, Base FFO was $78.2 million, an increase of 16% from the prior comparable period when Base FFO was $67.6 million, consistent with the increase in Base EBITDA. Maintenance capital expenditures for the second quarter ended September 30, 2016 decreased 13% from the prior comparable quarter. For the six months ended September 30, 2016, maintenance capital expenditures increased by 36% over the prior comparable period due to information technology projects in support of the Company’s operational improvement initiative.
Dividends and distributions for the three months ended September 30, 2016 were $18.8 million, an increase of 1% from the prior comparable quarter in fiscal 2016, resulting from the issuance of additional share-based awards to Just Energy employees. For the six months ended September 30, 2016, dividends and distributions were $37.6 million, an increase of 1% compared to $37.4 million reported for the six months ended September 30, 2015. The payout ratio on Base Funds from Operations was 36% for the three months ended September 30, 2016, compared to 50% reported in the second quarter of fiscal 2016, primarily resulting from the higher Base FFO described above. For the six months ended September 30, 2016, the payout ratio was 48%, compared with 55% in the prior comparable period. For the trailing 12 months ended September 30, 2016, the payout ratio was 50%, compared with a payout ratio of 62% for the trailing 12 months ended September 30, 2015.
| Summary of quarterly results for operations | |
| (thousands of dollars, except per share amounts) | | | | |
| | | | Q2 | | | | Q1 | | | | Q4 | | | | Q3 | |
| | | Fiscal 2017 | | | Fiscal 2017 | | | Fiscal 2016 | | | Fiscal 2016 | |
| Sales | | $ | 992,828 | | | $ | 898,409 | | | $ | 1,075,880 | | | $ | 1,009,709 | |
| Gross margin | | | 183,534 | | | | 162,672 | | | | 204,289 | | | | 179,937 | |
| Administrative expenses | | | 46,717 | | | | 44,701 | | | | 49,504 | | | | 42,934 | |
| Selling and marketing expenses | | | 59,454 | | | | 57,790 | | | | 62,259 | | | | 67,061 | |
| Finance costs | | | 17,882 | | | | 17,973 | | | | 20,312 | | | | 17,731 | |
| Profit (loss) for the period | | | (161,608 | ) | | | 482,671 | | | | 30,893 | | | | 10,188 | |
| Profit (loss) for the period per share – basic | | | (1.13 | ) | | | 3.24 | | | | 0.16 | | | | 0.04 | |
| Profit (loss) for the period per share – diluted | | | (1.13 | ) | | | 2.51 | | | | 0.14 | | | | 0.04 | |
| Dividends/distributions paid | | | 18,814 | | | | 18,793 | | | | 18,730 | | | | 18,662 | |
| Base EBITDA | | | 56,851 | | | | 41,141 | | | | 67,345 | | | | 55,724 | |
| Base Funds from Operations | | | 52,561 | | | | 25,669 | | | | 43,822 | | | | 26,783 | |
| Payout ratio on Base Funds from Operations | | | 36 | % | | | 73 | % | | | 43 | % | | | 70 | % |
| | | | | | | | | | | | | | | | | |
| | | | Q2 | | | | Q1 | | | | Q4 | | | | Q3 | |
| | | Fiscal 2016 | | | Fiscal 2016 | | | Fiscal 2015 | | | Fiscal 2015 | |
| Sales | | $ | 1,087,256 | | | $ | 933,015 | | | $ | 1,209,879 | | | $ | 946,752 | |
| Gross margin | | | 167,155 | | | | 150,907 | | | | 194,066 | | | | 150,098 | |
| Administrative expenses | | | 40,294 | | | | 37,598 | | | | 42,048 | | | | 40,912 | |
| Selling and marketing expenses | | | 65,248 | | | | 62,781 | | | | 63,980 | | | | 52,968 | |
| Finance costs | | | 17,641 | | | | 16,856 | | | | 16,684 | | | | 19,525 | |
| Profit (loss) from continuing operations | | | (88,258 | ) | | | 129,671 | | | | (64,976 | ) | | | (371,403 | ) |
| Profit (loss) for the period | | | (88,258 | ) | | | 129,671 | | | | (63,441 | ) | | | (206,193 | ) |
| Profit (loss) for the period from continuing operations per share – basic | | | (0.62 | ) | | | 0.87 | | | | (0.46 | ) | | | (2.56 | ) |
| Profit (loss) for the period from continuing operations per share – diluted | | | (0.62 | ) | | | 0.71 | | | | (0.46 | ) | | | (2.56 | ) |
| Dividends/distributions paid | | | 18,701 | | | | 18,699 | | | | 18,596 | | | | 18,572 | |
| Base EBITDA | | | 45,685 | | | | 38,875 | | | | 67,914 | | | | 50,592 | |
| Base Funds from Operations | | | 37,775 | | | | 29,818 | | | | 31,947 | | | | 21,179 | |
| Payout ratio on Base Funds from Operations | | | 50 | % | | | 63 | % | | | 58 | % | | | 88 | % |
Just Energy’s results reflect seasonality, as electricity consumption is slightly greater in the first and second quarters (summer quarters) and gas consumption is significantly greater during the third and fourth quarters (winter quarters). While quarter over quarter comparisons are relevant, sequential quarters will vary materially. The main impact of this will normally be higher Base EBITDA in the third and fourth quarters (assuming consumption based on normal winter weather) and lower Base EBITDA in the first and second quarters. This impact is lessening as current net customer additions are concentrated in electricity, which traditionally experiences less seasonality than natural gas.
Analysis of the second quarter
Sales decreased by 9% to $992.8 million for the three months ended September 30, 2016 from $1,087.3 million recorded in the second quarter of fiscal 2016. The Consumer and Commercial divisions’ sales decreased by 6% and 12%, respectively, due to the 7% decrease in customer base and the lower U.S. selling prices when converted to Canadian dollars, resulting from lower commodity market prices.
Gross margin was $183.5 million, an increase of 10% from the prior comparable quarter, as a result of continued margin improvement efforts across all markets, with a particularly strong contribution from the U.S. markets.
Administrative expenses for the three months ended September 30, 2016 increased by 16% from $40.3 million to $46.7 million as a result of costs to serve the growing customer base in the U.K., international expansion costs as well as efforts relating to new strategic initiatives.
Selling and marketing expenses for the three months ended September 30, 2016 were $59.5 million, a 9% decrease from $65.2 million reported in the prior comparable quarter. This decrease is largely attributable to lower commission expense due to a reduction in gross customer additions in the current quarter, as well as decreased residual commission costs.
Finance costs for the three months ended September 30, 2016 amounted to $17.9 million, an increase of 1% from $17.6 million reported for the three months ended September 30, 2015. The increase in finance costs was a result of the amortization of debt issuance costs related to the increase in the credit facility compared to the same period in the prior fiscal year.
The change in fair value of derivative instruments resulted in a non-cash loss of $194.4 million for the three months ended September 30, 2016, compared to a non-cash loss of $116.8 million in the prior comparative quarter, as market prices relative to Just Energy’s future electricity supply contracts decreased by an average of $3.34/MWh, while future gas contracts increased by an average of $0.36/GJ during the three months ended September 30, 2016. The loss for the three months ended September 30, 2016 was $161.6 million, representing a loss per share of $1.13 on a basic and diluted basis. For the prior comparable quarter, the loss was $88.3 million, representing a loss per share of $0.62 on a basic and diluted basis. Just Energy ensures that customer margins are protected by entering into fixed-price supply contracts. Under current IFRS, the customer contracts are not marked to market but there is a requirement to mark to market the future supply contracts. This creates unrealized gains (losses) depending upon current supply pricing. Management believes that these short-term mark to market non-cash gains (losses) do not impact the long-term financial performance of Just Energy.
Base EBITDA was $56.9 million for the three months ended September 30, 2016, a 24% increase from $45.7 million in the prior comparable period. The Company’s reported Base EBITDA in the second quarter of fiscal 2017 includes an additional $4.3 million of prepaid commission expense, reflecting the change in classification of prepaid commissions to a current asset effective April 1, 2016. Excluding this additional expense item, Base EBITDA increased by 34% to $61.2 million for the second quarter of fiscal 2017. The $15.5 million improvement in Base EBITDA was driven by $15.8 million of operational performance improvements primarily in the Company’s North American energy markets, offset by $0.3 million of foreign currency impact from the stronger Canadian dollar.
Base FFO was $52.6 million for the second quarter of fiscal 2017, up 39% compared to $37.8 million in the prior comparable quarter as a result of the 24% increase in Base EBITDA as well as the adjustment required to reflect net cash receipts from gas sales being greater than in the prior comparative quarter.
Dividends/distributions paid were $18.8 million, an increase of 1% over the prior comparable period based on a consistent annual dividend rate of $0.50 per share but reflecting additional share-based awards granted to Just Energy employees. The payout ratio for the three months ended September 30, 2016 was 36%, compared with 50% in the prior comparable quarter.
| | | | | | Fiscal 2017 | |
| | | Consumer | | | Commercial | | | | |
| | | division | | | division | | | Consolidated | |
| Sales | | $ | 527,286 | | | $ | 465,542 | | | $ | 992,828 | |
| Cost of sales | | | (396,655 | ) | | | (412,639 | ) | | | (809,294 | ) |
| Gross margin | | | 130,631 | | | | 52,903 | | | | 183,534 | |
| Add (subtract): | | | | | | | | | | | | |
| Administrative expenses | | | (32,905 | ) | | | (13,812 | ) | | | (46,717 | ) |
| Selling and marketing expenses | | | (36,259 | ) | | | (23,195 | ) | | | (59,454 | ) |
| Bad debt expense | | | (9,232 | ) | | | (5,586 | ) | | | (14,818 | ) |
| Amortization included in cost of sales | | | 735 | | | | - | | | | 735 | |
| Other expenses | | | (262 | ) | | | (513 | ) | | | (775 | ) |
| Profit attributable to non-controlling interest | | | (5,654 | ) | | | - | | | | (5,654 | ) |
| Base EBITDA from operations | | $ | 47,054 | | | $ | 9,797 | | | $ | 56,851 | |
| | | | | | | | | | | | | |
| | | | | | | Fiscal 2016 | |
| | | Consumer | | | Commercial | | | | | |
| | | division | | | division | | | Consolidated | |
| Sales | | $ | 560,351 | | | $ | 526,905 | | | $ | 1,087,256 | |
| Cost of sales | | | (439,031 | ) | | | (481,070 | ) | | | (920,101 | ) |
| Gross margin | | | 121,320 | | | | 45,835 | | | | 167,155 | |
| Add (subtract): | | | | | | | | | | | | |
| Administrative expenses | | | (31,730 | ) | | | (8,564 | ) | | | (40,294 | ) |
| Selling and marketing expenses | | | (41,280 | ) | | | (23,968 | ) | | | (65,248 | ) |
| Bad debt expense | | | (16,114 | ) | | | (2,483 | ) | | | (18,597 | ) |
| Amortization included in cost of sales/selling and marketing expenses | | | 625 | | | | 5,431 | | | | 6,056 | |
| Other income (expenses) | | | 734 | | | | (658 | ) | | | 76 | |
| Profit attributable to non-controlling interest | | | (3,463 | ) | | | - | | | | (3,463 | ) |
| Base EBITDA from operations | | $ | 30,092 | | | $ | 15,593 | | | $ | 45,685 | |
Segmented Base EBITDA1 | | | | | | | | | |
| For the six months ended September 30 | |
| (thousands of dollars) | |
| | | | | | Fiscal 2017 | |
| | | Consumer | | | Commercial | | | | |
| | | division | | | division | | | Consolidated | |
| Sales | | $ | 991,352 | | | $ | 899,885 | | | $ | 1,891,237 | |
| Cost of sales | | | (735,973 | ) | | | (809,058 | ) | | | (1,545,031 | ) |
| Gross margin | | | 255,379 | | | | 90,827 | | | | 346,206 | |
| Add (subtract): | | | | | | | | | | | | |
| Administrative expenses | | | (67,054 | ) | | | (24,364 | ) | | | (91,418 | ) |
| Selling and marketing expenses | | | (71,661 | ) | | | (45,583 | ) | | | (117,244 | ) |
| Bad debt expense | | | (20,999 | ) | | | (7,389 | ) | | | (28,388 | ) |
| Amortization included in cost of sales | | | 1,454 | | | | - | | | | 1,454 | |
| Other expenses | | | (335 | ) | | | (1,192 | ) | | | (1,527 | ) |
| Profit attributable to non-controlling interest | | | (11,091 | ) | | | - | | | | (11,091 | ) |
| Base EBITDA from operations | | $ | 85,693 | | | $ | 12,299 | | | $ | 97,992 | |
| | | | | | | | | | | | | |
| | | | | | | Fiscal 2016 | |
| | | Consumer | | | Commercial | | | | | |
| | | division | | | division | | | Consolidated | |
| Sales | | $ | 1,044,780 | | | $ | 975,491 | | | $ | 2,020,271 | |
| Cost of sales | | | (806,983 | ) | | | (895,226 | ) | | | (1,702,209 | ) |
| Gross margin | | | 237,797 | | | | 80,265 | | | | 318,062 | |
| Add (subtract): | | | | | | | | | | | | |
| Administrative expenses | | | (59,669 | ) | | | (18,223 | ) | | | (77,892 | ) |
| Selling and marketing expenses | | | (78,683 | ) | | | (49,346 | ) | | | (128,029 | ) |
| Bad debt expense | | | (31,439 | ) | | | (4,792 | ) | | | (36,231 | ) |
| Amortization included in cost of sales/selling and marketing expenses | | | 1,178 | | | | 15,548 | | | | 16,726 | |
| Other expenses | | | (1,369 | ) | | | (485 | ) | | | (1,854 | ) |
| Profit attributable to non-controlling interest | | | (6,222 | ) | | | - | | | | (6,222 | ) |
| Base EBITDA from operations | | $ | 61,593 | | | $ | 22,967 | | | $ | 84,560 | |
Consumer Energy contributed $47.1 million to Base EBITDA for the three months ended September 30, 2016, an increase of 56% from $30.1 million in the prior comparative quarter. Consumer gross margin increased 8% as a result of higher margin contribution per customer. Consumer administrative costs were up 4% in fiscal 2017 due to the increase in costs associated with international expansion and new strategic initiatives.
Commercial Energy’s contribution to Base EBITDA for the three months ended September 30, 2016 decreased by $5.8 million primarily as a result of the additional $4.3 million of prepaid commission costs being included in Base EBITDA as a result of the change in classification effective fiscal 2016. Excluding the incremental $4.3 million in additional selling costs, Base EBITDA for the Commercial division would have decreased by 10% to $14.1 million as a result of the Company’s operational improvement initiative being offset by higher administrative costs in the U.K. market, higher allocation of administrative corporate overhead expenses and higher bad debt in the U.S. market.
For the six months ended September 30, 2016, Base EBITDA was $98.0 million, an increase of 16% from $84.6 million recorded in the prior comparable period. The Consumer division contributed $85.7 million to Base EBITDA for the six months ended September 30, 2016, an increase of 39% from $61.6 million reported for the six months ended September 30, 2015. The Commercial division contributed $12.3 million to Base EBITDA, a 46% decrease from the prior comparable period, when the segment contributed $23.0 million. The decrease is primarily related to an additional $12.0 million in selling and marketing expenses related to the change in classification of prepaid expenses effective fiscal 2016.
| Customer aggregation | | | | |
| | July 1, | | | Failed to | Sept. 30, | % | Sept. 30, | % increase |
| | 2016 | Additions | Attrition | renew | 2016 | decrease | 2015 | (decrease) |
| Consumer Energy | | | | | | | |
| Gas | 642,000 | 26,000 | (33,000) | (11,000) | 624,000 | (3)% | 690,000 | (10)% |
| Electricity | 1,225,000 | 89,000 | (70,000) | (39,000) | 1,205,000 | (2)% | 1,215,000 | (1)% |
| Total Consumer RCEs | 1,867,000 | 115,000 | (103,000) | (50,000) | 1,829,000 | (2)% | 1,905,000 | (4)% |
| Commercial Energy | | | | | | |
| Gas | 247,000 | 9,000 | (7,000) | (4,000) | 245,000 | (1)% | 240,000 | 2% |
| Electricity | 2,272,000 | 72,000 | (40,000) | (67,000) | 2,237,000 | (2)% | 2,468,000 | (9)% |
| Total Commercial RCEs | 2,519,000 | 81,000 | (47,000) | (71,000) | 2,482,000 | (1)% | 2,708,000 | (8)% |
| Total RCEs | 4,386,000 | 196,000 | (150,000) | (121,000) | 4,311,000 | (2)% | 4,613,000 | (7)% |
Gross customer additions for the quarter ended September 30, 2016 were 196,000, a decrease of 32% compared to 290,000 customers added in the second quarter of fiscal 2016. The customer additions were lower in the current period due to market conditions as the commodity prices were lower and therefore more competitive across all markets, as well as an increased focus on the profitability of each customer, resulting in fewer customer additions. Additionally, the low and stable market conditions (no volatility) that have prevailed for the past two years have resulted in less customer switching.
Consumer customer additions amounted to 115,000 for the three months ended September 30, 2016, a 17% decrease from 139,000 gross customer additions recorded in the prior comparable quarter. The customer additions were lower in the current period due to market conditions as the commodity prices were lower and therefore more competitive across all markets, resulting in a decrease in customer additions through online and door-to-door marketing. As of September 30, 2016, the U.S., Canadian and U.K. segments accounted for 66%, 26% and 8% of the Consumer customer base, respectively.
Commercial customer additions were 81,000 for the three months ended September 30, 2016, a 46% decrease from 151,000 gross customer additions in the prior comparable quarter as a result of competitiveness in pricing and a more disciplined pricing strategy. Just Energy remains focused on increasing the gross margin per customer added for Commercial customers and, as a result, has been more selective in the margin added per customer. As of September 30, 2016, the U.S., Canadian and U.K. segments accounted for 75%, 18% and 7% of the Commercial customer base, respectively.
Net additions were a negative 75,000 for the second quarter of fiscal 2017, compared with 4,000 net customer additions in the second quarter of fiscal 2016, primarily as a result of the lower customer additions in North America and higher attrition in the Commercial division quarter over quarter. Just Energy continues to actively focus on improving retained customers’ profitability rather than pursuing low margin growth.
In addition to the customers referenced in the above table, the Consumer customer base also includes 55,000 smart thermostat customers. These smart thermostats are bundled with a commodity contract and are currently offered in Ontario, Alberta and Texas. Customers with bundled products have lower attrition and higher overall profitability. Further expansion of smart thermostats is a key driver of continued growth for Just Energy.
For the three months ended September 30, 2016, 41% of the total Consumer and Commercial customer additions were generated from commercial brokers, 39% through online and other non-door-to-door sales channels and 20% from door-to-door sales. In the prior comparable quarter, 44% of customer additions were generated from commercial brokers, 30% from online and other sales channels and 26% using door-to-door sales.
The U.K. operations increased their customer base by 16% to 319,000 RCEs over the past year with strong growth for both their Consumer and Commercial customer bases. As of September 30, 2016, the U.S., Canadian and U.K. segments accounted for 71%, 22% and 7% of the customer base, respectively. At September 30, 2015, the U.S., Canadian and U.K. segments represented 71%, 23% and 6% of the customer base, respectively.
| ATTRITION | | | |
| | Trailing 12 | | Trailing 12 |
| | months ended | | months ended |
| | Sept. 30, 2016 | | Sept. 30, 2015 |
| | | | |
| Consumer | 26% | | 27% |
| Commercial | 8% | | 10% |
| Total attrition | 15% | | 17% |
The combined attrition rate for Just Energy was 15% for the trailing 12 months ended September 30, 2016, a decrease of two percentage points from the 17% reported in the prior comparable period. While the Consumer attrition rate decreased one percentage point to 26% from a year ago, the Commercial attrition rate decreased two percentage points to 8%. Both decreases are a result of Just Energy’s focus on becoming the customers’ “trusted advisor” and providing a variety of energy management solutions to its customer base to drive customer loyalty.
The Company carefully monitors the levels of customer complaints from its Consumer and Commercial divisions. The goal is to resolve all complaints registered within five days of receipt. Our corporate target is to have an outstanding complaint rate of less than 0.05% of customers at any time. As of September 30, 2016, the total outstanding rate was 0.01%.
| RENEWALS | | | |
| | Trailing 12 | | Trailing 12 |
| | months ended | | months ended |
| | Sept. 30, 2016 | | Sept. 30, 2015 |
| | | | |
| Consumer | 78% | | 76% |
| Commercial | 53% | | 59% |
| Total renewals | 61% | | 64% |
| | | | |
The Just Energy renewal process is a multifaceted program that aims to maximize the number of customers who choose to renew their contract prior to the end of their existing contract term. Efforts begin up to 15 months in advance, allowing a customer to renew for an additional period. Overall, the renewal rate was 61% for the trailing 12 months ended September 30, 2016, down three percentage points from a renewal rate of 64% reported for the second quarter of fiscal 2016, and down one percentage point from the renewal rate reported as of June 30, 2016. The Consumer renewal rate increased by two percentage points, while the Commercial renewal rate decreased by six percentage points to 53%. The decline in Commercial renewal rates reflected a very competitive market for Commercial renewals with competitors pricing aggressively and Just Energy’s focus on improving retained customers’ profitability rather than pursuing low margin growth.
ENERGY CONTRACT RENEWALS
This table shows the customers up for renewal in the following fiscal periods:
| | | Consumer | | | Commercial | |
| | | Gas | | | Electricity | | | Gas | | | Electricity | |
| Remainder of 2017 | | | 10 | % | | | 14 | % | | | 17 | % | | | 19 | % |
| 2018 | | | 22 | % | | | 36 | % | | | 38 | % | | | 43 | % |
| 2019 | | | 24 | % | | | 24 | % | | | 21 | % | | | 20 | % |
| 2020 | | | 21 | % | | | 13 | % | | | 15 | % | | | 11 | % |
| Beyond 2020 | | | 23 | % | | | 13 | % | | | 9 | % | | | 7 | % |
| Total | | | 100 | % | | | 100 | % | | | 100 | % | | | 100 | % |
For the six months ended September 30
| | | Fiscal 2017 | | | Fiscal 2016 | |
| | | Consumer | | | Commercial | | | Total | | | Consumer | | | Commercial | | | Total | |
| Gas | | $ | 56,268 | | | $ | 7,499 | | | $ | 63,767 | | | $ | 45,644 | | | $ | 8,813 | | | $ | 54,457 | |
| Electricity | | | 199,111 | | | | 83,328 | | | | 282,439 | | | | 192,153 | | | | 71,452 | | | | 263,605 | |
| | | $ | 255,379 | | | $ | 90,827 | | | $ | 346,206 | | | $ | 237,797 | | | $ | 80,265 | | | $ | 318,062 | |
| Increase | | | 7 | % | | | 13 | % | | | 9 | % | | | | | | | | | | | | |
CONSUMER ENERGY
Gross margin for the three months ended September 30, 2016 for the Consumer division was $130.6 million, an increase of 8% from $121.3 million recorded in the prior comparable quarter. Gas gross margin increased by 62% while the electricity gross margin remained consistent.
For the six months ended September 30, 2016, gross margin for the Consumer division was $255.4 million, an increase of 7% from $237.8 million recorded for the six months ended September 30, 2015. The gross margin contribution from the gas and electricity markets increased by 23% and 4%, respectively.
Average realized gross margin for the Consumer division for the rolling 12 months ended September 30, 2016 was $261/RCE, representing a 19% increase from $219/RCE reported in the prior comparable quarter. The increase is largely due to higher margins on new customers added. The gross margin/RCE value includes an appropriate allowance for bad debt expense in applicable markets.
Gross margin from gas customers in the Consumer division was $23.8 million for the three months ended September 30, 2016, an increase of 62% from $14.7 million recorded in the prior comparable quarter. For the six months ended September 30, 2016, the gross margin contribution from the gas markets increased by 23% over the prior comparable period to $56.3 million. The change is primarily a result of the growth in the U.K. and the gross margin improvement initiative that was implemented over recent periods.
Electricity
Gross margin from electricity customers in the Consumer division was $106.8 million for the three months ended September 30, 2016, a slight increase from $106.6 million recorded in the prior comparable quarter. For the six months ended September 30, 2016, gross margin from electricity markets increased 4% to $199.1 million. The higher gross margin in fiscal 2017 is a result of the increased profitability on new customers despite a 1% decrease in customer base.
COMMERCIAL ENERGY
Gross margin for the Commercial division was $52.9 million for the three months ended September 30, 2016, an increase of 15% from $45.8 million recorded in the prior comparable quarter. Gas and electricity gross margins increased by 31% and 15%, respectively. For the six months ended September 30, 2016, gross margin for the Commercial division was $90.8 million, an increase of 13% from $80.3 million recorded for the six months ended September 30, 2015. The overall growth in margin was due to operational improvements in place to increase the margin for new customers added.
Average realized gross margin for the rolling 12 months ended September 30, 2016 was $80/RCE, an increase of 29% from the $62/RCE reported in the prior comparable period. The gross margin per RCE value includes an appropriate allowance for bad debt expense in Illinois, Texas, Georgia, Michigan and California.
Gas
Gas gross margin for the Commercial division was $2.7 million, an increase of 31% from $2.1 million recorded in the prior comparable quarter. For the six months ended September 30, 2016, the gross margin contribution from the gas markets decreased by 15% from the prior comparable period to $7.5 million. The decrease in gross margin is a result of higher balancing costs in the prior period.
The Commercial division’s electricity gross margin for the three months ended September 30, 2016 was $50.2 million, an increase of 15% from $43.7 million recorded in the prior comparable quarter. Gross margin from the Commercial electricity markets for the six months ended September 30, 2016 was $83.3 million, an increase of 17% from $71.5 million recorded in the six months ended September 30, 2015. The increase in gross margin is a result of increased profitability on new customers and despite the 9% decrease in customer base in the past year.
GROSS MARGIN ON NEW AND RENEWING CUSTOMERS
The table below depicts the annual margins on contracts for Consumer and Commercial customers signed during the quarter. This table reflects the gross margin (sales price less costs of associated supply and allowance for bad debt) earned on new additions and renewals, including both brown commodities and JustGreen supply.
| Annual gross margin per RCE | | | | | | | | | | |
| | | Q2 Fiscal | | | Number of | | | Q2 Fiscal | | | Number of | |
| | 2017 | | | customers | | 2016 | | | customers | |
| | | | | | | | | | | | | |
| Consumer customers added and renewed | | $ | 208 | | | | 223,000 | | | $ | 209 | | | | 227,000 | |
| Consumer customers lost | | | 199 | | | | 153,000 | | | | 188 | | | | 166,000 | |
| Commercial customers added and renewed | | | 89 | | | | 170,000 | | | | 84 | | | | 249,000 | |
| Commercial customers lost | | | 76 | | | | 118,000 | | | | 64 | | | | 120,000 | |
For the three months ended September 30, 2016, the average gross margin per RCE for the customers added and renewed by the Consumer division was $208/RCE, compared with $209/RCE in the prior comparable period. The target margins for markets remained relatively consistent year over year, while management continues to focus on new products, including bundled offerings. The average gross margin per RCE for the Consumer customers lost during the three months ended September 30, 2016 was $199/RCE, compared with $188/RCE in the second quarter of fiscal 2016. The increase in gross margin on customers lost is a result of the higher margins on new customers added with Consumer customers being added at an average gross margin of $200 or higher for the past seven quarters. The current quarter had 8% fewer Consumer customers lost through attrition or failure to renew as a result of Just Energy’s focus on becoming the customers’ “trusted advisor” and providing a variety of energy management solutions to its customer base to drive customer loyalty.
For the Commercial division, the average gross margin per RCE for the customers signed during the quarter ended September 30, 2016 was $89/RCE, compared to $84/RCE in the prior comparable quarter. Customers lost through attrition and failure to renew during the three months ended September 30, 2016 were at an average gross margin of $76/RCE, an increase from $64/RCE reported in the prior comparable period. The Company has pursued a plan where focus in the commercial market will be on higher margin segments while those with traditionally low margins are allowed to expire. Management will continue its margin optimization efforts by focusing on ensuring customers added meet its profitability targets.
| Overall consolidated results | | | | | | | | | | | | | | | | |
| | | | | | | | | | | | | | | | | | | |
| ADMINISTRATIVE EXPENSES | | | | | | | | | | | | | | | | | | |
| (thousands of dollars) | | | | | | | | | | | | | | | | | | |
| | Three months | | Three months | | | | | Six months | | | Six months | | | | |
| | ended | | | ended | | | | | ended | | | ended | | | | |
| | Sept. 30, | | Sept. 30, | | | % | | Sept. 30, | | | Sept. 30, | | | % | |
| | 2016 | | 2015 | | | increase | | 2016 | | 2015 | | | Increase | |
| Consumer Energy | | $ | 32,905 | | | $ | 31,730 | | | | 4 | % | | $ | 67,054 | | | $ | 59,669 | | | | 12 | % |
| Commercial Energy | | | 13,812 | | | | 8,564 | | | | 61 | % | | | 24,364 | | | | 18,223 | | | | 34 | % |
| Total administrative expenses | | $ | 46,717 | | | $ | 40,294 | | | | 16 | % | | $ | 91,418 | | | $ | 77,892 | | | | 17 | % |
Administrative expenses for the three months ended September 30, 2016 increased by 16% from $40.3 million to $46.7 million. The Consumer division’s administrative expenses were $32.9 million for the three months ended September 30, 2016, an increase of 4% from $31.7 million recorded in the prior comparable quarter. The Commercial division’s administrative expenses were $13.8 million for the second quarter of fiscal 2017, a 61% increase from $8.6 million for the prior comparable quarter in fiscal 2016. The increase over the prior comparable quarter was primarily driven by the higher operating costs for the growth in the U.K. operations to support its growing customer base, international expansion expenses as well as efforts relating to new strategic initiatives.
Administrative expenses increased by 17% to $91.4 million for the six months ended September 30, 2016 from $77.9 million recorded in the prior comparative period. Consumer and Commercial administrative expenses for the six months ended September 30, 2016 were $67.1 million and $24.4 million, an increase of 12% and 34%, respectively, as a result of the increased administrative costs for the growth in the U.K. operations, costs associated with international expansion and new strategic initiatives.
| SELLING AND MARKETING EXPENSES | | | | | | | | | | | | | |
| (thousands of dollars) | | | | | | | | | | | | | | | | | | |
| | Three months | | Three months | | | | | Six months | | Six months | | | | |
| | ended | | | ended | | | | | ended | | | ended | | | | |
| | Sept. 30, | | Sept. 30, | | | % | | Sept. 30, | | | Sept. 30, | | | % | |
| | 2016 | | 2015 | | | decrease | | 2016 | | 2015 | | | Decrease | |
| Consumer Energy | | $ | 36,259 | | | $ | 41,280 | | | | (12 | )% | | $ | 71,661 | | | $ | 78,683 | | | | (9 | )% |
| Commercial Energy | | | 23,195 | | | | 23,968 | | | | (3 | )% | | | 45,583 | | | | 49,346 | | | | (8 | )% |
| Total selling and marketing expenses | | $ | 59,454 | | | $ | 65,248 | | | | (9 | )% | | $ | 117,244 | | | $ | 128,029 | | | | (8 | )% |
Selling and marketing expenses, which consist of commissions paid to independent sales contractors, brokers and independent representatives, as well as sales-related corporate costs, were $59.5 million, a decrease of 9% from $65.2 million in the second quarter of fiscal 2016. This decrease is largely attributable to the lower gross customer additions in the current period.
The selling and marketing expenses for the Consumer division were $36.3 million for the three months ended September 30, 2016, a 12% decrease from $41.3 million recorded in the prior comparable quarter. The selling expenses decreased due to lower gross customer additions quarter over quarter.
The selling and marketing expenses for the Commercial division were $23.2 million for the three months ended September 30, 2016, down 3% from $24.0 million recorded in the prior comparable quarter. This decrease is a result of higher residual commission paid on increased gross margin, offset by lower gross customer additions in the three months ended September 30, 2016.
For the six months ended September 30, 2016, selling and marketing expenses were $117.2 million, a decrease of 8% compared to $128.0 million in the prior comparable period. The Consumer division’s selling and marketing expenses were down 9% to $71.7 million compared to $78.7 million for the six months ended September 30, 2015. Selling and marketing expenses for the Commercial division were $45.6 million for the six months ended September 30, 2016, a decrease of 8% compared to $49.3 million in the prior comparable period.
The aggregation costs per customer for the last 12 months for Consumer customers signed by independent representatives and Commercial customers signed by brokers were as follows:
| | Fiscal 2017 | | Fiscal 2016 |
| Consumer | $203/RCE | | $170/RCE |
| Commercial | $40/RCE | | $38/RCE |
The average aggregation cost for the Consumer division increased to $203/RCE for the trailing 12 months ended September 30, 2016, an increase from $170/RCE reported a year ago, but lower than the $207/RCE reported for the first quarter of fiscal 2017. The increase in cost in the current 12-month period over the prior year is a result of the higher allocations of overhead expense on a per RCE basis due to lower customer additions in the last 12 months.
The $40 average aggregation cost for Commercial division customers is based on the expected average annual cost for the respective customer contracts. It should be noted that commercial broker contracts are paid further commissions averaging $40 per year for each additional year that the customer flows. Assuming an average life of 2.8 years, this would add approximately $72 (1.8 x $40) to the year’s average aggregation cost reported above. As at September 30, 2015, the average aggregation cost for commercial brokers was $38/RCE. The lower cost in the prior comparable quarter is a function of broker commissions being a percentage of lower margins.
BAD DEBT EXPENSE
In Illinois, Alberta, Texas, Delaware, Ohio, California, Michigan, Georgia and the U.K., Just Energy assumes the credit risk associated with the collection of customer accounts. In addition, for commercial direct-billed accounts in British Columbia, Just Energy is responsible for the bad debt risk. Credit review processes have been established to manage the customer default rate. Management factors default from credit risk into its margin expectations for all of the above-noted markets. During the six months ended September 30, 2016, Just Energy was exposed to the risk of bad debt on approximately 79% of its sales, compared with 70% in the prior comparable quarter.
Bad debt expense is included in the consolidated income statement under other operating expenses. Bad debt expense for the three months ended September 30, 2016 was $14.8 million, a decrease of 20% from $18.6 million expensed for the three months ended September 30, 2015. The decrease is a result of improved collection efforts resulting in fewer write-offs in the U.S. Consumer markets. Management integrates its default rate for bad debt within its margin targets and continuously reviews and monitors the credit approval process to mitigate customer delinquency.
For the six months ended September 30, 2016, the bad debt expense of $28.4 million represents 1.9% of relevant revenue, down from 2.6% reported in fiscal 2016.
Management expects that bad debt expense will remain in the range of 2% to 3% of relevant revenue for fiscal 2017 in markets where the Company bears credit risk. For each of Just Energy’s other markets, the LDCs provide collection services and assume the risk of any bad debt owing from Just Energy’s customers for a regulated fee.
Total finance costs for the three months ended September 30, 2016 amounted to $17.9 million, an increase of 1% from $17.6 million recorded in the second quarter of fiscal 2016. For the six months ended September 30, 2016, finance costs were $35.9 million, an increase of 4% from the prior comparable period costs of $34.5 million. The increase is a result of the amortization of the debt issue costs in the current period from the credit facility renewal in September 2015, as well as the one-time interest cost associated with early redemption of $25.0 million of the senior unsecured notes outstanding in the first quarter of fiscal 2017.
Just Energy has an exposure to U.S. dollar exchange rates as a result of its U.S. operations. Any changes in the applicable exchange rate may result in a decrease or increase in other comprehensive income. For the three months ended September 30, 2016, a foreign exchange unrealized loss of $0.3 million was reported in other comprehensive income, versus an unrealized loss of $13.2 million reported in the second quarter of fiscal 2016. For the six months ended September 30, 2016, a foreign exchange unrealized gain of $1.0 million was recorded, compared to a loss of $12.2 million reported for the prior comparable period. In addition to changes in the U.S. foreign exchange rate, this fluctuation is a result of the significant increase in the mark to market liability position of the Company’s derivative financial instruments.
Overall, a stronger U.S. dollar increases the value of sales and gross margin in Canadian dollars, but this was offset by the impact from the sales and gross margin contribution from the U.K.-based customers as a result of the lower British pound following the Brexit vote. The total estimated impact of the foreign exchange between the Canadian dollar versus the U.S. dollar and British pound was an unfavourable $0.3 million and a favourable $0.9 million on Base EBITDA, respectively, and an unfavourable $0.4 million and a favourable $0.8 million on Base FFO, respectively, for the three and six months ended September 30, 2016.
Just Energy retains sufficient funds in the U.S. to support ongoing growth, and surplus cash is repatriated to Canada. U.S. cross border cash flow is forecasted annually, and hedges for cross border cash flow are placed. Just Energy hedges between 50% and 90% of the next 12 months of cross border cash flows depending on the level of certainty of the cash flow.
| PROVISION FOR INCOME TAX | | | | | | | |
| (thousands of dollars) | | | | | | | | | | | | |
| | Three months | | Three months | | Six months | | Six months | |
| | ended | | ended | | ended | | ended | |
| | Sept. 30, 2016 | | Sept. 30, 2015 | | Sept. 30, 2016 | | Sept. 30, 2015 | |
| Current income tax expense | | $ | 2,571 | | | $ | 2,221 | | | $ | 4,626 | | | $ | 4,340 | |
| Deferred tax provision (recovery) | | | 2,310 | | | | (11,419 | ) | | | 25,552 | | | | 8,309 | |
| Provision for (recovery of) income tax | | $ | 4,881 | | | $ | (9,198 | ) | | $ | 30,178 | | | $ | 12,649 | |
Just Energy recorded a current income tax expense of $2.6 million for the three months ended September 30, 2016, versus an expense of $2.2 million in the prior comparable quarter. For the six months ended September 30, 2016, the current income tax provision increased by 7% to $4.6 million.
During the three months ended September 30, 2016, a deferred tax expense of $2.3 million was recorded for the cumulative mark to market losses from financial instruments. In fiscal 2016, a deferred tax recovery of $11.4 million was recorded, primarily resulting from the change in fair value of derivative instruments. A deferred tax expense of $25.6 million and $8.3 million was recorded for the six months ended September 30, 2016 and September 30, 2015, respectively.
Under IFRS, Just Energy recognizes income tax assets and liabilities based on the estimated tax consequences attributable to temporary differences between the carrying value of the assets and liabilities on the consolidated financial statements and their respective tax bases, using substantively enacted income tax rates. A deferred tax asset will not be recognized if it is not anticipated that the asset will be realized in the foreseeable future. The effect of a change in the income tax rates used in calculating deferred income tax assets and liabilities is recognized in income during the period in which the change occurs.
| Liquidity and capital resources | | | | | | | | | | | | |
| SUMMARY OF CASH FLOWS | | | | | | | | | | | | |
| (thousands of dollars) | | | | | | | | | | | | |
| | Three months | | Three months | | Six months | | Six months | |
| | ended | | ended | | ended | | ended | |
| | Sept. 30, 2016 | | Sept. 30, 2015 | | Sept. 30, 2016 | | Sept. 30, 2015 | |
| Operating activities | | $ | 61,091 | | | $ | 15,418 | | | $ | 80,138 | | | $ | 69,691 | |
| Investing activities | | | (7,643 | ) | | | (8,359 | ) | | | (11,994 | ) | | | (11,646 | ) |
| Financing activities, excluding dividends | | | (6,597 | ) | | | (10,238 | ) | | | (38,000 | ) | | | (14,198 | ) |
| Effect of foreign currency translation | | | 3,347 | | | | 5,400 | | | | (1,391 | ) | | | 3,325 | |
| Increase in cash before dividends | | | 50,198 | | | | 2,221 | | | | 28,753 | | | | 47,172 | |
| Dividends (cash payments) | | | (18,806 | ) | | | (18,685 | ) | | | (37,590 | ) | | | (37,362 | ) |
| Increase (decrease) in cash | | | 31,392 | | | | (16,464 | ) | | | (8,837 | ) | | | 9,810 | |
| Cash and cash equivalents – beginning of period | | | 87,367 | | | | 105,088 | | | | 127,596 | | | | 78,814 | |
| Cash and cash equivalents – end of period | | $ | 118,759 | | | $ | 88,624 | | | $ | 118,759 | | | $ | 88,624 | |
| | | | | | | | | | | | | | | | | |
OPERATING ACTIVITIES
Cash flow from operating activities for the three months ended September 30, 2016 was an inflow of $61.1 million, compared to $15.4 million in the prior comparable quarter. For the six months ended September 30, 2016, cash flow from operating activities was an inflow of $80.1 million, an increase of 15% from $69.7 million reported for the prior comparable period. Cash flow from operations was higher in the current period as a result of higher gross margin earned in the current period as well as the payment term extension negotiated with some key suppliers which resulted in a deferral of approximately $35.0 million of commodity payments from September 2016 to October 2016.
INVESTING ACTIVITIES
Investing activities for the three and six months ended September 30, 2016 included purchases of capital and intangible assets totalling $3.6 million and $8.5 million, respectively, compared with $4.9 million and $8.2 million, respectively, in fiscal 2016. Just Energy’s capital spending related primarily to information technology-related purchases in support of the process improvement initiative.
FINANCING ACTIVITIES
Financing activities, excluding dividends, relates primarily to the issuance and repayment of long-term debt. During the three and six months ended September 30, 2016, Just Energy retired $0.8 million and $1.8 million, respectively, of its outstanding convertible debentures through the normal course issuer bid. As of September 30, 2016, Just Energy had not drawn on its $292.5 million credit facility, although letters of credit totalling $136.3 million remain outstanding.
Just Energy’s liquidity requirements are driven by the delay from the time that a customer contract is signed until cash flow is generated. The elapsed period between the time a customer is signed and receipt of the first payment from the customer varies with each market. The time delays per market are approximately two to nine months. These periods reflect the time required by the various LDCs to enroll, flow the commodity, bill the customer and remit the first payment to Just Energy. In Alberta, Georgia and Texas and for commercial direct-billed customers, Just Energy receives payment directly.
Just Energy’s annual dividend rate is $0.50 per share paid quarterly. The dividend policy states that shareholders of record on the 15th day of March, June, September and December, or the first business day thereafter, receive dividends at the end of that month. During the three months ended September 30, 2016, Just Energy paid cash dividends to its shareholders and distributions to holders of share-based awards in the amount of $18.8 million, compared to $18.7 million paid in the prior comparable period. For the six months ended September 30, 2016, Just Energy paid $37.6 million, compared to $37.4 million paid for the second half of fiscal 2016.
Balance sheet as at September 30, 2016, compared to March 31, 2016
Cash decreased from $127.6 million as at March 31, 2016 to $118.8 million. The decrease in cash is primarily attributable to the early repayment of $25.0 million of the senior unsecured note in June 2016. The repayment in June 2016 was offset by an increase in cash in September resulting from the payment term extension negotiated going forward for some of Just Energy’s commodity suppliers for which approximately $35.0 million of commodity costs were due in October 2016 instead of September 2016.
As of September 30, 2016, trade receivables and unbilled revenue amounted to $399.5 million and $204.7 million, respectively, compared to March 31, 2016, when the trade receivables and unbilled revenue amounted to $362.3 million and $227.4 million, respectively. The accounts receivable balances increased as a result of normal seasonal consumption with higher electricity bills in the current quarter. Trade payables, which include gas and electricity commodity payables of $262.4 million, increased from $511.3 million to $542.6 million during the second quarter of the fiscal year, primarily due to the negotiation with some commodity suppliers for an extension of payment terms going forward with approximately $35.0 million in commodity costs payable in October 2016. Under the previous agreement, these costs would have been payable in September 2016.
In Michigan, more gas has been delivered to LDCs than consumed by customers, resulting in gas delivered in excess of consumption and a deferred revenue position of $18.6 million and $46.1 million, respectively, as of September 30, 2016. There is an additional $18.2 million of deferred revenue for the U.K. operations as a result of customers who pay a flat rate of commodity per period. In Ontario, Manitoba and Quebec, more gas was consumed by customers than Just Energy had delivered to the LDCs. As a result, Just Energy has recognized an accrued gas receivable and accrued gas payable for $0.5 million and $0.5 million, respectively, as of September 30, 2016. These amounts decreased from $13.6 million and $11.3 million, respectively, as of March 31, 2016, as a result of the normal seasonal changes in consumption.
Prepaid expenses and deposits decreased from $114.7 million at March 31, 2016 to $103.2 million as of September 30, 2016. Capitalized commissions increased to $16.6 million during the six months ended September 30, 2016, while green commodity purchases decreased by $9.4 million.
Fair value of derivative financial assets and fair value of financial liabilities relate entirely to the financial derivatives. The mark to market gains and losses can result in significant changes in profit and loss and, accordingly, shareholders’ equity from year to year due to commodity price volatility. Given that Just Energy has purchased this supply to cover future customer usage at fixed prices, management believes that these non-cash changes are not meaningful and will not be experienced as future costs or cash outflows.
Long-term debt has decreased from $660.5 million as at March 31, 2016 to $278.5 million as at September 30, 2016. This decrease is a result of $365.5 million being reclassified to a current liability based on the early repayment of the $55 million senior unsecured note and the maturity date of June 30, 2017 for the remaining $330 million convertible debentures as well as the retirement of $1.8 million of convertible debentures for the first half of the year. The book value of net debt was 2.4x for the Base EBITDA, lower than both the 2.6x and 3.0x reported for March 31, 2016 and the prior comparable period, respectively.
| Debt and financing for operations | |
| (thousands of dollars) | | | | | | | | | |
| | Sept. 30, 2016 | | March 31, 2016 | | Sept. 30, 2015 | |
| | | | | | | | | | |
| Senior unsecured note | | $ | 55,000 | | | $ | 80,000 | | | $ | 105,000 | |
| $330m convertible debentures | | | 313,452 | | | | 311,028 | | | | 309,558 | |
| $100m convertible debentures | | | 94,804 | | | | 93,637 | | | | 92,519 | |
| $150m convertible bonds | | | 186,107 | | | | 182,564 | | | | 186,188 | |
In addition to the debt outlined above, Just Energy has a credit facility to meet its working capital requirements as well as support operational and development opportunities. The various debt instruments are described as follows:
• A $292.5 million credit facility expiring on September 1, 2018, supported by guarantees and secured by, among other things, a general security agreement and an asset pledge excluding, primarily, the U.K. operations. No funds have been drawn against the credit facility as of September 30, 2016 or March 31, 2016. However, total letters of credit outstanding as at September 30, 2016 amounted to $136.3 million (March 31, 2016 - $130.0 million).
• A $55 million senior unsecured note that matures in June 2018. The remaining balance of $55.0 million was repaid on October 6, 2016.
• A $330 million convertible unsecured subordinated debenture in place until June 30, 2017 with interest payable semi-annually in arrears on June 30 and December 31, at a rate of 6% per annum. During the quarter ended September 30, 2016, the Company purchased and retired $0.8 million (March 31, 2016 - $7.0 million) of convertible debentures and has adjusted the net book value accordingly. Just Energy redeemed $225 million in principal on November 7, 2016.
• A $100 million convertible extendible unsecured subordinated debenture maturing on September 30, 2018 with interest payable semi-annually on March 31 and September 30, at a rate of 5.75% per annum.
• A $150 million European-focused senior unsecured convertible bond with a maturity date of July 29, 2019 and interest payable semi-annually in arrears on January 29 and July 29, at a rate of 6.5% per annum.
Just Energy is required to meet a number of financial covenants under the various debt agreements. As at September 30, 2016, all of the covenants have been met. See note 10 of the interim condensed consolidated financial statements for the three and six months ended September 30, 2016 for further details regarding the nature of each debt agreement.
Contractual obligations
In the normal course of business, Just Energy is obligated to make future payments for contracts and other commitments that are known and non-cancellable.
| PAYMENTS DUE BY PERIOD | | | | | | | | | | | | | | | |
| (thousands of dollars) | | | | | | | | | | | | | | | |
| | | Less than 1 year | | | 1 – 3 years | | | 4 – 5 years | | | After 5 years | | | Total | |
| Trade and other payables | | $ | 542,614 | | | $ | - | | | $ | - | | | $ | - | | | $ | 542,614 | |
| Long-term debt (contractual cash flow) | | | 374,652 | | | | 100,000 | | | | 196,755 | | | | - | | | | 671,407 | |
| Interest payments | | | 34,006 | | | | 23,624 | | | | - | | | | - | | | | 57,630 | |
| Premises and equipment leasing | | | 5,653 | | | | 9,926 | | | | 6,061 | | | | 9,639 | | | | 31,279 | |
| Long-term gas and electricity contracts | | | 1,185,836 | | | | 2,092,389 | | | | 344,388 | | | | 44,732 | | | | 3,667,345 | |
| | | | | | | | | | | | | | | | | | | | | |
| | | $ | 2,142,761 | | | $ | 2,225,939 | | | $ | 547,204 | | | $ | 54,371 | | | $ | 4,970,275 | |
In the opinion of management, Just Energy has no material pending actions, claims or proceedings that have not been included either in its accrued liabilities or in the consolidated financial statements. In the normal course of business, Just Energy could be subject to certain contingent obligations that become payable only if certain events were to occur. The inherent uncertainty surrounding the timing and financial impact of any events prevents any meaningful measurement, which is necessary to assess any material impact on future liquidity. Such obligations include potential judgments, settlements, fines and other penalties resulting from actions, claims or proceedings.
Transactions with related parties
Just Energy does not have any material transactions with any individuals or companies that are not considered independent of Just Energy or any of its subsidiaries and/or affiliates.
Off balance sheet items
The Company has issued letters of credit in accordance with its credit facility totalling $136.3 million to various counterparties, primarily utilities in the markets where it operates, as well as suppliers.
Pursuant to separate arrangements with several bond agencies, The Hanover Insurance Group and Charter Brokerage LLC, Just Energy has issued surety bonds to various counterparties including states, regulatory bodies, utilities and various other surety bond holders in return for a fee and/or meeting certain collateral posting requirements. Such surety bond postings are required in order to operate in certain states or markets. Total surety bonds issued as at September 30, 2016 were $46.7 million.
Critical accounting estimates
The consolidated financial statements of Just Energy have been prepared in accordance with IFRS. Certain accounting policies require management to make estimates and judgments that affect the reported amounts of assets, liabilities, revenues, cost of sales, selling and marketing, and administrative expenses. Estimates are based on historical experience, current information and various other assumptions that are believed to be reasonable under the circumstances. The emergence of new information and changed circumstances may result in actual results or changes to estimated amounts that differ materially from current estimates.
The following assessment of critical accounting estimates is not meant to be exhaustive. Just Energy might realize different results from the application of new accounting standards promulgated, from time to time, by various rule-making bodies.
RECEIVABLES AND ALLOWANCE FOR DOUBTFUL ACCOUNTS
Energy revenues are recorded when energy is delivered to customers, which is determined based on systematic readings of customer meters, generally on a monthly basis. At the end of each month, amounts of energy delivered to customers since the date of the last meter reading are estimated, and corresponding unbilled revenue is recorded. The measurement of unbilled revenue is affected by the following factors: daily customer usage, losses of energy during delivery to customers and applicable customer rates.
The allowance for doubtful accounts reflects Just Energy’s best estimates of losses on the accounts receivable balances. Just Energy determines the allowance on customer receivables by applying loss rates derived from historical results to the outstanding receivable balance. Just Energy is exposed to credit risk on residential and commercial direct-billed accounts in various markets across Canada and the U.S. Credit review processes have been implemented to perform customer credit evaluations and manage customer default. If a significant number of customers were to default on their payments, it could have a material adverse effect on the operations and cash flows of Just Energy. Management factors default from credit risk in its margin expectations for all applicable markets.
DEFERRED TAXES
In accordance with IFRS, Just Energy uses the liability method of accounting for income taxes. Under the liability method, deferred income tax assets and liabilities are recognized on the differences between the carrying amounts of assets and liabilities and their respective income tax basis.
Preparation of the consolidated financial statements involves determining an estimate of, or provision for, income taxes in each of the jurisdictions in which Just Energy operates. The process also involves making an estimate of taxes currently payable and taxes expected to be payable or recoverable in future periods, referred to as deferred income taxes. Deferred income taxes result from the effects of temporary differences due to items that are treated differently for tax and accounting purposes. The tax effects of these differences are reflected in the consolidated statements of financial position as deferred income tax assets and liabilities. An assessment must also be made to determine the likelihood that our future taxable income will be sufficient to permit the recovery of deferred income tax assets. To the extent that such recovery is not probable, deferred income tax assets must be reduced. The reduction of the deferred income tax asset can be reversed if the estimated future taxable income improves. No assurances can be given as to whether any reversal will occur or as to the amount or timing of any such reversal. Management must exercise judgment in its assessment of continually changing tax interpretations, regulations and legislation to ensure deferred income tax assets and liabilities are complete and fairly presented. Assessments and applications differing from our estimates could materially impact the amount recognized for deferred income tax assets and liabilities.
Deferred income tax assets of $19.2 million and $41.0 million have been recorded on the interim condensed and consolidated statements of financial position as at September 30, 2016 and March 31, 2016, respectively. These assets primarily relate to mark to market losses on our derivative financial instruments. Management believes there will be sufficient taxable income that will permit the use of these future tax assets in the tax jurisdictions where they exist. When evaluating the future tax position, Just Energy assesses its ability to use deferred tax assets based on expected taxable income in future periods. As at September 30, 2016, no deferred tax assets were recognized in the U.S.
Deferred income tax liabilities of $5.3 million and $1.4 million have been recorded on the interim condensed and consolidated statements of financial position as at September 30, 2016 and March 31, 2016, respectively. These liabilities are primarily due to mark to market losses on the derivative financial instruments and unrealized foreign exchange gain which, when realized, will be recognized for tax purposes.
SUBSIDIARIES
Subsidiaries that are not wholly owned by Just Energy require judgment in determining the amount of control that Just Energy has over that entity and the appropriate accounting treatments. In these consolidated financial statements, management has determined that Just Energy controls Just Ventures and, therefore, has treated the 50% that is not owned by Just Energy as a non-controlling interest.
USEFUL LIFE OF KEY PROPERTY, PLANT AND EQUIPMENT AND INTANGIBLE ASSETS
Each significant component is depreciated over its estimated useful life. A component can be separately identified as an asset and is expected to provide a benefit of greater than one year. Estimated useful lives are determined based on current facts and past experience, and take into consideration the anticipated physical life of the asset, existing long-term sales agreements and contracts, current and forecasted demand, and the potential for technological obsolescence and regulations. The useful lives of property, plant and equipment and depreciation rates used are reviewed at least annually to ensure they continue to be appropriate.
Depreciation and amortization expense from operations for the three and six months ended September 30, 2016 recorded in the interim condensed consolidated statements of cash flows was $5.5 million and $10.0 million, respectively, compared with $10.8 million and $27.2 million for the three and six months ended September 30, 2015.
FAIR VALUE OF FINANCIAL INSTRUMENTS AND RISK MANAGEMENT
Just Energy has entered into a variety of derivative financial instruments as part of the business of purchasing and selling gas, electricity and JustGreen supply. Just Energy enters into contracts with customers to provide electricity and gas at fixed prices and provide comfort to certain customers that a specified amount of energy will be derived from green generation or carbon destruction. These customer contracts expose Just Energy to changes in market prices to supply these commodities. To reduce its exposure to commodity market price changes, Just Energy uses derivative financial and physical contracts to secure fixed-price commodity supply to cover its estimated fixed-price delivery or green commitment.
Just Energy uses a forward interest rate curve along with a volume weighted average share price to value its share swap. The Eurobond conversion feature is valued using an option pricing model.
Just Energy’s objective is to minimize commodity risk, other than consumption changes, usually attributable to weather. Accordingly, it is Just Energy’s policy to hedge the estimated fixed-price requirements of its customers with offsetting hedges of natural gas and electricity at fixed prices for terms equal to those of the customer contracts. The cash flow from these supply contracts is expected to be effective in offsetting Just Energy’s price exposure and serves to fix acquisition costs of gas and electricity to be delivered under the fixed-price or price-protected customer contracts. Just Energy’s policy is not to use derivative instruments for speculative purposes.
Just Energy’s U.S. and U.K. operations introduce foreign exchange-related risks. Just Energy enters into foreign exchange forwards in order to hedge its exposure to fluctuations in cross border cash flows.
The consolidated financial statements are in compliance with IAS 32, Financial Instruments: Presentation; IAS 39, Financial Instruments: Recognition and Measurement; and IFRS 7, Financial Instruments: Disclosure. All the mark to market changes on Just Energy’s derivative instruments are recorded on a single line on the consolidated income statement. Due to commodity volatility and to the size of Just Energy, the swings in mark to market on these positions will increase the volatility in Just Energy’s earnings.
The Company’s financial instruments are valued based on the following fair value (“FV”) hierarchy:
Level 1 – Unadjusted quoted prices in active markets for identical assets or liabilities;
Level 2 – Inputs other than quoted prices that are observable for the asset or liability either directly or indirectly; and
Level 3 – Inputs that are not based on observable market data.
The main cause of changes in the fair value of derivative instruments is changes in the forward curve prices used for the fair value calculations. For a sensitivity analysis of these forward curves, see note 7 of the interim condensed consolidated financial statements for the quarter ended September 30, 2016. Other inputs, including volatility and correlations, are driven off historical settlements.
Just Energy common shares
As at November 9, 2016, there were 147,792,961 common shares of Just Energy outstanding.
Normal course issuer bid
Just Energy has the ability to make a normal course issuer bid (“NCIB”) to purchase for cancellation a portion of the outstanding $330m convertible debentures, $100m convertible debentures as well as the Just Energy common shares up to March 16, 2017. Under each NCIB, Just Energy may purchase debentures and common shares representing 10% of the outstanding public float at close of business February 29, 2016 up to daily and total limits. For the three and six months ended September 30, 2016, Just Energy had purchased $0.8 million and $1.8 million, respectively, of the $330m convertible debentures.
Just Energy believes that the debentures and common shares may trade in a range that may not fully reflect their value. As a result, Just Energy believes that the purchase of the debentures and common shares from time to time can be undertaken at prices that make the acquisition of such securities an appropriate use of Just Energy’s available funds. In addition, purchases under each of the NCIBs may increase the liquidity of the debentures and common shares and will enable Just Energy to deleverage its balance sheet. Just Energy intends to continue to buy back debentures and common shares when the circumstances present themselves in a way that maximizes value for Just Energy. The Company’s current priority is the repurchase of debentures at attractive prices.
Just Energy’s subsidiaries are party to a number of legal proceedings. Other than as set out below, Just Energy believes that each proceeding constitutes a routine legal matter incidental to the business conducted by Just Energy and that the ultimate disposition of the proceedings will not have a material adverse effect on its consolidated earnings, cash flows or financial position.
The State of California has filed a number of complaints with the Federal Energy Regulatory Commission (“FERC”) against many suppliers of electricity, including Commerce Energy Inc. (“CEI”), a subsidiary of the Company, with respect to events stemming from the 2001 energy crisis in California. On March 18, 2010, the assigned Administrative Law Judge granted a motion to strike the claim for all parties in one of the complaints (in favour of the suppliers), holding that California did not prove that the reporting errors masked the accumulation of market power. California has appealed the decision. On June 13, 2012, FERC denied the plaintiffs’ request for a rehearing, affirming its initial decision. California appealed to the United States District Courts for the Ninth Circuit and oral arguments were heard on February 26, 2015. On April 29, 2015, the appeals court remanded the case back to FERC on grounds that the agency erred in assessing whether market power had resulted in unjust and unreasonable prices, when it considered power generation market share only. FERC extended the time period to conduct settlement conferences and reset the next status conference for August 15, 2016 to schedule hearings and discuss next steps. On August 23, 2016, the parties entered a settlement agreement for US$3.5 million which requires FERC approval. The settlement was approved by FERC on October 27, 2016.
In March 2012, Davina Hurt and Dominic Hill filed a lawsuit against Commerce Energy Inc., Just Energy Marketing Corp. and the Company (collectively referred to as “Just Energy”) in the Ohio Federal Court claiming entitlement to payment of minimum wage and overtime under Ohio wage claim laws and the federal Fair Labor Standards Act (“FLSA”) on their own behalf and similarly situated door-to-door sales representatives who sold for Commerce in certain regions of the United States. The Court granted the plaintiffs’ request to certify the lawsuit as a class action. Approximately 1,800 plaintiffs opted into the federal minimum wage and overtime claims, and approximately 8,000 plaintiffs were certified as part of the Ohio state overtime claims. A jury trial on the liability phase was completed on October 6, 2014. The jury refused to find a wilful violation by Just Energy but reached a verdict that supports the plaintiffs’ class and collective action that certain individuals were not properly classified as outside salespeople in order to qualify for an exemption under the minimum wage and overtime requirements pursuant to the FLSA and Ohio wage and hour laws. Just Energy disagrees with the result of the October 2014 trial and is of the opinion that it is not supported by existing law and precedent. On January 9, 2015, the Court struck the plaintiffs’ damage expert report. Potential amounts owing have yet to be determined and will be subject to a separate damage phase proceeding. Just Energy made a request for an early appeal of the liability phase decision (before the damage phase was completed), referred to as an interlocutory appeal. The trial judge granted Just Energy’s request. But in November 2015, the United States Court of Appeals for the Sixth Circuit refused the early appeal indicating the issues did not warrant early review. Just Energy’s appeal opportunities remain open after conclusion of the damages phase, which still remains unscheduled by the Court. Just Energy strongly believes it complied with the law and continues to vigorously defend against the claims.
In August 2013, Levonna Wilkins, a former door-to-door independent contractor for Just Energy Marketing Corp. (“JEMC”), filed a lawsuit against Just Energy Illinois Corp., Commerce Energy Inc., JEMC and the Company (collectively referred to as “Just Energy”) in the Illinois Federal District Court claiming entitlement to payment of minimum wage and overtime under Illinois wage claim laws and the FLSA on her own behalf and similarly situated door-to-door sales representatives who sold in Illinois. On March 13, 2015, the Court granted Wilkins’ request to certify the lawsuit as a class action to include a class made up of Illinois sales representatives who sold for Just Energy Illinois and Commerce. On March 22, 2016, Just Energy’s summary judgment motion to dismiss Wilkins’ claims was denied. On June 16, 2016, the Court granted Just Energy’s motion for reconsideration which objected to Wilkins’ class definition and revised the definition to exclude sales representatives who sold for Commerce. Wilkins decided not to seek leave to file an interlocutory appeal of the Court’s June 16 order. No trial date has been scheduled. Just Energy continues to vigorously contest this matter.
In March 2015, Kevin Flood, a former door-to-door independent contractor for Just Energy Marketing Corp., filed a lawsuit against JEMC, Just Energy New York Corp. and the Company (collectively referred to as “Just Energy”) in New York Federal District Court (Southern District) claiming entitlement to payment of minimum wage and overtime under New York wage claim laws and the FLSA on his own behalf and similarly situated door-to-door sales representatives who sold in New York. On January 25, 2016, the Court granted Flood’s request to certify the lawsuit as a class action for the FLSA claims to include a class made up of New York sales representatives who sold for Just Energy New York. 167 individuals opted in to the FLSA class. Flood also filed a request to certify the lawsuit as a class action for alleged violations of the New York wage claim laws, and Just Energy filed responsive papers. Flood’s request for a certified class action for New York wage and hour claims remains pending with the Court. Just Energy filed a motion for summary judgment for dismissal of all of Flood’s claims, which still remains pending. Just Energy continues to vigorously contest this matter.
In May 2015, Kia Kordestani, a former door-to-door independent contractor (“IC”) sales representative for Just Energy Corp. filed a lawsuit against Just Corp., Just Energy Ontario L.P. and the Company (collectively referred to as “Just Energy”) in the Superior Court of Justice, Ontario, claiming status as an employee and seeking benefits and protections of the Employment Standards Act such as minimum wage, overtime pay, and vacation and public holiday pay on his own behalf and similarly situated door-to-door sales representatives who sold in Ontario. On Just Energy’s request, Mr. Kordestani was removed as a plaintiff but replaced with Haidar Omarali, also a former door-to-door sales representative. In August 2015, Omarali filed a motion to certify a proposed class action of door-to-door sales representatives, and the Court set a hearing for June 21, 2016. The Court issued its certification decision on July 27, 2016, which granted Omarali’s request for certification with certain changes. Importantly, the Court refused to certify Omarali’s request for damages on an aggregate basis, finding that any alleged class member damages “cannot be determined without proof by individual class members”, and the Court left any further resolution on this issue to the common issues trial judge. The Court also refused to certify Omarali’s request for the option of punitive damages against Just Energy and found that there was no evidence that Just Energy’s conduct justified a punitive damages question, largely because the evidence presented showed that over the years Just Energy was “reassured that their sales agents were indeed ICs, not employees” by “various administrative agencies including the Canada Revenue Agency, the Workplace Safety and Insurance Board, and at least on one occasion before an employment officer of the Employment Standards Act”. At Just Energy’s request, the Court also certified a common issue on limitations which presents the question of whether claims for services provided before May 2013 are barred by the two-year limitations period set by statute. On September 16, 2016, Just Energy filed a motion for leave to appeal the class certification. The court’s decision on the appeal motion is not expected to be delivered until late winter/early spring 2017. No trial date has been scheduled. Just Energy continues to vigorously contest this matter.
Controls and procedures
INTERNAL CONTROLS FOR DISCLOSURE AND FINANCIAL REPORTING
As of September 30, 2016, the Co-Chief Executive Officers (“Co-CEOs”) and Chief Financial Officer (“CFO”) of the Company, along with the assistance of senior management, have designed disclosure controls and procedures to provide reasonable assurance that material information relating to Just Energy is made known to the Co-CEOs and CFO, and have designed internal controls over financial reporting based on the criteria established in the 2013 Internal Control – Integrated Framework issued by the Committee of Sponsoring Organizations of the Treadway Commission (the COSO criteria) to provide reasonable assurance regarding the reliability of financial reporting and the preparation of consolidated financial statements in accordance with IFRS.
During the six months ended September 30, 2016, there were no changes in Just Energy’s internal controls over financial reporting that occurred that have significantly affected, or are reasonably likely to significantly affect, the Company’s internal controls over financial reporting.
Corporate governance
Just Energy is committed to maintaining transparency in its operations and ensuring its approach to governance meets all recommended standards. Full disclosure of Just Energy’s compliance with existing corporate governance rules is available at www.justenergygroup.com and is included in Just Energy’s Management Proxy Circular. Just Energy actively monitors the corporate governance and disclosure environment to ensure timely compliance with current and future requirements.
Outlook
Just Energy continues to deploy its strategy to become a world-class consumer enterprise delivering superior value to its customers through a range of energy management solutions and a multi-channel approach. Growth plans centre on geographic expansion, structuring superior value product propositions, and enhancing the portfolio of energy management offerings. The Company’s geographic expansion is centred on Europe, where the Company expects to expand into two new European markets in fiscal 2017 and remains committed to evaluating further potential expansion in continental Europe and beyond over the longer term. Superior value propositions such as Just Energy’s new flat-bill product; solar energy management solutions; its new commercial energy storage pilot; and recently launched Just Energy Perks customer loyalty program are generating great interest and are expected to contribute towards its double-digit percentage Base EBITDA target in fiscal year 2017. Based on the strong first-half performance, management believes that the Company will achieve its previously provided fiscal 2017 Base EBITDA guidance range of $223 million to $233 million, reflecting continued double-digit percentage growth year over year. Fiscal 2017 guidance includes deductions to Base EBITDA of approximately $30.0 million to $35.0 million for prepaid commercial commissions, which would previously have been included as amortization within selling and marketing expenses. This represents a $12.0 million to $17.0 million increase over fiscal 2016. Just Energy expects to offset this headwind with continued strong gross margin performance.
Just Energy’s solar program commenced its initial pilot phases in California and New York during fiscal 2016, with expansion to New Jersey in fiscal 2017. Management’s initial estimates were that Solar and TerraPass would contribute $10 million towards the double-digit percentage Base EBITDA target in fiscal 2017. Given the sectoral challenges facing the solar industry today, management deems it prudent to remove these expectations for the current fiscal year. Management expects any shortfall to previous Base EBITDA contribution estimates will be fully absorbed by the ongoing outperformance of its core energy business for the remainder of the fiscal year.
Just Energy’s results reflect seasonality, as traditionally electricity consumption is slightly greater in the first and second quarters (summer quarters) and gas consumption is significantly greater during the third and fourth quarters (winter quarters). The main impact of this will normally be higher Base EBITDA in the third and fourth quarters (assuming consumption based on normal winter weather) and lower Base EBITDA in the first and second quarters. However, this impact is lessening as current net customer additions are concentrated in electricity, which traditionally experiences less seasonality than natural gas.
The margin per customer improvements in both the residential and commercial business are directly related to our ongoing commitment to Just Energy’s margin improvement initiative as well as the impact from the stronger U.S. dollar. While competition is certain to come and go from the space over time, we believe Just Energy can continue to drive sustainable margin improvement over the long term as a result of the Company’s innovative new products, which have more appeal and value for customers. This improved profitability per customer will add to our future margins over and above any growth in the customer base.
Just Energy’s ability to drive profitability and cash generation is inherent to the repositioned business model, and thus provides management with the confidence and freedom to commit to future dividend distributions and balance sheet restructuring. On November 7, 2016, Just Energy redeemed a principal amount of $225 million of its 6.0% convertible debentures scheduled to mature on June 30, 2017 at a redemption price of $229.8 million. Just Energy also redeemed the remaining principal amount of $55 million of its 9.75% senior unsecured notes due June 2018 at a redemption price of $59.1 million on October 6, 2016. The Company intends to address the remaining balance of the $330m convertible debentures in the near term through considerations including working capital financing options, senior notes, and cash on hand. Management’s balance sheet improvement initiative has resulted in significantly improved debt ratios, and management remains committed to further reducing and refinancing its debt in a shareholder-friendly manner.
We strive to deliver outstanding financial results, and have made significant progress towards achieving our objective of becoming a premier, world-class provider of energy management solutions. We are encouraged by the stronger profitability in the business and remain confident Just Energy is delivering the appropriate dividend strategy, one that is supported by our continued ability to generate strong cash flows consistently. We foresee continued, sustainable growth that will be driven by an expanded geographical footprint, continued product innovation and bringing new energy management solutions to market that align with customer demands.
33