Exhibit 99.2
Management’s discussion and analysis
– February 7, 2018
The following Management Discussion and Analysis (“MD&A”) is a review of the financial condition and operating results of Just Energy Group Inc. (“Just Energy” or the “Company”) for the three and nine months ended December 31, 2017. This MD&A has been prepared with all information available up to and including February 7, 2018. This MD&A should be read in conjunction with Just Energy’s unaudited interim condensed consolidated financial statements for the three and nine months ended December 31, 2017 (the “Interim Financial Statements”), as well as its audited consolidated financial statements for the years ended March 31, 2017 and 2016. The financial information contained herein has been prepared in accordance with International Financial Reporting Standards (“IFRS”), as issued by the International Accounting Standards Board (“IASB”). All dollar amounts are expressed in Canadian dollars unless otherwise noted. Quarterly reports, the annual report and supplementary information can be found on Just Energy’s corporate website at www.justenergygroup.com. Additional information about Just Energy, including the most recent Annual Report and Annual Information Form dated May 31, 2017 can be found on SEDAR at www.sedar.com or on the U.S. Securities and Exchange Commission’s website at www.sec.gov. Information contained within the annual MD&A is not discussed if it remains substantially unchanged.
Company overview
Established under the laws of Canada, Just Energy is a leading retail energy provider specializing in electricity and natural gas commodities, energy efficient solutions and renewable energy options. Currently operating in the United States, Canada and various international markets including the United Kingdom, Germany, Ireland and Japan, Just Energy serves residential and commercial customers, providing homes and businesses with a broad range of energy solutions that deliver comfort, convenience and control. Just Energy’s margin or gross profit on commodity products is derived from the difference between the commodity sale price to its customers and the related purchase price from its suppliers. The margin on certain non-commodity products is derived from the mark up price added to the cost of the product and charged to the customer. Just Energy is the parent company of Amigo Energy, Green Star Energy, Hudson Energy, Interactive Energy Group, Just Energy Advanced Solutions, Tara Energy and terrapass.

For a more detailed description of Just Energy’s business operations, refer to the “Operations overview” section on page 6 of this MD&A.
Forward-looking information
This MD&A may contain forward-looking statements and information, including guidance for EBITDA for the fiscal year ending March 31, 2018. These statements are based on current expectations that involve a number of risks and uncertainties which could cause actual results to differ from those anticipated. These risks include, but are not limited to general economic, business and market conditions, the ability of management to execute its business plan, levels of customer natural gas and electricity consumption, extreme weather conditions, rates of customer additions and renewals, rates of customer attrition, fluctuations in natural gas and electricity prices and interest and exchange rates, actions taken by governmental authorities including energy marketing regulation, increases in taxes and changes in government regulations and incentive programs, changes in regulatory regimes, results of litigation and decisions by regulatory authorities, competition, the performance of acquired companies and dependence on certain suppliers. Additional information on these and other factors that could affect Just Energy's operations, financial results or dividend levels is included in Just Energy's Annual Information Form dated May 26, 2017 and other reports on file with Canadian securities regulatory authorities which can be accessed through the SEDAR website at www.sedar.com or by visiting EDGAR on the SEC’s website at www.sec.gov.
| 1. |
Key terms
“5.75% convertible debentures” refers to the $100 million in convertible debentures issued by Just Energy to finance the purchase of Fulcrum Retail Holdings, LLC, issued in September 2011. The convertible debentures have a maturity date of September 30, 2018. See “Debt and financing for operations” on page 26 for further details.
“6.5% convertible bonds” refers to the US$150 million in convertible bonds issued in January 2014, which mature on July 29, 2019. Net proceeds were used to redeem Just Energy’s outstanding $90 million convertible debentures and pay down Just Energy’s line of credit. See “Debt and financing for operations” on page 26 for further details.
“6.75% convertible debentures” refers to the $160 million in convertible debentures issued in October 2016, which have a maturity date of December 31, 2021. Net proceeds were used to redeem Just Energy’s outstanding senior unsecured notes on October 5, 2016 and $225 million of its 6.0% convertible debentures on November 7, 2016. See “Debt and financing for operations” on page 26 for further details.
“Preferred shares” refers to the 8.50%, fixed-to-floating rate, cumulative, redeemable, perpetual preferred shares that were initially issued at a price of US$25.00 per preferred share in February 2017. The cumulative feature means that preferred shareholders are entitled to receive dividends at a rate of 8.50% on the initial offer price when, as and if, declared by our Board of Directors.
“Attrition” means customers whose contracts were terminated prior to the end of the term either at the option of the customer or by Just Energy.
“Customer” refers to an individual customer rather than an RCE (see key term below).
“Failed to renew” means customers who did not renew expiring contracts at the end of their term.
“Gross margin per RCE” refers to the energy gross margin realized on Just Energy’s RCE customer base, including gains/losses from the sale of excess commodity supply.
“LDC” means a local distribution company; the natural gas or electricity distributor for a regulatory or governmentally defined geographic area.
“RCE” means residential customer equivalent, which is a unit of measurement equivalent to a customer using, as regards natural gas, 2,815 m3 (or 106 GJs or 1,000 Therms or 1,025 CCFs) of natural gas on an annual basis and, as regards electricity, 10 MWh (or 10,000 kWh) of electricity on an annual basis, which represents the approximate amount of gas and electricity, respectively, used by a typical household in Ontario, Canada, including commercial brokerage sales.
Non-IFRS financial measures
Just Energy’s Interim Financial Statements are prepared in accordance with International Financial Reporting Standards (“IFRS”). The financial measures that are defined below do not have a standardized meaning prescribed by IFRS and may not be comparable to similar measures presented by other companies. These financial measures should not be considered as an alternative to, or more meaningful than, net income (loss), cash flow from operating activities and other measures of financial performance as determined in accordance with IFRS, but the Company believes that these measures are useful in providing relative operational profitability of the Company’s business.
| 2. |
EBITDA
“EBITDA” refers to earnings before finance costs, income taxes, depreciation and amortization. This is a non-IFRS measure that reflects the operational profitability of the business.
Base EBITDA
“Base EBITDA” refers to EBITDA adjusted to exclude the impact of mark to market gains (losses) arising from IFRS requirements for derivative financial instruments as well as reflecting an adjustment for share-based compensation and non-controlling interest. This measure reflects operational profitability as the non-cash share-based compensation expense is treated as an equity issuance for the purpose of this calculation, as it will be settled in shares and the mark to market gains (losses) are associated with supply already sold in the future at fixed prices.
Just Energy ensures that customer margins are protected by entering into fixed-price supply contracts. Under current IFRS, the customer contracts are not marked to market but there is a requirement to mark to market the future supply contracts. This creates unrealized gains (losses) depending upon current supply pricing. Management believes that these short-term mark to market non-cash gains (losses) do not impact the long-term financial performance of Just Energy and management has therefore excluded them from the Base EBITDA calculation.
Funds from operations
“FFO” refers to the cash flow generated by operations. FFO is calculated by Just Energy as gross margin adjusted for cash items including administrative expenses, selling and marketing expenses, bad debt expenses, finance costs, corporate taxes, capital taxes and other cash items. FFO also includes a seasonal adjustment for the gas markets in Ontario, Quebec, Manitoba and Michigan in order to include cash received from LDCs for gas not yet consumed by end customers.
base Funds from operations
“Base FFO” refers to FFO reduced by capital expenditures purchased to maintain productive capacity. Capital expenditures to maintain productive capacity represent the capital spend relating to capital and intangible assets.
Base Funds from Operations Payout Ratio
The payout ratio for Base FFO means dividends declared and paid as a percentage of Base FFO.
Embedded gross margin
“Embedded gross margin” is a rolling five-year measure of management’s estimate of future contracted energy gross margin. The energy marketing embedded gross margin is the difference between existing energy customer contract prices and the cost of supply for the remainder of the term, with appropriate assumptions for RCE attrition and renewals. It is assumed that expiring contracts will be renewed at target margin renewal rates.
Embedded gross margin indicates the margin expected to be realized from existing customers. It is intended only as a directional measure for future gross margin. It is not discounted to present value nor is it intended to take into account administrative and other costs necessary to realize this margin.
| 3. |
Financial highlights
For the three months ended December 31
(thousands of dollars, except where indicated and per share amounts)
| % increase | ||||||||||||
| Fiscal 2018 | (decrease) | Fiscal 2017 | ||||||||||
| Sales | $ | 912,203 | (1 | )% | $ | 918,536 | ||||||
| Gross margin | 171,305 | (2 | )% | 174,353 | ||||||||
| Administrative expenses | 50,389 | 13 | % | 44,567 | ||||||||
| Selling and marketing expenses | 55,547 | - | 55,337 | |||||||||
| Finance costs (net of non-cash finance charges) | 10,619 | (32 | )% | 15,646 | ||||||||
| Profit for the period1 | 208,415 | NMF | 3 | 188,041 | ||||||||
| Profit per share available to shareholders - basic | 1.42 | 1.22 | ||||||||||
| Profit per share available to shareholders - diluted | 1.13 | 0.98 | ||||||||||
| Dividends/distributions | 21,501 | 14 | % | 18,800 | ||||||||
| Base EBITDA2 | 52,507 | 2 | % | 51,489 | ||||||||
| Base FFO2 | 37,539 | 79 | % | 20,940 | ||||||||
| Payout ratio on Base FFO2 | 57 | % | 90 | % | ||||||||
1 Profit includes the impact of unrealized gains (losses), which represents the mark to market of future commodity supply acquired to cover future customer demand. The supply has been sold to customers at fixed prices, minimizing any realizable impact of mark to market gains and losses.
2See “Non-IFRS financial measures” on page 2.
3Not a meaningful figure.
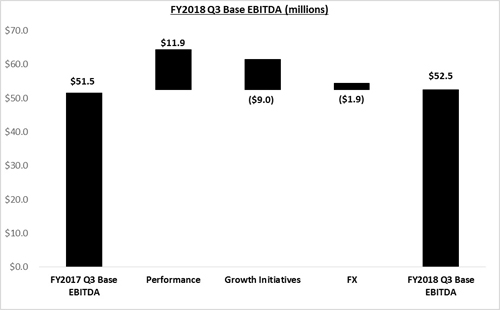
Just Energy’s financial results for the three months ended December 31, 2017 included sales of $912.2 million and gross margin of $171.3 million, 1% and 2% lower, respectively than the prior comparable quarter. Base EBITDA was $52.5 million, an increase of 2% compared to the third quarter of fiscal 2017. The operational performance improvements of $11.9 million included in Base EBITDA were offset by $9.0 million due to the Company’s investments in strategic sales growth initiatives and $1.9 million in negative foreign exchange impact primarily due to the weakening of the U.S. dollar.
Administrative expenses increased by 13% as a result of costs to serve the growing customer base in the U.K., international expansion costs as well as efforts relating to new strategic initiatives, selling and marketing expenses were consistent with the prior comparable quarter; and finance costs improved 32% during the quarter. Just Energy’s financial highlights for the three months ended December 31, 2017 are shown in the accompanying graph.
| 4. |
Financial highlights
For the nine months ended December 31
(thousands of dollars, except where indicated and per share amounts)
| % increase | ||||||||||||
| Fiscal 2018 | (decrease) | Fiscal 2017 | ||||||||||
| Sales | $ | 2,611,836 | (7 | )% | $ | 2,809,773 | ||||||
| Gross margin | 471,531 | (9 | )% | 520,559 | ||||||||
| Administrative expenses | 145,826 | 7 | % | 135,985 | ||||||||
| Selling and marketing expenses | 172,200 | - | 172,581 | |||||||||
| Finance costs (net of non-cash finance charges) | 29,942 | (30 | )% | 42,600 | ||||||||
| Profit for the period1 | 252,801 | NMF | 3 | 509,104 | ||||||||
| Profit per share available to shareholders - basic | 1.66 | 3.32 | ||||||||||
| Profit per share available to shareholders - diluted | 1.37 | 2.60 | ||||||||||
| Dividends/distributions | 64,752 | 15 | % | 56,407 | ||||||||
| Base EBITDA2 | 105,564 | (29 | )% | 149,481 | ||||||||
| Base FFO2 | 65,730 | (34 | )% | 99,170 | ||||||||
| Payout ratio on Base FFO2 | 99 | % | 57 | % | ||||||||
| Embedded gross margin2 | 1,956,000 | 4 | % | 1,873,500 | ||||||||
| Total RCEs | 4,114,000 | (3 | )% | 4,227,000 | ||||||||
1Profit includes the impact of unrealized gains (losses), which represents the mark to market of future commodity supply acquired to cover future customer demand. The supply has been sold to customers at fixed prices, minimizing any realizable impact of mark to market gains and losses.
2See “Non-IFRS financial measures” on page 2.
3Not a meaningful figure.
| 5. |
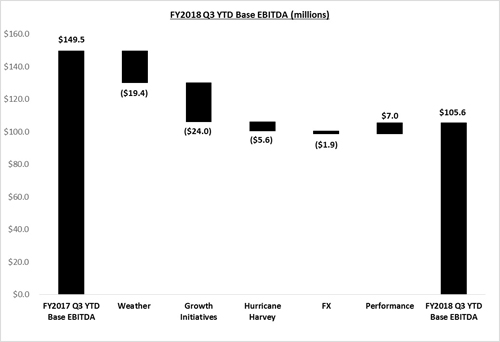
For the nine months ended December 31, 2017, sales were $2.6 billion and gross margin was $471.5 million, 7% and 9% lower, respectively than the prior comparable period. Base EBITDA amounted to $105.6 million, a decrease of 29% from the first nine months of fiscal 2017. The decline in Base EBITDA is largely attributable to a number of challenges the Company experienced in the second quarter, including reduction of consumption arising from the abnormally mild summer weather in North America, customer disruptions caused by Hurricane Harvey and competitive market conditions. In addition, the lower EBITDA was also attributable to the Company’s significant investments in strategic sales growth initiatives throughout the period.
Administrative expenses increased 7% from the prior comparable period as a result of costs to serve the growing customer base in the U.K., international expansion costs as well as efforts relating to new strategic initiatives; selling and marketing expenses were consistent with the prior comparable period; and finance costs improved 30% during the period. Just Energy’s financial highlights for the nine months ended December 31, 2017 are shown in the accompanying graph.
Operations overview
CONSUMER DIVISION
The sale of gas and electricity to customers with annual consumption equivalent to 15 RCEs and less is undertaken by the Consumer division. Marketing of the energy products of this division is primarily done through online marketing, door-to-door marketing as well as other newly implemented channels such as retail and affinity. Consumer customers make up 43% of Just Energy’s RCE base, which is currently focused on longer-term price-protected, flat-bill and variable rate product offerings as well as JustGreen products. To the extent that certain markets are better served by shorter-term or enhanced variable rate products, the Consumer division’s sales channels also offer these products.
| 6. |
Developments in connectivity and convergence and changes in customer preferences have created an opportunity for Just Energy to provide value added products and service bundles connected to energy. As a conservation solution, smart thermostats are offered as a bundled product with commodity contracts, but were also sold previously as a stand-alone unit. The smart thermostats are manufactured and distributed by ecobee Inc. (“ecobee”), a company in which Just Energy holds a 10% fully diluted equity interest. In addition, Just Energy has also expanded its product offering in some markets to include air filters, LED light bulbs and residential water sprinkler controllers.
COMMERCIAL DIVISION
Customers with annual consumption equivalent to over 15 RCEs are served by the Commercial division. These sales are made through three main channels: brokers; door-to-door commercial independent contractors; and inside commercial sales representatives. Commercial customers make up 57% of Just Energy’s RCE base. Products offered to Commercial customers can range from standard fixed-price offerings to “one off” offerings, which are tailored to meet the customer’s specific needs. These products can be either fixed or floating rate or a blend of the two, and normally have terms of less than five years. Gross margin per RCE for this division is lower than Consumer margins, but customer aggregation costs and ongoing customer care costs per RCE are lower as well. Commercial customers have significantly lower attrition rates than those of Consumer customers.
ABOUT THE ENERGY MARKETS
NATURAL GAS
Just Energy offers natural gas customers a variety of products ranging from month-to-month variable-price contracts to five-year fixed-price contracts. Gas supply is purchased from market counterparties based on forecasted Consumer and small Commercial RCEs. For larger Commercial customers, gas supply is generally purchased concurrently with the execution of a contract. Variable rate products allow customers to maintain competitive rates while retaining the ability to lock into a fixed price at their discretion. Flat-bill products offer customers the ability to pay a fixed amount per period regardless of usage or changes in the price of the commodity.
The LDCs provide historical customer usage which, when normalized to average weather, enables Just Energy to purchase the expected normal customer load. Furthermore, Just Energy mitigates exposure to weather variations through active management of the gas portfolio, which involves, but is not limited to, the purchase of options including weather derivatives. Just Energy’s ability to successfully mitigate weather effects is limited by the degree to which weather conditions deviate from normal. To the extent that balancing requirements are outside the forecasted purchase, Just Energy bears the financial responsibility for fluctuations in customer usage. To the extent that supply balancing is not fully covered through active management or the options employed, Just Energy’s realized customer gross margin may be reduced or increased depending upon market conditions at the time of balancing.
| 7. |
| Territory | Gas delivery method |
| Ontario, Quebec, Manitoba and Michigan | The volumes delivered for a customer typically remain constant throughout the year. Sales are not recognized until the customer actually consumes the gas. During the winter months, gas is consumed at a rate that is greater than delivery, resulting in accrued gas receivables, and, in the summer months, deliveries to LDCs exceed customer consumption, resulting in gas delivered in excess of consumption. Just Energy receives cash from the LDCs as the gas is delivered, which is even throughout the year. |
| Alberta, British Columbia, New York, Illinois, Indiana, Ohio, California, Georgia, Maryland, New Jersey, Pennsylvania, Saskatchewan, the United Kingdom, Germany and Ireland. | The volume of gas delivered is based on the estimated consumption and storage requirements for each month. Therefore, the amount of gas delivered in the winter months is higher than in the spring and summer months. Consequently, cash flow received from most of these markets is greatest during the third and fourth (winter) quarters, as cash is normally received from the LDCs in the same period as customer consumption. |
ELECTRICITY
Just Energy services various territories in Canada, the U.S., the U.K., Germany, Ireland and Japan with electricity. A variety of electricity solutions are offered, including fixed-price, flat-bill and variable-price products on both short-term and longer-term electricity contracts. Some of these products provide customers with price-protection programs for the majority of their electricity requirements. Just Energy uses historical usage data for all enrolled customers to predict future customer consumption and to help with long-term supply procurement decisions. Flat-bill products offer a consistent price regardless of usage.
Just Energy purchases power supply from market counterparties for residential and small Commercial customers based on forecasted customer aggregation. Power supply is generally purchased concurrently with the execution of a contract for larger Commercial customers. Historical customer usage is obtained from LDCs, which, when normalized to average weather, provides Just Energy with an expected normal customer consumption. Furthermore, Just Energy mitigates exposure to weather variations through active management of the power portfolio, which involves, but is not limited to, the purchase of options, including weather derivatives.
Just Energy’s ability to successfully mitigate weather effects is limited by the degree to which weather conditions deviate from normal. To the extent that balancing power purchases are outside the acceptable forecast, Just Energy bears the financial responsibility for excess or short supply caused by fluctuations in customer usage. Any supply balancing not fully covered through customer pass-throughs, active management or the options employed may impact Just Energy’s gross margin depending upon market conditions at the time of balancing.
JUSTGREEN
Customers also have the ability to choose an appropriate JustGreen program to supplement their natural gas and electricity contracts, providing an effective method to offset their carbon footprint associated with the respective commodity consumption.
JustGreen programs for gas customers involve the purchase of carbon offsets from carbon capture and reduction projects. Via power purchase agreements and renewable energy certificates, JustGreen’s electricity product offers customers the option of having all or a portion of their electricity sourced from renewable green sources such as wind, solar, hydropower or biomass. Additional green products allow customers to offset their carbon footprint without buying energy commodity products and can be offered in all states and provinces without being dependent on energy deregulation.
| 8. |
Just Energy currently sells JustGreen gas and electricity in eligible markets across North America. Of all Consumer customers who contracted with Just Energy in the past trailing 12 months, 31% took JustGreen for some or all of their energy needs. On average, these customers elected to purchase 72% of their consumption as green supply. For comparison, as reported for the trailing 12 months ended December 31, 2016, 30% of Consumer customers who contracted with Just Energy chose to include JustGreen for an average of 89% of their consumption. As of December 31, 2017, JustGreen now makes up 11% of the Consumer gas portfolio, compared with 8% a year ago. JustGreen makes up 12% of the Consumer electricity portfolio, compared to 17% a year ago.
EBITDA
For the three months ended December 31
(thousands of dollars)
| Fiscal 2018 | Fiscal 2017 | |||||||
| Reconciliation to Interim Financial Statements | ||||||||
| Profit for the period | $ | 208,415 | $ | 188,041 | ||||
| Add: | ||||||||
| Finance costs | 13,266 | 25,477 | ||||||
| Provision for income taxes | 5,613 | 20,976 | ||||||
| Depreciation and amortization | 7,267 | 6,435 | ||||||
| EBITDA | $ | 234,561 | $ | 240,929 | ||||
| Add (subtract): | ||||||||
| Change in fair value of derivative instruments and other | (183,759 | ) | (183,345 | ) | ||||
| Share-based compensation | 1,665 | 1,353 | ||||||
| Loss (profit) attributable to non-controlling interest | 40 | (7,448 | ) | |||||
| Base EBITDA | $ | 52,507 | $ | 51,489 | ||||
| Gross margin per Interim Financial Statements | $ | 171,305 | $ | 174,353 | ||||
| Add (subtract): | ||||||||
| Administrative expenses | (50,389 | ) | (44,567 | ) | ||||
| Selling and marketing expenses | (55,547 | ) | (55,337 | ) | ||||
| Bad debt expense | (13,056 | ) | (16,234 | ) | ||||
| Amortization included in cost of sales | 787 | 759 | ||||||
| Other expenses | (633 | ) | (37 | ) | ||||
| Loss (profit) attributable to non-controlling interest | 40 | (7,448 | ) | |||||
| Base EBITDA | $ | 52,507 | $ | 51,489 | ||||
| 9. |
EBITDA
For the nine months ended December 31
(thousands of dollars)
| Fiscal 2018 | Fiscal 2017 | |||||||
| Reconciliation to Interim Financial Statements | ||||||||
| Profit for the period | $ | 252,801 | $ | 509,104 | ||||
| Add: | ||||||||
| Finance costs | 37,777 | 61,332 | ||||||
| Provision for income taxes | 10,577 | 51,154 | ||||||
| Depreciation and amortization | 18,586 | 16,468 | ||||||
| EBITDA | $ | 319,741 | $ | 638,058 | ||||
| Add (subtract): | ||||||||
| Change in fair value of derivative instruments and other | (223,453 | ) | (474,293 | ) | ||||
| Share-based compensation | 18,628 | 4,255 | ||||||
| Profit attributable to non-controlling interest | (9,352 | ) | (18,539 | ) | ||||
| Base EBITDA | $ | 105,564 | $ | 149,481 | ||||
| Gross margin per Interim Financial Statements | $ | 471,531 | $ | 520,559 | ||||
| Add (subtract): | ||||||||
| Administrative expenses | (145,826 | ) | (135,985 | ) | ||||
| Selling and marketing expenses | (172,200 | ) | (172,581 | ) | ||||
| Bad debt expense | (42,091 | ) | (44,622 | ) | ||||
| Amortization included in cost of sales | 2,333 | 2,213 | ||||||
| Other income (expenses) | 1,169 | (1,564 | ) | |||||
| Profit attributable to non-controlling interest | (9,352 | ) | (18,539 | ) | ||||
| Base EBITDA | $ | 105,564 | $ | 149,481 | ||||
For the three months ended December 31, 2017, Base EBITDA amounted to $52.5 million, an increase of 2% from $51.5 million in the prior comparable quarter. The operational performance improvements of $11.9 million included in Base EBITDA were offset by $9.0 million due to the Company’s investments in strategic sales growth initiatives and $1.9 million in negative foreign exchange impact primarily due to the weakening of the U.S. dollar.
Sales decreased by 1% for the quarter ended December 31, 2017. Gross margin was down 2%. Administrative expenses increased by 13% from the prior comparable quarter to $50.4 million attributable to additional costs to serve the growing customer base in the U.K., international expansion costs as well as efforts relating to new strategic initiatives. Selling and marketing expenses for the three months ended December 31, 2017 were $55.5 million, consistent with the expenses reported in the prior comparable quarter.
Finance costs (net of non-cash finance charges) were $10.6 million, a decrease of 32% from the prior comparable quarter as a result of the redemption of the 6.0% convertible debentures and the senior unsecured notes, offset by the finance costs from the issuance of the 6.75% convertible debentures.
Bad debt expense was $13.1 million for the three months ended December 31, 2017, a decrease of 20% from $16.2 million recorded for the prior comparable quarter. For the nine months ended December 31, 2017, the bad debt expense of $42.1 million represents approximately 2.1% of revenue in the jurisdictions where the Company bears the credit risk, down from the 2.2% of revenue reported for the nine months ended December 31, 2016.
For the nine months ended December 31, 2017, Base EBITDA amounted to $105.6 million, a decrease of 29% from $ 149.5 million in the prior comparable period. The decline in Base EBITDA is largely attributable to a number of challenges the Company experienced in the second quarter, including reduction of consumption arising from the abnormally mild summer weather in North America, customer disruptions caused by Hurricane Harvey and competitive market conditions. In addition, the lower EBITDA was also attributable to the Company’s significant investments in strategic sales growth initiatives throughout the period.
| 10. |
For the nine months ended December 31, 2017, sales decreased by 7% and the gross margin decreased by 9%. For the nine months ended December 31, 2017, administrative expenses increased by 7% from $136.0 million to $145.8 million. The increase over the prior comparable period resulted from growth in the U.K., incremental costs associated with international expansion and efforts relating to new strategic initiatives. For the nine months ended December 31, 2017, selling and marketing expenses were in line with the prior comparable period at $172.2 million.
For more information on the changes in the results from operations, please refer to “Gross margin” on page 20 and “Administrative expenses” and “Selling and marketing expenses”, which are further explained on pages 22 and 23.
EMBEDDED GROSS MARGIN
Management's estimate of the future embedded gross margin is as follows:
(millions of dollars)
| As at | As at | Dec. 31 vs. | As at | 2017 vs. | ||||||||||||||||
| Dec. 31, | Sept. 30, | Sept. 30, | Dec. 30, | 2016 | ||||||||||||||||
| 2017 | 2017 | variance | 2016 | variance | ||||||||||||||||
| Energy marketing | $ | 1,956.0 | $ | 1,615.0 | 21 | % | $ | 1,873.5 | 4 | % | ||||||||||
Management’s estimate of the future embedded gross margin within its customer contracts amounted to $1,956.0 million as of December 31, 2017, an increase of 4% compared to the embedded gross margin as of December 31, 2016. The increase is attributable to the growth in the residential customer base in the U.K. and the actualization of gross margin and attrition rates in the U.S. partially offset by the negative foreign exchange impact due to the weakening of the U.S. dollar.
Embedded gross margin indicates the margin expected to be realized over the next five years from existing customers. It is intended only as a directional measure for future gross margin. It is not discounted to present value nor is it intended to take into account administrative and other costs necessary to realize this margin. As our mix of customers continues to reflect a higher proportion of Commercial volume, the embedded gross margin may, depending on currency rates, grow at a slower pace than customer growth; however, the underlying costs necessary to realize this margin will also decline.
| 11. |
Funds from Operations
For the three months ended December 31
(thousands of dollars)
| Fiscal 2018 | Fiscal 2017 | |||||||
| Cash inflow from operating activities | $ | 28,659 | $ | 35,605 | ||||
| Add (subtract): | ||||||||
| Changes in non-cash working capital | 7,538 | 1,312 | ||||||
| Loss (profit) attributable to non-controlling interest | 40 | (7,448 | ) | |||||
| Tax adjustment | 6,883 | (5,563 | ) | |||||
| Funds from Operations | $ | 43,120 | $ | 23,906 | ||||
| Less: Maintenance capital expenditures | (5,581 | ) | (2,966 | ) | ||||
| Base Funds from Operations | $ | 37,539 | $ | 20,940 | ||||
| Gross margin from Interim Financial Statements | $ | 171,305 | $ | 174,353 | ||||
| Add (subtract): | ||||||||
| Adjustment required to reflect net cash receipts from gas sales | (2,780 | ) | (2,024 | ) | ||||
| Administrative expenses | (50,389 | ) | (44,567 | ) | ||||
| Selling and marketing expenses | (55,547 | ) | (55,337 | ) | ||||
| Bad debt expense | (13,056 | ) | (16,234 | ) | ||||
| Current income tax provision | 4,105 | (9,823 | ) | |||||
| Amortization included in cost of sales | 787 | 759 | ||||||
| Other expenses | (633 | ) | (37 | ) | ||||
| Financing charges, non-cash | 2,647 | 9,831 | ||||||
| Finance costs | (13,266 | ) | (25,477 | ) | ||||
| Other non-cash adjustments | (53 | ) | (7,538 | ) | ||||
| Funds from Operations | $ | 43,120 | $ | 23,906 | ||||
| Less: Maintenance capital expenditures | (5,581 | ) | (2,966 | ) | ||||
| Base Funds from Operations | $ | 37,539 | $ | 20,940 | ||||
| Base Funds from Operations payout ratio | 57 | % | 90 | % | ||||
| Dividends/distributions | ||||||||
| Dividends on common shares | $ | 18,357 | $ | 18,475 | ||||
| Dividends on preferred shares | 2,842 | - | ||||||
| Distributions for share-based awards | 302 | 325 | ||||||
| Total dividends/distributions | $ | 21,501 | $ | 18,800 | ||||
| 12. |
Funds from Operations
For the nine months ended December 31
(thousands of dollars)
| Fiscal 2018 | Fiscal 2017 | |||||||
| Cash inflow from operating activities | $ | 58,454 | $ | 115,743 | ||||
| Add (subtract): | ||||||||
| Changes in non-cash working capital | 12,424 | 10,884 | ||||||
| Profit attributable to non-controlling interest | (9,352 | ) | (18,539 | ) | ||||
| Tax adjustment | 18,190 | 1,575 | ||||||
| Funds from Operations | $ | 79,716 | $ | 109,663 | ||||
| Less: Maintenance capital expenditures | (13,986 | ) | (10,493 | ) | ||||
| Base Funds from Operations | $ | 65,730 | $ | 99,170 | ||||
| Gross margin from Interim Financial Statements | $ | 471,531 | $ | 520,559 | ||||
| Add (subtract): | ||||||||
| Adjustment required to reflect net cash receipts from gas sales | 4,750 | 17,501 | ||||||
| Administrative expenses | (145,826 | ) | (135,985 | ) | ||||
| Selling and marketing expenses | (172,200 | ) | (172,581 | ) | ||||
| Bad debt expense | (42,091 | ) | (44,622 | ) | ||||
| Current income tax provision | (379 | ) | (14,449 | ) | ||||
| Amortization included in cost of sales | 2,333 | 2,213 | ||||||
| Other income (expense) | 1,169 | (1,564 | ) | |||||
| Financing charges, non-cash | 7,835 | 18,732 | ||||||
| Finance costs | (37,777 | ) | (61,332 | ) | ||||
| Other non-cash adjustments | (9,629 | ) | (18,809 | ) | ||||
| Funds from Operations | $ | 79,716 | $ | 109,663 | ||||
| Less: Maintenance capital expenditures | (13,986 | ) | (10,493 | ) | ||||
| Base Funds from Operations | $ | 65,730 | $ | 99,170 | ||||
| Base Funds from Operations payout ratio | 99 | % | 57 | % | ||||
| Dividends/distributions | ||||||||
| Dividends on common shares | $ | 55,081 | $ | 55,346 | ||||
| Dividends on preferred shares | 8,658 | - | ||||||
| Distributions for share-based awards | 1,013 | 1,061 | ||||||
| Total dividends/distributions | $ | 64,752 | $ | 56,407 | ||||
Base FFO for the three months ended December 31, 2017 was $37.5 million, an increase of 79% compared with Base FFO of $20.9 million for the prior comparable quarter, driven by finance costs improvement and the current income tax reduction.
For the nine months ended December 31, 2017, Base FFO was $65.7 million, a decrease of 34% from the prior comparable period when Base FFO was $99.2 million. The decline in Base FFO is largely attributable to a number of challenges the Company experienced in the second quarter, including reduction of consumption arising from the abnormally mild summer weather in North America, customer disruptions caused by Hurricane Harvey and competitive market conditions. In addition, the lower EBITDA was also attributable to the Company’s significant investments in strategic sales growth initiatives throughout the period.
Dividends and distributions for the three months ended December 31, 2017 were $21.5 million, an increase of 14% from the prior comparable quarter in fiscal 2017, resulting from the issuance of preferred shares. For the nine months ended December 31, 2017, dividends and distributions were $64.8 million, an increase of 15% compared to $56.4 million reported for the nine months ended December 31, 2016. The payout ratio on Base FFO was 57% for the three months ended December 31, 2017, compared to 90% reported in the third quarter of fiscal 2017, primarily resulting from the lower Base FFO described above. For the nine months ended December 31, 2017, the payout ratio on Base FFO was 99%, compared with 57% in the prior comparable period. For the trailing 12 months ended December 31, 2017, the payout ratio was 90%, compared with a payout ratio of 53% for the trailing 12 months ended December 31, 2016.
| 13. |
Summary of quarterly results for operations
(thousands of dollars, except per share amounts)
| Q3 | Q2 | Q1 | Q4 | |||||||||||||
| Fiscal 2018 | Fiscal 2018 | Fiscal 2018 | Fiscal 2017 | |||||||||||||
| Sales | $ | 912,203 | $ | 851,927 | $ | 847,706 | $ | 947,281 | ||||||||
| Gross margin | 171,305 | 142,663 | 157,563 | 175,412 | ||||||||||||
| Administrative expenses | 50,389 | 46,806 | 48,631 | 32,448 | ||||||||||||
| Selling and marketing expenses | 55,547 | 58,577 | 58,076 | 53,727 | ||||||||||||
| Finance costs | 13,266 | 12,521 | 11,990 | 16,745 | ||||||||||||
| Profit (loss) for the period | 208,415 | (64,923 | ) | 109,309 | (38,220 | ) | ||||||||||
| Profit (loss) for the period per share – basic | 1.42 | (0.47 | ) | 0.71 | (0.30 | ) | ||||||||||
| Profit (loss) for the period per share – diluted | 1.13 | (0.47 | ) | 0.56 | (0.30 | ) | ||||||||||
| Dividends/distributions paid | 21,501 | 21,468 | 21,783 | 20,344 | ||||||||||||
| Base EBITDA | 52,507 | 20,548 | 32,509 | 75,018 | ||||||||||||
| Base Funds from Operations | 37,539 | 7,683 | 20,508 | 28,588 | ||||||||||||
| Payout ratio on Base Funds from Operations | 57 | % | 279 | % | 106 | % | 71 | % | ||||||||
| Q3 | Q2 | Q1 | Q4 | |||||||||||||
| Fiscal 2017 | Fiscal 2017 | Fiscal 2017 | Fiscal 2016 | |||||||||||||
| Sales | $ | 918,536 | $ | 992,828 | $ | 898,409 | $ | 1,075,880 | ||||||||
| Gross margin | 174,353 | 183,534 | 162,672 | 204,289 | ||||||||||||
| Administrative expenses | 44,567 | 46,717 | 44,701 | 49,504 | ||||||||||||
| Selling and marketing expenses | 55,337 | 59,454 | 57,790 | 62,259 | ||||||||||||
| Finance costs | 25,477 | 17,882 | 17,973 | 20,312 | ||||||||||||
| Profit (loss) for the period | 188,041 | (161,608 | ) | 482,671 | 30,893 | |||||||||||
| Profit (loss) for the period per share – basic | 1.22 | (1.13 | ) | 3.24 | 0.16 | |||||||||||
| Profit (loss) for the period per share – diluted | 0.98 | (1.13 | ) | 2.51 | 0.14 | |||||||||||
| Dividends/distributions paid | 18,800 | 18,814 | 18,793 | 18,730 | ||||||||||||
| Base EBITDA | 51,489 | 56,851 | 41,141 | 67,345 | ||||||||||||
| Base Funds from Operations | 20,940 | 52,561 | 25,669 | 43,822 | ||||||||||||
| Payout ratio on Base Funds from Operations | 90 | % | 36 | % | 73 | % | 43 | % | ||||||||
Just Energy’s results reflect seasonality, as electricity consumption is slightly greater in the first and second quarters (summer quarters) and gas consumption is significantly greater during the third and fourth quarters (winter quarters). Electricity and gas customers currently represent 76% and 24%, respectively, of the customer base. Since consumption for each commodity is influenced by weather, annual quarter over quarter comparisons are more relevant than sequential quarter comparisons.
Analysis of the third quarter
Sales decreased by 1% to $912.2 million for the three months ended December 31, 2017 from $918.5 million recorded in the third quarter of fiscal 2017. The gross margin was $171.3 million, a decrease of 2% from the prior comparable quarter. The impact from foreign exchange, primarily due to the weakening of the U.S. dollar, resulted in a decrease of $5.1 million in gross margin.
| 14. |
Administrative expenses for the three months ended December 31, 2017 increased by 13% to $50.4 million, mainly attributable to supporting customer growth in the U.K., international expansion as well as efforts relating to new strategic initiatives.
Selling and marketing expenses for the three months ended December 31, 2017 were $55.5 million, consistent with the prior comparable quarter.
Total finance costs for the three months ended December 31, 2017 amounted to $13.3 million, a decrease of 48% from $25.5 million reported for the three months ended December 31, 2016. The lower finance costs were a result of the redemption of the 6.0% convertible debentures and the senior unsecured notes in fiscal 2017, offset by the finance costs from the issuance of the 6.75% convertible debentures.
The change in fair value of derivative instruments and other resulted in a non-cash gain of $183.8 million for the three months ended December 31, 2017, compared to a non-cash gain of $183.3 million in the prior comparative quarter, as market prices relative to Just Energy’s future electricity supply contracts decreased by an average of $3.65/MWh, while future gas contracts decreased by an average of $0.04/GJ. Just Energy ensures that customer margins are protected by entering into fixed-price supply contracts. Under current IFRS, the customer contracts are not marked to market but there is a requirement to mark to market the future supply contracts.
The profit for the three months ended December 31, 2017 was $208.4 million, representing earnings per share of $1.42 and $1.13 on a basic and diluted basis, respectively. For the prior comparable quarter, the profit was $188.0 million, representing earnings per share of $1.22 and $0.98 on a basic and diluted basis, respectively.
Base EBITDA was $52.5 million for the three months ended December 31, 2017, an increase of 2% from $51.5 million in the prior comparable quarter. The operational performance improvements of $11.9 million included in Base EBITDA were offset by $9.0 million due to the Company’s investments in strategic sales growth initiatives and $1.9 million in negative foreign exchange impact primarily due to the weakening of the U.S. dollar. Base FFO was $37.5 million for the third quarter of fiscal 2018, up 79% compared to $20.9 million in the prior comparable quarter as a result of lower Base EBITDA in the current quarter.
Dividends and distributions paid were $21.5 million, an increase of 14% compared to $18.8 million paid in the third quarter of fiscal 2017 as a result of dividends paid to preferred shareholders, which amounted to $2.8 million. The payout ratio on Base FFO for the quarter ended December 31, 2017 was 57%, compared with 90% in the prior comparable quarter. The payout ratio for the trailing 12 months ended December 31, 2017 was 90% compared with 53% for the trailing 12 months ended December 31, 2016.
| 15. |
Segmented Base EBITDA1
For the three months ended December 31
(thousands of dollars)
| Fiscal 2018 | ||||||||||||
| Consumer | Commercial | |||||||||||
| division | division | Consolidated | ||||||||||
| Sales | $ | 579,968 | $ | 332,235 | $ | 912,203 | ||||||
| Cost of sales | (447,161 | ) | (293,737 | ) | (740,898 | ) | ||||||
| Gross margin | 132,807 | 38,498 | 171,305 | |||||||||
| Add (subtract): | ||||||||||||
| Administrative expenses | (40,379 | ) | (10,010 | ) | (50,389 | ) | ||||||
| Selling and marketing expenses | (38,238 | ) | (17,309 | ) | (55,547 | ) | ||||||
| Bad debt expense | (12,276 | ) | (780 | ) | (13,056 | ) | ||||||
| Amortization included in cost of sales | 787 | - | 787 | |||||||||
| Other expense | (230 | ) | (403 | ) | (633 | ) | ||||||
| Loss attributable to non-controlling interest | 40 | - | 40 | |||||||||
| Base EBITDA from operations | $ | 42,511 | $ | 9,996 | $ | 52,507 | ||||||
| Fiscal 2017 | ||||||||||||
| Consumer | Commercial | |||||||||||
| division | division | Consolidated | ||||||||||
| Sales | $ | 523,857 | $ | 394,679 | $ | 918,536 | ||||||
| Cost of sales | (394,755 | ) | (349,428 | ) | (744,183 | ) | ||||||
| Gross margin | 129,102 | 45,251 | 174,353 | |||||||||
| Add (subtract): | ||||||||||||
| Administrative expenses | (31,267 | ) | (13,300 | ) | (44,567 | ) | ||||||
| Selling and marketing expenses | (32,514 | ) | (22,823 | ) | (55,337 | ) | ||||||
| Bad debt expense | (11,926 | ) | (4,308 | ) | (16,234 | ) | ||||||
| Amortization included in cost of sales | 759 | - | 759 | |||||||||
| Other income (expense) | (625 | ) | 588 | (37 | ) | |||||||
| Profit attributable to non-controlling interest | (7,448 | ) | - | (7,448 | ) | |||||||
| Base EBITDA from operations | $ | 46,081 | $ | 5,408 | $ | 51,489 | ||||||
| 16. |
Segmented Base EBITDA1
For the nine months ended December 31
(thousands of dollars)
| Fiscal 2018 | ||||||||||||
| Consumer | Commercial | |||||||||||
| division | division | Consolidated | ||||||||||
| Sales | $ | 1,571,439 | $ | 1,040,397 | $ | 2,611,836 | ||||||
| Cost of sales | (1,215,740 | ) | (924,565 | ) | (2,140,305 | ) | ||||||
| Gross margin | 355,699 | 115,832 | 471,531 | |||||||||
| Add (subtract): | ||||||||||||
| Administrative expenses | (109,453 | ) | (36,373 | ) | (145,826 | ) | ||||||
| Selling and marketing expenses | (110,886 | ) | (61,314 | ) | (172,200 | ) | ||||||
| Bad debt expense | (40,801 | ) | (1,290 | ) | (42,091 | ) | ||||||
| Amortization included in cost of sales | 2,333 | - | 2,333 | |||||||||
| Other income (expenses) | (681 | ) | 1,850 | 1,169 | ||||||||
| Profit attributable to non-controlling interest | (9,352 | ) | - | (9,352 | ) | |||||||
| Base EBITDA from operations | $ | 86,859 | $ | 18,705 | $ | 105,564 | ||||||
| Fiscal 2017 | ||||||||||||
| Consumer | Commercial | |||||||||||
| division | division | Consolidated | ||||||||||
| Sales | $ | 1,515,209 | $ | 1,294,564 | $ | 2,809,773 | ||||||
| Cost of sales | (1,130,728 | ) | (1,158,486 | ) | (2,289,214 | ) | ||||||
| Gross margin | 384,481 | 136,078 | 520,559 | |||||||||
| Add (subtract): | ||||||||||||
| Administrative expenses | (98,321 | ) | (37,664 | ) | (135,985 | ) | ||||||
| Selling and marketing expenses | (104,175 | ) | (68,406 | ) | (172,581 | ) | ||||||
| Bad debt expense | (32,925 | ) | (11,697 | ) | (44,622 | ) | ||||||
| Amortization included in cost of sales | 2,213 | - | 2,213 | |||||||||
| Other expenses | (960 | ) | (604 | ) | (1,564 | ) | ||||||
| Profit attributable to non-controlling interest | (18,539 | ) | - | (18,539 | ) | |||||||
| Base EBITDA from operations | $ | 131,774 | $ | 17,707 | $ | 149,481 | ||||||
1The segment definitions are provided on page 6.
Consumer Energy contributed $42.5 million to Base EBITDA for the three months ended December 31, 2017, a decrease of 8% from $46.1 million in the prior comparative quarter. The decrease in Base EBITDA for Consumer Energy was attributable to higher administrative expenses as a result of costs to serve the growing customer base in the U.K., international expansion costs as well as efforts relating to new strategic initiatives. Commercial Energy contributed $10.0 million to Base EBITDA, an increase of 85% from the prior comparable quarter, when the segment contributed $5.4 million. The increase in Base EBITDA for Commercial Energy was attributable to lower selling expenses.
For the nine months ended December 31, 2017, Base EBITDA was $105.6 million, a decrease of 29% from $ 149.5 million recorded in the prior comparable period. The Consumer division contributed $86.9 million to Base EBITDA for the nine months ended December 31, 2017, a decrease of 34% from $131.8 million reported for the nine months ended December 31, 2016. The Commercial division contributed $18.7 million to Base EBITDA, a 6% increase from the prior comparable period, when the segment contributed $17.7 million.
| 17. |
Customer aggregation
RCE SUMMARY
| Oct 1, | Failed to | Dec. 31, | % increase | Dec. 31, | % increase | |||||||||||||||||||||||||||
| 2017 | Additions | Attrition | renew | 2017 | (decrease) | 2016 | (decrease) | |||||||||||||||||||||||||
| Consumer Energy | ||||||||||||||||||||||||||||||||
| Gas | 627,000 | 26,000 | (25,000 | ) | (11,000 | ) | 617,000 | (2 | )% | 604,000 | 2 | % | ||||||||||||||||||||
| Electricity | 1,168,000 | 79,000 | (58,000 | ) | (18,000 | ) | 1,171,000 | - | 1,186,000 | (1 | )% | |||||||||||||||||||||
| Total Consumer RCEs | 1,795,000 | 105,000 | (83,000 | ) | (29,000 | ) | 1,788,000 | - | 1,790,000 | - | ||||||||||||||||||||||
| Commercial Energy | ||||||||||||||||||||||||||||||||
| Gas | 337,000 | 46,000 | (7,000 | ) | (11,000 | ) | 365,000 | 8 | % | 250,000 | 46 | % | ||||||||||||||||||||
| Electricity | 1,955,000 | 153,000 | (33,000 | ) | (114,000 | ) | 1,961,000 | - | 2,187,000 | (10 | )% | |||||||||||||||||||||
| Total Commercial RCEs | 2,292,000 | 199,000 | (40,000 | ) | (125,000 | ) | 2,326,000 | 1 | % | 2,437,000 | (5 | )% | ||||||||||||||||||||
| Total RCEs | 4,087,000 | 304,000 | (123,000 | ) | (154,000 | ) | 4,114,000 | 1 | % | 4,227,000 | (3 | )% | ||||||||||||||||||||
Just Energy’s total RCE base is currently at 4.1 million, a 3% decrease from one year ago. Gross RCE additions for the quarter ended December 31, 2017 were 304,000, an increase of 45% compared to RCEs added in the third quarter of fiscal 2017. Net additions were a positive 27,000 for the third quarter of fiscal 2018, compared with a negative 84,000 net RCE additions in the third quarter of fiscal 2017.
Consumer RCE additions amounted to 105,000 for the three months ended December 31, 2017, a 4% increase from 101,000 gross RCE additions recorded in the prior comparable quarter. Net RCE additions for the Consumer division improved to negative 7,000 for the three months ended December 31, 2017, compared with negative 39,000 reported in the prior comparable period. As of December 31, 2017, the U.S., Canadian and U.K. segments accounted for 64%, 20% and 16% of the Consumer RCE base, respectively.
Commercial RCE additions were 199,000 for the three months ended December 31, 2017, an 83% increase over the prior comparable quarter as a result of increased additions from large natural gas Commercial and Industrial RCEs in Canada. The Interactive Energy Group (“IEG”) which commenced operation during the second quarter of fiscal 2018 had 41,711 RCEs as of the end of third quarter. IEG operates as an independent, unbiased consulting company which offers a range of customized products and services that are tailored to meet the energy needs of Commercial customers. As at December 31, 2017, IEG had 997 commercial and industrial customer contracts.
Just Energy remains focused on increasing the gross margin per RCE added for Commercial customers and, as a result, has been more selective in its market strategy]. As of December 31, 2017, the U.S., Canadian and U.K. segments accounted for 71%, 23% and 6% of the Commercial RCE base, respectively.
For the three months ended December 31, 2017, 44% of the total Consumer and Commercial RCE additions were generated through online and other non-door-to-door sales channels, 39% from commercial brokers and 17% from door-to-door sales. In the prior comparable period, 46% of RCE additions were generated from commercial brokers, 33% from online and other sales channels and 21% using door-to-door sales.
Just Energy’s geographical footprint continues to diversify outside of North America. The U.K. operations increased their RCE base by 26% to 440,000 RCEs during the nine months ended December 31, 2017 with strong growth in their Consumer RCE base. As of December 31, 2017, the U.S., Canadian and U.K. segments accounted for 68%, 22% and 10% of the RCE base, respectively. At December 31, 2016, the U.S., Canadian and U.K. segments represented 71%, 22% and 7% of the RCE base, respectively.
| 18. |
The Company’s launch of the new retail consumer sales channel continued to meet expectations in the third quarter of fiscal 2018. The retail channel added 27,968 new RCEs during the third quarter through 12 retail partnerships. The total number of stores with a Just Energy kiosk increased in the third quarter of fiscal 2018 by 111, bringing the total to 348 retail stores with kiosks. The Company’s largest retail partner, Sam’s Club, recently awarded the Company with 48 additional stores to add to its portfolio of stores across North America. This partnership exemplifies how Just Energy is expanding its channel opportunities to further reach potential residential customers looking to take control of their energy needs.
CUSTOMER SUMMARY (in thousands)
| As at | As at | % increase | ||||||||||
| Dec. 31, 2017 | April 1, 2017 | (decrease) | ||||||||||
| Consumer | 1,494 | 1,357 | 10 | % | ||||||||
| Commercial | 112 | 117 | (4 | )% | ||||||||
| Total customer count | 1,606 | 1,474 | 9 | % | ||||||||
With the diversification of product offerings to include more than commodities, Just Energy anticipates that the number of customers will become an increasingly relevant measure for reporting.
Just Energy’s customer base also includes 44,700 smart thermostat customers. These smart thermostats are bundled with a commodity contract and are currently offered in Canada and the United States. Customers with bundled products have lower attrition and higher overall profitability. Further expansion of the energy management solutions is a key driver of continued growth for Just Energy with additional product offerings contributing to lower attrition rates.
ATTRITION
| Trailing 12 | Trailing 12 | |||||||
| months ended | months ended | |||||||
| Dec. 31, 2017 | Dec. 31, 2016 | |||||||
| Consumer | 22 | % | 24 | % | ||||
| Commercial | 5 | % | 8 | % | ||||
| Total attrition | 13 | % | 15 | % | ||||
The combined attrition rate for Just Energy was 13% for the trailing 12 months ended December 31, 2017, a decrease of two percentage points from the 15% reported in the prior comparable period. The Consumer attrition rate decreased two percentage points to 22% from a year ago and the Commercial attrition rate decreased three percentage points to 5%. The decrease in the attrition rates is a result of Just Energy’s focus on becoming the customers’ “trusted advisor” and providing a variety of energy management solutions to its customer base to drive customer loyalty.
The Company carefully monitors the levels of customer complaints from its Consumer and Commercial divisions. The goal is to resolve all complaints registered within five days of receipt. Our corporate target is to have an outstanding complaint rate of less than 0.05% of customers at any time. As of December 31, 2017, the total outstanding rate was 0.004%.
RENEWALS
| Trailing 12 | Trailing 12 | |||||||
| months ended | months ended | |||||||
| Dec. 31, 2017 | Dec. 31, 2016 | |||||||
| Consumer | 72 | % | 79 | % | ||||
| Commercial | 48 | % | 55 | % | ||||
| Total renewals | 58 | % | 64 | % | ||||
| 19. |
The Just Energy renewal process is a multifaceted program that aims to maximize the number of customers who choose to renew their contract prior to the end of their existing contract term. Efforts begin up to 15 months in advance, allowing a customer to renew for an additional period. Overall, the renewal rate was 58% for the trailing 12 months ended December 31, 2017, a decrease of six percentage points from 64% as at December 31, 2016. The Consumer renewal rate decreased by seven percentage points to 72%, while the Commercial renewal rate has also decreased by seven percentage points to 48%. The decline in Commercial renewal rate reflected a very competitive market for Commercial renewals with competitors pricing aggressively and Just Energy’s focus on improving retained customers’ profitability rather than pursuing low margin growth. The renewals in Consumer gas in Canada have decreased seven percentage points to 52% and Consumer electricity has decreased by nine percentage points to 49% mainly due to new consumer protection rules in Alberta and Ontario which prohibit selling energy products door-to-door, ban contracting with consumers at their home and disallow the automatic renewal or extension of expiring contracts.
ENERGY CONTRACT RENEWALS
This table shows the customers up for renewal in the following fiscal periods:
| Consumer | Commercial | |||||||||||||||
| Gas | Electricity | Gas | Electricity | |||||||||||||
| Remainder of 2018 | 4 | % | 6 | % | 5 | % | 6 | % | ||||||||
| 2019 | 24 | % | 32 | % | 26 | % | 33 | % | ||||||||
| 2020 | 22 | % | 22 | % | 20 | % | 23 | % | ||||||||
| 2021 | 22 | % | 20 | % | 14 | % | 13 | % | ||||||||
| Beyond 2021 | 28 | % | 20 | % | 35 | % | 25 | % | ||||||||
| Total | 100 | % | 100 | % | 100 | % | 100 | % | ||||||||
Note: All month-to-month customers, which represent 548,000 RCEs, are excluded from the table above.
Gross margin
For the three months ended December 31
(thousands of dollars)
| Fiscal 2018 | Fiscal 2017 | |||||||||||||||||||||||
| Consumer | Commercial | Total | Consumer | Commercial | Total | |||||||||||||||||||
| Gas | $ | 55,510 | $ | 5,318 | $ | 60,828 | $ | 51,141 | $ | 7,274 | $ | 58,415 | ||||||||||||
| Electricity | 77,297 | 33,180 | 110,477 | 77,961 | 37,977 | 115,938 | ||||||||||||||||||
| $ | 132,807 | $ | 38,498 | $ | 171,305 | $ | 129,102 | $ | 45,251 | $ | 174,353 | |||||||||||||
| Increase (decrease) | 3 | % | (15 | )% | (2 | )% | ||||||||||||||||||
For the nine months ended December 31
(thousands of dollars)
| Fiscal 2018 | Fiscal 2017 | |||||||||||||||||||||||
| Consumer | Commercial | Total | Consumer | Commercial | Total | |||||||||||||||||||
| Gas | $ | 104,150 | $ | 10,168 | $ | 114,318 | $ | 107,409 | $ | 14,773 | $ | 122,182 | ||||||||||||
| Electricity | 251,549 | 105,664 | 357,213 | 277,072 | 121,305 | 398,377 | ||||||||||||||||||
| $ | 355,699 | $ | 115,832 | $ | 471,531 | $ | 384,481 | $ | 136,078 | $ | 520,559 | |||||||||||||
| Decrease | (7 | )% | (15 | )% | (9 | )% | ||||||||||||||||||
CONSUMER ENERGY
Gross margin for the three months ended December 31, 2017 for the Consumer division was $132.8 million, an increase of 3% from $129.1 million recorded in the prior comparable quarter. For the nine months ended December 31, 2017, gross margin for the Consumer division was $355.7 million, a decrease of 7% from $384.5 million recorded for the nine months ended December 31, 2016. Average realized gross margin for the Consumer division for the rolling 12 months ended December 31, 2017 was $248/RCE, representing a 6% decrease from $264/RCE reported in the prior comparable quarter. The decrease is attributable to negative foreign exchange impact as a result of weakening of the U.S. dollar and U.K. pound and lower electricity consumption as a result of mild summer weather in North America during the second fiscal quarter. The gross margin/RCE value includes an appropriate allowance for bad debt expense in applicable markets.
| 20. |
Gas
Gross margin from gas customers in the Consumer division was $55.5 million for the three months ended December 31, 2017, an increase from $51.1 million recorded in the prior comparable quarter. For the nine months ended December 31, 2017, the gross margin contribution from the gas markets decreased by 3% over the prior comparable period to $104.2 million as a result of lower gross margin per RCE in the current quarter and negative foreign exchange impact as a result of the weakening of the U.S. dollar and U.K. pound.
Electricity
Gross margin from electricity customers in the Consumer division was $77.3 million for the three months ended December 31, 2017, a 1% decrease from $78.0 million recorded in the prior comparable quarter. For the nine months ended December 31, 2017, gross margin from electricity markets decreased 9% to $251.5 million.
COMMERCIAL ENERGY
Gross margin for the Commercial division was $38.5 million for the three months ended December 31, 2017, a decrease of 15% from $45.3 million recorded in the prior comparable quarter. For the nine months ended December 31, 2017, gross margin for the Commercial division was $115.8 million, a decrease of 15% from $136.1 million recorded for the nine months ended December 31, 2016.
Average realized gross margin for the rolling 12 months ended December 31, 2017 was $88/RCE, an increase of 7% from the $82/RCE reported in the prior comparable period. The gross margin per RCE value includes an appropriate allowance for bad debt expense in Illinois, Texas, Georgia, Michigan and California.
Gas
Gas gross margin for the Commercial division was $5.3 million for the three months ended December 31, 2017, a decrease of 27% from $7.3 million recorded in the prior comparable quarter. For the nine months ended December 31, 2017, the gross margin contribution from the gas markets decreased by 31% from the prior comparable period to $10.2 million. The decrease in gross margin for the three and nine months ended December 31, 2017 is as a result of lower gross margin per RCE and negative foreign exchange impact as a result of the weakening of the U.S. dollar and U.K. pound.
Electricity
The Commercial division’s electricity gross margin for the three months ended December 31, 2017 was $33.2 million, a decrease of 13% from $38.0 million recorded in the prior comparable quarter. Gross margin from the Commercial electricity markets for the nine months ended December 31, 2017 was $105.7 million, a decrease of 13% from $121.3 million recorded in the nine months ended December 31, 2016.
GROSS MARGIN ON NEW AND RENEWING CUSTOMERS
The table below depicts the annual margins on contracts for Consumer and Commercial customers signed during the quarter. This table reflects the gross margin (sales price less costs of associated supply and allowance for bad debt) earned on new additions and renewals, including both brown commodities and JustGreen supply.
| 21. |
Annual gross margin per RCE
| Q3 Fiscal | Number of | Q3 Fiscal | Number of | |||||||||||||
| 2018 | customers | 2017 | customers | |||||||||||||
| Consumer customers added and renewed | $ | 225 | 183,000 | $ | 222 | 205,000 | ||||||||||
| Consumer customers lost | 189 | 120,000 | 199 | 140,000 | ||||||||||||
| Commercial customers added and renewed1 | 73 | 239,000 | 82 | 229,000 | ||||||||||||
| Commercial customers lost | 77 | 157,000 | 81 | 154,000 | ||||||||||||
1 Annual gross margin per RCE excludes margins from IEG business and large commercial and industrial customers.
For the three months ended December 31, 2017, the average gross margin per RCE for the customers added and renewed by the Consumer division was $225/RCE, an increase from $222/RCE added in the prior comparable period. The average gross margin per RCE for the Consumer customers lost during the three months ended December 31, 2017 was $189/RCE, a decrease from $199/RCE margin lost on customers in the prior comparable period.
For the Commercial division, the average gross margin per RCE for the customers signed during the three months ended December 31, 2017 was $73/RCE, a decrease from $82/RCE added in the prior comparable period. Customers lost through attrition and failure to renew during the three months ended December 31, 2017 were at an average gross margin of $77/RCE, a decrease from $81/RCE reported in the prior comparable period. Management will continue to focus on meeting its profitability target by optimizing the margin of customers added and renewed and capturing a larger customer base.
Overall consolidated results
ADMINISTRATIVE EXPENSES
(thousands of dollars)
| Three months | Three months | Nine months | Nine months | |||||||||||||||||||||
| ended | ended | % | ended | ended | ||||||||||||||||||||
| Dec. 31, | Dec. 31, | increase | Dec. 31, | Dec. 31, | % | |||||||||||||||||||
| 2017 | 2016 | (decrease) | 2017 | 2016 | increase | |||||||||||||||||||
| Consumer Energy | $ | 40,379 | $ | 31,267 | 29 | % | $ | 109,453 | $ | 98,321 | 11 | % | ||||||||||||
| Commercial Energy | 10,010 | 13,300 | (25 | )% | 36,373 | 37,664 | (3 | )% | ||||||||||||||||
| Total administrative expenses | $ | 50,389 | $ | 44,567 | 13 | % | $ | 145,826 | $ | 135,985 | 7 | % | ||||||||||||
Administrative expenses increased by 13% to $50.4 million for the three months ended December 31, 2017 from $44.6 million recorded in the prior comparative period. The Consumer division’s administrative expenses were $40.4 million for the three months ended December 31, 2017, an increase of 29% from $31.3 million recorded in the prior comparable quarter. The Commercial division’s administrative expenses were $10.0 million for the third quarter of fiscal 2018, a 25% decrease from $13.3 million reported for the prior comparable quarter.
Administrative expenses increased by 7% to $145.8 million for the nine months ended December 31, 2017 from $136.0 million recorded in the prior comparative period. Consumer and Commercial administrative expenses for the nine months ended December 31, 2017 were $109.5 million and $36.4 million, an increase of 11% and a decrease of 3% over the prior comparable period, respectively. The increase in administrative costs was attributable to the growth in the U.K. operations, as well as costs associated with international expansion and new strategic initiatives.
| 22. |
SELLING AND MARKETING EXPENSES
(thousands of dollars)
| Three months | Three months | Nine months | Nine months | |||||||||||||||||||||
| ended | ended | % | ended | ended | % | |||||||||||||||||||
| Dec. 31, | Dec. 31, | increase | Dec. 31, | Dec. 31, | increase | |||||||||||||||||||
| 2017 | 2016 | (decrease) | 2017 | 2016 | (decrease) | |||||||||||||||||||
| Consumer Energy | $ | 38,238 | $ | 32,514 | 18 | % | $ | 110,886 | $ | 104,175 | 6 | % | ||||||||||||
| Commercial Energy | 17,309 | 22,823 | (24 | )% | 61,314 | 68,406 | (10 | )% | ||||||||||||||||
| Total selling and marketing expenses | $ | 55,547 | $ | 55,337 | - | $ | 172,200 | $ | 172,581 | - | ||||||||||||||
Selling and marketing expenses, which consist of commissions paid to independent sales contractors, brokers and sales agents, as well as sales-related corporate costs, were $55.5 million, remaining consistent with $55.3 million in the third quarter of fiscal 2017.
The selling and marketing expenses for the Consumer division were $38.2 million for the three months ended December 31, 2017, an 18% increase from $32.5 million recorded in the prior comparable quarter. The selling expenses increased due to significant RCE growth in the U.K.
The selling and marketing expenses for the Commercial division were $17.3 million for the three months ended December 31, 2017, down 24% from $22.8 million recorded in the prior comparable quarter. This decrease is a result of lower commission expenses due to a 5% decrease in Commercial RCEs for the nine months ended December 31, 2017.
For the nine months ended December 31, 2017, selling and marketing expenses were $172.2 million, consistent when compared to $172.6 million in the prior comparable period. The Consumer division’s selling and marketing expenses were up 6% to $110.9 million compared to $104.2 million for the nine months ended December 31, 2016. Selling and marketing expenses for the Commercial division were $61.3 million for the nine months ended December 31, 2017, a decrease of 10% compared to $68.4 million in the prior comparable period as a result of residual lower commission expenses in the current period.
The aggregation costs per customer for the last 12 months for Consumer customers signed by independent representatives and Commercial customers signed by brokers were as follows:
| Fiscal 2018 | Fiscal 2017 | |||||||
| Consumer | $ | 178 | /RCE | $ | 205 | /RCE | ||
| Commercial | $ | 42 | /RCE | $ | 40 | /RCE | ||
The average aggregation cost for the Consumer division was $178/RCE for the trailing 12 months ended December 31, 2017, a decrease from $205/RCE reported in the prior comparable period. The decrease in cost in the current 12-month period over the prior year is a result of the shift in the Company’s sales channels from door-to-door to online broker and other non-door-to-door sales channels.
The $42 average aggregation cost for Commercial division customers is based on the expected average annual cost for the respective customer contracts. It should be noted that commercial broker contracts are paid further commissions averaging $42 per year for each additional year that the customer flows. Assuming an average life of 2.8 years, this would add approximately $76 (1.8 x $42) to the year’s average aggregation cost reported above. As at December 31, 2016, the average aggregation cost for commercial brokers was $40/RCE. The lower cost in the prior comparable quarter is a function of broker commissions being a percentage of lower margins.
| 23. |
PROVISION FOR (RECOVERY OF) INCOME TAXES
(thousands of dollars)
| Three months | Three months | Nine months | Nine months | |||||||||||||
| ended | ended | ended | ended | |||||||||||||
| Dec. 31, 2017 | Dec. 31, 2016 | Dec. 31, 2017 | Dec. 31, 2016 | |||||||||||||
| Current income tax expense (recovery) | $ | (4,105 | ) | $ | 9,823 | $ | 379 | $ | 14,449 | |||||||
| Deferred income tax expense | 9,718 | 11,153 | 10,198 | 36,705 | ||||||||||||
| Provision for income taxes | $ | 5,613 | $ | 20,976 | $ | 10,577 | $ | 51,154 | ||||||||
Just Energy recorded a current income tax recovery of $4.1 million for the three months ended December 31, 2017, versus a $9.8 million current tax expense in the prior comparable quarter. For the nine months ended December 31, 2017, the current income tax expense amounts to $0.4 million, a decrease from $14.4 million reported for the nine months ended December 31, 2016 which corresponds to the decrease in income largely driven by a reduction of gross margin and Base EBITDA.
During the three months ended December 31, 2017, a deferred tax expense of $9.7 million was recorded, primarily relating to mark to market gains from financial instruments. In the same period in fiscal 2017, a deferred tax expense of $11.2 million was recorded, primarily resulting from the change in fair value of derivative instruments. A deferred tax provision of $10.2 million and $36.7 million was recorded for the nine months ended December 31, 2017 and December 31, 2016, respectively. The variance year over year is primarily due to lower mark to market gains in the current year relative to the nine months ended December 31, 2016.
Under IFRS, Just Energy recognizes income tax assets and liabilities based on the estimated tax consequences attributable to temporary differences between the carrying value of the assets and liabilities on the consolidated financial statements and their respective tax bases, using substantively enacted income tax rates. A deferred tax asset will not be recognized if it is not anticipated that the asset will be realized in the foreseeable future. The effect of a change in the income tax rates used in calculating deferred income tax assets and liabilities is recognized in income during the period in which the change occurs.
Liquidity and capital resources
SUMMARY OF CASH FLOWS
(thousands of dollars)
| Three months | Three months | Nine months | Nine months | |||||||||||||
| ended | ended | ended | ended | |||||||||||||
| Dec. 31, 2017 | Dec. 31, 2016 | Dec. 31, 2017 | Dec. 31, 2016 | |||||||||||||
| Operating activities | $ | 28,659 | $ | 35,605 | $ | 58,454 | $ | 115,743 | ||||||||
| Investing activities | 13,516 | (13,639 | ) | (4,696 | ) | (25,633 | ) | |||||||||
| Financing activities, excluding dividends | 20,768 | (43,691 | ) | 52,005 | (81,691 | ) | ||||||||||
| Effect of foreign currency translation | 1,390 | (712 | ) | 373 | (2,103 | ) | ||||||||||
| Increase in cash before dividends | 64,333 | (22,437 | ) | 106,136 | 6,316 | |||||||||||
| Dividends (cash payments) | (21,490 | ) | (18,788 | ) | (64,719 | ) | (56,378 | ) | ||||||||
| Increase (decrease) in cash | 42,843 | (41,225 | ) | 41,417 | (50,062 | ) | ||||||||||
| Cash and cash equivalents – beginning of period | 55,950 | 118,759 | 57,376 | 127,596 | ||||||||||||
| Cash and cash equivalents – end of period | $ | 98,793 | $ | 77,534 | $ | 98,793 | $ | 77,534 | ||||||||
OPERATING ACTIVITIES
Cash flow from operating activities for the three months ended December 31, 2017 was an inflow of $28.7 million, compared to $35.6 million in the prior comparable quarter. The reduction is primarily a result of a reduction in gross margin in the current period. For the nine months ended December 31, 2017, cash flow from operating activities was an inflow of $58.5 million, a decrease from $115.7 million reported for the prior comparable period as a result of lower gross margin in the current period.
| 24. |
INVESTING ACTIVITIES
Investing activities for the three months ended December 31, 2017 included purchases of property, plant and equipment and intangible assets totalling $1.0 million and $11.3 million respectively, compared with $2.2 million and $7.9 million, respectively in fiscal 2017.
Investing activities for the nine months ended December 31, 2017 included purchases of property, plant and equipment and intangible assets totalling $3.9 million and $23.8 million respectively, compared with $5.9 million and $12.7 million, respectively in fiscal 2017.
FINANCING ACTIVITIES
Financing activities, excluding dividends, relates primarily to the issuance and repayment of long-term debt. During the three months ended December 31, 2017, Just Energy had withdrawn $20.8 million on the credit facility. During the nine months ended December 31, 2017, Just Energy issued an additional $5.2 million in preferred shares and withdrew an additional $70.0 million on its credit facility, offset by common share repurchases of $11.9 million.
Just Energy’s liquidity requirements are driven by the delay from the time that a customer contract is signed until cash flow is generated. The elapsed period between the time a customer is signed and receipt of the first payment from the customer varies with each market. The time delays per market are approximately two to nine months. These periods reflect the time required by the various LDCs to enroll, flow the commodity, bill the customer and remit the first payment to Just Energy. In Alberta, Texas, Illinois, British Columbia, California, Michigan, Delaware, Ohio, Georgia and the United Kingdom, Just Energy receives payment directly.
DIVIDENDS AND DISTRIBUTIONS
During the three months ended December 31, 2017, Just Energy paid cash dividends to its common and preferred shareholders and distributions to holders of share-based awards in the amount of $21.5 million, compared to $18.8 million paid in the prior comparable quarter. For the nine months ended December 31, 2017, Just Energy paid $64.8 million, compared to $56.4 million paid for the comparable period of fiscal 2017.
Just Energy’s annual dividend rate on its common shares is currently set at $0.50 per common share paid quarterly. The current dividend set by the Board provides that common shareholders of record on the 15th day of March, June, September and December, or the first business day thereafter, receive dividends at the end of that month. The Board reviews the dividend each quarter and it is subject to Board approval. Neither the payment of the dividend nor the amount of the dividend is guaranteed.
Preferred shareholders are entitled to receive dividends at a rate of 8.50% on the initial offer price of US$25.00 per preferred share when, as and if declared by our Board of Directors, out of funds legally available for the payments of dividends, on the applicable dividend payment date. As the preferred shares are cumulative, dividends on preferred shares will accrue even if they are not paid. Common shareholders will not receive dividends until the preferred share dividends in arrears are paid. Dividend payment dates are quarterly on the last day of each of March, June, September and December. The dividend payment on December 31, 2017 was US$0.53125 per preferred share.
Balance sheet as at December 31, 2017, compared to March 31, 2017
Total cash and short-term investments increased from $83.6 million as at March 31, 2017 to $98.8 million. The increase in cash is primarily attributable to the credit facility withdrawals to support the seasonal cash requirements.
As of December 31, 2017, trade receivables and unbilled revenue amounted to $354.1 million and $311.7 million, respectively, compared to March 31, 2017, when the trade receivables and unbilled revenue amounted to $353.1 million and $218.4 million, respectively. The accounts receivable balances increased as a result of normal seasonal consumption with higher electricity bills in the current quarter. Trade payables, which include gas and electricity commodity payables of $271.2 million, increased from $486.6 million to $589.3 million during the third quarter of the fiscal year.
| 25. |
In Ontario, Manitoba, British Columbia, Michigan and the U.K. more gas has been delivered to LDCs than consumed by customers, resulting in gas delivered in excess of consumption and a deferred revenue position of $6.8 million and $76.2 million, respectively, as of December 31, 2017. These amounts increased from $3.2 million and $17.5 million, respectively, as of March 31, 2017 mainly due to the customer growth in the U.K. As at December 31, 2017, more gas was consumed by customers than Just Energy had delivered to the LDCs in Manitoba and Quebec and as a result, Just Energy recognized an accrued gas receivable and accrued gas payable of $1.6 million and $1.0 million, respectively. These amounts decreased from $16.4 million and $12.5 million, respectively, as of March 31, 2017. These changes represent normal seasonal fluctuations based on consumption during the winter months.
Prepaid expenses, deposits and current assets decreased from $111.3 million at March 31, 2017 to $99.2 million as of December 31, 2017 as green commodity purchases decreased by $8.8 million during the nine months ended December 31, 2017.
Fair value of derivative financial assets and fair value of financial liabilities relate entirely to the financial derivatives. The mark to market gains and losses can result in significant changes in profit and loss and, accordingly, shareholders’ equity from year to year due to commodity price volatility.
Total debt has increased from $498.1 million as at March 31, 2017 to $564.7 million as at December 31, 2017. This increase is a result of the withdrawal of an additional $70.0 million on the credit facility. The book value of net debt was 2.6x for the Base EBITDA, up from 2.5x reported one year ago, and the 1.8x reported at fiscal year-end.
Debt and financing for operations
(thousands of dollars)
| Dec. 31, | March 31, | Dec. 31, | ||||||||||||
| Maturity | 2017 | 2017 | 2016 | |||||||||||
| Credit facility | September 1, 2018 | $ | 138,288 | $ | 68,258 | $ | 90,295 | |||||||
| 6.75% convertible debentures | December 31, 2021 | 147,477 | 145,579 | 145,008 | ||||||||||
| 5.75% convertible debentures | September 30, 2018 | 97,955 | 96,022 | 95,413 | ||||||||||
| 6.5% convertible bonds | July 29, 2019 | 182,091 | 190,486 | 191,487 | ||||||||||
| 6.0% convertible debentures | N/A | - | - | 92,773 | ||||||||||
The various debt instruments are described as follows:
• A $342.5 million credit facility expiring on September 1, 2018, supported by guarantees and secured by, among other things, a general security agreement and an asset pledge excluding, primarily, the U.K. Japan, and Germany operations. Credit facility withdrawals amounted to $138.3 million as of December 31, 2017, compared with $68.3 million as of March 31, 2017. In addition, total letters of credit outstanding as at December 31, 2017 amounted to $109.5 million (March 31, 2017 - $109.2 million).
• A 6.75% senior unsecured subordinated debenture with a maturity date of December 31, 2021 was issued during the third quarter of fiscal 2017 for which interest is payable semi-annually in arrears on June 30 and December 31, at a rate of 6.75% per annum.
• A 5.75% convertible extendible unsecured subordinated debenture maturing on September 30, 2018 with interest payable semi-annually on March 31 and September 30, at a rate of 5.75% per annum.
| 26. |
• A 6.5% European-focused senior unsecured convertible bond with a maturity date of July 29, 2019 and interest payable semi-annually in arrears on January 29 and July 29, at a rate of 6.5% per annum.
See Note 11 of the unaudited interim condensed consolidated financial statements for further details regarding the nature of each debt agreement.
Acquisition of businesses
ACQUISITION OF INTELL ENERCARE SOLUTIONS INC.
On June 6, 2017, Just Energy completed the acquisition of 100% of the issued and outstanding shares of Intell Enercare Solutions Inc., a complete service provider for supply, design and installation of energy saving technologies, for up to $11.0 million, subject to closing adjustments. Terms of the deal include an initial payment of $2.2 million. Also, Just Energy will pay up to $9.0 million to the sellers over three years provided that certain EBITDA targets are satisfied. The fair value of the contingent consideration at acquisition was estimated to be $7.8 million. The acquisition of Intell Enercare Solutions Inc. was accounted for using the purchase method of accounting.
The transaction costs related to the acquisition have been expensed and are included in other operating expenses in the interim condensed consolidated statements of income. The fair value of the contingent consideration was subsequently reduced to $2.0 million during the quarter through the interim condensed consolidated statements of income due to changes in the assumptions of the timing for sellers to meet EBITDA targets.
For an allocated breakdown of the purchase price to identified assets and liabilities acquired in the acquisition, see Note 9 of the Interim Financial Statements for the three months and nine months ended December 31, 2017.
ACQUISITION OF DB SWDIREKT GMBH AND DB SWPRO GMBH
On December 8, 2016, Just Energy completed the acquisition of 95% of the issued and outstanding shares of SWDirekt, a retail energy company, and 50% of the issued and outstanding shares of SWPro, a sales and marketing company, for $6.4 million, subject to closing adjustments. Terms of the deal include a $2.2 million payment upon the achievement of sales targets. The contingent consideration was subsequently written down to $nil through the interim condensed consolidated statements of income due to changes of sellers’ involvement in the business and the assumption of timing for sellers to meet sales target.
The acquisition of SWDirekt and SWPro was accounted for using the purchase method of accounting. Just Energy allocated the purchase price to the identified assets and liabilities acquired based on their fair values at the time of acquisition.
For an allocated breakdown of the purchase price to identified assets and liabilities acquired in the acquisition, see Note 9 of the Interim Financial Statements for the three months and nine months ended December 31, 2017.
Contractual obligations
In the normal course of business, Just Energy is obligated to make future payments for contracts and other commitments that are known and non-cancellable.
| 27. |
PAYMENTS DUE BY PERIOD
(thousands of dollars)
| Less than 1 year | 1 – 3 years | 4 – 5 years | After 5 years | Total | ||||||||||||||||
| Trade and other payables | $ | 589,346 | $ | - | $ | - | $ | - | $ | 589,346 | ||||||||||
| Long-term debt | 238,288 | 188,175 | 160,000 | - | 586,463 | |||||||||||||||
| Interest payments | 28,781 | 33,831 | 10,800 | - | 73,412 | |||||||||||||||
| Premises and equipment leasing | 1,325 | 9,233 | 7,690 | 10,881 | 29,129 | |||||||||||||||
| Gas, electricity and non-commodity contracts | 567,020 | 2,156,560 | 133,905 | 19,380 | 2,876,865 | |||||||||||||||
| $ | 1,424,760 | $ | 2,387,799 | $ | 312,395 | $ | 30,261 | $ | 4,155,216 | |||||||||||
On August 1, 2017, Just Energy announced that it reached an agreement with its joint venture partner, Red Ventures LLC, to end the exclusive relationship for online sales of the Just Energy brand in North America. To facilitate the transaction, Just Energy acquired the outstanding 50% interest of each of Just Ventures LLC in the United States and Just Ventures L.P. in Canada. Under the terms of the agreement, the purchase price is a function of go-forward earnings based on the current client base and is payable in quarterly installments over five years estimated at $102.3 million, of which $37.8 million has been presented as current liabilities and $64.5 million as long-term liabilities. As at December 31, 2017, the current liabilities amount to $33.6 million and long term liabilities amount to $55.9 million.
OTHER OBLIGATIONS
In the opinion of management, Just Energy has no material pending actions, claims or proceedings that have not been included either in its accrued liabilities or in the consolidated financial statements. In the normal course of business, Just Energy could be subject to certain contingent obligations that become payable only if certain events were to occur. The inherent uncertainty surrounding the timing and financial impact of any events prevents any meaningful measurement, which is necessary to assess any material impact on future liquidity. Such obligations include potential judgments, settlements, fines and other penalties resulting from actions, claims or proceedings.
Transactions with related parties
Just Energy does not have any material transactions with any individuals or companies that are not considered independent of Just Energy or any of its subsidiaries and/or affiliates.
Off balance sheet items
The Company has issued letters of credit in accordance with its credit facility totalling $109.5 million to various counterparties, primarily utilities in the markets where it operates, as well as suppliers.
Pursuant to separate arrangements with Westchester Fire Insurance Company, Travelers Casualty, Surety Company of America, Berkley Insurance Company, Fidelity and Deposit Company of Maryland and Charter Brokerage LLC, Just Energy has issued surety bonds to various counterparties including States, regulatory bodies, utilities and various other surety bond holders in return for a fee and/or meeting certain collateral posting requirements. Such surety bond postings are required in order to operate in certain states or markets. Total surety bonds issued as at December 31, 2017 were $53.9 million (March 31, 2017 - $55.9 million).
Critical accounting estimates
The consolidated financial statements of Just Energy have been prepared in accordance with IFRS. Certain accounting policies require management to make estimates and judgments that affect the reported amounts of assets, liabilities, revenues, cost of sales, selling and marketing, and administrative expenses. Estimates are based on historical experience, current information and various other assumptions that are believed to be reasonable under the circumstances. The emergence of new information and changed circumstances may result in actual results or changes to estimated amounts that differ materially from current estimates.
| 28. |
The following assessment of critical accounting estimates is not meant to be exhaustive. Just Energy might realize different results from the application of new accounting standards promulgated, from time to time, by various rule-making bodies.
RECEIVABLES AND ALLOWANCE FOR DOUBTFUL ACCOUNTS
The allowance for uncollectible accounts reflects Just Energy’s best estimates of losses on the accounts receivable balances. Just Energy determines the allowance for doubtful accounts on customer receivables by applying loss rates based on historical results to the outstanding receivable balance. Just Energy is exposed to customer credit risk on its continuing operations in Alberta, Texas, Illinois, Ohio, Delaware, California, Michigan, Georgia, the U.K. and commercial direct-billed accounts in British Columbia. Credit review processes have been implemented to perform credit evaluations of customers and manage customer default. If a significant number of customers were to default on their payments, it could have a material adverse effect on the operations and cash flows of Just Energy. Management factors default from credit risk in its margin expectations for all the above markets.
Revenues related to the sale of energy are recorded when energy is delivered to customers. The determination of energy sales to individual customers is based on systematic readings of customer meters generally on a monthly basis. At the end of each month, amounts of energy delivered to customers since the date of the last meter reading are estimated, and corresponding unbilled revenue is recorded. The measurement of unbilled revenue is affected by the following factors: daily customer usage, losses of energy during delivery to customers and applicable customer rates.
Increases in volumes delivered to the utilities’ customers and favourable rate mix due to changes in usage patterns in the period could be significant to the calculation of unbilled revenue. Changes in the timing of meter reading schedules and the number and type of customers scheduled for each meter reading date would also have an effect on the measurement of unbilled revenue; however, total operating revenues would remain materially unchanged.
DEFERRED TAXES
In accordance with IFRS, Just Energy uses the liability method of accounting for income taxes. Under the liability method, deferred income tax assets and liabilities are recognized on the differences between the carrying amounts of assets and liabilities and their respective income tax basis.
The tax effects of these differences are reflected in the consolidated statements of financial position as deferred income tax assets and liabilities. An assessment must be made to determine the likelihood that our future taxable income will be sufficient to permit the recovery of deferred income tax assets. To the extent that such recovery is not probable, deferred income tax assets must be reduced. The reduction of the deferred income tax asset can be reversed if the estimated future taxable income improves. No assurances can be given as to whether any reversal will occur or as to the amount or timing of any such reversal. Management must exercise judgment in its assessment of continually changing tax interpretations, regulations and legislation to ensure deferred income tax assets and liabilities are complete and fairly presented. Assessments and applications differing from our estimates could materially impact the amount recognized for deferred income tax assets and liabilities.
Deferred income tax assets of $15.7 million and $23.0 million have been recorded on the interim condensed and consolidated statements of financial position as at December 31, 2017 and March 31, 2017, respectively. These assets primarily relate to mark to market losses on our derivative financial instruments. Management believes there will be sufficient taxable income that will permit the use of these future tax assets in the tax jurisdictions where they exist. When evaluating the future tax position, Just Energy assesses its ability to use deferred tax assets based on expected taxable income in future periods.
As at December 31, 2017, no deferred tax assets were recognized in the U.S. However, net taxable temporary differences of $180.0 million were generated for the nine months ended December 31, 2017.
Deferred income tax liabilities of $6.4 million and $1.7 million have been recorded on the interim condensed consolidated statements of financial position as at December 31, 2017 and March 31, 2017, respectively. These liabilities are primarily due to mark to market losses on the derivative financial instruments and unrealized foreign exchange losses which, when realized, will be recognized for tax purposes.
| 29. |
The enactment of the Tax Cuts and Jobs Act of 2017 in the U.S. resulted in a reduction in the federal corporate income tax rate effective January 1, 2018 and other tax measures. The enactment does not have a material impact as Just Energy has significant loss carryforward in the U.S. on which no deferred tax assets were recognized.
As further clarification and guidance on the new legislation is provided by the IRS and U.S. Treasury, Just Energy will continue to assess its impact on our financial position. However no material impact is expected.
SUBSIDIARIES
Subsidiaries that are not wholly owned by Just Energy require judgment in determining the amount of control that Just Energy has over that entity and the appropriate accounting treatments. In these interim consolidated financial statements, management has determined that Just Energy controls SWDirekt and SWPro and, therefore, has treated the portion that is not owned by Just Energy as a non-controlling interest.
USEFUL LIFE OF KEY PROPERTY, PLANT AND EQUIPMENT AND INTANGIBLE ASSETS
Each significant component is depreciated over its estimated useful life. A component can be separately identified as an asset and is expected to provide a benefit of greater than one year. Estimated useful lives are determined based on current facts and past experience, and take into consideration the anticipated physical life of the asset, existing long-term sales agreements and contracts, current and forecasted demand, and the potential for technological obsolescence and regulations. The useful lives of property, plant and equipment and depreciation rates used are reviewed at least annually to ensure they continue to be appropriate.
Depreciation and amortization expense from operations for the three and nine months ended December 31, 2017 recorded in the interim condensed consolidated statements of cash flows was $6.5 million and $16.3 million respectively, compared with $6.4 million and $16.5 million respectively for the three and nine months ended December 31, 2016.
FAIR VALUE OF FINANCIAL INSTRUMENTS AND RISK MANAGEMENT
Just Energy has entered into a variety of derivative financial instruments as part of the business of purchasing and selling gas, electricity and JustGreen supply. Just Energy enters into contracts with customers to provide electricity and gas at fixed prices and provide comfort to certain customers that a specified amount of energy will be derived from green generation or carbon destruction. These customer contracts expose Just Energy to changes in market prices to supply these commodities. To reduce its exposure to commodity market price changes, Just Energy uses derivative financial and physical contracts to secure fixed-price commodity supply to cover its estimated fixed-price delivery or green commitment.
Just Energy uses a forward interest rate curve along with a volume weighted average share price to value its share swap. The Eurobond conversion feature is valued using an option pricing model.
| 30. |
Just Energy’s objective is to minimize commodity risk, other than consumption changes, usually attributable to weather. Accordingly, it is Just Energy’s policy to hedge the estimated fixed-price requirements of its customers with offsetting hedges of natural gas and electricity at fixed prices for terms equal to those of the customer contracts. The cash flow from these supply contracts is expected to be effective in offsetting Just Energy’s price exposure and serves to fix acquisition costs of gas and electricity to be delivered under the fixed-price or price-protected customer contracts. Just Energy’s policy is not to use derivative instruments for speculative purposes.
Just Energy’s U.S., U.K., Germany and Ireland operations introduce foreign exchange-related risks. Just Energy enters into foreign exchange forwards in order to hedge its exposure to fluctuations in cross border cash flows.
The consolidated financial statements are in compliance with IAS 32, Financial Instruments: Presentation; IAS 39, Financial Instruments: Recognition and Measurement; and IFRS 7, Financial Instruments: Disclosure. All the mark to market changes on Just Energy’s derivative instruments are recorded on a single line on the consolidated income statement. Due to commodity volatility and to the size of Just Energy, the swings in mark to market on these positions will increase the volatility in Just Energy’s earnings.
The Company’s financial instruments are valued based on the following fair value (“FV”) hierarchy:
Level 1 – Unadjusted quoted prices in active markets for identical assets or liabilities;
Level 2 – Inputs other than quoted prices that are observable for the asset or liability either directly or indirectly; and
Level 3 – Inputs that are not based on observable market data.
The main cause of changes in the fair value of derivative instruments is changes in the forward curve prices used for the fair value calculations. For a sensitivity analysis of these forward curves, see Note 8 of the interim condensed consolidated financial statements for the quarter ended December 31, 2017. Other inputs, including volatility and correlations, are driven off historical settlements.
Just Energy common and preferred shares
As at February 7, 2018, there were 146,900,344 common shares and 4,290,778 preferred shares of Just Energy outstanding.
In February 2017, Just Energy closed its underwritten public offering of 4,040,000 of its 8.50% Series A Fixed-to-Floating Rate Cumulative Redeemable Perpetual Preferred Shares at a price of US$25.00 per preferred share, for gross proceeds of US$101 million.
In May 2017, Just Energy announced it has entered into an at-the-market issuance (“ATM offering”) sales agreement pursuant to which Just Energy may, at its discretion and from time to time, offer and sell in the United States preferred shares having an aggregate offering price of up to US$150 million. As at February 7, 2018, Just Energy has issued an additional 250,778 preferred shares for aggregate total gross proceeds of $8.2 million under the ATM offering.
Normal course issuer bid
Just Energy has the ability to make a normal course issuer bid (“NCIB”) to purchase for cancellation a portion of the outstanding 5.75% convertible debentures as well as the Just Energy common shares up to March 16, 2018. Under each NCIB, Just Energy may purchase debentures and common shares representing 10% of the outstanding public float at close of business February 28, 2017 up to daily and total limits. For the nine months ended December 31, 2017, Just Energy had purchased $11.9 million of common shares through the NCIB program, compared to $nil, purchased in the prior comparable period.
Just Energy believes that the debentures and common shares may trade in a range that may not fully reflect their value. As a result, Just Energy believes that the purchase of the debentures and common shares from time to time can be undertaken at prices that make the acquisition of such securities an appropriate use of Just Energy’s available funds. In addition, purchases under each of the NCIBs may increase the liquidity of the debentures and common shares and will enable Just Energy to deleverage its balance sheet. Just Energy intends to continue to buy back debentures and common shares when the circumstances present themselves in a way that maximizes value for Just Energy. The Company’s current priority is the repurchase of debentures at attractive prices.
Legal proceedings
Just Energy’s subsidiaries are party to a number of legal proceedings. Other than as set out below, Just Energy believes that each proceeding constitutes a routine legal matter incidental to the business conducted by Just Energy and that the ultimate disposition of the proceedings will not have a material adverse effect on its consolidated earnings, cash flows or financial position.
| 31. |
In March 2012, Davina Hurt and Dominic Hill filed a lawsuit against Commerce Energy Inc., Just Energy Marketing Corp. and the Company (collectively referred to as “Just Energy”) in the Ohio Federal Court claiming entitlement to payment of minimum wage and overtime under Ohio wage claim laws and the federal Fair Labor Standards Act (“FLSA”) on their own behalf and similarly situated door-to-door sales representatives who sold for Commerce in certain regions of the United States. The Court granted the plaintiffs’ request to certify the lawsuit as a class action. Approximately 1,800 plaintiffs opted into the federal minimum wage and overtime claims, and approximately 8,000 plaintiffs were certified as part of the Ohio state overtime claims. A jury trial on the liability phase was completed on October 6, 2014. The jury refused to find a wilful violation by Just Energy but reached a verdict that supports the plaintiffs’ class and collective action that certain individuals were not properly classified as outside salespeople in order to qualify for an exemption under the minimum wage and overtime requirements pursuant to the FLSA and Ohio wage and hour laws. Just Energy disagrees with the result of the October 2014 trial and is of the opinion that it is not supported by existing law and precedent. On January 9, 2015, the Court struck the plaintiffs’ damage expert report. A separate damages phase is in process but potential amounts owing have yet to be determined. Just Energy’s appeal opportunities will remain open after conclusion of the damages phase, which still remains unscheduled by the Court. Just Energy strongly believes it complied with the law and continues to vigorously defend against the claims.
In August 2013, Levonna Wilkins, a former door-to-door independent contractor for Just Energy Marketing Corp. (“JEMC”), filed a lawsuit against Just Energy Illinois Corp., Commerce Energy Inc., JEMC and the Company (collectively referred to as “Just Energy”) in the Illinois Federal District Court claiming entitlement to payment of minimum wage and overtime under Illinois wage claim laws and the FLSA on her own behalf and similarly situated door-to-door sales representatives who sold in Illinois. On March 13, 2015, the Court granted Wilkins’ request to certify the lawsuit as a class action to include a class made up of Illinois sales representatives who sold for Just Energy Illinois and Commerce. On March 22, 2016, Just Energy’s summary judgment motion to dismiss Wilkins’ claims was denied. On June 16, 2016, the Court granted Just Energy’s motion for reconsideration which objected to Wilkins’ class definition and revised the definition to exclude sales representatives who sold for Commerce. Certain class plaintiffs were dismissed by agreement of the parties due to failure to appear at deposition or failure to fit within the revised class definition. Motion for decertification of the class will be filed by March 16, 2018. Just Energy strongly believes it complied with the law and continues to vigorously contest this matter.
In March 2015, Kevin Flood, a former door-to-door independent contractor for Just Energy Marketing Corp., filed a lawsuit against JEMC, Just Energy New York Corp. and the Company (collectively referred to as “Just Energy”) in New York Federal District Court (Southern District) claiming entitlement to payment of minimum wage and overtime under New York wage claim laws and the FLSA on his own behalf and similarly situated door-to-door sales representatives who sold in New York. On January 25, 2016, the Court granted Flood’s request to certify the lawsuit as a class action for the FLSA claims to include a class made up of New York sales representatives who sold for Just Energy New York. 167 individuals opted in to the FLSA class. Flood also filed a request to certify the lawsuit as a class action for alleged violations of the New York wage claim laws. On January 20, 2017, the Court granted Just Energy’s motion for summary judgment dismissing Flood’s claims and denied the motion to certify the class action. On February 16, 2017, Flood and opt-in plaintiffs filed an appeal of the dismissal of the Federal District Court’s order to the Court of Appeals for the Second Circuit. The appeal remains pending with oral argument scheduled for February 20, 2018. Just Energy strongly believes it complied with the law and will vigorously contest the appeal of the dismissal.
In May 2015, Kia Kordestani, a former door-to-door independent contractor (“IC”) sales representative for Just Energy Corp., filed a lawsuit against Just Energy Corp., Just Energy Ontario L.P. and the Company (collectively referred to as “Just Energy”) in the Superior Court of Justice, Ontario, claiming status as an employee and seeking benefits and protections of the Employment Standards Act such as minimum wage, overtime pay, and vacation and public holiday pay on his own behalf and similarly situated door-to-door sales representatives who sold in Ontario. On Just Energy’s request, Mr. Kordestani was removed as a plaintiff but replaced with Haidar Omarali, also a former door-to-door sales representative. In August 2015, Omarali filed a motion to certify a proposed class action of door-to-door sales representatives, and the Court set a hearing for June 21, 2016. The Court issued its certification decision on July 27, 2016, which granted Omarali’s request for certification with certain changes. Importantly, the Court refused to certify Omarali’s request for damages on an aggregate basis, finding that any alleged class member damages “cannot be determined without proof by individual class members”, and the Court left any further resolution on this issue to the common issues trial judge. The Court also refused to certify Omarali’s request for the option of punitive damages against Just Energy and found that there was no evidence that Just Energy’s conduct justified a punitive damages question, largely because the evidence presented showed that over the years Just Energy was “reassured that their sales agents were indeed ICs, not employees” by “various administrative agencies including the Canada Revenue Agency, the Workplace Safety and Insurance Board, and at least on one occasion before an employment officer of the Employment Standards Act”. Examinations are being held during 2018. No trial date has been scheduled. Just Energy strongly believes it complied with the law and continues to vigorously contest this matter.
| 32. |
Controls and procedures
INTERNAL CONTROLS FOR DISCLOSURE AND FINANCIAL REPORTING
As of December 31, 2017, the Co-Chief Executive Officers (“Co-CEOs”) and Chief Financial Officer (“CFO”) of the Company, along with the assistance of senior management, have designed disclosure controls and procedures to provide reasonable assurance that material information relating to Just Energy is made known to the Co-CEOs and CFO, and have designed internal controls over financial reporting based on the criteria established in the 2013 Internal Control – Integrated Framework issued by the Committee of Sponsoring Organizations of the Treadway Commission (the COSO criteria) to provide reasonable assurance regarding the reliability of financial reporting and the preparation of consolidated financial statements in accordance with IFRS.
During the three and nine months ended December 31, 2017, there have been no changes in the Company's policies and procedures and other processes that comprise its internal control over financial reporting, that have materially affected, or are reasonably likely to materially affect, the Company's internal control over financial reporting.
Corporate governance
Just Energy is committed to maintaining transparency in its operations and ensuring its approach to governance meets all recommended standards. Full disclosure of Just Energy’s compliance with existing corporate governance rules is available at www.justenergygroup.com and is included in Just Energy’s Management Proxy Circular. Just Energy actively monitors the corporate governance and disclosure environment to ensure timely compliance with current and future requirements.
Outlook
Just Energy continues to deploy its strategy to become a world-class consumer enterprise delivering superior value to its customers through a range of energy management solutions and a multi-channel approach. The Company has recently completed a phase of internal transformation centered on repairing its balance sheet and overall debt structure, as well as improving the profitability profile of its customer base. Just Energy’s growth plans centre on customer growth, geographic expansion, channel growth and enhancements, strategic acquisitions, and new products and structures.
Management reiterated its previously issued guidance of fiscal 2018 Base EBITDA in the range of $175 million to $190 million. These expectations reflect the impact of the significant one-time weather events in the second fiscal quarter, combined with the low commodity pricing environment and the Company’s efforts to improve profitability. To achieve profitability and optimize growth in the fourth fiscal quarter and beyond, Just Energy will:
| • | Target sales growth through all channels. The Company is on track to be present in 500 stores by the fiscal year end, working with its retail partners, including Sam’s Club. With the success realized through our retail channel expansion efforts, the Company will focus on joint marketing partnerships and authorized agent programs to drive brand awareness and new customer growth. The business development efforts in retail will be shifted towards multinationals in footprint, allowing those efforts to be amortized over multiple countries in the portfolio. As part of Just Energy’s digital transformation, the Company revamped its website and completed its transition to its new digital partner while maintaining the expected new acquisitions. |
| 33. |
| • | Focus on sustainable cost reduction through continuous productivity enhancing and cost efficiency initiatives that were under way in the third fiscal quarter. Continued benefits will be realized in the fourth fiscal quarter and subsequent years. |
| • | Invest in international expansion by replicating its U.K. success in other markets. Just Energy fully launched its operations in Ireland, Japan and Germany. Supported by the U.K.’s leadership team, supplier relationships and market approximation, Ireland will grow at a faster pace. International expansion will continue to be the key driver for future growth of the Company and therefore significant investments will be made to seed more international operations. |
In addition, management is actively engaged in and expects to complete the refinancing of its 2018 maturing debts in the near term.
The Company remains committed to its current dividend policy.
34.