Exhibit 1.2
Management’s discussion and analysis
(“MD&A”) – May 18, 2016
Overview
The following discussion and analysis is a review of the financial condition and results of operations of Just Energy Group Inc. (“JE” or “Just Energy” or the “Company”) for the year ended March 31, 2016 and has been prepared with all information available up to and including May 18, 2016. This analysis should be read in conjunction with the audited consolidated financial statements of the Company for the year ended March 31, 2016. The financial information contained herein has been prepared in accordance with International Financial Reporting Standards (“IFRS”), as issued by the International Accounting Standards Board (“IASB”). All dollar amounts are expressed in Canadian dollars. Quarterly reports, the annual report and supplementary information can be found on Just Energy’s corporate website at www.justenergygroup.com. Additional information can be found on SEDAR at www.sedar.com or on the U.S. Securities and Exchange Commission’s website at www.sec.gov.
Just Energy is a corporation established under the laws of Canada and holds securities and distributes the income of its directly and indirectly owned operating subsidiaries and affiliates. Just Energy is an energy management solutions provider specializing in electricity, natural gas, and solar and green energy. The Company operates in the United States, Canada and the United Kingdom, offering a wide range of energy products and home energy management services including long-term fixed-price, variable-price and flat-bill programs, smart thermostats, and residential solar panel installations. Just Energy is the parent company of Amigo Energy, Commerce Energy, Green Star Energy, Hudson Energy, Just Energy Solar, Tara Energy and TerraPass.
By fixing the price of natural gas and electricity under its fixed-price or price-protected program contracts for a period of up to five years, Just Energy offsets its customers’ exposure to changes in the price of these essential commodities. Variable rate products allow customers to maintain competitive rates while retaining the ability to lock into a fixed price at their discretion. Just Energy derives its margin or gross profit from the difference between the price at which it is able to sell the commodities to its customers and the related price at which it purchases the associated volumes from its suppliers. Flat-bill programs keep monthly natural gas and/or electricity supply costs consistent each month for customers for a term of up to five years based on a maximum annual household usage.
Just Energy also offers green products through its JustGreen program and conservation solutions through smart thermostats. The JustGreen electricity product offers customers the option of having all or a portion of their electricity sourced from renewable green sources such as wind, run of the river hydro or biomass. The JustGreen gas product offers carbon offset credits that allow customers to reduce or eliminate the carbon footprint of their homes or businesses. Additional green products allow customers to offset their carbon footprint without buying energy commodity products and can be offered in all states and provinces without being dependent on energy deregulation.
Smart thermostats are offered as a bundled product with commodity contracts as well as a stand-alone unit. The smart thermostats are manufactured and distributed by ecobee Inc. (“ecobee”), a company in which Just Energy holds a 10% equity interest.
Just Energy markets its product offerings through a number of sales channels including broker and affinity relationships, door-to-door marketing and online marketing. The online marketing of gas and electricity contracts is primarily conducted through Just Ventures LLC and Just Ventures L.P. (collectively, “Just Ventures”), a joint venture in which Just Energy holds a 50% equity interest.
Just Energy began selling residential solar finance products through its partnership with Spruce Finance Inc. (“Spruce”), formerly Clean Power Finance. Under the agreement, Just Energy acts as an originator of residential solar deals that are financed and installed via Spruce. Just Energy is also able to sell complementary energy management solutions to solar customers.
Forward-looking information
This MD&A contains certain forward-looking information pertaining to customer additions and renewals, customer consumption levels, EBITDA, Base EBITDA, Funds from Operations, Base Funds from Operations and treatment under governmental regulatory regimes. These statements are based on current expectations that involve a number of risks and uncertainties, which could cause actual results to differ from those anticipated. These risks include, but are not limited to, levels of customer natural gas and electricity consumption, extreme weather conditions, rates of customer additions and renewals, customer attrition, fluctuations in natural gas and electricity prices, changes in regulatory regimes, decisions by regulatory authorities, competition, the results of litigation, and dependence on certain suppliers. Additional information on these and other factors that could affect Just Energy’s operations, financial results or dividend levels is included in the Annual Information Form and other reports on file with security regulatory authorities, which can be accessed on our corporate website at www.justenergygroup.com, or through the SEDAR website at www.sedar.com or at the U.S. Securities and Exchange Commission’s website at www.sec.gov.
Key terms
“$100m convertible debentures” refers to the $100 million in convertible debentures issued by the Company to finance the purchase of Fulcrum Retail Holdings, LLC, effective October 1, 2011. See “Debt and financing for continuing operations” on page 26 for further details.
“$330m convertible debentures” refers to the $330 million in convertible debentures issued by Just Energy to finance the purchase of Hudson Energy Services, LLC, effective May 1, 2010. See “Debt and financing for continuing operations” on page 26 for further details.
“$150m convertible bonds” refers to the US$150 million in convertible bonds issued in January 2014. Net proceeds were used to redeem Just Energy’s outstanding $90 million convertible debentures on March 19, 2014 and pay down Just Energy’s line of credit. See “Debt and financing for continuing operations” on page 26 for further details.
“attrition” means customers whose contracts were terminated prior to the end of the term either at the option of the customer or by Just Energy.
“customer” does not refer to an individual customer but instead to an RCE (see key term below).
“failed to renew” means customers who did not renew expiring contracts at the end of their term.
“gross margin per RCE” refers to the energy gross margin realized on Just Energy’s customer base, including gains/losses from the sale of excess commodity supply.
“LDC” means a local distribution company; the natural gas or electricity distributor for a regulatory or governmentally defined geographic area.
“RCE” means residential customer equivalent, which is a unit of measurement equivalent to a customer using, as regards natural gas, 2,815 m3 (or 106 GJs or 1,000 Therms or 1,025 CCFs) of natural gas on an annual basis and, as regards electricity, 10 MWh (or 10,000 kWh) of electricity on an annual basis, which represents the approximate amount of gas and electricity, respectively, used by a typical household in Ontario, Canada.
NON-IFRS FINANCIAL MEASURES
Just Energy’s consolidated financial statements are prepared in compliance with IFRS. All non-IFRS financial measures do not have standardized meanings prescribed by IFRS and are therefore unlikely to be comparable to similar measures presented by other issuers.
EBITDA
“EBITDA” refers to earnings before finance costs, taxes, depreciation and amortization. This is a non-IFRS measure that reflects the operational profitability of the business.
BASE EBITDA
“Base EBITDA” refers to EBITDA adjusted to exclude the impact of mark to market gains (losses) arising from IFRS requirements for derivative financial instruments on future supply positions as well as reflecting an adjustment for share-based compensation. This measure reflects operational profitability as the non-cash share-based compensation expense is treated as an equity issuance for the purpose of this calculation, as it will be settled in shares and the mark to market gains (losses) are associated with supply already sold in the future at fixed prices.
Just Energy ensures that customer margins are protected by entering into fixed-price supply contracts. Under current IFRS, the customer contracts are not marked to market but there is a requirement to mark to market the future supply contracts. This creates unrealized gains (losses) depending upon current supply pricing. Management believes that these short-term mark to market non-cash gains (losses) do not impact the long-term financial performance of Just Energy and management has therefore excluded them from the Base EBITDA calculation.
FUNDS FROM OPERATIONS
“Funds from Operations” refers to the cash flow generated by operations. Funds from Operations is calculated by Just Energy as gross margin adjusted for cash items including administrative expenses, selling and marketing expenses, bad debt expenses, finance costs, corporate taxes, capital taxes and other cash items. Funds from Operations also includes a seasonal adjustment for the gas markets in Ontario, Quebec, Manitoba and Michigan in order to include cash received from LDCs for gas not yet consumed by end customers.
BASE FUNDS FROM OPERATIONS/BASE FFO
“Base Funds from Operations” or “Base FFO” refers to the Funds from Operations reduced by capital expenditures purchased to maintain productive capacity. Capital expenditures to maintain productive capacity represent the capital spend relating to capital and intangible assets.
BASE FUNDS FROM OPERATIONS PAYOUT RATIO
The payout ratio for Base Funds from Operations means dividends declared and paid as a percentage of Base Funds from Operations.
EMBEDDED GROSS MARGIN
“Embedded gross margin” is a rolling five-year measure of management’s estimate of future contracted energy gross margin. The energy marketing embedded gross margin is the difference between existing energy customer contract prices and the cost of supply for the remainder of the term, with appropriate assumptions for customer attrition and renewals. It is assumed that expiring contracts will be renewed at target margin renewal rates.
Embedded gross margin indicates the margin expected to be realized from existing customers. It is intended only as a directional measure for future gross margin. It is not discounted to present value nor is it intended to take into account administrative and other costs necessary to realize this margin.
Financial highlights
For the years ended March 31
(thousands of dollars, except where indicated and per share amounts)
| | | Fiscal 2016 | | | % increase (decrease) | | | Fiscal 2015 | | | % increase (decrease) | | | Fiscal 2014 | |
| Sales | | $ | 4,105,860 | | | | 5% | | | $ | 3,895,940 | | | | 10% | | | $ | 3,534,614 | |
| Gross margin | | | 702,288 | | | | 17% | | | | 600,069 | | | | 19% | | | | 505,531 | |
| Administrative expenses | | | 170,330 | | | | 10% | | | | 154,222 | | | | 32% | | | | 116,713 | |
| Selling and marketing expenses | | | 257,349 | | | | 14% | | | | 225,243 | | | | 19% | | | | 189,890 | |
| Finance costs | | | 72,540 | | | | (2)% | | | | 73,680 | | | | 6% | | | | 69,441 | |
Profit (loss) from continuing operations1 | | | 82,494 | | | NMF3 | | | | (576,377 | ) | | NMF 3 | | | | 170,566 | |
| Profit (loss) from discontinued operations | | | - | | | NMF3 | | | | 132,673 | | | NMF 3 | | | | (33,625 | ) |
Profit (loss)1 | | | 82,494 | | | NMF3 | | | | (443,704 | ) | | NMF 3 | | | | 136,941 | |
| Profit (loss) per share from continuing operations available to shareholders - basic | | | 0.44 | | | | | | | | (4.01 | ) | | | | | | | 1.15 | |
| Profit (loss) per share from continuing operations available to shareholders -diluted | | | 0.43 | | | | | | | | (4.01 | ) | | | | | | | 1.11 | |
| Dividends/distributions | | | 74,792 | | | | (14)% | | | | 86,723 | | | | (30)% | | | | 123,429 | |
Base EBITDA2 | | | 207,629 | | | | 15% | | | | 180,426 | | | | 8% | | | | 167,663 | |
Base Funds from Operations2 | | | 138,199 | | | | 49% | | | | 92,472 | | | | 4% | | | | 88,577 | |
Payout ratio on Base Funds from Operations2 | | | 54% | | | | | | | | 94% | | | | | | | | 139% | |
Embedded gross margin2 | | | 1,917,600 | | | | 2% | | | | 1,874,900 | | | | 9% | | | | 1,718,900 | |
| Total customers (RCEs) | | | 4,520,000 | | | | (4)% | | | | 4,686,000 | | | | 6% | | | | 4,410,000 | |
1Profit (loss) includes the impact of unrealized gains (losses), which represents the mark to market of future commodity supply acquired to cover future customer demand. The supply has been sold to customers at fixed prices, minimizing any realizable impact of mark to market gains and losses.
2See “Non-IFRS financial measures” on page 2.
3Not a meaningful figure.
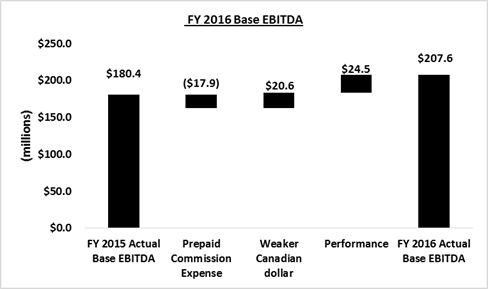
Just Energy delivered another year of strong operating and financial performance with sales of $4,105.9 million, 5% higher than the prior comparable year; gross margin of $702.3 million, 17% higher than the prior comparable year; and Base EBITDA of $207.6 million, 15% better than fiscal 2015. The Company’s reported Base EBITDA in fiscal 2016 includes $17.9 million of prepaid commission expense, reflecting the change in classification of prepaid commissions as a current asset effective fiscal 2016. Excluding this additional expense item, Base EBITDA increased by 25% to $225.5 million in comparison to fiscal 2015. Of this $45.1 million year over year improvement in Base EBITDA, $20.6 million was due to the foreign currency impact and $24.5 million was driven by operational performance improvements. Base FFO was $138.2 million, up 49%, compared to $92.5 million in fiscal 2015. The Company’s financial highlights for the year ended March 31, 2016 are shown on the next page.
Continuing operations
CONSUMER DIVISION
The sale of gas and electricity to customers with annual consumption equivalent to 15 RCEs and less is undertaken by the Consumer division. Marketing of the energy products of this division is primarily done through online marketing, door-to-door marketing and telemarketing efforts. Consumer customers make up 42% of Just Energy’s customer base, which is currently focused on longer-term price-protected, flat-bill and variable rate offerings of commodity products as well as JustGreen. To the extent that certain markets are better served by shorter-term or enhanced variable rate products, the Consumer division’s sales channels also offer these products. In addition, the Consumer division markets smart thermostats, offering the thermostats as a stand-alone unit or bundled with certain commodity products.
COMMERCIAL DIVISION
Customers with annual consumption equivalent to over 15 RCEs are served by the Commercial division. These sales are made through three main channels: sales through the broker channel using the commercial platform; door-to-door commercial independent contractors; and inside commercial sales representatives. Commercial customers make up 58% of Just Energy’s customer base. Products offered to Commercial customers can range from standard fixed-price offerings to “one off” offerings, which are tailored to meet the customer’s specific needs. These products can be either fixed or floating rate or a blend of the two, and normally have terms of less than five years. Gross margin per RCE for this division is lower than Consumer margins but customer aggregation costs and ongoing customer care costs per RCE are lower as well. Commercial customers have significantly lower attrition rates than those of Consumer customers.
RESIDENTIAL SOLAR DIVISION
Just Energy has entered into a partnership with Spruce (formerly Clean Power Finance) where Just Energy acts as an originator of residential solar deals that are financed and installed by Spruce. This agreement unites Just Energy’s strengths in customer acquisitions and experience with Spruce’s solar finance and fulfillment capabilities. Spruce’s online platform allows Just Energy to sell residential solar finance products and connects the Company with a national network of qualified solar installation professionals. Under the agreement, Just Energy acts as an originator of residential solar deals that are financed and installed via Spruce. Just Energy is also able to sell complementary energy management solutions to solar customers.
Just Energy began marketing solar energy solutions in California and New York in fiscal 2016 with the results of operations included in the Consumer division.
ABOUT THE ENERGY MARKETS
NATURAL GAS
Just Energy offers natural gas customers a variety of products ranging from month-to-month variable-price offerings to five-year fixed-price contracts. Just Energy purchases gas supply through physical or financial transactions with market counterparts in advance of marketing, based on forecast customer aggregation for residential and small Commercial customers. For larger Commercial customers, gas supply is generally purchased concurrently with the execution of a contract. Variable rate products allow customers to maintain competitive rates while retaining the ability to lock into a fixed price at their discretion. Flat-bill products allow predictability by removing the price and the volume risk from customers’ bills and guaranteeing the same price every month for their energy supply.
The LDC provides historical customer usage which, when normalized to average weather, enables Just Energy to purchase the expected normal customer load. Furthermore, Just Energy mitigates exposure to weather variations through active management of the gas portfolio, which involves, but is not limited to, the purchase of options including weather derivatives. Just Energy’s ability to successfully mitigate weather effects is limited by the degree to which weather conditions deviate from normal. To the extent that balancing requirements are outside the forecast purchase, Just Energy bears the financial responsibility for fluctuations in customer usage. To the extent that supply balancing is not fully covered through active management or the options employed, Just Energy’s realized customer gross margin may be reduced or increased depending upon market conditions at the time of balancing.
Ontario, Quebec, Manitoba and Michigan
In Ontario, Quebec, Manitoba and Michigan, the volumes delivered for a customer typically remain constant throughout the year. Just Energy does not recognize sales until the customer actually consumes the gas. During the winter months, gas is consumed at a rate that is greater than delivery and, in the summer months, deliveries to LDCs exceed customer consumption. Just Energy receives cash from the LDCs as the gas is delivered, which is even throughout the year.
Alberta and British Columbia
In Alberta and British Columbia, the volume of gas delivered is based on the estimated consumption for each month. Therefore, the amount of gas delivered in winter months is higher than in the spring and summer months. Consequently, cash received from customers and the LDC will be higher in the winter months.
Other gas markets
In New York, Illinois, Indiana, Ohio, California, Georgia, New Jersey, Pennsylvania, Saskatchewan and the United Kingdom, the volume of gas delivered is based on the estimated consumption and storage requirements for each month. Therefore, the amount of gas delivered in winter months is higher than in the spring and summer months. Consequently, cash flow received from these states/provinces is greatest during the third and fourth (winter) quarters, as cash is normally received from the LDCs in the same period as customer consumption.
ELECTRICITY
In Ontario, Alberta, New York, Texas, Illinois, Pennsylvania, New Jersey, Maryland, Michigan, California, Ohio, Delaware, Massachusetts and the United Kingdom, Just Energy offers a variety of solutions to its electricity customers, including fixed-price, flat-bill and variable-price products on both short-term and longer-term electricity contracts. Some of these products provide customers with price-protection programs for the majority of their electricity requirements. Just Energy uses historical usage data for all enrolled customers to predict future customer consumption and to help with long-term supply procurement decisions. The flat-bill product provides price and volume protection by guaranteeing the same price every month regardless of price fluctuations or changes in usage.
Just Energy purchases power supply through physical or financial transactions with market counterparties in advance of marketing to residential and small Commercial customers based on
forecast customer aggregation. Power supply is generally purchased concurrently with the execution of a contract for larger Commercial customers. The LDC provides historical customer usage, which, when normalized to average weather, enables Just Energy to purchase the expected normal customer load. Furthermore, Just Energy mitigates exposure to weather variations through active management of the power portfolio, which involves, but is not limited to, the purchase of options including weather derivatives.
The Company’s ability to successfully mitigate weather effects is limited by the degree to which weather conditions deviate from normal. In certain markets, to the extent that balancing requirements are outside the forecast purchase, Just Energy bears the financial responsibility for excess or short supply caused by fluctuations in customer usage. To the extent that supply balancing is not fully covered through customer pass-throughs or active management or the options employed, Just Energy’s customer gross margin may be impacted depending upon market conditions at the time of balancing.
JUSTGREEN
Customers also have the ability to choose an appropriate JustGreen program to supplement their electricity and natural gas contracts, providing an effective method to offset their carbon footprint associated with the respective commodity consumption.
JustGreen programs for electricity customers involve the purchase of power from green generators (such as wind, solar, run of the river hydro or biomass) via power purchase agreements and renewable energy certificates. JustGreen programs for gas customers involve the purchase of carbon offsets from carbon capture and reduction projects.
The Company currently sells JustGreen gas in the eligible markets of Ontario, British Columbia, Alberta, Saskatchewan, Michigan, New York, Ohio, Illinois, New Jersey, Maryland, Pennsylvania and California. JustGreen electricity is sold in Ontario, Alberta, New York, Texas, Maryland, Massachusetts, Ohio, Illinois and Pennsylvania. Of all Consumer customers who contracted with Just Energy in the past year, 34% took JustGreen for some or all of their energy needs. On average, these customers elected to purchase 91% of their consumption as green supply. For comparison, as reported in the year ended March 31, 2015, 31% of Consumer customers who contracted with Just Energy chose to include JustGreen for an average of 89% of their consumption. As of March 31, 2016, JustGreen now makes up 12% of the Consumer gas portfolio, the same as a year ago. JustGreen makes up 21% of the Consumer electricity portfolio compared to 20% a year ago.
EBITDA
For the years ended March 31
(thousands of dollars)
| | | Fiscal 2016 | | | Fiscal 2015 | | | Fiscal 2014 | |
| Reconciliation to consolidated statements of income (loss) | | | | | | | | | |
| Profit (loss) for the period from continuing operations | | $ | 82,494 | | | $ | (576,377 | ) | | $ | 170,566 | |
| Add (subtract): | | | | | | | | | | | | |
| Finance costs | | | 72,540 | | | | 73,680 | | | | 69,441 | |
| Provision for (recovery of) income taxes | | | (318 | ) | | | (28,889 | ) | | | 48,190 | |
| Amortization | | | 42,652 | | | | 76,040 | | | | 69,469 | |
| EBITDA | | $ | 197,368 | | | $ | (455,546 | ) | | $ | 357,666 | |
| Add (subtract): | | | | | | | | | | | | |
| Change in fair value of derivative instruments | | | 22,803 | | | | 635,204 | | | | (186,142 | ) |
| Share-based compensation | | | 5,348 | | | | 7,120 | | | | 1,598 | |
| Profit attributable to non-controlling interest | | | (17,890 | ) | | | (6,352 | ) | | | (5,459 | ) |
| Base EBITDA | | $ | 207,629 | | | $ | 180,426 | | | $ | 167,663 | |
| EBITDA | | | | | | | | | | | | |
| Gross margin per consolidated financial statements | | $ | 702,288 | | | $ | 600,069 | | | $ | 505,531 | |
| Add (subtract): | | | | | | | | | | | | |
| Administrative expenses | | | (170,330 | ) | | | (154,222 | ) | | | (116,713 | ) |
| Selling and marketing expenses | | | (257,349 | ) | | | (225,243 | ) | | | (189,890 | ) |
| Bad debt expense | | | (68,531 | ) | | | (62,077 | ) | | | (46,051 | ) |
| Amortization included in cost of sales/selling and marketing expenses | | | 21,983 | | | | 30,647 | | | | 17,324 | |
| Other income (expenses) | | | (2,542 | ) | | | (2,396 | ) | | | 2,921 | |
| Profit attributable to non-controlling interest | | | (17,890 | ) | | | (6,352 | ) | | | (5,459 | ) |
| Base EBITDA | | $ | 207,629 | | | $ | 180,426 | | | $ | 167,663 | |
Base EBITDA amounted to $207.6 million for the year ended March 31, 2016, an increase of 15% from $180.4 million in the prior year. Management had provided guidance of $193.0 million to $203.0 million of Base EBITDA for fiscal 2016. The result for fiscal 2016 includes the absorption of $17.9 million in additional deductions related to Commercial customer acquisition costs in fiscal 2016. The exclusion of these additional expenses would have resulted in Base EBITDA growth of 25% for the year ended March 31, 2016 as a result of operational improvements and the benefit from the currency translation of the U.S. operations’ financial results.
For the year ended March 31, 2016, sales increased by 5%, reflecting higher selling prices for the U.S. markets after currency conversion to Canadian dollars. Gross margin was up 17% as a result of higher realized margin per customer in fiscal 2016 due to more disciplined pricing performance and the positive foreign exchange impact on gross margin earned in U.S. markets. Gross margin increased by $68.3 million over the prior year as a result of the weaker Canadian dollar with the remaining $33.9 million of additional gross margin resulting from operational improvements.
Administrative expenses for the year ended March 31, 2016 increased by 10% from $154.2 million to $170.3 million. The increase over the prior comparable year included higher costs required to support customer growth in the U.K. as well as the impact from the exchange rate on the U.S. dollar denominated administrative costs.
Selling and marketing expenses for the year ended March 31, 2016 were $257.3 million, a 14% increase from $225.2 million reported in the prior year. The increase in selling and marketing expenses is due to the impact of foreign exchange on the U.S.-based commission and overhead expenses, the start-up costs associated with the Residential Solar division, as well as the expenses becoming more directly correlated to the growing portion of the customer base for which selling costs are recorded over the life of the contract (commercial brokers and online sales channels).
Effective fiscal 2016, newly capitalized commissions will be classified as a current asset (prepaid expense) instead of a non-current asset (contract initiation costs). This change is a result of management’s effort to reduce the average term of capitalized commission to 12 months going forward which will reduce the outlay of cash at the time of contract signing. As the capitalized commission is expensed into selling and marketing costs over the term for which the associated revenue is earned, it will no longer be recognized as amortization and will therefore be included in the Base EBITDA calculation. For the year ended March 31, 2016, the commission expense recorded related to this change was $17.9 million.
Fiscal 2017 guidance includes deductions to Base EBITDA of approximately $40 million for prepaid commercial commissions, which would previously have been included as amortization within selling and marketing expenses. This represents a $22 million increase in this expense over fiscal 2016 and a go forward run rate for this incremental deduction in future years. Just Energy expects to offset this headwind with continued strong gross margin performance, U.K. growth and Just Solar contributions.
Bad debt expense was $68.5 million for the year ended March 31, 2016, an increase of 10% from $62.1 million recorded for fiscal 2015, resulting from higher revenue in markets for which there is a credit risk as well as the impact of the U.S. exchange rate. For the year ended March 31, 2016, the bad debt expense of $68.5 million represents approximately 2.3% of revenue in the jurisdictions where the Company bears the credit risk, compared with 2.4% in fiscal 2015, both of which are well within management’s targeted range of 2% to 3%.
For more information on the changes in the results from operations, please refer to “Gross margin” on page 19 and “Administrative expenses”, “Selling and marketing expenses”, “Bad debt expense” and “Finance costs”, which are further clarified on pages 19 through 22.
For comparative purposes, the table includes the results for the year ended March 31, 2015 and 2014. For the year ended March 31, 2015, gross margin was $600.1 million for the year, an increase of 19% over $505.5 million reported in fiscal 2014, primarily due to an increased in the customer base and higher realized margins per customer compared with fiscal 2014. In fiscal 2015, administrative, selling and marketing and bad debt expenses amounted to $154.2 million, $225.2 million and $62.1 million, respectively, an increase of 32%, 19% and 35%, respectively. For fiscal 2015, Base EBITDA from continuing operations amounted to $180.4 million, an increase of 8% from $167.7 million in fiscal 2014, reflecting higher gross margin and operating economies of scale within the Company’s cost structure.
EMBEDDED GROSS MARGIN
Management's estimate of the future embedded gross margin is as follows:
(millions of dollars)
| | | Fiscal 2016 | | | Fiscal 2015 | | | 2016 vs. 2015 variance | | | Fiscal 2014 | | | 2015 vs. 2014 variance | |
| Energy marketing | | $ | 1,917.6 | | | $ | 1,874.9 | | | | 2% | | | $ | 1,718.9 | | | | 9% | |
Management’s estimate of the future embedded gross margin within its customer contracts amounted to $1,917.6 million as of March 31, 2016, an increase of 2% compared to embedded gross margin as of March 31, 2015. Higher margins earned on the customers signed in the current fiscal year as well as the foreign currency impact contributed to the growth year over year.
Embedded gross margin indicates the margin expected to be realized over the next five years from existing customers. It is intended only as a directional measure for future gross margin. It is not discounted to present value nor is it intended to take into account administrative and other costs necessary to realize this margin. As our mix of customers continues to reflect a higher proportion of Commercial volume, the embedded gross margin may, depending on currency rates, grow at a slower pace than customer growth; however, the underlying costs necessary to realize this margin will also decline.
In fiscal 2015, embedded gross margin increased by 9% to $1,874.9 million. The embedded gross margin for Energy marketing increased 9% due to a higher number of customers and the strengthening of the U.S dollar against the Canadian dollar during the year.
Funds from Operations
For the years ended March 31
(thousands of dollars)
| | | Fiscal 2016 | | | Fiscal 2015 | | | Fiscal 2014 | |
| Cash inflow from operations | | $ | 187,106 | | | $ | 96,212 | | | $ | 165,398 | |
| Add (subtract): | | | | | | | | | | | | |
| Changes in non-cash working capital | | | (18,710 | ) | | | 44,458 | | | | (45,765 | ) |
| Cash flows used in operating activities of discontinued operations | | | - | | | | (20,902 | ) | | | (6,652 | ) |
| Losses attributable to non-controlling interest | | | (17,890 | ) | | | (6,352 | ) | | | (5,459 | ) |
| Tax adjustment | | | 708 | | | | (2,845 | ) | | | (4,815 | ) |
| Funds from Operations | | $ | 151,214 | | | $ | 110,571 | | | $ | 102,707 | |
| Less: Maintenance capital expenditures | | | (13,015 | ) | | | (18,099 | ) | | | (14,130 | ) |
| Base Funds from Operations | | $ | 138,199 | | | $ | 92,472 | | | $ | 88,577 | |
| | | | | | | | | | | | | |
| Base Funds from operations | | | | | | | | | | | | |
| Gross margin from consolidated financial statements | | $ | 702,288 | | | $ | 600,069 | | | | 505,531 | |
| Add (subtract): | | | | | | | | | | | | |
| Adjustment required to reflect net cash receipts from gas sales | | | 14,895 | | | | (2,698 | ) | | | (6,186 | ) |
| Administrative expenses | | | (170,330 | ) | | | (154,222 | ) | | | (116,713 | ) |
| Selling and marketing expenses | | | (257,349 | ) | | | (225,243 | ) | | | (189,890 | ) |
| Bad debt expense | | | (68,531 | ) | | | (62,077 | ) | | | (46,051 | ) |
| Current income tax provision | | | (13,890 | ) | | | (8,859 | ) | | | (3,358 | ) |
| Amortization included in cost of sales/selling and marketing expenses | | | 21,983 | | | | 30,647 | | | | 17,324 | |
| Other income (expenses) | | | (2,542 | ) | | | (2,396 | ) | | | 2,921 | |
| Financing charges, non-cash | | | 15,471 | | | | 15,609 | | | | 14,271 | |
| Finance costs | | | (72,540 | ) | | | (73,680 | ) | | | (69,441 | ) |
| Other non-cash adjustments | | | (18,241 | ) | | | (6,579 | ) | | | (5,701 | ) |
| Funds from Operations | | $ | 151,214 | | | $ | 110,571 | | | $ | 102,707 | |
| Less: Maintenance capital expenditures | | | (13,015 | ) | | | (18,099 | ) | | | (14,130 | ) |
| Base Funds from Operations | | $ | 138,199 | | | $ | 92,472 | | | $ | 88,577 | |
| Base Funds from Operations payout ratio | | | 54% | | | | 94% | | | | 139% | |
| Dividends/distributions | | | | | | | | | | | | |
| Dividends | | $ | 73,449 | | | $ | 84,945 | | | $ | 120,142 | |
| Distributions for share-based awards | | | 1,343 | | | | 1,778 | | | | 3,287 | |
| Total dividends/distributions | | $ | 74,792 | | | $ | 86,723 | | | $ | 123,429 | |
Base Funds from continuing operations (“Base FFO”) for the year ended March 31, 2016 were $138.2 million, an increase of 49% compared with Base FFO of $92.5 million for the year ended March 31, 2015. The increase in Base FFO was higher than the increase in Base EBITDA due to the adjustment required reflecting net cash receipts from gas sales being greater than the prior year as a result of the lower consumption resulting from the warmer winter weather in the current year.
Dividends and distributions for the year ended March 31, 2016 were $74.8 million, a decrease of 14% from the prior fiscal year as a result of a reduction in the annual dividend from $0.84 to $0.50 effective
with the July 2014 dividend. The payout ratio on Base Funds from continuing operations was 54% for the year ended March 31, 2016, compared to 94% reported in fiscal 2015 resulting from higher free cash flow and lower dividends year over year. The payout ratio of 54% represents the lowest annual payout ratio since the Company’s inception.
Selected consolidated financial data from continuing operations
The results from operations have been reclassified for fiscal 2014 to present Hudson Energy Solar Corp. (“HES”) and National Homes Services (“NHS”) as discontinued operations as they were available for sale and sold in fiscal 2015.
For the years ended March 31
(thousands of dollars, except per share amount)
| Statements of operations | | Fiscal 2016 | | | Fiscal 2015 | | | Fiscal 2014 | |
| Sales | | $ | 4,105,860 | | | $ | 3,895,940 | | | $ | 3,534,614 | |
| Gross margin | | | 702,288 | | | | 600,069 | | | | 505,531 | |
| Profit (loss) from continuing operations | | | 82,494 | | | | (576,377 | ) | | | 170,566 | |
| Profit (loss) from continuing operations per share - basic | | | 0.44 | | | | (4.01 | ) | | | 1.15 | |
| Profit (loss) from continuing operations per share - diluted | | | 0.43 | | | | (4.01 | ) | | | 1.11 | |
| | | | | | | | | | | | | |
| Balance sheet data | | | | | | | | | | | | |
| As at March 31 | | | | | | | | | | | | |
| | | Fiscal 2016 | | | Fiscal 2015 | | | Fiscal 2014 | |
| Total assets | | $ | 1,247,435 | | | $ | 1,298,441 | | | $ | 1,642,650 | |
| Long-term liabilities | | | 954,672 | | | | 981,962 | | | | 1,023,832 | |
2016 COMPARED WITH 2015
Sales increased by 5% to $4,105.9 million in fiscal 2016, compared with $3,895.9 million in the prior fiscal year. The increase is primarily a result of the currency impact of converting U.S. dollar denominated sales into Canadian dollars.
For the year ended March 31, 2016, gross margin increased by 17% to $702.3 million from $600.1 million reported in fiscal 2015 as a result of higher realized margin per customer in fiscal 2016 due to more disciplined pricing performance and the positive foreign exchange impact on gross margin earned in U.S. markets. Gross margin increased by $68.3 million over the prior year as a result of the weaker Canadian dollar with the remaining $33.9 million of additional gross margin resulting from operational improvements. Gross margin for the Consumer division increased to $538.6 million, up 20%, while gross margin for the Commercial division increased by 9% to $163.6 million.
The profit from continuing operations for fiscal 2016 amounted to $82.5 million, compared to a loss of $576.4 million in fiscal 2015. The profit from continuing operations increased as a result of stronger operational results in fiscal 2016. The increase year over year is further attributable to the change in fair value of the derivative instruments on the Company’s supply portfolio, which resulted in a loss of $22.8 million in fiscal 2016 compared with a loss of $635.2 million in fiscal 2015. Under IFRS, there is a requirement to mark to market the future supply contracts, creating unrealized non-cash gains or losses depending on the supply pricing but the related future customer revenues are not marked to market (which would create an offsetting gain or loss to the supply gain or loss). Just Energy views Base EBITDA and FFO as the better measures of operating performance.
Total assets decreased by 4% to $1,247.4 million in fiscal 2016. Total long-term liabilities as of March 31, 2016 were $954.7 million, representing a 3% decrease over fiscal 2015. The decrease in total long-term
liabilities is primarily a result of the use of cash flow to reduce long-term debt with $7.0 million of convertible debentures purchased and retired in fiscal 2016 along with the repayment of $25.0 million of senior unsecured notes, both of which were partially offset by the growth in valuation of the Eurobond due to the weakening of the Canadian currency.
2015 COMPARED WITH 2014
Sales increased by 10% to $3,895.9 million in fiscal 2015, compared with $3,534.6 million in the prior fiscal year. The sales increase is a result of the 6% increase in the customer base and a strengthening of the U.S. dollar against the Canadian dollar.
For the year ended March 31, 2015, gross margin increased by 19% to $600.1 million from $505.5 million reported in fiscal 2014. Gross margin for the Consumer Energy division increased $450.2 million, up 21%, while gross margin for the Commercial Energy division increased by 13% to $149.8 million. The overall increase in margin is driven by a 6% increase in the customer base, higher currency exchange related impact on related margins for U.S. customers and comparison against the price spikes resulting from extreme winter weather in fiscal 2014.
The loss from continuing operations for fiscal 2015 amounted to $576.4 million, compared to a profit of $170.6 million in fiscal 2014. The loss from continuing operations is attributable to the change in fair value of the derivative instruments in the Company’s supply portfolio, which showed a loss of $635.2 million in fiscal 2015, versus a gain of $186.1 million in fiscal 2014. Under IFRS, there is a requirement to mark to market the future supply contracts, creating unrealized non-cash gains or losses depending on the supply pricing but the related future customer revenues are not marked to market (which would create an offsetting gain or loss to the supply gain or loss). Just Energy views Base EBITDA and FFO as the better measures of operating performance.
Total assets decreased by 21% to $1,298.4 million in fiscal 2015. The decrease in total assets is a result of sales of the Home Services and Commercial Solar divisions in November 2015, which resulted in a decrease in total assets of approximately $401.8 million.
Total long-term liabilities as of March 31, 2015 were $982.0 million representing a 4% decrease over fiscal 2014. The decrease in total long-term liabilities is primarily a result of the sale of the Home Services division and the use of its proceeds from sale to reduce long-term debt.
Summary of quarterly results for continuing operations
(thousands of dollars, except per share amounts)
| | | | Q4 | | | | Q3 | | | | Q2 | | | | Q1 | |
| | | Fiscal 2016 | | | Fiscal 2016 | | | Fiscal 2016 | | | Fiscal 2016 | |
| Sales | | $ | 1,075,880 | | | $ | 1,009,709 | | | $ | 1,087,256 | | | $ | 933,015 | |
| Gross margin | | | 204,289 | | | | 179,937 | | | | 167,155 | | | | 150,907 | |
| Administrative expenses | | | 49,504 | | | | 42,934 | | | | 40,294 | | | | 37,598 | |
| Selling and marketing expenses | | | 62,259 | | | | 67,061 | | | | 65,248 | | | | 62,781 | |
| Finance costs | | | 20,312 | | | | 17,731 | | | | 17,641 | | | | 16,856 | |
| Profit (loss) for the period from continuing operations | | | 30,893 | | | | 10,188 | | | | (88,258 | ) | | | 129,671 | |
| Profit (loss) for the period | | | 30,893 | | | | 10,188 | | | | (88,258 | ) | | | 129,671 | |
| Profit (loss) for the period from continuing operations per share – basic | | | 0.16 | | | | 0.04 | | | | (0.62 | ) | | | 0.87 | |
| Profit (loss) for the period from continuing operations per share – diluted | | | 0.14 | | | | 0.04 | | | | (0.62 | ) | | | 0.71 | |
| Dividends/distributions paid | | | 18,730 | | | | 18,662 | | | | 18,701 | | | | 18,699 | |
| Base EBITDA | | | 67,345 | | | | 55,724 | | | | 45,685 | | | | 38,875 | |
| Base Funds from Operations | | | 43,822 | | | | 26,783 | | | | 37,775 | | | | 29,819 | |
| Payout ratio on Base Funds from Operations | | | 43% | | | | 70% | | | | 50% | | | | 63% | |
| | | | | | | | | | | | | | | | | |
| | | | Q4 | | | | Q3 | | | | Q2 | | | | Q1 | |
| | | Fiscal 2015 | | | Fiscal 2015 | | | Fiscal 2015 | | | Fiscal 2015 | |
| Sales | | $ | 1,209,879 | | | $ | 946,752 | | | $ | 918,260 | | | $ | 821,049 | |
| Gross margin | | | 194,066 | | | | 150,098 | | | | 132,515 | | | | 123,390 | |
| Administrative expenses | | | 42,048 | | | | 40,912 | | | | 38,246 | | | | 33,016 | |
| Selling and marketing expenses | | | 63,980 | | | | 52,968 | | | | 53,088 | | | | 55,207 | |
| Finance costs | | | 16,684 | | | | 19,525 | | | | 18,700 | | | | 18,771 | |
| Profit (loss) for the period from continuing operations | | | (64,976 | ) | | | (371,403 | ) | | | (94,255 | ) | | | (45,743 | ) |
| Profit (loss) for the period | | | (63,441 | ) | | | (206,193 | ) | | | (135,156 | ) | | | (38,914 | ) |
| Profit (loss) for the period from continuing operations per share – basic | | | (0.46 | ) | | | (2.56 | ) | | | (0.67 | ) | | | (0.32 | ) |
| Profit (loss) for the period from continuing operations per share – diluted | | | (0.46 | ) | | | (2.56 | ) | | | (0.67 | ) | | | (0.32 | ) |
| Dividends/distributions paid | | | 18,596 | | | | 18,572 | | | | 18,622 | | | | 30,933 | |
| Base EBITDA | | | 67,914 | | | | 50,592 | | | | 31,734 | | | | 30,186 | |
| Base Funds from Operations | | | 31,947 | | | | 21,179 | | | | 23,756 | | | | 15,590 | |
| Payout ratio on Base Funds from Operations | | | 58% | | | | 88% | | | | 78% | | | | 198% | |
Just Energy’s results reflect seasonality, as electricity consumption is slightly greater in the first and second quarters (summer quarters) and gas consumption is significantly greater during the third and fourth quarters (winter quarters). While quarter over quarter comparisons are relevant, sequential quarters will vary materially. The main impact of this will normally be higher Base EBITDA in the third and fourth quarters (assuming consumption based on normal winter weather) and lower Base EBITDA in the first and second quarters. This impact is lessening as current net customer additions are concentrated in electricity, which traditionally experiences less seasonality than natural gas.
Financial highlights
For the three months ended March 31
(thousands of dollars, except where indicated and per share amounts)
| | | | | | % increase | | | | |
| | | Fiscal 2016 | | | (decrease) | | | Fiscal 2015 | |
| Sales | | $ | 1,075,880 | | | | (11)% | | | $ | 1,209,879 | |
| Gross margin | | | 204,289 | | | | 5% | | | | 194,066 | |
| Administrative expenses | | | 49,504 | | | | 18% | | | | 42,048 | |
| Selling and marketing expenses | | | 62,259 | | | | (3)% | | | | 63,980 | |
| Finance costs | | | 20,312 | | | | 22% | | | | 16,684 | |
Profit (loss) from continuing operations1 | | | 30,893 | | | NMF 3 | | | | (64,976 | ) |
| Profit (loss) from discontinued operations | | | - | | | NMF 3 | | | | 1,535 | |
Profit (loss)1 | | | 30,893 | | | NMF 3 | | | | (63,441 | ) |
| Profit (loss) per share from continuing operations available to shareholders - basic | | | 0.16 | | | | | | | | (0.46 | ) |
| Profit (loss) per share from continuing operations available to shareholders - diluted | | | 0.14 | | | | | | | | (0.46 | ) |
| Dividends/distributions | | | 18,730 | | | | 1% | | | | 18,596 | |
Base EBITDA from continuing operations2 | | | 67,345 | | | | (1)% | | | | 67,914 | |
Base Funds from continuing operations2 | | | 43,822 | | | | 37% | | | | 31,947 | |
Payout ratio on Base Funds from continuing operations2 | | | 43% | | | | | | | | 58% | |
1Profit (loss) includes the impact of unrealized gains (losses), which represents the mark to market of future commodity supply acquired to cover future customer demand. The supply has been sold to customers at fixed prices, minimizing any realizable impact of mark to market gains and losses.
2See “Non-IFRS financial measures” on page 2.
3Not a meaningful figure.
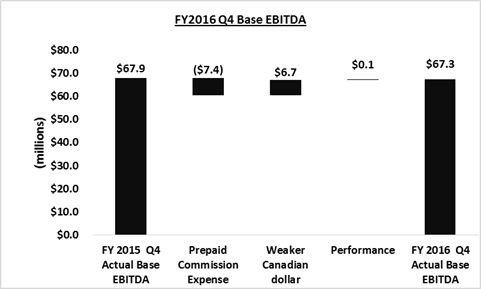
Just Energy delivered another quarter of strong operating and financial performance for the three months ended March 31, 2016. Despite sales decreasing by 11% to $1,075.9 million due to lower consumption from the warmer winter weather, gross margin increased by 5% to $204.3 million with the payout from the winter weather hedge and improved margins on new customers signed over the past 12 months. Base EBITDA was $67.3 million, a 1% decrease from the prior comparable period. The Company’s reported Base EBITDA for the three months ended March 31, 2016 includes $7.4 million of prepaid commission expense, reflecting the change in classification of prepaid commissions as a current asset effective April 1,
2016. Excluding this additional expense item, Base EBITDA increased by 10% to $74.7 million in comparison to fiscal 2015. Of this $6.8 million quarter over quarter improvement in Base EBITDA, $6.7 million was due to the foreign currency impact with the remaining $0.1 million driven by operational performance improvements.
Analysis of the fourth quarter
Sales decreased by 11% to $1,075.9 million for the three months ended March 31, 2016 from $1,209.9 million recorded in the fourth quarter of fiscal 2015. The Consumer division’s sales decreased by 15% due to market conditions as the commodity prices were lower and, therefore, more competitive across all markets as well as lower consumption from the warmer winter weather. The Commercial division’s sales decreased by 6%, primarily a result of the lower consumption during the winter months as well as a decrease in customer base year over year.
Gross margin was $204.3 million, an increase of 5% from the prior comparable quarter as a result of an increase from foreign exchange and the increase in the U.K. customer base. Just Energy entered into weather index derivatives with the intention of offsetting gross margin fluctuations from warmer than normal weather. The warmer than normal temperatures in Just Energy’s gas markets has resulted in a payout that largely offsets the negative impact from the warmer weather.
Administrative expenses for the three months ended March 31, 2016 increased by 18% from $42.0 million to $49.5 million as a result of an increase in U.S.-based currency expenditures as well as the costs to serve the growing customer base in the U.K.
Selling and marketing expenses for the three months ended March 31, 2016 were $62.3 million, a 3% decrease from $64.0 million reported in the prior comparable quarter. This decrease is largely attributable to lower commission expense resulting from lower gross customer additions in the current period partially offset by the foreign exchange impact of U.S.-based expenses.
Finance costs for the three months ended March 31, 2016 amounted to $20.3 million, an increase of 22% from $16.7 million reported for the three months ended March 31, 2015. The increase in finance costs was a result of the impact of foreign currency on the U.S dollar-based interest costs for the US$150m convertible bonds as well as the one-time interest cost associated with the early redemption of $25 million of the senior unsecured notes outstanding. Just Energy has the ability to make a normal course issuer bid (“NCIB”) to purchase for cancellation a portion of its convertible debentures. For the three months ended March 31, 2016, Just Energy purchased $1.1 million of the $330m convertible debentures under the NCIB program.
The change in fair value of derivative instruments resulted in a non-cash loss of $27.0 million for the fourth quarter of fiscal 2016 compared to a loss of $101.6 million in the prior comparative quarter, as a result of the change in commodity prices during the quarter along with the foreign exchange impact on change in fair value for the U.S. dollar based commodity contracts. The income from continuing operations for the three months ended March 31, 2016 was $30.9 million, representing a gain per share of $0.16 on a basic and $0.14 per share on a diluted basis. For the prior comparable quarter, the loss from continuing operations was $65.0 million, representing a loss per share of $0.46 on a basic and diluted basis. Just Energy ensures that customer margins are protected by entering into fixed-price supply contracts. Under current IFRS, the customer contracts are not marked to market but there is a requirement to mark to market the future supply contracts. This creates unrealized gains (losses) depending upon current supply pricing. Management believes that these short-term mark to market non-cash gains (losses) do not impact the long-term financial performance of Just Energy.
Base EBITDA was $67.3 million for the three months ended March 31, 2016, a 1% decrease from $67.9 million in the prior comparable quarter. The Company’s reported Base EBITDA in the fourth quarter of fiscal 2016 includes $7.4 million of prepaid commission expense, reflecting the change in classification of prepaid commissions to a current asset effective April 1, 2016. Excluding this additional expense item, Base EBITDA increased by 10% to $74.7 million for the fourth quarter of fiscal 2016. Of this $6.8 million year over year improvement in Base EBITDA, $6.7 million was due to the foreign currency impact from translation of the U.S. operations and $0.1 million was driven by operational performance improvements. Base FFO was $43.8 million for the fourth quarter of fiscal 2016, up 37% compared to $31.9 million in the prior comparable quarter as a result of the adjustment required to reflect net cash receipts from gas sales
being greater than the prior year as a result of the lower consumption in the current quarter resulting from the warmer winter weather.
Dividends/distributions paid were $18.7 million, consistent with the prior comparable period based on an annual dividend rate of $0.50 per share. Payout ratio for the three months ended March 31, 2016 was 43%, compared with 58% in the prior comparable quarter. The payout ratio for the fourth quarter was the lowest in the Company’s history.
Segmented Base EBITDA1
For the years ended March 31
(thousands of dollars)
| | | | | | Fiscal 2016 | |
| | | | | | | | | | |
| | | Consumer | | | Commercial | | | | |
| | | division | | | division | | | Consolidated | |
| Sales | | $ | 2,177,538 | | | $ | 1,928,322 | | | $ | 4,105,860 | |
| Cost of sales | | | (1,638,892 | ) | | | (1,764,680 | ) | | | (3,403,572 | ) |
| Gross margin | | | 538,646 | | | | 163,642 | | | | 702,288 | |
| Add (subtract): | | | | | | | | | | | | |
| Administrative expenses | | | (130,253 | ) | | | (40,077 | ) | | | (170,330 | ) |
| Selling and marketing expenses | | | (163,153 | ) | | | (94,196 | ) | | | (257,349 | ) |
| Bad debt expense | | | (59,689 | ) | | | (8,842 | ) | | | (68,531 | ) |
| Amortization included in cost of sales/selling and marketing expenses | | | - | | | | 21,983 | | | | 21,983 | |
| Other expenses | | | (1,853 | ) | | | (689 | ) | | | (2,542 | ) |
| Profit attributable to non-controlling interest | | | (17,890 | ) | | | - | | | | (17,890 | ) |
| Base EBITDA from operations | | $ | 165,808 | | | $ | 41,821 | | | $ | 207,629 | |
| | | | | | | | | | | | | |
| | | | | | | Fiscal 2015 | |
| | | | | | | | | | | | | |
| | | Consumer | | | Commercial | | | | | |
| | | division | | | division | | | Consolidated | |
| Sales | | $ | 2,113,828 | | | $ | 1,782,112 | | | $ | 3,895,940 | |
| Cost of sales | | | (1,663,598 | ) | | | (1,632,273 | ) | | | (3,295,871 | ) |
| Gross margin | | | 450,230 | | | | 149,839 | | | | 600,069 | |
| Add (subtract): | | | | | | | | | | | | |
| Administrative expenses | | | (121,170 | ) | | | (33,052 | ) | | | (154,222 | ) |
| Selling and marketing expenses | | | (134,084 | ) | | | (91,159 | ) | | | (225,243 | ) |
| Bad debt expense | | | (46,945 | ) | | | (15,132 | ) | | | (62,077 | ) |
| Amortization included in cost of sales/selling and marketing expenses | | | - | | | | 30,647 | | | | 30,647 | |
| Other expenses | | | (788 | ) | | | (1,608 | ) | | | (2,396 | ) |
| Profit attributable to non-controlling interest | | | (6,352 | ) | | | - | | | | (6,352 | ) |
| Base EBITDA from operations | | $ | 140,891 | | | $ | 39,535 | | | $ | 180,426 | |
1The segment definitions are provided on page 5.
Consumer Energy contributed $165.8 million to Base EBITDA for the year ended March 31, 2016, an increase of 18% from $140.9 million in the year ended March 31, 2015. Consumer gross margin increased by 20% as a result of the foreign exchange impact on U.S.-based sales and higher margin contribution per customer. Consumer administrative costs were up 7% in fiscal 2016 due in part to the expected growth in U.K. operating costs needed to support the growing customer base as well as the impact of foreign exchange.
Commercial Energy contributed $41.8 million to Base EBITDA, an increase of 6% from the year ended March 31, 2015, when the segment contributed $39.5 million. The increase in gross margin was offset by higher operating expenses, particularly as a result of the $17.9 million impact from the change in classification of prepaid commission costs. Excluding these additional costs, Base EBITDA for the Commercial operations would have increased by 51% to $59.7 million as a result of operational improvement initiatives and the foreign exchange impact from its U.S. markets.
Customer aggregation
| | | April 1, | | | | | | | | | Failed to | | | March 31, | | | % increase | |
| | | | 2015 | 1 | | Additions | | | Attrition | | | renew | | | | 2016 | | | (decrease) | |
| Consumer Energy | | | | | | | | | | | | | | | | | |
| Gas | | | 713,000 | | | | 146,000 | | | | (153,000 | ) | | | (38,000 | ) | | | 668,000 | | | | (6)% | |
| Electricity | | | 1,240,000 | | | | 377,000 | | | | (306,000 | ) | | | (95,000 | ) | | | 1,216,000 | | | | (2)% | |
| Total Consumer RCEs | | | 1,953,000 | | | | 523,000 | | | | (459,000 | ) | | | (133,000 | ) | | | 1,884,000 | | | | (4)% | |
| Commercial Energy | | | | | | | | | | | | | | | | | |
| Gas | | | 242,000 | | | | 86,000 | | | | (29,000 | ) | | | (55,000 | ) | | | 244,000 | | | | 1% | |
| Electricity | | | 2,491,000 | | | | 549,000 | | | | (183,000 | ) | | | (465,000 | ) | | | 2,392,000 | | | | (4)% | |
| Total Commercial RCEs | | | 2,733,000 | | | | 635,000 | | | | (212,000 | ) | | | (520,000 | ) | | | 2,636,000 | | | | (4)% | |
| Total RCEs | | | 4,686,000 | | | | 1,158,000 | | | | (671,000 | ) | | | (653,000 | ) | | | 4,520,000 | | | | (4)% | |
1The balance as at April 1, 2015 has been adjusted for customers who have either grown above 15 RCEs (becoming a Commercial customer) or have fallen below 15 RCEs (becoming a Consumer customer) during the fiscal year 2015. At the beginning of each fiscal year, Just Energy will adjust the opening balances to reflect any changes in allocation of customers between the Consumer and Commercial divisions as a result of the increases or decreases in the annual consumption.
Gross customer additions for the year ended March 31, 2016 were 1,158,000, a decrease of 20% compared to 1,441,000 customers added in fiscal 2015. The customer additions were lower in the current year due to market conditions as the commodity prices were lower and therefore, more competitive across all markets, as well as an increased focus on the profitability of a customer resulting in fewer customer additions but higher margin contribution from each new customer added. Additionally, the low and stable market conditions (no volatility) that have prevailed for the past two years have resulted in less customer switching.
Consumer customer additions amounted to 523,000 for the year ended March 31, 2016, a 23% decrease from 675,000 gross customer additions recorded in the prior comparable year. The customer additions were lower in the current year due to market conditions as the commodity prices were lower and, therefore, more competitive across all markets as well as a decrease in customer additions through online and door-to-door marketing.
Commercial customer additions were 635,000 for the year ended March 31, 2016, a 17% decrease from 766,000 gross customer additions in the prior comparable year as a result of competitiveness in pricing and a more disciplined pricing strategy. Just Energy remains focused on increasing the gross margin per customer added for Commercial customers and, as a result, has been more selective in the margin added per customer.
Net additions were a negative 166,000 for fiscal 2016, compared with 276,000 net customer additions in fiscal 2015, primarily as a result of the lower customer additions in North America and lower renewal rates for Commercial operations. Just Energy continues to actively focus on improving retained customers’ profitability rather than pursuing low margin growth.
In addition to the customers referenced in the above table, the Consumer customer base also includes 60,000 smart thermostat customers. These smart thermostats are bundled with a commodity contract and are currently offered in Ontario, Alberta and Texas. Customers with bundled products have lower attrition and higher overall profitability. Further expansion of smart thermostats is a key driver of continued growth for Just Energy.
For the year ended March 31, 2016, 52% of the total Consumer and Commercial customer additions were generated from commercial brokers, 28% through online and other non-door-to-door sales channels and 20% from door-to-door sales. In the prior year, 50% of customer additions were generated from commercial brokers, 29% from online and other sales channels and 21% using door-to-door sales.
The U.K. operations increased their customer base by 53% to 308,000 RCEs over the past year with strong growth for both their Consumer and Commercial customer bases. As of March 31, 2016, the U.S., Canadian and U.K. segments accounted for 71%, 22% and 7% of the customer base, respectively. At March 31, 2015, the U.S., Canadian and U.K. segments represented 72%, 24% and 4% of the customer base, respectively.
| ATTRITION | | | | | | |
| | | Fiscal 2016 | | | Fiscal 2015 | |
| | | | | | | |
| Consumer | | | 26% | | | | 27% | |
| Commercial | | | 9% | | | | 7% | |
| Total attrition | | | 16% | | | | 16% | |
The combined attrition rate for Just Energy was 16% for the year ended March 31, 2016, consistent with prior year. While the Consumer attrition rate decreased one percentage point to 26% from a year ago, the Commercial attrition rate increased by two percentage points to 9%. The increase in Commercial attrition was a result of increased competition over the past year. The Company continues to focus on maintaining its profitable customers and ensuring that variable rate customers meet base profitability profiles even if this results in higher attrition. The Consumer attrition includes the impact from higher customer defaults in markets where Just Energy bears collection risk.
The Company carefully monitors the levels of customer complaints from its Consumer and Commercial divisions. The goal is to resolve all complaints registered within five days of receipt. Our corporate target is to have an outstanding complaint rate of less than 0.05% of flowing customers at any time. As of March 31, 2016, the total outstanding rate was 0.01%.
| RENEWALS | | | | | | |
| | | | |
| | | Fiscal 2016 | | | Fiscal 2015 | |
| Consumer | | | 74% | | | | 77% | |
| Commercial | | | 57% | | | | 63% | |
| Total renewals | | | 62% | | | | 67% | |
The Just Energy renewal process is a multifaceted program that aims to maximize the number of customers who choose to renew their contract prior to the end of their existing contract term. Efforts begin up to 15 months in advance, allowing a customer to renew for an additional period. Overall, the renewal rate was 62% for fiscal 2016, down five percentage points from a renewal rate of 67% reported for fiscal 2015. The Consumer renewal rate decreased by three percentage points, while the Commercial renewal rate decreased by six percentage points to 57%. The decline reflected a very competitive market for Commercial renewals with competitors pricing aggressively and Just Energy’s focus on improving retained customers’ profitability rather than pursuing low margin growth.
ENERGY CONTRACT RENEWALS
This table shows the customers up for renewal in the following fiscal periods:
| | | Consumer | | | Commercial | |
| | | Gas | | | Electricity | | | Gas | | | Electricity | |
| 2017 | | | 19% | | | | 35% | | | | 32% | | | | 40% | |
| 2018 | | | 21% | | | | 28% | | | | 32% | | | | 34% | |
| 2019 | | | 24% | | | | 18% | | | | 19% | | | | 15% | |
| 2020 | | | 18% | | | | 9% | | | | 11% | | | | 7% | |
| Beyond 2020 | | | 18% | | | | 10% | | | | 6% | | | | 4% | |
| Total | | | 100% | | | | 100% | | | | 100% | | | | 100% | |
Note: All month-to-month customers, which represent 531,000 RCEs, are excluded from the table above.
Gross margin
For the years ended March 31
(thousands of dollars)
| | | Fiscal 2016 | | | Fiscal 2015 | |
| | | Consumer | | | Commercial | | | Total | | | Consumer | | | Commercial | | | Total | |
| Gas | | $ | 172,582 | | | $ | 31,632 | | | $ | 204,214 | | | $ | 165,770 | | | $ | 33,352 | | | $ | 199,122 | |
| Electricity | | | 366,064 | | | | 132,010 | | | | 498,074 | | | | 284,460 | | | | 116,487 | | | | 400,947 | |
| | | $ | 538,646 | | | $ | 163,642 | | | $ | 702,288 | | | $ | 450,230 | | | $ | 149,839 | | | $ | 600,069 | |
| Increase | | | 20% | | | | 9% | | | | 17% | | | | | | | | | | | | | |
Gross margin for the year ended March 31, 2016 for the Consumer division was $538.6 million, an increase of 20% from the $450.2 million recorded in the prior year. Gas and electricity gross margins increased by 4% and 29%, respectively.
Average realized gross margin for the Consumer division for the year ended March 31, 2016 was $243/RCE, representing a 22% increase from $199/RCE reported in the prior year. The increase is largely due to higher margins on new customers added as well as the foreign exchange impact from the weaker Canadian dollar. The gross margin/RCE value includes an appropriate allowance for bad debt expense in Illinois, Texas, Georgia, Michigan, Pennsylvania and Massachusetts.
Gas
Gross margin for the year ended March 31, 2016 from gas customers in the Consumer division was $172.6 million, an increase of 4% from $165.8 million recorded in fiscal 2015. The change is primarily a result of higher margins earned on variable rate products, the growth in the U.K. and the favourable impact from the exchange on the U.S. dollar denominated sales offsetting the decrease in margins from lower consumption.
Just Energy entered into weather index derivatives for the third and fourth quarters of fiscal 2016 with the intention of reducing gross margin fluctuations from warmer than normal weather. The warmer than normal temperatures in Just Energy’s gas markets has resulted in a payout that largely offsets the negative impact from the warmer weather.
Electricity
Gross margin from electricity customers in the Consumer Energy division was $366.1 million for the year ended March 31, 2016, an increase of 29% from $284.5 million recorded in the prior year. The higher gross margin in fiscal 2016 is a result of higher fee-based revenues earned, higher margins contribution from the JustGreen product offerings, attractive pricing on variable rate products due to lower power prices, the positive impact of the foreign currency translation on gross margin earned in the U.S. markets and the growth in the U.K. market.
Gross margin for the Commercial division was $163.6 million, an increase of 9% from the $149.8 million recorded in the prior year. Gas and electricity gross margins decreased by 5% and increased by 13%, respectively. The overall growth in margin was due to operational improvements in place to increase the margin for new customers added and the positive impact from the currency translation on the contribution from the U.S. customer base.
Average realized gross margin for the year ended March 31, 2016 was $72/RCE, an increase of 20% from $60/RCE. The GM/RCE value includes an appropriate allowance for bad debt expense in Illinois, Texas, Georgia, Michigan and California.
Gas gross margin for the Commercial division was $31.6 million for the year ended March 31, 2016, a decrease of 5% from $33.4 million. The decrease in gross margin is a result of lower consumption due to warmer weather although the majority of the margin impact from lower consumption was offset by the weather hedge.
Electricity
Electricity gross margin for the Commercial division was $132.0 million, an increase of 13% from the $116.5 million recorded in the prior comparable year. The increase in gross margin is a result of increased profitability on new customers and the favourable impact from the currency translation of U.S. dollar-based sales.
GROSS MARGIN ON NEW AND RENEWING CUSTOMERS
The table below depicts the annual margins on contracts for Consumer and Commercial customers signed during the year. This table reflects the gross margin (sales price less costs of associated supply and allowance for bad debt) earned on new additions and renewals including both brown commodities and JustGreen supply.
ANNUAL GROSS MARGIN PER RCE
| | | Fiscal 2016 | | | Number of customers | | | Fiscal2015 | | | Number of customers | |
| | | | | | | | | | | | | |
| Consumer customers added and renewed | | $ | 207 | | | | 888,000 | | | $ | 191 | | | | 983,000 | |
| Consumer customers lost | | | 196 | | | | 592,000 | | | | 184 | | | | 635,000 | |
| Commercial customers added and renewed | | | 84 | | | | 1,202,000 | | | | 79 | | | | 1,171,000 | |
| Commercial customers lost | | | 66 | | | | 732,000 | | | | 73 | | | | 531,000 | |
For the year ended March 31, 2016, the average gross margin per RCE for the customers added and renewed by the Consumer division was $207/RCE, an increase from $191/RCE in fiscal 2015. The average gross margin per RCE for the Consumer customers lost during fiscal 2016 was $196/RCE, compared with $184/RCE in fiscal 2015. Higher new customer margins reflect strong margins on new products including bundled offerings as well as an impact from foreign currency translation.
For the Commercial division, the average gross margin per RCE for the customers signed during the year ended March 31, 2016 was $84/RCE compared to $79/RCE in the prior fiscal year. Customers lost through attrition and failure to renew during the year ended March 31, 2016 were at an average gross margin of $66/RCE, a decrease from $73/RCE reported in the prior year. The Company has pursued a plan where focus in the commercial market will be on higher margin segments while those with traditionally low margins are allowed to expire. Management will continue its margin optimization efforts by focusing on ensuring customers added meet its profitability targets.
Overall consolidated results from continuing operations
ADMINISTRATIVE EXPENSES
For the years ended March 31
(Thousands of dollars)
| | | Fiscal 2016 | | | Fiscal 2015 | | | % increase | |
| Consumer Energy | | $ | 130,253 | | | $ | 121,170 | | | | 7 | % |
| Commercial Energy | | | 40,077 | | | | 33,052 | | | | 21 | % |
| Total administrative expenses | | $ | 170,330 | | | $ | 154,222 | | | | 10 | % |
Administrative expenses increased by 10% from $154.2 million to $170.3 million. The Consumer division’s administrative expenses were $130.3 million for the year ended March 31, 2016, an increase of 7% from $121.2 million recorded in the prior year. The Commercial division’s administrative expenses were $40.1 million for fiscal 2016, a 21% increase from $33.1 million for the year ended March 31, 2015. The increase over the prior year was primarily driven by the impact of the U.S. exchange rate as well as higher operating costs for the growth in the U.K. operations to support its growing customer base.
SELLING AND MARKETING EXPENSES
For the years ended March 31
(Thousands of dollars)
| | | Fiscal 2016 | | | Fiscal 2015 | | | % increase | |
| Consumer Energy | | $ | 163,153 | | | $ | 134,084 | | | | 22 | % |
| Commercial Energy | | | 94,196 | | | | 91,159 | | | | 3 | % |
| Total selling and marketing expenses | | $ | 257,349 | | | $ | 225,243 | | | | 14 | % |
Selling and marketing expenses, which consist of commissions paid to independent sales contractors, brokers and independent representatives, as well as sales-related corporate costs were $257.3 million for the year ended March 31, 2016, an increase of 14% from $225.2 million in fiscal 2015. The increase is largely attributable to the impact of foreign exchange on the U.S-based commission and overhead expenses, the cost associated with the Residential Solar start-up as well as the expenses becoming more directly correlated to the growing portion of the customer base for which selling costs are recorded over the life of the contract (commercial broker and online sales channels).
The selling and marketing expenses for the Consumer Energy division were $163.2 million for the year ended March 31, 2016, an increase of 22% from $134.1 million recorded in fiscal 2015. These selling expenses increased despite customer additions being lower year over year due to the impact of the currency translation of U.S.-based expenses, the start-up costs associated with the Residential Solar division as well as the selling and marketing expenses becoming more directly correlated to the growth portion of the customer base for which selling costs are recorded over the life of the contract.
The selling and marketing expenses for the Commercial Energy division were $94.2 million for the year ended March 31, 2016, up 3% from fiscal 2015 selling expenses of $91.2 million. The increase in selling expenses is a result of higher foreign currency translation on U.S.-based commission and overhead expenses and the growth in the U.K.
The aggregation costs per customer for Consumer customers signed by independent representatives and Commercial customers signed by brokers were as follows:
| | | Fiscal 2016 | | | Fiscal 2015 | |
| Consumer | | $ | 204/RCE | | | $ | 153/RCE | |
| Commercial | | $ | 38/RCE | | | $ | 29/RCE | |
The average aggregation costs for the Consumer division increased to $204/RCE compared to $153/RCE in the prior year. The increase in cost in the current year is a result of the higher exchange associated with the U.S.-based expenses as well as higher allocations of overhead expense on a per RCE basis due to lower customer additions in fiscal 2016.
The $38 average aggregation cost for Commercial division customers is based on the expected average annual costs for the respective customer contracts. It should be noted that commercial broker contracts are paid further commissions averaging $38 per year for each additional year that the customer flows. Assuming an average life of 2.8 years, this would add approximately $68 (1.8 x $38) to the year’s average aggregation cost reported above. For the prior year, the average aggregation costs for commercial brokers were $29/RCE. The lower costs in this prior year are a function of broker commissions being a percentage of lower margins as well as less impact from foreign exchange.
BAD DEBT EXPENSE
In Illinois, Alberta, Texas, Delaware, Ohio, California, Michigan and Georgia, Just Energy assumes the credit risk associated with the collection of customer accounts. In addition, for commercial direct-billed accounts in British Columbia, Just Energy is responsible for the bad debt risk. Credit review processes have been established to manage the customer default rate. Management factors default from credit risk into its margin expectations for all of the above-noted markets. During the year ended March 31, 2016, Just Energy was exposed to the risk of bad debt on approximately 74% of its sales, compared with 66% of sales during the year ended March 31, 2015.
Bad debt expense is included in the consolidated income statement under other operating expenses. Bad debt expense for the year ended March 31, 2016 was $68.5 million, an increase of 10% from $62.1 million expensed for the year ended March 31, 2015. Management integrates its default rate for bad debt within its margin targets and continuously reviews and monitors the credit approval process to mitigate customer delinquency. For the year ended March 31, 2016, the bad debt expense represents 2.3% of relevant revenue, down from 2.4% reported in fiscal 2015.
Management expects that bad debt expense will remain in the range of 2% to 3% of relevant revenue where the Company bears credit risk. For each of Just Energy’s other markets, the LDCs provide collection services and assume the risk of any bad debt owing from Just Energy’s customers for a regulated fee.
Total finance costs for the year ended March 31, 2016 amounted to $72.5 million, a decrease of 2% from $73.7 million during the year ended March 31, 2015. The decrease is a result of the 2% decrease in the long-term debt balance over the past year with lower borrowing costs under the credit facility due to the use of sale proceeds of National Home Services (“NHS”) in the third quarter of fiscal 2015 to reduce borrowings, as well as a $7.0 million reduction in debt through the NCIB over the past year.
Just Energy has an exposure to U.S. dollar exchange rates as a result of its U.S. operations. Any changes in the applicable exchange rate may result in a decrease or increase in other comprehensive income. For the year ended March 31, 2016, a foreign exchange unrealized loss of $7.5 million was reported in other comprehensive income versus an unrealized loss of $13.1 million in fiscal 2015. In addition to changes in the U.S. foreign exchange rate, this fluctuation is a result of the significant increase in the mark to market liability position of the Company’s derivative financial instruments.
Overall, a stronger U.S. dollar increases the value of sales and gross margin in Canadian dollars but this is partially offset by higher operating costs denominated in U.S. dollars. Total estimated impact of the decline in the Canadian dollar versus the U.S. dollar was a favourable $19.1 million on Base EBITDA and $15.3 million on FFO for fiscal 2016.
Just Energy retains sufficient funds in the U.S. to support ongoing growth and surplus cash is repatriated to Canada. U.S. cross border cash flow is forecasted annually, and hedges for cross border cash flow are placed. Just Energy hedges between 50% and 90% of the next 12 months of cross border cash flows, depending on the level of certainty of the cash flow.
PROVISION FOR (RECOVERY OF) INCOME TAX
For the years ended March 31
(thousands of dollars)
| | | Fiscal 2016 | | | Fiscal 2015 | |
Current income tax expense | | $ | 13,890 | | | $ | 8,859 | |
| Deferred tax (recovery) provision | | | (14,208 | ) | | | (37,748 | ) |
| Provision for (recovery of) income tax | | $ | (318 | ) | | $ | (28,889 | ) |
Just Energy recorded a current income tax expense of $13.9 million for the year versus $8.9 million in fiscal 2015. The increase in current tax expense in fiscal 2016 is mainly due to improved operating results as well as Just Energy becoming a taxpayer in Canada and the U.K.
During fiscal 2016, a deferred tax benefit of $14.2 million was recorded, which is mainly due to deferred tax expense that was set up for Canadian operations in prior years was classified as a current income tax in fiscal 2016 as a result of Just Energy becoming taxable in Canada. In fiscal 2015, a deferred tax benefit of $37.7 million was recorded, which is due to a significant increase of cumulative mark to market losses from financial instruments during that year.
Just Energy is taxed as a taxable Canadian corporation. Therefore, the deferred tax asset or liability associated with Canadian assets and liabilities recorded on the consolidated balance sheets as at that date will be realized over time as the temporary differences between the carrying value of assets in the consolidated financial statements and their respective tax bases are realized. Current Canadian income taxes are accrued to the extent that there is taxable income in Just Energy and its underlying corporations. For fiscal 2016, Canadian and U.K. corporations under Just Energy are subject to a tax rate of approximately 26% and 20%, respectively.
Under IFRS, Just Energy recognized income tax liabilities and assets based on the estimated tax consequences attributable to the temporary differences between the carrying value of the assets and liabilities on the consolidated financial statements and their respective tax bases, using substantively enacted income tax rates. A deferred tax asset will not be recognized if it is not anticipated that the asset will be realized in the foreseeable future. The effect of a change in the income tax rates used in calculating deferred income tax liabilities and assets is recognized in income during the period in which the change occurs.
HOME SERVICES DIVISION
On November 24, 2014, Just Energy announced that it had closed the sale of its shares of NHS to Reliance Comfort Limited Partnership. NHS provided Ontario and Quebec residential customers with a long-term water heater, furnace and air conditioning rental, offering high efficiency conventional and power vented tank and tankless water heaters and high efficiency furnaces and air conditioners. The purchase price was $505 million subject to certain potential adjustments at closing including working capital balances. Additionally, as a condition of closing, Just Energy paid all outstanding NHS borrowings and the remaining interest in a royalty agreement.
RESULTS OF OPERATIONS
For the period of April 1, 2014 to November 24, 2014, the Home Services division had sales of $58.8 million and gross margin of $47.6 million, compared with $76.4 million and $60.1 million, respectively, in fiscal 2014. NHS’s operating profit included in discontinued operations was $168.1 million (including gain on sale of $191.2 million) for fiscal 2015.
COMMERCIAL SOLAR (HES)
On November 5, 2014, Just Energy announced the closing of the sale of HES to SunEdison, Inc. and its subsidiary, TerraForm Power Inc., a leading global solar technology manufacturer and provider of solar energy services.
For the period of April 1, 2014 to November 5, 2014, the Commercial Solar division had sales of $4.4 million compared with $3.9 million for the year ended March 31, 2014. The operating loss of HES included in the discontinued operations was $35.5 million compared to $46.8 million in fiscal 2014.
Liquidity and capital resources
SUMMARY OF CASH FLOWS
For the years ended March 31
(thousands of dollars)
| | | Fiscal 2016 | | | Fiscal 2015 | |
| Operating activities from continuing operations | | $ | 187,106 | | | $ | 75,310 | |
| Investing activities from continuing operations | | | (6,408 | ) | | | 152,278 | |
| Financing activities from continuing operations, excluding dividends | | | (53,481 | ) | | | (77,865 | ) |
| Effect of foreign currency translation | | | (3,703 | ) | | | 7,037 | |
| Increase in cash before dividends | | | 123,514 | | | | 156,760 | |
| Dividends (cash payments) | | | (74,732 | ) | | | (83,041 | ) |
| Increase in cash | | | 48,782 | | | | 73,719 | |
| Decrease in cash from discontinued operations and cash reclassified to assets held for sale | | | - | | | | (15,306 | ) |
| Cash and cash equivalents – beginning of year | | | 78,814 | | | | 20,401 | |
| Cash and cash equivalents – end of year | | $ | 127,596 | | | $ | 78,814 | |
OPERATING ACTIVITIES FROM CONTINUING OPERATIONS
Cash flow from continuing operating activities for the year ended March 31, 2016 was an inflow of $187.1 million, compared to $75.3 million in fiscal 2015. Cash flow from continuing operations increased as a result of both improved operational performance and the impact of the stronger dollar on U.S. operations.
INVESTING ACTIVITIES FROM CONTINUING OPERATIONS
Investing activities for the current year included purchases of capital and intangible assets totalling $6.9 million and $10.1 million, respectively, compared with $5.8 million and $7.6 million, respectively, in fiscal 2015. Just Energy’s capital spending related primarily to smart thermostats for product bundling opportunities and office equipment. The $10.6 million change in restricted cash in the current year is related to the settlement of obligations from prior period acquisitions and dispositions.
In fiscal 2015, investing activities included proceeds on the disposal of subsidiaries in the amount of $195.5 million. Contract initiation cost additions decreased from $29.8 million in fiscal 2015 to $nil in fiscal 2016 as a result of a change in classification of upfront commission payments as prepaid commissions as a result of the shortening of the average upfront payment to approximately 12 months.
FINANCING ACTIVITIES FROM CONTINUING OPERATIONS
Financing activities, excluding dividends, relates primarily to the issuance and repayment of long-term debt. Just Energy early redeemed $25 million of the original $105 million principal on its senior unsecured note as well as purchased and retired $7.0 million of its outstanding convertible debentures through the normal course issuer bid. As of March 31, 2016, Just Energy had not drawn on its $277.5 million credit facility, although letters of credit totalling $130.0 million remain outstanding.
Just Energy’s liquidity requirements are driven by the delay from the time that a customer contract is signed until cash flow is generated. The elapsed period between the time a customer is signed and receipt of the first payment from the customer varies with each market. The time delays per market are approximately two to nine months. These periods reflect the time required by the various LDCs to enroll, flow the commodity, bill the customer and remit the first payment to Just Energy. In Alberta, Georgia and Texas and for commercial direct-billed customers, Just Energy receives payment directly.
DIVIDENDS (CASH AND SHARE PAYMENTS)
Just Energy reduced its dividend to an annual rate of $0.50 per share effective July 1, 2014 to be paid quarterly. Prior to this, the annual dividend rate was $0.84 per share. The revised dividend policy provides that shareholders of record on the 15th day of March, June, September and December, or the first business day thereafter, receive dividends at the end of that month. During the year ended March 31, 2016, Just Energy paid cash dividends to its shareholders and distributions to holders of share-based awards in the amount of $74.7 million, compared to $83.0 million paid in the prior comparable year with the decrease being attributable to the decrease in annual dividend rate effective July 1, 2014.
The dividend reinvestment plan (”DRIP”) reduces the amount of cash dividends as a portion of dividends declared is paid through the issuance of additional shares. Under the program, Canadian resident shareholders could elect to receive their dividends in shares at a 2% discount on the prevailing market price rather than the cash equivalent. The program was suspended effective January 1, 2015.
Balance sheet as at March 31, 2016, compared to March 31, 2015
Cash increased from $78.8 million as at March 31, 2015, to $127.6 million. The increase in cash is primarily attributable to strong operating performance. During fiscal 2016, Just Energy also repaid $25.0 million of the senior unsecured note and purchased and retired $7.0 million of convertible debentures.
As of March 31, 2016, trade receivables and unbilled revenue amounted to $362.3 million and $227.4 million, respectively, compared to March 31, 2015, when the trade receivables and unbilled revenue amounted to $459.4 million and $219.6 million, respectively. Trade payables decreased from $510.5 million to $458.9 million year over year. The lower accounts receivable and accounts payable balances reflect the lower consumption in the current year as a result of seasonally warmer winter weather.
In Michigan, more gas has been delivered to LDCs than consumed by customers, resulting in gas delivered in excess of consumption and a deferred revenue position of $6.3 million and $23.0 million, respectively, as of March 31, 2016. In Ontario, Manitoba and Quebec, more gas was consumed by customers than Just Energy had delivered to the LDCs. As a result, Just Energy has recognized an accrued gas receivable and accrued gas payable for $13.6 million and $11.3 million, respectively, as of March 31, 2016. These amounts decreased from $46.0 million and $28.9 million, respectively, as of March 31, 2015, as a result of the impact on consumption from the warmer winter weather in fiscal 2016.
Prepaid expenses and deposits increased from $22.9 million at March 31, 2015 to $62.3 million as of March 31, 2016. Effective fiscal 2016, newly capitalized commissions will be classified as a current asset (prepaid expense) instead of a non-current asset (contract initiation costs), which resulted in a $22.4 million increase in prepaid expense year over year and growth in U.K. operations.
Other assets and other liabilities relate entirely to the fair value of the financial derivatives. The mark to market gains and losses can result in significant changes in profit and, accordingly, shareholders’ equity from year to year due to commodity price volatility. Given that Just Energy has purchased this supply to cover future customer usage at fixed prices, management believes that these non-cash changes are not meaningful and will not be experienced as future costs or cash outflows.
Intangible assets include the goodwill and acquired customer contracts, as well as other intangibles such as brand, broker network and information technology systems, primarily related to the acquisitions in 2009, 2010 and 2011. The total intangible asset balance decreased to $345.9 million from $348.5 million during the year ended March 31, 2016 as a result of amortization of the intangible assets.
Long-term debt has decreased from $676.5 million as at March 31, 2015 to $660.5 million as at March 31, 2016, as a result of the $25 million repayment of the senior unsecured note along with the retirement of $7.0 million of convertible debentures. This decrease was offset by the higher valuation of the U.S.-based $150m convertible bonds as a result of change in the exchange rate to Canadian dollars. The book value of net debt was 2.6x for the Base EBITDA, significantly improved from 3.3x just one year ago.
Debt and financing for continuing operations
(thousands of dollars)
| | | March 31, 2016 | | | March 31, 2015 | |
| | | | | | | |
| Senior unsecured note | | $ | 80,000 | | | $ | 105,000 | |
| $330m convertible debentures | | | 311,028 | | | | 310,083 | |
| $100m convertible debentures | | | 93,637 | | | | 91,445 | |
| US$150m convertible bonds | | | 182,564 | | | | 175,003 | |
JUST ENERGY CREDIT FACILITY
As at March 31, 2016, Just Energy has a credit facility of $277.5 million. The current syndicate of lenders includes Shell Energy North America (Canada) Inc./Shell Energy North America (U.S.), L.P., Canadian Imperial Bank of Commerce, National Bank of Canada, HSBC Bank Canada, Alberta Treasury Branches and Canadian Western Bank. The term of the credit facility expires on September 1, 2018.
Under the terms of the credit facility, Just Energy is able to make use of Bankers’ Acceptances and LIBOR advances at a stamping fee of 3.75%, prime rate advances at rates of interest of bank prime plus 2.75%, and letters of credit at 3.75%. Interest rates are adjusted quarterly based on certain financial performance indicators.
As at March 31, 2016, the Canadian prime rate was 2.70% and the U.S. prime rate was 3.50%. As at March 31, 2016 and 2015, no amount has been drawn against the facility. Total letters of credit outstanding as of March 31, 2016 amounted to $130.0 million (March 31, 2015 - $134.8 million). As at March 31, 2016, Just Energy has $147.5 million of the facility remaining for future working capital and security requirements. Just Energy’s obligations under the credit facility are supported by guarantees of certain subsidiaries and affiliates and secured by a general security agreement and a pledge of the assets and securities of Just Energy and the majority of its operating subsidiaries and affiliates excluding, primarily, the U.K. operations. Just Energy is required to meet a number of financial covenants under the credit facility agreement. As at March 31, 2016, the Company was compliant with all of these covenants
Just Energy’s obligations under the credit facility are supported by guarantees of certain subsidiaries and affiliates, excluding, primarily, the U.K. operations, and secured by a pledge of the assets of Just Energy and the majority of its operating subsidiaries and affiliates. Just Energy is required to meet a number of financial covenants under the credit facility agreement. As at March 31, 2016, all of the covenants had been met.
SENIOR UNSECURED NOTE
On March 31, 2016, Just Energy early redeemed $25 million of the original $105 million principal on its senior unsecured note, resulting in a balance outstanding of $80 million. The senior unsecured note bears interest at 9.75% and matures in June 2018. The senior unsecured note is subject to certain financial and other covenants and as of March 31, 2016, all of the covenants have been met.
In conjunction with the covenant requirements associated with the issuance of senior unsecured notes, the following represents select financial disclosure for the “Restricted Subsidiaries” as defined within the Note Indenture, which generally excludes the U.K. operations.
| | | Fiscal | | | Fiscal | |
| | | 2016 | | | 2015 | |
| Base EBITDA | | $ | 195,937 | | | $ | 177,700 | |
Selling and marketing expenses to add gross margin | | | 118,333 | | | | 73,133 | |
| Share-based compensation | | | 5,345 | | | | 7,110 | |
| Maintenance capital expenditures | | | 12,285 | | | | 17,785 | |
$330M CONVERTIBLE DEBENTURES
To fund an acquisition in May 2010, Just Energy issued $330 million of convertible extendible unsecured subordinated debentures. The $330 million convertible debentures bear an interest rate of 6% per annum payable semi-annually in arrears on June 30 and December 31 in each year, with maturity on June 30, 2017. Each $1,000 principal amount of the $330 million convertible debentures is convertible at any time prior to maturity or on the date fixed for redemption, at the option of the holder, into approximately 55.6 shares of Just Energy, representing a conversion price of $18 per share. The debentures may be redeemed by Just Energy, in whole or in part, at a redemption price equal to the principal amount thereof, plus accrued and unpaid interest.
During the year ended March 31, 2016, the Company purchased and retired $7.0 million (2015 - $1.6 million) of convertible debentures and has adjusted the net book value accordingly.
$100M CONVERTIBLE DEBENTURES
In September 2011, Just Energy issued $100 million of convertible unsecured subordinated debentures. The $100 million convertible debentures bear interest at an annual rate of 5.75%, payable semi-annually on March 31 and September 30 in each year, and have a maturity date of September 30, 2018. Each $1,000 principal amount of the $100 million convertible debentures is convertible at the option of the holder at any time prior to the close of business on the earlier of the maturity date and the last business day immediately preceding the date fixed for redemption, into 56.0 common shares of Just Energy, representing a conversion price of $17.85 per share.
Prior to September 30, 2016, the $100 million convertible debentures may be redeemed in whole or in part from time to time at the option of the Company on not more than 60 days’ and not less than 30 days’ prior notice, at a price equal to their principal amount plus accrued and unpaid interest, provided that the weighted average trading price of the common shares of Just Energy on the Toronto Stock Exchange for the 20 consecutive trading days ending five trading days preceding the date on which the notice of redemption is given is at least 125% of the conversion price. On or after September 30, 2016, the $100 million convertible debentures may be redeemed in whole or in part from time to time at the option of the Company on not more than 60 days’ and not less than 30 days’ prior notice, at a price equal to their principal amount plus accrued and unpaid interest.
$150M CONVERTIBLE BONDS
In January 2014, Just Energy issued US$150 million of European-focused senior unsecured convertible bonds, which bear interest at an annual rate of 6.5%, payable semi-annually in arrears in equal installments on January 29 and July 29 in each year. The maturity date of the $150m convertible bonds is July 29, 2019.
A Conversion Right in respect of a bond may be exercised, at the option of the holder thereof, at any time (the “Conversion Period”) (subject to any applicable fiscal or other laws or regulations and as hereinafter provided) from May 30, 2014 (being the date falling four months and one day after the closing date) to the close of business on the business day falling 22 business days prior to the final maturity date. The initial
conversion price is US$9.3762 per common share (being C$10.2819 translated into U.S. dollars at the fixed exchange rate) but is subject to adjustments.
Contractual obligations
In the normal course of business, Just Energy is obligated to make future payments for contracts and other commitments that are known and non-cancellable.
PAYMENTS DUE BY PERIOD
(thousands of dollars)
| | | Total | | | Less than 1 year | | | 1 – 3 years | | | 4 – 5 years | | | After 5 years | |
| Trade and other payables | | $ | 458,922 | | | $ | 458,922 | | | $ | - | | | $ | - | | | $ | - | |
| Long-term debt (contractual cash flow) | | | 696,221 | | | | - | | | | 501,416 | | | | 194,805 | | | | - | |
| Interest payments | | | 91,031 | | | | 42,586 | | | | 43,570 | | | | 4,875 | | | | - | |
| Premises and equipment leasing | | | 30,287 | | | | 6,216 | | | | 9,565 | | | | 6,493 | | | | 8,013 | |
| Long-term gas and electricity contracts | | | 3,808,888 | | | | 2,099,984 | | | | 1,442,238 | | | | 231,227 | | | | 35,439 | |
| | | $ | 5,085,349 | | | $ | 2,607,708 | | | $ | 1,996,789 | | | $ | 437,400 | | | $ | 43,452 | |
OTHER OBLIGATIONS
In the opinion of management, Just Energy has no material pending actions, claims or proceedings that have not been included either in its accrued liabilities or in the consolidated financial statements. In the normal course of business, Just Energy could be subject to certain contingent obligations that become payable only if certain events were to occur. The inherent uncertainty surrounding the timing and financial impact of any events prevents any meaningful measurement, which is necessary to assess any material impact on future liquidity. Such obligations include potential judgments, settlements, fines and other penalties resulting from actions, claims or proceedings.
Transactions with related parties
Just Energy does not have any material transactions with any individuals or companies that are not considered independent of Just Energy or any of its subsidiaries and/or affiliates.
Off balance sheet items
The Company has issued letters of credit in accordance with its credit facility totalling $130.0 million to various counterparties, primarily utilities in the markets where it operates, as well as suppliers.
Pursuant to separate arrangements with several bond agencies, The Hanover Insurance Group and Charter Brokerage LLC, Just Energy has issued surety bonds to various counterparties including states, regulatory bodies, utilities and various other surety bond holders in return for a fee and/or meeting certain collateral posting requirements. Such surety bond postings are required in order to operate in certain states or markets. Total surety bonds issued as at March 31, 2016 were $52.9 million.
Critical accounting estimates
The consolidated financial statements of Just Energy have been prepared in accordance with IFRS. Certain accounting policies require management to make estimates and judgments that affect the reported amounts of assets, liabilities, revenues, cost of sales, selling and marketing, and administrative expenses. Estimates are based on historical experience, current information and various other assumptions that are believed to be reasonable under the circumstances. The emergence of new information and changed circumstances may result in actual results or changes to estimated amounts that differ materially from current estimates.
The following assessment of critical accounting estimates is not meant to be exhaustive. Just Energy might realize different results from the application of new accounting standards promulgated, from time to time, by various rule-making bodies.
IMPAIRMENT OF NON-FINANCIAL ASSETS
Just Energy performed its annual impairment test as at March 31, 2016. Just Energy considers the relationship between its market capitalization and its book value, among other factors, when reviewing for indicators of impairment. As at March 31, 2016, the market capitalization of Just Energy was above the book value of its equity, indicating that a potential impairment of goodwill and intangible assets with indefinite lives does not exist.
The recoverable amount of each of the cash generating units has been determined based on a value-in-use calculation using cash flow projections from financial budgets covering a five-year period. The projections for the first year have been approved by the Audit Committee; the assumptions used in the following years have been approved by the senior management. The calculation of the value-in-use for each unit is most sensitive to the following assumptions:
| | · | Customer consumption assumptions used in determining gross margin; |
| | · | New customer additions, attrition and renewals; |
| | · | Selling and marketing costs; |
| | · | Growth rates used to extrapolate cash flows beyond the budget period. |
Customer consumption is forecasted using normalized historical correlation between weather and customer consumption and weather projections. Just Energy uses weather derivatives to mitigate the risk that weather will deviate from expectations. An average customer consumption growth rate of 10% was used in the projections. A 5% decrease in the consumption assumptions would not have an impact on the results of the impairment test.
New customer additions and attrition and renewal rate estimates are based on historical results and are adjusted for new marketing initiatives that are included in the budget. A 10% average increase in the overall customer base was used in the projections. A 5% decrease annually in the overall customer base would not have an impact on the results of the impairment test.
Selling costs fluctuate with customer additions, renewals and attrition. Selling costs used in the financial forecast are based on assumptions consistent with the above new customer additions, renewals and attritions. Rates used are based on historical information and are adjusted for new marketing initiatives included in the budget. An average increase of 10% was applied to selling costs in the projections. A 5% increase annually in selling costs would not have an impact on the results of the impairment test.
Discount rates represent the current market assessment of the risks specific to the Company, regarding the time value of money and individual risks of the underlying assets. The discount rate calculation is based on the specific circumstances of Just Energy and its operating segments and is derived from its weighted average cost of capital (“WACC”). The WACC takes into account both debt and equity. The cost of equity is derived from the expected return on investment by Just Energy’s investors, and the cost of debt is based on the interest-bearing borrowings the Company is obliged to service. Just Energy used a discount rate of 10%. A 5% increase in the WACC would not have an impact on the results of the impairment test.
In addition to the above assumptions, the expected forecasted performance assumes that there will not be any new legislation that will have a negative impact on Just Energy’s ability to market its products in the jurisdictions in which it currently operates. Any changes in legislation would only impact the respective jurisdiction. This item is out of the control of management and cannot be predicted. Management has used all information available to prepare its financial projections.
DEFERRED TAXES
In accordance with IFRS, Just Energy uses the liability method of accounting for income taxes. Under the liability method, deferred income tax assets and liabilities are recognized on the differences between the carrying amounts of assets and liabilities and their respective income tax basis.
Preparation of the consolidated financial statements involves determining an estimate of, or provision for, income taxes in each of the jurisdictions in which Just Energy operates. The process also involves making an estimate of taxes currently payable and taxes expected to be payable or recoverable in future periods,
referred to as deferred income taxes. Deferred income taxes result from the effects of temporary differences due to items that are treated differently for tax and accounting purposes. The tax effects of these differences are reflected in the consolidated statements of financial position as deferred income tax assets and liabilities. An assessment must also be made to determine the likelihood that our future taxable income will be sufficient to permit the recovery of deferred income tax assets. To the extent that such recovery is not probable, deferred income tax assets must be reduced. The reduction of the deferred income tax asset can be reversed if the estimated future taxable income improves. No assurances can be given as to whether any reversal will occur or as to the amount or timing of any such reversal. Management must exercise judgment in its assessment of continually changing tax interpretations, regulations and legislation to ensure deferred income tax assets and liabilities are complete and fairly presented. Assessments and applications differing from our estimates could materially impact the amount recognized for deferred income tax assets and liabilities.
Deferred income tax assets of $41.0 million and $26.6 million have been recorded on the consolidated statements of financial position as at March 31, 2016 and March 31, 2015, respectively. These assets primarily relate to mark to market losses on our derivative financial instruments. Management believes there will be sufficient taxable income that will permit the use of these future tax assets in the tax jurisdictions where they exist. When evaluating the future tax position, Just Energy assesses its ability to use deferred tax assets based on expected taxable income in future periods. As at March 31, 2016, no deferred tax assets were recognized in the U.S.
Deferred income tax liabilities of $1.4 million and $1.3 million have been recorded on the consolidated statements of financial position as at March 31, 2016 and March 31, 2015, respectively. These liabilities are primarily due to unrealized foreign exchange gain which, when realized, will be recognized for tax purposes.
Fluctuations in deferred tax balances are primarily driven by changes in the fair value of derivative financial instruments. Any increase or decrease in the fair value of the derivative financial instruments will decrease or increase the net tax asset position by the effective tax rate of the entity.
SUBSIDIARIES
Subsidiaries that are not wholly owned by Just Energy require judgment in determining the amount of control that Just Energy has over that entity and the appropriate accounting treatments. In these consolidated financial statements, management has determined that Just Energy controls Just Ventures and, therefore, has treated the 50% that is not owned by Just Energy as a non-controlling interest.
USEFUL LIFE OF KEY PROPERTY, PLANT AND EQUIPMENT AND INTANGIBLE ASSETS
Each significant component is depreciated over its estimated useful life. A component can be separately identified as an asset and is expected to provide a benefit of greater than one year. Estimated useful lives are determined based on current facts and past experience, and take into consideration the anticipated physical life of the asset, existing long-term sales agreements and contracts, current and forecasted demand, and the potential for technological obsolescence and regulations. The useful lives of property, plant and equipment and depreciation rates used are reviewed at least annually to ensure they continue to be appropriate.
Depreciation and amortization expense from continuing operations for the year ended March 31, 2016 recorded in the consolidated statements of income (loss) was $42.7 million compared with $76.0 million for the year ended March 31, 2015.
Fair value of financial instruments and risk management
Just Energy has entered into a variety of derivative financial instruments as part of the business of purchasing and selling gas, electricity and JustGreen supply. Just Energy enters into contracts with customers to provide electricity and gas at fixed prices and provide comfort to certain customers that a specified amount of energy will be derived from green generation or carbon destruction. These customer contracts expose Just Energy to changes in market prices to supply these commodities. To reduce the exposure to the commodity market price changes, Just Energy uses derivative financial and physical contracts to secure fixed-price commodity supply to cover its estimated fixed-price delivery or green commitment.
Just Energy’s objective is to minimize commodity risk, other than consumption changes, usually attributable to weather. Accordingly, it is Just Energy’s policy to hedge the estimated fixed-price requirements of its customers with offsetting hedges of natural gas and electricity at fixed prices for terms equal to those of the customer contracts. The cash flow from these supply contracts is expected to be effective in offsetting Just Energy’s price exposure and serves to fix acquisition costs of gas and electricity to be delivered under the fixed-price or price-protected customer contracts. Just Energy’s policy is not to use derivative instruments for speculative purposes.
Just Energy’s U.S. and U.K. operations introduce foreign exchange-related risks. Just Energy enters into foreign exchange forwards in order to hedge its exposure to fluctuations in cross border cash flows.
The consolidated financial statements are in compliance with IAS 32, Financial Instruments: Presentation; IAS 39, Financial Instruments: Recognition and Measurement; and IFRS 7, Financial Instruments: Disclosure. All the mark to market changes on Just Energy’s derivative instruments are recorded on a single line on the consolidated income statement. Due to commodity volatility and to the size of Just Energy, the swings in mark to market on these positions will increase the volatility in Just Energy’s earnings.
The Company’s financial instruments are valued based on the following fair value (“FV”) hierarchy:
LEVEL 1
The fair value measurements are classified as Level 1 in the FV hierarchy if the fair value is determined using quoted unadjusted market prices.
LEVEL 2
Fair value measurements that require observable inputs other than quoted prices in Level 1, either directly or indirectly, are classified as Level 2 in the FV hierarchy. This could include the use of statistical techniques to derive the FV curve from observable market prices. However, in order to be classified under Level 2, inputs must be directly or indirectly observable in the market. Just Energy values its New York Mercantile Exchange (“NYMEX”) financial gas fixed-for-floating swaps under Level 2.
LEVEL 3
Fair value measurements that require unobservable market data or use statistical techniques to derive forward curves from observable market data and unobservable inputs are classified as Level 3 in the FV hierarchy. For the supply contracts, Just Energy uses quoted market prices as per available market forward data and applies a price-shaping profile to calculate the monthly prices from annual strips and hourly prices from block strips for the purposes of mark to market calculations. The profile is based on historical settlements with counterparties or with the system operator and is considered an unobservable input for the purpose of establishing the level in the FV hierarchy. For the natural gas supply contracts, Just Energy uses three different market observable curves: i) Commodity (predominately NYMEX), ii) Basis and iii) Foreign exchange. NYMEX curves extend for over five years (thereby covering the length of Just Energy’s contracts); however, most basis curves only extend 12 to 15 months into the future. In order to calculate basis curves for the remaining years, Just Energy uses extrapolation, which leads natural gas supply contracts to be classified under Level 3.
For the share swap, Just Energy uses a forward interest rate curve along with a volume weighted average share price. The Eurobond conversion feature is valued using an option pricing model.
Fair value measurement input sensitivity
The main cause of changes in the fair value of derivative instruments is changes in the forward curve prices used for the fair value calculations. Below is a sensitivity analysis of these forward curves. Other inputs, including volatility and correlations, are driven off historical settlements.
COMMODITY PRICE RISK
Just Energy is exposed to market risks associated with commodity prices and market volatility where estimated customer requirements do not match actual customer requirements. Management actively monitors these positions on a daily basis in accordance with its Risk Management Policy. This policy sets out a variety of limits, most importantly, thresholds for open positions in the gas and electricity portfolios, which also feed a Value at Risk limit. Should any of the limits be exceeded, they are closed expeditiously
or express approval to continue to hold is obtained. Just Energy’s exposure to market risk is affected by a number of factors, including accuracy of estimation of customer commodity requirements, commodity prices, and volatility and liquidity of markets. Just Energy enters into derivative instruments in order to manage exposures to changes in commodity prices. The derivative instruments used are designed to fix the price of supply for estimated customer commodity demand and thereby fix margins such that shareholder dividends can be appropriately established. Derivative instruments are generally transacted over the counter. The inability or failure of Just Energy to manage and monitor the above market risks could have a material adverse effect on the operations and cash flows of Just Energy. Just Energy mitigates the exposure to variances in customer requirements that are driven by changes in expected weather conditions, through active management of the underlying portfolio, which involves, but is not limited to, the purchase of options including weather derivatives. Just Energy’s ability to mitigate weather effects is limited by the degree to which weather conditions deviate from normal.
COMMODITY PRICE SENSITIVITY – ALL DERIVATIVE FINANCIAL INSTRUMENTS
If all the energy prices associated with derivative financial instruments including natural gas, electricity, verified emission-reduction credits and renewable energy certificates had risen (fallen) by 10%, assuming that all the other variables had remained constant, income before income taxes for the year ended March 31, 2016 would have increased (decreased) by $218.4 million ($218.0 million) primarily as a result of the change in fair value of Just Energy’s derivative instruments.
COMMODITY PRICE SENSITIVITY – LEVEL 3 DERIVATIVE FINANCIAL INSTRUMENTS
If the energy prices associated with only Level 3 derivative instruments including natural gas, electricity, verified emission-reduction credits and renewable energy certificates had risen (fallen) by 10%, assuming that all the other variables had remained constant, income before income taxes for the year ended March 31, 2016 would have increased (decreased) by $197.1 million ($196.8 million) primarily as a result of the change in fair value of Just Energy’s derivative instruments.
RECEIVABLES AND ALLOWANCE FOR DOUBTFUL ACCOUNTS
The allowance for uncollectible accounts reflects Just Energy’s best estimates of losses on the accounts receivable balances. Just Energy determines the allowance for doubtful accounts on customer receivables by applying loss rates based on historical results to the outstanding receivable balance. Just Energy is exposed to customer credit risk on its continuing operations in Alberta, Texas, Illinois, Ohio, Delaware, California, Michigan and Georgia and commercial direct-billed accounts in British Columbia, New York and Ontario. Credit review processes have been implemented to perform credit evaluations of customers and manage customer default. If a significant number of customers were to default on their payments, it could have a material adverse effect on the operations and cash flows of Just Energy. Management factors default from credit risk in its margin expectations for all the above markets.
Revenues related to the sale of energy are recorded when energy is delivered to customers. The determination of energy sales to individual customers is based on systematic readings of customer meters generally on a monthly basis. At the end of each month, amounts of energy delivered to customers since the date of the last meter reading are estimated, and corresponding unbilled revenue is recorded. The measurement of unbilled revenue is affected by the following factors: daily customer usage, losses of energy during delivery to customers and applicable customer rates.
Increases in volumes delivered to the utilities’ customers and favourable rate mix due to changes in usage patterns in the period could be significant to the calculation of unbilled revenue. Changes in the timing of meter reading schedules and the number and type of customers scheduled for each meter reading date would also have an effect on the measurement of unbilled revenue; however, total operating revenues would remain materially unchanged.
Just Energy common shares
As at May 18, 2016, there were 147,196,778 common shares of Just Energy outstanding.
Normal course issuer bid
Just Energy has the ability to make a normal course issuer bid to purchase for cancellation a portion of the outstanding $330m convertible debentures, $100m convertible debentures as well as the Just Energy common shares up to March 16, 2017. Under each NCIB, Just Energy may purchase debentures and common shares representing 10% of the outstanding public float at close of business February 29, 2016
up to daily and total limits. For the year ended March 31, 2016, Just Energy had purchased $7.0 million (2015 - $1.6 million) of the $330m convertible debentures.
Just Energy believes that the debentures and common shares may trade in a range that may not fully reflect their value. As a result, Just Energy believes that the purchase of the debentures and common shares from time to time can be undertaken at prices that make the acquisition of such securities an appropriate use of Just Energy’s available funds. In addition, purchases under each of the NCIBs may increase the liquidity of the debentures and common shares and will enable Just Energy to deleverage its balance sheet. Just Energy intends to continue to buy back debentures and common shares when the circumstances present themselves in a way that maximizes value for Just Energy. The Company’s current priority is the repurchase of debentures at attractive prices.
Accounting standards issued but not yet applied
IFRS 9, Financial Instruments (“IFRS 9”) was issued by the IASB on July 24, 2014, and will replace IAS 39. IFRS 9 uses a single approach to determine whether a financial asset is measured at amortized cost or fair value, replacing the multiple rules in IAS 39. The approach in IFRS 9 is based on how an entity manages its financial instruments in the context of its business model and the contractual cash flow characteristics of the financial assets. Two measurement categories continue to exist to account for financial liabilities in IFRS 9, fair value through profit or loss (“FVTPL”) and amortized cost. Financial liabilities held for trading are measured at FVTPL, and all other financial liabilities are measured at amortized cost unless the fair value option is applied. The treatment of embedded derivatives under the new standard is consistent with IAS 39 and is applied to financial liabilities and non-derivative hosts not within the scope of the standard. IFRS 9 also uses a new model for hedge accounting aligning the accounting treatment with risk management activities. IFRS 9 is effective for annual periods beginning on or after January 1, 2018. Management is currently evaluating the impact of IFRS 9 on the consolidated financial statements.
IFRS 11, Joint Arrangements (“IFRS 11”) Accounting for Acquisitions of Interests in Joint Operations requires an entity acquiring an interest in a joint operation in which the activity of the joint operation constitutes a business to apply, to the extent of its share, all of the principles on business combination accounting in IFRS 3, Business Combinations, and other IFRS, that do not conflict with the requirements of IFRS 11. Furthermore, entities are required to disclose the information required in those IFRS in relation to business combinations. The amendments also apply to an entity on the formation of a joint operation if, and only if, an existing business is contributed by the entity to the joint operation on its formation. The amendments also clarify that for the acquisition of an additional interest in a joint operation in which the activity of the joint operation constitutes a business, previously held interests in the joint operation must not be re-measured if the joint operator retains joint control. These amendments are effective for annual periods beginning on or after January 1, 2016, with early adoption permitted. The Company does not expect this standard to have any impact on the consolidated financial statements.
IFRS 15, Revenue from Contracts with Customers, (“IFRS 15”), establishes a five-step model that will apply to revenue earned from a contract with a customer, regardless of the type of revenue transaction or industry. The standard will also provide guidance on the recognition and measurement of gains and losses on the sale of some non-financial assets that are not an output of the entity’s ordinary activities. The standard also outlines increased disclosures that will be required, including disaggregation of total revenue, information about performance obligations, changes in contract asset and liability account balances between periods and key judgments and estimates made. IFRS 15 is effective for annual periods beginning on or after January 1, 2018. Management is currently evaluating the impact of IFRS 15 on the consolidated financial statements.
IAS 16 and IAS 38, Property, Plant and Equipment and Intangible Assets (“IAS 16 and 38”), clarify the acceptable methods of depreciation and amortization where revenue reflects a pattern of economic benefits generated from operating a business (of which the asset is part) rather than the economic benefits that are consumed through use of the asset. As a result, a revenue-based method cannot be used to depreciate property, plant and equipment and may only be used in very limited circumstances to amortize
intangible assets. These amendments are effective for annual periods beginning on or after January 1, 2016, with early adoption permitted. Just Energy does not expect these amendments to have any impact on the consolidated financial statements.
Amendments to IAS 1, Presentation of Financial Statements (“IAS 1”), were issued to address perceived impediments to preparers exercising their judgment in presenting their financial reports. Specific clarifications in the areas of materiality, aggregation and disaggregation of financial statement line items and the ordering of footnotes have been provided. The amendments are effective for annual periods beginning on or after January 1, 2016, with early adoption permitted. Just Energy does not expect this standard to have any impact on the consolidated financial statements.
IFRS 16, Leases(“IFRS 16”), was issued by the IASB in January 2016. This guidance brings most leases onto the balance sheet for lessees under a single model, eliminating the distinction between operating and finance leases. Lessor accounting remains largely unchanged and the distinction between operating and finance leases is retained. Furthermore, per the standard, a lessee recognizes a right-of-use asset and a lease liability. The right-of-use asset is treated similarly to other non-financial assets and depreciated accordingly, and the liability accrues interest. The lease liability is initially measured at the present value of the lease payments payable over the lease term, discounted at the rate implicit in the lease. Lessees are permitted to make an accounting policy election, by class of underlying asset, to apply a method like IAS 17’s operating lease accounting and not recognize lease assets and lease liabilities for leases with a lease term of 12 months or less, and on a lease-by-lease basis, to apply a method similar to current operating lease accounting to leases for which the underlying asset is of low value. IFRS 16 supersedes IAS 17, Leases, and related interpretations, and is effective for periods beginning on or after January 1, 2019, with earlier adoption permitted if IFRS 15 has also been applied. Just Energy has not yet assessed the impact of this standard.
Described below are the principal risks and uncertainties that Just Energy can foresee. It is not an exhaustive list, as some future risks may be as yet unknown and other risks, currently regarded as immaterial, could turn out to be material.
MARKET RISK
Market risk is a potential loss that may be incurred as a result of changes in the market or fair value of a particular instrument or commodity.
Commodity price risk
Just Energy’s cost to serve its retail energy customers is exposed to fluctuations in commodity prices. Although Just Energy enters into commodity derivative instruments with its suppliers to manage the commodity price risks, it is exposed to commodity price risk where estimated customer requirements do not match actual customer requirements or where it is not able to exactly purchase the estimated customer requirements. In such cases, Just Energy may suffer a loss if it is required to sell excess supply in the spot market (compared to its weighted average cost of supply) or to purchase additional supply in the spot market. Such losses could have a material adverse impact on Just Energy’s operating results, cash flow and liquidity.
A key risk to Just Energy’s business model is a sudden and significant drop in the commodity market price resulting in an increase in customer churn, regulatory pressure and resistance on enforcement of liquidation damages and enactment of provisions to reset the customer price to current market price levels which could have significant impact on Just Energy’s business.
Commodity volume balancing risk
Depending on several factors including weather, Just Energy’s customers may use more or less commodity than the volume purchased by Just Energy for delivery to them. Just Energy bears the financial responsibility, is exposed to market risk and, furthermore, may also be exposed to penalties by the LDCs for balancing the customer volume requirements. Although Just Energy manages the volume balancing
risk through balancing language in some of its retail energy contracts, enters into weather derivative transactions to mitigate weather risk, and leverages natural gas storage facilities to manage daily delivery requirements, increased costs and/or losses resulting from occurrences of volume imbalance net of Just Energy’s risk management activities could have a material adverse impact on Just Energy’s operating results, cash flow and liquidity.
Interest rate risk
Just Energy is exposed to interest rate risk associated with its credit facility. Current exposure to interest rate risk associated with its credit facility does not economically warrant the use of derivative instruments.
Foreign exchange rate risk
Just Energy is exposed to foreign exchange risk on repatriation of U.S. dollar denominated and U.K. pound denominated income against Canadian dollar denominated dividends. In addition, Just Energy is exposed to translation risk on U.S. dollar and U.K. pound denominated earnings and foreign investments. Just Energy enters into foreign exchange derivative instruments to manage the cash flow risk on repatriation of foreign funds. Currently, Just Energy does not enter into derivative instruments to manage foreign exchange translation risk. Large fluctuations in foreign exchange rates may have a significant impact on Just Energy’s earnings and cash flow. In particular, a significant rise in the relative value of the Canadian dollar to the U.S. dollar or U.K. pound could materially reduce reported earnings and cash flow.
LIQUIDITY RISK
Just Energy is at risk of not being able to settle its future debt obligations including convertible debentures and commercial notes. Increase in liquidity risk may put Just Energy’s cash dividend at risk or require Just Energy to raise additional funds. Liquidity risk may cause Just Energy to close down, sell or otherwise dispose of all or part of the business of Just Energy’s subsidiaries.
Credit agreement and other debt
Just Energy maintains a credit facility of up to $277.5 million for working capital purposes, pursuant to a credit agreement with various lenders (the “Credit Agreement”). The lenders under the Credit Agreement, together with certain suppliers of Just Energy and its affiliates are party to the Credit Agreement and related security agreement, which provide for a joint security interest over all customer contracts. There are various covenants pursuant to the Credit Agreement that govern activities of Just Energy and its affiliates. The restrictions in the Credit Agreement may adversely affect Just Energy’s ability to finance its future operations and capital needs and to pursue available business opportunities. Should Just Energy or its subsidiary default under the terms of the Credit Agreement, the credit facility thereunder may become unavailable and may materially reduce Just Energy’s liquidity. There can be no assurance that Just Energy would be able to obtain alternative financing or that such financing would be on terms favourable to Just Energy. In addition, Just Energy may not be able to extend, renew or refinance the credit facility on terms favourable to Just Energy, or at all, which would materially and adversely affect Just Energy’s liquidity position, in which case Just Energy could be forced to sell assets or secure additional financing to make up for any shortfall in its payment obligations under unfavourable circumstances.
Just Energy has significant levels of other debt, including convertible debentures and bonds and a senior unsecured note, which could further limit Just Energy's ability to obtain additional financing for working capital, capital expenditures, debt service requirements, restructuring, acquisitions or general corporate purposes, which could make Just Energy more vulnerable to economic downturns and adverse industry developments or limit flexibility in planning for or reacting to changes in its business. There can be no assurance that Just Energy would be able to refinance or replace such debt on terms favourable to Just Energy, or at all, which would materially and adversely affect Just Energy's liquidity position.
Working capital requirements (availability of credit)
In several markets where Just Energy operates, payment is provided to Just Energy by LDCs only when the customer has paid the LDC for the consumed commodity, rather than when the commodity is delivered. Just Energy also manages natural gas storage facilities where Just Energy must inject natural gas in advance of payment. These factors, along with seasonality in energy consumption, create a working capital requirement necessitating the use of Just Energy’s available credit. In addition, Just Energy and its
subsidiaries are required to post collateral to LDCs and Electricity System Operators. Any changes in payment terms managed by LDCs, any increase in cost of carrying natural gas storage inventory, and any increase in collateral posting requirements could result in significant liquidity risk to Just Energy.
Earnings seasonality and volatility
Just Energy’s business is seasonal in nature. In addition to regular seasonal fluctuations in its earnings, there is significant volatility in its earnings associated with the requirement to mark its commodity contracts to market. The earnings volatility associated with seasonality and mark to market accounting may affect the ability of Just Energy to access capital and increase its liquidity risk.
Cash dividends are not guaranteed
The ability to pay dividends and the actual amount of dividends will depend upon numerous factors, including profitability, fluctuations in working capital, debt service requirements (including compliance with Credit Agreement obligations) and the sustainability of margins. Cash dividends are not guaranteed and will fluctuate with the performance of Just Energy and the availability of cash liquidity from ongoing business operations.
Share ownership dilution
Just Energy may issue an unlimited number of common shares and up to 50,000,000 preferred shares without the approval of shareholders which would dilute existing shareholders’ interests.
SUPPLY COUNTERPARTY RISK
Counterparty risk is a loss that Just Energy would incur if a counterparty fails to perform under its contractual obligations
Credit risk
Just Energy enters into long-term derivative contracts with its counterparties. If a derivative counterparty were to default on its contractual obligations, Just Energy would be required to replace its contracted commodities or instruments at prevailing market prices, which would negatively affect related customer margin or cash flows.
Supply delivery risk
Just Energy’s business model is based on contracting for supply of electricity or natural gas to deliver to its customers. Failure by Just Energy’s supply counterparties to deliver these commodities to Just Energy due to business failure, supply shortage, force majeure, or any other failure of such counterparties to perform their obligations under the applicable contracts would put Just Energy at risk of not meeting its delivery requirements with LDCs, thereby resulting in penalties, price risk, liquidity and collateral risk and may have a significant impact on the business, financial condition, results of operations and cash flows of Just Energy.
LEGAL AND REGULATORY RISK
Legal and regulatory risk is a potential loss that may be incurred as a result of changes in regulations or legislation affecting Just Energy’s business model, costs or operations, as well as being a risk of potential litigation against Just Energy resulting in impact to Just Energy’s cash flow.
Regulatory environment
Just Energy may receive complaints from consumers which may involve sanctions from regulatory and legal authorities. The most significant potential sanction is the suspension or revocation of a license which would prevent Just Energy from selling in a particular jurisdiction.
Changes to consumer protection legislation may impact Just Energy’s business model and may include additional measures that require additional administration together with potential impacts to contracting, renewal and retention rates.
Just Energy is exposed to changes in energy market regulations that may put onus on Just Energy to adhere to stricter renewable energy compliance standards, procure additional volume of capacity and
transmission units and pay regulated tariff and charges for transmission and distribution of energy, which may change from time to time. In certain cases, Just Energy may not be able to pass through the additional costs from changes in energy market regulations to its customers that may impact Just Energy’s business, financial condition and cash flows.
Just Energy’s business model involves entering into derivative financial instruments to manage commodity price and supply risk. Financial reforms in the U.S., Canada and Europe may require Just Energy to comply with certain aspects of reporting, record keeping, position limits and other risk mitigation and price transparency rules that result in increased scrutiny of commodity procurement activities. Costs resulting from Just Energy’s compliance with certain new regulatory requirements as well as increased costs of doing business with Just Energy’s counterparties who may be subject to even greater regulatory requirements could have a material impact on Just Energy’s business.
Litigation
In addition to the litigation referenced herein (see “Legal proceedings” on page XX) and occurring in the ordinary course of business, Just Energy may in the future be subject to class actions and other actions arising in relation to its consumer contracts and marketing practices. This litigation is, and any such additional litigation could be, time consuming and expensive and could distract the executive team from the conduct of Just Energy’s daily business and may result in costly settlement arrangements. An adverse resolution or reputational damage of any specific lawsuit could have a material adverse effect on Just Energy’s business or results of operations and the ability to favourably resolve other lawsuits.
In certain jurisdictions, independent contractors that contract with Just Energy to provide door-to-door sales have made claims, either individually or as a class, that they are entitled to employee benefits such as minimum wage or overtime pursuant to legislation, even though they have entered into a contract with Just Energy that provides that they are not entitled to benefits normally available to employees. Just Energy’s position has been confirmed in some instances and overturned by regulatory bodies and courts in others, and some of these decisions are under appeal. Should the regulatory bodies or claimants ultimately be successful, Just Energy would be required to remit unpaid tax amounts plus interest and might be assessed a penalty, of which amounts could be substantial.
RETAIL RISK
Retail customer risk is a potential loss that may be incurred as a result of change in customer behaviour and from an increase in competition in the retail energy industry.
Consumer contract attrition and renewal rates
Just Energy may experience an increase in attrition rates and lower acceptance rates on renewal requests due to commodity price volatility, increased competition or change in customer behaviour. There can be no assurance that the historical rates of annual attrition will not increase substantially in the future or that Just Energy will be able to renew its existing energy contracts at the expiry of their terms. Any such increase in attrition or failure to renew could have a material adverse impact on Just Energy’s business, financial condition, operating results, cash flow, liquidity and prospects.
Customer credit risk
Just Energy has credit risk in various markets where bills are sent directly to customers for energy consumption from Just Energy. If a significant number of direct bill customers were to default on their payments, it could have a material adverse effect on the results of operations, cash flow and liquidity of Just Energy.
For the remaining customers, the LDCs provide collection services and assume the risk of any bad debts owing from Just Energy’s customers for a fee. There is no assurance that the LDCs that provide these services will continue to do so in the future, which would mean that Just Energy would have to accept additional customer credit risk.
Competition
A number of companies and incumbent utility subsidiaries compete with Just Energy in the residential, commercial and small industrial market. It is possible that new entrants may enter the market as marketers
and compete directly for the customer base that Just Energy targets, slowing or reducing its market share. If the LDCs are permitted by changes in the current regulatory framework to sell natural gas or electricity at prices other than at cost, their existing customer bases could provide them with a significant competitive advantage. This could limit the number of customers available for marketers, including Just Energy, and impact Just Energy’s growth and retention.
BUSINESS OPERATIONS RISKS
Business operations risk is a potential loss occurring from an unplanned interruption or cyber-attack, manual or system errors, or business earnings risk unique to the retail energy sales industry.
Cyber risk
Just Energy’s business requires retaining important customer information that is considered private, such as name, address, banking and payment information, drivers’ licenses, and Social Security and Social Insurance numbers. Although Just Energy protects this information with restricted access and enters into cyber risk insurance policies, there could be a significant adverse impact to the business, reputation and customer relations should the private information be compromised due to a cyber-attack on Just Energy’s information technology systems.
Just Energy’s vendors, suppliers and market operators rely on information technology systems to deliver services to Just Energy. These systems may be prone to cyber-attacks, which could result in market disruption and impact Just Energy’s business operations, finances and cash.
Just Energy is also subject to federal, state, provincial and foreign laws regarding privacy and protection of data. Changes to such data protection laws may impose more stringent requirements for compliance and impose significant penalties for non-compliance. Just Energy’s failure to comply with federal, state, provincial and foreign laws regarding privacy and protection of data could lead to significant fines and penalties imposed by regulators, as well as claims by our customers. There can be no assurance that the limitations of liability in Just Energy’s contracts would be enforceable or adequate or would otherwise protect Just Energy from any such liabilities or damages with respect to any particular claim. The successful assertion of one or more large claims against Just Energy that exceeds its available insurance coverage could have an adverse effect on our business, financial condition and results of operations.
Information technology systems
Just Energy relies on Information Technology (“IT”) systems to store critical information, generate financial forecasts, report financial results and make applicable securities law filings. Just Energy also relies on IT systems to make payments to suppliers, pay commissions to brokers and independent contractors, enroll new customers, send monthly bills to customers and collect payments from customers. Failure of these systems could have a material adverse effect on Just Energy’s business and financial prospects or cause it to fail to meet its reporting obligations, which could result in a suspension or delisting of its common shares.
Model risk
The approach to calculation of market value and customer forecasts requires data-intensive modelling used in conjunction with certain assumptions when independently verifiable information is not available. Although Just Energy uses industry standard approaches and validates its internally developed models, should underlying assumptions prove incorrect or an embedded modelling error go undetected in the vetting process, this could result in incorrect estimates and thereby have a material adverse impact on Just Energy’s business, financial condition, results of operations, cash flow and liquidity.
Accounting estimates risks
Just Energy makes accounting estimates and judgments in the ordinary course of business. Such accounting estimates and judgments will affect the reported amounts of Just Energy's assets and liabilities at the date of its financial statements and the reported amounts of its operating results during the periods presented. Additionally, Just Energy interprets the accounting rules in existence as of the date of its financial statements when the accounting rules are not specific to a particular event or transaction. If the underlying estimates are ultimately proven to be incorrect, or if Just Energy's auditors or regulators subsequently interpret Just Energy's application of accounting rules differently, subsequent adjustments
could have a material adverse effect on Just Energy's operating results for the period or periods in which the change is identified. Additionally, subsequent adjustments could require Just Energy to restate historical financial statements.
Risks from adoption of new accounting standards or interpretations
Implementation of and compliance with changes in accounting rules and interpretations could adversely affect Just Energy's operating results or cause unanticipated fluctuations in its results in future periods. The accounting rules and regulations that Just Energy must comply with are complex and continually changing. While Just Energy believes that its financial statements have been prepared in accordance with IFRS, Just Energy cannot predict the impact of future changes to accounting principles or Just Energy's accounting policies on its financial statements going forward.
Risks from deficiencies in internal control over financial reporting
Just Energy may face risks if there are deficiencies in its internal control over financial reporting and disclosure controls and procedures. The Board of Directors, in coordination with the Audit Committee, is responsible for assessing the progress and sufficiency of internal control over financial reporting and disclosure controls and procedures and makes adjustments as necessary. Any deficiencies, if uncorrected, could result in Just Energy's financial statements being inaccurate and in future adjustments or restatements of Just Energy's historical financial statements, which could adversely affect the business, financial condition and results of operations of Just Energy.
Outsourcing and third party service agreements
Just Energy has outsourcing arrangements to support its call centre’s requirements for business continuity plans and independence for regulatory purposes, billing and settlement arrangements for certain jurisdictions, scheduling responsibilities in certain jurisdictions and operational support for its operations in the United Kingdom. Contract data input is also outsourced as is some corporate business continuity, IT development and disaster recovery functions. Should the outsourced counterparties not deliver their contracted services, Just Energy may experience service and operational gaps that adversely impact customer retention and aggregation and cash flows.
In most jurisdictions in which Just Energy operates, the LDCs currently perform billing and collection services. If the LDCs cease to perform these services, Just Energy would have to seek a third party billing provider or develop internal systems to perform these functions. This could be time consuming and expensive.
Disruption to infrastructure
Customers are reliant upon the LDCs to deliver their contracted commodity. LDCs are reliant upon the continuing availability of their distribution infrastructure. Any disruptions in this infrastructure as a result of a hurricane, act of terrorism, cyber-attack or otherwise could result in counterparties’ default and, thereafter, Just Energy enacting the force majeure clauses of their contracts. Under such severe circumstances there could be no revenue or margin for the affected areas.
Additionally, any disruptions to Just Energy’s operations or sales office may also have a significant impact on business and financial prospects. Although Just Energy has insurance policies that cover business interruption and natural calamities, in certain cases, the insurance coverage may not be sufficient to cover the potential loss.
OTHER RISKS
Share price volatility risk
The common shares currently trade on the Toronto Stock Exchange (“TSX”) and the New York Stock Exchange (“NYSE”). The trading price of the common shares has in the past been, and may in the future be, subject to significant fluctuations. These fluctuations may be caused by events related or unrelated to Just Energy's operating performance and beyond its control. Factors such as actual or anticipated fluctuations in Just Energy's operating results (including as a result of seasonality and volatility caused by mark to market accounting for commodity contracts), fluctuations in the share prices of other companies operating in business sectors comparable to those in which Just Energy operates, outcomes of litigation or
regulatory proceedings or changes in estimates of future operating results by securities analysts, among other things, may have a significant impact on the market price of the common shares. In addition, the stock market has experienced volatility, which often has been unrelated to the operating performance of the affected companies. These market fluctuations may materially and adversely affect the market price of the common shares, which may make it more difficult for holders of common shares to sell their shares.
Management retention risk
Just Energy's future success will depend on, among other things, its ability to keep the services of its management and to hire other highly qualified employees at all levels. Just Energy will compete with other potential employers for employees, and may not be successful in hiring and keeping the services of executives and other employees that it needs. The loss of the services of, or the inability to hire, executives or key employees could hinder Just Energy's business operations and growth.
Legal proceedings
Just Energy’s subsidiaries are party to a number of legal proceedings. Other than as set out below, Just Energy believes that each proceeding constitutes a routine legal matter incidental to the business conducted by Just Energy and that the ultimate disposition of the proceedings will not have a material adverse effect on its consolidated earnings, cash flows or financial position.
The State of California has filed a number of complaints with the Federal Energy Regulatory Commission (“FERC”) against many suppliers of electricity, including Commerce Energy Inc. (“CEI”), a subsidiary of the Company, with respect to events stemming from the 2001 energy crisis in California. On March 18, 2010, the assigned Administrative Law Judge granted a motion to strike the claim for all parties in one of the complaints (in favour of the suppliers), holding that California did not prove that the reporting errors masked the accumulation of market power. California has appealed the decision. On June 13, 2012, FERC denied the plaintiff’s request for a rehearing, affirming its initial decision. California appealed to the United States District Courts for the Ninth Circuit and oral arguments were heard on February 26, 2015. On April 29, 2015, the appeals court remanded the case back to FERC on grounds that the agency erred in assessing whether market power had resulted in unjust and unreasonable prices, when it considered power generation market share only. FERC ordered settlement conferences for all parties and a status conference for May 24, 2016 to schedule hearings and discuss next steps. CEI continues to vigorously contest this matter.
In March 2012, Davina Hurt and Dominic Hill filed a lawsuit against Commerce Energy Inc., Just Energy Marketing Corp. and the Company (collectively referred to as “Just Energy”) in the Ohio Federal Court claiming entitlement to payment of minimum wage and overtime under Ohio wage claim laws and the federal Fair Labor Standards Act (“FLSA”) on their own behalf and similarly situated door-to-door sales representatives who sold for Commerce in certain regions of the United States. The Court granted the plaintiffs’ request to certify the lawsuit as a class action. Approximately 1,800 plaintiffs opted into the federal minimum wage and overtime claims, and approximately 8,000 plaintiffs were certified as part of the Ohio state overtime claims. A jury trial on the liability phase was completed on October 6, 2014. The jury reached a verdict that supports the plaintiffs’ class and collective action that certain individuals were not properly classified as outside salespeople in order to qualify for an exemption under the minimum wage and overtime requirements pursuant to the FLSA and Ohio wage and hour laws. Potential amounts owing have yet to be determined and will be subject to a separate damage phase proceeding, which remains unscheduled by the Court. On January 9, 2015, the Court struck the plaintiffs’ damage expert report. Just Energy disagrees with the result of the October trial and is of the opinion that it is not supported by existing law and precedent. Just Energy strongly believes it complied with the law and continues to vigorously defend against the claims. The Court granted Just Energy’s request to file an interlocutory appeal of the liability finding, but the United States Court of Appeals for the Sixth Circuit denied the request. Appeal steps will be taken after conclusion of the damages phase of the trial.
In August 2013, Levonna Wilkins, a former door-to-door independent contractor for Just Energy Marketing Corp. (“JEMC”), filed a lawsuit against Just Energy Illinois Corp., Commerce Energy Inc., JEMC and the Company (collectively referred to as “Just Energy”) in the Illinois Federal District Court claiming entitlement to payment of minimum wage and overtime under Illinois wage claim laws and the FLSA on her own behalf and similarly situated door-to-door sales representatives who sold in Illinois. On March 13, 2015, the Court
granted Wilkins’ request to certify the lawsuit as a class action to include a class made up of Illinois sales representatives who sold for Just Energy Illinois and Commerce. Just Energy filed a motion for reconsideration objecting to the class definition and requested that the Court revise its ruling to exclude sales representatives who sold for Commerce, and the motion remains under advisement with the Court. On March 22, 2016, Just Energy’s summary judgment motion and motion for reconsideration of certain issues were denied. Just Energy will continue to vigorously contest this matter.
In March 2015, Kevin Flood, a former door-to-door independent contractor for Just Energy Marketing Corp., filed a lawsuit against JEMC, Just Energy New York Corp. and the Company (collectively referred to as “Just Energy”) in New York Federal District Court (Southern District) claiming entitlement to payment of minimum wage and overtime under New York wage claim laws and the FLSA on his own behalf and similarly situated door-to-door sales representatives who sold in New York. On January 25, 2016, the Court granted Flood’s request to certify the lawsuit as a class action for the FLSA claims to include a class made up of New York sales representatives who sold for Just Energy New York. The class opt in period expired on May 4, 2016. Just Energy filed a motion for summary judgment for dismissal of Flood’s claims, which remains pending. Just Energy vigorously contests this matter.
Controls and procedures
An evaluation was performed under the supervision and with the participation of the Company’s management, including the Co-Chief Executive Officers and Chief Financial Officer, of the effectiveness of the Company’s disclosure controls and procedures, as defined in the rules of the U.S. Securities and Exchange Commission and Canadian Securities Administrators, as of March 31, 2016. Based on that evaluation, the Company’s management, including the Co-Chief Executive Officers and Chief Financial Officer, concluded that the Company’s disclosure controls and procedures were effective as of March 31, 2016.
REPORT OF MANAGEMENT ON INTERNAL CONTROL OVER FINANCIAL REPORTING
The Company’s management is responsible for establishing and maintaining adequate internal control over financial reporting for the Company. The Company’s internal control over financial reporting includes those policies and procedures that (1) pertain to the maintenance of records, that, in reasonable detail, accurately and fairly reflect the transactions and dispositions of the assets of the Company; (2) provide reasonable assurance that transactions are recorded as necessary to permit preparation of financial statements in accordance with IFRS, and that receipts and expenditures of the Company are being made only in accordance with authorization of the Company’s management and directors; and (3) provide reasonable assurance regarding prevention or timely detection of unauthorized acquisition, use or disposition of the Company’s assets that could have a material effect on the financial statements.
The Company’s management has used the criteria established in the 2013 Internal Control – Integrated Framework issued by the Committee of Sponsoring Organizations of the Treadway Commission to assess, with the participation of the Co-Chief Executive Officers and Chief Financial Officer, the effectiveness of the Company’s internal control over financial reporting. Based on this assessment, management has concluded that as at March 31, 2016, the Company’s internal control over financial reporting was effective based on the applicable criteria. The effectiveness of the Company’s internal control over financial reporting has been audited by the independent auditors, Ernst & Young LLP, a registered public accounting firm that has also audited the Consolidated Financial Statements of the Company as of and for the year ended March 31, 2016. Their Report of Internal Controls under Standards of the Public Company Accounting Oversight Board (United States), included in the Consolidated Financial Statements, expresses an unqualified opinion on the effectiveness of the Company’s internal control over financial reporting as of March 31, 2016.
CHANGES IN INTERNAL CONTROL OVER FINANCIAL REPORTING
During the year ended March 31, 2016, there have been no changes in the Company’s policies and procedures and other processes that comprise its internal control over financial reporting, that materially affected, or are reasonably likely to materially affect, the Company’s internal controls over financial reporting.
Corporate governance
Just Energy is committed to maintaining transparency in its operations and ensuring its approach to governance meets all recommended standards. Full disclosure of Just Energy’s compliance with existing corporate governance rules is available at www.justenergygroup.com and is included in Just Energy’s Management Proxy Circular. Just Energy actively monitors the corporate governance and disclosure environment to ensure timely compliance with current and future requirements.
Outlook
Just Energy continues to deploy its strategy to become a world-class consumer enterprise delivering superior value to its customers through a wide range of energy management solutions and a multi-channel approach. Growth plans centre on geographic expansion, structuring superior product value propositions, and enhancing the Company’s portfolio of energy management offerings. The Company’s geographic expansion is centred on Europe where the Company expects to expand into two new European markets in fiscal 2017 and remains committed to evaluating further potential expansion in continental Europe and beyond over the longer term. Just Energy has initiated several superior value propositions. These include successfully rolling out the new flat-bill product in six new markets, piloting and launching energy management solutions such as Residential Solar in California and New York, and planning a new commercial energy storage pilot.
The fiscal 2016 earnings results exceeded management’s expectations based on the targets provided. The Company also took steps to strengthen its sales force through the addition of four key sales channel leaders. While sales and net customer additions declined in the fourth quarter, as compared to a very strong fourth quarter of fiscal 2015, due to the Company’s refusal to engage in risky pricing tactics that would ultimately damage its improved profitability profile, management feels strongly that the margin per customer improvement initiative will continue to deliver in fiscal 2017 and beyond. Management is confident in the Company’s ability to embrace the customer and build longer-term loyalty programs through the offering of a differentiated product suite that will drive its market position growth in a very profitable manner moving forward.
To reflect the progress in repositioning the business, management believes that the Company will achieve fiscal 2017 Base EBITDA in the range of $223 million to $233 million, reflecting continued double-digit year over year percentage growth. Fiscal 2017 guidance includes deductions to Base EBITDA of approximately $40 million for prepaid commercial commissions, which would previously have been included as amortization within selling and marketing expenses. This represents a $22 million increase in this expense over fiscal 2016 and represents a go forward run rate for this incremental deduction in future years. Just Energy expects to offset this headwind with continued strong gross margin performance as evidenced in the strong fiscal 2016 results.
Just Energy’s solar program commenced its initial pilot phases in California and New York during fiscal 2016, with the volume signed during this initial pilot resulting in higher than expected profit. Based on the success of the pilot launch in southern California, operations will continue to grow with further expansion in California and the northeast U.S. In fiscal 2017, Solar is expected to contribute $10 million towards the double-digit percentage Base EBITDA target.
Just Energy’s results reflect seasonality, as traditionally, electricity consumption is slightly greater in the first and second quarters (summer quarters) and gas consumption is significantly greater during the third and fourth quarters (winter quarters). The main impact of this will normally be higher Base EBITDA in the third and fourth quarters (assuming consumption based on normal winter weather) and lower Base EBITDA in the first and second quarters. However, this impact is lessening as current net customer additions are concentrated in electricity, which traditionally experiences less seasonality than natural gas.
The margin per customer improvements in both the residential and commercial business are directly related to our ongoing commitment to Just Energy’s margin improvement initiative as well as the impact from the stronger U.S. dollar. While competition is certain to come and go from the space over time, we believe Just Energy can continue to drive margin improvement that can be sustained over the long term as a result of the Company’s innovative new products with more appeal and value for customers. This
improved profitability per customer will add to our future margins over and above any growth in the customer base.
Our objectives remain unchanged. The profitability and cash generation Just Energy delivered in fiscal 2016 are inherent to the repositioned business model and thus provide management with confidence and freedom to commit to future dividend distributions and balance sheet restructuring.
We strive to deliver outstanding financial results and have made significant progress towards achieving our objective of becoming a premier, world-class provider of energy management solutions. We are encouraged by the stronger profitability in the business and remain confident Just Energy is delivering the appropriate dividend strategy, one that is supported by our continued ability to generate strong cash flows consistently. We foresee continued, sustainable growth that will be driven by an expanded geographical footprint, continued product innovation and bringing new energy management solutions to market that align with customer demands.
43