Exhibit 99.1
| | São Jorge Gold Project, Pará State, |
| | Brazil |
| | (Latitude 6.48ºS, Longitude 55.58ºW) |
| | |
| | Independent Technical Report on Mineral Resources |
| | Prepared by GE21 Consultoria Mineral Ltda on behalf of: |
| | |
| | GoldMining Inc. (GMI) |
| | |
| | |
| | Report Date: 01 July 2021 |
| | Effective Date: 31 May 2021 |
| | Qualified Person: Porfirio Rodriguez – BSc (Min Eng), FAIG |
| | Qualified Person: Leonardo de Moraes Soares - BSc (Geo), MAIG |
| | |
| | |
| | GE21 210515 |
Author(s): | Porfirio Rodriguez Associate Consultant BSc(Eng), FAIG |
| Leonardo de Moraes Resource Geologist BSc(Geo), MAIG Soares |
| |
| |
Date: | 1st July 2021 |
| | |
Project Number: | GE21 - 210515 |
| | |
Version / Status: | Update / Final |
| | |
File Name: | SS:\Projetos\GOLDMINING\210515-Update-CIM43101-TechReport\23_Relatorio |
| | |
‘Print Date: | 16 July 2021 |
| | |
| |
Copies: | GoldMining Inc 1 |
| GE21– Belo Horizonte, Brazil 1 |
Document Change Control
Version | Description (section(s) amended) | Author(s) | Date |
| | | |
| | | |
| | | |
Document Review and Sign Off
Signed and Sealed | | Signed and Sealed |
| | | |
| Primary Author | | Co-Author |
| Porfirio Rodriguez | | Leonardo M. Soares |
São Jorge Gold Project, Pará State, Brazil GE21210515
Independent Technical Report on Mineral Resources – 31 May 2021
Date and Signature Page
This report titled São Jorge Gold Project, Para State, Brazil: Independent Technical Report on Mineral Resources with an effective date of May 31, 2021 was prepared on behalf of GoldMining Inc. by Porfirio Cabaleiro Rodriguez and Leonardo M. Soares and signed:
Dated at Belo Horizonte, this 1st day of July, 2021
Porfirio Rodriguez, BSc(Eng), FAIG.
Principal Engineer
Leonardo M. Soares, BSc(Geo), MAIG.
Resource Geologist
| Table of Contents | |
| 1 | SUMMARY | 1 |
| | 1.1 | Introduction | 1 |
| | 1.2 | Location | 2 |
| | 1.3 | Ownership | 2 |
| | 1.4 | Geology | 2 |
| | 1.5 | Mineralisation | 2 |
| | 1.6 | Project Status | 3 |
| | 1.7 | Resources | 3 |
| | 1.8 | Interpretations and Conclusions | 5 |
| | 1.9 | Recommendations | 6 |
| 2 | INTRODUCTION | 7 |
| | 2.1 | Scope of Work | 7 |
| | 2.2 | Principal Sources of Information | 8 |
| | 2.3 | Qualifications and Experience | 9 |
| | 2.4 | Units of Measurements and Currency | 9 |
| | 2.5 | Abbreviations | 10 |
| 3 | RELIANCE ON OTHER EXPERTS | 11 |
| 4 | PROPERTY DESCRIPTION AND LOCATION | 12 |
| | 4.1 | Background Information on Brazil | 12 |
| | 4.2 | Mining Legislation | 12 |
| | | 4.2.1 Prospecting Licenses | 13 |
| | | 4.2.2 Exploration Licenses | 13 |
| | | 4.2.3 Mining Licenses | 14 |
| | 4.3 | Project Location | 15 |
| | 4.4 | Tenement Status | 16 |
| | 4.5 | Royalties and Agreements | 18 |
| | 4.6 | Environmental Liabilities | 19 |
| | 4.7 | Permitting | 19 |
| | 4.8 | Other Significant Factors | 20 |
| 5 | ACCESSIBILITY, CLIMATE, LOCAL RESOURCES, INFRASTRUCTURE AND PHYSIOGRAPHY | 20 |
| | 5.1 | Project Access | 20 |
| | 5.2 | Physiography and Climate | 20 |
| | 5.3 | Local Infrastructure and Services | 20 |
| 6 | HISTORY | 22 |
| | 6.1 | Exploration History | 22 |
| | 6.2 | Resource History | 24 |
| | 6.3 | Production History | 26 |
São Jorge Gold Project, Pará State, Brazil GE21210515
Independent Technical Report on Mineral Resources – 31 May 2021
7 | GEOLOGICAL SETTING AND MINERALISATION | 27 |
| 7.1 | Regional Geology | 27 |
| 7.2 | Project Geology | 28 |
| | 7.2.1 Lithology | 29 |
| | 7.2.2 Alteration minerals | 31 |
| | 7.2.3 Alteration assemblages | 31 |
| | 7.2.4 Alteration Intensity | 36 |
| | 7.2.5 Structure | 37 |
| 7.3 | Mineralisation | 39 |
8 | DEPOSIT TYPES | 42 |
9 | EXPLORATION | 43 |
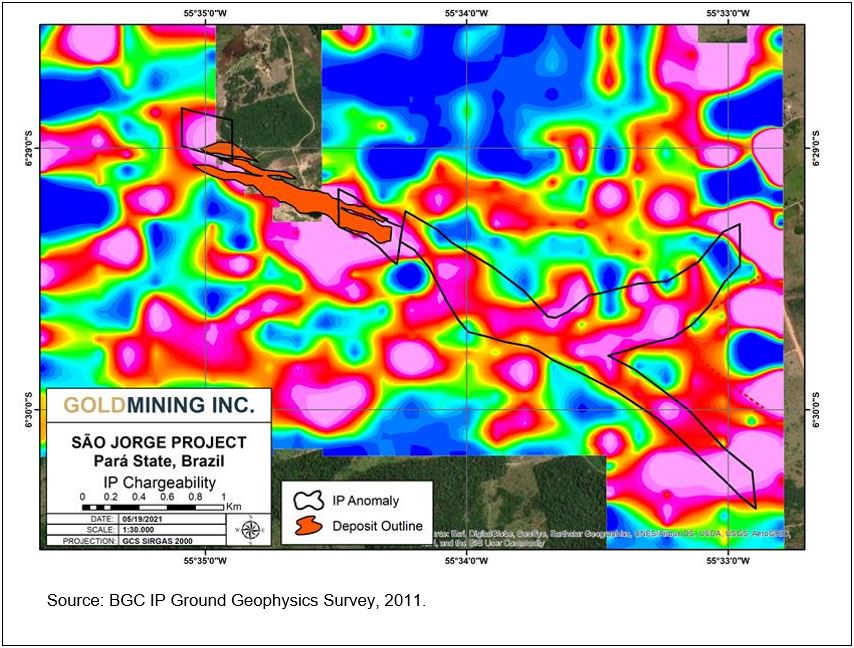
| 9.1 | Ground geophysics - IP Survey | 43 |
| 9.2 | Soil Geochemistry | 44 |
10 | DRILLING | 46 |
| 10.1 | Drilling Programs | 46 |
| 10.2 | Relevant Drillhole Intersections and True Thickness | 46 |
| 10.3 | RTDM Drilling | 50 |
| 10.4 | Talon Drilling | 50 |
| 10.5 | BGC Drilling | 51 |
| 10.6 | Drilling Results and Quality | 52 |
11 | SAMPLE PREPARATION, ANALYSES AND SECURITY | 53 |
| 11.1 | Density Determinations | 53 |
| 11.2 | Sample Preparation and Analysis | 54 |
| 11.3 | Sample Security | 55 |
| 11.4 | Adequacy of Procedures | 55 |
| 11.5 | QAQC | 56 |
| | 11.5.1 RTDM Drill Samples | 56 |
| | 11.5.2 Talon Drill Samples | 56 |
| | 11.5.3 BGC Drill Samples | 62 |
| 11.6 | Data Quality Summary | 64 |
| 11.7 | Summary | 64 |
12 | DATA VERIFICATION | 64 |
| 12.1 | Geological Database | 64 |
| 12.2 | Site Visit | 64 |
13 | MINERAL PROCESSING AND METALLURGICAL TESTING | 70 |
| 13.1 | Mineral Processing | 70 |
| 13.2 | Metallurgical Testing 2006 | 70 |
| 13.3 | Metallurgical Testing 2012 | 74 |
| | 13.3.1 Sample Selection and Location | 74 |
São Jorge Gold Project, Pará State, Brazil GE21210515
Independent Technical Report on Mineral Resources – 31 May 2021
| | 13.3.2 Head Samples and Assays | 74 |
| | 13.3.3 Granulometric Test Work | 76 |
| | 13.3.4 Grindability Testing | 77 |
| | 13.3.5 Gravity Concentration Test Work | 78 |
| | 13.3.6 Pre-Lime Addition | 79 |
| | 13.3.7 Kinetic Curves for Leaching Without Gravity Concentration | 79 |
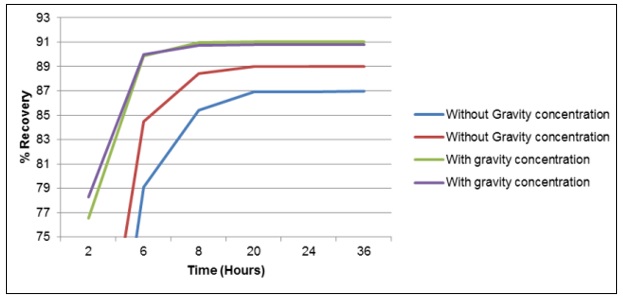
| | 13.3.8 Kinetic Curves for Leaching With Gravity Concentration | 80 |
| | 13.3.9 Optimization of Cyanide Dosage | 85 |
| 13.4 | Additional Metallurgical Testing | 87 |
| | 13.4.1 Column Tests | 88 |
| 13.5 | Metallurgical Tests - Conclusion and Recommendations | 90 |
| | 13.5.1 Conclusions | 90 |
| | 13.5.2 Recommendations | 93 |
14 | MINERAL RESOURCE ESTIMATES | 95 |
| 14.1 | Introduction | 95 |
| 14.2 | Geological Modelling | 95 |
| 14.3 | Block Model Development | 98 |
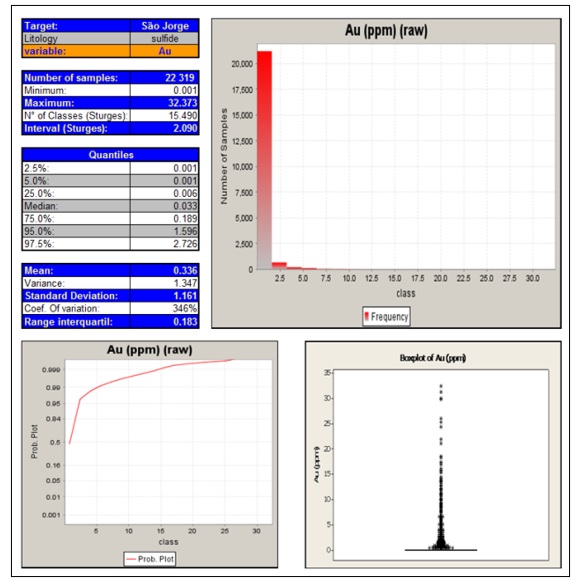
| 14.4 | Statistical Analysis | 98 |
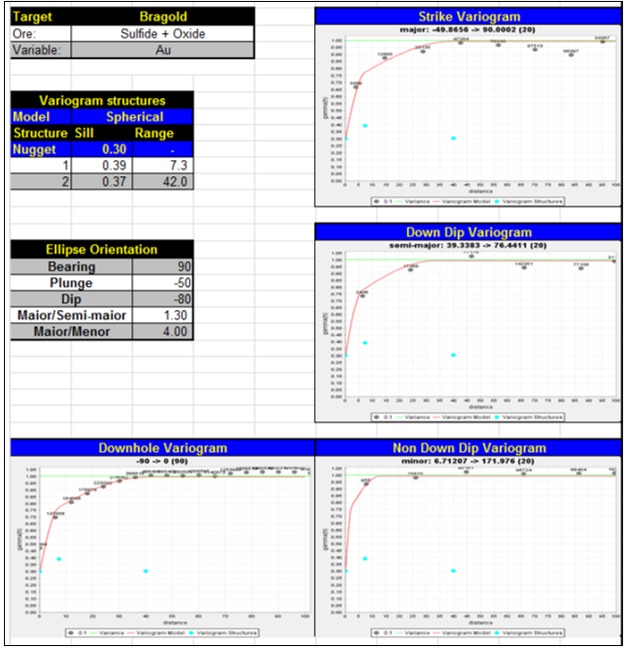
| 14.5 | Variography | 103 |
| | 14.5.1 Introduction | 103 |
| | 14.5.2 São Jorge Variography | 103 |
| 14.6 | Grade Estimation | 107 |
| 14.7 | Multiple Indicator Kriging Parameters | 107 |
| 14.8 | Resource Reporting | 110 |
| | 14.8.1 Mineral Resources Category Definitions | 110 |
| | 14.8.2 Cut Off grade | 111 |
| | 14.8.3 Mineral Resources estimation parameters | 111 |
15 | MINERAL RESERVE ESTIMATES | 119 |
16 | MINING METHODS | 119 |
17 | RECOVERY METHODS | 119 |
18 | PROJECT INFRASTRUCTURE | 119 |
19 | MARKET STUDIES AND CONTRACTS | 119 |
20 | ENVIRONMENTAL STUDIES, PERMITTING AND SOCIAL OR COMMUNITY IMPACT | 119 |
21 | CAPITAL AND OPERATING COSTS | 119 |
22 | ECONOMIC ANALYSIS | 119 |
23 | ADJACENT PROPERTIES | 119 |
24 | OTHER RELEVANT DATA AND INFORMATION | 120 |
25 | INTERPRETATION AND CONCLUSIONS | 121 |
26 | RECOMMENDATIONS | 122 |
27 | REFERENCES | 124 |
São Jorge Gold Project, Pará State, Brazil GE21210515
Independent Technical Report on Mineral Resources – 31 May 2021
List of Tables
Table 1 - Mineral Resources Calculation Parameters | 4 |
Table 2 - Mineral Resource Statement | 4 |
Table 3 - List of Abbreviations | 10 |
Table 4 - São Jorge Project - Summary of GMI’s Concessions Status | 17 |
Table 5 - São Jorge Project - Property Exploration History | 22 |
Table 6 - 2013 Historical Mineral Resource estimate | 24 |
Table 7 - 2013 Historic Mineral Resource estimate - Calculation Parameters | 25 |
Table 8 - Drilling Statistics Summary | 46 |
Table 9 - Relevant Drill Hole intersections | 49 |
Table 10 - Density Measurements for São Jorge Deposit rock types | 54 |
Table 11 - Density Measurements for Rock Alteration Types | 54 |
Table 12 - Summary Table of Blanks and Standards Statistical Analysis | 59 |
Table 13 - Head Sample Analysis (excluding SJ-MET-01) | 71 |
Table 14 - Summary of Gravity Separation tests | 71 |
Table 15 - Summary of Leaching Tests | 72 |
Table 16 - Comparison of Metallurgical Test Results | 73 |
Table 17 - Chemical Analysis for Sample MET-1 | 75 |
Table 18 - Gold Analysis for sample MET 1 | 75 |
Table 19 - Calculated and Assayed Heads for Sample MET 1 tests | 76 |
Table 20 - Recovery of Gold by Size fraction for sample MET 1 | 77 |
Table 21 - Bond work Index values for selected samples | 77 |
Table 22 - Pre-Lime Addition – Variation with Time | 79 |
Table 23 - Leach Recovery without the use of Gravity Separation – Sample MET-01 | 80 |
Table 24 - Gravity Concentration before Leaching P80 106-Microns | 81 |
Table 25 - Gravity Concentration before Leaching P80 75 Microns | 81 |
Table 26 - Leach Recovery rates of the Gravity Tails from sample MET 1 | 82 |
Table 27 - Calculated Overall Recoveries from Gravity and Leaching - Sample MET-01 | 83 |
Table 28 - Gold Recovery Rate as a Function of Cyanide Consumption | 86 |
Table 29 - Summary of Leaching Test Results | 87 |
Table 30 - Head Sample Grade – Sulphide Ore | 88 |
Table 31 - Head Sample Grade - Oxide Ore | 88 |
Table 32 - Column Test Leaching Results | 89 |
Table 33 - Column Test Leaching Curves | 89 |
Table 34 - Summary of the Block Model Parameters | 98 |
Table 35 - Statistics Summary– 1m Composites | 99 |
Table 36 - Indicator Class Means | 100 |
Table 37 - Variogram Models Summary- Nested Spherical | 104 |
Table 38 - Multiple Indicator Kriging Sample – Search Parameters | 108 |
Table 39 - Mineral Resources estimation parameters | 111 |
Table 40 - Confidence Levels of Key Categorisation Criteria | 114 |
Table 41 - Resource Statement Table – Total Resources per Category | 116 |
Table 42 - Phase I -Exploration and PEA Cost Estimates | 123 |
São Jorge Gold Project, Pará State, Brazil GE21210515
Independent Technical Report on Mineral Resources – 31 May 2021
List of Figures
Figure 1 - São Jorge Gold Project Location Map | 15 |
Figure 2 - São Jorge Project - GMI’’s Exploration Licences Location | 18 |
Figure 3 - Regional Geology Map | 28 |
Figure 4 - São Jorge Project Surface Geology | 29 |
Figure 5 - Typical São Jorge Deposit Lithologies | 30 |
Figure 6 - ‘Nada’ Alteration Zone | 32 |
Figure 7 - Fe-oxide +/- chlorite alteration zone | 33 |
Figure 8 - K-feldspar – epidote– chlorite alteration zone | 34 |
Figure 9 - Mixed zone alteration type | 35 |
Figure 10 - Heterogeneous alteration type zone | 36 |
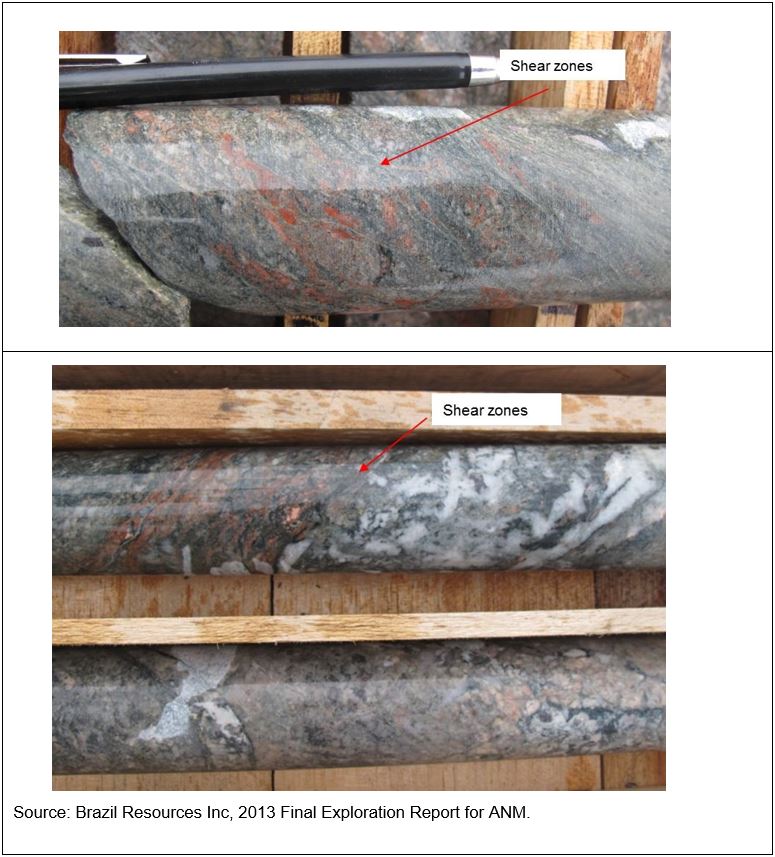
Figure 11 - Typical small shear zones | 38 |
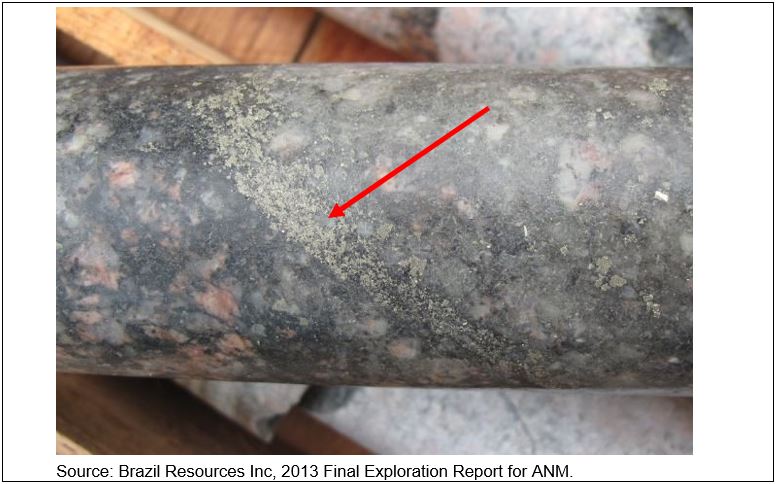
Figure 12 - Fine disseminated sulphide within mixed zone | 39 |
Figure 13 - Fracture controlled vein style pyrite within Fe-Ox-Chlorite material | 40 |
Figure 14 - Massive sulphide bleb | 41 |
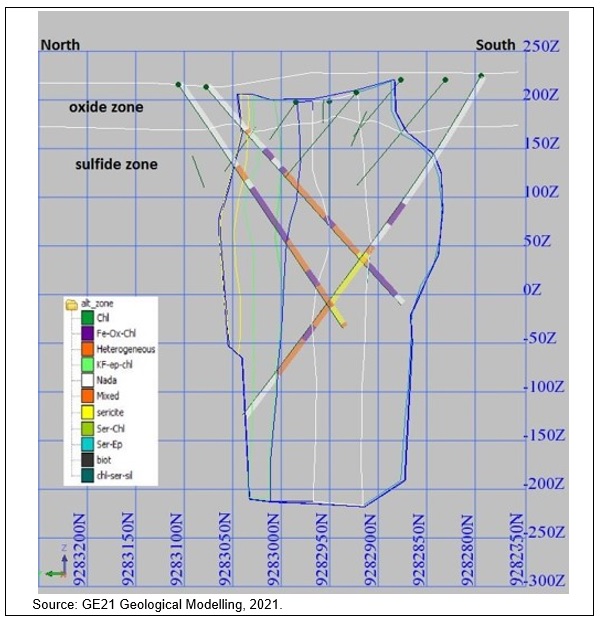
Figure 15 - São Jorge deposit typical section with alteration zones | 42 |
Figure 16 - IP Chargeability Map (100m level) | 44 |
Figure 17 - São Jorge Exploration - Soil Geochemistry - Gold in Soil Anomalies | 45 |
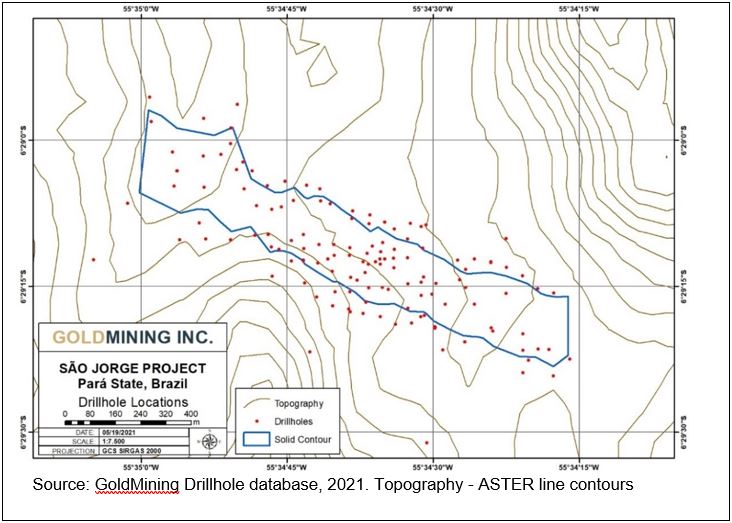
Figure 18 - São Jorge Gold Project Drillhole Locations | 47 |
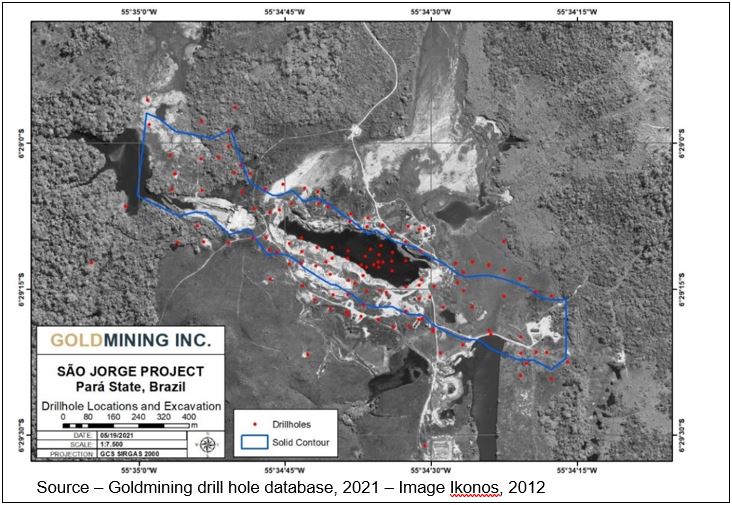
Figure 19 - São Jorge Gold Project Drillhole Location and the old Garimpo Pit | 48 |
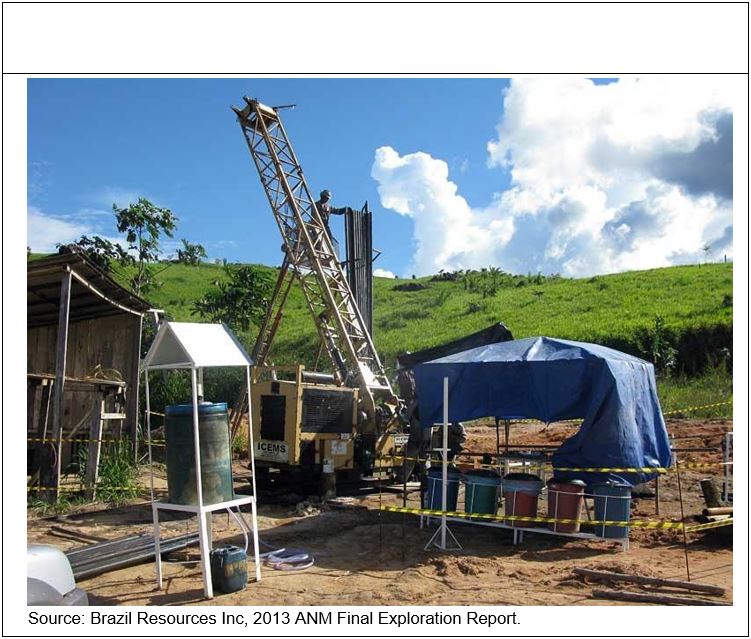
Figure 20 - Drill Rig operating at São Jorge Gold Project | 52 |
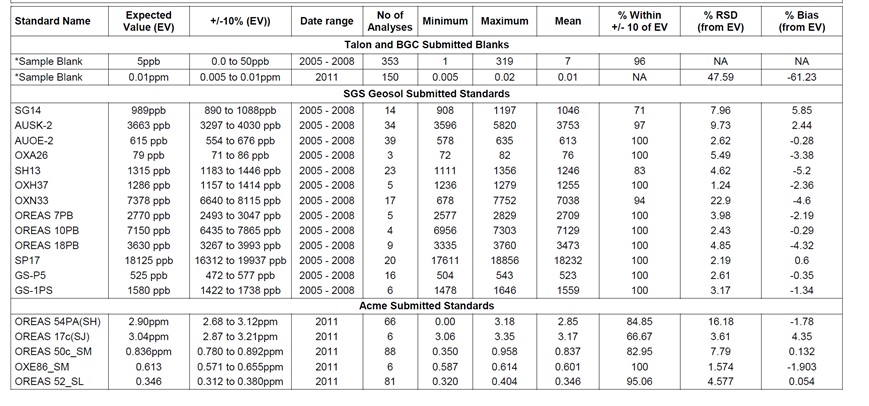
Figure 21 - Blank and Standards Statistical Data Example | 58 |
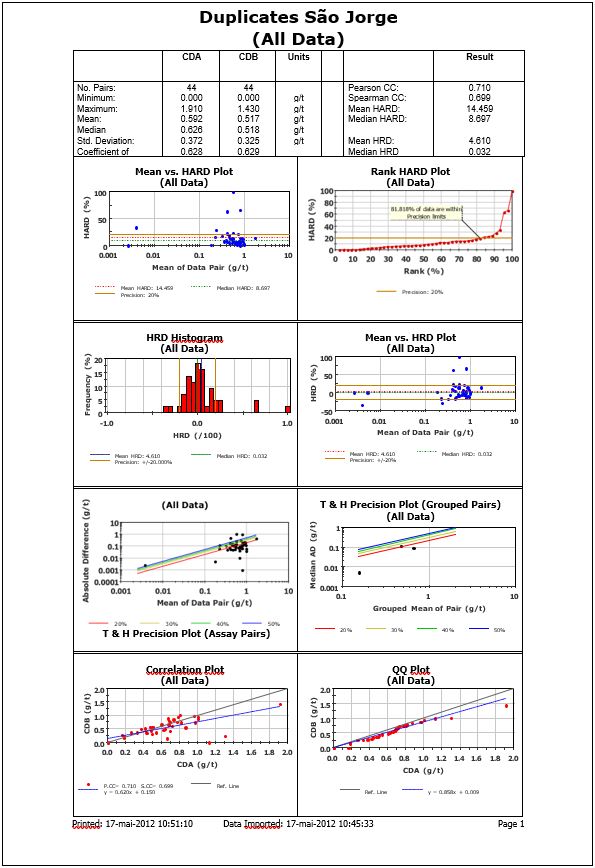
Figure 22 - Summarized Duplicates Quality Controls | 61 |
Figure 23 - Drill holes SJD-032-05 and SJD-019-05 collar locations | 66 |
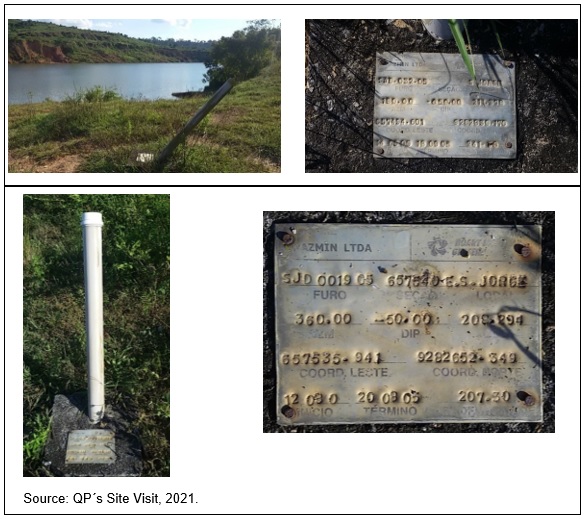
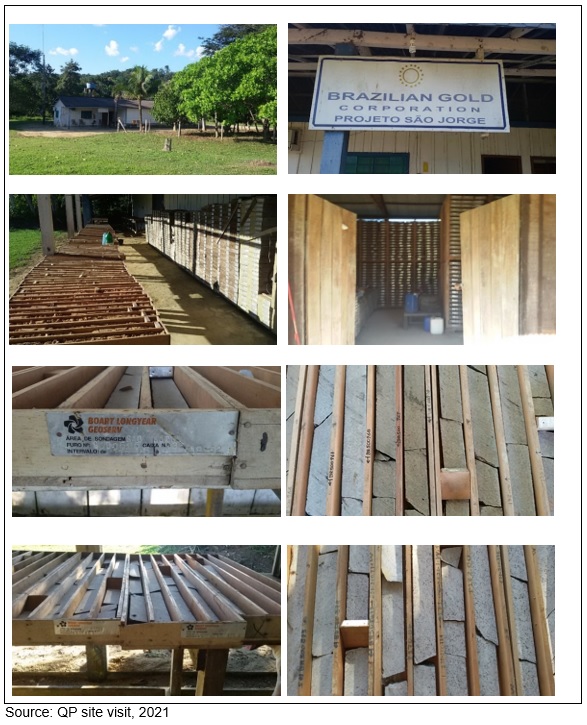
Figure 24 - QP Site Visit - Core Shed and Core Boxes Inspected | 67 |
Figure 25 - Relevant Selected Intercept Inspected - Drillhole SJD0505 | 68 |
Figure 26 - Relevant Selected Intercept Inspected - Drillhole SJD-004-05 | 69 |
Figure 27 - São Jorge Gravity Recovery Test Result | 71 |
Figure 28 - Leaching Recovery Test Result | 72 |
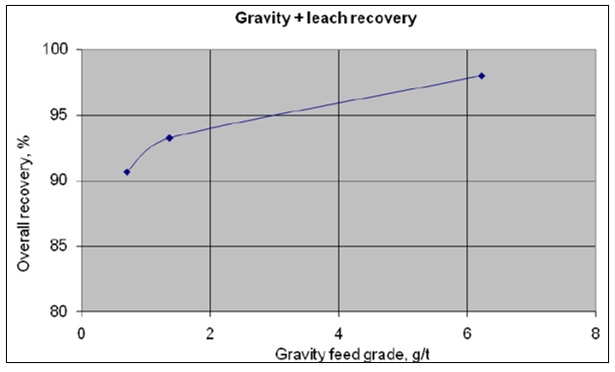
Figure 29 - Gravity + Leach Recovery Test Result | 73 |
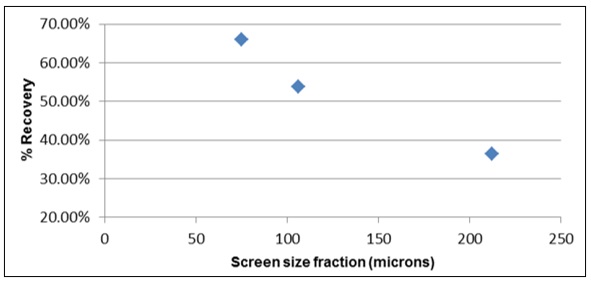
Figure 30 - Gold Recovery in percent versus grind size | 78 |
Figure 31 - Leaching Test - Percentage Recovery versus Time | 84 |
Figure 32 - Recovery versus Leach Time P80 = 106 Microns | 84 |
Figure 33 - Recovery versus Leach Time P80=75 Microns | 85 |
Figure 34- NaCN (g/t) Consumption | 86 |
Figure 35 - Predicted Grade versus Recovery for High Grade Ore | 92 |
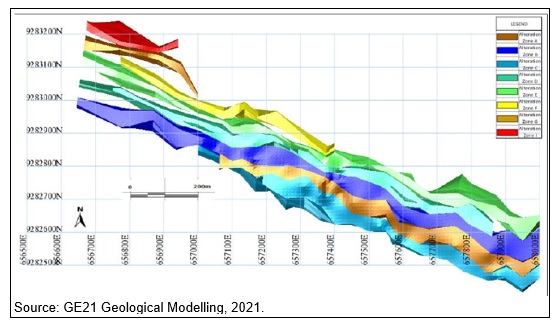
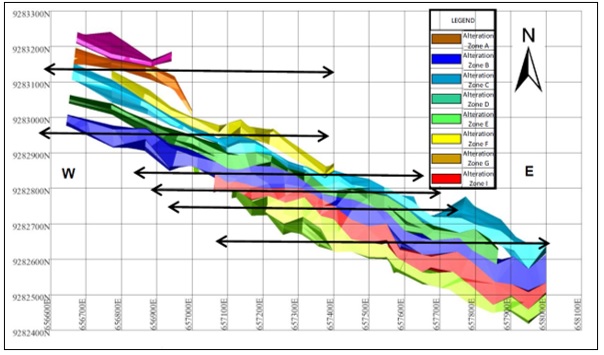
Figure 36 - Deposit Alteration Zones Model | 96 |
Figure 37 - Envelope modelling - Vertical Sections Location | 96 |
Figure 38 - Envelope Modelling - Vertical Section Example | 97 |
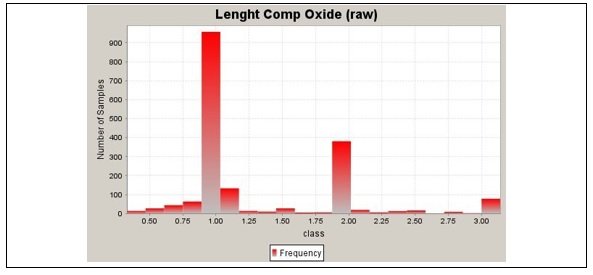
Figure 39 - Histogram showing sample lengths inside mineralized Oxide zone. | 98 |
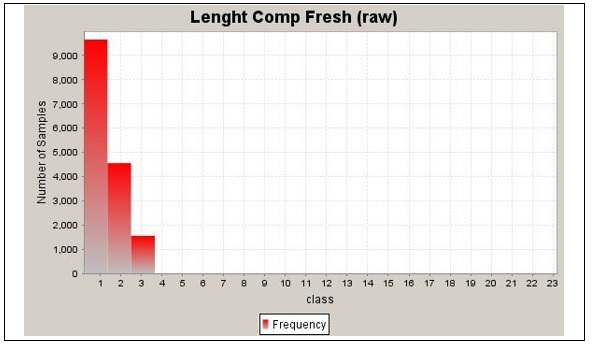
Figure 40 - Histogram showing sample lengths inside mineralised Sulphide zone. | 99 |
Figure 41 - Statistical Analysis for Oxide Domain Samples – 1 m Composite | 101 |
Figure 42 - Statistical Analysis for Sulphide Domain Samples – 1 m Composite | 102 |
Figure 43 - Definition of Small-Scale Bearing | 105 |
Figure 44 - Variography for Oxide and Sulphide Resource Estimation | 106 |
Figure 45 - MIK Validation - Sulphide | 109 |
Figure 46 - MIK Validation - Oxide | 109 |
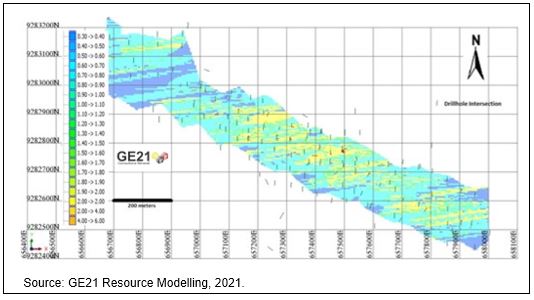
Figure 47 - Block Model Plan View – Grade Distribution >0,3 g/t Au – 100m asl | 112 |
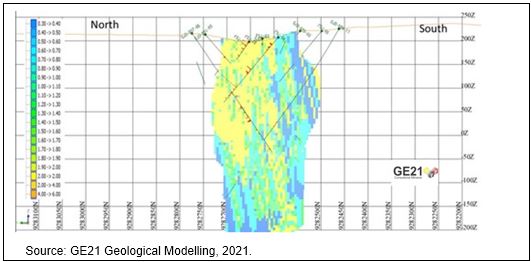
Figure 48 - Block Model - Vertical Section - Grade Distribution >0,3 g/t Au | 112 |
Figure 49 - Isometric View of Block Model - Grade Distribution >0,3 g/t Au | 113 |
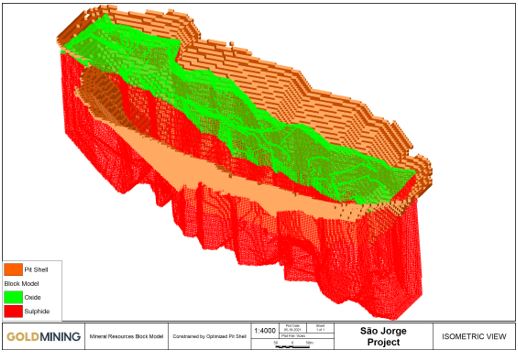
Figure 50 - Mineral Resources Block Model and Optimized Pit – Looking NW | 117 |
Figure 51 - Mineral Resources Block Model and Optimized Pit Plan view | 117 |
Figure 52 - Classified Mineral Resources Block Model and Optimized Pit | 118 |
Figure 53 - Classified Mineral Resources Block Model and Optimized Pit | 118 |
List of Appendices
Appendix A – Certificate of Qualified Persons
Appendix B – Drillhole Summary
São Jorge Gold Project, Pará State, Brazil GE21210515
Independent Technical Report on Mineral Resources – 31 May 2021
GE21 Consultoria Mineral, (GE21) has been commissioned by GoldMining Inc. (GMI) to prepare an updated Independent Technical Report on the Mineral Resource for the São Jorge Gold Project (the Project) in Para State, Brazil. The purpose of this report is to update the Mineral Resource Estimation for the Project. GE21 Consultoria Mineral assigned Mr. Porfirio Rodriguez, and Mr. Leonardo de Moraes Soares, all Qualified Professionals (QPs) as recognized under NI 43-101, to prepare the technical report.
Mr. Rodriguez is a professional Mining Engineer with more than 40 years of experience in Mineral Resource and Mineral Reserve estimation. His experience includes uranium, iron ore, gold and nickel. Mr. Rodriguez is a Fellow of the Australian Institute of Geoscientists (FAIG). Mr. Leonardo M. Soares is a geologist with more than 16 years of experience, most of them in resource estimation on gold properties. His experience includes iron ore, gold and copper. Mr. Soares is a Member of the Australian Institute of Geoscientists (MAIG). Both Messrs. Rodriguez and Soares are independent of GMI as that term is defined in Section 1.5 of the National Instrument 43-101.
The Mineral Resource estimation utilizes an optimized pit shell to constrain resources, a database of 145 drill holes totaling more than 37,000 metres and uses modernized cost and pricing assumptions. All available information from drilling exploration programs to the effective date have been included in this report.
Updates to commodity pricing and operational costing, as well as the improved and updated Mineral Resource basis, have been utilized to confirm that the constrained São Jorge Mineral Resources estimation has demonstrated reasonable potential of eventual economic extraction.
The QPs are unaware of any exploration work that has been undertaken on this project since 2012. This has been verified by the authors by reviewing public disclosures, the technical data provided by GMI and reviewed by the QPs and by the site visit by Mr. Soares.
This report complies with NI 43-101. NI 43-101 is a rule developed by the Canadian Securities Administrators that establishes standards for public disclosure by issuer of scientific and technical information concerning mineral projects.
All costs in this study have been expressed in US dollars unless noted otherwise.
São Jorge Gold Project, Pará State, Brazil GE21210515
Independent Technical Report on Mineral Resources – 31 May 2021
The São Jorge Gold Project is located in the southeast of Pará State, Brazil, in the municipality of Novo Progresso. The region is known as Tapajós and São Jorge is located 320km south of the main regional city Itaituba. Access to the São Jorge Gold Project from the cities of Itaituba or Novo Progresso is via highway BR163 or a 1 hour flight in a light aircraft from Itaituba.
GMI, through its Brazilian subsidiaries Brazilian Resources Mineração Ltda., Mineração Regent Brasil Ltda. and BRI Mineração Ltda., is the sole registered and beneficial holder of seven gold exploration licences in the São Jorge project for a total landholding of 45,996.63 ha.
On November 22, 2013, Brazilian Gold Corporation (BGC) completed an agreement with Brazil Resources Inc. (BRI), pursuant to which BRI acquired all the outstanding common shares of BGC. Brazil Resources Inc. announced that effective December 6, 2016, it had changed its name to GoldMining Inc. (GMI). As a result of its acquisition of BGC, GMI indirectly owns Brazilian Resources Mineração Ltda., Mineração Regent Brasil Ltda. and BRI Mineração Ltd., which in turn own the Project.
GMI is a public mineral exploration company with a focus on the acquisition and development of projects in emerging and producing gold districts in North America (United States and Canada) and South America (Brazil, Colombia and Peru).
The São Jorge property is underlain by a granitoid pluton dominantly composed of an amphibole-biotite monzogranite. The gold mineralisation is hosted in a circular shaped body comprised of the younger São Jorge granite. The intrusive body measures approximately 1.2km in diameter and is generally massive, grey to pink in colour with a porphyritic granular texture. The São Jorge intrusion trends 290° and is sub-parallel to the strike of the regional Cuiú-Cuiú - Tocantinzinho shear zone, which also hosts several important gold deposits including the Palito mine, Tocantinzinho and Cuiú-Cuiú deposits, and Bom Jardim and Batalha gold prospects.
Gold mineralisation is related to a hydrothermal alteration zone in the monzogranite along a structurally controlled fracture - vein system, approximately 1,400m long and up to 160m wide, and intersected in drill holes up to 350m below surface; the mineralisation is open along strike and down dip. The main trend is 290° with an almost vertical dip. The main mineralized zone is defined by a sharp but irregular contact between altered and unaltered monzogranite to the southwest and a more gradational transition from altered to unaltered rocks to the northeast. Strong alteration is associated with discrete quartz veinlets (1 to 2cm wide), associated with coarse pyrite grains and clusters that cut zones of intense quartz flooding.
São Jorge Gold Project, Pará State, Brazil GE21210515
Independent Technical Report on Mineral Resources – 31 May 2021
BGC conducted the most recent exploration program on the São Jorge Gold Project, during 2011, in an effort to increase the mineralized resource and raise confidence in the continuity of the deposit.
The results from this drill program have been made public and drilling results including all information available from previous exploration diamond drilling programs completed to date were used to estimate the updated Mineral Resource that is reported in this document.
The project is managed under an exploration license granted by Brazilian authorities, and which is in good standing.
Mineral Resource estimates for the São Jorge Gold Project have been generated by the QP on the basis of analytical and technical results available up to May 31, 2021. The resources are reported in this Independent Technical report on Mineral Resource São Jorge Gold Project, Para State, Brazil, National Instrument 43-101, dated 01 July 2021.
The Resource Statement has been determined with an effective date of May 31, 2021 and has been prepared and reported in accordance with Canadian National Instrument 43-101, Standards of Disclosure for Mineral Projects (the Instrument). Mineral Resources have been classified in accordance with the Canadian Institute of Mining, Metallurgy and Petroleum (CIM) Definition Standards on Mineral Resources and Mineral Reserves, whose definitions are incorporated by reference into National Instrument NI 43-101.
The cut-off grade represents the value, expressed in grams of gold per tonne, obtained as the sum of process costs, mining costs, G&A costs and other costs including royalties divided by the gold price, expressed in dollars per gram of gold (US$/g) multiplied by process recovery rate. The values used to determine the cut-off grade are shown in the Table 1.
São Jorge Gold Project, Pará State, Brazil GE21210515
Independent Technical Report on Mineral Resources – 31 May 2021
Table 1 - Mineral Resources Calculation Parameters
Item | Unit | Value |
| Financial Parameters | Sales Price | US$/oz | 1600 |
| | | Discount rate | % | 10 |
| | ROM | Density | g/cm³ | model & 2.69 on other waste |
| | | Grades | g/t | model - MIK cog@0.3g/t |
| | Block Model | Block dimensions | Unit | Value |
| | X | | 5 |
| Revenue | Y | m | 5 |
| | Z | | 5 |
| | Overall Slope Angle | Saprolite | ° | 35 |
| | | Fresh | 52 |
| | Processing | Metallurgical Recovery | % | 90 |
| | Cut-off Grade | g/t | 0.3 |
| Mining | US$/t mined | 2.00 |
| Costs | Processing | US$/T ROM | 8.50 |
| | G&A | 2.10 |
| | NSR Royalties | % product | 3.5% |
The summary of the total resources (oxide + sulphide) for the Project is:
| | ● | 14.275Mt at an average grade of 1.55g/t Au of Indicated Mineral Resources for 771.8 Koz; and |
| | ● | 17.58Mt at an average grade of 1.27g/t Au of Inferred Mineral Resources for 716.5 Koz. |
Table 2 lists the constrained resource tonnage, grade and contained gold ounces per Mineral Resource category at the cut-off grade of 0.3g/t Au for the total resource.
Table 2 - Mineral Resource Statement
Resource Category | Tonnes (Mt) | Average Grade (g/t Au) | Contained Gold (Kozs) |
Indicated Mineral Resource | 14.275 | 1.55 | 711.8 |
Inferred Mineral Resource | 17.582 | 1.27 | 716.5 |
Multiple Indicator Kriging Estimate - 31 May 2021 Indicated and Inferred open pit constrained resources reported above a 0.30g/t Au cut-off grade 5E x 5mN x 5mRL Selective Mining Unit |
São Jorge Gold Project, Pará State, Brazil GE21210515
Independent Technical Report on Mineral Resources – 31 May 2021
The independent QPs responsible for the Mineral Resource estimate in this report are Messrs. Porfirio Rodriguez and Leonardo M. Soares. Mr. Rodriguez is a professional Mining Engineer with more than 40 years of experience in Mineral Resource and mineral reserve estimation. His experience includes uranium, iron ore, gold and nickel. Mr. Rodriguez is a Fellow of the Australian Institute of Geoscientists (FAIG). Mr. Leonardo M. Soares is a geologist with more than 16 years of experience, most of them in resource estimation on gold properties. His experience includes iron ore, gold and copper. Mr. Soares is a Member of the Australian Institute of Geoscientists (MAIG). Both Messrs. Rodriguez and Soares are independent of GMI as that term is defined in Section 1.5 of the National Instrument 43-101.
Mineral resources are not mineral reserves and do not have demonstrated economic viability. There is no certainty that all or any part of the Mineral Resources will be converted into mineral reserves. The estimate of Mineral Resources may be materially affected by environmental permitting, legal, title, taxation, sociopolitical, marketing or other relevant issues. The Company is not currently aware of any known environmental, permitting, legal, title-related, taxation, socio-political, marketing or other relevant issue that could materially affect this Mineral Resource estimate.
These Mineral Resources have been estimated on the basis of a block model of the deposit which, in the opinion of Mr. Rodriguez, has been constrained to honour appropriate geological domains. Grades have been interpolated into individual blocks by Multiple Indicator kriging (MIK), using search radii and these are fully supported by the variography analysis. Mr. Rodriguez has estimated and classified the Mineral Resources contained within the São Jorge Gold Project deposit using procedures which are generally accepted within the industry and that these procedures have been properly applied.
The estimation was prepared based on the methodology and parameters determined appropriate for the Project and, the selective mining unit (SMU) block size of 5m x 5m x 5m was considered reasonable for the estimation based on Mr. Rodriguez’s experience with estimating gold resources in Brazil.
1.8 | Interpretations and Conclusions |
Mr. Rodriguez and Mr. Soares in compliance with Canadian National Instrument 43-101 which regulates the public disclosure of mining companies in Canada, concludes that the São Jorge Gold Project Mineral Resource estimate has been prepared in accordance with the best practices of the industry.
The São Jorge Project is underlain by a granitoid pluton dominantly composed of an amphibole-biotite monzogranite. The gold mineralisation is hosted in a circular shaped body comprised of the younger São Jorge granite. Gold mineralisation is related to a hydrothermal alteration zone in the monzogranite along a structurally controlled fracture - vein system approximately 1,400m long and up to 160m wide, and intersected in drill holes up to 350m below surface. The main trend is 290° with an almost vertical dip. There has been a total of 145 diamond drill holes completed on the property totaling 37,154 metres. The QP considers the Project to have relevant exploration potential along strike of the main identified São Jorge shear structure which hosts the Mineral Resource. Along strike from the drilling defining the Mineral Resource, there is very limited to no drilling and remain potential targets to discover additional mineralisation. Additional targets exist below the limits of diamond drilling where the boundaries of mineralisation have not been defined.
São Jorge Gold Project, Pará State, Brazil GE21210515
Independent Technical Report on Mineral Resources – 31 May 2021
In summary, the constrained Mineral Resource estimate, reported above a 0.30 g/t cut-off (oxide + sulphide) for the Project is:
14.275Mt at an average grade of 1.55g/t Au of Indicated Mineral Resources; and
17.58Mt at an average grade of 1.27g/t Au of Inferred Mineral Resources.
| | ■ | Potential head grade enhancement may be possible through selective mining of internal waste based on pit mapping and grade control; and |
| | ■ | Potential head grade enhancement may result from further upgrading of inferred resource to indicated. |
In the QPs' opinion, the property warrants a Preliminary Economic Assessment (PEA) to define the next course of action.
Mr. Rodriguez and Mr. Soares have the following recommendations:
| | ■ | A new exploration program and budget to drill test and support the conversion of targets to Mineral Resources; |
| | ■ | A study to determine the optimum drilling grid (drill spacing) for Mineral Resource conversion from Inferred to Indicated, based on the current database. One method is based on analysis of kriging variances for existing samples in the study area; |
| | ■ | Evaluate underground Mineral Resource potential beneath the current open pit model at São Jorge; and |
| | ■ | Prepare a preliminary economic analysis (PEA), to further evaluate the economic potential of an open-pit operation and advance opportunities to upgrade and expand the current resource base. |
The QPs also recommend the following Phase I exploration program for the São Jorge project:
| | ■ | Diamond drilling to advance opportunities to upgrade and expand the current resource base including drilling near surface (to approx. 200m depth) existing Mineral Resources to potentially upgrade Inferred resources to Indicated resources. |
São Jorge Gold Project, Pará State, Brazil GE21210515
Independent Technical Report on Mineral Resources – 31 May 2021
| | ■ | Additional modelling and interpretation of previously collected geophysical data: |
| | ☐ | Airborne magnetic survey completed by Fugro in 2006 that covers the entire property to identify possible structures for follow-up exploration. |
| | ☐ | Induced polarization survey (120 line km) completed by Fugro in 2011 that covers the strike extents of the São Jorge deposit with a particular emphasis on the resistivity +/- chargeability anomaly located along strike and for 2.5km southeast of the São Jorge deposit. |
| | ■ | Trenching and sampling of targets identified by the modelling and interpretation of the geophysical data. |
| | ■ | Near-deposit diamond drilling of geophysical-geochemical targets. |
| | ■ | A thorough re-examination of the existing diamond drill core including investigating potential additional sampling opportunities in areas that were not historically sampled. |
| | ■ | Conduct additional density measurements across representative lithologies for any additional diamond drilling programs. |
| | ■ | Develop a regional geochemical program to identify new targets on the largely unexplored São Jorge property. The program would consist of regional soil traverses using the existing east-west roads that cross the property. |
If a decision is made to move forward and advance the Project, it is recommended that more formal social and community programs should be established. Each program should be developed to address stakeholder concerns and needs to be sustainable.
GE21 Consultoria Mineral, (GE21) has been commissioned by GoldMining Inc. (GMI) to prepare an updated Independent Technical Report on the Mineral Resource for the São Jorge Gold Project (the Project) in Para State, Brazil. GE21 Consultoria Mineral assigned Mr. Porfirio Rodriguez, and Mr. Leonardo de Moraes Soares, all Qualified Professionals as recognized under NI 43-101, to prepare the technical report.
The QPs are unaware of any exploration work that has been undertaken on this project since 2012. This has also been verified by the authors by reviewing public disclosures, the technical data provided and by the site visit by Mr. Soares. All programs of sampling and assaying from exploration drilling to the effective date have been included in this report. This updated report reflects changes in metal prices and updated resource estimations based upon modified resource parameters and is based on the São Jorge Gold Project, Pará State, Brazil, Amended Independent Technical Report on Mineral Resources prepared by Coffey Mining on behalf of Brazil Resources Inc, and dated 15th January 2014.
São Jorge Gold Project, Pará State, Brazil GE21210515
Independent Technical Report on Mineral Resources – 31 May 2021
This report complies with NI 43-101. NI 43-101 is a rule developed by the Canadian Securities Administrators that establishes standards for public disclosure by issuer of scientific and technical information concerning mineral projects.
The issuer for whom this report has been prepared is GMI, a corporation under the laws of Canada.
Mr. Soares visited the São Jorge Gold Project on May 24 and May 25, 2021, where he reviewed the property, verified the infrastructure, procedures, data and the geological data used to prepare the Mineral Resource estimate. Such visit is being treated as the current personal inspection for the purposes of this report. Mr. Rodriguez last visited the Project in July 2012.
During the site visit, the QP conducted technical discussions and reviewed with the issuer’s local project geologist the lithology, mineralisation, alteration and structures. Such visit is being treated as the current personal inspection for the purposes of this report.
See Section 12.2 for further information regarding the site visit.
All costs in this study have been expressed in US dollars unless noted otherwise.
2.2 | Principal Sources of Information |
In addition to information collected through a current site visit undertaken by Leonardo Soares, to the São Jorge Gold Project on May 24th and 25th, 2021, the authors of this report prepared the report based upon information provided by GMI to the QPs during the course of the QPs' investigations and extensive discussions with GMI staff in Brazil. A list of the principal sources of information reviewed is provided below:
| | ■ | Coffey (2008) – NI43-101 Technical Report (resource estimate) on São Jorge Project, Para State, Brazil, for Talon Resources; |
| | ■ | Coffey (September 2010) – NI43-101 Technical Report (resource estimate) on São Jorge |
Project, Para State, Brazil, for Brazilian Gold Corporation;
| | ■ | Coffey (June, 2011) – Preliminary Economic Assessment NI 43-101 Technical Report on São Jorge Project, Pará State, Brazil for Brazilian Gold Corporation. |
| | ■ | Coffey (November, 2013) – NI 43-101 Independent Technical Report on Mineral Resources on São Jorge Project, Pará State, Brazil for Goldmining Inc |
The QP has made independent enquiries to verify and establish the completeness and authenticity of the information provided and identified.
São Jorge Gold Project, Pará State, Brazil GE21210515
Independent Technical Report on Mineral Resources – 31 May 2021
2.3 | Qualifications and Experience |
GE21 is a consulting firm specializing in the areas of geology, mining and geotechnical engineering, metallurgy, hydrogeology, hydrology, tailings disposal, environmental science and social and physical infrastructure.
The “qualified persons” (as defined in NI 43-101) for the purpose of this report are Porfirio Cabaleiro Rodriguez and Leonardo Soares.
This report has been compiled by Mr. Rodriguez, who is a professional Mining Engineer with more than 40 years of experience in Mineral Resource and mineral reserve estimation. His experience is spread across several commodities including uranium, iron ore, gold and nickel, among others. Mr. Rodriguez is a Fellow of the Australian Institute of Geoscientists (FAIG). Mr. Rodriguez is a principal engineer with GE21.
Mr. Rodriguez was supported by Leonardo Soares, a geologist with more than 16 years of experience, most of them in resource estimation on gold properties. His experience is spread across several commodities including iron ore, gold, copper, among others. Mr. Soares is a Member of the Australian Institute of Geoscientists (MAIG). Mr. Soares is an employee of GE21. Mr. Soares visited the São Jorge Gold project site between May 24th and 25th, 2021. Mr. Rodriguez is a principal geologist with GE21.
Neither GE21 nor the authors of this report have or have had any material interest in GMI or related entities or interests. GE21, and the QPs of this report’s relationship with GMI is solely one of professional association between client and independent consultant. This report is prepared in return for fees based on agreed commercial rates and the payment of these fees is in no way contingent on the results of this report.
This report is intended to be used by GMI, subject to the terms and conditions of its contract with GE21. This contract permits GMI to file this report as a Technical Report with Canadian Securities Regulatory Authorities pursuant to National Instrument 43-101, Standards of Disclosure for Mineral Projects.
2.4 | Units of Measurements and Currency |
Metric (SI) units are used throughout this report unless noted otherwise. Currency is in United States dollars ("US$"). At the time of writing this report, on May 31, 2021 the currency exchange rate was approximately 5.2328 Brazilian Real per US$, the spot gold price was US$1,905 per Troy ounce, and the three year average closing gold price on the COMEX was $1,554 per Troy ounce.
The QPs did not convert any currency figures during this study. A conversion factor of 31.1035 grams per Troy ounce was used.
São Jorge Gold Project, Pará State, Brazil GE21210515
Independent Technical Report on Mineral Resources – 31 May 2021
A full listing of abbreviations used in this report is provided in Table 3
Table 3 - List of Abbreviations
| Description | | | Description |
$ | United States of America dollars | | l/hr/m2 | litres per hour per square metre |
“ | Inches | | M | million |
µ | Microns | | m | metres |
3D | three dimensional | | Ma | thousand years |
AAS | atomic absorption spectrometry | | Mg | Magnesium |
Au | Gold | | ml MIK | millilitre Multiple Indicator Kriging |
bcm | bank cubic metres | | mm | millimetres |
CC | correlation coefficient | | Mtpa | million tonnes per annum |
cm | Centimetre | | N (Y) | northing |
Co | Cobalt | | Ni | nickel |
CRM | certified reference material or certified standard | | NPV | net present value |
Cu | Copper | | NQ2 | Size of diamond drill rod/bit/core |
CV | coefficient of variation | | ºC | degrees centigrade |
DDH | diamond drillhole | | OK | Ordinary Kriging |
DTM | digital terrain model | | P80 -75µ | 80% passing 75 microns |
E (X) | Easting | | Pd | palladium |
EDM | electronic distance measuring | | ppb | parts per billion |
Fe | Iron | | ppm | parts per million |
G | Gram | | psi | pounds per square inch |
Ga | Giga annun | | | |
g/m3 | grams per cubic metre | | PVC | poly vinyl chloride |
g/t | grams per tonne of gold | | QC | quality control |
HARD | Half the absolute relative difference | | QQ | quantile-quantile |
HDPE | High density poly ethylene | | RC | reverse circulation |
HQ2 | Size of diamond drill rod/bit/core | | RL (Z) | reduced level |
Hr | Hours | | ROM | run of mine |
HRD | Half relative difference | | RQD | rock quality designation |
ICP- AES | inductivity coupled plasma atomic emission spectroscopy | | SD | standard deviation |
ICPMS | inductivity coupled plasma mass spectroscopy | | SG | Specific gravity |
ISO | International Standards Organisation | | Si | silica |
kg | Kilogram | | SMU | selective mining unit |
kg/t | kilogram per tonne | | t | tonnes |
km | Kilometres | | t/m3 | tonnes per cubic metre |
km2 | square kilometres | | tpa | tonnes per annum |
kW | Kilowatts | | UC | Uniform conditioning |
kWhr/t | kilowatt hours per tonne | | w:o | waste to ore ratio |
São Jorge Gold Project, Pará State, Brazil GE21210515
Independent Technical Report on Mineral Resources – 31 May 2021
3 | RELIANCE ON OTHER EXPERTS |
This report was prepared as a National Instrument 43-101 Technical Report, in accordance with Form 43-101F1, for GoldMining Inc. by the authors. The quality of information and conclusions contained herein are consistent with the level of experience of the authors of this report.
The authors of this report are not qualified to provide extensive comment on legal land title status associated with the GMI concessions in Brazil included in Section 4.4 of this report. As such, for the purposes of its assessment of legal title in Section 4.4 hereof, the QPs have relied on information regarding such legal title status provided to them by GMI and have not been independently verified by the authors. The authors have relied on GMI, for the information on tenement status for the São Jorge project, which was provided in a tabular format with an effective date of May 31, 2021, which consisted of a list of land holdings compiled from the National Mining Agency´s record. The information related to tenement status has been relied upon solely for the purpose of listing the land holdings as stated in Section 4.4.
São Jorge Gold Project, Pará State, Brazil GE21210515
Independent Technical Report on Mineral Resources – 31 May 2021
4 | PROPERTY DESCRIPTION AND LOCATION |
4.1 | Background Information on Brazil |
Brazil occupies a land surface area of about 8.5 million square kilometres, slightly larger than Australia. The climate is largely tropical, with more temperate regions in the south. The topography is mostly flat, with rolling lowlands in the north, some plains and a narrow coastal belt. The total population is about 211 million (2020) and literacy is about 93% (2018). The official language is Portuguese, while English, Spanish and French are also spoken. The capital city is Brasilia, located in the centre of the country, and the largest city is São Paulo.
Political conditions in Brazil are stable. Brazil has been a member of the World Trade Organization since 1995 and is a founding member of Mercosul, a trade liberalization program for South America.
The fundamentals of Brazilian macro-economic policy are based primarily on fiscal austerity, the control of inflation and free foreign exchange. The strength of the world economy and the high level of liquidity in international financial resources have accelerated production, led to more intense global trade and created favourable conditions for foreign investment and the recovery of the country’s economy since 2004. Brazil is the largest national economy in Latin America and is the world’s ninth largest economy (2018).
Brazil has a mixed economy with abundant natural resources. In the mining sector, Brazil is the second highest world exporter of iron ore and is a significant producer of copper, gold, bauxite, manganese, tin, niobium and nickel. Brazil has been the world’s largest producer of coffee for 150 years and is a major producer of soy, maize, beef, chicken, and sugar. After rapid growth in preceding decades, the country entered an ongoing recession in 2014 amid a political corruption scandal and nationwide protests. The country has been expanding its presence in international financial and commodities markets, and is one of a group of four emerging economies called the BRIC countries`
Tenements in Brazil are granted subject to various conditions prescribed by the Mining Code, including the payment of rent and reporting requirements and each tenement is granted subject to standard conditions that regulate the holder’s activities or are designed to protect the environment. These standard conditions are not detailed in this report, however where a tenement is subject to further specific conditions, these are detailed in the notes accompanying the tenement schedule.
Mineral tenements in Brazil generally comprise Prospecting Licenses, Exploration Licenses and Mining Licenses.
The holder of a granted Prospecting License, Exploration License or Mining License is not required to spend a set annual amount per hectare in each tenement on exploration or mining activities. Therefore, there is no statutory or other minimum expenditure requirement in Brazil. However, annual rental payments are made to the ANM (National Mining Agency) and the holder of an Exploration License must pay rates and taxes, ranging from R$3.70 to R$5.56per hectare, to the Local Government, as of May 2021.
São Jorge Gold Project, Pará State, Brazil GE21210515
Independent Technical Report on Mineral Resources – 31 May 2021
Lodging a caveat or registering a material agreement against the tenement may protect various interests in a Mining License.
If a mineral tenement is located on private land, then the holder must arrange or agree with the landowners to secure access to the property.
4.2.1 | Prospecting Licenses |
A Prospecting License entitles the holder, to the exclusion of all others, to explore for minerals in the area of the License, but not to conduct commercial mining. A Prospecting License may cover a maximum area of 50 hectares and remains in force for up to 5 years. The holder may apply for a renewal of the Prospecting License which is subject to ANM approval. The period of renewal may be up to a further 5 years.
4.2.2 | Exploration Licenses |
An Exploration License entitles a holder, to the exclusion of all others, to explore for minerals in the area of the License, but not to conduct commercial mining. The maximum area of an Exploration License is 2,000 hectares outside of the Amazonia region and 10,000 hectares within the Amazonia region (Amazonas, Para, Mato Grosso, Amapá, Rondonia, Roraima and Acre states). An Exploration License remains in force for a maximum period of 3 years and can be extended by no more than a further 3 year period. Any extension is at ANM's discretion and will require full compliance with the conditions stipulated by the Mining Code that must be outlined in a report to ANM applying for the extension of the License.
Once the legal and regulatory requirements have been met, exploration authorisation is granted under an Exploration License, granting its holder all rights and obligations relating to public authorities and third parties. An Exploration License is granted subject to conditions regulating the conduct of activities. These include the requirement to commence exploration work no later than 60 days after the Exploration License has been published in the Federal Official Gazette and not to interrupt it without due reason for more than 3 consecutive months or 120 non-consecutive days; to perform exploration work under the responsibility of a geologist or mining engineer legally qualified in Brazil; to inform ANM of the occurrence of any other mineral substance not included in the exploration permit and to inform ANM of the start or resumption of the exploration work and any possible interruption.
If the holder of an exploration License proves the existence of a commercial ore reserve on the granted exploration License, the ANM cannot refuse the grant of a mining License with respect to that particular tenement if the License holder has undertaken the following:
| | ■ | An exploration study to prove the existence of an ore reserve. |
São Jorge Gold Project, Pará State, Brazil GE21210515
Independent Technical Report on Mineral Resources – 31 May 2021
| | ■ | A feasibility study on the commercial viability of the reserve. |
| | ■ | The grant of an environmental License to mine on the particular tenement. |
A Mining License entitles the holder to work, mine and take minerals from the mining lease subject to obtaining certain approvals.
Mining rights can be denied in very occasional circumstances, where a public authority considers that a subsequent public interest exceeds that of the utility of mineral exploration, in which case the Federal Government must compensate the mining concession holder.
A Mining License in Brazil covers an area of between 2,000 hectares and 10,000 hectares, depending on the geographical area, as detailed above, and remains in force indefinitely. The holder must report annually on the status and condition of the mine.
As with other mining tenements, a Mining License is granted subject to conditions regulating the conduct of activities. Standard conditions regulating activities include matters such as:
| | ■ | The area intended for mining must lie within the boundary of the exploration area. |
| | ■ | Work described in the mining plan must be commenced no later than 6 months from the date of publication of the grant of the Mining License, except in the event of a force majeure. |
| | ■ | Mining activity must not cease for more than 6 consecutive months once the operation has begun, except where there is proof of force majeure. |
| | ■ | The holder must work the deposit according to the mining plan approved by the ANM. |
| | ■ | The holder must undertake the mining activity according to environmental protection standards stipulated in an environmental License obtained by the holder. |
| | ■ | The holder must pay the landowner’s share of mining proceeds according to values and conditions of payments stipulated by law, which is a minimum of 50% of CFEM (see below), but is usually agreed to be higher under a contract between the holder of the Mining License and the landowner. |
| | ■ | The holder must pay financial compensation to States and local authorities for exploring Mineral Resources by way of a Federal royalty being the CFEM, which is a maximum of 3% of revenue, depending on commodity. In Pará State, the royalty on gold deposits is 1%. |
An application for a Mining License may only be granted solely and exclusively to individual firms or companies incorporated under Brazilian law, which will have a head office, management and administration in Brazil, and are authorized to operate as a mining company.
São Jorge Gold Project, Pará State, Brazil GE21210515
Independent Technical Report on Mineral Resources – 31 May 2021
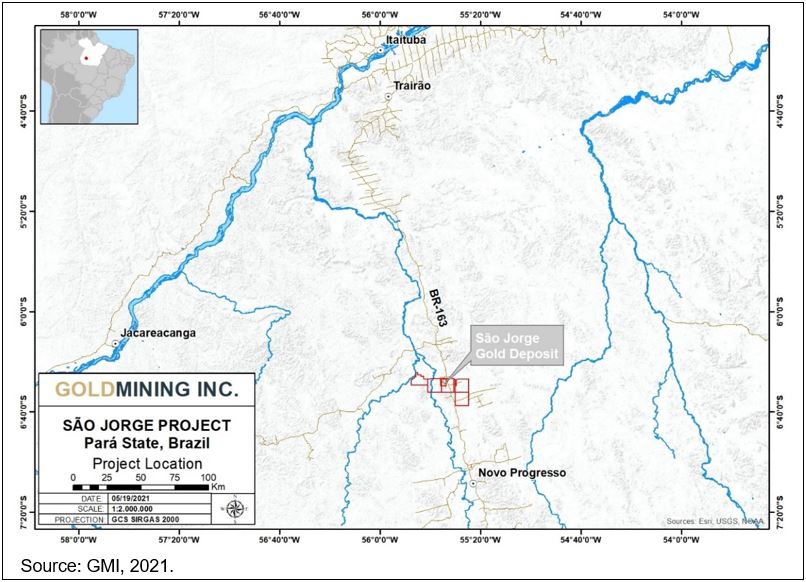
The São Jorge Gold Project is located in the southeast of Pará State, in the municipality of Novo Progresso, approximately 70km north of the town of Novo Progresso. Regional highway BR-163 passes through the São Jorge project site. The region is known as the Tapajós and São Jorge is located 320km south of the main regional city Itaituba (Figure 1).
Itaituba is located at the intersection of the Trans-Amazonica Highway with the Tapajós River. The topographical coordinates of the project are 6.48º latitude South and 55.58º longitude West. The nearest major cities with connections to international flights are Belém and Manaus. Several small regional airlines service Itaituba and Novo Progresso from Belem and Manaus.
Novo Progresso has a population of approximately 25,000 people (2020) and can supply the project with labour force, fuel and equipment that will be necessary to develop the project.
Figure 1 - São Jorge Gold Project Location Map
São Jorge Gold Project, Pará State, Brazil GE21210515
Independent Technical Report on Mineral Resources – 31 May 2021
The description of the mineral tenure is based on information supplied to the QP by GMI as of May 31st, 2021.
GMI, through its Brazilian subsidiaries Brazilian Resources Mineração Ltda., Mineração Regent Brasil Ltda. and BRI Mineração Ltda., is the sole registered and beneficial holder of seven gold exploration concessions in the São Jorge project area.
The mineral rights of São Jorge Project are represented by the Processes ANM Nrs. 850.058/2002, 850.275/2003, 850.556/2013, 850.193/2017, 850.194/2017. 850.195/2017 and 850.196/2017, which comprise an aggregate area of 45,996.63 hectares in the Municipalities of Itaituba and Novo Progresso, in the State of Pará.
Processes ANM Nrs. 850.058/2002 is an exploration licence for gold ore, held by Brazilian Resources Mineração Ltda., with the Final Exploration Report submitted to ANM in July, 2013. This license encompasses the São Jorge gold deposit. On the approval of the Final Exploration Report the company will have a one year period to prepare an Economic Assessment Plan (PAE) and submit to ANM with the application for a Mining License and start the Environmental licensing process.
All the other six mineral titles are currently valid exploration licences for gold ore, of which Brazilian Resources Mineração Ltda., Mineração Regent Brasil Ltda. and BRI Mineração Ltda. GMI subsidiaries, are the titleholders.
Details of GMI’s gold concession holdings in the São Jorge region, with an effective date of May 31, 2021 are found in Table 4 and Figure 2.
São Jorge Gold Project, Pará State, Brazil GE21210515
Independent Technical Report on Mineral Resources – 31 May 2021
Table 4 - São Jorge Project - Summary of GMI’s Concessions Status
Nº _ANM | Titleholder | Status | Phase | Area (ha) | District | State |
850058/2002 | Brazilian Resources Mineração Ltda. | IN PROGRESS | EXPLORATION LICENSE | 1,660.56 | Novo Progresso | Pará |
850275/2003 | Brazilian Resources Mineração Ltda. | IN PROGRESS | EXPLORATION LICENSE | 7,344.31 | Novo Progresso | Pará |
850556/2013 | Mineração Regent Brasil Ltda. | IN PROGRESS | EXPLORATION LICENSE | 9,619.15 | Novo Progresso | Pará |
8550193/2017 | BRI Mineração Ltda. | IN PROGRESS | EXPLORATION LICENSE | 7,307.93 | Novo Progresso | Pará |
850194/2017 | BRI Mineração Ltda. | IN PROGRESS | EXPLORATION LICENSE | 9,541.61 | Itaituba | Pará |
850195/2017 | BRI Mineração Ltda. | IN PROGRESS | EXPLORATION LICENSE | 9,572.68 | Novo Progresso | Pará |
850196/2017 | BRI Mineração Ltda. | IN PROGRESS | EXPLORATION LICENSE | 950.39 | Novo Progresso | Pará |
São Jorge Gold Project, Pará State, Brazil GE21210515
Independent Technical Report on Mineral Resources – 31 May 2021
Figure 2 - São Jorge Project - GMI’’s Exploration Licences Location
Source: ANM, 2021
4.5 | Royalties and Agreements |
Information provided by GMI indicates a number of underlying royalties on the São Jorge Property:
| | ● | 1.0% NSR over entire property – Osisko Gold Royalties Ltd. |
| | ● | 1.0% NSR over entire property – Gold Royalty Corp. |
| | ● | 1.5% NSR over entire property – Brazilian National Mining Agency (ANM) |
| | ● | 1.0% NSR over concession 850.275/2003 on NI 43-101 Proven reserves – Tapajos Mineração Ltda. Can be purchased for US$2.5 million until September 30, 2006; no resources or reserves identified on this concession to date. |
Furthermore, if GMI is not the owner of the surface rights at the time of production, a further 0.75% NSR (set at half the ANM rate) is payable to the overlying surface rights owner.
São Jorge Gold Project, Pará State, Brazil GE21210515
Independent Technical Report on Mineral Resources – 31 May 2021
Based on information supplied to the authors, GMI has complied with all its contractual obligations in respect to the original owners of the licenses (see Section 6.2 regarding Ownership History). The following payments and agreements listed below are the remaining contractual obligations to be completed by GMI:
| | • | Payment by BRML to Pedro Pacheco dos Santos Lima Neto and Tapajós Mineração Ltda. of an amount equivalent to 1% of the proven Mineral Resources within the area represented by ANM process N.850.275/2003; |
Pedro Pacheco and Tapajós sent a notice to BRML on 14 March 2013 claiming payment of an installment calculated based on the proven Mineral Resources at São Jorge based on a feasibility study. Pedro Pacheco and Tapajós claim that such feasibility study was prepared and they never received payment related thereto. BRML responded that there are no royalties or payments to be paid for Pedro Pacheco on the claim no.850.058/2002 that holds the current resources defined in the property.
4.6 | Environmental Liabilities |
The São Jorge deposit is located on an exploration license outside environmentally restricted areas.
A small open pit and 2 small leach pads remain from the previous garimpo operation that was in place in early 2000. The pit has been since filled with water. With the exception of one exploration licence that is located to the west of Jamaxim river that lies on the Jamaxim National Forest protected area (on which mining is permitted under certain conditions), all the other exploration licences of the property are located outside of environmentally restricted areas.
New legislation requires preservation of natural vegetation areas including margins of drainages that were in part degraded by previous artisanal miners activities. The company will have to comply with the minimum preservation area required by legislation and this will be verified and established based on the Environmental baseline studies that will be conducted as part of the Environmental Licensing work to be initiated after the ANM’s approval of the Final Exploration Report.
The authors have not been made aware of any current material environmental liabilities on the Property.
No additional permits, beyond what has been described in preceding sections, are required at the current stage of exploration.
São Jorge Gold Project, Pará State, Brazil GE21210515
Independent Technical Report on Mineral Resources – 31 May 2021
4.8 | Other Significant Factors |
To the extent known, the QPs are unaware of any other significant factors and risks that may affect access, title, or the right or ability to perform work on the property.
5 | ACCESSIBILITY, CLIMATE, LOCAL RESOURCES, INFRASTRUCTURE AND PHYSIOGRAPHY |
Access to the São Jorge Gold Project from the city of Itaituba is via 320km of paved roads on highway BR 163, and secondary roads that transect the property (Figure 2).
Itaituba is a well-established city with good port facilities on the Tapajós River and a capacity for large freight aircraft. Itaituba is located on the Transamazonian highway, and is approximately 1,000km west of Marabá, which is 1,500km from Brasília via the Belem-Brasília highway. Itaituba can be reached by scheduled jet aircraft from Manaus and Belem, where international connections are available. The area can also be reached by a one hour flight from Itaituba using the un-paved airstrip in the village of Morais de Almeida.
GMI has planned to base its operations in Novo Progresso as this town is much closer to the project, using the following criteria;
| | ■ | Located 70km by paved road south of the project; |
| | ■ | Town of approximately 25,000 inhabitants capable of supplying labour and services to the project; |
| | ■ | Novo Progresso airport has been upgraded with a longer and wider tarmac runway; |
| | ■ | Hydro-electric transmission line from Novo Progresso can supply power to the project; |
5.2 | Physiography and Climate |
The climate is tropical with an annual rainfall of around 2,000mm and seasonal variations with a drier period between July and November and a wetter period between December and May. Existing mining operations in the region can operate year-round. The average annual temperature is approximately 27.5ºC with minimal month to month variations.
The topography is gently rolling with elevations of 150m to 400m above mean sea level.
Vegetation varies from tropical rainforest, with the project area located within farmland.
5.3 | Local Infrastructure and Services |
São Jorge has an exploration camp comprising:
| | ■ | Housing facilities for up to 40 persons; |
| | ■ | Office with phone and internet; |
São Jorge Gold Project, Pará State, Brazil GE21210515
Independent Technical Report on Mineral Resources – 31 May 2021
| | ■ | Core storage and logging facility; |
| | ■ | Powerline and generator power. |
A core shed has been constructed to house all the drillcore from the project. The São Jorge exploration site is connected to the regional power line from the locality of Novo Progresso with emergency backup supplied by diesel generators. The power line will require upgrading to 138 kV capacity along with a local substation at the plant site for potential future mining operations.
A skilled work force and labour are mainly sourced from Novo Progresso located 70km to the south. Fuel, food and service companies are located in Novo Progresso.
The local economy consists mainly of cattle ranching, logging and small scale mining.
Water for industrial and potable use has been assumed to be drawn from the Jamanxim River, 9 km to the west of the project site. While GMI does not own surface rights in the Project area, they have a land use agreement with a local cattle farmer, for an area overlaying the exploration concessions, including land overlaying the Mineral Resource. As the Project is still in an exploration stage, it is premature to discuss mining personnel, potential tailings storage areas, potential waste disposal areas, and processing plant sites. However, it would be expected that such potential future infrastructure to support a mining operation could be located on undeveloped local land following the provisions of a potential future mining license.
São Jorge Gold Project, Pará State, Brazil GE21210515
Independent Technical Report on Mineral Resources – 31 May 2021
The exploration history for the São Jorge property is summarised in Table 5 below.
Table 5 - São Jorge Project - Property Exploration History
Date | Entity | Work Program | Significant Results |
Before 1990 | Informal miners during Tapajós Gold Rush | Alluvial and saprolite Garimpo mining | Some gold production (not reported) |
1993 - 1995 | RTDM | Mapping, soil sampling, trenching, auger and diamond drilling (26 holes for 4350.3m) | |
1997 - 1998 | RTDM | Scoping study and diamond drilling with 16 drillholes | First Mineral Resource estimation by RTDM (non- compliant with NI 43-101 guidelines) |
1998 | Altoro | Negotiated property with RTDM but didn’t advance with the option due to a merger with Solitario Resources | |
2001 - 2005 | Tapajós Mineração Ltda | Garimpo open pit mining operation | Production of gold by heap leaching (final production not reported); final pit 400m long, 80m wide and 20 to 30m deep |
2005 | Talon (previously named BrazMin) | Phase I diamond drilling program of 48 drillholes for 10,104m. | Defined a envelope of a vein and stockwork zone of 700m strike extent |
2006 | Talon | Phase II diamond drilling program of 34 drillholes for 7,952m and airborne and ground geophysics | New targets and extensions from Wilton Zone defined to the west – ‘Kite zone” and east “Wilton East zone”. First NI 43-101-compliant Mineral Resource estimation. |
2007 | Talon | Extension of regional soil sampling grid | Anomalous gold values along 600m on one line |
2011 | BGC | 120 linear km of soil geochemistry and geophysics (IP), and drilling (14,708m) in 37 holes | Increased the Mineral Resource and upgraded the resource classification |
Gold is reported to have been first discovered in the Tapajos region in the 18th century.
Significant production has been recorded since the end of the 1970s and beginning of the 1980s, when the BR 163 (Cuiaba - Santarém road) was opened. A gold rush started in the Tapajos region with thousands of garimpeiros entering the region that was until then totally isolated. Production from the region apparently peaked between 1983 and 1989, with as many as 300,000 garimpeiros reportedly extracting somewhere between 500,000oz and 1Moz per year, predominantly based on alluvial gold. Up until 1993, production was officially estimated at 7Moz, but real production is unknown. Production has since declined, reaching an average of 160,000oz of gold per year in the late 1990s.
São Jorge Gold Project, Pará State, Brazil GE21210515
Independent Technical Report on Mineral Resources – 31 May 2021
São Jorge is located in the eastern part of the so called “Tapajos Gold District”. São Jorge garimpo mining reportedly commenced in the 1970s. There are no published records to support the timing or amount of production. The exploration of the São Jorge area was initiated by Rio Tinto Desenvolvimento Minerais Ltda (“RTDM”), a subsidiary of Rio Tinto Plc Mineral Group, in 1993. At that time the São Jorge garimpeiro workings (Wilton Pit), was approximately 30m in diametre. Following sampling in this small open pit, RTDM applied for four exploration licences in order to acquire the bedrock mining rights. Additionally, they negotiated an agreement with the landowner Wilton Amorim, which enabled them to initiate exploration on the property.
The RTDM exploration program involved a 300m line spacing airborne magnetic survey, 200m by 200m soil sampling grid around the São Jorge garimpo workings, 202 auger holes totalling 1,868m (drilled on a 50m by 20m grid with infill 8m by 8m), trenching with channel sampling (total of 1,071 samples collected in 16 trenches), detailed geological mapping to define the geological and structural framework and 26 diamond drillholes for a total of 4,350.3m.
In 1997, as part of a scoping study, RTDM estimated a non-compliant NI43-101 Mineral Resource for the São Jorge Property and completed an additional 16 diamond drillhole program to test conclusions of the scoping study (see Section 6.3 below).
In March 1998, Altoro Gold Corp. (Altoro) negotiated an agreement on the property with RTDM and reviewed all data by check sampling of drillholes and surface sampling at the garimpeiro pit. However, due to a merger with Solitario Resources Corporation, no further work was completed on the property. In early 2003, RTDM relinquished the four São Jorge exploration licenses.
One of the licenees (No 850.024/02), was immediately acquired by a private individual and subsequently optioned to Centaurus Mineração e Participações Ltda (Centaurus). No exploration work was undertaken by Centaurus.
From 2001 to 2005, garimpeiro operations were undertaken by Tapajós Mineração Ltda (TML). These operations included small heap leach pads using cyanide solutions to recover gold. Production by TML was reported at 15,000t of ore per month grading 0.3 to 0.7g/t of gold. Harron (2004) reported an estimated production of “approximately 1,500 oz of gold per year.”
After garimpeiro operations ceased on the property, a pit of approximately 400m long, 80m wide and 20 to 30m deep had been excavated over the Wilton Pit area.
On July 16, 2004 Talon acquired from Centaurus a 100% interest in the São Jorge exploration licenses and in April 2005 entered into an agreement with Jaguar Resources Limited acquiring a 100% interest in the three adjacent claims.
On 14 June, 2010 Brazilian Gold Corporation (BGC) acquired from Talon a 100% interest in the São Jorge exploration licenses.
São Jorge Gold Project, Pará State, Brazil GE21210515
Independent Technical Report on Mineral Resources – 31 May 2021
BGC completed an exploration program in 2011 with 14,673m of diamond drilling on the São Jorge Gold Project. The conclusions from the program are published in this report.
On November 22, 2013, BGC completed an agreement with Brazil Resources Inc. (BRI), pursuant to which BRI acquired all of the outstanding common shares of BGC. Brazil Resources Inc. announced that effective December 6, 2016, it had changed its name to GoldMining Inc. As a result of its acquisition of BGC, GMI indirectly owns Brazilian Resources Mineração Ltda., Mineração Regent Brasil Ltda. and BRI Mineração Ltd., which in turn own the Project.
Several historical mineral resource estimates have been prepared for the gold deposits on the São Jorge gold project prior to the mineral resources presented in Section 14. The reader is cautioned that the historical mineral resource estimates are being treated by GoldMining as historical in nature, and should not be relied upon, and are superseded by the resource estimate detailed in this report. Neither the QPs or GoldMining has done sufficient work to classify the historical estimates as current mineral resources and are not treating these historic estimates as current mineral resources. The following section provides a brief history of the mineral resource estimates of the project by the previous owners including the now historical 2013 Mineral Resource.
Table 6 is the historical 2013 resource statement published by BGC in 2013 contained in the report titled “São Jorge Gold Project, Para State, Brazil: Amended Independent Technical Report on Mineral Resources.”
Table 6 - 2013 Historical Mineral Resource estimate
| Lower Cutoff Grade (g/t Au) | Million Tonnes | Average Grade (g/t Au) | Contained Gold (Kozs) |
Indicated Mineral Resource | 0.3 0.4 | 14.42 12.15 | 1.54 1.77 | 715 690 |
| | 0.5 | 10.49 | 1.97 | 666 |
Inferred Mineral Resource | 0.3 0.4 | 28.19 22.43 | 1.14 1.35 | 1035 971 |
| | 0.5 | 18.78 | 1.52 | 918 |
The 2013 historic Mineral Resource uses the same categories as the Mineral Resource presented in Section 14. The key assumptions and parameters used to prepare the 2013 historic Mineral Resource are outlined in Table 7
São Jorge Gold Project, Pará State, Brazil GE21210515
Independent Technical Report on Mineral Resources – 31 May 2021
Table 7 - 2013 Historic Mineral Resource estimate - Calculation Parameters
Item | Value | Unit |
Mining Cost | 1.39 | (US$/t mined) |
Processing Cost | 7.19 | (US$/t) |
G&A | 1.54 | (US$/t) |
Recovery | 90 | (%) |
Royalty etc. | 1.50 | (%) |
Gold Price | 1,300 | (US$/oz) |
Cut-off Grade | 0.3 | g/t |
Other than the above estimate, previous estimates, now treated as historical mineral resource estimates, were included in the following reports of predecessor operators:
| | ● | “Technical Report on Sao Jorge Project, Para State Brazil” with an effective date of Sept. 1, 2004 prepared for Resource Holdings & Investments Inc. by G. A. Harron P.Eng. |
| | ● | “Technical Report on Sao Jorge Project, Para State Brazil” with an effective date of Mar. 31, 2006 prepared for BrazMin Corp. by G. A. Harron P.Eng. |
| | ● | “Talon Metals Corp.: Sao Jorge Gold Project, Para State, Brazil, National Instrument 43-101 Second Technical Report” with an effective date of Sept. 4, 2008 prepared for Talon Metals Corp by Beau Nicholls, MAIG (Coffey Mining Pty Ltd.) |
| | ● | “Brazilian Gold Corporation - Sao Jorge Gold Project, Para State, Brazil, National Instrument 43-101 First Technical Report” with an effective date of Sept. 14, 2010 prepared for Brazilian Gold Corporation by Beau Nicholls, MAIG (Coffey Mining Pty Ltd.) |
| | ● | “Brazilian Gold Corporation - Sao Jorge Gold Project, Para State, Brazil, Preliminary Economic Assessment NI 43-101 First Technical Report” with an effective date of June 21, 2011 prepared for Brazilian Gold Corporation by Porfirio Cabaleiro (Coffey Mining Pty Ltd.) |
| | ● | “Brazilian Gold Corporation - Sao Jorge Gold Project, Para State, Brazil, Preliminary Economic Assessment NI 43-101” with an effective date of Jan. 31, 2013 prepared for Brazilian Gold Corporation by Curtis Clarke, MMSA (Coffey Mining Pty Ltd.) |
São Jorge Gold Project, Pará State, Brazil GE21210515
Independent Technical Report on Mineral Resources – 31 May 2021
A ‘garimpo’ type operation had existed previously at São Jorge.
Harron (2004) reported a non-official production for the garimpo production at São Jorge Gold Project of approximately 1,500oz of gold per year between 2001 and 2005.
São Jorge Gold Project, Pará State, Brazil GE21210515
Independent Technical Report on Mineral Resources – 31 May 2021
7 | GEOLOGICAL SETTING AND MINERALISATION |
The São Jorge Gold Project is located within the Tapajós District situated in the south-central portion of the Amazon Craton. The Amazon craton became tectonically stable at the end of the Late Proterozoic period. The Craton is generally divided into the Guyana Shield north of the Amazon River and the Brazil Shield south of the Amazon River. The provinces have a northwest trend across the shields. The Brazil Shield has, as its nucleus, the Archean granitoid - greenstone terranes of the Carajás-Imataca Province in the east. The structural provinces become younger towards the west and are dominantly granitic rocks of Paleoproterozoic age. There is a general agreement that in this region, initial oblique collision tectonism was associated with crustal shortening linked to subduction and or accretion of magmatic arcs and early continental nucleation.
The main units that form the basement of the Tapajós Gold Province are the Paleoproterozoic Cuiú-Cuiú Metamorphic Suite (2.0 to 2.4Ga old), and the Jacareacanga Metamorphic Suite, also of possible Paleoproterozoic age (>2.1Ga). The Cuiú-Cuiú Suite comprises gneisses, migmatites, granitoid rocks and amphibolites. The Jacareacanga Suite comprises a supracrustal sedimentary-volcanic sequence, which has been deformed and metamorphosed to greenschistfacies. Both Suites are intruded by granitoids of the Parauari Intrusive Suite consisting of a monzodiorite dated at 1.9 to 2.0Ga. These form the basement of the extensive felsic to intermediate volcanic rocks of the Iriri Group, dated at 1.87 to 1.89Ga, including comagmatic and anorogenic plutons of the Maloquinha Suite with intrusive events dated at 1.8 to 1.9Ga. The Iriri - Maloquinha igneous event is associated with a strong extensional period. Regional structural analysis in the Tapajós area has identified important lineaments that trend mainly northwest to southeast with a less well defined transverse east to west set.
The primary gold mineralisation in the Tapajos region is related to:
| | ■ | Lode-like mesothermal orogenic gold deposits, in the context of quartz veins in shear zones with local hydrothermal alteration in the context of the basement rocks; and |
| | ■ | Stockwork and disseminated gold with a more pervasive hydrothermal alteration in the context of the granitic and volcanic rocks, similar to porphyry and epithermal styles of mineralisation . |
The São Jorge gold deposit is related to the east extension of the regional 450km long northwest-southeast Cuiú-Cuiú - Tocantinzinho lineament which also hosts several important gold deposits including the Palito mine, Tocantinzinho deposit and Cuiú-Cuiú, Bom Jardim and Batalha gold prospects (Figure 3).
São Jorge Gold Project, Pará State, Brazil GE21210515
Independent Technical Report on Mineral Resources – 31 May 2021
Figure 3 - Regional Geology Map
The São Jorge property geology (Figure 4) is covered by a granitoid pluton dominantly composed of an amphibole-biotite monzogranite In the past, this pluton was interpreted to comprise one granitoid series, however geological research completed by the Federal University of Pará (UFPA) indicates that the pluton is heterogeneous and is comprised of two main granitoid series including:
| | ■ | Older São Jorge granite - massive granites and granite porphyries composed of amphibolite, biotite monzogranite to quartz monzogranite rocks and biotite leuco-monzogranites to syenogranite rocks, massive, displaying only local, nonpenetrative foliation; |
| | ■ | Younger São Jorge granite - massive granites composed of biotite leuco-monzogranite and syenogranites occurring as circular shaped bodies, with locally brecciated foliation indicating brittle-ductile deformation as in the vicinity of gold mineralisation. |
São Jorge Gold Project, Pará State, Brazil GE21210515
Independent Technical Report on Mineral Resources – 31 May 2021
The São Jorge granites frequently include 5 to 10cm long, oval-shaped mafic enclaves. They also display local rapakivi texture characterized by sparse crystals of K-feldspar mantled by plagioclase.
Figure 4 - São Jorge Project Surface Geology
The São Jorge mineralised envelope is currently estimated at 1,400 metres in length, striking WNW-ESE (110-290 degrees). The mineralised zone attains a maximum thickness of approximately 160 metres and has been shown to extend to at least 350 metres depth (limit of drilling). The mineralised zone/s are subvertical (Pedley, 2011).
Typically soil, laterite, saprolite and saprock comprise the upper 30 to 40 metres. Below this is fresh granite of a fairly narrow range of primary composition. Microscope work on representative samples indicates the following ranges for the major rock forming minerals in the weakly to moderately altered lithologies:
| Quartz: | 20 to 35 % |
| | |
| Plagioclase: | 20 to 35 % |
| | |
| K-feldspar (Microcline): | 15 to 40 % |
| | |
| Mafic minerals (chl/biot/amph): | 1 to 20 % |
São Jorge Gold Project, Pará State, Brazil GE21210515
Independent Technical Report on Mineral Resources – 31 May 2021
Based upon these compositions the primary rock is mostly monzogranite though lesser amounts of granodiorite (where microcline content is lower) are present. Depending on the contribution of hornblende, biotite and magnetite, a prefix of hornblende or biotite may be added to the rock name.
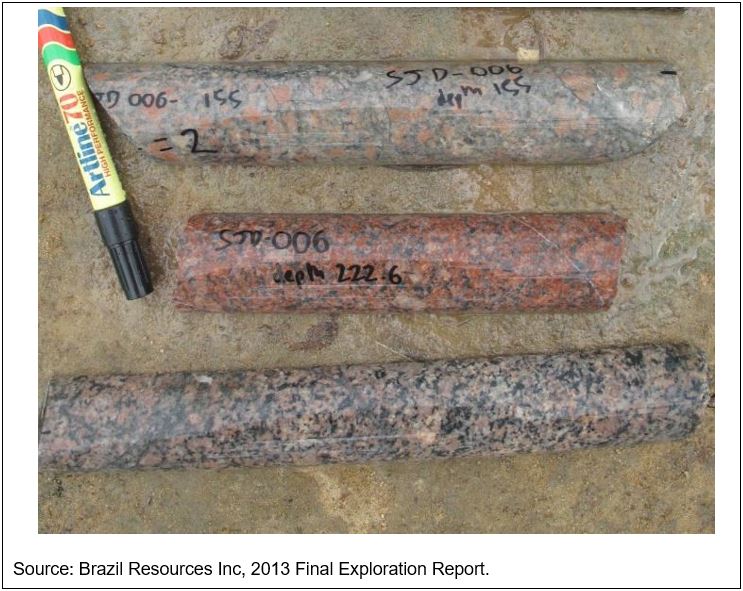
Figure 5 shows typical São Jorge lithologies; from top to bottom they are monzogranite with large orange/pink microcline crystals, 35% plagioclase (largely altered to sericite), 20% quartz; granodiorite comprised of 35% quartz, 30% plagioclase, 15% microcline and 15% chlorite (reddish colouration is due to fine hematite within plagioclase); and very weakly altered hornblende monzogranite comprised of 20% quartz, 30% plagioclase, 20% microcline, 18% hornblende, 6% biotite and 1 % chlorite. This sample is most representative of the original rock composition (Pedley, 2011).
Figure 5 - Typical São Jorge Deposit Lithologies
São Jorge Gold Project, Pará State, Brazil GE21210515
Independent Technical Report on Mineral Resources – 31 May 2021
The São Jorge granites are mostly medium grained and equigranular but where potassic alteration is advanced, microcline crystals up to 100mm size may give the rock a coarse porphyritic texture. A small percentage (<0.5%) of the rock mass is comprised of fine grained aplites which are pink/orange K-feldspar rich, cross-cutting and up to three metres thick. A small amount of leuco-granite is present in some boreholes; comprised mainly of K-feldspar, possibly as a result of pervasive potassic alteration. Where intensely sheared, the granite composition and texture is unrecognisable and the lithology is best described as a low-grade metamorphic granite or meta-granite (Pedley, 2011).
The main variable in the São Jorge lithology is alteration. The main visible alteration types are:
| | ■ | Sericitisation of plagioclase |
| | ■ | Chloritisation of hornblende and biotite |
| | ■ | Microclinisation (potassic) alteration of plagioclase |
| | ■ | Epidotisation of mafics and as a sassauritisation product within plagioclase |
| | ■ | Hematite development probably after magnetite |
| | ■ | Carbonatisation. Although widespread (in small quantities of 0 to 4%) it is difficult to recognise in core samples and has not been used in the classification of assemblages. |
In addition to the above is the development of new quartz (silicification) (Pedley, 2011).
7.2.3 | Alteration assemblages |
The intensity of alteration and the relative proportions of the main alteration minerals is variable and changes are typically gradational, but five alteration assemblages have been recognised as those which can be identified relatively easily in core and importantly, correlated between boreholes. The alteration minerals, in probable order of genesis/advancement, reflecting change from potassic to phyllic alteration, are: Fe-oxide→ chlorite→ microcline and epidote→ sericite and quartz.
The alteration assemblages of São Jorge rocks are described and illustrated in Sections 7.2.3.1 to 7.2.3.5.
7.2.3.1 | ‘Nada’ Zone – Very weak or no alteration |
Figure 6 illustrates the pale grey hornblende-magnetite monzogranite, sometimes with clusters of biotite and magnetite, in this case totally unaltered. Crystals are typically euhedral.
São Jorge Gold Project, Pará State, Brazil GE21210515
Independent Technical Report on Mineral Resources – 31 May 2021
Figure 6 - ‘Nada’ Alteration Zone
7.2.3.2 | Fe-oxide +/- chlorite alteration (Fe-Ox-chl zone) |
Hematite formation within feldspar crystals gives this alteration type a distinct reddish colouration. Chlorite typically forms veins and patches. Hornblende is partially/largely preserved. Crystals are euhedral to subhedral. Primary magnetite is largely replaced. Widely spaced narrow (<0.2m) mineralised zones of quartz-sericite alteration may be present. With increasing pervasive alteration this zone grades into the K-feldspar – epidote – chlorite zone, or; with a greater frequency of fracture controlled alteration/mineralisation may be classified as the heterogeneous ore type.
Figure 7 illustrates the Fe-oxide +/- chlorite assemblage, in this case very little chlorite present (hornblende remains largely unaltered).
São Jorge Gold Project, Pará State, Brazil GE21210515
Independent Technical Report on Mineral Resources – 31 May 2021
Figure 7 - Fe-oxide +/- chlorite alteration zone
7.2.3.3 | K-feldspar – epidote– chlorite alteration (K-feld – ep – chl zone) |
Sericite comprises less than 4-5% of the rock. Increased alteration is present, notably microclinisation forming overgrowths and new large K feldspar crystals. Microcline crystals may reach 100mm or more. Plagioclase takes on a light greenish appearance due to replacement by epidote. New quartz is not as abundant as it is in the mixed assemblage.
Chlorite is abundant forming veins and aggregates.
Figure 8 illustrates the K-feld – ep – chl zone. It presents large K-feldspar crystals and visible chlorite veins.
São Jorge Gold Project, Pará State, Brazil GE21210515
Independent Technical Report on Mineral Resources – 31 May 2021
Figure 8 - K-feldspar – epidote– chlorite alteration zone
7.2.3.4 | Sericite – K-feldspar – chlorite – epidote alteration (mixed zone) |
Sericite is an essential component of this assemblage, and epidote and K-feldspar are always present in varying amounts. A distinguishing criteria of this assemblage is that the alteration is pervasive. There is some variation in the relative proportion of sericite which may comprise between 5 and 50% by volume; largely reflecting the intensity of the alteration. With increasing intensity the epidote and K-feldspar component is reduced, replaced by a sericite quartz assemblage; it may be possible to subdivide the assemblage based upon the amount of sericite and epidote present.
Typically this alteration assemblage has a greenish/grey patchy or ‘marbled’ appearance. Original crystal forms are largely/entirely destroyed though less intensely altered varieties exist. New quartz is common, probably after K-feldspar (Pedley, 2011). It is distinct in core and provides a useful ‘marker’ for correlation. Figure 9 illustrates the mixed zone, in this case sericite is present in relatively small amounts (15%).
São Jorge Gold Project, Pará State, Brazil GE21210515
Independent Technical Report on Mineral Resources – 31 May 2021
Figure 9 - Mixed zone alteration type
7.2.3.5 | Heterogenous (variable) zone |
The importance of this assemblage was recognised midway through the re-logging exercise; on some sections it may be incorrectly logged as Fe-Ox +/- chl or K-feldspar-epidote-chlorite assemblage. It is typified by weak to moderately altered rock of these assemblages but with small (10mm to 0.5m) altered zones with quartz, sericite, epidote and appears to be fracture controlled as opposed to pervasive.
Figure 10 illustrates the heterogeneous (variable) zone alteration. In this picture there are several small zones of intense sericite-quartz alteration separated by sections of weak Fe-Ox +/- chl alteration. This heterogeneous appearance is typical of this mineralisation type.
São Jorge Gold Project, Pará State, Brazil GE21210515
Independent Technical Report on Mineral Resources – 31 May 2021
Figure 10 - Heterogeneous alteration type zone
7.2.4 | Alteration Intensity |
Alteration intensity is logged using a scale of 0 to 3:
| | 0 | - none or very minor alteration |
| | 2 | - moderate to strong alteration |
São Jorge Gold Project, Pará State, Brazil GE21210515
Independent Technical Report on Mineral Resources – 31 May 2021
There is a general increase in intensity with advancement through to ‘mixed’ alteration but there are exceptions to this. The mixed zone displays the greatest range of alteration intensity, possibly controlled by the proximity to shear zones where alteration is most intense.
The mineralised and altered portions of the São Jorge granite reflect zones of moderate shearing evident as numerous small (less than 2-3 metres, mostly less than 0.5 metre) ductile shears with foliation approaching mylonitic textures in places, and widespread micro-shearing and brecciation. Quartz and feldspar crystals are affected by cataclasis forming cryptocrystalline aggregates.
Figure 11 shows a typical small shear zone. On top: Foliation and cataclastic textures. On bottom: Typical quartz veining adjacent to most intense shearing then rock becomes less sheared but still brecciated. In both cases alteration is advanced (sericite dominated) and very intense.
The shear zones are typically discontinuous; they can be correlated between some boreholes but not others. Generally, shear zones are within the most advanced alteration zones. Quartz veining, boudin structures, carbonate veinlets and hematite are typical of the shear zones. Sericite may comprise up to 60% of the central parts of the shear zones, and this lithology is logged as meta-granite. Adjacent to these zones the granites showing micro-shearing and brecciation and a general destruction of the igneous textures (cataclasis) for several metres around the structure (Pedley, 2011).
São Jorge Gold Project, Pará State, Brazil GE21210515
Independent Technical Report on Mineral Resources – 31 May 2021
Figure 11 - Typical small shear zones
São Jorge Gold Project, Pará State, Brazil GE21210515
Independent Technical Report on Mineral Resources – 31 May 2021
Gold mineralisation is associated with sulphides; at least 99 percent of sulphide is pyrite. Chalcopyrite, and very rare galena and molybdenite make up less than 1%. sulphide is either disseminated (Figure 12) or within veins/veinlets (Figure 13) or small semi-massive blebs/lenses (Figure 14), comprising up to a maximum of 10% by volume by metre of core. Grains are typically < 2mm fine euhedral to subhedral but in exceptional specimens sulphide grains may reach 8-10mm in size.
Figure 12 - Fine disseminated sulphide within mixed zone
São Jorge Gold Project, Pará State, Brazil GE21210515
Independent Technical Report on Mineral Resources – 31 May 2021
Figure 13 - Fracture controlled vein style pyrite within Fe-Ox-Chlorite material
São Jorge Gold Project, Pará State, Brazil GE21210515
Independent Technical Report on Mineral Resources – 31 May 2021
Figure 14 - Massive sulphide bleb
As is illustrated in Figure 15, mineralisation is best developed within the central portions of the deposit, typically associated with sericite (phyllic alteration):
| | ■ | within the mixed zone, as disseminations and semi-massive accumulations. Sulphide is more abundant in the mixed zone than in any other assemblage but gold mineralisation appears to be equally well developed within the less pervasively altered heterogeneous zone. |
| | ■ | within numerous small fracture controlled altered and mineralised concentrations within the heterogeneous and Fe-Ox +/- chlorite zones This style of mineralisation is typically within sulphide veins up to 100 mm thick and is more likely to contain chalcopyrite than the other mineralisation styles. Some of the best grade intersections are within this fracture controlled ore-type. |
São Jorge Gold Project, Pará State, Brazil GE21210515
Independent Technical Report on Mineral Resources – 31 May 2021
Figure 15 - São Jorge deposit typical section with alteration zones
The São Jorge mineral deposit is a post-tectonic granite intrusion related gold deposit. The origin of gold mineralisation is thought to be related to late-stage volatile enriched intrusive phases controlled by extensional tectonics in the context of a regional lineament.
Analogous deposits associated with granitic intrusives in the Amazonian craton are the multi-million ounce Omai gold deposit in Guyana (Goldfarb et al 2001) and the Tocantinzinho gold deposit owned by Eldorado Gold, located approximately 80km northwest from the São Jorge property along the same regional lineament.
São Jorge Gold Project, Pará State, Brazil GE21210515
Independent Technical Report on Mineral Resources – 31 May 2021

Exploration work completed over the property by previous operators with potential results to generate targets for future exploration work includes:
| | ● | Induced polarization (“IP”) survey over the deposit and immediate surrounding area covering 24,6 square km and |
| | ● | Soil sampling survey over 15,0 squares kilometres on a 200 metre by 50 metre grid and 100m by 50m infill sampling grid for a total of 4,445 surficial soil samples collected and analyzed for gold. |
Since acquiring the Project, GMI has not conducted any exploration work on the Project.
9.1 | Ground geophysics - IP Survey |
In the period between May 3rd and August 8th, 2011, an IP survey with acquisition and preliminary processing of data was completed over the property totaling 101,550 linear metres of IP profiles.
The Spectral Induced Polarization survey was performed along lines using the Dipole-Dipole arrangement with spacing of 100 metres between NM and advances of 50 metres, using the system IP in time domain with VIP4000 Transmitter in conjunction with IP Receiver ELREC-PRO – both from IRIS.
In the induced polarization processing, the GEOSOFT Interactiv™ IP Processing System was used for data processing.
Figure 16, below show the chargeability distribution in plan at 100m level. The image is a representation of the chargeability at greater depths, presenting anomalous values in the east and central regions, where it is possible to infer the presence of thin bodies in preferred oriented directions and the interpretation of main anomaly.
São Jorge Gold Project, Pará State, Brazil GE21210515
Independent Technical Report on Mineral Resources – 31 May 2021
Figure 16 - IP Chargeability Map (100m level)
A soil geochemistry grid using a 200m line spacing and 50m sample spacing with some infill lines using a 100m line spacing and 50m sample spacing was competed in the area surrounding the deposit. This work resulted on collection and analyses of 4,445 surficial soil samples that were analyzed using the Fire Assay AAS and ICP 36 elements method.
Of the elements analyzed, the most important is gold which distribution on map is shown in the Figure 17.
From the results obtained, it was concluded that there is a significant gold anomaly in soil coincident with the limits of the São Jorge deposit, which was already expected.
To the southeast of the São Jorge deposit there are few gold in soil anomalies with scattered values above > 100 ppb Au that have not been subject to follow-up work. To the west and southwest of the deposit there are also few gold in soil anomalies that appear to have continuity in more than two contiguous lines that are targeted for future drilling.
São Jorge Gold Project, Pará State, Brazil GE21210515
Independent Technical Report on Mineral Resources – 31 May 2021
Figure 17 - São Jorge Exploration - Soil Geochemistry - Gold in Soil Anomalies
The QP considers the Project to have relevant exploration potential along strike of the main identified São Jorge shear structure along with sub-parallel regional structures as identified in the IP survey and soil sampling.
São Jorge Gold Project, Pará State, Brazil GE21210515
Independent Technical Report on Mineral Resources – 31 May 2021
A total of 145 diamond drillholes for 37,154 metres have been completed at São Jorge Gold Project, as summarized in Table 8. A list of all drillholes completed to date on the property are listed in Appendix B, including collar location, azimuth, dip and depth of each hole.
The results of this drilling have been incorporated with the previous drilling and were used in the resource estimate that is the focus of this report.
Table 8 - Drilling Statistics Summary
Company /Drill Hole Identification | Number of Drillholes | Metres Drilled |
Rio Tinto Desenvolvimento Mineral – RTDM ( FSJ01- FSJ10) | 10 | DDH | 1,700 |
Rio Tinto Desenvolvimento Mineral – RTDM (FSJ11- FSJ26) | 16 | DDH | 2,690 |
Talon Phase I (SJD01- SJD 48) | 48 | DDH | 10,104 |
Talon Phase II (SJD 49- SJD 82) | 34 | DDH | 7,952 |
BGC (SJD 83 - SJD119) | 37 | DDH | 14,708 |
Total | 145 | DDH | 37,154 |
Data collection can be subdivided into three distinct periods: The first period relates to data collected by RTDM. The second period relates to data collected under work programs managed by Talon and a third period by BGC. As such, further comments are directly attributed to each company. GMI has not done any drilling.
BGC in 2011 completed the most recent diamond drilling program (14,708m in 37 holes) at the São Jorge Gold Project to test the continuity of mineralisation 100m below previous intercepts (0 masl) and infill along strike where previous drilling was widely spaced.
Data collection methods applied by BGC and Talon have been reviewed by the QP and as such, have been directly assessed. Drilling completed by RTDM was undertaken prior to involvement by the QP so no detailed review has been undertaken.
10.2 | Relevant Drillhole Intersections and True Thickness |
To supplement the data in Appendix B, Table 9 shows the significant continuous mineralized intervals greater than 15m downhole from the drilling programs.
The >= to 15m highlights the significantly higher-grade intervals (gold grade samples >10g/t) which occur within the relevant drill hole intersections.
The mineralised envelope is currently estimated at 1,400 metres in length, striking WNW-ESE (110-290 degrees) and is subvertical. The mineralised envelope zone attains a maximum thickness of approximately 160 metres and has been shown to extend to at least 350 metres depth (limit of drilling).
São Jorge Gold Project, Pará State, Brazil GE21210515
Independent Technical Report on Mineral Resources – 31 May 2021
The thicknesses of the individual mineralized intervals for each hole will vary given the variable dips at which the holes were completed (including vertical) and the true thickness for the intervals from each individual mineralized intersection has not been determined.
Figure 18 illustrates drillholes (in red) and deposit outline (in blue) in the area of the deposit and topographic contours and Figure 19 presents drillhole positions (in red) and deposit outline (in blue) over a satellite image; note the garimpeiro pit in the centre of the deposit.
Figure 18 - São Jorge Gold Project Drillhole Locations
São Jorge Gold Project, Pará State, Brazil GE21210515
Independent Technical Report on Mineral Resources – 31 May 2021
Figure 19 - São Jorge Gold Project Drillhole Location and the old Garimpo Pit
São Jorge Gold Project, Pará State, Brazil GE21210515
Independent Technical Report on Mineral Resources – 31 May 2021
Table 9 - Relevant Drill Hole intersections
Continuous mineralization over a thickness >= to 15m
Hole ID | from (m) | to (m) | Interval (m) | Average (g/t Au) | Higher Grade Intervals ( > 10 g/t Au) |
FSJ-03 | 10.00 | 30.00 | 20.0 | 0.62 | |
FSJ-04 | 17.37 | 36.36 | 19.0 | 1.86 | |
FSJ-06 | 73.46 | 108.50 | 15.0 | 1.51 | incl. 1,00m @ 12,24 g/t Au (from 73.46m to 74.48m) |
FSJ-08 | 95.72 | 115.00 | 17.6 | 2.59 | incl. 0,36m @ 42,9 g/t Au (from 95.72m to 96.08m) |
FSJ-16 | 83.33 | 98.28 | 15.0 | 1.16 | |
FSJ-19 | 0.00 | 27.80 | 31.0 | 1.31 | |
FSJ-21 | 0.00 | 15.00 | 15.0 | 1.1 | |
FSJ-21 | 24.00 | 41.90 | 17.9 | 2.85 | incl. 1,08m @ 10,25g/t (from 34.85m to 35.93m); 0,81m@10,86g/t Au (from 37m to 37.81m) |
FSJ-22 | 1.00 | 17.00 | 16.0 | 2.68 | |
SJD-001-05 | 149.07 | 165.60 | 16.5 | 2.71 | incl. 0,87m @ 11,08 g/t Au (from 160.21m to 161.08m) |
SJD-002-05 | 178.60 | 196.30 | 17.7 | 1.69 | |
SJD-002-05 | 238.12 | 262.23 | 24.1 | 6.89 | incl. 4,00m @ 29,59 g/t Au (from 252.23m to 256.23m) |
SJD-004-05 | 109.25 | 137.20 | 28.0 | 3.16 | incl. 1,00m @ 44,95 g/t Au (from 121.67 to 122.67m) |
SJD-007-05 | 91.43 | 119.00 | 27.6 | 1.84 | |
SJD-007-05 | 126.00 | 144.20 | 18.2 | 1.68 | incl. 0,5m @ 15,89 g/t Au (from 126m to 126,5m) |
SJD-009-05 | 0.39 | 17.26 | 16.9 | 3.11 | incl. 0,85m @ 27,15 g/t Au (from 0,39m to 1,24m); 0,84 m @ 10,71 g/t Au (from 2,09m to 2,93m) |
SJD-009-05 | 25.92 | 55.26 | 29.3 | 2.48 | incl. 1,86m @ 12,9 g/t Au (from 27,78m to 29,64m) |
SJD-011-05 | 39.02 | 58.02 | 19.0 | 3.02 | incl. 2,00m @ 15,38 g/t Au (from 44,02m to 46.02m) |
SJD-012-05 | 2.67 | 44.30 | 41.6 | 3.76 | incl. 1m @ 17,16 g/t Au (from 7.26m to 8.3m) ; 2m @ 12,81 g/t Au (from 17,42m to 19.42m) |
SJD-013-05 | 13.50 | 32.00 | 18.5 | 1.36 | |
SJD-017-05 | 120.45 | 137.87 | 17.4 | 4.49 | incl. 2,01m @ 18,18 g/t Au (from 130.5m to 132.51m) |
SJD-021-05 | 27.00 | 44.00 | 17.0 | 1.84 | |
SJD-023-05 | 46.90 | 69.09 | 22.2 | 1.75 | |
SJD-024-05 | 36.72 | 85.23 | 48.5 | 1.45 | incl. 1,11m @ 10,82 g/t Au (from 63.16m to 64.27m) |
SJD-028-05 | 255.20 | 272.84 | 17.6 | 4.32 | incl. 0,57m @ 16,06 g/t Au (from 256,2m to 256,77m); 1,37m @ 19,22 g/t Au (from 267,13m to 268,4m) |
SJD-029-05 | 174.53 | 195.00 | 20.5 | 1.46 | |
SJD-030-05 | 235.00 | 252.00 | 17.0 | 2.39 | incl. 1,00m @ 11,61 g/t Au (from 238m to 239m) |
SJD-032-05 | 86.47 | 108.67 | 22.2 | 5.35 | incl. 0,60m @ 19,66 g/t Au (from 104,43m to 105,03m) |
SJD-035-05 | 286.11 | 301.99 | 15.9 | 1.4 | |
SJD-047-05 | 251.00 | 268.00 | 17.0 | 2.79 | |
SJD-051-06 | 262.30 | 288.00 | 25.7 | 1.08 | |
SJD-052-06 | 202.04 | 218.81 | 16.8 | 2.07 | |
SJD-057-06 | 184.83 | 27.09 | 42.3 | 1.46 | |
SJD-058A-06 | 171.81 | 188.85 | 17.0 | 0.94 | |
SJD-066-06 | 179.62 | 199.85 | 20.2 | 2.01 | |
SJD-072-06 | 101.09 | 126.78 | 24.8 | 1.69 | incl. 1,08m @ 11,61 g/t Au (from 111.49m to 112.57m) |
SJD-085-10 | 364.00 | 426.00 | 62.0 | 1.75 | incl. 4,00m @ 12,8m g/t Au (from 374m to 378m) |
SJD-088-11 | 312.00 | 330.00 | 18.0 | 1.44 | |
SJD-090-11 | 299.00 | 337.00 | 38.0 | 0.94 | |
SJD-094-11 | 138.00 | 158.00 | 20.0 | 2.12 | |
SJD-095-11 | 129.00 | 145.00 | 16.0 | 2.37 | |
SJD-097-11 | 207.00 | 241.00 | 34.0 | 1.77 | |
SJD-108-11 | 102.00 | 122.00 | 20.0 | 2.2 | |
SJD-114-11 | 411.00 | 427.50 | 16.5 | 0.94 | |
São Jorge Gold Project, Pará State, Brazil GE21210515
Independent Technical Report on Mineral Resources – 31 May 2021
Diamond drilling undertaken by RTDM was comprised of an initial phase of 10 drillholes comprising FSJ-01 to FSJ-10 for a total of about 1,700m with the deepest drillhole penetrating 150m below surface (as listed in Appendix B). These holes were inclined at 50º to 55º. All core drilled was BQ (36.5mm) diameter. The second phase of drilling by RTDM comprised 16 drillholes (FSJ-11 to FSJ-26) for a total of approximately 2,690m. Drillholes were drilled with a 50º to 55º inclination with a north or south azimuth. Five drillholes were drilled at an azimuth ranging from 20º degrees to 35º degrees, approximately perpendicular to the deposit strike. Core drilled during this campaign was HQ (63.5mm) and NQ (47.6mm) in diameter. Details of RTDM drilling procedures were reviewed by Harron (2006). Down hole surveys were not completed for RTDM holes and possible deviation may have occurred but verification of this deviation is not possible.
In 2005 Talon completed a Phase I diamond drilling program with a total of 10,104m from 48 drillholes completed, mainly targeting the existing garimpeiro pit.
From May to September 2006, Talon conducted a Phase II drilling program with a total of 34 drillholes completed for 7,952m. From this phase, 8 drillholes for 2,302m targeted an in-fill program at the Wilton pit, and another 5,650m tested prospective targets. Two new extensions, the “Kite zone” located northwest, and the “Wilton East zone’, located east of the pit, were defined.
São Jorge Gold Project, Pará State, Brazil GE21210515
Independent Technical Report on Mineral Resources – 31 May 2021
Drilling was contracted to Geoserv Pesquisas Geologicas SA of Rio de Janeiro, a subsidiary of Boart Longyear. Drilling equipment used on the project included two Diakore and one Longyear 38 drilling rigs. Overburden, laterite and saprolite rock was drilled using HQ core equipment. Unweathered rock was drilled with NQ diameter core.
The majority of drillholes over the Wilton Pit area were drilled with a north or south azimuth and inclined about 55º. Talon drilled 5 vertical drillholes and some drillholes with northeast and southwest orientations to test for sub-horizontal and oblique structures in the deposit.
The Talon drilling procedures include:
| | ■ | Storage of all core in wooden core boxes at drill site; |
| | ■ | Twice daily collection of core from drill site; |
| | ■ | Storage of core in secure corrugated metal and wood core shed; |
| | ■ | Run markers with metal tags indicating drilled depth; |
| | ■ | Measurement and recording of core recovery for each drilling run; |
| | ■ | Photography of core before splitting; |
| | ■ | Measurement of RQD, and magnetic susceptibility for part of the drillholes; |
| | ■ | Detailed logging of alteration, lithology, structures and sulphide s. |
Collar coordinates are based on the UTM coordinate SAD69, UTM zone 21S. Talon holes were surveyed by the drilling contractor using a Sperry Sun multi shot tool and later a reflex single shot tool. Initially holes were surveyed at 3m intervals and then with a better knowledge of drillhole deviations, variably from 40 to 90m intervals. Several holes were oriented using the downhole “spear” technique. Drill collar coordinates are recorded using a differential GPS system by Terra Engineering based in Novo Progresso, Pará state.
BGC had drilled about 14,708 metres in 37 drillholes from January to December 2011 (as listed in Appendix B). All of this data, along with the historic drill hole information, supports the updated Mineral Resource presented in this report. BGC implemented the exploration program keeping the same procedures and philosophy as Talon.
Figure 20 shows a drill rig operating on the São Jorge Gold Project site in 2011.
São Jorge Gold Project, Pará State, Brazil GE21210515
Independent Technical Report on Mineral Resources – 31 May 2021
Figure 20 - Drill Rig operating at São Jorge Gold Project
10.6 | Drilling Results and Quality |
Core recovery data for RTDM holes was not available for review. Harron (2006) indicates that RTDM drilling had an overall core recovery greater than 95% with the exception of the transition from saprolite to fresh rock.
Talon drillhole core recovery averaged 99% with a minimum recovery of 68% for one drilling run. The QP inspected 4 representative drillholes and noted that all had excellent recovery.
BGC drill core recovery averaged 99.3%; the mineralized hosted rock is very competent thus providing a good drill core recovery.
In general, drilling was orientated north-south and the holes inclined to the north or south. All drill results have not been individually reported in this report, but the results have been incorporated into the geological models and resource estimation documented in this report (see section 14) and the nature of the mineralisation has been described in section 9. Table 9 - Relevant Drill Hole intersections
São Jorge Gold Project, Pará State, Brazil GE21210515
Independent Technical Report on Mineral Resources – 31 May 2021
Continuous mineralization over a thickness >= to 15m shows the highlights of significant mineralized intervals greater than 15m from the drilling programs. The data includes significantly higher grade intervals (gold grade samples >10g/t) which occur within the lower grade intersections.
The QP considers the drilling procedures to be of an acceptable industry standard. All drilling programs reported excellent core recovery and the relevant drilling and sampling procedures were of sufficient standard and quality to produce accurate and reliable results. Sufficient drilling has been completed to support the geological model and resource estimates within this report.
11 | SAMPLE PREPARATION, ANALYSES AND SECURITY |
BGC, now a subsidiary of GMI, undertook exploration activities at São Jorge in 2011 for which the results were released in December 2012. BGC geologists supervised all core sampling undertaken and collected samples at 2m or 3m lengths for most of the sampling. Talon and RTDM collected core samples between 0.5m and 1.5m intervals based on the geological logging of rock types, geological controls and observed mineralisation consistent with the mineralisation model discussed in Section 9.
BGC, sampled historic core not previously sampled between the higher grade intervals. This contributed to an improved model and estimate confidence. The gold mineralisation in São Jorge is very subtle with no clearly defined visible geological controls.
The QP has reviewed and verified the exploration data from the 2011 exploration program that is included in this document.
11.1 | Density Determinations |
BGC has taken a total of 1,099 measurements of density on core using the immersion in water method.
This method is commonly used to determine the Density (Specific Gravity) in the mining industry. The immersion method for obtaining specific gravity on the basis of displaced water volume (weight) is extremely simple and straightforward and requires only two determinations: the weight of the completely water-immersed sample and its oven dry weight (in air). The specific gravity (SG) of the samples was calculated by substitution in the formula:
The density used in the resource estimation was discussed and agreed during the site visit and is summarized in Table 10.
São Jorge Gold Project, Pará State, Brazil GE21210515
Independent Technical Report on Mineral Resources – 31 May 2021
Table 10 - Density Measurements for São Jorge Deposit rock types
Material | Density g/cm3 |
Oxide rock | 2.64 |
Fresh rock | 2.69 |
Altered mineralized rock | 2.72 |
Pedley, 2011, tested variation in density for each type of alteration zone. These results are presented in Table 11 As can be observed; there is no significant variation of density between the different alteration assemblages.
Table 11 - Density Measurements for Rock Alteration Types
Alteration Type | Mean | Min | Max |
Nada | 2.68 | 2.62 | 2.77 |
Fe-Ox-Chl | 2.69 | 2.64 | 2.78 |
Kf-ep-chl | 2.68 | 2.63 | 2.72 |
Heterogeneous | 2.71 | 2.65 | 2.83 |
Sericite | 2.70 | 2.68 | 2.72 |
Kf-ep-chl-ser (mixed) | 2.70 | 2.64 | 2.78 |
Average Specific Gravity of all monzogranite samples with grades <0.3 g/t Au is 2.69
The average Specific Gravity of all monzogranite samples with grades ≥0.3 g/t Au is 2.72.
The QP concurs that the method to determine the Density was in accordance with mining industry best practices.
11.2 | Sample Preparation and Analysis |
Sample preparation and analysis of core samples taken by Talon were performed by SGS Lakefield-Geosol Ltda. (“Geosol”), an ISO 9000-2001 certified laboratory. Sample preparation procedures completed by the Geosol preparation laboratories based in Parauapebas and Itaituba were:
| | ■ | Drying and weighting of whole sample; |
| | ■ | Crushing of sample to -2mm; |
| | ■ | Sample homogenization and splitting to a 1kg sub-sample; |
| | ■ | Pulverization to 95% passing -150 mesh; |
| | ■ | Splitting of pulverized material to 50 gram pulp. |
São Jorge Gold Project, Pará State, Brazil GE21210515
Independent Technical Report on Mineral Resources – 31 May 2021
Sample pulps were air freighted to the Geosol analytical laboratory in Belo Horizonte, Minas Gerais State, Brazil. Sample pulps were analyzed for gold using a lead flux fire assay technique with an atomic absorption finish. Selected samples were subsequently sent for silver, lead, zinc analysis by ICP spectrometry using a multi-acid digestion technique. Abnormally high assays were re-analyzed by the laboratory. The detection limit of gold assays was 5ppb Au. Coarse rejects from the Parauapebas and Itaituba laboratories were sent to the São Jorge exploration office and stored in the core shed. Fifty gram pulp rejects were also stored in the Talon offices in Rio de Janeiro.
Sample preparation and analysis of core samples taken by BGC, for the 2011/ 2012 campaign were performed by Acme Laboratories.
Acme Labs performed each procedure for sample preparation and analysis, as follows:
| | ■ | Crush split and pulverize 500g drill core to 200 mesh |
| | ■ | Fire Assay fusion Au by ICP-ES on 50g charges |
The QP has reviewed and verified the procedures for sample preparation and analysis from the 2011 / 2012 exploration program as described here, and concurs they are adequate and in accordance with mining industry best practices.
Core is stored in a locked and secure core shed. After logging, core samples were marked for splitting and sampling by BGC geologists. Core sample intervals were measured and collected by BGC technical staff. Each core sample is placed in a doubled plastic bag and with two sample tags. Each bag is closed with a uniquely numbered plastic seal that is tamper proof. Seal numbers, sample numbers and sample intervals are recorded by BGC. Sample bags are collected for shipping in rice bags with each rice bag closed with a numbered plastic seal. Samples are stored in the BGC core shed until transported by truck to the Acme preparation laboratories in Itaituba in Pará state. The referred laboratory is 320km by road from the São Jorge project. After samples are received by the lab, seal numbers and sample numbers are reported to BGC for confirmation.
The QP considers the core sampling security to be above current industry best practice.
11.4 | Adequacy of Procedures |
The current analytical method is appropriate. Sufficient quality control data exists to allow thorough review of the analytical performance of samples taken by BGC.
Quality control data from the RTDM period is not available for analysis as it has not been located.
The sampling methods, chain of custody procedures and analytical techniques are all considered appropriate and are compatible with accepted industry standards although the sample preparation of gold should be reviewed in light of the QAQC analysis in the following section.
São Jorge Gold Project, Pará State, Brazil GE21210515
Independent Technical Report on Mineral Resources – 31 May 2021
The QP has not been able to verify the RTDM drill sample QAQC data as it has not been located.
11.5.2 | Talon Drill Samples |
Talon set in place a QAQC programme that included the submission of blanks, field duplicates, standards and pulp duplicates with ALS (Umpire assays).
This quality control data of drilling used in the resource estimation has been assessed statistically using a number of comparative analyses for each dataset. The objectives of these analyses was to determine relative precision and accuracy levels between various sets of assay pairs and the quantum of relative error. The results of the statistical analyses are presented as summary plots, which include the following:
| | ■ | Thompson and Howarth Plot, showing the mean relative percentage error of grouped assay pairs across the entire grade range, used to visualize precision levels by comparing against given control lines. |
| | ■ | Rank % HARD Plot, which ranks all assay pairs in terms of precision levels measured as half of the absolute relative difference from the mean of the assay pairs (% HARD), used to visualize relative precision levels and to determine the percentage of the assay pairs population occurring at a certain precision level. |
| | ■ | Mean vs % HARD Plot, used as another way of illustrating relative precision levels by showing the range of % HARD over the grade range. |
| | ■ | Mean vs %HRD Plot is similar to the above, but the sign is retained, thus allowing negative or positive differences to be computed. This plot gives an overall impression of precision and also shows whether or not there is significant bias between the assay pairs by illustrating the mean percent half relative difference between the assay pairs (mean % HRD). |
| | ■ | Correlation Plot is a simple plot of the value of assay 1 against assay 2. This plot allows an overall visualisation of precision and bias over selected grade ranges. Correlation coefficients are also used. |
| | ■ | Quantile-Quantile (Q-Q) Plot is a means where the marginal distributions of two datasets can be compared. Similar distributions should be noted if the data is unbiased. |
| | ■ | Standard Control Plot shows the assay results of a particular reference standard over time. The results can be compared to the expected value, and the ±10% precision lines are also plotted, providing a good indication of both precision and accuracy over time. |
São Jorge Gold Project, Pará State, Brazil GE21210515
Independent Technical Report on Mineral Resources – 31 May 2021
Au Standards
Talon used a total of 20 Au standards (inserted by the SGS - Geosol sample preparation laboratory at a rate of 1 in every 20 samples). The standards were supplied by the SGSGeosol Parauapebas and Itaituba sample preparation laboratories. The standards supplied and inserted by SGS-Geosol are a combination of internal and commercial standards. As the SGS made standards may not be as reliable as commercially available certified standards, and do not represent external control (as SGS-Geosol know the expected result of these standards).
In general, the standard assay result indicated acceptable accuracy was being achieved, with the majority of standards falling within 90% of the Standard Tolerance Values. The minor outliers identified are potentially associated with sample submission errors (mixing of samples).
Statistical analysis of all Standards and Blanks was completed using the GE21’s QC Assure statistical software (Figure 21) and the results obtained are summarized on Table 12.
São Jorge Gold Project, Pará State, Brazil GE21210515
Independent Technical Report on Mineral Resources – 31 May 2021
Figure 21 - Blank and Standards Statistical Data Example
Standard OREAS 54pa_ SJ (Standard: SH)
Printed: 17-mai-2012 14:05:26 Data Imported: 17-mai-2012 14:03:06 Page 1
São Jorge Gold Project, Pará State, Brazil GE21210515
Independent Technical Report on Mineral Resources – 31 May 2021
Table 12 - Summary Table of Blanks and Standards Statistical Analysis
São Jorge Gold Project, Pará State, Brazil GE21210515
Independent Technical Report on Mineral Resources – 31 May 2021
Blanks
The QP performed an analysis on blanks data provided by GMI. The blank material was sourced by Talon from unmineralized São Jorge Granites collected at one specific site at the project and submitted at a frequency of about five percent. GMI has kept the same routine.
Overall the blank data is within acceptable limits.
Field Duplicates
Talon completed field duplicate assaying ¼ of the NQ sized core at a frequency of 5% (1 in 20 samples). The procedure was to split the NQ sized core in half then ¼ the half core. The QP considers this practice to not be representative as it does not represent the normal ½ NQ core submitted and creates a bias in the sample size submitted. The results are presented in Figure 22.
Based on the analysis, the QP can conclude:
| | ■ | A good precision was achieved for 81.81% of the data within 20% HARD. |
| | ■ | No apparent bias exists represented by both samples returning a similar mean value. |
| | ■ | In summary the analysis of the 1/4 sized core has poor precision with no apparent bias present. It is clear that for this ¼ NQ size of sample (which doesn’t represent the ½ NQ size taken) that there is a significant nugget effect resulting in low precision results. |
São Jorge Gold Project, Pará State, Brazil GE21210515
Independent Technical Report on Mineral Resources – 31 May 2021
Figure 22 - Summarized Duplicates Quality Controls
São Jorge Gold Project, Pará State, Brazil GE21210515
Independent Technical Report on Mineral Resources – 31 May 2021
The QP confirmed BGC sampling procedures are in accordance with mining industry best practices. All procedures were summarized in this section.
The statistical summary for the Blanks and Standard samples QA/QC program utilized by BGC are include in the Table 12 - Summary Table of Blanks and Standards Statistical Analysis section 11.5.2.
Coarse Reject Duplicate Sampling
When an original sample was made into a smaller sub- sample, it was crushed and split then pulverised and split again. The final sub-sample is never exactly the same grade as the original. The coarse duplicates measure this error.
| | ■ | A coarse reject sample (returned from the lab) is split into two equal halves (CDA and CDB) ideally using a clean riffle-splitter. If a riffle-splitter is not available a good cone-and quarter split is acceptable. The duplicates (CDA and CDB) are inserted at every 44th and 46th number in the sampling sequence. |
| | ■ | The technicians usually made sure that they have enough coarse reject samples which should grade between 0.3 and 1.0 g/t Au. |
| | ■ | ¼ core samples are not duplicates and they are not used as duplicates because it is expected to indicate the short-range variability of the mineralisation (in the case of gold it is normally high). |
Blank Samples
Contamination can occur in a lab especially with gold as it sticks to the equipment. A blank sample tests if contamination has occurred due to inadequate clean out of equipment between samples; it should return an Au value of less than 2x the detection limit.
| | ■ | BGC blank material consists of coarse crushed aggregate from the "Geraldo Mineiro" Granite quarry which contains less than 0.005 ppm Au. |
| | ■ | Insert 2 blanks within/after mineralisation per 100 samples and a blank as the first sample of each batch. |
Standard Samples
Standards are the best way to measure the instrument or analytical error and are inserted by the mining company.
BGC used low, medium and high grade standards. The standard samples are pre-packaged as 50g sachets purchased from Rocklab.
São Jorge Gold Project, Pará State, Brazil GE21210515
Independent Technical Report on Mineral Resources – 31 May 2021
Sample dispatch and sample logs
BGC sent the samples as each batch was ready. The team confirmed that they followed the procedures as described below:
| | ■ | Do not submit a batch with less than 80 samples and a batch should never mix projects. |
| | ■ | The senior technician must prepare the sample submission sheet and the laboratory requisition form, and email to the laboratory before the samples arrive at the lab. The document for the lab should only be a list of the sample numbers, security tags and volume numbers (there must be nothing to indicate which samples is a QAQC samples). |
| | ■ | The complete sample sheet (showing QAQC samples) should be emailed to the Senior Geologist and the Database Manager as soon as the samples have been dispatched. |
| | ■ | The senior technician must keep an organised digital and paper directory of all the sampling information. |
São Jorge Gold Project, Pará State, Brazil GE21210515
Independent Technical Report on Mineral Resources – 31 May 2021
The standards data has shown a high accuracy as returned by the SGS Geosol laboratory although it is noted that SGS supplied the standards to Talon.
The standards data returned by Acme Labs shows relatively good accuracy and is suitable for resource estimation.
The field duplicate data determined by the analysis of the ¼ NQ core returned relatively poor precision suggesting a significant nugget effect although not changing the actual mean of the samples. It also suggests that the sample size is too small. This ¼ sized core is considered by the QP to not be a suitable practice in that it does not represent the ½ NQ core normally analyzed and has the potential to introduce a sample size bias.
The QP has reviewed the available samples, documents, and procedures for sample preparation, analyses and security from the various drilling and sampling campaigns for the Property and as summarized in Section 11 of this report. The author is of the opinion that the nature, extent, and results of quality control procedures employed, and quality assurance actions taken provide adequate confidence in the data collection and processing necessary for the Mineral Resource estimate in this report.
The QP had validated the GMI database for São Jorge Gold Project using the Gemcom Surpac Software System Database Audit tool with no inconsistencies noted.
A comparison of hardcopy assay and geological logging versus the digital database was performed on a total of 10% of the São Jorge Gold Project drillholes completed by BGC. No errors were identified with the original log and the digital database.
The QPs visited the São Jorge Gold Project with the objective of verifying the infrastructure, procedures, data and the geological data used to prepare the Mineral Resource estimate.
The visit was conducted by geologist Leonardo de Moraes Soares, MAIG on May 24-25, 2021. Mr. Soares visited the offices, core shed and drill core storage, and reviewed representative maps and sections. and the QP conducted technical discussions and reviewed with the issuer’s local project geologist the lithology, mineralisation, alteration and structures. Such visit is being treated as the current personal inspection for the purposes of this report.
São Jorge Gold Project, Pará State, Brazil GE21210515
Independent Technical Report on Mineral Resources – 31 May 2021
Mr. Soares reviewed and validated the geological model with the geological staff of GMI, as well as the preliminary procedures of the resource estimation.
The QP concluded that the geological data used to prepare the Mineral Resource estimate is appropriate for the processes of resource estimation.
During the site visit, the QP spent time looking at core from the higher-grade intervals from many drill holes to compare the drill core of higher-grade mineralisation to the surrounding lower-grade zones. This process confirmed that higher-grade mineralisation correlated well with intervals of disseminated sulphide (pyrite) quartz veinlets.
The QP was committed to the verification in field, sample preparation and assay, to the technical discussions with GMI and the veracity of information about applied procedures, sampling quality and assay results.
In the field technical visit, Mr. Soares inspected the old garimpeiro pit and drillhole collar locations (Figure 23) ,core shed (Figure 24) and selected high grade intercepts Figures 25 and 26)
The QP concludes that the mineral exploration data for the São Jorge property has been validated and is deemed appropriate for the resource estimation within this report.
The QP relied on visual inspection of the drill core and while there is documentation of re-assaying of core in the historical resource estimate, the QP has not conducted any lab-based assay verification process. Previous work completed by BCG using ¼ core samples as duplicated samples for grade verification shows that this method was not statistically valid, given the nature of the gold distribution and the nugget effect.
The sample preparation procedures, QA/QC protocols including assay blanks, standards and duplicates as well as sample security procedures reviewed for the previous drilling programs helps mitigate this potential risk. However, t is recommended to conduct a selective re-assaying of selected remnant core samples to compare and validate assays to the original assay values.
São Jorge Gold Project, Pará State, Brazil GE21210515
Independent Technical Report on Mineral Resources – 31 May 2021
Figure 23 - Drill holes SJD-032-05 and SJD-019-05 collar locations
São Jorge Gold Project, Pará State, Brazil GE21210515
Independent Technical Report on Mineral Resources – 31 May 2021
Figure 24 - QP Site Visit - Core Shed and Core Boxes Inspected
São Jorge Gold Project, Pará State, Brazil GE21210515
Independent Technical Report on Mineral Resources – 31 May 2021
Figure 25 - Relevant Selected Intercept Inspected - Drillhole SJD0505
São Jorge Gold Project, Pará State, Brazil GE21210515
Independent Technical Report on Mineral Resources – 31 May 2021
Figure 26 - Relevant Selected Intercept Inspected - Drillhole SJD-004-05
São Jorge Gold Project, Pará State, Brazil GE21210515
Independent Technical Report on Mineral Resources – 31 May 2021
13 | MINERAL PROCESSING AND METALLURGICAL TESTING |
The mineral processing options are not the subject of this report.
13.2 | Metallurgical Testing 2006 |
In 2006, SGS was commissioned to undertake metallurgical tests. Test work was performed on three carefully composed drill core samples from the São Jorge gold project, of high, medium and low-grade samples. The gold head grades of samples SJ MET-01, SJ MET-02 and SJ MET-03 were 6.5g/t, 1.8g/t and 0.6g/t Au respectively. The QP has reviewed the test work results and judges them to have been completed to industry standards.
SGS performed a comprehensive mineralogical and analytical approach of sample SJ MET01, including fire assay, heavy liquid separation, super-panning, ore microscopy, and electron microprobe. Results showed that the gold was present mainly in its native form with the native gold content ranging from 74.6% to 95.5% of the total gold occurrence. In terms of liberation, gold occurred as liberated particles, particles associated with pyrite and particles associated with non-sulphides. The grain size ranged from 1µm to 212µm, with the majority of grains below 50µm.
The gold balance shows that liberated gold accounted for approximately 17% of the head grade, with the majority of gold grains being less than 50µm in size. Approximately 62% and 13% of the gold was associated with pyrite and pyrite/non-sulphide binaries, respectively. Test work showed this gold can be recovered by flotation, followed by cyanidation. Gold attached to pyrite can be recovered by direct cyanidation. To extract gold locked in pyrite, however, finer grinding will be required.
The Bond ball mill work index of a composite of the three samples was determined to be 16.8kWh/t (metric) in a test using a 150 mesh closing screen.
The recovery of gold by gravity separation ranged from 33% to 43%. Gold extraction by CIL from the gravity separation tailing ranged from 97% from the highest-grade sample to 86% from the lowest grade sample, resulting in overall gold recoveries by gravity separation and CIL ranging from 98% (SJ MET-01) to 91% (SJ MET-03). The cyanide consumption was low at 0.1 to 0.3kg/t NaCN. Test results of the recovery of gold from the gravity separation tailing by flotation ranged from 94% to 98%.
A summary of test work results is shown in the Table 13 14 and 15 and Figures 27, 28 and Figure 29.
São Jorge Gold Project, Pará State, Brazil GE21210515
Independent Technical Report on Mineral Resources – 31 May 2021
Table 13 - Head Sample Analysis (excluding SJ-MET-01)
Head Sample | SJ MET 02 | SJ MET 03 |
| Assays | Au g/t | S (%) | Au g/t | S (%) |
Average | 1.82 | 0.87 | 0.64 | 0.52 |
Table 14 - Summary of Gravity Separation tests
Test | Sample | K80 | | Gravity Concentrate | Gravity Tail Assay | Head Assay, g/t |
No. | | µm | Wt | Assay | % Recovery | | calc. | direct |
| | | % | Au, g/t | Au | Au, g/t | Au | Au |
G2 | SJ MET-02 | 92 | 0.092 | 522 | 35.2 | 0.88 | 1.36 | 1.82 |
G3 | SJ MET-03 | 91 | 0.088 | 262 | 32.8 | 0.47 | 0.70 | 0.64 |
Figure 27 - São Jorge Gravity Recovery Test Result
São Jorge Gold Project, Pará State, Brazil GE21210515
Independent Technical Report on Mineral Resources – 31 May 2021
Table 15 - Summary of Leaching Tests
Test No. | Sample | Reagent Addition (kg/t) | Reagent Consumption (kg/t) | % Extr'n | Residu e | Leach Feed (calc) | Overall Gold Recovery, % |
| | | | | | |
| | NaCN | CaO | NaCN | CaO | Au | g/t Au | g/t Au | Gravity only | Gravity + CIL |
CIL 2 | SJ MET-02 | 0.70 | 0.69 | 0.10 | 0.64 | 89.6 | 0.09 | 0.87 | 35.2 | 93.3 |
| | | | | | |
CIL 3 | SJ MET-03 | 0.77 | 0.71 | 0.12 | 0.67 | 86.1 | 0.07 | 0.51 | 32.8 | 90.7 |
Figure 28 - Leaching Recovery Test Result
São Jorge Gold Project, Pará State, Brazil GE21210515
Independent Technical Report on Mineral Resources – 31 May 2021
Figure 29 - Gravity + Leach Recovery Test Result
A comparison of the metallurgical test work results is shown in Table 16.
Table 16 - Comparison of Metallurgical Test Results
| | % Gold Recovery | |
Sample | Gravity Only | Gravity + CIL | Gravity + Flotation |
SJ MET-02 | 35.2 | 93.3 | 97.3 |
SJ MET-03 | 32.8 | 90.7 | 95.6 |
In summary, the mineralized samples responded very well to Gravity+CIL and Gravity+ Flotation tests. Although flotation gave the highest overall gold recovery, further upgrading and/or treatment of the flotation concentrate would be required with the added risk of some, undefined, gold loss associated with the downstream processes.
Overall gold recoveries by gravity separation and flotation were 95.6% to 97.3%. Further upgrading and/or subsequent treatment would be required after flotation which could lead to some additional loss of gold.
São Jorge Gold Project, Pará State, Brazil GE21210515
Independent Technical Report on Mineral Resources – 31 May 2021
13.3 | Metallurgical Testing 2012 |
A second phase of testwork was carried out by Testwork Desenvolvimento de Processo Ltda who published a report titled “Gravimetric Concentration and Leaching Laboratory Test Report – dated 23 February 2012, Doc No:003-2012 Brazilian Gold Rev. 0” in order to determine the most economical processing route for the ore based on using CIL as the metal extraction method. The report was translated to English from Portuguese.
Several basic metallurgical tests were carried out on the master composite sample in order to reaffirm the conceptual flow sheet that was selected for the historical resource. The test work focused on estimating reagent consumption rates, metal recovery, grind size and leaching kinetics.
Results from the test work program were then used to determine a preliminary operating and capital cost estimates for the process plant and associated infrastructure.
The test work program was designed to obtain metallurgical information that is required in order to develop the most appropriate flow sheet for the deposit. The test work comprised chemical analysis on head samples, size by size distribution, leaching of the individual size fractions in order to establish leaching kinetics and gravity test work. Leaching was conducted on both gravity concentration tails and non-gravity tails with and without the addition of activated carbon. Finally, the effects on recovery with variation in cyanide addition rates were examined.
13.3.1 | Sample Selection and Location |
Samples were selected from 9 bore holes covering a strike length of 600 m over a vertical depth of 60 to 350 m below surface in the main portion of the São Jorge deposit. The samples are the remainder of the original 3.5 to 4.0 kilogram core samples submitted for assays. A selection of 30 samples with a grade of between 0.5 and 1.5 g/t Au were taken. A weighted average grade calculated for the 30 samples was made. From the 30 samples selected, samples were added and removed until a representative combination of 18 samples with an average grade of close to 1.0 g/t Au was defined. All samples were crushed to P80 = 1.68 mm and composited into a single representative sample from which a number of 1 kg sub-samples were taken for leach and gravity recovery testwork. The mean calculated head grade for the range of tests carried out was 0.78 g/t, well below the diluted resource grade of 0.91 g/t as reported by the Preliminary Economic Assessment and NI-43-101 Technical report dated June 12, 2012.
The mineral samples were delivered in bags that were labelled MET-01. This was the only sample that was used for the metallurgical test work program for this phase.
13.3.2 | Head Samples and Assays |
Four 1-kg sub-samples were selected at random, homogenized once more and divided into six 500g samples and one 1-kg sample in order to perform:
| | • | Au analysis via fire assay on the six 500g samples; |
| | • | Ag, S, Fe, Cu, As, Hg, CO32-, ICP multi-element, CTOTAL (total carbon) analyses on the one, 1-kg sample. |
São Jorge Gold Project, Pará State, Brazil GE21210515
Independent Technical Report on Mineral Resources – 31 May 2021
Assay results obtained from the head sample MET 01 chemical analysis are listed in Table 17 and Table 18 and the calculated grade results for the same samples analysed for gold content can be seen in Table 19.
Table 17 - Chemical Analysis for Sample MET-1
Hg | ppm | <0.001 |
Ag | ppm | <3 |
As | ppm | <10 |
Fe | % | 2.84 |
Cu | ppm | 166 |
S | % | 1.23 |
C (Organic) | % | 0.027 |
C (Elemental) | % | <0.005 |
C (Carbonitic) | % | 0.454 |
Table 18 - Gold Analysis for sample MET 1
| | 0.587 |
| | | 0.744 |
| Gold | g/t | 1.177 |
| | | 0.872 |
| | | 0.618 |
| | | 0.684 |
| | AVERAGE | 0.780 |
| | DP | 0.219 |
São Jorge Gold Project, Pará State, Brazil GE21210515
Independent Technical Report on Mineral Resources – 31 May 2021
Table 19 - Calculated and Assayed Heads for Sample MET 1 tests
Description | Gold Assays g/t |
Head Assay | 0.78 |
Test 1 Experimental Test Work | 0.49 |
Test 2 Experimental Test Work | 0.59 |
Granulometric weighted Average | 0.91 |
Gravity Concentration Test | 0.86 |
Kinetic Leaching w/o Gravity (w/o carbon) (P80 106 microns) | 0.67 – 0.87 |
Kinetic Leaching w/o Gravity (w carbon) (P80 106 microns) | 0.61 – 0.78 |
Kinetic Leaching w/o Gravity (w/o carbon) (P80 75 microns) | 0.72 – 1.10 |
Kinetic Leaching w/o Gravity (w carbon) (P80 75 microns) | 0.55 – 0.79 |
If a gold nugget effect exists, then metallic screening will need to be performed. This was partially simulated in the Granulometric test work on a sample screened and each size fraction individually leached with cyanide. The grades for the individual screens ranged from 0.63 g/t Au to 1.44 g/t Au. The highest grade reported in the plus 150 micron fraction.
13.3.3 | Granulometric Test Work |
A 3kg sample was crushed to P80 = 125 µm, dried and separated into size fractions of +100, +115, +150, +200, +325 and -325 mesh.
These fractions were leached, and both the solids and the solutions were analysed to verify gold distribution by fraction. Results can be seen in the Table 20
The recovery of gold per fraction varied between 90.6% and 74.4%, with an average of 81.8%. The recalculated concentration of gold per fraction varied between 1.44 and 0.63g/t, having a head concentration of 0.91g/t.
São Jorge Gold Project, Pará State, Brazil GE21210515
Independent Technical Report on Mineral Resources – 31 May 2021
Table 20 - Recovery of Gold by Size fraction for sample MET 1
Mesh Tyler | Size (µm) | Au Concentration (g/t) | Tailings (g/t) | Recovery Au per Fraction Au (%) | Recovery of Au per fraction in Relation to the Feed |
| | | | | | Au (%) | Au (%) Cumulative |
100 | 150 | 1.44 | 0.14 | 90.6% | 18.9% | 18.9% |
115 | 125 | 0.63 | 0.14 | 77.0% | 6.3% | 25.2% |
150 | 106 | 0.72 | 0.19 | 74.4% | 2.8% | 28.0% |
200 | 75 | 1.18 | 0.17 | 85.3% | 19.4% | 47.4% |
325 | 45 | 0.70 | 0.16 | 76.4% | 2.4% | 49.9% |
-325 | -45 | 0.78 | 0.10 | 86.9% | 35.8% | 85.7% |
Weighted Average | 0.91 | 0.13 | | | |
13.3.4 | Grindability Testing |
Testwork was carried out to determine the Bond Ball Mill work index on three samples collected from drill holes at different depths along the deposit. Sample SJ-WI-LOW was from approximately 200 to 250 m below surface, SJ-WI-INT was from approximately 135 to 175 m below surface and SJ-WI-SUP was from 30 to 45 m below surface. BGC has a record of the location of each drill core sample that comprises the composite sample. No further grindability test work has been conducted.
The results are shown below in Table 21. The Bond ball mill work index of the three samples varied from 13.7 to 15.5 kWh/t (metric) in a test using a 150 mesh closing screen.
Table 21 - Bond work Index values for selected samples
Sample Identification | Bond Ball Work Index kWh/t |
SJ-WI-LOW | 15.2 |
SJ-WI-INT | 15.5 |
SJ-WI-SUP | 13.7 |
From the values obtained above, the ore can be categorized as medium to hard in regards to the Ball Mill Work Index.
São Jorge Gold Project, Pará State, Brazil GE21210515
Independent Technical Report on Mineral Resources – 31 May 2021
13.3.5 | Gravity Concentration Test Work |
The test was conducted to determine the GRG (Gravity Recoverable Gold) according to the Knelson procedure for small quantities of ore.
A 10kg sample was crushed into three different granulometric fractions (P80 = 212, P80 = 106 and P80 = 75 µm), and at each increment of crushing the ore was passed through the Knelson MD3 concentrator to recover the free coarse gold (Figure 30).
Figure 30 - Gold Recovery in percent versus grind size
The gravity concentration test work was conducted by testing for gold recovery, then grinding the tails to a smaller particle size and retesting the gravity recovery. This was repeated down to the 75 micron size fraction.
The test results indicate that 66% recovery of gold is achievable, however this conclusion has been based on a test methodology that may not be replicated in a commercial-scale mill, hence the results and will require verification.
From the test results it was shown that an overall recovery of 36.5% with a gold grade of 38.91 g/t Au was achieved when the entire sample was ground to a P80 of 212 microns. The gravity tailings were further ground to a particle size of P80 106 microns which then recovered an additional 17.2% of the gold in relation to the feed grade. The tailings from the second stage of concentrating were then ground to a particle size of P80 75 microns and returned a further gold recovery of 12.4%. The cumulative recoveries total 66 % recovery.
The gravity concentrate is of low grade, less than 50 g/t Au, and would require further upgrading, likely at some loss of recovery, if it were to be sold to a smelter. An alternative would be to further treat this material in an Intense Leach Reactor (ILR) however this process was not explored in this phase of test work program.
São Jorge Gold Project, Pará State, Brazil GE21210515
Independent Technical Report on Mineral Resources – 31 May 2021
The first leaching tests were experimental, using the P80 = 106 µm to verify the need to predose the ore with lime. The samples were placed into bottles, the percentage of solids was adjusted to 50% and the pH of the pulp was adjusted to 10-11. The bottles were placed on a bottle roller and the pH was checked every 30 minutes to verify if the pH had changed. Results are listed in Table 22
Table 22 - Pre-Lime Addition – Variation with Time
Time (h) | pH Test 1 | Time (h) | pH Test 2 |
Start | 10.84 | Start | 10.82 |
0.5 | 10.40 | 0.5 | 10.49 |
1.5 | 10.20 | 1.5 | 10.20 |
2.0 | 10.20 | 2.0 | 10.15 |
2.5 | 10.20 | 2.5 | 10.13 |
3.0 | 10.15 | 3.0 | 10.10 |
4.0 | 10.10 | 4.0 | 10.05 |
From the results contained in Table 22, it is concluded that it will not be necessary to pre-dose this particular ore with lime as it was not necessary to add lime to adjust the pH.
13.3.7 | Kinetic Curves for Leaching Without Gravity Concentration |
The leach kinetic curves were conducted individually for different values of P80 (106 and 75 µm). For each assay, a 1.2kg sample was taken from the mill feed, ground to the desired P80 size, dried, homogenized and sampled into six 200g sub-samples that were then individually leached during various pre-determined time periods.
Test conditions are defined below:
| | • | With and without the addition of activated carbon to the pulp; |
| | • | Without pre-dosing the ore with lime; |
| | • | pH adjusted to between 10-11; |
| | • | Total residence time of 32 hours; |
| | • | Leaching kinetics (recovery of gold as a function of time) – Collection of aliquots (gold, cyanide, pH) at 2, 6, 10, 20, 24 and 32 hours; and ☐ Cyanide concentration – 1000 mg/L. |
It is not entirely understood why a carbon-in-leach test was performed other than perhaps to demonstrate that a CIL circuit may be beneficial for feasibility design. The problem with this test is that some of the results showed high tailings gold grades which suggests that some carbon was still present in the tailings. Screening of the solid tailings that includes carbon must be performed carefully to ensure that no carbon, which contains gold, reports to the tailings. Such a result was reported in the 24 hours bottle roll test where the recovery was only
71.8%. Results are listed in the Table 23
São Jorge Gold Project, Pará State, Brazil GE21210515
Independent Technical Report on Mineral Resources – 31 May 2021
Table 23 - Leach Recovery without the use of Gravity Separation – Sample MET-01
Time (h) | P80 = 106 µm without Activated carbon | P80 = 106 µm with Activated carbon | P80 = 75 µm without Activated carbon | P80 = 75 µm with Activated carbon |
| | Real (%) | Adjusted (%) | Real (%) | Adjusted (%) | Real (%) | Adjusted (%) | Real (%) | Adjusted (%) |
0 | 0 | 0 | 0 | 0 | 0 | 0 | 0 | 0 |
2 | 46.4 | 47.9 | 66.4 | 56.2 | 41.5 | 41.6 | 50.3 | 50.3 |
6 | 78.1 | 79.1 | 74.9 | 84.5 | 86.6 | 76.9 | 89 | 83.1 |
10 | 79.1 | 85.4 | 87.9 | 88.4 | 91.8 | 87.5 | 81 | 89.7 |
20 | 83.9 | 86.9 | 87.4 | 89 | 90.7 | 91.9 | 91.4 | 91.4 |
24 | 86.2 | 86.9 | 86.3 | 89 | 90 | 92.1 | 71.8 | 91.4 |
32 | 87 | 87 | 89 | 89 | 92.1 | 92.1 | 87.9 | 91.4 |
13.3.8 | Kinetic Curves for Leaching With Gravity Concentration |
Gravity concentration on the sample was carried out prior to leaching in order to remove the maximum amount of free gold possible with the least amount of mass.
The leach kinetic tests were conducted on individual tailing samples that were generated from the gravity tests having P80 values of 106 and 75 µm. For each assay, a 1.2kg sample of gravity concentration tailings was sampled and sub-divided into six 200 g samples that were leached individually.
Test conditions are defined below:
| | • | With and without the addition of activated carbon to the pulp; |
| | • | Without pre-dosing the ore with lime; |
| | • | pH adjusted to between 10-11; |
| | • | Total residence time of 32 hours; |
| | • | Leaching kinetics (recovery of gold as a function of time) – Collection of aliquots (gold, cyanide, pH) at 2, 6, 10, 20, 24 and 32 hours; and ☐ Cyanide concentration – 1000mg/L. |
Tables 24 and 25 indicate the result of the gravity test work on the different grind sizes prior to gravity separation and Table 26 indicates the gold recovery on the tails produced from gravity separation.
São Jorge Gold Project, Pará State, Brazil GE21210515
Independent Technical Report on Mineral Resources – 31 May 2021
Table 24 - Gravity Concentration before Leaching P80 106-Microns
ID | Weight (kg) | % mass | % cumulative mass | Au Concentration (g/t) | Au (mg) | Cumulative Au Concentration (g/t) | % Recovered | % Recovered Cumulative |
Conc. 1 | 0.047 | 1.60% | 1.60% | 26.582 | 1.254 | 26.58 | 49.50% | 49.50% |
Final Tailings | 2.953 | 98.40% | | 0.434 | 1.282 | 0.85 | 50.50% | 100.00% |
Calculated Feed | 3.000 | | | 0.850 | 2.536 | | | |
Analysed Feed | 3.000 | | | 0.700 | | | | |
Table 25 - Gravity Concentration before Leaching P80 75 Microns
ID | Weight (kg) | % mass | % cumulative mass | Au Concentration (g/t) | Au (mg) | Cumulative Au Concentration (g/t) | % Recovered | % Recovered Cumulative |
Conc. 1 | 0.035 | 1.12% | 1.20% | 25.808 | 0.901 | 25.81 | 40.75% | 40.75% |
Final Tailings | 2.965 | 98.80% | | 0.442 | 1.311 | 0.74 | 59.25% | 100.00% |
Feed Calculated | 3.000 | | | 0.740 | 2.212 | | | |
Feed Analysed | 3.000 | | | 0.700 | | | | |
São Jorge Gold Project, Pará State, Brazil GE21210515
Independent Technical Report on Mineral Resources – 31 May 2021
Table 26 - Leach Recovery rates of the Gravity Tails from sample MET 1
Time (h) | P80 = 106µm without Activated Carbon | P80 = 106µm with Activated Carbon | P80 = 75µm without Activated Carbon | P80 = 75µm with Activated Carbon |
| | Real (%) | Adjusted (%) | Real (%) | Adjusted (%) | Real (%) | Adjusted (%) | Real (%) | Adjusted (%) |
0 | 0.00% | 0.00% | 0.00% | 0.00% | 0.00% | 0.00% | 0.00% | 0.00% |
2 | 61.90% | 61.80% | 64.90% | 64.70% | 77.40% | 76.70% | 67.30% | 67.50% |
6 | 80.10% | 84.30% | 83.70% | 84.50% | 84.30% | 88.50% | 79.80% | 87.20% |
8 | 82.20% | 86.10% | 85.80% | 85.70% | 76.90% | 88.70% | 88.40% | 88.30% |
20 | 86.20% | 86.20% | 82.80% | 85.80% | 88.70% | 88.70% | 86.10% | 88.40% |
24 | 81.70% | 86.20% | 76.50% | 85.80% | 85.40% | 88.70% | 75.50% | 88.40% |
36 | 86.10% | 86.20% | 84.20% | 85.80% | 87.10% | 88.70% | 78.20% | 88.40% |
São Jorge Gold Project, Pará State, Brazil GE21210515
Independent Technical Report on Mineral Resources – 31 May 2021
Recovery rates for the samples that were subjected to gravity separation followed by leaching of the gravity tails have been adjusted to reflect possible overall recovery rates for the combined processes. In order to derive a final recovery, it was estimated that a recovery rate of 98 % can be achieved when the gravity concentrate is subjected to leaching. This needs to be confirmed in the next phase of metallurgical testing. The results are listed in Table 27
Table 27 - Calculated Overall Recoveries from Gravity and Leaching - Sample MET-01
Time (h) | P80 = 106 µm without Activated Carbon | P80 = 106 µm with Activated Carbon | P80 = 75 µm without Activated Carbon | P80 = 75 µm with Activated Carbon |
| Adjusted (%) | Adjusted (%) | Adjusted (%) | Adjusted (%) |
0 | 0.00% | 0.00% | 0.00% | 0.00% |
2 | 76.55% | 78.27% | 87.24 | 82.60 |
6 | 89.88% | 90.00% | 93.20 | 92.55 |
8 | 90.95% | 90.71% | 93.30 | 93.10 |
20 | 91.01% | 90.77% | 93.30 | 93.15 |
24 | 91.01% | 90.77% | 93.30 | 93.15 |
36 | 91.01% | 90.77% | 93.30 | 93.15 |
From the data obtained, it has been observed that a finer grind size of P80 75 microns results in higher gold recovery. When comparing overall recovery rates for samples ground to P80 75 microns the recovery was similar regardless of if the samples were subjected to gravity separation prior to leaching. A coarser grind size of P80 106 microns resulted in lower overall recoveries even when the samples were subjected to gravity separation prior to leaching. This is illustrated in Figure 31.
São Jorge Gold Project, Pará State, Brazil GE21210515
Independent Technical Report on Mineral Resources – 31 May 2021
Figure 31 - Leaching Test - Percentage Recovery versus Time
Figures 32 and 33 illustrate the effect of both grind size and gravity separation on recovery.
Figure 32 - Recovery versus Leach Time P80 = 106 Microns
São Jorge Gold Project, Pará State, Brazil GE21210515
Independent Technical Report on Mineral Resources – 31 May 2021
Figure 33 - Recovery versus Leach Time P80=75 Microns
Further test work is required in order to determine the overall benefit of gravity separation on São Jorge mineralized material.
13.3.9 | Optimization of Cyanide Dosage |
To determine the influence of the initial concentration of cyanide in the pulp, bottle roll tests were conducted on a sample that was crushed to P80 = 75 µm. For each dosage of cyanide, two assays were run, and the results reflect the average. The tests were conducted under the following conditions:
| | • | Per cent of solids 50% solids; |
| | • | pH of the pulp adjusted to between 10-11; |
| | • | Total residence time 24 hours; |
| | • | Analyses for gold, cyanide and pH |
| | • | Initial concentration of cyanide 300, 500, 700 and 1500 mg/L; and No activated carbon was added to the slurry. |
Table 28 below indicates the gold recovery rates as a function of cyanide consumption and Figure 34 indicates Cyanide consumption versus Recovery.
São Jorge Gold Project, Pará State, Brazil GE21210515
Independent Technical Report on Mineral Resources – 31 May 2021
.
Table 28 - Gold Recovery Rate as a Function of Cyanide Consumption
NaCN Initial | MET 01 |
| | Feed | Tailings | Gold Recovery | Consumption |
(g/t) | (g/t) | (g/t) | (%) | NaCN (g/t) |
300 | 0.71 | 0.17 | | 248 |
300 | 0.75 | 0.17 | 77.30% | 238 |
500 | 0.77 | 0.06 | | 319 |
500 | 1.08 | 0.15 | 89.00% | 398 |
700 | 0.92 | 0.08 | | 318 |
700 | 0.92 | 0.07 | 92.20% | 320 |
1500 | 0.79 | 0.06 | | 620 |
1500 | 0.84 | 0.07 | 92.00% | 650 |
Figure 34- NaCN (g/t) Consumption
The tests performed at different concentration levels of cyanide were beneficial in showing that maximum gold recovery, greater than 92% was achievable for 700 grams of cyanide per tonne of ore.
When comparing the cyanide consumption for all tests that were conducted for this phase of work, the average consumption rate is in the range of 600 g/t. Further test work needs to be performed in order to establish optimum cyanide consumption rates.
São Jorge Gold Project, Pará State, Brazil GE21210515
Independent Technical Report on Mineral Resources – 31 May 2021
13.4 | Additional Metallurgical Testing |
Additional bottle roll tests were conducted on left over samples from column leach tests. This work was conducted by Testwork Process Development Ltda for Brazilian Gold Corporation, AusIMM registration number 304552, Report 002-2013 Brazilian Gold Rev 0 entitled, “Leaching tests with São Jorge Ore”, dated January 2013. Refer to Appendix 2 which contains the metallurgical report generated by Testwork Desenvolvimento de Processo Ltda.
A number of 24 hour bottle roll tests were carried out on both the oxide and sulphide ore in order to determine the effect of grind size on recovery and also to estimate a gold recovery value for the oxide ore. The tests were performed on material containing a slightly higher head grade for the sulphide ore than that used in earlier metallurgical test work. The samples were taken from left over material from earlier column tests and were identified as SJ-LCH001, and SJ-LCH-002. Table 29 shows a summary of the leaching results.
The leaching tests were carried out in the following conditions:
Size: | P80 = 106 and 75 µm |
Carbon: | Without |
% solids: | 50% solids |
pH: | 10.5 to 11.0 |
Cyanide: | 1000 ppm (initial) |
Time: | 24 hours |
Sampling: | 24 h (Au, pH and NaCN). |
Table 29 - Summary of Leaching Test Results
SAMPLE | OXIDE ORE | SULPHIDE ORE |
P80 | P80 = 106 µm | P80 = 75 µm | P80 = 106 µm | P80 = 75 µm |
Analysed Feed (g/t) | 1,03 | 1,18 |
Calculated Feed (g/t) | 1,13 | 1,32 | 0,97 | 1,01 |
| Tailings | Recovery. | Tailings | Recovery. | Tailings | Recovery. | Tailings | Recovery. |
| | 0,149 | 86,96% | 0,168 | 86,10% | 0,082 | 91,72% | 0,102 | 91,13% |
| Leaching | 0,149 | 86,80% | 0,157 | 88,41% | 0,084 | 90,74% | 0,049 | 94,60% |
| | 0,078 | 92,31% | 0,188 | 86,19% | 0,061 | 94,24% | 0,048 | 95,85% |
| | 0,173 | 86,05% | 0,118 | 91,24% | 0,069 | 92,66% | 0,055 | 93,41% |
Global Recovery (%) | 87,9% | 88,0% | 92,4% | 93,7% |
Initial results indicate that grind size has little effect on the oxide ore with both grind sizes achieving virtually the same average recovery rate of 88 %. The finer grind size on the sulphide ore resulted in an increase in recovery of 1.3 %. The oxide ore exhibited a lower gold recovery as compared to the sulphide ore which may indicate some sort of organic fouling during the leaching cycle thus leading to possible preg robbing of gold laden solution. This needs to be further examined in the next phase of test work.
São Jorge Gold Project, Pará State, Brazil GE21210515
Independent Technical Report on Mineral Resources – 31 May 2021
Two column tests were performed on the São Jorge ore samples, one on the oxide ore and one on the sulphide ore in order to evaluate the potential for heap leaching of low grade material.
Samples were received in plastics bags and were identified as SJ-LCH-001, and SJ-LCH-002. For the oxide ore, samples were selected from 8 drill holes and for the sulphide ore samples were selected from 9 drill holes all at different depths along the deposit. A total of 20 samples for the oxide and 23 samples for the sulphide with varying grades were composited using a weight average to generate the final master composite.
The samples were crushed to 3/8”, homogenized and divided into a 20 kg sub-sample which were then used in the column leaching tests. The rest of the sample was homogenized again and one head sample was taken for gold analysis from each of the two original samples, SJLCH-001 and SJ-LCH-002.
The 20 kg sub-samples SJ-LCH-001 (oxidized material), and SJ-LCH-002 (sulphide material) were placed in two separate columns.
To determine the gold grades in the head samples, three sub-samples of 500g of each material (oxidized and sulphide) were sent for gold analysis. Table 30 and Table 31 show the results.
Table 30 - Head Sample Grade – Sulphide Ore
SJ-AL1-T1 | 1.08 |
SJ-AL1-T1 | 0.96 |
SJ-AL1-T1 | 1.48 |
Average | 1.18 |
SD | 0.27 |
Table 31 - Head Sample Grade - Oxide Ore
SJ-AL1-T2 | 1.08 |
SJ-AL1-T2 | 1.18 |
SJ-AL1-T2 | 0.82 |
Average | 1.03 |
SD | 0.19 |
The samples were leached in the following conditions:
| | • | Agglomeration with 500 g/t of cyanide and 1 kg/t of lime |
| | • | Leaching solution – 500 mg/L of NaCN ☐ pH – 10.5 |
São Jorge Gold Project, Pará State, Brazil GE21210515
Independent Technical Report on Mineral Resources – 31 May 2021
The cyanide solutions were prepared every day, no carbon adsorption was used.
Total leach time was 30 days. After that water was pumped through the column to wash the residual cyanide for 4 days. The columns were than discharged, the samples were dried, crushed to 1/8” (3 mm), homogenized and sampled for gold analysis.
A summary of the results is shown in the Table 32 and Table 33.
Table 32 - Column Test Leaching Results
| Head Grade (g/t) | Tailings Au | Recoveries (%) |
| Ore | | | (g/t) | |
| | Analysed | Calculated | | |
Sulphide | 1.18 | 1.20 | 0.56 | 53.0% |
Oxidized | 1.08 | 1.09 | 0.23 | 78.9% |
Table 33 - Column Test Leaching Curves
Initial column tests indicate that the gold recovery achieved for the sulphide material was 53 % and for the oxides 78.9 % based on 30 days leach cycle time. The graph above indicates that after 30 days of leaching maximum recovery has not yet been reached for both ores. Extended leach times should result in slightly higher metal recoveries for both ores. The sulphide material exhibited a rapid rise in recovery at the beginning of the leach cycle, this may be due to the quick “washing” of the ore. Initially the cyanide solution passes rapidly over the ore surface leaching all the available gold. However, after sometime the gold becomes more difficult to leach due to the low permeability of the ore. As a result, agglomeration tests utilizing cement should be carried out in order to improve on permeability and percolation of the cyanide solution.
São Jorge Gold Project, Pará State, Brazil GE21210515
Independent Technical Report on Mineral Resources – 31 May 2021
13.5 | Metallurgical Tests - Conclusion and Recommendations |
A number of specific conclusions have been drawn from the results of tests conducted in 2006, 2012 and 2013, as segmented and summarized below.
Column Tests
Further column test work on the oxide material should be performed in order to test the technical and economic viability of heap leaching. It is recommended that further leach tests be carried out using coarser feed material, i.e. P80 50 mm, P80 25mm and P80 13mm in order to establish optimum crush size.
Heap leach recoveries for both the oxide and sulphide material were 78.9 % and 53.0 %, respectively.
Cyanide consumption for the oxide was determined to be approximately 1.1 g/t while for the sulphide it was 1.2 g/t. Column leach tests do not accurately predict reagent consumption for full scale heap leach operations. Typical cyanide consumption for a heap leach operation would be 25 % to 40 % of the consumption predicted from column leach tests. Lime consumption predicted from column tests would also be higher than full scale operation.
Due to the nature of the Oxide ore which contributed to poor permeability during the initial column tests, further column tests incorporating cement in the agglomeration mix needs to be explored.
Column tests should be performed over a 60 day period in order to obtain leach cycle times, establish maximum recovery rates and generate leaching kinetic curves for coarser crushed material.
Bottle roll test work on material ground to P80 1.7mm (10 mesh), P80 250 micron, P80 106 micron and P80 75micron should be performed in order to establish ultimate recovery of the ore.
Moisture content of the heap leach ore should be determined before and after leaching in order to establish the amount of make- up water required.
Further column tests should be carried out using site water as opposed to tap water in order to determine the effects of site water on leach kinetics.
Percolation rates were measured to be 10 L/m2/h.
São Jorge Gold Project, Pará State, Brazil GE21210515
Independent Technical Report on Mineral Resources – 31 May 2021
Gravity and Leach Testwork Sulphide & Oxide Ore Phase 2
The data reviewed suggests that collection of gold through gravity concentration is viable based on recovery, but not feasible based on the low concentrate grades reported. It would have been beneficial to have performed gravity upgrading and/or leach tests on the first pass gravity concentrate in order to establish cyanide consumption rates and overall recoveries.
Gravity concentrate recoveries should be revised and stated with the grade of the concentrate produced.
The selection of the metallurgical sample needs to be verified in order to determine if the samples represent the deposit as it is currently defined.
The recoveries by granulometric fraction were between 74 % and 87 % for the finer fractions and 90.6 % for the coarser, 150 µm, fraction. As the process of sieving classifies material exclusively with respect to size, this may indicate that part of the gold (coarse and liberated) has been retained in the mesh.
For met samples SJ-AL1-T1 which represents the sulphides and SJ-AL2-T2 which represents the oxides, gold recovery for the finer ground samples P80 75 microns ranged from 91.1 to 95.8 % for the sulphides and between 86.1 to 91.2 % for the oxides.
For met samples SJ-AL1-T1 which represents the sulphide ore, gold recovery was increased from an average of 92.4 % to 93.7 % using a finer grind that is a P80 75 microns as compared to a P80 106 microns.
For met samples SJ-AL2-T2, which represents the oxide ore, the finer grind size did not affect recovery as both a grind size at P80 75 microns and of P80 106 microns resulted in the same recovery rates.
For met sample SJ-AL2-T2 low gold recoveries averaging 88 % may be attributed to organic fouling.
The GRG tests show how the gold is gradually liberated during the crushing process, and the results indicated that it was possible to attain a maximum gold recovery of 66% when the ore is crushed in stages to a P80 equalling 74 µm. It should be noted that the material was initially ground to a P80 of 212 microns and then subjected to gravity concentration. From the test results it was shown that an overall recovery of 36.5% with a gold grade of 38.91 g/t Au was achieved when the entire sample was ground to a P80 of 212 microns. The gravity tailings were further ground to a particle size of P80 106 microns which then recovered an additional 17.2% of the gold in relation to the feed grade. The tailings from the second stage of concentrating were then ground to a particle size of P80 75 microns and returned a further gold recovery of 12.4%. The cumulative recoveries total 66 % recovery. As a result of the three stages of grinding, the final gravity recovery that was achieved could be overstated.
São Jorge Gold Project, Pará State, Brazil GE21210515
Independent Technical Report on Mineral Resources – 31 May 2021
The tailings from the gravity concentration were subjected to leaching with and without carbon present. It was observed that carbon reported to the solid residue which increased the reported tailings grade and reduced the gold recovery (24 hour test).
Gravity gold recovery reached 49.5 % and 40.7 % when the ore was crushed at P80 levels of 106 µm and 75 µm, respectively.
For met sample MET -01, a grind size of P80 = 75 microns resulted in an overall recovery of 92.1 % and was achieved without the use of gravity separation. With gravity separation gold recovery can be slightly increased to 93 %. At the coarser grind size of P80 = 106 microns overall recovery was slightly lower at 91.0 % with the aid of gravity separation. Overall recovery is a combination of gravity recovery and leaching. Further test work is recommended to validate the benefit of gravity separation.
As the testwork was performed on a lower grade material, it is expected that as the head grade is increased, so too will the recovery of gold. This can be seen in Figure 35.
Figure 35 - Predicted Grade versus Recovery for High Grade Ore
At an anticipated head grade of approximately 1.57 g/t Au, the overall recovery is expected to be in the range of 94.0 % or slightly higher, if the process incorporates a CIL circuit with a feed size of P80 = 75 microns or finer.
| | • | The results from sample MET-01 indicates no great consumers of cyanide, such as thiocyanate, ferrocyanide or copper cyanide, exist in large concentrations in the solution; |
| | • | The ore is categorized as medium to hard with a Ball Mill work index ranging from 13.7 to 15.7 kWh/t; |
| | • | Results indicate that, at a fine grind of P80 75 microns, and a slightly higher grade of ore (1.18 g/t gold) a recovery of 93.7 % is achievable; |
São Jorge Gold Project, Pará State, Brazil GE21210515
Independent Technical Report on Mineral Resources – 31 May 2021
| | • | Leach kinetics curves indicate that maximum gold recovery can be achieved after 22 hours of leaching for the sulphide ore. Leach kinetic curves were not generated for the oxide ore. |
| | • | In order to fully understand and define the metallurgical response of the oxide and sulphide deposits a number of variability samples would be required. These samples would be used not only to develop the resource block model but would also be used in the grinding and leach test program. The results of this testwork would be inputted back into the block model in order to allow for metal extractions to be predicted across the deposit. |
| | • | Future samples must be chosen to be representative of the ore that will be mined in the first 5 years of the mine life. They should be selected by the Project Geologist in collaboration with the Lead Process Engineer and Mining Engineer. |
| | • | The different lithologies along with the master composite for each deposit should be submitted for head analysis. Elements for analysis would include gold, silver, copper, sulphur and iron. |
| | • | A representative sample from each lithology along with the master composites for the deposit should be submitted for mineralogical examination in order to obtain bulk modal analyses data and liberation data. Also QEMSCAN analysis should be performed on the final tails from the deposits in order to better understand the mineral composition within the ore body thus indicating how metallurgical performance may be affected. |
| | • | The next phase of the program requires more comminution data such as; Modified Bond ball mill work index tests, several full Bond ball mill work index determinations, Bond rod mill work index, crushing work index, abrasion work index, Unconfined Compression tests (UCS), SAG Mill Comminution tests (SMC) and JKTech drop weight tests in order to properly size the comminution circuit. |
| | • | On the master composite for the sulphide ore, a HPGR (high pressure grinding rolls) evaluation should be considered as an option to SAG milling. This would require a Static Pressure Test (SPT) to be performed. |
| | • | A series of flotation tests should be considered on both ore types in order to establish if flotation would be an appropriate flowsheet option in order to optimize gold recovery. |
| | • | Further gravity tests should be carried out on both ore types at various grinds in order to confirm original findings. |
| | • | Leaching of the gravity concentrate should be carried out in order to determine overall recovery rates and establish leach kinetic curves along with reagent consumptions. |
| | • | Leach kinetic curves need to be established on master composite samples for both the oxide and sulphide ore. |
| | • | Once optimum conditions have been established with the master composites, further bench tests should be performed on the variability samples using the same set of conditions. |
| | • | Once optimum conditions have been established from bench tests, locked-cycle testing and potentially a pilot plant trial should be conducted in order to confirm initial findings. |
São Jorge Gold Project, Pará State, Brazil GE21210515
Independent Technical Report on Mineral Resources – 31 May 2021
| | • | Reagent optimization for both ore types needs to be established. |
| | • | Settling tests on the tailings for both ore types are required. This would involve appropriate flocculent selection (ionic, cationic, neutral, coagulant) settling test work (feed percent solids, dosage, pH), specific gravity determination and viscosity measurements on tailings, with and without thickening. |
| | • | As the deposit consists of approximately 15% oxide (laterite and saprolite) material and 85% sulphide material the next phase of test work needs to include both gravity and leach test work on a composite sample that represents this ratio in order to determine what effect a blended ore has on recovery, if any, as this may be a possible process route. |
| | • | Further testing needs to be carried out on the oxide material as it may be processed separately for the first 18 months of production. This would include the same testwork that has been carried out on the sulphides. |
| | • | Testwork involving thickening of the leach tails is recommended for the next phase of work for both oxide and sulphide material in order to establish maximum obtainable densities for the CCD circuit. |
| | • | The ore rheology needs to be well defined and understood to thwart any potential viscosity issues which may arise from the processing of the oxides alone. |
| | • | Environmental testwork, as it relates to the processing plant and tailings storage facility is required. |
São Jorge Gold Project, Pará State, Brazil GE21210515
Independent Technical Report on Mineral Resources – 31 May 2021
14 | MINERAL RESOURCE ESTIMATES |
The QPs have estimated the Mineral Resource for the São Jorge Gold Project as at 31 May 2021. All grade estimation was completed using Multiple Indicator Kriging (‘MIK’) for gold. This estimation approach was considered appropriate based on a review of a number of factors, including the quantity and spacing of available data, the interpreted controls on mineralisation and the style of mineralisation . The estimation was constrained by a wireframe that separated altered mineralized rock from unaltered rock.
Previous resource estimates for São Jorge did not use a geological model; simple grade shells were used to control the estimation.
BGC geologists mapped alteration ‘assemblages’ to define meaningful zones that could be correlated between drill holes and sections. Alteration intensity, sulphide percentage and gold grade data are also helpful, particularly in areas of uncertainly (Pedley, 2011).
The work done by BGC geologists can be summarized as:
| | • | Data was imported into Gemcom GEMS 6.3. Alteration zones were drawn on sections as polylines, based mainly upon the alteration assemblages but also with consideration of alteration intensity, sulphide percent and gold assay data where available. |
| | • | 8 zones, A to G and I, were defined, between 10 and 70 metres thick and extending from the base of oxide to the limit of drilling. For the most part alteration type was consistent within these zones. In some sections, alteration zones were re-classified based upon logic; for example, a zone logged as Fe-Ox +/- chl in one hole maybe logged as heterogeneous in another but being the same zone were considered the same zone in final model. |
| | • | Unmineralised (but altered) material within the alteration zones were common; the model did not attempt to model grade. Correlatable internal zones of no mineralisation or alteration (nada) were left out of the wireframe models. |
| | • | Material of no or weak alteration on the margins of the deposit was not modelled. |
The QP has modelled an envelope based upon BGC geologists' geological model. The interpretation was completed using 27 vertical sections oriented as shown in Figure 37. The interpretation and wireframe models have been developed using the Gemcom Surpac mine planning software package.
São Jorge Gold Project, Pará State, Brazil GE21210515
Independent Technical Report on Mineral Resources – 31 May 2021
For the purpose of resource estimation, one mineralized domain was interpreted and was modelled around all alteration zones. The domain is depicted in plan and section in Figure 36 and Figure 37.
As the mineralisation is very diffuse, internal waste intervals were accepted within the mineralized domain. There are no non-sampled intervals; every interval was sampled for the estimation process.
Figure 36 - Deposit Alteration Zones Model
Figure 37 - Envelope modelling - Vertical Sections Location
An oxidation domain was defined based on the contact of the weathered rock (oxide) with the fresh rock (sulphide) using codes defined in the geological description table of the database.
São Jorge Gold Project, Pará State, Brazil GE21210515
Independent Technical Report on Mineral Resources – 31 May 2021
This domain was built using an intersection between the surface weathering DTM created using the contacts points. The Figure 38 shows the oxidation example.
Figure 38 - Envelope Modelling - Vertical Section Example
São Jorge Gold Project, Pará State, Brazil GE21210515
Independent Technical Report on Mineral Resources – 31 May 2021
14.3 | Block Model Development |
A three-dimensional block model was constructed for the São Jorge Gold Project, covering all the interpreted mineralisation zones and including suitable additional waste material to allow later pit optimisation studies. The block model has been developed using Gemcom Surpac software.
A block size of 5mE x 5mN x 5mRL has been used for all materials without sub-blocking. The attributes coded into the block models included mineralisation, grade and weathering. A visual review of the wireframe solids and the block model indicates robust flagging of the block model. Bulk density has been coded to the block model based on the defined density measurements for the different rock types of classification reported in the item 11.1 of this report.
Table 34 below shows the summary of the block model parameters created.
Table 34 - Summary of the Block Model Parameters
| Y | X | Z |
Minimum Coordinates | 9,282,400 | 656,500 | -300 |
Maximum Coordinates | 9,283,300 | 658,100 | 270 |
User Block Size | 5 | 5 | 5 |
Min. Block Size | 5 | 5 | 5 |
Rotation | 0 | 0 | 0 |
The drillhole database was composited to a 1m downhole composite interval, recording the geological model. The 1m composites were used for all statistical, geostatistical and grade estimation studies. The decision to use 1m composites was based on the sample lengths in the database, considering the samples inside the zone estimated and reported in this document. Figures 39 and 40 illustrate the predominant sample lengths for oxide and sulphide rock respectively.
Figure 39 - Histogram showing sample lengths inside mineralized Oxide zone.
São Jorge Gold Project, Pará State, Brazil GE21210515
Independent Technical Report on Mineral Resources – 31 May 2021
Figure 40 - Histogram showing sample lengths inside mineralised Sulphide zone.
Statistical analysis of the composite datasets was completed on the 2 domains (oxide and sulphide). The element included in the composite database is Au (grams per tonne).
Descriptive statistics are presented in Table 35
Table 35 - Statistics Summary– 1m Composites
| | Au (g/t) |
Oxide Rock Domain | Count Minimum Maximum | 2303 0.001 11.10 |
| | Mean | 0.257 |
| | Std. Dev. | 0.817 |
| | CV | 3.183 |
Sulphide Rock Domain | Count Minimum Maximum | 22319 0.001 32.373 |
| | Mean | 0.336 |
| | Std. Dev. | 1.160 |
| | CV | 3.457 |
Indicator classes have been defined for the single mineralized domain. The conditional statistics for the mineralized domain to be estimated by Multiple Indicator Kriging are listed in Table 36
São Jorge Gold Project, Pará State, Brazil GE21210515
Independent Technical Report on Mineral Resources – 31 May 2021
Multiple Indicator Kriging estimates the cumulative grade distribution frequency rather than the grades itself for each block, then it uses the interclass means of grade to estimate the median grade inside the block.
Multiple Indicator Kriging works on a probabilistic basis to define the distribution of the grades of samples within each search window, providing a discrete approximation to the CCDF for each block. As this distribution is based on the samples found within the search window centred on any given point, it changes from block to block to reflect local grade variability.
Table 36 - Indicator Class Means
Class Superior Limit | Mean Grade | Class Prob | CumlProb |
0.10 | 0.021 | 15183 | 66% |
0.25 | 0.161 | 17968 | 79% |
0.50 | 0.357 | 19698 | 86% |
1.00 | 0.709 | 21017 | 92% |
1.50 | 1.221 | 21615 | 95% |
2.00 | 1.724 | 21985 | 96% |
3.00 | 2.439 | 22341 | 98% |
4.51 | 3.628 | 22571 | 99% |
6.50 | 5.447 | 22700 | 99% |
10.02 | 8.073 | 22771 | 100% |
Figures 41 and 42 respectively show the statistical analysis for the 1m composite mineralized oxide and sulphide domain samples.
São Jorge Gold Project, Pará State, Brazil GE21210515
Independent Technical Report on Mineral Resources – 31 May 2021
Figure 41 - Statistical Analysis for Oxide Domain Samples – 1 m Composite
São Jorge Gold Project, Pará State, Brazil GE21210515
Independent Technical Report on Mineral Resources – 31 May 2021
Figure 42 - Statistical Analysis for Sulphide Domain Samples – 1 m Composite
São Jorge Gold Project, Pará State, Brazil GE21210515
Independent Technical Report on Mineral Resources – 31 May 2021
Variography is used to describe the spatial variability or correlation of an attribute (gold, silver, etc.). The spatial variability is traditionally measured by means of a variogram, which is generated by determining the averaged squared difference of data points at a nominated distance (h), or lag (Srivastava and Isaacs, 1989). The averaged squared difference (variogram or γ(h)) for each lag distance is plotted on a bivariate plot, where the X-axis is the lag distance, and the Y-axis represents the average squared differences (γ(h)) for the nominated lag distance.
Several types of variogram calculations are employed to determine the directions of the continuity of the mineralisation:
| | ■ | Traditional variograms are calculated from the raw assay values. |
| | ■ | Log-transformed variography involves a logarithmic transformation of the assay data. |
| | ■ | Gaussian variograms are based on the results after declustering and a transformation to a Normal distribution. |
| | ■ | Pairwise-relative variograms attempt to ‘normalise’ the variogram by dividing the variogram value for each pair by their squared mean value. |
| | ■ | Correlograms are ‘standardized’ by the variance calculated from the sample values that contribute to each lag. |
Fan variography involves the graphical representation of spatial trends by calculating a range of variograms in a selected plane and contouring the variogram values. The result is a contour map of the grade continuity within the domain.
The variography was calculated and modelled in the mining planning software, Gemcom Surpac Software. The rotations are tabulated as input into Gemcom Surpac Software (geological convention), with X representing the bearing, Y representing dip and Z representing plunge. Dip and dip direction of major, semi-major and minor axes of continuity are also referred to in the text.
14.5.2 | São Jorge Variography |
Grade and indicator variography was generated to enable grade estimation via MIK and change of support analysis to be completed.
Table 37 shows the nine indicator thresholds that were investigated for the mineralized domain. Interpreted anisotropy directions correspond well with the modelled geology and overall geometry of the interpreted domain. This interpretation appears to cross-cut the trend of the interpreted alteration envelopes, while being contained within them.
São Jorge Gold Project, Pará State, Brazil GE21210515
Independent Technical Report on Mineral Resources – 31 May 2021
Table 37 - Variogram Models Summary- Nested Spherical
Cutoff grade | Variable | (Nugget) C0 | C1 | A1 | C2 | A2 | C3 | A3 | Bearing | Plunge | Dip | Ratio SM | Ratio RM |
0.3 | Au | 0.30 | 0.39 | 7 | 0.37 | 42 | - | - | 90 | -50 | -80 | 1.3 | 4.02 |
0.4 | Au | 0.30 | 0.39 | 7 | 0.37 | 42 | - | - | 90 | -50 | -80 | 1.3 | 4.02 |
0.5 | Au | 0.30 | 0.39 | 7 | 0.37 | 42 | - | - | 90 | -50 | -80 | 1.3 | 4.02 |
0.75 | Au | 0.30 | 0.39 | 7 | 0.37 | 42 | - | - | 90 | -50 | -80 | 1.3 | 4.02 |
0.85 | Au | 0.30 | 0.39 | 7 | 0.37 | 42 | - | - | 90 | -50 | -80 | 1.3 | 4.02 |
1 | Au | 0.30 | 0.39 | 7 | 0.37 | 42 | - | - | 90 | -50 | -80 | 1.3 | 4.02 |
1.2 | Au | 0.30 | 0.39 | 7 | 0.37 | 42 | - | - | 90 | -50 | -80 | 1.3 | 4.02 |
1.5 | Au | 0.30 | 0.39 | 7 | 0.37 | 42 | - | - | 90 | -50 | -80 | 1.3 | 4.02 |
2 | Au | 0.30 | 0.39 | 7 | 0.37 | 42 | - | - | 90 | -50 | -80 | 1.3 | 4.02 |
São Jorge Gold Project, Pará State, Brazil GE21210515
Independent Technical Report on Mineral Resources – 31 May 2021
An extensive variogram modelling was done, before deciding by the final variogram attitude, it was found close to the secondary behaviour one can found on the altered zones attitude meanwhile the global bearing of the mineralised domain seen to be aligned with the direction N115o a secondary alignment, can be noted to be roughly West-East, as can be observed on the Figure 43.
Figure 44 Shows a graphic presentation of the Variogram used to estimate the São Jorge Gold Project
Figure 43 - Definition of Small-Scale Bearing
São Jorge Gold Project, Pará State, Brazil GE21210515
Independent Technical Report on Mineral Resources – 31 May 2021
Figure 44 - Variography for Oxide and Sulphide Resource Estimation
São Jorge Gold Project, Pará State, Brazil GE21210515
Independent Technical Report on Mineral Resources – 31 May 2021
Resource estimation for the São Jorge mineralisation was completed using MIK within the oxide and sulphide mineralized domains.
Grade estimation was carried out using the Gemcom Surpac Software implementation Indicator kriging algorithms.
The MIK technique is implemented by completing a series of Ordinary Kriging (“OK”) estimates of binary transformed data. A composite sample, which is equal to or above a nominated cutoff or threshold, is assigned a value of 1, with those below the nominated indicator threshold being assigned a value of 0. The indicator estimates, with a range between
0 and 1, represent the probability the point will exceed the indicator cutoff grade. The probability of the points exceeding a cutoff can also be considered broadly equivalent to the proportion of a nominated block that will exceed the nominated cutoff grade.
The estimation of a complete series of indicator cutoffs allows the reconstitution of the local histogram or conditional cumulative distribution function (ccdf) for the estimated point. Based on the ccdf, local or block properties, such as the block mean and proportion (tonnes) above or below a nominated cutoff grade can be investigated.
14.7 | Multiple Indicator Kriging Parameters |
MIK estimates were completed for relevant domains using the indicator variogram models and a set of ancillary parameters controlling the source and selection of composite data. The sample search parameters were defined based on the variography and the data spacing. A total of 9 indicator thresholds were estimated for oxide and sulphide mineralised domains as discussed in section 14.5
The sample search parameters are provided in Table 38. Soft boundaries were used in all estimation passes. The specific effect of this is to allow samples lying within the sulphide grade domain to be used for the estimation of the oxide domain and vice versa. This strategy allows adequate estimation in areas where the estimation domains are adjacent to each other which might otherwise remain unestimated in any given estimation pass due to a lack of available composites in the search neighbourhood. A three-pass estimation strategy was applied to each domain, applying progressively expanded and less restrictive sample searches to successive estimation passes, and only considering blocks not previously assigned an estimate.
São Jorge Gold Project, Pará State, Brazil GE21210515
Independent Technical Report on Mineral Resources – 31 May 2021
Table 38 - Multiple Indicator Kriging Sample – Search Parameters
Zone | Estimation Pass | Rotation | Search Distance | Min. No. of Comp. | Max. No. of Comp. | Max. No. of Comp. per Hole |
X | Y | Z | X | Y | Z |
Sulphide | 1 2 | 90 90 | -80 -80 | -50 -50 | 28 65 | 21.5 50.0 | 7.0 16.2 | 16 12 | 32 32 | 6 6 |
| | 3 | 90 | -80 | -50 | 150 | 115.4 | 37.3 | 6 | 32 | 6 |
Oxide | 1 2 | 90 90 | -80 -80 | -50 -50 | 28 65 | 21.5 50.0 | 7.0 16.2 | 16 12 | 32 32 | 6 6 |
| | 3 | 90 | -80 | -50 | 150 | 115.4 | 37.3 | 6 | 32 | 6 |
All relevant statistical information was recorded to enable validation and review of the MIK estimates. The recorded information included:
| | ■ | Number of samples used per block estimate. |
| | ■ | Average distance to samples per block estimate. |
| | ■ | Estimation flag to determine in which estimation pass a block was estimated. |
| | ■ | Number of drillholes from which composite data were used to complete the block estimate. |
| | ■ | Conditional variances for the block. |
| | ■ | The MIK estimates were reviewed visually and statistically prior to being accepted. The review included the following activities: |
| | • | Comparison of the MIK CCDF estimate versus the CCDF of the composite dataset, including weighting where appropriate to account for data clustering. |
| | • | Visual checks of cross sections, long sections, and plans. |
The comparison between the frequency distributions of Au grades in the block model and set of composited samples leads to the conclusion that both fix to the same law. The Figures 45 and 46 present these comparisons.
| | • | Part Samp represent the Cumulative distribution of samples |
| | • | Au Avg sample are the Au grade for each Cut-off grade on samples |
| | • | Part Blk represent the Cumulative distribution for all mineralised blocks Au Avg |
| | • | BLK are the Au grade for each Cut-off grade on all blocks |
São Jorge Gold Project, Pará State, Brazil GE21210515
Independent Technical Report on Mineral Resources – 31 May 2021
Figure 45 - MIK Validation - Sulphide
Figure 46 - MIK Validation - Oxide
São Jorge Gold Project, Pará State, Brazil GE21210515
Independent Technical Report on Mineral Resources – 31 May 2021
The summarised Resource Statement in has been determined with an Effective Date of 31 May 2021 and has been prepared and reported in accordance with Canadian National Instrument 43-101, Standards of Disclosure for Mineral Projects (the Instrument) and the CIM Definition Standards for Mineral Resources and Mineral Reserves as prepared by the CIM Standing Committee on Reserve Definitions as adopted by CIM Council May 19, 2014.
In regards to factors that can materially affect the current Mineral Resource estimation, Brazil has a very stable legislation for environmental, permitting, legal and mining and a very low political and socio-economic risk is perceived.
São Jorge project is located in the region of the Amazonian Development Superintendence (SUDAM) jurisdiction that grants tax incentives with a 75% exemption from Corporate Income Tax (IRPJ). This reduction may be even greater if the company, additionally, chooses to use 30% of the 25% of the tax due, to expand the mining capacities. Therefore, the tax deduction could reach 82.5% of the income tax due. There is no assurance that this taxation incentive will be in place at the time the project starts its production phase,
| | 14.8.1 | Mineral Resources Category Definitions |
The definitions of resources established by CIM are as follows:
| | ■ | A Mineral Resource is a concentration or occurrence of solid material of economic interest in or on the earth’s crust in such form, grade or quality and quantity that there are reasonable prospects for eventual economic extraction. The location, quantity, grade or quality, continuity and other geological characteristics of a Mineral Resource are known, estimated or interpreted from specific geological evidence and knowledge, including sampling. |
| | ■ | An Inferred Mineral Resource is that part of a Mineral Resource for which quantity and grade or quality are estimated on the basis of limited geological evidence and sampling. Geological evidence is sufficient to imply but not verify geological and grade or quality continuity. An Inferred Mineral Resource has a lower level of confidence than that applying to an Indicated Mineral Resource and must not be converted to a Mineral Reserve. It is reasonably expected that the majority of Inferred Mineral Resources could be upgraded to Indicated Mineral Resources with continued exploration. |
| | ■ | An Indicated Mineral Resource is that part of a Mineral Resource for which quantity, grade or quality, densities, shape and physical characteristics are estimated with sufficient confidence to allow the application of Modifying Factors in sufficient detail to support mine planning and evaluation of the economic viability of the deposit. Geological evidence is derived from adequately detailed and reliable exploration, sampling and testing and is sufficient to assume geological and grade or quality continuity between points of observation. An Indicated Mineral Resource has a lower level of confidence than that applying to a Measured Mineral Resource and may only be converted to a Probable Mineral Reserve. |
São Jorge Gold Project, Pará State, Brazil GE21210515
Independent Technical Report on Mineral Resources – 31 May 2021
| | ● | A Measured Mineral Resource is that part of a Mineral Resource for which quantity, grade or quality, densities, shape, and physical characteristics are estimated with confidence sufficient to allow the application of Modifying Factors to support detailed mine planning and final evaluation of the economic viability of the deposit. Geological evidence is derived from detailed and reliable exploration, sampling and testing and is sufficient to confirm geological and grade or quality continuity between points of observation. A Measured Mineral Resource has a higher level of confidence than that applying to either an Indicated Mineral Resource or an Inferred Mineral Resource. It may be converted to a Proven Mineral Reserve or to a Probable Mineral Reserve. This Mineral Resource estimate has been classified as Indicated and Inferred Mineral Resources based on the confidence of the input data, geological interpretation, and grade estimation. |
The cut-off grade represents the value, expressed in grams of gold per tonne, obtained as the sum of process costs, mining costs, G&A costs and other costs including royalties divided by the gold price, expressed in dollars per gram of gold (US$/g) multiplied by process recovery rate.
| | 14.8.3 | Mineral Resources estimation parameters |
In order to assess whether there is a reasonable prospect for eventual economic extraction, the Mineral Resources have been constrained within a conceptual pit shell that uses only Au g/t grades and the input parameters: presented in Table 39.
Table 39 - Mineral Resources estimation parameters
Item | Unit | Value |
Revenue | Financial Parameters | Sales Price | US$/oz | 1600 |
Discount rate | % | 10 |
ROM | Density | g/cm³ | model & 2.69 on other waste |
Grades | g/t | model - MIK cog@0.3g/t |
Block Model | Block dimensions | Unit | Value |
X | m | 5 |
Y | 5 |
Z | 5 |
Overall Slope Angle | Saprolite | ° | 35 |
Fresh | 52 |
Processing | Metallurgical Recovery | % | 90 |
Cut-off Grade | g/t | 0.3 |
Costs | Mining | US$/t mined | 2.00 |
Processing | US$/T ROM | 8.50 |
G&A | 2.10 |
NSR Royalties | % | 3.5% |
São Jorge Gold Project, Pará State, Brazil GE21210515
Independent Technical Report on Mineral Resources – 31 May 2021
Figures 47, 48 and 49 illustrate the distribution of block grades in plan view, vertical section and isometric section.
Figure 47 - Block Model Plan View – Grade Distribution >0,3 g/t Au – 100m asl
Figure 48 - Block Model - Vertical Section - Grade Distribution >0,3 g/t Au
São Jorge Gold Project, Pará State, Brazil GE21210515
Independent Technical Report on Mineral Resources – 31 May 2021
Figure 49 - Isometric View of Block Model - Grade Distribution >0,3 g/t Au
The key criteria for the Mineral Resource classification are listed in Table 40
São Jorge Gold Project, Pará State, Brazil GE21210515
Independent Technical Report on Mineral Resources – 31 May 2021
Table 40 - Confidence Levels of Key Categorisation Criteria
Items | Discussion | Confidence |
Drilling Techniques | Diamond drilling is Industry standard approach. | High |
Logging | Standard nomenclature and apparent high quality. | High |
Drill Sample Recovery | Very good recovery recorded. | High |
Sub-sampling Techniques & Sample Preparation | Accepted practice followed. | High |
Quality of Assay Data | Available Talon data shows no bias although precision is not high possibly due to either sample preparation methodology or sample size. BGC data collection has followed all the procedures and is compatible with mining industry best practices. | Moderate |
Verification of Sampling and Assaying | Umpire samples taken although results returned low to moderate precision. | Moderate-High |
Location of Sampling Points | Survey of all collars with downhole survey for Talon and BGC Drilling. No downhole survey for RTDM drilling. | Moderate |
Data Density and Distribution | Approximately 30m x 30m spaced drilling which is somewhat sparse given the generally poor continuity of grade that is evident. | Moderate |
Audits or Reviews | The author is unaware of external reviews. | N/A |
Database Integrity | No Material errors identified. | High |
Geological Interpretation | The broad mineralisation constraints are subject to a large amount of uncertainty concerning mineralisation trends as a reflection of drilling density and geological complexity. Closer spaced drilling is recommended to solve this issue. | Moderate |
Estimation and Modelling Techniques | Multiple Indicator Kriging. | High |
Cutoff Grades | Lower Cutoff Grade of 0.3g/t Au applied to define the mineralised zone. | High |
Mining Factors or Assumptions | 5mE by 5mN by 5mRL SMU. | High |
São Jorge Gold Project, Pará State, Brazil GE21210515
Independent Technical Report on Mineral Resources – 31 May 2021
The MRE disclosed herein was prepared by Porfirio Rodriguez, FAIG, of GE21 Consultoria Mineral LTDA (Brazil) and has an effective date of May 31, 2021. Mineral Resources are reported using a 0.3 g/t gold cut-off. The MRE was constrained using a Lerchs-Grossman (LG) optimized pit shell using maximum pit slopes of 35 degrees in saprolite and 52 degrees in fresh rock and based on an assumed US$1,600/oz gold price, average metallurgical recoveries of 90% average mining costs of US$2.00/tonne, average processing costs of US$8.50/tonne and average general and administrative costs of US$ 2.10/tonne processed. Mineral Resources were estimated using a block model utilizing multiple indicator kriging using a selective mining unit block size of 5x5x5 metres. Net smelter return (NSR) royalties of 3.5% in aggregate have been included in the constrained pit model.
Mineral Resources are not mineral reserves and do not have demonstrated economic viability. The Project has no Mineral Reserves and there is no certainty that all or any part of the mineral resources will be converted into Mineral Reserves. The estimate of Mineral Resources may be materially affected by environmental permitting, legal, title, taxation, sociopolitical, marketing or other relevant issues. The QP is not currently aware of any other known environmental, permitting, legal, title-related, taxation, socio-political, marketing or other relevant issue that could materially affect this Mineral Resource estimate. Mineral Resources are reported exclusive of Mineral Reserves; there are no reported Mineral Reserves.
A summary of the estimated resources for the São Jorge Gold Project is provided in Table 41 and Figures 50, 51, 52 and 53 shows the Mineral Resources block model constrained by optimized pit shell.
São Jorge Gold Project, Pará State, Brazil GE21210515
Independent Technical Report on Mineral Resources – 31 May 2021
Table 41 - Resource Statement Table – Total Resources per Category
Oxide |
Resource Category | Tonnage (Mt) | Average Grade (g/t Au) | Contained Gold (koz) |
Indicated Mineral Resource | 1.78 | 1.42 | 81.4 |
Inferred Mineral Resource | 1.96 | 1.11 | 69.7 |
Sulphide |
Resource Category | Tonnage (Mt) | Average Grade (g/t Au) | Contained Gold ( koz) |
Indicated Mineral Resource | 12.50 | 1.57 | 630.3 |
Inferred Mineral Resource | 15.62 | 1.29 | 646.8 |
Total |
Resource Category | Tonnage (Mt) | Average Grade (g/t Au) | Contained Gold (koz) |
Indicated Mineral Resource | 14.27 | 1.55 | 711.8 |
Inferred Mineral Resource | 17.58 | 1.27 | 716.8 |
* Indicated and Inferred open pit constrained resources reported above a 0.30g/t Au cut-off grade – Multiple Indicator Kriging Estimate - 31 May 2021 * 5E x 5mN x 5mRL Selective Mining Unit |
São Jorge Gold Project, Pará State, Brazil GE21210515
Independent Technical Report on Mineral Resources – 31 May 2021
Figure 50 - Mineral Resources Block Model and Optimized Pit – Looking NW
Source: GE21 Block Model, 2021
Figure 51 - Mineral Resources Block Model and Optimized Pit Plan view
Source: GE21 Block Model, 2021
São Jorge Gold Project, Pará State, Brazil GE21210515
Independent Technical Report on Mineral Resources – 31 May 2021
Figure 52 - Classified Mineral Resources Block Model and Optimized Pit
Isometric View looking NW
Source: GE21 Block Model, 2021
Figure 53 - Classified Mineral Resources Block Model and Optimized Pit
Plan view
Source: GE21 Block Model, 2021
São Jorge Gold Project, Pará State, Brazil GE21210515
Independent Technical Report on Mineral Resources – 31 May 2021
15 | MINERAL RESERVE ESTIMATES |
Not applicable.
Not applicable.
Not applicable.
Not applicable.
19 | MARKET STUDIES AND CONTRACTS |
Not applicable.
20 | ENVIRONMENTAL STUDIES, PERMITTING AND SOCIAL OR COMMUNITY IMPACT |
Not applicable.
21 | CAPITAL AND OPERATING COSTS |
Not applicable.
Not applicable.
There are no adjacent or nearby concessions owned by GMI, although the São Jorge gold deposit is related to the east extension of the regional 450km long northwest-southeast CuiúCuiú - Tocantinzinho lineament which also hosts several important gold deposits including the Palito mine, Tocantinzinho and Cuiú-Cuiú deposits, and Bom Jardim and Batalha gold prospects.
São Jorge Gold Project, Pará State, Brazil GE21210515
Independent Technical Report on Mineral Resources – 31 May 2021
24 | OTHER RELEVANT DATA AND INFORMATION |
All relevant data and information regarding the Project is included in other sections of this report.
São Jorge Gold Project, Pará State, Brazil GE21210515
Independent Technical Report on Mineral Resources – 31 May 2021
25 | INTERPRETATION AND CONCLUSIONS |
Mr. Rodriguez and Mr. Soares in compliance with Canadian National Instrument 43-101 which regulates the public disclosure of mining companies in Canada, concludes that the São Jorge Gold Project Mineral Resource estimate has been prepared in accordance with the best practices of the industry.
The São Jorge Project is underlain by a granitoid pluton dominantly composed of an amphibole-biotite monzogranite. The gold mineralisation is hosted in a circular shaped body comprised of the younger São Jorge granite. Gold mineralisation is related to a hydrothermal alteration zone in the monzogranite along a structurally controlled fracture - vein system approximately 1,400m long and up to 160m wide, and intersected in drill holes up to 350m below surface. The main trend is 290° with an almost vertical dip. There has been a total of 145 diamond drill holes completed on the property totaling 37,154 metres. The QP considers the Project to have relevant exploration potential along strike of the main identified São Jorge shear structure which hosts the Mineral Resource. Along strike from the drilling defining the Mineral Resource, there is very limited to no drilling and remain potential targets to discover additional mineralisation. Additional targets exist below the limits of diamond drilling where the boundaries of mineralisation have not been defined.
In summary, the constrained Mineral Resource estimate, reported above a 0.30 g/t cut-off (oxide + sulphide) for the Project is:
14.275Mt at an average grade of 1.55g/t Au of Indicated Mineral Resources; and
17.58Mt at an average grade of 1.27g/t Au of Inferred Mineral Resources.
| | ■ | Potential head grade enhancement may be possible through selective mining of internal waste based on pit mapping and grade control; and |
| | ■ | Potential head grade enhancement may result from further upgrading of inferred resource to indicated. |
In the QPs' opinion, the property warrants a Preliminary Economic Assessment (PEA) to define the next course of action.
São Jorge Gold Project, Pará State, Brazil GE21210515
Independent Technical Report on Mineral Resources – 31 May 2021
Mr. Rodriguez and Mr. Soares have the following recommendations:
| | ■ | A new exploration program and budget to drill test and support the conversion of targets to Mineral Resources; |
| | ■ | A study to determine the optimum drilling grid (drill spacing) for Mineral Resource conversion from Inferred to Indicated, based on the current database. One method is based on analysis of kriging variances for existing samples in the study area; |
| | ■ | Evaluate underground Mineral Resource potential beneath the current open pit model at São Jorge; and |
| | ■ | Prepare a preliminary economic analysis (PEA), to further evaluate the economic potential of an open-pit operation and advance opportunities to upgrade and expand the current resource base. |
The QPs also recommend the following Phase I exploration program for the São Jorge project:
| | ■ | Diamond drilling to advance opportunities to upgrade and expand the current resource base including drilling near surface (to approx. 200m depth) existing Mineral Resources to potentially upgrade Inferred resources to Indicated resources. |
| | ■ | Additional modelling and interpretation of previously collected geophysical data: |
| | ☐ | Airborne magnetic survey completed by Fugro in 2006 that covers the entire property to identify possible structures for follow-up exploration. |
| | ☐ | Induced polarization survey (120 line km) completed by Fugro in 2011 that covers the strike extents of the São Jorge deposit with a particular emphasis on the resistivity +/- chargeability anomaly located along strike and for 2.5km southeast of the São Jorge deposit. |
| | ■ | Trenching and sampling of targets identified by the modelling and interpretation of the geophysical data. |
| | ■ | Near-deposit diamond drilling of geophysical-geochemical targets. |
| | ■ | A thorough re-examination of the existing diamond drill core including investigating potential additional sampling opportunities in areas that were not historically sampled. |
| | ■ | Conduct additional density measurements across representative lithologies for any additional diamond drilling programs. |
| | ■ | Develop a regional geochemical program to identify new targets on the largely unexplored São Jorge property. The program would consist of regional soil traverses using the existing east-west roads that cross the property. |
São Jorge Gold Project, Pará State, Brazil GE21210515
Independent Technical Report on Mineral Resources – 31 May 2021
If a decision is made to move forward and advance the Project, it is recommended that more formal social and community programs should be established. Each program should be developed to address stakeholder concerns and needs to be sustainable.
The proposed budget to carry out the Phase I exploration program outlined above, concurrent with a PEA is summarized in the Table 42
Table 42 - Phase I -Exploration and PEA Cost Estimates
Task | Detail | Cost (US$) |
Deposit drilling to upgrade inferred to indicated | Drilling (5,000 m) | $1,750,000 |
| Assaying (5,000 samples) | $200,000 |
Modelling and interpretation of geophysical data | | $30,000 |
Trenching of geophysical geochemical targets | Trenching (2,000m) | $20,000 |
| Assaying (1,000 samples) | $40,000 |
Near-deposit diamond drilling of geophysical-geochemical targets | Drilling (2,000m) | $700,000 |
| Assaying (1,000 samples) | $40,000 |
Regional geochemistry program | Assaying (2,000 samples) | $80,000 |
Travel and Accommodation | | $100,000 |
Field Supervision and Support | | $500,000 |
Administration Preliminary Economic Assessment | | $100,000 $150,000 |
Subtotal | | $3,710,000 |
Contingency (15%) | | $556,500 |
Total | | $4,266,500 |
São Jorge Gold Project, Pará State, Brazil GE21210515
Independent Technical Report on Mineral Resources – 31 May 2021
Amizade Global Services. 2010. Brazil. Accessed May 13 2011 from <http://amizade.org/programs/locations-to-serve/brazil/>
Brazil. Accessed May 13 2011 from <http://www.geologo.com.br/epithermaltapajos.asp>
Clendenning, A. 28 May 2005. Paving the forests brings change in the Amazon rainforest. Accessed May 13 2011 from http://news.mongabay.com/2005/0527-ap.html
Coffey (September 2008) Talon Metals Corp.: São Jorge Gold Project, Para State, Brazil, National Instrument 43-101 Second Technical Report
Coffey (September 2010) – NI43-101 Technical Report (resource estimate) on São Jorge Project, Para State, Brazil, for Brazilian Gold Corporation;
Coffey (June 2011) Brazilian Gold Corporation – São Jorge Gold Project, Para State, Preliminary Economic Assessment NI 43-101 Technical Report
Coffey (November, 2013) NI 43-101 Independent Technical Report on Mineral Resources on São Jorge Project, Pará State, Brazil for Goldmining Inc
Dardenne, Marcel Auguste e Schoppenhaus, Carlos, 2001 Metalogênese do Brasil.
Eldorado Gold Corporation (May 2011) – Technical Report for the Tocantinzinho Gold Project, Brazil
Gardingen P., Valle, D., Thompson, I. 2006. Evaluation of yield regulation options for primary forests in Gentry, A. H. 1991. The distribution and evolution of climbing plants. Pages 3-49 in J. Putz and H. Mooney, editors, The biology of vines. Cambridge: Cambridge University Press.
Goldfarb, R. J., Groves D. I., and Gardoll S. (2001). Orogenic Gold and Geologic Time: A Global Synthesis in Ore Geology Reviews 18.
Harron, G. A., Technical Report on São Jorge Project, Pará State, Brazil for BrazMin Corp. MPH Consulting Limited (Toronto, 2006).
Harron, G. A., Winfield, B., Qualifying Report on São Jorge Project, Pará State, Brazil for Resource Holdings and Investments Inc. MPH Consulting Limited (Toronto, 2004).
HIDROVIA Hydrogeologia E Meio Ambiente, Preliminary Studies of Water Resources São Jorge Project – BGC / PA, Prepared for Coffey Ltd., May 2011.
Jacobi, P. The discovery of the first epithermal Au-Cu-Mo Proterozoic Province in the Tapajos region,
Mitja D., Miranda, I., Velasquez, E., Lavelle, P. 2008. Plant species richness and floristic composition change along a rice-pasture sequence in subsistence farms of Brazilian Amazon, influence on the fallow biodiversity. Agriculture Ecosystem and the Environment. 124. Pp 72-84.
São Jorge Gold Project, Pará State, Brazil GE21210515
Independent Technical Report on Mineral Resources – 31 May 2021
MPH Consulting Limited (March 2006) - Technical Report on São Jorge Project, Pará State, Brazil for BrazMin Corp.
NCL Brasil (March 2010) – Tocantinzinho Gold Project, Preliminary Economic Analysis for Brazauro Resources Corporation
Pedley, A. (2011). Sao Jorge Deposit – Description Of Geology And Modelling - Internal Report.
Reynal, V, Muchagata, M., Topall, O., He´bette, J., 1995. Agricultures familiales et de´veloppement en front pionnier amazonien. GRETUAG UFPa, Paris-Point a` PitreBele´m Richardson, K. February 2001. Urban Man. Accessed May 13 2011 from http://www.brazzil.com/cvrfeb01.htm
Rocha, Ianê Pitrowsky da. April 29, 2011. Title Opinion on São Jorge Project; Letter to Canadian law firms and potential investors.
SRK Consulting (October 2006) – Resource Estimate and Technical Report for the São Jorge Project, Brazil for BrazMin Corp
Tapajos National Forest, Brazil. Forest Ecology and Management. 231. Pp 184-195
Testwork Desenvolvimento De Processo Ltda, Brazil. 2012. Review of Metallurgical Testwork on Samples from the Sao Jorge Gold Project for Brazilian Gold Corporation
Virtual-Brazil.com. 2011. Para, Brazil - Economy. Accessed May 13 2011 from<http://www.vbrazil.com/information/geography/para/economy.html>
Virtual-Brazil.com. 2011. Para, Brazil- Geography. Accessed May 13 2011 from <http://www.v-brazil.com/information/geography/para/geography.html>
West, James. Feb 18 2009. Brazil’s Tapajos: Gold Rush in Progress. Accessed May 13 2011 from <http://www.midasletter.com/news/09021806_Brazils-tapajos-goldrush-inprogress.php>
World Wildlife Fund. 2001. Tapajós-Xingu moist forests (NT0168). Accessed May 13 2011 from <http://www.worldwildlife.org/wildworld/profiles/terrestrial/nt/nt0168_full.html#location>
São Jorge Gold Project, Pará State, Brazil GE21210515
Independent Technical Report on Mineral Resources – 31 May 2021
Appendix A
Certificate of Qualified Persons
São Jorge Gold Project, Pará State, Brazil GE21210515
Independent Technical Report on Mineral Resources – 31 May 2021
Certificate of Qualified Person – Porfírio Cabaleiro Rodriguez
FAIG #3708
I, Porfírio Cabaleiro Rodriguez, as an author of this report entitled “São Jorge Gold Project, Pará State, Brazil: Independent Technical Report on Mineral Resources” prepared for GoldMining Inc. and with effective date of May 31, 2021, do hereby certify that:
| | a) | I am a Mining Engineer and Director for GE21 Consultoria Mineral, located at Avenida Afonso Pena, 3130 − 12º andar, Belo Horizonte, MG, Brazil, CEP 30.130-910. |
| | b) | I hold the following academic qualifications: a B.A.Sc. in Mining Engineering from the Federal University of Minas Gerais, in Belo Horizonte, Brazil. |
| | c) | I am a professional Mining Engineer, with more than 42 years of experience in the mining industry. My relevant experience for the purpose of this Technical Report includes: |
| | ● | 1986 to 2015 – Consultant, manager and director with consulting engineering firms that specialize in technical studies and audits of Mineral Resource and reserves, mine planning, geometallurgy, pit optimization and analysis of economic viability for many types of mineral deposits, including rare earth projects in their exploration and development phases including supervising and reporting metallurgical studies for a variety of different deposit types, including gold deposits. |
| | ● | 2015 to present – Director of GE21 Consultoria Mineral, which provides advice, assistance and audits for the entire mining cycle, from defining strategies, generating and selecting targets and investments, mineral exploration, project development, geological assessments, resource and reserve estimation for JORC and NI 43-101 reports, conceptual technical and economic studies, metallurgical studies, and economic feasibility. |
| | d) | I am a Fellow of the Australian Institute of Geoscientists (FAIG) (#3708). |
| | e) | I meet all the education, work experience and professional registration requirements of a “Qualified Person” as defined in Section 1.1 of National Instrument 43-101. |
| | f) | I last visited the São Jorge Project between the 13th and 14th of July, 2012. |
| | g) | I am responsible for Sections 1.1 to 1.7, all of Sections 2 to 5, and 13, and am jointly responsible for Sections 1.8 to 1.9 and all of the Sections of 14 to 26 of the Technical Report. |
| | h) | I am independent of GoldMining Inc. pursuant to Section 1.5 of National Instrument 43-101. |
| | i) | I have had no previous involvement with the São Jorge Project, except as an independent consultant to Brazilian Gold Corporation in 2011 and as an independent consultant for GoldMining Inc. in 2013 and 2014 through working as an independent consultant for Coffey Mining. |
| | j) | I have read National Instrument 43-101 and the parts of the Technical Report for which I am responsible have been prepared in compliance with this Instrument, including the CIM Definition Standards on Mineral Resources and Mineral Reserves. |
| | k) | I do not have nor do I expect to receive a direct or indirect interest in the São Jorge Gold Project of Brazil Resources Inc and I do not beneficially own, directly or indirectly, any securities of Brazil Resources Inc or any associate or affiliate of such company. |
| | l) | At the effective date of the Technical Report, to the best of my knowledge, information, and belief, the parts of the Technical Report for which I am responsible contain all scientific and technical information that is required to be disclosed to make the Technical Report not misleading. |
Signed and sealed in Belo Horizonte, Minas Gerais, Brazil, 1st July, 2021.
Porfirio Cabaleiro Rodriguez
BSc(Mining Engineer), FAIG #3708.
São Jorge Gold Project, Pará State, Brazil GE21210515
Independent Technical Report on Mineral Resources – 31 May 2021
Certificate of Qualified Person – Leonardo de Moraes Soares
I, Leonardo de Moraes Soares, Geologist, as an author of this report entitled “São Jorge Gold Project, Pará State, Brazil:” completed a site visit on May 24-25, 2021 and prepared an Independent Technical Report on Mineral Resources for GoldMining Inc. São Jorge Project with effective date of May 31, 2021, do hereby certify that:
| | a. | I am a Senior Mineral Resource Geologist with GE21 Consultoria Mineral, located at Avenida Afonso Pena, 3130 − 12º andar, Belo Horizonte, MG, Brazil, CEP 30.130-910; |
| | b. | I am a graduate of the Federal University of Minas Gerais, Minas Gerais State, Brazil and hold a Bachelor of Science Degree in Geologist (2002) and I have practiced my profession continuously since 2002. |
| | c. | I am a professional geologist with more than 16 years of relevant experience in Resource and Reserve estimation, involving mining properties in Brazil, including iron ore, gold, copper and among others. |
| | d. | I have relevant experience with exploration and resource estimate on gold deposits on similar mineralisaton as Crixás (Anglogold), Nova Xavantina (Caraíba - MCSA), Turmalina and Pilar (Jaguar Mining), Faina (Troy Inc.) and others. |
| | e. | I am a member of the Australian Institute of Geoscientists (“MAIG”) #5180. |
| | f. | I have read the definition of "qualified person" set out in National Instrument 43 101 (NI43-101) and certify that by reason of my education, affiliation with a professional association (as defined in NI43-101) and past relevant work experience, I fulfil the requirements to be a "Qualified Person" for the purposes of NI43-101. |
| | g. | I made a current site inspection of the São Jorge Gold Project on May 24-25, 2021. |
| | h. | I prepared and am responsible for the geological information and geological modelling sections of this report. |
| | i. | I am responsible for Sections 6 to 12 of the Technical Report, and am jointly responsible as co-author for Sections 1.8-1.9 and all of the Sections of 14 to 26 of this Technical Report. |
| | j. | I am independent of GoldMining Inc. pursuant to Section 1.5 of National Instrument 43-101. |
| | k. | I have had no prior involvement with the property that is the subject of the Technical Report other than as an independent consultant for GoldMining Inc. in 2013 and 2014 through working as an independent consultant for Coffey Mining. |
| | l. | I have read NI 43-101 and, the Technical Report and I hereby certify that the Technical Report has been prepared in accordance with NI 43-101 and meets the form requirements of Form 43-101 F1. |
| | m. | At the effective date of the Technical Report, to the best of my knowledge, information, and belief, the Technical Report contains all scientific and technical information that is required to be disclosed to make the technical report not misleading. |
| | n. | I do not have nor do I expect to receive a direct or indirect interest in the São Jorge Gold Project of Brazil Resources Inc and I do not beneficially own, directly or indirectly, any securities of Brazil Resources Inc or any associate or affiliate of such company. |
Signed and sealed in Belo Horizonte, Minas Gerais, Brazil, 1st July, 2021
Leonardo de Moraes Soares
BSc(Geologist), MAIG #5180.
São Jorge Gold Project, Pará State, Brazil GE21210515
Independent Technical Report on Mineral Resources – 31 May 2021
Appendix B
Drillhole Summary
São Jorge Gold Project, Pará State, Brazil GE21210515
Independent Technical Report on Mineral Resources – 31 May 2021

São Jorge Gold Project, Pará State, Brazil GE21210515
Independent Technical Report on Mineral Resources – 31 May 2021

São Jorge Gold Project, Pará State, Brazil GE21210515
Independent Technical Report on Mineral Resources – 31 May 2021

São Jorge Gold Project, Pará State, Brazil GE21210515
Independent Technical Report on Mineral Resources – 31 May 2021