Exhibit 99.1
NI 43-101
TECHNICAL REPORT AND PRELIMINARY ECONOMIC ASSESSMENT
FOR THE LA MINA PROJECT
ANTIOQUIA, REPUBLIC OF COLOMBIA
REPORT DATE SEPTEMBER 6, 2023
EFFECTIVE DATE: JULY 24, 2023
PREPARED FOR:
GOLDMINING INC.
PREPARED BY:
Scott Wilson, C.P.G. Resource Development Associates, Inc. Highlands Ranch, Colorado, USA | Paul Hosford, P.Eng. PMet Services Maple Ridge, BC, Canada |
| |
| |
Michael Cole, SME Mine Planners Roanoke, Virginia, USA |
GoldMining Inc. NI 43-101 Report – La Mina Project | Page I |
DATE AND SIGNATURE PAGE
GoldMining Inc., Technical Report and Preliminary Economic Assessment for the La Mina Project, Antioquia, Republic of Colombia.
Technical Report Effective Date: July 24, 2023
September 6, 2023
[“Signed and Sealed”] Scott E. Wilson | |
Scott E. Wilson, C.P.G. | |
Geologist | |
[“Signed and Sealed”] Paul Hosford | |
Paul Hosford, P. Eng. Metallurgical Engineer | |
[“Signed and Sealed”] Michael Cole | |
Michael Cole, SME Registered Member Mining Engineer | |
Resource Development Associates Inc.
Effective Date July 24, 2023
GoldMining Inc. NI 43-101 Report – La Mina Project | Page II |
AUTHOR’S CERTIFICATE, SCOTT E. WILSON
I, Scott E. Wilson, CPG, SME-RM, of Highlands Ranch, Colorado, United States as an author of the technical report entitled “Technical Report and Preliminary Economic Assessment for the La Mina Project, Antioquia, Republic of Colombia” (the “Technical Report”) with an effective date of July 24, 2023 prepared for GoldMining Inc. (the “Issuer”) do hereby certify:
| | 1. | I am currently employed as President by Resource Development Associates Inc., Highlands Ranch, Colorado 80126. |
| | 2. | I graduated with a Bachelor of Arts degree in Geology from the California State University, Sacramento in 1989. |
| | 3. | I am a Certified Professional Geologist and member of the American Institute of Professional Geologists (CPG #10965) and a Registered Member (#4025107) of the Society for Mining, Metallurgy and Exploration, Inc. |
| | 4. | I have been employed as both a geologist and a mining engineer continuously for 34 years. My experience included resource estimation, mine planning, geological modeling, geostatistical evaluations, project development, and authorship of numerous technical reports and preliminary economic assessments of various projects throughout North America, South America and Europe. I have employed and mentored mining engineers and geologists continuously since 2003. |
| | 5. | I have read the definition of “Qualified Person” set out in National Instrument 43-101 (“NI 43-101) and certify that by reason of my education, affiliation with a professional association (as defined in NI 43-101) and past relevant work experience, I fulfill the requirements to be a “Qualified Person” for the purposes of NI 43-101. |
| | 6. | I visited the Project and surrounding area October 12 and 13, 2022. |
| | 7. | I am responsible for all parts of Section 1 through Section 12, Section 14 and 15, Section 18 through Section 20 and Sections 23 through Section 27. |
| | 8. | I am independent of the Issuer as independence is described in Section 1.5 of NI 43-101. |
| | 9. | I have been involved with the property as a qualified person since 2012. |
| | 10. | I have read NI 43-101 and Form 43-101F1, and this Technical Report was prepared in compliance with NI 43-101. |
| | 11. | As of the effective date of this Technical Report, to the best of my knowledge, information and belief, the portions of the Technical Report for which I am responsible contain all scientific and technical information that is required to be disclosed to make the portions of the Technical Report for which I am responsible not misleading. |
Dated: September 6, 2023
[“Signed and Sealed”] | |
Scott E. Wilson, C.P.G. | |
Resource Development Associates Inc.
Effective Date July 24, 2023
GoldMining Inc. NI 43-101 Report – La Mina Project | Page III |
AUTHOR’S CERTIFICATE, PAUL HOSFORD
I, Paul Hosford, P.Eng., of Maple Ridge, BC, Canada, as an author of the technical report entitled “Technical Report and Preliminary Economic Assessment for the La Mina Project, Antioquia, Republic of Colombia” (the “Technical Report”) with an effective date of July 24, 2023 prepared for GoldMining Inc. (the “Issuer”) do hereby certify:
| | 1. | I am currently employed as Principal, PMet Services, BC, Canada. |
| | 2. | I graduated with a Bachelor of Sciences degree in Chemical Engineering from the University of Edinburgh, Scotland in 1982. |
| | 3. | I am a Professional Engineer registered member of the Engineers and Geoscientists of BC, and a member of the Canadian Institute of Mining and Metallurgy. |
| | 4. | I have been employed as both a metallurgical engineer and project manager continuously for a total of 35 years. My experience included metallurgical test work planning and management, process plant design, project development and implementation, and authorship of numerous technical reports and preliminary economic assessments of various projects throughout North America, South America and Africa. |
| | 5. | I have read the definition of “Qualified Person” set out in National Instrument 43-101 (“NI 43-101) and certify that by reason of my education, affiliation with a professional association (as defined in NI 43-101) and past relevant work experience, I fulfill the requirements to be a “Qualified Person” for the purposes of NI 43-101. |
| | 6. | I have not visited the Project site. |
| | 7. | I am responsible for Sections 13, 17, Section 21.1.2 and Section 21.4 of the Technical Report. |
| | 8. | I am independent of the Issuer as independence is described in Section 1.5 of NI 43-101. |
| | 9. | Prior to being retained by the Issuer, I have not had prior involvement with the property that is the subject of the Technical Report. |
| | 10. | I have read NI 43-101 and Form 43-101F1, and this Technical Report was prepared in compliance with NI 43-101. |
| | 11. | As of the effective date of this Technical Report, to the best of my knowledge, information and belief, the portions of the Technical Report for which I am responsible contain all scientific and technical information that is required to be disclosed to make the portions of the Technical Report for which I am responsible not misleading. |
Dated: September 6, 2023
[“Signed and Sealed”] | |
Paul Hosford P. Eng. | |
Resource Development Associates Inc.
Effective Date July 24, 2023
GoldMining Inc. NI 43-101 Report – La Mina Project | Page IV |
AUTHOR’S CERTIFICATE, MICHAEL COLE
I, Michael Cole, SME-Registered Member, of Roanoke, Virginia, United States as an author of the technical report entitled “Technical Report and Preliminary Economic Assessment for the La Mina Project, Antioquia, Republic of Colombia” (the “Technical Report”) with an effective date of July 24, 2023 prepared for GoldMining Inc. (the “Issuer”) do hereby certify:
| | 1. | I am currently employed as Principal Mining Engineer by Mine Planners, Roanoke, Virginia. |
| | 2. | I graduated with a Bachelor of Science degree in Mining and Minerals Engineering from the Virginia Polytechnic Institute and State University in 2005. |
| | 3. | I am a Registered Member (#4130807) of the Society for Mining, Metallurgy and Exploration, Inc. |
| | 4. | I have been employed as a mining engineer continuously for a total of 18 years. My experiences include resource estimation, mine planning, cash-flow analysis and pit optimizations for numerous technical reports and preliminary economic assessments of various projects throughout North America and South America. I have been involved with mine supervision and management in several open pit mining operations, mining equipment purchases and mine construction projects. I have prepared operational mine plans and budgets that have performed as designed. I have held positions of Senior Mining Engineer, Chief Mining Engineer, Mine Planning Manager, Mine Manager and Principal Mining Engineer. |
| | 5. | I have read the definition of “Qualified Person” set out in National Instrument 43-101 (“NI 43-101) and certify that by reason of my education, affiliation with a professional association (as defined in NI 43-101) and past relevant work experience, I fulfill the requirements to be a “Qualified Person” for the purposes of NI 43-101. |
| | 6. | I visited the Project and surrounding area on March 30, 2022. |
| | 7. | I am responsible for Section 16, Section 21 (except for Section 21.1.2 and Section 21.4) and Section 22 of the Technical Report. |
| | 8. | I am independent of the Issuer as independence is described in Section 1.5 of NI 43-101. |
| | 9. | Prior to being retained by the Issuer, I have had prior involvement with the property working for Bellhaven Copper and Gold, the prior issuers on the Property. |
| | 10. | I have read NI 43-101 and Form 43-101F1, and this Technical Report was prepared in compliance with NI 43-101. |
| | 11. | As of the effective date of this Technical Report, to the best of my knowledge, information and belief, the portions of the Technical Report for which I am responsible contain all scientific and technical information that is required to be disclosed to make the portions of the Technical Report for which I am responsible not misleading. |
Dated: September 6, 2023
[“Signed and Sealed”] | |
Michael Cole, SME Registered Member | |
Resource Development Associates Inc.
Effective Date July 24, 2023
GoldMining Inc. NI 43-101 Report – La Mina Project | Page V |
TABLE OF CONTENTS
1.1 | La Mina Mineral Resource Estimate | 19 |
1.2 | Preliminary Economic Assessment | 20 |
1.3 | Mineralization | 22 |
1.4 | Metallurgy | 23 |
1.5 | Conclusions and Recommendations | 23 |
2.1 | Purpose of Technical Report | 25 |
2.1.1 | Personal Inspection | 25 |
2.1.1.1 | Units of Measure - Abbreviations | 25 |
2.1.1.2 | Acronyms and Symbols | 26 |
3 | Reliance on Other Experts | 27 |
4 | Property Description and Location | 28 |
4.1 | Area and Location | 28 |
4.2 | Mineral Tenure | 30 |
4.3 | SurFace Rights Agreements | 31 |
4.4 | General | 32 |
5 | Accessibility, Climate, Local Resources, Infrastructure and Physiography | 33 |
5.1 | Access and Infrastructure | 33 |
5.2 | Physiography | 33 |
5.3 | Climate | 33 |
6.1 | Exploration Prior to 2002 | 34 |
6.2 | Exploration 2002 - 2008 | 34 |
6.3 | AGA Drilling | 36 |
7 | Geological Setting and Mineralization | 37 |
7.1 | Regional Geology | 37 |
7.2 | Property Geology | 40 |
7.3 | Intrusive Rocks | 41 |
7.3.1 | X2 Porphyry (X2) | 43 |
7.3.2 | X1 Porphyry (X1) | 43 |
7.3.3 | X3 Porphyry (x3) | 44 |
7.3.4 | La Cantera Porphyry (C1) | 44 |
7.3.5 | El Limon Porphyry (L1) | 44 |
7.3.6 | El Limon Porphyry (L2) | 45 |
7.3.7 | El limon Porhyry (L3) | 45 |
7.3.8 | G1 Porphyry (G1) | 45 |
7.3.9 | G2 Porphyry (G2) | 46 |
7.3.10 | G4 Porphyry (G4) | 46 |
7.3.11 | Intrusive Breccias | 46 |
Resource Development Associates Inc.
Effective Date July 24, 2023
GoldMining Inc. NI 43-101 Report – La Mina Project | Page VI |
7.4 | Volcanic Rocks | 47 |
7.5 | Structure | 47 |
7.6 | La Cantera Prospect Geology | 48 |
7.7 | La Cantera Prospect Alteration | 50 |
7.8 | La Cantera Prospect Mineralization | 53 |
7.9 | Middle Zone Prospect Geology | 54 |
7.10 | Middle Zone Prospect Alteration | 56 |
7.11 | Middle Zone Propsect Mineralization | 57 |
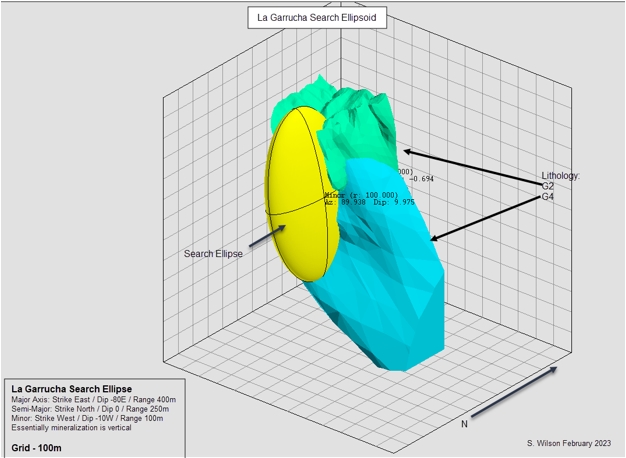
7.12 | La Garrucha Prospect Geology | 59 |
7.13 | La Garrucha Prospect Alteration | 64 |
7.14 | La Garrucha Prospect Mineralization | 65 |
7.15 | El Limon PROSPECT Geology | 65 |
7.16 | El Limon Propsect Alteration | 66 |
7.17 | El Limon Prospect Mineralization | 66 |
8 | Deposit Types | 67 |
9 | Exploration | 68 |
10 | Drilling | 72 |
10.1 | La Cantera Drilling | 72 |
10.2 | Middle Zone Drilling | 75 |
10.3 | La Garrucha Drilling | 77 |
10.4 | El Limon Drilling | 79 |
10.5 | Trenching | 80 |
10.6 | Rock Sampling and Soil Geochemistry | 80 |
11 | Sample Preparation, Analyses, and Security | 81 |
11.1 | Sample preparation Prior to 2022 | 81 |
11.2 | 2022 Sample Preparation Procedures | 82 |
11.3 | Standard, Blank, and Duplicate Samples | 83 |
11.3.1 | Standard, Blank, and Duplicate Samples Prior to 2022 | 83 |
11.3.2 | Standard Results Subsequent to LMDDH-010 | 84 |
11.3.3 | Blank results Prior to 2022 | 97 |
11.3.4 | Duplicate Types and results Prior to 2022 | 103 |
11.3.4.1 | Independent Check Assay Program | 106 |
11.4 | Goldmining Standard, Blank and Duplicate Samples | 109 |
11.4.1 | Goldmining Standard Results | 110 |
11.4.2 | GoldMining Blank Results | 113 |
11.4.3 | GoldMining Duplicate Types and results | 115 |
11.5 | GoldMining Independent Check Assay Program | 118 |
11.6 | Summary of QA/QC Program | 120 |
12.1 | Current Inspection and Data Validation | 123 |
12.2 | Verification Check Samples | 123 |
13 | Mineral Processing and Metallurgical Testing | 134 |
Resource Development Associates Inc.
Effective Date July 24, 2023
GoldMining Inc. NI 43-101 Report – La Mina Project | Page VII |
13.1 | Summary | 134 |
13.2 | Metallurgy Introduction | 135 |
13.3 | Metallurgical Test Work | 136 |
13.3.1 | Sample Preparation and Characterization | 136 |
13.4 | In-Place Bulk Densities | 137 |
13.5 | Ball Mill Work Indicies | 137 |
13.6 | Gravity Tests | 137 |
13.7 | Whole Ore Cyanidation Leach tests | 138 |
13.8 | Flotation Tests | 139 |
13.9 | ALS Metallurgical test Program (2022) | 145 |
13.9.1 | Characteristics of the Samples | 145 |
13.9.1.1 | Ore Hardness | 145 |
13.9.1.2 | Chemical and Mineral Content | 145 |
13.9.1.3 | Mineral Fragmentation | 147 |
13.9.2 | Test Results | 148 |
13.9.2.1 | Rougher Flotation Tests | 149 |
13.9.2.2 | Cleaner Flotation Tests | 151 |
13.9.2.3 | Whole ROCK Cyanidation Tests | 153 |
13.9.2.4 | Flotation Tail Cyanidation Tests | 155 |
13.10 | Conclusions | 157 |
13.11 | Recommendations | 158 |
14 | Mineral Resource Estimates | 159 |
14.1 | La Cantera Mineral Resource Estimate | 159 |
14.1.1 | Database for Geologic Model | 159 |
14.1.2 | Geologic Model | 163 |
14.1.3 | Topography | 169 |
14.1.4 | Block Model | 169 |
14.1.5 | Grade Estimation | 172 |
14.1.6 | Block Model Validation | 176 |
14.1.7 | Density | 176 |
14.1.8 | Inferred and Indicated Mineral Resources | 176 |
14.2 | Middle Zone Mineral Resource Estimate | 178 |
14.2.1 | Database for Geologic Model | 178 |
14.2.2 | Geologic Model | 183 |
14.2.3 | Topography | 190 |
14.2.4 | Block Model | 190 |
14.2.5 | Grade Estimation | 192 |
14.2.6 | Density | 195 |
14.2.7 | Pit Constraining Optimization Criteria | 195 |
14.2.8 | Inferred and Indicated Mineral resources | 195 |
14.3 | La Garrucha Mineral Resource Estimate | 197 |
Resource Development Associates Inc.
Effective Date July 24, 2023
GoldMining Inc. NI 43-101 Report – La Mina Project | Page VIII |
14.3.2 | Data Analysis | 197 |
14.3.3 | Grade Capping – Handling of Outliers | 200 |
14.3.4 | Compositing | 203 |
14.3.5 | Cell Declustering | 206 |
14.3.6 | Contact Profile Analysis | 209 |
14.3.7 | Anisotropy | 212 |
14.3.8 | Block Model | 212 |
14.3.9 | Grade Estimation | 213 |
14.3.10 | Model Validation | 213 |
14.3.11 | Density | 216 |
14.3.12 | Pit Constraining Optimization Criteria | 216 |
14.3.13 | Inferred and Indicated Mineral resources | 216 |
14.4 | La Mina Mineral Resources | 217 |
15 | Mineral Reserve Estimates | 219 |
16 | Mining Methods | 220 |
16.1 | Geotechnical and Hydrological Considerations | 220 |
16.2 | Mine Optimization | 220 |
16.3 | Pre-Stripping Requirements | 220 |
16.4 | Mine Production Schedule | 221 |
16.5 | Mine Configuration | 225 |
16.5.1 | Waste Rock Storage Facilities | 225 |
16.6.1 | Drilling and Blasting | 226 |
16.6.2 | Loading and Hauling | 227 |
16.6.3 | Support Equipment | 228 |
17.1 | Process Plant | 229 |
17.2 | Operating Schedule and Availability | 230 |
17.3 | Processing Facilities | 230 |
17.3.1 | Primary Crushing and coarse ore stockpile | 230 |
17.3.2 | Grinding Circuit | 231 |
17.3.3 | Flotation and Regrind | 231 |
17.3.4 | Copper Concentrate Thickening, Filtration and Handling | 232 |
17.3.5 | Cyanide Leach, Gold Adsorption, Stripping and Carbon Handling. | 232 |
17.4 | Process plant Tails | 232 |
17.5 | Reagent Handling and Storage | 232 |
17.6 | Process Plant Service Systems | 233 |
18 | Project Infrastructure | 234 |
18.1 | Access | 234 |
18.2 | Power | 234 |
18.3 | Labor | 234 |
18.4 | Water | 234 |
Resource Development Associates Inc.
Effective Date July 24, 2023
GoldMining Inc. NI 43-101 Report – La Mina Project | Page IX |
18.5 | Security | 235 |
18.6 | Waste Rock Disposal | 235 |
18.7 | Tailings Disposal | 235 |
19 | Market Studies and Contracts | 236 |
20 | Environmental Studies, Permitting and Social or Community | 237 |
21 | Capital and Operating Costs | 238 |
21.1 | Initial Capital Cost Estimate | 238 |
21.1.1 | Pre-Stripping | 238 |
21.1.2 | Processing Plant Initial Capital | 239 |
21.2 | Sustaining Capital Cost Estimate | 240 |
21.3 | Mining Operating Cost | 242 |
21.4 | Processing Operating Cost | 243 |
21.5 | G&A Costs | 243 |
22.1 | Key Performance Parameters | 244 |
22.2 | Taxes, royalties and Other Interests | 245 |
22.3 | Cash Flow | 246 |
22.4 | Sensitivity | 248 |
22.5 | Cash Costs | 250 |
23 | Adjacent Properties | 251 |
24 | Other Relevant Data and Information | 252 |
25 | Interpretation and Conclusions | 253 |
25.1 | Preliminary Economic Assessment | 253 |
25.2 | Metallurgy | 253 |
25.3 | Mining | 254 |
26.1 | Resource Development | 255 |
26.2 | Metallurgical Testing | 255 |
Resource Development Associates Inc.
Effective Date July 24, 2023
GoldMining Inc. NI 43-101 Report – La Mina Project | Page X |
LIST OF TABLES
Table 1‑1 La Mina Mineral Resource Estimate (Effective Date December 20, 2022. Qualified Person: Scott Wilson CPG. Cut-off Grade 0.30 g/t Au) | 20 |
Table 1‑2 PEA Financial Summary | 21 |
Table 1‑3 PEA Technical Summary | 21 |
Table 1‑4 PEA Production and Payable Metal Summary | 22 |
Table 1‑5 Proposed Phase 1 Work Program to advance La Mina | 24 |
Table 4‑1 La Mina Property Ownership | 31 |
Table 6‑1 AGA Drill Results | 36 |
Table 7‑1 Lithological Descriptions | 43 |
Table 9‑1 Drilling Completed by Bellhaven at La Mina | 69 |
Table 10‑1 La Cantera Drilling - All Holes | 75 |
Table 10‑2 La Cantera Deposit Significant Intercepts Through February 2012 | 75 |
Table 10‑3 Middle Zone Collar Surveys | 76 |
Table 10‑4 Middle Zone deposit Drilling Subsequent to the 2012 Resource | 78 |
Table 10‑5 La Garrucha Drill Holes Location and Depth | 78 |
Table 10‑6 La Garrucha Significant Drill Core Intercepts | 79 |
Table 10‑7 El Limon Drill Holes and Locations | 80 |
Table 10‑8 El Limon Significant Drill Intercepts | 81 |
Table 11‑1 Certified Reference Material | 111 |
Table 12‑1 2022 Site Visit Data Verification Samples | 124 |
Table 13‑1 Description of Composite Samples | 137 |
Table 13‑2 Head Analysis of Bellhaven Samples | 137 |
Table 13‑3 Proportion of Different Forms of Copper in the Bellhaven Samples | 137 |
Table 13‑4 ICP Analyses of Composite Samples | 137 |
Table 13‑5 Bond's Ball Mill Work Index @ 150 µm. | 138 |
Table 13‑6 Cyanidation Leach Test Results (P80 = 75 µm) | 139 |
Table 13‑7 Carbon-in-Leach (CIL) Test Results | 139 |
Table 13‑8 Flotation Process Test Parameters | 141 |
Table 13‑9 Flotation Test Results for Composite No. 1 | 142 |
Table 13‑10 Flotation Test Results for Composite No. 2 | 143 |
Table 13‑11 Flotation Test Results for Composite No. 3 | 144 |
Table 13‑12 Flotation Test Results for Composite No. 4 | 145 |
Resource Development Associates Inc.
Effective Date July 24, 2023
GoldMining Inc. NI 43-101 Report – La Mina Project | Page XI |
Table 13‑13 Head Assays - CuOx represents Cu solubilized in a weak sulphuric acid digestion, CuCN by sodium cyanide digestion | 147 |
Table 13‑14 Mineral Content | 147 |
Table 13‑15 Concentrate ICP Analysis | 152 |
Table 14‑1 La Mina Block Model Details | 171 |
Table 14‑2 Parameters for Ordinary Kriging Based on Nested Variography | 173 |
Table 14‑3 Cut-Off grade and Pit Constraining Parameters | 178 |
Table 14‑4 Pit Constrained Mineral Resources for La Cantera | 178 |
Table 14‑5 Mineral Resources at 0.30 g/t Cut-off for La Cantera. Effective Date December 20, 2022, Qualified Person Scott Wilson | 179 |
Table 14‑6 Total Project Drill Holes | 179 |
Table 14‑7 La Mina Block Parameters | 192 |
Table 14‑8 Middle Zone Capping Criteria | 194 |
Table 14‑9 Pit Constrained Resources for Middle Zone | 198 |
Table 14‑10 Total Resources with 0.30 g/t Cut-off for Middle Zone. Effective Date December 20, 2022, Qualified Person Scott Wilson | 198 |
Table 14‑11 Total Project Drill Holes | 199 |
Table 14‑12 Mineralized assay statistics for La Garrucha | 199 |
Table 14‑13 La Garrucha Assay Capping Statistics | 202 |
Table 14‑14 Model extents | 214 |
Table 14‑15 Comparison of NN estimates to IDW estimates for the 2023 MRE | 216 |
Table 14‑16 Pit Metal sensitivities for La Garrucha | 220 |
Table 14‑17 Mineral Resources at a 0.30g/t Cut-off for the La Garrucha MRE. Effective Date December 20, 2022, Qualified Person Scott Wilson | 220 |
Table 14‑18 Pit Constrained Sensitivity Estimates for the La Mina Project (La Cantera, Middle Zone and La Garrucha Combined) | 221 |
Table 14‑19 Total Indicated and Inferred Resources for La Mina Project (Cut-off Grade 0.30 g/t Au) Effective Date December 20, 2022, Qualified Person Scott Wilson | 221 |
Table 16‑1 Whittle Parameters | 223 |
Table 16‑2 Mine Schedule including Stripping. | 225 |
Table 16‑3 Mine Schedule and Annual Mill Feed Grades by Pit | 226 |
Table 16‑4 Mill Feed | 226 |
Table 16‑5 Breakdown of Resource Classification within the Mine Plan | 227 |
Table 16‑6 Mining Fleet Requirements | 229 |
Table 16‑7 Drill and Blast Parameters | 230 |
Resource Development Associates Inc.
Effective Date July 24, 2023
GoldMining Inc. NI 43-101 Report – La Mina Project | Page XII |
Table 21‑1 Initial Capital Costs | 241 |
Table 21‑2 Pre-Stripping Initial Capital Costs | 242 |
Table 21‑3 Processing Plant Initial Capital | 243 |
Table 21‑4 Total Sustaining Capital | 243 |
Table 21‑5 Mining Equipment Capital Costs | 244 |
Table 21‑6 Mining Operational Sustaining Capital Costs | 245 |
Table 21‑7 Mining Peak Labor Headcount and Average LOM Operating Cost Summary | 245 |
Table 21‑8 Summary Process Operating Cost Estimate | 246 |
Table 22‑1 La Mina Project Key Parameters and Assumptions | 247 |
Table 22‑2 Project Royalties | 248 |
Table 22‑3 Annual Material Movement, Metal Production and Gross Revenue | 250 |
Table 22‑4 Annual Cash Flow | 250 |
Table 22‑5 Economic Results | 251 |
Table 22‑6 Sensitivity of Estimated NPV and IRR (After-Tax) to Variation in Gold Price | 251 |
Table 22‑7 Cash Costs | 253 |
Table 25‑1 NPV and IRR Sensitivity to Gold Price, After-Tax | 256 |
Table 26‑1 Proposed Phase 1 Work Program to advance La Mina | 258 |
Table 26‑2 Future Metallurgical Test Work Cost Estimate | 259 |
Resource Development Associates Inc.
Effective Date July 24, 2023
GoldMining Inc. NI 43-101 Report – La Mina Project | Page XIII |
LIST OF FIGURES
Figure 4‑1 La Mina Property, Colombia | 29 |
Figure 4‑2 La Mina Project Location and Access Map | 30 |
Figure 6‑1 Portion of Aerial Magnetics. Illustrates the prominent magnetic features interpreted from aerial geophysics flown by the Avasca Joint venture in 2007. The high magnetic response of the La Cantera porphyry stock, at the southern end of the red rectangular block, is clearly visible. | 35 |
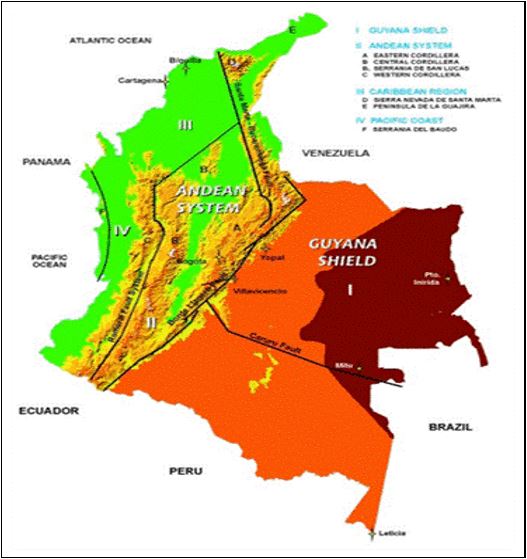
Figure 7‑1 Geomorphological Regions of Colombia Showing the Approximate Location of La Mina | 37 |
Figure 7‑2 Tectonic Map of Colombia | 39 |
Figure 7‑3 Generalized Geologic Map of the La Mina Project Area | 41 |
Figure 7‑4 Surface Geology of the La Cantera Prospect Showing the Location of the Drill Holes | 49 |
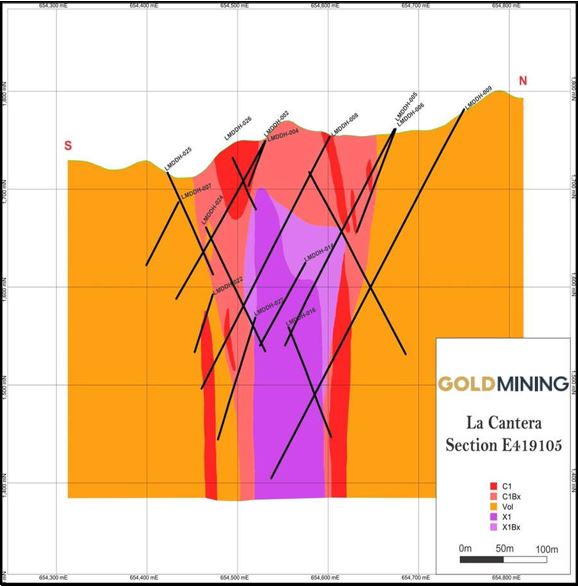
Figure 7‑5 North-South Cross Section (Looking West) of Geology through the La Cantera Deposit | 50 |
Figure 7‑6 LMDDH-008-288m. C1 Porphyry with Pervasive Biotite-Magnetite Alteration of the Matrix and Actinolite Alteration of Primary Magmatic Mafic Phenocrysts | 51 |
Figure 7‑7 LMDDH-016 392.5m. C1 Breccia with Potassic Alteration (Magnetite-k-Feldspar +/- Actinolite) Cut by Sheeted Magnetite Veins, Quartz Magnetite Stockwork Veins and Late Pyrite-filled Fractures | 52 |
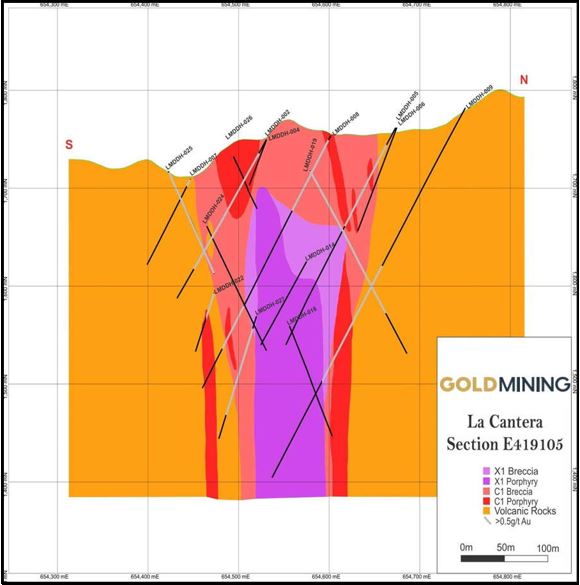
Figure 7‑8 Drill Hole Intercepts with >0.5g/t Au in the La Cantera Prospect | 54 |
Figure 7‑9 Surface Geology and Drill Holes Used in Resource Estimate at Middle Zone Prospect | 56 |
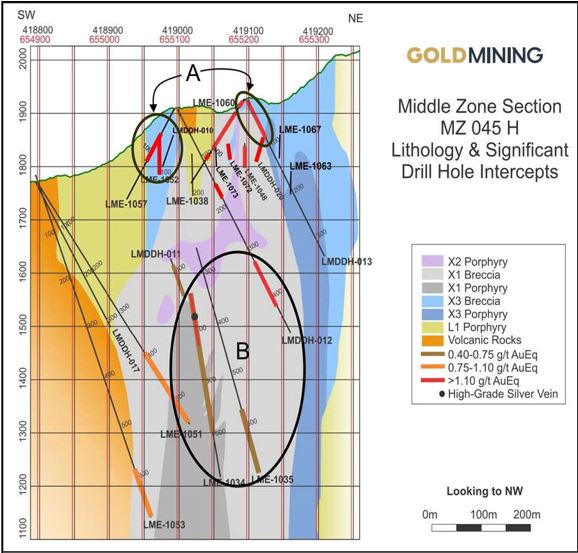
Figure 7‑10 NE-SW Cross Section through Middle Zone, Showing Significant Intercepts. Labels A and B Refer to the Two Distinct Mineralization Types | 58 |
Figure 7‑11 Surface Geology of Drill Holes at La Garrucha | 60 |
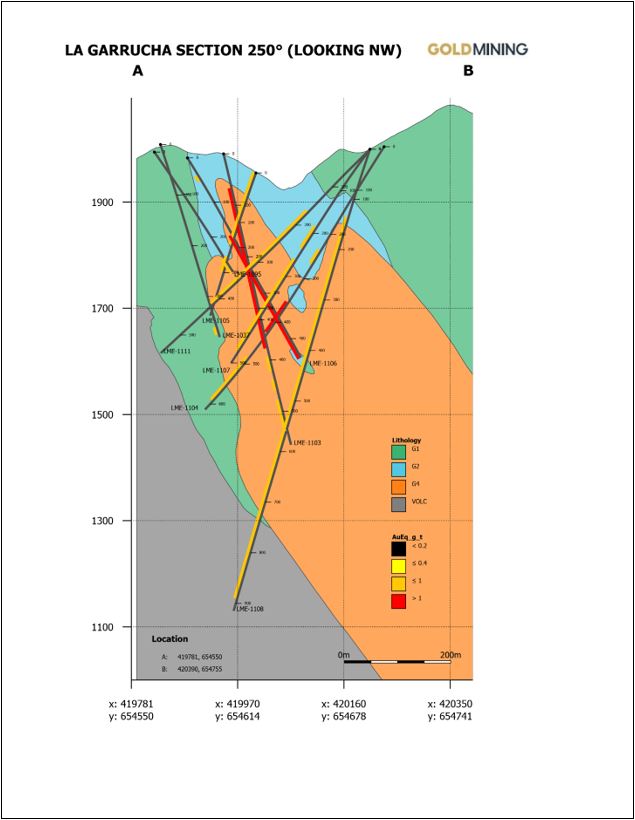
Figure 7‑12 NE-SW La Garrucha Cross Section | 61 |
Figure 7‑13 NE-SW La Garrucha Cross Section | 63 |
Figure 7‑14 El Limon Prospect Geology | 66 |
Figure 9‑1 Exploration Targets at La Mina Project | 70 |
Figure 9‑2 Magnetic Susceptibility Model at 100 m Depth. | 72 |
Figure 10‑1 La Mina Drill Collar Monuments | 74 |
Figure 11‑1 Reference Material CU156 Performance for Au | 86 |
Figure 11‑2 Reference Material CU157 Performance for Au | 86 |
Figure 11‑3 Reference Material CU158 Performance for Au | 87 |
Figure 11‑4 Reference Material CU159 Performance for Au | 87 |
Figure 11‑5 Reference Material CU164 Performance for Au | 88 |
Figure 11‑6 Reference Material CU175 Performance for Au | 88 |
Figure 11‑7 Reference Material CU184 Performance for Au | 89 |
Resource Development Associates Inc.
Effective Date July 24, 2023
GoldMining Inc. NI 43-101 Report – La Mina Project | Page XIV |
Figure 11‑8 Reference Material CM13 Performance for Au | 89 |
Figure 11‑9 Reference Material CM14 Performance for Au | 90 |
Figure 11‑10 Reference Material CGS27 Performance for Au | 90 |
Figure 11‑11 Reference Material PM434 Performance for Au | 91 |
Figure 11‑12 Reference Material PM436 Performance for Au | 91 |
Figure 11‑13 Reference Material PM438 Performance for Au | 92 |
Figure 11‑14 Reference Material PM446 Performance for Au | 92 |
Figure 11‑15 Reference Material PM447 Performance for Au | 93 |
Figure 11‑16 Reference Material CU156 Performance for Cu | 93 |
Figure 11‑17 Reference Material CU157 for Cu | 94 |
Figure 11‑18 Reference Material CU158 Performance for Cu | 94 |
Figure 11‑19 Reference Material CU159 Performance for Cu | 95 |
Figure 11‑20 Reference Material CU164 Performance for Cu | 95 |
Figure 11‑21 Reference Material CU175 Performance for Cu | 96 |
Figure 11‑22 Reference Material CU184 Performance for Cu | 96 |
Figure 11‑23 Reference Material CM13 Performance for Cu | 97 |
Figure 11‑24 Reference Material CM14 Performance for Cu | 97 |
Figure 11‑25 Reference Material CGS27 Performance for Cu | 98 |
Figure 11‑26 Reference Material - Blank BL110 Performance for Au | 99 |
Figure 11‑27 Reference Material - Blank BL111 Performance for Au | 99 |
Figure 11‑28 Reference Material - Blank BL112 Performance for Au | 100 |
Figure 11‑29 Reference Material - Blank BL113 Performance for Au | 100 |
Figure 11‑30 Reference Material - Blank BL115 Performance for Au | 101 |
Figure 11‑31 Reference Material - Blank BL110 Performance for Cu | 101 |
Figure 11‑32 Reference Material - Blank BL111 Performance for Cu | 102 |
Figure 11‑33 Reference Material - Blank BL112 Performance for Cu | 102 |
Figure 11‑34 Reference Material - Blank BL113 Performance for Cu | 103 |
Figure 11‑35 Reference Material - Blank BL115 Performance for Cu | 103 |
Figure 11‑36 Au Analyses (FA AA) for Preparation Duplicate Samples | 104 |
Figure 11‑37 Au Analyses (FA AA) for Preparation Duplicate Samples | 105 |
Figure 11‑38 Au Analyses (FA AA) for Preparation Duplicate Samples | 105 |
Figure 11‑39 Cu Analyses (ICP-AES) for Preparation Duplicate Samples | 106 |
Figure 11‑40 Cu Analyses (ICP-AES) for Preparation Duplicate Samples | 106 |
Resource Development Associates Inc.
Effective Date July 24, 2023
GoldMining Inc. NI 43-101 Report – La Mina Project | Page XV |
Figure 11‑41 Cu Analyses (ICP-AES) for Preparation Duplicate Samples | 107 |
Figure 11‑42 Original vs Check Sample Comparison for Middle Zone - Au The Blue Dotted lines are +/- 10% from the Mean | 108 |
Figure 11‑43 Original vs Check Sample Comparison for Middle Zone - Cu The Blue Dotted Lines are +/- 10% from the Mean | 109 |
Figure 11‑44 Original Assays vs Rechecks - with Outliers Rejected | 110 |
Figure 11‑45 Reference Material BH12002X Performance for Au | 112 |
Figure 11‑46 Reference Material BH12002X Performance for Cu | 112 |
Figure 11‑47 Reference Material BH12003X Performance for Au | 113 |
Figure 11‑48 Reference Material BH12003X Performance for Cu | 113 |
Figure 11‑49 Reference Material BH12004X Performance for Au | 114 |
Figure 11‑50 Reference Material BH12004X Performance for Cu | 114 |
Figure 11‑51 Reference Material - Blank BH12001X Performance for Au | 115 |
Figure 11‑52 Reference Material - Blank BH12001X Performance for Cu | 115 |
Figure 11‑53 Core Blank Performance for Au | 116 |
Figure 11‑54 Core Blank Performance for Cu | 116 |
Figure 11‑55 Au Analyses (FA AA) for GMI Field Duplicate Samples | 117 |
Figure 11‑56 Cu Analyses (ICP) for GMI Field Duplicate Samples | 117 |
Figure 11‑57 Au Analyses (FA AA) for GMI Preparation Coarse Duplicate Samples | 118 |
Figure 11‑58 Cu Analyses (ICP) for GMI Preparation Coarse Duplicate Samples | 118 |
Figure 11‑59 Au Analyses (FA AA) for GMI Preparation Pulp Duplicate Samples | 119 |
Figure 11‑60 Cu Analyses (ICP) for GMI Preparation Pulp Duplicate Samples | 119 |
Figure 11‑61 Original vs Independent Check Assay Comparison for GMI drilling at La Garrucha – Au | 120 |
Figure 11‑62 Original vs Independent Check Sample Comparison for GMI drilling at La Garrucha – Cu | 120 |
Figure 11‑63 Changes in the Magnitude of Difference between Standards and Blanks for Copper Plotted against Date of Analysis | 123 |
Figure 12‑1 Gravel road from Fredonia town to La Mina Project | 125 |
Figure 12‑2 Gate at the entrance of the facilities provides security to the drill cores, and other reliable information | 126 |
Figure 12‑3 Geology office and accommodation house | 126 |
Figure 12‑4 Electricity supply by regional grid interconnection | 127 |
Figure 12‑5 Warehouse drill-core storage | 128 |
Figure 12‑6 Pulp rejects storage | 129 |
Figure 12‑7 Core shed for core logging and sampling | 130 |
Resource Development Associates Inc.
Effective Date July 24, 2023
GoldMining Inc. NI 43-101 Report – La Mina Project | Page XVI |
Figure 12‑8 Technician demonstrating core cutting procedures | 131 |
Figure 12‑9 Core logging facilities | 132 |
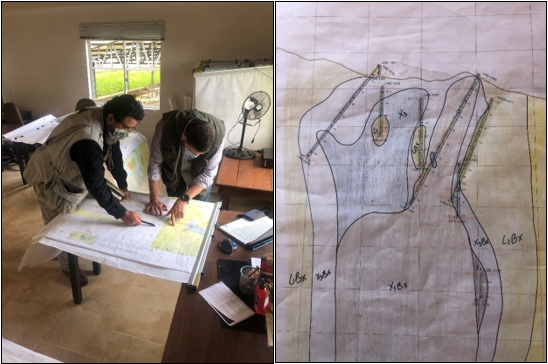
Figure 12‑10 and Figure 12‑11 Geology and model review by plan view and systematic sections – La Mina, Fredonia | 132 |
Figure 12‑12 Well organized core trays storage | 133 |
Figure 12‑13 ¼-core for duplicate checks ready for sampling as prepared under the supervision of the QP during the current site visit | 134 |
Figure 13‑1 Particle Mineral Analysis | 149 |
Figure 13‑2 Rougher Flotation Flowsheet | 151 |
Figure 13‑3 Cleaner Kinetics Flowsheet | 153 |
Figure 13‑4 Whole Ore Cyanidation Results | 155 |
Figure 13‑5 Flotation Tail Cyanidation Results | 157 |
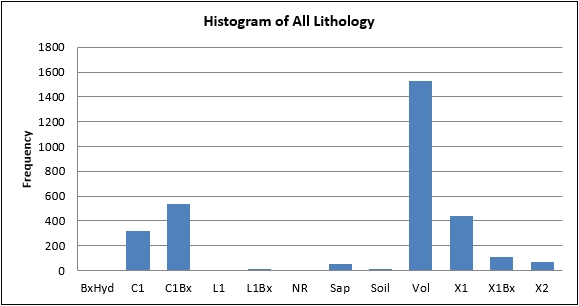
Figure 14‑1 Distribution of Lithology | 161 |
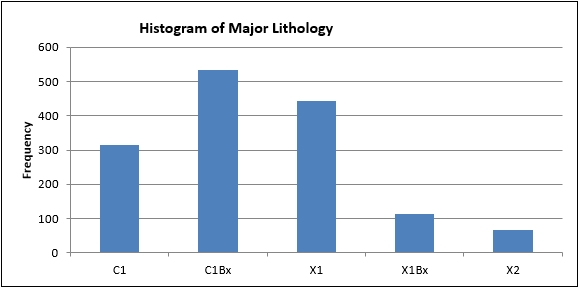
Figure 14‑2 Distribution of Major Lithologies at La Cantera | 161 |
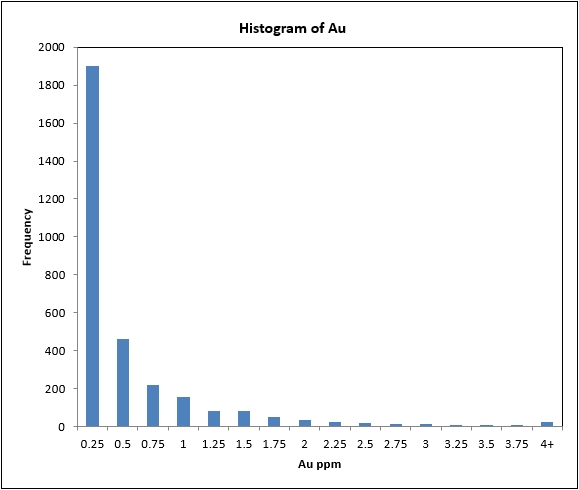
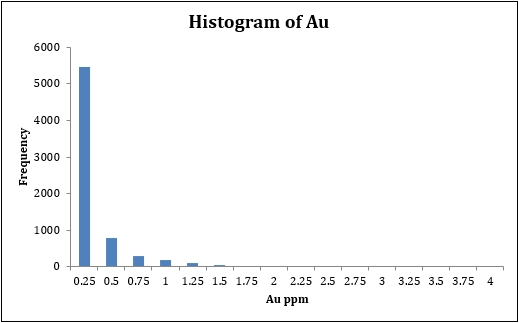
Figure 14‑3 Incremental Histogram for La Cantera Gold Data | 162 |
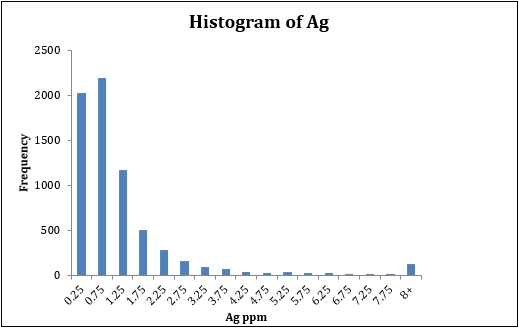
Figure 14‑4 Incremental Histogram for La Cantera Silver Data | 163 |
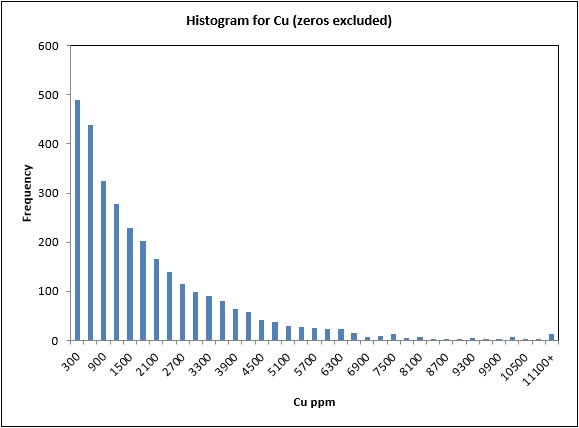
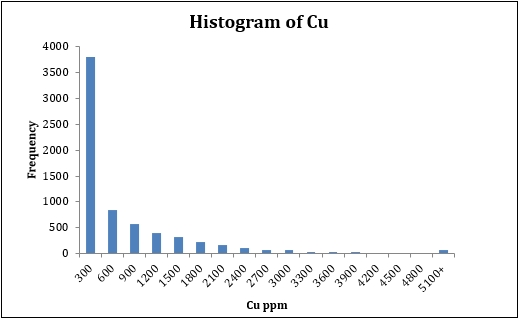
Figure 14‑5 Incremental Histogram for La Cantera Copper Data | 164 |
Figure 14‑6 Bellhaven Geologic Interpretation Section LC419105 | 166 |
Figure 14‑7 Bellhaven Sections with Geologic Interpretation for La Cantera | 167 |
Figure 14‑8 Bench Section Profiles of C and X in Vulcan | 168 |
Figure 14‑9 Bench Section Profiles Including Volcanic Buffer | 169 |
Figure 14‑10 Wireframes of C, X and Volcanic Boundaries | 170 |
Figure 14‑11 Block Model Showing Lithology of La Cantera | 172 |
Figure 14‑12 La Cantera Ellipsoids | 174 |
Figure 14‑13 La Cantera Block Model Slice Showing Pit Constrained Au Estimated Grades | 175 |
Figure 14‑14 La Cantera Block Slice Showing Pit Constrained Cu Estimated Grades | 176 |
Figure 14‑15 Plan View of Middle Zone Drilling | 180 |
Figure 14‑16 Isometric View of Middle Zone Drilling | 181 |
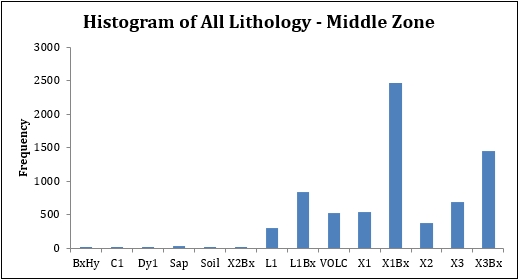
Figure 14‑17 Distribution of Lithology - Middle Zone | 182 |
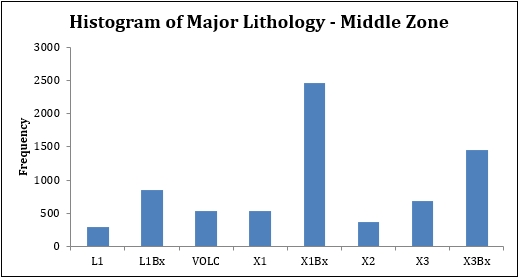
Figure 14‑18 Distribution of Major Lithologies - Middle Zone | 182 |
Figure 14‑19 Histogram for Middle Zone Gold Data | 183 |
Figure 14‑20 Histogram of Silver Data - Middle Zone | 183 |
Figure 14‑21 Cu Histogram Distribution | 184 |
Figure 14‑22 Bellhaven Geologic Interpretation Section MZ_315_J | 186 |
Resource Development Associates Inc.
Effective Date July 24, 2023
GoldMining Inc. NI 43-101 Report – La Mina Project | Page XVII |
Figure 14‑23 Middle Zone Sections with Geologic Interpretation | 187 |
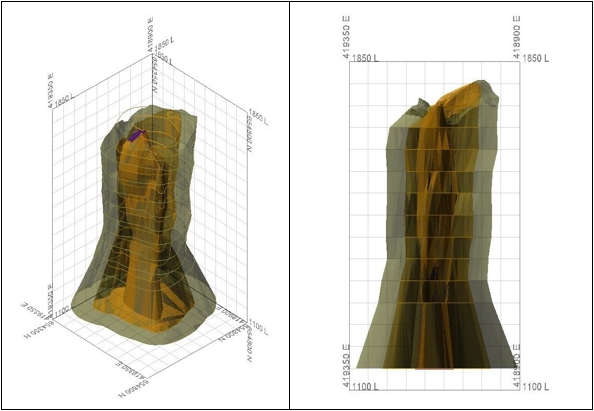
Figure 14‑24 Bench Section Profiles of X1, X2 and X3 | 188 |
Figure 14‑25 Bench Section Profiles including L1 and Volcanic Lithologies | 189 |
Figure 14‑26 Wireframes of X1, X2 and X3 Boundaries | 190 |
Figure 14‑27 Wireframes of L1, Volc, X3 and X1 Boundaries | 191 |
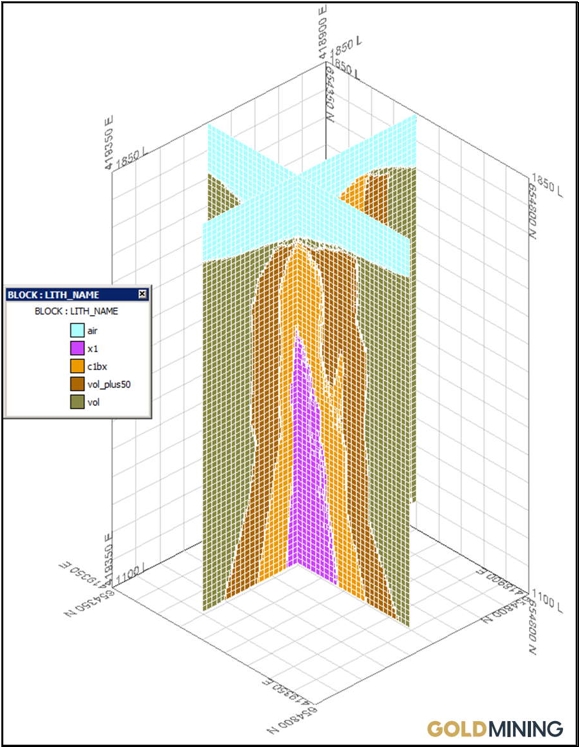
Figure 14‑28 Block Model showing Lithology of Middle Zone | 193 |
Figure 14‑29 Middle Zone Block Model Slice showing Pit Constrained Au Estimated Grades | 195 |
Figure 14‑30 Middle Zone Block Model Slice Showing Pit Constrained Cu Estimated Grades | 196 |
Figure 14‑31 Uncapped gold grade distribution by lithologic unit | 200 |
Figure 14‑32 Uncapped copper grade distribution by lithologic unit | 201 |
Figure 14‑33 Uncapped silver grade distribution by lithologic unit | 202 |
Figure 14‑34 Capped Au Assay Box Plot Statistics | 203 |
Figure 14‑35 Capped Cu Assay Box Plot Statistics | 204 |
Figure 14‑36 Capped Ag Assay Box Plot Statistics | 205 |
Figure 14‑37 Composite Au Box Plot Statistics | 206 |
Figure 14‑38 Composite Cu Box Plot Statistics | 207 |
Figure 14‑39 Composite Ag Box Plot Statistics | 208 |
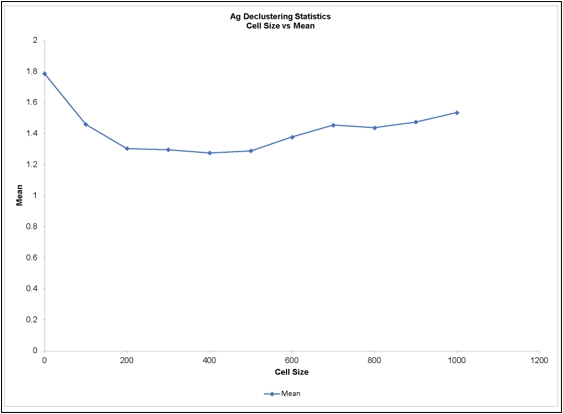
Figure 14‑40 La Garrucha Au declustering results | 209 |
Figure 14‑41 La Garrucha Au declustering results | 210 |
Figure 14‑42 La Garrucha Au declustering results | 211 |
Figure 14‑43 Gold Contact profile between G1 and G2 | 212 |
Figure 14‑44 Gold Contact between G2 and G4 | 212 |
Figure 14‑45 Copper Contact profile between G1 and G2 | 213 |
Figure 14‑46 Copper Contact between G2 and G4 | 213 |
Figure 14‑47 La Garrucha Anisotropy | 214 |
Figure 14‑48 Visual comparison of composite database with estimated Au grades for La Garrucha | 216 |
Figure 14‑49 Scattergram comparing global estimated Au grade to composite database Au values | 218 |
Figure 14‑50 Scattergram comparing global estimated Cu grade to composite database Cu values | 218 |
Figure 14‑51 Scattergram comparing global estimated Ag grade to composite database Ag values | 219 |
Figure 16‑1 Graph of Yearly Mine Schedule and Strip Ratio | 224 |
Figure 16‑2 Graph of Yearly Mill Feed by Pit and Head Grade | 225 |
Figure 16‑3 Pit Locations and Conceptual Site Layout | 228 |
Figure 16‑4 Equipment Requirements by Year | 231 |
Resource Development Associates Inc.
Effective Date July 24, 2023
GoldMining Inc. NI 43-101 Report – La Mina Project | Page XVIII |
Figure 17‑1 Process Flow Schematic | 233 |
Figure 22‑1 Sensitivity of Estimated NPV @ 5% After-Tax for Changes in Costs and Metal Prices | 252 |
Figure 22‑2 Sensitivity of Estimated IRR After-Tax for Changes in Costs and Metal Prices | 252 |
Resource Development Associates Inc.
Effective Date July 24, 2023
GoldMining Inc. NI 43-101 Report – La Mina Project | Page 19 |
The La Mina property consists of two concession contracts and two concession contract applications located in the Department of Antioquia, Republic of Colombia, South America. GoldMining Inc. (“GoldMining”) owns the property through its wholly owned subsidiary, Bellhaven Copper & Gold Inc. (“Bellhaven”) which in turn owns the property through its wholly-owned Colombian subsidiary Bellhaven Exploraciones Sucursal Colombia ("Bellhaven Exploraciones"); formerly Aurum Exploration Inc. Colombia. GoldMining announced on May 30, 2017 that it completed the acquisition of Bellhaven by way of a plan of arrangement pursuant to an arrangement agreement between the parties dated April 11, 2017.
Bellhaven acquired its first exploration license by entering into an earn-in agreement in mid-2010 to acquire 80% of the mineral rights of a 1,794-hectare license over a four-year period with the option to acquire the remaining 20% on the basis of an ounces-in-reserve formula defined by the earn-in agreement. The option agreement has been since modified several times by mutual consent and Bellhaven currently owns 100% of the La Mina Concession. This exploration license turned into a concession contract on August 5, 2020. The second concession contract, called the La Garrucha concession, is 1,416 hectares in size and occurs immediately to the east and north of the La Mina concession. It was acquired in 2013 from the wholly-owned Colombian subsidiary of AngloGold Ashanti Corporation, AngloGold Ashanti Colombia S.A. through an earn-in agreement based on total expenditures over a three-year period. This agreement was later renegotiated in March 2015, resulting in Bellhaven acquiring the La Garrucha concession for cash payments summing to US$ 290,000.
The La Mina project area forms a contiguous irregular shaped 3,210 hectares block centered at 5°55'19"N and 75°44'42"W. Geographically, the mineral title is located within the Municipalities of Venecia and Fredonia, Department of Antioquia, 51 km SW of the Colombian city of Medellin.
La Mina is located overlooking the Cauca River valley, along the western margin of Colombia's physiographic Central Cordillera. The topography of the region is mountainous, characterized by high-relief, vegetated mountains, and steeply incised active drainages. The geological evolution of the region is complex, and is characterized by compressional Meso-Cenozoic tectonics associated with Northern Andean Block assembly along the Cauca-Romeral fault and suture system. The accretion of various allochthonous terranes in western Colombia during the Miocene resulted in deformation, uplift, magmatism and erosion. Mineralization at La Mina is genetically linked to the emplacement of a cluster of Miocene-aged hypabyssal porphyry stocks. Magmatic-hydrothermal Au-(Cu) and Au-Ag (Pb, Zn, Cu) deposit types are spatially and temporally associated with the hydrothermal evolution of the porphyry stocks.
In 2022 GoldMining completed a 3,485-metre diamond core drilling program on the La Garrucha prospect with the objective to explore to the southeast along strike for extensions to the porphyry mineralization previously identified by Bellhaven. This report includes the 2022 drilling in an updated mineral resource estimate. In 2023 the concession contracts were integrated into one approved by resolution No. 2023060083727 from the Secretary of Mines of Antioquia.
1.1 | LA MINA MINERAL RESOURCE ESTIMATE |
A cut-off grade of 0.30 g/t Au gold was used to derive the mineral resources for La Mina. The Company and previous operators have maintained a strong quality assurance and quality control program, which has validated the accuracy and precision of the assay data. Bellhaven also advanced its knowledge of the metallurgical characteristics of the La Mina mineralization, as reported in November 2011 and 2013, subsequent to the maiden Inferred Resource, and in September 2016.
Resource Development Associates Inc.
Effective Date July 24, 2023
GoldMining Inc. NI 43-101 Report – La Mina Project | Page 20 |
A portion of La Mina mineralization has been categorized as Indicated Mineral Resources. The drill density and the confidence in the mineralization has allowed for a portion of the La Cantera, Middle Zone and La Garrucha mineral resources to be classified in the Indicated category. Indicated Mineral Resources for the La Mina project are reported in Table 1‑1. Inferred Mineral Resources for the La Mina Project is reported in Table 1‑2. These Mineral Resources conform to the definitions in the 2014 CIM Definition Standards – for Mineral Resources and Mineral Reserves. No reserves conforming to CIM standards have been estimated for this report, as GoldMining Inc. has not advanced the evaluation work to a point of developing mine plans, production schedules, and economic analysis.
Mineral resource estimates are pit constrained using Whittle© Software. Parameters used to estimate the pit constrained resources are as follows: metal selling prices of US$ 1,700/oz gold, US$ 21.00/oz silver, and US$ 3.50/lb copper, G&A of US$ 1.00 per tonne, open-pit mining costs of US$ 1.80 per tonne, processing costs of US$ 7.44 per tonne, metallurgical recoveries of 90% for gold, 30% for silver and 91% for copper, an average pit-slope of 47.5 degrees and a 6% NSR royalty.
Table 1‑1 summarizes the December 20, 2022 mineral resource estimate for La Mina at a cut-off grade of 0.30 g/t Au.
Table 1‑1 La Mina Mineral Resource Estimate (Effective Date December 20, 2022. Qualified Person: Scott Wilson CPG. Cut-off Grade 0.30 g/t Au)
| | Grades | Contained Metal |
| Deposit | Metric Tonnes
(‘000) | Au (g/t) | Ag (g/t) | Cu (%) | AuEq (g/t) | Au (oz) | Ag (oz) | Cu (lbs, ‘000) | AuEq (oz) |
Indicated Resources |
La Cantera | 17,614 | 0.86 | 2.03 | 0.31 | 1.33 | 487,009 | 1,149,569 | 120,460 | 753,166 |
La Garrucha | 7,358 | 0.65 | 3.14 | 0.11 | 0.85 | 153,764 | 742,797 | 17,762 | 201,076 |
Middle Zone | 8,800 | 0.54 | 1.28 | 0.11 | 0.71 | 152,777 | 362,138 | 21,185 | 200,873 |
Total | 33,772 | 0.73 | 2.08 | 0.21 | 1.06 | 793,550 | 2,254,504 | 159,407 | 1,149,591 |
Inferred Resources |
La Cantera | 11,175 | 0.71 | 1.85 | 0.30 | 1.15 | 255,086 | 664,661 | 72,709 | 413,168 |
La Garrucha | 44,107 | 0.55 | 2.46 | 0.10 | 0.72 | 779,922 | 3,488,379 | 96,846 | 1,020,989 |
Middle Zone | 949 | 0.47 | 1.15 | 0.09 | 0.62 | 14,340 | 35,087 | 1,873 | 18,916 |
Total | 56,231 | 0.58 | 2.32 | 0.14 | 0.80 | 1,049,348 | 4,188,126 | 171,429 | 1,454,025 |
Mineral resources are not mineral reserves and do not have demonstrated economic viability. There is no certainty that all or any part of the mineral resources will be converted into mineral reserves. Gold-equivalent grades were calculated using the following formula: AuEq = Au (g/t) + [Cu(%)} x {%Recoverable Cu / %Recoverable Au} x {Cu Price/Au Price} x 22.0462 x 31.1035] + [Ag (g/t) x {Ag Price/Au Price}]. Metal prices for calculating gold equivalency are gold (US$ 1,700/oz), silver (US$ 21.00/oz), and copper (US$ 3.50/lb). Metal prices are not constant and are subject to change. All quantities are rounded to the appropriate number of significant figures; consequently, sums may not add up due to rounding.
1.2 | PRELIMINARY ECONOMIC ASSESSMENT |
The PEA for the Project considers mining and processing of mineralization from all resource areas of the La Mina Project; La Cantera, La Garrucha and Middle Zone. The Project assumes of processing 61.3 million tonnes of mineralized material over a 11.2 year life of mine (LoM) to produce 203.9 million pounds of copper, 1.3 million ounces of gold, and 3.0 million ounces of silver. Conventional open pit mining methods using loaders and off-highway trucks were assumed to extract mineralized and rejected materials from all three adjacent open pit mines. The strip ratio of the combined pits is 5.5:1 (rejected material:mineralized material). Peak mining rates were 173,000 tonnes per day. Mineralized material would be delivered to a 15,000 tonne per day processing plant to produce a copper concentrate and gold dore. Process plant feed grades are 0.19% copper, 0.72 g/t gold and 2.36 g/t silver.
Resource Development Associates Inc.
Effective Date July 24, 2023
GoldMining Inc. NI 43-101 Report – La Mina Project | Page 21 |
Initial capital costs are estimated at US$ 424.8 million and sustaining capital costs are estimated at US$ 163.4 million plus US$ 39.8 million for mine closure.
The Project PEA estimates a pre-tax net present value (“NPV”) of US$ 447.3 million using a 5% discount rate. The post-tax estimated NPV is US$ 279.5 million using a 5% discount rate. The Internal Rate of Return (“IRR”) is 20.4% pre-tax and 15.2% after-tax.
The following tables summarize the key PEA financial, technical and metal production of the Project.
Table 1‑2 PEA Financial Summary
Parameter | | Units | Values |
Net Present Value (5%) | Pre-Tax | $ Million | 447.3 |
| | After-Tax | $ Million | 279.5 |
Internal Rate of Return (IRR) | Pre-Tax | % | 20.4 |
| | After-Tax | % | 15.2 |
After-Tax Payback | | Years | 5.6 |
Pre-production Capital | | $ Million | 424.8 |
Sustaining Capital including Closure | | $ Million | 203.2 |
Life-of-Mine (LoM) Cash Unit Cost | | $/oz | 795.0 |
LoM All-In Sustaining Unit Cost | | $/oz | 912.0 |
Metal Prices | | | |
Copper Gold Silver | | $/lb $/oz $/oz | 3.50 1,750 21.00 |
Table 1‑3 PEA Technical Summary
Parameter | Units | Values |
Mine Life | Years | 11.2 |
Mined Mineralized Material | Million Tonnes | 61.3 |
Process Plant Production Rate | Tonnes/day | 15,000 |
Process Plant Feed Grade Copper Gold Silver Gold Equivalent | % g/t g/t g/t | 0.19 0.72 2.36 1.01 |
Strip Ratio (Rejected Material : Mineralized Material) | Ratio | 5.49 |
Total On-Site Operating Unit Cost | $/t process | 21.26 |
Resource Development Associates Inc.
Effective Date July 24, 2023
GoldMining Inc. NI 43-101 Report – La Mina Project | Page 22 |
Table 1‑4 PEA Production and Payable Metal Summary
| | Copper | Gold | Silver | Gold Equivalent |
Metallurgical Recovery | 80% | 91% | 64% | |
Production | 203.9 Mlbs | 1,293 koz | 2,983 koz | 1,736 koz |
Payable | 195.7 Mlbs | 1,262koz | 2,88 koz | 1,687 koz |
The preliminary economic assessment is preliminary in nature, and there is no certainty that the reported results will be realized. The Mineral Resource estimate used for the PEA includes Inferred Mineral Resources which are considered too speculative geologically to have the economic considerations applied to them that would enable them to be categorized as Mineral Reserves, and there is no certainty that the projected economic performance will be realized. The purpose of the PEA is to demonstrate the economic viability of the La Mina Project, and the results are only intended as an initial, first-pass review of the Project economics based on preliminary information. Mineral Resources are not Mineral Reserves and do not have demonstrated economic viability.
La Cantera and Middle Zone constitute two of the four drill-tested mineralized porphyry intrusive and breccia bodies on the La Mina property. In both deposits, the intrusive centers are characterized by a series of porphyry stocks and related breccias that together make up porphyry copper-gold deposits. In the case of La Cantera, the core of the deposit is cut out by a late, barren porphyritic stock resulting in a “doughnut” pattern (plan view) whereby the copper- and gold-bearing rocks form a concentric pattern around the late, barren porphyritic stock. In the case of Middle Zone, the barren core is an amorphous feature that appears to have intruded preferentially along pre-existing planes of weakness. Various intrusive/breccias phases were involved in development of the porphyry deposits along with multi-phase alteration-mineralization events, as most-often expressed by pronounced densities of veinlets crosscutting the diamond drill core. Hydrothermal magnetite is an important gangue mineral associated with gold and copper, and potassic alteration is an important alteration type associated with gold and copper.
The La Cantera deposit is slightly elliptical in plan-view (long axis NW-SE), measuring approximately 200 m by 190 m in plan-view on surface with a depth extent of 350 m - 600 m based on the results from 26 drill holes. Average grades are close to 0.9 g/t Au with 0.3% Cu and 1.7 g/t Ag.
The Middle Zone deposit lies approximately 400 m north of La Cantera and consists of a more pronounced elliptical body in plan-view (long axis NE-SW), which remains open at depths of over 600 m, based on the results of 54 drill holes. Faults appear to have offset the western and eastern lobes of mineralization. Faults also appear to delimit the western edge. Mineralization here is of two types. The first is characterized by a high copper-gold ratio, similar to what is observed at La Cantera. The second is characterized by high gold with relatively low copper. Overall, the grades are lower than La Cantera, close to 0.5 g/t Au with 0.1% - 0.2% Cu, over true widths of up to 100 m.
Mineralization in the La Garrucha porphyry intrusive complex is similar to that described for La Cantera and Middle Zone prospects comprising a calcic-potassic core, grading out to sodic-calcic, and an outer argillic zone. Magnetite alteration is ubiquitous throughout all of the porphyry phases. Highest grade gold and copper is accompanied by strong potassic alteration, characterized by secondary potassium feldspar and biotite, disseminated and vein magnetite, quartz stockwork veining and both vein-hosted and disseminated sulphides that include pyrite, chalcopyrite and lesser bornite and covellite.
Resource Development Associates Inc.
Effective Date July 24, 2023
GoldMining Inc. NI 43-101 Report – La Mina Project | Page 23 |
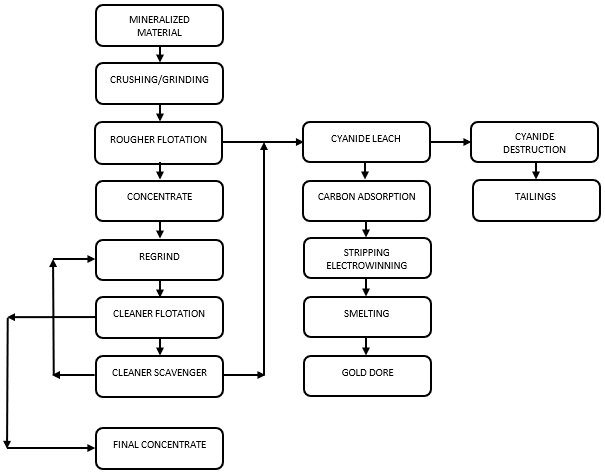
Two scoping level metallurgical test work programs have been completed on samples from the La Mina deposit. The first program was completed and reported in 2011, on samples from the La Canterra and the Middle Zone deposits and the second program was completed and reported in 2022, on samples from the La Garrucha deposit. The metallurgical test work undertaken included sample preparation and characterization, Bond’s ball millwork index determinations, in-place bulk density measurements, gravity tests, direct cyanidation and carbon-in-leach tests and rougher and cleaner flotation tests and flotation cleaner and rougher tailings leaching. Generally, the copper and gold recoveries by flotation into a bulk rougher concentrate and gold recovery by cyanide leaching were consistent between the two test programs for the materials tested and indicate that the La Mina samples (La Cantera, Middle Zone and La Garrucha) are amenable to standard flotation for copper and gold recovery and to cyanide leaching for gold recovery.
Preliminary mineralogy suggested a pyrite to copper sulphide ratio of 3:1 and relatively little association of copper sulphides with pyrite, which indicates that a reasonably efficient separation of pyrite from copper sulphides in a flotation process is possible. With about 48% copper liberation at the nominal 103 µm K80 primary grind sizing, reasonably good rougher copper response can be anticipated under relatively aggressive flotation conditions.
Flotation testing in the 2022 program produced a bulk concentrate containing 27% copper, 192 g/tonne gold and 549 g/tonne silver, while recovering about 77% of the copper and 67% of the gold. As this was an open circuit test, closed circuit testing would be expected to recover some of the losses in the cleaner tails, resulting in higher recoveries at lower grade. Cyanide leaching of the cleaner and rougher tailings could recover approximately 78% of the gold in the rougher tailings and 85% in the cleaner tailings, collectively representing about 25% of feed gold. As such, overall gold recovery from such a flowsheet would be expected to total around 90-92%.
The amount and effect of oxide/saprolite and transition material in the upper part of the deposits has not been established. There was some indication from the 2011 test work that flotation recoveries were lower in the composite samples that contained some amount of copper oxides. Currently, the effect is not quantified and warrants further investigation.
Considering the results from the two metallurgical programs and a preliminary mass balance for the process, an overall base case recovery for gold and copper by flotation after regrinding and cleaning into a 23% to 26% copper concentrate is projected at 69% and 80% respectively. Cyanide leaching of the combined cleaner and rougher tailings, increases the overall gold recovery to approximately 91%. Further test work on representative samples, for additional evaluation of mineralogy and a program of open and locked cycle flotation testing and cyanide leach testing is required to provide further confidence in the metallurgical response and optimization of the recovery process.
1.5 | CONCLUSIONS AND RECOMMENDATIONS |
Based on the assumptions of this PEA, the report suggests that the Project could be put into production and return capital investments within 5.7 years of startup.
Mining production estimates included Inferred Mineral Resources that are considered too speculative geologically to have the economic considerations applied to them that would enable them to be categorized as mineral reserves. Thus, this PEA is preliminary in nature and is based on technical and economic assumptions that should be evaluated in more advanced studies.
The geology of the La Cantera and Middle Zone deposits is well understood and well represented in the models presented. RDA believes there is opportunity to further expand the La Cantera resource and evaluate possible connections to the Middle Zone at depth. In addition, the new mineral resource estimate for La Garrucha presents an opportunity to update the economic analysis for La Mina. Further in-fill drilling should be evaluated and conducted to upgrade mineral resources to mineral reserves. Several additional porphyry-style intrusions are interpreted from existing geophysical datasets throughout the La Mina concessions. It is recommended the Company undertake a systematic exploration program to further test these targets for discovery of new porphyry style gold-copper mineralization.
Resource Development Associates Inc.
Effective Date July 24, 2023
GoldMining Inc. NI 43-101 Report – La Mina Project | Page 24 |
Preliminary metallurgical tests indicate that La Mina mineralization is amenable to standard flotation for copper and gold recovery and to cyanide leaching for gold recovery. Considering the results from the two metallurgical programs and a preliminary mass balance for the process, an overall base case recovery for gold and copper by flotation after regrinding and cleaning into a 23% to 26% copper concentrate is projected at 69% and 80% respectively. Cyanide leaching of the combined cleaner and rougher tailings, increases the overall gold recovery to approximately 91%. Further test work on representative samples, for additional evaluation of mineralogy and a program of open and locked cycle flotation testing and cyanide leach testing is required to provide further confidence in the metallurgical response and optimization of the recovery process.
Table 1‑5 Proposed Phase 1 Work Program to advance La Mina
Activity | Amount (US$ M) |
Property exploration to test additional porphyry targets | 1.0 |
Drilling Program focusing on resource expansion | 1.7 |
Drill technical services and assaying | 0.2 |
Updated Mineral Resource Estimate | 0.1 |
Updated Preliminary Economic Assessment | 0.2 |
Metallurgical Testing | 0.3 |
Total | 3.5 |
The authors have not recommended successive phases of work for the advancement of the Project.
Resource Development Associates Inc.
Effective Date July 24, 2023
GoldMining Inc. NI 43-101 Report – La Mina Project | Page 25 |
Scott Wilson (“Mr. Wilson”) and Michael Cole (“Mr. Cole”) of Resource Development Associates Inc. (“RDA”), Paul Hosford of PMet Services (“Mr. Hosford”), collectively (“the Authors”) prepared a National Instrument 43-101 (NI 43-101) Preliminary Economic Assessment (“PEA”) for the La Mina Project (“La Mina” or “the Property” or “the Project”) located in the Department of Antioquia, Republic of Colombia, South America.
The Authors were retained by GoldMining Inc. (“the Company” or “GoldMining”), a Canadian company trading on the Toronto Stock Exchange (“TSX”) and the New York Stock Exchange (“NYSE”).
The report has been prepared according to the guidelines of the Canadian Securities Administrators’ National Instrument 43-101 and Form 43-101F1, while the PEA reported herein has been prepared in conformity with generally accepted CIM “Estimation of Mineral Resources and Mineral Reserves Best Practice Guidelines.”
The preliminary economic assessment is preliminary in nature, as it includes inferred mineral resources that are considered too speculative geologically to have the economic considerations applied to them that would enable them to be categorized as mineral reserves, and there is no certainty that the preliminary economic assessment will be realized. Mineral resources are not mineral reserves and do not have demonstrated economic viability.
2.1 | PURPOSE OF TECHNICAL REPORT |
The purpose of the Technical Report is to provide GoldMining with an updated Preliminary Economic Assessment that includes the La Garrucha deposit. The objectives of this PEA update are:
| | ● | An independent opinion as to the technical merits of the Project and the appropriate manner to proceed with continuing exploration and project development. |
| | ● | It is intended that this report may be submitted to those Canadian stock exchanges and regulatory agencies that may require it. It is further intended that GoldMining may use the report for any lawful purpose to which it is suited. |
The current inspection for the Project was carried out on October 12 - 13, 2022 by Scott Wilson who visited the property located in the village of La Mina, municipality of Fredonia in the department of Antioquia, Colombia. Mr. Wilson met with the geological team and technicians to review geological maps and sections, inspect drill core, review the digital database, observe the location of drill collars and collect a number of core samples to validate and confirm existing information.
2.1.1.1 | UNITS OF MEASURE - ABBREVIATIONS |
Unit | Description |
% | Percent |
°C | Degrees Celsius |
cm | Centimeter (Centimetre) |
m | Meter (Metre) |
bcm | Bank Cubic Metres |
g | Grams |
g/t | grams per tonne |
ha | Hectare (10,000 M2) |
kg | Kilogram |
km | Kilometer (Kilometre) |
KW or kW | Kilowatt |
mm | Millimeters (Millimetres) |
opt | Ounces Per Ton |
ppm | Parts Per Million |
SG | Specific Gravity |
μm | Microns |
Resource Development Associates Inc.
Effective Date July 24, 2023
GoldMining Inc. NI 43-101 Report – La Mina Project | Page 26 |
2.1.1.2 | ACRONYMS AND SYMBOLS |
Term | Description |
Ag | Silver |
Au | Gold |
CIM | Canadian Institute of Mining, Metallurgy and Petroleum |
Company | GoldMining |
Cu | Copper |
ICP | Inductively Coupled Plasma |
Ma | Million Years |
Masl | Meters above sea level |
MMC | Metal Mining Consultants Inc. |
NSR | Net Smelter Return |
Pb | Lead |
Property | La Mina Project |
QA | Quality Assurance |
QA/QC | Quality Assurance/Quality Control |
QC | Quality Control |
QP(s) | Qualified Person(s) |
RC or RVC | Reverse Circulation |
Rdi | Resource Development Inc. |
RDA | Resource Development Associates Inc. |
RQD | Rock Quality Designation |
tpd | Tonnes per day |
US | United States |
Zn | Zinc |
Resource Development Associates Inc.
Effective Date July 24, 2023
GoldMining Inc. NI 43-101 Report – La Mina Project | Page 27 |
3 | RELIANCE ON OTHER EXPERTS |
The authors have not relied on information from other experts except in connection with certain legal matters relating to title, including information related to the concessions and their titles as described below.
The authors were provided with and reviewed documents relating to the mineral concessions including certificates of mineral registration, and certificates of good standing from GoldMining’s legal counsel (Camila Restrepo Uribe). Such documents included,” Good Standing Legal Opinion Colombian mining title No. 6355B (HHMM-04)” and “Good Standing Legal Opinion Colombian mining title No. L5263005”, both documents prepared by Camila Restrepo Uribe, and both dated June 15, 2021, GoldMining Inc provided the authors with updated copies of mineral concessions and an updated map of the concessions and two additional applications in process. This included Certificates of Mining Registration (Certificado de Registro Minero) from the National Mining Agency (Agencia Nacional de Minería) for mining title No. 6355B (HHMM-04) and mining title No. L5263005, both certificates dated June 15, 2021. While it appears that all titles (concessions) are in force and free of any liens and encumbrances, the authors are not qualified to express a legal opinion with respect to the property titles and current ownership and possible encumbrance status, and therefore, we have relied on the Company for providing this information and disclaim direct responsibility for such legal title information.
Resource Development Associates Inc.
Effective Date July 24, 2023
GoldMining Inc. NI 43-101 Report – La Mina Project | Page 28 |
4 | PROPERTY DESCRIPTION AND LOCATION |
The La Mina project consists of two properties: 1) the 1,794 hectare La Mina Colombian concession contract identified as concession contract L5263005 (“concession”) held by Bellhaven Exploraciones La Mina Fredonia S.A.S. and 2) the 1,416 hectare La Garrucha with concession contract No. HHMM04 held by Bellhaven Exploraciones, as well as two concession contract applications currently under evaluation a) LEA-16282X1 with 62,5146 hectares requested and b) 507076TL5-08011 with 99687 hectares requested. GoldMining owns 100% of the Property through its wholly owned subsidiary, Bellhaven which in turn owns the property through its wholly owned Colombian subsidiaries Bellhaven Exploraciones (formerly Aurum Exploration Inc. Colombia) and La Mina Fredonia S.A.S. GoldMining announced on May 30, 2017 that it had completed the acquisition of Bellhaven by way of a plan of arrangement pursuant to an arrangement agreement between the parties dated April 11, 2017.
The concessions are located near Medellin in the Department of Antioquia, Colombia approximately 500 km north-west of the Colombia’s federal capital of Bogota. This region has a long history of gold mining extending back several centuries. Now several parts of Antioquia are among the most active gold exploration regions in Colombia.
The closest settlement, La Mina, lies immediately adjacent to the La Mina Project. The larger town of Venecia, approximately 11 km from the project, provides a source of supplies and logistical support for the project, rural farming activities, and for several small underground coal- mining operations in the near area. Figure 4‑1 and Figure 4‑2 show the location of the mineral claim in relation to surrounding geography.
Resource Development Associates Inc.
Effective Date July 24, 2023
GoldMining Inc. NI 43-101 Report – La Mina Project | Page 29 |
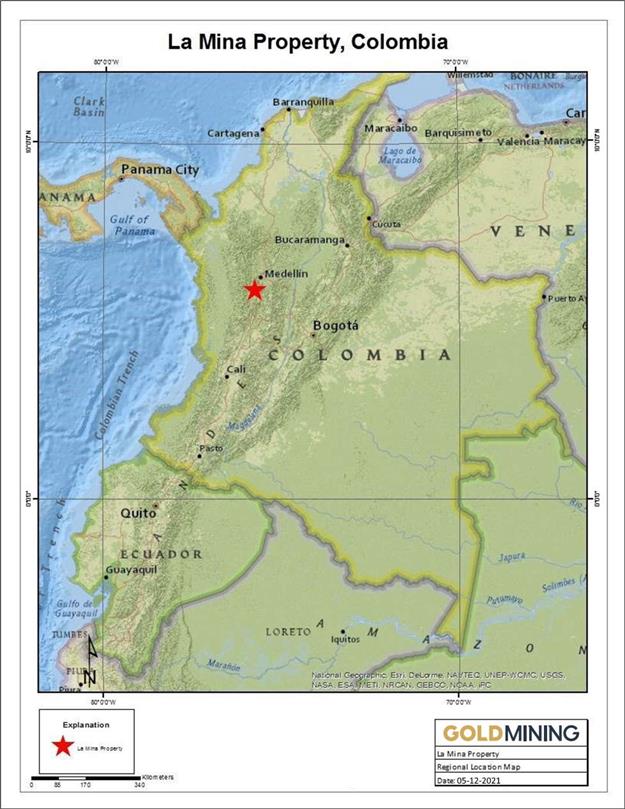
Figure 4‑1 La Mina Property, Colombia
Resource Development Associates Inc.
Effective Date July 24, 2023
GoldMining Inc. NI 43-101 Report – La Mina Project | Page 30 |
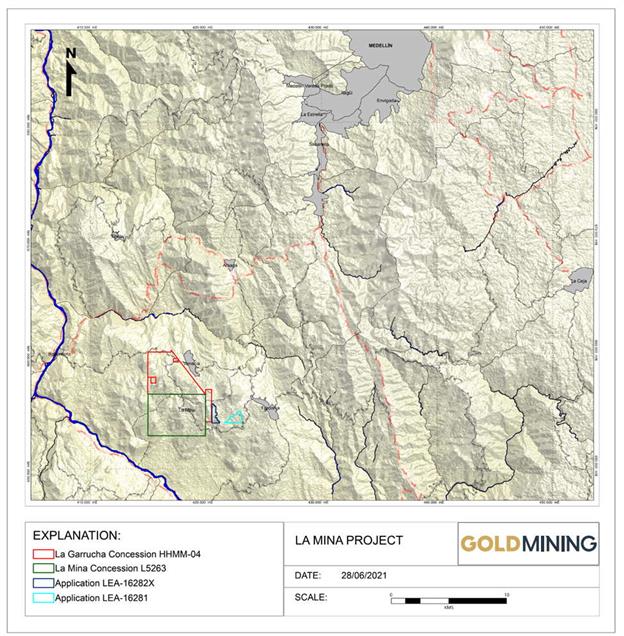
Figure 4‑2 La Mina Project Location and Access Map
The La Mina project property consists of two concession contracts totaling 3,210 hectares that were integrated into one on July 2023 approved by resolution No. 2023060083727. Namely the 1798 hectare La Mina license with concession contract No. 5263 and the La Garrucha license with concession contract No. 6355B. The location and details regarding the claim block are outlined in Table 4‑1.
Exploration license No. 5263 (La Mina concession) was granted by the Instituto Colombiano de Geología y Minería (“INGEOMINAS”) to Alejandro Montoya-Palacios (“Montoya”) in early 2000 as an Exploration Concession under the mining code of the country which grants the operator the right to explore over a three-year renewable period under certain conditions for an additional two years including submission of a work plan known as a “Plan de Trabajo de Inversión”, or PTI. This was turned into a concession contract on August 5, 2020.
Resource Development Associates Inc.
Effective Date July 24, 2023
GoldMining Inc. NI 43-101 Report – La Mina Project | Page 31 |
Table 4‑1 La Mina Property Ownership
Concession Contract Number | Size Hectares | Registered Title Holder |
L5263005 | 1,794 | La Mina Fredonia SAS |
HHMM04 | 1,416 | Bellhaven Exploraciones Inc. Sucursal Colombia |
GoldMining's indirect Colombian subsidiary, Bellhaven Exploraciones (formerly Aurum Exploration Inc. Colombia) signed an option agreement with Mr. Montoya to initially acquire 80% of the concession. The property was held jointly by both parties through Mina Fredonia S.A.S. (“Fredonia”) now the concession is held by Bellhaven Exploraciones with GoldMining currently indirectly owning 100% of the La Mina concession.
La Garrucha exploration contract, No. 6355B, now owned by Bellhaven Exploraciones Inc. Sucursal Colombia but originally owned by AngloGold Ashanti Colombia S.A., was optioned by Bellhaven in 2013 to explore an Au-Cu porphyry deposit indicated by the surface and drilling exploration in 2011 and 2012 respectively. This contract was renegotiated on March 7, 2015. As a result, GoldMining, through its ownership of Bellhaven Exploraciones and La Mina Fredonia S.A.S. now owns 100% of this mining concession with Bellhaven to pay AngloGold Ashanti US$ 1 per reserve ounce declared in a bankable Feasibility Study, or present at the start of mining whichever comes first.
4.3 | SURFACE RIGHTS AGREEMENTS |
Bellhaven signed an additional agreement with B2Gold regarding purchase of the surface rights over 60 hectares around the exploration camp site and immediate project area; this allowed Aurum to acquire these surface rights for a total of US$ 470,000 over a three-year period. During 2011, Bellhaven completed the payments under this agreement and now owns 100% of the surface rights governed by the agreement with B2Gold.
During 2012, Bellhaven also acquired additional surface rights over the El Limon target. In April, the Company contracted with a private vendor for the purchase of 100% interest in a surface property encompassing 9.75 hectares to the north of the Middle Zone (the El Limon property). The property acquisition closed in Q3 of 2012 for a total purchase price of US $15,315 in cash.
Surface rights over a portion of the La Garrucha concession contract is subject to a surface rights lease agreement and an option agreement as outlined below:
Pursuant to a surface rights lease agreement dated July 6, 2016 and amended August 19, 2016, April 4, 2017, November 5, 2018, and July 10, 2020, Bellhaven can lease the surface rights over a portion of the La Garrucha concession contract by making the following payments:
| | ● | US$ 75,000 in May 2017 (paid); |
| | ● | US$ 75,000 in November 2017 (paid); |
| | ● | US$ 75,000 in May 2018 (paid); |
| | ● | US$ 75,000 in November 2018 (paid); |
| | ● | US$ 25,000 in June 2019 (paid); |
| | ● | US$ 25,000 in December 2019 (paid); |
Resource Development Associates Inc.
Effective Date July 24, 2023
GoldMining Inc. NI 43-101 Report – La Mina Project | Page 32 |
| | ● | US$ 25,000 in June 2020 (paid); |
| | ● | US$ 25,000 in December 2020 (paid); |
| | ● | US$ 25,000 in June 2021 (paid); |
| | ● | US$ 25,000 in December 2021 (paid); |
| | ● | US$ 25,000 in June 2022 (paid) and |
| | ● | US$ 55,000 in December 2022 (paid). |
In addition, pursuant to an option agreement entered into by Bellhaven on November 18, 2016, amended April 4, 2017, November 5, 2018, and July 10, 2020, Bellhaven can purchase the La Garrucha concession by making an optional payment of US$ 650,000 on May 7, 2024.
The La Mina Project is subject to a 2% net smelter return royalty (NSR) payable to Gold Royalty Corp.
As well, a gross revenue royalty (GRR) of 4.0% on the precious metals and 5.0% on base metals are both imposed by the Colombian National Mining Agency.
The authors know of no other known royalties, back in rights, payments or any other agreements to which the property is subject outside of the existing Colombian mining code. There are no known environmental liabilities to the La Mina Project. There are no known factors or risks that affect access, title, or the right or ability to perform work on the property.
Resource Development Associates Inc.
Effective Date July 24, 2023
GoldMining Inc. NI 43-101 Report – La Mina Project | Page 33 |
5 | ACCESSIBILITY, CLIMATE, LOCAL RESOURCES, INFRASTRUCTURE AND PHYSIOGRAPHY |
5.1 | ACCESS AND INFRASTRUCTURE |
Access and infrastructure surrounding the La Mina Project are good. The area is surrounded by gravel roads which connect a rural farming population to various nearby population centers, including Medellin which is a large cosmopolitan city. Various small towns, including Bolombolo and La Pintada are located within a two-hour drive of the project area.
La Mina is accessed on a paved highway 30 km southwest of Medellin to the junction with a gravel road that leads 11 km to the property. Total travel time by road from Medellin is approximately 2.0 – 2.5 hours depending on road conditions and traffic around Medellin. Access to the area is available year-round.
The economy surrounding La Mina is based on rural activities. Agricultural activities dominated by coffee and mixed- crop farming are the principal sources of land use and income.
While GoldMining, through its wholly owned subsidiaries Bellhaven Exploraciones and La Mina Fredonia S.A.S. owns a considerable area of surface rights over the La Cantera and Middle Zone deposits, the Company has also secured surface access agreements with other property owners in the La Garrucha area of planned exploration and drilling. Additional surface rights may be necessary for the establishment of a commercial mining project.
Water, power, and labor are readily available at the project site. Local labor is not trained in modern exploration and mining methods, indicating the need to provide training and import qualified personnel. All requirements (personnel, equipment, contractors) for project exploration and development are available in Medellin. Heavy equipment and diamond drills are readily available throughout Colombia.
The project area is located on the eastern slopes leading up from the Cauca River. It is a major physiographic feature marking the limit between the Western and Central physiographic regions where the La Mina Property is located.
The topography in the property area can be described as “tropical mountainous”, with sharp positive and negative changes in relief from an average elevation of approximately 1,700 m with ridges cresting at approximately 2,000 m.
The property is essentially 100% vegetated by Andean Forest, dense secondary scrub growth, agricultural crops, and grassy cattle pastureland.
The climate, characterized by tropical weather in this district can vary abruptly with elevation: below an elevation of ~1,000 m (in the Cauca River valley) the climate is warm (>24°C) whereas higher up it tends to be temperate (18°C to 24°C) between 1,000 m and 2,000 m, and then becomes cool above 2,000 m (12°C to 18°C). Annual rainfall is approximately 2,000 mm with the wettest months being from March to May, and then again from September to December.
Resource Development Associates Inc.
Effective Date July 24, 2023
GoldMining Inc. NI 43-101 Report – La Mina Project | Page 34 |
6.1 | EXPLORATION PRIOR TO 2002 |
The Antioquia district of Colombia where the La Mina Property is located has been a source of gold mining that goes back several centuries to pre-Colombian times. Small-scale artisanal mining, some from hard-rock sources and some from alluvial deposits, were common throughout the district and so “barequero” prospectors were likely active throughout the Central Cordillera district on either flank of the Cauca River.
The general area around La Mina has been noted in early regional survey work by the Colombian mines department, INGEOMINAS and this led to the staking of ground by the original and still current owner, Mr. Alejandro Montoya in 2000.
Historical research by the Company has revealed local knowledge of several adits that targeted gold in the vicinity of the Middle Zone prospect. At one point, these mines were reportedly managed by a small-scale mining company from England. Artisanal miners exploited several streams originating from the resource areas in the past, a very small number of which are still active today. No records of production are known to exist, though different sources corroborate that mining activity goes back to at least the 1920’s. The amount of artisanal mining production is believed to be very small.
6.2 | EXPLORATION 2002 - 2008 |
In the early 2000s, AngloGold Ashanti (AGA) carried out broad-scale geochemical and other exploration programs throughout this district of Colombia and was responsible for the initial discovery of copper-gold mineralization on surface at the La Cantera outcrop. In 2006, AGA drilled six holes into the La Cantera target, four of which successfully intercepted the gold-copper porphyry stock with mineralized intercepts of 50 - 100 m.
In 2007, AGA formed the Avasca Joint Venture with Bema Gold (subsequently transferred to B2Gold) who continued with further surface geochemistry and geophysics north and south from the La Cantera discovery, as well as further west over a prominent N-S trending magnetic ridge feature identified from aerial geophysics flown by the Avasca JV in 2007.
The early exploration work at La Mina by AGA beginning in 2002 and later in 2005-08 by the Avasca Joint Venture (Avasca) focused on the principal La Cantera Zone. These programs consisted of:
| | ● | Regional mapping, 1:20,000 scale |
| | ● | Property-scale geological mapping: 1:10,000 scale |
| | ● | Geochemical sampling, soils and rock |
| | ● | Geophysical surveys: aerial magnetic and radiometrics |
| | ● | Drilling: six, core holes totaling 1,453 m (mid-2006) – AGA |
| | ● | At the end of 2007, a regional airborne magnetic/radiometric survey was completed over the Property and neighboring ground (Avasca) |
| | ● | In early 2008, the aerial geophysics was followed by additional auger soil and rock geochemical sampling programs over the anomalies (Avasca). |
| | ● | Various sampling methods have been used to explore the La Mina Property, as follows: |
| | ● | Regional-scale soil and rock/trench sampling carried out by AGA in 2002 which led to the discovery of the porphyry mineralization at the La Cantera zone. |
| | ● | In 2007/08, additional soil sampling was completed by the Avasca joint venture over the aero-magnetic anomalies identified from their aerial geophysics (2007). This soil sampling was completed on an irregular grid, widely spaced over the entire 1,794 ha Property area (123 samples), but principally focused on the area around the La Cantera prospect and immediate vicinity (~1 km by 1 km). A later rock sampling program in 2008 collected 857 samples on a 100 m standard grid, and focused on La Cantera and some nearby magnetic anomalies. |
Resource Development Associates Inc.
Effective Date July 24, 2023
GoldMining Inc. NI 43-101 Report – La Mina Project | Page 35 |
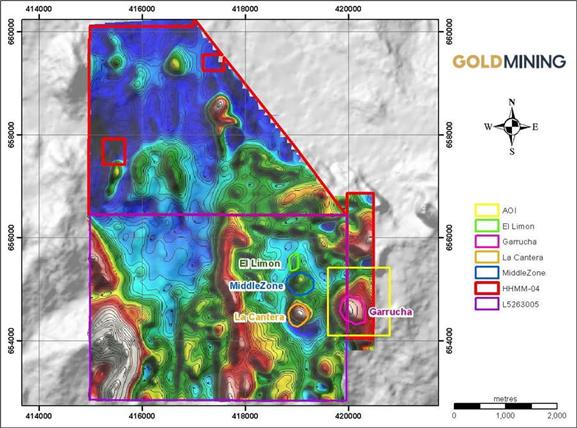
Figure 6‑1 Portion of Aerial Magnetics. Illustrates the prominent magnetic features interpreted from aerial geophysics flown by the Avasca Joint venture in 2007. The high magnetic response of the La Cantera porphyry stock, at the southern end of the red rectangular block, is clearly visible.
Resource Development Associates Inc.
Effective Date July 24, 2023
GoldMining Inc. NI 43-101 Report – La Mina Project | Page 36 |
Six AGA drill holes were completed in and around the La Mina porphyry (later re-named the La Cantera Stock), with Holes 2 and 5 yielding 90 m plus intercepts of greater than 1 g/t Au and good copper grades at shallow depths. Drillholes 4 and 6 also contained significant values located near the surface; however, Holes 1 and 3 were drilled off target to the west and did not encounter any mineralization of interest (Table 6‑1).
Table 6‑1 AGA Drill Results
Drill Hole | Dip | Total Depth | Significant Intercepts |
Name | Degree | m | Thickness (m) | Grades
(Au g/t/Cu %) |
LM-01 | -60.5 | 258 | No Significant Intercepts |
LM-02 | -58.5 | 189 | 152 | 0.82/0.26 |
LM-03 | -60.5 | 201 | No Significant Intercepts |
LM-04 | -60.0 | 250 | 106 | 0.32/0.21 |
LM-05 | -60.0 | 252 | 106 | 1.11/0.40 |
LM-06 | -60.0 | 304 | 122 | 0.40/0.24 |
Resource Development Associates Inc.
Effective Date July 24, 2023
GoldMining Inc. NI 43-101 Report – La Mina Project | Page 37 |
7 | GEOLOGICAL SETTING AND MINERALIZATION |
Colombia can be divided into four distinct geomorphological regions and can be seen in Figure 7‑1.
| | 4. | The Pacific Coast Region |
The La Mina property is located along the eastern margin of the western Cordillera in the Andean System (Figure 7‑1).
Figure 7‑1 Geomorphological Regions of Colombia Showing the
Approximate Location of La Mina
The La Mina region lies within the Romeral terrane, an oceanic mélange comprised of metamorphosed mafic to ultramafic complexes, ophiolite sequences, and oceanic sedimentary rocks of probable Late Jurassic to Early Cretaceous age (Cediel & Cáceres, 2000; Cediel et al., 2003). This terrane was accreted to the continental margin along the Romeral Fault, which lies east of the River Cauca, in the Aptian (125 to 110 Ma). Movement on the Romeral Fault was dextral indicating that terrane accretion was highly oblique from the southwest. The Romeral Fault zone is marked by dismembered ophiolitic rocks, including glaucophane schist, in a tectonic mélange and is interpreted as a terrane suture marking an old subduction zone. The resulting suture zone and mélange-related rocks can be traced for over 1,000 km along the northern Andes. The Romeral terrane is bounded on the west side by the Cauca Fault. Further west, additional oceanic and island arc terranes were subsequently accreted to the Western Cordillera in the Paleogene and Neogene periods, culminating in the on-going collision of the Choco (or Panamá) arc since the late Miocene. This reactivated the Cauca and Romeral faults with left lateral and reverse movements (Cediel & Cáceres, 2000; Cediel et al., 2003). The original structure of the Romeral fault system has been modified by various post-Romeral tectonic events.
Resource Development Associates Inc.
Effective Date July 24, 2023
GoldMining Inc. NI 43-101 Report – La Mina Project | Page 38 |
Following accretion, the Romeral terrane was overlain unconformably by siliciclastic, continentally derived sediments of the Oligocene to Lower Miocene Amagá Formation. The Amagá Formation, comprises basal conglomerates, sandstones, siltstones, shales, and local coal seams (Durán et al., 2005). These sedimentary rocks are overlain by a thick sequence of volcanic and sedimentary rocks of the Late Miocene Combia Formation. The Combia Formation is divided into a Lower Member of basalt and andesite lava flows, agglomerates, and tuffs, and an Upper Member of conglomerates, sandstones, and crystal and lithic tuffs (Durán et al., 2005). The Combia Formation volcanic rocks were associated with at least one Middle to Late Miocene volcanic arc emplaced into the Romeral terrane basement rocks during this time period. Also associated with latest stages of arc formation was the syntectonic emplacement of a series of shallow-level intrusive rocks, including poly-phase hypabyssal stocks, dikes and sills of dioritic, granodioritic, and monzonitic composition. These intrusive rocks cut all of the aforementioned sedimentary and volcanic units of the Amaga and Combia Formations. K-Ar whole-rock ages for the intrusive rocks range from 8 to 6 Ma (Cediel et al., 2003). The Combia Formation and accompanying hypabyssal intrusive rocks are well represented along a 100 km by 20 km N-S trending belt extending from Anserma in the south to Jericó, Fredonia and Titiribí, located to the north of the La Mina Project (Figure 7‑2).
Following the early accretionary events, the region was subjected to compressional deformation during the Early-Middle Miocene and Middle-Late Miocene. In both cases the deformation was related to additional accretionary tectonic events taking place to the west along the active Pacific margin. The structural architecture of the Romeral fault and mélange system is essentially that of a +10 km wide series of N-S striking, vertically dipping, and dextral transcurrent faults. Virtually all lithologic contacts within the Romeral basement rocks are structural in nature and are characterized by abundant shearing, mylonitization, and the formation of clay-rich fault gouge. Structural reactivation during the Miocene resulted in orthogonal compression accompanied by mostly west-directed (back) thrusting and high- angle reverse fault development in the basement rocks. The Amaga Formation was deformed primarily into generally open, upright folds; local tilting and near isoclinal folds were associated with the west-directed thrust faults. The Combia Formation records both tilting and open folding. Both the Amaga and Combia Formations exhibit moderate to strong diapiric doming through the emplacement of Miocene intrusive rocks. N-S, NE-SW, NW-SE and E-W striking conjugate shearing and dilational fracturing affect all of the above geologic units.
Resource Development Associates Inc.
Effective Date July 24, 2023
GoldMining Inc. NI 43-101 Report – La Mina Project | Page 39 |
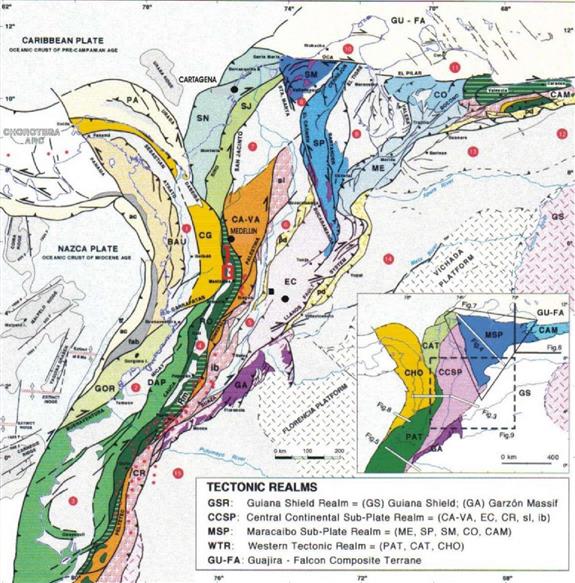
Figure 7‑2 Tectonic Map of Colombia
Note: | Litho-tectonic and morpho-structural map of Colombia and northwestern South America, after Cediel et al. (2003). RO = Romeral terrane; Rm = Romeral melange; CA-VA = Cajamarca-Valdivia terrane; sl = San Lucas block; ib = Ibague block;; DAP = Dagua- Pinon terrane; CG = Canas Gordas terrane; BAU Baudo terrane SP = Santander massif - Serranfa de Perija; GS = Guiana Shield; GA = Garzon massif; ME = Sierra de Merida; SM = Sierra Nevada de Santa Marta; EC = Eastern Cordillera; CO = Carora basin; CR = Cordillera Real; GOR = Gorgona terrane; PA = Panama terrane; SJ = San Jacinto terrane; SN = Sinu terrane; GU-FA = Guajira- Falcon terrane; CAM = Caribbean Mountain terrane; fab = fore arc basin; ac = accretionary prism; tf = trench fill; pd = piedmonte; 1 = Atrato (Choco) basin; 2 = Tumaco basin; 3 = Manabf basin; 4 = Cauca-Patfa basin; 5 = Upper Magdalena basin; 6 = Middle Magdalena basin; 7 = Lower Magdalena basin; 8 = Cesar-Rancherfa basin; 9 = Maracaibo basin; 10 = Guajira basin; 11 = Falcon basin; 12 = Guarico basin; 13 = Barinas basin; 14 = Llanos basin; 15 = Putumayo-Napo basin; Additional Symbols: PALESTINA = fault\suture system; red dot = Plio-Pleistocene volcano; Bogota = town or city. |
Resource Development Associates Inc.
Effective Date July 24, 2023
GoldMining Inc. NI 43-101 Report – La Mina Project | Page 40 |
The La Mina Project lies within the Middle Cauca Belt of Miocene-age volcano-plutonic rocks of central Colombia. This belt hosts several significant porphyry gold or copper-gold disseminated deposits such as La Colosa, Titiribí, Quebradona, and Quinchia, as well as large epithermal gold districts such as Marmato.
The immediate area around the La Mina Project is underlain by country rocks consisting of a series of basaltic volcanic rocks (Barroso Formation – oceanic tholeiitic basalts, dolerites, tuffs, etc.), sedimentary rocks of the Amagá Formation, and an upper Combia Formation of basalts and andesitic basalts inter-layered with volcaniclastic rocks and coarse-grained sedimentary rocks (conglomerates, arenites).
At the project scale, the key host rocks for the porphyry-related gold, copper, and silver mineralization are the intermediate composition volcanic rocks of the Combia Formation and the sub-volcanic breccias and related shallow level, porphyries which have intruded the Combia Formation. The Combia Formation developed within a Late Miocene magmatic arc that is interpreted to have included an early quiescent stage of volcanism and a later explosive event of wider extent.
Localized intrusive centers (e.g., La Cantera, Middle Zone, El Limon, and La Garrucha) comprise a series of intermediate composition porphyries and related intrusive (emplacement) breccias (Figure 7‑3). The structural controls for these intrusive centers appear to have been provided by N-S, NE-SW and/or NW-SE trending, high-angle fault systems associated with the major Cauca River structure to the west of La Mina.
Resource Development Associates Inc.
Effective Date July 24, 2023
GoldMining Inc. NI 43-101 Report – La Mina Project | Page 41 |
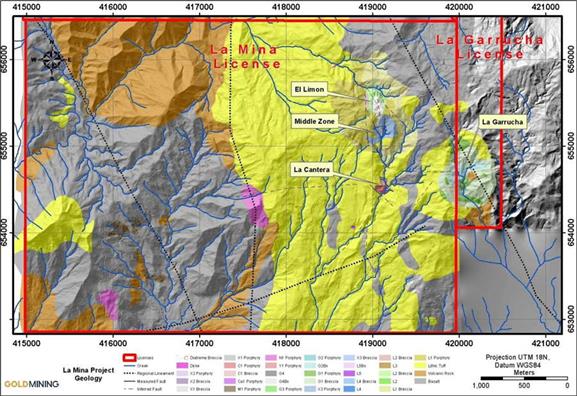
Figure 7‑3 Generalized Geologic Map of the La Mina Project Area
The following broad groupings of geological unites have been interpreted and recognized from surface mapping and the drill core logging to date:
| | ● | Lithic and Crystal Tuffs (Combia Formation) |
| | ● | Basalt-Andesite Lavas and Flows (Combia Formation) |
| | ● | The La Cantera Porphyry and intrusive breccia |
| | ● | The Middle Zone Porphyries and intrusive breccias |
| | ● | The La Garrucha Porphyries and intrusive breccias |
| | ● | Porphyry – undifferentiated |
A good understanding of the intrusive rocks is key to understanding the porphyry-related Au-Cu mineralization. Intrusive rocks at La Mina consist of porphyries of probable intermediate composition. At least four different porphyries have been identified in the La Mina Project area and are distinguished by their mineralogy and texture. Other potential targets exist on the property, as distinguished from magnetic and geochemical anomalies. None of these additional targets have been drill tested to date. To standardize the naming conventions for the porphyry-related, intrusive lithologies used in logging and mapping, a generic lithology naming scheme was adopted. Modifiers such as “early” and “late” were dropped and rocks were named primarily based on the original mineralogy and texture and, in some cases, the absence or presence of and type of alteration.
Resource Development Associates Inc.
Effective Date July 24, 2023
GoldMining Inc. NI 43-101 Report – La Mina Project | Page 42 |
As with other porphyry deposits worldwide, there is considerable overlap of the original mineralogy and texture of the different intrusive lithologies at La Mina. To date, four different centers of porphyry-related alteration and mineralization have been recognized: 1) La Cantera, 2) Middle Zone, 3) El Limon, and 4) La Garrucha. The phenocryst-to-matrix ratio of the intrusive lithologies varies from 50:50 to 80:20. The intrusive lithologies in all four intrusive centers contain essential plagioclase and amphibole phenocrysts, some lithologies contain minor but important amounts of magmatic biotite, and quartz phenocrysts or “eyes” are sparse. The dominant accessory mineral is magnetite; sphene, where observed, appears to be an alteration product of magmatic biotite or amphibole.
The porphyry “families” were named very simply for the geographic location of where they were first encountered (C – La Cantera, L – El Limon and G – La Garrucha) or in the case of the X family, because the origin and significance of these porphyries were uncertain. The numerical modifiers reflect the order in which the different members of a family (when more than one has been identified) were identified and not the relative age of the members of a family. For example, in the X family of Middle Zone, X1 was the first X porphyry identified but it was later determined to be younger than X3 and older than X2. These relative ages are based on clearly defined contact relations between different members of the same family. In previous press releases and the initial NI 43-101 technical report describing the geology of the La Cantera area (May 2011), the C1 Porphyry and C1 Breccia were referred to as the “early inter-mineral porphyry” and “early inter-mineral breccia” and the X1 Porphyry and X1 Breccia were referred to as the “late inter-mineral porphyry” and “late inter-mineral breccia”. The intrusive rocks of the El Limon area follow the nomenclature of Middle Zone. The relative ages of the different intrusive rocks and breccias in the various intrusive centers are given in Table 7‑1.
The relative ages of the different intrusive phases are well known within each intrusive center; however, to date, cross-cutting or contact relationships between C1 phases and L1 phases and X3 phases have not been observed. Hence, the relative ages of these lithologies cannot be determined definitively. Similarly, the relative ages of the intrusive phases in the La Garrucha area as compared with the other areas are not known. The porphyries and breccia at La Garrucha have only been mapped at surface and in limited drilling. The relative age relationships although becoming clear at La Garrucha are not clear with respect to the other porphyries, elsewhere in the project area.
Resource Development Associates Inc.
Effective Date July 24, 2023
GoldMining Inc. NI 43-101 Report – La Mina Project | Page 43 |
Table 7‑1 Lithological Descriptions
La Cantera | Middle Zone | La Garrucha |
| | | X2 Porphyry | Youngest | | |
| | | X1 Breccia | | G4 Breccia | Youngest |
X2 Porphyry | Youngest | X1 Porphyry | | G4 Porphyry | |
X1 Breccia | | X3 Breccia | | G2 Breccia | |
X1 Porphyry | | X3 Porphyry | | G2 Porphyry | |
C1 Breccia | | L1 Breccia | | G1 Breccia | |
C1 Porphyry | | L1 Porphyry | | G1 Porphyry | |
Volcanic Rocks | Oldest | Volcanic Rocks | Oldest | Volcanic Rocks | Oldest |
While there have been limited thin section studies of the Cantera and Middle Zone rocks, the detailed petrographic and mineralogical reports are pending at the time of this writing. The following lithological descriptions are derived from hand and drill-core specimens exhibiting weak to intense alteration and should therefore only be considered as field terms. Associated with the porphyries are breccias which includes auto-breccia and contact breccia. An auto-breccia is described as an intrusive breccia with clasts and matrix of the same intrusive phase. Contact breccias occur at contacts of porphyries with older volcanic rocks of the Combia Formation or with older porphyries. The porphyries are described below from youngest to oldest.
The X2 Porphyry is observed at the Cantera and Middle Zone prospects. This porphyry is believed to be one of the youngest porphyries at La Mina and as such is typically not mineralized or strongly altered. X2 Porphyry is composed of 70% phenocrysts and 30% fine-grained matrix. Phenocrysts are comprised of 45% plagioclase, 17% amphibole (hornblende?) and 7% biotite. Quartz phenocrysts are absent. Plagioclase phenocrysts are subhedral to euhedral tabular crystals ranging from 1.5 x 1.0 mm to 1.0 x 1.0 mm. Amphiboles occur as euhedral to subhedral crystals with bimodal sizes of 1.0 x 0.5 mm and 3.0 x 2.0 mm. Biotite is euhedral at 0.3 X 0.3 mm size. Accessory minerals consist of 1% fine-grained disseminated magnetite.
Alteration of the X2 porphyry where present is weak and typically propylitic to intermediate argillic with chlorite-carbonate and chlorite-clay respectively, chlorite partially replacing amphiboles. Locally where X2 is altered, trace to 1% disseminated pyrite is common.
The X1 is a name applied to a different intrusive at La Cantera than at Middle Zone. It was recognized first at La Cantera as a post-mineralizing intrusive at the core of the deposit. It was originally described as a “late intra-mineral porphyry” because it is only weakly and locally mineralized. X1 Porphyry has a porphyritic texture with 65-70% phenocrysts and 30-35% very fine-grained matrix. Phenocrysts are comprised of 45% plagioclase, 15-17% amphibole (hornblende) and 3-5% biotite. Quartz phenocrysts are absent. Plagioclase phenocrysts are typically subhedral to euhedral tabular crystals of two sizes, 1.5 x 1.0 mm and 1.0 x 1.0 mm. Amphiboles occur as euhedral –subhedral crystals of bimodal size of 0.4 x 0.2 mm and 0.8 x 0.2 mm. Biotite is euhedral at 0.3 x 0.3 mm size. Accessory minerals consist of 1% fine-grained disseminated magnetite.
Resource Development Associates Inc.
Effective Date July 24, 2023
GoldMining Inc. NI 43-101 Report – La Mina Project | Page 44 |
The X1 at Middle Zone is a mineralizing intrusive that has a similar petrography to the X1 of La Cantera. However, in this case it exhibits strong to intense potassic alteration with secondary biotite and magnetite within and proximal to gold and copper mineralized zones. In well mineralized portions it shows a high Cu/Au ratio. Pervasive replacement of the fine-grained feldspar matrix with potassium feldspar imparts a light pinkish buff color. In areas distal to mineralization, a condition met predominantly in Middle Zone, the unit displays argillic to propylitic alteration.
The X3 porphyry is observed only at the Middle Zone prospect. Contact relationships indicate that it is younger than El Limon Porphyry but older than X1 and X2 Porphyries. The X3 Porphyry is a bimodal feldspar porphyry with a phenocryst: matrix ratio of 70:30. Phenocrysts consist of 45-50% plagioclase, 10% - 12% amphibole (hornblende) and 2% - 3% biotite. Quartz phenocrysts are absent. Plagioclase is typically bimodal with finer phenocrysts of 0.4 x 0.2 mm and coarser phenocrysts at 0.4 x 0.8 mm. The coarser-grained plagioclase is euhedral to subhedral and usually zoned and occurs occasionally as agglomerated pairs. The content of coarse plagioclase is variable from 0 to 5%. Amphiboles are typically euhedral to subhedral and also bimodal in nature with >50% coarse grained at 3 x 1 mm and the balance of finer crystals having axes of 1 x 0.5 mm. Accessory minerals consist of 1% fine-grained disseminated magnetite.
Alteration is variable in type and intensity. Alteration ranges from moderate propylitic to pervasive, intense potassic (biotite-magnetite with local potassium feldspar replacement of earlier biotite). Argillic or argillic/phyllic alteration is localized along the contacts and margins of late fractures and faults.
7.3.4 | LA CANTERA PORPHYRY (C1) |
The La Cantera porphyry is the mineralizing intrusive at the La Cantera prospect. The La Cantera porphyry is a medium- to fine-grained porphyry. The porphyry is very “crowded” with a phenocryst: matrix ratio of approximately 70:30. The groundmass comprises both micro-phenocrysts and fine-grained crystalline quartzo-feldspathic (?) material (<20% of the matrix is aphanitic). Phenocrysts include plagioclase, amphibole, and biotite. Subhedral to euhedral plagioclase phenocrysts range in size from 0.4 x 0.2 mm to 0.8 x 0.5 mm, with occasional coarser-grained phenocrysts having axes of 1.0 x 1.5 mm in length. Subhedral to euhedral amphibole (10-12%) ranges in size from 0.2 x 0.4 mm to 0.4 x 0.8 mm. Biotite phenocrysts (5-8%) are dominantly 0.3 x 0.3 mm euhedral. Quartz phenocrysts are absent. Accessory minerals consist of 1-2% fine-grained disseminated magnetite.
Alteration of the La Cantera porphyry is dominantly potassic, having secondary biotite and potassium feldspar-bearing assemblages (± magnetite ± actinolite). The potassic alteration occurs as both pervasive replacement of phenocrysts and matrix and in veins and along vein selvages. Potassium feldspar alteration, when present, is generally pervasive with total replacement of plagioclase by potassium feldspar, as well as frequent veins and vein selvages of potassium feldspar. Zones of banded quartz and quartz-magnetite veins are common and locally may comprise >25% of the rock volume. Closely spaced sheeted quartz veins are common in the upper portions of the porphyry. Elsewhere quartz veins do not exhibit a preferred orientation.
7.3.5 | EL LIMON PORPHYRY (L1) |
The El Limon L1 Porphyry has been observed in the El Limon, Filo de Oro and Middle Zone prospects immediately to the north of the La Cantera gold-copper prospect. It is exposed over an area of several square kilometers. The El Limon porphyry is composed of 60% phenocrysts and 40% matrix. Phenocrysts are comprised of 40% subhedral to euhedral plagioclase (occasionally as agglomerated pairs) that range in size from 1 x 1.5 mm to 3 x 5 mm, 15% subhedral amphibole that is commonly 0.5 x 5.5 mm in size, and 5% subhedral biotite, which is typically 1 x 2 mm in size. Quartz phenocrysts are absent. Accessory minerals consist of 1% very fine-grained magnetite. The El Limon Porphyry is characterized by coarse grained plagioclase phenocrysts which makes it visibly distinct from the C1, X1 and X2 Porphyries. When strongly altered, it can be difficult to distinguish L1 Porphyry from X3 Porphyry.
Resource Development Associates Inc.
Effective Date July 24, 2023
GoldMining Inc. NI 43-101 Report – La Mina Project | Page 45 |
Alteration of the El Limon Porphyry is most commonly structurally-controlled argillic to intermediate argillic. Potassic alteration ranges from intense secondary biotite, commonly without magnetite, to moderate secondary biotite-magnetite. The latter occurs typically near contacts with potassically-altered X1 Porphyry or X3 Porphyry or their related intrusive breccias. Local weak potassic alteration in the form of secondary biotite and occasional potassium feldspar occurs in veins or selvages along quartz-magnetite veins.
7.3.6 | EL LIMON PORPHYRY (L2) |
The L2 porphyry is observed in drill core at the El Limon prospect centered approximately 300 m NNW of the center of the Middle Zone. L2 porphyry is composed of 45% phenocrysts and 55% fine grained, near aphanitic, matrix. Phenocrysts are comprised of 40% subhedral to euhedral plagioclase in a bimodal fashion ranging in size from <1 mm to 1.5 mm long and from 2 to 2.5 mm long, 2% - 5% subhedral amphibole is commonly 0.5 x 2 mm in size. The matrix is composed of a 50:50 mix of very fine-grained plagioclase crystals and too fine to identify aphanitic felsic material (feldspar and amphibole). Accessory minerals consist of magnetite. The L2 porphyry at El Limon is a mineralizing porphyry typically cut by an open quartz and quartz-magnetite vein stockwork and local fine-grained disseminated chalcopyrite.
7.3.7 | EL LIMON PORHYRY (L3) |
The El Limon L3 Porphyry occurs within the El Limon prospect. It is almost identical to the L1 porphyry except that it has 3% - 5% medium grained brown secondary biotite evenly distributed throughout. Like the L1 porphyry it is for the most part argillically altered as well. No other alteration other than the clay and biotite is evident and it typically is un-mineralized with detection limit Au values.
The La Garrucha intrusive center occurs in an area named La Garrucha approximately 650 m east of the La Cantera deposit. The possible importance of the intrusive center was realized in mid-2011 by Bellhaven geologists during routine reconnaissance geological mapping and sampling. Geologists encountered potassic altered (biotite-magnetite) porphyry with quartz-chalcopyrite veins in some of the sparse outcrops in the area.
The G1 Porphyry has a crowded porphyritic appearance with a phenocryst to matrix ratio of 60% to 40%. Phenocrysts are comprised of 55% plagioclase and 5% amphibole (hornblende?). Quartz and biotite phenocrysts are absent. Euhedral plagioclase phenocrysts range in size from 0.5 x 1 mm to 2 x 3 mm with sparse, larger phenocrysts 3 x 5 mm in size. Amphibole occurs as 0.5 x 2 mm to 2 x 4 mm euhedral phenocrysts. Accessory minerals consist of 1-3% fine-grained disseminated magnetite.
Most commonly the G1 Porphyry exhibits moderate to strong argillic alteration which largely masks the possible presence of earlier propylitic or potassic alteration. Locally weak to moderate potassic alteration is observed as secondary biotite, magnetite and actinolite with only weak potassium feldspar development.
G1 porphyry appears to be the earliest porphyry developed at La Garrucha and is in contact with Combia Formation volcanic rocks along its outer margins. Biotite hornfels superimposed on the volcanic rocks occurs along the G1-volcanic contact.
Resource Development Associates Inc.
Effective Date July 24, 2023
GoldMining Inc. NI 43-101 Report – La Mina Project | Page 46 |
The G2 porphyry intrudes and brecciates the G1 Porphyry. These contact relationships have been seen at the surface and in drill core. The G2 Porphyry is texturally distinct from G1 and is characterized by a phenocryst: matrix ratio of 30:70 and a hiatal texture. As such, G2 has a less crowded appearance in hand specimen due to the great percentage of fine-grained matrix. Phenocrysts are comprised of 25% plagioclase and 5% amphibole (hornblende?). Subhedral plagioclase is typically 1 x 1.5 mm in size whereas subhedral to euhedral amphiboles range in size from 0.3 x 2 mm to 0.5 x 2 mm. Accessory minerals consist of 1% fine-grained disseminated magnetite.
The G2 Porphyry is characterized by potassic alteration that includes both biotite and potassium feldspar-bearing assemblages. Magnetite and actinolite (?) occur with the biotite and potassium feldspar and also occur as a common alteration assemblage without significant secondary biotite.
The G4 Porphyry has only been encountered in drill core. It has a phenocryst: matrix ratio of 70:30 and is characterized by 35% - 50% subhedral to euhedral plagioclase phenocrysts that define a seriate texture and range in size from 0.2 x 0.4 mm to 3 x 4 mm. Approximately 5% - 10% amphibole phenocrysts are subhedral to euhedral and range in size from 0.2 x 0.5 mm to 0.5 x 2 mm.
Alteration in the G4 Porphyry includes strong to intense pervasive potassium feldspar and magnetite with actinolite-magnetite, propylitic, sericite, and argillic overprinting assemblages. Argillic overprinting is structurally controlled along fault zones. The potassium feldspar alteration which distinguishes G4 from G2 results in growth of feldspar phenocrysts, coarsening the crystal texture, and reduces the amount of fine-grained matrix (fine-grained matrix is more visibly crystalline). The potassium feldspar also imparts a distinct pink color cast to the rock making it more readily distinguishable from G2 porphyry.
Although G4 porphyry appears to be the core of the la Garrucha porphyry complex, it is in contact with Combia Formation volcanic rocks along its outer margins. Biotite hornfels superimposed on the volcanic rocks occurs also along the G4-volcanic contact.
Numerous breccias are associated with the emplacement of all of the porphyries. The breccias appear to be of two main types: auto-breccia and contact breccia. Auto breccias form along the margins of and within individual intrusive bodies where portions of the intrusive has partially cooled and solidified but comes in contact with unsolidified magma of the same intrusive. Contact breccia is created in several environments: a) at the contact with enclosing brittle host rocks such as the Combia Formation volcanic rocks at La Cantera, or b) with the El Limon porphyry in the Middle Zone, or c) at the contact with the younger non-mineralized G1 porphyry at La Garrucha, or d) along the contact of the Limon porphyry with the host Combia Formation. In addition to these breccias, in some parts of the deposits, there are localized zones that appear to represent the mixing of two magmas (e.g., when both were still molten or very plastic). Pebble dikes have also been encountered cutting the intrusive rocks at the La Mina Project.
Breccias at La Mina can be simple, complex or any variation in between. Alteration can impact on the ability to identify the origin of clasts and/or matrix. Breccias may be matrix or clast supported; the breccia clasts can be monolithic or heterolithic. The breccia clasts range in shape from angular to rounded and exhibit a wide range of alteration and mineralization in the clast population. Potassic altered clasts, sometimes cut by quartz-sulfide veinlets, can occur in a porphyry exhibiting significantly less alteration than the clasts indicating that there was an alteration and mineralization event that pre-dated the brecciation.
Resource Development Associates Inc.
Effective Date July 24, 2023
GoldMining Inc. NI 43-101 Report – La Mina Project | Page 47 |
The X2 porphyry at Middle Zone, discussed above, has an associated breccia now called the White Breccia (WBx). This unit is almost invariably found in contact with the X2, and appears to form a halo around it. It constitutes an intensely altered, structural boundary zone that formed as a result of the X2 intrusive phase. It contains fragments of X1 and X3, the two porphyries that were intruded by the X2 unit.
The intrusive breccias at La Mina have been named based on the composition of the intrusive that forms the breccia matrix. Thus, the X3 Breccia can contain a wide range of clasts (e.g., composition, alteration, mineralization, shape, etc.) but the common thread linking all of the X3 Breccias is the fact that the breccia matrix is X3 Porphyry.
The volcanic rocks in the immediate project area (e.g., La Cantera, the Middle Zone, El Limon, and La Garrucha) comprise a lower sequence of mafic lavas (basaltic to andesitic composition) and an upper sequence of lithic, crystal and crystal-lithic tuffs of presumed more felsic compositions. The technical team has not yet conducted any detailed work on the volcanic stratigraphy has been done to date. In the field, the volcanic rocks occur in sparse, isolated outcrops and are commonly pervasively argillized and oxidized (supergene) making rock identification difficult.
During the drilling of the La Cantera deposit, once the drill passed from the porphyry into the volcanic wall rocks, drilling typically continued for only another 30 m - 50 m before termination (as a function of alteration and mineralization). Accordingly, little was learned about the volcanic rocks from logging the drill core.
The alteration in the volcanic rocks is largely similar to the alteration in the intrusive rocks, comprising propylitic, potassic, and argillic assemblages. However, most of the volcanic rock form strong to intense biotite hornfels along this contact.
At the El Limon prospect and on the northeast margin of the Middle Zone occur what appears to be explosive diatreme or subvolcanic pebble breccia. This breccia is characterized by polymictic well-rounded clasts in a highly milled matrix. At the El Limon prospect it is conceivable that this explosive breccia removed much of the better grade mineralization leaving only narrow marginal zones of weak Au-Cu mineralized L2 porphyry.
The structural history at La Mina is gradually becoming clear as a result of three main factors: 1) evidence visible from airborne and ground geophysics, 2) mapping of surface features and inferences based on geomorphologic patterns, and 3) Middle Zone drilling, including the first oriented core holes.
There are several regional lineaments that cross the project area and these can be seen in the aerial magnetometry. The most important of these large-scale features is a prominent N-S trending lineament that parallels the N-S trending zone of anomalous magnetometry that bisects the project area. Two N30W trending regional lineaments are also present in the project area. The eastern most of these is parallel to a zone of less well-defined zones of anomalous magnetometry, anchored by the La Garrucha prospect at its southeastern most extent.
There are some faults mapped in the project area (Figure 7.3). These faults exhibit NE, NW, and EW strikes. Dips on all of the mapped faults are generally sub-vertical. The abundant vein and fracture-controlled alteration and mineralization generally lack a dominant orientation. When veins and fractures do exhibit a preferred orientation, it is commonly EW. In some areas of the property, stream cuts and ridgelines are clearly related to structural features; and this has been confirmed by drilling in the case of Middle Zone. These patterns show primarily NE and NW trends.
Resource Development Associates Inc.
Effective Date July 24, 2023
GoldMining Inc. NI 43-101 Report – La Mina Project | Page 48 |
Middle Zone drilling reveals a number of significant structures, which have been tentatively grouped as intercepts of several structural planes. The most important of these planes strikes NW though the central part of Middle Zone, and down drops both the later lithologic units and high Au-Cu mineralization on the west side. The two lobes of the Middle Zone magnetic anomaly shown in some versions of the data can be explained by offset along this NW trending fault zone.
7.6 | LA CANTERA PROSPECT GEOLOGY |
The La Cantera prospect was mapped initially by Anglo Gold Ashanti geologists at La Mina in 2002, with initial drilling in 2006. The geology was subsequently re-mapped by Bellhaven Copper and Gold geologists in 2010 and 2011 and is shown in Figure 7‑4. The resource estimate discussed in this report (released as the La Mina Technical Report dated August 29, 2011) is based on 6,579 m drilled in the La Cantera resource area: 1,452 m contained in six holes drilled by AngloGold Ashanti/Bema Gold in 2006 and 4,953 m contained in 13 holes drilled by Bellhaven in 2010 and 2011. The La Cantera drilling was conducted on two N-S lines, three NW-SE lines, and two NE-SW lines to an approximate depth of 550 m.
Porphyry-related alteration and mineralization at the La Cantera prospect outcrops on the surface. The surface projection of the intrusive center measures approximately 200 m EW by 200 m NS. The porphyry-related alteration and mineralization has been traced from surface to a depth of 550 m and is open at depth. The La Cantera prospect geology is relatively well understood. The volcanic rocks of the Combia Formation were intruded by the C1 Porphyry with both contact and auto breccias forming at the margins of the C1 Porphyry. Subsequently the C1 Porphyry, C1 Breccia, and the Combia Formation volcanic rocks were intruded by the X1 Porphyry and auto breccias formed at the contact of X1 Porphyry with the C1 Porphyry and C1 breccia (Figure 7‑5). Small amounts of X2 Porphyry subsequently intruded the X1 Porphyry.
Resource Development Associates Inc.
Effective Date July 24, 2023
GoldMining Inc. NI 43-101 Report – La Mina Project | Page 49 |

Figure 7‑4 Surface Geology of the La Cantera Prospect Showing the Location of the Drill Holes
Resource Development Associates Inc.
Effective Date July 24, 2023
GoldMining Inc. NI 43-101 Report – La Mina Project | Page 50 |
Figure 7‑5 North-South Cross Section (Looking West) of Geology through the La Cantera Deposit
7.7 | LA CANTERA PROSPECT ALTERATION |
The observed alteration at La Cantera is typical of a gold-copper porphyry deposit: a potassic (calcic) core and an outer propylitic zone. Sericitic and intermediate argillic alteration assemblages are typically structurally controlled and can be observed overprinting the potassic and propylitic zones.
Resource Development Associates Inc.
Effective Date July 24, 2023
GoldMining Inc. NI 43-101 Report – La Mina Project | Page 51 |
Potassic alteration is present as both biotite- and potassium-feldspar-bearing assemblages. Much of the potassic alteration is vein and fracture controlled. Common vein and fracture types include: 1) potassium feldspar “A” veins, 2) quartz veins with potassium feldspar selvages, 3) quartz-magnetite veins 4) hairline, anastomosing biotite fractures and 5) magnetite veins. The pervasive biotite alteration appears to have formed as a reaction between the hydrothermal fluids and primary magmatic mafic minerals. Much of the C1 Porphyry and C1 Breccia are pervasively altered to a biotite-magnetite assemblage wherein the mafic phenocrysts and porphyry matrix are replaced by biotite-magnetite. Volcanic rocks of the Combia Formation are also altered to biotite- and potassium feldspar-bearing assemblages near contacts with C1 Porphyry and C1 Breccia. As a result, the gold-bearing rocks are highly magnetic which creates a sharp contrast with the barren and weakly magnetic intermediate argillic altered rocks as well as the non-magnetic sericite-altered rocks surrounding the potassic core. Potassium feldspar-bearing alteration is locally widespread and pervasive but more commonly exists as irregularly shaped patches as a partial to total replacement of earlier biotite-bearing alteration assemblages. An example of pervasive biotite-magnetite-actinolite alteration in C1 Porphyry is shown in Figure 7‑6.
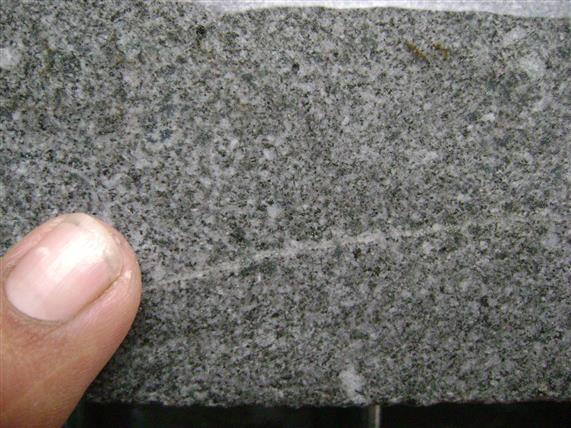
Figure 7‑6 LMDDH-008-288m. C1 Porphyry with Pervasive Biotite-Magnetite Alteration of the Matrix and Actinolite Alteration of Primary Magmatic Mafic Phenocrysts
Calcic alteration is represented by actinolite amphibole-bearing alteration. This amphibole is dark green in color and although not verified by thin-section petrography, it is interpreted as actinolite by analogy to other copper-gold porphyry deposits in the Middle Cauca Belt (e.g., Quebradona and La Colosa) where it has been identified as actinolite. The actinolite occurs in three different vein and fracture types: 1) potassium feldspar-actinolite ± actinolite vein selvages, 2) magnetite veins with actinolite halos and 3) actinolite ± chalcopyrite ± bornite veins and fractures. The actinolite amphibole also occurs as selective replacement of earlier secondary biotite which itself had originally replaced igneous amphibole or biotite phenocrysts. The presence of actinolite in the alteration assemblage is typically a good indicator of gold and copper mineralization.
At least four different phases of vein and fracture-controlled potassic and calcic alteration and mineralization have been recognized and, in order of their paragenetic sequence, include:
| | ● | Early hairline biotite fractures in zones of intense potassic alteration |
| | ● | Magnetite-actinolite ± chalcopyrite ± bornite veins and fractures which can reach a vein density of 30 per meter |
Resource Development Associates Inc.
Effective Date July 24, 2023
GoldMining Inc. NI 43-101 Report – La Mina Project | Page 52 |
| | ● | Quartz-magnetite-actinolite ± chalcopyrite ± bornite veins and fractures which cut the magnetite-actinolite veins and fractures and which can reach a vein density of approximately 10 per meter. These veins and fractures are the principal source of mineralization in the La Cantera prospect |
| | ● | Quartz-magnetite veins are commonly banded in appearance and do not carry significant mineralization. |
An example of the superposition of multiple episodes of vein and fracture-controlled alteration and mineralization is shown in Figure 7‑7.
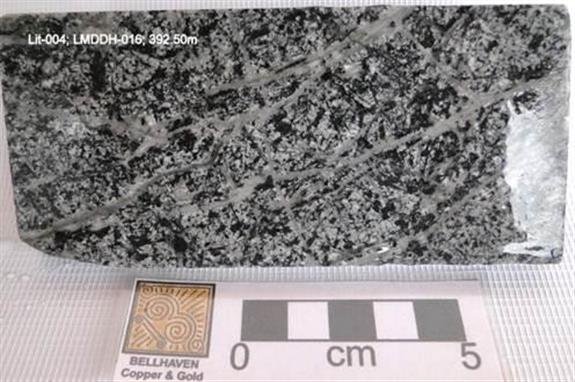
Figure 7‑7 LMDDH-016 392.5m. C1 Breccia with Potassic Alteration (Magnetite-k-Feldspar +/- Actinolite) Cut by Sheeted Magnetite Veins, Quartz Magnetite Stockwork Veins and Late Pyrite-filled Fractures
Sericitic alteration is represented by the mineral assemblage quartz-sericite-pyrite and is observed to a greater or lesser extent away from the potassic core but also replacing earlier potassic alteration. Sericitic alteration can be pervasive but much of the sericitic alteration is associated with quartz-pyrite veins with sericite selvages, the so-called “D” veins observed at El Salvador, Chile (Gustafson and Hunt, 1975).
Propylitic alteration is represented by two different mineral assemblages: 1) a “proximal” epidote- chlorite-illite-calcite assemblage and 2) a more widespread, “distal” chlorite-illite-calcite assemblage. Mafic phenocrysts are replaced by chlorite and calcite; plagioclase phenocrysts are partially to totally replaced by both epidote-calcite and illite-calcite. Propylitic alteration is found mostly in the Combia Formation volcanic rocks and X1 Porphyry and X1 Breccia. Propylitic alteration, if originally present in C1 Porphyry and C1 Breccia, has largely been overprinted by the potassic alteration.
Argillic alteration, both hypogene and supergene, is structurally controlled and is associated with faults, breccias and fractures and includes both chlorite and “clay”-bearing assemblages. Argillic alteration is the youngest alteration event preserved at La Cantera.
Resource Development Associates Inc.
Effective Date July 24, 2023
GoldMining Inc. NI 43-101 Report – La Mina Project | Page 53 |
7.8 | LA CANTERA PROSPECT MINERALIZATION |
The principal minerals associated with the Au-Cu porphyry mineralization at La Mina are chalcopyrite and lesser bornite, both with associated gold mineralization. Secondary copper minerals (chalcocite, azurite, malachite and chrysocolla) do occur locally in the upper portions of the La Cantera prospect. Overall gold mineralization greater than 0.3 g/t Au is sulfide-poor and typically contains less than 1% total sulfides. In this type of mineralization chalcopyrite ± bornite are more abundant than pyrite.
Minor silver, lead, and zinc mineralization is associated with calcite ± quartz-tetrahedrite-sphalerite veins that cut earlier potassic alteration. These veins may be related to argillic alteration, which is commonly present where these veins are found.
The most sulfide-rich with alteration and mineralization at La Cantera are the sericitic and argillic assemblages that commonly contain more than 3% total sulfides. However, this mineralization typically contains less than 0.3 g/t Au and is not economically important.
The typical habit of the ore minerals can be summarized as follows:
| | ● | Chalcopyrite occurs in veinlets or as disseminated grains with secondary biotite, potassium feldspar and/or actinolite. Locally chalcopyrite occurs as clots with or without pyrite and it can be associated with bornite. In the C1 Porphyry and C1 Breccia chalcopyrite occurs in quartz-pyrite and potassium feldspar-actinolite “A” veins. Chalcopyrite, with and without bornite, also occurs in sulfide veins and fractures with pyrite and in veins with anhydrite and in veins with gypsum. |
| | ● | Bornite is less abundant than chalcopyrite but it occurs in the same habits as, and virtually always with, chalcopyrite. Additionally, it occurs as anhedral crystals, often displaying exsolution patterns, associated with chalcopyrite or occurring as a replacement of chalcopyrite. |
| | ● | Gold is usually associated with chalcopyrite and bornite and to a lesser extent with tetrahedrite and filling fractures in chalcopyrite grains. |
| | ● | In addition to the calcite ± quartz - sphalerite veins described previously, tetrahedrite also locally forms subhedral crystals or grains associated with chalcopyrite or bornite. |
| | ● | In addition to the calcite ± quartz - tetrahedrite veins described previously, sphalerite can be found occurring as anhedral grains with chalcopyrite ± bornite ± pyrite. |
| | ● | In general, the mineralogy of the La Cantera system appears “clean” in that there are few minerals or elements that would negatively impact favorable response to standard metallurgical processes. |
| | ● | An example of the distribution of and lithological controls on gold mineralization at the La Cantera deposit is shown in Figure 7‑8. Note the sharp breaks of the >0.5 g/t Au mineralization at contacts between C1 Porphyry and Breccia with X1 Porphyry and Breccia. In general, the >0.5 g/t Au mineralization does not extend significantly into the post-mineralizing X1 Porphyry or Breccia. |
Resource Development Associates Inc.
Effective Date July 24, 2023
GoldMining Inc. NI 43-101 Report – La Mina Project | Page 54 |
Figure 7‑8 Drill Hole Intercepts with >0.5g/t Au in the La Cantera Prospect
7.9 | MIDDLE ZONE PROSPECT GEOLOGY |
The Middle Zone prospect was mapped and drilled during work by Bellhaven geologists starting in 2010. The surface geology of the Middle Zone prospect is shown in Figure 7‑9. In total, 54 holes were drilled at the Middle Zone prospect. The resource estimate discussed in this report is based on all 54 drill holes totaling 18,944 m of diamond core drilling. The Middle Zone drilling was conducted on one N-S line, six NW-SE lines, and four NE-SW lines to a maximum depth of 680 m below surface.
Resource Development Associates Inc.
Effective Date July 24, 2023
GoldMining Inc. NI 43-101 Report – La Mina Project | Page 55 |
Porphyry-related alteration and mineralization at the Middle Zone prospect outcrops in some areas, and the elongate surface projection of the intrusive center measures approximately 300 m NW-SE by 400 m NE-SW. The porphyry-related alteration and mineralization has been traced from surface to a depth of 680 m and is open at depth. All intrusive units, regardless of their relationship to the mineralizing events, show similar rock types, and also show great similarity to those at La Cantera. The volcanic rocks of the Combia Formation were first intruded by the extensive, pre-mineralization L1 porphyry with marginal contact breccias. Subsequently both the L1 porphyry and volcanic rocks were intruded by the mineralizing X3 porphyry and breccia units (low copper/gold ratio), and later by the mineralizing X1 porphyry and breccia units (high copper/gold ratio). Mineralization occurring during these phases affected pre-existing units. For example, the L1 porphyry (normally barren) is mineralized in some locations near the X3 unit, and mineralization in the X3 unit has been augmented in some areas close to the later X1 unit. There are also areas of un-mineralized X3 and X1 distal to the center of the Middle Zone. This phenomenon has been observed in drilling to the north and northeast. The post-mineralizing X2 unit (which is analogous to the X1 unit at La Cantera) forms an alternating pod- or dike-like body that has intruded opportunistically along zones of weakness into the Middle Zone. Gold and copper values in this unit are very low, an order of magnitude less than in the surrounding L1 porphyry and volcanic units. However, the X2 intrusive is associated with the White Breccia, a strongly fractured and altered unit that often forms a halo around the X2. The White Breccia is mineralized according to the density and nature of X3 and/or X1 fragments.
The Middle Zone exhibits a structural influence not seen at La Cantera. The mineralizing intrusive units are fault bound on the southwestern side by a feature striking NW. Another major feature runs through the center of Middle Zone, also striking NW, which appears to have down dropped the western half of the deposit. This displacement is most apparent along the X1 and X2 units, and is clear from the distribution of higher copper grades within the X1. A series of other faults with approximate NS trends occur throughout the Middle Zone, which do not provide clear evidence for displacement.
Resource Development Associates Inc.
Effective Date July 24, 2023
GoldMining Inc. NI 43-101 Report – La Mina Project | Page 56 |
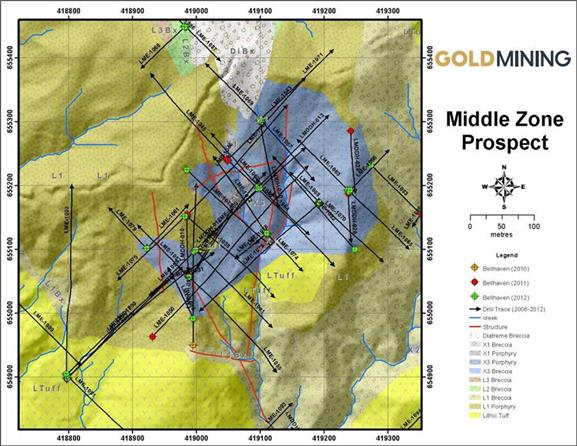
Figure 7‑9 Surface Geology and Drill Holes Used in Resource Estimate at Middle Zone Prospect
7.10 | MIDDLE ZONE PROSPECT ALTERATION |
The observed alteration at Middle Zone is typical of a gold-copper porphyry deposit, thus very similar to that described for La Cantera prospect in Section 7.6 a potassic (calcic) core and an outer propylitic zone. Sericitic and intermediate argillic alteration assemblages are typically structurally controlled and can be observed overprinting the potassic and propylitic alteration.
Some alteration features particular to Middle Zone that are not observed at La Cantera are as follows:
| | 1. | A strong halo of argillic alteration on the north and northeast sides of the deposit. This alteration penetrates the X1 and X3 units, and in some cases may have overprinted pre- existing mineralization (e.g., pyrite replacing magnetite in veins). This halo of argillic alteration is devoid of significant gold and copper. As with La Cantera, the argillic alteration appears to be a later event. |
| | 2. | An intense clay alteration is characteristic of the WBx (White Breccia) unit that is often found at the boundaries of the post-mineralizing X2 unit. |
In addition, veining at Middle Zone exhibits a distinct paragenetic sequence, for the most part observed in the following order:
| | ● | Early sinuous quartz veins and hairline magnetite-actinolite-chalcopyrite veins |
| | ● | Several styles of quartz veins with magnetite at the vein boundaries |
| | ● | Banded quartz veins and sinuous quartz-magnetite-actinolite-chalcopyrite veins |
| | ● | Quartz veins with pyrite and chalcopyrite along the centerlines |
Resource Development Associates Inc.
Effective Date July 24, 2023
GoldMining Inc. NI 43-101 Report – La Mina Project | Page 57 |
| | ● | Anhydrite-pyrite-chalcopyrite-bornite veins (bornite rare), pyrite-calcite-magnetite veins |
| | ● | Quartz-calcite-pyrite-sphalerite-galena veins |
| | ● | Quartz-gypsum and quartz-gypsum-pyrite veins |
7.11 | MIDDLE ZONE PROPSECT MINERALIZATION |
The principal ore minerals associated with the Au-Cu porphyry mineralization at Middle Zone consist of chalcopyrite, pyrite, and, in very rare cases, bornite. Secondary copper minerals (chalcocite, cuprite, malachite and chrysocolla) do occur locally in the shallow portions at Middle Zone prospect; they represent supergene alteration of primary hypogene copper mineralization. Generally, gold mineralization greater than 0.3 g/t Au occurs with sulfides, but total sulfide content is normally less than 3% (with pyrite > chalcopyrite).
Unlike La Cantera, Middle Zone mineralization falls into two distinct classes. The first is Au-rich, relatively Cu poor mineralization occurring in the X3 and X3 Breccia. It occurs at relatively shallow levels, primarily where the X3 unit drapes over the X1 Porphyry. In Figure 7‑10, examples of this mineralization type are marked in ellipses labeled ‘A’. The second mineralization type is Cu-rich with variable Au, and predominates in the X1 Porphyry and X1 Breccia units. In Figure 7‑10, examples of this type are shown in the ellipse labeled ‘B’. The deepest drilling in Middle Zone terminates in this second mineralization type.
Resource Development Associates Inc.
Effective Date July 24, 2023
GoldMining Inc. NI 43-101 Report – La Mina Project | Page 58 |
Figure 7‑10 NE-SW Cross Section through Middle Zone, Showing Significant Intercepts. Labels A and B Refer to the Two Distinct Mineralization Types
Minor silver, lead, and zinc mineralization is associated with cross-cutting calcite ± quartz- sphalerite-galena veins (late in the paragenetic sequence, as listed in the previous section). These veins are more common in the pervasive argillic alteration zone peripheral to the deposit. They also occur in contact margins between early and late porphyries. In the latter case, sub- epithermal veins occur predominantly in fault zones.
The most sulfide-rich zones at Middle Zone are the pyrite-rich argillic assemblages, where it is thought the sulfide has replaced magnetite during overprinting of potassic alteration. Pyrite content can exceed 6%. However, this mineralization invariably contains less than 0.3 g/t Au and is not economically important.
The typical habits of mineralization can be summarized as follows:
| | ● | Chalcopyrite occurs mainly in veinlets, or as disseminated grains with secondary biotite, potassium feldspar and/or actinolite. In the X3 Porphyry and X3 Breccia, chalcopyrite occurs in pink quartz-pyrite “A-type” veins; it may also occur as disseminations in fine matrix breccia with or without grey silica clasts. |
Resource Development Associates Inc.
Effective Date July 24, 2023
GoldMining Inc. NI 43-101 Report – La Mina Project | Page 59 |
| | ● | Chalcopyrite and magnetite also occur as very thin, hair-like veinlets, at borders or in the centerlines of pink quartz veins. This is common when the porphyry units show actinolite–magnetite alteration. |
| | ● | Chalcopyrite associated with pyrite in veins and fractures, and in veins with gypsum, which cut all veins and structures described previously. |
| | ● | In calcite ± quartz – sphalerite - galena veins, chalcopyrite also locally forms subhedral crystals or grains associated with pyrite. |
As with La Cantera, the mineralized mineralogy at Middle Zone appears “clean” in that there are few minerals or elements that could negatively impact favorable response to standard metallurgical processes.
7.12 | LA GARRUCHA PROSPECT GEOLOGY |
The La Garrucha prospect is a current exploration target for GoldMining at the La Mina Project. Routine surface mapping and sampling in 2011 indicated the presence of porphyritic intrusive rocks containing Au values up to 1.5 g/t Au in outcrop. Initial diamond drilling commenced in July 2011 with 6 drill holes (LME-1037, LME-1039, LME-1040, LME-1042, LME-1044 and LME-1047) completed. At the time drill holes were stopped before crossing the boundary of the adjacent AngloGold Ashanti Corporation license area to the east of the La Mina concession. The 2011 drilling indicated the presence of significant porphyry-style alteration and mineralization. A second drilling campaign of 4 drill holes (LME-1095, LME-1096, LME-1097 and LME-1098) in 2012 successfully intersected high-grade porphyry-style mineralization in hole LME-1096 and an intensely altered new (G4) porphyry, within the last 10 m of drill core averaging 1.09 g/t Au and 0.20% Cu.
Upon finalization of the acquisition of the AGAC license systematic soil sampling, surface mapping, and rock-channel sampling further defined the most prospective area of porphyry mineralization to guide diamond drilling. Diamond drilling at La Garrucha resumed in May 2013 and 7 holes were completed (LME-1100, LME-1101, LME-1102, LME-1103, LME-1104, LME-1105 and LME-1106).
In March 2022, an additional 5 holes were drilled (LME-1107, LME-1108, LME-1109, LME-1110 and LME-1111).
Porphyry-related alteration and mineralization at the La Garrucha prospect outcrops in some areas along stream beds and areas of steep topographic relief. Results from diamond drilling to date suggests that the elongate (330o azimuth) core of the airborne magnetic anomaly outlines the surface projection of the area containing mineralized G2 and G4 porphyries. Porphyry-related alteration and mineralization has been traced from surface to a depth of 500 m over a width of some 200 m and is open at depth.
The porphyry complex at La Garrucha consists of at least 3 distinct porphyry events consisting of G1, G2 and G4 and their respective intrusive and contact breccias. The earliest porphyry, G1, intruded Combia Formation volcanic rocks. G1 event breccias occur near the volcanic contact and contains clasts of volcanic rock and G1 porphyry. Local zones of G1 auto breccia occur within the G1 porphyry. G2 porphyry intrudes the G1 and G1 breccias. G1 occurs as well crystallized porphyry, dykes, auto breccia and contact breccia with G1 porphyry. The G4 porphyry is believed to be the core of the porphyry complex at La Garrucha and hosts much of the Au-Cu mineralization. Similar to G2 porphyry, G4 breccias form within and along the margins of the G4 porphyry. Core logging suggests there is a late porphyry event represented by minor dikes of andesitic composition cutting the previous events The G4 porphyry have come in contact with the volcanic Combia rocks in the southeast part of the complex
Resource Development Associates Inc.
Effective Date July 24, 2023
GoldMining Inc. NI 43-101 Report – La Mina Project | Page 60 |
La Garrucha appears thus far to be more structurally similar to La Cantera in that does not appear to be broken up by post-mineral cross faults like the Middle Zone. However, throughout the porphyry complex there are numerous steep angle fault zones often exhibiting clay gouge over several meters either side of the fault. Occasionally however the faults exhibit intensely crushed and fractured rock rather than gouge over several meters. Faults are frequently observed along lithologic contacts particularly between porphyries and breccia. No significant fault offsets are known to date.
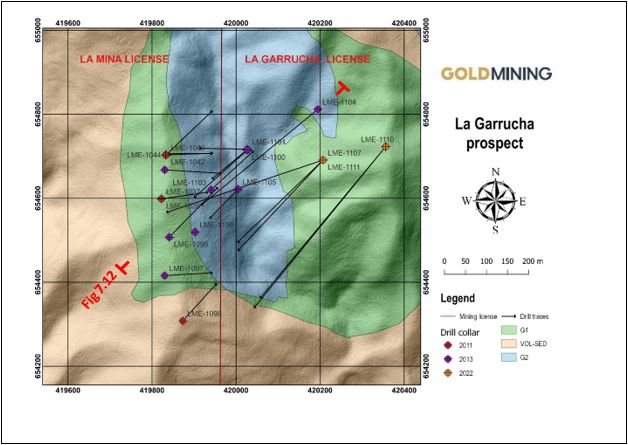
Figure 7‑11 Surface Geology of Drill Holes at La Garrucha
Resource Development Associates Inc.
Effective Date July 24, 2023
GoldMining Inc. NI 43-101 Report – La Mina Project | Page 61 |
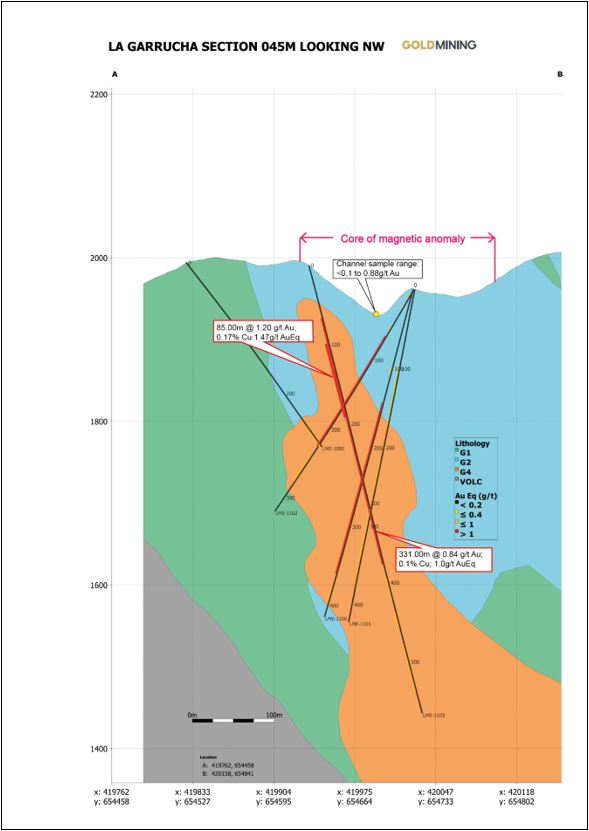
Figure 7‑12 NE-SW La Garrucha Cross Section
Resource Development Associates Inc.
Effective Date July 24, 2023
GoldMining Inc. NI 43-101 Report – La Mina Project | Page 62 |
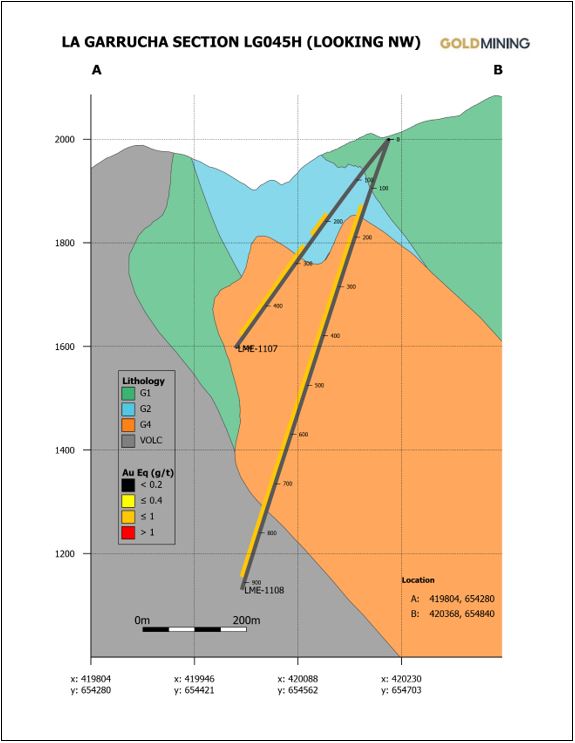
Figure 7‑13 NE-SW La Garrucha Cross Section
Resource Development Associates Inc.
Effective Date July 24, 2023
GoldMining Inc. NI 43-101 Report – La Mina Project | Page 63 |
Figure 7‑13 NE-SW La Garrucha Cross Section
Resource Development Associates Inc.
Effective Date July 24, 2023
GoldMining Inc. NI 43-101 Report – La Mina Project | Page 64 |
7.13 | LA GARRUCHA PROSPECT ALTERATION |
The observed alteration at La Garrucha is typical of a gold-copper porphyry deposit, thus very similar to that described for La Cantera and Middle Zone prospects in Section 7.6: a calcic-potassic core, grading out to sodic-calcic, and an outer argillic zone. Magnetite alteration is ubiquitous throughout all of the porphyry phases and intensifies where porphyries or their breccias come in contact. Typically, the magnetite is destroyed and replaced by pyrite in sericitic alteration zones and argillized fault zones. Sericitic alteration in the form of quartz-sericite-pyrite (QSP) appears to be structurally controlled and is observed overprinting the potassic, sodic-calcic, and local areas of propylitic alteration. A particular type of late-stage quartz - sulphide +/-carbonate vein set, up to several cm wide, invariably is enveloped by varying widths of QSP alteration, typically over intervals less than one meter but can be over 10s of meters where numerous veins occur at regular intervals over a number of meters.
Typically, from the outer margin of G1 porphyry, we encounter weak to moderate argillic (clay) alteration overprinting an inner sodic-calcic alteration zone of actinolite-magnetite. More proximal to the later G2 porphyry, moderate to intense secondary biotite and biotite magnetite alteration prevails within G1 porphyry and breccia. Later alteration associated with emplacement of G4 comprises moderate potassic alteration in the form of biotite distal to G4, and potassium feldspar proximal to the G4 porphyry. Typically, where G2 is within several meters of G4 porphyry G2, porphyry is strongly potassium feldspar flooded, exhibited by an increase in the potassium feldspar in the groundmass and an increase in the quantity of potassium feldspar selvedges along fractures and quartz veins. Late-stage overprinting of both potassic and sodic-calcic alteration comprises local-to-pervasive weak propylitic alteration consisting of chlorite, epidote and calcium carbonate.
The G4 porphyry is intensely potassium feldspar-altered. To the naked eye, it is readily distinguished from G2 by its coarse crystalline texture and marked pink color, while G2 is typically darker and has a hiatal porphyritic texture. Where alteration is most intense G4 porphyry has almost no crystalline texture visible and is almost totally composed of massive potassium feldspar magnetite. Although this is not extensive, it is locally common in 10 cm - 30cm patches. Later sodic-calcic alteration (actinolite-magnetite) overprints the potassic alteration giving the porphyry a dark greenish-pink cast. Preliminary observations suggest these areas contain somewhat higher Au-Cu values.
In conjunction with wall-rock alteration the La Garrucha porphyries are cut by a variety of porphyry style veins in varying amounts. The veins are typically composed of various combinations of quartz, magnetite, magnetite-sulphide, quartz-magnetite, quartz-magnetite-sulphide, quartz-sulphide and quartz-carbonate-sulphide. Preliminary paragenesis of these veins based on observations from 13 drill holes is as follows:
| | ● | Early magnetite veins, often hairline in size, cut by all other vein types |
| | ● | Quartz-chalcopyrite ± bornite centerline veins with <1 mm centerline of chalcopyrite in semi-otherwise translucent quartz; typically, several close spaced generations of this vein type as often times these cut similar quartz-chalcopyrite ± bornite centerline veins. |
| | ● | Quartz-magnetite ± chalcopyrite ± bornite veins with magnetite along inside margin of quartz vein |
| | ● | Quartz-magnetite ± chalcopyrite ± bornite centerline veins (magnetite along centerline) |
| | ● | Quartz-pyrite veins with sericite envelopes |
| | ● | Quartz-carbonate ± pyrite ± sphalerite ± stibnite |
Resource Development Associates Inc.
Effective Date July 24, 2023
GoldMining Inc. NI 43-101 Report – La Mina Project | Page 65 |
7.14 | LA GARRUCHA PROSPECT MINERALIZATION |
The principal ore minerals associated with the Au-Cu porphyry mineralization at La Garrucha consist of chalcopyrite and lesser amounts of bornite and covellite. Secondary copper minerals (chalcocite, cuprite, malachite and chrysocolla) do occur locally in the shallow portions at La Garrucha but are rare and do not account for significant Au-Cu values volumetrically. Pyrite mineralization for the most part is low at La Garrucha except where secondary QSP alteration has overprinted magnetite. Typically, the total sulphide content of the gold-copper zone at La Garrucha is less than 2% whereas the magnetite content averages approximately 3% - 5%.
Chalcopyrite is much more common than bornite. Bornite typically occurs in trace amounts and usually indicates higher Au values. Chalcopyrite occurs as disseminations and in various veins types as disseminations, patches and ribbons. In a typical moderately-to-well mineralized zone at La Garrucha the chalcopyrite will rarely exceed 1 vol% and typically averages 0.3 to 0.4 vol%. Chalcopyrite in veins however can make up to 20% by volume but these veins are typically less than 1 mm - 2 mm wide.
For the most part the tenor of the Au-Cu mineralization at La Garrucha is reflected in the presence of quartz veins and hydrothermal magnetite. However, in some instances there is little difference in Au-Cu grades between rocks containing 5 vol% quartz veins and rocks containing 25 vol% quartz veins. For lithologies exhibiting identical alteration intensities the Au-Cu content will be low (typically less than 0.30 g/t Au) where quartz veins are absent.
Minor silver, lead, and zinc mineralization is associated with cross-cutting quartz-calcite-sphalerite-galena veins (late in the paragenetic sequence, as listed in the previous section). These veins are more common at La Garrucha than Middle Zone and La Cantera. At La Garrucha they are more common in G1 porphyry and breccia than G2 porphyry and breccia and much less common in the G4 porphyry and breccia.
7.15 | EL LIMON PROSPECT GEOLOGY |
The Limon complex measures approximately 800 m in diameter of a sub-circular shape in plan-view. The Limon porphyry complex partially encircles the Middle Zone to the north, west and south. Within the complex are two known mineralizing porphyry systems, the Middle Zone prospect and the El Limon prospect. Argillic and propylitic alternation assemblages occur high in the system at the El Limon prospect. A possible explosive diatreme at El Limon suggests that the El Limon prospect porphyry is situated high vertically in the porphyry system. This may account for why the El Limon prospect is weakly mineralized. It may well be that higher grades of gold and copper occur at depth where a possible potassic alteration zone occurs associated with an undiscovered porphyry stock.
Resource Development Associates Inc.
Effective Date July 24, 2023
GoldMining Inc. NI 43-101 Report – La Mina Project | Page 66 |
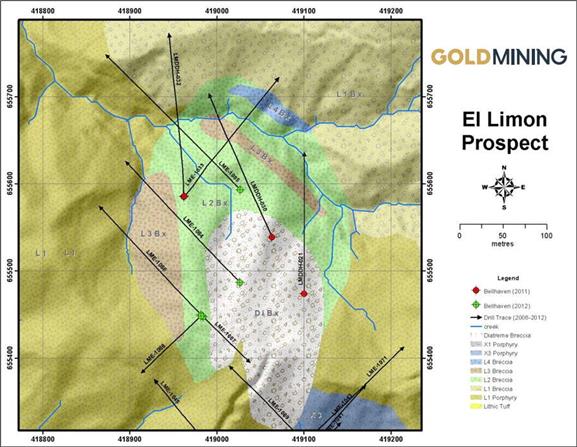
Figure 7‑14 El Limon Prospect Geology
7.16 | EL LIMON PROPSECT ALTERATION |
Alteration at the El Limon prospect is variable as at the other prospects. The L1 porphyry is for the most part, strongly overprinted by argillic alteration assemblages. Near its contact with the X3 porphyry it can exhibit weak-to-moderate biotite-magnetite alteration. Breccia clasts of L1 within the X3 porphyry typically exhibit moderate to strong relic biotite alteration. In the area of drill holes LMDDH-021 and -030, at considerable depth secondary potassium feldspar and magnetite and/or biotite are prevalent.
The L2 porphyry is moderately to strongly overprinted by propylitic assemblages with the development of considerable epidote-calcite patches and partial vein infill. Amphiboles are partially-to-completely replaced by a mix of epidote-calcite-magnetite. Where propylitic alteration is weak the original alteration of actinolite-magnetite prevails.
Secondary biotite alteration defines the L3 porphyry. The biotite is typically medium grained (1 mm - 2 mm length) euhedral, and evenly distributed throughout the porphyry.
7.17 | EL LIMON PROSPECT MINERALIZATION |
Gold-copper mineralization at El Limon is sporadic and associated with the L2 porphyry event and the strong potassic alteration (potassium feldspar-magnetite and biotite-magnetite) event cutting the L1 porphyry at depth in drill holes LMDDH-021 and 030. Mineralization in the potassic zones of LMDDH-021 and 030 is comprised of chalcopyrite disseminations in weakly developed quartz and quartz-magnetite veins. Mineralization in the L2 porphyry and associated L2 breccia of small amounts of chalcopyrite within quartz veins, quartz-magnetite veins, magnetite veins and fine-grained disseminations in the porphyry. Unfortunately, the L2 porphyry is small in extent and the Au-Cu grades observed are even much lower than the grades of the Middle Zone, typically in the 0.20 g/t Au range with less than 0.10% Cu. As a result, further exploration of the El Limon prospect is of low priority.
Resource Development Associates Inc.
Effective Date July 24, 2023
GoldMining Inc. NI 43-101 Report – La Mina Project | Page 67 |
The La Mina Property hosts copper-gold mineralization associated with sub-volcanic porphyry stocks intruding a late Miocene-age volcanic-sedimentary sequence of the Combia Formation. These rocks are related to an extensive magmatic arc that developed along the northern South American plate margin (the Chocó block margin).
Past and current exploration in and around the La Mina district has been aimed at Au-Cu porphyry, and/or epithermal Au styles of mineralization. In the specific cases of La Cantera Middle Zone, and La Garrucha the principal style of mineralization can be classified as Au-Cu porphyry.
Porphyry deposits are typically large low- or medium-grade deposits usually associated with a combination of gold, copper, plus other base metals. Porphyry deposits occur in a variety of tectonic settings; along the South American Andes Mountains they can be related to the roots of andesitic stratovolcanoes along subduction zones as well as continental-island arc settings. While some older examples of porphyries are known, most are associated with young, Tertiary-aged volcanic-igneous rocks. However, mineralization can extend into the surrounding sedimentary or volcanic host rocks.
Mineralization can occur in various styles and many combinations of disseminations, veins, stockwork, fractures, and breccias. As in the case of La Mina, multi-phase intrusions and inter-mineral phases are important factors in assessing porphyries, along with their wall-rock conditions, host rocks, structural conduits, and various chemical parameters (pH, water content, etc.).
A particular characteristic of porphyry deposits is the extent of their alteration halos as a result of abundant hydrothermal activity streaming from depth; these features in turn drive the applicable exploration methods for “vectoring” towards the center of this type of deposit. Therefore, geochemical surveys are a useful tool to map the large dispersion halos around the core porphyry center using stream sediments, soil sampling, or rock-chip sampling for the principal economic elements of interest or various pathfinder elements.
The dispersed nature of sulfide distribution is also conducive to the application of various geophysical methods, either ground-based or using fixed-wing or helicopter-borne instruments. Magnetics, Induced Polarization, and radiometric geophysical surveys can be successfully used to outline alteration dispersion patterns and have all been applied to varying degrees in exploring the La Mina Property.
Therefore, exploration at La Mina is focused on discovering porphyry-style mineralization using a wide set of exploration techniques for this style of deposit.
Resource Development Associates Inc.
Effective Date July 24, 2023
GoldMining Inc. NI 43-101 Report – La Mina Project | Page 68 |
Since acquiring an option on the Property in mid-2010 and until 2016, Bellhaven advanced exploration by conducting detailed mapping and trenching at La Cantera and Middle Zone, mapping and channel sampling at La Garrucha, mapping, rock-chip sampling and trenching throughout the project area, various ground geophysical surveys, and re-logging and re-interpretation of drill core from previous drilling campaigns. Furthermore, two airborne magnetic surveys have been flown over the La Mina Project at no cost to Bellhaven. AngloGold Ashanti flew the first survey and Colombia Crest flew the second in 2011. Ground magnetic follow-up surveys of geologically favorable areas was completed in mid-2012 and an airborne ZTEM survey was flown over much of the La Mina and La Garrucha licenses in late 2012. All of these data have been incorporated into the geophysical evaluation. Through July 2016, Bellhaven had completed a total of 106 drill holes for a total of 36,694 m. This drilling is summarized in Table 9‑1. GoldMining has not conducted any additional exploration since acquiring Bellhaven in 2017.
Within the La Mina Project, there are a total of six zones of interest for copper-gold mineralization outlined in yellow in Figure 9.1. Three of these zones are at least partially drill tested and have combined geological, geochemical and geophysical attributes that suggest that they have potential to host economic gold-copper mineralization (La Cantera, Middle Zone, and La Garrucha). Another zone (El Limon) has been cut by 8 drill holes. Results of El Limon reported limited low-grade Au-Cu mineralization but not of the size and tenor to warrant additional exploration. Two other prospects (El Oso and Media Luna) exhibit amenable geophysical and geochemical characteristics (Figure 9‑1) and are also considered to be highly prospective.
Table 9‑1 Drilling Completed by Bellhaven at La Mina
Area | Drill Holes | Meters |
La Cantera | 26 | 8,327 |
Middle Zone | 54 | 18,803 |
El Limon | 9 | 2,923 |
La Garrucha | 22 | 10,191 |
Resource Development Associates Inc.
Effective Date July 24, 2023
GoldMining Inc. NI 43-101 Report – La Mina Project | Page 69 |
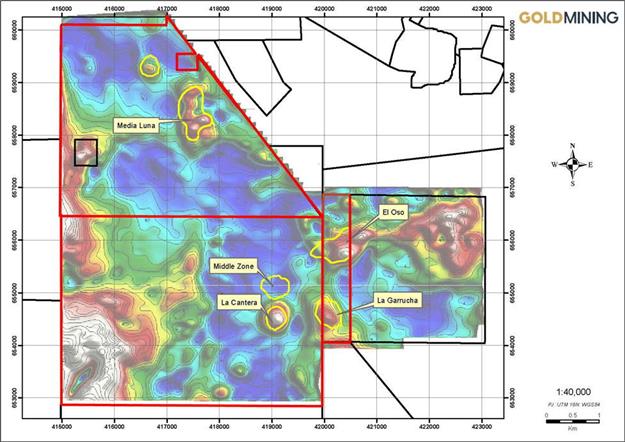
Figure 9‑1 Exploration Targets at La Mina Project
Bellhaven’s drilling programs have been carried out by Kluane Colombia SA, a subsidiary of the Canadian drill contractor Kluane Drilling Ltd. and for a short period of time in 2012 by Andina de Perforaciones S.A. also based in Colombia.
Prior to initiating its drill programs in 2010, Bellhaven completed channel sampling in trenches at Middle Zone where two surface exposures returned results of 19 m grading 0.73 g/t Au and 24 m grading 0.74 g/t Au (0.4 g/t Au cut off) separated by a zone of 40 m of unsampled trench.
In early 2012, a ground-based survey was conducted over the entire eastern half of La Mina. This program consisted of approximately 114-line kilometers of magnetic surveying and was carried out by KTTM Geophysics Limited, an independent geophysical contractor based in Medellin, Colombia.
Principal observations from correlation of the 2010 ground geophysics with geochemistry and geological features were:
| | ● | Anomalously high radiometrics (potassium) likely represents K-silicate (potassic) altered rocks. The high potassium values occur over a distance of 900 m along an approximately north-south trending corridor defined by the La Cantera-Middle Zone targets. High values also occur to the north at El Limon along an approximately east-west belt that is 500-m long. |
| | ● | High-chargeability zones fringing the drilled zones at La Cantera and Middle Zone can be attributed to rocks containing high quantities (typically 5-10 vol%) of pyrite. High-chargeability features are observed at La Cantera and Middle Zone. |
Resource Development Associates Inc.
Effective Date July 24, 2023
GoldMining Inc. NI 43-101 Report – La Mina Project | Page 70 |
| | ● | The La Cantera stock spatially coincides with a strong resistivity “low” whereas the Middle Zone is characterized by a weakly defined “low”. Another prominent area characterized by a strong resistivity “low” occurs between the El Limon and Middle Zone targets. |
In summary, exploration of the La Mina Property has been carried out using a systematic combination of geology, geochemistry, and geophysics which has identified several anomalous zones of interest. To date four of these targets have been drilled: La Cantera, the Middle Zone, El Limon, and La Garrucha with 111 drill holes for 40,269 metres completed through to September 2022. The last drill program was conducted by GoldMining at La Garrucha in 2022.
Resource Development Associates Inc.
Effective Date July 24, 2023
GoldMining Inc. NI 43-101 Report – La Mina Project | Page 71 |
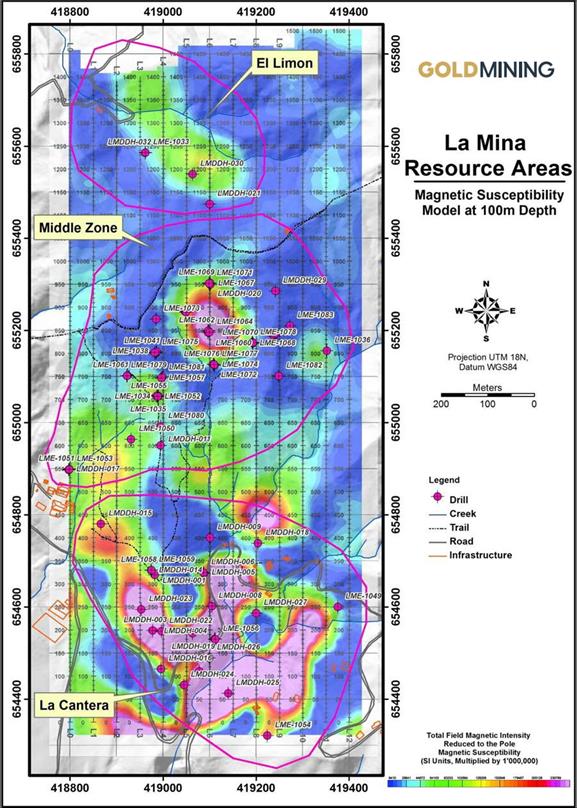
Figure 9‑2 Magnetic Susceptibility Model at 100 m Depth.
Resource Development Associates Inc.
Effective Date July 24, 2023
GoldMining Inc. NI 43-101 Report – La Mina Project | Page 72 |
Drilling programs by AngloGold Ashanti (2005) and Bellhaven in (2010 - 2013) used HQ, HTW, NTW and BTW core, depending on the drill-hole depth, drill-hole inclination, drill machine availability and ground conditions. The author’s observations at site and review of core logs and assay certificates indicates that the core sampling has been carried out in a professional manner and that there are no biases in recovery or sampling error evident.
Core samples are collected on a nominal 2 m interval, except where occasional structures, core recovery, or lithological breaks are needed. Bellhaven completed a program of re-logging the early AGA holes. Re-logging of its own holes is ongoing as the current geological understanding evolves to acquire a more complete and accurate understanding of the geological lithologies and mineralization controls. Bellhaven’s logging procedure is thorough and includes recording of the following information:
| | ● | Sample Number, From – To. |
| | ● | Alteration Minerals: quartz, biotite, potassium feldspar, actinolite, albite, epidote, chlorite, sericite, calcite and clay. |
| | ● | Mineralization, volume %: chalcopyrite, bornite, chalcocite,pyrite, magnetite, limonite and goethite. |
| | ● | Vein Mineralization, volume %: quartz, quartz-magnetite, pyrite, magnetite-actinolite, anhydrite, and age relationships, etc. |
| | ● | Graphic Log of Alteration, Mineralization, Lithology, Structure, etc. |
| | ● | Alpha-numeric codes for lithology, structure and alteration (early, late and other) |
| | ● | Comments and short description of principal alteration associations, etc. |
A separate geotechnical log records fracture frequency, core recovery, Rock Quality Designation (RQD), and descriptions of fracture types and characteristics. A magnetic susceptibility meter has been in use throughout much of the program; the drill-core technicians collect a nominal three magnetic susceptibility readings per sample interval. The average value is recorded on the log form.
Beginning with drill hole LMDDH-019, core densities are determined approximately every 30 meters using a standard weight in air/weight in water technique. These readings are recorded on a separate log sheet and are entered into the database.
Core is photographed (2 boxes/photograph) in the condition that it is received from the drill site and then it is photographed again after the core has been logged, marked for sampling and cut.
A total of 111 diamond core holes totaling 40,244 m have been drilled on the La Mina Project.
The La Cantera deposit is intersected by a total of 26 diamond drill holes, the first six of which were drilled previous to Bellhaven’s efforts. Table 10‑1 below summarizes the drilling locations and depths. For the La Cantera area, a total of 8,327 m have been drilled with an average of 320 m per hole. All drill hole collar locations are surveyed by GPS and identified with well-defined monuments (Figure 10‑1). A summary of significant intercepts in drilling completed at La Cantera by Bellhaven (2010 through February 2012) is included in Table 10‑2.
All drilling on the project by Bellhaven and previous owners has been done with man-portable, diamond drill-core machines. Drill-hole locations are initially located in the field with a hand-held GPS unit or a total station theodolite. Bellhaven’s full-time survey crew surveyed the coordinates of the final drill-hole collars using a total-station theodolite.
Resource Development Associates Inc.
Effective Date July 24, 2023
GoldMining Inc. NI 43-101 Report – La Mina Project | Page 73 |
At the Middle Zone and La Cantera prospects drill holes have been drilled at azimuths of N45E, N45W and NS with inclinations of -55 to -90 degrees. In the case of La Cantera drilling was completed on a wide-spaced scissor pattern (50- to 100-m spacing) providing complete 3-dimensional coverage of the extent of mineralization that extends to a vertical depth of some 250 m - 500 m (around the low-grade central core); see Figure 7‑4 and Figure 7‑5 in Section 7
At La Cantera drill holes were drilled at azimuths of E-W (90o), W-E (270o), N45E and S45W with inclinations of -50 to -78 degrees. Core recovery observed has been very good, in excess of 90%, except in some discrete fault-gouge zones of a few meters in length (core length).
In the case of La Cantera, the drilling programs confirmed the ellipsoidal outline of the porphyry complex on surface (coincident with the magnetic signature), its steep vertical attitude, and the occurrence of mineralized porphyry and breccia zones draped around a central low-grade core.
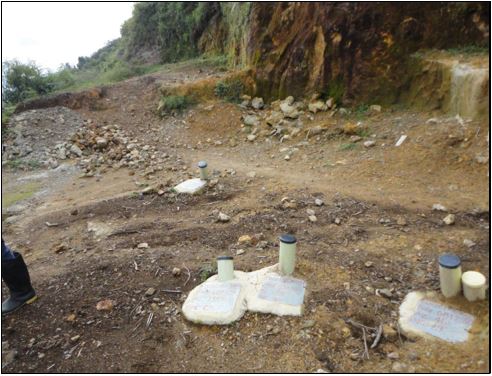
Figure 10‑1 La Mina Drill Collar Monuments
Resource Development Associates Inc.
Effective Date July 24, 2023
GoldMining Inc. NI 43-101 Report – La Mina Project | Page 74 |
Table 10‑1 La Cantera Drilling - All Holes
Hole ID | East (UTM) | North (UTM) | Elevation | Azimuth | Dip | EOH |
LMDDH-001 | 418982.4 | 654669.3 | 1804.9 | 0 | -60 | 258.2 |
LMDDH-002 | 419111.3 | 654529.9 | 1749.1 | 177 | -59 | 188.6 |
LMDDH-003 | 418977.6 | 654548.4 | 1771.5 | 0 | -61 | 200.2 |
LMDDH-004 | 419111.3 | 654530.3 | 1749.0 | 127 | -60 | 250.0 |
LMDDH-005 | 419088.2 | 654673.0 | 1761.2 | 184 | -60 | 251.6 |
LMDDH-006 | 419087.2 | 654674.4 | 1761.5 | 135 | -60 | 303.9 |
LMDDH-007 | 419078.2 | 654460.4 | 1730.2 | 180 | -60 | 125.0 |
LMDDH-008 | 419105.6 | 654601.6 | 1753.4 | 180 | -60 | 297.2 |
LMDDH-009 | 419101.0 | 654750.0 | 1781.6 | 180 | -60 | 434.3 |
LMDDH-014 | 418974.7 | 654680.1 | 1802.1 | 135 | -50 | 511.7 |
LMDDH-015 | 418866.5 | 654780.1 | 1773.0 | 135 | -55 | 639.8 |
LMDDH-016 | 418995.6 | 654465.4 | 1757.8 | 45 | -58 | 517.0 |
LMDDH-018 | 419204.2 | 654738.3 | 1783.3 | 326 | .62 | 213.4 |
LMDDH-019 | 419063.6 | 654542.6 | 1780.2 | 45 | -57 | 320.0 |
LMDDH-022 | 418996.6 | 654547.2 | 1780.8 | 132 | -59 | 286.7 |
LMDDH-023 | 418953.4 | 654594.3 | 1774.3 | 135 | -65 | 365.8 |
LMDDH-024 | 419045.4 | 654430.6 | 1730.8 | 45 | -55 | 436.8 |
LMDDH-025 | 419140.5 | 654412.3 | 1738.0 | 315 | -55 | 305.4 |
LMDDH-026 | 419099.7 | 654489.1 | 1743.0 | 45 | -55 | 294.1 |
LMDDH-027 | 419200.4 | 654586.6 | 1751.4 | 225 | -60 | 419.1 |
LME-1049 | 419376.2 | 654600.0 | 1786.3 | 225 | -55 | 501.8 |
LME-1054 | 419224.5 | 654320.5 | 1783.2 | 25 | -55 | 483.4 |
LME-1056 | 419112.6 | 654529.4 | 1749.0 | 180 | -60 | 163.4 |
LME-1058 | 418975.1 | 654679.5 | 1802.5 | 135 | -50 | 68.0 |
LME-1059 | 418975.3 | 654680.1 | 1802.5 | 135 | -50 | 196.6 |
LME-1099 | 419449.6 | 653513.8 | 1683.3 | 0 | -90 | 295.35 |
Resource Development Associates Inc.
Effective Date July 24, 2023
GoldMining Inc. NI 43-101 Report – La Mina Project | Page 75 |
Table 10‑2 La Cantera Deposit Significant Intercepts Through February 2012
Hole Number | From (m) | To (m) | Intercept (m) | Au (g/t) | Cu (%) | AuEq (g/t) |
LMDDH-07 | 7.6 | 27.9 | 20.3 | 0.74 | 0.40 | 1.43 |
LMDDH-08 | 0.7 | 88.0 | 87.3 | 1.07 | 0.30 | 1.59 |
LMDDH-08 | 197.1 | 269.7 | 72.7 | 0.88 | 0.39 | 1.55 |
LMDDH-09 | 194.8 | 337.2 | 142.4 | 0.70 | 0.29 | 1.20 |
LMDDH-14 | 100.0 | 246.0 | 146.0 | 0.93 | 0.33 | 1.51 |
LMDDH-14 | 392.0 | 454.0 | 62.0 | 0.75 | 0.38 | 1.40 |
LM-DDH-15 | 511.0 | 601.0 | 90.0 | 0.57 | 0.34 | 1.15 |
LMDDH-15 | 626.0 | 634.0 | 8.5 | 0.48 | 0.23 | 0.87 |
LMDDH-16 | 12.0 | 217.3 | 205.3 | 0.91 | 0.31 | 1.45 |
LMDDH-16 | 402.0 | 470.0 | 68.0 | 0.60 | 0.34 | 1.19 |
LMDDH-19 | 0.0 | 230.0 | 230.0 | 0.99 | 0.30 | 1.50 |
LMDDH-22 | 8.0 | 244.0 | 236.0 | 1.04 | 0.45 | 1.80 |
LMDDH-23 | 211.0 | 289.0 | 78.0 | 0.14 | 0.20 | 0.47 |
LMDDH-23 | 311.9 | 322.0 | 10.1 | 0.19 | 0.22 | 0.57 |
LMDDH-24 | 87.0 | 181.1 | 94.1 | 1.53 | 0.52 | 2.43 |
LMDDH-24 | 328.0 | 420.0 | 92.0 | 0.46 | 0.24 | 0.86 |
LMDDH-25 | 17.0 | 274.0 | 257.0 | 0.45 | 0.23 | 0.84 |
LMDDH-26 | 4.6 | 47.0 | 42.4 | 1.02 | 0.28 | 1.49 |
LMDDH-26 | 129.2 | 275.0 | 145.8 | 0.46 | 0.29 | 1.13 |
LMDDH-27 | 29.0 | 141.6 | 112.7 | 0.74 | 0.32 | 1.29 |
LMDDH-27 | 219.0 | 313.0 | 94.0 | 0.69 | 0.27 | 1.15 |
LME-1056 | 40.0 | 158.0 | 118.0 | 1.00 | 0.32 | 1.54 |
LME-1059 | 88.1 | 196.6 | 108.5 | 0.75 | 0.33 | 1.32 |
The Middle Zone deposit resource is based on the intersections from a total of 54 diamond drill holes, all by Bellhaven. For the Middle Zone area, there have been a total of 18,803 m drilled with an average of 348 m per hole. This report is to update the resource model to include the 14 additional holes drilled after the previous report. Table 10‑3 below gives the collar locations and starting azimuth and dip for each of these holes.
At the Middle Zone, 54 holes have been drilled to date within a generally elongated zone (N45E) in plan that is bounded on the western flank by interpreted faults. The Middle Zone remains open to the southwest, southeast, and at depth. The fault offsets and open targets on the south suggest a possible connection with La Cantera at depth. A summary of the significant intercepts in drilling completed in Middle Zone by Bellhaven which are used to update the resource estimate in this report, are given below in Table 10‑4.
GoldMining Inc. NI 43-101 Report – La Mina Project | Page 76 |
Table 10‑3 Middle Zone Collar Surveys
Hole ID | East (UTM) | North (UTM) | Elevation | Azimuth | Dip | EOH |
LMDDH-010 | 418985.0 | 655150.8 | 1940.1 | 180 | -60 | 178.30 |
LMDDH-011 | 418995.0 | 654950.0 | 1869.7 | 0 | -62 | 541.02 |
LMDDH-012 | 418999.2 | 655099.3 | 1907.7 | 45 | -61 | 493.78 |
LMDDH-013 | 419098.0 | 655198.9 | 1928.0 | 45 | -60 | 335.28 |
LMDDH-017 | 418797.1 | 654897.2 | 1772.9 | 45 | -62 | 312.42 |
LMDDH-020 | 419101.1 | 655300.0 | 1958.2 | 179 | -57 | 260.60 |
LMDDH-028 | 419238.3 | 655187.1 | 1971.2 | 180 | -70 | 228.30 |
LMDDH-029 | 419241.9 | 655285.5 | 1998.7 | 180 | -70 | 297.18 |
LMDDH-031 | 418989.1 | 655056.9 | 1887.5 | 0 | -90 | 530.35 |
LME-1034 | 418990.1 | 655057.4 | 1887.6 | 45 | -79 | 681.23 |
LME-1035 | 418990.2 | 655057.4 | 1887.6 | 45 | -70 | 689.19 |
LME-1036 | 419352.6 | 655155.9 | 1913.1 | 225 | -85 | 353.56 |
LME-1038 | 418985.5 | 655152.3 | 1940.3 | 135 | -70 | 650.74 |
LME-1041 | 418986.4 | 655154.5 | 1940.7 | 45 | -60 | 504.44 |
LME-1043 | 419048.8 | 655240.0 | 1932.1 | 45 | -60 | 375.82 |
LME-1045 | 419047.4 | 655241.5 | 1932.5 | 315 | -60 | 391.66 |
LME-1046 | 419047.6 | 655241.6 | 1932.5 | 0 | -90 | 473.96 |
LME-1048 | 419049.5 | 655239.5 | 1932.0 | 135 | -60 | 501.35 |
LME-1050 | 418931.5 | 654963.5 | 1815.1 | 45 | -50 | 600.45 |
LME-1051 | 418798.7 | 654898.7 | 1773.0 | 45 | -55 | 539.15 |
LME-1052 | 418986.9 | 655058.2 | 1887.5 | 315 | -70 | 355.09 |
LME-1053 | 418798.5 | 654898.5 | 1773.0 | 45 | -70 | 680.60 |
LME-1055 | 418988.7 | 655056.6 | 1887.5 | 135 | -60 | 427.50 |
LME-1057 | 418996.6 | 655096.9 | 1909.3 | 225 | -60 | 199.30 |
LME-1060 | 419096.7 | 655195.7 | 1926.1 | 225 | -53 | 195.40 |
LME-1061 | 418923.3 | 655102.0 | 1881.7 | 45 | -60 | 199.64 |
LME-1062 | 419096.9 | 655199.1 | 1926.2 | 315 | -55 | 198.00 |
LME-1063 | 419237.4 | 655192.6 | 1971.1 | 315 | -60 | 250.24 |
LME-1064 | 419100.1 | 655196.0 | 1926.3 | 135 | -55 | 198.50 |
LME-1065 | 419239.9 | 655190.2 | 1971.2 | 135 | -52 | 251.46 |
LME-1066 | 419241.1 | 655192.9 | 1971.4 | 45 | -60 | 190.50 |
LME-1067 | 419102.2 | 655299.8 | 1958.3 | 135 | -60 | 260.30 |
LME-1068 | 419191.8 | 655174.3 | 1931.4 | 315 | -70 | 204.21 |
LME-1069 | 419101.4 | 655302.9 | 1958.8 | 315 | -60 | 235.30 |
LME-1070 | 419193.7 | 655172.3 | 1931.4 | 135 | -52 | 245.36 |
LME-1071 | 419099.2 | 655302.2 | 1959.5 | 45 | -55 | 293.10 |
LME-1072 | 419108.6 | 655126.9 | 1894.9 | 325 | -45 | 225.55 |
LME-1073 | 418985.5 | 655224.8 | 1952.6 | 135 | -52 | 307.20 |
LME-1074 | 419110.9 | 655124.0 | 1895.1 | 135 | -70 | 303.27 |
LME-1075 | 418982.3 | 655151.7 | 1940.2 | 225 | -50 | 236.10 |
LME-1076 | 419110.0 | 655125.7 | 1894.9 | 225 | -50 | 39.62 |
LME-1077 | 419110.2 | 655125.8 | 1895.0 | 225 | -65 | 153.92 |
LME-1078 | 419193.0 | 655173.4 | 1931.7 | 225 | -50 | 422.09 |
LME-1079 | 418922.5 | 655101.4 | 1880.5 | 315 | -50 | 147.82 |
LME-1080 | 418995.3 | 654991.7 | 1868.1 | 335 | -60 | 188.36 |
LME-1081 | 418998.9 | 655098.6 | 1906.9 | 135 | -50 | 292.60 |
LME-1082 | 419248.7 | 655100.0 | 1939.2 | 315 | -50 | 322.78 |
LME-1083 | 419273.9 | 655231.9 | 1973.8 | 135 | -50 | 208.78 |
LME-1089 | 418694.0 | 655043.5 | 1793.8 | 135 | -51 | 297.18 |
LME-1090 | 418797.4 | 654904.1 | 1774.2 | 45 | -64 | 596.79 |
LME-1091 | 418798.0 | 654902.3 | 1773.4 | 135 | -50 | 548.94 |
LME-1092 | 418796.7 | 654905.4 | 1773.6 | 0 | -48 | 446.53 |
LME-1093 | 418975.7 | 654683.3 | 1801.6 | 45 | -51 | 400.81 |
LME-1094 | 419318.3 | 654805.1 | 1856.2 | 45 | -65 | 341.07 |
Resource Development Associates Inc.
Effective Date July 24, 2023
GoldMining Inc. NI 43-101 Report – La Mina Project | Page 77 |
Table 10‑4 Middle Zone deposit Drilling Subsequent to the 2012 Resource
Hole Number | From (m) | To (m) | Intercept (m) | Au (g/t) | Cu (%) | AuEq (g/t) |
LME-1075 | 95.6 | 109.9 | 14.3 | 0.51 | 0.15 | 0.76 |
LME-1075 | 120.4 | 126.1 | 5.7 | 0.95 | 0.18 | 1.27 |
LME-1075 | 132.4 | 157.8 | 25.4 | 0.41 | 0.06 | 0.51 |
LME-1076 | 19.5 | 24.38 | 4.88 | 0.29 | 0.07 | 0.41 |
LME-1076 | 30.48 | 39.62 | 9.14 | 0.26 | 0.24 | 0.67 |
LME-1077 | 12.19 | 65.53 | 53.34 | 0.33 | 0.21 | 0.69 |
LME-1078 | 16.76 | 27.43 | 10.67 | 0.73 | 0.06 | 0.84 |
LME-1079 | No Significant Results |
LME-1080 | 66.75 | 101.19 | 34.44 | 0.69 | 0.1 | 0.86 |
| | 136.55 | 179.26 | 42.71 | 0.72 | 0.08 | 0.85 |
LME-1081 | 48.76 | 64 | 15.24 | 0.39 | 0.11 | 0.58 |
LME-1082 | 107.43 | 129.54 | 22.11 | 0.72 | 0.08 | 0.85 |
and | 138.68 | 254.5 | 115.82 | 1.01 | 0.08 | 1.15 |
including | 138.68 | 202 | 63.32 | 1.48 | 0.09 | 1.63 |
LME-1083 | No Significant Results |
LME-1089 | No Significant Results |
LME-1090 | 530.58 | 548.7 | 18.12 | 0.34 | 0.3 | 0.81 |
LME-1091 | No Significant Results |
LME-1092 | No Significant Results |
LME-1093 | No Significant Results |
The La Garrucha deposit resource is delimited by 22 diamond drill holes. There has been a total of 10,191 m drilled with an average of 460 m per hole. Table 10‑5 is a summary of these holes and their location. A summary of the significant drill-core intercepts for La Garrucha prospect is provided in Table 10‑6.
Table 10‑5 La Garrucha Drill Holes Location and Depth
Hole ID | East (UTM) | North (UTM) | Elevation | Azimuth | Dip | EOH |
LME-1037 | 419822.24 | 654598.62 | 2008.49 | 90 | -70 | 380.08 |
LME-1039 | 419822.39 | 654598.45 | 2008.76 | 0 | -90 | 509.93 |
LME-1040 | 419833.15 | 654703.30 | 2013.51 | 90 | -70 | 355.09 |
LME-1042 | 419833.33 | 654703.11 | 2013.54 | 0 | -90 | 391.66 |
LME-1044 | 419832.58 | 654702.80 | 2013.41 | 45 | -70 | 502.92 |
LME-1047 | 419833.73 | 654703.22 | 2011.88 | 90 | -60 | 242.31 |
LME-1095 | 419840.83 | 654507.20 | 1994.24 | 45 | -51 | 280.11 |
LME-1096 | 419830.11 | 654667.60 | 2007.10 | 0 | -90 | 349.81 |
LME-1097 | 419830.11 | 654667.56 | 2007.17 | 90 | -65 | 349.81 |
LME-1098 | 419829.85 | 654415.93 | 1981.45 | 90 | -70 | 360.27 |
LME-1100 | 419873.03 | 654308.13 | 1980.78 | 45 | -65 | 297.18 |
LME-1101 | 420026.27 | 654714.28 | 1961.06 | 225 | -75 | 414.52 |
LME-1102 | 420026.62 | 654716.92 | 1961.05 | 270 | -76 | 422.45 |
LME-1103 | 420026.34 | 654715.66 | 1961.15 | 225 | -60 | 320.04 |
LME-1104 | 419940.21 | 654620.09 | 1990.95 | 45 | -75 | 565.40 |
LME-1105 | 420194.53 | 654811.87 | 2004.27 | 225 | -55 | 614.17 |
LME-1106 | 420004.19 | 654621.40 | 1954.82 | 225 | -68 | 285.59 |
LME1107 | 420,207 | 654691 | 1,999.5 | 225° | -50° | 500.49 |
LME1108 | 420,207 | 654,691 | 1,999.5 | 225° | -70° | 914.70 |
LME1109 | 420,356 | 654,723 | 2,088.0 | 221° | -50° | 818.12 |
LME1110 | 420,356 | 654,723 | 2,088.0 | 221° | -40° | 701.37 |
LME1111 | 420,207 | 654,691 | 1,999.5 | 250° | -45° | 550.17 |
Resource Development Associates Inc.
Effective Date July 24, 2023
GoldMining Inc. NI 43-101 Report – La Mina Project | Page 78 |
Table 10‑6 La Garrucha Significant Drill Core Intercepts
Hole Number | From (m) | To (m) | Intercept
(m) | Au (g/t) | Cu (%) | AuEq (g/t) |
LME-1037 | 359 | 374.1 | 15.1 | 0.49 | 0.08 | 0.62 |
LME-1039 | No Significant Results |
LME-1040 | 161 | 169 | 8 | 0.3 | 0.18 | 0.6 |
| | 192 | 210.5 | 18.5 | 0.35 | 0.17 | 0.64 |
| | 258 | 355.09 | 97.09 | 0.35 | 0.14 | 0.6 |
LME-1042 | No Significant Results |
LME-1044 | 269.1 | 281.94 | 12.84 | 12.84 | 0.09 | 0.99 |
LME-1047 | 119.5 | 1239.54 | 10.04 | 0.55 | 0.31 | 1.08 |
| | 154 | 172.4 | 18.4 | 0.31 | 0.15 | 0.57 |
| | 178.25 | 242.31 | 64.06 | 0.55 | 0.15 | 0.8 |
LME-1095 | 248.2 | 280.11 | 31.91 | 0.47 | 0.09 | 0.81 |
LME-1096 | 199.64 | 282 | 82.36 | 0.48 | 0.17 | 0.76 |
LME-1096 | 322.96 | 349.81 | 26.85 | 0.64 | 0.13 | 0.85 |
LME-1097 | No Significant Results |
LME-1098 | No Significant Results |
LME-1100 | 99.06 | 107.28 | 8.22 | 0.51 | 0.08 | 0.62 |
| | 143 | 359.8 | 216.8 | 1.31 | 0.15 | 1.55 |
| | 379 | 397.76 | 18.76 | 0.59 | 0.09 | 0.74 |
LME-1101 | 94.87 | 174.95 | 80.08 | 0.49 | 0.06 | 0.57 |
| | 216.71 | 253.59 | 36.88 | 0.45 | 0.03 | 0.49 |
| | 278.58 | 374.5 | 95.92 | 0.5 | 0.13 | 0.73 |
LME-1102 | 7.62 | 13.71 | 6.09 | 0.71 | 0.03 | 0.76 |
| | 19.81 | 25.9 | 6.09 | 0.53 | 0.03 | 0.57 |
| | 52.3 | 60.4 | 8.1 | 0.4 | 0.26 | 0.8 |
| | 66.5 | 224.62 | 158.12 | 1.01 | 0.17 | 1.26 |
| | 242 | 278 | 36 | 0.34 | 0.13 | 0.54 |
LME-1103 | 66 | 377 | 311 | 0.84 | 0.1 | 1 |
| | 392.8 | 421.2 | 28.4 | 0.34 | 0.04 | 0.41 |
| | 436.77 | 458.3 | 21.53 | 0.41 | 0.04 | 0.48 |
| | 476.09 | 537.8 | 61.7 | 0.56 | 0.04 | 0.62 |
Lme-1104 | 236.5 | 268 | 31.5 | 0.44 | 0.11 | 0.6 |
| | 355 | 426 | 71 | 1.02 | 0.14 | 1.24 |
| | 485.65 | 592.25 | 106.6 | 0.56 | 0.11 | 0.72 |
LME-1105 | 0 | 145 | 145 | 0.51 | 0.15 | 0.73 |
| | 168.6 | 200.25 | 31.65 | 0.38 | 0.04 | 0.44 |
LME-1106 | 38.1 | 50.29 | 12.19 | 0.43 | 0.07 | 0.54 |
| | 171 | 441.96 | 270.96 | 1.03 | 0.13 | 1.23 |
LME1107 | 186.05 | 236.85 | 50.8 | 0.32 | 0.1 | 0.46 |
| | 282.75 | 339.92 | 57.17 | 0.6 | 0.13 | 0.79 |
| | 387.21 | 458.1 | 70.89 | 0.6 | 0.1 | 0.74 |
LME1108 | 328.92 | 388.37 | 59.45 | 0.76 | 0.19 | 1.04 |
| | 463.36 | 612.5 | 149.14 | 0.69 | 0.09 | 0.82 |
| | 733.47 | 825.9 | 92.43 | 0.31 | 0.13 | 0.51 |
LME1109 | 473.49 | 491.93 | 18.44 | 0.34 | 0.06 | 0.42 |
| | 526.35 | 551 | 24.65 | 0.23 | 0.04 | 0.29 |
| | 572.35 | 602 | 29.65 | 0.22 | 0.06 | 0.31 |
| | 614.32 | 625.4 | 11.08 | 0.26 | 0.05 | 0.33 |
| | 727.55 | 813.2 | 85.65 | 0.17 | 0.02 | 0.2 |
LME1110 | 368.05 | 387.95 | 19.9 | 0.21 | 0.09 | 0.34 |
| | 557.19 | 621.11 | 63.92 | 0.21 | 0.06 | 0.29 |
| | 642.93 | 663.22 | 20.29 | 0.18 | 0.07 | 0.28 |
LME1111 | 188.3 | 208.04 | 19.74 | 0.87 | 0.04 | 0.93 |
| | 220.26 | 225.55 | 5.29 | 1.28 | 0.05 | 1.35 |
| | 266.85 | 280.4 | 13.55 | 1.32 | 0.1 | 1.47 |
| | 297.95 | 327.75 | 29.8 | 1.1 | 0.07 | 1.2 |
| | 339.67 | 375.16 | 35.49 | 1.03 | 0.11 | 1.19 |
Resource Development Associates Inc.
Effective Date July 24, 2023
GoldMining Inc. NI 43-101 Report – La Mina Project | Page 79 |
Notes:
1. | AuEq calculated using metal prices of US$1,600/oz gold and US$3.39/lb copper, Results are presented as core length and assays are uncut as there are no high-grade outliers in the sample population. Results to date are insufficient to determine true width. |
The El Limon deposit resource is known from the intersections of 9 diamond drill holes. For the El Limon area, there have been a total of 2923 m drilled with an average of 325 m per hole. Table 10‑7 is a summary of these holes and their location. A summary of the significant drill-holes intercepts for the El Limon prospect are found below in Table 10‑8.
Table 10‑7 El Limon Drill Holes and Locations
Hole ID | East (UTM) | North (UTM) | Elevation | Azimuth | Dip | EOH |
LMDDH-021 | 419100.48 | 655474.02 | 1974.88 | 0 | -63 | 359.66 |
LMDDH-030 | 419063.61 | 655539.21 | 1970.59 | 335 | -60 | 381.00 |
LMDDH-032 | 418961.77 | 655585.57 | 1949.54 | 0 | -60 | 414.52 |
LME-1033 | 418962.60 | 655585.98 | 1949.45 | 45 | -68 | 461.77 |
LME-1084 | 419026.66 | 655487.08 | 1986.53 | 315 | -55 | 333.75 |
LME-1085 | 419026.95 | 655593.22 | 1917.00 | 315 | -55 | 353.56 |
LME-1086 | 418981.98 | 655450.14 | 1994.02 | 315 | -51 | 284.98 |
LME-1087 | 418984.24 | 655447.90 | 1993.80 | 135 | -65 | 181.35 |
LME-1088 | 418981.84 | 655448.59 | 1994.04 | 225 | -50 | 152.70 |
Resource Development Associates Inc.
Effective Date July 24, 2023
GoldMining Inc. NI 43-101 Report – La Mina Project | Page 80 |
Table 10‑8 El Limon Significant Drill Intercepts
Hole Number | From (m) | To (m) | Intercept
(m) | Au (g/t) | Cu (%) | AuEq (g/t) |
LMDDH-021 | 283 | 359.66 | 76.66 | 0.24 | 0.02 | 0.28 |
LMDDH-030 | 38 | 247 | 209 | 0.19 | 0.07 | 0.33 |
LMDDH-032 | 4.57 | 44.26 | 39.69 | 0.19 | 0.05 | 0.27 |
LMDDH-033 | 9.14 | 365 | 355.86 | 0.15 | 0.04 | 0.22 |
LME-1084 | 117.34 | 196.29 | 78.95 | 0.31 | 0.1 | 0.47 |
| | 234.39 | 283.46 | 49.07 | 0.36 | 0.11 | 0.53 |
LME-1085 | 18.28 | 60.65 | 42.37 | 0.24 | 0.12 | 0.43 |
LME-1086 | 154.22 | 175.8 | 21.58 | 0.31 | Nil | 0.32 |
LME-1087 | No Significant Values |
LME-1088 | No Significant Values |
Since acquiring the Property in 2010, Bellhaven completed several continuous trenches over the La Cantera and Middle Zone targets. Samples were collected as channels from surface outcrop using hammer and maul, or hand-held pneumatic hammer. Trenches vary in length from 20 m to +50 m and are generally oriented E-W. 256 trench samples were provided. These samples averaged 0.22 g/t Au and had 58 samples that were valued above 0.3 g/t Au. None of these trenches in the Middle Zone has been incorporated into the resource estimate but are used in determination of new exploration targets.
10.6 | ROCK SAMPLING AND SOIL GEOCHEMISTRY |
Bellhaven also augmented and significantly extended the original soil and rock-chip sampling done by AGA. Ending July 2012, Bellhaven took a total of 491 rock-chip samples and 4,779 soil samples. The rock-chip samples had an average of 0.03 g/t Au with 14 samples of higher than 0.3 g/t Au assays. The soil samples had an average of 0.02 g/t Au with 35 samples of higher that 0.3 g/t Au assays. None of the rock-chip samples or the soil samples were used in the mineral resource estimation.
Resource Development Associates Inc.
Effective Date July 24, 2023
GoldMining Inc. NI 43-101 Report – La Mina Project | Page 81 |
11 | SAMPLE PREPARATION, ANALYSES, AND SECURITY |
11.1 | SAMPLE PREPARATION PRIOR TO 2022 |
Sample preparation is described in the following sections for previous drilling programs and for the GoldMining 2022 drilling program. At the La Mina Project site, a field office and employee housing complex are located within walking distance of the La Cantera and Middle Zone prospects. All core from the Project drill program is stored on site. A new core shed was constructed in 2011 which has a two-tier core rack system. The pulps, splits, and rejects of prepared samples were transferred directly from the preparation labs to a warehouse located at La Mina Project.
The core sample procedure begins with checking of driller-placed core blocks for accuracy followed by photographs of consecutive pairs of core boxes. The core then undergoes detailed geotechnical and geological logging. Data recorded in geotechnical and geological logs are entered into the project database using a two-person parallel input protocol. Technicians identify the nominal 2 m sample intervals with wooden core blocks and mark the length of the core with a “cut line” to guide the core cutting. The technicians take care not to mix intervals of significantly different core recovery in the same sample, resulting in some sample intervals that are shorter than the nominal length. All core boxes (metal) are clearly tagged with hole ID and from/to information.
Core marked for sampling was cut or split by technicians (under geological supervision) using a standard electric masonry core saw mounted on a secure steel stand or by a manual Longyear core splitter. Standard safety equipment (hard hat, ear plugs and eye protection) is used by the core cutters and their helpers. The half-core is placed in plastic bags and tagged with a sample number marked on the outside of the bag and a corresponding sample tag inside the bag. Each bag is securely closed. The unused cut half of the core is then placed back in its correct place in the core box and stored for later reference. Blanks (5%), standards (5% - 12% depending on the nature of the material), preparation duplicates (5%) and field duplicates (2%) are inserted in the sample stream during this stage.
Samples were cut (using a core saw) or split (using a core splitter). The instrument used depended on the level of clay content, in which high clay samples were split to avoid core loss from the core saw’s lubricating water. The cut or split samples were stored in a secure core shed on site until they were shipped to sample preparation facilities in Bogota (through LMDDH-023) or Medellin (all samples from LMDDH-024 to present), Colombia. The samples were prepared at the ALS Minerals sample preparation facilities and then sent to the ALS Minerals regional analytical facility in Lima, Peru.
Regular drill-core samples are collected in lots of 25 – 76 and shipped by company vehicle to ALS Minerals for preparation and analysis. Early in the drilling program samples were dispatched to the ALS preparation laboratory in Bogota. However, in early 2011 with the addition of an ALS preparation facility in Medellin, samples are dispatched directly to ALS in Medellin for preparation and then forward by ALS to the ALS laboratory in Lima, Peru. Beginning in early 2013 (La Garrucha drill holes LME-1100 to LME-1106) core samples were dispatched to Actlabs Colombia in Rio Negro, Colombia for preparation and analysis. As noted, several QA/QC steps are included in sample preparation. At the preparation facility each sample is coarse crushed to 70% less than 2 mm size. A 1kg split of each sample is routinely pulverized to 85% passing 75 μms. A final pulp of 250 g - 300 g is sent for analysis to the ALS Minerals laboratory in Lima.
Gold, copper, and ICP analyses at the ALS Minerals Lima lab are carried out as follows:
| | ● | Gold: Fire Assay, 50/30 g charge, Atomic Absorption finish |
| | ● | Over-range (>10 ppm) results for gold are analyzed by Fire Assay with a Gravimetric finish. |
| | ● | Copper and other elements: 4-acid digestion and ICP-AES analysis, including Cu, Ag, Al, As, Ba, Be, Bi, Ca, Co, Cr, Fe, Ga, K, La, Mg, Mn, Mo, Na, Ni, P, Pb, S, Sc, Sr, Th, Ti, Tl, U, V, W and Zn. |
Resource Development Associates Inc.
Effective Date July 24, 2023
GoldMining Inc. NI 43-101 Report – La Mina Project | Page 82 |
The ALS Minerals laboratory in Lima, Peru is registered to ISO 9001:2008 and has received ISO 17025:2005 accreditation for certain specific methods, such as fire assay/AA gold.
The Actlabs Colombia laboratory in Rio Negro, Colombia is ISO 9001 certified and provides the company with significant turn-around-time on its drill core analyses as the result of a combined preparation and analytical facility in Colombia. Analytical preparation and procedures for gold fire assay and base and trace metal ICP-AES analysis is identical to that of ALS and SGS.
Check assay samples are collected in lots of varying size and shipped by company vehicle to the SGS laboratory in Medellin for preparation, then forwarded by SGS/ALS to the analytical facility in Lima, Peru. At the preparation facility, each sample is coarse crushed to 95% less than 2 mm size. The final sample is pulverized to 95% passing 105 μms, and approximately 250 gram is sent to the analytical lab.
Gold, copper, and ICP analyses at the SGS Lima lab are carried out as follows:
| | ● | Gold: Fire Assay, 30 g charge, Atomic Absorption finish |
| | ● | Over-range (>3 g/t) results for gold are analyzed by 30 g, Fire Assay with a Gravimetric finish |
| | ● | Copper and other elements: 4-acid digestion and ICP-AES analysis, including Cu, Ag, Al, As, Ba, Be, Bi, Ca, Co, Cr, Fe, Ga, K, La, Mg, Mn, Mo, Na, Ni, P, Pb, S, Sc, Sr, Th, Ti, Tl, U, V, W and Zn |
The SGS laboratory in Lima, Peru, has received accreditation to ISO/IEC 17025:2006 for mineral assay procedures. The preparation laboratory in Medellin is registered to ISO 9001:2008 for storage and preparation of samples.
Samples for check assays were prepared at the SGS facility in Medellin, Colombia, and analyzed at the SGS laboratory in Lima, Peru.
11.2 | 2022 SAMPLE PREPARATION PROCEDURES |
The drilling cores obtained were transported in metal boxes daily from the drilling site to the company's base camp, where the facilities of the La Mina project are located.
At the drill rig, the core was cleaned and washed, and placed in metal core boxes marked with “Start” and “Finish” and arrows pointing downhole direction. The core boxes were marked with the drill hole information and wooden core blocks were placed at the end of each run containing the depth (in metres) of the hole marked.
When the boxes were received daily at the base camp, the core was cleaned of mud, oxides, and grease left over from the drill cores. Subsequently, a verification of the information in the wooden blocks and core boxes was made checking the depths, hole information, and the recovery. In case of any inconsistency in the marking of the boxes, runs, or losses of cores, it was reported to the project geologist to require the drilling contractor and solve the problem.
Subsequently, photographs were taken of the wet core boxes with a sign indicating drill hole number, box number and depths. Once the boxes were photographed, they were laid down in the logging tables to perform the core logging. All core was logged geotechnically and lithologically in paper copies and then entered into a laptop computer.
Resource Development Associates Inc.
Effective Date July 24, 2023
GoldMining Inc. NI 43-101 Report – La Mina Project | Page 83 |
After the detailed geological logging, the longitudinal cutting line is marked by the geologist, and the core is taken for cutting. Samples are nominally cut every two meters. However, the sample length will be shorter when there were changes in lithology or alterations. The drilling cores are cut into two halves using a standard fixed Freemasonry electric saw or quartered depending on the condition of the cores under the supervision of the geologist. One of the halves is left for future reference in the core box and the other half is packed in double plastic bags marked on the outside with the sample number ID and inside the bag, a tag with the sample ID was placed. Each bag was secured and stored in a restricted access site and then shipped to the laboratory for sample preparation and analysis. It is important to note that none of the cutting or logging technicians were allowed to wear jewelry to avoid contamination of the sample.
Batches of shipping samples are collected in groups of 20 to 75, including QC samples. Each batch had at least one blank and one standard, which were inserted randomly by geologists within the numbering sequence. Blanks, standards and duplicates samples were inserted in the sample stream as follows: Blanks (2%), standards (2%), preparation duplicates (2%), and field duplicates (2%). These batches were sent by a company vehicle to the ALS laboratory for preparation in Medellín and then sent for assaying and ICP analysis to ALS Peru. The samples sent to ALS followed the following preparation and analysis procedures:
| | ● | Crushed to 70% less than 2 mm size. A 1kg split of each sample is routinely pulverized to 85% passing 75 μms. A final pulp of 250-300 g is sent for analysis to the ALS Minerals laboratory in Lima. |
| | ● | Gold: Fire Assay, 30g charge, Atomic Absorption finish (Au-AA23) |
| | ● | Over-range (>10 ppm) results for gold were analyzed by Fire Assay with a Gravimetric finish (Au-GRA22) |
| | ● | Copper and other elements: 4-acid digestion and ICP-AES analysis (ME-ICP61), including Ag, Al, As, Ba, Be, Bi, Ca, Cd, Co, Cr, Cu, Fe, Ga, K, La, Mg, Mn, Mo, Na, Ni, P, Pb, S, Sb, Sc, Sr, Th, Ti, Tl, U, V, W and Zn. |
| | ● | Over-range (100 ppm) results for Ag were analyzed by Fire Assay with a gravimetric finish (Ag-GRA22). |
11.3 | STANDARD, BLANK, AND DUPLICATE SAMPLES |
11.3.1 | STANDARD, BLANK, AND DUPLICATE SAMPLES PRIOR TO 2022 |
La Mina geologists commenced Quality Assurance – Quality Control (QA-QC) program with the first hole, LMDDH-007. The system involved regular insertion of blanks, standards, and duplicates into the sample stream. Coarse and pulp duplicates are included in the protocol. In addition, approximately 10% of all samples are sent to the SGS laboratory in Lima as part of a check assay program. Certified reference materials (CRMs), including blanks and standards, were purchased from two Canadian suppliers, WCM Minerals in Burnaby British Columbia and CDN Laboratories in Burnaby, British Columbia. These include the following CRMs: blanks numbered BL110, BL111, BL112, BL113, BL115 and standards numbered CGS27, CM13, CM14, CU156, CU157, CU158, CU159, CU164, CU175, CU185, PM434, PM436, PM438, PM446 and PM447. The standards cover low, medium, and high grades monitored within +/- 2 standard deviations around the certified mean value of each.
The results of the analyses on the CRM’s are included in this report. In all cases, the charts are annotated with the name of the reference material and the certified values for the elements of interest (the copper series of reference materials) as determined by WCM/CDN shown in the yellow box. The individual analyses are noted by the blue/black markers. The certified or accepted value is the solid black/blue line. Lines indicating ±2 and ±3 standard deviations (Std. Dev.) are shown by the dashed green and red lines, respectively. The number of determinations, mean, and standard deviation for all of the analyses are shown in the top right-hand corner of the graph. The 3rd standard deviation was chosen as a limit for acceptable deviation from the certified means. This is currently the industry standard for both certified standards and blanks.
Resource Development Associates Inc.
Effective Date July 24, 2023
GoldMining Inc. NI 43-101 Report – La Mina Project | Page 84 |
11.3.2 | STANDARD RESULTS SUBSEQUENT TO LMDDH-010 |
Fifteen standards were used in Middle Zone drilling (Figure 11‑1 through Figure 11‑25), distributed randomly but with consideration for the size of assay lots. By and large, the results were consistent with expected results for both gold and copper. Out of 500 measurements for Au, only one fell outside of the allowable 3 standard deviations. Out of 300 Cu measurements, only 10 fell outside of the allowable 3 standard deviations.
Using 2 standard deviations departure from the accepted value as a benchmark, only 13 Au determinations and 34 Cu determinations were outside an acceptable range.
Resource Development Associates Inc.
Effective Date July 24, 2023
GoldMining Inc. NI 43-101 Report – La Mina Project | Page 85 |
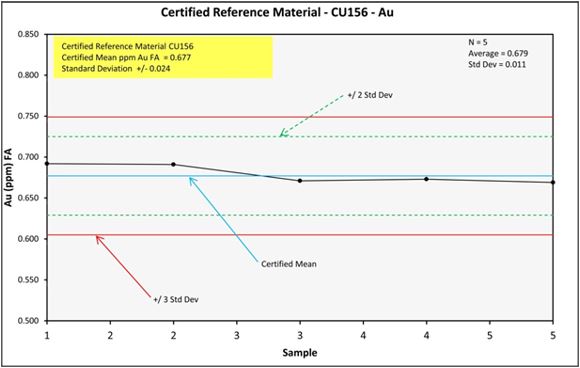
Figure 11‑1 Reference Material CU156 Performance for Au
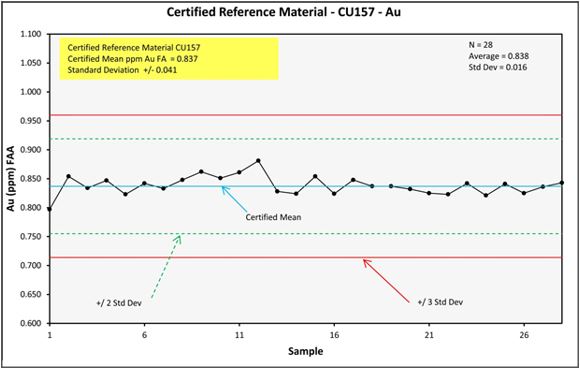
Figure 11‑2 Reference Material CU157 Performance for Au
Resource Development Associates Inc.
Effective Date July 24, 2023
GoldMining Inc. NI 43-101 Report – La Mina Project | Page 86 |
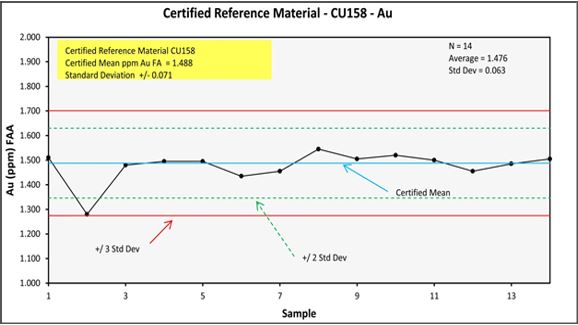
Figure 11‑3 Reference Material CU158 Performance for Au
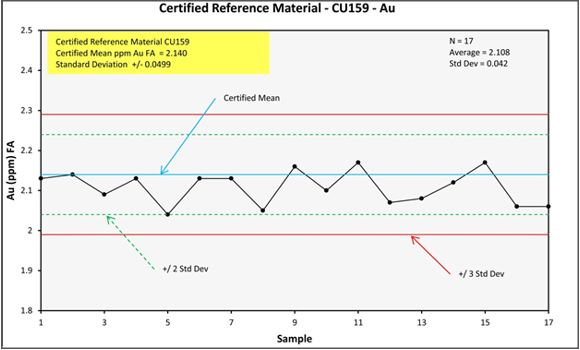
Figure 11‑4 Reference Material CU159 Performance for Au
Resource Development Associates Inc.
Effective Date July 24, 2023
GoldMining Inc. NI 43-101 Report – La Mina Project | Page 87 |
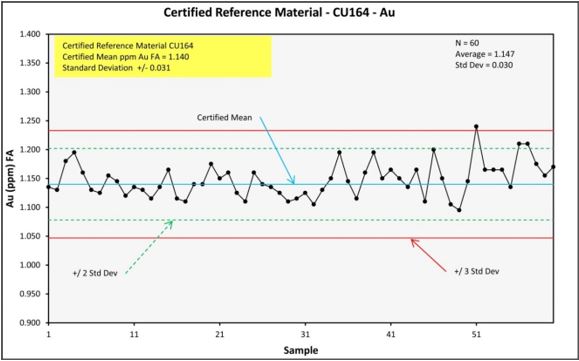
Figure 11‑5 Reference Material CU164 Performance for Au
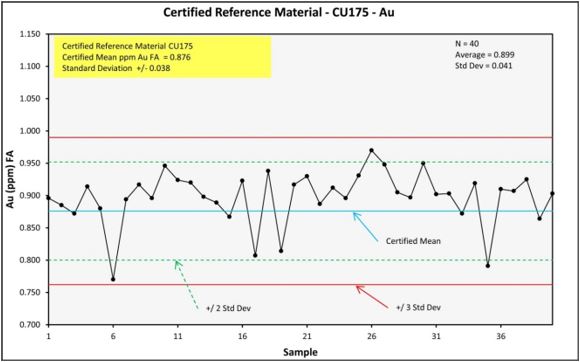
Figure 11‑6 Reference Material CU175 Performance for Au
Resource Development Associates Inc.
Effective Date July 24, 2023
GoldMining Inc. NI 43-101 Report – La Mina Project | Page 88 |
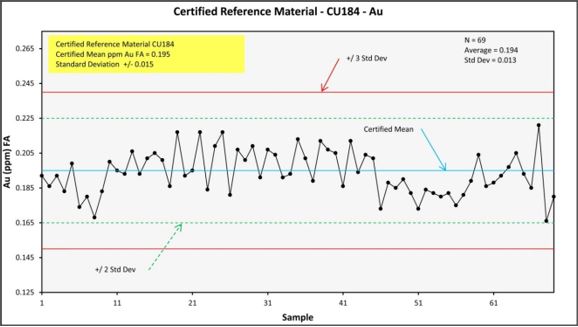
Figure 11‑7 Reference Material CU184 Performance for Au
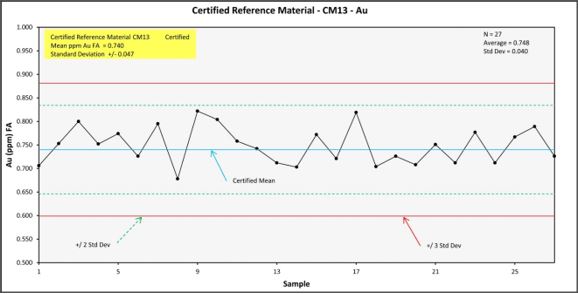
Figure 11‑8 Reference Material CM13 Performance for Au
Resource Development Associates Inc.
Effective Date July 24, 2023
GoldMining Inc. NI 43-101 Report – La Mina Project | Page 89 |
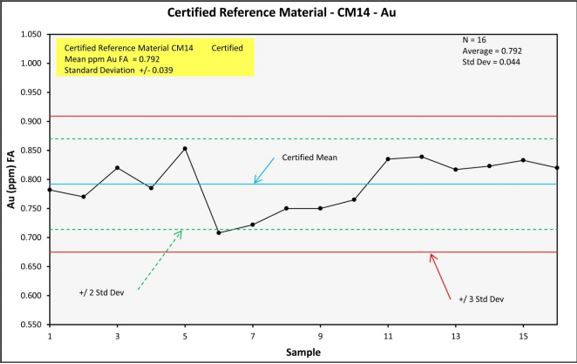
Figure 11‑9 Reference Material CM14 Performance for Au
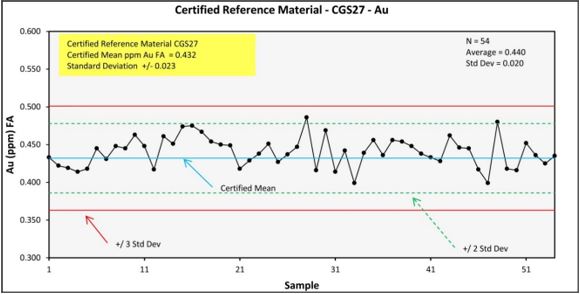
Figure 11‑10 Reference Material CGS27 Performance for Au
Resource Development Associates Inc.
Effective Date July 24, 2023
GoldMining Inc. NI 43-101 Report – La Mina Project | Page 90 |
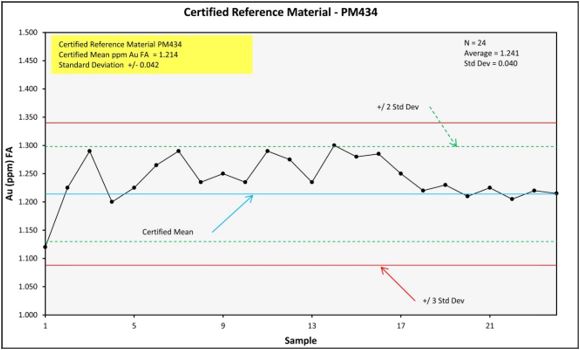
Figure 11‑11 Reference Material PM434 Performance for Au
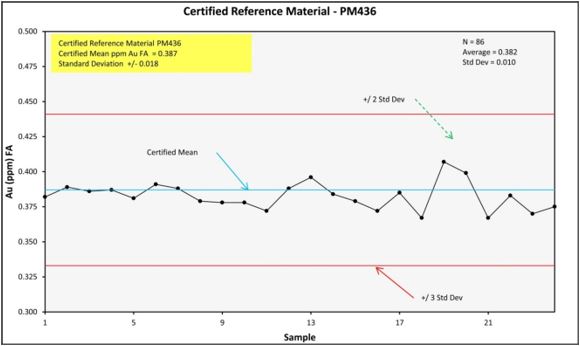
Figure 11‑12 Reference Material PM436 Performance for Au
Resource Development Associates Inc.
Effective Date July 24, 2023
GoldMining Inc. NI 43-101 Report – La Mina Project | Page 91 |
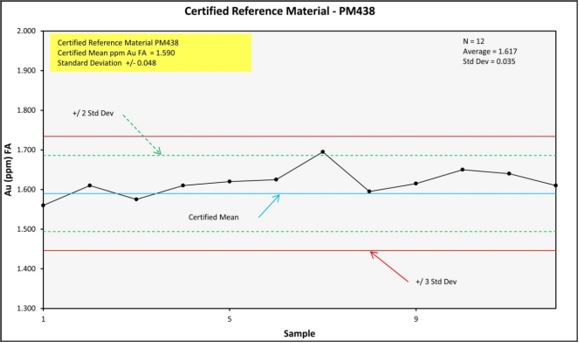
Figure 11‑13 Reference Material PM438 Performance for Au
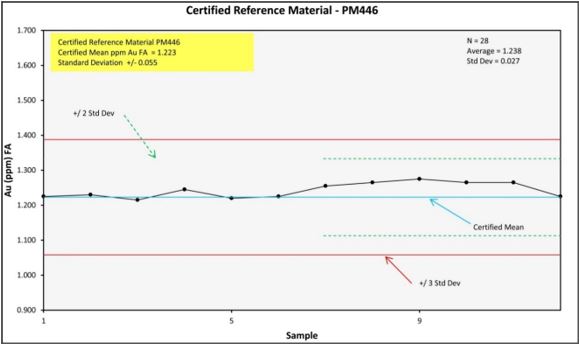
Figure 11‑14 Reference Material PM446 Performance for Au
Resource Development Associates Inc.
Effective Date July 24, 2023
GoldMining Inc. NI 43-101 Report – La Mina Project | Page 92 |
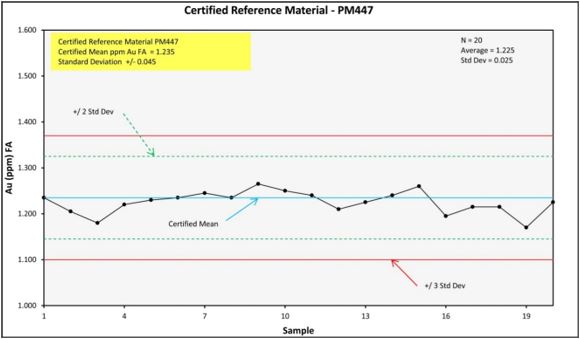
Figure 11‑15 Reference Material PM447 Performance for Au
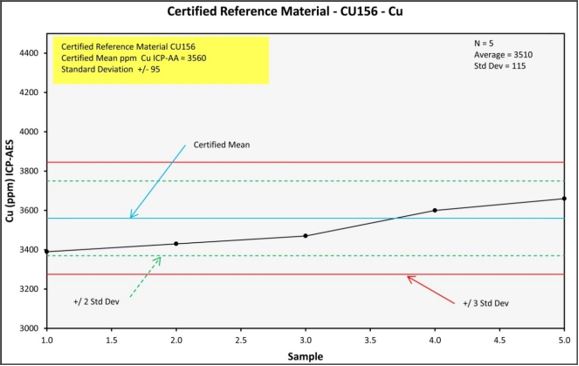
Figure 11‑16 Reference Material CU156 Performance for Cu
Resource Development Associates Inc.
Effective Date July 24, 2023
GoldMining Inc. NI 43-101 Report – La Mina Project | Page 93 |

Figure 11‑17 Reference Material CU157 for Cu
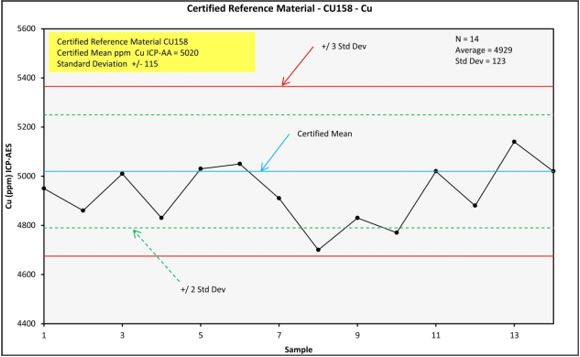
Figure 11‑18 Reference Material CU158 Performance for Cu
Resource Development Associates Inc.
Effective Date July 24, 2023
GoldMining Inc. NI 43-101 Report – La Mina Project | Page 94 |
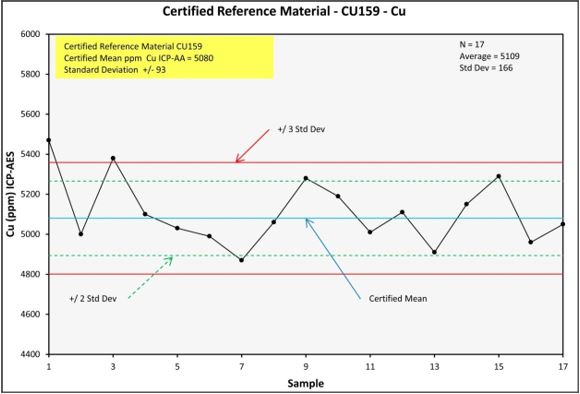
Figure 11‑19 Reference Material CU159 Performance for Cu
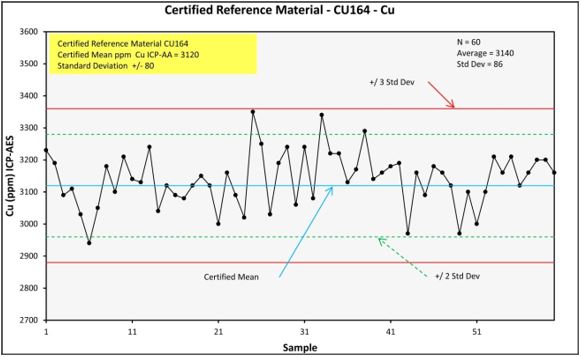
Figure 11‑20 Reference Material CU164 Performance for Cu
Resource Development Associates Inc.
Effective Date July 24, 2023
GoldMining Inc. NI 43-101 Report – La Mina Project | Page 95 |
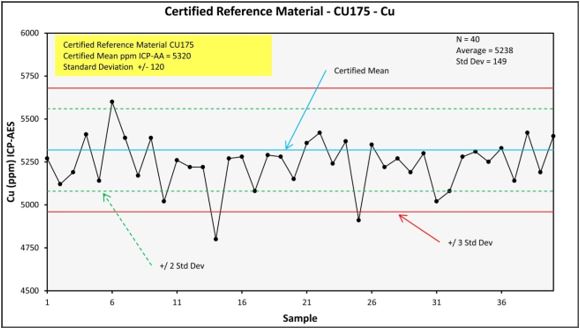
Figure 11‑21 Reference Material CU175 Performance for Cu
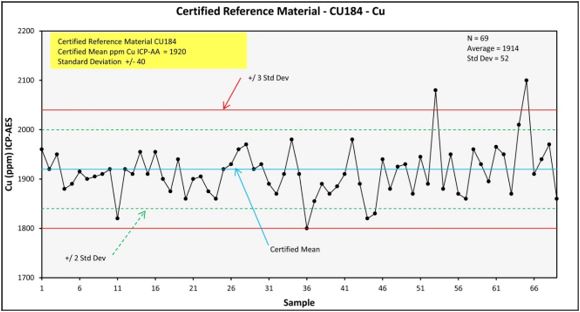
Figure 11‑22 Reference Material CU184 Performance for Cu
Resource Development Associates Inc.
Effective Date July 24, 2023
GoldMining Inc. NI 43-101 Report – La Mina Project | Page 96 |
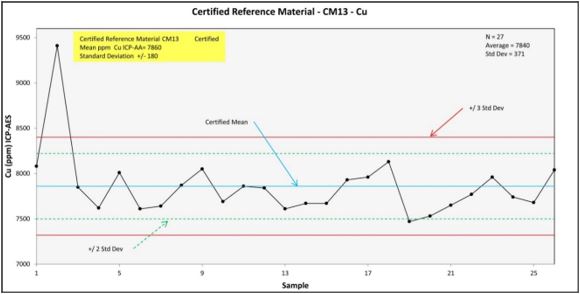
Figure 11‑23 Reference Material CM13 Performance for Cu
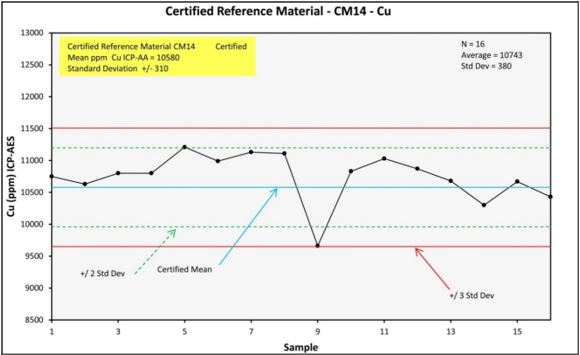
Figure 11‑24 Reference Material CM14 Performance for Cu
Resource Development Associates Inc.
Effective Date July 24, 2023
GoldMining Inc. NI 43-101 Report – La Mina Project | Page 97 |
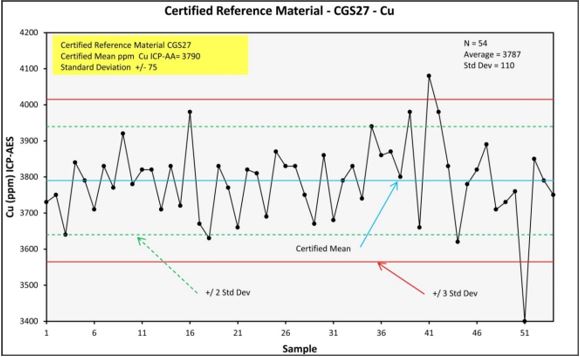
Figure 11‑25 Reference Material CGS27 Performance for Cu
11.3.3 | BLANK RESULTS PRIOR TO 2022 |
Five standard blanks were used in the Middle Zone (Figure 11‑26 through Figure 11‑35). The gold results were again very good, with only six samples out of a total of 258 exceeding the 3rd standard deviation line. Copper also performed well in most cases, with 38 out of 258 samples falling outside of the 3rd standard deviation. Of these failures, just under half are at levels that fall well within ten times the copper reporting limit and therefore are not significant from a statistical standpoint. There are a few cases where review is warranted; and the Company is following up on this. BL110 and BL111 have statistically significant busts (three and two successive samples, respectively), and BL115 shows a number of busts that will be reviewed. Such a failure rate for certified blank materials is well within industry norms.
Resource Development Associates Inc.
Effective Date July 24, 2023
GoldMining Inc. NI 43-101 Report – La Mina Project | Page 98 |
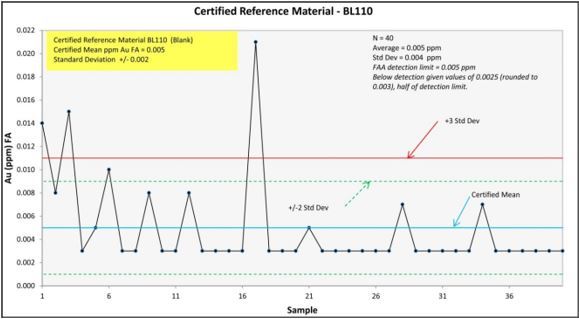
Figure 11‑26 Reference Material - Blank BL110 Performance for Au
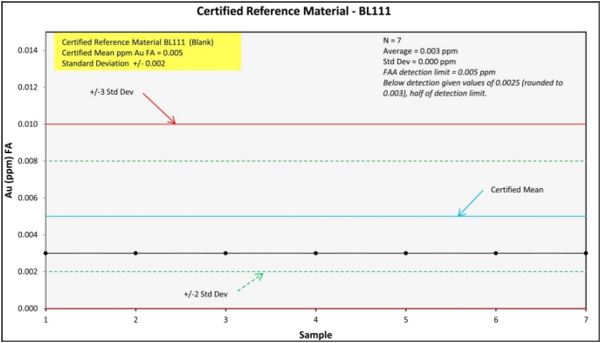
Figure 11‑27 Reference Material - Blank BL111 Performance for Au
Resource Development Associates Inc.
Effective Date July 24, 2023
GoldMining Inc. NI 43-101 Report – La Mina Project | Page 99 |
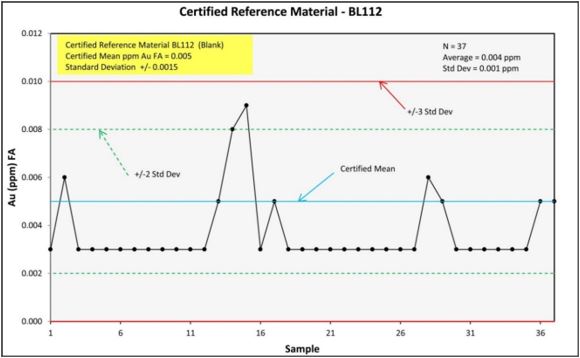
Figure 11‑28 Reference Material - Blank BL112 Performance for Au
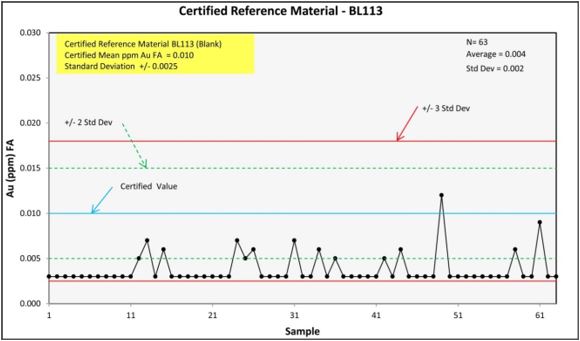
Figure 11‑29 Reference Material - Blank BL113 Performance for Au
Resource Development Associates Inc.
Effective Date July 24, 2023
GoldMining Inc. NI 43-101 Report – La Mina Project | Page 100 |
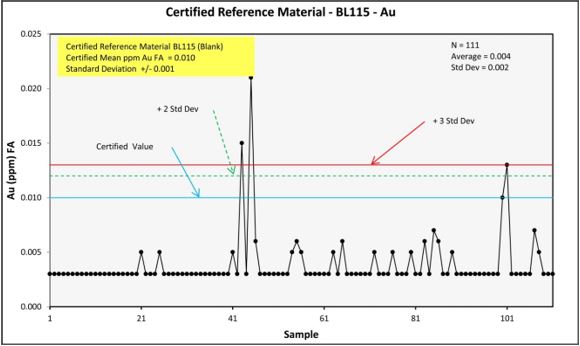
Figure 11‑30 Reference Material - Blank BL115 Performance for Au
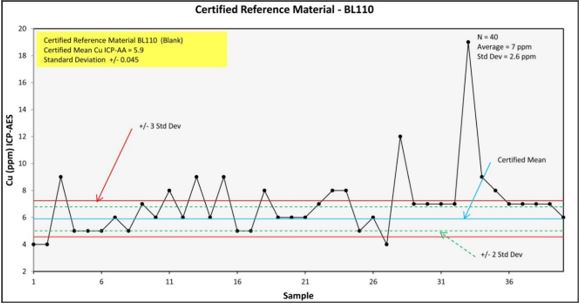
Figure 11‑31 Reference Material - Blank BL110 Performance for Cu
Resource Development Associates Inc.
Effective Date July 24, 2023
GoldMining Inc. NI 43-101 Report – La Mina Project | Page 101 |
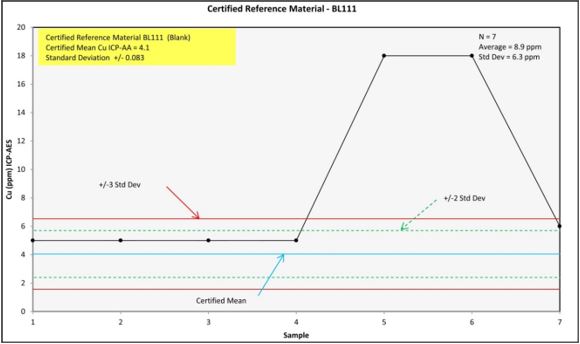
Figure 11‑32 Reference Material - Blank BL111 Performance for Cu
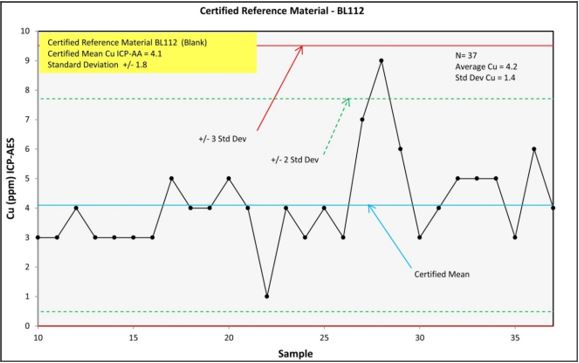
Figure 11‑33 Reference Material - Blank BL112 Performance for Cu
Resource Development Associates Inc.
Effective Date July 24, 2023
GoldMining Inc. NI 43-101 Report – La Mina Project | Page 102 |
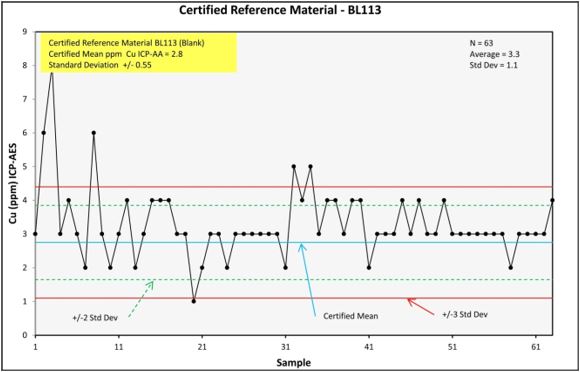
Figure 11‑34 Reference Material - Blank BL113 Performance for Cu
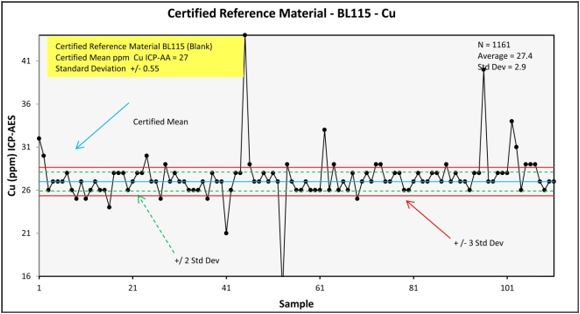
Figure 11‑35 Reference Material - Blank BL115 Performance for Cu
Resource Development Associates Inc.
Effective Date July 24, 2023
GoldMining Inc. NI 43-101 Report – La Mina Project | Page 103 |
11.3.4 | DUPLICATE TYPES AND RESULTS PRIOR TO 2022 |
Three duplicate sample types are routinely generated during sampling of drill core at La Mina:
| | ● | Field duplicates are generated on-site at La Mina. Subsequent to sawing and packing half of the core as per normal sampling, an additional ¼ of the remaining core is cut and sent under a different sample number. |
| | ● | Coarse duplicates are generated at the preparation lab in Medellin. It is a split of the original coarse crush, which is relabeled and processed through pulverization. |
| | ● | Pulp duplicates are generated at the preparation lab in Medellin. It is a split of the final pulverized sample, which is relabeled and sent to the analytical lab. |
The Middle Zone coarse pulp and field duplicates were collected in the following frequency on a hole-by-hole basis: 1% globally of all sampled intervals, 1.5% of samples assaying near cutoff grades for gold (0.3 g/t), and 2.5% for all intervals assaying above gold cutoff. In total, 164 coarse duplicates, 165 pulp duplicates, and 63 field duplicates were analyzed. There is excellent agreement between the coarse and pulp duplicates, and nearly all fall within the 10% range. The results are shown graphically in Figure 11‑36 through Figure 11‑41 below.
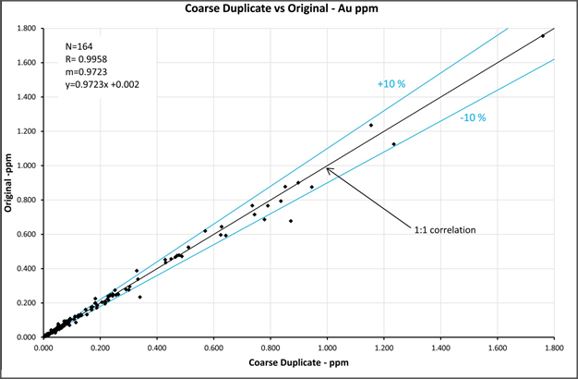
Figure 11‑36 Au Analyses (FA AA) for Preparation Duplicate Samples
Resource Development Associates Inc.
Effective Date July 24, 2023
GoldMining Inc. NI 43-101 Report – La Mina Project | Page 104 |
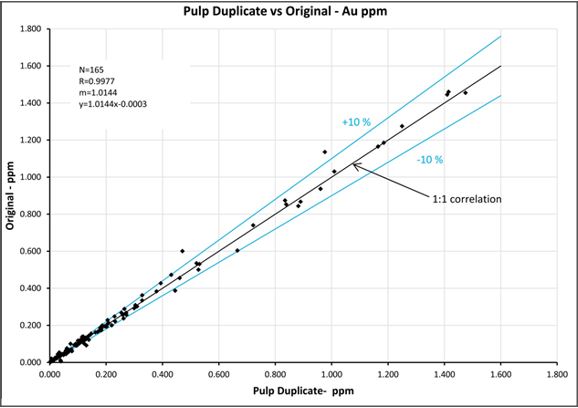
Figure 11‑37 Au Analyses (FA AA) for Preparation Duplicate Samples
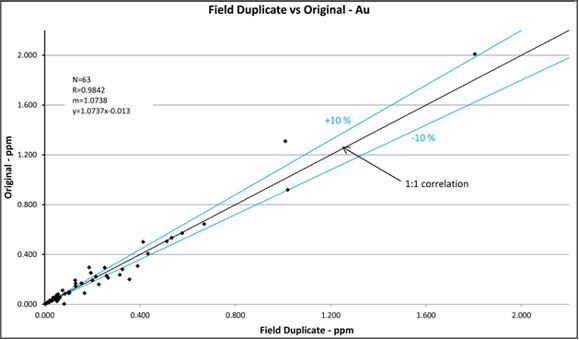
Figure 11‑38 Au Analyses (FA AA) for Preparation Duplicate Samples
Resource Development Associates Inc.
Effective Date July 24, 2023
GoldMining Inc. NI 43-101 Report – La Mina Project | Page 105 |
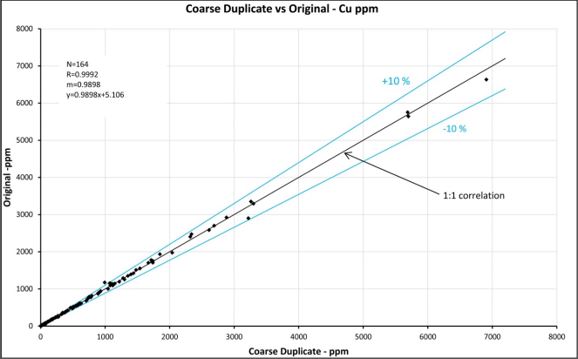
Figure 11‑39 Cu Analyses (ICP-AES) for Preparation Duplicate Samples
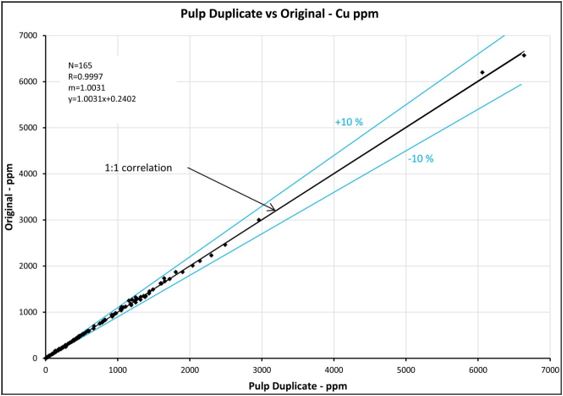
Figure 11‑40 Cu Analyses (ICP-AES) for Preparation Duplicate Samples
Resource Development Associates Inc.
Effective Date July 24, 2023
GoldMining Inc. NI 43-101 Report – La Mina Project | Page 106 |
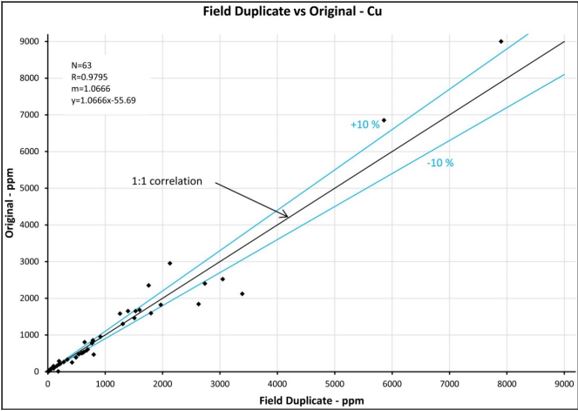
Figure 11‑41 Cu Analyses (ICP-AES) for Preparation Duplicate Samples
11.3.4.1 | INDEPENDENT CHECK ASSAY PROGRAM |
Bellhaven conducted a check assay study for the Middle Zone resource to accompany the standards, blanks, and duplicates program. Company geologists selected a suite of samples based on geological and grade variation for assay by a fully independent laboratory in order to further validate the resource and investigate possible laboratory or method bias. The first phase of this study is complete, with the second phase pending. The initial phase involved 70 check samples sent from intervals in 13 Middle Zone drill holes, distributed through a range of grades, alteration types, and intensities of weathering. The check assay value (reported by SGS) was compared with the original value for both gold and copper (originating from ALS Laboratories). The check value is considered acceptable if it falls within 10% of the original value, according to the following formula:
Absolute value| (original value – check value) | / (average of values) < 10%.
Of the 70 check samples for Middle Zone completed to date, only three gold values were flagged as failing the above formula (Figure 11‑42). In one case, the check value was higher than the original value. No values fell outside acceptable limits for copper (Figure 11‑43). Four certified standards and blanks were inserted into the sample set, all of which fell within acceptable ranges.
For the three gold exceptions, re-check samples were sent to ALS Laboratories with different sample numbers. In each case, the two closest values were chosen and the outlier discarded. The two values were then subjected to the above formula to assure that they fell into the same compliance criteria. In all three cases acceptable values were obtained. These accepted values were then averaged and entered into the database (Figure 11‑44). Two certified standards and two blanks were inserted into the sample set, all of which fell within acceptable ranges.
Resource Development Associates Inc.
Effective Date July 24, 2023
GoldMining Inc. NI 43-101 Report – La Mina Project | Page 107 |
As an additional check, three to five samples from intervals close to each flagged re-check sample were re-assayed for gold. Out of 12 samples, all but one fell within acceptable check assay limits, and the one non-compliant value was greater in the re-check than the original. These are included in Figure 11‑44.
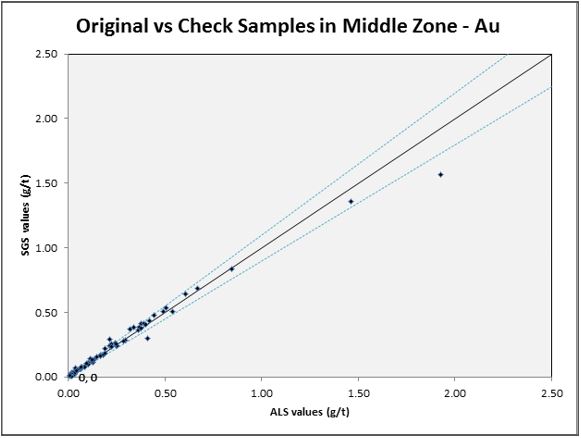
Figure 11‑42 Original vs Check Sample Comparison for Middle Zone - Au
The Blue Dotted lines are +/- 10% from the Mean
Resource Development Associates Inc.
Effective Date July 24, 2023
GoldMining Inc. NI 43-101 Report – La Mina Project | Page 108 |
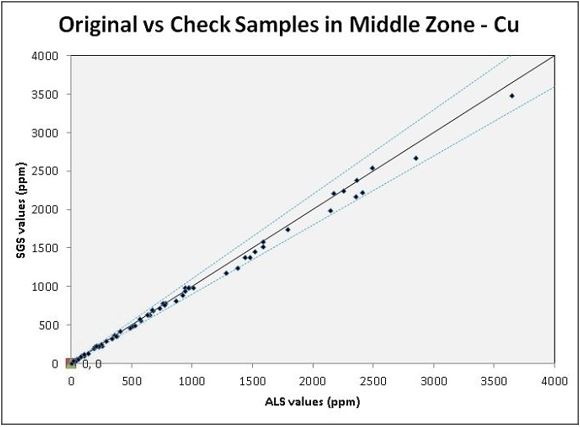
Figure 11‑43 Original vs Check Sample Comparison for Middle Zone - Cu
The Blue Dotted Lines are +/- 10% from the Mean
Resource Development Associates Inc.
Effective Date July 24, 2023
GoldMining Inc. NI 43-101 Report – La Mina Project | Page 109 |
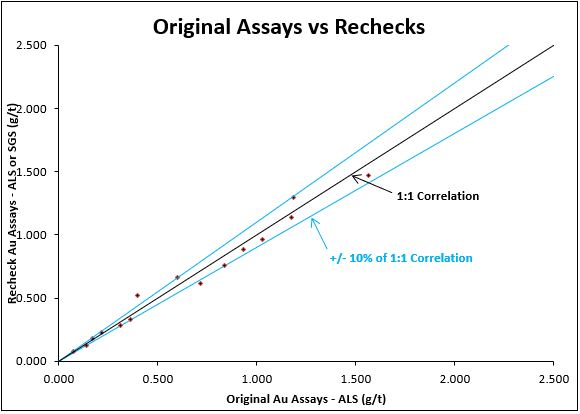
Figure 11‑44 Original Assays vs Rechecks - with Outliers Rejected
11.4 | GOLDMINING STANDARD, BLANK AND DUPLICATE SAMPLES |
GoldMining commenced its Quality Assurance – Quality Control (QA-QC) program with its first hole, LME-1107. The system involved regular insertion of blanks, standards, and duplicates into the sample stream. Coarse and pulp duplicates are included in the protocol. In addition, approximately 10% of all samples are sent to ACT Labs as part of an independent check assay program. Certified reference materials (CRMs), were purchased from Shea Clarke Smith Labs.
ALS labs use an internal QA/QC procedure including the insertion of blanks, standards, and duplicates. Each batch had at least one blank and one standard, which were inserted randomly by geologists within the numbering sequence. Blanks, standards and duplicates samples were inserted in the sample stream as follows: Blanks (2%), standards (2%), preparation duplicates (2%), and field duplicates (2%).
Assays and analytical results were reported on a batch-by-batch basis and reviewed by the project geologist. The criteria for accepting/rejecting the results were as follows:
| | ● | For reference materials, if the results were greater than three standard deviations, the batch fails. |
| | ● | For reference materials, if the results of two consecutive batches were greater than two standard deviations on the same side of the mean, the batch fails. |
| | ● | For field blank, if the results are over a pre-set limit, the batch fails. |
Rejected batches (failed reference sample assays) were rerun by the laboratory with the same CRM and blank inserted, to ensure the reference samples passed within the tolerances set out above. Following the above criteria, all core sample batch results from the 2022 drill program were accepted.
The reference material inserted in the sample streams were:
Resource Development Associates Inc.
Effective Date July 24, 2023
GoldMining Inc. NI 43-101 Report – La Mina Project | Page 110 |
BH12001X (Blank), BH12002X (Low Au, Med Cu Standard), BH12003X (Med Au, Med Cu standard), BH12004X (High Au, Med Cu standard). These reference materials were prepared by Shea Clark Labs. The standards inserted are detailed in Table 11‑1.
For the 2022 drilling program, samples for independent check assay were prepared at the ACT LABS facility in Rionegro, Antioquia, and analyzed at the ACT LABS laboratory in Zacatecas, Mexico.
The results of the analyses on the CRM’s are included in this report. In all cases, the charts are annotated with the name of the reference material and the certified values for the elements of interest (the copper series of reference materials).
The information shown below is specific to the La Garrucha resource (from LME1107 - 1111).
Table 11‑1 Certified Reference Material
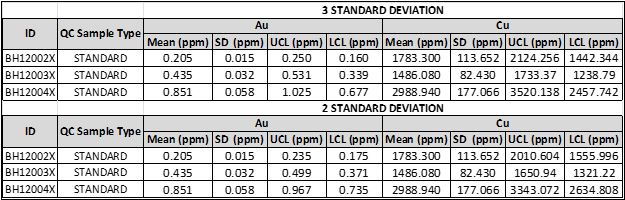
11.4.1 | GOLDMINING STANDARD RESULTS |
Three standards were used in the La Garrucha drilling (Table 11‑1) distributed randomly. The away results were consistent with expected results for both gold and copper. Out of 47 measurements, none fell outside of the allowable 3 standard deviations for Au or Cu.
Resource Development Associates Inc.
Effective Date July 24, 2023
GoldMining Inc. NI 43-101 Report – La Mina Project | Page 111 |
Using 2 standard deviations departure from the accepted value as a benchmark, only 1 Au determination (see Figure 11‑47), and nil Cu determinations, were outside an acceptable range.
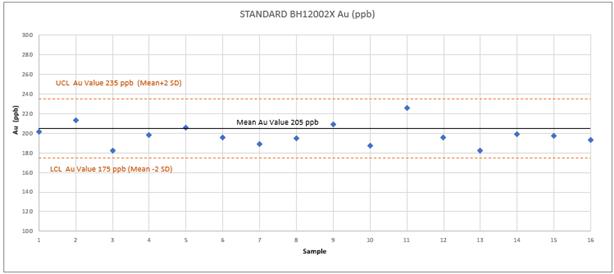
Figure 11‑45 Reference Material BH12002X Performance for Au
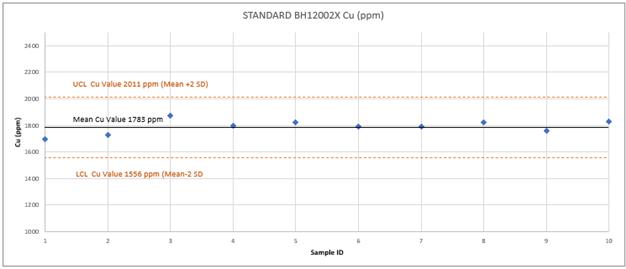
Figure 11‑46 Reference Material BH12002X Performance for Cu
Resource Development Associates Inc.
Effective Date July 24, 2023
GoldMining Inc. NI 43-101 Report – La Mina Project | Page 112 |
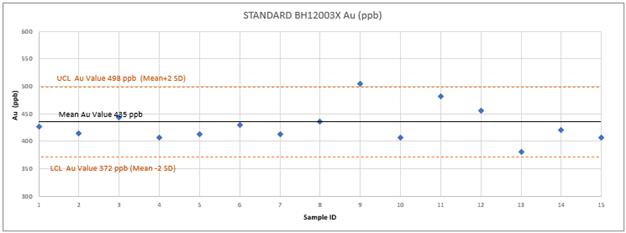
Figure 11‑47 Reference Material BH12003X Performance for Au
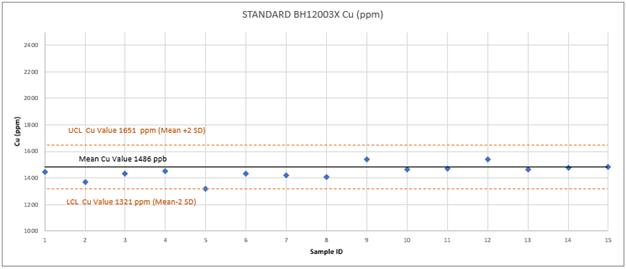
Figure 11‑48 Reference Material BH12003X Performance for Cu
Resource Development Associates Inc.
Effective Date July 24, 2023
GoldMining Inc. NI 43-101 Report – La Mina Project | Page 113 |
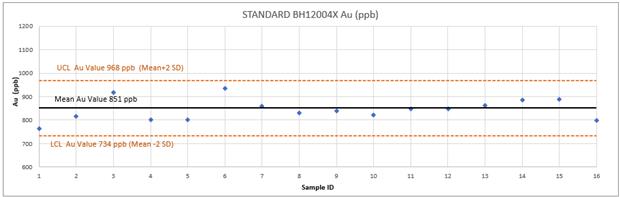
Figure 11‑49 Reference Material BH12004X Performance for Au
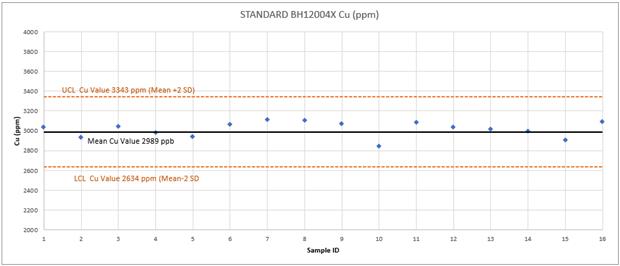
Figure 11‑50 Reference Material BH12004X Performance for Cu
11.4.2 | GOLDMINING BLANK RESULTS |
Two blank standards were used in the GoldMining La Garrucha 2022 drilling, a certified reference material (CRM) gold blank and a second blank derived from core drilled at another GMI project.
CRM blank BH12001X was inserted 26 times across the five drillholes completed, see Figure 11‑51 and Figure 11‑52. The gold results were very good, with no samples exceeding the 3rd standard deviation line. Copper also performed well with no samples falling outside of the 3rd standard deviation.
Resource Development Associates Inc.
Effective Date July 24, 2023
GoldMining Inc. NI 43-101 Report – La Mina Project | Page 114 |
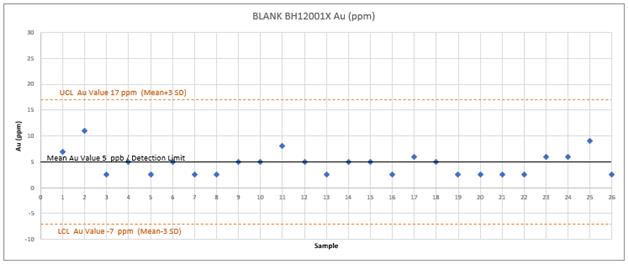
Figure 11‑51 Reference Material - Blank BH12001X Performance for Au

Figure 11‑52 Reference Material - Blank BH12001X Performance for Cu
The core blank performed well for Au with only one sample exceeding the 5.0 ppb detection limit, and the majority of samples assaying less than detection and thus recorded as 2.5 ppb Au. Copper demonstrated relatively uniform performance, however as a core sample from another GMI project it has a naturally high Cu background and returned values between 60 ppm - 80 ppm Cu. See Figure 11‑53 and Figure 11‑54.
Resource Development Associates Inc.
Effective Date July 24, 2023
GoldMining Inc. NI 43-101 Report – La Mina Project | Page 115 |
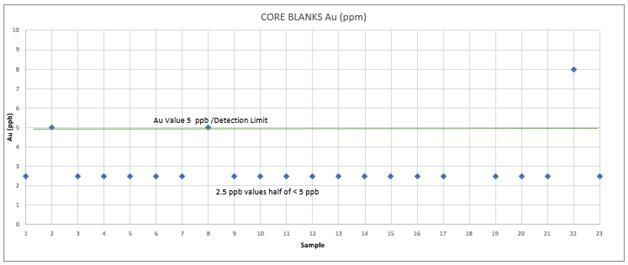
Figure 11‑53 Core Blank Performance for Au
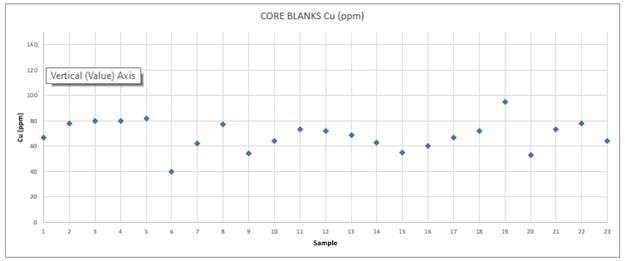
Figure 11‑54 Core Blank Performance for Cu
11.4.3 | GOLDMINING DUPLICATE TYPES AND RESULTS |
Three duplicate sample types are routinely generated during sampling of drill core at La Garrucha:
| | ● | Field duplicates are generated on-site at La Mina. Subsequent to sawing and packing half of the core as per normal sampling, an additional ¼ of the remaining core is cut and sent under a different sample number. |
| | ● | Coarse duplicates are generated at the preparation lab in Medellin. It is a split of the original coarse crush, which is relabeled and processed through pulverization. |
| | ● | Pulp duplicates are generated at the preparation lab in Medellin. It is a split of the final pulverized sample, which is relabeled and sent to the analytical lab. |
The La Garrucha coarse, pulp, and field duplicates were collected in the following frequency on a hole-by-hole basis: preparation duplicates (2%), and field duplicates (2%).
Resource Development Associates Inc.
Effective Date July 24, 2023
GoldMining Inc. NI 43-101 Report – La Mina Project | Page 116 |
In total, 45 field duplicates were analyzed. There is generally good agreement between original and duplicate assays for Au, with most samples falling within or just outside of the ±10% range. Cu showed more scatter, however without any trend in bias. The scatter is interpreted to be natural geological variation between samples. The results are shown graphically in Figure 11‑55 and Figure 11‑56.
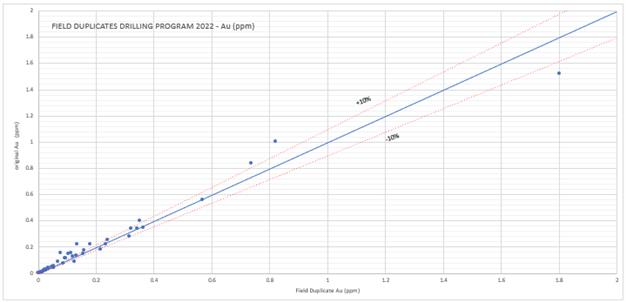
Figure 11‑55 Au Analyses (FA AA) for GMI Field Duplicate Samples
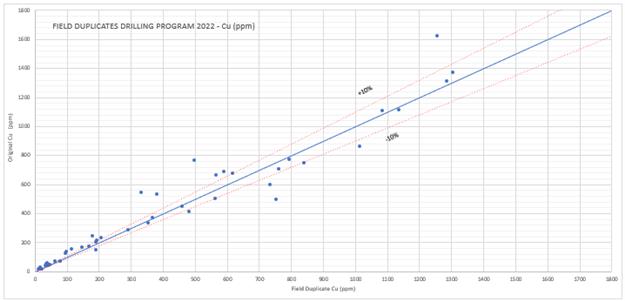
Figure 11‑56 Cu Analyses (ICP) for GMI Field Duplicate Samples
In total, 24 sample preparation coarse duplicates were analyzed. There is good agreement between original and duplicate assays for Au & Cu, with only 1 Au sample above cutoff grade (0.25 g/t Au) falling outside of the ±10% range. The results are shown graphically in Figure 11‑57 and Figure 11‑58.
Resource Development Associates Inc.
Effective Date July 24, 2023
GoldMining Inc. NI 43-101 Report – La Mina Project | Page 117 |
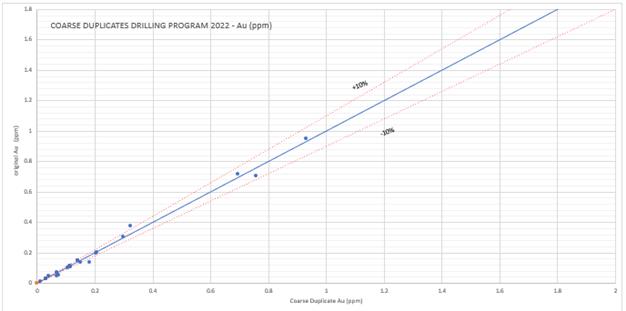
Figure 11‑57 Au Analyses (FA AA) for GMI Preparation Coarse Duplicate Samples
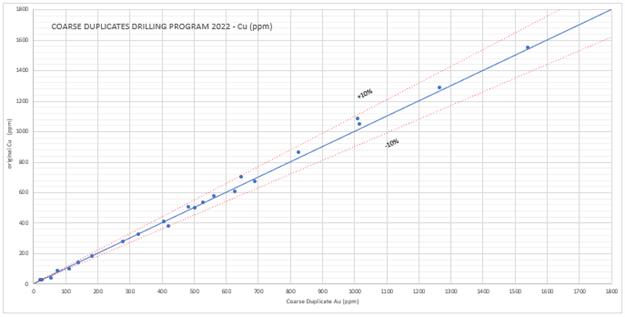
Figure 11‑58 Cu Analyses (ICP) for GMI Preparation Coarse Duplicate Samples
In total, 24 sample preparation pulp duplicates were analyzed. There is excellent agreement between original and duplicate assays for Au & Cu. The results are shown graphically in Figure 11‑59 and Figure 11‑60.
Resource Development Associates Inc.
Effective Date July 24, 2023
GoldMining Inc. NI 43-101 Report – La Mina Project | Page 118 |
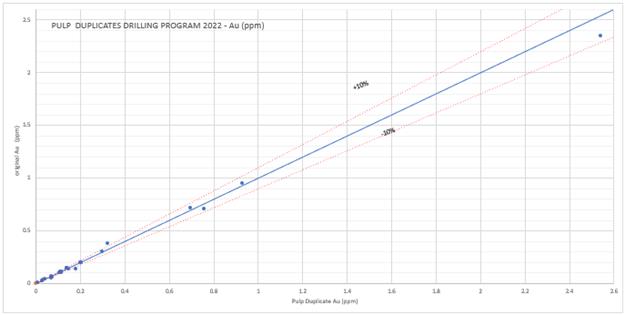
Figure 11‑59 Au Analyses (FA AA) for GMI Preparation Pulp Duplicate Samples
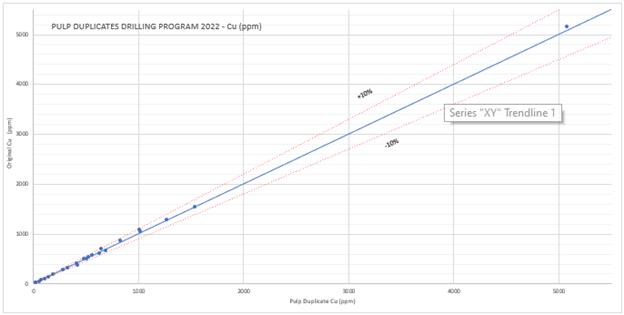
Figure 11‑60 Cu Analyses (ICP) for GMI Preparation Pulp Duplicate Samples
11.5 | GOLDMINING INDEPENDENT CHECK ASSAY PROGRAM |
GoldMining conducted a check assay study for the La Garrucha 2022 drilling. Company geologists selected a suite of 154 samples from the five core holes drilling, based on geological and grade variation, for assay by a fully independent laboratory in order to further validate the resource and investigate possible laboratory or method bias. The program involved insertion of 14 CRM standards to further check the veracity of the check sample assays. The check assay value (reported by ACT Labs) was compared with the original value (reported by ALS) for both gold and copper. The check value is considered acceptable if it falls within 10% of the original value.
Resource Development Associates Inc.
Effective Date July 24, 2023
GoldMining Inc. NI 43-101 Report – La Mina Project | Page 119 |
Of the 154 check samples for the 2022 La Garrucha completed, the vast majority of sample values for both Au and Cu fall within or near 10% of the original value, with Cu performing particularly well. See Figure 11‑61 and Figure 11‑62. Three certified standards were inserted into the sample set, all of which fell within acceptable ranges.
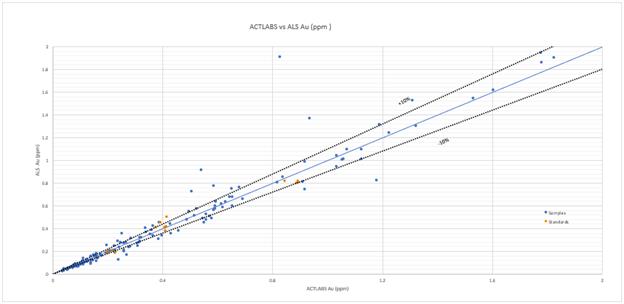
Figure 11‑61 Original vs Independent Check Assay Comparison for GMI drilling at La Garrucha – Au
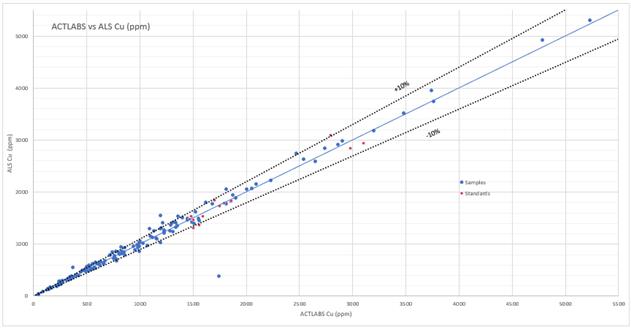
Figure 11‑62 Original vs Independent Check Sample Comparison for GMI drilling at La Garrucha – Cu
Resource Development Associates Inc.
Effective Date July 24, 2023
GoldMining Inc. NI 43-101 Report – La Mina Project | Page 120 |
11.6 | SUMMARY OF QA/QC PROGRAM |
The La Mina QA/QC program consisted of certified standards, blanks, two types of lab duplicates and one type of field duplicate, as well as a check assay program involving a second analytical laboratory. The accuracy of the assays for gold and copper appears to be very good, as measured by the performance of analytical control samples. The repeatability or precision of the assay data for both copper and gold, as measured by duplicate and replicate assays, is also well within industry norms. Furthermore, the confirmation by an independent lab of gold and copper values for a selected suite of Middle Zone samples further enhances the credibility of the data. The fact that two accredited laboratories produced data that are so highly correlative is significant. Taken in its entirety, the quality assurance program from the Middle Zone deposit confirms that the data are of sufficient quality to support this resource calculation.
The methodology used to monitor the quality control during the drilling at the La Mina Project also exceeds industry norms. Company geologists routinely compare quality control data against certified values. The data and charts presented here document the follow-up assessment that occurs on the relatively rare occasions when values are returned that fall outside industry guidelines for quality. When assays for standards exceed certified values by more than 3 standard deviations, Bellhaven has investigated and addressed the concerns. Similarly, when replicates or duplicates disagree by more than 10%, one can see follow-up analyses in the database. Hence, a complete review of the quality control data and Company practices tends to boost confidence in the assay data that are the building blocks of the resource models.
The quality control data for Middle Zone gold assays is particularly strong. Standards and blanks show almost no significant outliers beyond the 3rd standard deviation from certified values (one out of 500 cases for standards, 6 out of 258 cases for blanks). Even using the more stringent 2nd standard deviation, a relatively insignificant number of values were flagged (13 out of 500 cases for standards, 9 out of 258 cases for blanks). As documented above, many of the failures on blanks occurred at concentrations less than 10x the lower reporting limit of the method. At these low levels, an analytical method is much less reliable as precision is very high. The data from standards and blanks for gold indicate acceptable accuracy and do not identify any major episodes of contamination in the lab.
Gold assays from the coarse and pulp duplicates show good correlation and nearly all fall within ±10% of a 1:1 correlation. Since Company geologists collected data on duplicates at the crushing and pulverizing stages of sample preparation, we can see from the above data that there are no major problems with sub-sampling of the Middle Zone samples for gold. This level of agreement is well beyond industry norms. This type of duplicate data suggests that the sample prep laboratory is performing well, the geological materials pose no extraordinary challenges, and the precision of the analytical data is within expectations.
As expected, the field duplicates show significantly more scatter in the gold assays than laboratory duplicates do. It is important to see an improvement in duplicate performance from field duplicates to coarse lab duplicates. GoldMining geologists should review the methodology for field duplicates in order to ensure equitable assessments of sampling error for future sampling programs. Using a +20% precision envelope, we can see that most gold duplicates group nicely. Given that this comparison is between half core (original) and quarter core (duplicate) taken at the core saw, such correlation is certainly acceptable. It is recommended that future field duplicates be of comparable mass and volume, so the geologists should select either equal quarter core splits or half core splits.
The independent lab check assay program also results in good agreement between gold in the data sets, with only three sample pairs out of 70 differing by more than 10%. Subsequent re-check samples on these three cases (with a number of surrounding samples being checked) resulted in assay pairs with acceptable precision. The confirmation of the tenor of mineralization from an independent laboratory provides added confidence. The ongoing comparison between independent labs will also provide a fallback position from which to evaluate drift or bias over time. This will become important as the resource is upgraded to potentially economic Measured & Indicated categories.
Resource Development Associates Inc.
Effective Date July 24, 2023
GoldMining Inc. NI 43-101 Report – La Mina Project | Page 121 |
The quality control results for copper are also very good. While there may be some subtle evidence of drifting bias at low concentration ranges in the laboratory method, the overall accuracy and precision of the copper data are sufficient to support this resource calculation.
Regarding the copper results for the analytical control samples and blanks, only 10 out of 330 standard determinations fell outside the 3rd standard deviation from the accepted copper values. The copper values in most certified blanks fell below the acceptable maximum values, but there were numerous failures at low concentration ranges (less than 10x the lower reporting limit for copper). The total number of failures was 38 out of 258 samples. The failures occurred with three certified blanks (BL110, BL111, and BL115). In the first two cases, the successive failures are limited in duration and do not suggest a prolonged problem at the lab. In the case of BL115, the number of successive busts does warrant a more detailed review. Analytical failures of low-level standards or blanks could indicate contamination or some sort of drift in calibration at the low end of a method’s operational range.
To evaluate this apparent systematic trend noted in the copper blanks and standards, Figure 11‑45 below arranges both standard and blank failures by analysis date. The chart tracks the specific cases of failure of standards and blanks when compared against a conservative two standard deviations threshold. Percentage failure (y-axis) is defined as the percentage of the standard or blank measurement over (or under) the threshold value for that specific standard or blank. The chart excludes the majority of standards and blank measurements, since these fell within the above thresholds. Note that from the beginning of Middle Zone drilling in August 2010 to September 2011, there is a consistent positive bias to the copper results. The curve is almost bell shaped with its apex occurring in March 2011. The bias appears to neutralize or perhaps become weakly negative from September 2011 to mid-March 2012, possibly returning to a subtle positive bias thereafter.
Resource Development Associates Inc.
Effective Date July 24, 2023
GoldMining Inc. NI 43-101 Report – La Mina Project | Page 122 |
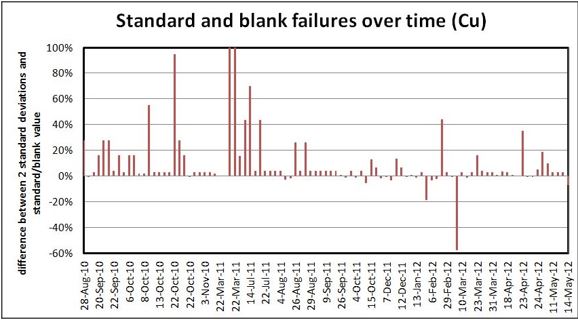
Figure 11‑63 Changes in the Magnitude of Difference between Standards and Blanks for Copper Plotted against Date of Analysis
If confirmed, this pattern could indicate some kind of drift in the copper baseline assay results. Contamination could also play a part in the positive bias, but it may be difficult to confirm that. However, it is important to point out that most of these failures occur at very low levels – well below the average grade of the Middle Zone resource. For that reason, it is unlikely that the apparent drift in low level copper values that may be in evidence here would have any material effect on these mineral resources.
As with gold, pulp and coarse duplicates for copper show good correlation, while the field duplicates show a significantly larger spread. Using the 10% precision envelope, the chart shows only one failure of a coarse duplicate at higher copper concentrations. The pulp duplicates perform even better. Again, having data for both coarse and pulp duplicates build confidence that there are no significant sub-sampling problems for copper with the Middle Zone samples.
The field duplicates do show more scatter, suggesting that sampling error increases when dealing with geological materials in the field. However, as the coefficient of correlation remains high and the scatter is largely contained with a + 20% precision envelope, the sampling variability at Middle Zone is well in line with expectations. Improved consistency may result from collecting consistent quarter core samples for field duplicates in the future.
The two independent laboratories confirm the levels of copper mineralization based on the check assay program so far. The agreement between the two labs was excellent, with no values out of 70 pairs flagged outside the + 10% precision envelope for samples containing at least 500 ppm copper.
Resource Development Associates Inc.
Effective Date July 24, 2023
GoldMining Inc. NI 43-101 Report – La Mina Project | Page 123 |
Since taking an option on the property and until 2016, the Bellhaven sampling and assaying programs were controlled by a systematic application of certified standards and blanks, along with Bellhaven’s own field duplicate and laboratory duplicate checks. The use of an independent international preparation and assay laboratory, ALS Chemex, adds additional assurance that assay results are representative of the mineralization encountered on the property.
As an additional verification and check on the overall level of copper-gold grades reported for the porphyry mineralization at La Mina, the authors, on many site visits, have collected samples independently from drill core representing the current drill programs. The samples for this report were collected by Mr. Wilson.
This verification sampling is intended only as a check of the general level of copper-gold mineralization found at La Mina, but is not intended as a comprehensive QA-QC assessment for the purposes of resource estimation.
The results of the check assays compared to the original assays are within acceptable precision. GoldMining put no limitations on the author’s review of the exploration site.
During the authors’ site visit, logging procedures, sample collection and preparation procedures were reviewed.
In the opinion of the qualified person, the data collected by the Company, is adequate for the estimation of mineral resource for the La Mina Project.
12.1 | CURRENT INSPECTION AND DATA VALIDATION |
The current inspection for the La Mina Project was carried out on October 12 and 13, 2022 by Scott Wilson. During the visit there was active work ongoing. The QP inspected the Project infrastructure including the core storage, logging areas, sample preparation areas and the office and related building infrastructure.
The visit was accompanied and supported by the Company’s exploration geologist Diego Fernando Gomez, along with the support of his support team, both for geological discussions and review and for visiting and reviewing the facilities.
12.2 | VERIFICATION CHECK SAMPLES |
Three samples were collected from three different La Garrucha exploration holes. One quarter core interval was collected from each hole; LME-1107, LME-1108 and LME-1111.
Table 12‑1 lists the details of the samples selected and evaluated as verification checks for La Garrucha.
Table 12‑1 2022 Site Visit Data Verification Samples
Hole Id | Sample Id | From | To | Au | Cu | Resampled
Au | Resampled
Cu |
LME-1107 | 26380 | 186.92 | 188.26 | 0.347 | 1620 | 0.329 | 917 |
LME-1108 | 26908 | 498.6 | 499.2 | 1.055 | 762 | 1.14 | 861 |
LME-1111 | 28148 | 383.8 | 385.8 | 0.157 | 419 | 0.13 | 442 |
Resource Development Associates Inc.
Effective Date July 24, 2023
GoldMining Inc. NI 43-101 Report – La Mina Project | Page 124 |
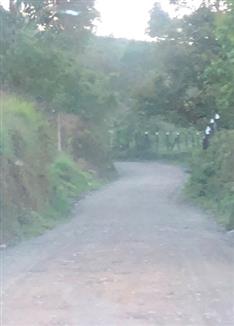
Figure 12‑1 Gravel road from Fredonia town to La Mina Project
Resource Development Associates Inc.
Effective Date July 24, 2023
GoldMining Inc. NI 43-101 Report – La Mina Project | Page 125 |
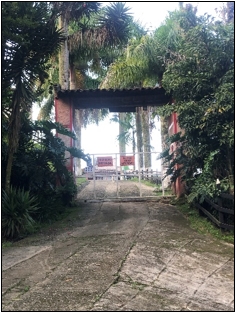
Figure 12‑2 Gate at the entrance of the facilities provides security to the drill cores, and other reliable information
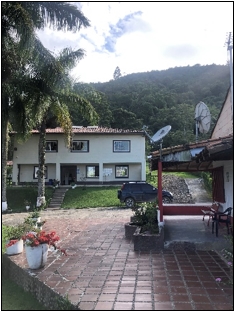
Figure 12‑3 Geology office and accommodation house
Resource Development Associates Inc.
Effective Date July 24, 2023
GoldMining Inc. NI 43-101 Report – La Mina Project | Page 126 |
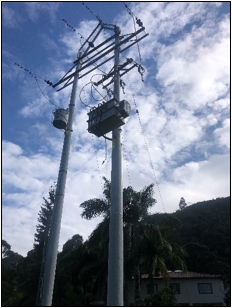
Figure 12‑4 Electricity supply by regional grid interconnection
Resource Development Associates Inc.
Effective Date July 24, 2023
GoldMining Inc. NI 43-101 Report – La Mina Project | Page 127 |
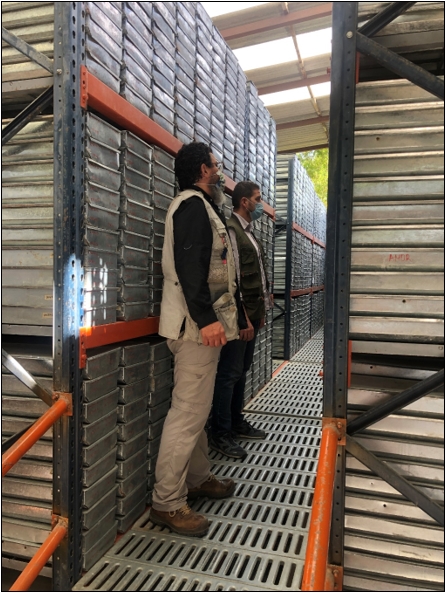
Figure 12‑5 Warehouse drill-core storage
Resource Development Associates Inc.
Effective Date July 24, 2023
GoldMining Inc. NI 43-101 Report – La Mina Project | Page 128 |
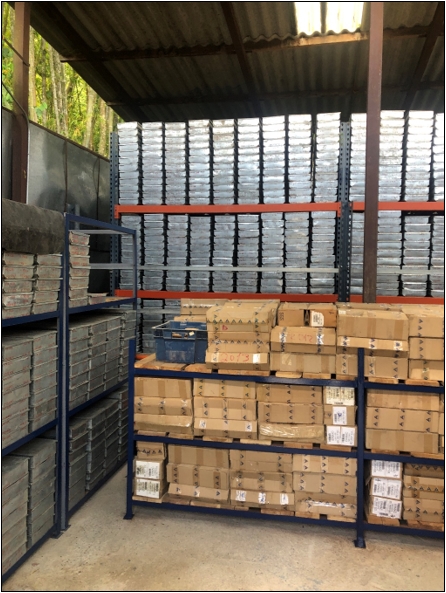
Figure 12‑6 Pulp rejects storage
Resource Development Associates Inc.
Effective Date July 24, 2023
GoldMining Inc. NI 43-101 Report – La Mina Project | Page 129 |
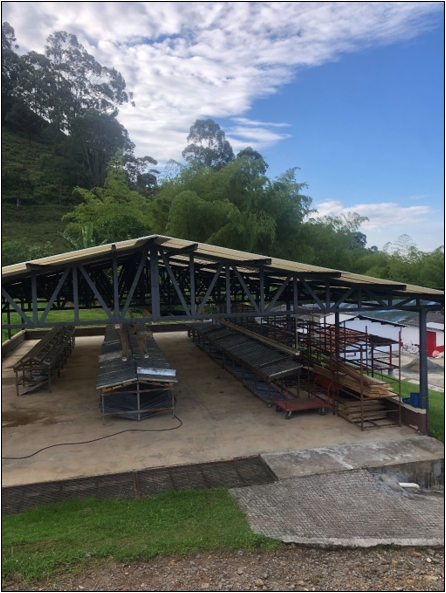
Figure 12‑7 Core shed for core logging and sampling
Resource Development Associates Inc.
Effective Date July 24, 2023
GoldMining Inc. NI 43-101 Report – La Mina Project | Page 130 |
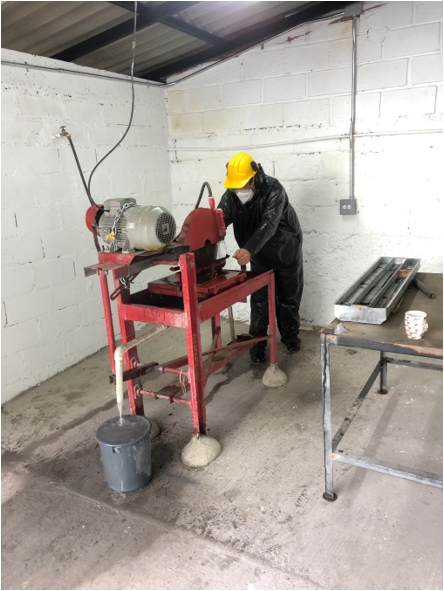
Figure 12‑8 Technician demonstrating core cutting procedures
Resource Development Associates Inc.
Effective Date July 24, 2023
GoldMining Inc. NI 43-101 Report – La Mina Project | Page 131 |
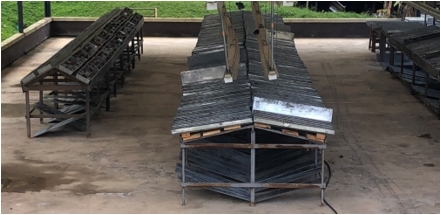
Figure 12‑9 Core logging facilities
During the field visit to the La Mina Project, it was possible to verify and analyze geological information from maps and geological sections of the La Mina mining project that correlate with representative drill cores.
Figure 12‑10 and Figure 12‑11 Geology and model review by plan view and systematic sections – La Mina, Fredonia
The drill core is mainly stored in industrial aluminum metal boxes, duly labeled and organized in shelves arranged under the roof to protect them from deterioration.
The logging of some type or representative sections in the drilling cores was carried out where the existence of the host rock and zones hosting gold, silver and copper mineralization of the La Mina Project could be validated. Additionally, random sections of mineralized core samples were selected, cut and sampled to validate the grades and concentrations previously reported in the La Mina Project.
Resource Development Associates Inc.
Effective Date July 24, 2023
GoldMining Inc. NI 43-101 Report – La Mina Project | Page 132 |
During the review of the core and the corresponding drill logs, it was possible to verify the proper labeling of the boxes, core and the sample correlation.
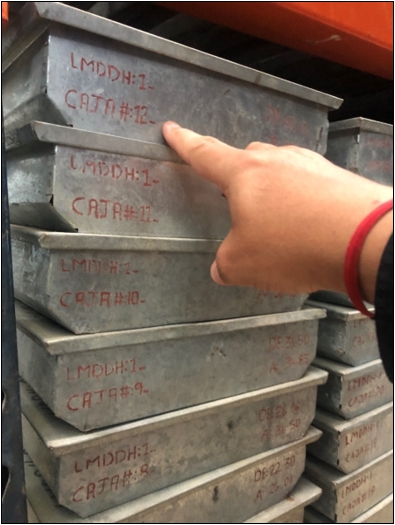
Figure 12‑12 Well organized core trays storage
Resource Development Associates Inc.
Effective Date July 24, 2023
GoldMining Inc. NI 43-101 Report – La Mina Project | Page 133 |
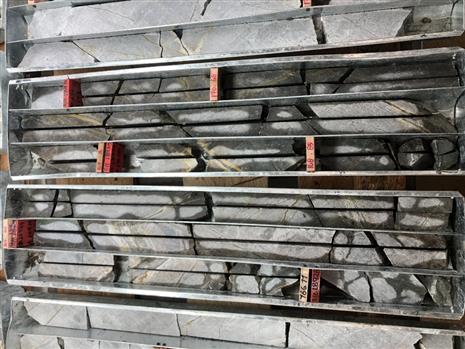
Figure 12‑13 ¼-core for duplicate checks ready for sampling as prepared under the supervision of the QP during the current site visit
Resource Development Associates Inc.
Effective Date July 24, 2023
GoldMining Inc. NI 43-101 Report – La Mina Project | Page 134 |
13 | MINERAL PROCESSING AND METALLURGICAL TESTING |
The PEA for the Project considers mining and processing of mineralization from the La Cantera, and Middle Zone and La Garrucha zones.
Two scoping level metallurgical test work programs have been completed on samples from the La Mina deposit. The first program was completed and reported in 2011. Bellhaven Exploraciones contracted Resource Development Inc. (RDi) to undertake a scoping level metallurgical study for La Mina porphyry gold and copper prospect in Colombia (RDi 2011). The second program was completed and reported in 2022, on samples from the La Garrucha deposit. Goldmining Inc contracted ALS Metallurgy (ALS) to complete the work. Generally, the copper and gold recoveries by flotation into a bulk rougher concentrate and gold recovery by cyanide leaching were consistent in the two test programs for the materials tested, and indicate that the La Mina samples (La Cantera, Middle Zone and Garrucha) are amenable to standard flotation for copper and gold recovery and to cyanide leaching for gold recovery.
RDi received four composite samples for the first metallurgical study. The metallurgical test work undertaken included sample preparation and characterization, Bond ball millwork index determinations, in-place bulk density measurements, gravity tests, direct cyanidation and carbon-in-leach tests and rougher and cleaner flotation tests. ALS received ten bags of samples, comprising quarter NQ core derived from 2 drillholes, and used these to form a Master Composite of the La Garrucha zone for metallurgical testing. The ALS test program included sample preparation and characterization, Bond ball millwork index determinations, mineralogical assessments, cyanide leaching of whole ore samples and of cleaner and rougher flotation tails samples and rougher and cleaner flotation tests.
The RDi and ALS test work showed a Bond’s ball mill work index of 10.2 to 14.0, and 15.5 kWh/t respectively, indicating that the Garrucha material is slightly harder than the other La mina zones tested.
Gravity concentration tests on the RDi samples indicated that it was unlikely that a high-grade concentrate amenable to direct smelting could be produced, and that the quantity of coarse free gold was not significant.
No mineralogical testwork was undertaken for the RDi test program. The mineralogical testwork on the ALS samples, indicated that the material was relatively amenable for copper and gold recovery, with a pyrite to copper sulphide ratio of 3:1 but relatively little association of copper sulphides with pyrite, which indicates that a reasonably efficient separation of pyrite from copper sulphides in a flotation process is feasible. The sample contained insignificant amounts of oxide copper minerals. With about 48 percent copper liberation at the nominal 103 µm K80 primary grind sizing, reasonably rougher copper response could be anticipated if relatively aggressive flotation conditions are applied.
Whole ore cyanide leach tests on the RDi samples extracted over 80% of the gold from three of the four RDi composites, but with high cyanide consumptions. Cyanidation tests were also completed on whole rock in the ALS testing, from which gold extractions averaged 90 percent. Pre-aeration prior to cyanidation leach tests increased the dissolved oxygen level, which markedly improved initial leach kinetics and substantially decreased overall sodium cyanide consumption.
A series of open-circuit, batch flotation tests were conducted in the RDI test program using a simple reagent suite consisting of potassium amyl xanthate (PAX), Aeropromotor 404 and methyl isobutyl carbonal. Generally, recoveries ranged between 74% to 90% for both gold and copper in the rougher concentrate over a primary grind size range of 150 µm - 74 µm. No systematic cleaner tests were performed, but a single test incorporating regrinding of the rougher concentrate followed by two stages of cleaner flotation in open-circuit tests produced a concentrate assaying over 26% Cu and ±50 g/t Au for three of the four composite samples. No data on concentrate grades or recoveries were presented, but ICP analysis of the composites indicated that the levels of some of the major potential deleterious elements (As<10ppm, Bi<10ppm, Hg, Se not measured) were relatively low.
Resource Development Associates Inc.
Effective Date July 24, 2023
GoldMining Inc. NI 43-101 Report – La Mina Project | Page 135 |
Rougher and cleaner flotation tests in the ALS program were completed at three different primary grind sizings, nominally 150 µm, 106 µm, and 74 µm. Copper rougher recovery improved slightly with finer primary grind sizing. Gold recoveries to rougher concentrates didn’t vary much by primary grind size, averaging approximately 86%. On this basis, the coarser primary grind sizing may be optimal, though an economic trade-off study would be required to confirm this. Increasing cleaner circuit pH from 10 to 11 improved copper concentrate grade, while maintaining similar overall copper and gold recoveries
Two different processing options were tested in the ALS program, flotation and also cyanide leaching of flotation tailings. Flotation testing produced a bulk concentrate containing 27% copper, 192 g/tonne gold and 549 g/tonne silver, while recovering about 77% of the copper and 67% of the gold. As this was an open circuit test, closed circuit testing would be expected to recover some of the losses in the cleaner tails, resulting in higher recoveries at lower grade. Final concentrate analysis, based on small sample availability, indicated relatively high concentrations of some deleterious metals eg As, Pb. Cyanide leaching of the cleaner and rougher tailings recovered approximately 78% of the gold in the rougher tailings and 85% in the cleaner tailings, collectively representing about 25% of the feed gold. Overall gold recovery from such a flowsheet would be expected to total around 92%.
An overall base case recovery for gold and copper by flotation after regrind and cleaning into a 23% - 26% copper concentrate is projected at 69% and 80% respectively. Cyanide leaching of the cleaner and rougher tailings, increases the total gold recovery to approximately 91%. It is reasonable to assume that further test work and optimization work around primary grind size, flotation reagents, mass pull and concentrate regrind and cyanide leaching conditions could further improve gold and copper recoveries and optimize reagent consumptions. Further test work on representative samples, mineralogy and a program of open and locked cycle flotation testing and cyanide leach testing is required to provide further confidence in the metallurgical response and optimization of the recovery process.
13.2 | METALLURGY INTRODUCTION |
Bellhaven Exploraciones contracted Resource Development Inc. to undertake the initial scoping metallurgical study to evaluate the various processing options to recover copper and gold. RDi received four composite samples for the study. There were three samples from the La Cantera prospect consisting of average grade, low grade and high grade and one sample from the Middle Zone prospect. The scoping studies undertaken included sample preparation and characterization, Bond’s ball mill work index determinations, gravity tests, direct cyanidation and carbon- in-leach tests and rougher and cleaner flotation tests.
Goldmining Inc contracted ALS to conduct preliminary metallurgical testing on samples from the La Garrucha zone for the La Mina Project in Colombia. The objective of the testing was to evaluate the flotation and leaching characteristics of a single Master Composite.
This Technical Report summarizes the metallurgical test work results obtained in the two test programs and expected metallurgical performance for the deposit.
Resource Development Associates Inc.
Effective Date July 24, 2023
GoldMining Inc. NI 43-101 Report – La Mina Project | Page 136 |
13.3 | METALLURGICAL TEST WORK |
Coarse drill-core rejects were supplied to RDi for the metallurgical study. These samples were composited to make four representative composite samples for the study. They are listed in Table 13‑1.
Table 13‑1 Description of Composite Samples
Composite No | Description |
1 | La Cantera prospect, average grade |
2 | Middle Zone prospect |
3 | La Cantera, high grade |
4 | La Cantera prospect, low grade |
13.3.1 | SAMPLE PREPARATION AND CHARACTERIZATION |
The composite samples were stage crushed to P100 of 3.35 mm (6 mesh), thoroughly blended and riffle split into two parts. One part was stored in drums for later work. The other half of each composite was blended and split into 1 kg charges using a twenty-way rotary splitter. The 1 kg charges were weighed, bagged and stored in the freezer to avoid oxidation.
A 1 kg charge for each composite was pulverized to 106 µm (150 mesh), blended and representative splits taken out for head analyses. The samples were submitted for gold assay using one-assay-ton fire-assay procedure, sequential copper analyses and ICP analyses.
The composite analyses results are presented in Table 13‑2 to Table 13‑4, and indicate the following:
| | ● | The gold content in these samples varied from 0.727 g/t to 1.454 g/t. |
| | ● | The total copper content varied from 0.306% to 0.476%. Most of the copper in composite No.2 and No. 3 was primary copper whereas other two composites had significant amount of oxide and secondary copper (Table 13‑3). |
| | ● | ICP analyses indicated that the composite samples had only traces of other sulfide minerals (i.e., Zn, Pb, As, Ni, Mo, etc.). |
Table 13‑2 Head Analysis of Bellhaven Samples
| Composite Number |
| Element | 1 | 2 | 3 | 4 |
Au, g/t | 1.207 | 0.727 | 1.427 | 1.454 |
CuTotal, ppm | 3520 | 3320 | 4760 | 3060 |
CuAcid sol, ppm | 1468 | 82 | 393 | 856 |
CuCNsol, ppm | 1092 | 65 | 299 | 425 |
Table 13‑3 Proportion of Different Forms of Copper in the Bellhaven Samples
| Composite Number |
| Element | 1 | 2 | 3 | 4 |
CuAcid sol, % | 41.7 | 2.5 | 8.3 | 28 |
CuCNsol, % | 31.0 | 2.0 | 6.3 | 13.9 |
CuCPrimary, % | 27.3 | 95.5 | 85.4 | 58.1 |
Resource Development Associates Inc.
Effective Date July 24, 2023
GoldMining Inc. NI 43-101 Report – La Mina Project | Page 137 |
Table 13‑4 ICP Analyses of Composite Samples
Composite Number |
Element | 1 | 2 | 3 | 4 |
Al | 6.95 | 7.48 | 6.41 | 7.94 |
Ca | 0.89 | 1.26 | 3.36 | 1.79 |
Fe | 7.96 | 5.51 | 6.81 | 7.33 |
K | 4.62 | 3.89 | 3.57 | 4.53 |
Mg | 0.68 | 0.84 | 0.88 | 1.02 |
Na | 1.99 | 2.01 | 1.89 | 2.25 |
Ti | 0.19 | 0.14 | 0.21 | 0.24 |
Element, ppm | | | | |
As | <10 | <10 | <10 | <10 |
Ba | 837 | 1267 | 783 | 1062 |
Bi | <10 | <10 | <10 | <10 |
Cd | 9 | 6 | 7 | 8 |
Co | 14 | 11 | 12 | 13 |
Cr | 30 | 36 | 30 | 30 |
Cu | 3533 | 3233 | 4359 | 3061 |
Mn | 520 | 502 | 741 | 595 |
Mo | 17 | 29 | 100 | 20 |
Ni | <5 | <5 | <5 | <5 |
Pb | 12 | 11 | <10 | 11 |
Sr | 307 | 408 | 487 | 433 |
V | 110 | 99 | 84 | 105 |
W | <10 | <10 | <10 | <10 |
Zn | 132 | 95 | 105 | 167 |
13.4 | IN-PLACE BULK DENSITIES |
RDi received rock samples from the various parts of the prospect for in-place bulk density measurements. We used the standard procedure of waxing the dried core samples and determining the water displacement volume to calculate the in-place bulk densities. The results for the 16 samples are given in Table 13‑5. The bulk densities ranged from 2.48 to 2.98 g/cc.
13.5 | BALL MILL WORK INDICIES |
Ball Mill work indices were determined at 150 µm (100 mesh) for the four composite samples. The test data are given in Appendix B and the results are summarized in Table 13‑6
Table 13‑5 Bond's Ball Mill Work Index @ 150 µm.
Composite No. | Area | BWI |
1 | La Cantera average grade | 10.22 |
2 | Middle Zone | 11.96 |
3 | La Cantera high grade | 14.00 |
4 | La Cantera low grade | 12.85 |
These results indicate that the ore hardness is within the range for the porphyry ores. The La Cantera high-grade sample had the highest work index.
The objective of the gravity testing was to determine if one could recover free gold, especially coarse gold, from the ore in a concentrate which could be directly smelted.
The four composite samples (1 kg charges) were ground to P80 of 212 µm, 150 µm and 106 µm (65, 100, and 150 mesh) and subjected to gravity concentration using a laboratory Knelson concentrator. The gravity concentrate was subjected to cleaner gravity concentration using Gemini table.
The test results indicate that gravity concentrate recovered 11% to 28% of the gold in 0.4% to 2.8% of the weight. The concentrate grade ranged from 2 g/t to 115 g/t Au. Since the concentrate grade was too low to treat it separately there may not be a significant quantity of coarse gold in the deposit, indicating that a primary gravity recovery circuit is likely not appropriate for this deposit. However, the use of gravity concentration within the grinding circuit may be suitable to scalp out coarse free gold.
Resource Development Associates Inc.
Effective Date July 24, 2023
GoldMining Inc. NI 43-101 Report – La Mina Project | Page 138 |
13.7 | WHOLE ORE CYANIDATION LEACH TESTS |
Whole ore cyanidation and carbon-in-leach tests were performed on the four composites to determine the metal extractions and reagent consumptions.
Each composite sample (1 kg charge) was ground to P80 of 75 µm (200 mesh) and slurried with water to a density of 40% solids. The slurry sample was adjusted to a pH of 11 with lime and a cyanide concentration of 1 g/l. For the carbon-in-leach tests, 20 g/l of carbon was also added to the slurry. The samples were bottle rolled for 48 hours. Kinetic samples were taken at 6, 24 and 48 hours for whole ore cyanidation tests and assayed for gold and copper. The pH and NaCN concentration were adjusted to 11 and 1 g/l respectively at 6 and 24 hours. After 48 hours, the samples were filtered and the test residues thoroughly washed and dried. The dry residues were pulverized and assayed for gold and copper.
The test results are summarized in Table 13‑7 and Table 13‑8.
The test results indicate the following:
| | ● | Gold extractions were reasonable (>80%) for composite No’s. 2 to 4. The gold extraction from composite No. 1 was only 31.3%. |
| | ● | The copper extractions for these samples ranged from 44% to 71%. |
| | ● | The NaCN consumption was high (i.e., 1.7 kg/t to 4.4 kg/t). |
There appears to be no robbing components in these ores based on direct cyanidation and CIL tests.
Table 13‑6 Cyanidation Leach Test Results (P80 = 75 µm)
| Composite Number |
| Parameter | 1 | 2 | 3 | 4 |
| | Au | Cu | Au | Cu | Au | Cu | Au | Cu |
Extraction % | | | | | | | | |
6 hrs. | 8.6 | 28.8 | 33.7 | 15.5 | 10.3 | 22.3 | 7.4 | 17.8 |
24 hrs. | 24.1 | 31.4 | 80.6 | 29.5 | 62.9 | 54.4 | 59.5 | 31.5 |
48 hrs. | 31.3 | 48.8 | 86.2 | 44.3 | 84.5 | 70.7 | 90.2 | 34.8 |
Residue, g/t | 0.61 | 2120 | 0.1 | 320 | 0.21 | 402 | 0.06 | 2042 |
Cal. Feed g/t | 0.89 | 4140 | 0.72 | 575 | 1.35 | 1372 | 0.63 | 3125 |
NaCN Consumption, Kg/t | 4.36 | 1.79 | 3.27 | 2.86 |
Table 13‑7 Carbon-in-Leach (CIL) Test Results
| Composite Number |
| Parameter | 1 | 2 | 3 | 4 |
| | Au | Cu | Au | Cu | Au | Cu | Au | Cu |
Extraction % (48 hrs) | 41.3 | 49.4 | 86.8 | 42.6 | 85.7 | 72.9 | 84.9 | 34.7 |
Carbon g/t | 12.2 | 241.2 | 21.26 | 518 | 41.06 | 4,920 | 20.2 | 2,184 |
Residue, g/t | 0.54 | 2,082 | 0.1 | 322 | 0.21 | 390 | 0.11 | 2,050 |
Cal. Feed g/t | 0.91 | 4,115 | 0.73 | 561 | 1.49 | 1,439 | 0.73 | 3,139 |
NaCN Consumption, Kg/t | 4.04 | 1.90 | 3.64 | 3.19 |
Resource Development Associates Inc.
Effective Date July 24, 2023
GoldMining Inc. NI 43-101 Report – La Mina Project | Page 139 |
Flotation tests were undertaken with the primary objective of producing a copper- and gold-rich sulfide mineral concentrate. The process variables evaluated included grind size, collectors (potassium amyl xanthate (PAX), Aero Promotors 404 and 3418A) and sulfidization of the ore in the grinding circuit. There were six rougher flotation tests run for each of the four composites.
The process parameters for the flotation tests are given in Table 13‑8. The flotation test results are summarized in Table 13‑9 to Table 13‑12. The test results indicated the following:
| | ● | Gold recovery of 70% to 90% can be obtained in the rougher flotation concentrate along with similar recoveries for copper. |
| | ● | These recoveries were achieved with a simple reagent suite consisting of potassium amyl xanthate (PAX), Aeropromotor 404. |
| | ● | Sulfidization was found to be detrimental instead of beneficial for some of these samples, although this needs further evaluation. |
No mineralogical analysis was reported in the metallurgical program. Mineralogical analysis is useful to understand the mineralogical makeup of each composite e.g., content of primary and secondary copper minerals, grain size distributions of copper minerals and gold and extent of liberation from gangue minerals. This information is useful to understand metallurgical response and guide further targeted testwork. Some mineralogy is reported in the geology section of (RD1, 2011) indicating that the predominant primary copper minerals are chalcopyrite and bornite, with gold largely associated with those minerals, and the secondary minerals as chalcocite, cuprite, malachite and chrysocolla.
Composite 1, the La Cantera average grade, displayed the most variable flotation response which could be partially explained by the relatively high content of oxide copper (acid soluble) and of secondary copper minerals (cyanide soluble copper), as shown in Table 13‑2. Details of the results show that four of the seven tests generated high Au and associated high Cu recoveries, with very low recoveries from the other tests. The samples for Composite 1 were generated from samples from relatively shallow depths ranging from 30-64 m, which could also explain the greater oxidation levels. However, Composite 4, which also has substantial proportions of oxide and secondary copper returned consistent Au and Cu recoveries, 74% - 86% and 74% - 79% respectively.
The open circuit cleaner flotation tests (1 for each composite) show that concentrate grades of approx. 26% Cu and +50 g/t Au were attainable, although at the expense of reduced overall recoveries. The report does not indicate the regrind size tested. However, it is reasonable to assume that optimization of the regrind and circuit configuration could achieve concentrate grades of this order with a cleaner recovery of about 95%.
Resource Development Associates Inc.
Effective Date July 24, 2023
GoldMining Inc. NI 43-101 Report – La Mina Project | Page 140 |
Table 13‑8 Flotation Process Test Parameters
Test No | Composite No | Grind P80, mesh | Reagents, g/t |
| | | | PAX | AP 404 | MIBC | Na2S | 3418 A |
1 | 1 | 100 | 100 | 100 | 40 | 2000 | - |
2 | 1 | 150 | 100 | 100 | 40 | 2000 | - |
3 | 1 | 200 | 100 | 100 | 40 | 2000 | - |
4 | 1 | 150 | 100 | 100 | 40 | - | - |
5 | 1 | 150 | - | - | 40 | 2000 | 100 |
6 | 1 | 150 | - | 100 | 40 | 2000 | 100 |
7 | 2 | 100 | 100 | 100 | 40 | - | - |
8 | 2 | 150 | 100 | 100 | 40 | - | - |
9 | 2 | 200 | 100 | 100 | 40 | - | - |
10 | 2 | 150 | 100 | - | 40 | - | - |
11 | 2 | 150 | - | - | 40 | - | 100 |
12 | 2 | 150 | - | 100 | 40 | - | 100 |
13 | 4 | 100 | 100 | 100 | 40 | 1000 | - |
14 | 4 | 150 | 100 | 100 | 40 | 1000 | - |
15 | 4 | 200 | 100 | 100 | 40 | 1000 | - |
16 | 4 | 150 | 100 | 100 | 40 | - | - |
17 | 4 | 150 | - | - | 40 | 1000 | 100 |
18 | 4 | 150 | - | 100 | 40 | 1000 | 100 |
19 | 3 | 100 | 100 | 100 | 40 | - | - |
20 | 3 | 150 | 100 | 100 | 40 | - | - |
21 | 3 | 200 | 100 | 100 | 40 | - | - |
22 | 3 | 150 | 100 | - | 40 | - | - |
23 | 3 | 150 | - | - | 40 | - | 100 |
24 | 3 | 150 | - | 100 | 40 | - | 100 |
1 | 1 | 100 | 100 | 100 | 40 | 2000 | - |
Resource Development Associates Inc.
Effective Date July 24, 2023
GoldMining Inc. NI 43-101 Report – La Mina Project | Page 141 |
Table 13‑9 Flotation Test Results for Composite No. 1
| Concentrate Recovery (9 min. float time) | Concentrate Grade |
| Product | Wt | Au | Cu | Au, g/t | Cu, % |
Test No 1 | | | | | |
Rougher Conc | 3.9 | 13.6 | 7.3 | 3.37 | 0.7403 |
Rougher Tails | 96.1 | 86.4 | 92.7 | 0.86 | 0.3800 |
Cal. Head | 100.0 | 100.0 | 100.0 | 0.96 | 0.3940 |
Test No 2 | | | | | |
Rougher Conc | 6.1 | 94.0 | 88.9 | 12.02 | 6.3531 |
Rougher Tails | 93.9 | 6.0 | 11.1 | <0.10 | 0.0514 |
Cal. Head | 100.0 | 100.0 | 100.0 | 0.78 | 0.4342 |
Test No 3 | | | | | |
Rougher Conc | 6.6 | 71.8 | 91.2 | 12.22 | 5.1777 |
Rougher Tails | 93.4 | 28.2 | 8.8 | 0.34 | 0.0352 |
Cal. Head | 100.0 | 100.0 | 100.0 | 1.13 | 0.3751 |
Test No 4 | | | | | |
Rougher Conc | 6.9 | 96.8 | 90.8 | 20.75 | 4.9856 |
Rougher Tails | 93.1 | 3.2 | 9.2 | <0.10 | 0.0374 |
Cal. Head | 100.0 | 100.0 | 100.0 | 1.47 | 0.3779 |
Test No 5 | | | | | |
Rougher Conc | 5.7 | 33.0 | 28.9 | 5.60 | 2.0329 |
Rougher Tails | 94.3 | 67.0 | 71.1 | 0.69 | 0.3020 |
Cal. Head | 100.0 | 100.0 | 100.0 | 0.97 | 0.4008 |
Test No 6 | | | | | |
Rougher Conc | 7.7 | 57.0 | 72.6 | 7.11 | 3.9677 |
Rougher Tails | 92.3 | 43.0 | 27.4 | 0.45 | 0.1254 |
Cal. Head | 100.0 | 100.0 | 100.0 | 0.97 | 0.4227 |
Resource Development Associates Inc.
Effective Date July 24, 2023
GoldMining Inc. NI 43-101 Report – La Mina Project | Page 142 |
Table 13‑10 Flotation Test Results for Composite No. 2
| Concentrate Recovery (9 min. float time) | Concentrate Grade |
| Product | Wt | Au | Cu | Au, g/t | Cu, % |
Test No 7 | | | | | |
Rougher Conc | 8.6 | 77.0 | 87.5 | 7.45 | 3.2684 |
Rougher Tails | 91.4 | 23.0 | 12.5 | 0.21 | 0.0442 |
Cal. Head | 100.0 | 100.0 | 100.0 | 0.83 | 0.3222 |
Test No 8 | | | | | |
Rougher Conc | 10.2 | 93.2 | 88.7 | 6.06 | 3.1202 |
Rougher Tails | 89.8 | 6.8 | 11.3 | <0.10 | 0.0452 |
Cal. Head | 100.0 | 100.0 | 100.0 | 0.66 | 0.3592 |
Test No 9 | | | | | |
Rougher Conc | 10.5 | 79.9 | 87.0 | 5.76 | 2.9573 |
Rougher Tails | 89.5 | 20.1 | 13.0 | 0.17 | 0.0518 |
Cal. Head | 100.0 | 100.0 | 100.0 | 0.76 | 0.3572 |
Test No 10 | | | | | |
Rougher Conc | 10.7 | 93.6 | 91.2 | 6.11 | 3.0482 |
Rougher Tails | 89.3 | 6.4 | 8.8 | <0.10 | 0.0350 |
Cal. Head | 100.0 | 100.0 | 100.0 | 0.70 | 0.3572 |
Test No 11 | | | | | |
Rougher Conc | 10.4 | 80.9 | 90.8 | 6.16 | 3.0248 |
Rougher Tails | 89.6 | 19.1 | 8.2 | 0.17 | 0.0356 |
Cal. Head | 100.0 | 100.0 | 100.0 | 0.80 | 0.3477 |
Test No 12 | | | | | |
Rougher Conc | 10.3 | 83.6 | 88.9 | 6.25 | 3.0045 |
Rougher Tails | 89.7 | 16.4 | 11.1 | 0.14 | 0.0430 |
Cal. Head | 100.0 | 100.0 | 100.0 | 0.77 | 0.3467 |
Resource Development Associates Inc.
Effective Date July 24, 2023
GoldMining Inc. NI 43-101 Report – La Mina Project | Page 143 |
Table 13‑11 Flotation Test Results for Composite No. 3
| Concentrate Recovery (9 min. float time) | Concentrate Grade |
| Product | Wt | Au | Cu | Au, g/t | Cu, % |
Test No 19 | | | | | |
Rougher Conc | 8.4 | 74.3 | 75.1 | 15.11 | 5.1047 |
Rougher Tails | 91.6 | 25.7 | 24.9 | 0.48 | 0.1552 |
Cal. Head | 100.0 | 100.0 | 100.0 | 1.71 | 0.5715 |
Test No 20 | | | | | |
Rougher Conc | 8.1 | 75.5 | 79.9 | 16.81 | 5.4353 |
Rougher Tails | 91.9 | 24.5 | 20.1 | 0.48 | 0.1210 |
Cal. Head | 100.0 | 100.0 | 100.0 | 1.80 | 0.5519 |
Test No 21 | | | | | |
Rougher Conc | 7.1 | 80.5 | 85.3 | 18.31 | 6.2283 |
Rougher Tails | 92.9 | 19.5 | 14.7 | 0.34 | 0.0824 |
Cal. Head | 100.0 | 100.0 | 100.0 | 1.62 | 0.5209 |
Test No 22 | | | | | |
Rougher Conc | 7.3 | 81.1 | 84.3 | 18.37 | 5.8776 |
Rougher Tails | 92.7 | 18.9 | 15.7 | 0.34 | 0.0870 |
Cal. Head | 100.0 | 100.0 | 100.0 | 1.66 | 0.5124 |
Test No 23 | | | | | |
Rougher Conc | 7.6 | 83.5 | 86.5 | 16.67 | 5.5137 |
Rougher Tails | 92.4 | 16.5 | 13.5 | 0.27 | 0.0704 |
Cal. Head | 100.0 | 100.0 | 100.0 | 1.51 | 0.4835 |
Test No 24 | | | | | |
Rougher Conc | 7.9 | 83.9 | 82.3 | 16.37 | 5.4444 |
Rougher Tails | 92.1 | 16.1 | 17.7 | 0.27 | 0.1006 |
Cal. Head | 100.0 | 100.0 | 100.0 | 1.54 | 0.5226 |
Resource Development Associates Inc.
Effective Date July 24, 2023
GoldMining Inc. NI 43-101 Report – La Mina Project | Page 144 |
Table 13‑12 Flotation Test Results for Composite No. 4
| Concentrate Recovery (9 min. float time) | Concentrate Grade |
| Product | Wt | Au | Cu | Au, g/t | Cu, % |
Test No 13 | | | | | |
Rougher Conc | 5.3 | 73.9 | 74.9 | 10.73 | 4.8051 |
Rougher Tails | 94.7 | 26.1 | 25.1 | 0.21 | 0.0894 |
Cal. Head | 100.0 | 100.0 | 100.0 | 0.76 | 0.3375 |
Test No 14 | | | | | |
Rougher Conc | 6.0 | 79.0 | 78.0 | 10.12 | 4.3742 |
Rougher Tails | 94.0 | 21.0 | 22.0 | 0.17 | 0.0782 |
Cal. Head | 100.0 | 100.0 | 100.0 | 0.76 | 0.3341 |
Test No 15 | | | | | |
Rougher Conc | 5.9 | 86.0 | 79.2 | 9.80 | 4.4733 |
Rougher Tails | 94.1 | 14.0 | 20.8 | 0.10 | 0.0736 |
Cal. Head | 100.0 | 100.0 | 100.0 | 0.67 | 0.3327 |
Test No 16 | | | | | |
Rougher Conc | 6.8 | 80.9 | 73.6 | 4.08 | 3.6364 |
Rougher Tails | 93.2 | 19.1 | 26.4 | 0.07 | 0.0946 |
Cal. Head | 100.0 | 100.0 | 100.0 | 0.34 | 0.3338 |
Test No 17 | | | | | |
Rougher Conc | 6.6 | 57.5 | 77.4 | 9.15 | 4.0718 |
Rougher Tails | 93.4 | 42.5 | 22.6 | 0.48 | 0.0840 |
Cal. Head | 100.0 | 100.0 | 100.0 | 1.05 | 0.3478 |
Test No 18 | | | | | |
Rougher Conc | 6.6 | 82.0 | 78.3 | 9.04 | 4.0440 |
Rougher Tails | 93.4 | 18.0 | 21.7 | 0.14 | 0.0794 |
Cal. Head | 100.0 | 100.0 | 100.0 | 0.73 | 0.3413 |
Resource Development Associates Inc.
Effective Date July 24, 2023
GoldMining Inc. NI 43-101 Report – La Mina Project | Page 145 |
13.9 | ALS METALLURGICAL TEST PROGRAM (2022) |
ALS Metallurgy was contracted by Goldmining Inc. to conduct preliminary metallurgical testing on samples from the La Garrucha zone for the La Mina Project, to evaluate the flotation and leaching characteristics of a single Master Composite. The following tests were carried out:
| | ● | Duplicate Bond ball mill tests on the Master Composite “Garrucha Composite 1” with a closing screen size of 150 µm. |
| | ● | A QEMSCAN Particle Mineral Analysis (PMA) at 103 µm K80 primary grind sizing on the Master Composite. |
| | ● | Six rougher flotation tests on the Master Composite at three primary grind sizings (duplicate) and four cleaner tests at various conditions. |
| | ● | Six whole ore cyanidation leach tests on the Master Composite at three primary grind sizings (duplicate), two additional leach tests included pre-aeration at two primary grind sizings. |
| | ● | Three cyanidation leach tests on various flotation tailings. |
Approximately 100 kilograms of samples were received by ALS from Goldmining Inc for testing on October 27, 2022, comprised from quarter NQ cores, derived from two drillholes drilled in 2022. The samples were selected by Goldmining Inc, as generally representative of the grade and lithology of the deposit. All samples were used to form a Master Composite “Garrucha Composite 1”.
13.9.1 | CHARACTERISTICS OF THE SAMPLES |
The chemical contents of the Master Composite were assessed in duplicate using standard analytical techniques as well as through multi-element ICP analysis. The mineralogical characteristics were measured using QEMSCAN Particle Mineral Analysis (PMA) protocols on a feed sample of the Master Composite ground to around 103 µm K80 and sized into four size fractions. These characteristics are discussed in the following subsections.
Duplicate Bond ball work index tests were completed on the Master Composite. The tests were performed using a 150 µm closing screen size. The Bond ball mill work indices measured 15.3 and 15.4 kWh/tonne, indicating the material would be of average hardness with respect to ball mill grinding.
13.9.1.2 | CHEMICAL AND MINERAL CONTENT |
Chemical contents are summarized in Table 13‑13while mineral contents are summarized in Table 13‑14. Copper averaged about 0.13% and measured primarily as chalcopyrite. Only low amounts of copper measured in weak-acid soluble or cyanide soluble forms. Sulphur assayed about 0.7% and was primarily present within pyrite, chalcopyrite, and trace amounts of other sulphide minerals and sulphate minerals. Copper and sulphur deportment are included in Figure 13‑1.
Resource Development Associates Inc.
Effective Date July 24, 2023
GoldMining Inc. NI 43-101 Report – La Mina Project | Page 146 |
Table 13‑13 Head Assays - CuOx represents Cu solubilized in a weak sulphuric acid digestion, CuCN by sodium cyanide digestion
| Assay - percent or g/tonne |
| Composite | Cu% | CuOx% | CuCN% | Fe% | Au g/t | S(t) |
Garrucha Comp 1 Hd1 | 0.13 | 0.009 | 0.021 | 6.0 | 1.06 | 0.68 |
Garrucha Comp 1 Hd2 | 0.13 | 0.009 | 0.020 | 6.1 | 1.05 | 0.63 |
Average | 0.13 | 0.009 | 0.021 | 6.1 | 1.06 | 0.66 |
The pyrite to copper sulphide ratio measured about 3 to 1, and rejection of pyrite from a flotation concentrate is required to produce high copper grade concentrates. The primary non-sulphide gangue mineral by weight in the Master Composite was feldspars, measuring approximately 54%. Quartz measured approximately 22%, chlorite measured approximately 7%, and iron oxides measured approximately 6%.
Table 13‑14 Mineral Content
Minerals | Garrucha Composite 1, % |
Sizing (µm K80) | 103 |
Chalcopyrite | 0.34 |
Bornite | 0.01 |
Chalcocite/Covellite/Tetrahedrite | <0.01 |
Other Sulphide Minerals | 0.01 |
Pyrite | 1.07 |
Iron Oxides | 6.22 |
Quartz | 22.1 |
Feldspars | 54.0 |
Chlorite | 6.67 |
Micas | 3.13 |
Calcium Carbonates | 2.38 |
Others | 4.12 |
Total | 100 |
Notes: 1) Other Sulphide Minerals includes Sphalerite, Molybdenite and Galena. |
Resource Development Associates Inc.
Effective Date July 24, 2023
GoldMining Inc. NI 43-101 Report – La Mina Project | Page 147 |
13.9.1.3 | MINERAL FRAGMENTATION |
Mineral fragmentation results are summarized in Figure 13‑1. Particles with a single mineral are easier to separate by flotation than particles with multiple minerals, and are referred to as ‘liberated’. The copper sulphides measured about 48% liberated at the 103 µm K80 primary grind sizing. This would be considered within the range typically measured for operating copper concentrators. Very little of the copper was measured to be physically attached to pyrite (binaries), and efficient separation of copper from pyrite in a rougher flotation stage should be possible.
Using the PMA and sizing data, the estimated copper sulphide liberations would be around 59% at the 69 µm K80 primary grind sizing, and around 40% at the 156 µm K80 primary grind sizing. On the basis of this data alone, it is unlikely that finer primary grind sizing would beneficially improve copper sulphide liberation; however, the impact of primary grind sizing on gold recovery would need to be evaluated. A coarser sizing, however, may also be viable, and merits testing.
The amount of sulphide mineral at the surface of a particle denotes how easy it is to attach the particle to a bubble. In two-dimensional mineralogy, the perimeter of the particle is used as an estimate of mineral exposure. Typically, coarsely sized particles with less than 5% exposure at the perimeter of the particle are difficult to recover via flotation. In this composite, almost 10% of copper measured below 5% exposure in the size fractions coarser than 75 µm and may be difficult to recover using standard flotation techniques.
Resource Development Associates Inc.
Effective Date July 24, 2023
GoldMining Inc. NI 43-101 Report – La Mina Project | Page 148 |
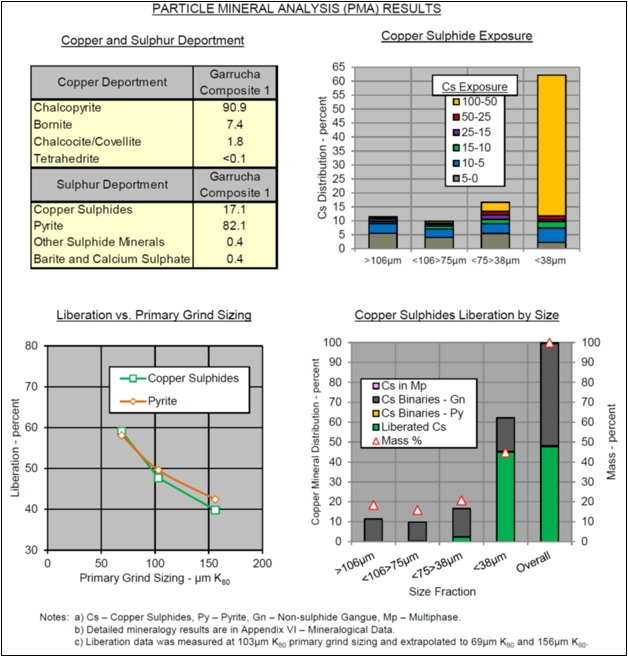
Figure 13‑1 Particle Mineral Analysis
Metallurgical testing investigated flotation separation and cyanidation leaching. The tested flotation flowsheet pursued production of a copper concentrate or a bulk sulphide concentrate product. Cyanidation testing investigated whole ore cyanidation and cyanidation of flotation tailings. The following subsection discuss the results of this testing.
Resource Development Associates Inc.
Effective Date July 24, 2023
GoldMining Inc. NI 43-101 Report – La Mina Project | Page 149 |
13.9.2.1 | ROUGHER FLOTATION TESTS |
A series of preliminary rougher tests were completed using the Master Composite. The objective was to assess the effect of primary grind sizes on flotation performance. A conventional flowsheet was applied in duplicate at primary grind sizes of 69, 103 and 156 µm K80. Potassium Amyl Xanthate (PAX) was used as sulphide collector and Methyl Isobutyl Carbinol (MIBC) was used as frother. The flowsheet, test conditions and rougher test results are summarized in Figure 13‑2.
For the coarsest tested primary grind size of 156µm K80, overall copper recoveries to the rougher concentrates averaged 86%; at a primary grind size of 103 µm K80, copper recoveries to rougher concentrates averaged 88%; and at a primary grind size of 69 µm K80, copper recoveries to rougher concentrates averaged 90%. However, gold recoveries to rougher concentrates didn’t vary as much, ranging from 85% to 87%. It is noted that both gold and copper recoveries were lower than sulphur recovery, which measured between 93% and 96 %. This would suggest that the gold that was not recovered may not be associated with sulphide minerals.
Mass recoveries were relatively high given the feed content of sulphide minerals. A notable increase in mass recovery was recorded at the finest tested grind sizing, likely related to the increased viscosity. A lower density could mitigate this effect if testing at fine sizes is investigated in future programs.
Resource Development Associates Inc.
Effective Date July 24, 2023
GoldMining Inc. NI 43-101 Report – La Mina Project | Page 150 |
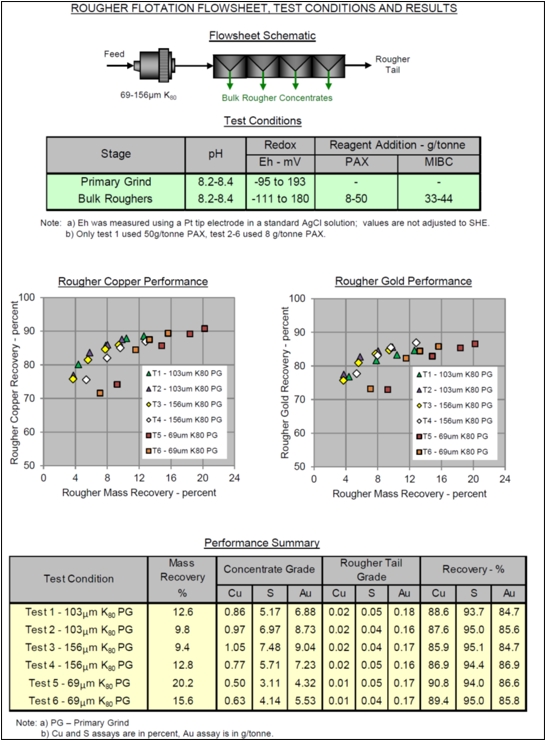
Figure 13‑2 Rougher Flotation Flowsheet
Resource Development Associates Inc.
Effective Date July 24, 2023
GoldMining Inc. NI 43-101 Report – La Mina Project | Page 151 |
13.9.2.2 | CLEANER FLOTATION TESTS |
A series of open circuit cleaner flotation tests were conducted on the Master Composite to investigate upgrading potential at a primary grind size of 103 µm K80. A regrind size of 21 to 24 µm K80 was applied in the cleaner circuit. The same collector dosages as rougher tests were used. In addition, lime was used to modulate the pulp pH to further assist with depression of pyrite in the cleaner circuit. The flowsheet, test conditions and results of the cleaner tests are summarized in Figure 13‑3.
Test 13 used a pH of 10 in the cleaner circuit, produced a bulk cleaner concentrate grading 14.2% copper and 101 g/tonne gold at 77% copper recovery and 67% gold recovery. The relatively low copper grade in the concentrate shows the inefficiency of pyrite depression in this test. In Test 14, the pH was increased to 11 in the cleaner circuit, resulting in a higher concentrate copper grade of 27%. Interestingly, the copper and gold recoveries were essentially unchanged compared to Test 13 indicating relatively little association of gold with pyrite. The same test conditions were used in Test 15 to produce cleaner tails for a cyanidation leach test; this test produced a copper concentrate with a copper grade of 21%. The inconsistency in concentrate grade may suggest further modification to test conditions is required to produce consistent flotation results.
Multi-element ICP analysis was completed on Test 14 concentrate, results of the most significant elements are presented in Table 13‑15 below. Silver measured about 549 g/tonne, which would be expected to result in smelting credits. Lead measured about 0.37% and zinc measured almost 0.1% which may be close to penalty thresholds. Other elements were generally below typical penalty thresholds, though consultation with a concentrate marketing expert is recommended.
Table 13‑15 Concentrate ICP Analysis
Element | Units | Analysis |
As | ppm | 473 |
Cd | ppm | 23.4 |
Mn | ppm | 230 |
Mo | ppm | 340 |
Pb | ppm | 3680 |
Sb | ppm | 310 |
Se | ppm | 130 |
Zn | ppm | 950 |
Test 16 investigated the gold recovery potential to bulk cleaner concentrate. This test used natural pH in the cleaner circuit, produced a high sulphide cleaner concentrate with a sulphur grade of 46%, and recovered 83% of feed sulphur to the cleaner concentrate. The test improved gold recovery to cleaner concentrate to 74%, measuring a concentrate gold grade of 61 g/tonne. At a copper grade of about 8%, the copper content in this concentrate may not be payable; however, consultation with a concentrate marketing specialist would be required to confirm.
Resource Development Associates Inc.
Effective Date July 24, 2023
GoldMining Inc. NI 43-101 Report – La Mina Project | Page 152 |
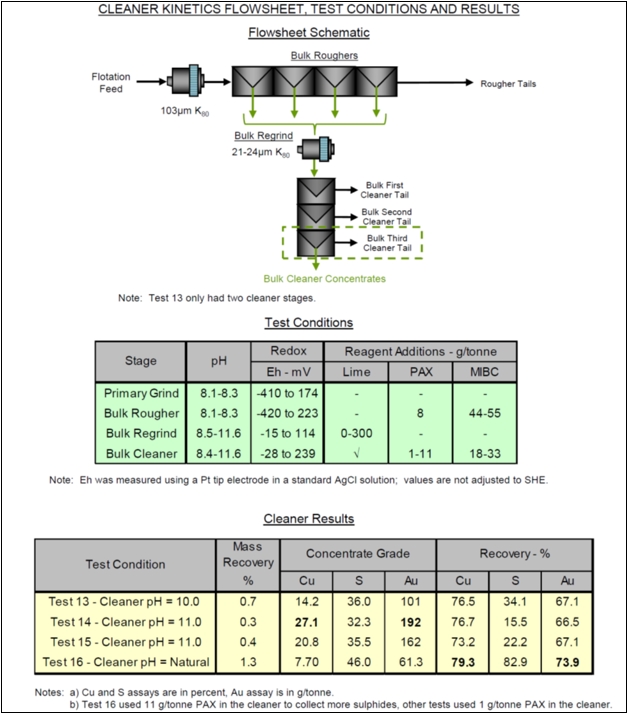
Figure 13‑3 Cleaner Kinetics Flowsheet
Resource Development Associates Inc.
Effective Date July 24, 2023
GoldMining Inc. NI 43-101 Report – La Mina Project | Page 153 |
13.9.2.3 | WHOLE ROCK CYANIDATION TESTS |
Cyanidation bottle roll tests were completed on the Master Composite. All cyanidation tests were completed over 48 hours using a sodium cyanide concentration of 1,000 ppm. All tests were completed at 33% solids with a pH target of 11.0, controlled by lime addition. Oxygen levels were controlled by sparging oxygen into either headspace, or into pulps when low dissolved oxygen level measured (<4 ppm). A summary of the flowsheet, test conditions and results are displayed in Figure 13‑4.
Duplicate cyanidation tests were performed at each primary grind sizing. For primary grind size of 156 µm K80 and 103 µm K80, gold extractions were similar and averaged around 89%. The finer primary grind size of 69 µm K80 had slightly improved gold extraction averaging about 92%. Copper extraction ranged from 23% to 27 % in all tests. It was noted that sodium cyanide consumption was moderate to high, from 1.3 to 2.4 kilograms per tonne.
Low dissolved oxygen levels and poor leaching kinetics were observed during the first 6 hours of tests. A 16-hour pre-aeration stage was introduced in Test 20 and 21, this change reduced sodium cyanide consumption to about 0.9 kilograms per tonne while maintaining similar gold recovery. The initial leaching kinetics also improved, from as low as 2% to about 40% gold extraction after 2 hours.
Resource Development Associates Inc.
Effective Date July 24, 2023
GoldMining Inc. NI 43-101 Report – La Mina Project | Page 154 |
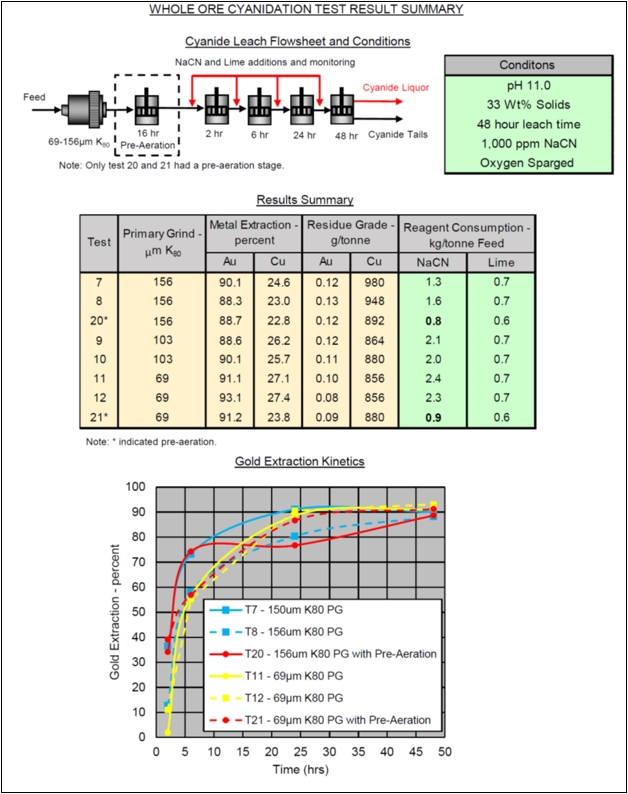
Figure 13‑4 Whole Ore Cyanidation Results
Resource Development Associates Inc.
Effective Date July 24, 2023
GoldMining Inc. NI 43-101 Report – La Mina Project | Page 155 |
13.9.2.4 | FLOTATION TAIL CYANIDATION TESTS |
Three cyanidation bottle roll tests were completed using tails produced from flotation tests. All cyanidation tests were completed over 48 hours using a sodium cyanide concentration of 1000ppm. All tests were completed at 33% solids with a pH target of 11.0, controlled by lime addition. A 16-hour pre-aeration stage was also included. A summary of the flowsheet, test conditions and results are displayed in Figure 13‑5.
Two cyanidation tests were completed on bulk rougher tails from rougher flotation tests. The flotation test primary grind size was nominally 156 µm K80 and 69 µm K80. About 79% and 76% of the gold in the coarser and finer rougher tailings, respectively, was cyanide extractable. This represents about 12% and 10% of the gold in the flotation feed. Sodium cyanide consumption measured around 0.1 kg/t while lime consumption measured around 0.6 kg/t.
One cyanidation test was completed on combined bulk cleaner tail from Test 15. The gold recovery was 85%. A comparison of whole ore leach test and flotation and tail leach test results (Gold) are shown in Figure 13‑5.
Collectively, the gold recovery from a combination of flotation and cyanidation leaching of the tailings was superior to that obtained via whole ore cyanidation. In addition, cyanide and lime consumptions were lower and there is also the benefit of removing the copper ahead of cyanidation as a saleable concentrate and also reduced cyanide consumption.
Resource Development Associates Inc.
Effective Date July 24, 2023
GoldMining Inc. NI 43-101 Report – La Mina Project | Page 156 |
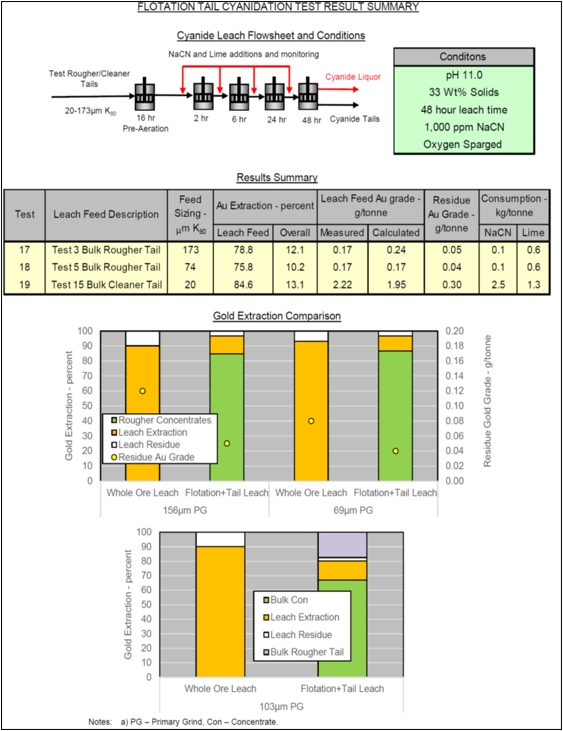
Figure 13‑5 Flotation Tail Cyanidation Results
Resource Development Associates Inc.
Effective Date July 24, 2023
GoldMining Inc. NI 43-101 Report – La Mina Project | Page 157 |
Two scoping level metallurgical test work programs have been completed on samples from the La Mina deposit. The first program was completed and reported by RDi in 2011, on samples from the La Canterra and the Middle Zone deposits. The second program was completed and reported in 2022 by ALS, on samples from the La Garrucha deposit. Generally, the copper and gold recoveries by flotation into a bulk rougher concentrate and gold recovery by cyanide leaching were consistent between the two test programs for the materials tested and indicate that the La Mina samples (La Cantera, Middle Zone and La Garrucha) are amenable to standard flotation for copper and gold recovery and to cyanide leaching for gold recovery.
The characteristics of the ore were relatively favorable for copper and gold recovery, with a pyrite to copper sulphide ratio of 3:1 and relatively little association of copper sulphides with pyrite, which indicates that a reasonably efficient separation of pyrite from copper sulphides in a potential flotation process is possible. With about 48% copper liberation at the nominal 103 µm K80 primary grind sizing, reasonably rougher copper response would be anticipated if relatively aggressive flotation conditions are applied.
Flotation testing in the 2022 program produced a bulk concentrate containing 27% copper, 192 g/tonne gold and 549 g/tonne silver, while recovering about 77% of the copper and 67% of the gold. As this was an open circuit test, closed circuit testing would be expected to recover some of the losses in the cleaner tails, resulting in higher recoveries at lower grade. Cyanide leaching of the cleaner and rougher tailings could recover approximately 78% of the gold in the rougher tailings and 85% in the cleaner tailings, collectively representing about 25% of feed gold. As such, overall gold recovery from such a flowsheet would be expected to total around 90% - 92%.
Cyanidation tests were also completed on whole ore from which gold extraction averaged 90%. Pre-aeration prior to cyanidation leach tests increased the dissolved oxygen level, which improved initial leach kinetics and decreased overall sodium cyanide consumption. Overall, whole ore leaching resulted in marginally lower overall gold recovery and higher reagent consumptions.
Rougher and cleaner flotation tests were completed at three different primary grind sizings – 150 µm, 106 µm and 75 µm. Copper rougher recovery improved slightly with finer primary grind sizing. Gold recoveries to rougher concentrates didn’t vary significantly for varied primary grind size, averaging approximately 86%. On this basis, the coarser primary grind sizing may be optimal, though an economic trade-off study would be required to confirm this. Increasing cleaner circuit pH from 10 to 11 improved copper concentrate grade, while maintaining similar overall copper and gold recoveries.
The amount and effect of oxide/saprolite and transition material in the upper part of the deposits has not been established. There was some indication from the 2011 test work that flotation recoveries were lower in the composite samples that contained some amount of copper oxides. Currently, the effect is not quantifiable and warrants further investigation.
Considering the results from the two metallurgical programs and a preliminary mass balance for the process, an overall base case recovery for gold and copper by flotation after regrind and cleaning into a 23% to 26% copper concentrate is projected at 69% and 80% respectively. Cyanide leaching of the combined cleaner and rougher tailings, increases the overall gold recovery to approximately 91%. Further test work on representative samples, for additional evaluation of mineralogy and a program of open and locked cycle flotation testing and cyanide leach testing is required to provide further confidence in the metallurgical response and optimization of the recovery process.
Resource Development Associates Inc.
Effective Date July 24, 2023
GoldMining Inc. NI 43-101 Report – La Mina Project | Page 158 |
Additional metallurgical tests should be run on composite samples representative of the La Mina deposits, to provide further understanding of the metallurgical performance of the material laterally and vertically and improve the robustness of the proposed process: The test work program should incorporate testing on fresh and oxide/transition material (if geological interpretation and modelling indicates that oxide materials could be a substantial component of plant feed). Samples should be derived from fresh drill core and composited to generate representative composites for the zones. Testing should include:
| | o | Further mineralogy to understand mineral and gold deportment, grain size distribution and liberation size. |
| | o | SAG and Ball mill grinding parameters |
| | o | Primary grind size and concentrate regrind size determination |
| | o | Open and locked cycle flotation tests to confirm flotation parameters, cleaner requirements and reagent scheme. |
| | o | Evaluation of sulphidization for oxide/transition flotation |
| | o | Evaluation of cyanide leaching on the cleaner and rougher tails, and carbon loading. Testing should include confirming pre-aeration conditions to minimize cyanide consumption. |
| | o | Settling tests on flotation tails and on leach tails. |
| | o | Filtration tests on concentrate and leach tails |
| | o | Cyanide destruction tests on leach tails. |
| | o | Silver assays in all flotation and leach tests |
| | o | Testing a variety of lithologies and spatially representative samples to enable preliminary understanding of the variability in metallurgical performance across the deposits, and to understand grade vs recovery response. |
| | ● | All sample core for met testing should be stored to minimize oxidation between time of collection and delivery to the met laboratory e.g., in plastic sleeves with either the air removed or nitrogen added to prevent oxidation and storage/transport in refrigerated units |
| | ● | A Trade off study should be undertaken to determine whether a flotation cleaner leach circuit would be economically more viable than the full flotation tailings leach circuit, incorporating also the impact of the tailings storage facilities for those scenarios. |
| | ● | A trade-off study should be undertaken to evaluate optimal grind size for the flotation and leach circuit |
Resource Development Associates Inc.
Effective Date July 24, 2023
GoldMining Inc. NI 43-101 Report – La Mina Project | Page 159 |
14 | MINERAL RESOURCE ESTIMATES |
Global mineral resource estimates for La Mina (the “Project”) are based on a resource block model constructed using Vulcan Geomodeller® and Whittle ® scientific software programs. Mineral Resources were estimated using a combination of Inverse Distance Weighting (“IDW”) interpolation techniques. As described in Sections 7 and 8, mineralization at La Mina has been identified and quantified within a cluster if three subvertical intrusive porphyry bodies; La Cantera, Middle Zone and La Garrucha.
Three-dimensional geological interpretations were used to flag the block model with varying lithology types representative of the mineral deposits. Grade discontinuities at these lithological contacts were evaluated to determine hard and soft boundaries for the estimation of mineralization withing these varying domains of the deposits.
Mineralization for the deposit is quantified in parts per million of Cu, Au and Ag. Database audits performed by the author demonstrate the assay database values for La Mina interpret are sufficient to interpret mineral resources for the Project. Individual block grades have been used to determine the equivalent gold values for each model block. Equivalent gold grades are reported and summarized within this report. However, equivalent gold grades have not been used for any mineral resource estimates.
14.1 | LA CANTERA MINERAL RESOURCE ESTIMATE |
14.1.1 | DATABASE FOR GEOLOGIC MODEL |
The drillhole database for the La Mina resource estimation was provided by GoldMining in digital format which was imported into Vulcan modeling software. The current database includes a total of 111 drill holes. Of those 111 drill holes, 26 pertain to the La Cantera deposit.
Statistical analysis has been undertaken of the La Mina data, summary statistics histograms have been calculated and the results of the analysis were compared to determine if suitable geological domains could be identified to be used in the Mineral Resource Estimation. The statistical investigations included descriptive and distribution analyses and assessments of outlier statistics. This section will discuss and review the data and details that pertain to the La Cantera deposit. Histograms and Log histograms have been plotted for sample gold, copper and silver assays. In all cases the data displays a positively skewed log normal distribution.
The 26 holes for La Cantera contain 3,913 intervals containing assays and lithology records, with an average interval length of 1.99 m. The assay table contains assays of 34 elements, and lithology table contains 12 different lithology types. Figure 14‑1 and Figure 14‑2 illustrate the distribution of lithology groups in the La Cantera area only.
Resource Development Associates Inc.
Effective Date July 24, 2023
GoldMining Inc. NI 43-101 Report – La Mina Project | Page 160 |
Figure 14‑1 Distribution of Lithology
Figure 14‑2 Distribution of Major Lithologies at La Cantera
Resource Development Associates Inc.
Effective Date July 24, 2023
GoldMining Inc. NI 43-101 Report – La Mina Project | Page 161 |
Histograms demonstrating lognormal distribution of AU, Ag and Cu.
Figure 14‑3 Incremental Histogram for La Cantera Gold Data
Resource Development Associates Inc.
Effective Date July 24, 2023
GoldMining Inc. NI 43-101 Report – La Mina Project | Page 162 |
Figure 14‑4 Incremental Histogram for La Cantera Silver Data
Resource Development Associates Inc.
Effective Date July 24, 2023
GoldMining Inc. NI 43-101 Report – La Mina Project | Page 163 |
Figure 14‑5 Incremental Histogram for La Cantera Copper Data
Bellhaven created the first set of sections, a total of 12, for the La Cantera area. These sections were hand drawn on maps that had drill-hole traces plotted. The sections were a combination of North, North-East by South-West and North-West by South-East bearing sections. Figure 14‑6 is a sample of one of these sections. Figure 14‑7 illustrates the section layout at La Cantera, and the 12 sections that included interpreted geology.
The four main lithology types in the La Cantera area were grouped into two lithology groups for the purpose of the Vulcan geologic model. The C1 and C1Bx types were grouped together into a C group and X1 and X1Bx were group into the X group. The C1 and C1Bx types were determined to have the same mineral composition, as were the X1 and X1Bx types. A third group was created to account for mineralization in the volcanic host rock. The C group is the primary group of interest, as it is the most mineralized with the highest grades. The X and Volcanic groups are also mineralized, but not to the same extent as the C group.
In Vulcan, the C group and X group lithologies were modeled in bench sections every 50 m to a depth of 450 m. The geologic interpretation for each bench was made using the section profile intercepts at each bench, along with intercepts of diamond drilling. Based on the author’s experience with porphyry mineral deposits in the Cauca Belt, it can be reasonably assumed that the porphyry flares out at depth. This interpretation of the porphyry shape increases the potential volume of mineralized C-type porphyry, but it also proportionally increases the volume of barren X-group porphyry. Current drilling shows the pipe to be open at depth, however for this model a bottom depth of 600 m, or the 1,050 m elevation, was chosen as a limit to grade estimation. Anything deeper than this is too speculative for grade estimation or geological inference.
Resource Development Associates Inc.
Effective Date July 24, 2023
GoldMining Inc. NI 43-101 Report – La Mina Project | Page 164 |
While there is limited sampling to support grade estimate to the depth of 650 m, the grade of copper and gold in the porphyry is robust to the bottom of the data set, and the geostatistics indicate very high vertical continuity of the porphyry mineralization. Therefore, it is reasonably assumed that mineralization can be projected to 650 m depth. Additional drilling will be required to verify the depth and extent of the pipe, the geological continuity of the rock units and the grade continuity of the porphyry. Figure 14‑8 illustrates the shape of the breccia pipe and the bench polygons used to create the geologic wireframes. The outer polygons displayed in orange represent the C lithology group, while the inner polygons colored in purple represent the mostly barren X group.
Figure 14‑9 includes the addition of a volcanic zone group, which is a 50 m buffer from the C type lithology. Drilling results indicate that the volcanic host rock around the breccia pipe could be mineralized within 50 m of the contact with the porphyry. Figure 14‑10 illustrates the wireframes created from the bench polygons that were used to flag lithology boundaries in the block model, which will ultimately affect grade estimation parameters.
Resource Development Associates Inc.
Effective Date July 24, 2023
GoldMining Inc. NI 43-101 Report – La Mina Project | Page 165 |
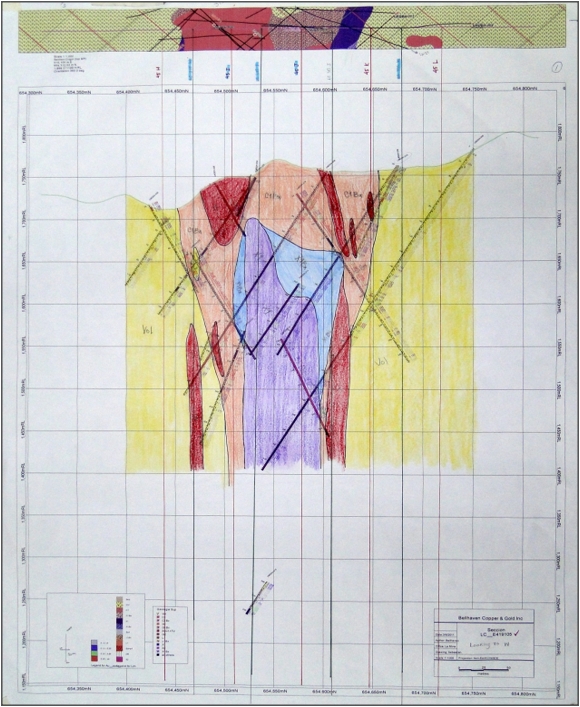
Figure 14‑6 Bellhaven Geologic Interpretation Section LC419105
Resource Development Associates Inc.
Effective Date July 24, 2023
GoldMining Inc. NI 43-101 Report – La Mina Project | Page 166 |
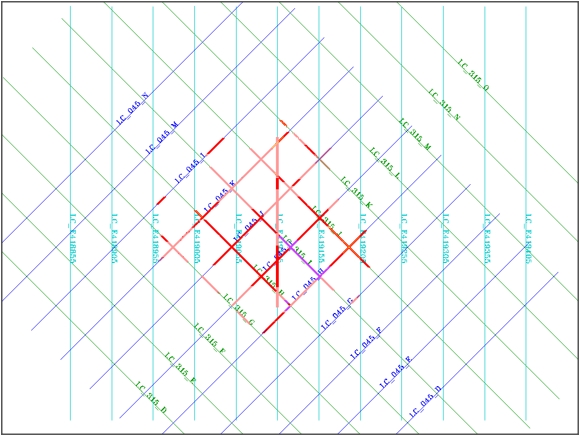
Figure 14‑7 Bellhaven Sections with Geologic Interpretation for La Cantera
Resource Development Associates Inc.
Effective Date July 24, 2023
GoldMining Inc. NI 43-101 Report – La Mina Project | Page 167 |
Figure 14‑8 Bench Section Profiles of C and X in Vulcan
Resource Development Associates Inc.
Effective Date July 24, 2023
GoldMining Inc. NI 43-101 Report – La Mina Project | Page 168 |
Figure 14‑9 Bench Section Profiles Including Volcanic Buffer
Resource Development Associates Inc.
Effective Date July 24, 2023
GoldMining Inc. NI 43-101 Report – La Mina Project | Page 169 |
Figure 14‑10 Wireframes of C, X and Volcanic Boundaries
GoldMining provided 2 m contours for the La Cantera area. This was used to create a surface wireframe in Vulcan to represent the surface topography. The topography was used to limit the surface extent of the C and X group wireframes.
A block model was created in Vulcan for the La Mina Project. LA Cantera and the other deposits fit within the frame of this block model. Table 14‑1 highlights the parameters used to build the La Mina block model.
The block model includes variables to store lithology, gold grade, copper grade, silver grade, distance to nearest gold sample, number of gold samples used, number of drill holes used and depth. The lithology wireframes for the C, X and Volcanic groups were used to flag the lithology codes in the block model variable for lithology. Figure 14‑11 shows two slices through the block model showing blocks colored by lithology.
Resource Development Associates Inc.
Effective Date July 24, 2023
GoldMining Inc. NI 43-101 Report – La Mina Project | Page 170 |
Table 14‑1 La Mina Block Model Details
Parameter | X | Y | Z |
Origin | 418,600 | 654,000 | 1,150 |
Extent | 420,600 | 655,500 | 2,100 |
Parent Block Size | 10 | 10 | 10 |
| | Bearing | Plunge | Dip |
Rotation | 90 | 0 | 0 |
Resource Development Associates Inc.
Effective Date July 24, 2023
GoldMining Inc. NI 43-101 Report – La Mina Project | Page 171 |
Figure 14‑11 Block Model Showing Lithology of La Cantera
Resource Development Associates Inc.
Effective Date July 24, 2023
GoldMining Inc. NI 43-101 Report – La Mina Project | Page 172 |
Based on variography, ordinary Kriging was used to estimate grades in the block model. Kriging yields the best unbiased estimate at each individual model block location. Three estimations were setup for each element; one for each lithology group. Gold, copper and silver grades were estimated into the block model. For each estimation run the block selection was restricted to within the respective lithology group. Hard boundaries were also set for estimations to restrict samples used; only samples matching the respective lithology group could be used for grade estimation. For all estimations, sample intervals were only used if they were greater than 1.5 m in length. The search parameters were the same for estimates of gold, silver and copper. A minimum of 3 samples was required to estimate a block, and no more than 21 samples were used per block. No more than 3 samples from a single drill hole were allowed per estimated bock. For ordinary Kriging estimation, the nugget value was set to 0.184. Table 14‑2 outlines the parameters used for ordinary Kriging. Figure 14‑12 shows a section through the search ellipsoid showing the strong vertical continuity and anisotropy of the mineralization.
Table 14‑2 Parameters for Ordinary Kriging Based on Nested Variography
Model Type | Sill Differential | Bearing (Rot. About Z) | Plunge (Rot. About Y) | Dip (Rot. About X) | Major Axis | Semi- Major Axis | Minor Axis |
Spherical | 0.137 | 48 | 17 | -27 | 23 | 70 | 135 |
Spherical | 0.269 | 56 | -11 | -3 | 118 | 32 | 290 |
Resource Development Associates Inc.
Effective Date July 24, 2023
GoldMining Inc. NI 43-101 Report – La Mina Project | Page 173 |
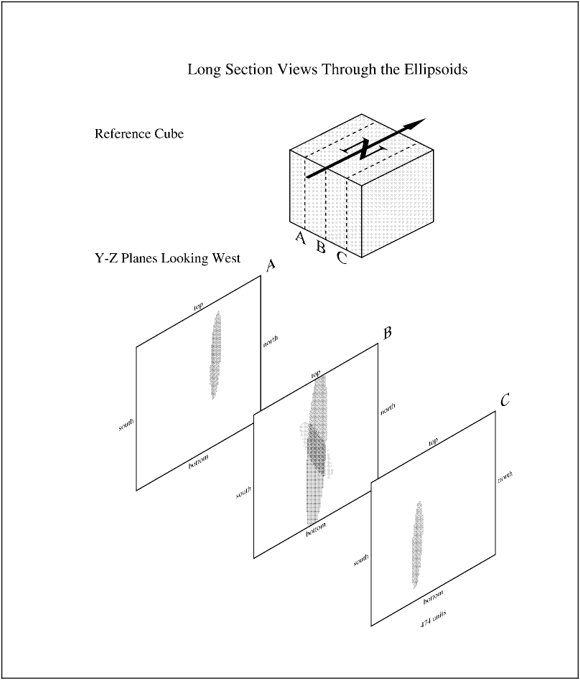
Figure 14‑12 La Cantera Ellipsoids
Resource Development Associates Inc.
Effective Date July 24, 2023
GoldMining Inc. NI 43-101 Report – La Mina Project | Page 174 |
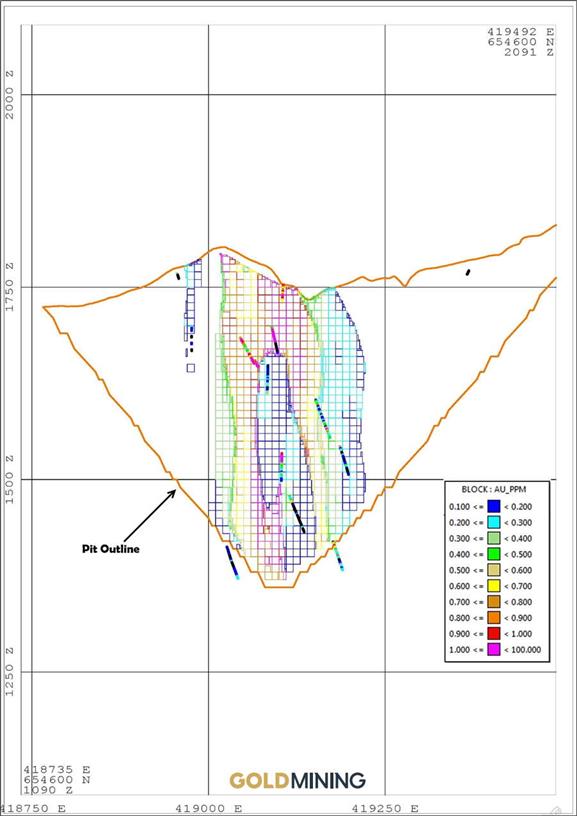
Figure 14‑13 La Cantera Block Model Slice Showing Pit Constrained Au Estimated Grades
Resource Development Associates Inc.
Effective Date July 24, 2023
GoldMining Inc. NI 43-101 Report – La Mina Project | Page 175 |
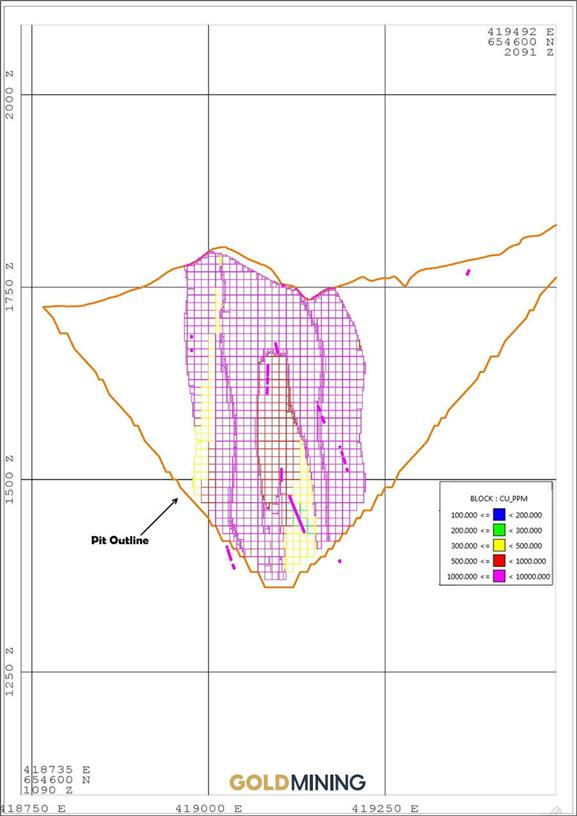
Figure 14‑14 La Cantera Block Slice Showing Pit Constrained Cu Estimated Grades
Resource Development Associates Inc.
Effective Date July 24, 2023
GoldMining Inc. NI 43-101 Report – La Mina Project | Page 176 |
14.1.6 | BLOCK MODEL VALIDATION |
The author has undertaken a thorough validation of the resultant interpolated model in order to confirm the estimation parameters, to check that the model represents the input data on both local and global scales, and to check that the estimate is not biased.
Visual validation provides a local validation of the interpolated block model on a local block scale, using visual assessments and validation plots of sample grades verses estimated block grades. A thorough visual inspection of cross-sections, long-sections and bench/level plans, comparing the sample grades with the block grades has been undertaken, which demonstrates good correlation between local block estimates and nearby samples, without excessive smoothing in the block model.
Figure 14‑13 and Figure 14‑14 demonstrate that Au and Cu mineralization estimates were constrained by geological shapes. At the deeper portions of the model, the distribution of the estimated grades is not propagated into the outer volcanic halo or into the mostly barren X1 core. Based on geology and geophysics, the interpretation in this district is that these near surface mineralized porphyries are apotheoses of deeper, larger intrusive bodies. The interpreted shape of the La Cantera porphyries used in this model is a reasonable representation of that interpretation. While mineralization appears to continue below the limits of this model to depth, GoldMining will need to drill several deep holes in order to support any estimation of grades below the 1,050 m level.
A density of 2.7 tonnes per cubic meter was used for the tonnage estimates, based on daily measurements performed by Bellhaven geologists on drill-core samples (e.g., the observed global density for La Cantera is 2.714 t/cu m based on 100 determinations from drill holes LM-DDH-019 as well as LM-DDH-027).
14.1.8 | INFERRED AND INDICATED MINERAL RESOURCES |
The geology, deposit type, and mineralogy at La Cantera are well understood. Indicated Mineral Resources are defined as estimated mineralization within 35 meters of a mineralized composite. An additional constraint was that the estimation within 35 m had to come from a minimum of two drill holes. The drilling density at 35 m, combined with the estimation search and number of drillholes, established continuity of identified mineralization within the deposit. Additionally, recent metallurgical testing supports the QP’s confidence to classify mineralization as Indicated Mineral Resources. Table 14‑3 shows the different cutoff grades and the associated tonnes, ounces and pounds for the La Cantera deposit constrained by pit designs.
A gold price of US$ 1,700 per ounce, a processing cost of US$ 8.44/ tonne, and a gold recovery of 93% was used to determine cut-off grades and pit limits. Copper was not used in the determination of the cut-off grade. Due to the uncertainty of gold prices and recovery, the author recommends that a base cut-off grade of 0.30 g/t Au is appropriate for reporting resources for the La Cantera deposit. Given the style of mineralization, the author is of the opinion that the entire mineral deposit, as currently modeled, has a reasonable likelihood of economic extraction by open pit mining the La Cantera Resource Estimates.
Resource Development Associates Inc.
Effective Date July 24, 2023
GoldMining Inc. NI 43-101 Report – La Mina Project | Page 177 |
Table 14‑3 Cut-Off grade and Pit Constraining Parameters
Parameter | Unit | Value |
Metal Prices | $/oz Au $/oz Ag $/lb Cu | 1,700 21 3.50 |
Refining Cost | $/oz Au $/oz Ag $/lb Cu | 2.00 0.21 0.07 |
Royalty* | % | 6 |
Metallurgical Recovery | % Au % Ag % Cu | 93 30 91 |
Mining Unit Cost | $/t mined | 1.76 |
Process Unit Cost | $/t process | 7.44 |
G&A Unit Cost | $/t process | 1.00 |
Mineral Resource Cut-Off Grade | g/t Au | 0.30 |
*Consists of a 2% NSR payable to Gold Royalty Corp and a GRR (4% on precious metals, 5% on base metals) imposed by the Colombian National Mining Agency.
Mineral resources at La Cantera are sensitive to the selection of the reporting cut-off grade. To illustrate this sensitivity, the block model quantities and grade estimates within the constraining pit are presented in Table 14‑4 at linear increases in the cut-off grades for Measured, Indicated and Inferred Mineral Resources at La Cantera. The reader is cautioned that Table 14‑4 contains estimates at cutoff grades other than 0.25 g/t Au and should not be misconstrued as a mineral resource. The reported quantities and grades are only presented as a sensitivity of the resource model to the selection of cut-off grade. Mineral resources are not mineral reserves and do not have demonstrate economic viability.
Table 14‑4 Pit Constrained Mineral Resources for La Cantera
Cut-off | Metric | Pit Constrained Resources |
Grade
(g/t Au) | Tonnes ('000) | Au
(g/t) | Ag
(g/t) | Cu
(%) | AuEq
(g/t) |
Indicated Resources |
0.20 | 21,572 | 0.75 | 1.86 | 0.28 | 1.17 |
0.25 | 19,204 | 0.81 | 1.96 | 0.30 | 1.26 |
0.30 | 17,614 | 0.86 | 2.03 | 0.31 | 1.33 |
0.35 | 16,093 | 0.91 | 2.10 | 0.32 | 1.39 |
0.40 | 14,687 | 0.97 | 2.18 | 0.33 | 1.46 |
Inferred Resources |
0.200 | 13,563 | 0.63 | 1.70 | 0.27 | 1.03 |
0.250 | 12,199 | 0.67 | 1.79 | 0.29 | 1.10 |
0.300 | 11,175 | 0.71 | 1.85 | 0.30 | 1.15 |
0.350 | 10,002 | 0.75 | 1.91 | 0.31 | 1.21 |
0.400 | 8,852 | 0.80 | 1.99 | 0.32 | 1.27 |
Resource Development Associates Inc.
Effective Date July 24, 2023
GoldMining Inc. NI 43-101 Report – La Mina Project | Page 178 |
Table 14‑5 Mineral Resources at 0.30 g/t Cut-off for La Cantera. Effective Date December 20, 2022, Qualified Person Scott Wilson
| Metric | Grades | Contained Metal |
| Deposit | Tonnes (‘000) | Au
(g/t) | Ag
(g/t) | Cu
(%) | AuEq (g/t) | Au (oz) | Ag (oz) | Cu (lbs, ‘000) | AuEq (oz) |
Indicated Resources |
La Cantera | 17,614 | 0.86 | 2.03 | 0.31 | 1.33 | 487,009 | 1,149,569 | 120,460 | 753,166 |
Inferred Resources |
La Cantera | 11,175 | 0.71 | 1.85 | 0.30 | 1.15 | 255,086 | 664,661 | 72,709 | 413,168 |
Mineral Resources are not Mineral Reserves and do not have demonstrated economic viability. There is no certainty that any or all of the Mineral Resources will be converted to Mineral Reserves.
14.2 | MIDDLE ZONE MINERAL RESOURCE ESTIMATE |
14.2.1 | DATABASE FOR GEOLOGIC MODEL |
The drill-hole database for the Middle Zone resource estimate was provided by GoldMining in digital format and was imported into Vulcan modeling software. The database is inclusive of all 111 drill holes, including the 54 drill holes (Figure 14‑15 and Figure 14‑16) that pertain to the Middle Zone deposit. Table 14‑6 outlines the data in the drill-hole database provided by GoldMining.
The 54 holes for the Middle Zone contain 8,955 assay intervals and lithology records, with an average interval length of 1.99 m. The assay table contains assays of 34 elements; and the lithology table contains 16 different lithology types. Figure 14‑17 through Figure 14‑21 illustrate the distribution of lithology groups in the Middle Zone area only.
Table 14‑6 Total Project Drill Holes
Area | Drill Holes | Meters |
La Cantera | 26 | 8,327 |
Middle Zone | 54 | 18,803 |
El Limon | 9 | 2,923 |
La Garrucha | 22 | 6,641 |
Resource Development Associates Inc.
Effective Date July 24, 2023
GoldMining Inc. NI 43-101 Report – La Mina Project | Page 179 |
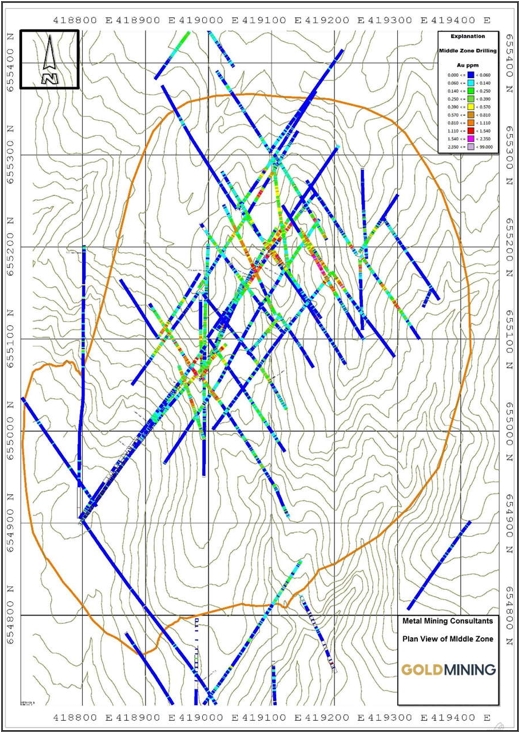
Figure 14‑15 Plan View of Middle Zone Drilling
Resource Development Associates Inc.
Effective Date July 24, 2023
GoldMining Inc. NI 43-101 Report – La Mina Project | Page 180 |
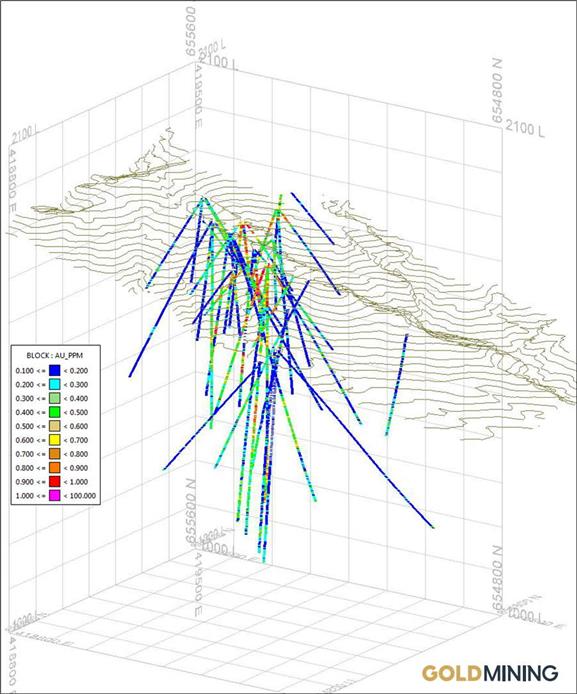
Figure 14‑16 Isometric View of Middle Zone Drilling
Resource Development Associates Inc.
Effective Date July 24, 2023
GoldMining Inc. NI 43-101 Report – La Mina Project | Page 181 |
Figure 14‑17 Distribution of Lithology - Middle Zone
Figure 14‑18 Distribution of Major Lithologies - Middle Zone
Resource Development Associates Inc.
Effective Date July 24, 2023
GoldMining Inc. NI 43-101 Report – La Mina Project | Page 182 |
Figure 14‑19 Histogram for Middle Zone Gold Data
Figure 14‑20 Histogram of Silver Data - Middle Zone
Resource Development Associates Inc.
Effective Date July 24, 2023
GoldMining Inc. NI 43-101 Report – La Mina Project | Page 183 |
Figure 14‑21 Cu Histogram Distribution
Bellhaven created the first set of sections, a total of 15, for the Middle Zone area. These sections were hand drawn on maps that had drill-hole traces plotted. The sections were a combination of North, North-East by South-West and North-West by South-East bearing sections. Figure 14‑22 is a sample of one of these sections. Bellhaven subsequently digitized each section into ArcView Software in 3D. GoldMining provided these digitized geologic sections which were then imported into Vulcan for further modeling. Figure 14‑23 illustrates the section layout at Middle Zone, and the 15 sections that included interpreted geology.
Eight out of the nine lithology types in the Middle Zone area were grouped into five lithology groups for the purpose of the Vulcan geologic model. The L1 and L1Bx types were grouped together as L1; X1 and X1Bx were grouped together as X1; X2 and X2Bx were grouped together as X2; and X3 and X3bx were grouped together as X3. The L1 and L1Bx types were determined to have the same mineral composition, as were the X1 and X1Bx, X2 and X2Bx, X3 and X3Bx types. The Volcanic (Volc) lithology group represents the host rock and was modeled to account for mineralization in this lithology. The X2 group represents the non-mineralized barren core of the deposit and was modeled. The principal lithology groups (L1, X1, X3) are the primary groups of interest, as they are the most mineralized with the highest grades.
In Vulcan, all the lithologies were modeled in bench sections every 20 m to a depth of 820 m or to 1,050 masl. The geologic interpretation for each bench was made using the GoldMining section profile intercepts at each bench, along with diamond drilling intercepts. Current drilling shows the deposit to be open at depth, however for this model a bottom depth of 880 m, or 1,060 m elevation, was chosen. Further drilling will be required to determine the depth extent and boundaries of the body at depth. Figure 14‑24 illustrates the shape of the porphyries and related breccias and the bench polygons used to create the geologic wireframes. The outer polygons displayed in blue represent X3, the middle polygons displayed in grey represent X1, while the inner polygons colored in magenta represent X2, the barren core.
Figure 14‑25 includes the addition of the outer L1 and Volc lithologies. Drilling has indicated there is mineralization present in the Volc lithology; however, the bulk of mineralization is hosted in the inner core (X1, X3, L1). Figure 14‑26 and Figure 14‑27 illustrate the wireframes created from the bench polygons that were used to flag lithology boundaries in a block model, which will ultimately affect grade estimation parameters.
Resource Development Associates Inc.
Effective Date July 24, 2023
GoldMining Inc. NI 43-101 Report – La Mina Project | Page 184 |
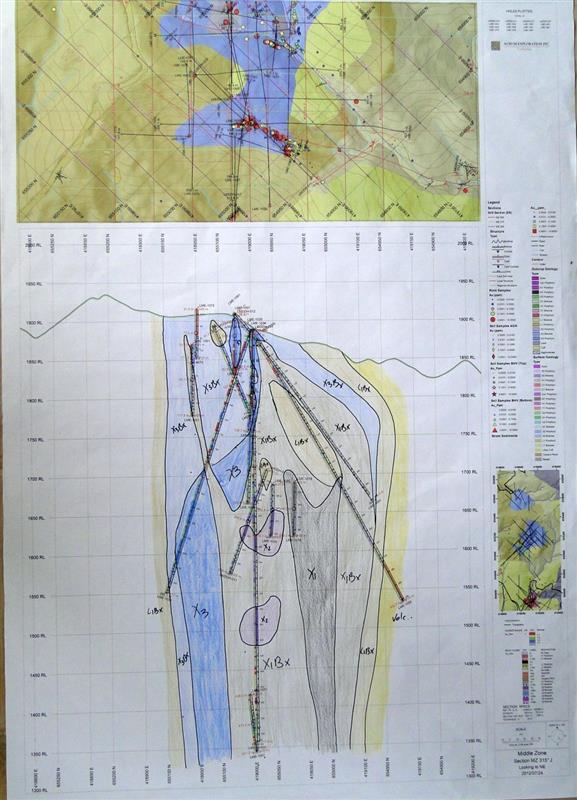
Figure 14‑22 Bellhaven Geologic Interpretation Section MZ_315_J
Resource Development Associates Inc.
Effective Date July 24, 2023
GoldMining Inc. NI 43-101 Report – La Mina Project | Page 185 |
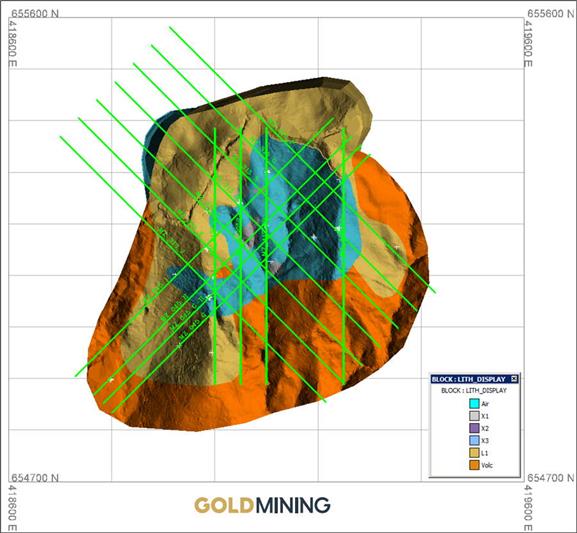
Figure 14‑23 Middle Zone Sections with Geologic Interpretation
Resource Development Associates Inc.
Effective Date July 24, 2023
GoldMining Inc. NI 43-101 Report – La Mina Project | Page 186 |
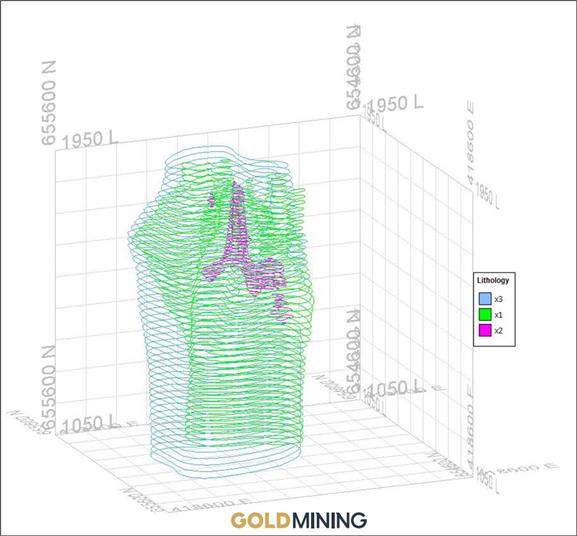
Figure 14‑24 Bench Section Profiles of X1, X2 and X3
Resource Development Associates Inc.
Effective Date July 24, 2023
GoldMining Inc. NI 43-101 Report – La Mina Project | Page 187 |
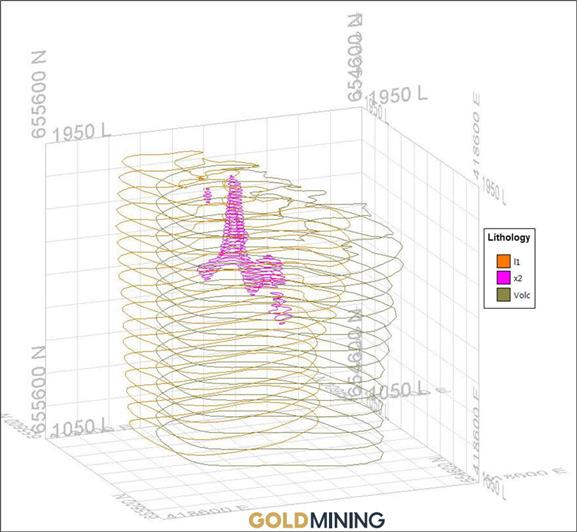
Figure 14‑25 Bench Section Profiles including L1 and Volcanic Lithologies
Resource Development Associates Inc.
Effective Date July 24, 2023
GoldMining Inc. NI 43-101 Report – La Mina Project | Page 188 |
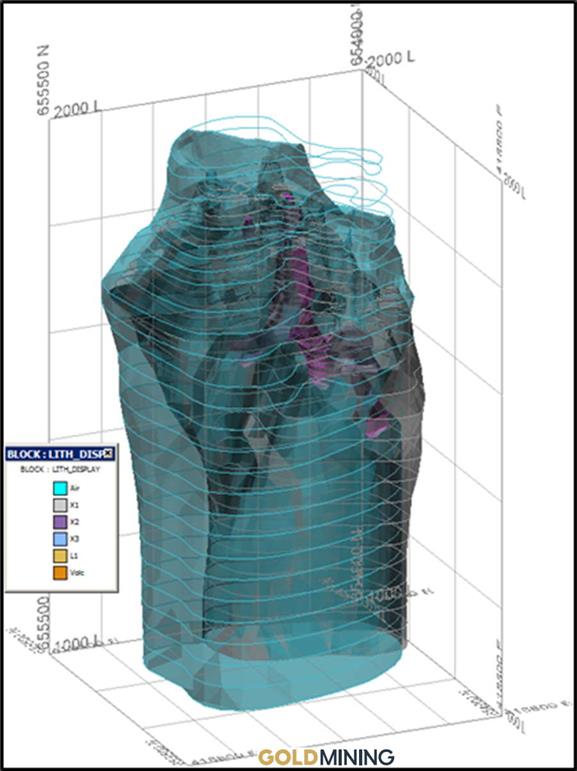
Figure 14‑26 Wireframes of X1, X2 and X3 Boundaries
Resource Development Associates Inc.
Effective Date July 24, 2023
GoldMining Inc. NI 43-101 Report – La Mina Project | Page 189 |
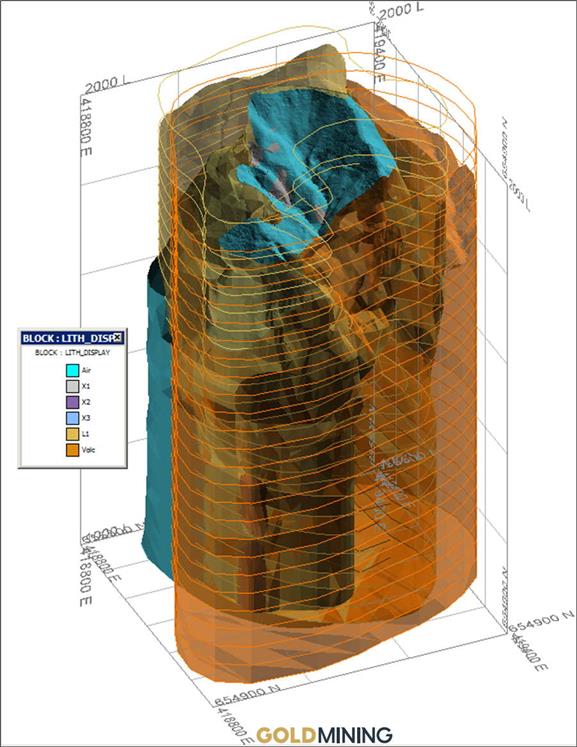
Figure 14‑27 Wireframes of L1, Volc, X3 and X1 Boundaries
Resource Development Associates Inc.
Effective Date July 24, 2023
GoldMining Inc. NI 43-101 Report – La Mina Project | Page 190 |
GoldMining provided 2-m contours for the entire La Mina resource area. This was used to create a surface wireframe in Vulcan to represent the surface topography. The topography was used to limit the surface extent of the X1, X2, X3, L1 and Volcanic wireframes. Drill hole collar survey information matches well with the digital topography used to constrain the model.
A block model was created in Vulcan for La Mina which encompasses all three deposits including Middle Zone. The block model utilizes parent blocking methods to best define the geologic interpretations in the block model. The parent block size for the Middle Zone block measures 10 m cubed. Table 14‑7 highlights the parameters used to build the La Mina block model.
Table 14‑7 La Mina Block Parameters
Parameter | X | Y | Z |
Origin | 416,800 | 654,000 | 1,150 |
Extent | 420,600 | 655,500 | 2,100 |
Parent Block Size | 10 | 10 | 10 |
The block model included variables to store lithology, gold grade, copper grade, silver grade, distance to nearest gold sample, number of gold samples used, number of drill holes used, and depth.
The wireframes for the X1, X2, X3, L1 and Volcanic lithologies were used to flag the lithology codes in the block model variable for lithology. Figure 14‑28 shows a slice through the block model with blocks colored by lithology.
Resource Development Associates Inc.
Effective Date July 24, 2023
GoldMining Inc. NI 43-101 Report – La Mina Project | Page 191 |
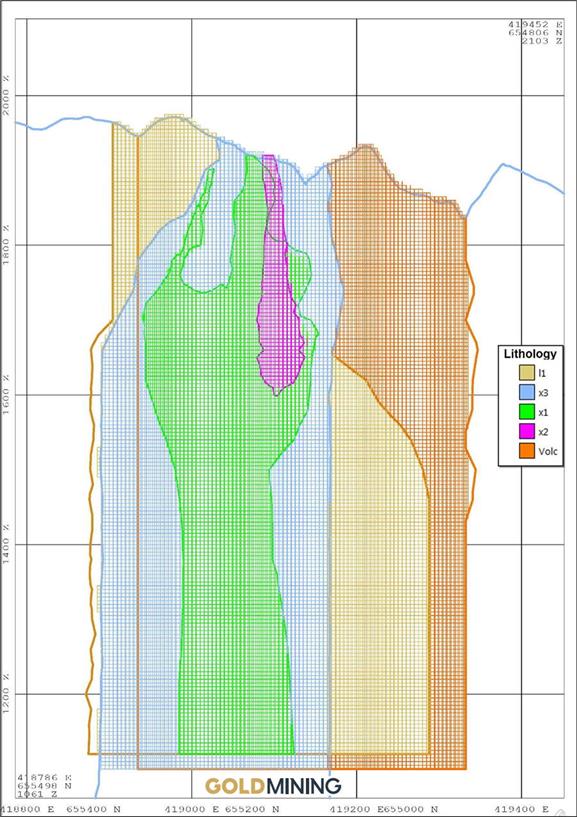
Figure 14‑28 Block Model showing Lithology of Middle Zone
Resource Development Associates Inc.
Effective Date July 24, 2023
GoldMining Inc. NI 43-101 Report – La Mina Project | Page 192 |
Grades were estimated into the block model by using inverse distance interpolation. Variances were calculated to the 2nd power or Inverse Distance Squared. A minimum of 1 sample and a maximum of 15 samples were used for the estimation of contained metal (Au, Ag, Cu) in the deposit. For each estimation run the block selection was restricted to respect lithology groups. The search parameters were the same for each estimate for gold, silver and copper. No more than 4 samples from a single drill hole were allowed per estimated bock.
The search ellipsoid parameters were:
| | ● | Major axis Radius: 140 m |
| | ● | Semi-major axis radius: 140 m |
The ellipsoid has an orientation of
| | ● | Bearing: 45 degrees (rotation about the Z axis) |
| | ● | Plunge: 0 degrees (rotation about Y’ axis) |
| | ● | Dip: -90 degrees (rotation about X’ axis) |
The following cross sections show that the search parameters modeled the geological interpretation of the ore deposit. This gives confidence that the estimation was appropriate for the Middle Zone deposit.
Mineralization grades were capped prior to compositing. Lognormal probability plots were evaluated to determine the effect of outlier mineralization grades on the global estimate. This was done to limit biased grade estimates.
Table 14‑8 Middle Zone Capping Criteria
| | Maximum Assay Grade | Grade Cap | Average Grade Prior to Capping | Average Grade after Capping |
Au | 13 ppm | 4.2 g/t | 0.232 | 0.229 |
Ag | 448 ppm | 25.5 | 0.69 | 0.68 |
Cu | 17,700 ppm | 3,000 ppm | 0.53 | 0.53 |
Resource Development Associates Inc.
Effective Date July 24, 2023
GoldMining Inc. NI 43-101 Report – La Mina Project | Page 193 |
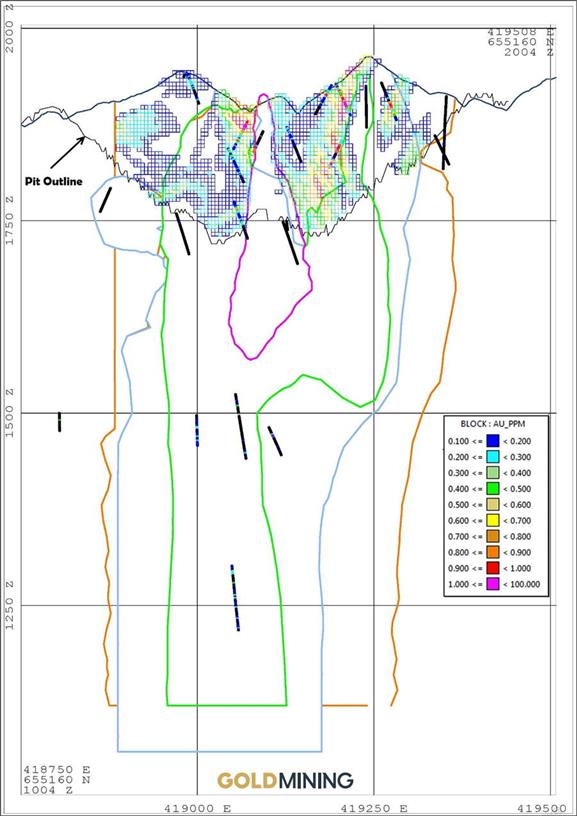
Figure 14‑29 Middle Zone Block Model Slice showing Pit Constrained Au Estimated Grades
Resource Development Associates Inc.
Effective Date July 24, 2023
GoldMining Inc. NI 43-101 Report – La Mina Project | Page 194 |
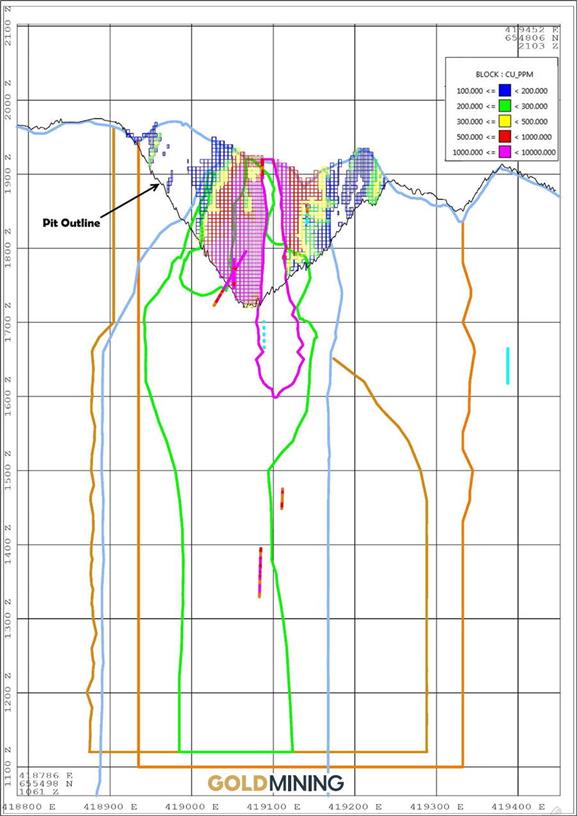
Figure 14‑30 Middle Zone Block Model Slice Showing Pit Constrained Cu Estimated Grades
Resource Development Associates Inc.
Effective Date July 24, 2023
GoldMining Inc. NI 43-101 Report – La Mina Project | Page 195 |
A density of 2.65 tonnes per cubic meter was used for the tonnage estimates, based on 536 measurements performed by Bellhaven geologists on drill-core samples.
14.2.7 | PIT CONSTRAINING OPTIMIZATION CRITERIA |
The phrase “reasonable prospects for eventual economic extraction” requirement means that the quantity and grade estimates meet certain economic thresholds and that the mineral resources are reported at an appropriate cut-off grade that takes into account extraction scenarios and processing recoveries. The deposit gold mineralization is amenable for open-pit extraction. To determine the quantities of material offering “reasonable prospects for eventual economic extraction” by an open pit, the Lerch-Grossman algorithm was used, which constructs lists of related blocks that should or should not be mined. The final list defines a surface pit shell that has the highest possible total value, while honoring the required surface mine slope and economic parameters.
Economic parameters used in the analysis are based on the following general assumptions: Input parameters at US$ 1,700 per ounce gold price, a processing and G&A cost of $8.44/ tonne, and a recovery of 93% Au to determine cut-off grades.
The parameters define a realistic basis to estimate the Mineral Resource for the La Mina Project. The Mineral Resource has been limited to mineralized material that occurs within pit shells and that could be scheduled to be processed based on the defined cut-off grade.
14.2.8 | INFERRED AND INDICATED MINERAL RESOURCES |
The geology, deposit type, and mineralogy at the Middle Zone is well understood. Nominal drill spacing in the upper portions of the deposit is approximately 50 m, but the drill density decreases below 300 m depth. There is sufficient information to classify the resources for the project into two categories of Inferred Mineral Resources and Indicated Mineral Resources. Indicated Mineral Resources are defined as estimated mineralization within 35 m of a mineralized composite. An additional constraint was that the estimation within 35 m had to come from a minimum of two drill holes. The drilling density at 35 m, combined with the estimation search and number of drill holes, established continuity of identified mineralization within the deposit. Additionally, recent metallurgical testing has allowed the QP confidence to classify mineralization as Indicated Mineral Resources.
Mineral resources at Middle Zone are sensitive to the selection of the reporting cut-off grade. To illustrate this sensitivity, the block model quantities and grade estimates within the constraining pit are presented in Table 14‑9 at linear increases in the cut-off grades for Measured, Indicated and Inferred Mineral Resources at Middle Zone. The reader is cautioned that Table 14‑9 contains estimates at cutoff grades other than 0.30 g/t Au and should not be misconstrued as a mineral resource. The reported quantities and grades are only presented as a sensitivity of the resource model to the selection of cut-off grade. Mineral resources are not mineral reserves and do not have demonstrate economic viability.
Resource Development Associates Inc.
Effective Date July 24, 2023
GoldMining Inc. NI 43-101 Report – La Mina Project | Page 196 |
Table 14‑9 Pit Constrained Resources for Middle Zone
Cut-off | Metric | Grades |
Grade
(g/t Au) | Tonnes ('000) | Au
(g/t) | Ag
(g/t) | Cu
(%) | AuEq
(g/t) |
Indicated Resources |
0.20 | 13,864 | 0.43 | 1.17 | 0.10 | 0.58 |
0.25 | 11,030 | 0.48 | 1.23 | 0.11 | 0.65 |
0.30 | 8,800 | 0.54 | 1.28 | 0.11 | 0.71 |
0.35 | 7,080 | 0.59 | 1.34 | 0.12 | 0.77 |
0.40 | 5,753 | 0.64 | 1.41 | 0.12 | 0.82 |
Inferred Resources |
0.20 | 2,320 | 0.34 | 1.12 | 0.08 | 0.46 |
0.25 | 1,467 | 0.40 | 1.15 | 0.08 | 0.53 |
0.30 | 949 | 0.47 | 1.15 | 0.09 | 0.62 |
0.35 | 680 | 0.54 | 1.15 | 0.09 | 0.67 |
0.40 | 492 | 0.60 | 1.17 | 0.09 | 0.73 |
Mineral Resources are not Mineral Reserves and do not have demonstrated economic viability. There is no certainty that Mineral Resources will be converted to Mineral Reserves.
Table 14‑10 Total Resources with 0.30 g/t Cut-off for Middle Zone. Effective Date December 20, 2022, Qualified Person Scott Wilson
| Metric | Grades | Contained Metal |
| Deposit | Tonnes (‘000) | Au
(g/t) | Ag
(g/t) | Cu
(%) | AuEg
(g/t) | Au (oz) | Ag (oz) | Cu (lbs, ‘000) | AuEq (oz) |
Indicated Resources |
Middle Zone | 8,800 | 0.54 | 1.28 | 0.11 | 0.71 | 152,777 | 362,138 | 21,185 | 200,873 |
Inferred Resources |
Middle Zone | 949 | 0.47 | 1.15 | 0.09 | 0.62 | 14,340 | 35,087 | 1,873 | 18,916 |
Mineral Resources are not Mineral Reserves and do not have demonstrated economic viability. There is no certainty that Mineral Resources will be converted to Mineral Reserves.
Resource Development Associates Inc.
Effective Date July 24, 2023
GoldMining Inc. NI 43-101 Report – La Mina Project | Page 197 |
14.3 | LA GARRUCHA MINERAL RESOURCE ESTIMATE |
The drill-hole database for La Garrucha was provided by GoldMining in digital format and was imported into Vulcan modeling software. The database is inclusive of all 111 drill holes, including the 22 drill holes that pertain to the La Garrucha deposit. Table 14‑11 outlines the data in the drill-hole database.
The 22 holes for La Garrucha contain 5,802 assay intervals and lithology records, with an average interval length of 1.75 m.
Table 14‑11 Total Project Drill Holes
Area | Drill Holes | Meters |
La Cantera | 26 | 8,327 |
Middle Zone | 54 | 18,803 |
El Limon | 9 | 2,923 |
La Garrucha | 22 | 10,191 |
A statistical summary of Au, Ag and Cu above detection limits is shown in Table 14‑12; the elements of concern for La Garrucha 2022 mineral resource estimate. These elements are of major interest and drive the mining, metallurgical and economic considerations for the La Mina mineral deposits with copper adding a significant gold equivalent credit to the project.
Table 14‑12 Mineralized assay statistics for La Garrucha
Element | Unit | N | Mean | Maximum | Std. Dev. | C.V. |
Au | ppm | 5,802 | 2.04 | 188 | 5.86 | 2.86 |
Ag | ppm | 4,735 | 2.45 | 188 | 6.42 | 2.62 |
Cu | ppm | 5,802 | 570.28 | 8,790 | 694.64 | 1.21 |
G1, G2 and G4 lithologies are the main hosts of mineralization for La Garrucha. The following statistics were evaluated for the mineral resource estimate. Each of the assay intervals were logged for lithology, alteration and mineralization. Disseminated mineralization displays varying average grades controlled by the lithology of the deposit (Figure 14‑31 through Figure 14‑33). Sampled assay values show a range of coefficients of variation due to some higher-grade outliers, relative to the assay values of the whole population, which may skew the mean average grades above the third quartile. Evaluation of the following graphs suggests that capping the assayed grades by lithologic type is required in order to estimate the contained metal content of the deposit.
Resource Development Associates Inc.
Effective Date July 24, 2023
GoldMining Inc. NI 43-101 Report – La Mina Project | Page 198 |
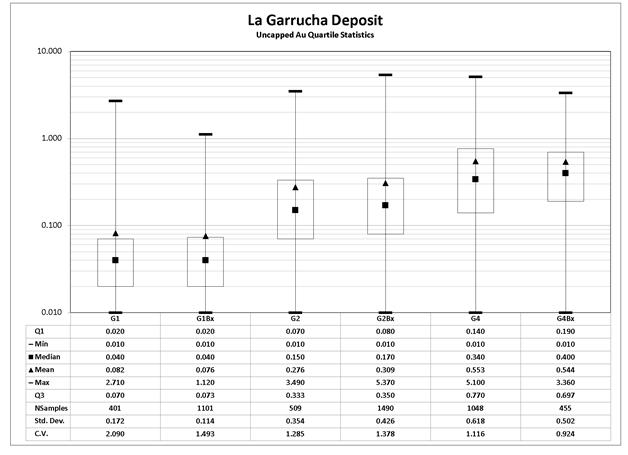
Figure 14‑31 Uncapped gold grade distribution by lithologic unit
Resource Development Associates Inc.
Effective Date July 24, 2023
GoldMining Inc. NI 43-101 Report – La Mina Project | Page 199 |
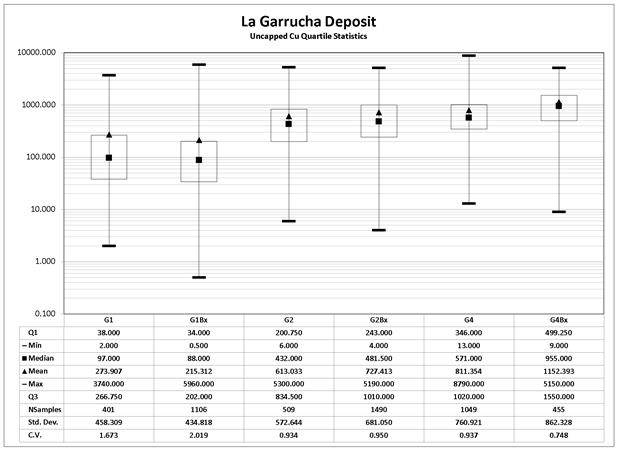
Figure 14‑32 Uncapped copper grade distribution by lithologic unit
Resource Development Associates Inc.
Effective Date July 24, 2023
GoldMining Inc. NI 43-101 Report – La Mina Project | Page 200 |
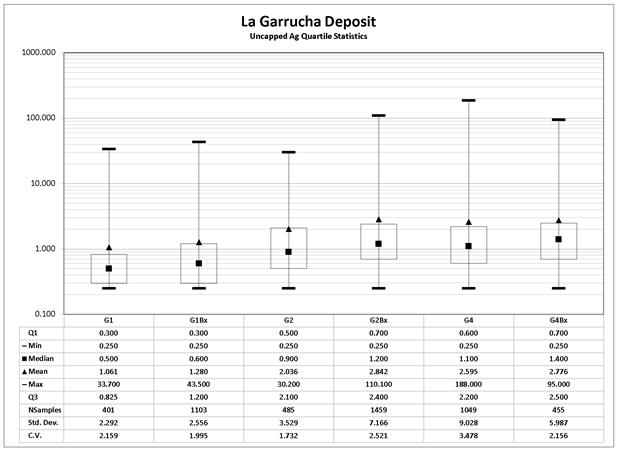
Figure 14‑33 Uncapped silver grade distribution by lithologic unit
14.3.3 | GRADE CAPPING – HANDLING OF OUTLIERS |
Treatment of outliers is a perplexing problem. There is no generally accepted solution to handling of outliers.; however, diligence needs to be exerted with the assay database to ensure the ability to estimate the true average grade of the mineral deposit. Therefore, the accepted practice of capping grades at the 90th through 99th percentile has been employed to limit the impact of high-grade outliers for the deposit.
Table 14‑13 summarizes the capping statistics. Figure 14‑34 through Figure 14‑36 show the resulting box plot quartile statistics after subsequent capping with the outliers reduced to the capping levels listed in Table 14‑13.
Table 14‑13 La Garrucha Assay Capping Statistics
Lithology | Uncapped Grade (ppm) | Number of Assays | Capping Grade (ppm) | Capped Grade (ppm) | Number Samples Capped |
Gold |
G1 & G1Bx | 0.078 | 1,504 | 0.70 | 0.074 | 13 |
G2 & G2Bx | 0.301 | 1,999 | 1.98 | 0.292 | 20 |
G4 & G4Bx | 0.550 | 1,503 | 2.75 | 0.541 | 15 |
Copper |
G1 & G1Bx | 230.9 | 1,507 | 2,176 | 221.1 | 15 |
G2 & G2Bx | 698.3 | 1,999 | 3,080 | 691.2 | 20 |
G4 & G4Bx | 914.5 | 1,504 | 3,660 | 903.2 | 15 |
Silver |
G1 & G1Bx | 1.22 | 1,504 | 11.80 | 1.14 | 14 |
G2 & G2Bx | 2.64 | 1,968 | 27.68 | 2.35 | 20 |
G4 & G4Bx | 2.65 | 1,504 | 24.80 | 2.28 | 14 |
Resource Development Associates Inc.
Effective Date July 24, 2023
GoldMining Inc. NI 43-101 Report – La Mina Project | Page 201 |
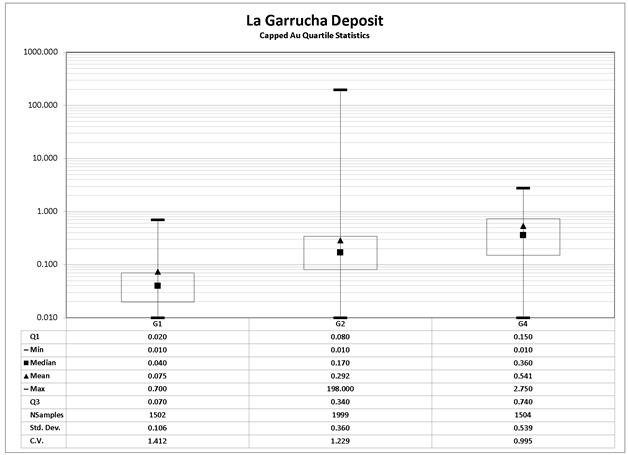
Figure 14‑34 Capped Au Assay Box Plot Statistics
Resource Development Associates Inc.
Effective Date July 24, 2023
GoldMining Inc. NI 43-101 Report – La Mina Project | Page 202 |
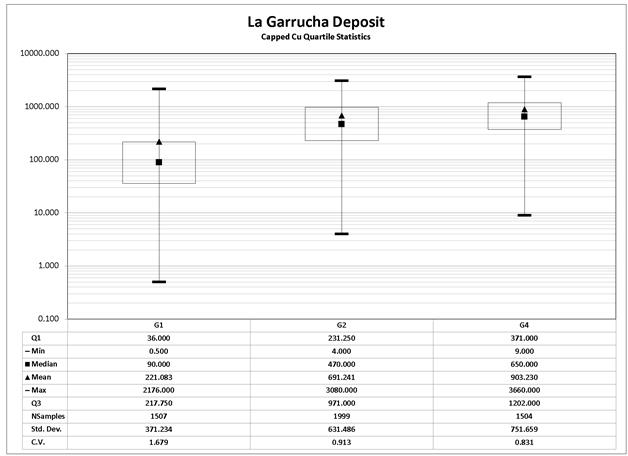
Figure 14‑35 Capped Cu Assay Box Plot Statistics
Resource Development Associates Inc.
Effective Date July 24, 2023
GoldMining Inc. NI 43-101 Report – La Mina Project | Page 203 |
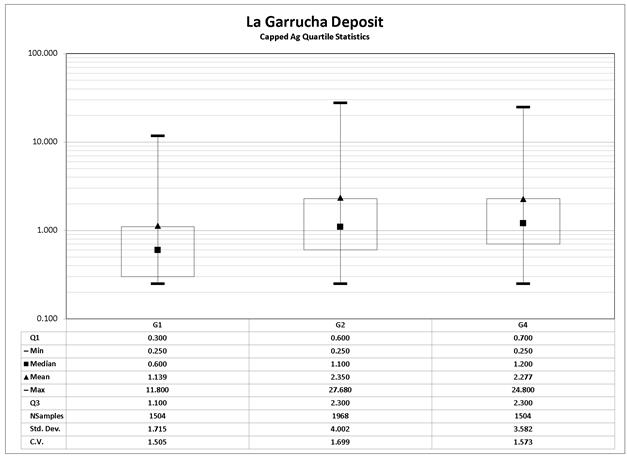
Figure 14‑36 Capped Ag Assay Box Plot Statistics
Compositing reduces the impact of short assay intervals and helps to better estimate the average grade of the deposit. Compositing incorporates a certain amount of dilution into the raw assay data prior to estimation. The mining operation envisioned for the Project, open pit, will be at a larger scale than the assays sampled for the deposit. The selective mining unit for the Project is expected to be 10 m, therefore, the assays for the database have been composited to 10 m. Composites are length weighted down hole composites of the capped Au, Cu and Ag values.
Figure 14‑37, Figure 14‑38 and Figure 14‑39 detail the final composite statistics, by lithology, that have been used for the mineral resource estimate. Coefficients of variance are within acceptable ranges; high grade outliers have been accounted for and the average metal grades are within acceptable ranges. The manipulation from assays to composites has been carried out with industry accepted practices and the author recommends that the final composite database can be used for mineral resource estimation of the La Garrucha deposit.
Resource Development Associates Inc.
Effective Date July 24, 2023
GoldMining Inc. NI 43-101 Report – La Mina Project | Page 204 |
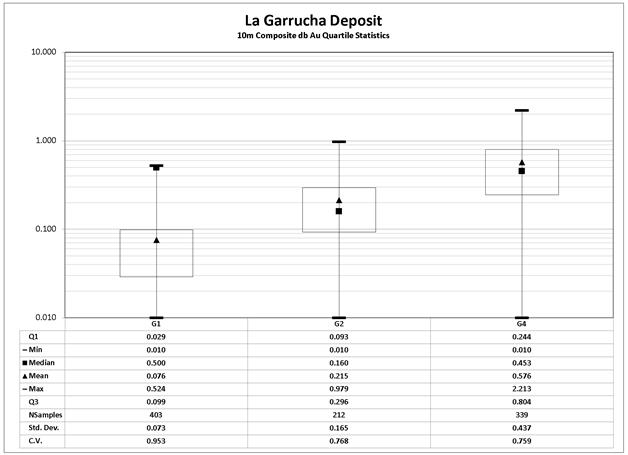
Figure 14‑37 Composite Au Box Plot Statistics
Resource Development Associates Inc.
Effective Date July 24, 2023
GoldMining Inc. NI 43-101 Report – La Mina Project | Page 205 |
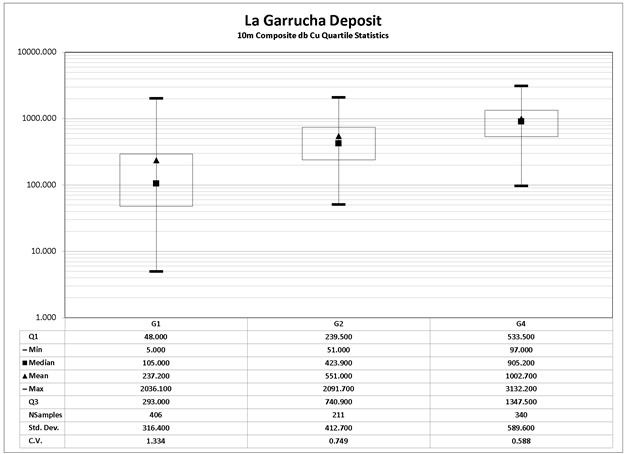
Figure 14‑38 Composite Cu Box Plot Statistics
Resource Development Associates Inc.
Effective Date July 24, 2023
GoldMining Inc. NI 43-101 Report – La Mina Project | Page 206 |
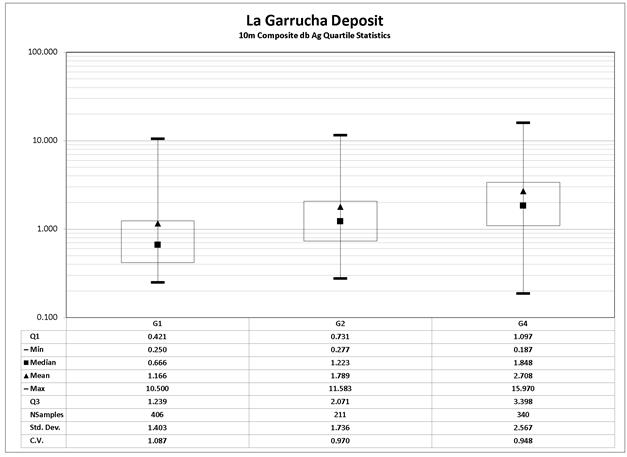
Figure 14‑39 Composite Ag Box Plot Statistics
Cell declustering is a further step to debias a mineral resource estimate. Cell declustering was evaluated to ensure more densely drilled out portions of the deposit are not biased by a large sample set of high grades that may be localized to one area. 100 x 100 x 100 meter cell sizes were used to apply a weight to the histograms to ensure no bias was introduced to the grade estimate. With the low number of drillholes at La Garrucha bias is very small. The following three charts show a low mean grade out to 500 meters which demonstrate very low sample bias due to localized drilling densities.
Resource Development Associates Inc.
Effective Date July 24, 2023
GoldMining Inc. NI 43-101 Report – La Mina Project | Page 207 |
Figure 14‑40 La Garrucha Au declustering results
Resource Development Associates Inc.
Effective Date July 24, 2023
GoldMining Inc. NI 43-101 Report – La Mina Project | Page 208 |
Figure 14‑41 La Garrucha Au declustering results
Resource Development Associates Inc.
Effective Date July 24, 2023
GoldMining Inc. NI 43-101 Report – La Mina Project | Page 209 |
Figure 14‑42 La Garrucha Au declustering results
14.3.6 | CONTACT PROFILE ANALYSIS |
Gold and copper values of the three main lithologic units of the deposit were evaluated to determine if the mineralization of the units is separate and distinct from each other unit. If mineralization is continuous or convergent across lithologic contacts, then it is possible to estimate mineralization from both assay populations. The average grades of the units do not need to be similar. If the grades appeared graphically to converge at the contact, then these units were to be estimated as one unit. Mean average Au and Cu grades diverge at the contacts for G1, G2 and G4 which suggests the mineralization is distinct within each unit. Therefore, each of the three lithologies are considered distinct estimation domains. Care was taken to estimate using only assay information within each domain and not estimating grades across these hard boundaries.
Resource Development Associates Inc.
Effective Date July 24, 2023
GoldMining Inc. NI 43-101 Report – La Mina Project | Page 210 |
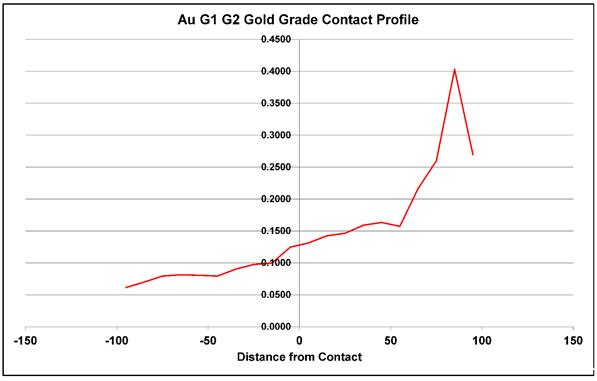
Figure 14‑43 Gold Contact profile between G1 and G2
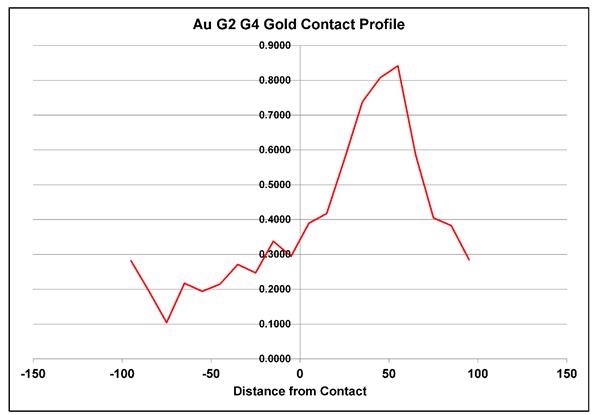
Figure 14‑44 Gold Contact between G2 and G4
Resource Development Associates Inc.
Effective Date July 24, 2023
GoldMining Inc. NI 43-101 Report – La Mina Project | Page 211 |
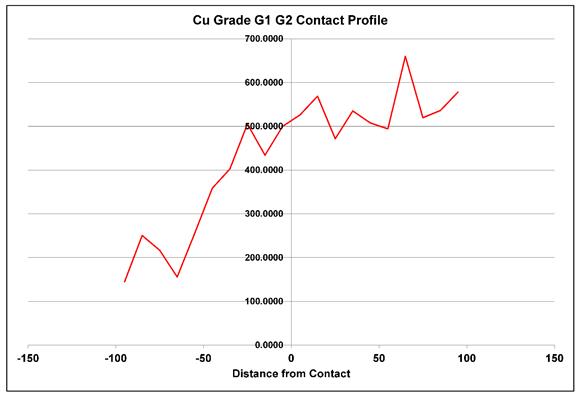
Figure 14‑45 Copper Contact profile between G1 and G2
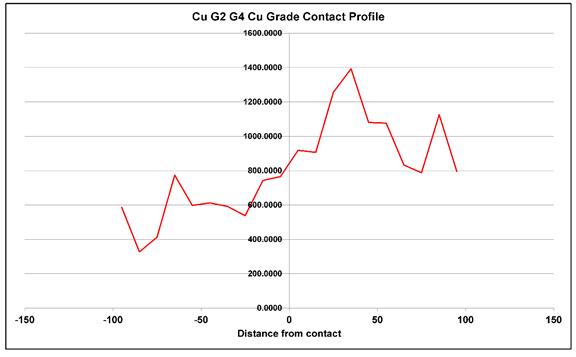
Figure 14‑46 Copper Contact between G2 and G4
Resource Development Associates Inc.
Effective Date July 24, 2023
GoldMining Inc. NI 43-101 Report – La Mina Project | Page 212 |
Anisotropy of mineralization was evaluated with Sage spatial modeling software to determine appropriate search ellipses for grade estimation. Mineralization at La Garrucha is sub-vertical just like the shape of the intrusive bodies that host the mineralization. Evaluations with spatial modeling software yield fairly large search ellipses, which suggest low variances of mineralization grades vertically. One search ellipse was chosen to estimate mineralization through all the domains for La Garrucha.
Figure 14‑47 La Garrucha Anisotropy
The La Mina block model was expanded to encompass La Garrucha along with Middle Zone and La Cantera. Block model dimensions are shown in Table 14‑14.
Table 14‑14 Model extents
| | Minimum (m) | Maximum (m) | Extent (m) | Block size (m) | N. of Blocks |
East | 418,600 | 420,600 | 2,000 | 10 | 200 |
North | 654,000 | 655,500 | 1,500 | 10 | 150 |
Elevation | 1,150 | 2,100 | 950 | 10 | 95 |
The block model has been coded with several interpreted shapes that are representative of the deposit. These include topography, lithology, specific gravity, as well as metal grades.
Resource Development Associates Inc.
Effective Date July 24, 2023
GoldMining Inc. NI 43-101 Report – La Mina Project | Page 213 |
Metal grades for the mineral resource are estimated using Inverse Distance Weighting. Inverse distance methods are a suite of weighted average estimation methods. These result in estimates that are smoothed versions of the original sample data. Inverse distance methods are based on calculating weights for the samples based on the distance from the samples to the centroid of a model block. This is essentially a linear estimate where sample weights are assigned to composite values for all composites used in the estimate. The calculation of the weights is based on the inverse of the distance between the composite and the center of the block being estimated. Sample weights are standardized to a sum of 1 to ensure there is not a globally biased estimate. In the mining industry there are two common exponents used, Inverse Distance squared (ID2) and Inverse Distance cubed (ID3). ID3 is used when large weights are desired for the closest composites. This is applicable when the variable being estimated is erratic and the current data spacing is large relative to the data that would be available for mineral boundary decision making. Such as with open pit gold and silver grade distributions. ID3 methodologies are widely used in the mining industry and have proven through the decades to be an acceptable and reliable methodology for the estimation of metal distributions in metallic mineral deposits. Copper mineralization is less erratic than gold and silver. A weight of 2 (ID2), inverse distance squared was the methodology used to estimate Cu mineralization for La Garrucha.
Metal grades have been interpolated throughout the block model. They are stored as a grade in each model block based on the estimation parameters decided upon for the deposit. Two individual estimation domains were run on the model for G1+G2 and G4 lithologies. Only samples and blocks matching the lithology criteria were used in each of the estimation runs. These estimations honor the hard and soft boundaries identified by the contact profile analysis.
Estimation | Minimum Samples | Maximum Samples | Max Samples Allowed per Hole | Sample Rocktype | Block Model Rocktype | Number of Blocks Estimated |
lgg1au | 2 | 12 | 3 | G1 & G2 | G1 & G2 | 109,064 |
lgg4au | 2 | 12 | 3 | G4 | G4 | 55,142 |
lgg1cu | 2 | 12 | 3 | G1 & G2 | G1 & G2 | 109,070 |
lgg4cu | 2 | 12 | 3 | G4 | G4 | 55,142 |
lgg1ag | 2 | 12 | 3 | G1 & G2 | G1 & G2 | 109,070 |
lgg4ag | 2 | 12 | 3 | G4 | G4 | 55,142 |
Block model validation can be quantified numerically in certain aspects and in many cases is visual and sometimes subjective. Many locations throughout the mineral deposit have been checked for biased estimates. One such validation is to compare the ID3 estimate against the nearest neighbor (NN) estimation. A NN estimated should have a globally higher variance than the NN estimation. Bias can be surmised visually if high grades of mineralization have been estimated over known low grade areas of the deposit. A comparison of estimated mineralization should mimic the same visual characteristics as seen against an overlay of the composites used for the estimation as shown for Au in Figure 14‑48. Another visual characteristic to ensure no bias is that there are no obvious streaks of high grade, which can be an indicator of high-grade bias in the estimate. The blocks on Section A-B demonstrate that the estimate of mineralization compares well with the La Garrucha exploration drilling data.
Resource Development Associates Inc.
Effective Date July 24, 2023
GoldMining Inc. NI 43-101 Report – La Mina Project | Page 214 |
Table 14‑15 compares the global ID3 estimate against the global NN estimate at a 0.00 g/t for each of the three estimated elements. The same conditions and criteria used for the ID3 interpolation we used for the NN interpolation. Variance, standard deviation and coefficient of variance all display higher values than the IDW estimates. These comparisons satisfy the author that there is no global bias in the 2023 MRE. An acceptable smoothing of the original assayed grades of the deposit has been achieved.
Table 14‑15 Comparison of NN estimates to IDW estimates for the 2023 MRE
IDW Modeled Grade vs. NN Model Grade | Units | Au | Au Variance | Std. Dev. | C.V. |
ID3 Global Resource Estimate | ppm | 0.238 | 0.057 | 0.239 | 1.003 |
NN Global Resource Estimate | ppm | 0.236 | 0.080 | 0.282 | 1.201 |
| | | | | | |
IDW Modeled Grade vs. NN Model Grade | Units | Cu | Cu Variance | Std. Dev. | C.V. |
ID3 Global Resource Estimate | ppm | 518 | 168,304 | 410 | 0.792 |
NN Global Resource Estimate | ppm | 524 | 253,882 | 503 | 0.961 |
| | | | | | |
IDW Modeled Grade vs. NN Model Grade | Units | Ag | Ag Variance | Std. Dev. | C.V. |
ID3 Global Resource Estimate | ppm | 1.53 | 1.42 | 1.19 | 0.78 |
NN Global Resource Estimate | ppm | 1.49 | 2.81 | 1.68 | 1.12 |
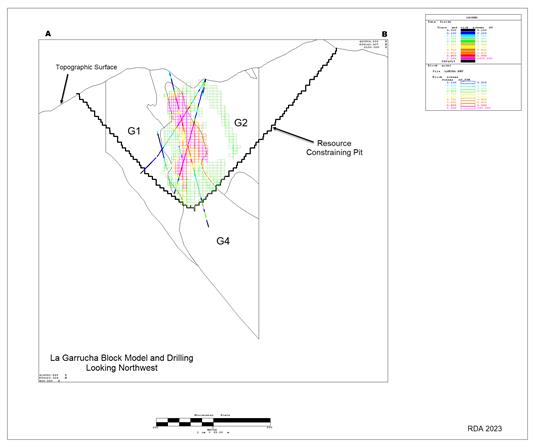
Figure 14‑48 Visual comparison of composite database with estimated Au grades for La Garrucha
Scattergrams comparing the composite Au, Cu and Ag grades to the modeled Au, Cu and Ag grades are shown in Figure 14‑49, Figure 14‑50 and Figure 14‑51. The modelled grades are nearly the same as the composite data, which is expected. The variances are nearly identical to the composites as expected. The slopes are nearly at a 1 to 1 for all three modelled grades. The author is confident that there are no biases in the 2021 MRE for La Garrucha. The 2023 MRE can be relied upon for economic analyses.
Resource Development Associates Inc.
Effective Date July 24, 2023
GoldMining Inc. NI 43-101 Report – La Mina Project | Page 215 |
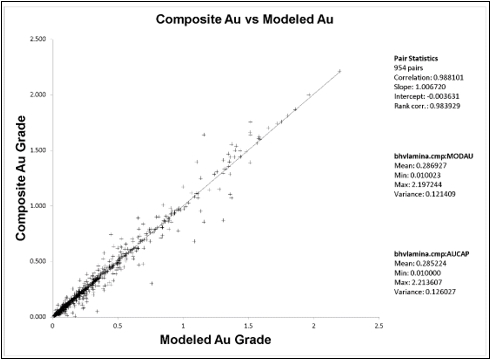
Figure 14‑49 Scattergram comparing global estimated Au grade to composite database Au values
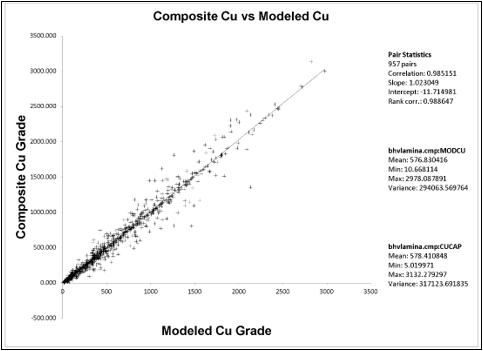
Figure 14‑50 Scattergram comparing global estimated Cu grade to composite database Cu values
Resource Development Associates Inc.
Effective Date July 24, 2023
GoldMining Inc. NI 43-101 Report – La Mina Project | Page 216 |
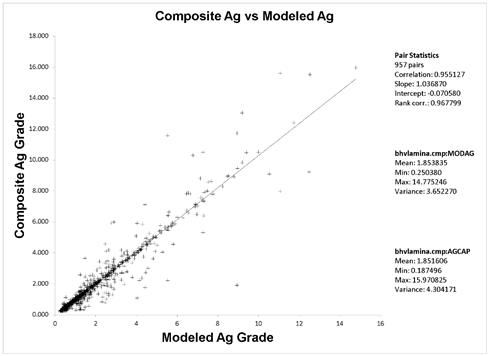
Figure 14‑51 Scattergram comparing global estimated Ag grade to composite database Ag values
A density of 2.65 tonnes per cubic meter was used for the tonnage estimates, based on 552 measurements performed by GoldMining geologists on drill-core samples.
14.3.12 | PIT CONSTRAINING OPTIMIZATION CRITERIA |
To determine the quantities of material offering “reasonable prospects for eventual economic extraction” by an open pit, the Lerch-Grossman algorithm was used, which constructs lists of related blocks that should or should not be mined. The final list defines a surface pit shell that has the highest possible total value, while honoring the required surface mine slope and economic parameters.
Economic parameters used in the analysis are based on the following general assumptions: Input parameters at US$ 1,700 per ounce gold price, a processing cost and G&A of $8.44/ tonne, and a recovery of 93% Au to determine cut-off grades.
The parameters define a realistic basis to estimate the Mineral Resource for the La Mina Project including La Garrucha. Mineral Resources have been limited to mineralized material that occurs within pit shells and that could be scheduled to be processed based on the defined cut-off grade.
14.3.13 | INFERRED AND INDICATED MINERAL RESOURCES |
There is sufficient information to classify the resources for the project into two categories of Inferred Mineral Resources and Indicated Mineral Resources. Indicated Mineral Resources are defined as estimated mineralization within 35 m of a mineralized composite. An additional constraint was that the estimation within 35 m had to come from a minimum of two drill holes.
Mineral resources at La Garrucha are sensitive to the selection of the reporting cut-off grade. To illustrate this sensitivity, the block model quantities and grade estimates within the constraining pit are presented in Table 14‑16 at linear increases in the cut-off grades for Indicated and Inferred Mineral Resources at La Garrucha. The reader is cautioned that Table 14‑16 contains estimates at cutoff grades other than 0.30 g/t Au and should not be misconstrued as a mineral resource. The reported quantities and grades are only presented as a sensitivity of the resource model to the selection of cut-off grade. Mineral resources are not mineral reserves and do not have demonstrate economic viability.
Resource Development Associates Inc.
Effective Date July 24, 2023
GoldMining Inc. NI 43-101 Report – La Mina Project | Page 217 |
Table 14‑16 Pit Metal sensitivities for La Garrucha
Cut-off | Metric | Grades |
Grade
(g/t Au) | Tonnes ('000) | Au
(g/t) | Ag
(g/t) | Cu
(%) | AuEq
(g/t) |
Indicated Resources |
0.200 | 9,705 | 0.56 | 2.87 | 0.10 | 0.73 |
0.250 | 8,428 | 0.61 | 3.03 | 0.10 | 0.79 |
0.300 | 7,358 | 0.65 | 3.14 | 0.11 | 0.85 |
0.350 | 6,274 | 0.71 | 3.27 | 0.11 | 0.91 |
0.400 | 5,469 | 0.76 | 3.35 | 0.12 | 0.97 |
Inferred Resources |
0.200 | 59,728 | 0.47 | 2.30 | 0.09 | 0.63 |
0.250 | 50,727 | 0.52 | 2.40 | 0.10 | 0.68 |
0.300 | 44,107 | 0.55 | 2.46 | 0.10 | 0.72 |
0.350 | 36,948 | 0.60 | 2.53 | 0.11 | 0.78 |
0.400 | 30,627 | 0.64 | 2.58 | 0.11 | 0.83 |
Mineral Resources are not Mineral Reserves and do not have demonstrated economic viability. There is no certainty that Mineral Resources will be converted to Mineral Reserves.
Table 14‑17 Mineral Resources at a 0.30g/t Cut-off for the La Garrucha MRE. Effective Date December 20, 2022, Qualified Person Scott Wilson
| Metric | Grades | Contained Metal |
| Deposit | Tonnes (‘000) | Au
(g/t) | Ag
(g/t) | Cu
(%) | AuEg
(g/t) | Au (oz) | Ag (oz) | Cu (lbs, ‘000) | AuEq (oz) |
Indicated Resources |
La Garrucha | 7,358 | 0.65 | 3.14 | 0.11 | 0.85 | 153,764 | 742,797 | 17,762 | 201,076 |
Inferred Resources |
La Garrucha | 44,107 | 0.55 | 2.46 | 0.10 | 0.72 | 779,922 | 3,488,379 | 96,846 | 1,020,989 |
Mineral Resources are not Mineral Reserves and do not have demonstrated economic viability. There is no certainty that Mineral Resources will be converted to Mineral Reserves.
14.4 | LA MINA MINERAL RESOURCES |
Table 14‑18 and Table 14‑19 report the La Mina mineral resources which are combined from La Cantera, Middle Zone and La Garrucha.
Mineral resources at La Mina are sensitive to the selection of the reporting cut-off grade. To illustrate this sensitivity, the block model quantities and grade estimates within the constraining pit are presented in Table 14‑18 at linear increases in the cut-off grades for Indicated and Inferred Mineral Resources. The reader is cautioned that Table 14‑18 contains estimates at cut-off grades other than 0.30 g/t Au and should not be misconstrued as a mineral resource. The reported quantities and grades are only presented as a sensitivity of the resource model to the selection of cut-off grade. Mineral resources are not mineral reserves and do not have demonstrate economic viability.
Resource Development Associates Inc.
Effective Date July 24, 2023
GoldMining Inc. NI 43-101 Report – La Mina Project | Page 218 |
Table 14‑18 Pit Constrained Sensitivity Estimates for the La Mina Project (La Cantera, Middle Zone and La Garrucha Combined)
Cut-off | Metric | Grades | Contained Metal |
Grade (g/t Au) | Tonnes (‘000) | Au (g/t) | Ag (g/t) | Cu (%) | AuEq (g/t) | Au (oz) | Ag (oz) | Cu (lbs, ‘000) | AuEq (oz) |
Indicated Resources |
0.20 | 45,141 | 0.61 | 1.87 | 0.19 | 0.90 | 886,547 | 2,706,971 | 186,737 | 1,304,443 |
0.25 | 38,662 | 0.67 | 1.98 | 0.20 | 0.98 | 835,602 | 2,467,306 | 171,994 | 1,220,186 |
0.30 | 33,772 | 0.73 | 2.08 | 0.21 | 1.06 | 793,550 | 2,254,504 | 159,407 | 1,149,591 |
0.35 | 29,447 | 0.79 | 2.17 | 0.23 | 1.14 | 748,335 | 2,051,121 | 147,398 | 1,077,139 |
0.40 | 25,909 | 0.85 | 2.26 | 0.24 | 1.22 | 710,025 | 1,879,185 | 136,300 | 1,013,856 |
Inferred Resources |
0.20 | 75,611 | 0.49 | 2.16 | 0.12 | 0.69 | 1,202,592 | 5,241,411 | 202,720 | 1,684,703 |
0.25 | 64,393 | 0.55 | 2.26 | 0.13 | 0.76 | 1,129,692 | 4,670,368 | 185,922 | 1,570,166 |
0.30 | 56,231 | 0.58 | 2.32 | 0.14 | 0.80 | 1,049,348 | 4,188,126 | 171,429 | 1,454,025 |
0.35 | 47,630 | 0.63 | 2.38 | 0.15 | 0.87 | 965,706 | 3,644,661 | 154,536 | 1,328,890 |
0.40 | 39,971 | 0.67 | 2.43 | 0.15 | 0.92 | 867,345 | 3,125,262 | 136,011 | 1,185,974 |
Mineral Resources are not Mineral Reserves and do not have demonstrated economic viability. There is no certainty that Mineral Resources will be converted to Mineral Reserves.
Table 14‑19 Total Indicated and Inferred Resources for La Mina Project
(Cut-off Grade 0.30 g/t Au) Effective Date December 20, 2022, Qualified Person Scott Wilson
| Metric | Grades | Contained Metal |
| Deposit | Tonnes (‘000) | Au (g/t) | Ag (g/t) | Cu (%) | AuEq (g/t) | Au (oz) | Ag (oz) | Cu (lbs, ‘000) | AuEq (oz) |
Indicated Resources |
La Cantera | 17,614 | 0.86 | 2.03 | 0.31 | 1.33 | 487,009 | 1,149,569 | 120,460 | 753,166 |
La Garrucha | 7,358 | 0.65 | 3.14 | 0.11 | 0.85 | 153,764 | 742,797 | 17,762 | 201,076 |
Middle Zone | 8,800 | 0.54 | 1.28 | 0.11 | 0.71 | 152,777 | 362,138 | 21,185 | 200,873 |
Total | 33,772 | 0.73 | 2.08 | 0.21 | 1.06 | 793,550 | 2,254,504 | 159,407 | 1,149,591 |
Inferred Resources |
La Cantera | 11,175 | 0.71 | 1.85 | 0.30 | 1.15 | 255,086 | 664,661 | 72,709 | 413,168 |
La Garrucha | 44,107 | 0.55 | 2.46 | 0.10 | 0.72 | 779,922 | 3,488,379 | 96,846 | 1,020,989 |
Middle Zone | 949 | 0.47 | 1.15 | 0.09 | 0.62 | 14,340 | 35,087 | 1,873 | 18,916 |
Total | 56,231 | 0.58 | 2.32 | 0.14 | 0.80 | 1,049,348 | 4,188,126 | 171,429 | 1,454,025 |
Mineral Resources are not Mineral Reserves and do not have demonstrated economic viability. There is no certainty that Mineral Resources will be converted to Mineral Reserves.
Resource Development Associates Inc.
Effective Date July 24, 2023
GoldMining Inc. NI 43-101 Report – La Mina Project | Page 219 |
15 | MINERAL RESERVE ESTIMATES |
There are no mineral reserves categorized for the La Mina Project.
Resource Development Associates Inc.
Effective Date July 24, 2023
GoldMining Inc. NI 43-101 Report – La Mina Project | Page 220 |
This PEA evaluates conventional surface mining methods using surface drill and blast techniques with off-highway haul trucks and front-end loaders to be appropriate for the La Mina Project.
This PEA is preliminary in nature and is based on technical and economic assumptions which will be evaluated in more advanced studies. The PEA includes all resources areas of the Project; La Cantera, Middle Zone, and La Garrucha. Each pit includes Inferred Mineral Resource that are considered too speculative geologically to have the economic considerations applied to them that would enable them to be categorized as mineral reserves. Therefore, there is no certainty that the PEA will be realized. The basis for the PEA is to demonstrate the economic viability of the La Mina Project. The PEA results are only intended as an initial, first pass review of the potential project economics based on preliminary information. There are no advanced studies on the project that would be impacted by the PEA.
16.1 | GEOTECHNICAL AND HYDROLOGICAL CONSIDERATIONS |
No site-specific geotechnical or hydrological studies have been undertaken at the La Mina Project. For pit shell design, an overall pit slope angle of 47.5 degrees was used.
Pit optimization was performed with GEOVIA WhittleTM software which uses the Lerchs-Grossman algorithm to create a series of nested revenue factor pit shells. Table 16‑1 outlines the parameters used in Whittle for the analysis. These parameters were applied to all pit areas.
Table 16‑1 Whittle Parameters
Whittle Input | Units | Value |
Overall Pit Slope Angle | Degrees | 47.5 |
Mining Cost | $USD | 1.90 |
Processing Cost | $USD | 10.30 |
Royalty | % | 6 |
G&A | $USD | 1.00 |
Metal Prices: | | |
Au | $USD/oz | 1,750 |
Ag | $USD/oz | 21.00 |
Cu | $USD/lb | 3.50 |
Metallurgical Recovery: | | |
Au | % | 91 |
Ag | % | 64 |
Cu | % | 80 |
Cut-off Grade | g/t Au | 0.35 |
Mining Recovery | % | 95 |
Dilution | % | 5 |
16.3 | PRE-STRIPPING REQUIREMENTS |
An initial 12-month stripping campaign is required and scheduled in year -1 before mining starts and while the site infrastructure is under construction. The initial stripping phases for each pit will require different sized equipment than production mining due to the steep terrain. It was assumed a contractor would be utilized for this work. The contractor pre-stripping will continue into years 1 and 2 of mine production and will be concurrent with owner-operated mining operations. All 3 pit areas will require a separate degree of stripping that needs to be conducted by the contractor. Once a bench has reached a workable width for the selected owner’s-fleet, the bench will be mined by the owner. No mineralized material is located within the stripping benches.
Resource Development Associates Inc.
Effective Date July 24, 2023
GoldMining Inc. NI 43-101 Report – La Mina Project | Page 221 |
16.4 | MINE PRODUCTION SCHEDULE |
The mine production schedule was created using a Microsoft Excel scheduling spreadsheet. It was based on the bench output within selected Whittle pit shells that were generated and used as phases for scheduling each pit. No crest/toe pit designs with haul roads were created for interim phases nor ultimate pits. This method of mine production scheduling is adequate for a preliminary technical report to provide the initial viability of an economic mine schedule. Detailed mine designs incorporating haul roads for each phase of each pit will provide a more attainable mine production schedule.
After the initial 12-month stripping campaign, production mining begins at a rate of 104 k tonnes per day, delivering and sustaining 15 k tonnes per day of mineralized material to the process plant for 11.2 years. Life-of-mine annual material movement from the La Cantera, Middle Zone and La Garrucha pits is outlined in Table 16‑2 and Table 16‑3 shown below in Figure 16‑1.
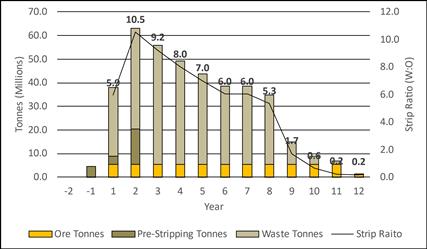
Figure 16‑1 Graph of Yearly Mine Schedule and Strip Ratio
The La Cantera pit contains the highest-grade material and is located closest to the processing plant, making it the most ideal location to start mining. Middle Zone is also within close proximity of the plant and has the lowest strip ratio and was scheduled to be mined concurrently with the La Cantera pit. Despite the lower grade material in Middle Zone, it is mined earlier in the mine plan so that when finished, Middle Zone can be backed filled as a waste rock storage facility. La Garrucha is farthest from the plant and has a high strip ratio. Because of this, it starts later to allow more time for contractor and owner stripping. Figure 16‑2 below shows mineralized material delivered to the processing plant by year and by source pit.
Resource Development Associates Inc.
Effective Date July 24, 2023
GoldMining Inc. NI 43-101 Report – La Mina Project | Page 222 |
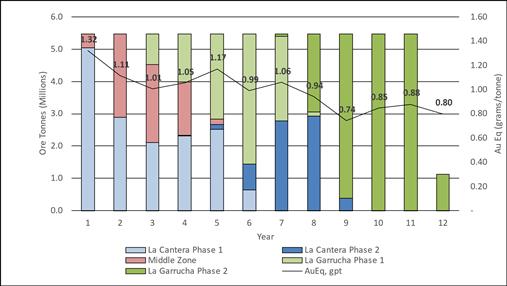
Figure 16‑2 Graph of Yearly Mill Feed by Pit and Head Grade
Table 16‑4 outlines the expected annual process plant head grades and contained metal quantities to be delivered to the process plant. Table 16‑5 outlines the breakdown of the mineral resource contained within the mine plan.
Table 16‑2 Mine Schedule including Stripping.
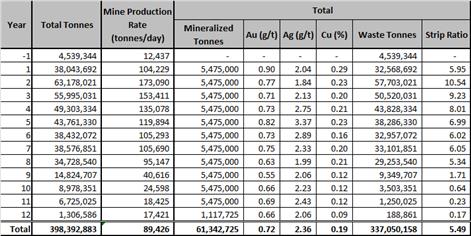
Resource Development Associates Inc.
Effective Date July 24, 2023
GoldMining Inc. NI 43-101 Report – La Mina Project | Page 223 |
Table 16‑3 Mine Schedule and Annual Mill Feed Grades by Pit
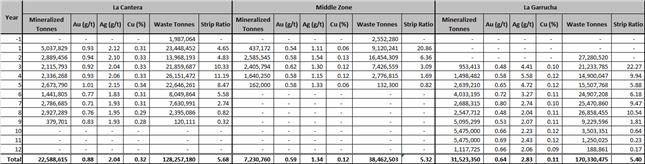
Table 16‑4 Mill Feed
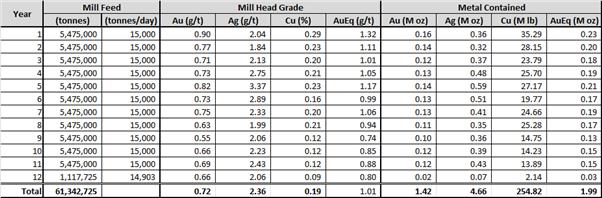
Resource Development Associates Inc.
Effective Date July 24, 2023
GoldMining Inc. NI 43-101 Report – La Mina Project | Page 224 |
Table 16‑5 Breakdown of Resource Classification within the Mine Plan
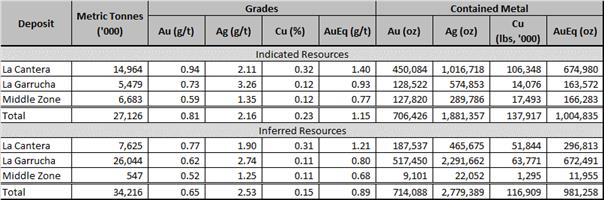
Resource Development Associates Inc.
Effective Date July 24, 2023
GoldMining Inc. NI 43-101 Report – La Mina Project | Page 225 |
Figure 16‑3 shows the location of the La Cantera, Middle Zone and La Garrucha Pits and a conceptual layout of the La Mina Project facilities.
Figure 16‑3 Pit Locations and Conceptual Site Layout
16.5.1 | WASTE ROCK STORAGE FACILITIES |
A total of 337 million tonnes of waste rock is contained within the three mineralized pit areas of The Project. The first waste rock storage facility is located east and adjacent to the Middle Zone pit to facilitate short hauls during stripping years. This location is estimated to hold approximately 28 million tonnes.
Most of the waste rock will be stored to the south-west of the mine area in a storage facility estimated to hold approximately 258 million tonnes.
Both the Middle Zone and La Cantera pits will be backfilled with waste from La Garrucha. The Middle Zone pit will be entirely reclaimed with this waste material. A total of 51 million tonnes of waste rock will be back filled into the Middle Zone and La Cantera pits. This represents a total of 15% of waste tonnes being stored in exhausted mine pits.
The Tailing Storage Facility will utilize waste rock from the mine areas and reduce the volume required for the waste rock storage facilities as shown and described.
Resource Development Associates Inc.
Effective Date July 24, 2023
GoldMining Inc. NI 43-101 Report – La Mina Project | Page 226 |
A complete list of mining equipment required for peak mine production is outlined Table 16‑6.
Table 16‑6 Mining Fleet Requirements
Equipment | Size | LOM Quantity |
Front-End Wheeled Loader | 1.91 m3 bucket | 3 |
Haul Truck | 139 tonnes | 18 |
Rotary Crawler Drill | 17 cm hole, 12.2 m rod length, 27 kg pulldown, 142.5 cm, 350 psi compressor | 4 |
Track Dozer | 4.9 m blade width, 70,000 kg weight | 3 |
Motor Grader | 7.3 m blade width | 2 |
Water Truck | 34,000 liters | 2 |
Skid Steer | 975 kg lift capacity | 2 |
Bulk ANFO Truck | Emulsion loader with 9,378 kg hopper capacity | 2 |
Light Plants | Diesel 9.14 m tower, 13.6 Hp engine, 1,000 watt | 6 |
Light Duty Pickup | 1 ton automatic, crew cab, heavy duty | 12 |
Field Service Truck | 14,969 kg GVWR chassis with 3,900 kg capacity hydraulic crane with 6.1 m maximum reach | 4 |
Field Lube Truck | 568 L diesel fuel capacity and 3 - 379 L oil delivery systems | 3 |
Off-Road Tire Truck | 14,969 kg GVWR chassis | 2 |
16.6.1 | DRILLING AND BLASTING |
Once the mine operation is in full production in year 1, it is estimated all material will be drilled and blasted prior to loading into haul trucks. A 5.5 meter square pattern was estimated as appropriate for the given rock type. The drill and blast parameters outlined in Table 16‑7 were used to determine the size and quantity of the blast hole drills required. Four (4) rotary crawler drills were selected, each having a 12.2 meter rod length with down-the-hole hammers with a 27,216 kg pulldown rating and a 42.5 cmm compressor.
Resource Development Associates Inc.
Effective Date July 24, 2023
GoldMining Inc. NI 43-101 Report – La Mina Project | Page 227 |
Table 16‑7 Drill and Blast Parameters
Parameter | Units | Value |
Rock Density | t/m3 | 2.65 |
Bench Height | m | 10 |
Sub Drill | m | 0.8 |
Hole Space (square) | m | 5.5 |
Height of Stemming | m | 3.5 |
Hole Diameter | cm | 17.1 |
Powder Factor | kg/tonne | 0.17 |
Powder Factor | kg/bcm | 0.45 |
Drill Penetration Rate | m/hr | 45 |
16.6.2 | LOADING AND HAULING |
Preliminary mining fleet requirements are based on material haul routes and cycle times. Haul distances and grades were estimated for every fourth bench within each pit phase and loaded into RPM Global’s Talpac™ software to calculate haul cycle times for each material type and destination. Travel times between every fourth bench were interpreted. These cycle times were used against the mine production profile to determine the loading and hauling fleet required to meet the plan. Because haul cycle times are always changing throughout the mine life, the equipment fleet was maximized and kept steady while material movement fluctuated to fully utilize the peak fleet.
The mining fleet is expected to utilize three (3), 19.1 cubic meter front-end wheeled loaders. These will load eighteen (18) 139 tonne capacity haul trucks at the peak of mine production. As the pits deepen and haul distances extend, the number of haul trucks required increases. In later years, as the strip ratio decreases and fewer tonnes are mined, the requirement for haul trucks relaxes. Figure 16‑4 outlines the number of haul trucks, loaders and blast hole drills required for each year of the mine life while producing mineralized material for the process plant.
Resource Development Associates Inc.
Effective Date July 24, 2023
GoldMining Inc. NI 43-101 Report – La Mina Project | Page 228 |
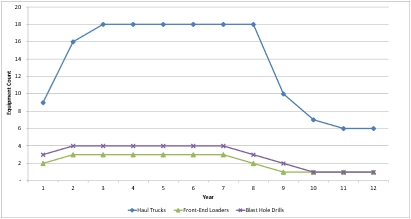
Figure 16‑4 Equipment Requirements by Year
Equipment to support production mining activities is included in Table 16‑6. During peak production years, two water trucks are anticipated to mitigate dust on haul roads during dry periods. Two road motor graders are anticipated to maintain haul roads within the pit and throughout the operating site. Two skid steers are anticipated to aid in blasting operations and general use at site. Twelve light duty trucks are anticipated for multi-purpose use throughout the open pit operations and waste storage facility locations.
Resource Development Associates Inc.
Effective Date July 24, 2023
GoldMining Inc. NI 43-101 Report – La Mina Project | Page 229 |
The PEA for the Project considers mining and milling of mineralization from La Cantera, and Middle Zone and La Garrucha zones.
It is proposed that mineralized material from the La Cantera and the Middle Zone open pits will be processed in a 15,000 tonnes per day (“tpd”) conventional concentrator to produce a copper concentrate with gold as a by-product. The unit processes are described as follows:
| | ● | Crushing and grinding to liberate minerals from the ore |
| | ● | Froth flotation to recover most of the copper bearing minerals together with most of the gold into a high-grade copper/gold concentrate. |
| | ● | Cyanide leaching and gold adsorption/desorption circuit to extract most of the gold from the flotation tailings streams onto activated carbon, which is then stripped into an alkali solution and electrowon into gold sludge and smelted into gold doré. The stripped carbon is recycled back to the leach circuit. |
| | ● | Cyanide destruction of residual cyanide in the leach tails. |
| | ● | Facilities to pump tailings to the tailings storage facility (“TSF”) and to pump reclaim water from the TSF to the plant for the process. |
| | ● | Concentrate dewatering, materials handling and storage facilities. |
A process schematic diagram is provided in Figure 17‑1.
Resource Development Associates Inc.
Effective Date July 24, 2023
GoldMining Inc. NI 43-101 Report – La Mina Project | Page 230 |
Figure 17‑1 Process Flow Schematic
The conceptual design is based on the limited data from the preliminary metallurgical test work in conjunction with general industry experience. No preliminary equipment sizing, except for the grinding mills has been undertaken. No general layouts of the process plant or quantity estimates have been generated.
17.2 | OPERATING SCHEDULE AND AVAILABILITY |
The processing plant is planned to operate 24 hours per day at a nominal throughput rate of 15,000 tpd and overall circuit availability of 92%.
17.3 | PROCESSING FACILITIES |
This section describes the equipment and processes typical of a conventional concentrator and cyanide leach plant, as proposed for the La Mina process plant.
17.3.1 | PRIMARY CRUSHING AND COARSE ORE STOCKPILE |
A conventional gyratory crusher facility will be designed to crush run-of-mine (ROM) material to reduce the incoming feed material from the open pits to an appropriate feed size for the SAG mill.
Haul trucks from the mine will deposit ROM material into the ROM feed hopper, feeding the gyratory crusher, where it’ll be crushed to a nominal size of 150 mm and discharged onto the crushed material stockpile.
Resource Development Associates Inc.
Effective Date July 24, 2023
GoldMining Inc. NI 43-101 Report – La Mina Project | Page 231 |
The grinding circuit will further reduce the size of the crushed material to the particle size required for the flotation process. The proposed grinding circuit will consist of a SAG mill followed by a ball mill in a series configuration. The ball mill will operate in closed circuit with classifying cyclones. The grinding circuit has the following main units:
| | ● | SAG mill (9.8 m diameter x 3 m long, 5.0 MW |
| | ● | Ball mill (7.3 m diameter × 7.9 m long, 7.5 MW |
| | ● | Cyclone feed slurry pumps |
| | ● | Classification cyclone cluster |
The SAG mill will be fed at a controlled rate from the crushed material stockpile. SAG mill product will discharge to a vibrating screen. The screen oversize will be further crushed in a pebble crusher and the product returned to the SAG feed. Screen undersize material will report to the mill discharge sump where it will be pumped to the classifying cyclone cluster. Cyclone undersize will report as feed to the ball mill, and mill discharge will flow to the mill discharge sump where dilution water will be added as required to adjust the slurry density as required for the cyclone classification duty.
Lime will be added as required to the mill sump to adjust the pH of the slurry in the grinding circuit prior to the flotation process. Grinding media are charged into the SAG and ball mills to maintain the grinding efficiency.
17.3.3 | FLOTATION AND REGRIND |
The major equipment in this unit process area includes:
| | ● | Rougher scavenger flotation cells |
| | ● | Cleaner flotation column cells |
| | ● | Regrind mill (vertical, 1,250 kW) |
Grinding cyclone overflow from the ball mills will report to the rougher flotation cells. It is envisioned that one bank of 120 m3 tank cells will provide sufficient residence time. Frother and collector may be added to individual cells at the first and sixth cells. Tailings from the rougher bank will report to the rougher scavenger flotation circuit and will be combined with cleaner tails for further recovery.
Rougher concentrate, approximately 8% - 12% of the flotation feed flow, will be reground to a nominal size of about 30 μm to further liberate the minerals of value from gangue. The combined concentrate from the rougher and rougher scavenger flotation banks will be pumped to cyclones. Cyclone overflow from the cluster will be pumped to the first cleaner feed distributor and cyclone underflow will be fed to a vertical regrind mill.
The reground concentrate will be cleaned in one stage of mechanical flotation cells and one stage of flotation columns. In the cleaner circuit, the pH will be elevated to reject pyrite by adding lime to the regrind mills and the first mechanical cells. Provisions will be made for adding frother and collector throughout the circuit.
Resource Development Associates Inc.
Effective Date July 24, 2023
GoldMining Inc. NI 43-101 Report – La Mina Project | Page 232 |
The regrind cyclone overflow will be pumped to a distributor that splits the flow between a bank of 30 m3 tank cells, which constitute the first cleaners. The first cleaners will also have about 30 minutes of residence time and will be pulled moderately hard to achieve recovery in the cleaner circuit. Cleaner tails will be pumped to the rougher scavenger circuit to allow for additional time for copper and gold mineral collection.
Concentrates from the first cleaner banks will be combined and upgraded in a second bank of cleaners. The second stage of cleaning consists of a series of column cells in parallel. The second cleaner tails will be pumped together with the first cleaner tails to the rougher scavenger circuit.
The concentrate will be approximately 23% - 26% Cu with an average gold grade of approx. 60 g/t - 90 g/t and silver grade of approximately 150 g/t - 200 g/t, depending on the grade of gold and silver in the mineralized material feed. Future metallurgical design should investigate the potential for direct flotation reactors in the cleaner circuit, for the potential to increase final concentrate grade and recoveries.
17.3.4 | COPPER CONCENTRATE THICKENING, FILTRATION AND HANDLING |
Copper concentrate from the second cleaner columns will be thickened and then filtered in a pressure filter, to generate a product at roughly 8% moisture, suitable for transport. Thickener overflow water will be returned to the process water tank for re-use in the process.
17.3.5 | CYANIDE LEACH, GOLD ADSORPTION, STRIPPING AND CARBON HANDLING. |
The major equipment in this unit process area includes:
| | ● | Carbon in leach (CIL) tanks, 14 m diameter x 14 m high |
| | ● | Carbon strip vessels, 6 tonne each |
| | ● | Carbon regeneration kiln, 14 tpd |
| | ● | Cyanide detoxification tanks |
Rougher and cleaner tailings streams will be pumped to the CIL plant, comprised of ten mechanically agitated tanks. The first two tanks will be supplied with air or oxygen to pre-aerate the slurry, reducing potential cyanide consuming agents. Activated carbon will be present in the following eight CIL tanks. Carbon and slurry flow countercurrent in the CIL tank train. Loaded carbon will be pumped to one of two strip vessels, acid washed to remove scale build up and the metals stripped in a hot alkaline solution, which will be pumped through electrowinning cells and the metals precipitated as a sludge. The high-grade sludge will be dried and smelted to produce gold/silver doré bullion.
The stripped carbon will be thermally regenerated in a rotary kiln and recycled back to the first CIL tank.
The CIL tails will be pumped to the cyanide detoxification tanks, to reduce the residual cyanide levels to acceptable limits and the treated plant tailings will be pumped to the lined tailings storage facility (TSF).
17.5 | REAGENT HANDLING AND STORAGE |
Various chemical reagents will be added to the process in order to facilitate processing, and the subsequent settling of the solids in the thickeners. These include:
Resource Development Associates Inc.
Effective Date July 24, 2023
GoldMining Inc. NI 43-101 Report – La Mina Project | Page 233 |
17.6 | PROCESS PLANT SERVICE SYSTEMS |
The process service systems required will include:
| | ● | Process water, made up largely of recycled water from the TSF and from in-plant thickeners |
| | ● | Compressed air, for some services and instrumentation |
Resource Development Associates Inc.
Effective Date July 24, 2023
GoldMining Inc. NI 43-101 Report – La Mina Project | Page 234 |
The La Mina Project is well situated in terms of access to regional highways for both north and south conveyance. Highway 25 connects major transportation hubs in the north and south of the country, and nearby local roads have good access to the highway. The roughly 11 km of off-highway roads needed to access the mine site will require some expansion and drainage improvements to allow heavy machinery and equipment to reliably pass, but nothing exceptional. Road transport of goods is the primary method of delivery accounting for more than seventy percent of material transport in Colombia.
Rail service is not the prime carrier in Colombia but offers benefits in pricing. Rail only transports around twenty-five percent of all national goods. Given the rail access available from the nearest industrial city of Medellin northward to the ports of Santa Marta and Cartagena, bimodal transport may prove profitable depending on the location of the copper concentrate smelter. In the south only the city of Cali is connected to its nearby port of Buenaventura by rail. If northbound rail service from nearby the mine is desired, decommissioned railway tracks lay within 20 km and while repairs would be required, it may result in cost savings over time.
Favorable investment conditions have enabled electricity generation to keep up with demand and avoid any major blackouts since 1991. Despite these improvements, electricity transmission lines still do not reach some geographically isolated areas of the country. For the La Mina Project, due to its proximity to Medellin, electrical power should not be an issue. Most of the generated power is produced from hydroelectric plants with most of the rest coming from biomass oxidation. The La Mina Project lies within a few dozen kilometers of a 200 kV power substation, of which its additional output capacity is unknown. Local backup power generation would be advisable.
Colombia has some reserves of natural gas and coal which are exported. A nearby gas pipeline may be welcome for the generation of power, should auxiliary power be required. However, coal delivery may prove problematic without nearby rail service.
Unskilled labor is available in the area, though with an overall unemployment rate around ten percent it may be difficult to attract higher skilled workers. Locally, there exists a reasonably large class of high school educated locals. Artisanal miners may provide a more skilled workforce with some exposure to the mining process and methods at a reasonable cost.
Water at the site is plentiful with access to seasonal and year-round streams. On site wells should also produce exceptionally depending on location. Normal water requirements for a typical copper concentrator are 1 cubic meter per tonne treated (this includes recycle from the tailings pond). In the project area, there are no reasons for water supply challenges but it is recommended to be studied further.
Previous and planned exploration operations have acquired water from the aqueduct that supplies water to the La Mina Project. The amount used is minimal (0.27% of the current flow rate) during the rainy season. However, the use of water from this source during the dry season may cause conflicts with the La Mina community. A complete water resources study (surface and groundwater) should be completed over several years to provide baseline information that will allow the Company to make sound judgments on water acquisition and to provide a basis for determining potential impacts and defending the project from frivolous damage claims.
Resource Development Associates Inc.
Effective Date July 24, 2023
GoldMining Inc. NI 43-101 Report – La Mina Project | Page 235 |
Colombia, especially the Medellin area has made great strides in the protection of industry and persons since the 1980s. However, local narcotics forces still endanger commerce to some degree. Measures should be taken against non-governmental actions to avoid such inconveniences, such as disruptions to transport of concentrate and electrical power for the La Mina Project.
Overburden, soils and barren rock to be stored in close proximity to the open pits.
The conceptual plan for the TSF is based on a total of 61.3 million tonnes of tailings deposited at a rate of 5.5 Mt per year. A preliminary review of the topographical map indicated a location for the TSF in the southwestern portion of the property.
No geotechnical or hydrological testing, evaluations or design have been undertaken to date.
The containment dam would be built employing an initial starter dam with successive height increases constructed in a downstream configuration. The starter dam would be composed of local low permeability soils; the design would include a drainage system and, if appropriate, a liner on the upstream slope. The successive raises would be constructed of the coarse sand underflow portion from thickened tailings slurry compacted to a satisfactory density, provided sufficient coarse materials were generated in the processing operations. Otherwise, the additional raises could be composed of suitable mine waste rock (i.e. if the rock is not Potentially Acid Generating – “PAG”). If it is considered PAG, then materials, from a nearby quarry or borrow source could be used.
Foundation preparation would require the removal of vegetation, topsoil and unsuitable material excavation to expose a suitably competent foundation to support the TSF embankment and basin. Excavation depths of topsoil and unsuitable materials would be estimated based on the results of the geological and geotechnical investigations. The topsoil would be stockpiled separately for future reclamation purposes, while unsuitable materials would be disposed of in appropriate places.
A tailings deposition plan would likely consist of multiple deposition points from the crest of the TSF, with frequent rotation of the active points to build the deposit in thin layers and to locate the pond away from the embankment structure. The supernatant water recovery would be by barge pump configuration.
Resource Development Associates Inc.
Effective Date July 24, 2023
GoldMining Inc. NI 43-101 Report – La Mina Project | Page 236 |
19 | MARKET STUDIES AND CONTRACTS |
No market studies have been undertaken for the La Mina Project at this time, and no contracts have been discussed for the sale of the copper concentrate with gold by-products which may be produced at the La Mina Project.
Resource Development Associates Inc.
Effective Date July 24, 2023
GoldMining Inc. NI 43-101 Report – La Mina Project | Page 237 |
20 | ENVIRONMENTAL STUDIES, PERMITTING AND SOCIAL OR COMMUNITY |
The La Mina Project intends to comply with applicable environmental and social regulatory requirements of the Colombian and Regional regulatory agencies and with international standards as dictated by the Equator Principles, International Finance Corporation Principles, Performance Standards and Guidelines, and the World Bank Guidelines. The development of an Environmental and Social Impact Assessment (ESIA) will be required by the government of Colombia to acquire a mining operation permit and by Western Lenders as part of their requirements to provide support for project development.
The ESIA should include a baseline assessment of the site, expected impacts due to Project activities, mitigation actions required to prevent environmental and social impacts, and monitoring programs to determine the success of mitigations. Development and implementation of detailed environmental and social management plans will be required to address construction, operations, closure and post-closure periods of the Project. Closure and post-closure management plans should include appropriate maintenance and continued monitoring of the site, pollution emissions and potential impacts. The duration of monitoring and subsequent mitigations (if required) will be extended through the post-closure period, which should be defined on a risk basis with typical periods requiring a minimum of 5 years after closure or longer.
Resource Development Associates Inc.
Effective Date July 24, 2023
GoldMining Inc. NI 43-101 Report – La Mina Project | Page 238 |
21 | CAPITAL AND OPERATING COSTS |
Capital and operating costs were developed using information available from CostMine cost data service for 2021 by InfoMine USA, Inc. Costs were escalated to reflect 2023 estimated prices given recent inflation. Additionally, all available project technical data and metallurgical process related test work were considered to build up the on-site unit operating cost estimate.
Cost accuracy is estimated to be plus or minus 30% in the opinions of the Authors.
21.1 | INITIAL CAPITAL COST ESTIMATE |
Initial capital costs are assumed to be incurred in years -2 and -1 of the project when process facilities are constructed, the site is under development, and pre-stripping activities are underway. Initial Capital Costs are outlined in Table 21‑1.
Table 21‑1 Initial Capital Costs
Description | Initial Capital Cost
(USD$ M) |
Pre-Stripping Contractor, Year -1 | 10.0 |
Processing Plant, Direct | 200.5 |
Processing Plant Indirect (32%) | 74.2 |
Site Infrastructure | 65.0 |
Tailing Storage Facility | 6.0 |
Owner’s Cost & Contingency (20%)(1) | 69.1 |
Total Initial Capital | 424.8 |
| (1) Pre-Stripping Initial Capital Costs were not included in the 20% calculation for Owner’s Cost and Contingency. |
The cost of the pre-stripping activities was determined by estimating the cost of operations for such activities with appropriately sized equipment and crews, including drilling, blasting, loading, hauling and support activities plus equipment maintenance. A unit cost was estimated and a 30% premium was added to accommodate for contracting these activities, as the equipment required, and pace of activities will differ from main production mining. This is mainly attributed to the steep terrain of the initial topography. Contractor pre-stripping activities are necessary during years -1, 1 and 2. The cost buildup for pre-stripping activities is outlined in Table 21‑2.
Resource Development Associates Inc.
Effective Date July 24, 2023
GoldMining Inc. NI 43-101 Report – La Mina Project | Page 239 |
Table 21‑2 Pre-Stripping Initial Capital Costs
Description | Units | Total |
Waste Material | Mt | 23.0 |
Average Material Movement Rate | Tonnes/Day | 62.9k |
Estimated Unit Cost | $/Tonne | $1.69 |
Contractor Premium | % | 30% |
Contractor Unit Cost | $/Tonnes | $2.20 |
Mobilization | USD$ M | $2.0 |
Total Contractor Cost | USD$ M | $50.5 |
21.1.2 | PROCESSING PLANT INITIAL CAPITAL |
| | ● | A capital estimate for the 15,000 tpd process plant was made based on an evaluation of the following data |
| | ● | Process flowsheet for a conventional copper concentrator, based on the flowsheet as shown in Figure 17‑1 |
| | ● | Estimates from other projects with similar process unit operations, scaled to reflect the capacity of La Mina and adjusted for inflation |
| | ● | Current budgetary pricing for the major grinding equipment |
| | ● | Grinding hardness data from the preliminary metallurgical test work |
No engineering, flowsheet design, complete mass balance, equipment sizing (except the mills), quantity take-offs or layout design has been done to support this estimate and it should be considered very preliminary at this stage. This estimate does not include costs for the tailings dam or ancillary infrastructure e.g., offices, warehouses etc.
The estimate is broken out into direct and indirect costs. Direct costs pertain to the permanent equipment, materials and labor associated with the physical construction of the facilities. Indirect costs encompass all other costs associated with implementation of the plant and incurred by the owner, engineer or consultants in the design, procurement, construction, and commissioning of the La Mina Project.
Total direct costs for the process plant, incorporating ore handling and crushing, grinding and classification, flotation, regrinding and copper concentrate filtration, were evaluated as a percentage of the cost of the primary grinding equipment and by applying factors derived from historical project data, for the major process areas.
Indirect costs were estimated at 32% of direct costs and an overall contingency of 20% was applied to both the total direct and indirect cost estimates.
The initial capital estimate for the process plant is summarized in Table 21‑3.
Resource Development Associates Inc.
Effective Date July 24, 2023
GoldMining Inc. NI 43-101 Report – La Mina Project | Page 240 |
Table 21‑3 Processing Plant Initial Capital
Process Area | Initial Capex (USD$ M) |
Primary crushing and stockpile | 33.1 |
Process plant general | 12.4 |
Primary/secondary grinding | 48.2 |
Regrind and flotation | 33.5 |
Leach | 15.2 |
Strip, regeneration, gold room | 15.9 |
Detox, tailings dewatering | 17.8 |
Reagents and services | 13.4 |
Concentrate dewatering/handling | 6.9 |
Tailings/water pumps and pipelines | 4.1 |
| | |
Total directs | 200.5 |
Indirects and Owner's costs | 74.2 |
Total directs + indirects | 274.7 |
Contingency | 54.9 |
Total process plant | 329.6 |
21.2 | SUSTAINING CAPITAL COST ESTIMATE |
Sustaining capital cost estimates include all capital costs that would be incurred years 1 through year 11, and mine closure in year 12. Total sustaining capital cost estimates are summarized in Table 21‑4.
Table 21‑4 Total Sustaining Capital
Description | Sustaining Capital Cost
(USD$ M) |
Contractor Stripping | 40.5 |
Mining Equipment (1) | 65.4 |
Mining Operations | 32.7 |
Processing Operations | 5.0 |
Tailing Storage Facility (1) | 5.6 |
Contingency (1) | 14.2 |
Mine Closure | 39.8 |
Total Sustaining Capital | 203.2 |
| (1) Contingency is based on mining equipment and tailing storage facility. |
Resource Development Associates Inc.
Effective Date July 24, 2023
GoldMining Inc. NI 43-101 Report – La Mina Project | Page 241 |
For mining operations, all mining equipment will be purchased new and be ready for commissioning at the beginning of year 1. Mining sustaining capital consists of all the mining equipment fleet and capital cost to maintain the fleet and mining operations. All mining equipment capital was categorized as sustaining since it is required in year 1. Detail of the capital cost for the mining equipment fleet is outlined in Table 21‑5.
Table 21‑5 Mining Equipment Capital Costs
Equipment | LOM Quantity | Total Capital Cost
(USD$ Thousands) |
Front-End Wheeled Loader (19.1m Bucket) | 3 | 7,983 |
Haul Truck (139 Tonne) | 18 | 29,040 |
Rotary Crawler Drill | 4 | 9,766 |
Dozer | 3 | 5,628 |
Motor Grader | 2 | 4,503 |
Water Truck | 2 | 6,012 |
Skid Steer | 2 | 130 |
Bulk ANFO Truck | 2 | 746 |
Light Plants | 6 | 129 |
Light Duty Pickups | 12 | 699 |
Field Service Truck | 4 | 337 |
Field Lube Truck | 3 | 302 |
Off-Road Tire Truck | 2 | 169 |
Total | | 65,443 |
Contingency (20%) | | 13,089 |
Total Mining Fleet Cost with Contingency | | 78,532 |
The estimated mining operation sustaining cost was based on a unit cost of $0.10 USD/tonne mined starting in year 2. A unit cost of $0.05 USD/tonne was used for the last three years of mining, as spare equipment would be available versus sustaining the entire fleet. The total is USD$ 32.7 million over the life of the mine. Table 21‑6 outlines the total mining operational sustaining costs.
Resource Development Associates Inc.
Effective Date July 24, 2023
GoldMining Inc. NI 43-101 Report – La Mina Project | Page 242 |
Table 21‑6 Mining Operational Sustaining Capital Costs
Description | Sustaining Capital Cost
(USD$ M) |
Mining Equipment Fleet | 65.4 |
Mining Equipment Fleet Contingency (20%) | 13.1 |
Mining Operational Sustaining Capital | 32.7 |
Total Mine Operations | 111.2 |
For the process plant, annual sustaining capital costs were estimated at US$ 0.5 million per annum to cover the cost of replacement and upgrades of equipment and control systems throughout the life of the project, starting in year 2 of operations. This totals USD$ 5 million of the life of the mine. No contingency was applied to this cost.
Mine closure costs were estimated based on US$ 0.10 /tonne of material mined, including material stripping in the stripping campaign. The total for mine closure totals US$ 39.84 million and was applied in year 12 after mining activities have completed.
21.3 | MINING OPERATING COST |
Mine operating costs were built up from first principles based on the annual mine plan developed for the preliminary economic assessment. The costs considered production physicals, assumed equipment productivities, consumables and operating maintenance and associated labor for production and supporting activities. Table 22‑7 outlines the life-of-mine peak labor requirements and average unit cost for each mine activity category. For financial analysis, yearly labor and unit calculated costs were used.
Table 21‑7 Mining Peak Labor Headcount and Average LOM Operating Cost Summary
Mine Activity | Peak Labor Headcount | LOM Average Unit Cost
(USD$/Tonne Mined) |
Drilling | 16 | 0.12 |
Blasting | 10 | 0.37 |
Loading | 12 | 0.11 |
Hauling | 72 | 0.71 |
Mine Support | 33 | 0.28 |
Maintenance | 25 | 0.23 |
Technical Services | 17 | 0.12 |
Total | 185 | 1.63 |
Resource Development Associates Inc.
Effective Date July 24, 2023
GoldMining Inc. NI 43-101 Report – La Mina Project | Page 243 |
21.4 | PROCESSING OPERATING COST |
Process plant operating costs were estimated using the following cost categories: power, labor, reagents, wear parts, spare parts, and other costs. The breakdown of processing operating costs by category is summarized in Table 21‑8.
In general, the process operating cost estimate is based on the following preliminary documentation: preliminary metallurgical test work report, conceptual process schematic, conceptual mass balance, list of reagents and consumables, and a typical staffing plan appropriate to the size of plant.
The operating cost was built up based on typical labor levels, grinding media and reagent consumption and maintenance spares usage typical of flotation and cyanide leach process plants. Power consumption was factored from estimated grinding power and costed at an electrical power cost of 9 c/kWh. Columbian labor rates were provided by GoldMining Inc and a 30% burden was added to account for social costs and benefits. Total operating costs were benchmarked against similar projects and operating mines.
The estimated average annual process operating cost is summarized in Table 21-8.
Table 21‑8 Summary Process Operating Cost Estimate
Description | Annual Cost (USD $000) | Unit Cost (USD $/Tonne Processed) |
Manpower | 9,135 | 1.7 |
Major Consumables | | |
Metal Consumables | 15,386 | 2.8 |
Reagent Consumables | 12,096 | 2.2 |
Supplies | | |
Maintenance Supplies | 3,337 | 0.6 |
Operating Supplies | 1,470 | 0.3 |
Power Supply | 15,151 | 2.8 |
Sub-Total Supplies, including Power | 47,442 | 8.7 |
Total | 56,577 | 10.3 |
General and administrative costs were estimated at 5% the cost of mining and processing costs. This is equal to a life-of-mine average G&A cost was US$ 0.17 per total tonne mined, or US$ 1.01 per tonne processed.
Resource Development Associates Inc.
Effective Date July 24, 2023
GoldMining Inc. NI 43-101 Report – La Mina Project | Page 244 |
This PEA is preliminary in nature, it includes Inferred Mineral Resources that are considered too speculative geologically to have the economic considerations applied to them that would enable them to be categorized as mineral reserves, and there is no certainty that the preliminary economic assessment will be realized. The current basis of the La Mina Project information is not sufficient to convert the in-situ Mineral Resources to Mineral Reserves, and Mineral Resources that are not Mineral Reserves do not have demonstrated economic viability. The PEA results are only intended as an initial, first-pass review of the project economics based on preliminary information.
The economic analysis for the La Mina Project assumed constant 2023 US dollars and was performed on an annual basis beginning at the start of year -2. Construction and pre-stripping activities were assumed to require 2 years prior to delivering mineralized material to the mill. The annual mine plan developed and outlined in Section 16 was used as the main driving force in determining the annual cost for the project. Unit costs outlined in Sections 16 and 17 for mining and processing, respectively, were used in the annual cash flow model to determine the economics of the La Mina Project.
22.1 | KEY PERFORMANCE PARAMETERS |
Table 22‑1 details the key performance parameters and assumptions used in this PEA and the economic analysis for the La Mina Project.
Table 22‑1 La Mina Project Key Parameters and Assumptions
Parameter | Units | Value |
Mineralized Material | M Tonnes | 61.3 |
Strip Ratio (Rejected: Mineralized Material) | Ratio | 5.49 |
Mine Life | Years | 11.2 |
Process Plant Production Rate | Tonne/day | 15,000 |
Contained Metal in Mineralized Material Copper Gold Silver Gold Equivalent | M lb M oz M oz M oz | 254.8 1.4 4.7 2.0 |
Process Plant Feed Grade Copper Gold Silver Gold Equivalent | % g/t g/t g/t | 0.19 0.72 2.36 1.01 |
Process Plant Metal Recoveries Copper Gold Silver | % % % | 80 91 64 |
Process Plant Payable Metal Copper Gold Silver Gold Equivalent | M lb M oz M oz M oz | 195.7 1.3 2.8 1.7 |
Resource Development Associates Inc.
Effective Date July 24, 2023
GoldMining Inc. NI 43-101 Report – La Mina Project | Page 245 |
| Parameter | Units | Value |
Metal Prices Copper Gold Silver | US$/lb US$/oz US$/oz | 3.50 1,750 21.00 |
On-Site Operating Unit Cost | $/t process | 21.26 |
Total Operating Unit Cost | $/t process | 22.50 |
Preproduction Capital | US$ M | 424.8 |
Sustaining Capital, including Closure | US$ M | 203.2 |
Total Capital Costs | US$ M | 620.8 |
Colombian Taxes | % | 30 |
Royalties Copper Gold Silver | % % % | 7 6 6 |
Exploration Deductible | USD $M | 10 |
Tax Loss Carry Forward | USD $M | 7.9 |
Commercial and Transportation Assumptions for Copper Concentrate |
Payable Gold | % | 97 |
Payable Silver | % | 92 |
Payable Copper | % | 96 |
Treatment Charge | US$/t Concentrate | 70 |
Refining Charge – Au | US$/oz | 2.00 |
Refining Charge – Ag | % of Metal Price | 1 |
Refining Charge – Cu | US$/lb | 0.07 |
Copper Concentrate Transportation | | |
Concentrate Trucking and Port | US$/t | 29 |
Concentrate Shipping | US$/t | 45 |
Commercial and Transportation Assumptions for Gold Dore |
Payable Gold | % | 99.5 |
Payable Silver | % | 99.5 |
Refining Charge – Au | US$/oz | 1.00 |
Refining Charge – Ag | % of Metal Price | 50 |
Dore Transportation | US$/oz | 1.00 |
22.2 | TAXES, ROYALTIES AND OTHER INTERESTS |
Tax calculations in the financial model are based on current tax laws in Colombia which are 30%. Payable royalties for the project are outlined in Table 22‑2.
Table 22‑2 Project Royalties
Royalty | Colombia Government GRR | GRC | Total |
Copper | 5% | 2% | 7% |
Gold | 4% | 2% | 6% |
Silver | 4% | 2% | 6% |
Resource Development Associates Inc.
Effective Date July 24, 2023
GoldMining Inc. NI 43-101 Report – La Mina Project | Page 246 |
Table 22‑3 details material and metal quantities on an annual basis for the project. The table also includes the gross revenue based on those results. Table 22‑4 details the project annual cash flow for the project.
The key economic results for the La Mina Project are outlined in Table 22‑5.
Resource Development Associates Inc.
Effective Date July 24, 2023
GoldMining Inc. NI 43-101 Report – La Mina Project | Page 247 |
Table 22‑3 Annual Material Movement, Metal Production and Gross Revenue
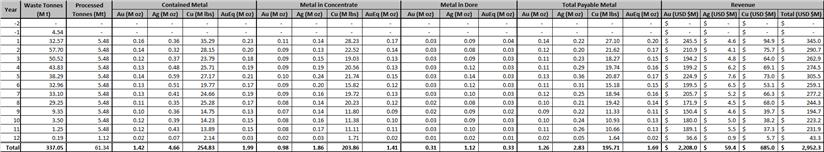
Table 22‑4 Annual Cash Flow
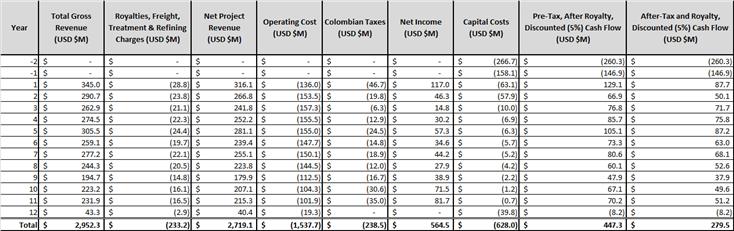
Resource Development Associates Inc.
Effective Date July 24, 2023
GoldMining Inc. NI 43-101 Report – La Mina Project | Page 248 |
Table 22‑5 Economic Results
Parameters | Unis | Values |
Pre-Tax NPV (5%) | US$ M | 447.3 |
Post-Tax NPV (5%) | US$ M | 279.5 |
Pre-Tax IRR | % | 20.4 |
Post-Tax IRR | % | 15.2 |
Payback | Years | 5.6 |
Pre-Production Capital | US$ M | 424.8 |
Sustaining Capital including Closure | US$ M | 203.2 |
Total Capital Costs | US$ M | 620.8 |
Life-of-Mine Unit Cash Cost | $/oz Au Eq | 795 |
Life-of-Mine All-In Sustaining Unit Cost | $/oz Au Eq | 912 |
The preliminary economic assessment is preliminary in nature, and there is no certainty that the reported results will be realized. The Mineral Resource estimate used for the PEA includes Inferred Mineral Resources which are considered too speculative geologically to have the economic considerations applied to them that would enable them to be categorized as Mineral Reserves, and there is no certainty that the projected economic performance will be realized. The purpose of the PEA is to demonstrate the economic viability of the La Mina Project, and the results are only intended as an initial, first-pass review of the Project economics based on preliminary information. Mineral Resources are not Mineral Reserves and do not have demonstrated economic viability.
The sensitivity of the PEA for the La Mina Project has been evaluated against key assumptions. Table 22‑6 outlines the sensitivity to the after-tax NPV and IRR based on changes in just the gold price.
Table 22‑6 Sensitivity of Estimated NPV and IRR (After-Tax) to Variation in Gold Price
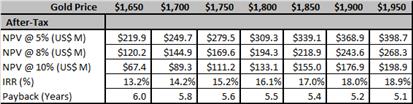
Additional sensitivity analyses were evaluated on after-tax NPV and IRR shown in Figure 22‑1 and Figure 22‑2 respectively. For both figures, operating costs, capital costs and metal prices were adjusted individually on a percent basis from the base case assumptions. Changes in the metal prices are indicative of changes in the respective metal recoveries.
Resource Development Associates Inc.
Effective Date July 24, 2023
GoldMining Inc. NI 43-101 Report – La Mina Project | Page 249 |

Figure 22‑1 Sensitivity of Estimated NPV @ 5% After-Tax for Changes in Costs and Metal Prices
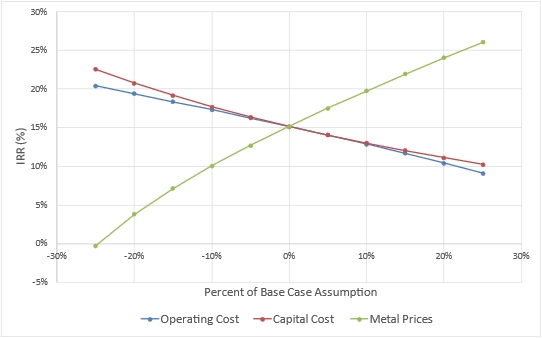
Figure 22‑2 Sensitivity of Estimated IRR After-Tax for Changes in Costs and Metal Prices
Resource Development Associates Inc.
Effective Date July 24, 2023
GoldMining Inc. NI 43-101 Report – La Mina Project | Page 250 |
The average total cash cost for on-site operations over the life of the mine is estimated to be USD $21.26 per processed tonne. Table 22‑7 outlines the cash costs for the La Mina Project.
Table 22‑7 Cash Costs
| | Unit Costs |
| | (US$ /t process) | (US$ /oz Au Eq) |
Mining | 9.95 | 351.7 |
Processing | 10.30 | 363.9 |
G&A (on-site) | 1.01 | 35.8 |
Sub-Total (on-site) | 21.26 | 751.4 |
Transport | | 17.3 |
Off-Taker (TC, RC) | | 26.3 |
Sub-Total (off-site) | | 43.6 |
Royalties | | 90.71 |
Income Tax | | 137.4 |
Unit Cash Cost | | 795.0 |
Sustaining Capital | | 94.1 |
Closure / Reclamation | | 22.95 |
All In Sustaining Unit Cost | | 912.0 |
The unit cash cost of US$ 795 per gold equivalent ounce is the total cash operating on-site costs plus off-site costs, royalties and income taxes. Adhering to the definition according to the World Gold Council, the All in Sustaining unit cost is US$ 912 per gold equivalent ounce.
Resource Development Associates Inc.
Effective Date July 24, 2023
GoldMining Inc. NI 43-101 Report – La Mina Project | Page 251 |
There are no adjacent properties to La Mina that have published NI 43-101 technical reports.
Resource Development Associates Inc.
Effective Date July 24, 2023
GoldMining Inc. NI 43-101 Report – La Mina Project | Page 252 |
24 | OTHER RELEVANT DATA AND INFORMATION |
The authors are not aware of any other information that would aid in the understanding of the La Mina Project.
Resource Development Associates Inc.
Effective Date July 24, 2023
GoldMining Inc. NI 43-101 Report – La Mina Project | Page 253 |
25 | INTERPRETATION AND CONCLUSIONS |
This report was prepared by a group of independent consultants, all Qualified Persons as defined by NI 31-101, to demonstrate the economic viability of open pit mining and processing, based on the estimated Mineral Resources at the La Mina Project. This report provides a summary of the results and findings to the level that should be expected for a preliminary economic assessment. Standard industry practices and assumptions have been applied in this study.
Mineral Resources meet the reasonable prospects of eventual economic extraction due two main factors; 1) cut-off grades are based on scientific data and assumptions related to the project and 2) Mineral Resources are estimated only within pit limits derived by the scientific data as well as by using generally accepted mining and processing costs. Confidence in the Mineral Estimate was used to classify Mineral Resources based upon drill hole spacing, geological knowledge of the deposits, metallurgical studies and a proper QA/QC program.
25.1 | PRELIMINARY ECONOMIC ASSESSMENT |
Estimated Mineral Resources were assumed to be conventionally mined and processed with a conventional concentrator to produce a copper, silver and gold concentrate that would be shipped to an external refinery. In addition, this updated study includes a gold doré produced and shipped to an external refinery.
Under the base case assumption for the project, the preliminary economic assessment indicated an undiscounted pre-tax cash flow of US$ 786.6 million, and a post-tax NPV at 5% of US$ 279.5 million.
Table 25‑1 shows the results of sensitivity analyses of post-tax cash flow and post-tax IRR show that the project is most sensitive to recovery and gold price while the project is least sensitive to changes in capital costs.
Table 25‑1 NPV and IRR Sensitivity to Gold Price, After-Tax
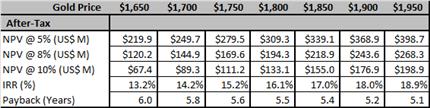
The base case assumptions demonstrate that the La Mina project may produce an average of 155,522 gold equivalent ounces per year averaged over full producing years.
Two scoping level metallurgical test work programs have been completed on samples from the La Mina deposit. The first program was completed and reported in 2011 by RDi, on samples from the La Cantera and the Middle Zone deposits and the second program was completed and reported in 2022 by ALS, on samples from the La Garrucha deposit. Generally, the copper and gold recoveries by flotation into a bulk rougher concentrate and gold recovery by cyanide leaching were consistent between the two test programs for the materials tested and indicate that the La Mina samples (La Cantera, Middle Zone and La Garrucha) are amenable to standard flotation for copper and gold recovery and to cyanide leaching for gold recovery.
Resource Development Associates Inc.
Effective Date July 24, 2023
GoldMining Inc. NI 43-101 Report – La Mina Project | Page 254 |
The characteristics of the ore were relatively favorable for copper and gold recovery, with a pyrite to copper sulphide ratio of 3:1 and relatively little association of copper sulphides with pyrite, which indicates that a reasonably efficient separation of pyrite from copper sulphides in a potential flotation process is possible. With about 48% copper liberation at the nominal 103 µm K80 primary grind sizing, reasonably good rougher copper response can be anticipated under relatively aggressive flotation conditions.
Flotation testing in the 2022 program produced a bulk sulphide concentrate containing 27% copper, 192 g/tonne gold and 549 g/tonne silver, while recovering about 77% of the copper and 67% of the gold. As this was an open circuit test, closed circuit testing would be expected to recover some of the losses in the cleaner tails, resulting in higher recoveries at lower grade. Cyanide leaching of the cleaner and rougher tailings could recover approximately 78% of the gold in the rougher tailings and 85% in the cleaner tailings, collectively representing about 25% of feed gold. As such, overall gold recovery from such a flowsheet would be expected to total around 90% - 92%.
The amount and effect of oxide/saprolite and transition material in the upper part of the deposits has not been established. There was some indication from the 2011 test work that flotation recoveries were lower in some composite samples that contained some amount of copper oxides. Currently, the effect is not quantifiable and warrants further investigation.
Considering the results from the two metallurgical programs and a preliminary mass balance for the process, an overall base case recovery for gold and copper by flotation after regrind and cleaning into a 23% to 26% copper concentrate is projected at 69% and 80% respectively. Cyanide leaching of the combined cleaner and rougher tailings, increases the overall gold recovery to approximately 91%. Further test work on representative samples, for additional evaluation of mineralogy and a program of open and locked cycle flotation testing and cyanide leach testing is required to provide further confidence in the metallurgical response and optimization of the recovery process.
Further in-depth metallurgical test work needs to be conducted to enhance the understanding of the metallurgy to support further development studies for the project
Conventional surface mining methods using surface drill and blast techniques with off-highway truck and front-end loaders were assumed for this report and are standard amongst similar mines. Equipment requirements were based on typical equipment performance in similar mines. Haul truck estimates were based on estimated cycle times by bench for each pit and respective phase. No detailed mined designs nor haul road designs were completed for this report, however such detail will provide better understanding of hauling requirements.
Pit slope angles were assumed to be 47.5 degrees for all pits. These slope angles may be aggressive and further geotechnical studies are needed to understand the stability of the pit walls. Detailed pit designs with haul roads may also contribute to flatter overall wall slope angles.
The mine production schedule was created using a Microsoft Excel Scheduling Spreadsheet. It was based on the bench output of nested whittle pit shells that were generated and used as phases for scheduling each pit. No crest/toe pit designs with haul roads were created for interim phases nor ultimate pits. This method of mine production scheduling is adequate for a preliminary technical report to provide the initial viability of an economic mine schedule. Detailed mine designs incorporating haul roads for each phase of each pit will provide more attainable mine production schedule.
Resource Development Associates Inc.
Effective Date July 24, 2023
GoldMining Inc. NI 43-101 Report – La Mina Project | Page 255 |
It is recommended that GoldMining implement the following resource development plans at La Mina:
| | ● | Evaluate the exploration opportunity to further expand the La Cantera resource and evaluate possible connections to Middle Zone at depth. Drill test resulting targets. |
| | ● | Evaluate the exploration opportunity for expansion of the Middle Zone deposit, particularly at depth. Drill test resulting targets. |
| | ● | Drill test the exploration opportunity at the La Garrucha target which remains open along strike to the southeast. |
| | ● | Evaluate the requirements for infill drilling to upgrade the La Cantera and La Garrucha resources to M&I. |
| | ● | Evaluate the requirements for infill drilling to upgrade the Middle Zone resource to M&I advance the metallurgical evaluation of the La Cantera and La Garrucha mineralization for input to future engineering studies. |
Several additional porphyry intrusions are interpreted from existing geophysical datasets throughout the La Mina concessions. It is recommended the Company also undertakes a systematic exploration program to further test these targets for discovery of new porphyry gold-copper mineralization.
Table 26‑1 Proposed Phase 1 Work Program to advance La Mina
Activity | Amount (US$ M) |
Property exploration to test additional porphyry targets | 1.0 |
Drilling Program focusing on resource expansion | 1.7 |
Drill technical services and assaying | 0.2 |
Updated Mineral Resource Estimate | 0.1 |
Updated Preliminary Economic Assessment | 0.2 |
Metallurgical Testing | 0.3 |
Total | 3.5 |
The authors are not recommending successive phases of work for the advancement of the Project.
26.2 | METALLURGICAL TESTING |
Additional metallurgical tests should be run on composite samples representative of the La Mina deposits, to provide further understanding of the metallurgical performance of the material laterally and vertically and improve the robustness of the proposed process. The following are recommendations for future testing:
| | ● | The test work program should incorporate testing on fresh and oxide/transition material (if geological interpretation and modelling indicates that oxide materials could be a substantial component of plant feed). Samples should be derived from fresh drill core and composited to generate representative composites for the zones. Testing should include: |
| | o | Further mineralogy to understand mineral and gold deportment, grain size distribution and liberation size. |
| | o | SAG and Ball mill grinding parameters |
| | o | Primary grind size and concentrate regrind size determination |
| | o | Open and locked cycle flotation tests to confirm flotation parameters, cleaner requirements and reagent scheme. |
| | o | Evaluation of sulphidation for oxide/transition flotation |
Resource Development Associates Inc.
Effective Date July 24, 2023
GoldMining Inc. NI 43-101 Report – La Mina Project | Page 256 |
| | o | Evaluation of cyanide leaching on the cleaner and rougher tails, and carbon loading. Testing should include confirming pre-aeration conditions to minimize cyanide consumption. |
| | o | Settling tests on flotation tails and on leach tails. |
| | o | Filtration tests on concentrate and leach tails |
| | o | Cyanide destruction tests on leach tails. |
| | o | Silver assays in all flotation and leach tests |
| | o | Testing a variety of lithologies and spatially representative samples to enable preliminary understanding of the variability in metallurgical performance across the deposits, and to understand grade vs recovery response. |
| | ● | All sample core for met testing should be stored to minimize oxidation between time of collection and delivery to the met laboratory e.g., in plastic sleeves with either the air removed or nitrogen added to prevent oxidation and storage/transport in refrigerated units |
| | ● | A Trade off study should be undertaken to determine whether a flotation cleaner leach circuit would be economically more viable than the full flotation tailings leach circuit, incorporating also the impact of the tailing storage facilities for those scenarios. |
| | ● | A trade-off study should be undertaken to evaluate optimal grind size for the flotation and leach circuit. |
Table 26‑2 Future Metallurgical Test Work Cost Estimate
Description | Units | Cost (US$) |
Sample receipt, preparation, reporting | | 30,500 |
Mineralogy: feed, concentrates | 12 | 39,000 |
Open circuit flotation tests, rougher, cleaner | 50 | 55,500 |
Locked cycle tests | 6 | 23,000 |
Concentrate generation flotation tests | 4 | 28,500 |
Concentrate analysis, assays | | 3,500 |
Comminution tests: SMC, BWi, regrind SGE | | 22,750 |
Concentrate filtration, tailings settling | | 8,700 |
Geochemical characterization of tailings | | 1,600 |
Contingency | | 38,799 |
Total | | 251,849 |
Resource Development Associates Inc.
Effective Date July 24, 2023
GoldMining Inc. NI 43-101 Report – La Mina Project | Page 257 |
Aurum Exploration Inc. and Alberto Montoya-Arbelaez, Mining Rights Purchase Agreement, La Mina Project, May 14, 2010.
Aurum Exploration Inc., Montoya Option License. April 15, 2010
Cediel, F., R. P. Shaw, and C. Cáceres, (2003), Tectonic assembly of the Northern Andean Block, AAPG Memoir 79, p. 815-848.
Cediel, F., and Cáceres, C., (2000), Geologic map of Colombia, Geotec Ltd., Third Edition, Digital Format with Legend and Tectono-Stratigraphic Chart.
Durán, R., et al., (2005). Complementación Geológica, Geoquímica y Geofísica (Magnetométrica) de las Planchas 166, 167, 186 y 187, Escala 1:100,000, IGAC, Zona de Influencia del Sector Caucal‐Romeral. Report by Union Temporal Dunia ATG (Dunia Consultores Ltda & Asesorias Técnicas Geológicas), Bogotá, 23 November 2005, 462 p.
Gustafson, L.B. and Hunt, J.P., (1975), The Porphyry Copper Deposit at El Salvador, Chile: Economic Geology, v. 70, p. 857-912.
InterPro Development, (2013), La Mina Gold-Copper Project Antioquia, Republic of Colombia, PEA, September 2013.
Resource Development Inc., (2011) Metallurgical Study for La Mina Porphyry Gold and Copper Prospect, Colombia, October 19, 2011, 106 p.
Resource Development Associates Inc., (2022) NI 43-101 Technical Report and Preliminary Economic Assessment for the La Mina Project, Antioquia, Republic of Colombia, February 25, 2022, 215 p.
Wilson, S.E., (2011) NI 43-101 Technical Report, Bellhaven Copper and Gold Inc., La Mina Project, Antioquia, Republic of Colombia” Scott E. Wilson Consulting, Inc., Scott Wilson CPG, August 29, 2011, 92 p.
Wilson, S.E., (2013) NI 43-101 Technical Report, Bellhaven Copper and Gold Inc., La Mina Project, Antioquia, Republic of Colombia” Scott E. Wilson Consulting, Inc., Scott Wilson CPG, May 2013, 148 p.
Wilson, S.E., (2021) NI 43-101 Technical Report, GoldMining Inc., La Mina Project, Antioquia, Republic of Colombia” Metal Mining Consultants, Inc., Scott Wilson CPG, September 2021, 200 p.
Resource Development Associates Inc.
Effective Date July 24, 2023