February 2019 Fourth Quarter 2018 Earnings Call Exhibit 99.2
Forward Looking Statement Statements contained in this presentation that state the Partnership’s or management’s expectations or predictions of the future are forward-looking statements. The words “believe,” “expect,” “should,” “intends,” “anticipates”, “estimates,” “target” and other similar expressions identify forward-looking statements. It is important to note that actual results could differ materially from those projected in such forward-looking statements. For more information concerning factors that could cause actual results to differ from those expressed or forecasted, see CrossAmerica’s annual reports on Form 10-K, quarterly reports on Form 10-Q and other reports filed with the Securities and Exchange Commission and available on the Partnership’s website at www.crossamericapartners.com. If any of these factors materialize, or if our underlying assumptions prove to be incorrect, actual results may vary significantly from what we projected. Any forward-looking statement you see or hear during this presentation reflects our current views as of the date of this presentation with respect to future events. We assume no obligation to publicly update or revise these forward-looking statements for any reason, whether as a result of new information, future events, or otherwise.
CrossAmerica Business Overview Gerardo Valencia, CEO & President
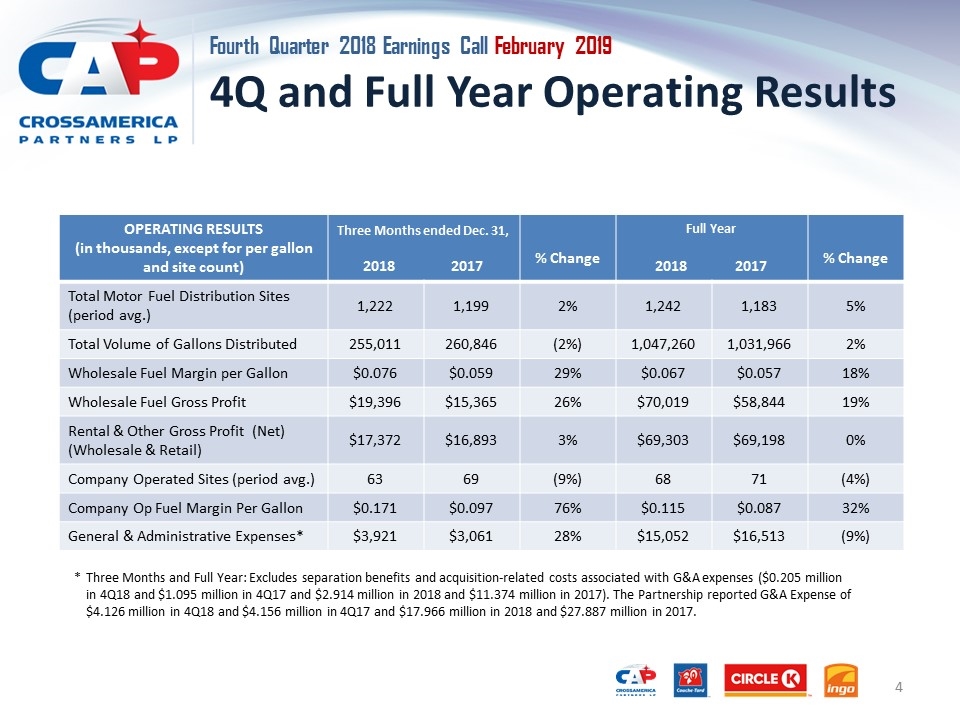
4Q and Full Year Operating Results OPERATING RESULTS (in thousands, except for per gallon and site count) Three Months ended Dec. 31, 2018 2017 % Change Full Year 2018 2017 % Change Total Motor Fuel Distribution Sites (period avg.) 1,222 1,199 2% 1,242 1,183 5% Total Volume of Gallons Distributed 255,011 260,846 (2%) 1,047,260 1,031,966 2% Wholesale Fuel Margin per Gallon $0.076 $0.059 29% $0.067 $0.057 18% Wholesale Fuel Gross Profit $19,396 $15,365 26% $70,019 $58,844 19% Rental & Other Gross Profit (Net) (Wholesale & Retail) $17,372 $16,893 3% $69,303 $69,198 0% Company Operated Sites (period avg.) 63 69 (9%) 68 71 (4%) Company Op Fuel Margin Per Gallon $0.171 $0.097 76% $0.115 $0.087 32% General & Administrative Expenses* $3,921 $3,061 28% $15,052 $16,513 (9%) *Three Months and Full Year: Excludes separation benefits and acquisition-related costs associated with G&A expenses ($0.205 million in 4Q18 and $1.095 million in 4Q17 and $2.914 million in 2018 and $11.374 million in 2017). The Partnership reported G&A Expense of $4.126 million in 4Q18 and $4.156 million in 4Q17 and $17.966 million in 2018 and $27.887 million in 2017.
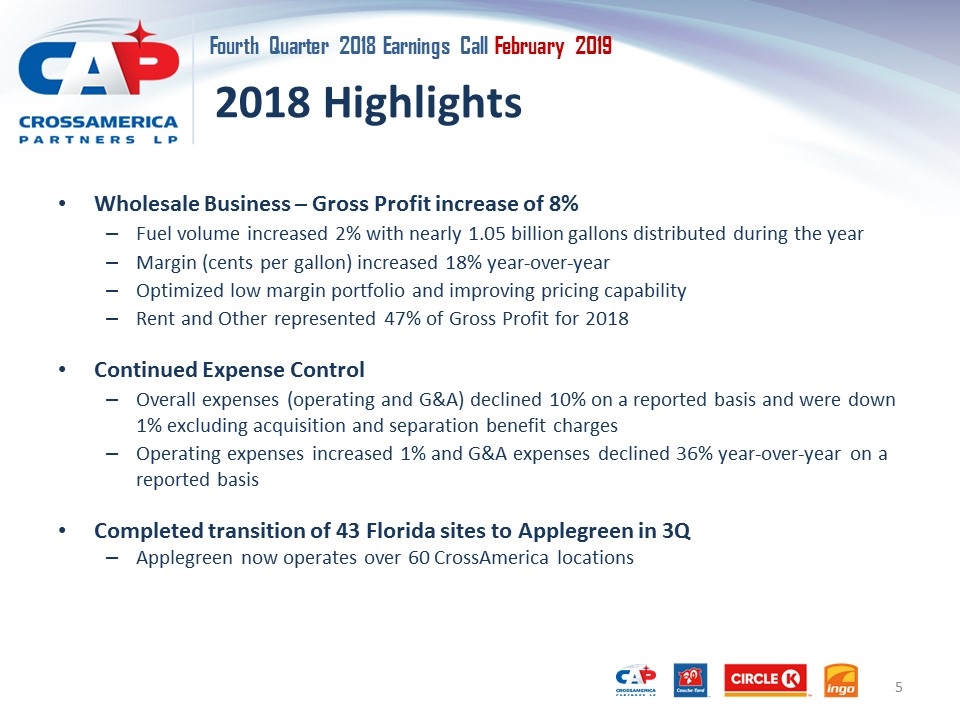
2018 Highlights Wholesale Business – Gross Profit increase of 8% Fuel volume increased 2% with nearly 1.05 billion gallons distributed during the year Margin (cents per gallon) increased 18% year-over-year Optimized low margin portfolio and improving pricing capability Rent and Other represented 47% of Gross Profit for 2018 Continued Expense Control Overall expenses (operating and G&A) declined 10% on a reported basis and were down 1% excluding acquisition and separation benefit charges Operating expenses increased 1% and G&A expenses declined 36% year-over-year on a reported basis Completed transition of 43 Florida sites to Applegreen in 3Q Applegreen now operates over 60 CrossAmerica locations
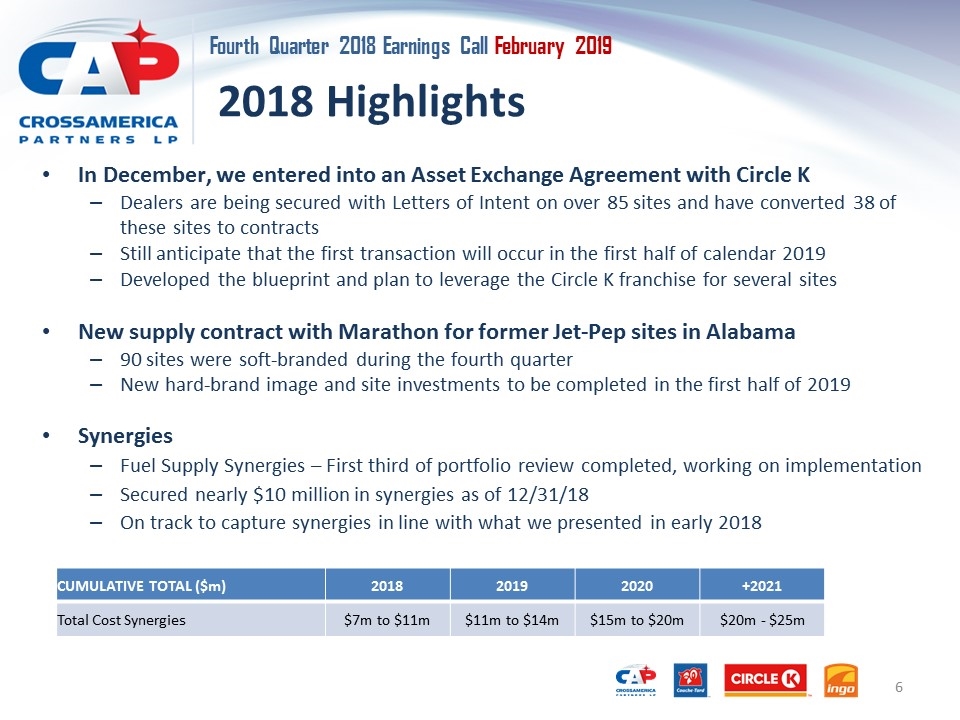
2018 Highlights In December, we entered into an Asset Exchange Agreement with Circle K Dealers are being secured with Letters of Intent on over 85 sites and have converted 38 of these sites to contracts Still anticipate that the first transaction will occur in the first half of calendar 2019 Developed the blueprint and plan to leverage the Circle K franchise for several sites New supply contract with Marathon for former Jet-Pep sites in Alabama 90 sites were soft-branded during the fourth quarter New hard-brand image and site investments to be completed in the first half of 2019 Synergies Fuel Supply Synergies – First third of portfolio review completed, working on implementation Secured nearly $10 million in synergies as of 12/31/18 On track to capture synergies in line with what we presented in early 2018 CUMULATIVE TOTAL ($m) 2018 2019 2020 +2021 Total Cost Synergies $7m to $11m $11m to $14m $15m to $20m $20m - $25m
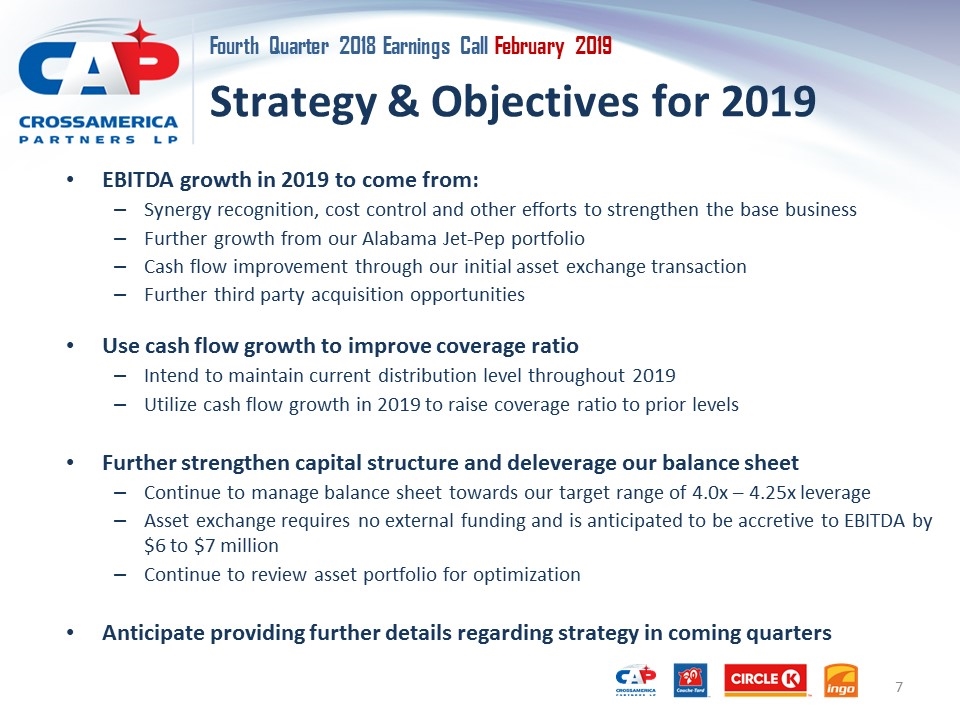
Strategy & Objectives for 2019 EBITDA growth in 2019 to come from: Synergy recognition, cost control and other efforts to strengthen the base business Further growth from our Alabama Jet-Pep portfolio Cash flow improvement through our initial asset exchange transaction Further third party acquisition opportunities Use cash flow growth to improve coverage ratio Intend to maintain current distribution level throughout 2019 Utilize cash flow growth in 2019 to raise coverage ratio to prior levels Further strengthen capital structure and deleverage our balance sheet Continue to manage balance sheet towards our target range of 4.0x – 4.25x leverage Asset exchange requires no external funding and is anticipated to be accretive to EBITDA by $6 to $7 million Continue to review asset portfolio for optimization Anticipate providing further details regarding strategy in coming quarters
CrossAmerica Financial Overview Evan Smith, Chief Financial Officer
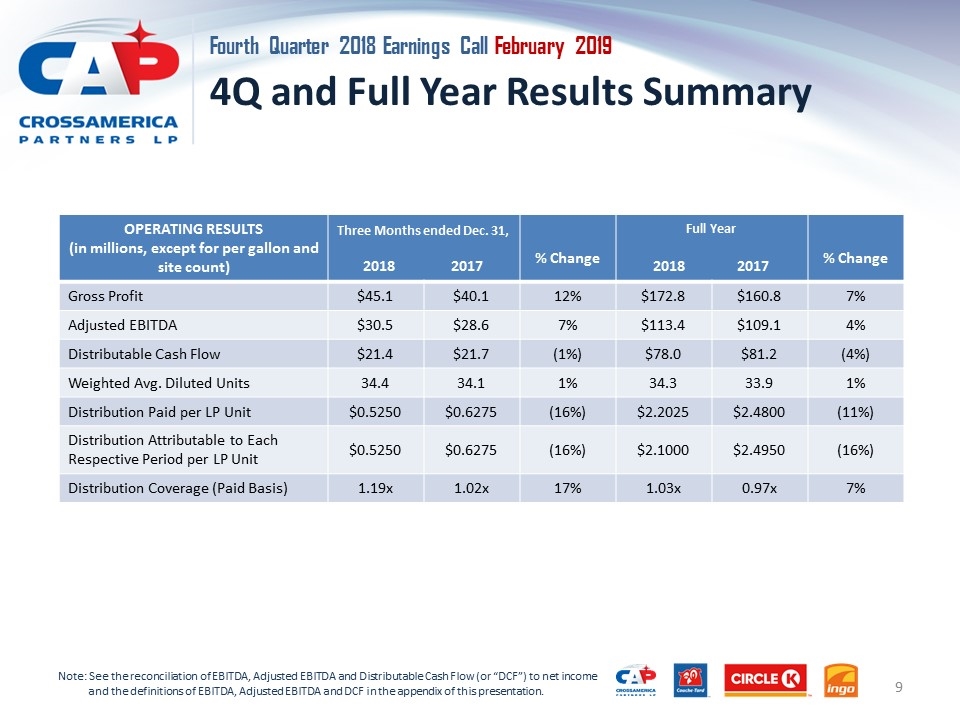
4Q and Full Year Results Summary OPERATING RESULTS (in millions, except for per gallon and site count) Three Months ended Dec. 31, 2018 2017 % Change Full Year 2018 2017 % Change Gross Profit $45.1 $40.1 12% $172.8 $160.8 7% Adjusted EBITDA $30.5 $28.6 7% $113.4 $109.1 4% Distributable Cash Flow $21.4 $21.7 (1%) $78.0 $81.2 (4%) Weighted Avg. Diluted Units 34.4 34.1 1% 34.3 33.9 1% Distribution Paid per LP Unit $0.5250 $0.6275 (16%) $2.2025 $2.4800 (11%) Distribution Attributable to Each Respective Period per LP Unit $0.5250 $0.6275 (16%) $2.1000 $2.4950 (16%) Distribution Coverage (Paid Basis) 1.19x 1.02x 17% 1.03x 0.97x 7% Note: See the reconciliation of EBITDA, Adjusted EBITDA and Distributable Cash Flow (or “DCF”) to net income and the definitions of EBITDA, Adjusted EBITDA and DCF in the appendix of this presentation.
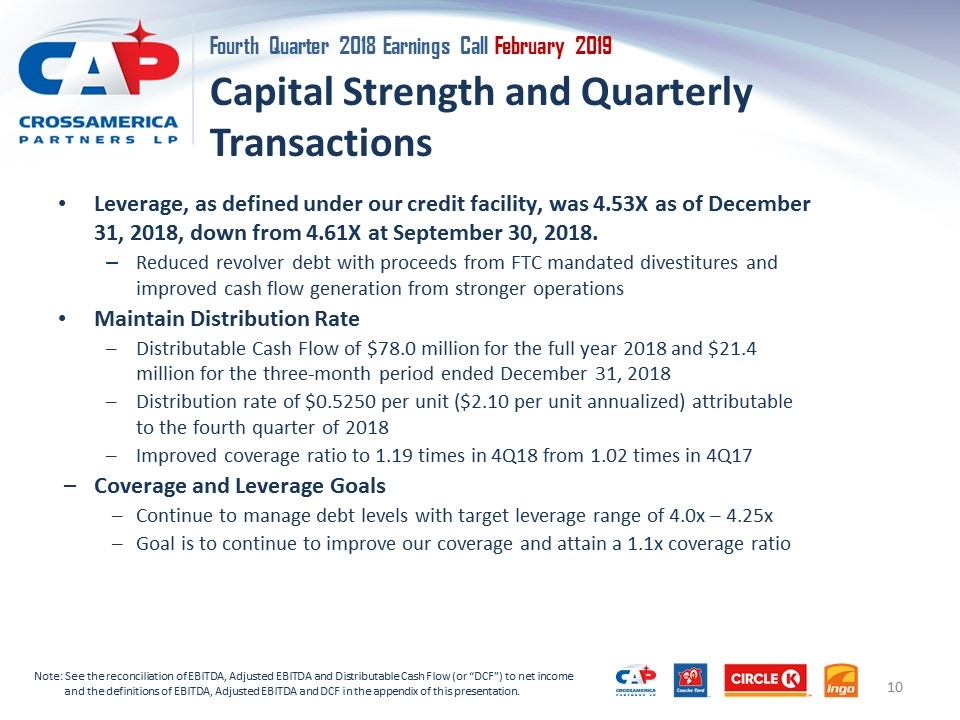
Capital Strength and Quarterly Transactions Leverage, as defined under our credit facility, was 4.53X as of December 31, 2018, down from 4.61X at September 30, 2018. Reduced revolver debt with proceeds from FTC mandated divestitures and improved cash flow generation from stronger operations Maintain Distribution Rate Distributable Cash Flow of $78.0 million for the full year 2018 and $21.4 million for the three-month period ended December 31, 2018 Distribution rate of $0.5250 per unit ($2.10 per unit annualized) attributable to the fourth quarter of 2018 Improved coverage ratio to 1.19 times in 4Q18 from 1.02 times in 4Q17 Coverage and Leverage Goals Continue to manage debt levels with target leverage range of 4.0x – 4.25x Goal is to continue to improve our coverage and attain a 1.1x coverage ratio Note: See the reconciliation of EBITDA, Adjusted EBITDA and Distributable Cash Flow (or “DCF”) to net income and the definitions of EBITDA, Adjusted EBITDA and DCF in the appendix of this presentation.
Appendix Fourth Quarter 2018 Earnings Call
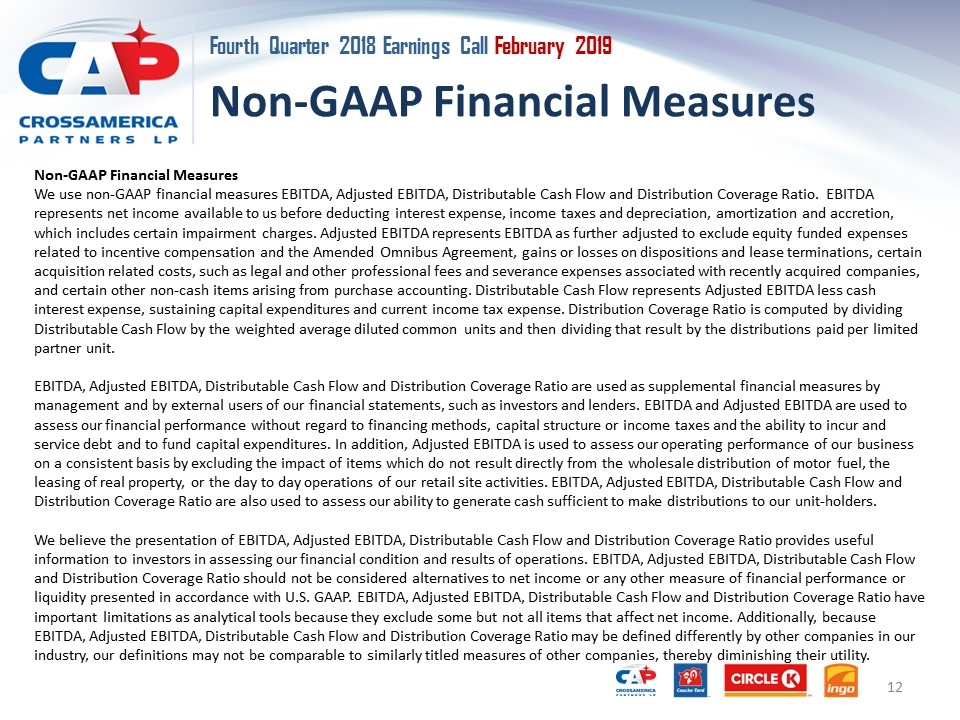
Non-GAAP Financial Measures Non-GAAP Financial Measures We use non-GAAP financial measures EBITDA, Adjusted EBITDA, Distributable Cash Flow and Distribution Coverage Ratio. EBITDA represents net income available to us before deducting interest expense, income taxes and depreciation, amortization and accretion, which includes certain impairment charges. Adjusted EBITDA represents EBITDA as further adjusted to exclude equity funded expenses related to incentive compensation and the Amended Omnibus Agreement, gains or losses on dispositions and lease terminations, certain acquisition related costs, such as legal and other professional fees and severance expenses associated with recently acquired companies, and certain other non-cash items arising from purchase accounting. Distributable Cash Flow represents Adjusted EBITDA less cash interest expense, sustaining capital expenditures and current income tax expense. Distribution Coverage Ratio is computed by dividing Distributable Cash Flow by the weighted average diluted common units and then dividing that result by the distributions paid per limited partner unit. EBITDA, Adjusted EBITDA, Distributable Cash Flow and Distribution Coverage Ratio are used as supplemental financial measures by management and by external users of our financial statements, such as investors and lenders. EBITDA and Adjusted EBITDA are used to assess our financial performance without regard to financing methods, capital structure or income taxes and the ability to incur and service debt and to fund capital expenditures. In addition, Adjusted EBITDA is used to assess our operating performance of our business on a consistent basis by excluding the impact of items which do not result directly from the wholesale distribution of motor fuel, the leasing of real property, or the day to day operations of our retail site activities. EBITDA, Adjusted EBITDA, Distributable Cash Flow and Distribution Coverage Ratio are also used to assess our ability to generate cash sufficient to make distributions to our unit-holders. We believe the presentation of EBITDA, Adjusted EBITDA, Distributable Cash Flow and Distribution Coverage Ratio provides useful information to investors in assessing our financial condition and results of operations. EBITDA, Adjusted EBITDA, Distributable Cash Flow and Distribution Coverage Ratio should not be considered alternatives to net income or any other measure of financial performance or liquidity presented in accordance with U.S. GAAP. EBITDA, Adjusted EBITDA, Distributable Cash Flow and Distribution Coverage Ratio have important limitations as analytical tools because they exclude some but not all items that affect net income. Additionally, because EBITDA, Adjusted EBITDA, Distributable Cash Flow and Distribution Coverage Ratio may be defined differently by other companies in our industry, our definitions may not be comparable to similarly titled measures of other companies, thereby diminishing their utility.
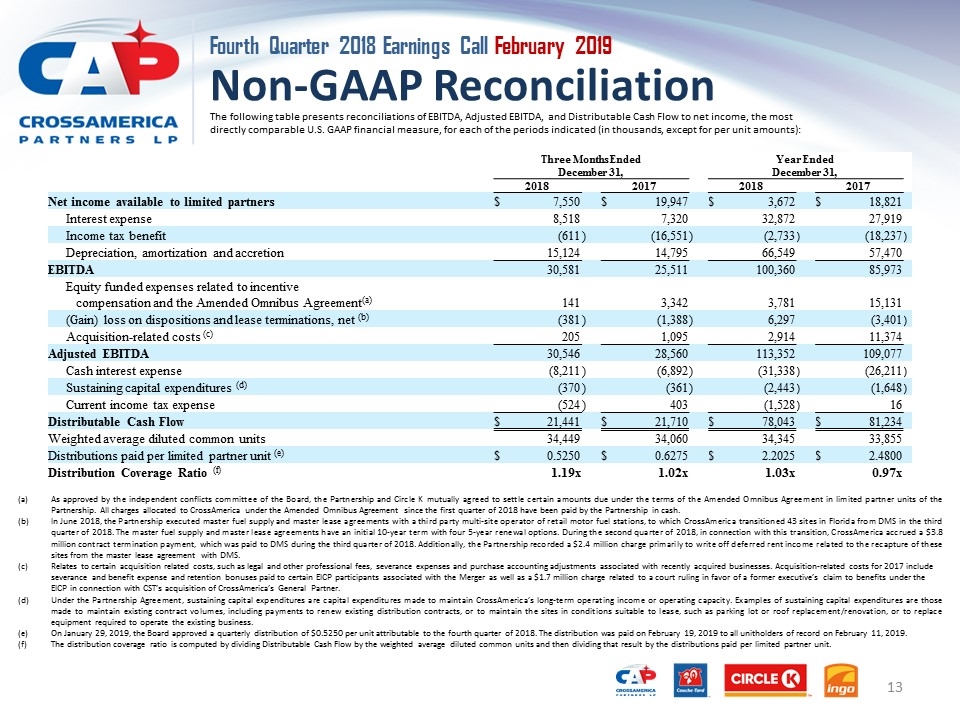
Non-GAAP Reconciliation The following table presents reconciliations of EBITDA, Adjusted EBITDA, and Distributable Cash Flow to net income, the most directly comparable U.S. GAAP financial measure, for each of the periods indicated (in thousands, except for per unit amounts): (a)As approved by the independent conflicts committee of the Board, the Partnership and Circle K mutually agreed to settle certain amounts due under the terms of the Amended Omnibus Agreement in limited partner units of the Partnership. All charges allocated to CrossAmerica under the Amended Omnibus Agreement since the first quarter of 2018 have been paid by the Partnership in cash. (b)In June 2018, the Partnership executed master fuel supply and master lease agreements with a third party multi-site operator of retail motor fuel stations, to which CrossAmerica transitioned 43 sites in Florida from DMS in the third quarter of 2018. The master fuel supply and master lease agreements have an initial 10-year term with four 5-year renewal options. During the second quarter of 2018, in connection with this transition, CrossAmerica accrued a $3.8 million contract termination payment, which was paid to DMS during the third quarter of 2018. Additionally, the Partnership recorded a $2.4 million charge primarily to write off deferred rent income related to the recapture of these sites from the master lease agreement with DMS. (c)Relates to certain acquisition related costs, such as legal and other professional fees, severance expenses and purchase accounting adjustments associated with recently acquired businesses. Acquisition-related costs for 2017 include severance and benefit expense and retention bonuses paid to certain EICP participants associated with the Merger as well as a $1.7 million charge related to a court ruling in favor of a former executive’s claim to benefits under the EICP in connection with CST’s acquisition of CrossAmerica’s General Partner. (d)Under the Partnership Agreement, sustaining capital expenditures are capital expenditures made to maintain CrossAmerica’s long-term operating income or operating capacity. Examples of sustaining capital expenditures are those made to maintain existing contract volumes, including payments to renew existing distribution contracts, or to maintain the sites in conditions suitable to lease, such as parking lot or roof replacement/renovation, or to replace equipment required to operate the existing business. (e)On January 29, 2019, the Board approved a quarterly distribution of $0.5250 per unit attributable to the fourth quarter of 2018. The distribution was paid on February 19, 2019 to all unitholders of record on February 11, 2019. (f)The distribution coverage ratio is computed by dividing Distributable Cash Flow by the weighted average diluted common units and then dividing that result by the distributions paid per limited partner unit. Three Months Ended December 31, Year Ended December 31, 2018 2017 2018 2017 Net income available to limited partners $ 7,550 $ 19,947 $ 3,672 $ 18,821 Interest expense 8,518 7,320 32,872 27,919 Income tax benefit (611 ) (16,551 ) (2,733 ) (18,237 ) Depreciation, amortization and accretion 15,124 14,795 66,549 57,470 EBITDA 30,581 25,511 100,360 85,973 Equity funded expenses related to incentive compensation and the Amended Omnibus Agreement(a) 141 3,342 3,781 15,131 (Gain) loss on dispositions and lease terminations, net (b) (381 ) (1,388 ) 6,297 (3,401 ) Acquisition-related costs (c) 205 1,095 2,914 11,374 Adjusted EBITDA 30,546 28,560 113,352 109,077 Cash interest expense (8,211 ) (6,892 ) (31,338 ) (26,211 ) Sustaining capital expenditures (d) (370 ) (361 ) (2,443 ) (1,648 ) Current income tax expense (524 ) 403 (1,528 ) 16 Distributable Cash Flow $ 21,441 $ 21,710 $ 78,043 $ 81,234 Weighted average diluted common units 34,449 34,060 34,345 33,855 Distributions paid per limited partner unit (e) $ 0.5250 $ 0.6275 $ 2.2025 $ 2.4800 Distribution Coverage Ratio (f) 1.19x 1.02x 1.03x 0.97x


