
May 2019 First Quarter 2019 Earnings Call Exhibit 99.2
Forward Looking Statement Statements contained in this presentation that state the Partnership’s or management’s expectations or predictions of the future are forward-looking statements. The words “believe,” “expect,” “should,” “intends,” “anticipates”, “estimates,” “target” and other similar expressions identify forward-looking statements. It is important to note that actual results could differ materially from those projected in such forward-looking statements. For more information concerning factors that could cause actual results to differ from those expressed or forecasted, see CrossAmerica’s annual reports on Form 10-K, quarterly reports on Form 10-Q and other reports filed with the Securities and Exchange Commission and available on the Partnership’s website at www.crossamericapartners.com. If any of these factors materialize, or if our underlying assumptions prove to be incorrect, actual results may vary significantly from what we projected. Any forward-looking statement you see or hear during this presentation reflects our current views as of the date of this presentation with respect to future events. We assume no obligation to publicly update or revise these forward-looking statements for any reason, whether as a result of new information, future events, or otherwise.
CrossAmerica Business Overview Gerardo Valencia, CEO & President
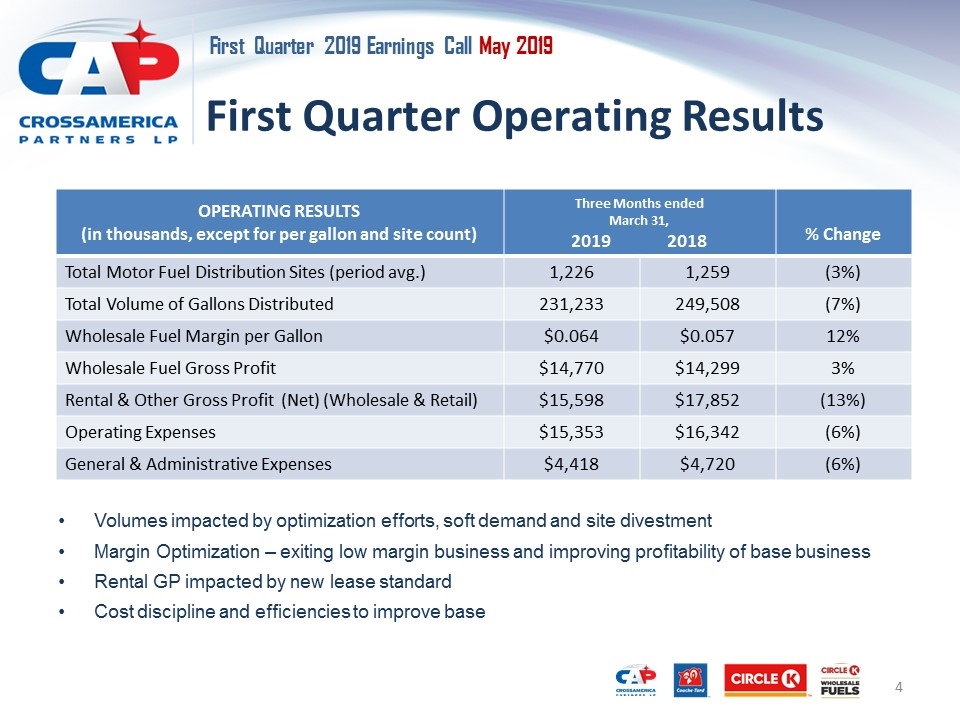
First Quarter Operating Results OPERATING RESULTS (in thousands, except for per gallon and site count) Three Months ended March 31, 2019 2018 % Change Total Motor Fuel Distribution Sites (period avg.) 1,226 1,259 (3%) Total Volume of Gallons Distributed 231,233 249,508 (7%) Wholesale Fuel Margin per Gallon $0.064 $0.057 12% Wholesale Fuel Gross Profit $14,770 $14,299 3% Rental & Other Gross Profit (Net) (Wholesale & Retail) $15,598 $17,852 (13%) Operating Expenses $15,353 $16,342 (6%) General & Administrative Expenses $4,418 $4,720 (6%) Volumes impacted by optimization efforts, soft demand and site divestment Margin Optimization – exiting low margin business and improving profitability of base business Rental GP impacted by new lease standard Cost discipline and efficiencies to improve base
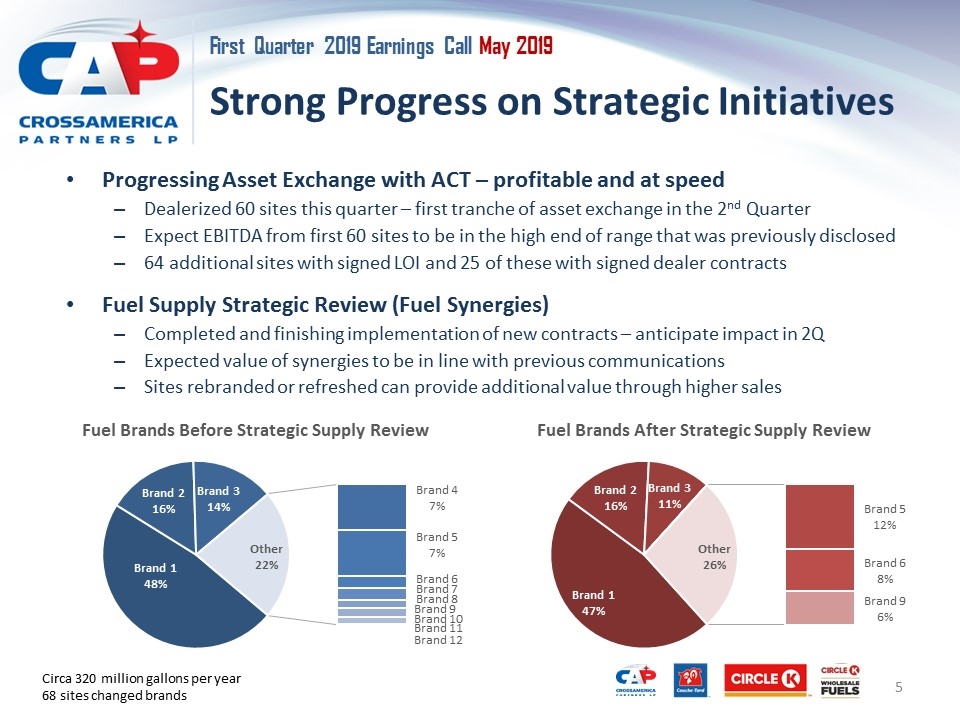
Strong Progress on Strategic Initiatives Progressing Asset Exchange with ACT – profitable and at speed Dealerized 60 sites this quarter – first tranche of asset exchange in the 2nd Quarter Expect EBITDA from first 60 sites to be in the high end of range that was previously disclosed 64 additional sites with signed LOI and 25 of these with signed dealer contracts Fuel Supply Strategic Review (Fuel Synergies) Completed and finishing implementation of new contracts – anticipate impact in 2Q Expected value of synergies to be in line with previous communications Sites rebranded or refreshed can provide additional value through higher sales Circa 320 million gallons per year 68 sites changed brands
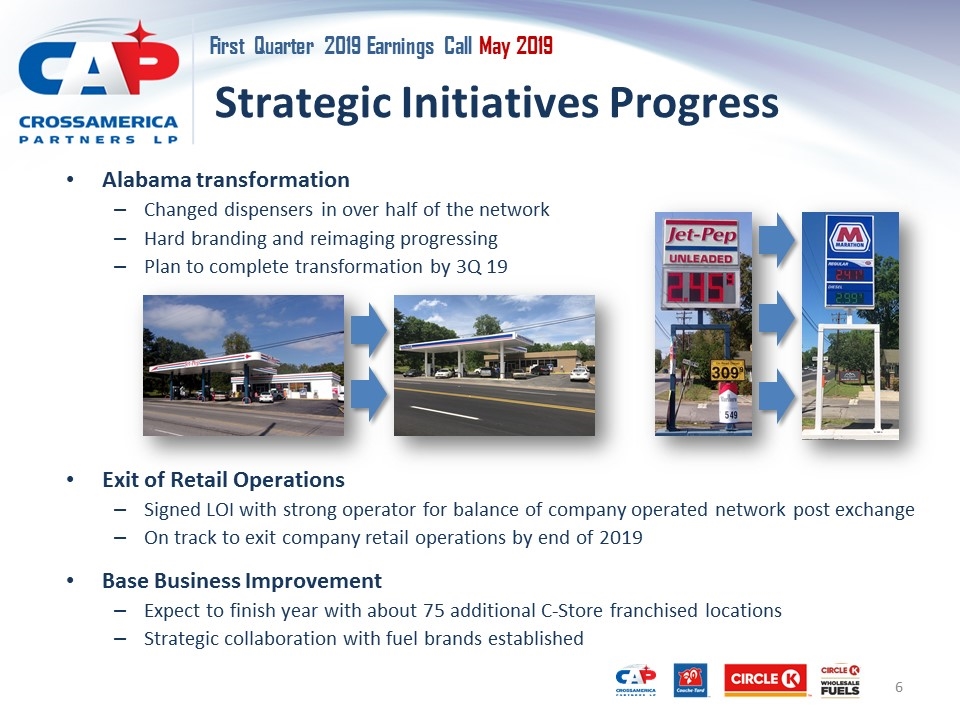
Strategic Initiatives Progress Alabama transformation Changed dispensers in over half of the network Hard branding and reimaging progressing Plan to complete transformation by 3Q 19 Exit of Retail Operations Signed LOI with strong operator for balance of company operated network post exchange On track to exit company retail operations by end of 2019 Base Business Improvement Expect to finish year with about 75 additional C-Store franchised locations Strategic collaboration with fuel brands established
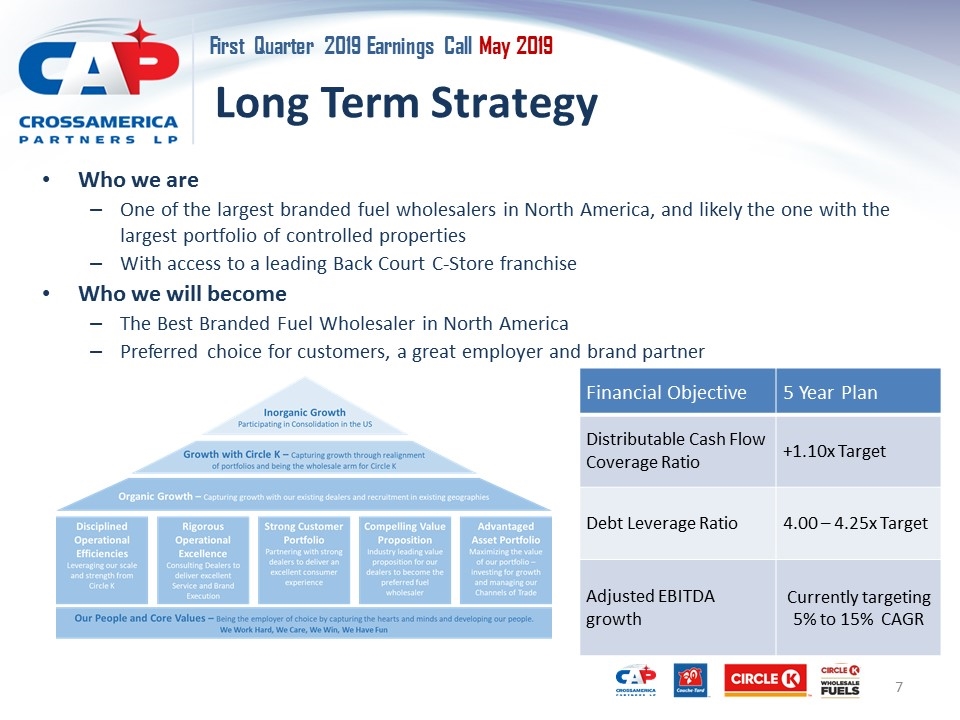
Long Term Strategy Who we are One of the largest branded fuel wholesalers in North America, and likely the one with the largest portfolio of controlled properties With access to a leading Back Court C-Store franchise Who we will become The Best Branded Fuel Wholesaler in North America Preferred choice for customers, a great employer and brand partner Financial Objective 5 Year Plan Distributable Cash Flow Coverage Ratio +1.10x Target Debt Leverage Ratio 4.00 – 4.25x Target Adjusted EBITDA growth Currently targeting 5% to 15% CAGR
CrossAmerica Financial Overview Evan Smith, Chief Financial Officer
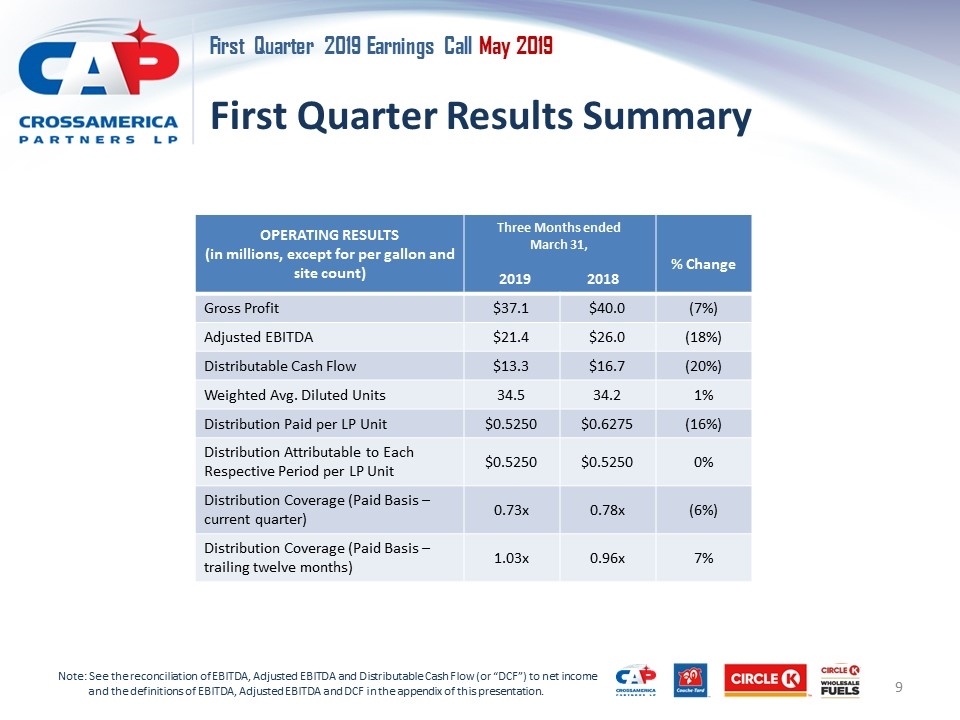
First Quarter Results Summary OPERATING RESULTS (in millions, except for per gallon and site count) Three Months ended March 31, 2019 2018 % Change Gross Profit $37.1 $40.0 (7%) Adjusted EBITDA $21.4 $26.0 (18%) Distributable Cash Flow $13.3 $16.7 (20%) Weighted Avg. Diluted Units 34.5 34.2 1% Distribution Paid per LP Unit $0.5250 $0.6275 (16%) Distribution Attributable to Each Respective Period per LP Unit $0.5250 $0.5250 0% Distribution Coverage (Paid Basis – current quarter) 0.73x 0.78x (6%) Distribution Coverage (Paid Basis – trailing twelve months) 1.03x 0.96x 7% Note: See the reconciliation of EBITDA, Adjusted EBITDA and Distributable Cash Flow (or “DCF”) to net income and the definitions of EBITDA, Adjusted EBITDA and DCF in the appendix of this presentation.
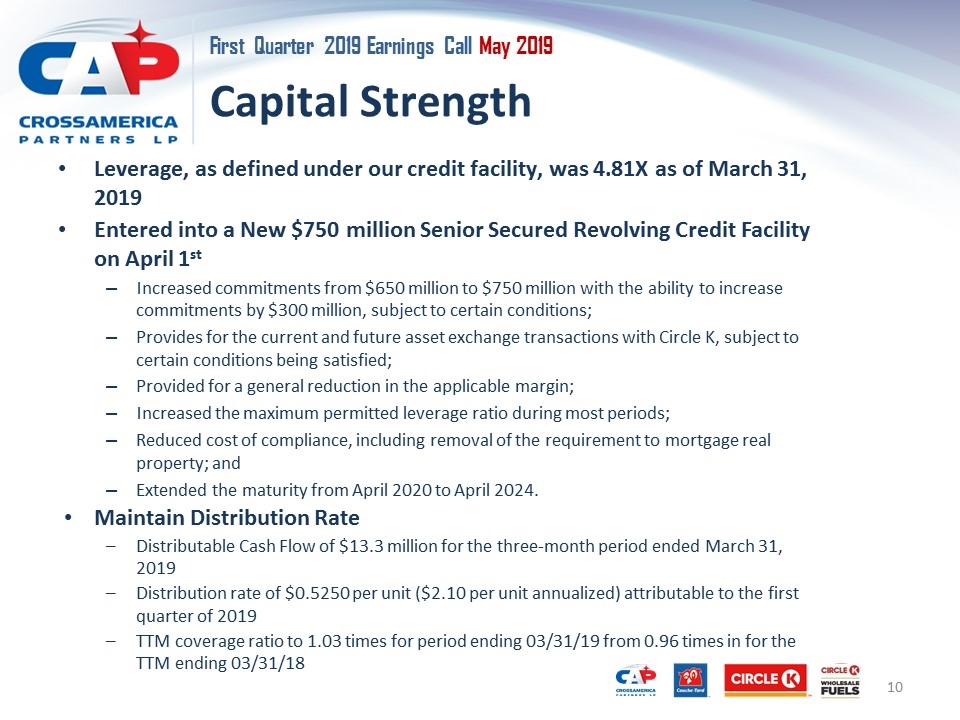
Capital Strength Leverage, as defined under our credit facility, was 4.81X as of March 31, 2019 Entered into a New $750 million Senior Secured Revolving Credit Facility on April 1st Increased commitments from $650 million to $750 million with the ability to increase commitments by $300 million, subject to certain conditions; Provides for the current and future asset exchange transactions with Circle K, subject to certain conditions being satisfied; Provided for a general reduction in the applicable margin; Increased the maximum permitted leverage ratio during most periods; Reduced cost of compliance, including removal of the requirement to mortgage real property; and Extended the maturity from April 2020 to April 2024. Maintain Distribution Rate Distributable Cash Flow of $13.3 million for the three-month period ended March 31, 2019 Distribution rate of $0.5250 per unit ($2.10 per unit annualized) attributable to the first quarter of 2019 TTM coverage ratio to 1.03 times for period ending 03/31/19 from 0.96 times in for the TTM ending 03/31/18
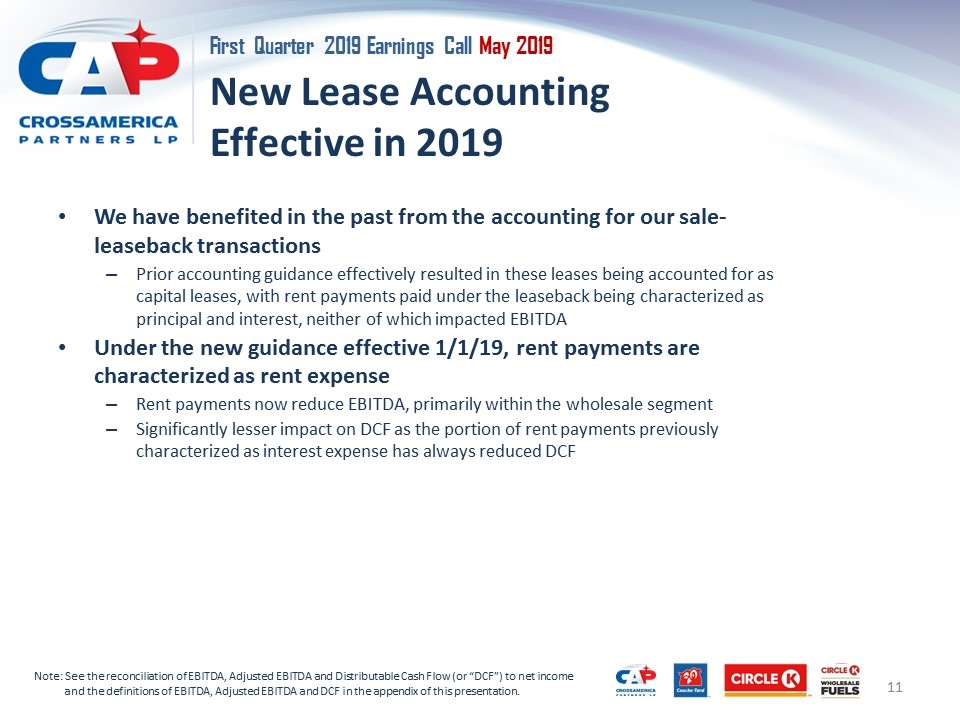
New Lease Accounting Effective in 2019 We have benefited in the past from the accounting for our sale-leaseback transactions Prior accounting guidance effectively resulted in these leases being accounted for as capital leases, with rent payments paid under the leaseback being characterized as principal and interest, neither of which impacted EBITDA Under the new guidance effective 1/1/19, rent payments are characterized as rent expense Rent payments now reduce EBITDA, primarily within the wholesale segment Significantly lesser impact on DCF as the portion of rent payments previously characterized as interest expense has always reduced DCF Note: See the reconciliation of EBITDA, Adjusted EBITDA and Distributable Cash Flow (or “DCF”) to net income and the definitions of EBITDA, Adjusted EBITDA and DCF in the appendix of this presentation.
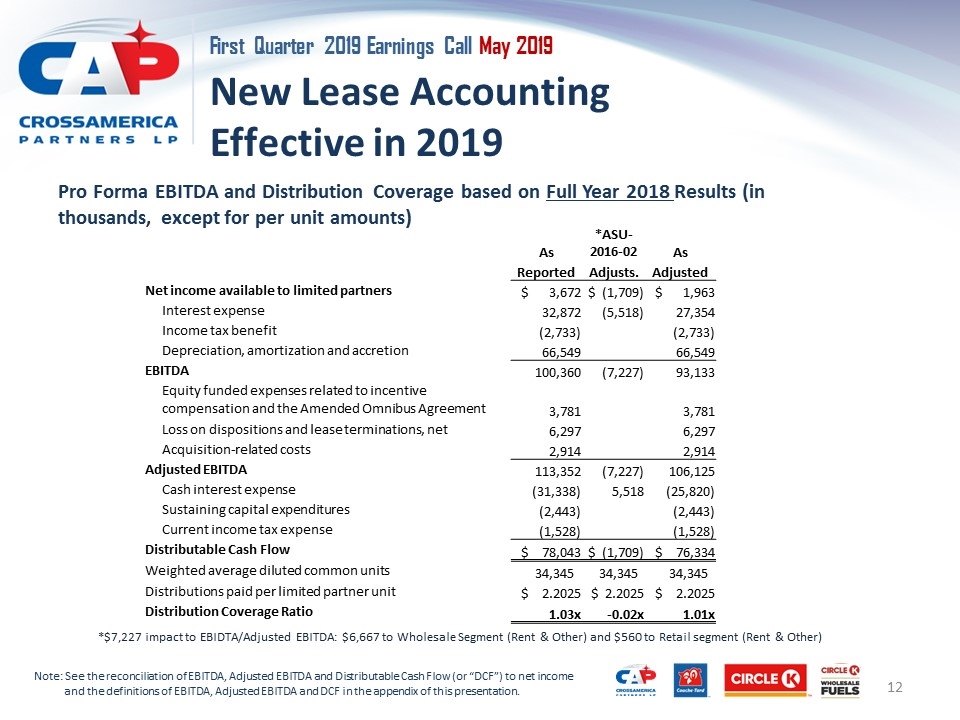
New Lease Accounting Effective in 2019 Pro Forma EBITDA and Distribution Coverage based on Full Year 2018 Results (in thousands, except for per unit amounts) Note: See the reconciliation of EBITDA, Adjusted EBITDA and Distributable Cash Flow (or “DCF”) to net income and the definitions of EBITDA, Adjusted EBITDA and DCF in the appendix of this presentation. As *ASU-2016-02 As Reported Adjusts. Adjusted Net income available to limited partners $ 3,672 $ (1,709) $ 1,963 Interest expense 32,872 (5,518) 27,354 Income tax benefit (2,733) (2,733) Depreciation, amortization and accretion 66,549 66,549 EBITDA 100,360 (7,227) 93,133 Equity funded expenses related to incentive compensation and the Amended Omnibus Agreement 3,781 3,781 Loss on dispositions and lease terminations, net 6,297 6,297 Acquisition-related costs 2,914 2,914 Adjusted EBITDA 113,352 (7,227) 106,125 Cash interest expense (31,338) 5,518 (25,820) Sustaining capital expenditures (2,443) (2,443) Current income tax expense (1,528) (1,528) Distributable Cash Flow $ 78,043 $ (1,709) $ 76,334 Weighted average diluted common units 34,345 34,345 34,345 Distributions paid per limited partner unit $ 2.2025 $ 2.2025 $ 2.2025 Distribution Coverage Ratio 1.03x -0.02x 1.01x *$7,227 impact to EBIDTA/Adjusted EBITDA: $6,667 to Wholesale Segment (Rent & Other) and $560 to Retail segment (Rent & Other)
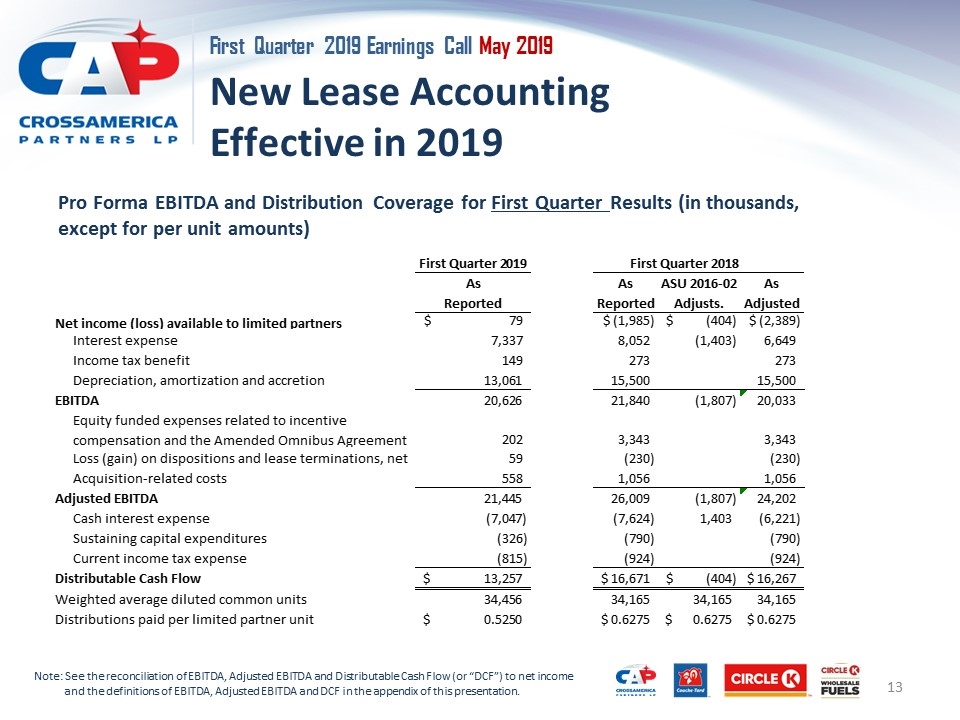
New Lease Accounting Effective in 2019 Pro Forma EBITDA and Distribution Coverage for First Quarter Results (in thousands, except for per unit amounts) Note: See the reconciliation of EBITDA, Adjusted EBITDA and Distributable Cash Flow (or “DCF”) to net income and the definitions of EBITDA, Adjusted EBITDA and DCF in the appendix of this presentation. First Quarter 2019 First Quarter 2018 As As ASU 2016-02 As Reported Reported Adjusts. Adjusted Net income (loss) available to limited partners $79 $-1,985 $-,404 $-2,389 Interest expense 7,337 8,052 -1,403 6,649 Income tax benefit 149 273 273 Depreciation, amortization and accretion 13,061 15,500 15,500 EBITDA 20,626 21,840 -1,807 20,033 Equity funded expenses related to incentive compensation and the Amended Omnibus Agreement 202 3,343 3,343 Loss (gain) on dispositions and lease terminations, net 59 -,230 -,230 Acquisition-related costs 558 1,056 1,056 Adjusted EBITDA 21,445 26,009 -1,807 24,202 Cash interest expense -7,047 -7,624 1,403 -6,221 Sustaining capital expenditures -,326 -,790 -,790 Current income tax expense -,815 -,924 -,924 Distributable Cash Flow $13,257 $16,671 $-,404 $16,267 Weighted average diluted common units 34,456 34,165 34,165 34,165 Distributions paid per limited partner unit $0.52500000000000002 $0.62749999999999995 $0.62749999999999995 $0.62749999999999995 Distribution Coverage Ratio 0.73x 0.78x -0.02x 0.76x
Appendix First Quarter 2019 Earnings Call
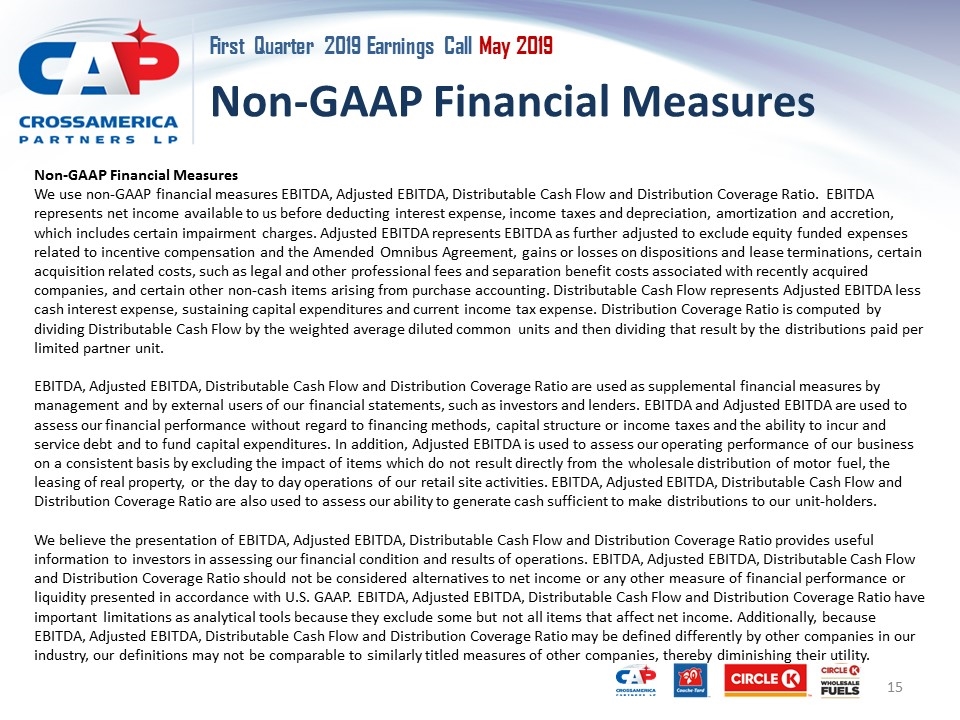
Non-GAAP Financial Measures Non-GAAP Financial Measures We use non-GAAP financial measures EBITDA, Adjusted EBITDA, Distributable Cash Flow and Distribution Coverage Ratio. EBITDA represents net income available to us before deducting interest expense, income taxes and depreciation, amortization and accretion, which includes certain impairment charges. Adjusted EBITDA represents EBITDA as further adjusted to exclude equity funded expenses related to incentive compensation and the Amended Omnibus Agreement, gains or losses on dispositions and lease terminations, certain acquisition related costs, such as legal and other professional fees and separation benefit costs associated with recently acquired companies, and certain other non-cash items arising from purchase accounting. Distributable Cash Flow represents Adjusted EBITDA less cash interest expense, sustaining capital expenditures and current income tax expense. Distribution Coverage Ratio is computed by dividing Distributable Cash Flow by the weighted average diluted common units and then dividing that result by the distributions paid per limited partner unit. EBITDA, Adjusted EBITDA, Distributable Cash Flow and Distribution Coverage Ratio are used as supplemental financial measures by management and by external users of our financial statements, such as investors and lenders. EBITDA and Adjusted EBITDA are used to assess our financial performance without regard to financing methods, capital structure or income taxes and the ability to incur and service debt and to fund capital expenditures. In addition, Adjusted EBITDA is used to assess our operating performance of our business on a consistent basis by excluding the impact of items which do not result directly from the wholesale distribution of motor fuel, the leasing of real property, or the day to day operations of our retail site activities. EBITDA, Adjusted EBITDA, Distributable Cash Flow and Distribution Coverage Ratio are also used to assess our ability to generate cash sufficient to make distributions to our unit-holders. We believe the presentation of EBITDA, Adjusted EBITDA, Distributable Cash Flow and Distribution Coverage Ratio provides useful information to investors in assessing our financial condition and results of operations. EBITDA, Adjusted EBITDA, Distributable Cash Flow and Distribution Coverage Ratio should not be considered alternatives to net income or any other measure of financial performance or liquidity presented in accordance with U.S. GAAP. EBITDA, Adjusted EBITDA, Distributable Cash Flow and Distribution Coverage Ratio have important limitations as analytical tools because they exclude some but not all items that affect net income. Additionally, because EBITDA, Adjusted EBITDA, Distributable Cash Flow and Distribution Coverage Ratio may be defined differently by other companies in our industry, our definitions may not be comparable to similarly titled measures of other companies, thereby diminishing their utility.
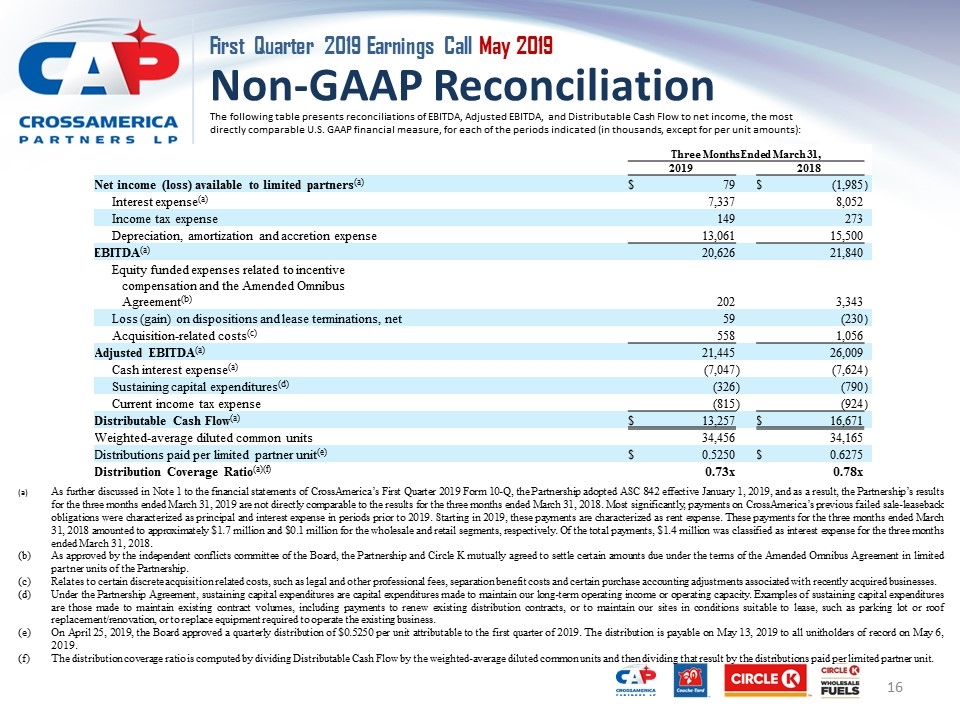
Non-GAAP Reconciliation The following table presents reconciliations of EBITDA, Adjusted EBITDA, and Distributable Cash Flow to net income, the most directly comparable U.S. GAAP financial measure, for each of the periods indicated (in thousands, except for per unit amounts): (a)As further discussed in Note 1 to the financial statements of CrossAmerica’s First Quarter 2019 Form 10-Q, the Partnership adopted ASC 842 effective January 1, 2019, and as a result, the Partnership’s results for the three months ended March 31, 2019 are not directly comparable to the results for the three months ended March 31, 2018. Most significantly, payments on CrossAmerica’s previous failed sale-leaseback obligations were characterized as principal and interest expense in periods prior to 2019. Starting in 2019, these payments are characterized as rent expense. These payments for the three months ended March 31, 2018 amounted to approximately $1.7 million and $0.1 million for the wholesale and retail segments, respectively. Of the total payments, $1.4 million was classified as interest expense for the three months ended March 31, 2018. (b) As approved by the independent conflicts committee of the Board, the Partnership and Circle K mutually agreed to settle certain amounts due under the terms of the Amended Omnibus Agreement in limited partner units of the Partnership. (c) Relates to certain discrete acquisition related costs, such as legal and other professional fees, separation benefit costs and certain purchase accounting adjustments associated with recently acquired businesses. (d) Under the Partnership Agreement, sustaining capital expenditures are capital expenditures made to maintain our long-term operating income or operating capacity. Examples of sustaining capital expenditures are those made to maintain existing contract volumes, including payments to renew existing distribution contracts, or to maintain our sites in conditions suitable to lease, such as parking lot or roof replacement/renovation, or to replace equipment required to operate the existing business. (e) On April 25, 2019, the Board approved a quarterly distribution of $0.5250 per unit attributable to the first quarter of 2019. The distribution is payable on May 13, 2019 to all unitholders of record on May 6, 2019. (f) The distribution coverage ratio is computed by dividing Distributable Cash Flow by the weighted-average diluted common units and then dividing that result by the distributions paid per limited partner unit. Three Months Ended March 31, 2019 2018 Net income (loss) available to limited partners(a) $ 79 $ (1,985 ) Interest expense(a) 7,337 8,052 Income tax expense 149 273 Depreciation, amortization and accretion expense 13,061 15,500 EBITDA(a) 20,626 21,840 Equity funded expenses related to incentive compensation and the Amended Omnibus Agreement(b) 202 3,343 Loss (gain) on dispositions and lease terminations, net 59 (230 ) Acquisition-related costs(c) 558 1,056 Adjusted EBITDA(a) 21,445 26,009 Cash interest expense(a) (7,047 ) (7,624 ) Sustaining capital expenditures(d) (326 ) (790 ) Current income tax expense (815 ) (924 ) Distributable Cash Flow(a) $ 13,257 $ 16,671 Weighted-average diluted common units 34,456 34,165 Distributions paid per limited partner unit(e) $ 0.5250 $ 0.6275 Distribution Coverage Ratio(a)(f) 0.73x 0.78x


