SINGLE | TENANT | OPERATIONAL | REAL | ESTATE NYSE: STOR ir.storecapital.com 1Q22 Supplemental Information May 4, 2022 |
This Supplemental Information should be read together with the Company’s first quarter 2022 earnings press release (included as Exhibit 99.1 of the Company’s Current Report on Form 8 - K, filed on May 4, 2022) as certain disclosures, definitions and reconciliations in such release have not been included in this Supple men tal Information. 1 T ABLE OF C ONTENTS STORE is Single Tenant Operational Real Estate 2 About STORE Capital 2 Financial Condensed Consolidated Statements of Income 3 Funds from Operations and Adjusted Funds from Operations 4 Condensed Consolidated Balance Sheets 5 Debt Summary and Market Capitalization 6 Adjusted Debt to Adjusted EBITDA re 7 Long - Term Debt Maturities and Prepayment Terms 8 Debt Covenants 9 Portfolio Portfolio At A Glance 10 Acquisitions and Dispositions 11 Diversification Across Customers and Geographies 12 Diversification Across Industry Groups 13 Occupancy 15 Rent Escalations and Lease Expirations 16 Guidance 17 Footnotes 18 Supplemental Reporting Measures 19 Forward - Looking Statements 21 |
STORE IS S INGLE T ENANT O PERATIONAL R EAL E STATE What We Do We were formed to fill the needs of thousands of middle market and larger companies for efficient long - term capital for their pr ofit - center real estate. In addressing this large market, we have maintained a significant investment pipeline of targeted investment opportunities since th e day we opened our doors. These opportunities allow us to be selective, choosing strong tenants and investments that offer attractive risk - adjusted return s. Common Stock Our common stock is traded on the New York Stock Exchange under the symbol “STOR” Closing price on March 31, 2022: $29.23 Corporate Headquarters 8377 East Hartford Drive, Suite 100 Scottsdale, Arizona 85255 480.256.1100 About STORE Capital STORE Capital Corporation is an internally managed net - lease real estate investment trust, or REIT, that is a leader in the acquisition, investment and management of S ingle T enant O perational R eal E state. We are one of the largest and fastest growing net - lease REITs and own a large, well - diversified portfolio that consists of investments in 2,965 property locations aggregating $11.2 billion in gross investment dollars at March 31, 2022. Our customers operate across a wide variety of vital industries within the service, retail and manufacturing sectors of the U.S. economy, with restaurants, early childhood education centers, metal fabrication, automotive repair and maintenance and health clubs representing the top industries in our portfolio. We estimate the market for STORE Properties to be among the nation’s largest real estate sectors, exceeding $3.9 trillion in market value and including more than 2.0 million properties. For more information about STORE Capital, please visit our website at www.storecapital.com .. STORE Senior Leadership Team Mary Fedewa, President, Chief Executive Officer and Director Sherry Rexroad, Executive Vice President, Chief Financial Officer and Treasurer Craig Barnett, Executive Vice President – Underwriting and Portfolio Management Chad Freed, General Counsel, Executive Vice President and Secretary Tyler Maertz, Executive Vice President – Acquisitions Lori Markson, Executive Vice President – Portfolio Operations Alex McElyea, Executive Vice President – Data, Analytics and Business Strategy 2 |
C ONDENSED C ONSOLIDATED S TATEMENTS OF I NCOME Three Months Ended March 31, $ thousands, except share and per share data 2022 2021 Revenues: (unaudited) Rental revenues $ 202,061 $ 169,328 Interest income on loans and financing receivables 14,930 12,563 Other income 5,125 370 Total revenues 222,116 182,261 Expenses: Interest 43,999 41,828 Property costs 4,241 4,663 General and administrative 17,016 25,006 Depreciation and amortization 72,639 63,567 Provisions for impairment 912 7,350 Total expenses 138,807 142,414 Other Income: Net gain on dispositions of real estate 6,076 15,670 Loss from non - real estate, equity method investment (2,157) (363 ) Income before income taxes 87,228 55,154 Income tax expense 206 194 Net income $ 87,022 $ 54,960 Net income per share of common stock - basic and diluted $ 0.32 $ 0.21 Dividends declared per common share $ 0.385 $ 0.36 Weighted average common shares outstanding – basic 275,003,273 266,366,698 – diluted 275,003,273 266,366,698 3 |
F UNDS F ROM O PERATIONS AND A DJUSTED F UNDS FROM O PERATIONS 1 See footnotes on Page 18. .. Three Months Ended March 31, $ thousands, except per share data 2022 2021 (unaudited) NET INCOME $ 87,022 $ 54,960 Depreciation and amortization of real estate assets 72,566 63,507 Provision for impairment of real estate 1,200 5,350 Net gain on dispositions of real estate (6,076 ) (15,670 ) FUNDS FROM OPERATIONS (FFO) 2 $ 154,712 $ 108,147 Adjustments: Straight - line rental revenue, net: Fixed rent escalations accrued (1,502 ) (1,511 ) Construction period rent deferrals 1,366 628 Amortization of: Equity - based compensation 3 3,068 12,905 Deferred financing costs and other noncash interest expense 2,161 2,100 Lease - related intangibles and costs 678 827 (Reduction in) provision for loan losses (288 ) 2,000 Lease termination fees (4,174 ) - Capitalized interest (410 ) (214 ) Loss from non - real estate, equity method investment 2,157 363 ADJUSTED FUNDS FROM OPERATIONS (AFFO) 2 $ 157,768 $ 125,245 Net Income per share of common stock - basic and diluted 4 $ 0.32 $ 0.21 FFO per share of common stock - basic and diluted 4 $ 0.56 $ 0.41 AFFO per share of common stock - basic and diluted 4 $ 0.57 $ 0.47 4 |
C ONDENSED C ONSOLIDATED B ALANCE S HEETS $ thousands, except share and per share data March 31, 2022 December 31, 2021 Assets (unaudited) (audited) Investments: Real estate investments: Land and improvements $ 3,239,050 $ 3,133,402 Buildings and improvements 7,096,841 6,802,918 Intangible lease assets 59,216 54,971 Total real estate investments 10,395,107 9,991,291 Less accumulated depreciation and amortization (1,224,323 ) (1,159,292 ) 9,170,884 8,831,999 Real estate investments held for sale, net 33,234 25,154 Operating ground lease assets 32,960 33,318 Loans and financing receivables, net 736,410 697,269 Net investments 9,973,488 9,587,740 Cash and cash equivalents 39,340 64,269 Other assets, net 118,320 121,073 Total assets $ 10,131,148 $ 9,773,082 Liabilities and stockholders' equity Liabilities: Credit facility $ 359,000 $ 130,000 Unsecured notes payable, net 1,783,440 1,782,813 Non - recourse debt obligations of consolidated special purpose entities, net 2,410,834 2,425,708 Dividends payable 107,644 105,415 Operating lease liabilities 37,330 37,637 Accrued expenses, deferred revenue and other liabilities 145,909 147,380 Total liabilities 4,844,157 4,628,953 Stockholders' equity: Common stock, $0.01 par value per share, 375,000,000 shares authorized, 279,595,851 and 273,806,225 shares issued and outstanding, respectively 2,796 2,738 Capital in excess of par value 5,910,856 5,745,692 Distributions in excess of retained earnings (624,558 ) (602,137 ) Accumulated other comprehensive loss (2,103 ) (2,164 ) Total stockholders' equity 5,286,991 5,144,129 Total liabilities and stockholders' equity $ 10,131,148 $ 9,773,082 5 |
D EBT S UMMARY AND M ARKET C APITALIZATION DEBT SUMMARY DEBT MATURITIES STORE MASTER FUNDING » S&P rated AAA and A+ » Able to maintain constant leverage » Complete portfolio management flexibility » Non - recourse with minimal covenants » Provides borrowing diversity and prepayment flexibility » Enhances capital efficiency » BBB rating » S&P positive outlook » Efficient execution and pricing UNSECURED NOTES PAYABLE $ millions Weighted Average Interest Rate Expiration/ Maturity Date Outstanding Borrowings Gross Investment Amount of Collateral $600 MM unsecured credit facility LIBOR + spread June 2025 $ 359 $ - Unsecured notes payable 3.89% 2022 - 2031 1,800 - Total unsecured notes payable (short and long - term) 2,159 - STORE Master Funding net - lease mortgage notes payable 3.84% 2024 to 2034* 2,268 3,582 Other mortgage notes payable 4.86% 2022 to 2049 168 301 Total secured long - term debt 3.92% 2,436 3,883 Unencumbered real estate assets 7,315 Totals $ 4,595 $ 11,198 Long - Term Debt 33.2% Common Stock 64.0% Credit Facility 2.8% CAPITALIZATION AS OF MARCH 31, 2022 UNSECURED CREDIT FACILITY » $600MM immediate borrowings » $1B accordion feature * STORE Master Funding debt is prepayable 24 or 36 months prior to maturity – see Page 8 for details. 6 |
A DJUSTED D EBT TO A DJUSTED EBITDA RE .. $ millions (unaudited) As of March 31, 2022 Credit facility $ 359.0 Unsecured notes payable, net 1,783.4 Non - recourse debt obligations of consolidated special purpose entities, net 2,410.8 TOTAL DEBT $ 4,553.2 Adjustments: Unamortized net debt discount 5.1 Unamortized deferred financing costs 36.4 Cash and cash equivalents (39.3 ) Restricted cash deposits held for the benefit of lenders (2.0 ) ADJUSTED DEBT $ 4,553.4 Debt to Adjusted Debt 1 $ millions (unaudited) Three Months Ended March 31, 2022 NET INCOME $ 87.0 Adjustments: Interest 44.0 Income tax expense 0.2 Depreciation and amortization 72.7 EBITDA 203.9 Adjustments: Provision for impairment of real estate 1.2 Net gain on dispositions of real estate (6.1 ) EBITDA re 199.0 Adjustments: Net reduction in provision for loan losses (0.3 ) Lease termination fees ( 4.2 ) Loss from non - real estate, equity method investment 2.2 ADJUSTED EBITDA re $ 196.7 Estimated adjustment to Adjusted EBITDA re as if all real estate acquisitions and dispositions for the quarter ended March 31, 2022 had occurred as of January 1, 2022 4.3 ADJUSTED EBITDA re – CURRENT ESTIMATED RUN RATE $ 201.0 ANNUALIZED ADJUSTED EBITDA re $ 786.7 ANNUALIZED ADJUSTED EBITDA re – CURRENT ESTIMATED RUN RATE $ 804.0 ADJUSTED DEBT / ANNUALIZED ADJUSTED EBITDA re 5.8x ADJUSTED DEBT/ ANNUALIZED ADJUSTED EBITDA re – CURRENT ESTIMATED RUN RATE 5.7x Net Income to Adjusted EBITDA re 1 7 See footnotes on Page 18. .. |
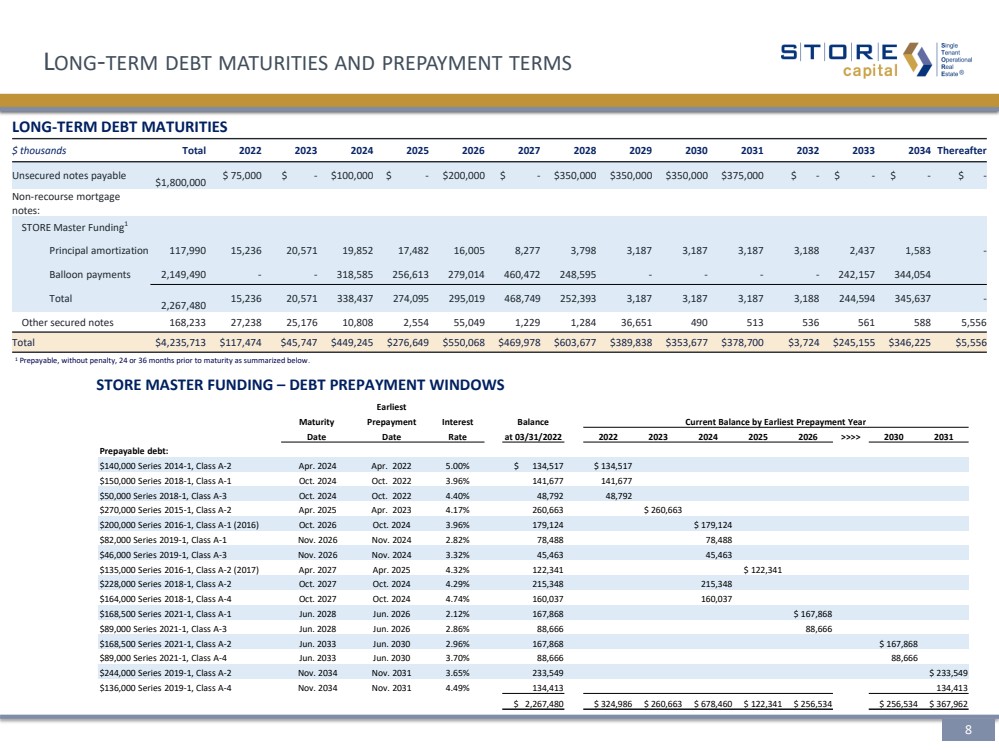
$ thousands Total 2022 2023 2024 2025 2026 2027 2028 2029 2030 2031 2032 2033 2034 Thereafter Unsecured notes payable $1,800,000 $ 75,000 $ - $100,000 $ - $200,000 $ - $350,000 $350,000 $350,000 $375,000 $ - $ - $ - $ - Non - recourse mortgage notes: STORE Master Funding 1 Principal amortization 117,990 15,236 20,571 19,852 17,482 16,005 8,277 3,798 3,187 3,187 3,187 3,188 2,437 1,583 - Balloon payments 2,149,490 - - 318,585 256,613 279,014 460,472 248,595 - - - - 242,157 344,054 Total 2,267,480 15,236 20,571 338,437 274,095 295,019 468,749 252,393 3,187 3,187 3,187 3,188 244,594 345,637 - Other secured notes 168,233 27,238 25,176 10,808 2,554 55,049 1,229 1,284 36,651 490 513 536 561 588 5,556 Total $4,235,713 $117,474 $45,747 $449,245 $276,649 $550,068 $469,978 $603,677 $389,838 $353,677 $378,700 $3,724 $245,155 $346,225 $5,556 Earliest Maturity Prepayment Interest Balance Current Balance by Earliest Prepayment Year Date Date Rate at 03/31/2022 2022 2023 2024 2025 2026 >>>> 2030 2031 Prepayable debt: $140,000 Series 2014 - 1, Class A - 2 Apr. 2024 Apr. 2022 5.00% $ 134,517 $ 134,517 $150,000 Series 2018 - 1, Class A - 1 Oct. 2024 Oct. 2022 3.96% 141,677 141,677 $50,000 Series 2018 - 1, Class A - 3 Oct. 2024 Oct. 2022 4.40% 48,792 48,792 $270,000 Series 2015 - 1, Class A - 2 Apr. 2025 Apr. 2023 4.17% 260,663 $ 260,663 $200,000 Series 2016 - 1, Class A - 1 (2016) Oct. 2026 Oct. 2024 3.96% 179,124 $ 179,124 $82,000 Series 2019 - 1, Class A - 1 Nov. 2026 Nov. 2024 2.82% 78,488 78,488 $46,000 Series 2019 - 1, Class A - 3 Nov. 2026 Nov. 2024 3.32% 45,463 45,463 $135,000 Series 2016 - 1, Class A - 2 (2017) Apr. 2027 Apr. 2025 4.32% 122,341 $ 122,341 $228,000 Series 2018 - 1, Class A - 2 Oct. 2027 Oct. 2024 4.29% 215,348 215,348 $164,000 Series 2018 - 1, Class A - 4 Oct. 2027 Oct. 2024 4.74% 160,037 160,037 $168,500 Series 2021 - 1, Class A - 1 Jun. 2028 Jun. 2026 2.12% 167,868 $ 167,868 $89,000 Series 2021 - 1, Class A - 3 Jun. 2028 Jun. 2026 2.86% 88,666 88,666 $168,500 Series 2021 - 1, Class A - 2 Jun. 2033 Jun. 2030 2.96% 167,868 $ 167,868 $89,000 Series 2021 - 1, Class A - 4 Jun. 2033 Jun. 2030 3.70% 88,666 88,666 $244,000 Series 2019 - 1, Class A - 2 Nov. 2034 Nov. 2031 3.65% 233,549 $ 233,549 $136,000 Series 2019 - 1, Class A - 4 Nov. 2034 Nov. 2031 4.49% 134,413 134,413 $ 2,267,480 $ 324,986 $ 260,663 $ 678,460 $ 122,341 $ 256,534 $ 256,534 $ 367,962 L ONG - TERM DEBT MATURITIES AND PREPAYMENT TERMS STORE MASTER FUNDING – DEBT PREPAYMENT WINDOWS LONG - TERM DEBT MATURITIES 1 Prepayable, without penalty, 24 or 36 months prior to maturity as summarized below .. .. 8 |
Presented below is a summary of the key financial covenants as they relate to STORE’s unsecured debt, which consists of: • Unsecured Revolving Credit Facility (Credit Facility) • Note Purchase Agreements (NPAs) • Senior Unsecured Notes (Public Notes) Such covenants are defined and calculated in accordance with the terms of the Credit Facility, the NPAs and the governing documents of the Public Notes. The NPAs contain financial covenants that are similar to those of the Credit Facility; therefore, the summary of key financial covenants is combined below, presenting the most restrictive covenant, if different. Credit Facility/NPAs – Key Covenants Required March 31, 2022 Maximum leverage ratio < 60% 40% Maximum unsecured leverage ratio < 60% 30% Maximum secured indebtedness ratio < 45% 21% Minimum fixed charge coverage ratio > 1.5x 3.9x Minimum unencumbered interest ratio > 2.0x 7.1x Public Notes – Key Covenants Required March 31, 2022 Limitation on incurrence of total debt < 60% 40% Limitation on incurrence of secured debt < 40% 21% Debt service coverage ratio > 1.5x 4.3x Maintenance of total unencumbered assets > 150% 340% 9 C OVENANTS – C REDIT F ACILITY AND U NSECURED N OTES P AYABLE |
P ORTFOLIO AT A G LANCE MARCH 31, 2022 2021 PORTFOLIO DIVERSITY Customers 573 522 Investment property locations 2,965 2,656 Top customer 1 3.0% 3.0% Top ten customers 1 18.0% 17.9% States 49 49 Industries in which our customers operate 121 117 ORIGINATION Investment portfolio subject to Master Leases 2 94% 94% Average investment amount / replacement cost (new) 3 80% 80% Weighted average annual lease escalation 4 1.8% 1.9% Weighted average remaining lease contract term ~13.3 years ~14 years PORTFOLIO MANAGEMENT Occupancy 5 99.5% 99.6% Locations subject to unit - level financial reporting 6 99% 99% Weighted average 4 - wall FCCR 7 4.7x 4.0x Weighted average unit FCCR 7 3.6x 3.0x $11.2 Billion Assets Under Management 80% Percentage of portfolio from direct origination 10 See footnotes on Page 18. .. |
Q1 2019 Q2 2019 Q3 2019 Q4 2019 Q1 2020 Q2 2020 Q3 2020 Q4 2020 Q1 2021 Q2 2021 Q3 2021 Q4 2021 Q1 2022 Acquisitions 1 : Gross acquisitions ($MM) $393 $364 $395 $537 $264 $135 $251 $436 $271 $341 $412 $486 $513 No. of properties 83 79 85 103 57 21 52 84 66 95 75 100 111 No. of new customers 15 16 15 19 9 9 10 13 10 9 9 18 19 No. of transactions 44 36 29 43 21 18 23 40 24 37 24 51 39 Average transaction size ($MM) $8.9 $10.1 $13.6 $12.5 $12.6 $7.5 $10.9 $10.9 $11.3 $9.2 $17.2 $9.5 $13.1 Initial cap rate 7.8% 7.9% 7.7% 7.7% 7.5% 8.7% 8.3% 8.1% 7.8% 7.8% 7.4% 7.2% 7.1% Annual lease escalation 1.9% 1.9% 1.9% 1.8% 2.5% 1.8% 1.9% 1.7% 1.9% 1.9% 1.8% 1.9% 1.8% Weighted avg. lease term (years) 17 18 17 17 16 17 18 18 18 17 16 17 17 Dispositions 1 : # nonperforming properties 2 2 - 8 5 6 10 7 12 19 6 9 9 3 Proceeds - nonperforming ($MM) $5.7 - $30.7 $5.6 $7.8 $25.4 $21.0 $11.7 $12.7 $19.6 $27.1 $26.7 $9.0 # performing properties 2 22 46 10 3 6 11 22 25 7 16 12 8 Proceeds - performing ($MM) $2.1 $87.4 $284.1 $32.0 $11.1 $19.5 $19.3 $99.4 $124.8 $15.4 $73.1 $58.4 $47.3 Cap rate – performing 7.1% 7.5% 7.4% 7.5% 7.0% 7.8% 7.0% 7.0% 7.8% 6.1% 6.7% 6.6% 7.0% A CQUISITIONS AND D ISPOSITIONS 11 See footnotes on Page 18. .. |
D IVERSIFICATION A CROSS C USTOMERS AND G EOGRAPHIES T OP T EN S TATES State % Base Rent and Interest 1 # of Properties Texas 11.2% 350 Illinois 6.1 181 California 5.8 80 Georgia 5.7 169 Florida 5.1 160 Wisconsin 5.0 87 Ohio 4.9 148 Arizona 4.3 90 Tennessee 3.7 124 Michigan 3.3 105 Top Ten States 55.1 1,494 All other (39 states) 44.9 1,471 Total 100.0% 2,965 T OP T EN C USTOMERS Customer % Base Rent and Interest 1 # of Properties Spring Education Group Inc. 3.0% 28 LBM Acquisition, LLC 2.9 156 Fleet Farm Group LLC 2.2 9 Cadence Education, Inc. 2.0 75 Dufresne Spencer Group Holdings, LLC 1.6 30 CWGS Group, LLC 1.4 20 Great Outdoors Group, LLC 1.3 9 American Multi - Cinema, Inc. 1.2 14 Zips Holdings, LLC 1.2 44 At Home Stores LLC 1.2 11 Top Ten Customers 18.0 396 All other (563 customers) 82.0 2,569 Total 100.0% 2,965 ❖ STORE Capital has a diverse customer base. At March 31, 2022, the Company’s property locations were operated by 573 customers; these customers operate their businesses across approximately 895 business concepts and the largest single concept represents 2.2% of base rent and interest. 12 See footnotes on Page 18. .. ❖ STORE Capital’s portfolio is also highly diversified by geography, as the Company’s property locations can be found in every state except Hawaii. |
D IVERSIFICATION A CROSS I NDUSTRY G ROUPS 80% OF P ORTFOLIO IS IN C USTOMER - F ACING I NDUSTRIES Located near target customers Not readily available online Broad array of everyday services SERVICE Service 64% Manufacturing 20% Service - oriented retail 16% Customer Industry Group % Base Rent and Interest 1 # of Properties Building Sq. Ft. (thousands) Restaurants – full service 7.0% 360 2,547 Restaurants – limited service 4.9 403 1,286 Early childhood education 6.1 277 2,919 Automotive repair and maintenance 5.6 241 1,385 Health clubs 5.2 91 3,199 Pet care 3.4 186 1,743 Lumber and construction materials wholesalers 3.2 167 6,865 Medical and dental 3.2 161 1,476 Movie theaters 3.2 36 1,842 Behavioral health 3.2 87 1,705 Family entertainment 2.9 40 1,569 Elementary and secondary schools 2.9 16 850 Equipment sales and leasing 1.8 56 1,399 Logistics 1.8 34 4,227 Wholesale automobile auction 1.1 8 428 All other service (24 industry groups) 8.6 228 14,363 Total service 64.1% 2,391 47,803 The business concepts of our customers are diversified across 121 different industries in the service, retail and manufacturing sectors of the U.S. economy. We group these industries into 79 different industry groups as shown in the following tables. 13 See footnotes on Page 18. .. |
D IVERSIFICATION A CROSS I NDUSTRY G ROUPS ( CONTINUED ) Customer Industry Group % Base Rent and Interest 1 # of Properties Building Sq. Ft. (thousands) Farm and ranch supply 3.3% 41 4,136 Furniture 3.2 64 3,569 Recreational vehicle dealers 2.1 32 1,257 Home furnishings 1.9 28 2,475 Used car dealers 1.4 27 269 Hunting and fishing 1.3 8 630 New car dealers 1.0 14 505 All other retail (11 industry groups) 1.5 46 1,986 Total service - oriented retail 15.7% 260 14,827 Customer Industry Group % Base Rent and Interest 1 # of Properties Building Sq. Ft. (thousands) Metal fabrication 5.9% 112 14,499 Food processing 2.9 29 3,547 Automotive parts and accessories 1.7 25 4,584 Plastic and rubber products 1.7 18 3,260 Furniture manufacturing 1.2 12 2,980 Aerospace product and parts 1.1 25 1,806 All other manufacturing (16 industry groups) 5.7 93 10,213 Total manufacturing 20.2% 314 40,889 Total Portfolio 100.0% 2,965 103,519 S ERVICE - ORIENTED RETAIL Located in retail corridors Internet resistant High experiential component MANUFACTURING Primarily located in industrial parks Strategically near customers/suppliers Broad array of industries Making everyday necessities 14 See footnotes on Page 18. .. |
99.5% 99.5% 99.6% 99.7% 99.6% 99.5% 99.4% 99.5% 99.5% 80% 84% 88% 92% 96% 100% Q1 2020 Q2 2020 Q3 2020 Q4 2020 Q1 2021 Q2 2021 Q3 2021 Q4 2021 Q1 2022 Percentage of Properties Occupied O CCUPANCY 1 15 See footnotes on Page 18. .. |
R ENT E SCALATIONS AND C ONTRACT E XPIRATIONS FREQUENT RENT ESCALATIONS PROVIDE A MEASURE OF INFLATION PROTECT ION AND A STRONG POTENTIAL SOURCE OF INTERNAL GROWTH Lease Escalation Frequency % Base Rent and Interest 1 Weighted Average Annual Escalation Rate 2 Annually 76% 1.9% Every 5 years 17 1.8% Other escalation frequencies 6 1.2% Flat 1 NA Total / Weighted Average 100% 1.8% Contractual Fixed Increases 14% Flat 1% Contractual CPI - Based Increases 85% 77.9% 17.7% 4.4% Thereafter 2027 - 2031 2022 - 2026 Year of Lease or Loan Maturity % Base Rent and Interest 1 # of Properties 3 Remainder of 2022 0.3% 18 2023 1.1 10 2024 0.6 21 2025 0.9 23 2026 1.5 55 2027 1.6 55 2028 2.9 68 2029 4.7 153 2030 3.4 147 2031 5.1 214 Thereafter 77.9 2,185 Total 100.0% 2,949 CONTRACT EXPIRATIONS 1 - BY YEAR OF LEASE EXPIRATION OR LOAN MATURITY 16 See footnotes on Page 18. .. |
2022 G UIDANCE 2022 Guidance Net income per share (excluding gains or losses on sales of property) $1.06 - $1.08 Depreciation and amortization of real estate assets per share $1.07 - $1.08 FFO per share $2.13 - $2.16 Straight - line rent and other amortization adjustments per share $0.07 AFFO per share 1 $2.20 - $2.23 Estimated run - rate funded debt / adjusted EBITDA 2 5.5x – 6.0x Real estate acquisition volume, net of projected property sales ~$1.3 billion - $1.5 billion Weighted average cap rate on new acquisitions 7.0 – 7.2% 1 AFFO per share is sensitive to the timing and amount of real estate acquisitions and capital markets activities during the year, as well as to the spread achieved between the lease rates on new acquisitions and the interest rates on borrowings used to finance those acquisitions. See page 19 for further discussion regarding use of FFO and AFFO. 2 See page 20 for the definition of Adjusted EBITDA. 17 |
F OOTNOTES Page 4 1 See page 19 for discussion regarding use of Funds From Operations and Adjusted Funds from Operations. 2 FFO and AFFO for the three months ended March 31, 2022 and 2021, include approximately $0.7 million and $2.0 million, respectively, of net revenue that is subject to the short - term deferral arrangements entered into in response to the COVID - 19 pandemic; the Company accounts for these deferral arrangements as rental revenue and a corresponding increase in receivables. For the three months ended March 31, 2022 and 2021, FFO and AFFO exclude $3.4 million and $5.9 million, respectively, collected under these short - term deferral arrangements. 3 For the three months March 31, 2021, stock - based compensation expense included $10.1 million of expense related to the modification of certain performance - based awards granted in 2018 and 2019. 4 Under the two - class method, earnings attributable to unvested restricted stock are deducted from earnings in the computation of per share amounts applicable. Page 7 1 See page 20 for discussion regarding use of EBITDA, EBITDAre , Adjusted EBITDAre and Adjusted Debt. Page 10 1 Denotes the percentage the Company’s largest customer or its top ten largest customers represent of the Company’s total base rent and interest as of March 31, 2022. See Page 12 for listing of top ten customers. 2 The percentage of investment portfolio subject to master leases represents the percentage (based on base rent and interest) of the investment portfolio in multiple properties with a single customer subject to master leases. Approximately 87% of the investment portfolio involves multiple properties with a single customer, whether or not subject to a master lease. 3 The average investment amount/replacement cost (new) represents the ratio of purchase price to replacement cost (new) at acquisition. 4 Weighted average annual lease escalation represents the weighted average annual escalation rate of the entire portfolio as if all escalations occurred annually. For escalations based on a formula including CPI, assumes the stated fixed percentage in the contract or assumes 1.5% if no fixed percentage is in the contract. For contracts with no escalations remaining in the current lease term, assumes the escalation in the extension term. Calculation excludes contracts representing less than 0.1% of base rent and interest where there are no further escalations remaining in the current lease term and there are no extension options. 5 STORE defines occupancy as a property being subject to a lease or loan contract. As of March 31, 2022, sixteen of the Company’s properties were vacant and not subject to a contract. 6 Of the 99% of properties that are required to provide unit - level reporting, 97.9% have provided current obligated statements as of April 21, 2022. 7 Represents the weighted - average 4 - Wall and unit fixed charge coverage ratio of the portfolio as of March 31, 2022. The 4 - Wall coverage ratio refers to a unit’s FCCR before taking into account standardized corporate overhead expense. STORE also calculates a unit fixed charge coverage ratio generally as the ratio of (i) the unit’s EBITDAR, less a standardized corporate overhead expense based on estimated industry standards, to (ii) the unit’s total fixed charges, which are its lease expense, interest expense and scheduled principal payments on indebtedness (if applicable). The median 4 - Wall coverage ratio and unit FCCR were 3.1x and 2.6x, respectively, as of March 31, 2022, 2.7x and 2.2x, respectively, as of March 31, 2021 and 2.6x and 2.2x, respectively, as of March 31, 2020. Page 11 1 Acquisitions represent both acquisitions of real estate and investment in loans and financing receivables. Dispositions represent the net proceeds received from the sale of real estate and lease termination fees received in conjunction with those sales. 2 Includes the number of properties sold that were vacant or not performing at the time of sale. Pages 12, 13 and 14 1 Data as of March 31, 2022, by percentage of base rent and interest (based on rates in effect on March 31, 2022, for all leases, loans and financing receivables in place as of that date). Page 15 1 STORE defines occupancy as a property being subject to a lease or loan contract. As of March 31, 2022, sixteen of the Company’s properties were vacant and not subject to a contract. Page 16 1 Data as of March 31, 2022, by percentage of base rent and interest (based on rates in effect on March 31, 2022, for all leases, loans and financing receivables in place as of that date). 2 Represents the weighted average annual escalation rate of the entire portfolio as if all escalations occurred annually. For escalations based on a formula including CPI, assumes the stated fixed percentage in the contract or assumes 1.5% if no fixed percentage is in the contract. For contracts with no escalations remaining in the current lease term, assumes the escalation in the extension term. 3 Excludes 16 properties that were vacant and not subject to a lease as of March 31, 2022. 18 |
S UPPLEMENTAL R EPORTING M EASURES Funds from Operations, or FFO, and Adjusted Funds from Operations, or AFFO Our reported results are presented in accordance with U.S. generally accepted accounting principles, or GAAP. We also disclose Funds from Operations, or FFO, and Adjusted Funds from Operations, or AFFO, both of which are non - GAAP measures. We believe these two non - GAAP financial measures are useful to investors because they are widely accepted industry measures used by analysts and investors to compare the operating performance of REITs. FFO and AFFO do not represent cash generated from operating activities and are not necessarily indicative of cash available to fund cash requirements; accordingly, they should not be considered alternatives to net income as a performance measure or to cash flows from operations as reported on a statement of cash flows as a liquidity measure and should be considered in addition to, and not in lieu of, GAAP financial measures. We compute FFO in accordance with the definition adopted by the Board of Governors of the National Association of Real Estate Investment Trusts, or NAREIT. NAREIT defines FFO as GAAP net income, excluding gains (or losses) from extraordinary items and sales of depreciable property, real estate impairment losses, and depreciation and amortization expense from real estate assets, including the pro rata share of such adjustments of unconsolidated subsidiaries. To derive AFFO, we modify the NAREIT computation of FFO to include other adjustments to GAAP net income related to certain revenues and expenses that have no impact on our long - term operating performance, such as straight - line rents, amortization of deferred financing costs and stock - based compensation. In addition, in deriving AFFO, we exclude certain other costs not related to our ongoing operations, such as the amortization of lease - related intangibles and executive severance and transition costs. FFO is used by management, investors and analysts to facilitate meaningful comparisons of operating performance between periods and among our peers primarily because it excludes the effect of real estate depreciation and amortization and net gains (or losses) on sales, which are based on historical costs and implicitly assume that the value of real estate diminishes predictably over time, rather than fluctuating based on existing market conditions. Management believes that AFFO provides more useful information to investors and analysts because it modifies FFO to exclude certain additional revenues and expenses such as, as applicable, straight - line rents, including construction period rent deferrals, and the amortization of deferred financing costs, stock - based compensation, lease - related intangibles, and executive severance and transition costs as such items have no impact on long - term operating performance. As a result, we believe AFFO to be a more meaningful measurement of ongoing performance that allows for greater performance comparability. Therefore, we disclose both FFO and AFFO and reconcile them to the most appropriate GAAP performance metric, which is net income. STORE Capital’s FFO and AFFO may not be comparable to similarly titled measures employed by other companies. 19 |
S UPPLEMENTAL R EPORTING M EASURES We believe that presenting supplemental reporting measures, or non - GAAP measures, such as EBITDA, EBITDA re and Adjusted EBITDA re , is useful to investors and analysts because it provides important supplemental information concerning our operating performance exclusive of certain non - cash and other costs. These non - GAAP measures have limitations as they do not include all items of income and expense that affect operations. Accordingly, they should not be considered alternatives to net income as a performance measure and should be considered in addition to, and not in lieu of, GAAP financial measures. Our presentation of such non - GAAP measures may not be comparable to similarly titled measures employed by other companies. EBITDA, EBITDA re and Adjusted EBITDA re EBITDA represents earnings (GAAP net income) plus interest expense, income tax expense, depreciation and amortization. We compute EBITDAre in accordance with the definition adopted by NAREIT. NAREIT defines EBITDA re as EBITDA (as defined above) excluding gains (or losses) from the sales of depreciable property and real estate impairment losses. To derive Adjusted EBITDAre we modify the NAREIT definition of EBITDA re to exclude other items included in GAAP net income, such as provisions for loan losses and executive severance, as such items are not related to our ongoing performance. Note: The adjustments to derive Adjusted EBITDAre may not exist in every quarter, therefore EBITDAre and Adjusted EBITDAre may be equal. Annualized Adjusted EBITDA re and Adjusted Debt Annualized Adjusted EBITDAre is calculated by multiplying Adjusted EBITDA re for the most recently completed fiscal quarter by four. Annualized Adjusted EBITDAre – Current Estimated Run Rate is based on an estimated Adjusted EBITDA re calculated as if all leases and loans in place as of the last date of the most recently completed fiscal quarter had been in place as of the beginning of such quarter; then annualizing that estimated Adjusted EBITDA re for the quarter by multiplying it by four. You should not unduly rely on this metric as it is based on several assumptions and estimates that may prove to be inaccurate. Our actual reported Adjusted EBITDA re for future periods may be significantly less than that implied by our reported Annualized Adjusted EBITDA re – Current Estimated Run Rate for a variety of reasons. Adjusted Debt represents our outstanding debt obligations excluding unamortized deferred financing costs and net debt premium, further reduced for cash and cash equivalents and restricted cash deposits held for the benefit of lenders. We believe excluding unamortized deferred financing costs and net debt premium, cash and cash equivalents and restricted cash deposits held for the benefit of lenders provides an estimate of the net contractual amount of borrowed capital to be repaid, which we believe is a beneficial disclosure to investors and analysts. Adjusted Debt to Annualized Adjusted EBITDA re Adjusted Debt to Annualized Adjusted EBITDAre , or leverage, is a supplemental non - GAAP financial measure we use to evaluate the level of borrowed capital being used to increase the potential return of our real estate investments. We calculate leverage by dividing Adjusted Debt by Annualized Adjusted EBITDA re .. Because our portfolio growth level is significant to the overall size of the Company, we believe that presenting this leverage metric on a run rate basis is more meaningful than presenting the metric for the historical quarterly period, and we refer to this metric as Adjusted Debt to Annualized Adjusted EBITDA re — Current Estimated Run Rate. Leverage should be considered as a supplemental measure of the level of risk to which stockholder value may be exposed. Our computation of leverage may differ from the methodology employed by other companies and, therefore, may not be comparable to other measures. Note: NAREIT issued a white paper in 2017 recommending that companies that report EBITDA also report EBITDA re .. 20 |
Forward - Looking Statements Certain statements contained in this document that are not historical facts contain forward - looking statements within the meaning of Section 27A of the Securities Act of 1933, as amended, and within the meaning of Section 21E of the Securities Exchange Act of 1934, as amended, that are subject to the “safe harbor” created by those sections. Forward - looking statements can be identified by the use of words such as "estimate," "anticipate," "expect," "believe," "intend," "may," "will," "should," "seek," "approximate" or "plan," or the negative of these words and phrases or similar words or phrases. Forward - looking statements, by their nature, involve estimates, projections, goals, forecasts and assumptions and are subject to risks and uncertainties that could cause actual results or outcomes to differ materially from those expressed in the forward - looking statements. For more information on risk factors for our business, please refer to the periodic reports we file with the Securities and Exchange Commission from time to time. These forward - looking statements herein speak only as of the date of this document and should not be relied upon as predictions of future events. STORE Capital expressly disclaims any obligation or undertaking to update or revise any forward - looking statements contained herein, to reflect any change in STORE Capital’s expectations with regard thereto, or any other change in events, conditions or circumstances on which any such statement is based, except as required by law. F ORWARD - L OOKING S TATEMENTS Investor and Media Contacts: Financial Profiles, Inc. Moira Conlon, (310) 622 - 8220 Megan McGrath, (310) 622 - 8248 STORECapital@finprofiles.com 21 |