UNITED STATES
SECURITIES AND EXCHANGE COMMISSION
Washington, D.C. 20549
FORM N-CSR
CERTIFIED SHAREHOLDER REPORT OF REGISTERED
MANAGEMENT INVESTMENT COMPANIES
Investment Company Act file number | 811-22658 |
|
Nuveen Real Asset Income and Growth Fund |
(Exact name of registrant as specified in charter) |
|
Nuveen Investments 333 West Wacker Drive Chicago, IL 60606 |
(Address of principal executive offices) (Zip code) |
|
Kevin J. McCarthy Nuveen Investments 333 West Wacker Drive Chicago, IL 60606 |
(Name and address of agent for service) |
|
Registrant’s telephone number, including area code: | (312) 917-7700 | |
|
Date of fiscal year end: | December 31 | |
|
Date of reporting period: | June 30, 2012 | |
| | | | | | |
Form N-CSR is to be used by management investment companies to file reports with the Commission not later than 10 days after the transmission to stockholders of any report that is required to be transmitted to stockholders under Rule 30e-1 under the Investment Company Act of 1940 (17 CFR 270.30e-1). The Commission may use the information provided on Form N-CSR in its regulatory, disclosure review, inspection, and policymaking roles.
A registrant is required to disclose the information specified by Form N-CSR, and the Commission will make this information public. A registrant is not required to respond to the collection of information contained in Form N-CSR unless the Form displays a currently valid Office of Management and Budget ("OMB") control number. Please direct comments concerning the accuracy of the information collection burden estimate and any suggestions for reducing the burden to Secretary, Securities and Exchange Commission, 450 Fifth Street, NW, Washington, DC 20549-0609. The OMB has reviewed this collection of information under the clearance requirements of 44 U.S.C. ss. 3507.
ITEM 1. REPORTS TO STOCKHOLDERS.

Closed-End Funds
Nuveen Investments
Closed-End Funds
Seeks High Current Income and Capital Appreciation
of Commercial Real Estate Investments
Semi-Annual Report
June 30, 2012

Nuveen Real Asset Income and Growth Fund
JRI

LIFE IS COMPLEX.
Nuveen makes things e-simple.
It only takes a minute to sign up for e-Reports. Once enrolled, you'll receive an e-mail as soon as your Nuveen Fund information is ready. No more waiting for delivery by regular mail. Just click on the link within the e-mail to see the report and save it on your computer if you wish.
Free e-Reports right to your e-mail!
www.investordelivery.com
If you receive your Nuveen Fund distributions and statements from your financial advisor or brokerage account.
OR
www.nuveen.com/accountaccess
If you receive your Nuveen Fund distributions and statements directly from Nuveen.

Table of Contents
| Chairman's Letter to Shareholders | | | 4 | | |
|
| Portfolio Managers' Comments | | | 5 | | |
|
| Fund Leverage and Other Information | | | 7 | | |
|
| Share Distribution and Price Information | | | 9 | | |
|
| Performance Overview | | | 11 | | |
|
| Portfolio of Investments | | | 12 | | |
|
| Statement of Assets & Liabilities | | | 18 | | |
|
| Statement of Operations | | | 19 | | |
|
| Statement of Changes in Net Assets | | | 20 | | |
|
| Statement of Cash Flows | | | 21 | | |
|
| Financial Highlights | | | 22 | | |
|
| Notes to Financial Statements | | | 24 | | |
|
| Annual Investment Management Agreement Approval Process | | | 32 | | |
|
| Reinvest Automatically, Easily and Conveniently | | | 39 | | |
|
| Glossary of Terms Used in this Report | | | 41 | | |
|
| Additional Fund Information | | | 43 | | |
|
Chairman's
Letter to Shareholders

Dear Shareholders,
Investors have many reasons to remain cautious. The challenges in the Euro area are casting a shadow over global economies and financial markets. The political support for addressing fiscal issues is eroding as the economic and social impacts become more visible. At the same time, member nations appear unwilling to provide adequate financial support or to surrender sufficient sovereignty to strengthen the banks or unify the Euro area financial system. The gains made in reducing deficits, and the hard-won progress on winning popular acceptance of the need for economic austerity, are at risk. To their credit, European political leaders press on to find compromise solutions, but there is increasing concern that time will begin to run out.
In the U.S., strong corporate earnings have enabled the equity markets to withstand much of the downward pressures coming from weakening job creation, slower economic growth and political uncertainty. The Fed remains committed to low interest rates but has refrained from predicting another program of quantitative easing unless economic growth were to weaken significantly or the threat of recession appears on the horizon. Pre-election maneuvering has added to the already highly partisan atmosphere in the Congress. The end of the Bush-era tax cuts and implementation of the spending restrictions of the Budget Control Act of 2011, both scheduled to take place at year-end, loom closer.
During the last year, U.S. based investors have experienced a sharp decline and a strong recovery in the equity markets. The experienced investment teams at Nuveen keep their eye on a longer time horizon and use their practiced investment disciplines to negotiate through market peaks and valleys to achieve long-term goals for investors. Experienced professionals pursue investments that will weather short-term volatility and at the same time, seek opportunities that are created by markets that overreact to negative developments. Monitoring this process is an important consideration for the Fund Board as it oversees your Nuveen Fund on your behalf.
As always, I encourage you to contact your financial consultant if you have any questions about your investment in a Nuveen Fund. On behalf of the other members of your Fund Board, we look forward to continuing to earn your trust in the months and years ahead.
Sincerely,

Robert P. Bremner
Chairman of the Board
August 23, 2012
Nuveen Investments
4
Portfolio Managers' Comments
Certain statements in this report are forward-looking statements. Discussions of specific investments are for illustration only and are not intended as recommendations of individual investments. The forward-looking statements and other views expressed herein are those of the portfolio managers as of the date of this report. Actual future results or occurrences may differ significantly from those anticipated in any forward-looking statements and the views expressed herein are subject to change at any time, due to numerous market and other factors. The Fund disclaims any obligation to update publicly or revise any forward-looking statements or views expressed herein.
Ratings shown are the highest rating given by one of the following national rating agencies: Standard & Poor's Group, Moody's Investors Service, Inc. or Fitch, Inc. Credit ratings are subject to change. AAA, AA, A, and BBB are investment grade ratings; BB, B, CCC, CC, C and D are below investment grade ratings. Certain bonds backed by U.S. Government or agency securities are regarded as having an implied rating equal to the rating of such securities. Holdings designated N/R are not rated by a national rating agency.
Nuveen Real Asset Income and Growth Fund (JRI)
The Nuveen Real Asset Income and Growth Fund (JRI) features portfolio management by Nuveen Asset Management, LLC, an affiliate of Nuveen Investments. Jay Rosenberg, who has more than 17 years of financial industry experience, John Wenker, with 29 years of experience and Jeff Schmitz, CFA, who has 26 years of experience, have managed the Fund since its inception.
In the following paragraphs, they talk about their management strategy and performance of the Fund over the period ended June 30, 2012. While this is a semi-annual report, the Fund is not reviewing a full six months of performance as the inception date for JRI was April 25, 2012.
What key strategies were used to manage the Fund during this reporting period?
The Fund launched on April 25, 2012, with an objective of providing a high level of current income and long-term capital appreciation. In an effort to achieve this objective, the Fund invests in a global portfolio of infrastructure and commercial real estate related securities (i.e. real assets) across the capital structure. Since its inception, the proceeds from the Fund's initial public offering have been invested with an eye toward our long-term target allocations: 33% in global infrastructure common stock, 15% in real estate investment trust (REIT) common stock, 12% in global infrastructure preferred stock and hybrids, 20% in REIT preferred stock and 20% in debt securities.
We selected securities through an investment process that screens for companies and assets across the real assets market that provide higher dividend yields. From the group of securities providing the highest yields, we focused on owning those companies and securities with the highest total return potential in the Fund's portfolio. Our process places a premium on finding securities whose revenues come from tangible assets with long-term concessions, contracts or leases and are therefore capable of producing steady, predictable and recurring cash flows. The Fund's management team employs a bottom-up, fundamental approach to security selection and portfolio construction. We look for stable companies that demonstrate consistent and growing cash flow, strong balance sheets and histories of being good stewards of shareholder capital.
Over the long term, the Fund's portfolio should be relatively balanced between U.S. and non-U.S. exposure; however, at the end of this reporting period, the overall portfolio was roughly 60% U.S. and 40% non-U.S. exposure, primarily because of a current underweight to Europe. Once Europe has achieved some stability, we intend to be more evenly
Nuveen Investments
5
Past performance is not predictive of future results. Current performance may be higher or lower than the data shown. Returns do not reflect the deduction of taxes that shareholders may have to pay on Fund distributions or upon the sale of Fund shares.
For additional information, see the Performance Overview page in this report.
* Since inception returns are from 4/25/12.
** Refer to Glossary of Terms Used in this Report for definitions. Indexes are not available for direct investment.
balanced as there are many European companies with qualifying dividend yields that we are currently avoiding in the Fund.
How did the Fund perform over this reporting period?
The performance of the Fund, as well as for its comparative benchmark and index, is presented in the accompanying table.
Cumulative Total Return on Net Asset Value
For the period ended 6/30/12
| | | Since Inception* | |
| JRI | | | 0.42 | % | |
| Comparative Benchmark** | | | 1.09 | % | |
| MSCI World Index** | | | -3.13 | % | |
The Fund underperformed its Comparative Benchmark, but outperformed the Morgan Stanley Capital International (MSCI) World Index for the abbreviated performance period from April 25, 2012 through June 30, 2012. During the period's risk-averse environment, the Fund experienced widespread strength across several of it sectors while generating an attractive level of yield in excess of the blended benchmark's yield. Generally speaking, the Fund benefited from its lower volatility profile, which stems from our focus on owning companies and assets that are, on balance, more mature and stable with higher payout ratios.
The best performing areas of the Fund were infrastructure preferreds, REIT common equities, high yield bonds and REIT preferreds during this abbreviated reporting period. Our outperformance in the infrastructure preferred sector of the Fund was primarily the result of our exposure to hybrid bonds, which performed very well as investors drove up the valuations of these securities in their quest for yield. The REIT common equity portion of the Fund also produced positive results due to our focus on owning higher yielding, more stable and mature companies, which outpaced riskier, more total-return oriented securities. The Fund's high-yield bond portfolio experienced solid performance as a result of our focus on the higher quality tiers of the market. High yield also benefited as strong inflows into the segment coupled with a fall-off in underwriting caused investors to bid up existing bonds. In the REIT preferred portion of the Fund, performance was aided by our exposure to non-rated securities and our monitoring of call and credit risk in this segment. Finally, the infrastructure common equity segment produced flat results as solid stock selection across many sectors was offset by weakness from our Canadian pipeline exposure.
Nuveen Investments
6
Fund Leverage
and Other Information
IMPACT OF THE FUND'S LEVERAGE STRATEGY ON PERFORMANCE
The Fund intends to use leverage because its managers believe that, over time, leveraging provides opportunities for additional income and total return for common shareholders. However, use of leverage also can expose common shareholders to additional volatility. For example, as the prices of securities held by a fund decline, the negative impact of these valuation changes on common share net asset value and common shareholder total return is magnified by the use of leverage. Conversely, leverage may enhance common share returns during periods when the prices of securities held by a fund generally are rising. Subsequent to the reporting period, the Fund entered into a $90 million borrowings facility as a means of financial leverage.
RISK CONSIDERATIONS
Fund shares are not guaranteed or endorsed by any bank or other insured depository institution, and are not federally insured by the Federal Deposit Insurance Corporation. Shares of closed-end funds are subject to investment risks, including the possible loss of principal invested. Past performance is no guarantee of future results. The following risks are listed in order of priority.
Investment and Market Risk. An investment in common shares is subject to investment risk, including the possible loss of the entire principal amount that you invest. Your investment in common shares represents an indirect investment in the corporate securities owned by the Fund, which generally trade in the over-the-counter markets. Your common shares at any point in time may be worth less than your original investment, even after taking into account the reinvestment of Fund dividends and distributions.
Price Risk. Shares of closed-end investment companies like the Fund frequently trade at a discount to their net asset value (NAV). Your common shares at any point in time may be worth less than your original investment, even after taking into account the reinvestment of Fund dividends and distributions.
Tax Risk. The tax treatment of Fund distributions may be affected by new IRS interpretations of the Internal Revenue Code and future changes in tax laws and regulations. This is particularly true for funds employing a managed distribution program.
Real Estate Risk. Your investment in the Fund is linked to the performance of the commercial real estate markets, which may fall due to increasing vacancies, declining rents or the failure of borrowers to pay their loans.
Common Stock Risk. Common stock returns often have experienced significant volatility.
Nuveen Investments
7
Issuer Credit Risk. This is the risk that a security in the Fund's portfolio will fail to make dividend or interest payments when due.
Non-U.S. Securities Risk. Investments in non-U.S securities involve special risks not typically associated with domestic investments including currency risk and adverse political, social and economic development. These risks often are magnified in emerging markets.
Interest Rate Risk. Fixed-income securities such as bonds, preferred, convertible and other debt securities will decline in value if market interest rates rise.
Preferred Stock Risk. Preferred stocks are subordinated to bonds and other debt instruments in a company's capital structure, and therefore are subject to greater credit risk.
Convertible Securities Risk. Convertible securities generally offer lower interest or dividend yields than non-convertible fixed-income securities of similar credit quality.
Currency Risk. Changes in exchange rates will affect the value of the Fund's investments.
Reinvestment Risk. If market interest rates decline, income earned from the Fund's portfolio may be reinvested at rates below that of the original bond that generated the income.
Nuveen Investments
8
Share Distribution
and Price Information
Distribution Information
The following information regarding the Fund's distributions is current as of June 30, 2012, and likely will vary over time based on the Fund's investment activities and portfolio investment value changes.
During this abbreviated reporting period, the Fund had not yet declared its initial quarterly distributions to shareholders. The Fund declared its initial quarterly distribution to shareholders of $0.3675 per share in July 2012.
The Fund intends to employ financial leverage through the use of bank borrowings. Financial leverage provides the potential for higher earnings (net investment income), total returns and distributions over time, but-as noted earlier-also increases the variability of shareholders' net asset value per share in response to changing market conditions.
The Fund has a managed distribution program. The goal of this program is to provide shareholders with relatively consistent and predictable cash flow by systematically converting the Fund's expected long-term return potential into regular distributions. As a result, regular distributions throughout the year are likely to include a portion of expected long-term gains (both realized and unrealized), along with net investment income.
Important points to understand about the managed distribution program are:
• The Fund seeks to establish a relatively stable distribution rate that roughly corresponds to the projected total return from its investment strategy over an extended period of time. However, you should not draw any conclusions about the Fund's past or future investment performance from its current distribution rate.
• Actual returns will differ from projected long-term returns (and therefore the Fund's distribution rate), at least over shorter time periods. Over a specific timeframe, the difference between actual returns and total distributions will be reflected in an increasing (returns exceed distributions) or a decreasing (distributions exceed returns) Fund net asset value.
• Each distribution is expected to be paid from some or all of the following sources:
• net investment income (regular interest and dividends),
• realized capital gains, and
• unrealized gains, or, in certain cases, a return of principal (non-taxable distributions).
• A non-taxable distribution is a payment of a portion of the Fund's capital. When the Fund's returns exceed distributions, it may represent portfolio gains generated, but
Nuveen Investments
9
not realized as a taxable capital gain. In periods when the Fund's returns fall short of distributions, the shortfall will represent a portion of your original principal, unless the shortfall is offset during other time periods over the life of your investment (previous or subsequent) when the Fund's total return exceeds distributions.
• Because distribution source estimates are updated during the year based on the Fund's performance and forecast for its current fiscal year (which is the calendar year for the Fund), estimates on the nature of your distributions provided at the time the distributions are paid may differ from both the tax information reported to you in your Fund's IRS Form 1099 statement provided at year end, as well as the ultimate economic sources of distributions over the life of your investment.
The following table provides information regarding the Fund's distributions and total return performance for the period April 25, 2012 (commencement of operations) through June 30, 2012. This information is intended to help you better understand whether the Fund's returns for the specified time period were sufficient to meet the Fund's distributions.
| As of 6/30/12 | | JRI | |
| Inception date | | | 4/25/12 | | |
| The period April 25, 2012 (commencement of operations) through June 30, 2012: | |
| Per share distribution: | |
| From net investment income | | $ | 0.00 | | |
| From realized capital gains | | | 0.00 | | |
| Return of capital | | | 0.00 | | |
| Total per share distribution | | $ | 0.00 | *** | |
| Annualized distribution rate on NAV | | | N/A% | | |
| Cumulative total returns: | |
| Since inception on NAV | | | 0.42 | % | |
*** As of June 30, 2012, the Fund had not declared its initial quarterly distribution to shareholders. The Fund declared its initial quarterly distribution of $0.3675 per share in July 2012.
Price Information
As of June 30, 2012, the Fund was trading at a -2.87% discount to its share NAV, compared with an average premium of +3.31% for the abbreviated reporting period.
Nuveen Investments
10
JRI
Performance
OVERVIEW
Nuveen Real Asset Income and Growth Fund
as of June 30, 2012
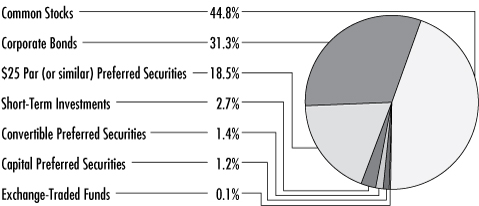
Portfolio Allocation (as a % of total investments)1
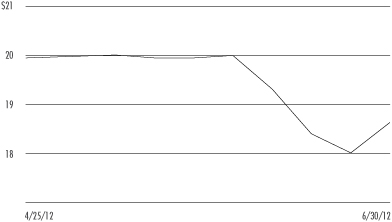
Share Price Performance — Weekly Closing Price
Refer to the Glossary of Terms used in this Report for further definition of the terms used within this Fund's Performance Overview Page.
1 Holdings are subject to change.
Fund Snapshot
| Share Price | | $ | 18.63 | | |
| Net Asset Value (NAV) | | $ | 19.18 | | |
| Premium/(Discount) to NAV | | | -2.87 | % | |
| Net Assets ($000) | | $ | 187,570 | | |
Cumulative Total Returns
(Inception 4/25/12)
| | | On Share Price | | On NAV | |
| Since Inception | | | -6.85 | % | | | 0.42 | % | |
Portfolio Composition
(as a % of total investments)1
| Real Estate Investment Trust | | | 36.3 | % | |
| Diversified Financial Services | | | 10.0 | % | |
| Electric Utilities | | | 8.4 | % | |
| Multi-Utilities | | | 8.3 | % | |
| Transportation Infrastructure | | | 6.8 | % | |
| Oil, Gas & Consumable Fuels | | | 6.3 | % | |
| Health Care Providers & Services | | | 3.7 | % | |
| Gas Utilities | | | 3.4 | % | |
| Short-Term Investments | | | 2.7 | % | |
| Other | | | 14.1 | % | |
Country Allocation
(as a % of total investments)1
| United States | | | 61.7 | % | |
| Australia | | | 11.1 | % | |
| Hong Kong | | | 5.0 | % | |
| United Kingdom | | | 4.0 | % | |
| Philippines | | | 4.0 | % | |
| Canada | | | 2.9 | % | |
| Germany | | | 2.4 | % | |
| Other | | | 8.9 | % | |
Top Five Common Stock Holdings
(as a % of total investments)1
| National Retail Properties, Inc. | | | 2.9 | % | |
| Duet Group | | | 2.2 | % | |
| National Grid PLC, Sponsored ADR | | | 2.2 | % | |
| Pepco Holdings, Inc. | | | 2.2 | % | |
| Select Income REIT | | | 1.8 | % | |
Nuveen Investments
11
JRI
Nuveen Real Asset Income and Growth Fund
Portfolio of INVESTMENTS
June 30, 2012 (Unaudited)
| Shares | | Description (1) | | Value | |
| | | Common Stocks – 44.4% | |
| | | Air Freight & Logistics – 0.6% | |
| | 1,282,637 | | | Singapore Post Limited, (5) | | $ | 1,070,198 | | |
| | | Construction & Engineering – 0.0% | |
| | 3,243 | | | Ferrovial S.A., (5) | | | 36,573 | | |
| | | Diversified Telecommunication Services – 0.5% | |
| | 376,163 | | | Singapore Telecommunications Limited, (5) | | | 979,749 | | |
| | | Electric Utilities – 6.3% | |
| | 26,282 | | | CEZ | | | 908,260 | | |
| | 13,044 | | | CPFL Energia S.A. | | | 325,970 | | |
| | 77,994 | | | EDP Energias do Brasil S.A. | | | 500,544 | | |
| | 204,371 | | | Pepco Holdings, Inc. | | | 3,999,540 | | |
| | 113,025 | | | Scottish and Southern Energy PLC, (5) | | | 2,465,698 | | |
| | 1,317,852 | | | SP Ausnet, (5) | | | 1,381,118 | | |
| | 383,341 | | | Spark Infrastructure Group, (5) | | | 601,023 | | |
| | 59,211 | | | Unitil Corp. | | | 1,569,092 | | |
| | | Total Electric Utilities | | | 11,751,245 | | |
| | | Gas Utilities – 2.9% | |
| | 615,659 | | | APA Group, (5) | | | 3,160,462 | | |
| | 2,803,161 | | | Cityspring Infrastructure Trust, (5) | | | 888,067 | | |
| | 1,968 | | | Companhia de Gas de Sao Paulo – Comgás | | | 42,623 | | |
| | 27,119 | | | Enagás, (5) | | | 494,817 | | |
| | 986,429 | | | Envestra Limited, (5) | | | 796,362 | | |
| | | Total Gas Utilities | | | 5,382,331 | | |
| | | Industrial Conglomerates – 0.3% | |
| | 377,000 | | | NWS Holdings Limited, (5) | | | 550,406 | | |
| | | Multi-Utilities – 6.1% | |
| | 184,730 | | | Centrica PLC, (5) | | | 923,643 | | |
| | 2,194,004 | | | Duet Group, (5) | | | 4,156,790 | | |
| | 167,485 | | | Just Energy Group Inc. | | | 1,839,193 | | |
| | 75,771 | | | National Grid PLC, Sponsored ADR | | | 4,015,105 | | |
| | 279,188 | | | Vector Limited, (5) | | | 600,245 | | |
| | | Total Multi-Utilities | | | 11,534,976 | | |
| | | Oil, Gas & Consumable Fuels – 3.3% | |
| | 7,314 | | | Enterprise Products Partnership, L.P. | | | 374,769 | | |
| | 38,178 | | | Holly Energy Partners, L.P. | | | 2,160,875 | | |
| | 12,755 | | | Kinder Morgan Energy Partners, L.P. | | | 1,002,288 | | |
| | 12,969 | | | Pembina Pipeline Corporation | | | 331,454 | | |
| | 192,997 | | | Veresen Inc. | | | 2,291,851 | | |
| | | Total Oil, Gas & Consumable Fuels | | | 6,161,237 | | |
Nuveen Investments
12
| Shares | | Description (1) | | Value | |
| | | Real Estate Investment Trust – 19.1% | |
| | 10,409 | | | Brandywine Realty Trust | | $ | 128,447 | | |
| | 26,392 | | | Campus Crest Communities Inc. | | | 274,213 | | |
| | 69,802 | | | Franklin Street Properties Corp. | | | 738,505 | | |
| | 10,667 | | | Health Care REIT, Inc. | | | 621,886 | | |
| | 30,961 | | | Highwoods Properties, Inc. | | | 1,041,838 | | |
| | 26,231 | | | Inland Real Estate Corporation | | | 219,816 | | |
| | 91,869 | | | Kite Realty Group Trust | | | 2,342,660 | | |
| | 43,502 | | | Liberty Property Trust | | | 1,602,614 | | |
| | 50,890 | | | Mack-Cali Realty Corporation | | | 1,479,372 | | |
| | 68,799 | | | Medical Properties Trust Inc. | | | 661,846 | | |
| | 49,674 | | | Mission West Properties, Inc. | | | 428,190 | | |
| | 191,102 | | | National Retail Properties, Inc. | | | 5,406,275 | | |
| | 108,207 | | | Omega Healthcare Investors, Inc. | | | 2,434,658 | | |
| | 799,860 | | | Parkway Life REIT, (5) | | | 1,190,339 | | |
| | 66,254 | | | Pebblebrook Hotel Trust | | | 1,735,192 | | |
| | 102,390 | | | Ramco-Gershenson Properties Trust | | | 1,287,042 | | |
| | 2,378 | | | Sabra Health Care Real Estate Investment Trust Inc. | | | 40,688 | | |
| | 138,007 | | | Select Income REIT | | | 3,279,046 | | |
| | 71,308 | | | STAG Industrial Inc. | | | 1,039,671 | | |
| | 122,008 | | | Starwood Property Trust, Inc. | | | 2,599,990 | | |
| | 7,892 | | | Summit Hotel Properties Inc. | | | 66,056 | | |
| | 77,946 | | | Summit Hotel Properties Inc. | | | 2,028,155 | | |
| | 41,833 | | | Sunstone Hotel Investors, Inc. | | | 1,048,753 | | |
| | 32,643 | | | Universal Health Realty Income Trust | | | 1,355,664 | | |
| | 77,270 | | | Urstadt Biddle Properties Inc. | | | 1,527,628 | | |
| | 43,654 | | | Washington Real Estate Investment Trust | | | 1,241,956 | | |
| | 396 | | | Westfield Realty Trust, (5) | | | 1,162 | | |
| | | Total Real Estate Investment Trust | | | 35,821,662 | | |
| | | Transportation Infrastructure – 5.1% | |
| | 4,343 | | | Abertis Infraestructuras S.A., (2) | | | 58,506 | | |
| | 370,737 | | | Auckland International Airport Limited, (5) | | | 727,112 | | |
| | 9,658 | | | Autostrada Torino-Milano SpA, (5) | | | 60,003 | | |
| | 3,677,477 | | | Hutchison Port Holdings Trust, (5) | | | 2,628,694 | | |
| | 1,232,966 | | | Jiangsu Expressway Company Limited, (5) | | | 1,157,603 | | |
| | 881,987 | | | Sydney Airport, (5) | | | 2,628,602 | | |
| | 412,936 | | | Transuburban Group, (5) | | | 2,411,963 | | |
| | | Total Transportation Infrastructure | | | 9,672,483 | | |
| | | Water Utilities – 0.2% | |
| | 182,546 | | | Inversiones Aguas Metropolitanas S.A. | | | 305,853 | | |
| | | Total Common Stocks (cost $82,463,945) | | | 83,266,713 | | |
| Shares | | Description (1) | | Value | |
| | | Exchange-Traded Funds – 0.1% | |
| | | Transportation Infrastructure – 0.1% | |
| | 98,009 | | | Australian Infrastructure Fund, (5) | | $ | 242,427 | | |
| | | Total Exchange-Traded Funds (cost $228,495) | | | 242,427 | | |
| Shares | | Description (1) | | Coupon | | Ratings (3) | | Value | |
| | | Convertible Preferred Securities – 1.5% | |
| | | Electric Utilities – 0.7% | |
| | 24,913 | | | PPL Corporation | | | 8.750 | % | | N/R | | $ | 1,332,098 | | |
Nuveen Investments
13
JRI
Nuveen Real Asset Income and Growth Fund
Portfolio of INVESTMENTS June 30, 2012 (Unaudited)
| Shares | | Description (1) | | Coupon | | | | Ratings (3) | | Value | |
| | | Real Estate Investment Trust – 0.8% | |
| | 10,307 | | | Alexandria Real Estate Equities Inc., Series D, (5) | | | 7.000 | % | | | | | | N/R | | $ | 269,914 | | |
| | 21,549 | | | Ramco-Gershenson Properties Trust | | | 7.250 | % | | | | | | N/R | | | 1,077,450 | | |
| | | | | Total Real Estate Investment Trust | | | | | | | | | | | | | | | 1,347,364 | | |
| | | | | Total Convertible Preferred Securities (cost $2,610,172) | | | | | | | | | | | | | | | 2,679,462 | | |
| Shares | | Description (1) | | Coupon | | | | Ratings (3) | | Value | |
| | | $25 Par (or similar) Preferred Securities – 18.4% | |
| | | Electric Utilities – 0.2% | |
| | 14,114 | | | SCE Trust I | | | 5.625 | % | | | | | | BBB+ | | $ | 359,625 | | |
| | | Energy Equipment & Services – 0.6% | |
| | 41,291 | | | NextEra Energy Inc. | | | 5.625 | % | | | | | | BBB | | | 1,073,153 | | |
| | | Real Estate Investment Trust – 16.1% | |
| | 36,158 | | | Alexandria Real Estate Equities Inc., Series B | | | 6.450 | % | | | | | | Baa3 | | | 950,232 | | |
| | 6,363 | | | Apartment Investment & Management Company | | | 7.000 | % | | | | | | BB | | | 167,411 | | |
| | 18,961 | | | Brandywine Realty Trust, Series D | | | 7.375 | % | | | | | | BB+ | | | 481,230 | | |
| | 48,147 | | | Brandywine Realty Trust, Series E | | | 6.900 | % | | | | | | Ba1 | | | 1,217,156 | | |
| | 54,486 | | | CBL & Associates Properties Inc. | | | 7.375 | % | | | | | | N/R | | | 1,392,117 | | |
| | 1,662 | | | Cedar Shopping Centers Inc., Series A | | | 8.875 | % | | | | | | N/R | | | 42,298 | | |
| | 39,666 | | | Cedar Shopping Centers Inc., Series B, (4) | | | 7.250 | % | | | | | | N/R | | | 922,235 | | |
| | 44,011 | | | Corporate Office Properties Trust, (4) | | | 0.000 | % | | | | | | N/R | | | 1,110,838 | | |
| | 26,402 | | | Cousins Property Inc. | | | 7.750 | % | | | | | | N/R | | | 669,291 | | |
| | 42,368 | | | Cousins Property Inc. | | | 7.500 | % | | | | | | N/R | | | 1,068,521 | | |
| | 51,603 | | | CubeSmart | | | 7.750 | % | | | | | | Ba1 | | | 1,357,675 | | |
| | 19,299 | | | Developers Diversified Realty Corporation | | | 7.500 | % | | | | | | Ba1 | | | 484,984 | | |
| | 23,316 | | | Digital Realty Trust Inc. | | | 6.625 | % | | | | | | Baa3 | | | 603,651 | | |
| | 5,503 | | | Digital Realty Trust Inc.. Series E | | | 7.000 | % | | | | | | Baa3 | | | 147,866 | | |
| | 13,690 | | | Duke Realty Corporation, Series L | | | 6.600 | % | | | | | | Baa3 | | | 345,809 | | |
| | 10,133 | | | Dupont Fabros Technology | | | 7.875 | % | | | | | | Ba2 | | | 265,079 | | |
| | 25,081 | | | Essex Property Trust | | | 7.125 | % | | | | | | BB+ | | | 655,617 | | |
| | 23,261 | | | Excel Trust Inc. | | | 8.125 | % | | | | | | N/R | | | 590,364 | | |
| | 63,193 | | | First Industrial Realty Trust, Inc., Series J | | | 7.250 | % | | | | | | B+ | | | 1,532,430 | | |
| | 22,043 | | | First Industrial Realty Trust, Inc., Series K | | | 7.250 | % | | | | | | B+ | | | 534,102 | | |
| | 4,265 | | | First Potomac Realty Trust | | | 7.750 | % | | | | | | N/R | | | 107,862 | | |
| | 72,358 | | | Glimcher Realty Trust, Series G | | | 8.125 | % | | | | | | B2 | | | 1,826,316 | | |
| | 57,703 | | | Hersha Hospitality Trust | | | 8.000 | % | | | | | | N/R | | | 1,468,541 | | |
| | 41,243 | | | Hudson Pacific Properties Inc. | | | 8.375 | % | | | | | | N/R | | | 1,099,538 | | |
| | 23,179 | | | Inland Real Estate Corporation | | | 8.250 | % | | | | | | N/R | | | 589,210 | | |
| | 43,817 | | | Kilroy Realty Corporation | | | 6.875 | % | | | | | | Ba1 | | | 1,135,298 | | |
| | 17,307 | | | Lexington Realty Trust | | | 7.550 | % | | | | | | N/R | | | 434,579 | | |
| | 35,198 | | | Monmouth Real Estate Investment Corp. | | | 0.000 | % | | | | | | N/R | | | 930,283 | | |
| | 34,697 | | | National Retail Properties Inc. | | | 6.625 | % | | | | | | Baa3 | | | 902,122 | | |
| | 12,865 | | | Pebblebrook Hotel Trust | | | 7.875 | % | | | | | | N/R | | | 331,402 | | |
| | 34,629 | | | Penn Real Estate Investment Trust | | | 8.250 | % | | | | | | N/R | | | 891,697 | | |
| | 11,795 | | | Post Properties, Inc., Series A | | | 8.500 | % | | | | | | Ba1 | | | 731,998 | | |
| | 6,385 | | | Prologis Inc. | | | 6.750 | % | | | | | | Baa3 | | | 159,689 | | |
| | 21,398 | | | Prologis Inc., Series G | | | 6.750 | % | | | | | | BB | | | 545,221 | | |
| | 10,744 | | | Prologis Inc., Series R | | | 6.750 | % | | | | | | BB | | | 269,567 | | |
| | 84,279 | | | Sunstone Hotel Investors Inc. | | | 8.000 | % | | | | | | N/R | | | 2,098,547 | | |
| | 896 | | | Vornado Realty Trust | | | 6.750 | % | | | | | | BBB- | | | 22,758 | | |
| | 88,280 | | | Weingarten Realty Trust | | | 6.750 | % | | | | | | Baa3 | | | 2,223,775 | | |
| | | | | Total Real Estate Investment Trust | | | | | | | | | | | | | | | 30,307,309 | | |
| | | Real Estate Management & Development – 1.5% | |
| | 115,672 | | | Forest City Enterprises, Inc. | | | 0.000 | % | | | | | | B- | | | 2,749,523 | | |
| | | | | Total $25 Par (or similar) Preferred Securities (cost $34,062,152) | | | | | | | | | | | | | | | 34,489,610 | | |
Nuveen Investments
14
Principal
Amount (000) | | Description (1) | | Coupon | | Maturity | | Ratings (3) | | Value | |
| | | Corporate Bonds – 30.9% | | | |
| | | Aerospace & Defense – 0.5% | | | |
| $ | 1,000 | | | Huntington Ingalls Industries Inc. | | | 6.875 | % | | 3/15/18 | | BB | | $ | 1,042,500 | | |
| | | Building Products – 0.5% | | | |
| | 1,000 | | | Corporativo Javer S.A. de C.V, 144A | | | 9.875 | % | | 4/06/21 | | B1 | | | 940,000 | | |
| | | Commercial Services & Supplies – 1.6% | | | |
| | 250 | | | Casella Waste Systems Inc. | | | 7.750 | % | | 2/15/19 | | CCC+ | | | 246,250 | | |
| | 1,115 | | | Covanta Energy Corporation | | | 6.375 | % | | 10/01/22 | | BB | | | 1,178,548 | | |
| | 784 | | | EnergySolutions Inc. | | | 10.750 | % | | 8/15/18 | | B | | | 654,640 | | |
| | 1,000 | | | Geo Group Inc. | | | 6.625 | % | | 2/15/21 | | B+ | | | 1,032,500 | | |
| | | 3,149Total Commercial Services & Supplies | | | 3,111,938 | | |
| | | Communications Equipment – 1.4% | | | |
| | 500 | | | Goodman Networks Inc., 144A | | | 12.125 | % | | 7/01/18 | | B+ | | | 515,000 | | |
| | 1,000 | | | IntelSat Jackson Holdings | | | 7.250 | % | | 4/01/19 | | B | | | 1,050,000 | | |
| | 1,000 | | | Telesat Canada, 144A | | | 6.000 | % | | 5/15/17 | | B- | | | 1,017,500 | | |
| | | 2,500Total Communications Equipment | | | 2,582,500 | | |
| | | Diversified Financial Services – 9.9% | | | |
| | 4,235 | | | Origin Energy Finance Limited | | | 7.875 | % | | 6/16/71 | | Baa3 | | | 5,225,458 | | |
| | 6,634 | | | PHBS Limited | | | 6.625 | % | | 12/31/49 | | N/R | | | 6,209,026 | | |
| | 5,075 | | | Royal Capital BV | | | 8.375 | % | | 11/05/61 | | N/R | | | 5,163,813 | | |
| | 1,000 | | | SinOceanic II ASA, 144A | | | 10.000 | % | | 2/17/15 | | N/R | | | 960,000 | | |
| | 750 | | | Tennet Holding BV | | | 6.655 | % | | 6/01/61 | | BBB | | | 965,950 | | |
| | | 17,694Total Diversified Financial Services | | | 18,524,247 | | |
| | | Energy Equipment & Services – 1.4% | | | |
| | 1,000 | | | Energy Transfer Equity LP | | | 7.500 | % | | 10/15/20 | | BB | | | 1,097,500 | | |
| | 1,500 | | | NGPL PipeCo LLC | | | 7.119 | % | | 12/15/17 | | Ba3 | | | 1,500,000 | | |
| | | 2,500Total Energy Equipment & Services | | | 2,597,500 | | |
| | | Gas Utilities – 0.5% | | | |
| | 1,000 | | | AmeriGas Finance LLC | | | 6.750 | % | | 5/20/20 | | Ba2 | | | 1,020,000 | | |
| | | Health Care Providers & Services – 3.7% | | | |
| | 950 | | | Acadia Healthcare | | | 12.875 | % | | 11/01/18 | | B- | | | 1,083,000 | | |
| | 1,000 | | | Community Health Systems, Inc. | | | 8.000 | % | | 11/15/19 | | B | | | 1,065,000 | | |
| | 1,200 | | | Health Management Associates, 144A | | | 7.375 | % | | 1/15/20 | | BB- | | | 1,276,500 | | |
| | 1,000 | | | HealthSouth Corporation | | | 7.750 | % | | 9/15/22 | | BB- | | | 1,072,500 | | |
| | 1,175 | | | Kindred Healthcare Inc. | | | 8.250 | % | | 6/01/19 | | B- | | | 1,089,813 | | |
| | 1,325 | | | National Mentor Holdings, 144A | | | 12.500 | % | | 2/15/18 | | CCC+ | | | 1,320,031 | | |
| | | 6,650Total Health Care Providers & Services | | | 6,906,844 | | |
| | | Household Durables – 0.7% | | | |
| | 1,200 | | | Desarrolla Homex S.A.B. de CV, 144A | | | 9.750 | % | | 3/25/20 | | Ba3 | | | 1,260,000 | | |
| | | Independent Power Producers & Energy Traders – 1.6% | | | |
| | 1,000 | | | Calpine Corporation, 144A | | | 7.875 | % | | 1/15/23 | | BB | | | 1,090,000 | | |
| | 450 | | | Mirant Americas Generation LLC | | | 8.500 | % | | 10/01/21 | | BB | | | 405,000 | | |
| | 1,500 | | | NRG Energy Inc. | | | 7.875 | % | | 5/15/21 | | BB | | | 1,515,000 | | |
| | | 2,950Total Independent Power Producers & Energy Traders | | | 3,010,000 | | |
| | | IT Services – 0.8% | | | |
| | 1,375 | | | Zayo Escrow Corporation, 144A | | | 8.125 | % | | 1/01/20 | | B1 | | | 1,436,875 | | |
Nuveen Investments
15
JRI
Nuveen Real Asset Income and Growth Fund
Portfolio of INVESTMENTS June 30, 2012 (Unaudited)
Principal
Amount (000) | | Description (1) | | Coupon | | Maturity | | Ratings (3) | | Value | |
| | | Marine – 0.6% | |
| $ | 1,250 | | | Navios Maritime Acquisition Corporation | | | 8.625 | % | | 11/01/17 | | B | | $ | 1,162,500 | | |
| | | Metals & Mining – 0.5% | |
| | 1,100 | | | WPE International Cooperatief U.A., 144A | | | 10.375 | % | | 9/30/20 | | B+ | | | 869,000 | | |
| | | Multi-Utilities – 2.1% | |
| | 1,120 | | | Dayton Power and Light, 144A | | | 7.250 | % | | 10/15/21 | | BB+ | | | 1,243,200 | | |
| | 700 | | | RWE AG | | | 7.000 | % | | 10/12/72 | | BBB | | | 707,000 | | |
| | 700 | | | RWE AG | | | 7.000 | % | | 3/20/49 | | BBB | | | 1,088,083 | | |
| | 750 | | | Suez Environnement | | | 4.820 | % | | 12/31/49 | | Baa2 | | | 900,263 | | |
| | 3,270 | | | Total Multi-Utilities | | �� | | | | | | | 3,938,546 | | |
| | | Oil, Gas & Consumable Fuels – 3.0% | |
| | 1,050 | | | Crosstex Energy Finance | | | 8.875 | % | | 2/15/18 | | B+ | | | 1,109,063 | | |
| | 1,000 | | | Holly Energy Partners LP, 144A | | | 6.500 | % | | 3/01/20 | | BB- | | | 1,007,500 | | |
| | 1,050 | | | Inergy LP Finance | | | 7.000 | % | | 10/01/18 | | Ba3 | | | 1,081,500 | | |
| | 1,060 | | | PBF Holding Company LLC, 144A | | | 8.250 | % | | 2/15/20 | | BB+ | | | 1,057,350 | | |
| | 1,300 | | | United Refining Inc., 144A | | | 10.500 | % | | 2/28/18 | | B | | | 1,332,500 | | |
| | 5,460 | | | Total Oil, Gas & Consumable Fuels | | | 5,587,913 | | |
| | | Road & Rail – 0.7% | |
| | 1,303 | | | Inversiones Alsacia S.A., 144A | | | 8.000 | % | | 8/18/18 | | Ba2 | | | 1,260,017 | | |
| | | Transportation Infrastructure – 1.4% | |
| | 2,700 | | | Eurogate GmbH | | | 6.750 | % | | 5/28/67 | | N/R | | | 2,716,395 | | |
| $ | 56,101 | | | Total Corporate Bonds (cost $59,003,572) | | | | | | | | | 57,966,775 | | |
Principal
Amount (000) | | Description (1) | | Coupon | | Maturity | | Ratings (3) | | Value | |
| | | Capital Preferred Securities – 1.2% | |
| | | Electric Utilities – 1.2% | |
| $ | 900 | | | First Philipine Holdings Corporation | | | 8.723 | % | | 7/31/58 | | N/R | | $ | 2,232,111 | | |
| | | | | Total Capital Preferred Securities (cost $2,263,163) | | | | | | | | | | | | | | | 2,232,111 | | |
Nuveen Investments
16
Principal
Amount (000) | | Description (1) | | Coupon | | Maturity | | Ratings (3) | | Value | |
| | | Short-Term Investments – 2.7% | |
| | | U.S. Government and Agency Obligations – 0.2% | |
| $ | 350 | | | U.S. Treasury Bills | | | 0.000 | % | | 9/20/12 | | N/R | | $ | 349,944 | | |
| | | Repurchase Agreements – 2.5% | |
| | 4,762 | | | Repurchase Agreement with State Street Bank, dated 6/29/12, repurchase
price $4,761,956, collateralized by $4,640,000 U.S. Treasury Notes,
1.750%, due 5/31/16, value $4,858,860 | | | 0.010 | % | | 7/02/12 | | N/A | | | 4,761,952 | | |
| | | Total Short-Term Investments (cost $5,111,864) | | | | | | | | | | | | | | | 5,111,896 | | |
| | | Total Investments (cost $185,743,363) – 99.2% | | | | | | | | | | | | | | | 185,988,994 | | |
| | | Other Assets Less Liabilities – 0.8% | | | | | | | | | | | | | | | 1,580,605 | | |
| | | Net Assets – 100% | | | | | | | | | | | | | | $ | 187,569,599 | | |
For Fund portfolio compliance purposes, the Fund's industry classifications refer to any one or more of the industry sub-classifications used by one or more widely recognized market indexes or ratings group indexes, and/or as defined by Fund management. This definition may not apply for purposes of this report, which may combine industry sub-classifications into sectors for reporting ease.
(1) All percentages shown in the Portfolio of Investments are based on net assets.
(2) Investment valued at fair value using methods determined in good faith by, or at the discretion of, the Board of Trustees. For fair value disclosure purposes, investment categorized as Level 3. See Notes to Financial Statements, Footnote 1—General Information and Significant Accounting Policies, Investment Valuation for more information.
(3) Ratings: Using the highest of Standard & Poor's Group ("Standard & Poor's"), Moody's Investors Service, Inc. ("Moody's") or Fitch, Inc. ("Fitch") rating. Ratings below BBB by Standard & Poor's, Baa by Moody's or BBB by Fitch are considered to be below investment grade. Holdings designated N/R are not rated by any of these national rating agencies.
(4) Non-income producing; issuer has not declared a dividend within the past twelve months.
(5) For fair value measurement disclosure purposes, Common Stock, Exchange-Traded Fund and Convertible Preferred Security categorized as Level 2. See Notes to Financial Statements, Footnote 1—General Information and Significant Accounting Policies, Investment Valuation for more information.
N/R Not rated.
N/A Not applicable.
144A Investment is exempt from registration under Rule 144A of the Securities Act of 1933, as amended. These investments may only be resold in transactions exempt from registration, which are normally those transactions with qualified institutional buyers.
ADR American Depositary Receipt.
REIT Real Estate Investment Trust.
See accompanying notes to financial statements.
Nuveen Investments
17
Statement of
ASSETS & LIABILITIES
June 30, 2012 (Unaudited)
| Assets | |
| Investments, at value (cost $185,743,363) | | $ | 185,988,994 | | |
| Cash denominated in foreign currencies (cost $51,041) | | | 51,041 | | |
| Receivables: | |
| Dividends | | | 1,154,390 | | |
| Interest | | | 1,051,011 | | |
| Investments sold | | | 2,597,802 | | |
| Reclaims | | | 45,197 | | |
| Total assets | | | 190,888,435 | | |
| Liabilities | |
| Cash overdraft | | | 1,258,749 | | |
| Payable for investments purchased | | | 1,862,604 | | |
| Accrued expenses: | |
| Management fees | | | 144,485 | | |
| Other | | | 52,998 | | |
| Total liabilities | | | 3,318,836 | | |
| Net assets | | $ | 187,569,599 | | |
| Shares outstanding | | | 9,780,250 | | |
| Net asset value per share outstanding | | $ | 19.18 | | |
| Net assets consist of: | |
| Shares, $.01 par value per share | | $ | 97,803 | | |
| Paid-in surplus | | | 186,313,972 | | |
| Undistributed (Over-distribution of) net investment income | | | 2,336,532 | | |
| Accumulated net realized gain (loss) | | | (1,432,179 | ) | |
| Net unrealized appreciation (depreciation) | | | 253,471 | | |
| Net assets | | $ | 187,569,599 | | |
| Authorized shares | | | Unlimited | | |
See accompanying notes to financial statements.
Nuveen Investments
18
Statement of
OPERATIONS
For the period April 25, 2012 (commencement of operations) through June 30, 2012 (Unaudited)
| Investment Income | |
| Dividends (net of foreign tax withheld of $252,163) | | $ | 2,038,469 | | |
| Interest | | | 639,587 | | |
| Total investment income | | | 2,678,056 | | |
| Expenses | |
| Management fees | | | 296,165 | | |
| Shareholders' servicing agent fees and expenses | | | 117 | | |
| Custodian's fees and expenses | | | 17,808 | | |
| Trustees' fees and expenses | | | 797 | | |
| Professional fees | | | 7,230 | | |
| Shareholders' reports — printing and mailing expenses | | | 12,275 | | |
| Stock exchange listing fees | | | 1 | | |
| Investor relations expense | | | 4,104 | | |
| Other expenses | | | 3,051 | | |
| Total expenses before custodian fee credit | | | 341,548 | | |
| Custodian fee credit | | | (24 | ) | |
| Net expenses | | | 341,524 | | |
| Net investment income (loss) | | | 2,336,532 | | |
| Realized and Unrealized Gain (Loss) | |
| Net realized gain (loss) from: | |
| Investments and foreign currency | | | (1,477,533 | ) | |
| Call options written | | | 45,354 | | |
| Change in net unrealized appreciation (depreciation) of investments and foreign currency | | | 253,471 | | |
| Net realized and unrealized gain (loss) | | | (1,178,708 | ) | |
| Net increase (decrease) in net assets from operations | | $ | 1,157,824 | | |
See accompanying notes to financial statements.
Nuveen Investments
19
Statement of
CHANGES in NET ASSETS (Unaudited)
| | | For the Period 4/25/12
(commencement
of operations)
through 6/30/12 | |
| Operations | |
| Net investment income (loss) | | $ | 2,336,532 | | |
| Net realized gain (loss) from: | |
| Investments and foreign currency | | | (1,477,533 | ) | |
| Call options written | | | 45,354 | | |
| Change in net unrealized appreciation (depreciation) of investments and foreign currency | | | 253,471 | | |
| Net increase (decrease) in net assets from operations | | | 1,157,824 | | |
| Capital Share Transactions | |
| Proceeds from sale of shares, net of offering costs | | | 186,311,500 | | |
| Net increase (decrease) in net assets from capital share transactions | | | 186,311,500 | | |
| Net increase (decrease) in net assets | | | 187,469,324 | | |
| Net assets at the beginning of period | | | 100,275 | | |
| Net assets at the end of period | | $ | 187,569,599 | | |
| Undistributed (Over-distribution of) net investment income at the end of period | | $ | 2,336,532 | | |
See accompanying notes to financial statements.
Nuveen Investments
20
Statement of
CASH FLOWS
For the period April 25, 2012 (commencement of operations)
through June 30, 2012 (Unaudited)
| Cash Flows from Operating Activities: | |
| Net Increase (Decrease) in Net Assets from Operations | | $ | 1,157,824 | | |
Adjustments to reconcile the net increase (decrease) in net assets
from operations to net cash provided by (used in) operating activities: | |
| Purchases of investments | | | (224,729,427 | ) | |
| Proceeds from sales and maturities of investments | | | 42,616,262 | | |
| Proceeds from (Purchases of) short-term investments, net | | | (5,111,896 | ) | |
| Proceeds from (Payments of) cash denominated in foreign currency | | | (51,041 | ) | |
| Cash paid for terminated call options written | | | (45,354 | ) | |
| Premiums received for call options written | | | 90,708 | | |
| Amortization (Accretion) of premiums and discounts, net | | | 12,005 | | |
| (Increase) Decrease in: | |
| Receivable for dividends | | | (1,154,390 | ) | |
| Receivable for interest | | | (1,051,011 | ) | |
| Receivable for investments sold | | | (2,597,802 | ) | |
| Receivable for reclaims | | | (45,197 | ) | |
| Increase (Decrease) in: | |
| Payable for investments purchased | | | 1,862,604 | | |
| Accrued management fees | | | 144,485 | | |
| Accrued other expenses | | | 52,998 | | |
| Net realized gain (loss) from: | |
| Investments and foreign currency | | | 1,477,533 | | |
| Call options written | | | (45,354 | ) | |
| Change in net unrealized (appreciation) depreciation of investments and foreign currency | | | (253,471 | ) | |
| Net cash provided by (used in) operating activities | | | (187,670,524 | ) | |
| Cash Flows from Financing Activities: | |
| Increase (Decrease) in cash overdraft balance | | | 1,258,749 | | |
| Proceeds from sale of shares, net of offering costs | | | 186,311,500 | | |
| Net cash provided by (used in) financing activities | | | 187,570,249 | | |
| Net Increase (Decrease) in Cash | | | (100,275 | ) | |
| Cash at the beginning of period | | | 100,275 | | |
| Cash at the End of Period | | $ | — | | |
See accompanying notes to financial statements.
Nuveen Investments
21
Financial
HIGHLIGHTS (Unaudited)
Selected data for a share outstanding throughout each period:
| | | | |
| | | | | Investment Operations | | Less Distributions | |
| | | Beginning
Net Asset
Value | | Net
Investment
Income
(Loss)(a) | | Net
Realized/
Unrealized
Gain
(Loss) | | Total | | Net
Investment
Income | | Capital
Gains | | Return of
Capital | | Total | |
| Year Ended 12/31: | |
| 2012(d) | | $ | 19.10 | | | $ | .24 | | | $ | (.12 | ) | | $ | .12 | | | $ | — | | | $ | — | | | $ | — | | | $ | — | | |
Nuveen Investments
22
| | | | | | | Ratios/Supplemental Data | |
| | | | | | | | | Total Returns | | | | Ratios to Average Net Assets(c) | | | |
| | | Offering
Costs | | Ending
Net Asset
Value | | Ending
Market
Value | | Based
on
Market
Value(b) | | Based
on
Net
Asset
Value(b) | | Ending Net
Assets
(000) | | Expenses | | Net
Investment
Income
(Loss) | | Portfolio
Turnover
Rate | |
| Year Ended 12/31: | |
| 2012(d) | | $ | (.04 | ) | | $ | 19.18 | | | $ | 18.63 | | | | (6.85 | )% | | | .42 | % | | $ | 187,570 | | | | 1.12 | %* | | | 7.67 | %* | | | 24 | % | |
(a) Per share Net Investment Income (Loss) is calculated using the average daily shares method.
(b) Total Return Based on Market Value is the combination of changes in the market price per share and the effect of reinvested dividend income and reinvested capital gains distributions, if any, at the average price paid per share at the time of reinvestment. The last dividend declared in the period, which is typically paid on the first business day of the following month, is assumed to be reinvested at the ending market price. The actual reinvestment for the last dividend declared in the period may take place over several days, and in some instances may not be based on the market price, so the actual reinvestment price may be different from the price used in the calculation. Total returns are not annualized.
Total Return Based on Net Asset Value is the combination of changes in net asset value, reinvested dividend income at net asset value and reinvested capital gains distributions at net asset value, if any. The last dividend declared in the period, which is typically paid on the first business day of the following month, is assumed to be reinvested at the ending net asset value. The actual reinvest price for the last dividend declared in the period may often be based on the Fund's market price (and not its net asset value), and therefore may be different from the price used in the calculation. Total returns are not annualized.
(c) Ratios do not reflect the effect of custodian fee credits earned on the Fund's net cash on deposit with the custodian bank, where applicable.
(d) For the period April 25, 2012 (commencement of operations) through June 30, 2012.
* Annualized.
See accompanying notes to financial statements.
Nuveen Investments
23
Notes to
FINANCIAL STATEMENTS (Unaudited)
1. General Information and Significant Accounting Policies
General Information
Nuveen Real Asset Income and Growth Fund (the "Fund") is a closed-end registered investment company registered under the Investment Company Act of 1940, as amended. The Fund's shares are listed on the New York Stock Exchange ("NYSE") and trade under the ticker symbol "JRI." The Fund was organized as a Massachusetts business trust on January 10, 2012.
The Fund seeks to provide a high level of current income and long-term capital appreciation. Under normal market conditions, the Fund will invest at least 80% of its managed assets (as defined in Footnote 7—Management Fees and Other Transactions With Affiliates) in equity and debt securities issued by real asset related companies located anywhere in the world. The Fund will not have more than 40% of its managed assets, at the time of purchase, in debt securities. All of the Fund's debt securities may be rated lower than investment grade quality (BB+/Ba1 or lower); no more than 10% of the Fund's managed assets may be invested in debt securities rated CCC+/Caa1 or lower at any time. The Fund will invest at least 25% and no more than 75% in securities of non-U.S. issuers through the direct investment in securities of non-U.S. companies and depositary receipts. The Fund will also employ an option strategy focused on securities issued by real asset related companies that seeks to generate option premiums for the purpose of enhancing the Fund's risk-adjusted total returns over time. The Fund expects to write (sell) custom basket options with a notional value of options ranging from 5% to 10% of managed assets.
Prior to its commencement of operations on April 25, 2012, the Fund had no operations other than those related to organizational matters, the initial contribution of $100,275 by Nuveen Fund Advisors, Inc. (the "Adviser"), a wholly-owned subsidiary of Nuveen Investments, Inc. ("Nuveen"), and the recording of the Fund's organizational expenses ($11,000) and its reimbursement by the Adviser.
Significant Accounting Policies
The following is a summary of significant accounting policies followed by the Fund in the preparation of its financial statements in accordance with U.S. generally accepted accounting principles ("U.S. GAAP").
Investment Valuation
Common stocks and other equity-type securities are valued at the last sales price on the securities exchange on which such securities are primarily traded and are generally classified as Level 1 for fair value measurement purposes. Securities primarily traded on the NASDAQ National Market ("NASDAQ") are valued, except as indicated below, at the NASDAQ Official Closing Price and are generally classified as Level 1. However, securities traded on a securities exchange or NASDAQ for which there were no transactions on a given day or securities not listed on a securities exchange or NASDAQ are valued at the quoted bid price and are generally classified as Level 2. Prices of certain American Depositary Receipts ("ADR") held by the Fund that trade in the United States are valued based on the last traded price, official closing price, or the most recent bid price of the underlying non-U.S.-traded stock, adjusted as appropriate for the underlying-to-ADR conversion ratio and foreign exchange rate, and from time-to-time may also be adjusted further to take into account material events that may take place after the close of the local non-U.S. market but before the close of the NYSE. These securities may represent a transfer from a Level 1 to a Level 2 security.
Prices of fixed-income securities are provided by a pricing service approved by the Fund's Board of Trustees. These securities are generally classified as Level 2. The pricing service establishes a security's fair value using methods that may include consideration of the following: yields or prices of investments of comparable quality, type of issue, coupon, maturity and rating, market quotes or indications of value from security dealers, evaluations of anticipated cash flows or collateral, general market conditions and other information and analysis, including the obligor's credit characteristics considered relevant. In pricing certain securities, particularly less liquid and lower quality securities, the pricing service may consider information about a security, its issuer, or market activity provided by the Adviser. These securities are generally classified as Level 2 or Level 3 depending on the priority of the significant inputs.
Investments in investment companies are valued at their respective net asset values on valuation date. These investment vehicles are generally classified as Level 1.
Nuveen Investments
24
The value of exchange-traded options are based on the mean of the closing bid and ask prices. Exchange-traded options are generally classified as Level 1. Options traded in the over-the-counter market are valued using an evaluated mean price and are generally classified as Level 2.
Repurchase agreements are valued at contract amount plus accrued interest, which approximates market value. These securities are generally classified as Level 2.
Certain securities may not be able to be priced by the pre-established pricing methods as described above. Such securities may be valued by the Fund's Board of Trustees or its designee at fair value. These securities generally include, but are not limited to, restricted securities (securities which may not be publicly sold without registration under the Securities Act of 1933, as amended) for which a pricing service is unable to provide a market price; securities whose trading has been formally suspended; debt securities that have gone into default and for which there is no current market quotation; a security whose market price is not available from a pre-established pricing source; a security with respect to which an event has occurred that is likely to materially affect the value of the security after the market has closed but before the calculation of the Fund's net asset value (as may be the case in non-U.S. markets on which the security is primarily traded) or make it difficult or impossible to obtain a reliable market quotation; and a security whose price, as provided by the pricing service, is not deemed to reflect the security's fair value. As a general principle, the fair value of a security would appear to be the amount that the owner might reasonably expect to receive for it in a current sale. A variety of factors may be considered in determining the fair value of such securities, which may include consideration of the following: yields or prices of investments of comparable quality, type of issue, coupon, maturity and rating, market quotes or indications of value from security dealers, evaluations of anticipated cash flows or collateral, general market conditions and other information and analysis, including the obligor's credit characteristics considered relevant. These securities are generally classified as Level 2 or Level 3 depending on the priority of the significant inputs. Regardless of the method employed to value a particular security, all valuations are subject to review by the Fund's Board of Trustees or its designee.
Refer to Footnote 2—Fair Value Measurements for further details on the leveling of securities held by the Fund as of the end of the reporting period.
Investment Transactions
Investment transactions are recorded on a trade date basis. Realized gains and losses from investment transactions are determined on the specific identification method, which is the same basis used for federal income tax purposes. Investments purchased on a when-issued/delayed delivery basis may have extended settlement periods. Any investments so purchased are subject to market fluctuation during this period. The Fund has instructed the custodian to earmark securities in the Fund's portfolio with a current value at least equal to the amount of the when-issued/delayed delivery purchase commitments. At June 30, 2012, the Fund had no such outstanding purchase commitments.
Investment Income
Dividend income is recorded on the ex-dividend date or, for foreign securities, when information is available. Interest income, which reflects the amortization of premiums and includes accretion of discounts for financial reporting purposes, is recorded on an accrual basis. Interest income also reflects paydown gains and losses, if any.
Income Taxes
The Fund intends to distribute substantially all of its investment company taxable income to shareholders and to otherwise comply with the requirements of Subchapter M of the Internal Revenue Code applicable to regulated investment companies. In any year when the Fund realizes net capital gains, the Fund may choose to distribute all or a portion of its net capital gains to shareholders, or alternatively, to retain all or a portion of its net capital gains and pay federal corporate income taxes on such retained gains.
For all open tax years and all major taxing jurisdictions, management of the Fund has concluded that there are no significant uncertain tax positions that would require recognition in the financial statements. Open tax years are those that are open for examination by taxing authorities (i.e., generally the last four tax year ends and the interim tax period since then). Furthermore, management of the Fund is also not aware of any tax positions for which it is reasonably possible that the total amounts of unrecognized tax benefits will significantly change in the next twelve months.
Dividends and Distributions to Shareholders
Distributions to shareholders are recorded on the ex-dividend date. The amount and timing of distributions are determined in accordance with federal income tax regulations, which may differ from U.S. GAAP.
The Fund makes quarterly cash distributions to shareholders of a stated dollar amount per share. Subject to approval and oversight by the Fund's Board of Trustees, the Fund seeks to maintain a stable distribution level designed to deliver the long-term return potential of the Fund's investment strategy through regular quarterly distributions (a "Managed Distribution Program"). Total distributions during a calendar year generally will be made from the Fund's net investment income, net realized capital gains and net unrealized capital gains in the Fund's portfolio, if any. The portion of distributions paid attributed to net unrealized gains, if any, is distributed from the Fund's assets and is treated by shareholders as a non-taxable distribution ("Return of Capital") for tax purposes. In the event that total distributions during a calendar year exceed the Fund's total return on net asset value, the difference will reduce net asset value per
Nuveen Investments
25
Notes to
FINANCIAL STATEMENTS (Unaudited) (continued)
share. If the Fund's total return on net asset value exceeds total distributions during a calendar year, the excess will be reflected as an increase in net asset value per share. The final determination of the source and character of all distributions for the fiscal year are made after the end of the fiscal year and are reflected in the financial statements contained in the annual report as of December 31 each year.
Foreign Currency Transactions
The Fund is authorized to engage in foreign currency exchange transactions, including foreign currency exchange contracts, futures, options and swap contracts. To the extent that the Fund invests in securities and/or contracts that are denominated in a currency other than U.S. dollars, the Fund will be subject to currency risk, which is the risk that an increase in the U.S. dollar relative to the foreign currency will reduce returns or portfolio value. Generally, when the U.S. dollar rises in value against a foreign currency, the Fund's investments denominated in that currency will lose value because its currency is worth fewer U.S. dollars; the opposite effect occurs if the U.S. dollar falls in relative value. Investments and other assets and liabilities denominated in foreign currencies are converted into U.S. dollars on a spot (i.e. cash) basis at the spot rate prevailing in the foreign currency exchange market at the time of valuation. Purchases and sales of investments and income denominated in foreign currencies are translated into U.S. dollars on the respective dates of such transactions.
The books and records of the Fund are maintained in U.S. dollars. Foreign currencies, assets and liabilities are translated into U.S. dollars at 4:00 p.m. Eastern Time. Investment transactions, income and expenses are translated on the respective dates of such transactions. Net realized foreign currency gains and losses resulting from changes in exchange rates include foreign currency gains and losses between trade date and settlement date of the transactions, foreign currency transactions, and the difference between the amounts of interest and dividends recorded on the books of the Fund and the amounts actually received.
The realized gains and losses resulting from changes in foreign currency exchange rates and changes in foreign exchange rates associated with other assets and liabilities on investments and options written are recognized as a component of "Net realized gain (loss) from investments and foreign currency," on the Statement of Operations, when applicable.
The unrealized gains and losses resulting from changes in foreign currency exchange rates and changes in foreign exchange rates associated with other assets and liabilities on investments are recognized as a component of "Change in net unrealized appreciation (depreciation) of investments and foreign currency," on the Statement of Operations, when applicable. The unrealized gains and losses resulting from changes in foreign exchange rates associated with foreign currency exchange contracts, futures, options purchased, options written and swaps are recognized as a component of "Change in net unrealized appreciation (depreciation) of foreign currency exchange contracts, futures, options purchased, options written and swap contracts," respectively on the Statement of Operations, when applicable.
Options Transactions
The Fund is subject to equity price risk in the normal course of pursuing its investment objectives and is authorized to write (sell) call options on securities in an attempt to manage such risk. When the Fund writes a call option, an amount equal to the net premium received (the premium less commission) is recognized as a component of "Call options written, at value" on the Statement of Assets and Liabilities and is subsequently adjusted to reflect the current value of the written option until the option is exercised or expires or the Fund enters into a closing purchase transaction. The changes in the value of options written during the fiscal period are recognized as a component of "Change in net unrealized appreciation (depreciation) of call options written" on the Statement of Operations. When an option is exercised or expires or the Fund enters into a closing purchase transaction, the difference between the net premium received and any amount paid at expiration or on executing a closing purchase transaction, including commission, is recognized as a component of "Net realized gain (loss) from call options written" on the Statement of Operations. The Fund, as a writer of an option has no control over whether the underlying instrument may be sold (called) or purchased (put) and as a result bears the risk of an unfavorable change in the market value of the instrument underlying the written option. There is also the risk the Fund may not be able to enter into a closing transaction because of an illiquid market.
During the period April 25, 2012 (commencement of operations) through June 30, 2012, the Fund wrote call options on a basket of stocks, while investing in a portfolio of equities, to enhance returns while foregoing some upside potential.
Nuveen Investments
26
The average notional amount of call options written during the period April 25, 2012 (commencement of operations) through June 30, 2012, was as follows:
| Average notional amount of call options written* | | $ | — | | |
* The average notional amount of call options written is calculated based on the outstanding notional at the beginning of the fiscal year and at the end of each fiscal quarter within the current fiscal year.
Refer to Footnote 3—Derivative Instruments and Hedging Activities and Footnote 5—Investment Transactions for further details on options activity.
Market and Counterparty Credit Risk
In the normal course of business the Fund may invest in financial instruments and enter into financial transactions where risk of potential loss exists due to changes in the market (market risk) or failure of the other party to the transaction to perform (counterparty credit risk). The potential loss could exceed the value of the financial assets recorded on the financial statements. Financial assets, which potentially expose the Fund to counterparty credit risk, consist principally of cash due from counterparties on forward, option and swap transactions, when applicable. The extent of the Fund's exposure to counterparty credit risk in respect to these financial assets approximates their carrying value as recorded on the Statement of Assets and Liabilities. Futures contracts, when applicable, expose the Fund to minimal counterparty credit risk as they are exchange traded and the exchange's clearing-house, which is counterparty to all exchange traded futures, guarantees the futures contracts against default.
The Fund helps manage counterparty credit risk by entering into agreements only with counterparties the Adviser believes have the financial resources to honor their obligations and by having the Adviser monitor the financial stability of the counterparties. Additionally, counterparties may be required to pledge collateral daily (based on the daily valuation of the financial asset) on behalf of the Fund with a value approximately equal to the amount of any unrealized gain above a pre-determined threshold. Reciprocally, when the Fund has an unrealized loss, the Fund has instructed the custodian to pledge assets of the Fund as collateral with a value approximately equal to the amount of the unrealized loss above a pre-determined threshold. Collateral pledges are monitored and subsequently adjusted if and when the valuations fluctuate, either up or down, by at least the pre-determined threshold amount.
Organizational and Offering Costs
The Adviser has agreed to reimburse the Fund's organizational expenses (approximately $11,000) and to pay all offering costs (other than the sales load) that exceed $.04 per share. The Fund's share of offering costs ($391,000) was recorded as a reduction of proceeds from the sale of shares.
Repurchase Agreements
In connection with transactions in repurchase agreements, it is the Fund's policy that its custodian take possession of the underlying collateral securities, the fair value of which exceeds the principal amount of the repurchase transaction, including accrued interest, at all times. If the counterparty defaults, and the fair value of the collateral declines, realization of the collateral may be delayed or limited.
Zero Coupon Securities
The Fund is authorized to invest in zero coupon securities. A zero coupon security does not pay a regular interest coupon to its holders during the life of the security. Income to the holder of the security comes from accretion of the difference between the original purchase price of the security at issuance and the par value of the security at maturity and is effectively paid at maturity. The market prices of zero coupon securities generally are more volatile than the market prices of securities that pay interest periodically.
Custodian Fee Credit
The Fund has an arrangement with the custodian bank whereby certain custodian fees and expenses are reduced by net credits earned on the Fund's cash on deposit with the bank. Such deposit arrangements are an alternative to overnight investments. Credits for cash balances may be offset by charges for any days on which the Fund overdraws its account at the custodian bank.
Indemnifications
Under the Fund's organizational documents, its officers and trustees are indemnified against certain liabilities arising out of the performance of their duties to the Fund. In addition, in the normal course of business, the Fund enters into contracts that provide general indemnifications to other parties. The Fund's maximum exposure under these arrangements is unknown as this would involve future claims that may be made against the Fund that have not yet occurred. However, the Fund has not had prior claims or losses pursuant to these contracts and expects the risk of loss to be remote.
Use of Estimates
The preparation of financial statements in conformity with U.S. GAAP requires management to make estimates and assumptions that affect the reported amounts of assets and liabilities at the date of the financial statements and the reported amounts of increases and decreases in net assets applicable to Common shares from operations during the reporting period. Actual results may differ from those estimates.
Nuveen Investments
27
Notes to
FINANCIAL STATEMENTS (Unaudited) (continued)
2. Fair Value Measurements
Fair value is defined as the price that the Fund would receive upon selling an investment or transferring a liability in an orderly transaction to an independent buyer in the principal or most advantageous market for the investment. A three-tier hierarchy is used to maximize the use of observable market data and minimize the use of unobservable inputs and to establish classification of fair value measurements for disclosure purposes. Observable inputs reflect the assumptions market participants would use in pricing the asset or liability. Observable inputs are based on market data obtained from sources independent of the reporting entity. Unobservable inputs reflect the reporting entity's own assumptions about the assumptions market participants would use in pricing the asset or liability. Unobservable inputs are based on the best information available in the circumstances. The following is a summary of the three-tiered hierarchy of valuation input levels.
Level 1 — Inputs are unadjusted and prices are determined using quoted prices in active markets for identical securities.
Level 2 — Prices are determined using other significant observable inputs (including quoted prices for similar securities, interest rates, prepayment speeds, credit risk, etc.).
Level 3 — Prices are determined using significant unobservable inputs (including management's assumptions in determining the fair value of investments).
The inputs or methodologies used for valuing securities are not an indication of the risks associated with investing in those securities. The following is a summary of the Fund's fair value measurements as of the end of the reporting period:
| | | Level 1 | | Level 2 | | Level 3 | | Total | |
| Long-Term Investments*: | |
| Common Stocks | | $ | 54,297,578 | | | $ | 28,910,629 | | | $ | 58,506 | | | $ | 83,266,713 | | |
| Exchange-Traded Funds | | | — | | | | 242,427 | | | | — | | | | 242,427 | | |
| Convertible Preferred Securities | | | 2,409,548 | | | | 269,914 | | | | — | | | | 2,679,462 | | |
| $25 Par (or similar) Preferred Securities | | | 34,489,610 | | | | — | | | | — | | | | 34,489,610 | | |
| Corporate Bonds | | | — | | | | 57,966,775 | | | | — | | | | 57,966,775 | | |
| Capital Preferred Securities | | | 2,232,111 | | | | — | | | | — | | | | 2,232,111 | | |
| Short-Term Investments: | |
| U.S. Government and Agency Obligations | | | — | | | | 349,944 | | | | — | | | | 349,944 | | |
| Repurchase Agreements | | | — | | | | 4,761,952 | | | | — | | | | 4,761,952 | | |
| Total | | $ | 93,428,847 | | | $ | 92,501,641 | | | $ | 58,506 | | | $ | 185,988,994 | | |
* Refer to the Fund's Portfolio of Investments for industry classifications, a breakdown of securities classified as Level 3 and a breakdown of Common Stocks, Exchange-Traded Funds and Convertible Preferred Securities classified as Level 2.
The Nuveen funds' Board of Directors/Trustees is responsible for the valuation process and has delegated the oversight of the daily valuation process to the Adviser's Valuation Committee. The Valuation Committee, pursuant to the valuation policies and procedures adopted by the Board of Directors/Trustees, is responsible for making fair value determinations, evaluating the effectiveness of the funds' pricing policies, and reporting to the Board of Directors/Trustees. The Valuation Committee is aided in its efforts by the Adviser's dedicated Securities Valuation Team, which is responsible for administering the daily valuation process and applying fair value methodologies as approved by the Valuation Committee. When determining the reliability of independent pricing services for investments owned by the funds, the Valuation Committee, among other things, conducts due diligence reviews of the pricing services and monitors the quality of security prices received through various testing reports conducted by the Securities Valuation Team.
The Valuation Committee will consider pricing methodologies it deems relevant and appropriate when making fair value determinations. Examples of possible methodologies include, but are not limited to, multiple of earnings; discount from market of a similar freely traded security; discounted cash-flow analysis; book value or a multiple thereof; risk premium/yield analysis; yield to maturity; and/or fundamental investment analysis. The Valuation Committee will also consider factors it deems relevant and appropriate in light of the facts and circumstances. Examples of possible factors include, but are not limited to, the type of security; the issuer's financial statements; the purchase price of the security; the discount from market value of unrestricted securities of the
Nuveen Investments
28
same class at the time of purchase; analysts' research and observations from financial institutions; information regarding any transactions or offers with respect to the security; the existence of merger proposals or tender offers affecting the security; the price and extent of public trading in similar securities of the issuer or comparable companies; and the existence of a shelf registration for restricted securities.
For each portfolio security that has been fair valued pursuant to the policies adopted by the Board of Directors/Trustees, the fair value price is compared against the last available and next available market quotations. The Valuation Committee reviews the results of such testing and fair valuation occurrences are reported to the Board of Directors/Trustees.
3. Derivative Instruments and Hedging Activities
The Fund records derivative instruments at fair value, with changes in fair value recognized on the Statement of Operations, when applicable. Even though the Fund's investments in derivatives may represent economic hedges, they are not considered to be hedge transactions for financial reporting purposes. For additional information on the derivative instruments in which the Fund was invested during and at the end of the reporting period, refer to the Portfolio of Investments, Financial Statements and Footnote 1—General Information and Significant Accounting Policies.
The following table presents the amount of net realized gain (loss) recognized for the period April 25, 2012 (commencement of operations) through June 30, 2012, on derivative instruments, as well as the primary risk exposure.
| Net Realized Gain (Loss) from Call Options Written | |
| Risk Exposure | |
| Equity Price | | $ | 45,354 | | |
4. Fund Shares
Transactions in Fund shares were as follows:
| | | For the period 4/25/12
(commencement of operations)
through 6/30/12 | |
| Shares sold | | | 9,775,000 | | |
5. Investment Transactions
Purchases and sales (excluding short-term investments and derivative transactions) during the period April 25, 2012, (commencement of operations) through June 30, 2012, aggregated $224,729,427 and $42,616,262, respectively.
Transactions in call options written during the period April 25, 2012 (commencement of operations) through June 30, 2012, were as follows:
| | | Number of
Contracts | | Premiums
Received | |
| Outstanding, beginning of period | | | — | | | $ | — | | |
| Call options written | | | 362,834 | | | | 90,708 | | |
| Call options terminated in closing purchase transactions | | | (181,417 | ) | | | (45,354 | ) | |
| Call options exercised | | | — | | | | — | | |
| Call options expired | | | (181,417 | ) | | | (45,354 | ) | |
| Outstanding, end of period | | | — | | | $ | — | | |
6. Income Tax Information
The following information is determined in accordance with income tax regulations, which may differ from U.S. GAAP.
At June 30, 2012, the cost and unrealized appreciation (depreciation) of investments (excluding investments in derivatives), as determined on a federal income tax basis, were as follows:
| Cost of investments | | $ | 185,757,195 | | |
| Gross unrealized: | |
| Appreciation | | $ | 2,794,309 | | |
| Depreciation | | | (2,562,510 | ) | |
| Net unrealized appreciation (depreciation) of investments | | $ | 231,799 | | |
Nuveen Investments
29
Notes to
FINANCIAL STATEMENTS (Unaudited) (continued)
7. Management Fees and Other Transactions with Affiliates
The Fund's management fee consists of two components—a fund-level fee, based only on the amount of assets within the Fund, and a complex-level fee, based on the aggregate amount of all eligible fund assets managed by the Adviser. This pricing structure enables Fund shareholders to benefit from growth in the assets within the Fund as well as from growth in the amount of complex-wide assets managed by the Adviser.
The annual fund-level fee, payable monthly, is calculated according to the following schedule:
| Average Daily Managed Assets* | | Fund-Level Fee Rate | |
| For the first $500 million | | | .8000 | % | |
| For the next $500 million | | | .7750 | | |
| For the next $500 million | | | .7500 | | |
| For the next $500 million | | | .7250 | | |
| For managed assets over $2 billion | | | .7000 | | |
The annual complex-level fee, payable monthly, is calculated according to the following schedule:
| Complex-Level Managed Asset Breakpoint Level* | | Effective Rate at Breakpoint Level | |
| $55 billion | | | .2000 | % | |
| $56 billion | | | .1996 | | |
| $57 billion | | | .1989 | | |
| $60 billion | | | .1961 | | |
| $63 billion | | | .1931 | | |
| $66 billion | | | .1900 | | |
| $71 billion | | | .1851 | | |
| $76 billion | | | .1806 | | |
| $80 billion | | | .1773 | | |
| $91 billion | | | .1691 | | |
| $125 billion | | | .1599 | | |
| $200 billion | | | .1505 | | |
| $250 billion | | | .1469 | | |
| $300 billion | | | .1445 | | |
* For the fund-level and complex-level fees, managed assets include closed-end fund assets managed by the Adviser that are attributable to financial leverage. For these purposes, financial leverage includes the funds' use of preferred stock and borrowings and certain investments in the residual interest certificates (also called inverse floating rate securities) in tender option bond (TOB) trusts, including the portion of assets held by a TOB trust that has been effectively financed by the trust's issuance of floating rate securities, subject to an agreement by the Adviser as to certain funds to limit the amount of such assets for determining managed assets in certain circumstances. The complex-level fee is calculated based upon the aggregate daily managed assets of all Nuveen Funds that constitute "eligible assets." Eligible assets do not include assets attributable to investments in other Nuveen Funds and assets in excess of $2 billion added to the Nuveen Fund complex in connection with the Adviser's assumption of the management of the former First American Funds effective January 1, 2011. As of June 30, 2012, the complex-level fee rate for the Fund was .1731%.
The management fee compensates the Adviser for overall investment advisory and administrative services and general office facilities. The Adviser is responsible for the Fund's overall investment strategy and asset allocation decisions. The Adviser has entered into a sub-advisory agreement with Nuveen Asset Management, LLC (the "Sub-Adviser"), a wholly-owned Subsidiary of the Adviser, under which the Sub-Adviser manages the investment portfolio of the Fund, including the Fund's options strategy. The Sub-Adviser is compensated for its services to the Fund from the management fees paid to the Adviser.
The Fund pays no compensation directly to those of its trustees who are affiliated with the Adviser or to its officers, all of whom receive remuneration for their services to the Fund from the Adviser or its affiliates. The Board of Trustees has adopted a deferred compensation plan for independent trustees that enables trustees to elect to defer receipt of all or a portion of the annual
Nuveen Investments
30
compensation they are entitled to receive from certain Nuveen-advised funds. Under the plan, deferred amounts are treated as though equal dollar amounts had been invested in shares of select Nuveen-advised funds.
8. Borrowing Arrangements
The Fund may use borrowings as a means of financial leverage.
Subsequent to the reporting period, the Fund entered into a $90 million (maximum commitment amount) senior committed secured 180-day rolling margin commitment facility (the "Facility"), with Bank of America N.A.
In order to maintain the Facility, the Fund must meet certain collateral, asset coverage and other requirements. Borrowings outstanding are fully secured by securities held in the Fund's portfolio of investments. Interest will be charged on the Facility at a rate equal to the one-month LIBOR (London Inter-bank Offered Rate) plus 0.75%. In addition to interest expense, the Fund will pay a commitment fee based on either (1) 0.25% of the undrawn commitment amount or (2) a 80% facility minimum utilization.
Borrowings outstanding will be recognized as "Borrowings" on the Statement of Assets and Liabilities. Interest expense and commitment fees will be recognized as a component of "Interest expense on borrowings" on the Statement of Operations.
9. New Accounting Pronouncements
Financial Accounting Standards Board ("FASB") Balance Sheet (Topic 210): Disclosures about Offsetting Assets and Liabilities
In December 2011, the FASB issued Accounting Standards Update ("ASU") No. 2011-11 ("ASU No. 2011-11") to enhance disclosures about financial instruments and derivative instruments that are subject to offsetting ("netting") on the Statement of Assets and Liabilities. This information will enable users of the entity's financial statements to evaluate the effect or potential effect of netting arrangements on the entity's financial position. ASU No. 2011-11 is effective prospectively during interim or annual periods beginning on or after January 1, 2013. At this time, management is evaluating the implications of this guidance and the impact it will have to the financial statements amounts and footnote disclosures, if any.
Nuveen Investments
31
Annual Investment Management
Agreement Approval Process (Unaudited)
The Board of Trustees (the "Board," and each Trustee, a "Board Member") of the Fund, including the Board Members who are not parties to its advisory or sub-advisory agreements or "interested persons" of any such parties (the "Independent Board Members"), is responsible for approving advisory arrangements for the Fund. At a meeting held on February 27-29, 2012 (the "February Meeting"), the Board Members, including the Independent Board Members, considered and approved the investment management agreement (the "Investment Management Agreement") between the Fund and Nuveen Fund Advisors, Inc. (the "Advisor"), and the investment sub-advisory agreement (the "Sub-Advisory Agreement") between the Advisor and Nuveen Asset Management, LLC (the "Sub-Adviser"), on behalf of the Fund. At a subsequent meeting held on April 18-19, 2012 (the "April Meeting" and, together with the February Meeting, the "Meetings"), the Board Members, including the Independent Board Members, further considered and re-approved the sub-advisory fee to be paid by the Advisor to the Sub-Adviser. The Sub-Adviser and the Advisor are each hereafter a "Fund Adviser." The Investment Management Agreement and the Sub-Advisory Agreement are each hereafter an "Advisory Agreement."
To assist the Board in its evaluation of an Advisory Agreement with a Fund Adviser at the February Meeting, the Independent Board Members had received, in adequate time in advance of the February Meeting or at prior meetings, materials which outlined, among other things:
• the nature, extent and quality of services expected to be provided by the Fund Adviser;
• the organization of the Fund Adviser, including the responsibilities of various departments and key personnel;
• the expertise and background of the Fund Adviser with respect to the Fund's investment strategy;
• certain performance-related information (as described below);
• the profitability of Nuveen Investments, Inc. ("Nuveen") (which incorporated Nuveen's wholly-owned affiliated sub-advisers);
• the proposed management fees of the Fund, including comparisons of such fees with the management fees of comparable funds;
• the expected expenses of the Fund, including comparisons of the Fund's expected expense ratio with the expense ratios of comparable funds; and
• the soft dollar practices of the Fund Adviser, if any.
Nuveen Investments
32
At the February Meeting, the Advisor made a presentation to and responded to questions from the Board. The Independent Board Members also met privately with their legal counsel to review the Board's duties under the Investment Company Act of 1940 (the "1940 Act"), the general principles of state law in reviewing and approving advisory contracts, the standards used by courts in determining whether investment company boards of directors have fulfilled their duties, factors to be considered in voting on advisory contracts and an adviser's fiduciary duty with respect to advisory agreements and compensation. It is with this background that the Independent Board Members considered the Advisory Agreements. As outlined in more detail below, the Independent Board Members considered all factors they believed relevant with respect to the Fund, including the following: (a) the nature, extent and quality of the services to be provided by the Fund Adviser; (b) investment performance, as described below; (c) the advisory fees and costs of the services to be provided to the Fund and the profitability of Nuveen and its affiliates; (d) the extent of any anticipated economies of scale; and (e) any benefits expected to be derived by the Fund Adviser from its relationship with the Fund.
A. Nature, Extent and Quality of Services
The Independent Board Members considered the nature, extent and quality of the respective Fund Adviser's services, including advisory services and administrative services. As the Advisor and the Sub-Adviser already serve as adviser and sub-adviser, respectively, to other Nuveen funds overseen by the Board Members, the Board has a good understanding of each such Fund Adviser's organization, operations and personnel. As the Independent Board Members meet regularly throughout the year to oversee the Nuveen funds, including funds currently advised by the Fund Advisers, the Independent Board Members have relied upon their knowledge from their meetings and any other interactions throughout the year of the respective Fund Adviser and its services in evaluating the Advisory Agreements. At the Meetings and at prior meetings, the Independent Board Members reviewed materials outlining, among other things, the respective Fund Adviser's organization and business; the types of services that such Fund Adviser or its affiliates provide to the Nuveen funds and are expected to provide to the Fund; and the experience of the respective Fund Adviser with applicable investment strategies. Further, the Independent Board Members have evaluated the background and experience of the Fund Adviser's investment personnel.
In addition to advisory services, the Independent Board Members considered the quality and extent of any administrative or non-advisory services to be provided. In this regard, the Advisor is expected to provide the Fund with such administrative and other services (exclusive of, and in addition to, any such services provided by others for the Fund) and officers and other personnel as are necessary for the operations of the Fund. In addition to investment management services, the Advisor and its affiliates will provide the Fund with a wide range of services, including, among other things, product management, investment services (such as oversight of investment policies and procedures, risk management and pricing), fund administration, oversight of service providers, shareholder services, administration of Board relations, regulatory and portfolio compliance, legal support, managing leverage and promoting an orderly secondary market for
Nuveen Investments
33
Annual Investment Management Agreement
Approval Process (Unaudited) (continued)
common shares. The Independent Board Members also recognized that the Advisor would oversee the Sub-Adviser.
In addition to the foregoing services, the Independent Board Members also noted the additional services that the Advisor or its affiliates provide to closed-end funds, including, in particular, Nuveen's continued commitment to supporting the secondary market for the common shares of its closed-end funds through a comprehensive secondary market communication program designed to raise investor and analyst awareness and understanding of closed-end funds. These efforts include participating in conferences; communicating continually with closed-end fund analysts covering the Nuveen funds; providing marketing for the closed-end funds; and maintaining and enhancing a closed-end fund website.
In evaluating the services of the Sub-Adviser, the Independent Board Members noted that the Sub-Adviser was expected to supply portfolio investment management services to the Fund and that the Fund was expected to utilize the portfolio management capabilities of the Sub-Adviser's real assets investment team.
Based on their review, the Independent Board Members found that, overall, the nature, extent and quality of services expected to be provided to the Fund under each Advisory Agreement were satisfactory.
B. Investment Performance
The Fund was new and therefore did not have its own performance history. However, the Independent Board Members are familiar with the performance records of other Nuveen funds advised by the Adviser and sub-advised by the Sub-Adviser, including the Nuveen Real Asset Income Fund, which is a rather new open-end fund with an investment strategy similar to that of the Fund, and, in addition, the Nuveen Real Estate Securities Fund and the Nuveen Global Infrastructure Fund, which are two other open-end funds in the Nuveen fund complex that are also managed by the real assets investment team. For each of the foregoing funds, the Independent Board Members were provided with performance information, including return information for the one-year, three-year, five-year and since inception periods ending December 31, 2011 or such shorter periods for funds that did not exist during the respective time frame.
C. Fees, Expenses and Profitability
1. Fees and Expenses
In evaluating the management fees and expenses that the Fund was expected to bear, the Independent Board Members considered, among other things, the Fund's proposed management fee structure and its expected expense ratio in absolute terms as well as compared with the fees and expense ratios of comparable funds. In this regard, the Independent Board Members reviewed, among other things, the management fees of various other funds classified as sector equity funds. In addition, the Independent Board Members noted that the Fund may make investments in certain instruments that have the economic effect of leverage. The Independent Board Members recognized that assets attributable to such Fund's use of effective leverage would be included in the amount of assets upon which the advisory fee is
Nuveen Investments
34
calculated. In this regard, the Independent Board Members noted that the advisory fee is based on a percentage of average daily "Managed Assets." "Managed Assets" generally means the total assets of the Fund minus the sum of its accrued liabilities (other than Fund liabilities incurred for the express purpose of creating leverage). "Total assets" for this purpose includes assets attributable to the Fund's use of leverage (whether or not those assets are reflected in the Fund's financial statements for purposes of U.S. generally accepted accounting principles). The Board Members recognized that because a decision to increase the Fund's leverage would have the effect, all other things being equal, of increasing Managed Assets, and, therefore, the Fund Advisers' respective fees, the Advisor and the Sub-Adviser may have a conflict of interest in determining whether to increase the Fund's use of leverage. Notwithstanding the foregoing, the Independent Board Members considered that the Advisor would seek to manage that potential conflict by only increasing the Fund's use of leverage when it determines that such increase is consistent with the Fund's investment objective, and by periodically reviewing the Fund's performance and use of leverage with the Board.
In addition, the Independent Board Members considered the fund-level breakpoint schedule and the complex-wide breakpoint schedule (described in further detail below) and any applicable fee waivers and expense reimbursements expected to be provided. Based on their review of the fee and expense information provided, the Independent Board Members determined that the Fund's management fees were reasonable in light of the nature, extent and quality of services to be provided to it.
2. Comparisons with the Fees of Other Clients
Due to their experience with other Nuveen funds, the Board Members were familiar with the fees the Advisor assesses to other clients. Such other clients include separately managed accounts (both retail and institutional accounts), foreign investment funds offered by Nuveen and funds that are not offered by Nuveen but are sub-advised by one of Nuveen's investment management teams. In evaluating the comparisons of fees, the Independent Board Members have noted, at the February Meeting or at prior meetings, that the fee rates charged to a fund (such as the Fund) and charged to other clients vary, among other things, because of the different services involved and the additional regulatory and compliance requirements associated with registered investment companies, such as the Fund. Accordingly, the Independent Board Members have considered the differences in the product types, including, but not limited to, the services to be provided, the structure and operations, product distribution and costs thereof, portfolio investment policies, investor profiles, account sizes and regulatory requirements. The Independent Board Members have noted, in particular, that the range of services as described above to be provided to a fund (such as the Fund) is much more extensive than that provided to separately managed accounts. Given the inherent differences in the products, particularly the extensive services to be provided to the Fund, the Independent Board Members believe such facts justify the different levels of fees.
Nuveen Investments
35
Annual Investment Management Agreement
Approval Process (Unaudited) (continued)
In considering the advisory fees of the Sub-Adviser, the Independent Board Members are familiar with the pricing schedule the Sub-Adviser charges for similar investment management services for other clients (such as institutional separate accounts, various separately managed accounts and other Nuveen funds).
3. Profitability of Nuveen
In conjunction with its review of fees at prior meetings, the Independent Board Members have considered the profitability of Nuveen for its advisory activities (which incorporated Nuveen's wholly-owned affiliated sub-advisers) and its financial condition. At the February Meeting or prior meetings, the Independent Board Members reviewed the revenues and expenses of Nuveen's advisory activities, the allocation methodology used in preparing the profitability data and an analysis of the key drivers behind the changes in revenues and expenses that impacted profitability. They also reviewed, among other things, certain financial information dated February 15, 2012 that was provided to investors in Nuveen, as well as Nuveen's financial statements dated as of June 30, 2011. The Independent Board Members have also considered, at the February Meeting or at prior meetings, Nuveen's revenues for advisory activities, expenses, and profit margin compared to that of various unaffiliated management firms with similar amounts of assets under management and relatively comparable asset composition prepared by Nuveen.
In reviewing profitability, the Independent Board Members have recognized the subjective nature of determining profitability, which may be affected by numerous factors, including the allocation of expenses. Further, the Independent Board Members have recognized the difficulties in making comparisons as the profitability of other advisers generally is not publicly available and the profitability information that is available for certain advisers or management firms may not be representative of the industry and may be affected by, among other things, the adviser's particular business mix, capital costs, types of funds managed and expense allocations. Notwithstanding the foregoing, the Independent Board Members reviewed Nuveen's methodology and assumptions for allocating expenses across product lines to determine profitability. In reviewing profitability, the Independent Board Members recognized Nuveen's investment in its fund business. Based on their review, the Independent Board Members concluded that Nuveen's level of profitability for its advisory activities was reasonable in light of the services to be provided.
In evaluating the reasonableness of the compensation, the Independent Board Members also considered any other amounts expected to be paid to a Fund Adviser as well as any indirect benefits (such as soft dollar arrangements, if any) the respective Fund Adviser and its affiliates are expected to receive that are directly attributable to their management of the Fund, if any. See Section E below for additional information on indirect benefits a Fund Adviser may receive as a result of its relationship with the Fund. Based on their review of the overall fee arrangements of the Fund, the Independent Board Members determined that the advisory fees and expected expenses of the Fund were reasonable.
Nuveen Investments
36
D. Economies of Scale and Whether Fee Levels Reflect These Economies of Scale
With respect to economies of scale, the Independent Board Members have recognized the potential benefits resulting from the costs of a fund being spread over a larger asset base, although economies of scale are difficult to measure and predict with precision, particularly on a fund-by-fund basis. The Independent Board Members therefore considered whether the Fund could be expected to benefit from any economies of scale. One method to help ensure that shareholders share in these benefits is to include breakpoints in the advisory fee schedule. Generally, management fees for funds in the Nuveen complex are comprised of a fund-level component and a complex-level component. Accordingly, the Independent Board Members received and reviewed the schedule of proposed advisory fees for the Fund, including fund-level breakpoints thereto. In this regard, however, given that the Fund is a closed-end fund, the Independent Board Members recognized that although the Fund may from time to time make additional share offerings, the growth in its assets will occur primarily through appreciation of its investment portfolio.
In addition to fund-level advisory fee breakpoints, the Board also considered the Fund's complex-wide fee arrangement. Pursuant to the complex-wide fee arrangement, the fees of the funds in the Nuveen complex, including the Fund, are generally reduced as the assets in the fund complex reach certain levels. In evaluating the complex-wide fee arrangement, the Independent Board Members have considered that the complex-wide fee arrangement seeks to provide the benefits of economies of scale to fund shareholders when total fund complex assets increase, even if assets of a particular fund are unchanged or have decreased. The approach reflects the notion that some of Nuveen's costs are attributable to services provided to all its funds in the complex and therefore all funds benefit if these costs are spread over a larger asset base. Based on their review, the Independent Board Members concluded that the breakpoint schedules and complex-wide fee arrangement were acceptable and reflect economies of scale to be shared with the Fund's shareholders when assets under management increase.
E. Indirect Benefits
In evaluating fees, the Independent Board Members also considered information regarding potential "fall out" or ancillary benefits that a Fund Adviser or its affiliates may receive as a result of its relationship with the Fund. In this regard, the Independent Board Members considered any revenues expected to be received by affiliates of the Advisor for serving as agent at Nuveen's trading desk or acting as co-manager in an initial public offering.
In addition to the above, the Independent Board Members considered whether the Fund Advisers will receive any benefits from soft dollar arrangements whereby a portion of the commissions paid by the Fund for brokerage may be used to acquire research that may be useful to a Fund Adviser in managing the assets of the Fund and other clients. The Independent Board Members recognized that each Fund Adviser has authority to pay a higher commission in return for brokerage and research services if it determines in good faith that the commission paid is reasonable in relation to the value of the brokerage and research services provided.
Nuveen Investments
37
Annual Investment Management Agreement
Approval Process (Unaudited) (continued)
Based on their review, the Independent Board Members concluded that any indirect benefits received by a Fund Adviser as a result of its relationship with the Fund were reasonable and within acceptable parameters.
F. Approval
The Independent Board Members did not identify any single factor discussed previously as all-important or controlling. The Board Members, including a majority of the Independent Board Members, concluded that the terms of the Investment Management Agreement and Sub-Advisory Agreement were fair and reasonable, that the Fund Advisers' fees are reasonable in light of the services to be provided to the Fund and that the Investment Management Agreement and Sub-Advisory Agreement should be and were approved on behalf of the Fund.
As noted above, at the April Meeting, the Board further considered the sub-advisory fee to be paid by the Advisor to the Sub-Adviser pursuant to the Sub-Advisory Agreement. The Board determined that the factors and considerations of the Board in approving the sub-advisory fees at the February Meeting were equally applicable at the April Meeting, at which they re-approved such fees.
Nuveen Investments
38
Reinvest Automatically,
Easily and Conveniently
Nuveen makes reinvesting easy. A phone call is all it takes to set up your reinvestment account.
Nuveen Closed-End Funds Automatic Reinvestment Plan
Your Nuveen Closed-End Fund allows you to conveniently reinvest distributions in additional Fund shares.
By choosing to reinvest, you'll be able to invest money regularly and automatically, and watch your investment grow through the power of compounding. Just like distributions in cash, there may be times when income or capital gains taxes may be payable on distributions that are reinvested.
It is important to note that an automatic reinvestment plan does not ensure a profit, nor does it protect you against loss in a declining market.
Easy and convenient
To make recordkeeping easy and convenient, each quarter you'll receive a statement showing your total distributions, the date of investment, the shares acquired and the price per share, and the total number of shares you own.
How shares are purchased
The shares you acquire by reinvesting will either be purchased on the open market or newly issued by the Fund. If the shares are trading at or above net asset value at the time of valuation, the Fund will issue new shares at the greater of the net asset value or 95% of the then-current market price. If the shares are trading at less than net asset value, shares for your account will be purchased on the open market. If the Plan Agent begins purchasing Fund shares on the open market while shares are trading below net asset value, but the Fund's shares subsequently trade at or above their net asset value before the Plan Agent is able to complete its purchases, the Plan Agent may cease open-market purchases and may invest the uninvested portion of the distribution in newly-issued Fund shares at a price equal to the greater of the shares' net asset value or 95% of the shares' market value on the last business day immediately prior to the purchase date. Distributions received to purchase shares in the open market will normally be invested shortly after the distribution payment date. No interest will be paid on distributions awaiting reinvestment. Because the market price of the shares may increase before purchases are completed, the average purchase price per share may exceed the market price at the time of valuation, resulting in the acquisition of fewer shares than if the distribution had been paid in shares issued by the Fund. A pro rata portion of any applicable brokerage commissions on open market purchases will be paid
Nuveen Investments
39
Reinvest Automatically,
Easily and Conveniently (continued)
by Plan participants. These commissions usually will be lower than those charged on individual transactions.
Flexible
You may change your distribution option or withdraw from the Plan at any time, should your needs or situation change.
You can reinvest whether your shares are registered in your name, or in the name of a brokerage firm, bank, or other nominee. Ask your financial advisor if his or her firm will participate on your behalf. Participants whose shares are registered in the name of one firm may not be able to transfer the shares to another firm and continue to participate in the Plan.
The Fund reserves the right to amend or terminate the Plan at any time. Although the Fund reserves the right to amend the Plan to include a service charge payable by the participants, there is no direct service charge to participants in the Plan at this time.
Call today to start reinvesting distributions
For more information on the Nuveen Automatic Reinvestment Plan or to enroll in or withdraw from the Plan, speak with your financial advisor or call us at (800) 257-8787.
Nuveen Investments
40
Glossary of Terms
Used in this Report
• Average Annual Total Return: This is a commonly used method to express an investment's performance over a particular, usually multi-year time period. It expresses the return that would have been necessary each year to equal the investment's actual cumulative performance (including change in NAV or market price and reinvested dividends and capital gains distributions, if any) over the time period being considered.
• Beta: A measure of the variability of the change in the share price for a fund in relation to a change in the value of the fund's market benchmark. Securities with betas higher than 1.0 have been, and are expected to be, more volatile than the benchmark; securities with betas lower than 1.0 have been, and are expected to be, less volatile than the benchmark.
• Comparative Benchmark: A five index blend comprised of weightings approximating the Fund's proposed portfolio: 1) 33% S&P Global Infrastructure Index; 2) 20% BofA Merrill Lynch REIT Preferred Index; 3) 20% Barclays U.S. Corporate High Yield Debt Bond Index; 4) 15% MSCI U.S. REIT Index; and 5) 12% BofA Merrill Lynch Fixed Rate Preferred Securities Index. The Fund's proposed portfolio may differ significantly from the blended portfolio and actual returns may be substantially lower. 1) S&P Global Infrastructure Index: An unmanaged index comprised of 75 of the largest publicly listed infrastructure companies that meet specific investability requirements; 2) BofA Merrill Lynch REIT Preferred Index: An unmanaged index of investment grade REIT preferred shares with a deal size in excess of $100 million, weighted by capitalization and considered representative of investment grade preferred real estate stock performance; 3) Barclays U.S. Corporate High Yield Debt Bond Index: An unmanaged index that covers the universe of domestic fixed-rate non-investment grade debt; 4) MSCI U.S. REIT Index: A free float-adjusted market capitalization weighted index that is comprised of equity REITs that are included in the MSCI U.S. Investable Market 2500 Index, with the exception of specialty equity REITs that do not generate a majority of their revenue and income from real estate rental and leasing operations. This index represents approximately 85% of the U.S. REIT universe; 5) BofA Merrill Lynch Fixed Rate Preferred Securities Index: Tracks the performance of fixed-rate U.S. dollar-denominated preferred securities issued in the U.S. domestic market. Qualifying securities must be rated investment-grade (based on an average of Moody's, S&P and Fitch) and must have an investment-grade-rated country of risk (based on an average of Moody's, S&P and Fitch foreign currency long-term sovereign debt ratings). Benchmark returns do not include the effects of any sales charges or management fees.
Nuveen Investments
41
Glossary of Terms
Used in this Report (continued)
• Effective Leverage: Effective leverage is a Fund's effective economic leverage, and includes both Regulatory Leverage (see below) and the leverage effects of certain derivative investments in the Fund's portfolio that increase the Fund's investment exposure.
• Leverage: Using borrowed money to invest in securities or other assets, seeking to increase the return of an investment or portfolio.
• MSCI World Index: A free-float adjusted market capitalization-weighted index that is designed to measure equity market performance of developed markets. Index returns assume reinvestment of distributions, but do not include the effects of any applicable sales charges or management fees.
• Net Asset Value (NAV): The net market value of all securities held in a portfolio.
• Net Asset Value (NAV) Per Share: The market value of one share of a mutual fund or closed-end fund. For a Fund, the NAV is calculated daily by taking the Fund's total assets (securities, cash, and accrued earnings), subtracting the Fund's liabilities, and dividing by the number of shares outstanding.
• Regulatory Leverage: Regulatory Leverage consists of preferred shares issued by or borrowings of the Fund. Both of these are part of the Fund's capital structure. Regulatory leverage is sometimes referred to as "'40 Act Leverage" and is subject to asset coverage limits set in the Investment Company Act of 1940.
Nuveen Investments
42
Additional Fund Information
Board of Trustees
John P. Amboian
Robert P. Bremner
Jack B. Evans
William C. Hunter
David J. Kundert
William J. Schneider
Judith M. Stockdale
Carole E. Stone
Virginia L. Stringer
Terence J. Toth
Fund Manager
Nuveen Fund Advisors, Inc.
333 West Wacker Drive
Chicago, IL 60606
Custodian
State Street Bank & Trust Company
Boston, MA
Transfer Agent and
Shareholder Services
State Street Bank & Trust Company
Nuveen Funds
P.O. Box 43071
Providence, RI 02940-3071
(800) 257-8787
Legal Counsel
Chapman and Cutler LLP
Chicago, IL
Independent Registered
Public Accounting Firm
Ernst & Young LLP
Chicago, IL
Quarterly Portfolio of Investments and Proxy Voting Information
You may obtain (i) the Fund's quarterly portfolio of investments, (ii) information regarding how the Fund voted proxies relating to portfolio securities held during the most recent twelve-month period ended June 30, and (iii) a description of the policies and procedures that the Fund used to determine how to vote proxies relating to portfolio securities without charge, upon request, by calling Nuveen Investments toll-free at (800) 257-8787 or on Nuveen's website at www.nuveen.com.
You may also obtain this and other Fund information directly from the Securities and Exchange Commission (SEC). The SEC may charge a copying fee for this information. Visit the SEC on-line at http://www.sec.gov or in person at the SEC's Public Reference Room in Washington, D.C. Call the SEC at (202) 942-8090 for room hours and operation. You may also request Fund information by sending an e-mail request to publicinfo@sec.gov or by writing to the SEC's Public Reference Section at 100 F Street NE, Washington, D.C. 20549.
CEO Certification Disclosure
The Fund's Chief Executive Officer has submitted to the New York Stock Exchange (NYSE) the annual CEO certification as required by Section 303A.12(a) of the NYSE Listed Company Manual.
The Fund has filed with the SEC the certification of its Chief Executive Officer and Chief Financial Officer required by Section 302 of the Sarbanes-Oxley Act.
Nuveen Investments
43
Nuveen Investments:
Serving Investors for Generations
Since 1898, financial advisors and their clients have relied on Nuveen Investments to provide dependable investment solutions through continued adherence to proven, long-term investing principles. Today, we offer a range of high quality equity and fixed-income solutions designed to be integral components of a well-diversified core portfolio.
Focused on meeting investor needs.
Nuveen Investments provides high-quality investment services designed to help secure the long-term goals of institutional and individual investors as well as the consultants and financial advisors who serve them. Nuveen Investments markets a wide range of specialized investment solutions which provide investors access to capabilities of its high-quality boutique investment affiliates—Nuveen Asset Management, Symphony Asset Management, NWQ Investment Management Company, Santa Barbara Asset Management, Tradewinds Global Investors, Winslow Capital Management and Gresham Investment Management. In total, Nuveen Investments managed $212 billion as of June 30, 2012.
Find out how we can help you.
To learn more about how the products and services of Nuveen Investments may be able to help you meet your financial goals, talk to your financial advisor, or call us at (800) 257-8787. Please read the information provided carefully before you invest. Investors should consider the investment objective and policies, risk considerations, charges and expenses of any investment carefully. Where applicable, be sure to obtain a prospectus, which contains this and other relevant information. To obtain a prospectus, please contact your securities representative or Nuveen Investments, 333 W. Wacker Dr., Chicago, IL 60606. Please read the prospectus carefully before you invest or send money.
Learn more about Nuveen Funds at: www.nuveen.com/cef
Distributed by
Nuveen Securities, LLC
333 West Wacker Drive
Chicago, IL 60606
www.nuveen.com/cef
ESA-M-0612D
ITEM 2. CODE OF ETHICS.
Not applicable to this filing.
ITEM 3. AUDIT COMMITTEE FINANCIAL EXPERT.
Not applicable to this filing.
ITEM 4. PRINCIPAL ACCOUNTANT FEES AND SERVICES.
Not applicable to this filing.
ITEM 5. AUDIT COMMITTEE OF LISTED REGISTRANTS.
Not applicable to this filing.
ITEM 6. SCHEDULE OF INVESTMENTS.
a) See Portfolio of Investments in Item 1.
b) Not applicable.
ITEM 7. DISCLOSURE OF PROXY VOTING POLICIES AND PROCEDURES FOR CLOSED-END MANAGEMENT INVESTMENT COMPANIES.
Not applicable to this filing.
ITEM 8. PORTFOLIO MANAGERS OF CLOSED-END MANAGEMENT INVESTMENT COMPANIES.
Not applicable to this filing.
ITEM 9. PURCHASES OF EQUITY SECURITIES BY CLOSED-END MANAGEMENT INVESTMENT COMPANY AND AFFILIATED PURCHASERS.
Not applicable.
ITEM 10. SUBMISSION OF MATTERS TO A VOTE OF SECURITY HOLDERS.
There have been no material changes to the procedures by which shareholders may recommend nominees to the registrant’s Board implemented after the registrant last provided disclosure in response to this Item.
ITEM 11. CONTROLS AND PROCEDURES.
(a) The registrant’s principal executive and principal financial officers, or persons performing similar functions, have concluded that the registrant’s disclosure controls and procedures (as defined in Rule 30a-3(c) under the Investment Company Act of 1940, as amended (the “1940 Act”) (17 CFR 270.30a-3(c))) are effective, as of a date within 90 days of the filing date of this report that includes the disclosure required by this paragraph, based on their evaluation of the controls and procedures required by Rule 30a-3(b) under the 1940 Act (17 CFR 270.30a-3(b)) and Rules 13a-15(b) or 15d-15(b) under the Securities Exchange Act of 1934, as amended (the “Exchange Act”) (17 CFR 240.13a-15(b) or 240.15d-15(b)).
(b) There were no changes in the registrant’s internal control over financial reporting (as defined in Rule 30a-3(d) under the 1940 Act (17 CFR 270.30a-3(d)) that occurred during the second fiscal quarter of the period covered by this report that has materially affected, or is reasonably likely to materially affect, the registrant’s internal control over financial reporting.
ITEM 12. EXHIBITS.
File the exhibits listed below as part of this Form.
(a)(1) Any code of ethics, or amendment thereto, that is the subject of the disclosure required by Item 2, to the extent that the registrant intends to satisfy the Item 2 requirements through filing of an exhibit: Not applicable to this filing.
(a)(2) A separate certification for each principal executive officer and principal financial officer of the registrant as required by Rule 30a-2(a) under the 1940 Act (17 CFR 270.30a-2(a)) in the exact form set forth below: See Ex-99.CERT attached hereto.
(a)(3) Any written solicitation to purchase securities under Rule 23c-1 under the 1940 Act (17 CFR 270.23c-1) sent or given during the period covered by the report by or on behalf of the registrant to 10 or more persons. Not applicable.
(b)If the report is filed under Section 13(a) or 15(d) of the Exchange Act, provide the certifications required by Rule 30a-2(b) under the 1940 Act (17 CFR 270.30a-2(b)); Rule 13a-14(b) or Rule 15d-14(b) under the Exchange Act (17 CFR 240.13a-14(b) or 240.15d-14(b)), and Section 1350 of Chapter 63 of Title 18 of the United States Code (18 U.S.C. 1350) as an exhibit. A certification furnished pursuant to this paragraph will not be deemed “filed” for purposes of Section 18 of the Exchange Act (15 U.S.C. 78r), or otherwise subject to the liability of that section. Such certification will not be deemed to be incorporated by reference into any filing under the Securities Act of 1933 or the Exchange Act, except to the extent that the registrant specifically incorporates it by reference. See Ex-99.906 CERT attached hereto.
SIGNATURES
Pursuant to the requirements of the Securities Exchange Act of 1934 and the Investment Company Act of 1940, the registrant has duly caused this report to be signed on its behalf by the undersigned, thereunto duly authorized.
(Registrant) Nuveen Real Asset Income and Growth Fund
By (Signature and Title) | /s/ Kevin J. McCarthy | |
| Kevin J. McCarthy
Vice President and Secretary | |
Date: September 7, 2012
Pursuant to the requirements of the Securities Exchange Act of 1934 and the Investment Company Act of 1940, this report has been signed below by the following persons on behalf of the registrant and in the capacities and on the dates indicated.
By (Signature and Title) | /s/ Gifford R. Zimmerman | |
| Gifford R. Zimmerman Chief Administrative Officer (principal executive officer) | |
Date: September 7, 2012
By (Signature and Title) | /s/ Stephen D. Foy | |
| Stephen D. Foy Vice President and Controller (principal financial officer) | |
Date: September 7, 2012