UNITED STATES
SECURITIES AND EXCHANGE COMMISSION
Washington, D.C. 20549
FORM N-CSR
CERTIFIED SHAREHOLDER REPORT OF REGISTERED
MANAGEMENT INVESTMENT COMPANIES
Investment Company Act file number | 811-22658 |
|
Nuveen Real Asset Income and Growth Fund |
(Exact name of registrant as specified in charter) |
|
Nuveen Investments 333 West Wacker Drive Chicago, IL 60606 |
(Address of principal executive offices) (Zip code) |
|
Kevin J. McCarthy Nuveen Investments 333 West Wacker Drive Chicago, IL 60606 |
(Name and address of agent for service) |
|
Registrant’s telephone number, including area code: | (312) 917-7700 | |
|
Date of fiscal year end: | December 31 | |
|
Date of reporting period: | December 31, 2013 | |
| | | | | | |
Form N-CSR is to be used by management investment companies to file reports with the Commission not later than 10 days after the transmission to stockholders of any report that is required to be transmitted to stockholders under Rule 30e-1 under the Investment Company Act of 1940 (17 CFR 270.30e-1). The Commission may use the information provided on Form N-CSR in its regulatory, disclosure review, inspection, and policymaking roles.
A registrant is required to disclose the information specified by Form N-CSR, and the Commission will make this information public. A registrant is not required to respond to the collection of information contained in Form N-CSR unless the Form displays a currently valid Office of Management and Budget ("OMB") control number. Please direct comments concerning the accuracy of the information collection burden estimate and any suggestions for reducing the burden to Secretary, Securities and Exchange Commission, 450 Fifth Street, NW, Washington, DC 20549-0609. The OMB has reviewed this collection of information under the clearance requirements of 44 U.S.C. ss. 3507.
ITEM 1. REPORTS TO STOCKHOLDERS.

Nuveen Investments
Closed-End Funds
Seeks High Current Income and Capital Appreciation of Commercial Real Estate Investments.
Annual Report December 31, 2013
JRI
Nuveen Real Asset Income and Growth Fund
Nuveen makes things e-simple.
It only takes a minute to sign up for e-Reports. Once enrolled, you'll receive an e-mail as soon as your Nuveen Investments Fund information is ready—no more waiting for delivery by regular mail. Just click on the link within the e-mail to see the report and save it on your computer if you wish.
Free e-Reports right to your e-mail!
www.investordelivery.com
If you receive your Nuveen Fund dividends and statements from your financial advisor or brokerage account.
or
www.nuveen.com/accountaccess
If you receive your Nuveen Fund dividends and statements directly from Nuveen.

Chairman's Letter to Shareholders | | | 4 | | |
Portfolio Managers' Comments | | | 5 | | |
Fund Leverage | | | 9 | | |
Share Information | | | 10 | | |
Risk Considerations | | | 12 | | |
Performance Overview and Holding Summaries | | | 14 | | |
Report of Independent Registered Public Accounting Firm | | | 16 | | |
Portfolio of Investments | | | 17 | | |
Statement of Assets and Liabilities | | | 24 | | |
Statement of Operations | | | 25 | | |
Statement of Changes in Net Assets | | | 26 | | |
Statement of Cash Flows | | | 27 | | |
Financial Highlights | | | 28 | | |
Notes to Financial Statements | | | 30 | | |
Additional Fund Information | | | 40 | | |
Glossary of Terms Used in this Report | | | 41 | | |
Reinvest Automatically, Easily and Conveniently | | | 43 | | |
Board Members & Officers | | | 44 | | |
Nuveen Investments
3
Chairman's Letter
to Shareholders

Dear Shareholders,
I am pleased to have this opportunity to introduce myself to you as the new independent chairman of the Nuveen Fund Board, effective July 1, 2013. I am honored to have been selected as chairman, with its primary responsibility to serve the interests of the Nuveen Fund shareholders. My predecessor, Robert Bremner, was the first independent director to serve as chairman of the Board and I, and my fellow Board members, plan to continue his legacy of strong independent oversight of your funds.
The global economy has hit major turning points over the last several months to a year. The developed world is gradually recovering from its financial crisis while the emerging markets appear to be struggling with the downshift of China's growth potential. Japan is entering a new era of growth after decades of economic stagnation and many of the Eurozone nations appear to be exiting their recession. Despite the positive events, there are still potential risks. Middle East tensions, rising oil prices, defaults in Europe and fallout from the financial stress in emerging markets could all reverse the recent progress in the global economy.
On the domestic front, recent events such as the Federal Reserve decision to slow down its bond buying program beginning in January of 2014 and the federal budget compromise that would guide government spending into 2015 are both positives for the economy moving forward. Corporate fundamentals are strong as earnings per share and corporate cash are at the highest level in two decades. Unemployment is trending down and the housing market has experienced a rebound, each assisting the positive economic scenario. However, there are some issues to be watched. Interest rates are expected to increase but significant uncertainty about the timing remains. Partisan politics in Washington D.C. with their troublesome outcomes add to the uncertainties that could cause problems for the economy going forward.
In the near term, governments are focused on economic recovery and the growth of their economies, which could lead to an environment of attractive investment opportunities. Over the long term, the uncertainties mentioned earlier could hinder the potential growth. Because of this, Nuveen's investment management teams work hard to balance return and risk with a range of investment strategies. I encourage you to read the following commentary on the management of your fund.
On behalf of the other members of the Nuveen Fund Board, we look forward to continuing to earn your trust in the months and years ahead.

William J. Schneider
Chairman of the Nuveen Fund Board
February 21, 2014
Nuveen Investments
4
Portfolio Managers'
Comments
Nuveen Real Asset Income and Growth Fund (JRI)
Nuveen Real Asset Income and Growth Fund (JRI) features portfolio management by Nuveen Asset Management, LLC, an affiliate of Nuveen Investments. Jay L. Rosenberg has been the lead portfolio manager, while John G. Wenker and Jeffrey T. Schmitz, CFA, have co-managed the Fund since its inception.
Here the portfolio managers discuss general market conditions and trends, their management strategy and the performance of the Fund for the twelve-month reporting period ended December 31, 2013.
What factors affected the U.S. economy and the equity market during the twelve-month reporting period ended December 31, 2013?
During the first part of this reporting period, widespread uncertainty about the next step for the Federal Reserve's (Fed) quantitative easing program and the potential impact on the economy and financial markets led to increased market volatility. After surprising the market in September 2013 with its decision to wait for additional evidence of an improving economy before making any adjustments to the program, the Fed announced on December 18th, that it would begin tapering its monthly bond-buying program by $10 billion (to $75 billion) in January 2014. The outlook for the U.S. economy was clouded by uncertainty about global financial markets and the outcome of the "fiscal cliff." The tax consequences of the fiscal cliff situation were averted through a last-minute deal that raised payroll taxes, but left in place a number of tax breaks. However, lawmakers failed to reach a resolution on $1.2 trillion in spending cuts intended to address the federal budget deficit. This triggered a program of automatic spending cuts (or sequestration) that impacted federal programs beginning March 1, 2013. Although Congress later passed legislation that established federal funding levels for the remainder of fiscal 2013, the federal budget for fiscal 2014 continued to be debated.
On October 1, 2013, the start date for fiscal 2014, the federal government shut down for 16 days until an interim appropriations bill was signed into law, funding the government at sequestration levels through January 15, 2014, and suspending the debt limit until February 7, 2014. At the end of the reporting period, Congress passed a federal budget deal that would guide government spending into 2015 and defuse the chances of another shutdown. In addition to the ongoing political debate over federal spending, Chairman Bernanke's June 2013 remarks about tapering the Fed's asset purchase program touched off widespread uncertainty about the next step for the Fed's quantitative easing program and about the potential impact on the economy and financial markets, leading to increased market volatility.
In the third quarter of 2013, the U.S. economy, as measured by the U.S. gross domestic product (GDP), grew at an annualized rate of 4.1%, up from 2.5% for the second quarter of 2013, continuing the pattern of positive economic growth for the tenth consecutive quarter. The Consumer Price Index (CPI) rose 1.5% year-over-year as of December 2013, while the
Certain statements in this report are forward-looking statements. Discussions of specific investments are for illustration only and are not intended as recommendations of individual investments. The forward-looking statements and other views expressed herein are those of the portfolio managers as of the date of this report. Actual future results or occurrences may differ significantly from those anticipated in any forward-looking statements and the views expressed herein are subject to change at any time, due to numerous market and other factors. The Fund disclaims any obligation to update publicly or revise any forward-looking statements or views expressed herein.
Ratings shown are the highest rating given by one of the following national rating agencies: Standard & Poor's (S&P), Moody's Investors (Moody's) Service, Inc. or Fitch, Inc. (Fitch). Credit ratings are subject to change. AAA, AA, A and BBB are investment grade ratings; BB, B, CCC, CC, C and D are below investment grade ratings. Certain bonds backed by U.S. Government or agency securities are regarded as having an implied rating equal to the rating of such securities. Holdings designated N/R are not rated by these national rating agencies.
Nuveen Investments
5
Portfolio Managers' Comments (continued)
core CPI (which excludes food and energy) increased 1.7% during the same period, staying within the Fed's unofficial objective of 2.0% or lower for this inflation measure. Improvements in the labor markets continued to be slow, and unemployment remained above the Fed's target of 6.5%. As of December 2013, the national unemployment rate was 6.7%, down from 7.0% in November 2013. The housing market continued to deliver good news, as the average home price in the S&P/Case-Shiller Index of 20 major metropolitan areas rose 13.7% for the twelve months ended November 2013 (most recent data available at the time this report was prepared), the largest twelve-month percentage gain for the index since February 2006.
For much of the reporting period, low interest rates and a fairly benign macro environment caused U.S. investors to move out the risk spectrum, resulting in robust flows into U.S. equity funds. Leading U.S. stock market indexes, including the S&P 500® Index, the Dow Jones Industrial Average and the Russell 2000® Index, each hit all-time highs during the reporting period. The S&P 500® Index gained 32.39% and the Dow Jones Industrial Average gained 29.65% during the reporting period.
What key strategies were used to manage the Fund during this twelve-month reporting period ended December 31, 2013?
The Fund has an objective of providing a high level of current income and long-term capital appreciation. In an effort to achieve this objective, the Fund invests in a global portfolio of infrastructure and commercial real estate related securities (i.e. real assets) across the capital structure. These securities include a combination of infrastructure and real estate common stock, infrastructure and real estate preferred stock and infrastructure and real estate related debt. Our goal is to combine these securities into a portfolio that provides investors with an attractive level of income and dampens levels of risk versus the broader equity market. Our long-term target allocations for each of these segments are: 33% in global infrastructure common stock, 15% in real estate investment trust (REIT) common stock, 12% in global infrastructure preferred stock and hybrids, 20% in REIT preferred stock and 20% in debt securities. To a limited extent, the Fund also opportunistically writes calls options primarily on securities issued by real asset related companies, seeking to enhance its risk-adjusted total returns over time.
During the reporting period, we continued to select securities using an investment process that screens for companies and assets across the real assets market that provide higher yields. From the group of securities providing significant yields, we focused on owning those companies and securities with the highest total return potential in the Fund's portfolio. Our process places a premium on finding securities whose revenues come from tangible assets with long-term concessions, contracts or leases and are therefore capable of producing steady, predictable and recurring cash flows. The Fund's management team employs a bottom-up, fundamental approach to security selection and portfolio construction. We look for stable companies that demonstrate consistent and growing cash flow, strong balance sheets and histories of being good stewards of shareholder capital.
As is typical with this strategy, we maintained active asset allocation during the period. Starting when the Fed mentioned the possibility of tapering last June, we believed that companies with higher potential growth and less sensitivity to interest rate moves would most likely outperform. Therefore, we made a concerted effort to begin shifting the Fund's exposure toward companies that can generate growth, while still meeting our yield hurdles. This shift included reducing the Fund's fixed income exposure and increasing its equity exposure (either common equity or convertible type investments). It has also meant moving toward more floating rate and fixed-to-floating rate hybrid securities, which also offered some interest rate protection.
Because of our active asset allocation, the Fund ended the twelve-month reporting period with sector weights that were intentionally different than the above mentioned targets. The Fund's infrastructure preferred/hybrid exposure remained about the same during the reporting period. We sold some of the Fund's perpetual securities that had the most duration risk, while increasing its weight in hybrid securities. In the REIT preferred space, we reduced exposure, particularly early in the period before the segment's sell-off, due to the duration risk posed by these securities. However, the Fund's REIT
Nuveen Investments
6
preferred exposure remained overweight versus the comparative benchmark's allocation. We increased exposure in the infrastructure common equity sector, while still remaining significantly below the comparative benchmark's allocation. The Fund's REIT common equity exposure decreased during the reporting period, but with more exposure within the sector to floating rate mortgage REITs. With the continued prospect of higher rates, we believed commercial mortgage REITs could participate in that market instead of presenting only duration risk. Within the high yield portfolio, we maintained approximately the same weight throughout the reporting period. Our trades were focused on finding attractive opportunities further down the credit spectrum in CCC-rated securities versus taking longer duration bets with securities in the higher BB-rated category. At the end of the reporting period, we owned high yield securities spread across the U.S., emerging markets and European markets and diversified among a number of real asset categories, with the greatest concentrations in the industrial, pipeline, utility, hospital and technology infrastructure sectors.
We also slightly increased the Fund's overall U.S. exposure during the reporting period as a result of the increase in U.S. domiciled equity and commercial mortgage REITs. However, our long-term target for geographic distribution in the Fund remains at roughly 50% U.S. exposure and 50% non-U.S. exposure.
How did the Fund perform during this twelve-month reporting period ended December 31, 2013?
The table in the Performance Overview and Holding Summaries section of this report provides total return performance for the Fund for the one-year and since inception periods ended December 31, 2013. For the twelve-month reporting period ended December 31, 2013, the Fund's total return on net asset value (NAV) outperformed its JRI Blended Index, but underperformed the Morgan Stanley Capital International (MSCI) World Index.
During the reporting period, the Fund continued to generate a higher level of yield than its comparative benchmark, while experiencing particularly favorable attribution from three of its five major segments. The Fund's top-performing area on a relative basis for the period was REIT preferreds, followed by REIT common equity and infrastructure preferred/hybrids. REIT preferred and REIT common equity in particular showed strong results. Meanwhile, the high yield portion of the Fund produced returns in line with the benchmark during the reporting period, while the infrastructure common equity portfolio detracted. The Fund also benefited from several strategic asset allocation shifts we made during the reporting period discussed below. The Fund's returns fell short of the MSCI World Index mainly due to its focus on infrastructure and real estate related securities. Relative to the broader equity markets, real estate underperformed as interest rate volatility more adversely impacted this segment relative to higher beta securities with higher growth prospects. The more defensive infrastructure holdings also lagged the more pro-cyclical global equity benchmark as investors developed a stronger appetite for risk. In addition, the Fund's exposure to fixed income detracted, as the high yield market underperformed global equity markets.
The REIT preferred portion of the Fund produced very strong results relative to its comparative benchmark owing strictly to strong stock selection, which more than made up for our overweight to this underperforming sector. As measured by the BofA/Merrill Lynch REIT Preferred Index, REIT preferreds produced a -11.46% return during the reporting period due to the long durations of many of these securities. However, prior to the Fed's tapering discussion, we focused the Fund's REIT preferred exposure almost exclusively on non-rated securities, which we believed would offer protection against rising interest rates as they had a much larger spread to Treasuries. Non-rated securities appeal to a much smaller pool of investors because they don't have a preferred rating, which means we can often find pricing inefficiencies in the market. However, at the same time, they offer yields that are quite a bit more attractive than their rated counterparts. Although most of the Fund's non-rated exposure is in cumulative preferred securities, we also own various convertible preferreds that offer an acceptable level of yield with the option of upside potential if the conversion occurs. The Fund's non-rated securities did indeed exhibit superior duration protection during the reporting period as they outperformed rated preferred securities by a significant margin.
Nuveen Investments
7
Portfolio Managers' Comments (continued)
The Fund also outperformed in the REIT common equity space due to strong security selection, again despite the headwinds caused by the sector's underperformance and our overweight to this area. In this portion of the Fund, we saw very favorable returns from our out-of-index exposure to commercial mortgage REITs that originate predominantly floating rate mortgages. These securities strongly outperformed the return of the REIT common equity sector during the reporting period, as measured by the MSCI U.S. REIT Index. Well before the Fed began its tapering discussion, we believed REIT common equities were overvalued and moved into these commercial mortgage REITs (both common equity and convertible bonds) at prices that were close to book value. As interest rates rise, we believe these companies will continue to trade at larger premiums to book value as they undertake accretive transactions.
Our infrastructure preferred/hybrid portfolio also outperformed relative to the index as it benefited from our positioning for a rising interest rate environment. The majority of the Fund's infrastructure preferred/hybrid portfolio is invested in non-U.S. hybrid securities that have a fixed-to-floating rate structure whereby they change to a floating rate security after five years. These securities outperformed because of their lower perceived duration risk compared to long-maturity perpetual preferred securities as rates moved higher.
The high yield portion of the Fund fell in line with the index during the reporting period. Investors returned to the asset class in the second half of the year in the wake of the Fed's "no taper" decision, after the segment's dramatic sell-off in June. However, the high yield asset class still had net outflows for the full year of $3.4 billion, only the sixth time since 1984 that this market segment has posted withdrawals. The spread between high yield and Treasuries tightened by 110 basis points during the reporting period to end the year at 428 basis points. Given the benign credit environment seen over the course of the past two years, few investors were overly concerned with credit risk as most wanted to avoid interest rate risk. As a result, throughout 2013 the lower quality tiers of high yield outpaced higher rated securities. The Fund's high yield performance benefited from our overweights in the pipeline, health care and utilities sectors. However, a lack of exposure to the more economically sensitive areas of the industrials sector, which are not part of the Fund's infrastructure/real estate mandate, detracted as those areas were the strongest performers during the reporting period.
The Fund's only significant sector detractor on a relative basis during the reporting period was infrastructure common equity. The shortfall was due to a combination of an underweight position in what turned out to be the highest returning sector in our comparative benchmark and our focus on the highest yielding areas within the sector. Infrastructure common equity makes up a large portion of the comparative benchmark, while the Fund had a smaller exposure in the asset class during the period. As measured by the S&P Global Infrastructure Index, the sector returned 14.99% during the reporting period ended December 31, 2013. The reason we so significantly underweighted this segment versus the benchmark was because of our focus on the higher yielding names, which we correctly anticipated would have more sensitivity to rising rates. Our infrastructure common equity exposure focuses on securities that pay out the majority of their cash flows and that have more mature, stable assets and less cyclicality. Overall during the reporting period, the higher beta, more cyclical names within the segment outperformed the higher yielding, more defensive names.
The Fund also periodically wrote call options on REIT stocks, while owning REIT equities, to enhance returns while foregoing some upside potential. These options had a small negative impact on performance and expired prior to the close of this reporting period.
Nuveen Investments
8
IMPACT OF THE FUND'S LEVERAGE STRATEGY ON PERFORMANCE
One important factor impacting the returns of the Fund relative to its benchmarks was the Fund's use of leverage through the use of bank borrowings. The Fund uses leverage because our research has shown that, over time, leveraging provides opportunities for additional income and total return for shareholders. However, use of leverage also can expose shareholders to additional volatility. For example, as the prices of securities held by the Fund decline, the negative impact of these valuation changes on common share NAV and common shareholder total return is magnified by the use of leverage. Conversely, leverage may enhance common share returns during periods when the prices of securities held by the Fund generally are rising. The Fund's use of leverage had a positive impact on performance during this reporting period.
The Fund also continued to use swap contracts to partially fix the interest cost of leverage, which as mentioned previously, the Fund uses through the use of bank borrowings. The swap contracts impact on performance was positive during the period.
THE FUND'S REGULATORY LEVERAGE
Bank Borrowings
As discussed previously, the Fund employs regulatory leverage through the use of bank borrowings. As of December 31, 2013, the Fund had outstanding bank borrowings of $87,500,000.
Refer to Notes to Financial Statements, Note 8 – Borrowing Arrangements for further details.
As of December 31, 2013, the Fund's percentages of leverage are as shown in the accompanying table.
| | | JRI | |
Effective Leverage* | | | 32.20 | % | |
Regulatory Leverage* | | | 32.20 | % | |
* Effective leverage is the Fund's effective economic leverage, and includes both regulatory leverage and the leverage effects of certain derivative and other investments in the Fund's portfolio that increase the Fund's investment exposure. Regulatory leverage consists of preferred shares issued or borrowings of the Fund. Both of these are part of the Fund's capital structure. Regulatory leverage is subject to asset coverage limits set forth in the Investment Company Act of 1940.
Nuveen Investments
9
DISTRIBUTION INFORMATION
The following information regarding the Fund's distributions is current as of December 31, 2013. The Fund's distribution levels may vary over time based on the Fund's investment activities and portfolio investment value changes.
The Fund has a managed distribution program. The goal of this program is to provide shareholders with relatively consistent and predictable cash flow by systematically converting the Fund's cash flows from investment strategies including investments in common equities, corporate bonds, preferred securities and shares of REITs, into regular distributions. Cash flows from REITs received by the Fund are generally comprised of ordinary income, long-term capital gains and a return of REIT capital. As a result, regular distributions throughout the year are likely to include a portion of expected long-term gains (both realized and unrealized), along with net investment income.
Important points to understand about the managed distribution program are:
• The Fund seeks to establish a distribution rate that roughly corresponds to the cash flows from its investment strategy. However, you should not draw any conclusions about the Fund's past or future investment performance from its current distribution rate.
• Actual returns will differ from cash flows (and therefore the Fund's distribution rate), at least over shorter time periods. Over a specific timeframe, the difference between actual returns and total distributions will be reflected in an increasing (returns exceed distributions) or a decreasing (distributions exceed returns) Fund net asset value.
• Each distribution is expected to be paid from some or all of the following sources:
• net investment income (regular interest and dividends),
• realized capital gains, and
• unrealized gains, or, in certain cases, a return of principal (non-taxable distributions).
• A non-taxable distribution is a payment of a portion of the Fund's capital. When the Fund's returns exceed distributions, it may represent portfolio gains generated, but not realized as a taxable capital gain. In periods when the Fund's returns fall short of distributions, the shortfall will represent a portion of your original principal, unless the shortfall is offset during other time periods over the life of your investment (previous or subsequent) when the Fund's total return exceeds distributions.
• Because distribution source estimates are updated during the year based on the Fund's performance and forecast for its current fiscal year (which is the calendar year for the Fund), estimates on the nature of your distributions provided at the time the distributions are paid may differ from both the tax information reported to you in your Fund's IRS Form 1099 statement provided at year end, as well as the ultimate economic sources of distributions over the life of your investment.
Nuveen Investments
10
The following table provides information regarding the Fund's distributions and total return performance for the year ended December 31, 2013. This information is intended to help you better understand whether the Fund's returns for the specified time period were sufficient to meet its distributions.
As of 12/31/13 | | JRI | |
Inception date | | | 4/25/12 | | |
Fiscal year (calendar year) ended December 31, 2013: | |
Per share distribution: | |
From net investment income | | $ | 1.65 | | |
From long-term capital gains | | | 0.30 | | |
From short-term capital gains | | | 1.45 | | |
Return of capital | | | 0.00 | | |
Total per share distribution | | $ | 3.40 | | |
Distribution rate on NAV | | | 18.05 | % | |
Current distribution rate* | | | 9.64 | % | |
Average annual total returns: | |
| 1-Year on NAV | | | 9.35 | % | |
Since inception on NAV | | | 13.32 | % | |
* Current distribution rate is based on the Fund's current annualized monthly distribution divided by the Fund's current market price. The Fund's monthly distributions to its shareholders may be comprised of ordinary income, net realized capital gains and, if at the end of the fiscal year the Fund's cumulative net ordinary income and net realized gains are less than the amount of the Fund's distributions, a return of capital for tax purposes.
During the current reporting period, the Fund switched from a quarterly distribution to a monthly distribution to shareholders.
SHARE REPURCHASES
During November 2013, the Nuveen Funds' Board of Directors/Trustees reauthorized the Fund's open-market share repurchase program, allowing the Fund to repurchase an aggregate of up to approximately 10% of its outstanding shares.
Since the inception of the Fund's repurchase program, the Fund has not repurchased any of its outstanding shares.
| | JRI | |
Common Shares Cumulatively Repurchased and Retired | | | — | | |
Common Shares Authorized for Repurchase | | | 980,000 | | |
SHARE OTHER INFORMATION
As of December 31, 2013, and during the twelve-month reporting period, the Fund's share price was trading at a premium/(discount) to its NAV as shown in the accompanying table.
| | | JRI | |
Share NAV | | $ | 18.84 | | |
Share Price | | $ | 16.75 | | |
Premium/(Discount) to NAV | | | (11.09 | )% | |
12-Month Average Premium/(Discount) to NAV | | | (9.31 | )% | |
Nuveen Investments
11
Fund shares are not guaranteed or endorsed by any bank or other insured depository institution, and are not federally insured by the Federal Deposit Insurance Corporation. Shares of closed-end funds are subject to investment risks, including the possible loss of principal invested. Past performance is no guarantee of future results. Fund common shares are subject to a variety of risks, including:
Investment, Market and Price Risk. An investment in common shares is subject to investment risk, including the possible loss of the entire principal amount that you invest. Your investment in common shares represents an indirect investment in the corporate securities owned by the Fund, which generally trade in the over-the-counter markets. Shares of closed-end investment companies like the Fund frequently trade at a discount to their NAV. Your common shares at any point in time may be worth less than your original investment, even after taking into account the reinvestment of Fund dividends and distributions.
Leverage Risk. The Fund's use of leverage creates the possibility of higher volatility for the Fund's per share NAV, market price, and distributions. Leverage risk can be introduced through regulatory leverage (issuing preferred shares or debt borrowings at the Fund level) or through certain derivative investments held in the Fund's portfolio. Leverage typically magnifies the total return of the Fund's portfolio, whether that return is positive or negative. The use of leverage creates an opportunity for increased common share net income, but there is no assurance that the Fund's leveraging strategy will be successful.
Tax Risk. The tax treatment of Fund distributions may be affected by new IRS interpretations of the Internal Revenue Code and future changes in tax laws and regulations. This is particularly true for funds employing a managed distribution program.
Infrastructure and Real Estate Concentration Risk. The Fund's investments will be concentrated in issuers of infrastructure and real estate securities. Because the Fund will be concentrated in such securities, it may be subject to more risks than if it were broadly diversified across the economy. General changes in market sentiment towards infrastructure and real estate companies may adversely affect the Fund, and the performance of infrastructure and real estate issuers may lag behind the broader market as a whole. Also, the Fund's concentration in infrastructure and real estate may subject the Fund to a variety of risks associated with such companies.
Common Stock Risk. Common stock returns often have experienced significant volatility.
Derivatives Strategy Risk. Derivative securities, such as calls, puts, warrants, swaps and forwards, carry risks different from, and possibly greater than, the risks associated with the underlying investments.
Dividend Income Risk. There is no guarantee that the issuers of common stocks in which the Fund invests will declare dividends in the future or that, if declared, they will remain at current levels or increase over time.
Issuer Credit Risk. This is the risk that a security in the Fund's portfolio will fail to make dividend or interest payments when due.
Non-U.S. Securities Risk. Investments in non-U.S securities involve special risks not typically associated with domestic investments including currency risk and adverse political, social and economic development. These risks often are magnified in emerging markets.
Nuveen Investments
12
Interest Rate Risk. Fixed-income securities such as bonds, preferred, convertible and other debt securities will decline in value if market interest rates rise.
Preferred Stock Risk. Preferred stocks are subordinated to bonds and other debt instruments in a company's capital structure, and therefore are subject to greater credit risk.
Convertible Securities Risk. Convertible securities generally offer lower interest or dividend yields than non-convertible fixed-income securities of similar credit quality.
Call Option Risks. The value of call options sold (written) by the Fund will fluctuate. The Fund may not participate in any appreciation of its equity portfolio as fully as it would if the Fund did not sell call options. In addition, the Fund will continue to bear the risk of declines in the value of the equity portfolio.
Currency Risk. Changes in exchange rates will affect the value of the Fund's investments.
Reinvestment Risk. If market interest rates decline, income earned from the Fund's portfolio may be reinvested at rates below that of the original bond that generated the income.
Unrated Investment Risk. In determining whether an unrated security is an appropriate investment for the Fund, the portfolio manager will consider information from industry sources, as well as its own quantitative and qualitative analysis, in making such a determination. However such a determination by the portfolio manager is not the equivalent of a rating by a rating agency.
Nuveen Investments
13
Nuveen Real Asset Income and Growth Fund
Performance Overview and Holding Summaries as of December 31, 2013
Average Annual Total Returns as of December 31, 2013
| | Average Annual | |
| | 1-Year | | Since
Inception1 | |
JRI at Share NAV | | | 9.35 | % | | | 13.32 | % | |
JRI at Share Price | | | 7.88 | % | | | 4.14 | % | |
Comparative Benchmark | | | 3.79 | % | | | 6.00 | % | |
MSCI World Index | | | 26.68 | % | | | 18.97 | % | |
Past performance is not predictive of future results. Current performance may be higher or lower than the data shown. Returns do not reflect the deduction of taxes that shareholders may have to pay on Fund distributions or upon the sale of Fund shares. Comparative index return information is provided for the Fund's shares at NAV only. Indexes are not available for direct investment.
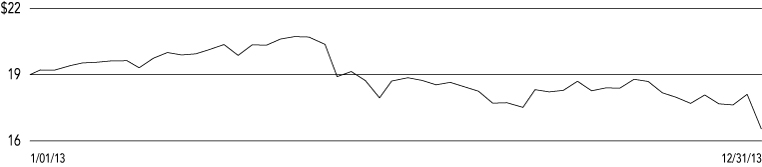
Share Price Performance — Weekly Closing Price
Nuveen Investments
14
Portfolio Allocation2,3
(as a % of total investments)
Common Stocks | | | 42.1 | % | |
$25 Par (or similar)
Retail Structures | | | 25.3 | % | |
Corporate Bonds | | | 19.4 | % | |
$1,000 Par (or similar)
Institutional Structures | | | 4.6 | % | |
Convertible Preferred Securities | | | 3.1 | % | |
Convertible Bonds | | | 2.3 | % | |
Short-Term Investments | | | 2.1 | % | |
Investment Companies | | | 1.1 | % | |
Common Stock Right | | | — | %4 | |
Portfolio Composition2,3
(as a % of total investments)
Real Estate Investment Trust | | | 43.6 | % | |
Electric Utilities | | | 11.8 | % | |
Oil, Gas & Consumable Fuels | | | 8.4 | % | |
Transportation Infrastructure | | | 7.3 | % | |
Multi-Utilities | | | 6.8 | % | |
Common Stock Right | | | — | %4 | |
Short-Term Investments | | | 2.1 | % | |
Other | | | 20.0 | % | |
Portfolio Credit Quality2,3,5,6
(as a % of total investments)
A | | | 1.8 | % | |
BBB | | | 17.8 | % | |
BB or Lower | | | 46.5 | % | |
N/R | | | 33.9 | % | |
Country Allocation2,3
(as a % of total investments)
United States7 | | | 68.5 | % | |
Australia | | | 6.2 | % | |
United Kingdom | | | 4.3 | % | |
Hong Kong | | | 3.6 | % | |
Italy | | | 2.6 | % | |
Other | | | 14.8 | % | |
Top Five Common Stock
Holdings2
(as a % of total common stocks)
National Grid PLC, Sponsored ADR | | | 7.0 | % | |
Atlantia SpA | | | 5.8 | % | |
Hutchison Port Holdings Trust | | | 4.2 | % | |
Transurban Group | | | 4.1 | % | |
Liberty Property Trust | | | 3.8 | % | |
Refer to the Glossary of Terms Used in this Report for further definition of the terms used within this page.
1 Since inception returns are from 4/25/12.
2 Holdings are subject to change.
3 Excluding investments in derivatives.
4 Rounds to less than 0.1%.
5 Excluding Common Stocks, Common Stock Right, Investment Companies and Short-Term Investments.
6 Ratings shown are the highest rating given by one of the following national rating agencies: Standard & Poor's, Moody's Investors Service, Inc. or Fitch, Inc. Credit ratings are subject to change. AAA, AA, A and BBB are investment grade ratings; BB, B, CCC, CC, C and D are below investment grade ratings. Certain bonds backed by U.S. Government or agency securities are regarded as having an implied rating equal to the rating of such securities. Holdings designated N/R are not rated by these national rating agencies.
7 Includes short-term investments.
Nuveen Investments
15
Report of
Independent Registered Public Accounting Firm
The Board of Trustees and Shareholders
Nuveen Real Asset Income and Growth Fund
We have audited the accompanying statement of assets and liabilities, including the portfolio of investments, of Nuveen Real Asset Income and Growth Fund (the "Fund") as of December 31, 2013, and the related statements of operations and cash flows for the year then ended, and the statements of changes in net assets and financial highlights for each of the periods indicated therein. These financial statements and financial highlights are the responsibility of the Fund's management. Our responsibility is to express an opinion on these financial statements and financial highlights based on our audits.
We conducted our audits in accordance with the standards of the Public Company Accounting Oversight Board (United States). Those standards require that we plan and perform the audit to obtain reasonable assurance about whether the financial statements and financial highlights are free of material misstatement. We were not engaged to perform an audit of the Fund's internal control over financial reporting. Our audits included consideration of internal control over financial reporting as a basis for designing audit procedures that are appropriate in the circumstances, but not for the purpose of expressing an opinion on the effectiveness of the Fund's internal control over financial reporting. Accordingly, we express no such opinion. An audit also includes examining, on a test basis, evidence supporting the amounts and disclosures in the financial statements and financial highlights, assessing the accounting principles used and significant estimates made by management, and evaluating the overall financial statement presentation. Our procedures included confirmation of securities owned as of December 31, 2013, by correspondence with the custodian, counterparties, and brokers or by other appropriate auditing procedures where replies from brokers were not received. We believe that our audits provide a reasonable basis for our opinion.
In our opinion, the financial statements and financial highlights referred to above present fairly, in all material respects, the financial position of Nuveen Real Asset Income and Growth Fund at December 31, 2013, and the results of its operations and its cash flows for the year then ended and the changes in its net assets and the financial highlights for each of the periods indicated therein, in conformity with U.S. generally accepted accounting principles.

Chicago, Illinois
February 27, 2014
Nuveen Investments
16
Nuveen Real Asset Income and Growth Fund
Portfolio of Investments December 31, 2013
Shares | | Description (1) | | Value | |
| | | LONG-TERM INVESTMENTS – 141.0% (97.9% of Total Investments) | |
| | | COMMON STOCKS – 60.6% (42.1% OF TOTAL INVESTMENTS) | |
| | | Air Freight & Logistics – 1.6% | |
| | 64,011 | | | BPost SA | | $ | 1,251,331 | | |
| | 19,190 | | | Oesterreichische Post AG | | | 918,181 | | |
| | 834,191 | | | Singapore Post Limited | | | 875,869 | | |
| | | Total Air Freight & Logistics | | | 3,045,381 | | |
| | | Commercial Services & Supplies – 0.9% | |
| | 1,980,359 | | | K-Green Trust | | | 1,639,903 | | |
| | | Electric Utilities – 5.0% | |
| | 125,281 | | | Alupar Investimento SA, (2) | | | 862,908 | | |
| | 16,057 | | | Duke Energy Corporation | | | 1,108,094 | | |
| | 93,482 | | | EDP Energias do Brasil S.A | | | 449,728 | | |
| | 185,442 | | | Energa SA, (2) | | | 977,836 | | |
| | 30,572 | | | Hafslund ASA, Class B Shares | | | 234,382 | | |
| | 3,023 | | | NRG Yield Inc., Class A Shares | | | 120,950 | | |
| | 95,078 | | | Pepco Holdings, Inc. | | | 1,818,842 | | |
| | 41,745 | | | PPL Corporation | | | 1,256,107 | | |
| | 65,908 | | | Scottish and Southern Energy PLC | | | 1,495,223 | | |
| | 437,615 | | | Spark Infrastructure Group | | | 634,963 | | |
| | 46,293 | | | Terna-Rete Elettrica Nazionale SpA | | | 231,305 | | |
| | 12,294 | | | Transmissora Alianca de Energia Eletrica SA | | | 94,840 | | |
| | | Total Electric Utilities | | | 9,285,178 | | |
| | | Gas Utilities – 0.0% | |
| | 12,441 | | | Snam Rete Gas S.p.A | | | 69,590 | | |
| | | Independent Power Producers & Energy Traders – 1.6% | |
| | 1,509 | | | Pattern Energy Group Inc. | | | 45,738 | | |
| | 282,425 | | | TransAlta Renewables Inc. | | | 2,921,959 | | |
| | | Total Independent Power Producers & Energy Traders | | | 2,967,697 | | |
| | | Multi-Utilities – 8.5% | |
| | 29,235 | | | Centrica PLC | | | 168,327 | | |
| | 1,799,733 | | | Duet Group | | | 3,213,964 | | |
| | 109,331 | | | GDF Suez | | | 2,571,201 | | |
| | 6,031 | | | Hera SpA | | | 13,690 | | |
| | 119,836 | | | National Grid PLC, Sponsored ADR | | | 7,827,688 | | |
| | 872,850 | | | Vector Limited | | | 1,844,828 | | |
| | | Total Multi-Utilities | | | 15,639,698 | | |
| | | Oil, Gas & Consumable Fuels – 3.4% | |
| | 5,385 | | | Access Midstream Partners LP | | | 304,683 | | |
| | 921 | | | BlueKnight Energy Partners LP | | | 7,838 | | |
| | 36,720 | | | Boardwalk Pipeline Partners, LP | | | 937,094 | | |
| | 8,991 | | | DCP Midstream Partners LP | | | 452,697 | | |
| | 19,784 | | | MarkWest Energy Partners LP | | | 1,308,316 | | |
| | 41,727 | | | Plains All American Pipeline LP | | | 2,160,207 | | |
| | 1,885 | | | QEP Midstream Partners LP | | | 43,770 | | |
| | 26,096 | | | Rose Rock Midstream Limited Partnership | | | 1,009,915 | | |
| | | Total Oil, Gas & Consumable Fuels | | | 6,224,520 | | |
Nuveen Investments
17
JRI Nuveen Real Asset Income and Growth Fund (continued)
Portfolio of Investments December 31, 2013
Shares | | Description (1) | | Value | |
| | | Real Estate Investment Trust – 27.6% | |
| | 61,258 | | | AmREIT Inc., Class B Shares | | $ | 1,029,134 | | |
| | 91,070 | | | Apollo Commercial Real Estate Finance, Inc. | | | 1,479,888 | | |
| | 12,596 | | | Armada Hoffler Properties Inc. | | | 116,891 | | |
| | 70,672 | | | Artis Real Estate Investment Trust | | | 988,643 | | |
| | 567,627 | | | Ascendas Real Estate Investment Trust | | | 989,563 | | |
| | 57,801 | | | Aviv REIT Inc. | | | 1,369,884 | | |
| | 120,758 | | | Blackstone Mortgage Trust Inc, Class A | | | 3,276,165 | | |
| | 165,015 | | | Campus Crest Communities Inc. | | | 1,552,791 | | |
| | 286,036 | | | CapitaMall Trust | | | 431,791 | | |
| | 7,722 | | | CBL & Associates Properties Inc. | | | 138,687 | | |
| | 150,225 | | | Colony Financial Inc. | | | 3,048,065 | | |
| | 108,139 | | | Corrections Corporation of America | | | 3,468,018 | | |
| | 9,050 | | | Digital Realty Trust Inc. | | | 444,536 | | |
| | 11,048 | | | Entertainment Properties Trust | | | 543,120 | | |
| | 67,540 | | | Franklin Street Properties Corporation | | | 807,103 | | |
| | 20,279 | | | Geo Group Inc. | | | 653,389 | | |
| | 37,198 | | | Health Care REIT, Inc. | | | 1,992,697 | | |
| | 29,511 | | | Healthcare Realty Trust, Inc. | | | 628,879 | | |
| | 158,715 | | | Healthcare Trust of America Inc., Class A | | | 1,561,756 | | |
| | 47,722 | | | Kite Realty Group Trust | | | 1,204,981 | | |
| | 125,838 | | | Liberty Property Trust | | | 4,262,133 | | |
| | 9,898 | | | LTC Properties Inc. | | | 350,290 | | |
| | 48,065 | | | Mack-Cali Realty Corporation | | | 1,032,436 | | |
| | 692,099 | | | Mapletree Logistics Trust | | | 578,600 | | |
| | 31,062 | | | Monmouth Real Estate Investment Corporation | | | 282,354 | | |
| | 15,378 | | | National Health Investors Inc. | | | 862,706 | | |
| | 69,841 | | | National Retail Properties, Inc. | | | 2,118,278 | | |
| | 206,247 | | | Newcastle Investment Corporation | | | 1,183,858 | | |
| | 661,560 | | | Parkway Life Real Estate Investment Trust | | | 1,231,955 | | |
| | 76,084 | | | Pebblebrook Hotel Trust | | | 1,905,143 | | |
| | 25,257 | | | Penn Real Estate Investment Trust | | | 599,349 | | |
| | 33,550 | | | Physicians Realty Trust | | | 427,427 | | |
| | 26,892 | | | Public Storage, Inc. | | | 580,867 | | |
| | 39,903 | | | Select Income REIT | | | 1,067,006 | | |
| | 4,621 | | | STAG Industrial Inc. | | | 94,222 | | |
| | 73,273 | | | Starwood Property Trust Inc. | | | 2,029,662 | | |
| | 201,980 | | | Summit Hotel Properties Inc. | | | 1,817,820 | | |
| | 32,074 | | | Trade Street Residential Inc. | | | 203,028 | | |
| | 10,225 | | | Universal Health Realty Income Trust | | | 409,614 | | |
| | 83,303 | | | Urstadt Biddle Properties Inc. | | | 1,536,940 | | |
| | 777,942 | | | Westfield Retail Trust | | | 2,063,035 | | |
| | 6,880 | | | WP Carey Inc. | | | 422,088 | | |
| | | Total Real Estate Investment Trust | | | 50,784,792 | | |
| | | Real Estate Management & Development – 1.5% | |
| | 47,013 | | | Brookfield Property Partners | | | 937,439 | | |
| | 3,820,746 | | | Langham Hospitality Investments Limited, (2) | | | 1,832,941 | | |
| | | Total Real Estate Management & Development | | | 2,770,380 | | |
| | | Transportation Infrastructure – 10.1% | |
| | 12,410 | | | Abertis Infraestructuras S.A | | | 275,720 | | |
| | 291,259 | | | Atlantia SpA | | | 6,535,167 | | |
| | 6,926,459 | | | Hutchison Port Holdings Trust | | | 4,675,359 | | |
| | 1,889 | | | Kobenhavns Lufthavne | | | 970,147 | | |
| | 112 | | | Societa Iniziative Autostradali e Servizi SpA | | | 1,112 | | |
| | 453,461 | | | Sydney Airport | | | 1,538,603 | | |
| | 746,574 | | | Transurban Group | | | 4,559,654 | | |
| | | Total Transportation Infrastructure | | | 18,555,762 | | |
Nuveen Investments
18
Shares | | Description (1) | | Value | |
| | | Water Utilities – 0.4% | |
| | 395,780 | | | Inversiones Aguas Metropolitanas SA | | $ | 670,367 | | |
| | | Total Common Stocks (cost $110,520,266) | | | 111,653,268 | | |
Shares | | Description (1) | | Coupon | | | | Ratings (4) | | Value | |
| | | CONVERTIBLE PREFERRED SECURITIES – 4.4% (3.1% OF TOTAL INVESTMENTS) | |
| | | Electric Utilities – 1.4% | |
| | 32,210 | | | NextEra Energy Inc. | | | 5.799 | % | | | | | | N/R | | $ | 1,615,976 | | |
| | 19,586 | | | PPL Corporation | | | 8.750 | % | | | | | | N/R | | | 1,035,708 | | |
| | | Total Electric Utilities | | | 2,651,684 | | |
| | | Real Estate Investment Trust – 2.0% | |
| | 66,462 | | | Alexandria Real Estate Equities Inc., (3) | | | 7.000 | % | | | | | | N/R | | | 1,653,242 | | |
| | 72,491 | | | American Homes 4 Rent, (2) | | | 5.000 | % | | | | | | N/R | | | 1,765,156 | | |
| | 6,380 | | | Ramco-Gershenson Properties Trust | | | 7.250 | % | | | | | | N/R | | | 371,507 | | |
| | | Total Real Estate Investment Trust | | | 3,789,905 | | |
| | | Wireless Telecommunication Services – 1.0% | |
| | 17,590 | | | Crown Castle International Corporation | | | 4.500 | % | | | | | | N/R | | | 1,759,704 | | |
| | | Total Convertible Preferred Securities (cost $8,177,665) | | | 8,201,293 | | |
Shares | | Description (1) | | Coupon | | | | Ratings (4) | | Value | |
| | | $25 PAR (OR SIMILAR) RETAIL STRUCTURES – 36.6% (25.3% OF TOTAL INVESTMENTS) | |
| | | Electric Utilities – 6.0% | |
| | 21,885 | | | Alabama Power Company, (5) | | | 6.450 | % | | | | | | A– | | $ | 563,539 | | |
| | 7,270 | | | APT Pipelines Limited, (2), (5) | | | 7.057 | % | | | | | | N/R | | | 686,788 | | |
| | 33,259 | | | Duke Energy Capital Trust II | | | 5.125 | % | | | | | | Baa2 | | | 686,798 | | |
| | 113,820 | | | Integrys Energy Group Inc. | | | 6.000 | % | | | | | | BBB | | | 2,725,989 | | |
| | 25,919 | | | NextEra Energy Inc. | | | 5.700 | % | | | | | | BBB | | | 541,707 | | |
| | 29,666 | | | NextEra Energy Inc. | | | 5.125 | % | | | | | | BBB | | | 548,821 | | |
| | 90,264 | | | NextEra Energy Inc. | | | 5.000 | % | | | | | | BBB | | | 1,648,221 | | |
| | 106,551 | | | PPL Capital Funding, Inc. | | | 5.900 | % | | | | | | BB+ | | | 2,213,064 | | |
| | 18,610 | | | SCE Trust I | | | 5.625 | % | | | | | | BBB+ | | | 374,061 | | |
| | 53,520 | | | SCE Trust II | | | 5.100 | % | | | | | | BBB+ | | | 986,909 | | |
| | | Total Electric Utilities | | | 10,975,897 | | |
| | | Energy Equipment & Services – 0.0% | |
| | 1,564 | | | NextEra Energy Inc. | | | 5.625 | % | | | | | | BBB | | | 31,530 | | |
| | | Multi-Utilities – 0.6% | |
| | 22,587 | | | DTE Energy Company | | | 6.500 | % | | | | | | Baa2 | | | 546,154 | | |
| | 29,291 | | | DTE Energy Company | | | 5.250 | % | | | | | | Baa2 | | | 564,438 | | |
| | | Total Multi-Utilities | | | 1,110,592 | | |
| | | Real Estate Investment Trust – 30.0% | |
| | 50,704 | | | Alexandria Real Estate Equities Inc., Series B | | | 6.450 | % | | | | | | Baa3 | | | 1,074,925 | | |
| | 73,583 | | | American Homes 4 Rent | | | 5.000 | % | | | | | | N/R | | | 1,838,839 | | |
| | 15,737 | | | Apartment Investment & Management Company | | | 7.000 | % | | | | | | BB | | | 393,425 | | |
| | 23,988 | | | Apollo Commercial Real Estate Finance | | | 8.625 | % | | | | | | N/R | | | 596,102 | | |
| | 29,632 | | | Campus Crest Communities | | | 8.000 | % | | | | | | Ba1 | | | 731,910 | | |
| | 94,302 | | | Cedar Shopping Centers Inc., Series A | | | 7.250 | % | | | | | | N/R | | | 2,168,946 | | |
| | 33,826 | | | Colony Financial Inc. | | | 8.500 | % | | | | | | N/R | | | 845,650 | | |
| | 3,161 | | | Cousins Property Inc. | | | 7.500 | % | | | | | | N/R | | | 79,499 | | |
| | 138,698 | | | DDR Corporation | | | 6.500 | % | | | | | | Baa3 | | | 3,023,616 | | |
| | 99,231 | | | DDR Corporation | | | 6.250 | % | | | | | | Baa3 | | | 2,071,943 | | |
| | 30,210 | | | Digital Realty Trust Inc. | | | 5.875 | % | | | | | | Baa3 | | | 548,312 | | |
| | 103,866 | | | Equity Lifestyle Properties Inc. | | | 6.750 | % | | | | | | N/R | | | 2,373,338 | | |
Nuveen Investments
19
JRI Nuveen Real Asset Income and Growth Fund (continued)
Portfolio of Investments December 31, 2013
Shares | | Description (1) | | Coupon | | | | Ratings (4) | | Value | |
| | | Real Estate Investment Trust (continued) | |
| | 8,972 | | | Essex Property Trust | | | 7.125 | % | | | | | | BBB– | | $ | 229,952 | | |
| | 141,917 | | | General Growth Properties | | | 6.375 | % | | | | | | B | | | 2,859,628 | | |
| | 103,570 | | | Glimcher Realty Trust | | | 7.500 | % | | | | | | B1 | | | 2,391,431 | | |
| | 100,740 | | | Glimcher Realty Trust | | | 6.875 | % | | | | | | B1 | | | 2,175,984 | | |
| | 14,465 | | | Hersha Hospitality Trust | | | 8.000 | % | | | | | | N/R | | | 361,625 | | |
| | 87,043 | | | Hersha Hospitality Trust | | | 6.875 | % | | | | | | N/R | | | 2,023,750 | | |
| | 9,032 | | | Investors Real Estate Trust | | | 7.950 | % | | | | | | N/R | | | 232,935 | | |
| | 64,599 | | | Kilroy Realty Corporation | | | 6.875 | % | | | | | | Ba1 | | | 1,414,072 | | |
| | 48,803 | | | Kimco Realty Corporation, | | | 5.625 | % | | | | | | Baa2 | | | 958,979 | | |
| | 45,898 | | | Kimco Realty Corporation, | | | 5.500 | % | | | | | | Baa2 | | | 892,716 | | |
| | 37,006 | | | LaSalle Hotel Properties | | | 7.250 | % | | | | | | N/R | | | 875,932 | | |
| | 8,590 | | | LaSalle Hotel Properties | | | 6.375 | % | | | | | | N/R | | | 173,346 | | |
| | 31,013 | | | Monmouth Real Estate Investment Corp | | | 7.875 | % | | | | | | N/R | | | 767,882 | | |
| | 321 | | | National Retail Properties Inc. | | | 6.625 | % | | | | | | Baa2 | | | 7,110 | | |
| | 89,501 | | | National Retail Properties Inc. | | | 5.700 | % | | | | | | Baa2 | | | 1,700,519 | | |
| | 5,689 | | | Pebblebrook Hotel Trust | | | 7.875 | % | | | | | | N/R | | | 142,054 | | |
| | 96,023 | | | Pebblebrook Hotel Trust | | | 6.500 | % | | | | | | N/R | | | 1,955,028 | | |
| | 15,246 | | | Post Properties, Inc., Series A | | | 8.500 | % | | | | | | Baa3 | | | 888,080 | | |
| | 29,204 | | | PS Business Parks, Inc. | | | 5.750 | % | | | | | | Baa2 | | | 565,097 | | |
| | 1,921 | | | Regency Centers Corporation | | | 6.625 | % | | | | | | Baa3 | | | 41,686 | | |
| | 4,963 | | | Regency Centers Corporation | | | 6.000 | % | | | | | | Baa3 | | | 98,019 | | |
| | 114,068 | | | Retail Properties of America | | | 7.000 | % | | | | | | N/R | | | 2,406,835 | | |
| | 107,720 | | | Saul Centers, Inc. | | | 6.875 | % | | | | | | N/R | | | 2,389,230 | | |
| | 82,895 | | | SL Green Realty Corporation | | | 6.500 | % | | | | | | Ba2 | | | 1,766,492 | | |
| | 63,161 | | | STAG Industrial Inc. | | | 6.625 | % | | | | | | BB | | | 1,315,644 | | |
| | 105,600 | | | Summit Hotel Properties Inc. | | | 7.875 | % | | | | | | N/R | | | 2,517,504 | | |
| | 208,805 | | | Summit Hotel Properties Inc. | | | 7.125 | % | | | | | | N/R | | | 4,518,540 | | |
| | 27,063 | | | Summit Hotel Properties Inc. | | | 9.250 | % | | | | | | N/R | | | 730,430 | | |
| | 34,461 | | | Taubman Centers Incorporated, Series J | | | 6.500 | % | | | | | | N/R | | | 717,478 | | |
| | 78,578 | | | Taubman Centers Incorporated, Series K | | | 6.250 | % | | | | | | N/R | | | 1,559,773 | | |
| | 1,023 | | | Terreno Realty Corporation | | | 7.750 | % | | | | | | N/R | | | 25,064 | | |
| | 38,840 | | | Urstadt Biddle Properties | | | 7.125 | % | | | | | | N/R | | | 894,486 | | |
| | | Total Real Estate Investment Trust | | | 55,343,806 | | |
| | | Total $25 Par (or similar) Retail Structures (cost $74,635,143) | | | 67,461,825 | | |
Principal
Amount (000) | | Description (1) | | Coupon | | Maturity | | Ratings (4) | | Value | |
| | | CORPORATE BONDS – 28.0% (19.4% OF TOTAL INVESTMENTS) | |
| | | Building Products – 0.9% | |
$ | 1,525 | | | Associated Asphalt Partners Limited Liability Corporation, 144A | | | 8.500 | % | | 2/15/18 | | B | | $ | 1,570,750 | | |
| | | Commercial Services & Supplies – 2.1% | |
| | 1,720 | | | ADS Waste Holdings Inc. | | | 8.250 | % | | 10/01/20 | | CCC+ | | | 1,866,200 | | |
| | 1,925 | | | Casella Waste Systems Inc. | | | 7.750 | % | | 2/15/19 | | Caa1 | | | 1,973,125 | | |
| | 3,645 | | | Total Commercial Services & Supplies | | | 3,839,325 | | |
| | | Diversified Financial Services – 0.6% | |
| | 1,150 | | | Jefferies LoanCore LLC Finance Corporation, 144A | | | 6.875 | % | | 6/01/20 | | B | | | 1,138,500 | | |
| | — | (6) | | SinOceanic II ASA, 144A | | | 10.000 | % | | 2/17/15 | | N/R | | | 1 | | |
| | 1,150 | | | Total Diversified Financial Services | | | 1,138,501 | | |
| | | Diversified Telecommunication Services – 1.0% | |
| | 1,800 | | | IntelSat Limited | | | 8.125 | % | | 6/01/23 | | B– | | | 1,930,500 | | |
| | | Electric Utilities – 1.6% | |
| | 1,400 | | | Intergen NV, 144A | | | 7.000 | % | | 6/30/23 | | B+ | | | 1,449,000 | | |
| | 1,700 | | | Star Energy Geothermal Wayang Windu Limited, 144A | | | 6.125 | % | | 3/27/20 | | B+ | | | 1,576,750 | | |
| | 3,100 | | | Total Electric Utilities | | | 3,025,750 | | |
Nuveen Investments
20
Principal
Amount (000) | | Description (1) | | Coupon | | Maturity | | Ratings (4) | | Value | |
| | | Energy Equipment & Services – 2.1% | |
$ | 2,565 | | | Origin Energy Finance Limited | | | 7.875 | % | | 6/16/71 | | BB+ | | $ | 3,819,784 | | |
| | | Gas Utilities – 0.8% | |
| | 1,500 | | | LBC Tank Terminals Holdings Netherlands BV, 144A | | | 6.875 | % | | 5/15/23 | | B | | | 1,550,625 | | |
| | | Health Care Equipment & Supplies – 0.8% | |
| | 1,350 | | | Community Health Systems, Inc. | | | 7.125 | % | | 7/15/20 | | B | | | 1,400,625 | | |
| | | Health Care Providers & Services – 4.3% | |
| | 1,200 | | | IASIS Healthcare Capital Corporation | | | 8.375 | % | | 5/15/19 | | CCC+ | | | 1,272,000 | | |
| | 1,500 | | | Lifepoint Hospitals Inc., 144A | | | 5.500 | % | | 12/01/21 | | Ba1 | | | 1,505,625 | | |
| | 1,975 | | | National Mentor Holdings, 144A | | | 12.500 | % | | 2/15/18 | | CCC+ | | | 2,113,250 | | |
| | 1,625 | | | Select Medical Corporation | | | 6.375 | % | | 6/01/21 | | B– | | | 1,588,438 | | |
| | 1,500 | | | Tenet Healthcare Corporation | | | 6.750 | % | | 2/01/20 | | B3 | | | 1,537,500 | | |
| | 7,800 | | | Total Health Care Providers & Services | | | 8,016,813 | | |
| | | Independent Power Producers & Energy Traders – 1.1% | |
| | 1,850 | | | Mirant Americas Generation LLC | | | 8.500 | % | | 10/01/21 | | BB– | | | 1,947,125 | | |
| | | Industrial Conglomerates – 0.4% | |
| | 865 | | | OAS Financial Limited, 144A | | | 8.875 | % | | 7/25/63 | | BB– | | | 765,525 | | |
| | | Internet Software & Services – 0.5% | |
| | 950 | | | Equinix Inc. | | | 5.375 | % | | 4/01/23 | | BB | | | 928,625 | | |
| | | Metals & Mining – 0.6% | |
| | 1,600 | | | WPE International Cooperatief U.A, 144A | | | 10.375 | % | | 9/30/20 | | B+ | | | 1,036,000 | | |
| | | Multi-Utilities – 0.7% | |
| | 700 | | | RWE AG | | | 7.000 | % | | 3/20/49 | | BBB– | | | 1,226,397 | | |
| | | Oil, Gas & Consumable Fuels – 7.5% | |
| | 1,525 | | | Atlas Pipeline LP Finance, 144A | | | 5.875 | % | | 8/01/23 | | B+ | | | 1,452,562 | | |
| | 1,750 | | | Calumet Specialty Products, 144A | | | 7.625 | % | | 1/15/22 | | B+ | | | 1,767,500 | | |
| | 1,000 | | | Crestwood Midstream Partners LP, 144A | | | 6.125 | % | | 3/01/22 | | BB | | | 1,025,000 | | |
| | 1,300 | | | Gibson Energy, 144A | | | 6.750 | % | | 7/15/21 | | BB | | | 1,374,750 | | |
| | 1,365 | | | Martin Mid-Stream Partners LP Finance | | | 7.250 | % | | 2/15/21 | | B– | | | 1,392,300 | | |
| | 1,463 | | | Niska Gas Storage US LLC | | | 8.875 | % | | 3/15/18 | | B | | | 1,521,520 | | |
| | 750 | | | NuStar Logistics LP | | | 6.750 | % | | 2/01/21 | | BB+ | | | 773,936 | | |
| | 1,660 | | | PBF Holding Company LLC | | | 8.250 | % | | 2/15/20 | | BB+ | | | 1,801,100 | | |
| | 1,150 | | | Summit Midstream Holdings LLC Finance, 144A | | | 7.500 | % | | 7/01/21 | | B | | | 1,201,750 | | |
| | 1,500 | | | Western Refining Inc. | | | 6.250 | % | | 4/01/21 | | B+ | | | 1,511,250 | | |
| | 13,463 | | | Total Oil, Gas & Consumable Fuels | | | 13,821,668 | | |
| | | Real Estate Investment Trust – 1.3% | |
| | 1,300 | | | Geo Group Inc., 144A | | | 5.875 | % | | 1/15/22 | | B+ | | | 1,290,250 | | |
| | 1,000 | | | MPT Operating Partnership Finance | | | 6.375 | % | | 2/15/22 | | Ba1 | | | 1,035,000 | | |
| | 2,300 | | | Total Real Estate Investment Trust | | | 2,325,250 | | |
| | | Road & Rail – 0.9% | |
| | 1,750 | | | Watco Companies LLC Finance, 144A | | | 6.375 | % | | 4/01/23 | | B3 | | | 1,732,500 | | |
| | | Wireless Telecommunication Services – 0.8% | |
| | 500 | | | Crown Castle International Corporation | | | 5.250 | % | | 1/15/23 | | BB– | | | 490,000 | | |
| | 900 | | | Goodman Networks Inc., 144A | | | 12.125 | % | | 7/01/18 | | B3 | | | 949,500 | | |
| | 1,400 | | | Total Wireless Telecommunication Services | | | 1,439,500 | | |
$ | 49,313 | | | Total Corporate Bonds (cost $50,745,195) | | | | | | | | | | | | | 51,515,263 | | |
Nuveen Investments
21
JRI Nuveen Real Asset Income and Growth Fund (continued)
Portfolio of Investments December 31, 2013
Principal
Amount (000) | | Description (1) | | Coupon | | Maturity | | Ratings (4) | | Value | |
| | | CONVERTIBLE BONDS – 3.2% (2.3% OF TOTAL INVESTMENTS) | |
| | | Oil, Gas & Consumable Fuels – 1.3% | |
$ | 2,695 | | | DCP Midstream LLC | | | 5.850 | % | | 5/21/43 | | Baa3 | | $ | 2,506,350 | | |
| | | Real Estate Investment Trust – 1.9% | |
| | 3,275 | | | Blackstone Mortgage Trust | | | 5.250 | % | | 12/01/18 | | N/R | | | 3,446,938 | | |
$ | 5,970 | | | Total Convertible Bonds (cost $5,970,000) | | | 5,953,288 | | |
Principal
Amount (000) | | Description (1) | | Coupon | | Maturity | | Ratings (4) | | Value | |
| | | $1,000 PAR (OR SIMILAR) INSTITUTIONAL STRUCTURES – 6.7% (4.6% OF TOTAL INVESTMENTS) | |
| | | Construction & Engineering – 1.7% | |
$ | 3,174 | | | PHBS Limited | | | 6.625 | % | | | N/A (7) | | | N/R | | $ | 3,102,584 | | |
| | | Diversified Financial Services – 1.6% | |
| | 2,850 | | | Royal Capital BV | | | 8.375 | % | | | N/A (7) | | | N/R | | | 2,950,899 | | |
| | | Electric Utilities – 3.0% | |
| | 2,015 | | | AES Gener SA, 144A | | | 8.375 | % | | 12/18/73 | | Ba2 | | | 2,100,638 | | |
| | 2,061 | | | Electricite de France, 144A | | | 5.250 | % | | | N/A (7) | | | A3 | | | 2,049,665 | | |
| | 900 | | | Tennet Holding BV | | | 6.655 | % | | | N/A (7) | | | BBB | | | 1,366,028 | | |
| | 4,976 | | | Total Electric Utilities | | | 5,516,331 | | |
| | | Transportation Infrastructure – 0.4% | |
| | 500 | | | Eurogate GmbH | | | 6.750 | % | | | N/A (7) | | | N/R | | | 698,167 | | |
$ | 11,500 | | | Total $1,000 Par (or similar) Institutional Structures (cost $11,652,010) | | | 12,267,981 | | |
Shares | | Description (1) | | | | | | | | Value | |
| | | COMMON STOCK RIGHT – 0.0% (0.0% OF TOTAL INVESTMENTS) | |
| | 32,074 | | | Trade Street Residential Inc., Stock Right, (2) | | | | | | | | | | | | | | $ | 9,622 | | |
| | | | | Total Common Stock Right (cost $37,014) | | | 9,622 | | |
Shares | | Description (1), (8) | | | | | | | | Value | |
| | | INVESTMENT COMPANIES – 1.5% (1.1% OF TOTAL INVESTMENTS) | |
| | | Gas Utilities – 0.6% | |
| | 2,849,108 | | | Cityspring Infrastructure Trust | | | | | | | | | | | | | | $ | 1,061,120 | | |
| | | Real Estate Management & Development – 0.9% | |
| | 1,024,252 | | | Starwood European Real Estate Finance Limited | | | | | | | | | | | | | | | 1,708,831 | | |
| | | | | Total Investment Companies (cost $2,528,295) | | | 2,769,951 | | |
| | | | | Total Long-Term Investments (cost $264,265,588) | | | 259,832,491 | | |
Principal
Amount (000) | | Description (1) | | Coupon | | Maturity | | | | Value | |
| | | SHORT-TERM INVESTMENTS – 3.1% (2.1% OF TOTAL INVESTMENTS) | |
$ | 5,635
| | | Repurchase Agreement with Fixed Income Clearing Corporation, dated 12/31/13,
repurchase price $5,634,727, collateralized by $5,890,000 U.S. Treasury Notes,
2.000%, due 11/30/20, value $5,750,113 | | | 0.000
| % | | 1/02/14
| |
| | $ | 5,634,727
| | |
| | | | | Total Short-Term Investments (cost $5,634,727) | | | 5,634,727 | | |
| | | | | Total Investments (cost $269,900,315) – 144.1% | | | 265,467,218 | | |
| | | | | Borrowings – (47.5)% (9), (10) | | | (87,500,000 | ) | |
| | | | | Other Assets Less Liabilities – 3.4% (11) | | | 6,281,586 | | |
| | | | | Net Assets – 100% | | $ | 184,248,804 | | |
Nuveen Investments
22
Investments in Derivatives as of December 31, 2013
Interest Rate Swaps outstanding:
Counterparty | | Notional
Amount | | Fund
Pay/Receive
Floating Rate | | Floating Rate Index | | Fixed Rate
(Annualized) | | Fixed Rate
Payment
Frequency | | Effective
Date (12) | | Termination
Date | | Unrealized
Appreciation
(Depreciation) (11) | |
JPMorgan | | $ | 29,250,000 | | | Receive | | 1-Month USD-LIBOR | | | 1.255 | % | | Monthly | | 12/01/14 | | 12/01/18 | | $ | 876,540 | | |
JPMorgan | | | 29,250,000 | | | Receive | | 1-Month USD-LIBOR | | | 1.673 | | | Monthly | | 12/01/14 | | 12/01/20 | | | 1,750,448 | | |
| | | $ | 58,500,000 | | | | | | | | | | | | | | | $ | 2,626,988 | | |
For Fund portfolio compliance purposes, the Fund's industry classifications refer to any one or more of the industry sub-classifications used by one or more widely recognized market indexes or ratings group indexes, and/or as defined by Fund management. This definition may not apply for purposes of this report which may combine industry sub-classifications into sectors for reporting ease.
(1) All percentages shown in the Portfolio of Investments are based on net assets.
(2) Non-income producing; issuer has not declared a dividend within the past twelve months.
(3) For fair value measurement disclosure purposes, Convertible Preferred Securities categorized as Level 2. See Notes to Financial Statements, Note 2 – Investment Valuation and Fair Value Measurements for more information.
(4) Ratings (not covered by the report of independent registered public accounting firm): Using the highest of Standard & Poor's Group ("Standard & Poor's"), Moody's Investors Service, Inc. ("Moody's") or Fitch, Inc. ("Fitch") rating. Ratings below BBB by Standard & Poor's, Baa by Moody's or BBB by Fitch are considered to be below investment grade. Holdings designated N/R are not rated by any of these national rating agencies.
(5) For fair value measurement disclosure purposes, $25 Par (or similar) Retail Structures categorized as Level 2. See Notes to Financial Statements, Note 2 – Investment Valuation and Fair Value Measurements for more information.
(6) Principal Amount (000) rounds to less than $1,000.
(7) Perpetual security. Maturity date is not applicable.
(8) A copy of the most recent financial statements for the investment companies in which the Fund invests can be obtained directly from the Securities and Exchange Commission on its website at http://www.sec.gov.
(9) Borrowings as a percentage of total investments is 33.0%.
(10) The Fund may pledge up to 100% of its eligible investments in the Portfolio of Investments as collateral for Borrowings. As of the end of the reporting period, investments with a value of $142,691,796 have been pledged as collateral for Borrowings.
(11) Other Assets Less Liabilities includes the Unrealized Appreciation (Depreciation) of derivative instruments as listed within Investments in Derivatives as of the end of the reporting period.
(12) Effective date represents the date on which both the Fund and Counterparty commence interest payment accruals on each contract.
N/A Not applicable.
ADR American Depositary Receipt.
REIT Real Estate Investment Trust.
144A Investment is exempt from registration under Rule 144A of the Securities Act of 1933, as amended. These investments may only be resold in transactions exempt from registration, which are normally those transactions with qualified institutional buyers.
USD-LIBOR United States Dollar – London Inter-Bank Offered Rate.
See accompanying notes to financial statements.
Nuveen Investments
23
Statement of
Assets and Liabilities December 31, 2013
Assets | |
Long-term investments, at value (cost $264,265,588) | | $ | 259,832,491 | | |
Short-term investments, at value (cost approximates value) | | | 5,634,727 | | |
Cash denominated in foreign currencies (cost $136,227) | | | 136,804 | | |
Unrealized appreciation on interest rate swaps | | | 2,626,988 | | |
Receivable for: | |
Dividends | | | 1,617,394 | | |
Interest | | | 1,300,898 | | |
Investments sold | | | 4,106,819 | | |
Reclaims | | | 157,848 | | |
Other assets | | | 5,429 | | |
Total assets | | | 275,419,398 | | |
Liabilities | |
Borrowings | | | 87,500,000 | | |
Cash overdraft | | | 108,050 | | |
Payable for investments purchased | | | 3,235,255 | | |
Accrued expenses: | |
Interest on borrowings | | | 2,219 | | |
Management fees | | | 232,189 | | |
Trustees fees | | | 5,753 | | |
Other | | | 87,128 | | |
Total liabilities | | | 91,170,594 | | |
Net assets | | $ | 184,248,804 | | |
Shares outstanding | | | 9,780,250 | | |
Net asset value per share outstanding | | $ | 18.84 | | |
Net assets consist of: | |
Shares, $.01 par value per share | | $ | 97,803 | | |
Paid-in surplus | | | 186,258,689 | | |
Undistributed (Over-distribution of) net investment income | | | 757,326 | | |
Accumulated net realized gain (loss) | | | (1,075,722 | ) | |
Net unrealized appreciation (depreciation) | | | (1,789,292 | ) | |
Net assets | | $ | 184,248,804 | | |
Authorized shares | | | Unlimited | | |
See accompanying notes to financial statements.
Nuveen Investments
24
Statement of
Operations Year ended December 31, 2013
Investment Income | |
Dividends (net of foreign tax withheld of $495,039) | | $ | 13,238,944 | | |
Interest | | | 5,667,411 | | |
Total investment income | | | 18,906,355 | | |
Expenses | |
Management fees | | | 2,800,134 | | |
Interest expense on borrowings | | | 807,862 | | |
Shareholder servicing agent fees and expenses | | | 155 | | |
Custodian fees and expenses | | | 170,055 | | |
Trustees fees and expenses | | | 11,053 | | |
Professional fees | | | 68,736 | | |
Shareholder reporting expenses | | | 65,496 | | |
Investor relations expenses | | | 26,883 | | |
Stock exchange listing fees | | | 9,574 | | |
Other expenses | | | 25,250 | | |
Total expenses | | | 3,985,198 | | |
Net investment income (loss) | | | 14,921,157 | | |
Realized and Unrealized Gain (Loss) | |
Net realized gain (loss) from: | |
Investments and foreign currency | | | 16,157,943 | | |
Options written | | | (277,860 | ) | |
Change in net unrealized appreciation (depreciation) of: | |
Investments and foreign currency | | | (14,616,789 | ) | |
Swaps | | | 2,389,756 | | |
Net realized and unrealized gain (loss) | | | 3,653,050 | | |
Net increase (decrease) in net assets from operations | | $ | 18,574,207 | | |
See accompanying notes to financial statements.
Nuveen Investments
25
Statement of
Changes in Net Assets
| | | Year
Ended
12/31/13 | | For the period from 4/25/12
(commencement
of operations)
through 12/31/12 | |
Operations | |
Net investment income (loss) | | $ | 14,921,157 | | | $ | 9,175,303 | | |
Net realized gain (loss) from: | |
Investments and foreign currency | | | 16,157,943 | | | | 4,283,513 | | |
Options written | | | (277,860 | ) | | | 126,557 | | |
Change in net unrealized appreciation (depreciation) of: | |
Investments and foreign currency | | | (14,616,789 | ) | | | 10,200,509 | | |
Swaps | | | 2,389,756 | | | | 237,232 | | |
Net increase (decrease) in net assets from operations | | | 18,574,207 | | | | 24,023,114 | | |
Distributions to Shareholders | |
From net investment income | | | (16,080,121 | ) | | | (8,538,158 | ) | |
From accumulated net realized gains | | | (17,142,410 | ) | | | (2,999,603 | ) | |
Decrease in net assets from distributions to shareholders | | | (33,222,531 | ) | | | (11,537,761 | ) | |
Capital Share Transactions | |
Proceeds from sale of shares, net of offering costs | | | — | | | | 186,311,500 | | |
Net increase (decrease) in net assets from capital share transactions | | | — | | | | 186,311,500 | | |
Net increase (decrease) in net assets | | | (14,648,324 | ) | | | 198,796,853 | | |
Net assets at the beginning of period | | | 198,897,128 | | | | 100,275 | | |
Net assets at the end of period | | $ | 184,248,804 | | | $ | 198,897,128 | | |
Undistributed (Over-distribution of) net investment income at the end of period | | $ | 757,326 | | | $ | 461,496 | | |
See accompanying notes to financial statements.
Nuveen Investments
26
Statement of
Cash Flows Year Ended December 31, 2013
Cash Flows from Operating Activities: | |
Net Increase (Decrease) in Net Assets from Operations | | $ | 18,574,207 | | |
Adjustments to reconcile the net increase (decrease) in net assets from operations to net cash provided by
(used in) operating activities: | |
Purchases of investments | | | (521,036,863 | ) | |
Proceeds from sales and maturities of investments | | | 528,767,489 | | |
Proceeds from (Purchases of) short-term investments, net | | | 1,091,509 | | |
Proceeds from (Payments for) cash denominated in foreign currencies, net | | | (103,625 | ) | |
Premiums received for options written | | | 131,040 | | |
Cash paid for terminated options written | | | (40,020 | ) | |
Amortization (Accretion) of premiums and discounts, net | | | (2,757 | ) | |
(Increase) Decrease in: | |
Receivable for dividends | | | (450,200 | ) | |
Receivable for interest | | | 219,691 | | |
Receivable for investments sold | | | 2,175,085 | | |
Receivable for reclaims | | | (59,861 | ) | |
Other assets | | | 16,369 | | |
Increase (Decrease) in: | |
Payable for investments purchased | | | (3,095,620 | ) | |
Accrued interest on borrowings | | | 105 | | |
Accrued management fees | | | 3,662 | | |
Accrued Trustees fees | | | 3,734 | | |
Accrued other expenses | | | (7,018 | ) | |
Net realized gain (loss) from: | |
Investments and foreign currency | | | (16,157,943 | ) | |
Options written | | | 277,860 | | |
Change in net unrealized (appreciation) of: | |
Investments and foreign currency | | | 14,616,789 | | |
Swaps | | | (2,389,756 | ) | |
Taxes paid on undistributed capital gains | | | (55,722 | ) | |
Capital gain and return of capital distributions from investments | | | 1,136,326 | | |
Net cash provided by (used in) operating activities | | | 23,614,481 | | |
Cash Flows from Financing Activities: | |
Increase (Decrease) in cash overdraft | | | 108,050 | | |
Proceeds from borrowings | | | 9,500,000 | | |
Cash distributions paid to shareholders | | | (33,222,531 | ) | |
Net cash provided by (used in) financing activities | | | (23,614,481 | ) | |
Net Increase (Decrease) in Cash | | | — | | |
Cash at the beginning of period | | | — | | |
Cash at the End of Period | | $ | — | | |
Supplemental Disclosure of Cash Flow Information | |
Cash paid for interest on borrowings (excluding borrowing costs) | | $ | 807,757 | | |
See accompanying notes to financial statements.
Nuveen Investments
27
Selected data for a share outstanding throughout each period:
| | | | |
| | | | | Investment Operations | | Less Distributions | | | | | | | |
| | | Beginning
Net Asset
Value | | Net
Investment
Income
(Loss)(a) | | Net
Realized/
Unrealized
Gain (Loss) | | Total | | From Net
Investment
Income | | From
Accumulated
Net Realized
Gains | | Return of
Capital | | Total | | Offering
Costs | | Ending
Net Asset
Value | | Ending
Market
Value | |
Year Ended 12/31: | |
2013 | | $ | 20.34 | | | $ | 1.53 | | | $ | .37 | | | $ | 1.90 | | | $ | (1.65 | ) | | $ | (1.75 | ) | | $ | — | | | $ | (3.40 | ) | | $ | — | | | $ | 18.84 | | | $ | 16.75 | | |
| 2012(d) | | | 19.10 | | | | .94 | | | | 1.53 | | | | 2.47 | | | | (.88 | ) | | | (.31 | ) | | | — | | | | (1.19 | ) | | | (.04 | ) | | | 20.34 | | | | 18.67 | | |
| | | Borrowings at End of Period | |
| | | Aggregate
Amount
Outstanding
(000) | | Asset
Coverage
Per $1,000 | |
Year Ended 12/31: | |
2013 | | $ | 87,500 | | | $ | 3,106 | | |
| 2012(d) | | | 78,000 | | | | 3,550 | | |
Nuveen Investments
28
| | | | | Ratios/Supplemental Data | |
| | | Total Returns | | | | Ratios to Average Net Assets(c) | | | |
| | | Based
on
Net Asset
Value(b) | | Based
on
Market
Value(b) | | Ending Net
Assets (000) | | Expenses | | Net
Investment
Income (Loss) | | Portfolio
Turnover
Rate(e) | |
Year Ended 12/31: | |
2013 | | | 9.35 | % | | | 7.88 | % | | $ | 184,249 | | | | 1.95 | % | | | 7.30 | % | | | 188 | % | |
| 2012(d) | | | 12.93 | | | | (.68 | ) | | | 198,897 | | | | 1.65 | * | | | 7.11 | * | | | 114 | | |
(a) Per share Net Investment Income (Loss) is calculated using the average daily shares method.
(b) Total Return Based on Market Value is the combination of changes in the market price per share and the effect of reinvested dividend income and reinvested capital gains distributions, if any, at the average price paid per share at the time of reinvestment. The last dividend declared in the period, which is typically paid on the first business day of the following month, is assumed to be reinvested at the ending market price. The actual reinvestment for the last dividend declared in the period may take place over several days, and in some instances may not be based on the market price, so the actual reinvestment price may be different from the price used in the calculation. Total returns are not annualized.
Total Return Based on Net Asset Value is the combination of changes in net asset value, reinvested dividend income at net asset value and reinvested capital gains distributions at net asset value, if any. The last dividend declared in the period, which is typically paid on the first business day of the following month, is assumed to be reinvested at the ending net asset value. The actual reinvest price for the last dividend declared in the period may often be based on the Fund's market price (and not its net asset value), and therefore may be different from the price used in the calculation. Total returns are not annualized.
(c) • Net Investment Income (Loss) ratios reflect income earned and expenses incurred on assets attributable to borrowings.
• Each ratio includes the effect of all interest expense paid and other costs related to borrowings as follows:
Ratios of Borrowings Interest Expense
to Average Net Assets | |
Year Ended 12/31: | |
2013 | | | .40 | % | |
| 2012(d) | | | .27 | * | |
(d) For the period from April 25, 2012 (commencement of operations) through December 31, 2012.
(e) Portfolio Turnover Rate is calculated based on the lesser of long-term purchases or sales (as disclosed in Note 5—Investment Transactions) divided by the average long-term market value during the period.
* Annualized.
See accompanying notes to financial statements.
Nuveen Investments
29
Notes to
Financial Statements
1. General Information and Significant Accounting Policies
General Information
Fund Information
Nuveen Real Asset Income and Growth Fund (the "Fund") is registered under the Investment Company Act of 1940, as amended, as a diversified closed-end registered investment company. The Fund's shares are listed on the New York Stock Exchange ("NYSE") and trade under the ticker symbol "JRI." The Fund was organized as a Massachusetts business trust on January 10, 2012.
Investment Adviser
The Fund's investment adviser is Nuveen Fund Advisors, LLC (the "Adviser"), a wholly-owned subsidiary of Nuveen Investments, Inc. ("Nuveen"). The Adviser is responsible for the Fund's overall investment strategy and asset allocation decisions. The Adviser has entered into a sub-advisory agreement with Nuveen Asset Management, LLC (the "Sub-Adviser"), a subsidiary of the Adviser, under which the Sub-Adviser manages the Fund's investment portfolio.
Investment Objective
The Fund seeks to provide a high level of current income and long-term capital appreciation. Under normal market conditions, the Fund will invest at least 80% of its managed assets (as defined in Note 7—Management Fees and Other Transactions With Affiliates) in equity and debt securities issued by real asset related companies located anywhere in the world. The Fund will not have more than 40% of its managed assets, at the time of purchase, in debt securities. All of the Fund's debt securities may be rated lower than investment grade quality (BB+/Ba1 or lower); no more than 10% of the Fund's managed assets may be invested in debt securities rated CCC+/Caa1 or lower at any time. The Fund will invest at least 25% and no more than 75% of its managed assets in securities of non-U.S. issuers through the direct investment in securities of non-U.S. companies and depository receipts. The Fund will also employ an option strategy focused on securities issued by real asset related companies that seeks to generate option premiums for the purpose of enhancing the Fund's risk-adjusted total returns over time. The Fund expects to write (sell) custom basket options with a notional value of options ranging from 5% to 10% of its managed assets.
Significant Accounting Policies
The following is a summary of significant accounting policies followed by the Fund in the preparation of its financial statements in accordance with U.S. generally accepted accounting principles ("U.S. GAAP").
Investment Transactions
Investment transactions are recorded on a trade date basis. Realized gains and losses from investment transactions are determined on the specific identification method, which is the same basis used for federal income tax purposes. Investments purchased on a when-issued/delayed delivery basis may have extended settlement periods. Any investments so purchased are subject to market fluctuation during this period. The Fund has instructed the custodian to earmark securities in the Fund's portfolio with a current value at least equal to the amount of the when-issued/delayed delivery purchase commitments. As of December 31, 2013, the Fund had no such outstanding purchase commitments.
Investment Income
Dividend income is recorded on the ex-dividend date or, for foreign securities, when information is available. Interest income, which reflects the amortization of premiums and includes accretion of discounts for financial reporting purposes, is recorded on an accrual basis. Interest income also reflects paydown gains and losses, if any.
Professional Fees
Professional fees presented on the Statement of Operations consist of legal fees incurred in the normal course of operations, audit fees, tax consulting fees and, in some cases, workout expenditures. Workout expenditures are incurred in an attempt to protect or enhance an investment or to pursue other claims or legal actions on behalf of Fund shareholders. Should the Fund receive a refund of workout expenditures paid in a prior reporting period, such amounts will be recognized as "Legal fee refund" on the Statement of Operations.
Nuveen Investments
30
Dividends and Distributions to Shareholders
Distributions to shareholders are recorded on the ex-dividend date. The amount and timing of distributions are determined in accordance with federal income tax regulations, which may differ from U.S. GAAP.
During the current reporting period, the Fund changed its distribution frequency from quarterly to monthly, beginning with the distribution payable to shareholders on October 1, 2013. The Fund makes cash distributions to shareholders of a stated dollar amount per share. Subject to approval and oversight by the Fund's Board of Trustees, the Fund seeks to establish a distribution rate that roughly corresponds to the cash flows from its investment strategies through regular distributions (a "Managed Distribution Program"). Total distributions during a calendar year generally will be made from the Fund's net investment income, net realized capital gains and net unrealized capital gains in the Fund's portfolio, if any. The portion of distributions paid attributed to net unrealized gains, if any, is distributed from the Fund's assets and is treated by shareholders as a non-taxable distribution ("Return of Capital") for tax purposes. In the event that total distributions during a calendar year exceed the Fund's total return on net asset value, the difference will reduce net asset value per share. If the Fund's total return on net asset value exceeds total distributions during a calendar year, the excess will be reflected as an increase in net asset value per share. The final determination of the source and character of all distributions for the fiscal year are made after the end of the fiscal year and are reflected in the financial statements contained in the annual report as of December 31 each year.
Real Estate Investment Trust ("REIT") distributions received by the Fund are generally comprised of ordinary income, long-term capital gains and a return of REIT capital. The actual character of amounts received during the period are not known until after the fiscal year-end. For the fiscal year ended December 31, 2013, the character of distributions to the Fund from the REITs was 84.58% ordinary income, 5.27% long-term capital gains, and 10.15% return of REIT capital. For the period April 25, 2012 (commencement of operations) through December 31, 2012, the character of distributions to the Fund from the REITs was 74.88% ordinary income, 9.35% long-term capital gains, and 15.77% return of REIT capital.
For the fiscal year ended December 31, 2013 and for the period April 25, 2012 (commencement of operations) through December 31, 2012, the Fund applied the actual character of distributions reported by the REITs in which the Fund invests to its receipts from the REITs. If a REIT held in the portfolio of investments did not report the actual character of its distributions during the period, the Fund treated the distributions as ordinary income.
The actual character of distributions made by the Fund during the fiscal year ended December 31, 2013 and period April 25, 2012 (commencement of operations) through December 31, 2012, are reflected in the accompanying financial statements.
Indemnifications
Under the Fund's organizational documents, its officers and trustees are indemnified against certain liabilities arising out of the performance of their duties to the Fund. In addition, in the normal course of business, the Fund enters into contracts that provide general indemnifications to other parties. The Fund's maximum exposure under these arrangements is unknown as this would involve future claims that may be made against the Fund that have not yet occurred. However, the Fund has not had prior claims or losses pursuant to these contracts and expects the risk of loss to be remote.
Netting Agreements
In the ordinary course of business, the Fund may enter into transactions subject to enforceable master repurchase agreements, International Swaps and Derivative Association, Inc. ("ISDA") master agreements or other similar arrangements ("netting agreements"). Generally, the right to offset in netting agreements allows the Fund to offset any exposure to a specific counterparty with any collateral received or delivered to that counterparty based on the terms of the agreements. Generally, the Fund manages its cash collateral and securities collateral on a counterparty basis. As of December 31, 2013, the Fund was not invested in any portfolio securities or derivatives, other than repurchase agreements and swap contracts further described in Note 3 – Portfolio Securities and Investments in Derivatives that are subject to netting agreements.
Use of Estimates
The preparation of financial statements in conformity with U.S. GAAP requires management to make estimates and assumptions that affect the reported amounts of assets and liabilities at the date of the financial statements and the reported amounts of increases and decreases in net assets from operations during the reporting period. Actual results may differ from those estimates.
2. Investment Valuation and Fair Value Measurements
Investment Valuation
Common stocks and other equity-type securities are valued at the last sales price on the securities exchange on which such securities are primarily traded and are generally classified as Level 1 for fair value measurement purposes. Securities primarily traded on the NASDAQ National Market ("NASDAQ") are valued, except as indicated below, at the NASDAQ Official Closing Price and are generally classified as Level 1. However, securities traded on a securities exchange or NASDAQ for which there were no transactions on a given day or securities not listed on a securities exchange or NASDAQ are valued at the quoted bid price and are generally classified as Level 2. Prices of certain American Depositary Receipts ("ADR") held by the Fund that trade in the United States are valued based on the last traded price, official closing price or the most recent bid price of the underlying non-U.S.-traded stock, adjusted as appropriate for the underlying-to-ADR conversion ratio and foreign exchange rate, and from time-to-time may also be
Nuveen Investments
31
Notes to Financial Statements (continued)
adjusted further to take into account material events that may take place after the close of the local non-U.S. market but before the close of the NYSE, which may represent a transfer from a Level 1 to a Level 2 security.
Prices of fixed-income securities and swap contracts are provided by a pricing service approved by the Fund's Board of Trustees. These securities are generally classified as Level 2. The pricing service establishes a security's fair value using methods that may include consideration of the following: yields or prices of investments of comparable quality, type of issue, coupon, maturity and rating, market quotes or indications of value from security dealers, evaluations of anticipated cash flows or collateral, general market conditions and other information and analysis, including the obligor's credit characteristics considered relevant. In pricing certain securities, particularly less liquid and lower quality securities, the pricing service may consider information about a security, its issuer or market activity provided by the Adviser. These securities are generally classified as Level 2 or Level 3 depending on the priority of the significant inputs.
Investments initially valued in currencies other than the U.S. dollar are converted to the U.S. dollar using exchange rates obtained from pricing services. As a result, the net asset value (NAV) of the Fund's shares may be affected by changes in the value of currencies in relation to the U.S. dollar. The value of securities traded in markets outside the United States or denominated in currencies other than the U.S. dollar may be affected significantly on a day that the NYSE is closed and an investor is not able to purchase, redeem or exchange shares. If significant market events occur between the time of determination of the closing price of a foreign security on an exchange and the time that the Fund's NAV is determined, or if under the Fund's procedures, the closing price of a foreign security is not deemed to be reliable, the security would be valued at fair value as determined in accordance with procedures established in good faith by the Fund's Board of Trustees. These securities are generally classified as Level 2 or Level 3 depending on the priority of the significant inputs.
Investments in investment companies are valued at their respective net asset values on valuation date and are generally classified as Level 1.
The value of exchange-traded options are based on the mean of the closing bid and ask prices. Exchange-traded options are generally classified as Level 1. Options traded in the over-the-counter market are valued using an evaluated mean price and are generally classified as Level 2.
Repurchase agreements are valued at contract amount plus accrued interest, which approximates market value. These securities are generally classified as Level 2.
Certain securities may not be able to be priced by the pre-established pricing methods as described above. Such securities may be valued by the Fund's Board of Trustees or its designee at fair value. These securities generally include, but are not limited to, restricted securities (securities which may not be publicly sold without registration under the Securities Act of 1933, as amended) for which a pricing service is unable to provide a market price; securities whose trading has been formally suspended; debt securities that have gone into default and for which there is no current market quotation; a security whose market price is not available from a pre-established pricing source; a security with respect to which an event has occurred that is likely to materially affect the value of the security after the market has closed but before the calculation of the Fund's net asset value (as may be the case in non-U.S. markets on which the security is primarily traded) or make it difficult or impossible to obtain a reliable market quotation; and a security whose price, as provided by the pricing service, is not deemed to reflect the security's fair value. As a general principle, the fair value of a security would appear to be the amount that the owner might reasonably expect to receive for it in a current sale. A variety of factors may be considered in determining the fair value of such securities, which may include consideration of the following: yields or prices of investments of comparable quality, type of issue, coupon, maturity and rating, market quotes or indications of value from security dealers, evaluations of anticipated cash flows or collateral, general market conditions and other information and analysis, including the obligor's credit characteristics considered relevant. These securities are generally classified as Level 2 or Level 3 depending on the priority of the significant inputs. Regardless of the method employed to value a particular security, all valuations are subject to review by the Fund's Board of Trustees or its designee.
Fair Value Measurements
Fair value is defined as the price that the Fund would receive upon selling an investment or transferring a liability in an orderly transaction to an independent buyer in the principal or most advantageous market for the investment. A three-tier hierarchy is used to maximize the use of observable market data and minimize the use of unobservable inputs and to establish classification of fair value measurements for disclosure purposes. Observable inputs reflect the assumptions market participants would use in pricing the asset or liability. Observable inputs are based on market data obtained from sources independent of the reporting entity. Unobservable inputs reflect the reporting entity's own assumptions about the assumptions market participants would use in pricing the asset or liability. Unobservable inputs are based on the best information available in the circumstances. The following is a summary of the three-tiered hierarchy of valuation input levels.
Level 1 – Inputs are unadjusted and prices are determined using quoted prices in active markets for identical securities.
Level 2 – Prices are determined using other significant observable inputs (including quoted prices for similar securities, interest rates, prepayment speeds, credit risk, etc.).
Level 3 – Prices are determined using significant unobservable inputs (including management's assumptions in determining the fair value of investments).
Nuveen Investments
32
The inputs or methodologies used for valuing securities are not an indication of the risks associated with investing in those securities. The following is a summary of the Fund's fair value measurements as of the end of the reporting period:
| | | Level 1 | | Level 2 | | Level 3 | | Total | |
Long-Term Investments*: | |
Common Stocks | | $ | 111,653,268 | | | $ | — | | | $ | — | | | $ | 111,653,268 | | |
Convertible Preferred Securities | | | 6,548,051 | | | | 1,653,242 | | | | — | | | | 8,201,293 | | |
$25 Par (or similar) Retail Structures | | | 66,211,498 | | | | 1,250,327 | | | | — | | | | 67,461,825 | | |
Corporate Bonds | | | — | | | | 51,515,263 | | | | — | | | | 51,515,263 | | |
Convertible Bonds | | | — | | | | 5,953,288 | | | | — | | | | 5,953,288 | | |
$1,000 Par (or similar) Institutional Structures | | | — | | | | 12,267,981 | | | | — | | | | 12,267,981 | | |
Common Stock Rights | | | 9,622 | | | | — | | | | — | | | | 9,622 | | |
Investment Companies | | | 2,769,951 | | | | — | | | | — | | | | 2,769,951 | | |
Short-Term Investments: | |
Repurchase Agreements | | | — | | | | 5,634,727 | | | | — | | | | 5,634,727 | | |
Derivatives | |
Swaps** | | | — | | | | 2,626,988 | | | | — | | | | 2,626,988 | | |
Total | | $ | 187,192,390 | | | $ | 80,901,816 | | | $ | — | | | $ | 268,094,206 | | |
* Refer to the Fund's Portfolio of Investments for industry classifications and a breakdown of Convertible Preferred Securities and $25 Par (or similar) Retail Structures classified as Level 2.
** Represents net unrealized appreciation (depreciation) as reported in the Fund's Portfolio of Investments.
The table below presents the transfers in and out of the three valuation levels for the Fund as of the end of the reporting period when compared to the valuation levels as of the end of the previous fiscal year. Changes in valuation inputs or methodologies may result in transfers into or out of an assigned level within the fair value hierarchy. Transfers in or out of levels are generally due to the availability of publicly available information and to the significance or extent a manager determines that the valuation inputs or methodologies may impact the valuation of those securities.
| | | Level 1 | | Level 2 | | Level 3 | |
| | | Transfers In | | (Transfers Out) | | Transfers In | | (Transfers Out) | | Transfers In | | (Transfers Out) | |
Common Stocks | | $ | 19,686,704 | | | $ | — | | | $ | — | | | $ | (19,686,704 | ) | | $ | — | | | $ | — | | |
Investment Companies | | | 1,061,120 | | | | — | | | | — | | | | (1,061,120 | ) | | | — | | | | — | | |
The Nuveen funds' Board of Directors/Trustees is responsible for the valuation process and has delegated the oversight of the daily valuation process to the Adviser's Valuation Committee. The Valuation Committee, pursuant to the valuation policies and procedures adopted by the Board of Directors/Trustees, is responsible for making fair value determinations, evaluating the effectiveness of the funds' pricing policies, and reporting to the Board of Directors/Trustees. The Valuation Committee is aided in its efforts by the Adviser's dedicated Securities Valuation Team, which is responsible for administering the daily valuation process and applying fair value methodologies as approved by the Valuation Committee. When determining the reliability of independent pricing services for investments owned by the funds, the Valuation Committee, among other things, conducts due diligence reviews of the pricing services and monitors the quality of security prices received through various testing reports conducted by the Securities Valuation Team.
The Valuation Committee will consider pricing methodologies it deems relevant and appropriate when making a fair value determination, based on the facts and circumstances specific to the portfolio instrument. Fair value determinations generally will be derived as follows, using public or private market information:
(i) If available, fair value determinations shall be derived by extrapolating from recent transactions or quoted prices for identical or comparable securities.
(ii) If such information is not available, an analytical valuation methodology may be used based on other available information including, but not limited to: analyst appraisals, research reports, corporate action information, issuer financial statements and shelf registration statements. Such analytical valuation methodologies may include, but are not limited to: multiple of earnings, discount from market value of a similar freely-traded security, discounted cash flow analysis, book value or a multiple thereof, risk premium/yield analysis, yield to maturity and/or fundamental investment analysis.
The purchase price of a portfolio instrument will be used to fair value the instrument only if no other valuation methodology is available or deemed appropriate, and it is determined that the purchase price fairly reflects the instrument's current value.
For each portfolio security that has been fair valued pursuant to the policies adopted by the Board of Directors/Trustees, the fair value price is compared against the last available and next available market quotations. The Valuation Committee reviews the results of such testing and fair valuation occurrences are reported to the Board of Directors/Trustees.
Nuveen Investments
33
Notes to Financial Statements (continued)
3. Portfolio Securities and Investments in Derivatives
Portfolio Securities
Foreign Currency Transactions
To the extent that the Fund invests in securities and/or contracts that are denominated in a currency other than U.S. dollars, the Fund will be subject to currency risk, which is the risk that an increase in the U.S. dollar relative to the foreign currency will reduce returns or portfolio value. Generally, when the U.S. dollar rises in value against a foreign currency, the Fund's investments denominated in that currency will lose value because its currency is worth fewer U.S. dollars; the opposite effect occurs if the U.S. dollar falls in relative value. Investments and other assets and liabilities denominated in foreign currencies are converted into U.S. dollars on a spot (i.e. cash) basis at the spot rate prevailing in the foreign currency exchange market at the time of valuation. Purchases and sales of investments and income denominated in foreign currencies are translated into U.S. dollars on the respective dates of such transactions.
The Fund may invest in non-U.S. securities (as described in Note 1 – General Information and Significant Accounting Policies, Investment Objective). As of December 31, 2013, the Fund's investments in non-U.S. securities were as follows:
| | | Value | | % of Total
Investments | |
Country: | |
Australia | | $ | 16,516,791 | | | | 6.2 | % | |
United Kingdom | | | 11,421,738 | | | | 4.3 | | |
Hong Kong | | | 9,610,886 | | | | 3.6 | | |
Italy | | | 6,850,866 | | | | 2.6 | | |
Other* | | | 39,219,789 | | | | 14.8 | | |
Total | | $ | 83,620,070 | | | | 31.5 | % | |
* Includes all other countries less than $6,850,866.
The books and records of the Fund are maintained in U.S. dollars. Foreign currencies, assets and liabilities are translated into U.S. dollars at 4:00 p.m. Eastern time. Investment transactions, income and expenses are translated on the respective dates of such transactions. Net realized foreign currency gains and losses resulting from changes in exchange rates include foreign currency gains and losses between trade date and settlement date of the transactions, foreign currency transactions, and the difference between the amounts of interest and dividends recorded on the books of the Fund and the amounts actually received.
The realized gains and losses resulting from changes in foreign currency exchange rates and changes in foreign exchange rates associated with other assets and liabilities on investments, forward foreign currency exchange contracts, futures, options purchased, options written and swaps are recognized as a component of "Net realized gain (loss) from investments and foreign currency" on the Statement of Operations, when applicable.
The unrealized gains and losses resulting from changes in foreign currency exchange rates and changes in foreign exchange rates associated with other assets and liabilities on investments are recognized as a component of "Change in net unrealized appreciation (depreciation) of investments and foreign currency" on the Statement of Operations, when applicable. The unrealized gains and losses resulting from changes in foreign exchange rates associated with forward foreign currency exchange contracts, futures, options purchased, options written and swaps are recognized as a component of "Change in net unrealized appreciation (depreciation) of forward foreign currency exchange contracts, futures, options purchased, options written and swap contracts," respectively, on the Statement of Operations, when applicable.
Repurchase Agreements
In connection with transactions in repurchase agreements, it is the Fund's policy that its custodian take possession of the underlying collateral securities, the fair value of which exceeds the principal amount of the repurchase transaction, including accrued interest, at all times. If the counterparty defaults, and the fair value of the collateral declines, realization of the collateral may be delayed or limited.
The following table presents the repurchase agreements for the Fund that are subject to netting agreements as of the end of the reporting period, and the collateral delivered related to those repurchase agreements.
| Counterparty | | Short-Term
Investments, at Value | | Collateral
Pledged (From)
Counterparty* | | Net
Exposure | |
Fixed Income Clearing Corporation | | $ | 5,634,727 | | | $ | (5,634,727 | ) | | $ | — | | |
* As of December 31, 2013, the value of the collateral pledged from the counterparty exceeded the value of the repurchase agreements. Refer to the Fund's Portfolio of Investments for details on the repurchase agreements.
Nuveen Investments
34
Zero Coupon Securities
The Fund is authorized to invest in zero coupon securities. A zero coupon security does not pay a regular interest coupon to its holders during the life of the security. Income to the holder of the security comes from accretion of the difference between the original purchase price of the security at issuance and the par value of the security at maturity and is effectively paid at maturity. The market prices of zero coupon securities generally are more volatile than the market prices of securities that pay interest periodically.
Investment in Derivatives
The Fund is authorized to invest in certain derivative instruments, such as futures, options and swap contracts. The Fund limits its investments in futures, options on futures and swap contracts to the extent necessary for the Adviser to claim the exclusion from registration by the Commodity Futures Trading Commission as a commodity pool operator with respect to the Fund. The Fund records derivative instruments at fair value, with changes in fair value recognized on the Statement of Operations, when applicable. Even though the Fund's investments in derivatives may represent economic hedges, they are not considered to be hedge transactions for financial reporting purposes.
Options Transactions
When the Fund writes an option, an amount equal to the net premium received (the premium less commission) is recognized as a component of "Options written, at value" on the Statement of Assets and Liabilities and is subsequently adjusted to reflect the current value of the written option until the option is exercised or expires or the Fund enters into a closing purchase transaction. The changes in the value of options written during the fiscal period are recognized as a component of "Change in net unrealized appreciation (depreciation) of options written" on the Statement of Operations. When an option is exercised or expires or the Fund enters into a closing purchase transaction, the difference between the net premium received and any amount paid at expiration or on executing a closing purchase transaction, including commission, is recognized as a component of "Net realized gain (loss) from options written" on the Statement of Operations. The Fund, as a writer of an option has no control over whether the underlying instrument may be sold (called) or purchased (put) and as a result bears the risk of an unfavorable change in the market value of the instrument underlying the written option. There is also the risk the Fund may not be able to enter into a closing transaction because of an illiquid market.
During the fiscal year ended December 31, 2013, the Fund periodically wrote options on REIT stocks, while owning REIT equities, to enhance returns while foregoing some upside potential. The Fund had no other transactions in options during the fiscal year ended December 31, 2013.
The average notional amount of outstanding options contracts during the fiscal year ended December 31, 2013, was as follows:
Average notional amount of outstanding options written* | | $ | — | ** | |
* The average notional amount of options written is calculated based on the outstanding notional at the beginning of the fiscal year and at the end of each fiscal quarter within the current fiscal year.
** The Fund did not hold any options at the beginning of the fiscal year or at the end of each fiscal quarter within the current fiscal year.
The following table presents the amount of net realized gain (loss) and change in net unrealized appreciation (depreciation) recognized on options contracts during the fiscal year ended December 31, 2013, and the primary underlying risk exposure.
Underlying
Risk Exposure | | Derivative
Instrument | | Net Realized Gain (Loss)
from Options Written | | Change in Net Unrealized
Appreciation (Depreciation)
of Options Written | |
Equity price | | Options | | $ | (277,860 | ) | | $ | — | | |
Swap Contracts
Interest rate swap contracts involve the Fund's agreement with the counterparty to pay or receive a fixed rate payment in exchange for the counterparty receiving or paying a variable rate payment that is intended to approximate the Fund's variable rate payment obligation on any variable rate borrowing. Forward interest rate swap transactions involve the Fund's agreement with a counterparty to pay, in the future, a fixed or variable rate payment in exchange for the counterparty paying the Fund a variable or fixed rate payment, the accruals for which would begin at a specified date in the future (the "effective date"). The payment obligation is based on the notional amount of the swap contract. Swap contracts do not involve the delivery of securities or other underlying assets or principal. Accordingly, the risk of loss with respect to the swap counterparty on such transactions is limited to the net amount of interest payments that the Fund is to receive. Swap contracts are valued daily. Upon entering into an interest rate swap (and beginning on the effective date for a forward interest rate swap), the Fund accrues the fixed rate payment expected to be paid or received and the variable rate payment expected to be received or paid on the swap contracts on a daily basis, and recognizes the daily change in the fair value of the Fund's contractual rights and obligations under the contracts. The net amount recorded for these transactions for each counterparty is recognized on the Statement of Assets and Liabilities as a component of "Unrealized appreciation or depreciation on swaps (, net)" with the change during the fiscal period recognized on the Statement of Operations as a component of "Change in net unrealized appreciation (depreciation) of swaps." Income received or paid by the Fund is recognized as a component of "Net realized gain (loss) from swaps" on the Statement of Operations, in addition to the net realized gains or losses recognized upon the termination of a swap contract and are equal to the difference between the Fund's basis in the swap and the proceeds from (or cost of) the closing transaction. Payments received or made at the beginning of the measurement period are recognized as a component of "Interest rate
Nuveen Investments
35
Notes to Financial Statements (continued)
swap premiums paid and/or received" on the Statement of Assets and Liabilities, when applicable. For tax purposes, periodic payments are treated as ordinary income or expense.
During the fiscal year ended December 31, 2013, the Fund held interest rate swap contracts in order to hedge leverage costs, which the Fund employs through the use of bank borrowings.
The average notional amount of interest rate swap contracts outstanding during the fiscal year ended December 31, 2013, was as follows:
Average notional amount of interest rate swap contracts outstanding* | | $ | 58,500,000 | | |
* The average notional amount is calculated based on the outstanding notional at the beginning of the fiscal year and at the end of each fiscal quarter within the current fiscal year.
The following table presents the fair value of all interest rate swap contracts held by the Fund as of December 31, 2013, the location of these instruments on the Statement of Assets and Liabilities and the primary underlying risk exposure.
| | | | | Location on the Statement of Assets and Liabilities | |
Underlying | | Derivative | | Asset Derivatives | | (Liability) Derivatives | |
Risk Exposure | | Instrument | | Location | | Value | | Location | | Value | |
Interest rate | | Swaps | | Unrealized appreciation on interest rate swaps | | $ | 2,626,988 | | | | — | | | $ | — | | |
The following table presents the swap contacts, which are subject to netting agreements, as well as the collateral delivered related to those swap contracts.
Counterparty | | Gross Unrealized
Appreciation on
Interest Rate Swaps* | | Amounts
Netted on
Statement of
Assets and Liabilities* | | Net Unrealized
Appreciation on
Interest Rate Swaps | | Collateral
Pledged
to (from)
Counterparty | | Net Exposure | |
JPMorgan | | $ | 2,626,988 | | | $ | — | | | $ | 2,626,988 | | | $ | (2,561,162 | ) | | $ | 65,826 | | |
* Represents gross unrealized appreciation (depreciation) for the counterparty as presented in the Fund's Portfolio of Investments.
The following table presents the amount of net realized gain (loss) and change in net unrealized appreciations (depreciation) recognized on swap contracts during the fiscal year ended December 31, 2013, and the primary underlying risk exposure.
Underlying
Risk Exposure | | Derivative
Instrument | | Net Realized Gain (Loss) from Swaps | | Change in Net Unrealized
Appreciation (Depreciation) of Swaps | |
Interest rate | | Swaps | | $ | — | | | $ | 2,389,756 | | |
Market and Counterparty Credit Risk
In the normal course of business the Fund may invest in financial instruments and enter into financial transactions where risk of potential loss exists due to changes in the market (market risk) or failure of the other party to the transaction to perform (counterparty credit risk). The potential loss could exceed the value of the financial assets recorded on the financial statements. Financial assets, which potentially expose the Fund to counterparty credit risk, consist principally of cash due from counterparties on forward, option and swap transactions, when applicable. The extent of the Fund's exposure to counterparty credit risk in respect to these financial assets approximates their carrying value as recorded on the Statement of Assets and Liabilities.
The Fund helps manage counterparty credit risk by entering into agreements only with counterparties the Adviser believes have the financial resources to honor their obligations and by having the Adviser monitor the financial stability of the counterparties. Additionally, counterparties may be required to pledge collateral daily (based on the daily valuation of the financial asset) on behalf of the Fund with a value approximately equal to the amount of any unrealized gain above a pre-determined threshold. Reciprocally, when the Fund has an unrealized loss, the Fund has instructed the custodian to pledge assets of the Fund as collateral with a value approximately equal to the amount of the unrealized loss above a pre-determined threshold. Collateral pledges are monitored and subsequently adjusted if and when the valuations fluctuate, either up or down, by at least the pre-determined threshold amount.
4. Fund Shares
Transactions in Fund shares were as follows:
| | | Year
Ended
12/31/13 | | For the period from 4/25/12
(commencement of operations)
through 12/31/12 | |
Shares sold | | | — | | | | 9,775,000 | | |
5. Investment Transactions
Purchases and sales (including maturities, but excluding short-term investments and derivative transactions) during the fiscal year ended December 31, 2013, aggregated $521,036,863 and $528,767,489, respectively.
Nuveen Investments
36
Transactions in options written during the fiscal year ended December 31, 2013, were as follows:
| | | Number of
Contracts | | Premiums
Received | |
Options outstanding, beginning of period | | | — | | | $ | — | | |
Options written | | | 9,250 | | | | 131,040 | | |
Options terminated in closing purchase transactions | | | (4,350 | ) | | | (40,020 | ) | |
Options expired | | | (4,900 | ) | | | (91,020 | ) | |
Options outstanding, end of period | | | — | | | $ | — | | |
6. Income Tax Information
The Fund intends to distribute substantially all of its investment company taxable income to shareholders and to otherwise comply with the requirements of Subchapter M of the Internal Revenue Code applicable to regulated investment companies. In any year when the Fund realizes net capital gains, the Fund may choose to distribute all or a portion of its net capital gains to shareholders, or alternatively, to retain all or a portion of its net capital gains and pay federal corporate income taxes on such retained gains.
For all open tax years and all major taxing jurisdictions, management of the Fund has concluded that there are no significant uncertain tax positions that would require recognition in the financial statements. Open tax years are those that are open for examination by taxing authorities (i.e., generally the last four tax year ends and the interim tax period since then). Furthermore, management of the Fund is also not aware of any tax positions for which it is reasonably possible that the total amounts of unrecognized tax benefits will significantly change in the next twelve months.
The following information is presented on an income tax basis. Differences between amounts for financial statement and federal income tax purposes are primarily due to the recognition of premium amortization, and timing differences in recognizing certain gains and losses on investment transactions. To the extent that differences arise that are permanent in nature, such amounts are reclassified within the capital accounts as detailed below. Temporary differences do not require reclassification. Temporary and permanent differences do not impact the net asset value of the Fund.
As of December 31, 2013, the cost and unrealized appreciation (depreciation) of investments (excluding investments in derivatives), as determined on a federal income tax basis, were as follows:
Cost of investments | | $ | 271,248,238 | | |
Gross unrealized: | |
Appreciation | | $ | 7,954,706 | | |
Depreciation | | | (13,735,726 | ) | |
Net unrealized appreciation (depreciation) of investments | | $ | (5,781,020 | ) | |
Permanent differences, primarily due to the bond premium amortization, federal taxes paid, investments in partnerships, foreign currency reclassifications, investments in passive foreign investment companies, complex securities character adjustments and distribution character reclassifications, resulted in reclassifications among the Fund's components of net assets as of December 31, 2013, the Fund's tax year end, as follows:
Paid-in surplus | | $ | (55,283 | ) | |
Undistributed (Over-distribution of) net investment income | | | 1,419,172 | | |
Accumulated net realized gain (loss) | | | (1,363,889 | ) | |
The tax components of undistributed net ordinary income and net long-term capital gains as of December 31, 2013, the Fund's tax year end, were as follows:
Undistributed net ordinary income1 | | $ | 1,120,849 | | |
Undistributed net long-term capital gains | | | — | | |
1 Net ordinary income consists of net taxable income derived from dividends and interest, and net short-term capital gains.
The tax character of distributions paid during the Fund's tax years ended December 31, 2013 and December 31, 2012, was designated for purposes of the dividends paid deduction as follows:
2013 | |
Distributions from net ordinary income1 | | $ | 30,259,101 | | |
Distributions from net long-term capital gains | | | 2,963,430 | | |
2012 | |
Distributions from net ordinary income1 | | $ | 11,537,761 | | |
Distributions from net long-term capital gains | | | — | | |
1 Net ordinary income consists of net taxable income derived from dividends and interest, and net short-term capital gains.
Nuveen Investments
37
Notes to Financial Statements (continued)
The Fund has elected to defer late-year losses in accordance with federal income tax rules. These losses are treated as having arisen on the first day of the following fiscal year. The Fund has elected to defer losses as follows:
Post-October capital losses2 | | $ | 91,322 | | |
Late-year ordinary losses3 | | | — | | |
2 Capital losses incurred from November 1, 2013 through December 31, 2013, the Fund's tax year end.
3 Specified losses incurred from November 1, 2013 through December 31, 2013.
7. Management Fees and Other Transactions with Affiliates
The Fund's management fee compensates the Adviser for overall investment strategy advisory and administrative services and general office facilities. The Sub-Adviser is compensated for its services to the Fund from the management fees paid to the Adviser.
The Fund's management fee consists of two components—a fund-level fee, based only on the amount of assets within the Fund, and a complex-level fee, based on the aggregate amount of all eligible fund assets managed by the Adviser. This pricing structure enables Fund shareholders to benefit from growth in the assets within the Fund as well as from growth in the amount of complex-wide assets managed by the Adviser.
The annual fund-level fee, payable monthly, is calculated according to the following schedule:
Average Daily Managed Assets* | | Fund-Level Fee Rate | |
For the first $500 million | | | .8000 | % | |
For the next $500 million | | | .7750 | | |
For the next $500 million | | | .7500 | | |
For the next $500 million | | | .7250 | | |
For managed assets over $2 billion | | | .7000 | | |
The annual complex-level fee, payable monthly, is calculated according to the following schedule:
Complex-Level Managed Asset Breakpoint Level* | | Effective Rate at Breakpoint Level | |
| $55 billion | | | .2000 | % | |
| $56 billion | | | .1996 | | |
| $57 billion | | | .1989 | | |
| $60 billion | | | .1961 | | |
| $63 billion | | | .1931 | | |
| $66 billion | | | .1900 | | |
| $71 billion | | | .1851 | | |
| $76 billion | | | .1806 | | |
| $80 billion | | | .1773 | | |
| $91 billion | | | .1691 | | |
| $125 billion | | | .1599 | | |
| $200 billion | | | .1505 | | |
| $250 billion | | | .1469 | | |
| $300 billion | | | .1445 | | |
* For the fund-level and complex-level fees, managed assets include closed-end fund assets managed by the Adviser that are attributable to certain types of leverage. For these purposes, leverage includes the funds' use of preferred stock and borrowings and certain investments in the residual interest certificates (also called inverse floating rate securities) in tender option bond (TOB) trusts, including the portion of assets held by a TOB trust that has been effectively financed by the trust's issuance of floating rate securities, subject to an agreement by the Adviser as to certain funds to limit the amount of such assets for determining managed assets in certain circumstances. The complex-level fee is calculated based upon the aggregate daily managed assets of all Nuveen Funds that constitute "eligible assets." Eligible assets do not include assets attributable to investments in other Nuveen Funds and assets in excess of $2 billion added to the Nuveen Fund complex in connection with the Adviser's assumption of the management of the former First American Funds effective January 1, 2011. As of December 31, 2013, the complex-level fee rate for the Fund was .1686%.
The Fund pays no compensation directly to those of its trustees who are affiliated with the Adviser or to its officers, all of whom receive remuneration for their services to the Fund from the Adviser or its affiliates. The Board of Trustees has adopted a deferred compensation plan for independent trustees that enables trustees to elect to defer receipt of all or a portion of the annual compensation they are entitled to receive from certain Nuveen-advised funds. Under the plan, deferred amounts are treated as though equal dollar amounts had been invested in shares of select Nuveen-advised funds.
8. Borrowing Arrangements
The Fund has entered into a $90 million (maximum commitment amount) senior committed secured 180-day continuous rolling margin commitment facility ("Borrowings"), with Bank of America N. A. ("Bank of America"), unless terminated earlier in accordance with the terms of the Borrowings, as a means of leverage. On December 31, 2013, the outstanding balance on these Borrowings was $87.5 million. During the fiscal year ended December 31, 2013, the average daily balance outstanding and annual interest rate on these Borrowings were $84.9 million and .94%, respectively.
In order to maintain these Borrowings, the Fund must meet certain collateral, asset coverage and other requirements. Borrowings outstanding are fully secured by securities held in the Fund's portfolio of investments. Interest is charged on these Borrowings at a rate equal to the one-month LIBOR
Nuveen Investments
38
(London Inter-Bank Offered Rate) plus .75% or if LIBOR were to become unavailable, the Federal Funds Rate plus .50% plus .75%. In addition to interest expense, the Fund pays a non-utilization fee to the extent that the average daily drawn balance for a month is less than $72 million.
Borrowings outstanding are recognized as "Borrowings" on the Statement of Assets and Liabilities. Interest expense incurred and non-utilization fees are recognized as a component of "Interest expense on borrowings" on the Statement of Operations.
Nuveen Investments
39
Additional
Fund Information
Board of Trustees
William Adams IV* | | Robert P. Bremner | | Jack B. Evans | | William C. Hunter | | David J. Kundert | | John K. Nelson | |
William J. Schneider | | Thomas S. Schreier, Jr.* | | Judith M. Stockdale | | Carole E. Stone | | Virginia L. Stringer | | Terence J. Toth | |
* Interested Board Member.
Fund Manager
Nuveen Fund Advisors, LLC
333 West Wacker Drive
Chicago, IL 60606 | | Custodian
State Street Bank
& Trust Company
Boston, MA 02111 | | Legal Counsel
Chapman and Cutler LLP
Chicago, IL 60603 | | Independent Registered
Public Accounting Firm
Ernst & Young LLP
Chicago, IL 60606 | | Transfer Agent and
Shareholder Services
State Street Bank
& Trust Company
Nuveen Funds
P.O. Box 43071
Providence, RI 02940-3071
(800) 257-8787 | |
Quarterly Form N-Q Portfolio of Investments Information
The Fund is required to file its complete schedule of portfolio holdings with the Securities and Exchange Commission (SEC) for the first and third quarters of each fiscal year on Form N-Q. You may obtain this information directly from the SEC. Visit the SEC on-line at http://www.sec.gov or in person at the SEC's Public Reference Room in Washington, D.C. Call the SEC toll-free at (800) SEC -0330 for room hours and operation.
Nuveen Funds' Proxy Voting Information
You may obtain (i) information regarding how each fund voted proxies relating to portfolio securities held during the most recent twelve-month period ended June 30, without charge, upon request, by calling Nuveen Investments toll-free at (800) 257-8787 or on Nuveen's website at www.nuveen.com and (ii) a description of the policies and procedures that each fund used to determine how to vote proxies relating to portfolio securities without charge, upon request, by calling Nuveen Investments toll free at (800) 257-8787. You may also obtain this information directly from the SEC. Visit the SEC on-line at http://www.sec.gov.
CEO Certification Disclosure
The Fund's Chief Executive Officer has submitted to the New York Stock Exchange (NYSE) the annual CEO certification as required by Section 303A.12(a) of the NYSE Listed Company Manual.
The Fund has filed with the SEC the certification of its CEO and Chief Financial Officer required by Section 302 of the Sarbanes-Oxley Act.
Common Share Information
The Fund intends to repurchase shares of its own common stock in the future at such times and in such amounts as is deemed advisable. During the period covered by this report, the Fund did not repurchase any of it shares.
Any future repurchases will be reported to shareholders in the next annual or semi-annual report.
Distribution Information
The Fund hereby designates its percentage of dividends paid from net ordinary income as dividends qualifying for the 70% dividends received deduction (DRD) for corporations and its percentage as qualified dividend income (QDI) for individuals under Section 1(h)(11) of the Internal Revenue Code as shown in the accompanying table. The actual qualified dividend income distributions will be reported to shareholders on Form 1099-DIV which will be sent to shareholders shortly after calendar year end.
| | JRI | |
| % QDI | | | 10.72 | % | |
| % DRD | | | 1.39 | % | |
Nuveen Investments
40
Glossary of Terms
Used in this Report
n Average Annual Total Return: This is a commonly used method to express an investment's performance over a particular, usually multi-year time period. It expresses the return that would have been necessary each year to equal the investment's actual cumulative performance (including change in NAV or market price and reinvested dividends and capital gains distributions, if any) over the time period being considered.
n Beta: A measure of the variability of the change in the share price for a fund in relation to a change in the value of the fund's market benchmark. Securities with betas higher than 1.0 have been, and are expected to be, more volatile than the benchmark; securities with betas lower than 1.0 have been, and are expected to be, less volatile than the benchmark.
n JRI Blended Index (Comparative Benchmark): A five index blend comprised of weightings approximating the Fund's proposed portfolio: 1) 33% S&P Global Infrastructure Index; 2) 20% BofA Merrill Lynch REIT Preferred Index; 3) 20% Barclays U.S. Corporate High Yield Debt Bond Index; 4) 15% MSCI U.S. REIT Index; and 5) 12% BofA Merrill Lynch Fixed Rate Preferred Securities Index. The Fund's proposed portfolio may differ significantly from the blended portfolio and actual returns may be substantially lower. 1) S&P Global Infrastructure Index: An unmanaged index comprised of 75 of the largest publicly listed infrastructure companies that meet specific investability requirements; 2) BofA Merrill Lynch REIT Preferred Index: An unmanaged index of investment grade REIT preferred shares with a deal size in excess of $100 million, weighted by capitalization and considered representative of investment grade preferred real estate stock performance; 3) Barclays U.S. Corporate High Yield Debt Bond Index: An unmanaged index that covers the universe of domestic fixed-rate non-investment grade debt; 4) MSCI U.S. REIT Index: A free float-adjusted market capitalization weighted index that is comprised of equity REITs that are included in the MSCI U.S. Investable Market 2500 Index, with the exception of specialty equity REITs that do not generate a majority of their revenue and income from real estate rental and leasing operations. This index represents approximately 85% of the U.S. REIT universe; 5) BofA Merrill Lynch Fixed Rate Preferred Securities Index: Tracks the performance of fixed-rate U.S. dollar-denominated preferred securities issued in the U.S. domestic market. Qualifying securities must be rated investment-grade (based on an average of Moody's, S&P and Fitch) and must have an investment-grade-rated country of risk (based on an average of Moody's, S&P and Fitch foreign currency long-term sovereign debt ratings). Benchmark returns do not include the effects of any sales charges or management fees.
n Duration: Duration is a measure of the expected period over which a bond's principal and interest will be paid, and consequently is a measure of the sensitivity of a bond's or bond fund's value to changes when market interest rates change. Generally, the longer a bond's or fund's duration, the more the price of the bond or fund will change as interest rates change.
n Effective Leverage: Effective leverage is a fund's effective economic leverage, and includes both regulatory leverage (see below) and the leverage effects of certain derivative investments in the fund's portfolio.
n Gross Domestic Product (GDP): The total market value of all final goods and services produced in a country/region in a given year, equal to total consumer, investment and government spending, plus the value of exports, minus the value of imports.
n Leverage: Leverage is created whenever a fund has investment exposure (both reward and/or risk) equivalent to more than 100% of the investment capital.
n MSCI World Index: A free-float adjusted market capitalization-weighted index that is designed to measure equity market performance of developed markets. Index returns assume reinvestment of distributions, but do not include the effects of any applicable sales charges or management fees.
Nuveen Investments
41
Glossary of Terms Used in this Report (continued)
n Net Asset Value (NAV) Per Share: A fund's Net Assets is equal to its total assets (securities, cash, accrued earnings and receivables) less its total liabilities. NAV per share is equal to the fund's Net Assets divided by its number of shares outstanding.
n Regulatory Leverage: Regulatory leverage consists of preferred shares issued by or borrowings of the fund. Both of these are part of the fund's capital structure. Regulatory leverage is subject to asset coverage limits set in the Investment Company Act of 1940.
Nuveen Investments
42
Reinvest Automatically,
Easily and Conveniently
Nuveen makes reinvesting easy. A phone call is all it takes to set up your reinvestment account.
Nuveen Closed-End Funds Automatic Reinvestment Plan
Your Nuveen Closed-End Fund allows you to conveniently reinvest distributions in additional Fund shares.
By choosing to reinvest, you'll be able to invest money regularly and automatically, and watch your investment grow through the power of compounding. Just like distributions in cash, there may be times when income or capital gains taxes may be payable on distributions that are reinvested.
It is important to note that an automatic reinvestment plan does not ensure a profit, nor does it protect you against loss in a declining market.
Easy and convenient
To make recordkeeping easy and convenient, each quarter you'll receive a statement showing your total distributions, the date of investment, the shares acquired and the price per share, and the total number of shares you own.
How shares are purchased
The shares you acquire by reinvesting will either be purchased on the open market or newly issued by the Fund. If the shares are trading at or above net asset value at the time of valuation, the Fund will issue new shares at the greater of the net asset value or 95% of the then-current market price. If the shares are trading at less than net asset value, shares for your account will be purchased on the open market. If the Plan Agent begins purchasing Fund shares on the open market while shares are trading below net asset value, but the Fund's shares subsequently trade at or above their net asset value before the Plan Agent is able to complete its purchases, the Plan Agent may cease open-market purchases and may invest the uninvested portion of the distribution in newly-issued Fund shares at a price equal to the greater of the shares' net asset value or 95% of the shares' market value on the last business day immediately prior to the purchase date. Distributions received to purchase shares in the open market will normally be invested shortly after the distribution payment date. No interest will be paid on distributions awaiting reinvestment. Because the market price of the shares may increase before purchases are completed, the average purchase price per share may exceed the market price at the time of valuation, resulting in the acquisition of fewer shares than if the distribution had been paid in shares issued by the Fund. A pro rata portion of any applicable brokerage commissions on open market purchases will be paid by Plan participants. These commissions usually will be lower than those charged on individual transactions.
Flexible
You may change your distribution option or withdraw from the Plan at any time, should your needs or situation change.
You can reinvest whether your shares are registered in your name, or in the name of a brokerage firm, bank, or other nominee. Ask your investment advisor if his or her firm will participate on your behalf. Participants whose shares are registered in the name of one firm may not be able to transfer the shares to another firm and continue to participate in the Plan.
The Fund reserves the right to amend or terminate the Plan at any time. Although the Fund reserves the right to amend the Plan to include a service charge payable by the participants, there is no direct service charge to participants in the Plan at this time.
Call today to start reinvesting distributions
For more information on the Nuveen Automatic Reinvestment Plan or to enroll in or withdraw from the Plan, speak with your financial advisor or call us at (800) 257-8787.
Nuveen Investments
43
Board
Members & Officers (Unaudited)
The management of the Funds, including general supervision of the duties performed for the Funds by the Adviser, is the responsibility of the Board of Trustees of the Funds. The number of trustees of the Funds is currently set at twelve. None of the trustees who are not "interested" persons of the Funds (referred to herein as "independent trustees") has ever been a director or employee of, or consultant to, Nuveen or its affiliates. The names and business addresses of the trustees and officers of the Funds, their principal occupations and other affiliations during the past five years, the number of portfolios each oversees and other directorships they hold are set forth below.
Name,
Year of Birth
& Address | | Position(s) Held
with the Funds | | Year First
Elected or
Appointed
and Term(1) | | Principal
Occupation(s)
Including other
Directorships
During Past 5 Years | | Number
of Portfolios
in Fund Complex
Overseen by
Board Member | |
Independent Board Members: | | | |
| nWILLIAM J. SCHNEIDER | | | |
1944
333 W. Wacker Drive Chicago, IL 60606 | |
Chairman and
Board Member | | 1996
Class III | | Chairman of Miller-Valentine Partners Ltd., a real estate investment company; formerly, Senior Partner and Chief Operating Officer (retired 2004) of Miller-Valentine Group; an owner in several other Miller Valentine entities; Board Member of Mid-America Health System, Tech Town, Inc., a not-for-profit community development company, Board Member of WDPR Public Radio station; formerly, member, Business Advisory Council, Cleveland Federal Reserve Bank and University of Dayton Business School Advisory Council. | | |
206 | | |
| nROBERT P. BREMNER | | | |
1940
333 W. Wacker Drive Chicago, IL 60606 | |
Board Member | | 1996
Class lll | | Private Investor and Management Consultant; Treasurer and Director, Humanities Council of Washington, D.C.; Board Member, Independent Directors Council affiliated with the Investment Company Institute. | | |
206 | | |
| nJACK B. EVANS | | | |
1948
333 W. Wacker Drive Chicago, IL 60606 | |
Board Member | | 1999
Class lll | | President, The Hall-Perrine Foundation, a private philanthropic corporation (since 1996); Chairman, United Fire Group, a publicly held company; formerly, Member and President Pro-Tem of the Board of Regents for the State of Iowa University System; Director, Source Media Group; Life Trustee of Coe College; formerly, Director, Alliant Energy; formerly, Director, Federal Reserve Bank of Chicago; formerly, President and Chief Operating Officer, SCI Financial Group, Inc., a regional financial services firm. | | |
206 | | |
| nWILLIAM C. HUNTER | | | |
1948
333 W. Wacker Drive Chicago, IL 60606 | |
Board Member | | 2004
Class l | | Dean Emeritus (since June 30, 2012), formerly, Dean, Tippie College of Business, University of Iowa (2006-2012); Director (since 2004) of Xerox Corporation; Director (since 2005), and President (since July 2012) Beta Gamma Sigma, Inc., The International Honor Society; Director of Wellmark, Inc. (since 2009); formerly, Dean and Distinguished Professor of Finance, School of Business at the University of Connecticut (2003-2006); previously, Senior Vice President and Director of Research at the Federal Reserve Bank of Chicago (1995-2003); formerly, Director (1997-2007), Credit Research Center at Georgetown University. | | |
206 | | |
| nDAVID J. KUNDERT | | | |
1942
333 W. Wacker Drive Chicago, IL 60606 | |
Board Member | | 2005
Class ll | | Formerly, Director, Northwestern Mutual Wealth Management Company (2006-2013), retired (since 2004) as Chairman, JPMorgan Fleming Asset Management, President and CEO, Banc One Investment Advisors Corporation, and President, One Group Mutual Funds; prior thereto, Executive Vice President, Banc One Corporation and Chairman and CEO, Banc One Investment Management Group; Regent Emeritus, Member of Investment Committee, Luther College; member of the Wisconsin Bar Association; member of Board of Directors, Friends of Boerner Botanical Gardens; member of Board of Directors and Chair of Investment Committee, Greater Milwaukee Foundation; member of the Board of Directors (Milwaukee), College Possible. | | |
206 | | |
Nuveen Investments
44
Name,
Year of Birth
& Address | | Position(s) Held
with the Funds | | Year First
Elected or
Appointed
and Term(1) | | Principal
Occupation(s)
Including other
Directorships
During Past 5 Years | | Number
of Portfolios
in Fund Complex
Overseen by
Board Member | |
Independent Board Members (continued): | | | |
| nJOHN K. NELSON | | | |
1962
333 West Wacker Drive
Chicago, IL 60606 | |
Board Member | | 2013
Class ll | | Senior external advisor to the financial services practice of Deloitte Consulting LLP (since 2012); Member of Board of Directors of Core12 LLC (since 2008), a private firm which develops branding, marketing and communications strategies for clients; Chairman of the Board of Trustees of Marian University (since 2010 as trustee, 2011 as Chairman); Director of The Curran Center for Catholic American Studies (since 2009) and The President's Council, Fordham University (since 2010); formerly, Chief Executive Officer of ABN AMRO N.V. North America, and Global Head of its Financial Markets Division (2007-2008); prior senior positions held at ABN AMRO include Corporate Executive Vice President and Head of Global Markets-the Americas (2006-2007), CEO of Whole- sale Banking North America and Global Head of Foreign Exchange and Futures Markets (2001-2006), and Regional Commercial Treasurer and Senior Vice President Trading-North America (1996-2001); formerly, Trustee at St. Edmund Preparatory School in New York City. | | |
206 | | |
| nJUDITH M. STOCKDALE | | | |
1947
333 W. Wacker Drive
Chicago, IL 60606 | |
Board Member | | 1997
Class l | | Formerly, Executive Director (1994-2012), Gaylord and Dorothy Donnelley Foundation (since 1994); prior thereto, Executive Director, Great Lakes Protection Fund (1990-1994). | | |
206 | | |
| nCAROLE E. STONE | | | |
1947
333 W. Wacker Drive
Chicago, IL 60606 | |
Board Member | | 2007
Class l | | Director, Chicago Board Options Exchange (since 2006); Director, C2 Options Exchange, Incorporated (since 2009); Director, CBOE Holdings, Inc. (since 2010); formerly, Commissioner, New York State Commission on Public Authority Reform (2005-2010); formerly, Chair, New York Racing Association Oversight Board (2005-2007). | | |
206 | | |
| nVIRGINIA L. STRINGER | | | |
1944
333 W. Wacker Drive
Chicago, IL 60606 | |
Board Member | | 2011
Class l | | Board Member, Mutual Fund Directors Forum; former governance consultant and non-profit board member; former Owner and President, Strategic Management Resources, Inc., a management consulting firm; former Member, Governing Board, Investment Company Institute's Independent Directors Council; previously, held several executive positions in general management, marketing and human resources at IBM and The Pillsbury Company; Independent Director, First American Fund Complex (1987-2010) and Chair (1997-2010). | | |
206 | | |
| nTERENCE J. TOTH | | | |
1959
333 W. Wacker Drive
Chicago, IL 60606 | |
Board Member | | 2008
Class lI | | Managing Partner, Promus Capital (since 2008); Director, Fulcrum IT Service LLC (since 2010), Quality Control Corporation (since 2012) and LogicMark LLC (since 2012); formerly, Director, Legal & General Investment Management America, Inc. (2008-2013); formerly, CEO and President, Northern Trust Global Investments (2004-2007); Executive Vice President, Quantitative Management & Securities Lending (2000-2004); prior thereto, various positions with Northern Trust Company (since 1994); member: Chicago Fellowship Board (since 2005), Catalyst Schools of Chicago Board (since 2008) and Chairman, and Mather Foundation Board (since 2012), and a member of its investment committee; formerly, Member, Northern Trust Mutual Funds Board (2005-2007), Northern Trust Global Investments Board (2004-2007), Northern Trust Japan Board (2004-2007), Northern Trust Securities Inc. Board (2003-2007) and Northern Trust Hong Kong Board (1997-2004). | | |
206 | | |
Nuveen Investments
45
Board Members & Officers (Unaudited) (continued)
Name,
Year of Birth
& Address | | Position(s) Held
with the Funds | | Year First
Elected or
Appointed
and Term(1) | | Principal
Occupation(s)
Including other
Directorships
During Past 5 Years | | Number
of Portfolios
in Fund Complex
Overseen by
Board Member | |
Interested Board Members: | | | |
| nWILLIAM ADAMS IV(2) | | | |
1955
333 W. Wacker Drive
Chicago, IL 60606 | |
Board Member | | | 2013
Class ll | | | Senior Executive Vice President, Global Structured Products (since 2010); formerly, Executive Vice President, U.S. Structured Products, of Nuveen Investments, Inc. (1999-2010); Co-President of Nuveen Fund Advisors, LLC (since 2011); President (since 2011), formerly, Managing Director (2010-2011) of Nuveen Commodities Asset Management, LLC; Board Member of the Chicago Symphony Orchestra and of Gilda s Club Chicago. | | |
132 | | |
| nTHOMAS S. SCHREIER, JR.(2) | | | |
1962
333 W. Wacker Drive
Chicago, IL 60606 | |
Board Member | | | 2013
Class lll | | | Vice Chairman, Wealth Management of Nuveen Investments, Inc. (since 2011); Co-President of Nuveen Fund Advisors, LLC; Chairman of Nuveen Asset Management, LLC (since 2011); Co-Chief Executive Officer of Nuveen Securities, LLC (since 2011); Member of Board of Governors and Chairman's Council of the Investment Company Institute; formerly, Chief Executive Officer (2000-2010) and Chief Investment Officer (2007-2010) of FAF Advisors, Inc.; formerly, President of First American Funds (2001-2010). | | |
132 | | |
Name,
Year of Birth
& Address | | Position(s) Held
with the Funds | | Year First
Elected or
Appointed(3) | | Principal
Occupation(s)
During Past 5 Years | | Number
of Portfolios
in Fund Complex
Overseen by
Officer | |
Officers of the Funds: | | | |
| nGIFFORD R. ZIMMERMAN | | | |
1956
333 W. Wacker Drive
Chicago, IL 60606 | | Chief
Administrative
Officer | | | 1988 | | | Managing Director (since 2002), and Assistant Secretary of Nuveen Securities, LLC; Managing Director (since 2004) and Assistant Secretary (since 1994) of Nuveen Investments, Inc.; Managing Director (since 2002), Assistant Secretary (since 1997) and Co-General Counsel (since 2011) of Nuveen Fund Advisors, LLC; Managing Director, Assistant Secretary and Associate General Counsel of Nuveen Asset Management, LLC (since 2011); Managing Director, Associate General Counsel and Assistant Secretary, of Symphony Asset Management LLC (since 2003); Vice President and Assistant Secretary of NWQ Investment Management Company, LLC (since 2002), Nuveen Investments Advisers Inc. (since 2002), Santa Barbara Asset Management, LLC (since 2006), and of Winslow Capital Management, LLC, (since 2010); Vice President and Assistant Secretary (since 2013), formerly, Chief Administrative Officer and Chief Compliance Officer (2006-2013) of Nuveen Commodities Asset Management, LLC; Chartered Financial Analyst. | | |
206 | | |
| nCEDRIC H. ANTOSIEWICZ | | | |
1962
333 W. Wacker Drive
Chicago, IL 60606 | |
Vice President | | | 2007 | | | Managing Director of Nuveen Securities, LLC. | | |
100 | | |
| nMARGO L. COOK | | | |
1964
333 W. Wacker Drive
Chicago, IL 60606 | |
Vice President | | | 2009 | | | Executive Vice President (since 2008) of Nuveen Investments, Inc. and of Nuveen Fund Advisors, LLC (since 2011); Managing Director-Investment Services of Nuveen Commodities Asset Management, LLC (since August 2011), previously, Head of Institutional Asset Management (2007-2008) of Bear Stearns Asset Management; Head of Institutional Asset Management (1986-2007) of Bank of NY Mellon; Chartered Financial Analyst. | | |
206 | | |
| nLORNA C. FERGUSON | | | |
1945
333 W. Wacker Drive
Chicago, IL 60606 | |
Vice President | | | 1998 | | | Managing Director (since 2005) of Nuveen Fund Advisors, LLC and Nuveen Securities, LLC (since 2004). | | |
206 | | |
Nuveen Investments
46
Name,
Year of Birth
& Address | | Position(s) Held
with the Funds | | Year First
Elected or
Appointed(3) | | Principal
Occupation(s)
During Past 5 Years | | Number
of Portfolios
in Fund Complex
Overseen by
Officer | |
Officers of the Funds (continued): | | | |
| nSTEPHEN D. FOY | | | |
1954
333 W. Wacker Drive
Chicago, IL 60606 | | Vice President and Controller | | | 1998 | | | Senior Vice President (2010-2011), formerly, Vice President (2005-2010) and Funds Controller of Nuveen Securities, LLC; Senior Vice President (since 2013), formerly, Vice President of Nuveen Fund Advisors, LLC; Chief Financial Officer of Nuveen Commodities Asset Management, LLC (since 2010); Certified Public Accountant. | | |
206 | | |
| nSCOTT S. GRACE | | | |
1970
333 W. Wacker Drive
Chicago, IL 60606 | | Vice President
and Treasurer | | | 2009 | | | Managing Director, Corporate Finance & Development, Treasurer (since 2009) of Nuveen Securities, LLC; Managing Director and Treasurer (since 2009) of Nuveen Fund Advisors, LLC, Nuveen Investments Advisers, Inc., Nuveen Investments Holdings Inc. and (since 2011) Nuveen Asset Management, LLC; Vice President and Treasurer of NWQ Investment Management Company, LLC, Tradewinds Global Investors, LLC, Symphony Asset Management LLC and Winslow Capital Management, LLC.; Vice President of Santa Barbara Asset Management, LLC; formerly, Treasurer (2006-2009), Senior Vice President (2008-2009), previously, Vice President (2006-2008) of Janus Capital Group, Inc.; formerly, Senior Associate in Morgan Stanley's Global Financial Services Group (2000-2003); Chartered Accountant Designation. | | |
206 | | |
| nWALTER M. KELLY | | | |
1970
333 W. Wacker Drive
Chicago, IL 60606 | | Chief Compliance Officer and
Vice President | | | 2003 | | | Senior Vice President (since 2008) of Nuveen Investment Holdings, Inc. | | |
206 | | |
| nTINA M. LAZAR | | | |
1961
333 W. Wacker Drive
Chicago, IL 60606 | |
Vice President | | | 2002 | | | Senior Vice President of Nuveen Investment Holdings, Inc. | | |
206 | | |
| nKEVIN J. MCCARTHY | | | |
1966
333 W. Wacker Drive
Chicago, IL 60606 | | Vice President
and Secretary | | | 2007 | | | Managing Director and Assistant Secretary (since 2008), Nuveen Securities, LLC; Managing Director (since 2008), Assistant Secretary (since 2007) and Co-General Counsel (since 2011) of Nuveen Fund Advisors, LLC; Managing Director, Assistant Secretary and Associate General Counsel (since 2011) of Nuveen Asset Management, LLC; Managing Director (since 2008), and Assistant Secretary, Nuveen Investment Holdings, Inc.; Vice President (since 2007) and Assistant Secretary of Nuveen Investments Advisers Inc., NWQ Investment Management Company, LLC, NWQ Holdings, LLC, Symphony Asset Management LLC, Santa Barbara Asset Management, LLC, and of Winslow Capital Management, LLC. (since 2010); Vice President and Secretary (since 2010) of Nuveen Commodities Asset Management, LLC. | | |
206 | | |
| nKATHLEEN L. PRUDHOMME | | | |
1953
901 Marquette Avenue
Minneapolis, MN 55402 | | Vice President and
Assistant Secretary | | | 2011 | | | Managing Director, Assistant Secretary and Co-General Counsel (since 2011) of Nuveen Fund Advisors, LLC; Managing Director, Assistant Secretary and Associate General Counsel (since 2011) of Nuveen Asset Management, LLC; Managing Director and Assistant Secretary (since 2011) of Nuveen Securities, LLC; formerly, Deputy General Counsel, FAF Advisors, Inc. (2004-2010). | | |
206 | | |
Nuveen Investments
47
Board Members & Officers (Unaudited) (continued)
Name,
Year of Birth
& Address | | Position(s) Held
with the Funds | | Year First
Elected or
Appointed(3) | | Principal
Occupation(s)
During Past 5 Years | | Number
of Portfolios
in Fund Complex
Overseen by
Officer | |
Officers of the Funds (continued): | | | |
| nJOEL T. SLAGER | | | |
1978
333 West Wacker Drive
Chicago, IL 60606 | | Vice President and
Assistant Secretary | | | 2013 | | | Fund Tax Director for Nuveen Funds (since May, 2013); previously, Vice President of Morgan Stanley Investment Management, Inc., Assistant Treasurer of the Morgan Stanley Funds (from 2010 to 2013); Tax Director at PricewaterhouseCoopers LLP (from 2008 to 2010). | | |
206 | | |
(1) The Board Members serve three year terms. The Board of Trustees is divided into three classes. Class I, Class II, and Class III, with each being elected to serve until the third succeeding annual shareholders' meeting subsequent to its election or thereafter in each case when its respective successors are duly elected or appointed. The first year elected or appointed represents the year in which the board member was first elected or appointed to any fund in the Nuveen Complex.
(2) "Interested person" as defined in the 1940 Act, by reason of his position with Nuveen Investments, Inc. and certain of its subsidiaries, which are affiliates of the Nuveen Funds.
(3) Officers serve one year terms through August of each year. The year first elected or appointed represents the year in which the Officer was first elected or appointed to any fund in the Nuveen Complex.
Nuveen Investments
48

Nuveen Investments:
Serving Investors for Generations
Since 1898, financial advisors and their clients have relied on Nuveen Investments to provide dependable investment solutions through continued adherence to proven, long-term investing principles. Today, we offer a range of high quality equity and fixed-income solutions designed to be integral components of a well-diversified core portfolio.
Focused on meeting investor needs.
Nuveen Investments provides high-quality investment services designed to help secure the long-term goals of institutional and individual investors as well as the consultants and financial advisors who serve them. Nuveen Investments markets a wide range of specialized investment solutions which provide investors access to capabilities of its high-quality boutique investment affiliates—Nuveen Asset Management, Symphony Asset Management, NWQ Investment Management Company, Santa Barbara Asset Management, Tradewinds Global Investors, Winslow Capital Management and Gresham Investment Management. In total, Nuveen Investments managed approximately $215 billion as of September 30, 2013.
Find out how we can help you.
To learn more about how the products and services of Nuveen Investments may be able to help you meet your financial goals, talk to your financial advisor, or call us at (800) 257-8787. Please read the information provided carefully before you invest. Investors should consider the investment objective and policies, risk considerations, charges and expenses of any investment carefully. Where applicable, be sure to obtain a prospectus, which contains this and other relevant information. To obtain a prospectus, please contact your securities representative or Nuveen Investments, 333 W. Wacker Dr., Chicago, IL 60606. Please read the prospectus carefully before you invest or send money.
Learn more about Nuveen Funds at: www.nuveen.com/cef
Distributed by Nuveen Securities, LLC | 333 West Wacker Drive | Chicago, IL 60606 | www.nuveen.com/cef
ITEM 2. CODE OF ETHICS.
As of the end of the period covered by this report, the registrant has adopted a code of ethics that applies to the registrant’s principal executive officer, principal financial officer, principal accounting officer or controller, or persons performing similar functions. There were no amendments to or waivers from the Code during the period covered by this report. The registrant has posted the code of ethics on its website at www.nuveen.com/CEF/Shareholder/FundGovernance.aspx. (To view the code, click on Code of Conduct.)
ITEM 3. AUDIT COMMITTEE FINANCIAL EXPERT.
The registrant’s Board of Directors or Trustees (“Board”) determined that the registrant has at least one “audit committee financial expert” (as defined in Item 3 of Form N-CSR) serving on its Audit Committee. The registrant’s audit committee financial expert is Carole E. Stone, who is “independent” for purposes of Item 3 of Form N-CSR.
Ms. Stone served for five years as Director of the New York State Division of the Budget. As part of her role as Director, Ms. Stone was actively involved in overseeing the development of the State’s operating, local assistance and capital budgets, its financial plan and related documents; overseeing the development of the State’s bond-related disclosure documents and certifying that they fairly presented the State’s financial position; reviewing audits of various State and local agencies and programs; and coordinating the State’s system of internal audit and control. Prior to serving as Director, Ms. Stone worked as a budget analyst/examiner with increasing levels of responsibility over a 30 year period, including approximately five years as Deputy Budget Director. Ms. Stone has also served as Chair of the New York State Racing Association Oversight Board, as Chair of the Public Authorities Control Board, as a Commissioner on the New York State Commission on Public Authority Reform and as a member of the Boards of Directors of several New York State public authorities. These positions have involved overseeing operations and finances of certain entities and assessing the adequacy of project/entity financing and financial reporting. Currently, Ms. Stone is on the Board of Directors of CBOE Holdings, Inc., of the Chicago Board Options Exchange, and of C2 Options Exchange. Ms. Stone’s position on the boards of these entities and as a member of both CBOE Holdings’ Audit Committee and its Finance Committee has involved, among other things, the oversight of audits, audit plans and preparation of financial statements.
ITEM 4. PRINCIPAL ACCOUNTANT FEES AND SERVICES.
Nuveen Real Asset Income and Growth Fund
The following tables show the amount of fees that Ernst & Young LLP, the Fund’s auditor, billed to the Fund during the Fund’s last two full fiscal years. For engagements with Ernst & Young LLP the Audit Committee approved in advance all audit services and non-audit services that Ernst & Young LLP provided to the Fund, except for those non-audit services that were subject to the pre-approval exception under Rule 2-01 of Regulation S-X (the “pre-approval exception”). The pre-approval exception for services provided directly to the Fund waives the pre-approval requirement for services other than audit, review or attest services if: (A) the aggregate amount of all such services provided constitutes no more than 5% of the total amount of revenues paid by the Fund to its accountant during the fiscal year in which the services are provided; (B) the Fund did not recognize the services as non-audit services at the time of the engagement; and (C) the services are promptly brought to the Audit Committee’s attention, and the Committee (or its delegate) approves the services before the audit is completed.
The Audit Committee has delegated certain pre-approval responsibilities to its Chairman (or, in his absence, any other member of the Audit Committee).
SERVICES THAT THE FUND’S AUDITOR BILLED TO THE FUND
| | Audit Fees Billed | | Audit-Related Fees | | Tax Fees | | All Other Fees | |
Fiscal Year Ended | | to Fund (1) | | Billed to Fund (2) | | Billed to Fund (3) | | Billed to Fund (4) | |
December 31, 2013 | | $ | 25,300 | | $ | 0 | | $ | 5,200 | | $ | 0 | |
| | | | | | | | | |
Percentage approved pursuant to pre-approval exception | | 0 | % | 0 | % | 0 | % | 0 | % |
| | | | | | | | | |
December 31, 2012 | | $ | 20,250 | | $ | 6,000 | | $ | 500 | | $ | 0 | |
| | | | | | | | | |
Percentage approved pursuant to pre-approval exception | | 0 | % | 0 | % | 0 | % | 0 | % |
(1) “Audit Fees” are the aggregate fees billed for professional services for the audit of the Fund’s annual financial statements and services provided in connection with statutory and regulatory filings or engagements.
(2) “Audit Related Fees” are the aggregate fees billed for assurance and related services reasonably related to the performance of the audit or review of financial statements that are not reported under “Audit Fees”. These fees include offerings related to the Fund’s common shares and leverage.
(3) “Tax Fees” are the aggregate fees billed for professional services for tax advice, tax compliance, and tax planning. These fees include: all global withholding tax services; excise and state tax reviews; capital gain, tax equalization and taxable basis calculation performed by the principal accountant.
(4) “All Other Fees” are the aggregate fees billed for products and services other than “Audit Fees”, “Audit-Related Fees” and “Tax Fees”. These fees represent all “Agreed-Upon Procedures” engagements pertaining to the Fund’s use of leverage.
SERVICES THAT THE FUND’S AUDITOR BILLED TO THE
ADVISER AND AFFILIATED FUND SERVICE PROVIDERS
The following tables show the amount of fees billed by Ernst & Young LLP to Nuveen Fund Advisors, LLC (formerly Nuveen Fund Advisors, Inc.) (the “Adviser”), and any entity controlling, controlled by or under common control with the Adviser that provides ongoing services to the Fund (“Affiliated Fund Service Provider”), for engagements directly related to the Fund’s operations and financial reporting, during the Fund’s last two full fiscal years.
The tables also show the percentage of fees subject to the pre-approval exception. The pre-approval exception for services provided to the Adviser and any Affiliated Fund Service Provider (other than audit, review or attest services) waives the pre-approval requirement if: (A) the aggregate amount of all such services provided constitutes no more than 5% of the total amount of revenues paid to Ernst & Young LLP by the Fund, the Adviser and Affiliated Fund Service Providers during the fiscal year in which the services are provided that would have to be pre-approved by the Audit Committee; (B) the Fund did not recognize the services as non-audit services at the time of the engagement; and (C) the services are promptly brought to the Audit Committee’s attention, and the Committee (or its delegate) approves the services before the Fund’s audit is completed.
| | Audit-Related Fees | | Tax Fees Billed to | | All Other Fees | |
| | Billed to Adviser and | | Adviser and | | Billed to Adviser | |
| | Affiliated Fund | | Affiliated Fund | | and Affiliated Fund | |
Fiscal Year Ended | | Service Providers | | Service Providers | | Service Providers | |
December 31, 2013 | | $ | 0 | | $ | 0 | | $ | 0 | |
| | | | | | | |
Percentage approved pursuant to pre-approval exception | | 0 | % | 0 | % | 0 | % |
| | | | | | | |
December 31, 2012 | | $ | 0 | | $ | 0 | | $ | 0 | |
| | | | | | | |
Percentage approved pursuant to pre-approval exception | | 0 | % | 0 | % | 0 | % |
NON-AUDIT SERVICES
The following table shows the amount of fees that Ernst & Young LLP billed during the Fund’s last two full fiscal years for non-audit services. The Audit Committee is required to pre-approve non-audit services that Ernst & Young LLP provides to the Adviser and any Affiliated Fund Services Provider, if the engagement related directly to the Fund’s operations and financial reporting (except for those subject to the pre-approval exception described above). The Audit Committee requested and received information from Ernst & Young LLP about any non-audit services that Ernst & Young LLP rendered during the Fund’s last fiscal year to the Adviser and any Affiliated Fund Service Provider. The Committee considered this information in evaluating Ernst & Young LLP’s independence.
| | | | | | | | | |
| | | | Total Non-Audit Fees | | | | | |
| | | | billed to Adviser and | | | | | |
| | | | Affiliated Fund Service | | Total Non-Audit Fees | | | |
| | | | Providers (engagements | | billed to Adviser and | | | |
| | | | related directly to the | | Affiliated Fund Service | | | |
| | Total Non-Audit Fees | | operations and financial | | Providers (all other | | | |
Fiscal Year Ended | | Billed to Fund | | reporting of the Fund) | | engagements) | | Total | |
December 31, 2013 | | $ | 5,200 | | $ | 0 | | $ | 0 | | $ | 5,200 | |
December 31, 2012 | | $ | 500 | | $ | 0 | | $ | 0 | | $ | 500 | |
“Non-Audit Fees billed to Fund” for both fiscal year ends represent “Tax Fees” and “All Other Fees” billed to Fund in their respective amounts from the previous table.
Less than 50 percent of the hours expended on the principal accountant’s engagement to audit the registrant’s financial statements for the most recent fiscal year were attributed to work performed by persons other than the principal accountant’s full-time, permanent employees.
Audit Committee Pre-Approval Policies and Procedures. Generally, the Audit Committee must approve (i) all non-audit services to be performed for the Fund by the Fund’s independent accountants and (ii) all audit and non-audit services to be performed by the Fund’s independent accountants for the Affiliated Fund Service Providers with respect to operations and financial reporting of the Fund. Regarding tax and research projects conducted by the independent accountants for the Fund and Affiliated Fund Service Providers (with respect to operations and financial reports of the Fund) such engagements will be (i) pre-approved by the Audit Committee if they are expected to be for amounts greater than $10,000; (ii) reported to the Audit Committee chairman for his verbal approval prior to engagement if they are expected to be for amounts under $10,000 but greater than $5,000; and (iii) reported to the Audit Committee at the next Audit Committee meeting if they are expected to be for an amount under $5,000.
ITEM 5. AUDIT COMMITTEE OF LISTED REGISTRANTS.
The registrant’s Board has a separately designated Audit Committee established in accordance with Section 3(a)(58)(A) of the Securities Exchange Act of 1934, as amended (15 U.S.C. 78c(a)(58)(A)). The members of the audit committee are Robert P. Bremner, Jack B. Evans, David J. Kundert, Carole E. Stone and Terence J. Toth.
ITEM 6. SCHEDULE OF INVESTMENTS.
(a) See Portfolio of Investments in Item 1.
(b) Not applicable.
ITEM 7. DISCLOSURE OF PROXY VOTING POLICIES AND PROCEDURES FOR CLOSED-END MANAGEMENT INVESTMENT COMPANIES.
Nuveen Fund Advisors, LLC, formerly known as Nuveen Fund Advisors, Inc., is the registrant’s investment adviser (also referred to as the “Adviser”). The Adviser is responsible for the on-going monitoring of the Fund’s investment portfolio, managing the Fund’s business affairs and providing certain clerical, bookkeeping and administrative services. The Adviser has engaged Nuveen Asset Management, LLC (“Sub-Adviser”) as Sub-Adviser to provide discretionary investment advisory services. As part of these services, the Adviser has delegated to the Sub-Adviser the full responsibility for proxy voting on securities held in the registrant’s portfolio and related duties in accordance with the Sub-Adviser’s policies and procedures. The Adviser periodically monitors the Sub-Adviser’s voting to ensure that it is carrying out its duties. The Sub-Adviser’s proxy voting policies and procedures are attached to this filing as an exhibit and incorporated herein by reference.
ITEM 8. PORTFOLIO MANAGERS OF CLOSED-END MANAGEMENT INVESTMENT COMPANIES.
Nuveen Fund Advisors, LLC, formerly known as Nuveen Fund Advisors, Inc. (“NFALLC”), is the registrant’s investment adviser (NFALLC is also referred to as the “Adviser”). NFALLC is responsible for the selection and on-going monitoring of the Fund’s investment portfolio, managing the Fund’s business affairs and providing certain clerical, bookkeeping and administrative services. The Adviser has engaged Nuveen Asset Management, LLC (“Nuveen Asset Management” or “Sub-Adviser”), as Sub-Adviser to provide discretionary investment advisory services. The following section provides information on the portfolio manager at the Sub-Adviser:
NUVEEN ASSET MANAGEMENT
Item 8(a)(1). PORTFOLIO MANAGER BIOGRAPHIES
The following individuals have primary responsibility for the day-to-day implementation of the registrant’s investment strategies:
Name |
Jay L. Rosenberg |
John G. Wenker |
Jeffrey T. Schmitz |
Jay L. Rosenberg, Managing Director at Nuveen Asset Management, is the lead manager of the Fund. He began working with infrastructure and real estate assets in 1995. In 2005, he joined FAF Advisors, Inc. (“FAF”), which was acquired by Nuveen Investments on January 1, 2011. While at FAF, he was the creator and primary portfolio manager of the Global Infrastructure product and co-lead manager of the Real Estate Securities product.
John G. Wenker, Managing Director at Nuveen Asset Management, is a co-manager of the Fund. Mr. Wenker serves in strategic roles as head of the Real Assets Investment Team, which includes the firm’s Real Estate product and its Global Infrastructure strategy. He joined FAF in 1992 as a managing director of the Fixed Income department. He was responsible for the investment process and performance of the Real Estate Securities team, a lead manager of the Real Estate Debt product and co-lead manager of the Real Estate Securities product, co-portfolio manager of the Global Infrastructure product and a member of the Asset Allocation Committee.
Jeffrey T. Schmitz, CFA, Vice President at Nuveen Asset Management, is a co-manager of the Fund and the Nuveen Real Asset Income Fund and Nuveen High Income Bond Fund. Mr. Schmitz is a member of the High-Yield Credit and the Emerging Markets Sector Teams. He conducts credit analysis and monitors credit quality for debt securities, focusing on energy, healthcare and pharmaceuticals, technology, and emerging market corporates. Prior to joining FAF in 2006, Mr. Schmitz worked as a senior credit research analyst at Deephaven Capital Management, as a trading risk manager at Cargill Financial Services, and in various risk oversight roles with the Office of the Comptroller of the Currency. He holds the Chartered Financial Analyst designation and is a member of the CFA Institute, as well as the CFA Society of Minnesota.
Item 8(a)(2). OTHER ACCOUNTS MANAGED BY PORTFOLIO MANAGERS
In addition to managing the registrant, the portfolio managers are also primarily responsible for the day-to-day portfolio management of the following accounts:
Portfolio Manager | | Type of Account
Managed | | Number of
Accounts | | Assets* | | Number of
Accounts
with
Performance
Based Fees | | Assets in
Accounts
with
Performance
Based Fees* | |
Jay Rosenberg | | Registered Investment Company | | 5 | | $ | 5.7 billion | | 0 | | $ | 0 | |
| | Other Pooled Investment Vehicles | | 6 | | $ | 970.3 million | | 0 | | $ | 0 | |
| | Other Accounts | | 9 | | $ | 431 million | | 0 | | $ | 0 | |
| | | | | | | | | | | |
John Wenker | | Registered Investment Company | | 8 | | $ | 5.9 billion | | 0 | | $ | 0 | |
| | Other Pooled Investment Vehicles | | 6 | | $ | 970.3 million | | 0 | | $ | 0 | |
| | Other Accounts | | 9 | | $ | 431 million | | 0 | | $ | 0 | |
| | | | | | | | | | | |
Jeffrey Schmitz | | Registered Investment Company | | 2 | | $ | 960 million | | 0 | | $ | 0 | |
| | Other Pooled Investment Vehicles | | 0 | | $ | 0 | | 0 | | $ | 0 | |
| | Other Accounts | | 0 | | $ | 0 | | 0 | | $ | 0 | |
* Assets are as of December 31, 2013.
POTENTIAL MATERIAL CONFLICTS OF INTEREST
Actual or apparent conflicts of interest may arise when a portfolio manager has day-to-day management responsibilities with respect to more than one account. More specifically, portfolio managers who manage multiple accounts are presented a number of potential conflicts, including, among others, those discussed below.
The management of multiple accounts may result in a portfolio manager devoting unequal time and attention to the management of each account. Nuveen Asset Management seeks to manage such competing interests for the time and attention of portfolio managers by having portfolio managers focus on a particular investment discipline. Most accounts managed by a portfolio manager in a particular investment strategy are managed using the same investment models.
If a portfolio manager identifies a limited investment opportunity which may be suitable for more than one account, an account may not be able to take full advantage of that opportunity due to an allocation of filled purchase or sale orders across all eligible accounts. To deal with these situations, Nuveen Asset Management has adopted procedures for allocating limited opportunities across multiple accounts.
With respect to many of its clients’ accounts, Nuveen Asset Management determines which broker to use to execute transaction orders, consistent with its duty to seek best execution of the transaction. However, with respect to certain other accounts, Nuveen Asset Management may be limited by the client with respect to the selection of brokers or may be instructed to direct trades through a particular broker. In these cases, Nuveen Asset Management may place separate, non-simultaneous, transactions for a Fund and other accounts which may temporarily affect the market price of the security or the execution of the transaction, or both, to the detriment of the Fund or the other accounts.
Some clients are subject to different regulations. As a consequence of this difference in regulatory requirements, some clients may not be permitted to engage in all the investment techniques or transactions or to engage in these transactions to the same extent as the other accounts managed by the portfolio manager. Finally, the appearance of a conflict of interest may arise where Nuveen Asset Management has an incentive, such as a performance-based management fee, which relates to the management of some accounts, with respect to which a portfolio manager has day-to-day management responsibilities.
Nuveen Asset Management has adopted certain compliance procedures which are designed to address these types of conflicts common among investment managers. However, there is no guarantee that such procedures will detect each and every situation in which a conflict arises.
Item 8(a)(3). FUND MANAGER COMPENSATION
Portfolio manager compensation consists primarily of base pay, an annual cash bonus and long term incentive payments.
Base pay. Base pay is determined based upon an analysis of the portfolio manager’s general performance, experience, and market levels of base pay for such position.
Annual cash bonus. The Fund’s portfolio managers are eligible for an annual cash bonus based on investment performance, qualitative evaluation and financial performance of Nuveen Asset Management.
A portion of each portfolio manager’s annual cash bonus is based on the Fund’s investment performance, generally measured over the past one- and three or five-year periods unless the portfolio manager’s tenure is shorter. Investment performance for the Fund generally is determined by evaluating the Fund’s performance relative to its benchmark(s) and/or Lipper industry peer group.
A portion of the cash bonus is based on a qualitative evaluation made by each portfolio manager’s supervisor taking into consideration a number of factors, including the portfolio manager’s team collaboration, expense management, support of personnel responsible for asset growth, and his or her compliance with Nuveen Asset Management’s policies and procedures.
The final factor influencing a portfolio manager’s cash bonus is the financial performance of Nuveen Asset Management based on its operating earnings.
Long-term incentive compensation. Certain key employees of Nuveen Investments and its affiliates, including certain portfolio managers, have received equity interests in the parent company of Nuveen Investments. In addition, certain key employees of Nuveen Asset Management, including certain portfolio managers, have received profits interests in Nuveen Asset Management which entitle their holders to participate in the firm’s growth over time.
There are generally no differences between the methods used to determine compensation with respect to the Fund and the Other Accounts shown in the table above.
Item 8(a)(4). OWNERSHIP OF JRI SECURITIES AS OF DECEMBER 31, 2013
Name of Portfolio
Manager | | None | | $1 -
$10,000 | | $10,001-
$50,000 | | $50,001-
$100,000 | | $100,001-
$500,000 | | $500,001-
$1,000,000 | | Over
$1,000,000 | |
Jay Rosenberg | | | | | | | | X | | | | | | | |
John Wenker | | | | | | | | | | X | | | | | |
Jeffrey Schmitz | | | | | | | | X | | | | | | | |
ITEM 9. PURCHASES OF EQUITY SECURITIES BY CLOSED-END MANAGEMENT INVESTMENT COMPANY AND AFFILIATED PURCHASERS.
Not applicable.
ITEM 10. SUBMISSION OF MATTERS TO A VOTE OF SECURITY HOLDERS.
There have been no material changes to the procedures by which shareholders may recommend nominees to the registrant’s Board implemented after the registrant last provided disclosure in response to this Item.
ITEM 11. CONTROLS AND PROCEDURES.
(a) | The registrant’s principal executive and principal financial officers, or persons performing similar functions, have concluded that the registrant’s disclosure controls and procedures (as defined in Rule 30a-3(c) under the Investment Company Act of 1940, as amended (the “1940 Act”) (17 CFR 270.30a-3(c))) are effective, as of a date within 90 days of the filing date of this report that includes the disclosure required by this paragraph, based on their evaluation of the controls and procedures required by Rule 30a-3(b) under the 1940 Act (17 CFR 270.30a-3(b)) and Rules 13a-15(b) or 15d-15(b) under the Securities Exchange Act of 1934, as amended (the “Exchange Act”) (17 CFR 240.13a-15(b) or 240.15d-15(b)). |
| |
(b) | There were no changes in the registrant’s internal control over financial reporting (as defined in Rule 30a-3(d) under the 1940 Act (17 CFR 270.30a-3(d)) that occurred during the second fiscal quarter of the period covered by this report that has materially affected, or is reasonably likely to materially affect, the registrant’s internal control over financial reporting. |
ITEM 12. EXHIBITS.
File the exhibits listed below as part of this Form.
(a)(1) Any code of ethics, or amendment thereto, that is the subject of the disclosure required by Item 2, to the extent that the registrant intends to satisfy the Item 2 requirements through filing of an exhibit: Not applicable because the code is posted on registrant’s website at www.nuveen.com/CEF/Shareholder/FundGovernance.aspx and there were no amendments during the period covered by this report. (To view the code, click on Code of Conduct.)
(a)(2) A separate certification for each principal executive officer and principal financial officer of the registrant as required by Rule 30a-2(a) under the 1940 Act (17 CFR 270.30a-2(a)) in the exact form set forth below: Ex-99.CERT Attached hereto.
(a)(3) Any written solicitation to purchase securities under Rule 23c-1 under the 1940 Act (17 CFR 270.23c-1) sent or given during the period covered by the report by or on behalf of the registrant to 10 or more persons. Not applicable.
(b) If the report is filed under Section 13(a) or 15(d) of the Exchange Act, provide the certifications required by Rule 30a-2(b) under the 1940 Act (17 CFR 270.30a-2(b)); Rule 13a-14(b) or Rule 15d-14(b) under the Exchange Act (17 CFR 240.13a-14(b) or 240.15d-14(b)), and Section 1350 of Chapter 63 of Title 18 of the United States Code (18 U.S.C. 1350) as an exhibit. A certification furnished pursuant to this paragraph will not be deemed “filed” for purposes of Section 18 of the Exchange Act (15 U.S.C. 78r), or otherwise subject to the liability of that section. Such certification will not be deemed to be incorporated by reference into any filing under the Securities Act of 1933 or the Exchange Act, except to the extent that the registrant specifically incorporates it by reference. Ex-99.906 CERT attached hereto.
SIGNATURES
Pursuant to the requirements of the Securities Exchange Act of 1934 and the Investment Company Act of 1940, the registrant has duly caused this report to be signed on its behalf by the undersigned, thereunto duly authorized.
(Registrant) Nuveen Real Asset Income and Growth Fund
By (Signature and Title) | /s/ Kevin J. McCarthy | |
| Kevin J. McCarthy | |
| Vice President and Secretary | |
Date: March 6, 2014
Pursuant to the requirements of the Securities Exchange Act of 1934 and the Investment Company Act of 1940, this report has been signed below by the following persons on behalf of the registrant and in the capacities and on the dates indicated.
By (Signature and Title) | /s/ Gifford R. Zimmerman | |
| Gifford R. Zimmerman | |
| Chief Administrative Officer | |
| (principal executive officer) | |
Date: March 6, 2014
By (Signature and Title) | /s/ Stephen D. Foy | |
| Stephen D. Foy | |
| Vice President and Controller | |
| (principal financial officer) | |
Date: March 6, 2014