Nuveen Real Asset Income and Growth Fund (JRI)
Filed: 28 Mar 12, 12:00am

March 29, 2012
Kieran G. Brown
Senior Counsel
Division of Investment Management
Securities and Exchange Commission
100 F Street, N.E.
Washington, D.C. 20549
Dear Mr. Brown:
Nuveen Real Asset Income and Growth Fund (333-179180; 811-22658)
In connection with the SEC comment response correspondence filed on March 23, 2012, regarding the above captioned fund, due to an oversight the supporting materials referenced within the response letter were not attached to the filing. Please find those supporting materials attached hereto.
If you should require additional information or need anything further, please call me at 312.807.4295 or Fatima Sulaiman at 202.778.9082.
Very truly yours,
/s/ David P. Glatz
David P. Glatz

Institutional Investor Themes: Real Assets Jeremy King, Asset Management Insights | May 23, 2011, 5:19 PM | 1,640 | Share 17 0 AAA A few weeks ago I published my Top 5 Institutional Investor Themes on Business Insider. Number one on the list was an increasing allocation to real assets driven in part by an uncertain inflationary outlook, by concern over the debasement of fiat currencies and government manipulation of financial asset prices generally. Since that post, the World Economic Forum (WEF) has published its Future of Long Term Investing report and the investment consulting firm Casey Quirk (together with eVestment Alliance) has published its annual consultant survey, both of which confirm this trend. I want look more closely at the characteristics, benefits and risks of the asset class, consider how to implement an allocation within a portfolio and provide some references to good source material. Overview The data is mixed, the inflation outlook is clouded, portfolio construction is evolving and institutional investors are increasing their allocations to real assets Real assets can provide strong total returns, solid diversification and inflation protection Allocations should be made stand-alone and comprise a portion of fixed income, equities and alternative buckets Derivative strategies can minimize the risk of unexpected ‘fat tail’ inflation Jeremy King Jeremy King is an asset management executive with deep experience structuring, marketing and distributing investment solutions to institutional clients and key wirehouses globally. Recent Posts Strategic Marketing: A 7 Point Plan to Keep Your Brand on its. How the “Crisis Effect” Has Fundamentally Altered Investor Behavior ESG: An Idea Whose Time Has Come Jeremy King ASSET MANAGEMENT INSIGHTS Building a Pension Funding Bridge Across the Atlantic Pension Funds Under Water on Both Sides of the Pond Top 10 Thought Leaders What Are Real Assets? Real assets are characterized by their physical/ tangible form, a strong correlation to inflation and a high degree of illiquidity. Real assets are often described as ‘hard assets’ having intrinsic value or ‘value in use’ that can be contrasted with financial assets, such as equities, bonds and options that derive their value from contractual claims, as well as ‘soft commodities’, that are perishable and consumable (e.g. agriculturals and livestock). Real assets are also generally significantly more illiquid than financial assets: e.g. it is more challenging to offload an interest in a piece of commercial real estate than it is a portfolio of blue chip stocks. Examples of real assets include: real estate Timber other ‘hard’ commodities such as oil and gas and infrastructure. In addition to this list the WEF adds intellectual property, specifically patents, which seems very odd as intellectual property is an intangible asset by definition. Meanwhile, Treasury Inflation-Protected Inflation Securities (TIPS) are also often considered a real asset. Ultimately the only sense in which TIPS are ‘real’ is that they are inflation-adjusted. TIPS are bonds issued by the U.S. Treasury with a financially engineered link to the level of consumer price inflation. TIPS deserve a position in investors’ portfolios but should ultimately be considered a financial asset that is subject to sovereign risk.
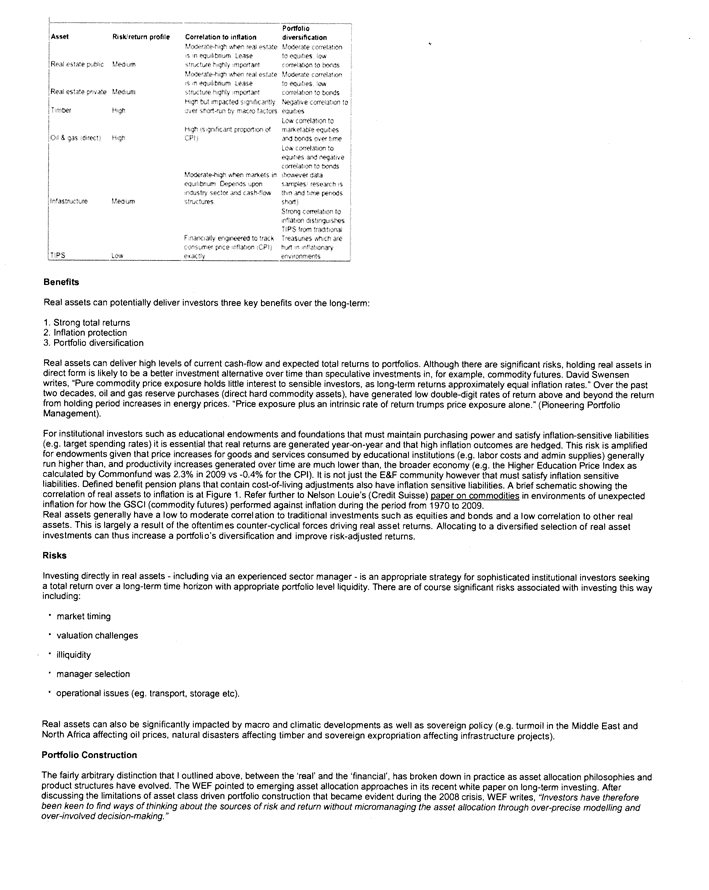
Asset Risk/return profile Correlation to inflation Portfolio diversification Real estate public Medium Moderate-high when real estate is in equilibrium. Lease structure highly important. Moderate correlation to equities, low correlation to bonds Real estate private Medium Moderate-high when real estate is in equilibrium. Lease structure highly important. Moderate correlation to equities, low correlation to bonds Timber High High but impacted significantly over short-run by macro factors Negative correlation to equities Oil & gas (direct) High High (significant proportion of CPI) Low correlation to marketable equities and bonds over time Infrastructure Medium Moderate-high when markets in equilibrium. Depends upon industry sector and cash-flow structures. Low correlation to equities and negative correlation to bonds (however data samples/research is thin and time periods short) TIPS Low Financially engineered to track consumer price inflation (CPI) exactly Strong correlation to inflation distinguishes TIPS from traditional Treasuries which are hurt in inflationary environments Benefits Real assets can potentially deliver investors three key benefits over the long-term: 1. Strong total returns 2. Inflation protection 3. Portfolio diversification Real assets can deliver high levels of current cash-flow and expected total returns to portfolios. Although there are significant risks, holding real assets in direct form is likely to be a better investment alternative over time than speculative investments in, for example, commodity futures. David Swensen writes, “Pure commodity price exposure holds little interest to sensible investors, as long-term returns approximately equal inflation rates.” Over the past two decades, oil and gas reserve purchases (direct hard commodity assets), have generated low double-digit rates of return above and beyond the return from holding period increases in energy prices. “Price exposure plus an intrinsic rate of return trumps price exposure alone.” (Pioneering Portfolio Management). For institutional investors such as educational endowments and foundations that must maintain purchasing power and satisfy inflation-sensitive liabilities (e.g. target spending rates) it is essential that real returns are generated year-on-year and that high inflation outcomes are hedged. This risk is amplified for endowments given that price increases for goods and services consumed by educational institutions (e.g. labor costs and admin supplies) generally run higher than, and productivity increases generated over time are much lower than, the broader economy (e.g. the Higher Education Price Index as calculated by Common fund was 2.3% in 2009 vs -0.4% for the CPI). It is not just the E&F community however that must satisfy inflation sensitive liabilities. Defined benefit pension plans that contain cost-of-living adjustments also have inflation sensitive liabilities. A brief schematic showing the correlation of real assets to inflation is at Figure 1. Refer further to Nelson Louie’s (Credit Suisse) paper on commodities in environments of unexpected inflation for how the GSCI (commodity futures) performed against inflation during the period from 1970 to 2009. Real assets generally have a low to moderate correlation to traditional investments such as equities and bonds and a low correlation to other real assets. This is largely a result of the oftentimes counter-cyclical forces driving real asset returns. Allocating to a diversified selection of real asset investments can thus increase a portfolio’s diversification and improve risk-adjusted returns. Risks Investing directly in real assets—including via an experienced sector manager—is an appropriate strategy for sophisticated institutional investors seeking a total return over a long-term time horizon with appropriate portfolio level liquidity. There are of course significant risks associated with investing this way including: market timing valuation challenges illiquidity manager selection operational issues (eg. transport, storage etc). Real assets can also be significantly impacted by macro and climatic developments as well as sovereign policy (e.g. turmoil in the Middle East and North Africa affecting oil prices, natural disasters affecting timber and sovereign expropriation affecting infrastructure projects). Portfolio Construction The fairly arbitrary distinction that I outlined above, between the ‘real’ and the ‘financial’, has broken down in practice as asset allocation philosophies and product structures have evolved. The WEF pointed to emerging asset allocation approaches in its recent white paper on long-term investing. After discussing the limitations of asset class driven portfolio construction that became evident during the 2008 crisis, WEF writes, “Investors have therefore been keen to find ways of thinking about the sources of risk and return without micromanaging the asset allocation through over-precise modelling and over-involved decision-making.”
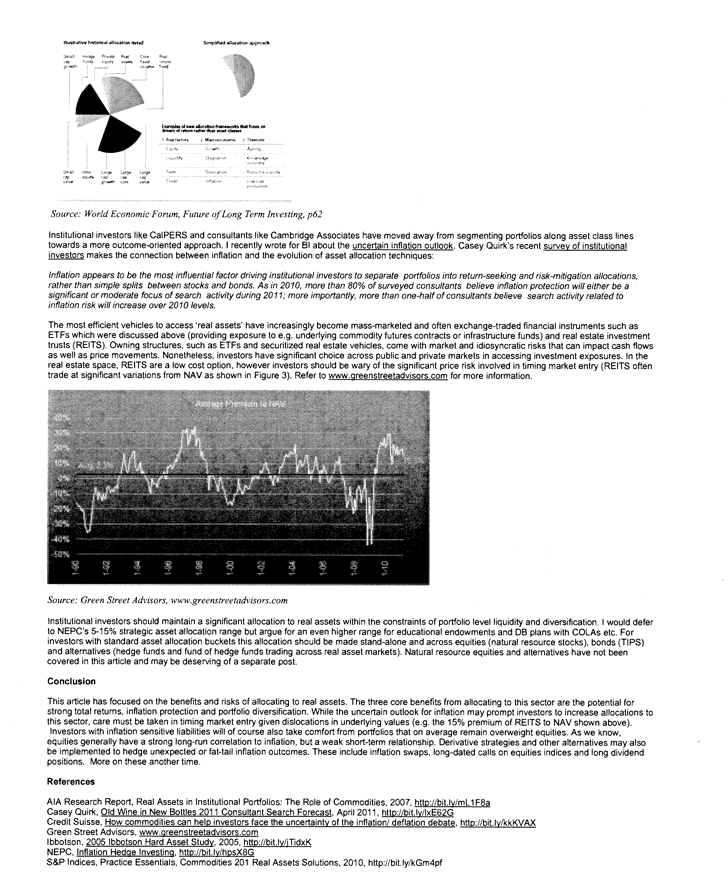
Illustrative historical allocation detail Small cap growth Hedge funds Private equity Real assets Core fixed income Real return fixed Small cap value Intnl equity Large cap growth Large cap core Large cap value Simplified allocation approach Examples of new allocation frameworks that focus on drivers of return rather than asset classes 1. Risk factors 2. Macroeconomic 3. Thematic Equity Growth Ageing Liquidity Stagnation Knowledge economy Term Dislocation Resource scarcity Credit Inflation Low-cost production Source: World Economic Forum, Future of Long Term Investing, p62 Institutional investors like CalPERS and consultants like Cambridge Associates have moved away from segmenting portfolios along asset class lines towards a more outcome-oriented approach. I recently wrote for BI about the uncertain inflation outlook. Casey Quirk’s recent survey of institutional investors makes the connection between inflation and the evolution of asset allocation techniques: Inflation appears to be the most influential factor driving institutional investors to separate portfolios into return-seeking and risk-mitigation allocations, rather than simple splits between stocks and bonds. As in 2010, more than 80% of surveyed consultants believe inflation protection will either be a significant or moderate focus of search activity during 2011; more importantly, more than one-half of consultants believe search activity related to inflation risk will increase over 2010 levels. The most efficient vehicles to access ‘real assets’ have increasingly become mass-marketed and often exchange-traded financial instruments such as ETFs which were discussed above (providing exposure to e.g. underlying commodity futures contracts or infrastructure funds) and real estate investment trusts (REITS). Owning structures, such as ETFs and securitized real estate vehicles, come with market and idiosyncratic risks that can impact cash flows as well as price movements. Nonetheless, investors have significant choice across public and private markets in accessing investment exposures. In the real estate space, REITS are a low cost option, however investors should be wary of the significant price risk involved in timing market entry (REITS often trade at significant variations from NAV as shown in Figure 3). Refer to www.greenstreetadvisors.com for more information. Average Premium to NAV Source: Green Street Advisors, www.greenstreetadvisors.com Institutional investors should maintain a significant allocation to real assets within the constraints of portfolio level liquidity and diversification. I would defer to NEPC’s 5-15% strategic asset allocation range but argue for an even higher range for educational endowments and DB plans with COLAs etc. For investors with standard asset allocation buckets this allocation should be made stand-alone and across equities (natural resource stocks), bonds (TIPS) and alternatives (hedge funds and fund of hedge funds trading across real asset markets). Natural resource equities and alternatives have not been covered in this article and may be deserving of a separate post. Conclusion This article has focused on the benefits and risks of allocating to real assets. The three core benefits from allocating to this sector are the potential for strong total returns, inflation protection and portfolio diversification. While the uncertain outlook for inflation may prompt investors to increase allocations to this sector, care must be taken in timing market entry given dislocations in underlying values (e.g. the 15% premium of REITS to NAV shown above). Investors with inflation sensitive liabilities will of course also take comfort from portfolios that on average remain overweight equities. As we know, equities generally have a strong long-run correlation to inflation, but a weak short-term relationship. Derivative strategies and other alternatives may also be implemented to hedge unexpected or fat-tail inflation outcomes. These include inflation swaps, long-dated calls on equities indices and long dividend positions. More on these another time. References AIA Research Report, Real Assets in Institutional Portfolios: The Role of Commodities, 2007, http://bit.ly/mL1F8a Casey Quirk, Old Wine in New Bottles 2011 Consultant Search Forecast, April 2011, http://bit.ly/lxE62G Credit Suisse, How commodities can help investors face the uncertainty of the inflation/ deflation debate, http://bit.ly/kkKVAX Green Street Advisors, www.greenstreetadvisors.com Ibbotson, 2005 Ibbotson Hard Asset Study, 2005, http://bit.ly/jTidxK NEPC, Inflation Hedge Investing, http://bit.ly/hpsX8G S&P Indices, Practice Essentials, Commodities 201 Real Assets Solutions, 2010, http://bit.ly/kGm4pf

David Swensen, Pioneering Portfolio Management, Free Press, 2000, 2009 World Economic Forum, The Future of Long Term Investing, 2011, http://bit.ly/mbt4bT Please follow Money Game on Twitter and Facebook. Short URL http://read.bi/lN4wqj Share: Twitter Facebook Buzz Digg StumbleUpon Reddit LinkedIn Email Embed Alerts Newsletter Comments on this post are now closed.
CALLAN ASSOCIATESINC
Knowledge for Investors
Research Presentation
with talking points
Real Assets – Give Me Something Real
Callan Investments Institute
2007 National Conference

CALLAN
ASSOCIATESINC
Knowledge for Investors Callan Investments Institute

CALLAN
ASSOCIATESINC
Knowledge for Investors Callan Investments Institute
Presenters:
Matthew W. Costello, CFA
Vice President
Paul M. Erlendson
Senior Vice President
Chae N. Hong
Investment Consultant
James W. Van Heuit
Senior Vice President
Session Details:
Callan Investments Institute
2007 National Conference, January 29-31
San Francisco, California
The following is a presentation given by the Callan Investments Institute during one of its educational sessions.
Each slide is accompanied by the commentary provided by the presenters during the session.
Commentary is provided on the left side pages. Some commentary pages were left intentionally blank
when the presenter chose to skip that page as part of his/her presentation.
Session Title:
Real Assets – Give Me Something Real

CALLAN ASSOCIATESINC
Knowledge for Investors Callan Investments Institute
??Paul Erlendson moderated this workshop on real assets, their characteristics, and how
they may enhance a portfolio.
??James Van Heuit provided an overview of real assets and how they are viewed within
an asset allocation framework.
??Matthew Costello followed with a discussion of timberland, highlighting some of the
unique opportunities this asset class has to offer.
??Chae Hong explored infrastructures, what is driving the growing demand for these
assets, and how and why to invest in this segment of the market.
RP-1
CALLAN ASSOCIATESINC
Knowledge for Investors
What are Real Assets?
James W. Van Heuit
1 |
|
CALLAN ASSOCIATESINC
Knowledge for Investors Callan Investments Institute
??Simply defined, real assets as those that are tangible, such as real estate,
infrastructure, and commodity related assets. The market, however, has a broader
definition that often includes intangibles such as inflation-linked bonds and real return
portfolios. These intangible assets are really financial assets designed to provide a
return after inflation—or real return assets. While the market may not differentiate
between real assets and real return assets, it’s important to be aware of the
distinction as real assets do not necessarily provide a consistent rate of return.
RP-2
CALLAN ASSOCIATESINC
Knowledge for Investors Callan Investments Institute
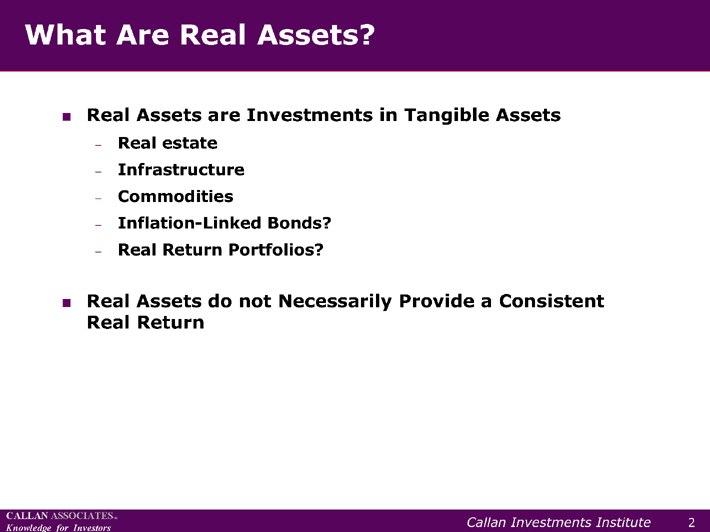
What Are Real Assets?
??Real Assets are Investments in Tangible Assets
? Real estate
? Infrastructure
? Commodities
? Inflation-Linked Bonds?
? Real Return Portfolios?
??Real Assets do not Necessarily Provide a Consistent
Real Return
2 |
|
CALLAN ASSOCIATESINC
Knowledge for Investors Callan Investments Institute
??There are a variety of reasons why real assets are an area of growing interest. Real
assets may be a viable destination for new cash inflows when existing portfolio
investments in other asset classes are at or near capacity. In addition, real assets
may put investment dollars to work more quickly than say, private equity, hedge
funds, or real estate.
??Real assets may also serve as a hedge for inflation. Although the rate of inflation
remains fairly low, rising commodity prices and the current federal budget and trade
deficits have fueled growing inflation fears. For investors seeking to get ahead of the
curve in terms of inflation, real assets offer some important benefits.
??Because real assets often react differently to changes in inflation than do traditional
asset classes, they can serve as an effective diversification tool as well.
RP-3
CALLAN ASSOCIATESINC
Knowledge for Investors Callan Investments Institute
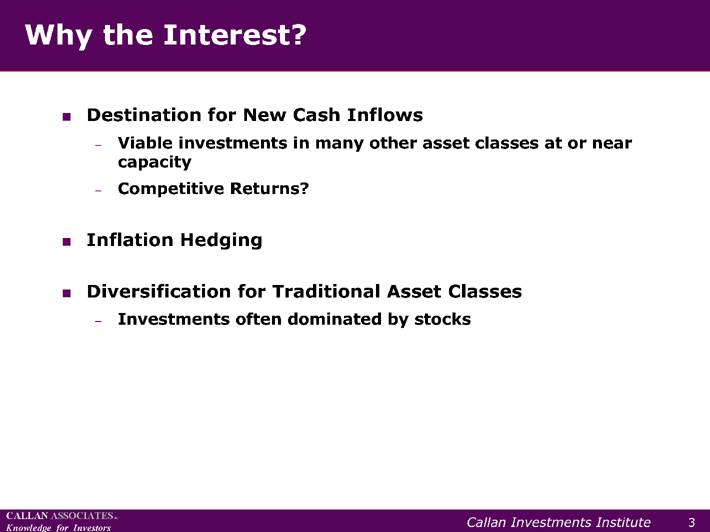
Why the Interest?
??Destination for New Cash Inflows
? Viable investments in many other asset classes at or near
capacity
? Competitive Returns?
??Inflation Hedging
??Diversification for Traditional Asset Classes
? Investments often dominated by stocks
3 |
|
CALLAN ASSOCIATESINC
Knowledge for Investors Callan Investments Institute
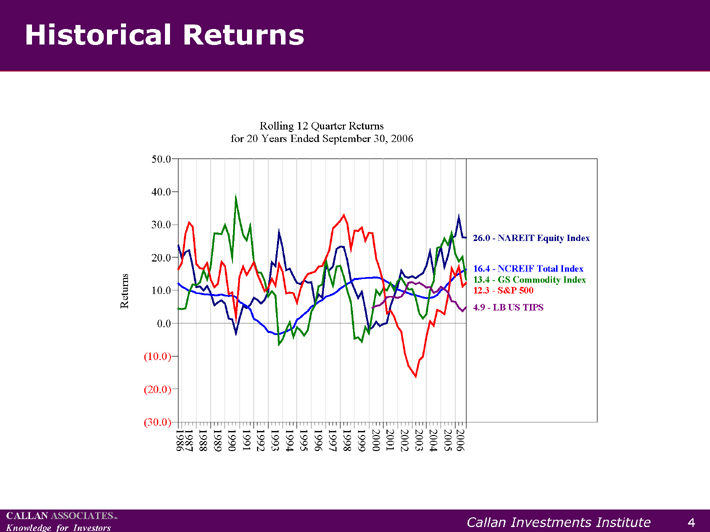
??Real assets also have a history of strong performance. This graph shows rolling threeyear
returns of real assets over the last 20 years (as measured by the NAREIT Equity
Index, NCREIF Total Index, and Goldman Sachs Commodity Index) versus the returns
of stocks (S&P 500 Index) and TIPS (Lehman Brothers U.S. TIPS Index).
??Note that for the rolling three-year period ended September 30, 2006, the NAREIT
Equity Index was up 26% on an annualized basis, a considerably higher return than
the other asset classes represented.
RP-4
CALLAN ASSOCIATESINC
Knowledge for Investors Callan Investments Institute
Historical Returns
1986
1987
1988
1989
1990
1991
1992
1993
1994
1995
1996
1997
1998
1999
2000
2001
2002
2003
2004
2005
2006
(30.0)
(20.0)
(10.0)
0.0
10.0
20.0
30.0
40.0
50.0
for 20 Years Ended September 30, 2006
Rolling 12 Quarter Returns Returns
26.0—NAREIT Equity Index
16.4—NCREIF Total Index
13.4—GS Commodity Index
12.3—S&P 500
4.9—LB US TIPS
4 |
|

CALLAN ASSOCIATESINC
Knowledge for Investors Callan Investments Institute
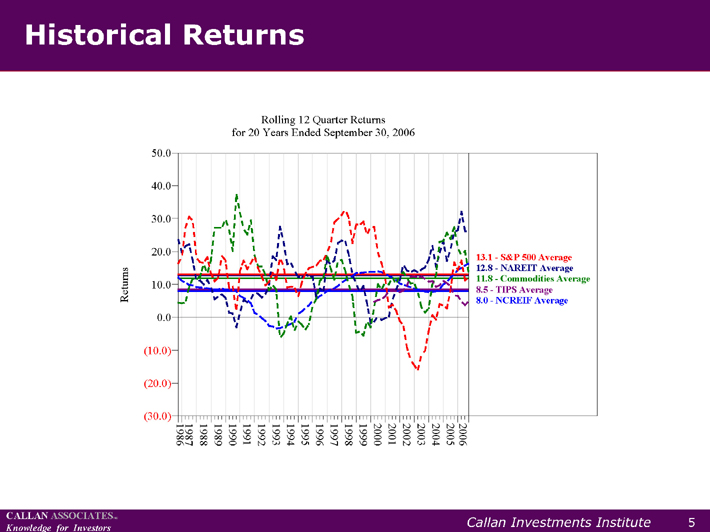
??Here we show the average returns of the indexes, represented by the solid lines, as
compared to the return patterns from the previous graph. Again, these are rolling
three-year returns over the past 20 years. Interestingly, despite the significant run
ups that commodities and real estate have experienced in recent years, the S&P 500
finished on top. In other words, the argument for adding commodities to a portfolio
does not rest on long-term return enhancement.
RP-5
CALLAN ASSOCIATESINC
Knowledge for Investors Callan Investments Institute
Historical Returns
1986
1987
1988
1989
1990
1991
1992
1993
1994
1995
1996
1997
1998
1999
2000
2001
2002
2003
2004
2005
2006
(30.0)
(20.0)
(10.0)
0.0
10.0
20.0
30.0
40.0
50.0
for 20 Years Ended September 30, 2006
Rolling 12 Quarter Returns Returns
12.8—NAREIT Average
8.0—NCREIF Average
11.8—Commodities Average
13.1—S&P 500 Average
8.5—TIPS Average
5 |
|
CALLAN ASSOCIATESINC
Knowledge for Investors Callan Investments Institute
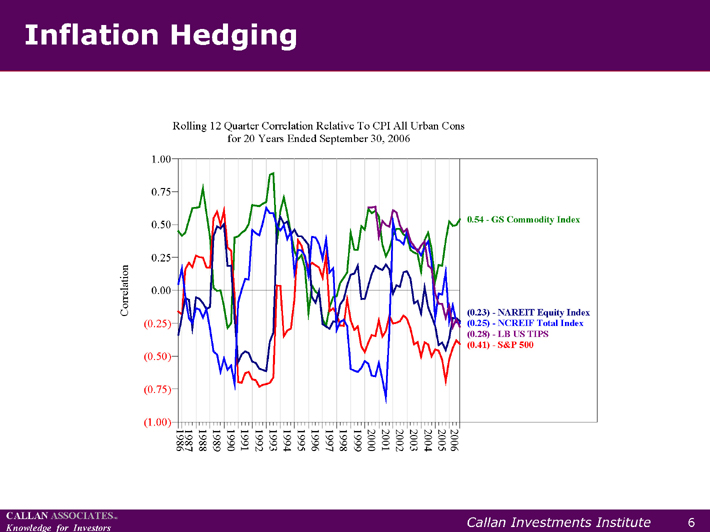
??Returning to the subject of real assets as an inflation hedge, we examined the
historical correlation between CPI and the returns of the various real asset classes
over the same 20-year period. In this graph, a 1.0 correlation represents a perfect
inflation hedge, a correlation of 0 represents no correlation between returns and
inflation, and a -1.0 correlation indicates that returns move in the opposite direction
of inflation.
??As the graph shows, the correlations, and therefore the short-term hedging properties
of the real assets, have varied substantially. The commodity index has been the best
inflation hedge, which is not surprising given that rising oil and materials prices have
been a key driver of inflation. Real estate, on the other hand, had a negative
correlation and as such, would have been a relatively poor inflation hedge.
??In summary, although the commodity index had the highest correlation, none of the
real asset classes shown have provided a consistent short-term hedge to inflation.
RP-6
CALLAN ASSOCIATESINC
Knowledge for Investors Callan Investments Institute
Inflation Hedging
1986
1987
1988
1989
1990
1991
1992
1993
1994
1995
1996
1997
1998
1999
2000
2001
2002
2003
2004
2005
2006
(1.00)
(0.75)
(0.50)
(0.25)
0.00
0.25
0.50
0.75
1.00
for 20 Years Ended September 30, 2006
Rolling 12 Quarter Correlation Relative To CPI All Urban Cons Correlation
0.54—GS Commodity Index
(0.41)—S&P 500
(0.23)—NAREIT Equity Index
(0.25)—NCREIF Total Index
(0.28)—LB US TIPS
6 |
|

CALLAN ASSOCIATESINC
Knowledge for Investors Callan Investments Institute
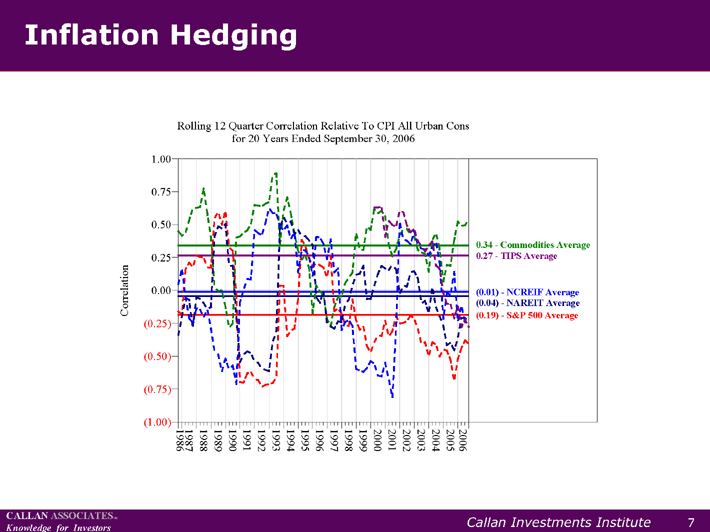
??When we looked at the average returns over that same 20-year period (as shown by
the solid lines on the graph), we found that commodities again had the highest
correlation to CPI. Although commodities are a fairly good hedge to inflation, they’re
not a complete hedge because they only make up a portion of inflation. For example,
they don’t take into account wages, which can be a drive of inflation. Interestingly,
although TIPS improved substantially from a negative to a positive correlation,
commodities were still a better hedge to inflation. We attribute this to the fact that
intermediate pricing on TIPS can vary fairly substantially.
??The real estate indexes moved up to near zero correlations, which implies that there is
no relationship between real estate returns and inflation. While this may seem
somewhat surprising, like commodities, there are certain aspects of real estate that
are not directly related to inflation such as demand for office space, the price of that
space, real estate capacity, even the nature of the economy itself, which can drive
real estate prices.
RP-7
CALLAN ASSOCIATESINC
Knowledge for Investors Callan Investments Institute
Inflation Hedging
1986
1987
1988
1989
1990
1991
1992
1993
1994
1995
1996
1997
1998
1999
2000
2001
2002
2003
2004
2005
2006
(1.00)
(0.75)
(0.50)
(0.25)
0.00
0.25
0.50
0.75
1.00
for 20 Years Ended September 30, 2006
Rolling 12 Quarter Correlation Relative To CPI All Urban Cons Correlation
(0.04)—NAREIT Average
(0.01)—NCREIF Average
0.27—TIPS Average
0.34—Commodities Average
(0.19)—S&P 500 Average
7 |
|

CALLAN ASSOCIATESINC
Knowledge for Investors Callan Investments Institute
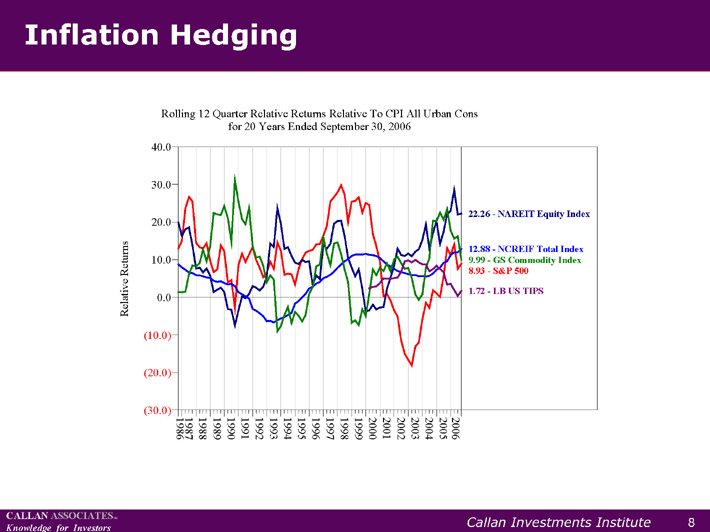
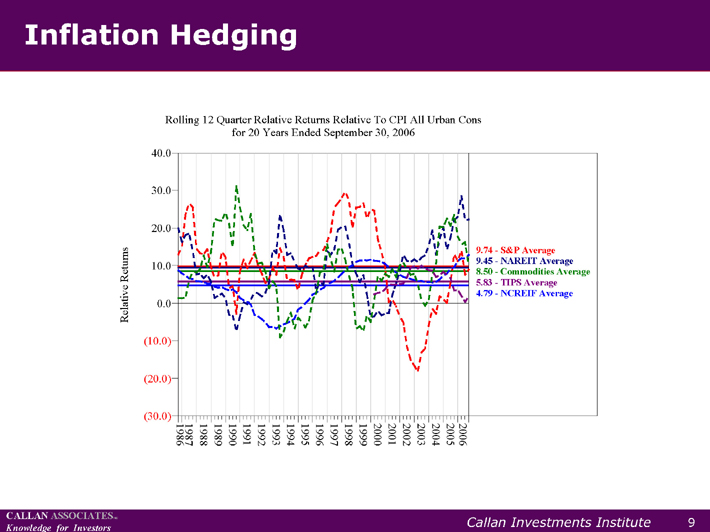
??In terms of long-term inflation hedging, what really matters is how large the returns
are in relation to inflation. This graph illustrates the returns in excess of CPI for the
same asset classes. Again, the pattern is the same as was shown previously for
nominal returns.
RP-8
CALLAN ASSOCIATESINC
Knowledge for Investors Callan Investments Institute
Inflation Hedging
1986
1987
1988
1989
1990
1991
1992
1993
1994
1995
1996
1997
1998
1999
2000
2001
2002
2003
2004
2005
2006
(30.0)
(20.0)
(10.0)
0.0
10.0
20.0
30.0
40.0
for 20 Years Ended September 30, 2006
Rolling 12 Quarter Relative Returns Relative To CPI All Urban Cons
Relative Returns
8.93—S&P 500
22.26—NAREIT Equity Index
12.88—NCREIF Total Index
9.99—GS Commodity Index
1.72—LB US TIPS
8 |
|
CALLAN ASSOCIATESINC
Knowledge for Investors Callan Investments Institute
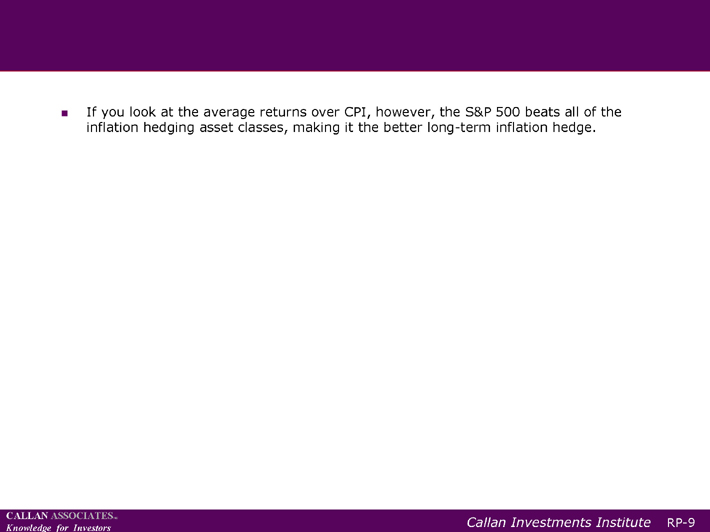
??If you look at the average returns over CPI, however, the S&P 500 beats all of the
inflation hedging asset classes, making it the better long-term inflation hedge.
RP-9
CALLAN ASSOCIATESINC
Knowledge for Investors Callan Investments Institute
Inflation Hedging
1986
1987
1988
1989
1990
1991
1992
1993
1994
1995
1996
1997
1998
1999
2000
2001
2002
2003
2004
2005
2006
(30.0)
(20.0)
(10.0)
0.0
10.0
20.0
30.0
40.0
for 20 Years Ended September 30, 2006
Rolling 12 Quarter Relative Returns Relative To CPI All Urban Cons Relative Returns
9.74—S&P Average
9.45—NAREIT Average
8.50—Commodities Average
4.79—NCREIF Average
5.83—TIPS Average
9

CALLAN ASSOCIATESINC
Knowledge for Investors Callan Investments Institute
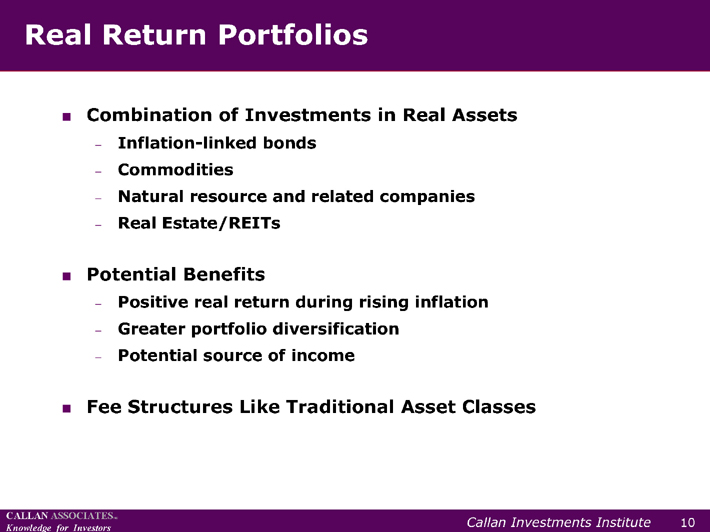
??While each of the individual real asset classes may offer valuable benefits, real return
portfolios—that is, portfolios comprised of collections of assets such as inflation-linked
bonds, commodities, natural resource-related companies, and real estate and sold as
a single package—may provide additional benefits.
??As shown earlier, while the individual real asset classes tend to move up and down in
terms of their correlation with inflation, they don’t necessarily move together. When
these assets are combined in a real return portfolio, however, they may provide a
more consistent positive real rate of return.
??The real return portfolio also offers a greater degree of diversification within real
assets investments, a potentially better source of income, and a more reasonable fee
structure than some of the more exotic investment alternatives.
RP-10
CALLAN ASSOCIATESINC
Knowledge for Investors Callan Investments Institute
Real Return Portfolios
??Combination of Investments in Real Assets
? Inflation-linked bonds
? Commodities
? Natural resource and related companies
? Real Estate/REITs
??Potential Benefits
? Positive real return during rising inflation
? Greater portfolio diversification
? Potential source of income
??Fee Structures Like Traditional Asset Classes
10
CALLAN ASSOCIATESINC
Knowledge for Investors Callan Investments Institute
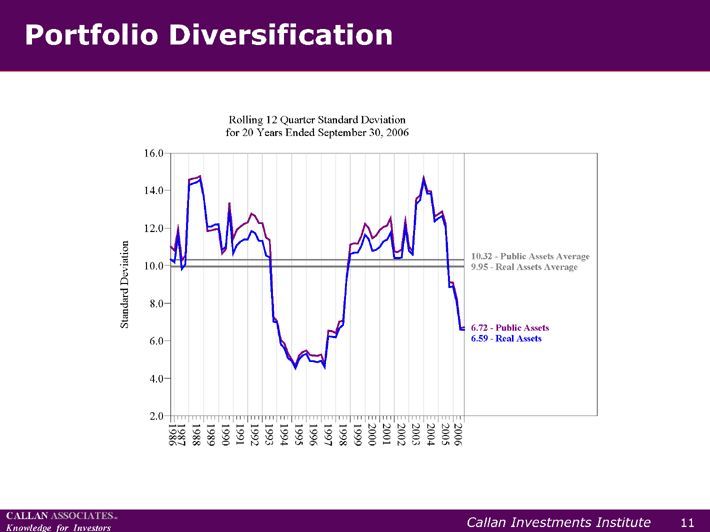
??We tested this concept of the diversified real return portfolio by constructing two
hypothetical portfolios—a “public assets” portfolio comprised of 65% stock and 35%
bonds, and a “real assets” portfolio comprised of the same ratio of stocks to bonds but
with 20% of total portfolio assets invested in a diversified mix of real return assets.
??We measured the standard deviation over the last 20 years, in terms of rolling threeyear
periods and the averages of those rolling three-year periods, and found that the
standard deviation of the real assets portfolio was approximately 40 basis points lower
than that of the public asset portfolio. In other words, adding real return assets to the
portfolio would have reduced volatility by roughly 4%.
RP-11
CALLAN ASSOCIATESINC
Knowledge for Investors Callan Investments Institute
Portfolio Diversification
1986
1987
1988
1989
1990
1991
1992
1993
1994
1995
1996
1997
1998
1999
2000
2001
2002
2003
2004
2005
2006
2.0
4.0
6.0
8.0
10.0
12.0
14.0
16.0
for 20 Years Ended September 30, 2006
Rolling 12 Quarter Standard Deviation Standard Deviation
10.32—Public Assets Average
9.95—Real Assets Average
6.72—Public Assets
6.59—Real Assets
11
CALLAN ASSOCIATESINC
Knowledge for Investors Callan Investments Institute
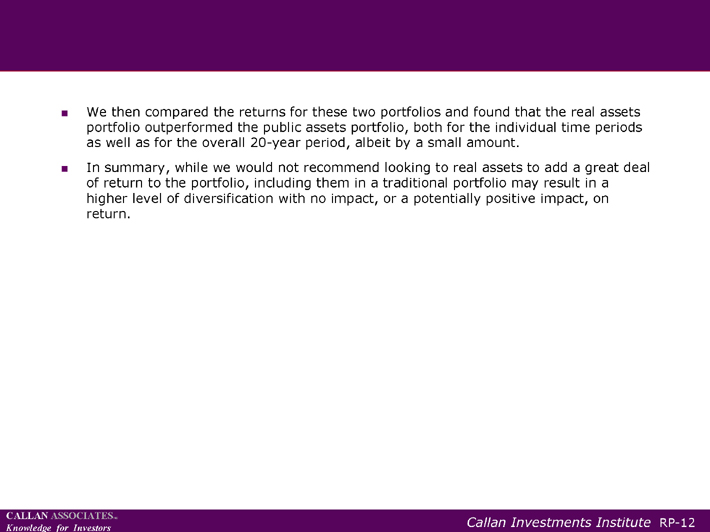
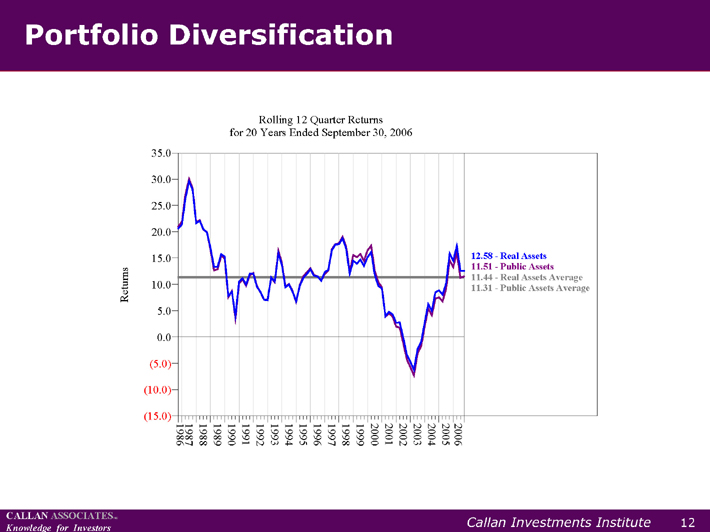
??We then compared the returns for these two portfolios and found that the real assets
portfolio outperformed the public assets portfolio, both for the individual time periods
as well as for the overall 20-year period, albeit by a small amount.
??In summary, while we would not recommend looking to real assets to add a great deal
of return to the portfolio, including them in a traditional portfolio may result in a
higher level of diversification with no impact, or a potentially positive impact, on
return.
RP-12
CALLAN ASSOCIATESINC
Knowledge for Investors Callan Investments Institute
Portfolio Diversification
1986
1987
1988
1989
1990
1991
1992
1993
1994
1995
1996
1997
1998
1999
2000
2001
2002
2003
2004
2005
2006
(15.0)
(10.0)
(5.0)
0.0
5.0
10.0
15.0
20.0
25.0
30.0
35.0
for 20 Years Ended September 30, 2006
Rolling 12 Quarter Returns Returns
11.31—Public Assets Average
11.44—Real Assets Average
11.51—Public Assets
12.58—Real Assets
12

CALLAN ASSOCIATESINC
Knowledge for Investors Callan Investments Institute RP-13
CALLAN ASSOCIATESINC
Knowledge for Investors Callan Investments Institute
Asset Allocation Challenges
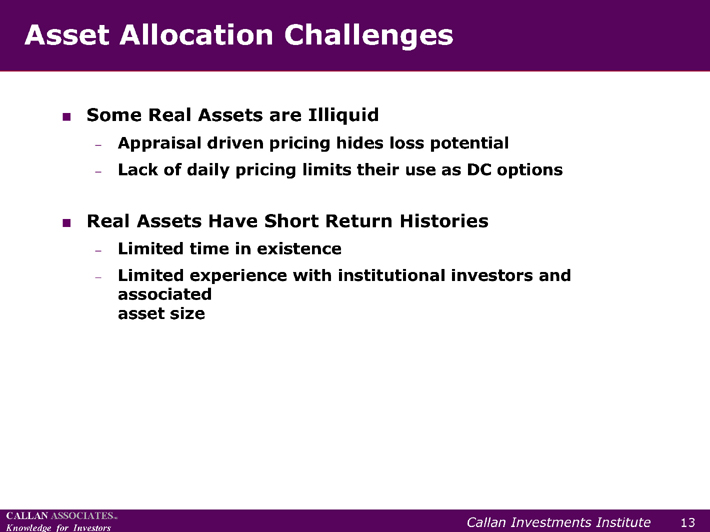
??Some Real Assets are Illiquid
? Appraisal driven pricing hides loss potential
? Lack of daily pricing limits their use as DC options
??Real Assets Have Short Return Histories
? Limited time in existence
? Limited experience with institutional investors and
associated
asset size
13

CALLAN ASSOCIATESINC
Knowledge for Investors Callan Investments Institute RP-14
CALLAN ASSOCIATESINC
Knowledge for Investors Callan Investments Institute
Callan Real Asset Research
??Infrastructure: Investment that Saves the World?
??Timberland: A Growing Asset Class
??Commodities Investing: Implementation
??So You Want to Invest in Commodities
??Farmland Investing
14

CALLAN ASSOCIATESINC
Knowledge for Investors Callan Investments Institute RP-15
CALLAN ASSOCIATESINC
Knowledge for Investors
Timberland Investment Overview
Matthew W. Costello, CFA
15

CALLAN ASSOCIATESINC
Knowledge for Investors Callan Investments Institute
??The second segment of the workshop explores timberland, a unique and growing
segment of the real assets market. On the following pages we provide an overview of
the characteristics of the asset class, its diversification benefits, and sources of return.
We also present some compelling reasons to invest, the inherent risks involved, and a
recent case study showing how one Callan client implemented a timberland portfolio
in their overall allocation.
RP-16
CALLAN ASSOCIATESINC
Knowledge for Investors Callan Investments Institute
Outline
??Investable U.S. Market
??Diversification Considerations
??Classification of Timberland
??Sources of Return
??Why Invest in Timberland
? Competitive Relative Returns
? Cash Flow
? Low Volatility
? Diversification
? Unique Characteristics
? Inflation Hedge ?
??Risks
??Timberland Managers
??Case Study
16
CALLAN ASSOCIATESINC
Knowledge for Investors Callan Investments Institute
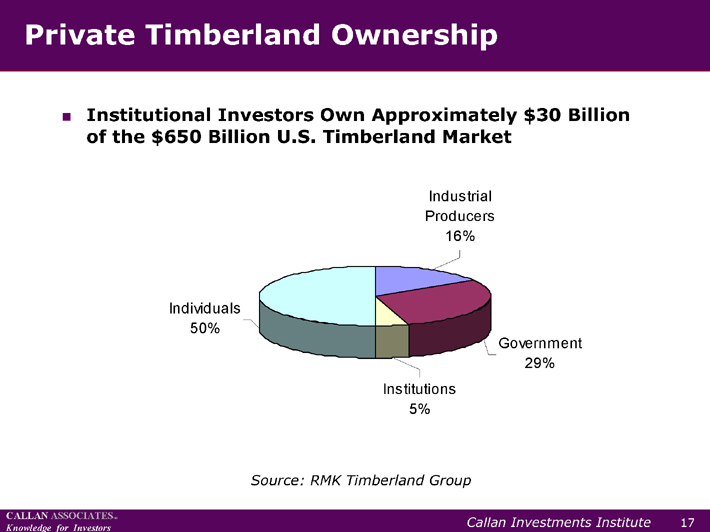
??When we talk about the U.S. timberland market here we are referring to private
timberland ownership excluding timber REITs. In our view, timber REITs are not a
substitute for private timberland ownership for various reasons. One, they tend to
correlate with the equity markets. Two, many REITs actually own the manufacturing
facilities and therefore, involve some operating scales that may be undesirable for the
investor simply seeking access to timberland. Lastly, REITs tend to trade on yield,
which is a different model than that of timberland itself.
??This chart shows the breakdown of private timberland ownership. Institutional
investors currently represent the smallest segment of the market. Industrial
producers—manufacturers such as International Paper—have more or less taken
timberland off their balance sheets, which has put a lot of timberland into the market
over the past ten years.
RP-17
CALLAN ASSOCIATESINC
Knowledge for Investors Callan Investments Institute
Source: RMK Timberland Group
Institutions
5%
Government
29%
Industrial
Producers
16%
Individuals
50%
Private Timberland Ownership
??Institutional Investors Own Approximately $30 Billion
of the $650 Billion U.S. Timberland Market
17

CALLAN ASSOCIATESINC
Knowledge for Investors Callan Investments Institute
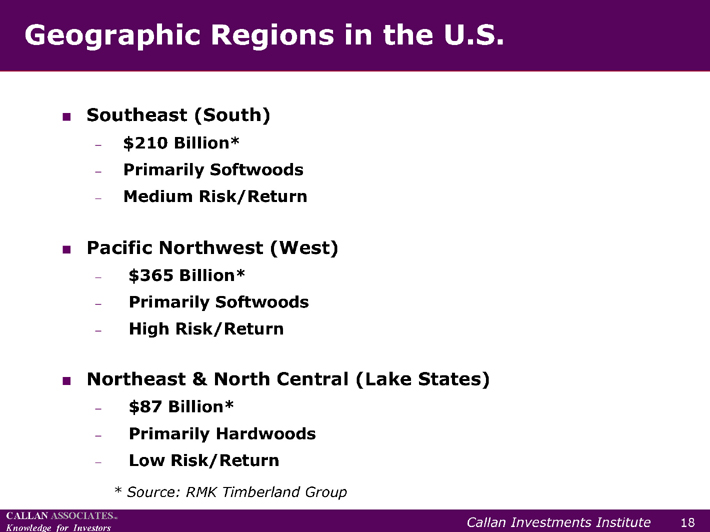
??The U.S. timberland market is comprised of three main components or regions. The
first is the Southeast, which primarily consists of fast-growing pine softwood timber
that takes roughly 30 years to mature. The second region, the Pacific Northwest, is
also comprised primarily of pine softwood timber, but in this area of the country these
trees grow considerably slower, taking nearly 60 years to reach maturity. The third
segment of the market is the Northeast, where hardwoods are mainly grown and used
in making furniture.
??The demand and supply factors in each of these timberland regions are mandated by
the mill capacities within the surrounding areas, which means that the primary
determinants of timber price are very local. As such, it is possible to build a diversified
timberland portfolio by investing in each of the three regions.
RP-18
CALLAN ASSOCIATESINC
Knowledge for Investors Callan Investments Institute
* |
| Source: RMK Timberland Group |
Geographic Regions in the U.S.
??Southeast (South)
? $210 Billion*
? Primarily Softwoods
? Medium Risk/Return
??Pacific Northwest (West)
? $365 Billion*
? Primarily Softwoods
? High Risk/Return
??Northeast & North Central (Lake States)
? $87 Billion*
? Primarily Hardwoods
? Low Risk/Return
18

CALLAN ASSOCIATESINC
Knowledge for Investors Callan Investments Institute
??A timberland portfolio can also be diversified by the age of the trees. For example,
pulpwood, which is about 4 to 8 inches in diameter and used in making paper, is
generally derived from young trees and has the lowest commercial value. Chip-n-saw
is approximately 8 to 12 inches in diameter and has the greatest appreciation
potential. The most mature trees, or sawtimber, offer the highest cash flow potential.
??International timberland investing is another means of diversification. While the
potential returns of investing outside the U.S. may be high, the political, currency,
and developmental risks inherent in these market also make them the riskiest.
RP-19
CALLAN ASSOCIATESINC
Knowledge for Investors Callan Investments Institute
Other Diversification Considerations
??Stage of Growth
? Mature: High cash flow potential (Sawtimber)
? Intermediate: Greatest appreciation potential
(Chip-n-Saw)
? Young: Lowest commercial value (Pulpwood)
??International
? Highest overall risk and return
? Primarily Argentina, Australia, Brazil, Canada, Chile,
New Zealand, South Africa & Uruguay
? Fast growing plantations, primarily export, less
environmental concerns
? Political, currency, developmental risk, poor infrastructure
19

CALLAN ASSOCIATESINC
Knowledge for Investors Callan Investments Institute
??How does timberland fit into the real asset classes? Timberland has been used
primarily as a means of diversifying an already established real estate portfolio of
traditional core real estate and REITs. While many view timberland as real estate, we
view it as more of a commodity because approximately two-thirds of return is derived
the biological growth of the timber rather than appreciation within the land. Like
bonds, the cash flows from timberland harvests can be reasonably predicted over long
periods of time. Similar to private equity, the timberland market is illiquid, although it
is becoming more liquid as transactions in the market have been increasing. Lastly,
timberland investments typically operate in limited liability partnerships.
RP-20
CALLAN ASSOCIATESINC
Knowledge for Investors Callan Investments Institute
Timberland Classification
??Private Equity
? Illiquid
??Fixed-Income
? Yearly harvests
??Real Estate
? Real Property with cash flow similar to commercial
property leases
??Real Assets
? Timber component is a commodity
20

CALLAN ASSOCIATESINC
Knowledge for Investors Callan Investments Institute
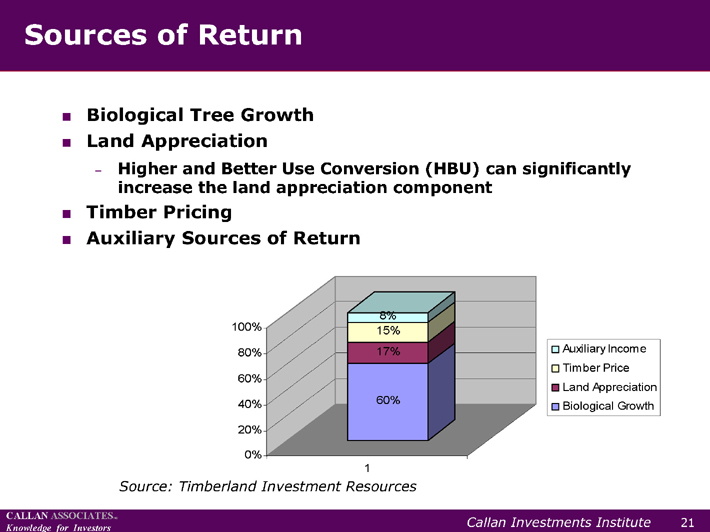
??Here we show the components of timberland returns over time. As noted earlier, the
majority of return, roughly 60%, is derived from the biological growth of the trees.
Land appreciation is another component of return and can become a much larger
component over time when firms dedicate more of their resources toward finding the
higher and best-use components. For example, when significant tracts of land around
lakes are developed for condominiums.
RP-21
CALLAN ASSOCIATESINC
Knowledge for Investors Callan Investments Institute
Sources of Return
??Biological Tree Growth
??Land Appreciation
? Higher and Better Use Conversion (HBU) can significantly
increase the land appreciation component
??Timber Pricing
??Auxiliary Sources of Return
60%
17%
15%
8%
0%
20%
40%
60%
80%
100%
1 |
|
Auxiliary Income
Timber Price
Land Appreciation
Biological Growth
Source: Timberland Investment Resources
21

CALLAN ASSOCIATESINC
Knowledge for Investors Callan Investments Institute
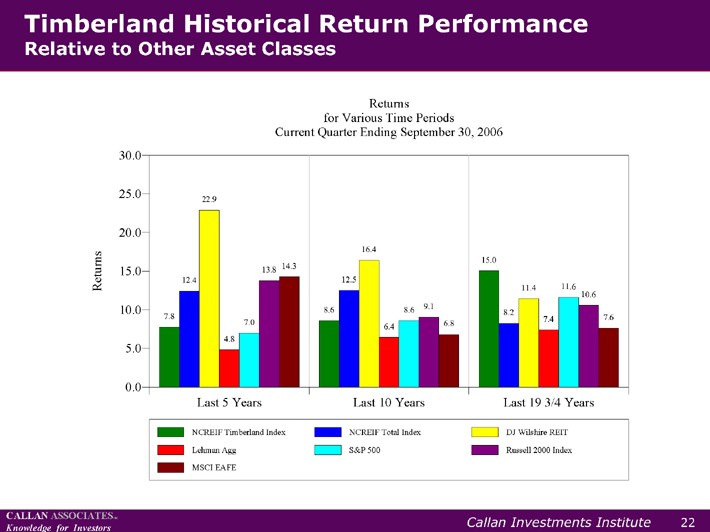
??Timberland has historically performed very well relative to the other asset classes.
This chart shows the average returns for timberland, represented by the NCREIF
(National Council of Real Estate Investment Fiduciaries) Timberland Index, over the
last five years, the last ten years, and since the inception of the index 19 3/4 years ago,
relative to the returns of various commodity, real estate and equity indexes.
RP-22
CALLAN ASSOCIATESINC
Knowledge for Investors Callan Investments Institute
Timberland Historical Return Performance
Relative to Other Asset Classes
0.0
5.0
10.0
15.0
20.0
25.0
30.0
Current Quarter Ending September 30, 2006
for Various Time Periods
Returns Returns
7.8
8.6
15.0
12.4 12.5
8.2
22.9
16.4
11.4
4.8
6.4
7.4 7.0
8.6
11.6
13.8
9.1
10.6
14.3
6.8
7.6
Last 5 Years Last 10 Years Last 19 3/4 Years
NCREIF Timberland Index NCREIF Total Index DJ Wilshire REIT
Lehman Agg S&P 500 Russell 2000 Index
MSCI EAFE
22

CALLAN ASSOCIATESINC
Knowledge for Investors Callan Investments Institute
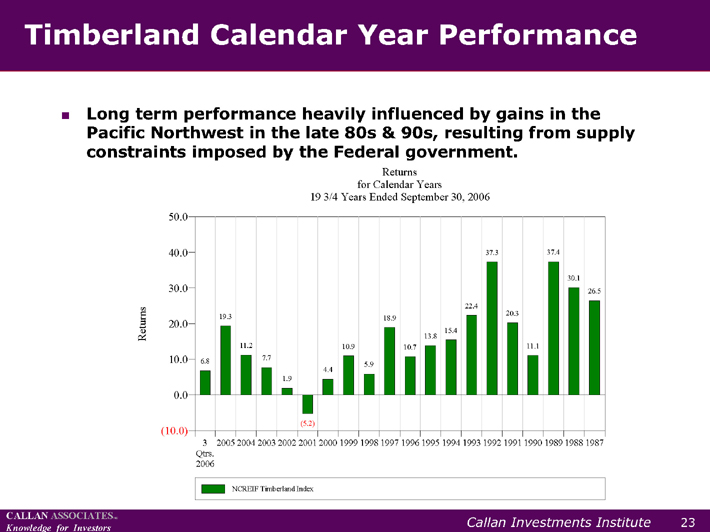
??This chart shows calendar year returns for the NCREIF Timberland Index. It’s
important to note that at the time the index was created, there was a supply trough in
the market due to the Spotted Owl issue in the Pacific Northwest, which inflated
timberland returns for the following five to six years. For this reason, returns for the
past five or ten years may provide a more realistic picture of the market’s overall
performance.
RP-23
CALLAN ASSOCIATESINC
Knowledge for Investors Callan Investments Institute
(10.0)
0.0
10.0
20.0
30.0
40.0
50.0
19 3/4 Years Ended September 30, 2006
for Calendar Years
Returns
Returns
6.8
19.3
11.2
7.7
1.9
(5.2)
4.4
10.9
5.9
18.9
10.7
13.8
15.4
22.4
37.3
20.3
11.1
37.4
30.1
26.5
2006
Qtrs.
3 |
| 2005 2004 2003 2002 2001 2000 1999 1998 1997 1996 1995 1994 1993 1992 1991 1990 1989 1988 1987 |
NCREIF Timberland Index
Timberland Calendar Year Performance
??Long term performance heavily influenced by gains in the
Pacific Northwest in the late 80s & 90s, resulting from supply
constraints imposed by the Federal government.
23
CALLAN ASSOCIATESINC
Knowledge for Investors Callan Investments Institute
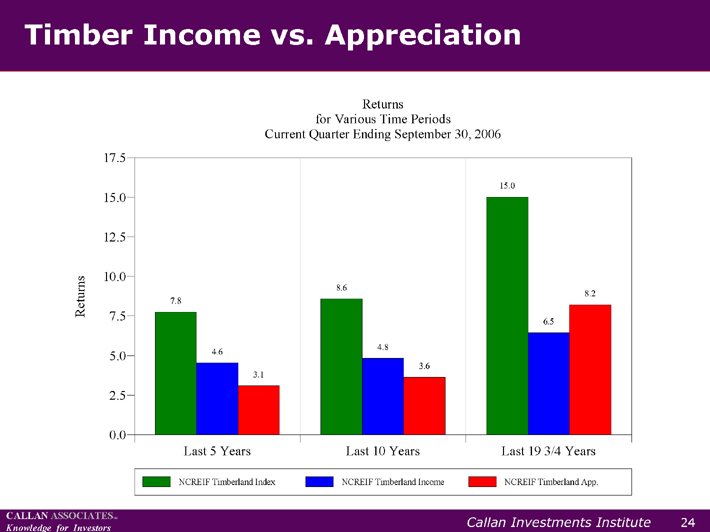
??This chart provides a snapshot of the income and appreciation components of
timberland returns for the same time periods. As the chart illustrates, timberland has
been a relatively good source of cash flow—as represented by the blue bars.
RP-24
CALLAN ASSOCIATESINC
Knowledge for Investors Callan Investments Institute
Last 5 Years Last 10 Years Last 19 3/4 Years
0.0
2.5
5.0
7.5
10.0
12.5
15.0
17.5
Current Quarter Ending September 30, 2006
for Various Time Periods
Returns
Returns
7.8
8.6
15.0
4.6 4.8
6.5
3.1
3.6
8.2
NCREIF Timberland Index NCREIF Timberland Income NCREIF Timberland App.
Timber Income vs. Appreciation
24

CALLAN ASSOCIATESINC
Knowledge for Investors Callan Investments Institute
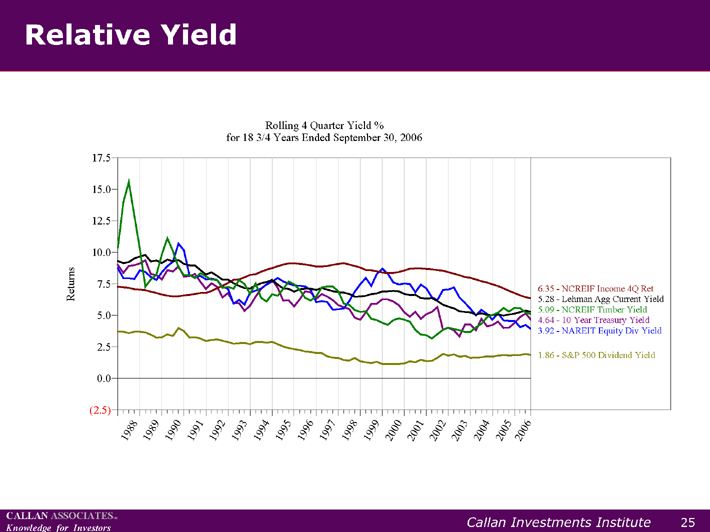
??When we look at historic yields of timberland, which represent cash flows from timber
harvests (and are denoted here by the green line on the graph), we notice an
interesting trend: timber yields do not appear to be correlated with the yield flows
from the other asset classes. In our view, this lack of correlation suggests that
timberland may provide yield diversification within a portfolio.
RP-25
CALLAN ASSOCIATESINC
Knowledge for Investors Callan Investments Institute
1988
1989
1990
1991
1992
1993
1994
1995
1996
1997
1998
1999
2000
2001
2002
2003
2004
2005
2006
(2.5)
0.0
2.5
5.0
7.5
10.0
12.5
15.0
17.5
for 18 3/4 Years Ended September 30, 2006
Rolling 4 Quarter Yield %
Returns
4.64—10 Year Treasury Yield
3.92—NAREIT Equity Div Yield
6.35—NCREIF Income 4Q Ret
1.86—S&P 500 Dividend Yield
5.28—Lehman Agg Current Yield
5.09—NCREIF Timber Yield
Relative Yield
25

CALLAN ASSOCIATESINC
Knowledge for Investors Callan Investments Institute
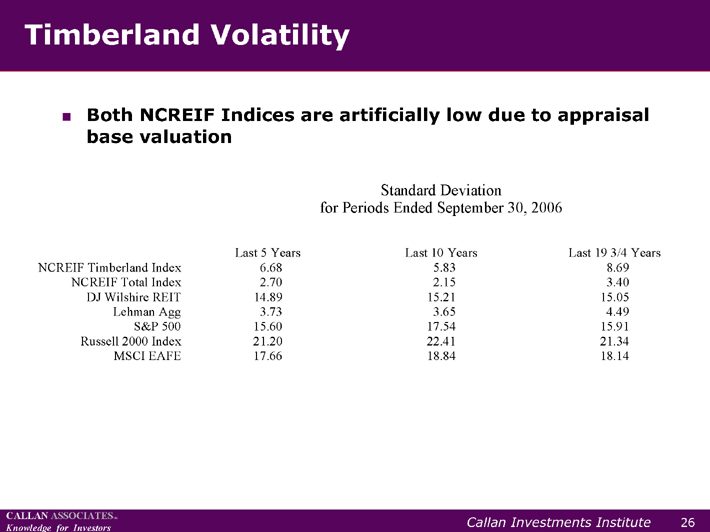
??Another attractive characteristic of timberland is its lower relative volatility. As this
table shows, when we compare the relative volatility of the timberland index to that of
the other asset classes, we find that the timberland index has historically had
approximately one-third to one-half the standard deviation of the S&P 500. It should
be noted, however, that land is typically appraised on a rolling basis every one to
three years. As such, the timberland index may be subject to smoothing.
RP-26
CALLAN ASSOCIATESINC
Knowledge for Investors Callan Investments Institute
for Periods Ended September 30, 2006
Standard Deviation
Last 5 Years Last 10 Years Last 19 3/4 Years
NCREIF Timberland Index 6.68 5.83 8.69
NCREIF Total Index 2.70 2.15 3.40
DJ Wilshire REIT 14.89 15.21 15.05
Lehman Agg 3.73 3.65 4.49
S&P 500 15.60 17.54 15.91
Russell 2000 Index 21.20 22.41 21.34
MSCI EAFE 17.66 18.84 18.14
Timberland Volatility
??Both NCREIF Indices are artificially low due to appraisal
base valuation
26
CALLAN ASSOCIATESINC
Knowledge for Investors Callan Investments Institute
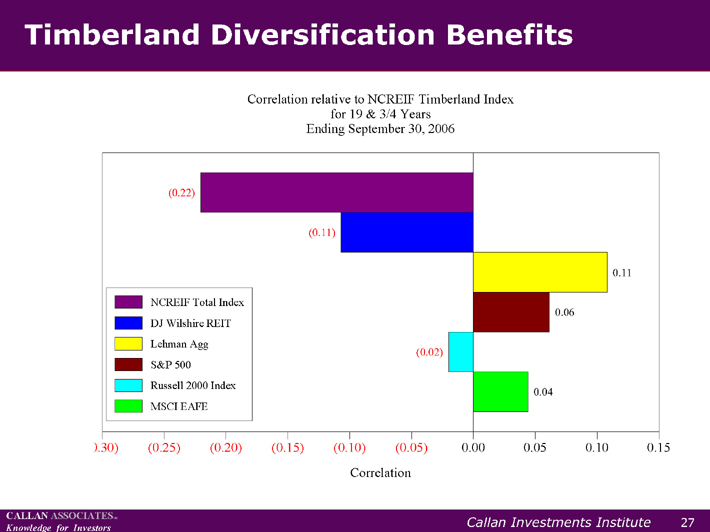
??This chart illustrates the overall correlation of timberland to the other assets classes
since the timberland index’s inception. Again, there has been little correlation with any
of the other asset classes shown. Surprisingly, the timberland index was most
negatively correlated with the NCREIF Total Index. As you’ll see on the next chart,
however, the correlation between the two indexes has been increasing as of late.
RP-27
CALLAN ASSOCIATESINC
Knowledge for Investors Callan Investments Institute
0.30) (0.25) (0.20) (0.15) (0.10) (0.05) 0.00 0.05 0.10 0.15
Ending September 30, 2006
for 19 & 3/4 Years
Correlation relative to NCREIF Timberland Index
Correlation
(0.22)
(0.11)
0.11
0.06
(0.02)
0.04
NCREIF Total Index
DJ Wilshire REIT
Lehman Agg
S&P 500
Russell 2000 Index
MSCI EAFE
Timberland Diversification Benefits
27
CALLAN ASSOCIATESINC
Knowledge for Investors Callan Investments Institute
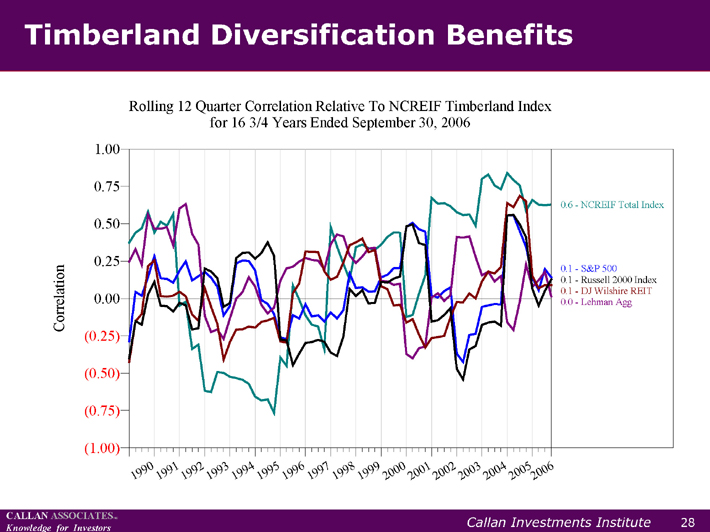
??When we plot rolling 12-quarter correlations, we see that over the past ten years the
correlation of the timberland index to the NCREIF Total Index has risen considerably.
This trend has been driven primarily by the fact that individuals and institutions have
been increasingly involved in the real estate market.
RP-28
CALLAN ASSOCIATESINC
Knowledge for Investors Callan Investments Institute
1990
1991
1992
1993
1994
1995
1996
1997
1998
1999
2000
2001
2002
2003
2004
2005
2006
(1.00)
(0.75)
(0.50)
(0.25)
0.00
0.25
0.50
0.75
1.00
for 16 3/4 Years Ended September 30, 2006
Rolling 12 Quarter Correlation Relative To NCREIF Timberland Index
Correlation
0.6—NCREIF Total Index
0.1—S&P 500
0.0—Lehman Agg
0.1—DJ Wilshire REIT
0.1—Russell 2000 Index
Timberland Diversification Benefits
28

CALLAN ASSOCIATESINC
Knowledge for Investors Callan Investments Institute
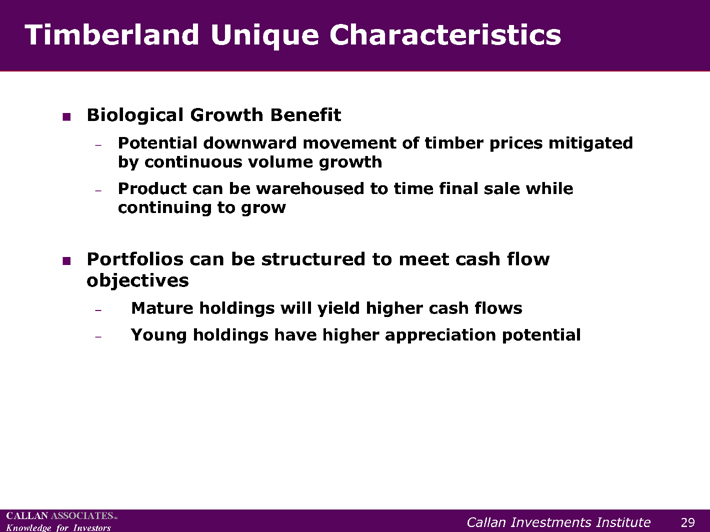
??Beyond its attractive historical performance and diversification benefits, timberland
offers some other compelling characteristics. The first is the ability to “store it on the
stump.” Unlike agricultural crops, which must be harvested at a particular time or go
to waste, timber has a more flexible timeframe for harvesting. During period of falling
timber prices, trees can be left to grow and harvested when prices become more
favorable.
??A timberland portfolio can also be structured to meet cash flow objectives. The
portfolio can be structured either for higher cash flow yields through investments in
more mature tracts of timberland, or for higher appreciation potential through
investments in younger holdings.
RP-29
CALLAN ASSOCIATESINC
Knowledge for Investors Callan Investments Institute
Timberland Unique Characteristics
??Biological Growth Benefit
? Potential downward movement of timber prices mitigated
by continuous volume growth
? Product can be warehoused to time final sale while
continuing to grow
??Portfolios can be structured to meet cash flow
objectives
? Mature holdings will yield higher cash flows
? Young holdings have higher appreciation potential
29

CALLAN ASSOCIATESINC
Knowledge for Investors Callan Investments Institute
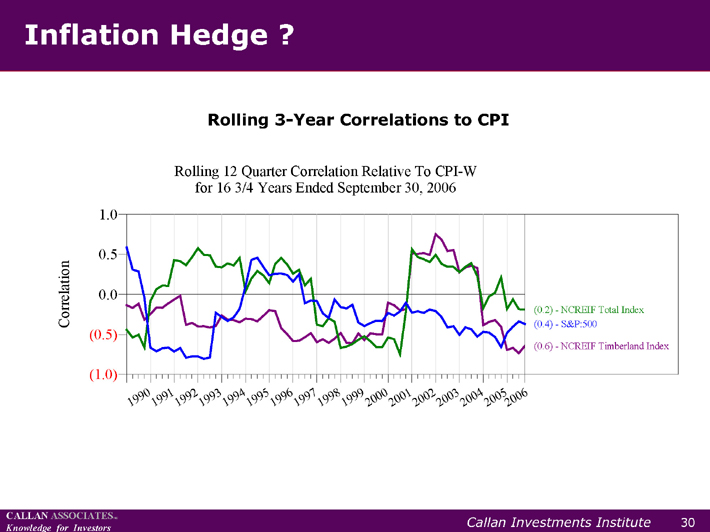
??In terms of timberland’s effectiveness as an inflation hedge, we’re a bit more cautious.
Although the historical correlation of the NCREIF Timberland Index to CPI approaches
0.5 (on a scale where 1.0 represents a perfect correlation) as this graph denotes, the
index was not in existence during the inflation-heavy years. If it had, we expect that
the index’s correlation to inflation would be lower.
RP-30
CALLAN ASSOCIATESINC
Knowledge for Investors Callan Investments Institute
1990
1991
1992
1993
1994
1995
1996
1997
1998
1999
2000
2001
2002
2003
2004
2005
2006
(1.0)
(0.5)
0.0
0.5
1.0
for 16 3/4 Years Ended September 30, 2006
Rolling 12 Quarter Correlation Relative To CPI-W
Correlation
(0.6)—NCREIF Timberland Index
(0.2)—NCREIF Total Index
(0.4)—S&P:500
Inflation Hedge ?
Rolling 3-Year Correlations to CPI
30

CALLAN ASSOCIATESINC
Knowledge for Investors Callan Investments Institute
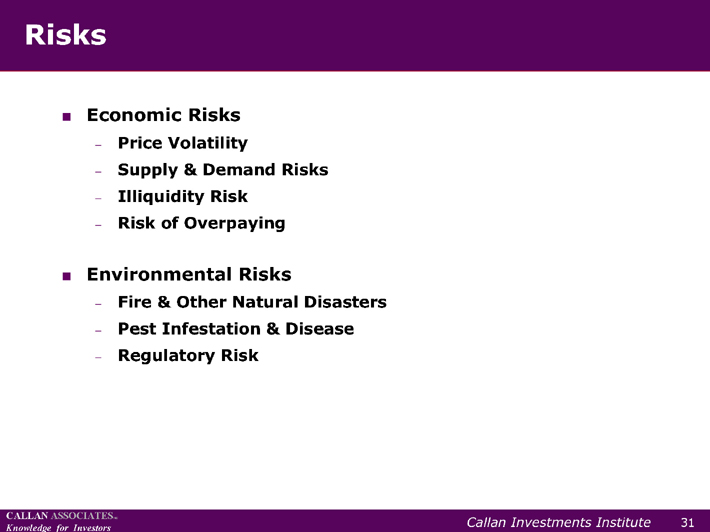
??Given the rising institutional interest in the timberland asset class, as well as the
increasing number of public auctions, we believe the biggest inherent risk of investing
is the risk of overpaying.
??Price volatility is another risk. Different weather patterns can create short-term supply
issues and result in short-term volatility, while macro issues such as housing starts
may cause long-term volatility.
??Illiquidity risks also exist, but have lessened as market activity has grown.
??Lastly, there are the environmental risks such as natural disasters, pest infestation,
and regulatory risks. These risks tend to be quite small. In fact, only about one-tenth
of one percent of U.S. forest land has been affected by any natural disasters or pest
infestation. Typically, these types of risks can be actively managed away.
RP-31
CALLAN ASSOCIATESINC
Knowledge for Investors Callan Investments Institute
Risks
??Economic Risks
? Price Volatility
? Supply & Demand Risks
? Illiquidity Risk
? Risk of Overpaying
??Environmental Risks
? Fire & Other Natural Disasters
? Pest Infestation & Disease
? Regulatory Risk
31

CALLAN ASSOCIATESINC
Knowledge for Investors Callan Investments Institute
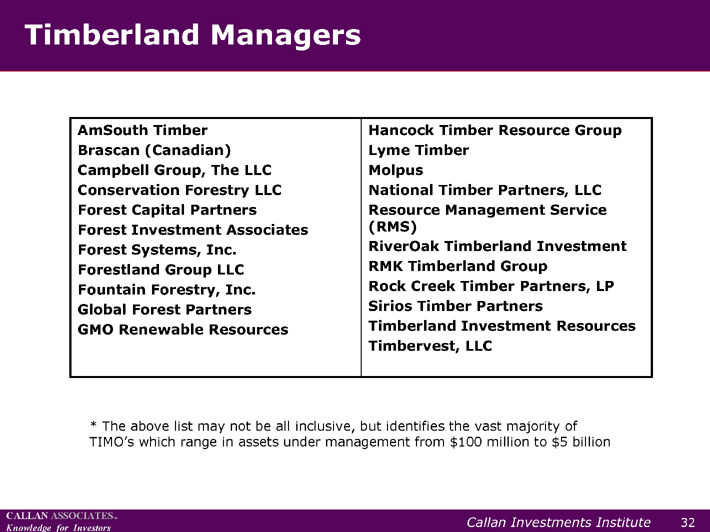
??Here we provide a list of some of the current timberland managers, or
“TIMOs”—Timberland Investment Management Organizations, whose assets under
management range from $100 million to $5 billion. The most global of these
managers are Global Forest Partners and Hancock Timber Resources. RMK Timberland
Group has been dipping their hand in the Uruguay market and Campbell Group
specializes in the Pacific Northwest. This is merely a snapshot of the TIMO universe.
Each manager has its own strengths and many specialize in a particular region or area
of the market. As such, investors have the option of diversifying within the market
with multiple managers.
RP-32
CALLAN ASSOCIATESINC
Knowledge for Investors Callan Investments Institute
Hancock Timber Resource Group
Lyme Timber
Molpus
National Timber Partners, LLC
Resource Management Service
(RMS)
RiverOak Timberland Investment
RMK Timberland Group
Rock Creek Timber Partners, LP
Sirios Timber Partners
Timberland Investment Resources
Timbervest, LLC
AmSouth Timber
Brascan (Canadian)
Campbell Group, The LLC
Conservation Forestry LLC
Forest Capital Partners
Forest Investment Associates
Forest Systems, Inc.
Forestland Group LLC
Fountain Forestry, Inc.
Global Forest Partners
GMO Renewable Resources
* |
| The above list may not be all inclusive, but identifies the vast majority of |
TIMO’s which range in assets under management from $100 million to $5 billion
Timberland Managers
32
CALLAN ASSOCIATESINC
Knowledge for Investors Callan Investments Institute
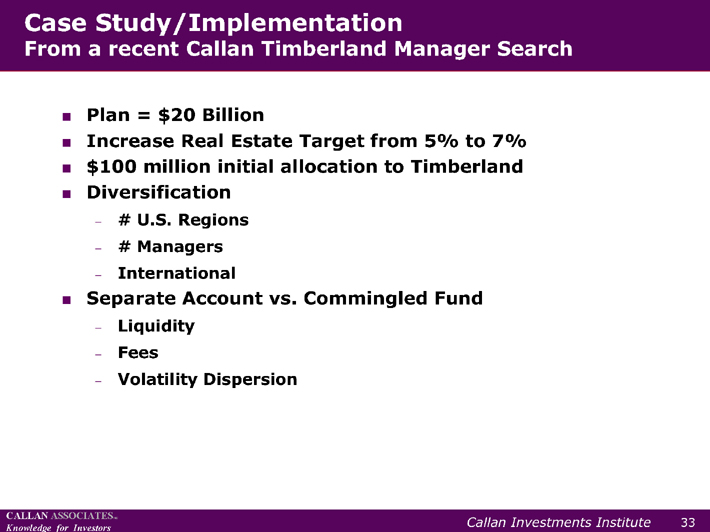
??Callan recently conducted a manager search for a client who sought to augment their
real estate portfolio with a timberland allocation. Initially, the client struggled with the
question of whether or not to include an international component. Ultimately, they
decided upon a 20% international allocation within their timberland portfolio because
they essentially wanted a core portfolio and did not want to assume the added risk
involved with a higher international allocation.
??The client had $100 million to invest in timberland initially, which gave them the
ability to create a separate account. We considered the variables involved in
establishing a separate account versus a commingled fund. A separate account can
offer some pricing power—perhaps 20 basis points off the management fee—as well
as more investor control of the assets, and is more liquid. However, by going with a
$100 million separate account as opposed to a larger commingled fund pool of
investments, you likely give up compression of volatility over time. These are merely
some of the variables they had to consider before establishing an account. In the end
the fee discount as well as the ability to customize the desired risk/return
characteristics of the timberland portfolio led the client to go with a separate account.
RP-33
CALLAN ASSOCIATESINC
Knowledge for Investors Callan Investments Institute
Case Study/Implementation
From a recent Callan Timberland Manager Search
??Plan = $20 Billion
??Increase Real Estate Target from 5% to 7%
??$100 million initial allocation to Timberland
??Diversification
? # U.S. Regions
? # Managers
? International
??Separate Account vs. Commingled Fund
? Liquidity
? Fees
? Volatility Dispersion
33

CALLAN ASSOCIATESINC
Knowledge for Investors Callan Investments Institute
??The last segment of the workshop explores infrastructures, what is driving the
growing demand for these assets, and how and why to invest in this segment of the
market. We also provide a brief case study overview of a client seeking to augment
their real estate allocation with an investment in infrastructure.
RP-34

CALLAN ASSOCIATESINC
Knowledge for Investors
Infrastructure
Chae N. Hong
34

CALLAN ASSOCIATESINC
Knowledge for Investors Callan Investments Institute
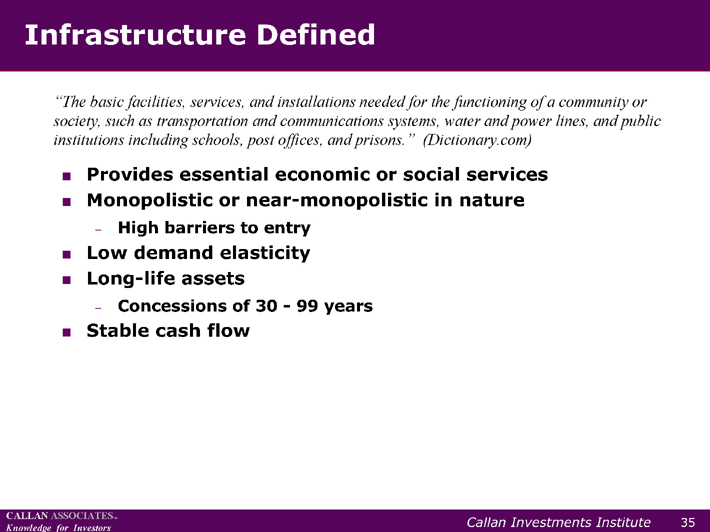
??Infrastructure plays a central role in our daily lives, though often we don’t realize it.
Transportation systems, water and power lines, public institutions such as schools,
post offices, and prisons all fall under the definition of infrastructures.
??Beyond providing essential economic or social services, infrastructure has four other
general characteristics. First, it is a monopolistic or near monopolistic market in
nature and as such, has high barriers to entry. Second, demand elasticity is low,
which essentially means that pricing power is very strong. Third, infrastructure assets
are typically long-lived; concessions from municipalities to private owners can range
from 30 to 99 years. And lastly, infrastructure assets provide a stable and predictable
cash flow.
RP-35
CALLAN ASSOCIATESINC
Knowledge for Investors Callan Investments Institute
“The basic facilities, services, and installations needed for the functioning of a community or
society, such as transportation and communications systems, water and power lines, and public
institutions including schools, post offices, and prisons.” (Dictionary.com)
Infrastructure Defined
??Provides essential economic or social services
??Monopolistic or near-monopolistic in nature
? High barriers to entry
??Low demand elasticity
??Long-life assets
? Concessions of 30—99 years
??Stable cash flow
35
CALLAN ASSOCIATESINC
Knowledge for Investors Callan Investments Institute
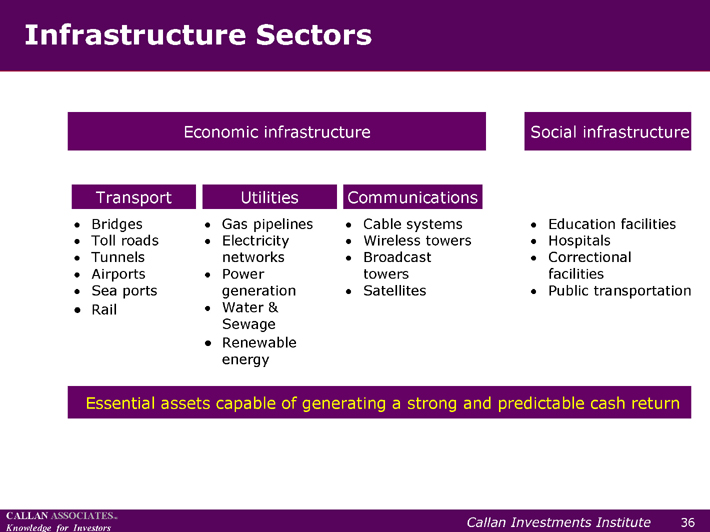
??Infrastructure can be divided into two broad sectors: economic infrastructure and
social infrastructure. Assets related to transportation, utilities, and communications
fall under the economic sector and whereas more service-oriented assets such as
educational and correctional facilities, public transportation, and hospitals comprise
the social sector. Despite their differences, these two sectors have one characteristic
in common: they both consist of essential assets capable of generating a strong and
predictable cash return.
RP-36
CALLAN ASSOCIATESINC
Knowledge for Investors Callan Investments Institute
Infrastructure Sectors
Economic infrastructure Social infrastructure
Transport Utilities Communications
• Bridges
• Toll roads
• Tunnels
• Airports
• Sea ports
• Rail
• Gas pipelines
• Electricity
networks
• Power
generation
• Water &
Sewage
• Renewable
energy
• Cable systems
• Wireless towers
• Broadcast
towers
• Satellites
• Education facilities
• Hospitals
• Correctional
facilities
• Public transportation
Essential assets capable of generating a strong and predictable cash return
36

CALLAN ASSOCIATESINC
Knowledge for Investors Callan Investments Institute
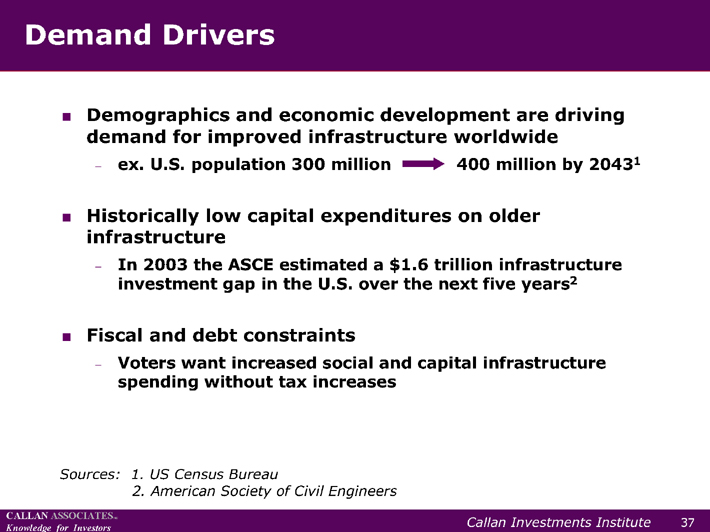
??There are a variety of factors driving demand for infrastructure assets today. First and
foremost is demographics. Given current population projections, existing
infrastructure capacity will simply not be enough to meet future needs. In addition,
capital expenditures on infrastructure have historically been low. In fact, the America
Society of Civil Engineers estimates that there will be a $1.6 trillion infrastructure
investment gap in the U.S. over the next five years. Fiscal and debt constraints also
play a role. Voters want the services infrastructure assets provide but they don’t
necessarily want to pay the taxes needed to fund them. Together, these factors
provide some compelling reasons to invest.
RP-37
CALLAN ASSOCIATESINC
Knowledge for Investors Callan Investments Institute
Sources: 1. US Census Bureau
2. American Society of Civil Engineers
Demand Drivers
??Demographics and economic development are driving
demand for improved infrastructure worldwide
? ex. U.S. population 300 million 400 million by 20431
??Historically low capital expenditures on older
infrastructure
? In 2003 the ASCE estimated a $1.6 trillion infrastructure
investment gap in the U.S. over the next five years2
??Fiscal and debt constraints
? Voters want increased social and capital infrastructure
spending without tax increases
37

CALLAN ASSOCIATESINC
Knowledge for Investors Callan Investments Institute
??Before we explore infrastructure further, it’s helpful to understand how the asset class
has evolved. The concept of infrastructure investment was pioneered in Australia. As
the Australian’s appetite for real assets grew, infrastructure became a prime candidate.
Reforms in the pension systems led to increasing contributions at a time when the
public sector could not meet the investment need of infrastructure. Canadian and
European funds soon followed suit. Shown here are four such funds and their target
long-term allocations to infrastructure.
RP-38

CALLAN ASSOCIATESINC
Knowledge for Investors Callan Investments Institute
* |
| Long-term target allocations |
** Inclusive of private market investments
Brief History
??The early 1990s
? Government mandated reforms in the Australian pension
systems lead to large increases in contributions that
coincide a with pressing need for investments in
infrastructure that the public sector could not meet.
??Allocations to infrastructure adopted as a result
? Canadian and European funds follow:
??Ontario Municipal Employees’ Retirement System—15%*
??Ontario Teachers—10%*
??Canada Pension Plan—10%*
??Fonds des Reserve pour les Tetraites (France)—10%**
38
CALLAN ASSOCIATESINC
Knowledge for Investors Callan Investments Institute
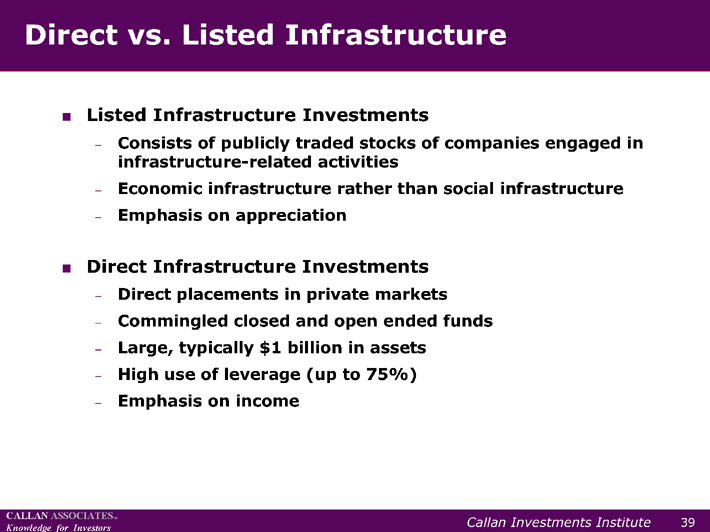
??There are two methods for investing in infrastructure. The first is by purchasing
publicly traded stock in companies that operate in infrastructure or own infrastructure
assets. This method generally emphasizes appreciation rather than cash flow.
??The second method is via direct placements in private markets or through commingled
closed and open-end funds, which emphasizes the income component of return. These
investments typically target $1 billion in assets and are highly leveraged because the
cash flows are very predictable.
RP-39
CALLAN ASSOCIATESINC
Knowledge for Investors Callan Investments Institute
Direct vs. Listed Infrastructure
??Listed Infrastructure Investments
? Consists of publicly traded stocks of companies engaged in
infrastructure-related activities
? Economic infrastructure rather than social infrastructure
? Emphasis on appreciation
??Direct Infrastructure Investments
? Direct placements in private markets
? Commingled closed and open ended funds
? Large, typically $1 billion in assets
? High use of leverage (up to 75%)
? Emphasis on income
39

CALLAN ASSOCIATESINC
Knowledge for Investors Callan Investments Institute
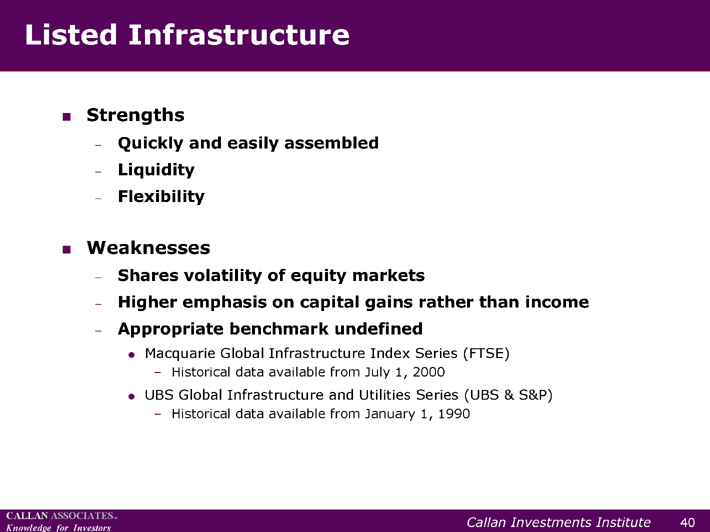
??Listed infrastructure investments have some important benefits, including the fact
that they are quickly and easily assembled, liquid, and flexible. On the other hand,
these types of investments have volatility similar to equities, as well as an emphasis
on appreciation, which may not be a desirable feature for plan sponsors seeking
income. In addition, an appropriate benchmark has yet to be defined, though some
indexes are in the process of being developed.
RP-40
CALLAN ASSOCIATESINC
Knowledge for Investors Callan Investments Institute
Listed Infrastructure
??Strengths
? Quickly and easily assembled
? Liquidity
? Flexibility
??Weaknesses
? Shares volatility of equity markets
? Higher emphasis on capital gains rather than income
? Appropriate benchmark undefined
??Macquarie Global Infrastructure Index Series (FTSE)
– Historical data available from July 1, 2000
??UBS Global Infrastructure and Utilities Series (UBS & S&P)
– Historical data available from January 1, 1990
40
CALLAN ASSOCIATESINC
Knowledge for Investors Callan Investments Institute
??Moving on to direct infrastructure investing, the strengths of this method include the
fact that the assets are monopolistic in nature and therefore, provide a high level of
cash flow. In addition, price volatility is relatively low due to the appraisal-based
valuation process.
??One of the challenges with direct infrastructure investing, however, is that
transactions tend to very large and involve very complex financial structures, making
it difficult for the common investor to get through the many layers of capital
structures involved. Furthermore, valuations may not be accurate because they are
based in discounted cash flow analysis that relies on projections of utilization rates.
Another weakness is that many strategies lack a clear exit strategy. Lastly, as with
listed infrastructures, there is no clearly defined benchmark as of yet.
RP-41
CALLAN ASSOCIATESINC
Knowledge for Investors Callan Investments Institute
Direct Infrastructure Investing
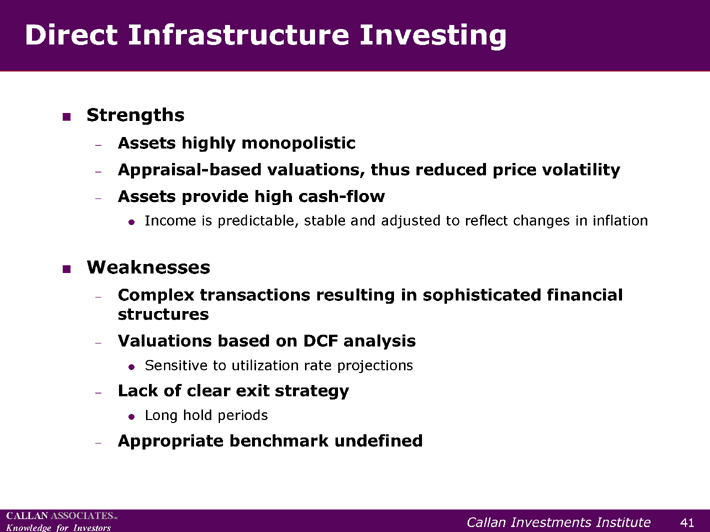
??Strengths
? Assets highly monopolistic
? Appraisal-based valuations, thus reduced price volatility
? Assets provide high cash-flow
??Income is predictable, stable and adjusted to reflect changes in inflation
??Weaknesses
? Complex transactions resulting in sophisticated financial
structures
? Valuations based on DCF analysis
??Sensitive to utilization rate projections
? Lack of clear exit strategy
??Long hold periods
? Appropriate benchmark undefined
41
CALLAN ASSOCIATESINC
Knowledge for Investors Callan Investments Institute
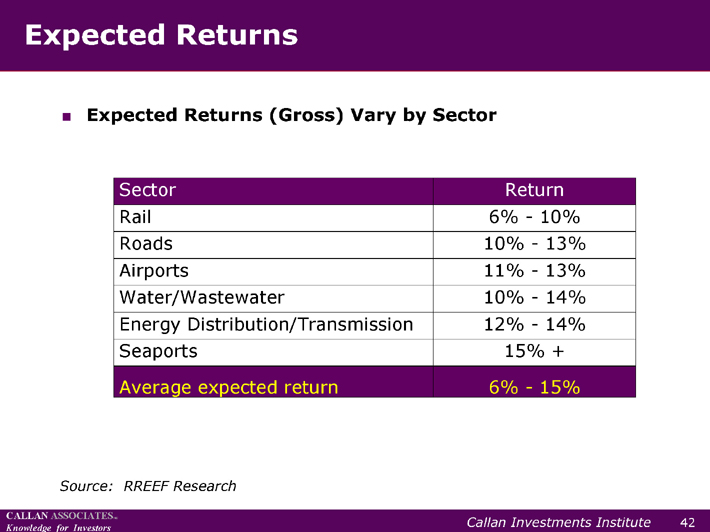
??This chart shows expected gross returns by sector. Typically the largest component
(more than three quarters) of total return is from income, while appreciation accounts
for about 25%.
??Very mature assets, or “brown field assets”, tend to have returns that fall in the lower
end of the range. Because these assets already exist and usually have a strong history
of predictable cash flows, they are inherently less risky. Conversely, “green field
assets”, or assets yet to be fully developed, entail greater risks and therefore,
generate higher returns.
RP-42
CALLAN ASSOCIATESINC
Knowledge for Investors Callan Investments Institute
Expected Returns
??Expected Returns (Gross) Vary by Sector
Sector Return
Rail 6%—10%
Roads 10%—13%
Airports 11%—13%
Water/Wastewater 10%—14%
Energy Distribution/Transmission 12%—14%
Seaports 15% +
Average expected return 6%—15%
Source: RREEF Research
42

CALLAN ASSOCIATESINC
Knowledge for Investors Callan Investments Institute
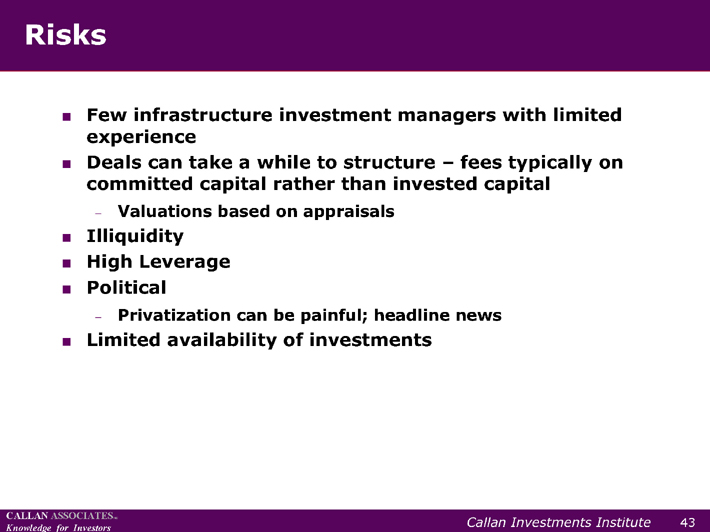
??Before entering the infrastructure space, there are certain risks to be aware of. First,
there are a relatively small number of infrastructure managers, some of whom have
limited experience. Second, deals are typically very large and take a while to structure.
Fees are usually on committed capital, rather than invested capital, so an investor
may be paying fees on money that is not yet being put to work. Illiquidity is another
risk, as is the highly leveraged nature of the deals. There may also be political risks
involved as well; privatization can be a high-profile process garnering unwanted
publicity. Lastly, the availability of investments is limited. Because of this fact, there
are usually several investment managers looking at any one asset, which can
substantially drive up prices.
RP-43
CALLAN ASSOCIATESINC
Knowledge for Investors Callan Investments Institute
Risks
??Few infrastructure investment managers with limited
experience
??Deals can take a while to structure – fees typically on
committed capital rather than invested capital
? Valuations based on appraisals
??Illiquidity
??High Leverage
??Political
? Privatization can be painful; headline news
??Limited availability of investments
43
CALLAN ASSOCIATESINC
Knowledge for Investors Callan Investments Institute
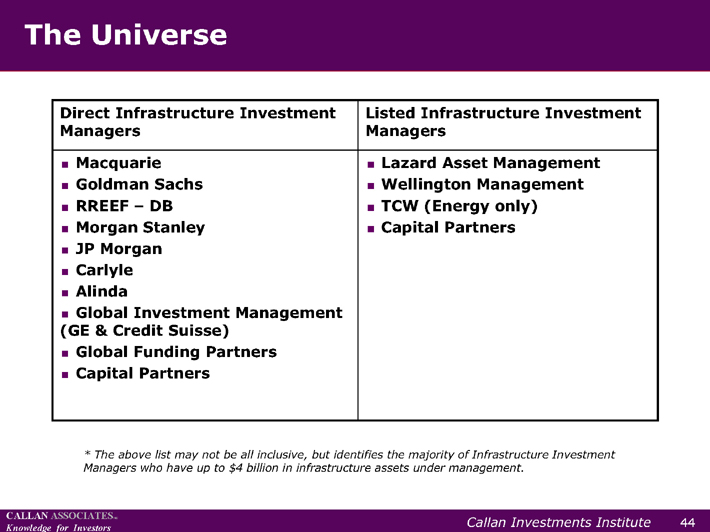
??The universe of infrastructure investment managers changes almost daily. Here we
provide a list of the majority of these managers, who have up to $4 billion in assets
under management. Some of these managers have a longer history than others;
some specialize in a particular sub-sector; and certain managers have a hybrid
strategy.
RP-44
CALLAN ASSOCIATESINC
Knowledge for Investors Callan Investments Institute
The Universe
??Lazard Asset Management
??Wellington Management
??TCW (Energy only)
??Capital Partners
??Macquarie
??Goldman Sachs
??RREEF – DB
??Morgan Stanley
??JP Morgan
??Carlyle
??Alinda
??Global Investment Management
(GE & Credit Suisse)
??Global Funding Partners
??Capital Partners
Listed Infrastructure Investment
Managers
Direct Infrastructure Investment
Managers
* |
| The above list may not be all inclusive, but identifies the majority of Infrastructure Investment |
Managers who have up to $4 billion in infrastructure assets under management.
44
CALLAN ASSOCIATESINC
Knowledge for Investors Callan Investments Institute
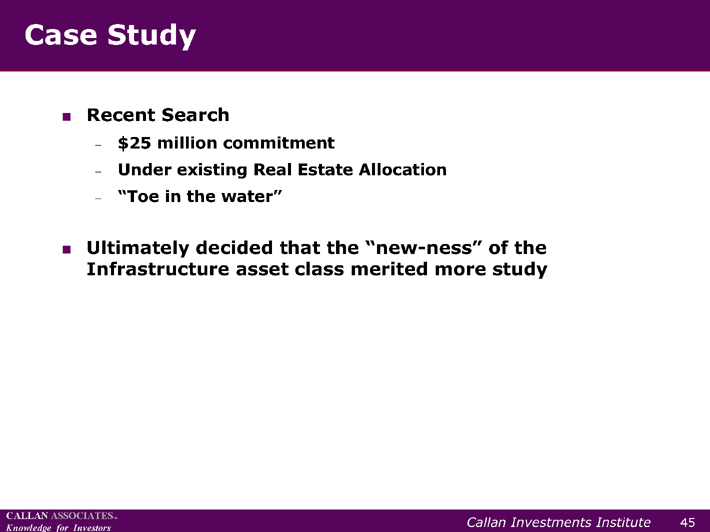
??The following is a brief client case study overview. Our client had a $25 million
commitment and sought to invest within their real estate allocation. We conducted a
manager search and identified 11 managers who were able to take investments at
that time. Initially, the client’s decision to enter the infrastructure market was
somewhat of a “toe in the water” test. If it proved successful, they were prepared to
invest more in the strategy. Ultimately, however, the client decided to take a slower
approach and we continue to work with them, helping to build their knowledge and
comfort level with infrastructure investing.
??In closing, most investors, like this client, view infrastructure as real estate due to the
fact that infrastructures are long-lived assets where the bulk of return is derived from
income. We believe that in time, as the market continues to expand, infrastructure
will become its own asset category.
RP-45
CALLAN ASSOCIATESINC
Knowledge for Investors Callan Investments Institute
Case Study
??Recent Search
? $25 million commitment
? Under existing Real Estate Allocation
? “Toe in the water”
??Ultimately decided that the “new-ness” of the
Infrastructure asset class merited more study
45

CALLAN ASSOCIATESINC
Knowledge for Investors
Callan Investments Institute
101 California Street, Suite 3500
San Francisco, CA 94111
phone 415.974.5060 fax 415.274.3049 www.callan.com
For more information about Callan Investments Institute,
please contact Gina Falsetto at 415.974.5060 or institute@callan.com.
The Callan Investments Institute is, and will be, the sole owner and copyright holder of all material
prepared or developed by the Institute. All Institute Clients shall understand that they do not have the
right to reproduce, revise, resell, disseminate externally, disseminate to subsidiaries, or post on internal
web sites any part of any material prepared or developed by the Institute, without the Institute’s
permission. All Institute Clients understand that they are subscribing only to the right to utilize such
material internally in their business. All Institute clients shall understand that Institute material is for use
only within the Institute Client firm, and not to be shared with subsidiaries or parent companies.
Russell Investments Russell Research By: Adam Babson, Senior Portfolio Analyst AUGUST 2011Tamara Larsen, Senior Research Analyst Structuring a private infrastructure portfolio As a real asset category, infrastructure offers risk, return and diversification characteristics distinct from those of other asset classes, and thus merits consideration for allocation in a diversified portfolio. Infrastructure investments can feature steady cash flows derived from tangible, long-lived assets with monopolistic-like pricing power; many are regulated and may feature income linked directly to inflation. The relatively noncompetitive position of the assets is driven by high barriers to entry due to the considerable fixed costs required in development, as well as a high degree of regulation. “Pure play” infrastructure assets—which include toll roads, regulated utilities, airports, seaports and cell towers—are essential to the fluid, effective functioning of societies, and accordingly reflect highly inelastic demand patterns. Infrastructure investment can be implemented through both listed vehicles and unlisted (or direct) vehicles. Introduction The distinction between listed and unlisted infrastructure is akin to that between listed and unlisted real estate: listed instruments offer daily liquidity, lower fees, lower leverage and, generally, better transparency. Private equity-style unlisted infrastructure offers higher return potential and exposure to “pure play” infrastructure assets. The investments included in unlisted vehicles are typically valued less frequently than those in listed infrastructure, for which daily pricing is available. Similarly to real estate open-end funds, infrastructure valuations based on appraisals can produce a “smoothing” and lagging effect, and, similarly to traditional private equity funds, unlisted infrastructure funds have accounting frameworks that can contribute to lower volatility than that associated with other major asset classes. Unlisted infrastructure funds’ targeting of institutional investors began in the early 1990s. The unlisted infrastructure market had global assets under management of $48 billion as of Russell Investments // Structuring a private infrastructure portfolio
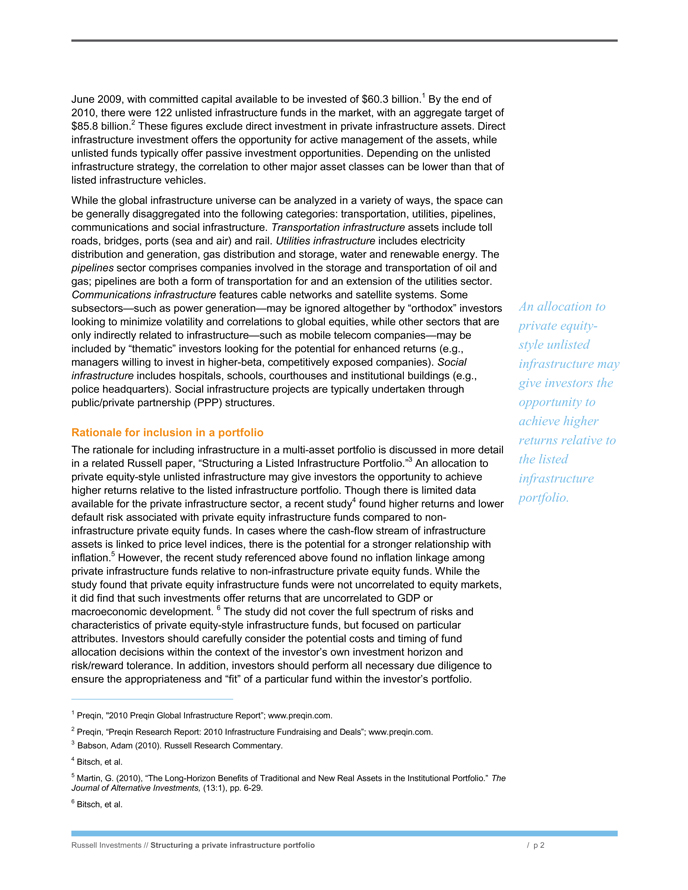
June 2009, with committed capital available to be invested of $60.3 billion.1 By the end of 2010, there were 122 unlisted infrastructure funds in the market, with an aggregate target of $85.8 billion.2 These figures exclude direct investment in private infrastructure assets. Direct infrastructure investment offers the opportunity for active management of the assets, while unlisted funds typically offer passive investment opportunities. Depending on the unlisted infrastructure strategy, the correlation to other major asset classes can be lower than that of listed infrastructure vehicles. While the global infrastructure universe can be analyzed in a variety of ways, the space can be generally disaggregated into the following categories: transportation, utilities, pipelines, communications and social infrastructure. Transportation infrastructure assets include toll roads, bridges, ports (sea and air) and rail. Utilities infrastructure includes electricity distribution and generation, gas distribution and storage, water and renewable energy. The pipelines sector comprises companies involved in the storage and transportation of oil and gas; pipelines are both a form of transportation for and an extension of the utilities sector. Communications infrastructure features cable networks and satellite systems. Some subsectors—such as power generation—may be ignored altogether by “orthodox” investors looking to minimize volatility and correlations to global equities, while other sectors that are only indirectly related to infrastructure—such as mobile telecom companies—may be included by “thematic” investors looking for the potential for enhanced returns (e.g., managers willing to invest in higher-beta, competitively exposed companies). Social infrastructure includes hospitals, schools, courthouses and institutional buildings (e.g., police headquarters). Social infrastructure projects are typically undertaken through public/private partnership (PPP) structures. Rationale for inclusion in a portfolio The rationale for including infrastructure in a multi-asset portfolio is discussed in more detail in a related Russell paper, “Structuring a Listed Infrastructure Portfolio.”3 An allocation to private equity-style unlisted infrastructure may give investors the opportunity to achieve higher returns relative to the listed infrastructure portfolio. Though there is limited data available for the private infrastructure sector, a recent study4 found higher returns and lower default risk associated with private equity infrastructure funds compared to non-infrastructure private equity funds. In cases where the cash-flow stream of infrastructure assets is linked to price level indices, there is the potential for a stronger relationship with inflation.5 However, the recent study referenced above found no inflation linkage among private infrastructure funds relative to non-infrastructure private equity funds. While the study found that private equity infrastructure funds were not uncorrelated to equity markets, it did find that such investments offer returns that are uncorrelated to GDP or macroeconomic development. 6 The study did not cover the full spectrum of risks and characteristics of private equity-style infrastructure funds, but focused on particular attributes. Investors should carefully consider the potential costs and timing of fund allocation decisions within the context of the investor’s own investment horizon and risk/reward tolerance. In addition, investors should perform all necessary due diligence to ensure the appropriateness and “fit” of a particular fund within the investor’s portfolio. An allocation to private equity-style unlisted infrastructure may give investors the opportunity to achieve higher returns relative to the listed infrastructure portfolio. 1 Preqin, “2010 Preqin Global Infrastructure Report”; www.preqin.com. 2 Preqin, “Preqin Research Report: 2010 Infrastructure Fundraising and Deals”; www.preqin.com. 3 Babson, Adam (2010). Russell Research Commentary. 4 Bitsch, et al. 5 Martin, G. (2010), “The Long-Horizon Benefits of Traditional and New Real Assets in the Institutional Portfolio.” The Journal of Alternative Investments, (13:1), pp. 6-29. 6 Bitsch, et al. Russell Investments // Structuring a private infrastructure portfolio / p 2
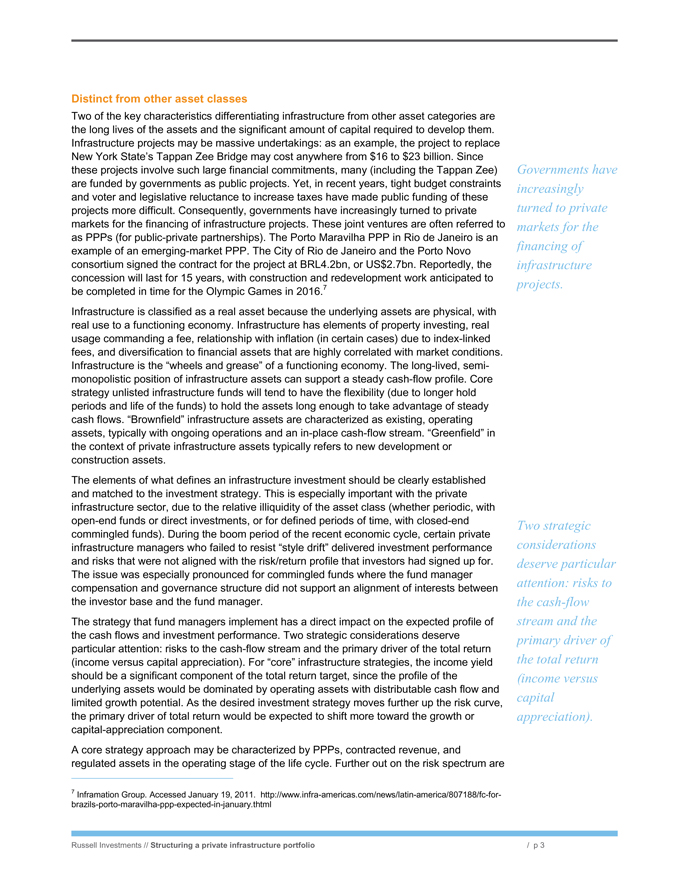
Distinct from other asset classes Two of the key characteristics differentiating infrastructure from other asset categories are the long lives of the assets and the significant amount of capital required to develop them. Infrastructure projects may be massive undertakings: as an example, the project to replace New York State’s Tappan Zee Bridge may cost anywhere from $16 to $23 billion. Since these projects involve such large financial commitments, many (including the Tappan Zee) are funded by governments as public projects. Yet, in recent years, tight budget constraints and voter and legislative reluctance to increase taxes have made public funding of these projects more difficult. Consequently, governments have increasingly turned to private markets for the financing of infrastructure projects. These joint ventures are often referred to as PPPs (for public-private partnerships). The Porto Maravilha PPP in Rio de Janeiro is an example of an emerging-market PPP. The City of Rio de Janeiro and the Porto Novo consortium signed the contract for the project at BRL4.2bn, or US$2.7bn. Reportedly, the concession will last for 15 years, with construction and redevelopment work anticipated to be completed in time for the Olympic Games in 2016.7 Infrastructure is classified as a real asset because the underlying assets are physical, with real use to a functioning economy. Infrastructure has elements of property investing, real usage commanding a fee, relationship with inflation (in certain cases) due to index-linked fees, and diversification to financial assets that are highly correlated with market conditions. Infrastructure is the “wheels and grease” of a functioning economy. The long-lived, semi-monopolistic position of infrastructure assets can support a steady cash-flow profile. Core strategy unlisted infrastructure funds will tend to have the flexibility (due to longer hold periods and life of the funds) to hold the assets long enough to take advantage of steady cash flows. “Brownfield” infrastructure assets are characterized as existing, operating assets, typically with ongoing operations and an in-place cash-flow stream. “Greenfield” in the context of private infrastructure assets typically refers to new development or construction assets. The elements of what defines an infrastructure investment should be clearly established and matched to the investment strategy. This is especially important with the private infrastructure sector, due to the relative illiquidity of the asset class (whether periodic, with open-end funds or direct investments, or for defined periods of time, with closed-end commingled funds). During the boom period of the recent economic cycle, certain private infrastructure managers who failed to resist “style drift” delivered investment performance and risks that were not aligned with the risk/return profile that investors had signed up for. The issue was especially pronounced for commingled funds where the fund manager compensation and governance structure did not support an alignment of interests between the investor base and the fund manager. The strategy that fund managers implement has a direct impact on the expected profile of the cash flows and investment performance. Two strategic considerations deserve particular attention: risks to the cash-flow stream and the primary driver of the total return (income versus capital appreciation). For “core” infrastructure strategies, the income yield should be a significant component of the total return target, since the profile of the underlying assets would be dominated by operating assets with distributable cash flow and limited growth potential. As the desired investment strategy moves further up the risk curve, the primary driver of total return would be expected to shift more toward the growth or capital-appreciation component. A core strategy approach may be characterized by PPPs, contracted revenue, and regulated assets in the operating stage of the life cycle. Further out on the risk spectrum are 7 Inframation Group. Accessed January 19, 2011. http://www.infra-americas.com/news/latin-america/807188/fc-for-brazils-porto-maravilha-ppp-expected-in-january.thtml
Governments have increasingly turned to private markets for the financing of infrastructure projects. Two strategic considerations deserve particular attention: risks to the cash-flow stream and the primary driver of the total return (income versus capital appreciation). Russell Investments // Structuring a private infrastructure portfolio / p 3
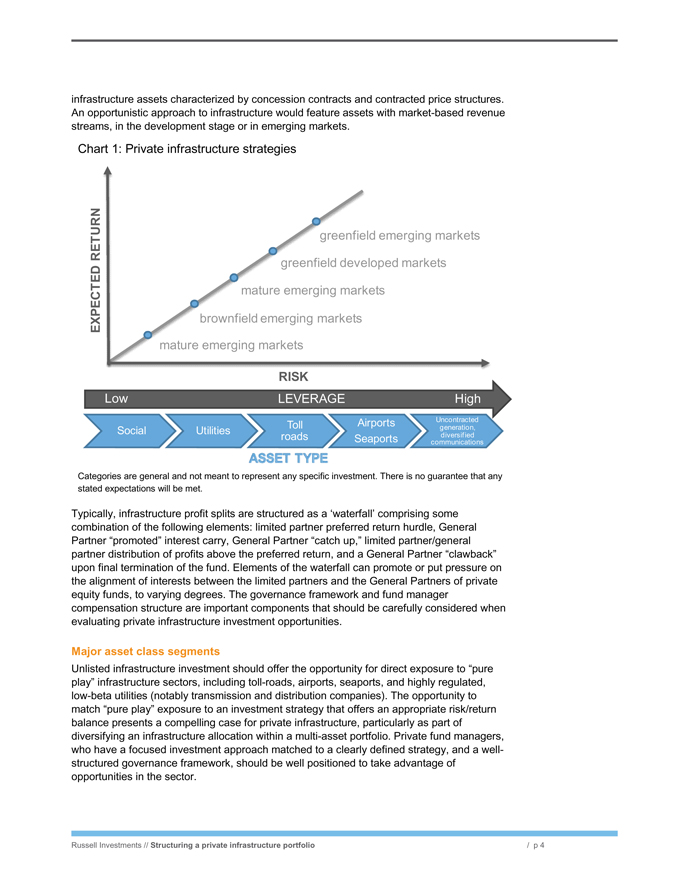
infrastructure assets characterized by concession contracts and contracted price structures. An opportunistic approach to infrastructure would feature assets with market-based revenue streams, in the development stage or in emerging markets. Chart 1: Private infrastructure strategies EXPECTED RETURN greenfield emerging markets greenfield developed markets mature emerging markets brownfield emerging markets mature emerging markets RISK Low LEVERAGE High Social Utilities Toll roads Airports Seaports Uncontracted generation, diversified communications ASSET TYPE Categories are general and not meant to represent any specific investment. There is no guarantee that any stated expectations will be met. Typically, infrastructure profit splits are structured as a ‘waterfall’ comprising some combination of the following elements: limited partner preferred return hurdle, General Partner “promoted” interest carry, General Partner “catch up,” limited partner/general partner distribution of profits above the preferred return, and a General Partner “clawback” upon final termination of the fund. Elements of the waterfall can promote or put pressure on the alignment of interests between the limited partners and the General Partners of private equity funds, to varying degrees. The governance framework and fund manager compensation structure are important components that should be carefully considered when evaluating private infrastructure investment opportunities. Major asset class segments Unlisted infrastructure investment should offer the opportunity for direct exposure to “pure play” infrastructure sectors, including toll-roads, airports, seaports, and highly regulated, low-beta utilities (notably transmission and distribution companies). The opportunity to match “pure play” exposure to an investment strategy that offers an appropriate risk/return balance presents a compelling case for private infrastructure, particularly as part of diversifying an infrastructure allocation within a multi-asset portfolio. Private fund managers, who have a focused investment approach matched to a clearly defined strategy, and a well-structured governance framework, should be well positioned to take advantage of opportunities in the sector. Russell Investments // Structuring a private infrastructure portfolio / p 4

Unlisted infrastructure investment offers segmentation by strategy as well. As in private real estate, the strategies tend to be defined as core, value-add and opportunistic. In theory, core strategy funds would offer “pure play” exposure with lower-risk capital structuring and underlying risk to the cash-flow stream. At the other end of the spectrum, opportunistic strategies would include “greenfield” or new-construction investments, and would generally be structured with higher risk exposures to the cash flow stream. During the boom period of the most recent economic cycle, “style drift” issues at the fund manager level undermined the strategy implementation for certain funds. In the aftermath of the global financial crisis, it is expected that lessons learned will translate to increased strategy differentiation among private infrastructure managers going forward. In the early years of private infrastructure funds, the sector was dominated by Australia-only and Europe-only funds, with opportunistic funds often focusing on emerging markets or China. During the boom period of the last economic cycle, private infrastructure funds that targeted multiple regions – i.e., global infrastructure funds – gained traction. However, in the wake of the global financial crisis, more regionally targeted funds have emerged (i.e., U.S., Mexico and Africa). Traditionally, the broad regional target zones were North America, Europe and “Asia and Rest of World.”
It is also worth mentioning that there tend to be regional differences in fund structure, with certain regional or globally focused funds structured as closed-end funds, and others as open-end funds. These two approaches to fund structures are discussed in more detail below. Benchmarks The data available for private infrastructure’s performance, volatility and correlation relative to other major asset classes is very limited. While there are indications that private infrastructure indexes constructed similarly to other private investments are in development, as of the date of this paper, such indexes are not yet in place. If and when such indexes are available, we expect that they will have issues similar to those of other private indexes, including appraisals and reporting biases. In theory, listed infrastructure could be used as the base return, with a basis point spread added to take into account the increased asset concentration and liquidity risks associated with private investment. However, the benchmarks for the listed infrastructure sector are a “best available” index set, as discussed in more detail in our companion paper, “Structuring a Listed Infrastructure Portfolio.” Moreover, we expect listed infrastructure securities to exhibit different return patterns relative to private infrastructure. Traditionally, private infrastructure funds have used a total (absolute) return target. An advantage of the total return approach over a longer time horizon (+10 years) is that it is more likely to span a full market cycle. It brings into focus the periodic illiquidity of the open-end fund sector and orients the investor toward a longer investment horizon, rather than toward “timed” investment in the sector (which can be challenging to implement, from a practical perspective). The total return approach is consistent with that used for private equity funds and closed-end real estate funds. Liquidity issues Liquidity risk in private infrastructure investment is highly comparable to that of other forms of private equity investment. Globally, the private equity-style infrastructure commingled funds tend to be structured as closed-end vehicles, with “lockup” periods of 10 to 15 years. Open-end funds offer periodic (typically quarterly) opportunities for acquisition or redemption of shares, subject to fund liquidity. There are open-end funds available in the In the aftermath of the global financial crisis, it is expected that lessons learned will translate to increased strategy differentiation among private infrastructure managers going forward. Russell Investments // Structuring a private infrastructure portfolio / p 5
market, particularly in Australia. Globally, however, there are limited institutional open-end funds targeting developed markets. Open-end funds tend to offer the opportunity for quarterly liquidity, and tend also to have more frequent external appraisals of the underlying assets. The advantage of open-end funds is the long-term investment horizon, which enables the fund manager to choose the appropriate time to buy/sell assets on the basis of market conditions, rather than on the term of the fund. Frequent independent appraisals of underlying assets can support private infrastructure investments’ being more responsive to changes in market conditions. Challenges with open-end funds generally relate to periods of illiquidity, where contribution or redemption queues may form for investors seeking to enter/exit a particular fund, and to issues pertaining to matching a fund’s strategy to its structure. For instance, Russell believes that opportunistic and higher-risk strategies that are more growth oriented pose challenges to ongoing liquidity (cash distributions and redemption distributions, as applicable), due to the “lumpiness” of the cash-flow streams that typically characterize opportunistic investments. The in-place income streams associated with assets purchased for core strategy funds are a better fit for the open-end structure. Closed-end funds tend to offer the opportunity to access higher-risk strategies and to diversify vintage year exposure. Closed-end funds tend to have defined “lockup” periods, during which investors cannot redeem their capital contributions; periodic distributions of cash, and of capital event proceeds (i.e., proceeds from sales or refinancing), are then the sources of liquidity. The “lumpiness” of the cash-flow stream associated with higher-risk investment strategies is well matched to the closed-end fund structure, which insulates the fund manager from pressures to provide quarterly liquidity to investors; rather than focusing on the cash-management aspects of offering quarterly liquidity to investors, the fund manager can focus solely on selecting and managing investments to drive value. However, one of the key drawbacks of the closed-end fund structure is the semi-hard termination date (typically, the date can be extended by 1 to 2 years), which potentially creates a situation wherein the sale of the portfolio is vulnerable to the state of the market at a given time. Cash flow Infrastructure characteristics—such as government-guaranteed monopoly and the provision of essential services—can translate to cash flows that are very predictable. These predictable cash flows may garner high credit ratings and result in very reasonable borrowing costs compared to those associated with most real estate assets. On the flip side, heavy government involvement may spell close government scrutiny to asset behavior, potentially resulting in more modest returns than what might be associated with other private markets. A recent study of private equity infrastructure found that regulatory frameworks do have an impact on returns. Results from the study suggested that deals in the transportation sector had significantly higher returns than those in other infrastructure sectors.8 Relative to the utilities and energy sectors, the transportation infrastructure sector is associated with a lower degree of independent regulation. As discussed above, the strategy a fund manager implements has a direct impact on the profile of the expected cash flows and investment performance. As the investment strategy moves up the risk curve, the primary driver of the total return should shift away from the income yield component and toward the growth or capital appreciation component. Additionally, the structure of the fund can influence investors’ cash flow expectations, with the cash flows from open-end funds being more oriented to income/yield generation.
8 Bitsch, et al. Infrastructure characteristics—such as government-guaranteed monopoly and the provision of essential services—can translate to cash flows that are very predictable. Russell Investments // Structuring a private infrastructure portfolio / p 6
Active management potential and common strategies Private infrastructure fund managers are positioned to screen the investment universe for companies with “pure play” infrastructure characteristics. Niche investment strategies, if structured well, and with the right sponsorship, can offer a compelling investment case. The following are two examples of niche or focused investment strategies that may be gaining momentum: Infrastructure debt funds. For underlying “core” operating assets that are generating cash flow, private infrastructure debt opportunities may offer a compelling risk-adjusted return relative to private equity. As of the date of this report, timing does appear to be favorable for this segment of the private infrastructure market, since there are fewer debt providers since the financial crisis yet there continues to be significant demand and an expectation for future demand for infrastructure spending in developed and emerging markets (while, at the same time, many municipalities continue to face tightening budget constraints). There are also higher-return seeking infrastructure debt funds that provide construction or mezzanine debt for new infrastructure projects (or expansions of existing projects), which may provide investors with a lower risk alternative relative to equity investment, particularly for accessing emerging markets (if structured and underwritten appropriately). Sector-focused funds, such as renewable energy. The availability of infrastructure funds focused on the renewable energy sector has increased, with traditional private equity and real estate investment managers increasingly active in the space. Within renewable energy, a fund may be diversified across wind power, biomass (i.e., conversion of waste to energy), solar and small-scale hydro. The sector focus is a nod to how critical specialized expertise is to navigating through and accessing government resources, particularly in the renewables sector. The focus of state and national governments on reaching defined goals pertaining to use of renewables over the next few decades is expected to support demand. Regionally focused infrastructure funds are becoming increasingly common. The regional focus may enhance fund managers’ ability to cultivate specialized expertise in navigating and accessing the government resources that play a key role in regulating and financing large-scale infrastructure projects. For instance, a recent study found that European private equity infrastructure investments had consistently higher returns than non-European private equity infrastructure investments.9 The study also found that the regulatory framework impacted returns. Regulatory frameworks can vary dramatically by country, and regionally focused funds may be best positioned to navigate existing frameworks and to be responsive to changes. Debt strategies for private infrastructure funds vary. Due to the relatively large size of infrastructure assets, debt is often used to enable fund managers to procure larger investment portfolios and to potentially enhance returns. Depending on the profile of the cash-flow stream associated with a given infrastructure asset, lenders may be willing to provide a significant amount of debt capital. Lenders tend to size the debt on the basis of the risk profile of the underlying cash flows. Thus, “core” infrastructure assets that offer stable, predictable cash flows can have leverage levels that are more commonly associated with opportunistic investment strategies in other private asset classes. Depending on the risk profile of a fund manager’s stated investment strategy, the leverage level should reflect a balance between the greater financial risk that comes with leverage and the potential benefit of lowering a fund’s weighted average cost of capital. 9 Bitsch, et al. For underlying “core” operating assets that are generating cash flow, private infrastructure debt opportunities may offer a compelling risk-adjusted return relative to private equity. For institutional investors.we believe an allocation to private infrastructure can offer diversification benefits within a broader multi-asset-class portfolio. Russell Investments // Structuring a private infrastructure portfolio / p 7
Model weights within the asset class For institutional investors, depending on their unique liquidity needs and other structural considerations, we believe an allocation to private infrastructure can offer diversification benefits within a broader multi-asset-class portfolio. Given the variation in returns by geographic region and regulatory framework, globally diversified exposure is expected to benefit investors allocating to unlisted private infrastructure. In many cases, basing fund allocations on the strategy’s revenue risk and sector allocations can result in a portfolio that matches the risk/return preferences of the investor. Conclusion There is an enormous need for private-sector investment in infrastructure globally, in both developed and developing economies. Four years ago, Strategy+Business magazine estimated that modernizing and expanding global infrastructure would require approximately $41 trillion over ~25 years.10 Given the essential role of infrastructure assets in serving as the backbone for economic growth, and in light of the growing trend toward privatization of these assets, the sector is very much an emerging asset class in its own right, offering investors the potential for a strong source of diversification, yield and attractive total returns from a total portfolio context. Private infrastructure investments should give investors the opportunity to complement a listed infrastructure portfolio by offering the potential for higher returns and “pure play” exposure. Going forward, Russell expects more strategy differentiation in investment allocations among unlisted private funds. RELATED READING Babson, Adam (2010). “Structuring a Listed Infrastructure Portfolio.” Russell Research Commentary. Available online at http://www.russell.com/institutional/research_commentary/PDF/Structuring_a_listed_infrastr ucture_portfolio_.pdf.
Beeferman, Larry W. (2008). “Pension Fund Investment in Infrastructure: A Resource Paper.” Pensions and Capital Stewardship Project, Labor and Worklife Program, Harvard Law School. Accessed July 28, 2011 at http://www.community-wealth.org/_pdfs/articles-publications/state-local/article-beeferman.pdf.
Bitsch, Florian, Axel Buchner and Christoph Kaserer (2010). “Risk, Return and Cash Flow Characteristics of Infrastructure Fund Investments.” Accessed July 28, 2011 at http://efmaefm.org/0EF MSYMPOSIUM/Toronto-2011/papers/bitsch.pdf.
Inderst, G. (2009). “Pension Fund Investment in Infrastructure,” OECD Working Papers on Insurance and Private Pensions, No. 32. OECD Publishing. © OECD. doi:10.1787/227416754242
Martin, G. (2010). “The Long-Horizon Benefits of Traditional and New Real Assets in the Institutional Portfolio.” The Journal of Alternative Investments (13:1), pp. 6–29. http://www.cfainstitute.org.
Preqin. “Preqin Research Report: 2010 Infrastructure Fundraising and Deals.” http://www.preqin.com.
10 “Lights! Water! Motion!” Strategy+Business magazine (Spring 2007). Booz Allen Hamilton, Inc.
Russell Investments // Structuring a private infrastructure portfolio / p 8
For more information:
Call Russell at 800-426-8506 or visit www.russell.com/institutional
Important information Nothing contained in this material is intended to constitute legal, tax, securities, or investment advice, nor an opinion regarding the appropriateness of any investment, nor a solicitation of any type. The general information contained in this publication should not be acted upon without obtaining specific legal, tax, and investment advice from a licensed professional. These views are subject to change at any time based upon market or other conditions and are current as of the date at the beginning of the document. The opinions expressed in this material are not necessarily those held by Russell Investments, its affiliates or subsidiaries. While all material is deemed to be reliable, accuracy and completeness cannot be guaranteed. The information, analysis and opinions expressed herein are for general information only and are not intended to provide specific advice or recommendations for any individual or entity. Please remember that all investments carry some level of risk, including the potential loss of principal invested. They do not typically grow at an even rate of return and may experience negative growth. As with any type of portfolio structuring, attempting to reduce risk and increase return could, at certain times, unintentionally reduce returns. Diversification does not assure a profit and does not protect against loss in declining markets. Investments in infrastructure-related companies have greater exposure to the potential adverse economic, regulatory, political and other changes affecting such entities. Investment in infrastructure-related companies are subject to various risks including governmental regulations, high interest costs associated with capital construction programs, costs associated with compliance and changes in environmental regulation, economic slowdown and surplus capacity, competition from other providers of services and other factors. Investment in non-U.S. and emerging market securities is subject to the risk of currency fluctuations and to economic and political risks associated with such foreign countries. The trademarks, service marks and copyrights related to the Russell indexes and other materials as noted are the property of their respective owners. Indexes and/or benchmarks are unmanaged and cannot be invested in directly. Returns represent past performance, are not a guarantee of future performance, and are not indicative of any specific investment. Russell Investment Group, a Washington USA corporation, operates through subsidiaries worldwide, including Russell Investments, and is a subsidiary of The Northwestern Mutual Life Insurance Company. The Russell logo is a trademark and service mark of Russell Investments. Copyright © Russell Investments 2011. All rights reserved. This material is proprietary and may not be reproduced, transferred, or distributed in any form without prior written permission from Russell Investments. It is delivered on an “as is” basis without warranty. First used: August 2011
USI-10531-08-13
Russell Investments // Structuring a private infrastructure portfolio / p 9