 INVESTOR DECK March 4, 2015 LIKE NO OTHER Exhibit 99.2 |
 DISCLAIMER FORWARD-LOOKING STATEMENTS This presentation contains forward-looking statements. Any statements about our expectations, beliefs, plans, predictions, forecasts, objectives, assumptions or future events or performance are not historical facts and may be forward-looking. You can identify forward-looking statements by the use of forward-looking terminology such as “believes,” “expects,” “could,” “may,” “will,” “should,” “seeks,” “likely,” “intends,” “plans,” “pro forma,” “projects,” “estimates” or “anticipates” or the negative of these words and phrases or similar words or phrases that are predictions of or indicate future events or trends and that do not relate solely to historical matters. You can also identify forward-looking statements by discussions of strategy, plans or intentions. Forward-looking statements involve numerous risks and uncertainties and you should not rely on them as predictions of future events. Forward-looking statements depend on assumptions, data or methods that may be incorrect or imprecise and we may not be able to realize them. We do not guarantee that the transactions and events described will happen as described (or that they will happen at all). The following factors, among others, could cause actual results and future events to differ materially from those set forth or contemplated in the forward-looking statements: our limited operating history as an integrated company; business and economic conditions generally and in the bank and non-bank financial services industries, nationally and within our local market area; our ability to mitigate our risk exposures; our ability to maintain our historical earnings trends; risks related to the integration of acquired businesses and any future acquisitions; changes in management personnel; interest rate risk; concentration of our factoring services in the transportation industry; credit risk associated with our loan portfolio; lack of seasoning in our loan portfolio; deteriorating asset quality and higher loan charge-offs; time and effort necessary to resolve nonperforming assets; inaccuracy of the assumptions and estimates we make in establishing reserves for probable loan losses and other estimates; lack of liquidity; fluctuations in the fair value and liquidity of the securities we hold for sale; impairment of investment securities, goodwill, other intangible assets or deferred tax assets; risks related to our asset management business; our risk management strategies; environmental liability associated with our lending activities; increased competition in the bank and non-bank financial services industries, nationally, regionally or locally, which may adversely affect pricing and terms; the obligations associated with being a public company; the accuracy of our financial statements and related disclosures; material weaknesses in our internal control over financial reporting; system failures or failures to prevent breaches of our network security; the institution and outcome of litigation and other legal proceedings against us or to which we become subject; changes in carry-forwards of net operating losses; changes in federal tax law or policy; the impact of recent and future legislative and regulatory changes, including changes in banking, securities and tax laws and regulations, such as the Dodd-Frank Wall Street Reform and Consumer Protection Act (the “Dodd-Frank Act”) and their application by our regulators; governmental monetary and fiscal policies; changes in the scope and cost of the Federal Deposit Insurance Corporation insurance and other coverages; failure to receive regulatory approval for future acquisitions; increases in our capital requirements; and risk retention requirements under the Dodd-Frank Act. While forward-looking statements reflect our good-faith beliefs, they are not guarantees of future performance. All forward-looking statements are necessarily only estimates of future results. Accordingly, actual results may differ materially from those expressed in or contemplated by the particular forward-looking statement, and, therefore, you are cautioned not to place undue reliance on such statements. Further, any forward-looking statement speaks only as of the date on which it is made, and we undertake no obligation to update any forward-looking statement to reflect events or circumstances after the date on which the statement is made or to reflect the occurrence of unanticipated events or circumstances, except as required by applicable law. NON-GAAP FINANCIAL MEASURES This presentation includes certain non-GAAP financial measures intended to supplement, not substitute for, comparable GAAP measures. Reconciliations of non-GAAP financial measures to GAAP financial measures are provided at the end of the presentation. See page 17 of this presentation for additional information. Numbers in this presentation may not sum due to rounding. Unless otherwise referenced, all data presented is as of 12/31/2014. |
 PAGE 3 (1) Triumph Savings Bank, SSB d/b/a Triumph Commercial Finance; (2) Triumph Community Bank N.A. d/b/a Triumph Healthcare Finance; (3) Advance Business Capital LLC d/b/a Triumph Business Capital; (4) Number of states represents states with branches, loan production offices or sales personnel; (5) 492.5 full time equivalent employees. PLATFORM OVERVIEW $1.4 billion in assets states (4) 12 517 team members (5) (1) (3) (2) Headquartered in Dallas, Texas, Triumph Bancorp, Inc. (NASDAQ: TBK) is a financial holding company with a diversified line of community banking, commercial finance and asset management activities. www.triumphbancorp.com |
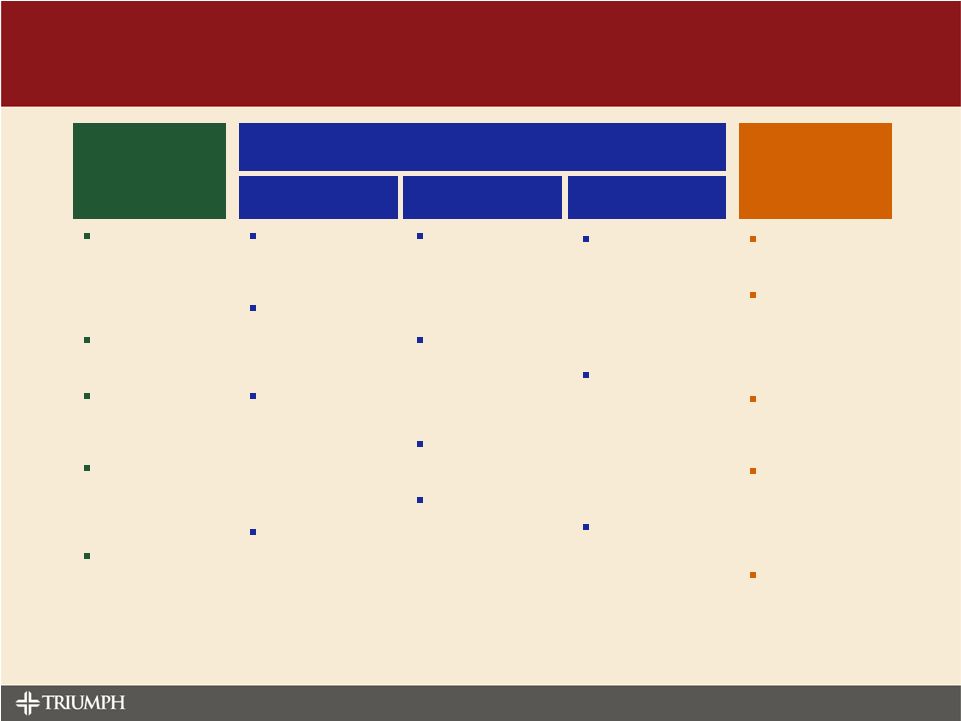 HOW WE GO TO MARKET Community Banking Factoring Asset Based Lending Equipment Finance Asset Management Commercial Finance Focused on reaching our communities through service, selling and saturation Emphasis on long- term customer relationships Demonstrated ability to work with clients throughout economic cycles Focused on cross- selling additional products and services to enhance relationships A bank for all people, committed to their financial goals in every stage of life Offered at our Triumph Business Capital subsidiary and at Triumph Savings Bank under our Triumph Commercial Finance brand Following over 10 years in the business, Triumph Business Capital is among the largest and most respected discount factors in the transportation sector Expanding operations into staffing, distribution and other sectors Offered under our Triumph Commercial Finance and Triumph Healthcare Finance brands Decades of experience in our leadership team that has a proven track record in credit discipline Specialized industry expertise in healthcare ABL Relationship-based lending built around knowing our clients and their businesses Offered under our Triumph Commercial Finance brand National lending platform focused on transportation, construction, and waste management Multi-use collateral with a broad and active resale market, revenue producing, long economic life and low risk of obsolescence Direct sales model built on long term relationships, many going back over 10 years Offered through Triumph Capital Advisors $1.7 billion in assets under management, including active CLOs and warehouse assets as of 03/03/15 Focuses on issuing and managing collateralized loan obligations (CLOs) Led by a team with decades of experience who has been involved in the issuance of nearly $30 billion of CLOs 4 CLOs under management and 1 CLO currently in warehouse as of 03/03/15 PAGE 4 |
 PAGE 5 Purchased Triumph Healthcare Finance asset based lending group Triumph Capital Advisors issued two CLOs and began warehousing a third Triumph Community Bank $12.6 million pretax branch sale gain Completed initial public offering raising net proceeds of $83.8 million Named one of the Best Companies to Work for in TEXAS in 2015 by the Texas Association of Business, after being named a Best Place to Work in Dallas in 2013 and 2014 by the Dallas Business Journal $16.9 million Net income to common stockholders 2014 HIGHLIGHTS LOANS 14.2% $124.8 million loan growth DEPOSITS 11.5% $120.4 million deposit growth ROA 1.46% Return on Assets TCE/TA 14.0% Tangible Common Equity / Tangible Assets |
 PAGE 6 FINANCIAL HIGHLIGHTS (1) The Company uses certain non-GAAP financial measures to provide meaningful supplemental information regarding the Company's operational performance and to enhance investors' overall understanding of such financial performance. (2) Asset quality ratios exclude loans held for sale Key Metrics Dec 31, Sep 30, Jun 30, Mar 31, Dec 31, 2014 2014 2014 2014 2013 Performance ratios - annualized Return on average assets 0.78% 3.01% 0.88% 1.19% 3.99% Return on average tangible common equity (ROATCE) (1) 5.11% 34.26% 8.98% 13.00% 48.88% Yield on loans 8.98% 8.66% 8.83% 9.17% 9.38% Cost of total deposits 0.52% 0.48% 0.42% 0.43% 0.47% Net interest margin (1) 6.58% 6.69% 6.58% 6.85% 6.68% Net noninterest expense to average assets (1) 4.44% 4.48% 3.99% 3.92% 3.82% Efficiency ratio (1) 78.58% 78.29% 71.78% 69.40% 69.06% Asset Quality (2) Nonperforming assets to total assets 1.73% 2.05% 1.82% 1.86% 2.03% ALLL to total loans 0.88% 0.75% 0.67% 0.58% 0.41% Net charge-offs to average loans 0.03% 0.03% 0.01% (0.01%) 0.02% Capital Tier 1 capital to average assets 15.92% 12.20% 11.00% 11.89% 12.87% Tier 1 capital to risk-weighted assets 19.56% 14.59% 12.66% 14.32% 14.11% Total capital to risk-weighted assets 20.35% 15.27% 13.22% 14.78% 14.47% Market Book value per share 12.68 $ 14.18 $ 13.23 $ 12.94 $ 12.60 $ Tangible book value per share (1) 11.06 $ 11.17 $ 10.08 $ 10.12 $ 9.70 $ Basic earnings per common share 0.14 $ 0.96 $ 0.23 $ 0.32 $ 1.17 $ Diluted earnings per common share 0.14 $ 0.91 $ 0.23 $ 0.32 $ 1.12 $ As of and For the Three Months Ended |
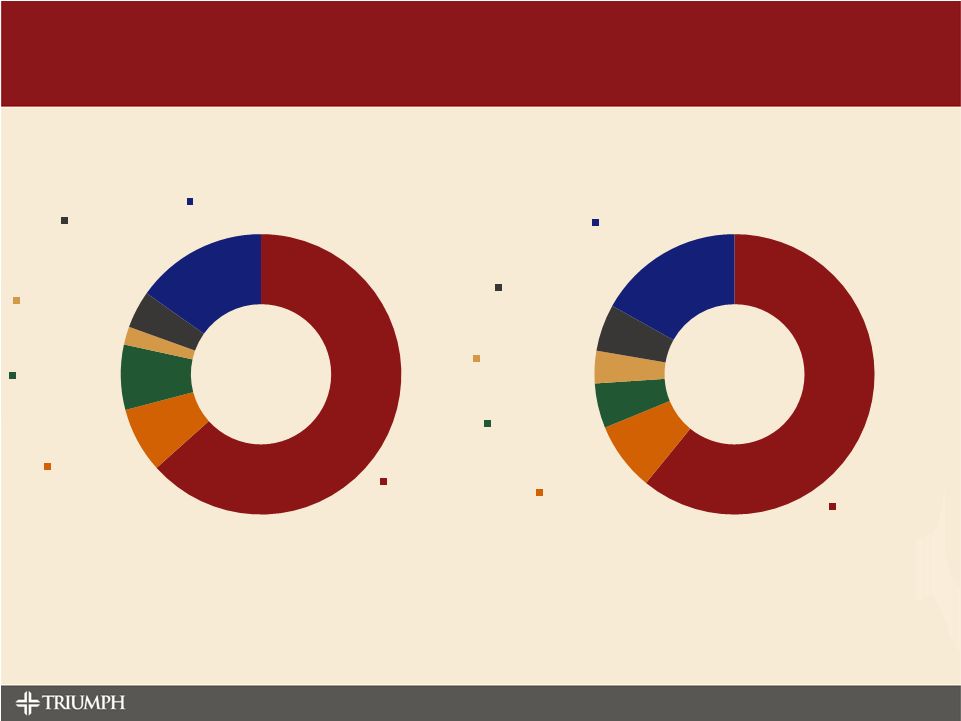
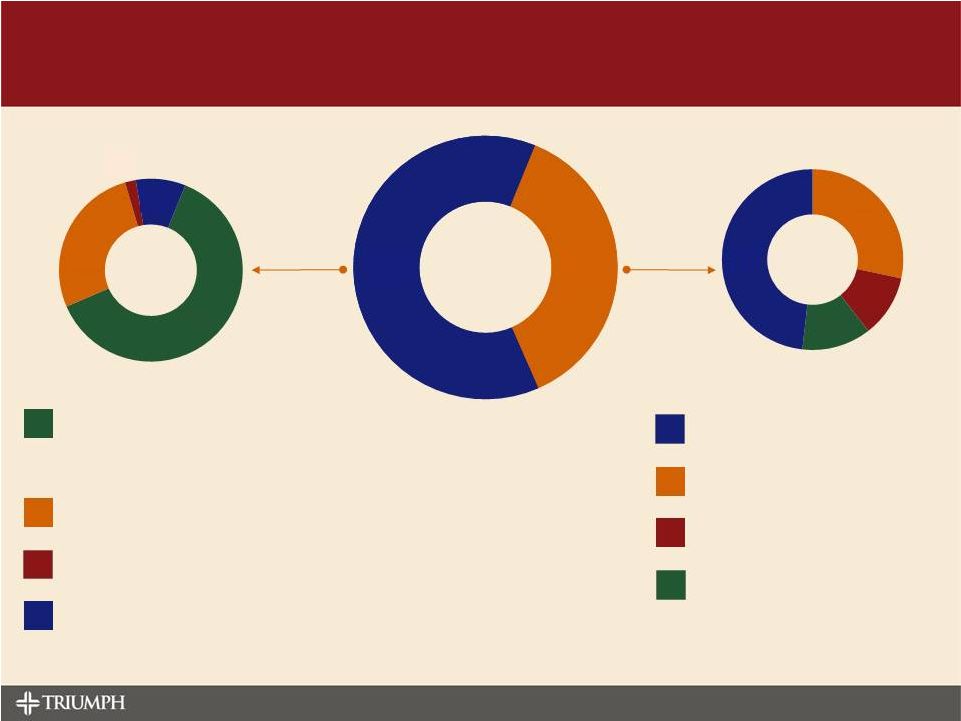 PAGE 7 REAL ESTATE Commercial Real Estate Construction, Land & Development 1-4 Family Residential Farmland COMMERCIAL CONSUMER MORTGAGE WAREHOUSE Loans HFI = $1,005.9 million 4Q14 Yield = 8.98% GAAP (1) Chart data labels – dollars in millions (1) Adjusted yield on loans of 8.29% excluding discount accretion. HEALTHCARE ASSET BASED LENDING EQUIPMENT FINANCE FACTORED RECEIVABLES ASSET BASED LENDING LOAN PORTFOLIO DETAIL Community Banking / Other Commercial Finance 62% 27% 2% 9% $375.4 37% $630.5 63% 28% 11% 13% 48% 249.2 $78.7 $22.5 $11.9 $55.1 $170.1 $42.9 $180.9 $106.4 $41.8 $46.4 |
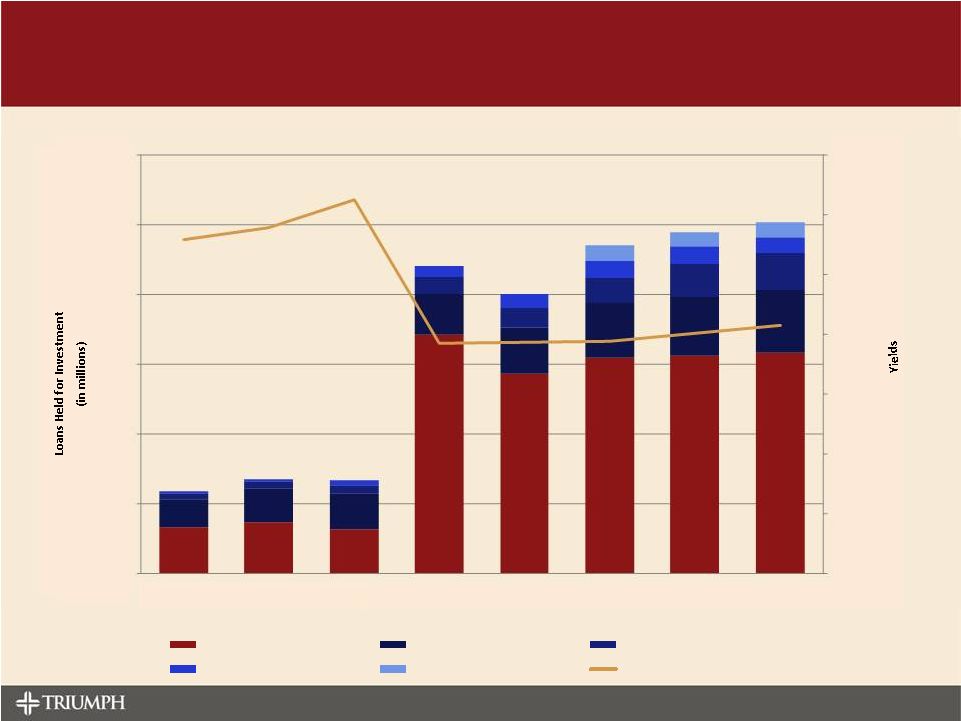 PAGE 8 LOAN MIX, YIELD AND GROWTH 0% 2% 4% 6% 8% 10% 12% 14% 0 200 400 600 800 1,000 1,200 1Q13 2Q13 3Q13 4Q13 1Q14 2Q14 3Q14 4Q14 Community Banking / Other Factored receivables Equipment Asset based lending (General) Asset based lending (Healthcare) Adjusted Loan Yields |
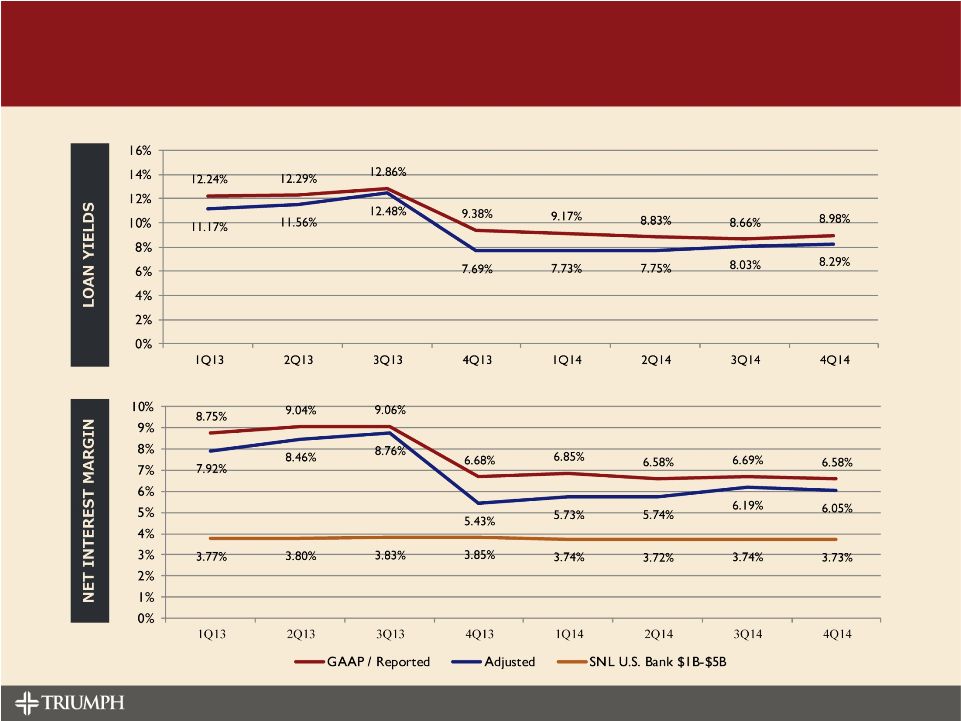 LOAN YIELDS AND NET INTEREST MARGIN PAGE 9 |
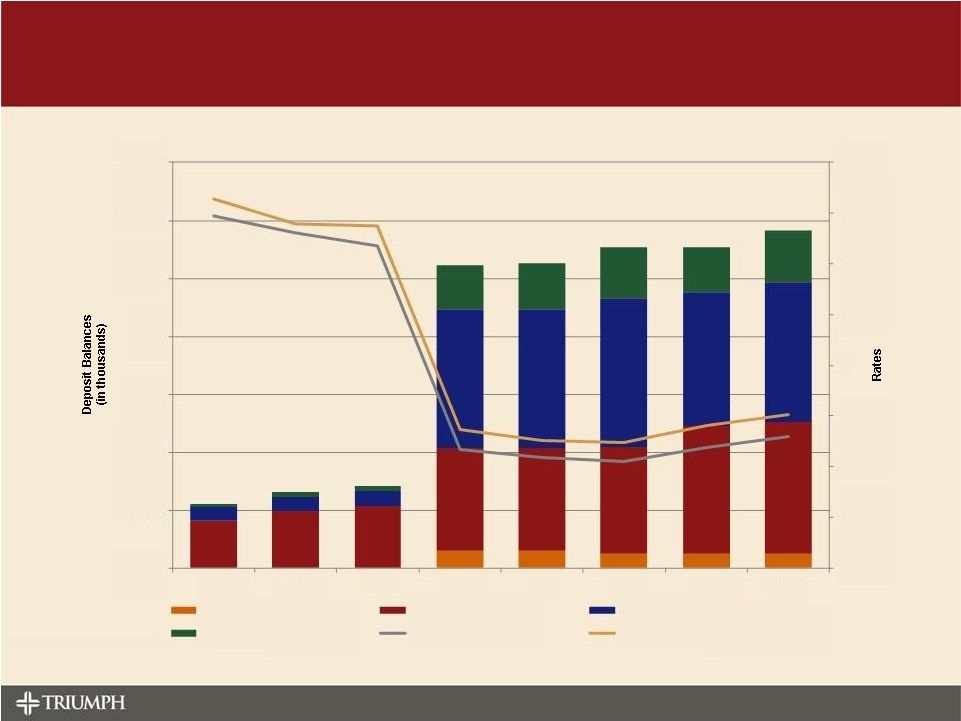 PAGE 10 DEPOSIT MIX, RATE AND GROWTH 0.0% 0.2% 0.4% 0.6% 0.8% 1.0% 1.2% 1.4% 1.6% 0 200,000 400,000 600,000 800,000 1,000,000 1,200,000 1,400,000 1Q13 2Q13 3Q13 4Q13 1Q14 2Q14 3Q14 4Q14 Brokered deposits Certificates of deposit Interest bearing deposits Noninterest bearing demand Cost of total deposits Cost of interest bearing deposits |
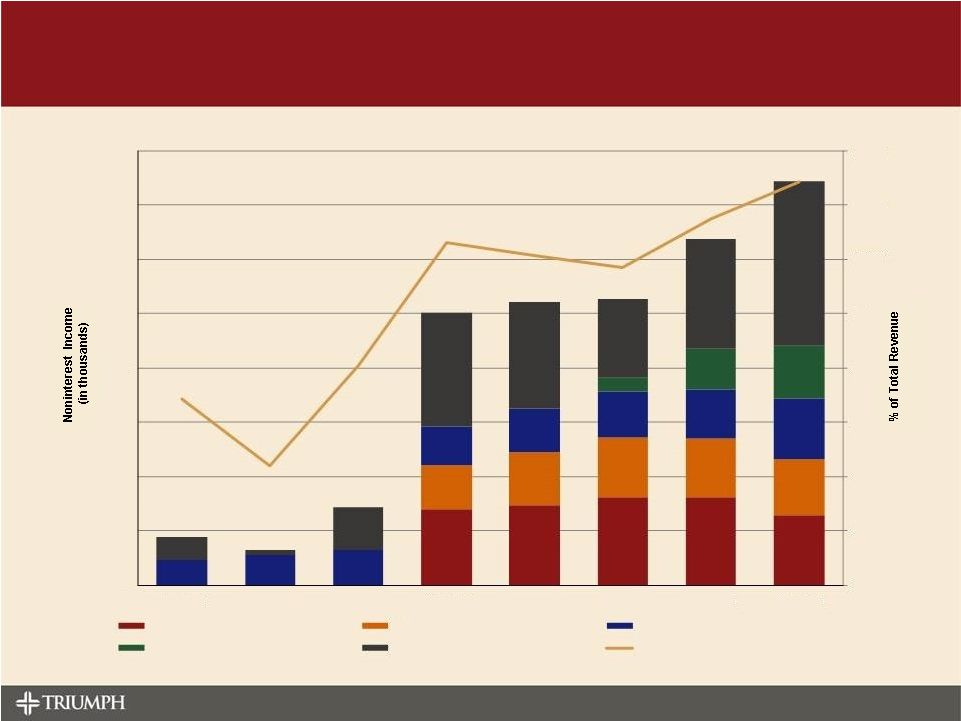 PAGE 11 NONINTEREST INCOME Note: Excludes $12.6 million in branch sale gains in Q3 of 2014 and $9.0 million of bargain purchase gains in Q4 of 2013 for comparability purposes 0.0% 2.0% 4.0% 6.0% 8.0% 10.0% 12.0% 14.0% 16.0% 500 1,000 1,500 2,000 2,500 3,000 3,500 4,000 Q1 2013 Q2 2013 Q3 2013 Q4 2013 Q1 2014 Q2 2014 Q3 2014 Q4 2014 Service charges on deposits Card income Fee income Asset management fees Other Noninterest income as a % of total revenue — |
 NONINTEREST EXPENSE Noninterest expense = $32.7 million Efficiency Ratio = 73.1% Noninterest expense = $69.2 million Efficiency Ratio = 74.7% Full Year 2013 Full Year 2014 Chart data labels – dollars in thousands PAGE 12 Salaries and employee benefits $20,737 Occupancy, furniture and equipment $2,465 Professional fees $2,460 Advertising and promotion $682 Communications and technology $1,413 Other $4,967 Salaries and employee benefits $42,131 Occupancy, furniture and equipment $5,474 Professional fees $3,574 Advertising and promotion $2,594 Communications and technology $3,748 Other $11,681 |
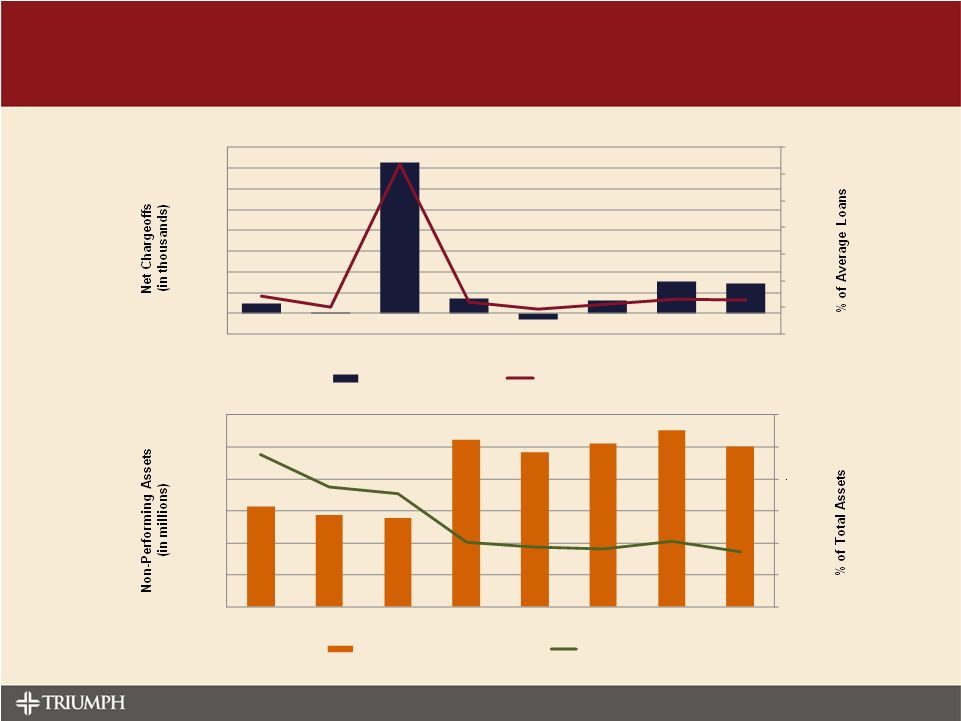 ASSET QUALITY PAGE 13 -0.1% 0.0% 0.1% 0.2% 0.3% 0.4% 0.5% 0.6% (200) - 200 400 600 800 1,000 1,200 1,400 1,600 1Q13 2Q13 3Q13 4Q13 1Q14 2Q14 3Q14 4Q14 Net Chargeoffs (NCOs) NCOs / Average Loans 0.0% 1.0% 2.0% 3.0% 4.0% 5.0% 6.0% - 5.0 10.0 15.0 20.0 25.0 30.0 1Q13 2Q13 3Q13 4Q13 1Q14 2Q14 3Q14 4Q14 Non-Performing Assets (NPAs) NPAs / Assets |
 PAGE 14 Coverage Analysts: Brad Milsaps - Sandler O’Neill & Partners John Pancari - Evercore ISI Jared Shaw - Wells Fargo Securities, LLC Jefferson Harrelson - Keefe, Bruyette and Woods Bill Carcache - Nomura Securities International INVESTMENT CONSIDERATIONS • We are an entrepreneurial financial services company that seeks to balance financial returns with franchise value creation • We prefer to spread our risk all along the economic continuum (start-ups to mature businesses) through a variety of community banking and commercial finance products and services • We provide bundled services (insurance, treasury management, etc.) which contribute to operational efficiency, client retention and relational pricing power • We leverage a highly experienced, well respected executive leadership team who has “been there, done that” at much larger institutions • Our community banking and commercial finance lending operations are built on policies, processes and, most importantly, people that have successfully navigated multiple credit cycles 0.85 0.90 0.95 1.00 1.05 1.10 1.15 1.20 Normalized as of 11/7/2014 through 12/31/2014 TBK BKX Index CBNK Index |
 APPENDIX LIKE NO OTHER |
 OIL AND GAS DETAIL As part of our ongoing operations, Triumph lends in the energy space in Texas and across the nation. Our activities consist of indirect transactions with short durations or to customers borrowing on mostly multi-use assets. We do not participate in production or reserve based lending. ASSET BASED LENDING We have approximately $16.4 million in exposure to energy related clients. These loans are mostly working capital loans where we maintain dominion of cash. We typically average less than 45 days exposure with these clients. COMMUNITY BANKING We currently do not have any material exposure in our community banking portfolio. FACTORING We have exposure and factor approximately $20.5 million for transportation clients who haul for energy related account debtors. A small portion of these provide miscellaneous oilfield services unrelated to trucking (roustabout, welding, tank cleaning, etc.). We perform regular credit checks on the account debtors and average between 60 and 74 days exposure. EQUIPMENT We have approximately $26.3 million in exposure to energy related clients. Most of these loans are secured by multi- use equipment not directly tied to the energy industry, such as trucks, trailers and cranes for which there is a robust secondary market. PAGE 16 |
 PAGE 17 NON-GAAP FINANCIAL RECONCILIATION Metrics and non-GAAP financial reconciliation Dec 31, Sep 30, Jun 30, Mar 31, Dec 31, (Dollars in thousands, except per share amounts) 2014 2014 2014 2014 2013 Net income available to common stockholders 2,021 $ 9,495 $ 2,285 $ 3,148 $ 11,318 $ Average tangible common equity 156,888 109,944 102,107 98,198 91,865 Return on average tangible common equity (ROATCE) 5.11% 34.26% 8.98% 13.00% 48.88% Efficiency ratio: Net interest income 21,329 $ 20,395 $ 19,881 $ 18,855 $ 17,358 $ Noninterest income 3,721 15,804 2,633 2,609 11,522 Operating revenue 25,050 36,199 22,514 21,464 28,880 Less: gain on branch sale — 12,619 — — — Less: bargain purchase gain — — — — 9,014 Adjusted operating revenue 25,050 $ 23,580 $ 22,514 $ 21,464 $ 19,866 $ Total noninterest expenses 19,685 $ 18,461 $ 16,160 $ 14,896 $ 14,657 $ Less: merger and acquisition expenses — — — — 938 Adjusted noninterest expenses 19,685 $ 18,461 $ 16,160 $ 14,896 $ 13,719 $ Efficiency ratio 78.58% 78.29% 71.78% 69.40% 69.06% Net noninterest expense to average assets ratio: Total noninterest expenses 19,685 $ 18,461 $ 16,160 $ 14,896 $ 14,657 $ Less: merger and acquisition expenses — — — — 938 Less: noninterest income, excluding gain on branch sale and bargain purchase gain 3,721 3,185 2,633 2,609 2,508 Adjusted net noninterest expenses 15,964 $ 15,276 $ 13,527 $ 12,287 $ 11,211 $ Average total assets 1,427,475 1,354,207 1,359,503 1,271,024 1,164,758 Net noninterest expense to average assets ratio 4.44% 4.48% 3.99% 3.92% 3.82% As of and For the Three Months Ended |
 PAGE 18 NON-GAAP FINANCIAL RECONCILIATION Metrics and non-GAAP financial reconciliation (cont'd) Dec 31, Sep 30, Jun 30, Mar 31, Dec 31, ($ in thousands, except per share amounts) 2014 2014 2014 2014 2013 Reported yield on loans 8.98% 8.66% 8.83% 9.17% 9.38% Effect of accretion income on acquired loans (0.69%) (0.63%) (1.08%) (1.44%) (1.69%) Adjusted yield on loans 8.29% 8.03% 7.75% 7.73% 7.69% Reported net interest margin 6.58% 6.69% 6.58% 6.85% 6.68% Effect of accretion income on acquired loans (0.53%) (0.50%) (0.84%) (1.12%) (1.25%) Adjusted net interest margin 6.05% 6.19% 5.74% 5.73% 5.43% Total stockholders' equity 237,509 $ 149,931 $ 140,027 $ 137,184 $ 133,600 $ Less: Preferred stock liquidation preference 9,746 9,746 9,746 9,746 9,746 Total common stockholders' equity 227,763 140,185 130,281 127,438 123,854 Less: Goodwill and other intangibles 29,057 29,783 31,043 27,792 28,518 Tangible common stockholders' equity 198,706 $ 110,402 $ 99,238 $ 99,646 $ 95,336 $ Common shares outstanding 17,963,783 9,886,778 9,845,819 9,846,096 9,832,585 Tangible book value per share 11.06 $ 11.17 $ 10.08 $ 10.12 $ 9.70 $ Total assets at end of period 1,447,898 $ 1,347,798 $ 1,407,072 $ 1,297,110 $ 1,288,239 $ Less: Goodwill and other intangibles 29,057 29,783 31,043 27,792 28,518 Adjusted total assets at period end 1,418,841 $ 1,318,015 $ 1,376,029 $ 1,269,318 $ 1,259,721 $ Tangible common stockholders' equity ratio 14.00% 8.38% 7.21% 7.85% 7.57% As of and For the Three Months Ended |