Subordinated Debt Offering September 2016 Exhibit 99.1
Offering Disclosure PAGE Forward-Looking Information This slide presentation contains statements that constitute forward-looking statements within the meaning of Section 27A of the Securities Act of 1933, as amended, Section 21E of the Securities Exchange Act of 1934, as amended, and the U.S. Private Securities Litigation Reform Act of 1995. These forward-looking statements reflect our current views with respect to, among other things, future events and our financial performance. These statements are often, but not always, made through the use of words or phrases such as “may,” “should,” “could,” “predict,” “potential,” “believe,” “will likely result,” “expect,” “continue,” “will,” “anticipate,” “seek,” “estimate,” “intend,” “plan,” “projection,” “would” and “outlook,” or the negative version of those words or other comparable of a future or forward-looking nature. These forward-looking statements are not historical facts and are based on current expectations, estimates and projections about our industry, management’s beliefs and certain assumptions made by management, many of which, by their nature, are inherently uncertain and beyond our control. Accordingly, we caution you that any such forward-looking statements are not guarantees of future performance and are subject to risks, assumptions and uncertainties that are difficult to predict. Although we believe that the expectations reflected in these forward-looking statements are reasonable as of the date made, actual results may prove to be materially different from the results expressed or implied by the forward-looking statements. There are or will be important factors that could cause our actual results to differ materially from those indicated in these forward-looking statements, including, but are not limited to, the following: our limited operating history as an integrated company and our recent acquisitions; business and economic conditions generally and in the bank and non-bank financial services industries, nationally and within our local market area; our ability to mitigate our risk exposures; our ability to maintain our historical earnings trends; risks related to the integration of acquired businesses (including our recent acquisition of ColoEast Bankshares, Inc.) and any future acquisitions; changes in management personnel; interest rate risk; concentration of our factoring services in the transportation industry; credit risk associated with our loan portfolio; lack of seasoning in our loan portfolio; deteriorating asset quality and higher loan charge-offs; time and effort necessary to resolve nonperforming assets; inaccuracy of the assumptions and estimates we make in establishing reserves for probable loan losses and other estimates; lack of liquidity; fluctuations in the fair value and liquidity of the securities we hold for sale; impairment of investment securities, goodwill, other intangible assets or deferred tax assets; risks related to our acting as the asset manager for one or more collateralized loan obligations; our risk management strategies; environmental liability associated with our lending activities; increased competition in the bank and non-bank financial services industries, nationally, regionally or locally, which may adversely affect pricing and terms; the obligations associated with being a public company; material weaknesses in our internal control over financial reporting; system failures or failures to prevent breaches of our network security; the institution and outcome of litigation and other legal proceedings against us or to which we become subject; changes in carry-forwards of net operating losses; changes in federal tax law or policy; the impact of current and future legislation and regulation, including changes in banking, securities and tax laws and regulations, such as the Dodd-Frank Act and their application by our regulators; governmental monetary and fiscal policies; changes in the scope and cost of FDIC, insurance and other coverages; failure to receive regulatory approval for future acquisitions; increases in our capital requirements; risk retention requirements under the Dodd-Frank Act as well as other factors described in the other reports we file with the SEC, including those factors included in the disclosures under the heading “Forward-Looking Information” and “Item 1A. Risk Factors” in our most recent Annual Report on Form 10-K for the year ended December 31, 2015. Should one or more of the foregoing risks materialize, or should underlying assumptions prove incorrect, actual results or outcomes may vary materially from those described in the forward-looking statements. Registration Statement The Company has filed a registration statement (File No. 333-213169) (including a base prospectus) and related preliminary prospectus supplement dated September 26, 2016 with the SEC for the offering to which this communication relates. Before you invest, you should read the prospectus in that registration statement, the related preliminary prospectus supplement and other documents the Company has filed with the SEC for more complete information about the Company and this offering. You may get these documents for free by visiting EDGAR on the SEC website at www.sec.gov. Alternatively, the Company, the underwriter or any dealer participating in the offering will arrange to send you the base prospectus and the related preliminary prospectus supplement if you request it by calling Sandler O’Neill + Partners, L.P. toll-free at 1-866-805-4128. Neither the SEC nor any state securities commission has approved or disapproved of these securities or determined if this free writing prospectus, or any related prospectus supplement or prospectus, is truthful or complete. Any representation to the contrary is a criminal offense.
Use of Non-GAAP Financial Measures PAGE Use of Non-GAAP Financial Measures This presentation includes certain non‐GAAP financial measures intended to supplement, not substitute for, comparable GAAP measures. Reconciliations of non‐GAAP financial measures to GAAP financial measures are provided at the end of the presentation. Numbers in this presentation may not sum due to rounding. Unless otherwise referenced, all data presented is as of June 30, 2016. We use certain non-GAAP financial measures to provide meaningful supplemental information regarding the Company's operational performance and to enhance investors' overall understanding of such financial performance. These non-GAAP disclosures should not be viewed as a substitute for financial results determined in accordance with GAAP, nor are they necessarily comparable to non-GAAP performance measures that may be presented by other companies. Reconciliations of these non-GAAP financial measures to the most directly comparable GAAP financial measures are included in the Appendix to this slide presentation.
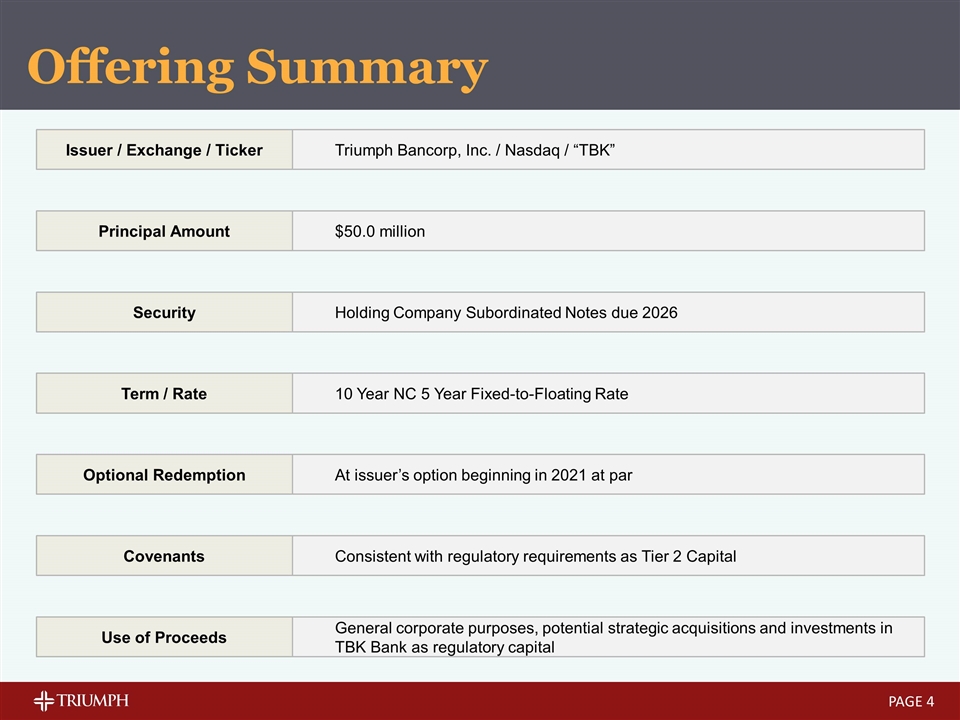
Offering Summary PAGE Optional Redemption At issuer’s option beginning in 2021 at par Covenants Consistent with regulatory requirements as Tier 2 Capital Issuer / Exchange / Ticker Triumph Bancorp, Inc. / Nasdaq / “TBK” Security Holding Company Subordinated Notes due 2026 Term / Rate 10 Year NC 5 Year Fixed-to-Floating Rate Principal Amount $50.0 million Use of Proceeds General corporate purposes, potential strategic acquisitions and investments in TBK Bank as regulatory capital
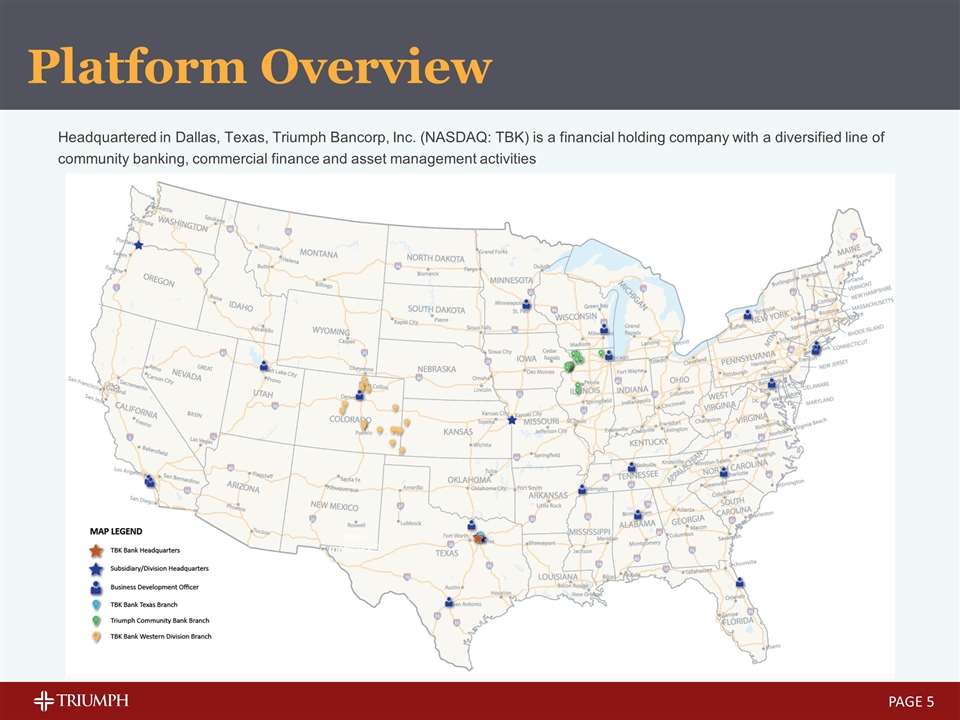
PAGE Headquartered in Dallas, Texas, Triumph Bancorp, Inc. (NASDAQ: TBK) is a financial holding company with a diversified line of community banking, commercial finance and asset management activities team members(2) Platform Overview
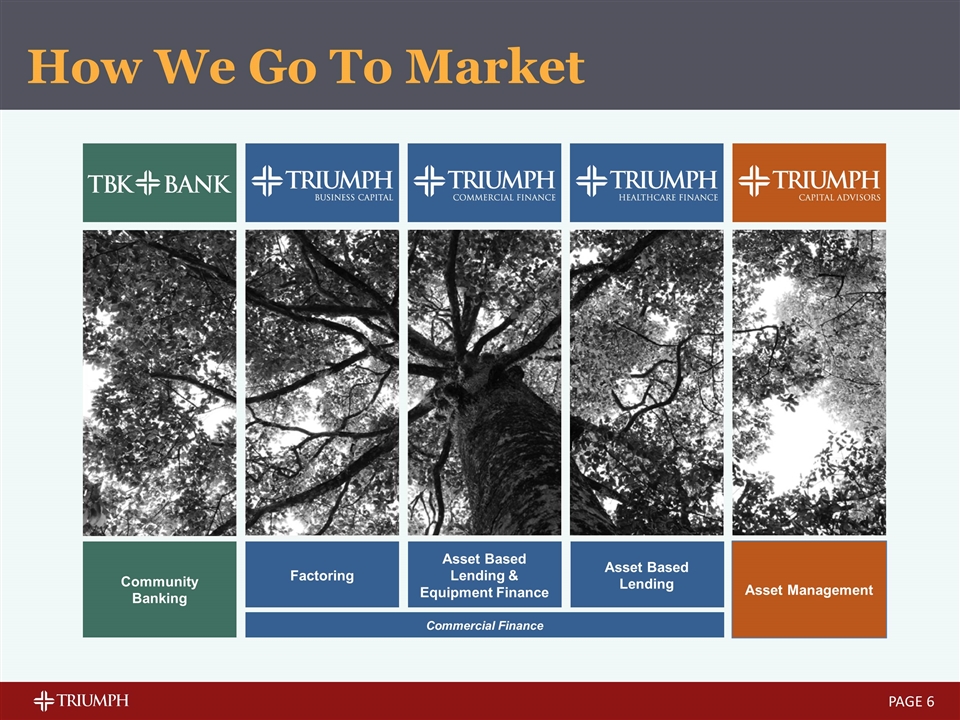
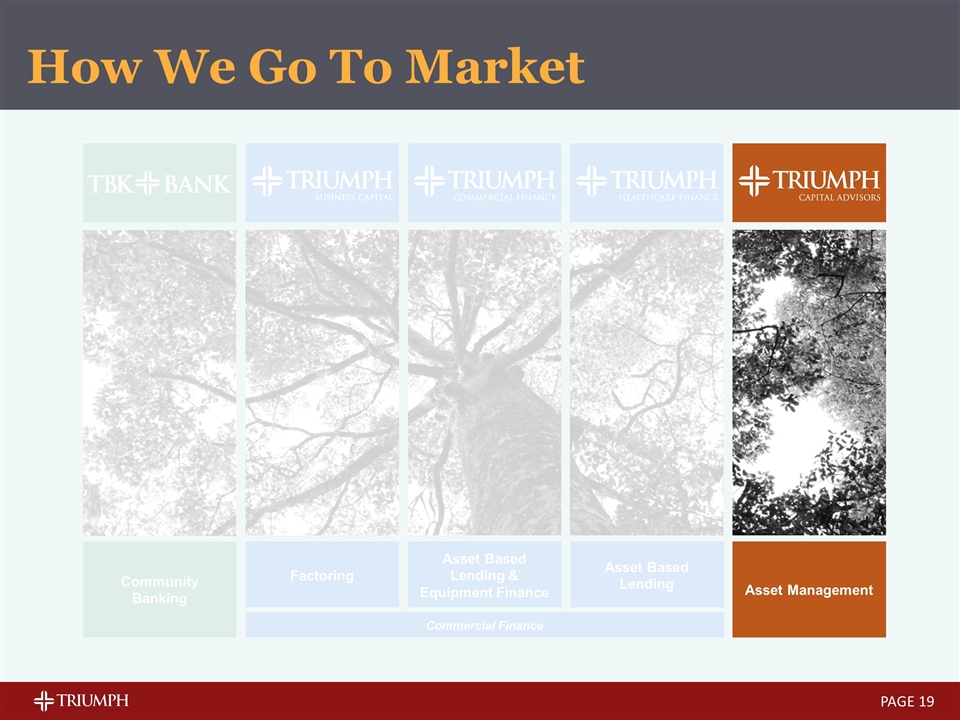
How We Go To Market PAGE Commercial Finance Community Banking Asset Management Factoring Asset Based Lending & Equipment Finance Asset Based Lending
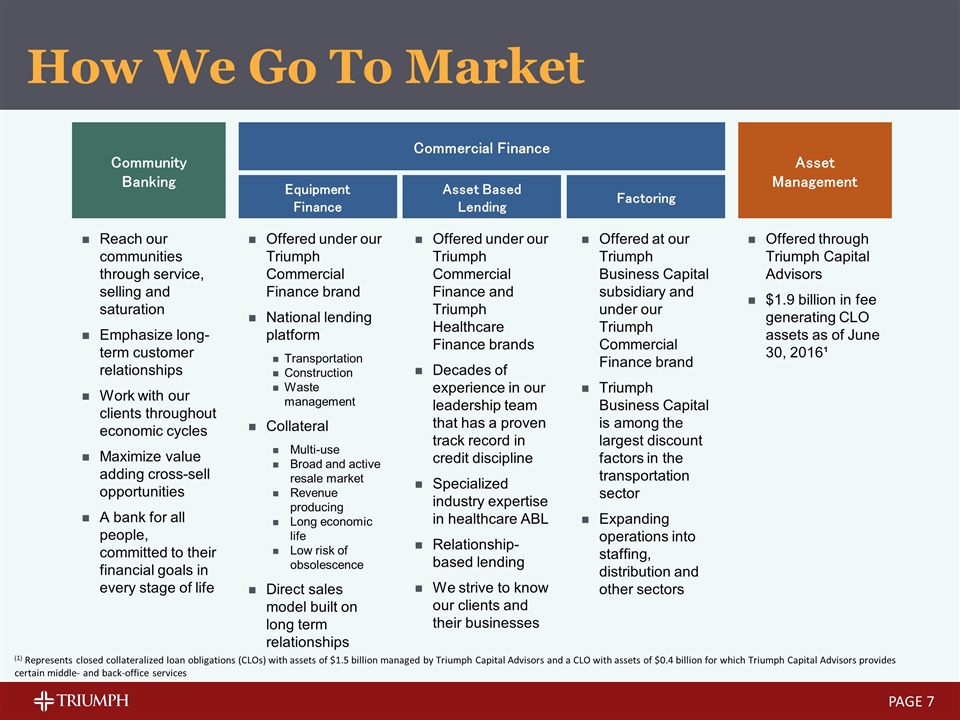
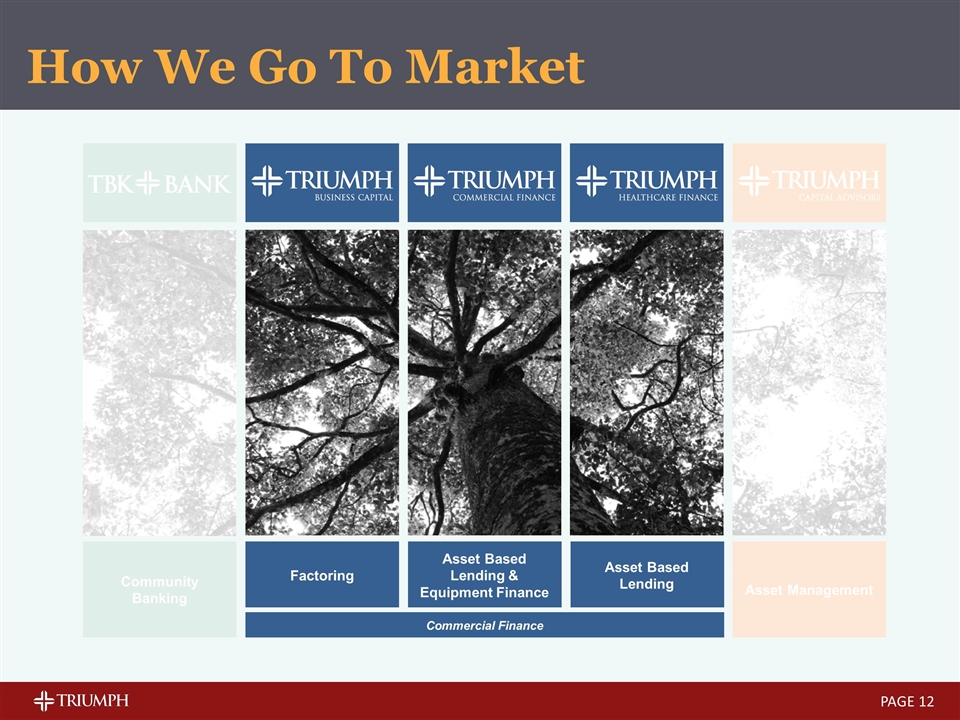
Community Banking Reach our communities through service, selling and saturation Emphasize long-term customer relationships Work with our clients throughout economic cycles Maximize value adding cross-sell opportunities A bank for all people, committed to their financial goals in every stage of life Factoring Offered at our Triumph Business Capital subsidiary and under our Triumph Commercial Finance brand Triumph Business Capital is among the largest discount factors in the transportation sector Expanding operations into staffing, distribution and other sectors Asset Based Lending Offered under our Triumph Commercial Finance and Triumph Healthcare Finance brands Decades of experience in our leadership team that has a proven track record in credit discipline Specialized industry expertise in healthcare ABL Relationship-based lending We strive to know our clients and their businesses Equipment Finance Offered under our Triumph Commercial Finance brand National lending platform Transportation Construction Waste management Collateral Multi-use Broad and active resale market Revenue producing Long economic life Low risk of obsolescence Direct sales model built on long term relationships Asset Management Offered through Triumph Capital Advisors $1.9 billion in fee generating CLO assets as of June 30, 2016¹ Commercial Finance How We Go To Market PAGE (1) Represents closed collateralized loan obligations (CLOs) with assets of $1.5 billion managed by Triumph Capital Advisors and a CLO with assets of $0.4 billion for which Triumph Capital Advisors provides certain middle- and back-office services
How We Go To Market PAGE Commercial Finance Community Banking Asset Management Factoring Asset Based Lending & Equipment Finance Asset Based Lending
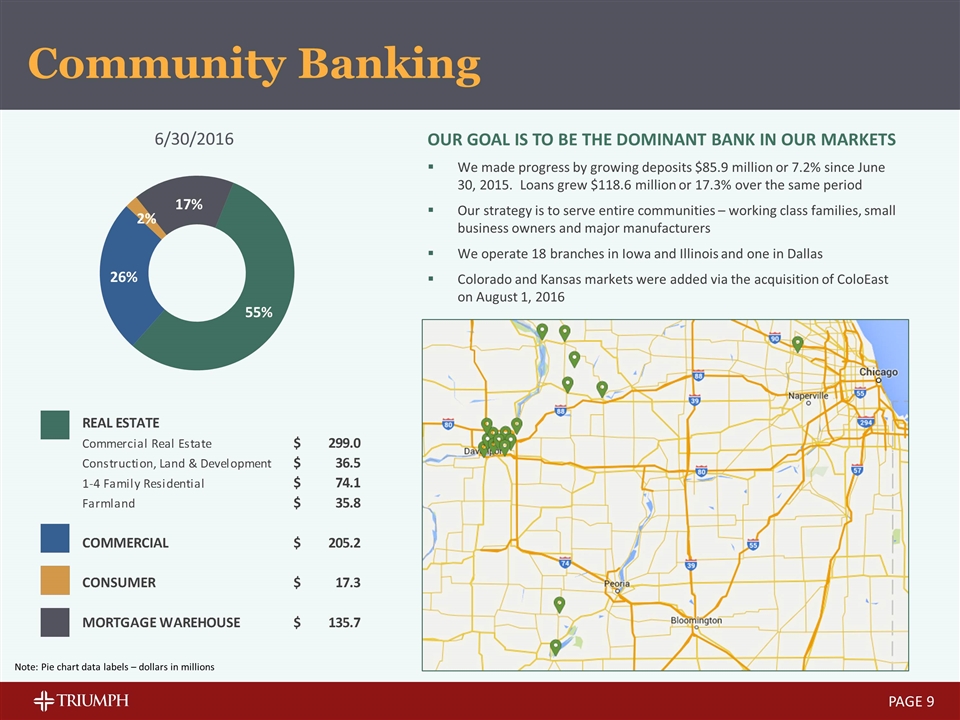
6/30/2016 Our goal is to be the dominant bank in our markets We made progress by growing deposits $85.9 million or 7.2% since June 30, 2015. Loans grew $118.6 million or 17.3% over the same period Our strategy is to serve entire communities – working class families, small business owners and major manufacturers We operate 18 branches in Iowa and Illinois and one in Dallas Colorado and Kansas markets were added via the acquisition of ColoEast on August 1, 2016 Community Banking PAGE Note: Pie chart data labels – dollars in millions 42185 42277 42369 42460 42551 Q2 2015 Q3 2015 Q4 2015 Q1 2016 Q2 2016 Community Banking 685.02599999999995 687.54200000000003 770.9 717.72799999999995 803.58500000000004 Equipment 138.018 143.483 148.95099999999999 159.755 167 0.275153929675928 Commercial Finance: Asset based lending (General) 64.835999999999999 85.641000000000005 75.134 85.739000000000004 114.63200000000001 0.18887092974018549 Asset based lending (Healthcare) 65.082999999999998 66.831999999999994 80.2 79.58 81.664000000000001 0.13455191923985022 Premium Finance 0 0 1.6120000000000001 3.5059999999999998 6.117 1.0078542442081746E-2 Factored receivables 199.71600000000001 201.803 215.08799999999999 199.53200000000001 237.52 0.39134467890195462 Q2 2016 Commercial Finance Products $606.93299999999999 Community Banking $803.58500000000004 Real Estate & Farmland $445.40499999999997 Commercial Real Estate $298.99099999999999 Commercial $205.09500000000003 Construction, Land Development, Land $36.497999999999998 Consumer $17.338999999999999 1-4 Family Residential Properties $74.120999999999995 Mortgage Warehouse $135.74600000000001 Farmland $35.795000000000002 Commercial $205.09500000000003 Consumer $17.338999999999999 Community Banking Mortgage Warehouse $135.74600000000001 REAL ESTATE Commercial Real Estate $298.99099999999999 Construction, Land & Development $36.497999999999998 1-4 Family Residential $74.120999999999995 Farmland $35.795000000000002 0.55427241673251748 COMMERCIAL $205.19500000000002 Rounded 0.25534946520903207 CONSUMER $17.338999999999999 2.1577057809690325E-2 MORTGAGE WAREHOUSE $135.74600000000001 0.16892550259151182 FACTORED RECEIVABLES $237.52 EQUIPMENT FINANCE $167 ASSET BASED LENDING $114.63200000000001 HEALTHCARE ASSET $81.664000000000001 BASED LENDING PREMIUM FINANCE $6.117
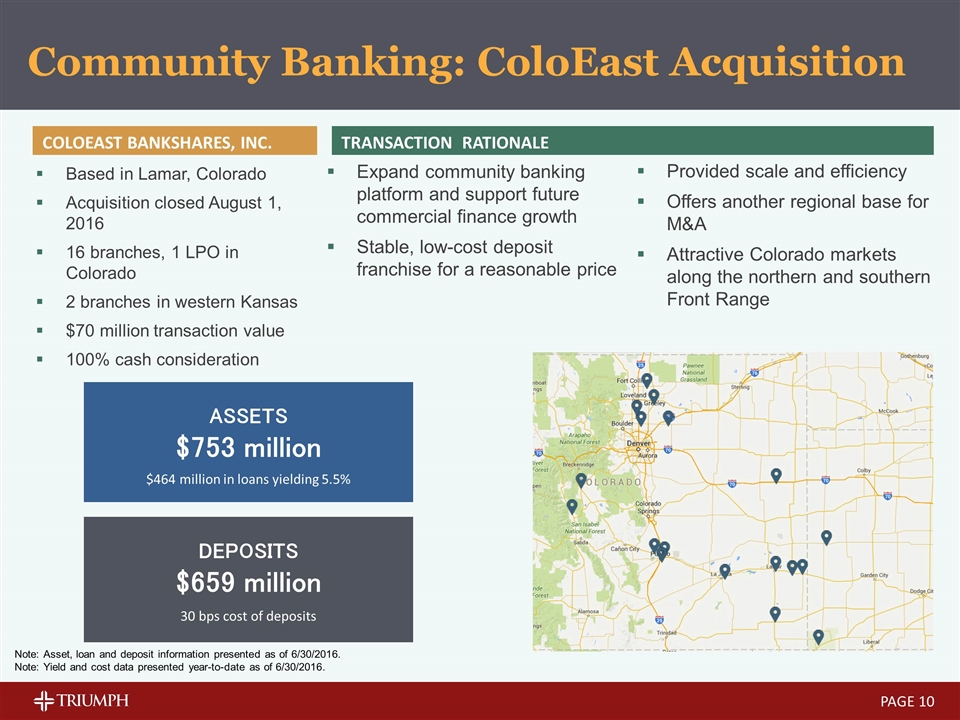
TRANSACTION RATIONALE Expand community banking platform and support future commercial finance growth Stable, low-cost deposit franchise for a reasonable price Based in Lamar, Colorado Acquisition closed August 1, 2016 16 branches, 1 LPO in Colorado 2 branches in western Kansas $70 million transaction value 100% cash consideration ASSETS $753 million $464 million in loans yielding 5.5% DEPOSITS $659 million 30 bps cost of deposits COLOEAST BANKSHARES, Inc. Community Banking: ColoEast Acquisition Provided scale and efficiency Offers another regional base for M&A Attractive Colorado markets along the northern and southern Front Range PAGE Note: Asset, loan and deposit information presented as of 6/30/2016. Note: Yield and cost data presented year-to-date as of 6/30/2016.

Deposit Mix, Rate and Growth PAGE (1) (1) Consists of the following deposits: Interest Bearing Demand, Individual Retirement Accounts, Money Market, and Savings.
How We Go To Market PAGE Commercial Finance Community Banking Asset Management Factoring Asset Based Lending & Equipment Finance Asset Based Lending
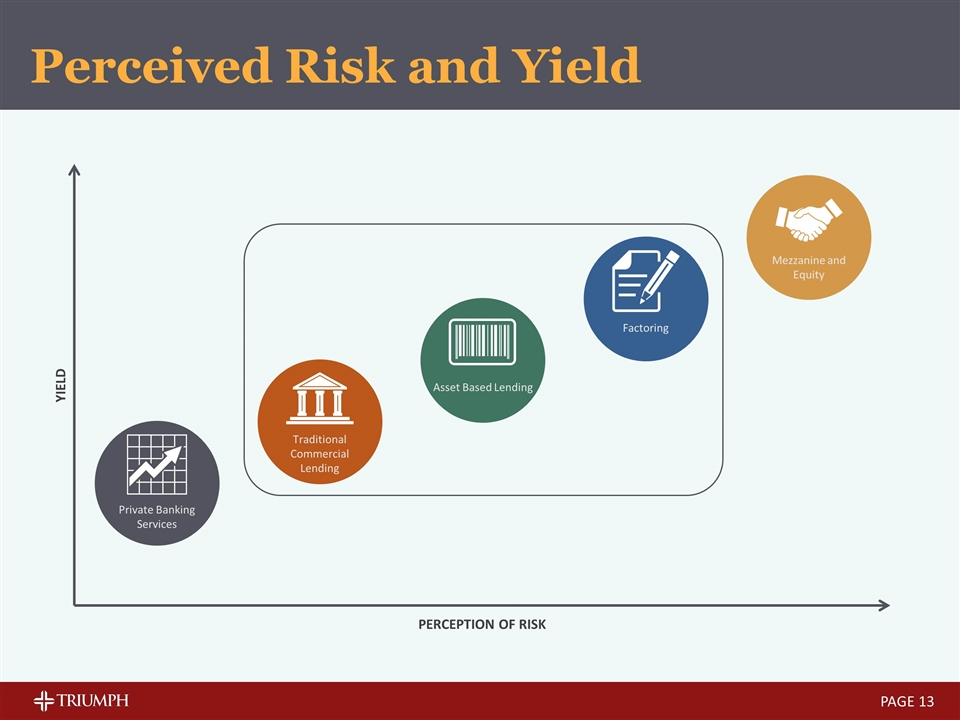
Private Banking Services Traditional Commercial Lending Asset Based Lending Factoring Mezzanine and Equity YIELD PERCEPTION OF RISK Perceived Risk and Yield PAGE
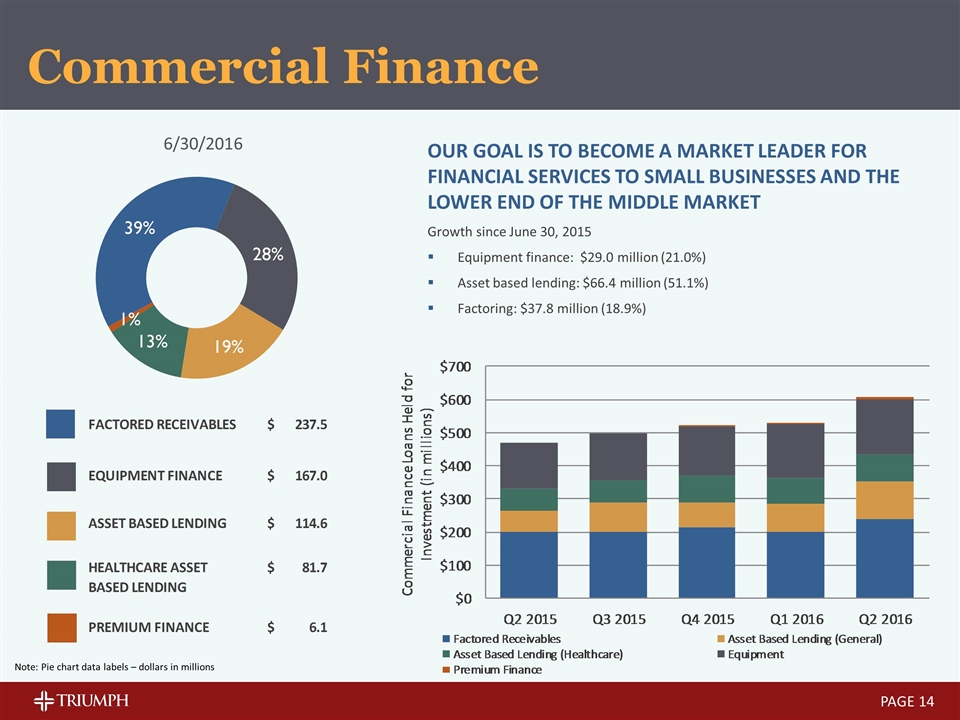
6/30/2016 Our goal is to become a market leader for financial services to small businesses and the lower end of the middle market Growth since June 30, 2015 Equipment finance: $29.0 million (21.0%) Asset based lending: $66.4 million (51.1%) Factoring: $37.8 million (18.9%) Commercial Finance PAGE Note: Pie chart data labels – dollars in millions 42185 42277 42369 42460 42551 Q2 2015 Q3 2015 Q4 2015 Q1 2016 Q2 2016 Community Banking 685.02599999999995 687.54200000000003 770.9 717.72799999999995 803.58500000000004 Equipment 138.018 143.483 148.95099999999999 159.755 167 0.275153929675928 Commercial Finance: Asset based lending (General) 64.835999999999999 85.641000000000005 75.134 85.739000000000004 114.63200000000001 0.18887092974018549 Asset based lending (Healthcare) 65.082999999999998 66.831999999999994 80.2 79.58 81.664000000000001 0.13455191923985022 Premium Finance 0 0 1.6120000000000001 3.5059999999999998 6.117 1.0078542442081746E-2 Factored receivables 199.71600000000001 201.803 215.08799999999999 199.53200000000001 237.52 0.39134467890195462 Q2 2016 Commercial Finance Products $606.93299999999999 Community Banking $803.58500000000004 Real Estate & Farmland $445.40499999999997 Commercial Real Estate $298.99099999999999 Commercial $205.09500000000003 Construction, Land Development, Land $36.497999999999998 Consumer $17.338999999999999 1-4 Family Residential Properties $74.120999999999995 Mortgage Warehouse $135.74600000000001 Farmland $35.795000000000002 Commercial $205.09500000000003 Consumer $17.338999999999999 Community Banking Mortgage Warehouse $135.74600000000001 REAL ESTATE Commercial Real Estate $298.99099999999999 Construction, Land & Development $36.497999999999998 1-4 Family Residential $74.120999999999995 Farmland $35.795000000000002 0.55427241673251748 COMMERCIAL $205.19500000000002 Rounded 0.25534946520903207 CONSUMER $17.338999999999999 2.1577057809690325E-2 MORTGAGE WAREHOUSE $135.74600000000001 0.16892550259151182 FACTORED RECEIVABLES $237.52 EQUIPMENT FINANCE $167 ASSET BASED LENDING $114.63200000000001 HEALTHCARE ASSET $81.664000000000001 BASED LENDING PREMIUM FINANCE $6.117

Loan Portfolio Detail Community Banking / Other Commercial Finance Loans Held for Investment PAGE Note: Financial loan information as of June 30, 2016. Dollars in millions. 42185 42277 42369 42460 42551 Q2 2015 Q3 2015 Q4 2015 Q1 2016 Q2 2016 Community Banking 685.02599999999995 687.54200000000003 770.9 717.72799999999995 803.58500000000004 Equipment 138.018 143.483 148.95099999999999 159.755 167 0.275153929675928 Commercial Finance: Asset based lending (General) 64.835999999999999 85.641000000000005 75.134 85.739000000000004 114.63200000000001 0.18887092974018549 Asset based lending (Healthcare) 65.082999999999998 66.831999999999994 80.2 79.58 81.664000000000001 0.13455191923985022 Premium Finance 0 0 1.6120000000000001 3.5059999999999998 6.117 1.0078542442081746E-2 Factored receivables 199.71600000000001 201.803 215.08799999999999 199.53200000000001 237.52 0.39134467890195462 Q2 2016 Commercial Finance Products $606.93299999999999 Community Banking $803.58500000000004 Real Estate & Farmland $445.40499999999997 Commercial Real Estate $298.99099999999999 Commercial $205.09500000000003 Construction, Land Development, Land $36.497999999999998 Consumer $17.338999999999999 1-4 Family Residential Properties $74.120999999999995 Mortgage Warehouse $135.74600000000001 Farmland $35.795000000000002 Commercial $205.09500000000003 Consumer $17.338999999999999 Community Banking Mortgage Warehouse $135.74600000000001 REAL ESTATE Commercial Real Estate $298.99099999999999 Construction, Land & Development $36.497999999999998 1-4 Family Residential $74.120999999999995 Farmland $35.795000000000002 0.55427241673251748 COMMERCIAL $205.19500000000002 Rounded 0.25534946520903207 CONSUMER $17.338999999999999 2.1577057809690325E-2 MORTGAGE WAREHOUSE $135.74600000000001 0.16892550259151182 FACTORED RECEIVABLES $237.52 EQUIPMENT FINANCE $167 ASSET BASED LENDING $114.63200000000001 HEALTHCARE ASSET $81.664000000000001 BASED LENDING PREMIUM FINANCE $6.117 42185 42277 42369 42460 42551 Q2 2015 Q3 2015 Q4 2015 Q1 2016 Q2 2016 Community Banking 685.02599999999995 687.54200000000003 770.9 717.72799999999995 803.58500000000004 Equipment 138.018 143.483 148.95099999999999 159.755 167 0.275153929675928 Commercial Finance: Asset based lending (General) 64.835999999999999 85.641000000000005 75.134 85.739000000000004 114.63200000000001 0.18887092974018549 Asset based lending (Healthcare) 65.082999999999998 66.831999999999994 80.2 79.58 81.664000000000001 0.13455191923985022 Premium Finance 0 0 1.6120000000000001 3.5059999999999998 6.117 1.0078542442081746E-2 Factored receivables 199.71600000000001 201.803 215.08799999999999 199.53200000000001 237.52 0.39134467890195462 Q2 2016 Commercial Finance Products $606.93299999999999 Community Banking $803.58500000000004 Real Estate & Farmland $445.40499999999997 Commercial Real Estate $298.99099999999999 Commercial $205.09500000000003 Construction, Land Development, Land $36.497999999999998 Consumer $17.338999999999999 1-4 Family Residential Properties $74.120999999999995 Mortgage Warehouse $135.74600000000001 Farmland $35.795000000000002 Commercial $205.09500000000003 Consumer $17.338999999999999 Community Banking Mortgage Warehouse $135.74600000000001 REAL ESTATE Commercial Real Estate $298.99099999999999 Construction, Land & Development $36.497999999999998 1-4 Family Residential $74.120999999999995 Farmland $35.795000000000002 0.55427241673251748 COMMERCIAL $205.19500000000002 Rounded 0.25534946520903207 CONSUMER $17.338999999999999 2.1577057809690325E-2 MORTGAGE WAREHOUSE $135.74600000000001 0.16892550259151182 FACTORED RECEIVABLES $237.52 EQUIPMENT FINANCE $167 ASSET BASED LENDING $114.63200000000001 HEALTHCARE ASSET $81.664000000000001 BASED LENDING PREMIUM FINANCE $6.117
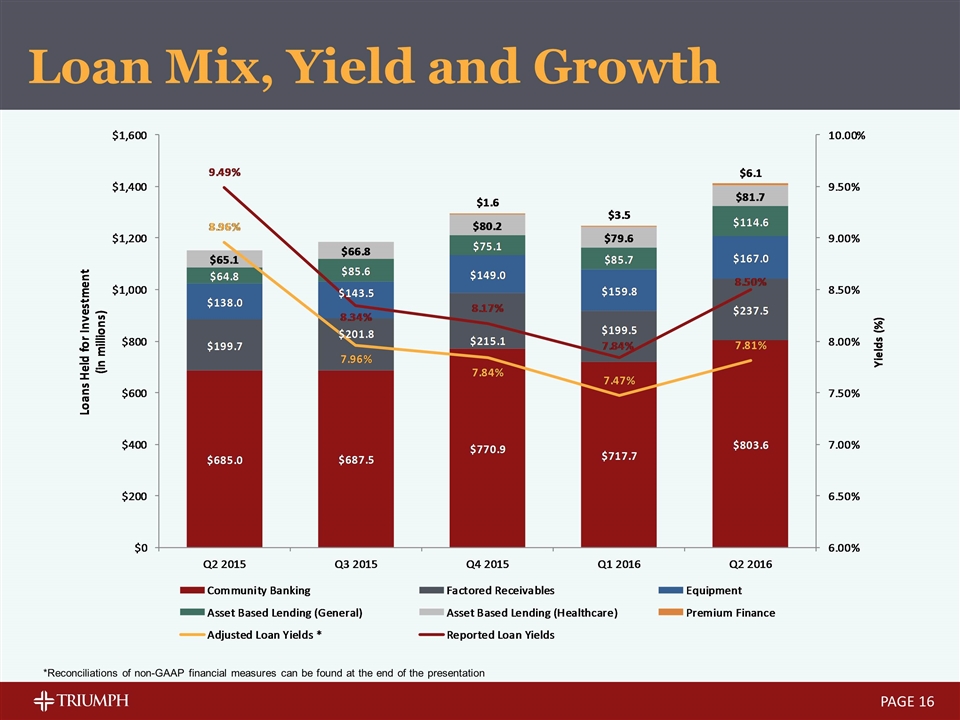
Loan Mix, Yield and Growth PAGE *Reconciliations of non-GAAP financial measures can be found at the end of the presentation
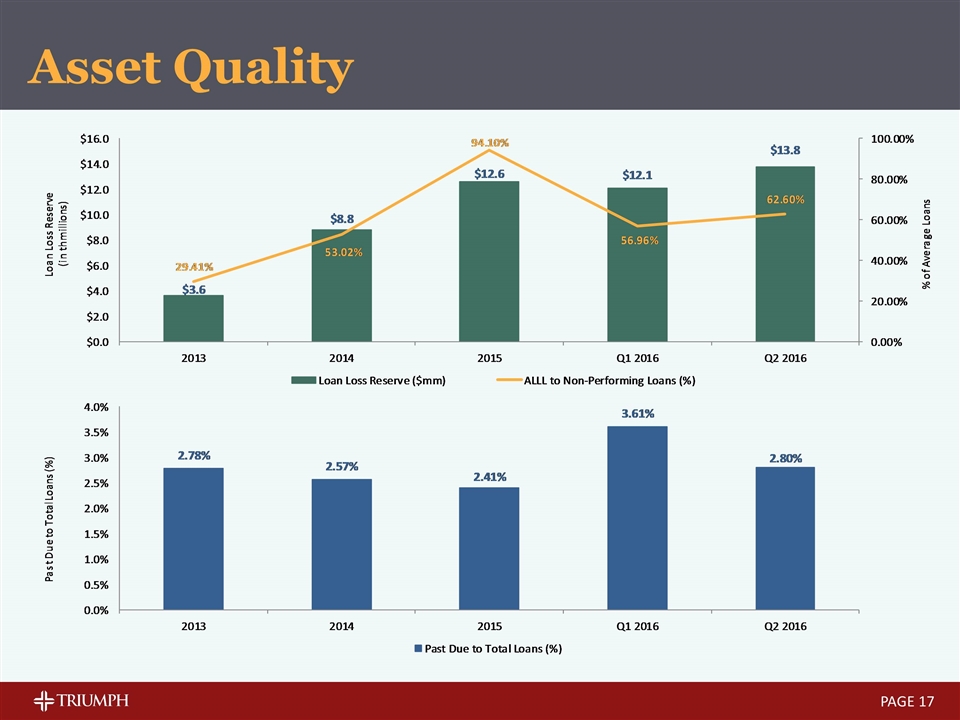
Asset Quality PAGE
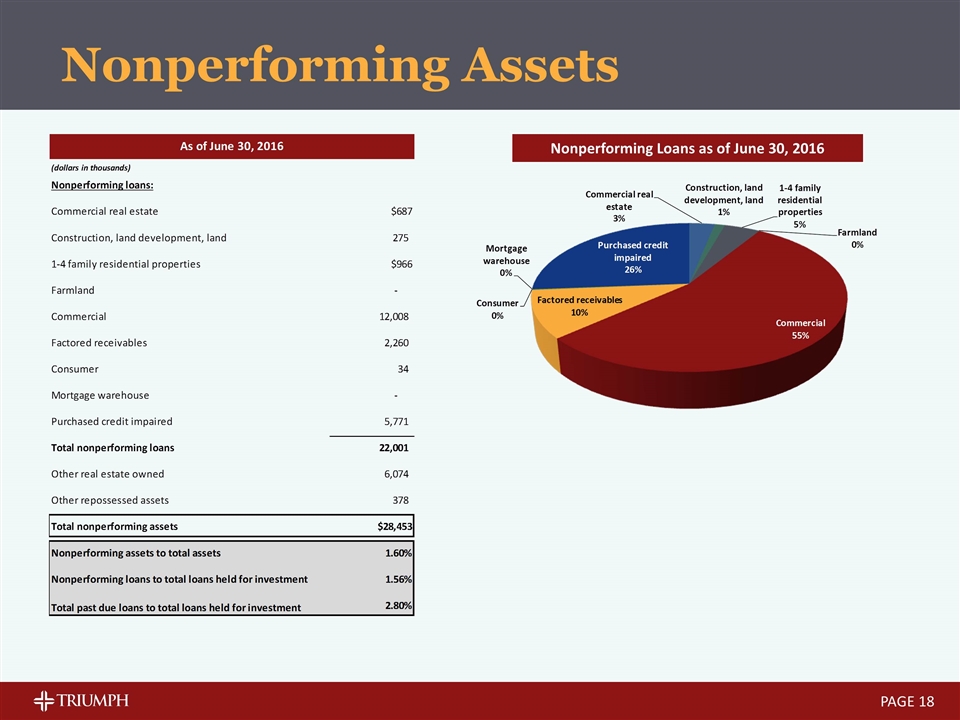
Nonperforming Assets PAGE Nonperforming Loans as of June 30, 2016
How We Go To Market PAGE Commercial Finance Community Banking Asset Management Factoring Asset Based Lending & Equipment Finance Asset Based Lending
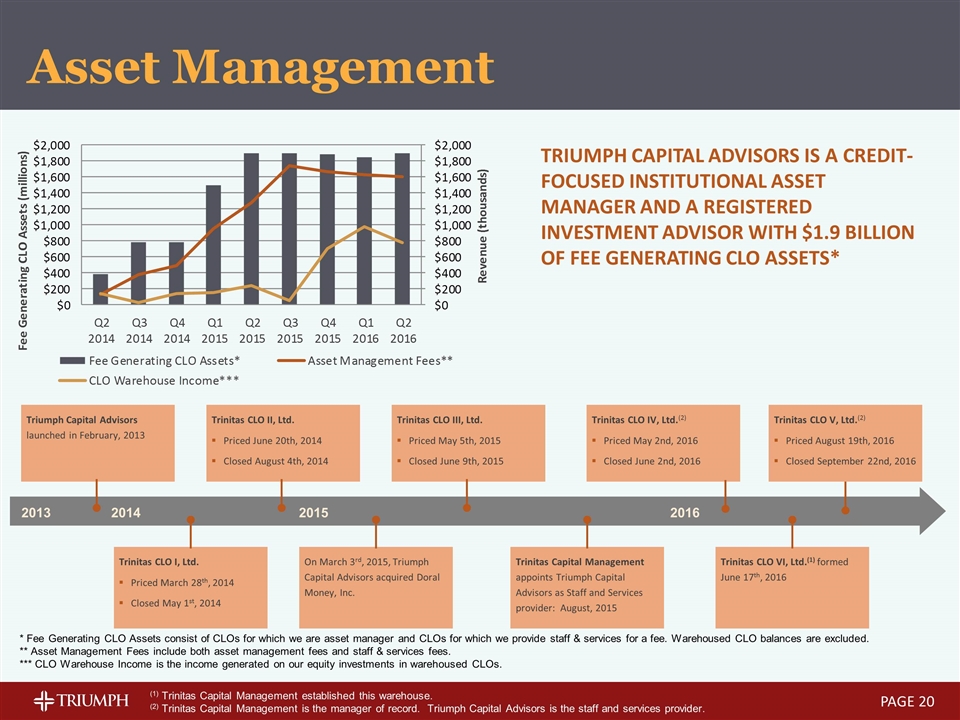
2013 * Fee Generating CLO Assets consist of CLOs for which we are asset manager and CLOs for which we provide staff & services for a fee. Warehoused CLO balances are excluded. ** Asset Management Fees include both asset management fees and staff & services fees. *** CLO Warehouse Income is the income generated on our equity investments in warehoused CLOs. Triumph Capital Advisors is a credit-focused institutional asset manager and a registered investment advisor with $1.9 billion of fee generating CLO assets* 2014 2015 Triumph Capital Advisors launched in February, 2013 On March 3rd, 2015, Triumph Capital Advisors acquired Doral Money, Inc. Trinitas CLO I, Ltd. Priced March 28th, 2014 Closed May 1st, 2014 Trinitas CLO II, Ltd. Priced June 20th, 2014 Closed August 4th, 2014 Trinitas CLO III, Ltd. Priced May 5th, 2015 Closed June 9th, 2015 Asset Management 2016 Trinitas CLO VI, Ltd.(1) formed June 17th, 2016 Trinitas CLO IV, Ltd.(2) Priced May 2nd, 2016 Closed June 2nd, 2016 (1) Trinitas Capital Management established this warehouse. (2) Trinitas Capital Management is the manager of record. Triumph Capital Advisors is the staff and services provider. Trinitas Capital Management appoints Triumph Capital Advisors as Staff and Services provider: August, 2015 PAGE Trinitas CLO V, Ltd.(2) Priced August 19th, 2016 Closed September 22nd, 2016
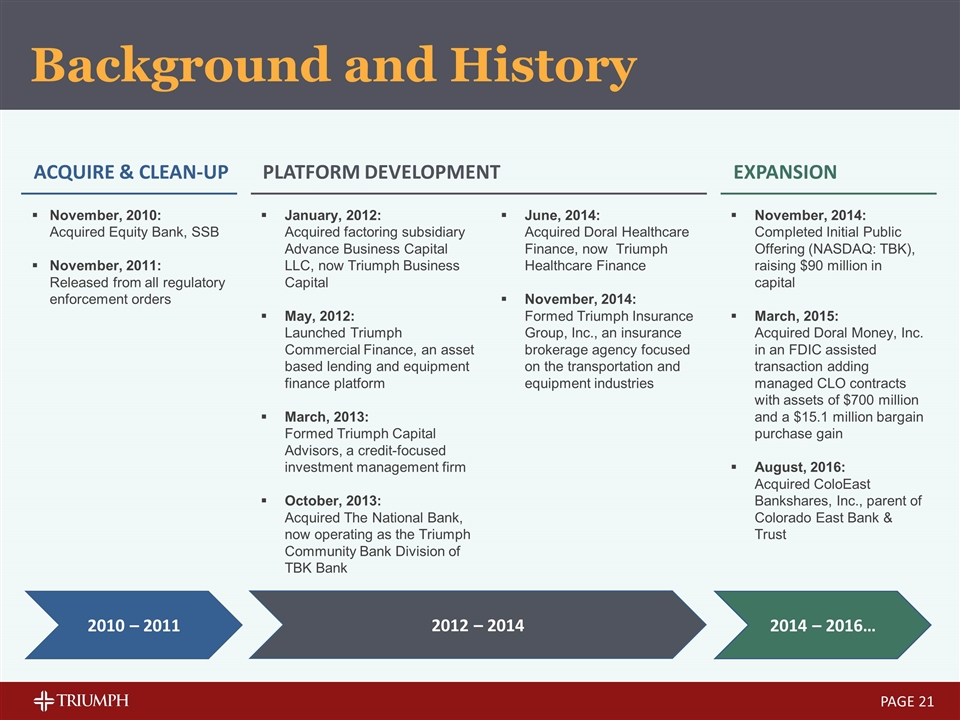
PAGE Background and History November, 2010: Acquired Equity Bank, SSB November, 2011: Released from all regulatory enforcement orders Acquire & Clean-up 2010 – 2011 2012 – 2014 Platform Development June, 2014: Acquired Doral Healthcare Finance, now Triumph Healthcare Finance November, 2014: Formed Triumph Insurance Group, Inc., an insurance brokerage agency focused on the transportation and equipment industries January, 2012: Acquired factoring subsidiary Advance Business Capital LLC, now Triumph Business Capital May, 2012: Launched Triumph Commercial Finance, an asset based lending and equipment finance platform March, 2013: Formed Triumph Capital Advisors, a credit-focused investment management firm October, 2013: Acquired The National Bank, now operating as the Triumph Community Bank Division of TBK Bank 2014 – 2016… Expansion November, 2014: Completed Initial Public Offering (NASDAQ: TBK), raising $90 million in capital March, 2015: Acquired Doral Money, Inc. in an FDIC assisted transaction adding managed CLO contracts with assets of $700 million and a $15.1 million bargain purchase gain August, 2016: Acquired ColoEast Bankshares, Inc., parent of Colorado East Bank & Trust
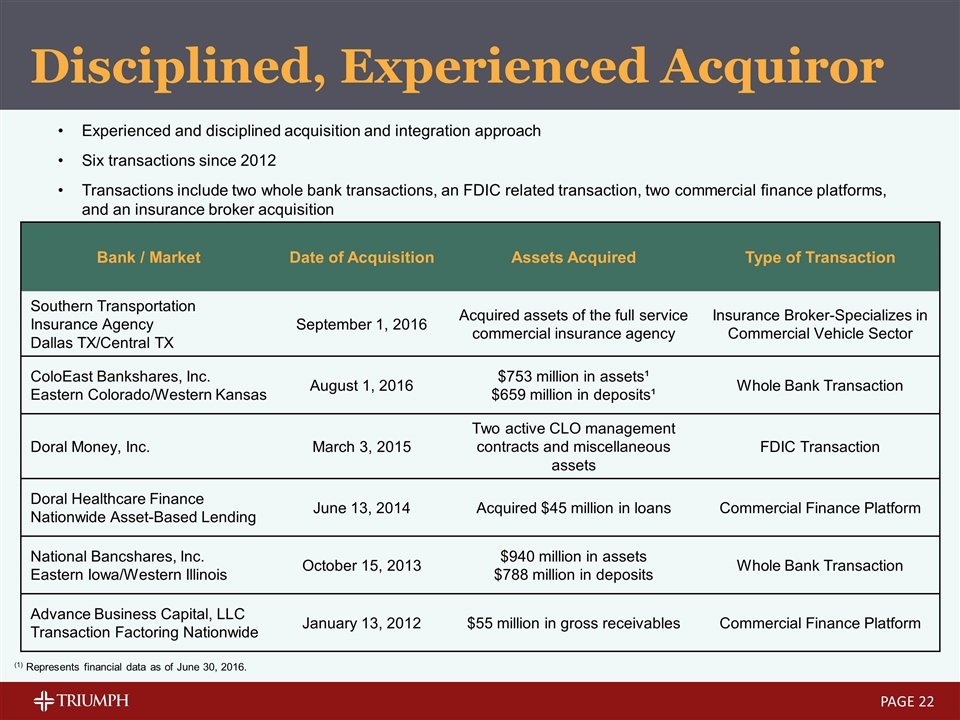
Disciplined, Experienced Acquiror PAGE Experienced and disciplined acquisition and integration approach Six transactions since 2012 Transactions include two whole bank transactions, an FDIC related transaction, two commercial finance platforms, and an insurance broker acquisition Bank / Market Date of Acquisition Assets Acquired Type of Transaction Southern Transportation Insurance Agency Dallas TX/Central TX September 1, 2016 Acquired assets of the full service commercial insurance agency Insurance Broker-Specializes in Commercial Vehicle Sector ColoEast Bankshares, Inc. Eastern Colorado/Western Kansas August 1, 2016 $753 million in assets¹ $659 million in deposits¹ Whole Bank Transaction Doral Money, Inc. March 3, 2015 Two active CLO management contracts and miscellaneous assets FDIC Transaction Doral Healthcare Finance Nationwide Asset-Based Lending June 13, 2014 Acquired $45 million in loans Commercial Finance Platform National Bancshares, Inc. Eastern Iowa/Western Illinois October 15, 2013 $940 million in assets $788 million in deposits Whole Bank Transaction Advance Business Capital, LLC Transaction Factoring Nationwide January 13, 2012 $55 million in gross receivables Commercial Finance Platform (1) Represents financial data as of June 30, 2016.
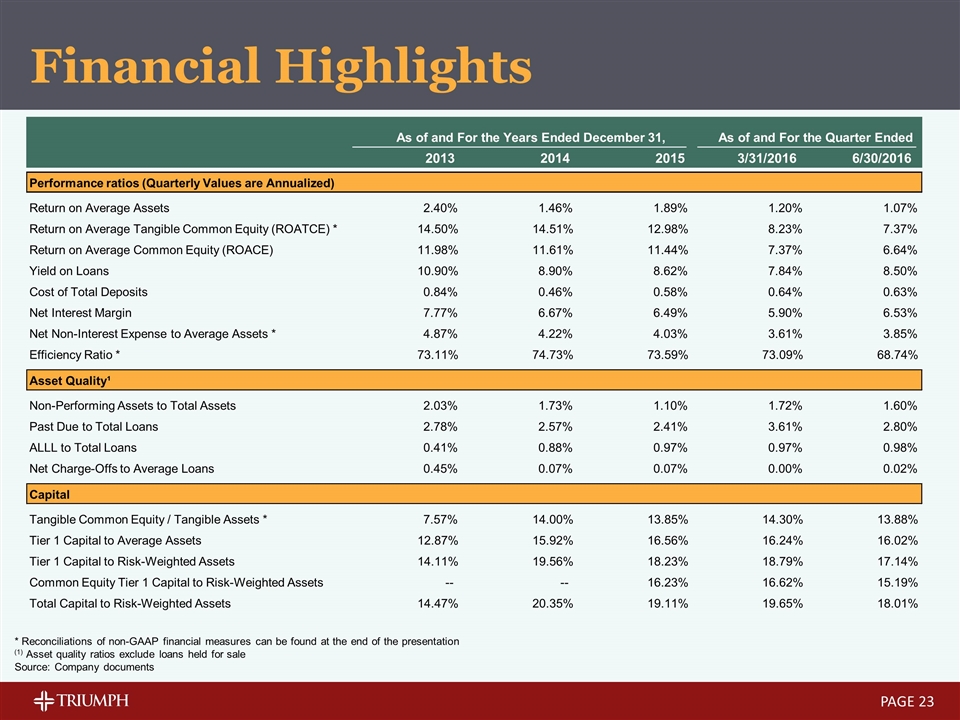
Financial Highlights PAGE * Reconciliations of non-GAAP financial measures can be found at the end of the presentation (1) Asset quality ratios exclude loans held for sale Source: Company documents As of and For the Years Ended December 31, As of and For the Quarter Ended 2013 2014 2015 3/31/2016 6/30/2016 Performance ratios (Quarterly Values are Annualized) Return on Average Assets 2.40% 1.46% 1.89% 1.20% 1.07% Return on Average Tangible Common Equity (ROATCE) * 14.50% 14.51% 12.98% 8.23% 7.37% Return on Average Common Equity (ROACE) 11.98% 11.61% 11.44% 7.37% 6.64% Yield on Loans 10.90% 8.90% 8.62% 7.84% 8.50% Cost of Total Deposits 0.84% 0.46% 0.58% 0.64% 0.63% Net Interest Margin 7.77% 6.67% 6.49% 5.90% 6.53% Net Non-Interest Expense to Average Assets * 4.87% 4.22% 4.03% 3.61% 3.85% Efficiency Ratio * 73.11% 74.73% 73.59% 73.09% 68.74% Asset Quality¹ Non-Performing Assets to Total Assets 2.03% 1.73% 1.10% 1.72% 1.60% Past Due to Total Loans 2.78% 2.57% 2.41% 3.61% 2.80% ALLL to Total Loans 0.41% 0.88% 0.97% 0.97% 0.98% Net Charge-Offs to Average Loans 0.45% 0.07% 0.07% 0.00% 0.02% Capital Tangible Common Equity / Tangible Assets * 7.57% 14.00% 13.85% 14.30% 13.88% Tier 1 Capital to Average Assets 12.87% 15.92% 16.56% 16.24% 16.02% Tier 1 Capital to Risk-Weighted Assets 14.11% 19.56% 18.23% 18.79% 17.14% Common Equity Tier 1 Capital to Risk-Weighted Assets -- -- 16.23% 16.62% 15.19% Total Capital to Risk-Weighted Assets 14.47% 20.35% 19.11% 19.65% 18.01%
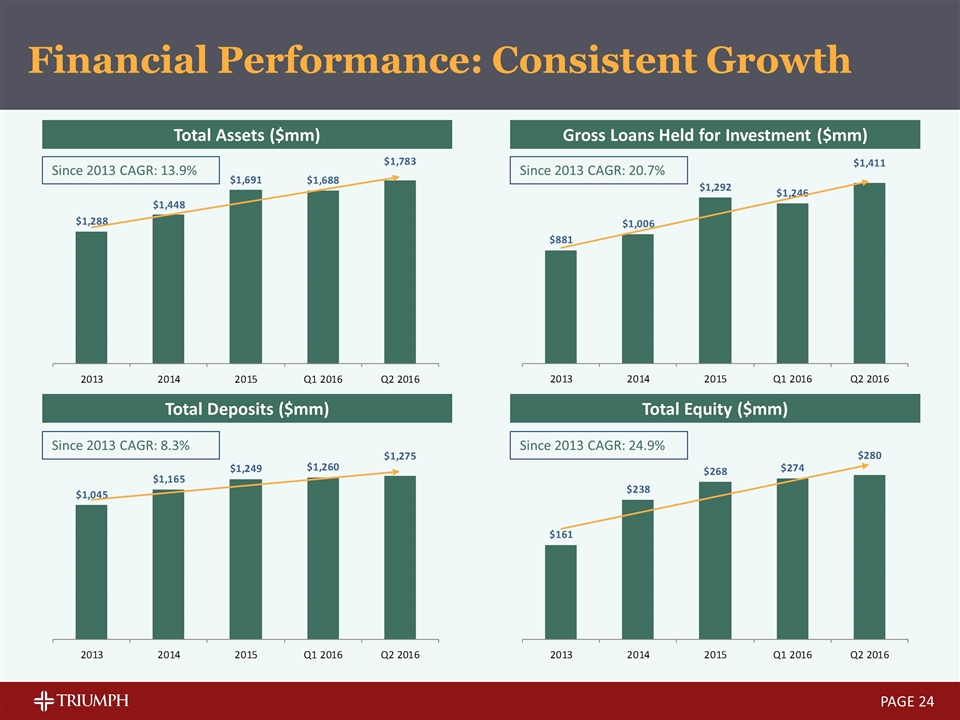
PAGE Total Assets ($mm) Gross Loans Held for Investment ($mm) Total Deposits ($mm) Total Equity ($mm) Since 2013 CAGR: 13.9% Since 2013 CAGR: 20.7% Since 2013 CAGR: 8.3% Since 2013 CAGR: 24.9% Financial Performance: Consistent Growth
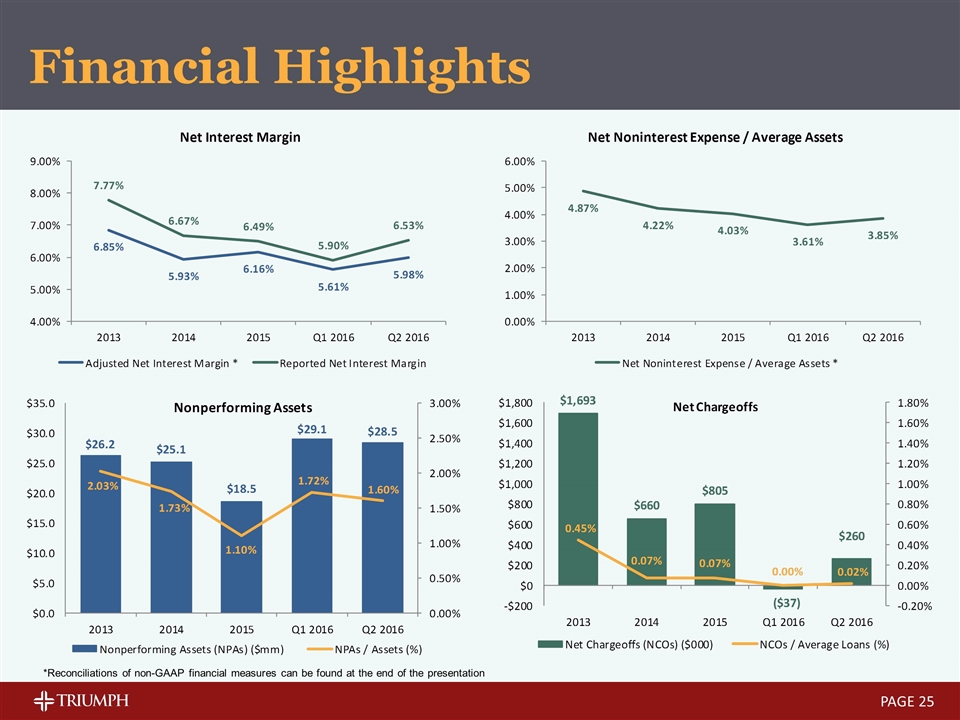
Financial Highlights PAGE *Reconciliations of non-GAAP financial measures can be found at the end of the presentation
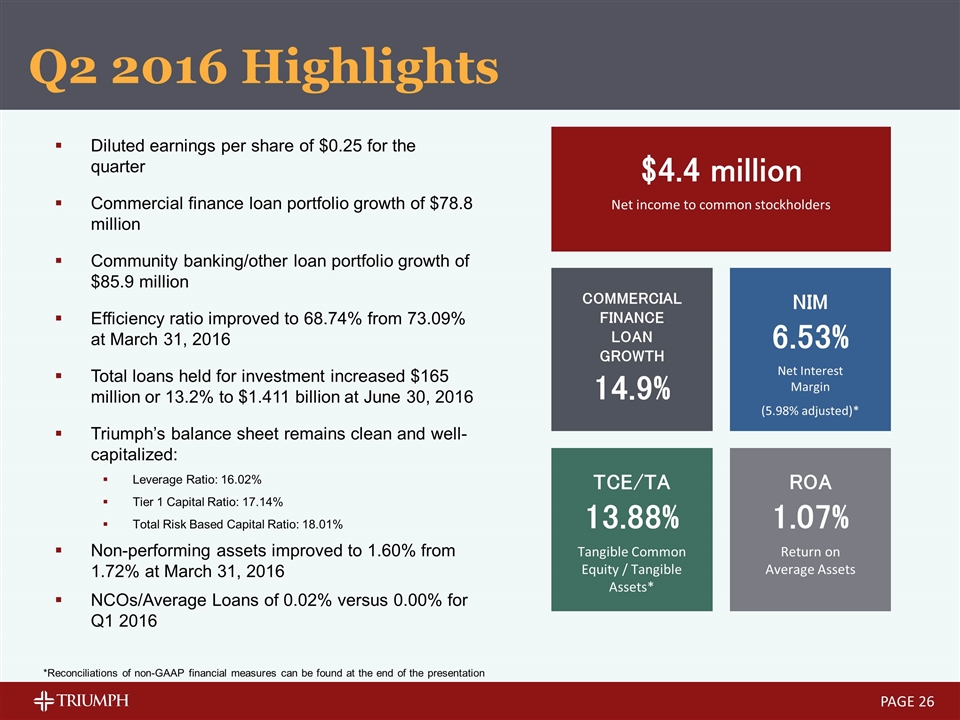
Diluted earnings per share of $0.25 for the quarter Commercial finance loan portfolio growth of $78.8 million Community banking/other loan portfolio growth of $85.9 million Efficiency ratio improved to 68.74% from 73.09% at March 31, 2016 Total loans held for investment increased $165 million or 13.2% to $1.411 billion at June 30, 2016 Triumph’s balance sheet remains clean and well-capitalized: Leverage Ratio: 16.02% Tier 1 Capital Ratio: 17.14% Total Risk Based Capital Ratio: 18.01% Non-performing assets improved to 1.60% from 1.72% at March 31, 2016 NCOs/Average Loans of 0.02% versus 0.00% for Q1 2016 $4.4 million Net income to common stockholders COMMERCIAL FINANCE LOAN GROWTH 14.9% NIM 6.53% Net Interest Margin (5.98% adjusted)* ROA 1.07% Return on Average Assets TCE/TA 13.88% Tangible Common Equity / Tangible Assets* Q2 2016 Highlights *Reconciliations of non-GAAP financial measures can be found at the end of the presentation PAGE
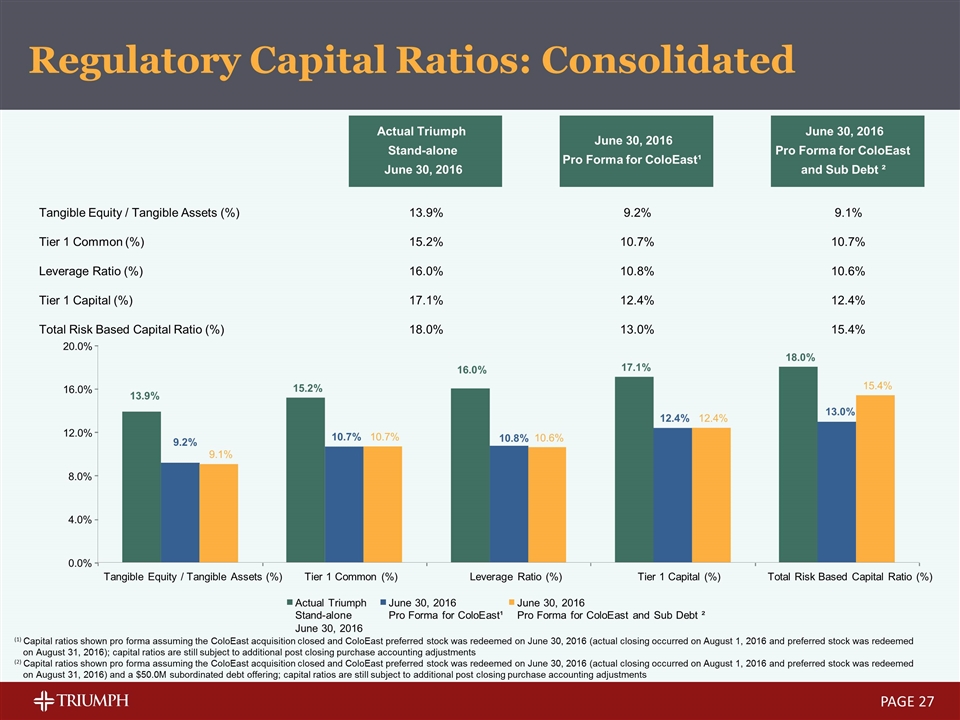
PAGE Regulatory Capital Ratios: Consolidated (1) Capital ratios shown pro forma assuming the ColoEast acquisition closed and ColoEast preferred stock was redeemed on June 30, 2016 (actual closing occurred on August 1, 2016 and preferred stock was redeemed on August 31, 2016); capital ratios are still subject to additional post closing purchase accounting adjustments (2) Capital ratios shown pro forma assuming the ColoEast acquisition closed and ColoEast preferred stock was redeemed on June 30, 2016 (actual closing occurred on August 1, 2016 and preferred stock was redeemed on August 31, 2016) and a $50.0M subordinated debt offering; capital ratios are still subject to additional post closing purchase accounting adjustments Actual Triumph Stand-alone June 30, 2016 June 30, 2016 Pro Forma for ColoEast¹ June 30, 2016 Pro Forma for ColoEast and Sub Debt ² Tangible Equity / Tangible Assets (%) 13.9% 9.2% 9.1% Tier 1 Common (%) 15.2% 10.7% 10.7% Leverage Ratio (%) 16.0% 10.8% 10.6% Tier 1 Capital (%) 17.1% 12.4% 12.4% Total Risk Based Capital Ratio (%) 18.0% 13.0% 15.4% 13.9% 15.2% 16.0% 17.1% 18.0% 9.2% 10.7% 10.8% 12.4% 13.0% 9.1% 10.7% 10.6% 12.4% 15.4% 0.0% 4.0% 8.0% 12.0% 16.0% 20.0% Tangible Equity / Tangible Assets (%) Tier 1 Common (%) Leverage Ratio (%) Tier 1 Capital (%) Total Risk Based Capital Ratio (%) Actual Triumph Stand-alone June 30, 2016 June 30, 2016 Pro Forma for ColoEast¹ June 30, 2016 Pro Forma for ColoEast and Sub Debt ²
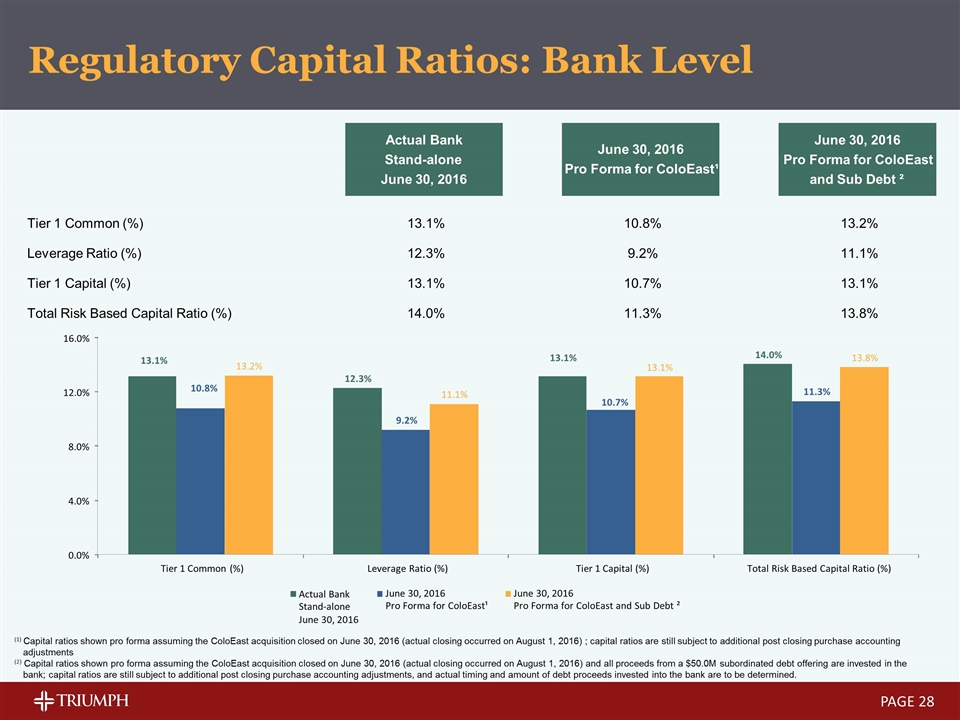
PAGE Regulatory Capital Ratios: Bank Level (1) Capital ratios shown pro forma assuming the ColoEast acquisition closed on June 30, 2016 (actual closing occurred on August 1, 2016) ; capital ratios are still subject to additional post closing purchase accounting adjustments (2) Capital ratios shown pro forma assuming the ColoEast acquisition closed on June 30, 2016 (actual closing occurred on August 1, 2016) and all proceeds from a $50.0M subordinated debt offering are invested in the bank; capital ratios are still subject to additional post closing purchase accounting adjustments, and actual timing and amount of debt proceeds invested into the bank are to be determined. Actual Bank Stand-alone June 30, 2016 June 30, 2016 Pro Forma for ColoEast¹ June 30, 2016 Pro Forma for ColoEast and Sub Debt ² Tier 1 Common (%) 13.1% 10.8% 13.2% Leverage Ratio (%) 12.3% 9.2% 11.1% Tier 1 Capital (%) 13.1% 10.7% 13.1% Total Risk Based Capital Ratio (%) 14.0% 11.3% 13.8% 13.1% 12.3% 13.1% 14.0% 10.8% 9.2% 10.7% 11.3% 13.2% 11.1% 13.1% 13.8% 0.0% 4.0% 8.0% 12.0% 16.0% Tier 1 Common (%) Leverage Ratio (%) Tier 1 Capital (%) Total Risk Based Capital Ratio (%) Actual Bank Stand-alone June 30, 2016 June 30, 2016 Pro Forma for ColoEast¹ June 30, 2016 Pro Forma for ColoEast and Sub Debt ²
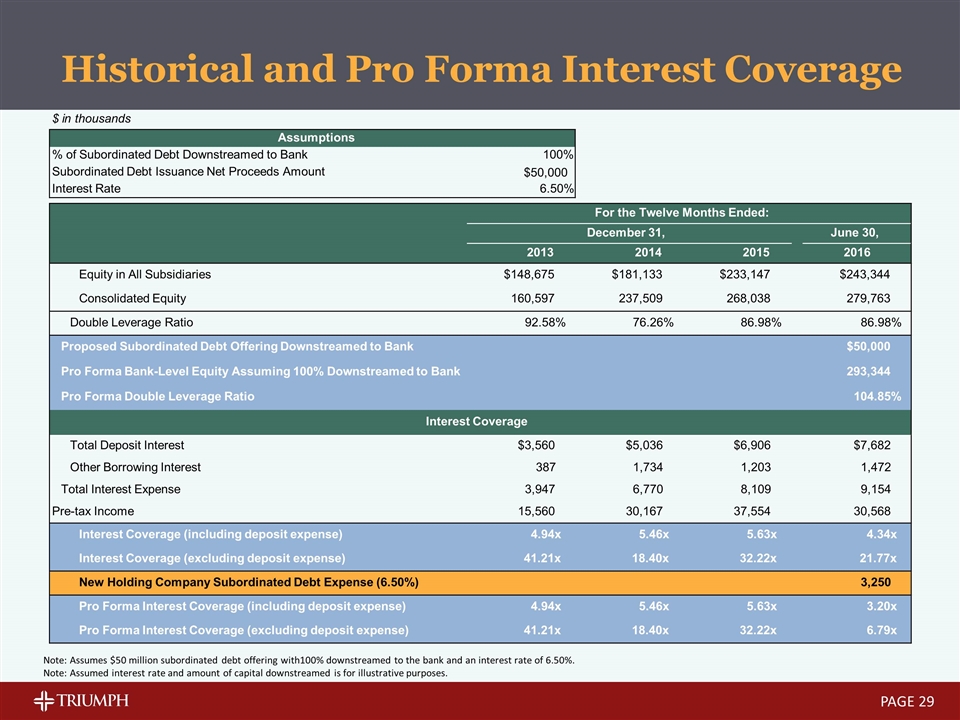
Historical and Pro Forma Interest Coverage PAGE Note: Assumes $50 million subordinated debt offering with100% downstreamed to the bank and an interest rate of 6.50%. Note: Assumed interest rate and amount of capital downstreamed is for illustrative purposes. $ in thousands Assumptions % of Subordinated Debt Downstreamed to Bank 100% Subordinated Debt Issuance Net Proceeds Amount $50,000 Interest Rate 6.50% For the Twelve Months Ended: December 31, June 30, 2013 2014 2015 2016 Equity in All Subsidiaries $148,675 $181,133 $233,147 $243,344 Consolidated Equity 160,597 237,509 268,038 279,763 Double Leverage Ratio 92.58% 76.26% 86.98% 86.98% Proposed Subordinated Debt Offering Downstreamed to Bank $50,000 293,344 Pro Forma Double Leverage Ratio 104.85% Interest Coverage Total Deposit Interest $3,560 $5,036 $6,906 $7,682 Other Borrowing Interest 387 1,734 1,203 1,472 Total Interest Expense 3,947 6,770 8,109 9,154 Pre-tax Income 15,560 30,167 37,554 30,568 Interest Coverage (including deposit expense) 4.94x 5.46x 5.63x 4.34x Interest Coverage (excluding deposit expense) 41.21x 18.40x 32.22x 21.77x New Holding Company Subordinated Debt Expense (6.50%) 3,250 Pro Forma Interest Coverage (including deposit expense) 4.94x 5.46x 5.63x 3.20x Pro Forma Interest Coverage (excluding deposit expense) 41.21x 18.40x 32.22x 6.79x Pro Forma Bank-Level Equity Assuming 100% Downstreamed to Bank
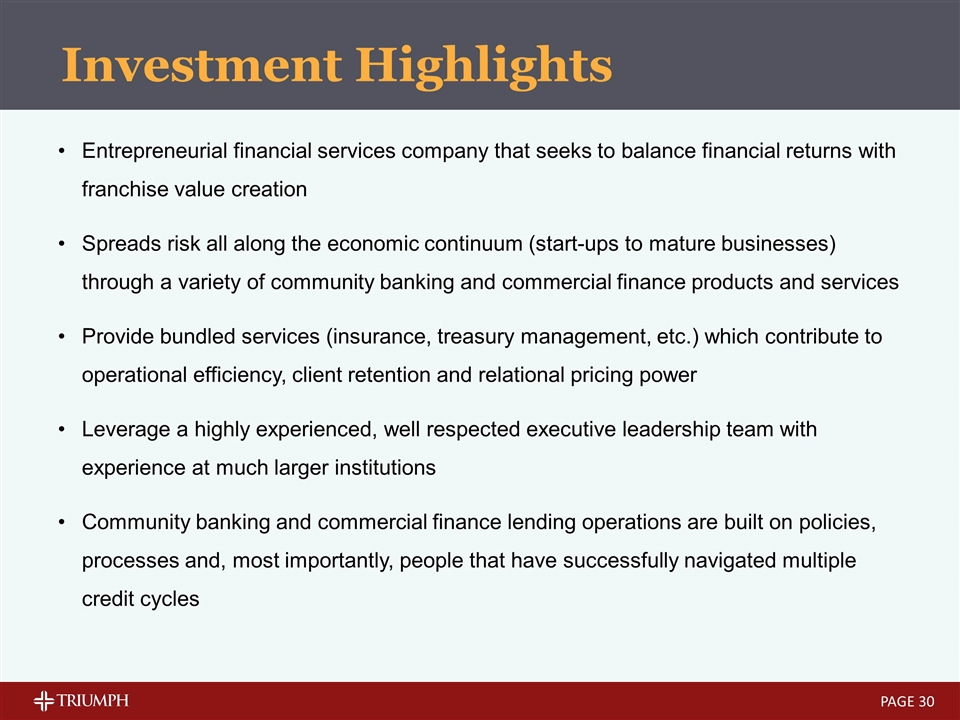
Investment Highlights PAGE Entrepreneurial financial services company that seeks to balance financial returns with franchise value creation Spreads risk all along the economic continuum (start-ups to mature businesses) through a variety of community banking and commercial finance products and services Provide bundled services (insurance, treasury management, etc.) which contribute to operational efficiency, client retention and relational pricing power Leverage a highly experienced, well respected executive leadership team with experience at much larger institutions Community banking and commercial finance lending operations are built on policies, processes and, most importantly, people that have successfully navigated multiple credit cycles

APPENDIX
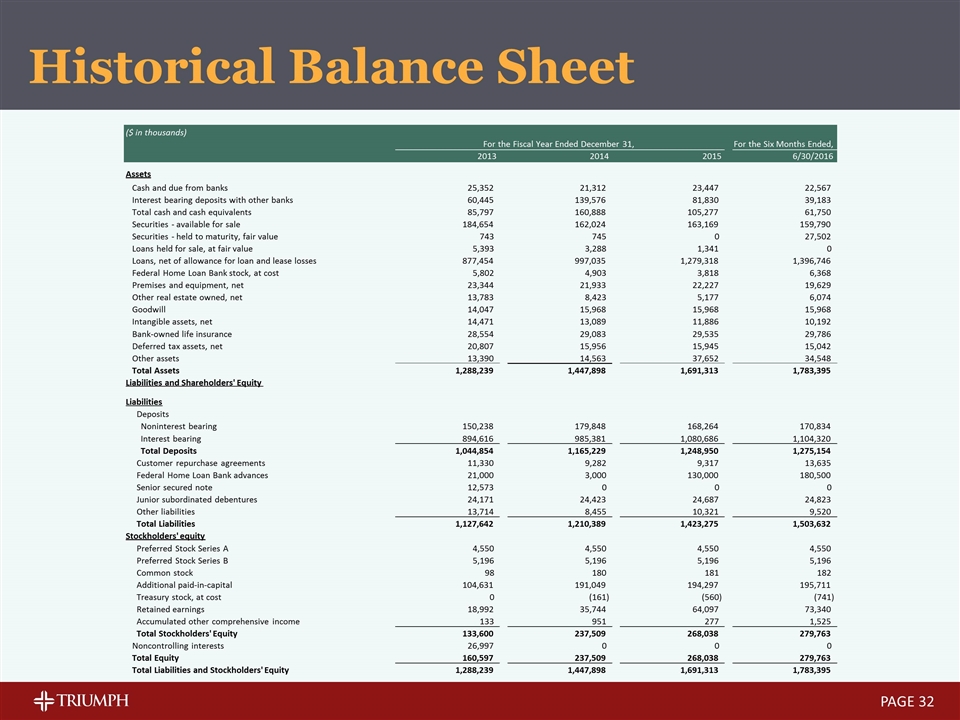
Historical Balance Sheet PAGE ($ in thousands) For the Fiscal Year Ended December 31, For the Six Months Ended, 2013 2014 2015 6/30/2016 Assets Cash and due from banks 25,352 21,312 23,447 22,567 Interest bearing deposits with other banks 60,445 139,576 81,830 39,183 Total cash and cash equivalents 85,797 160,888 105,277 61,750 Securities - available for sale 184,654 162,024 163,169 159,790 Securities - held to maturity, fair value 743 745 0 27,502 Loans held for sale, at fair value 5,393 3,288 1,341 0 Loans, net of allowance for loan and lease losses 877,454 997,035 1,279,318 1,396,746 Federal Home Loan Bank stock, at cost 5,802 4,903 3,818 6,368 Premises and equipment, net 23,344 21,933 22,227 19,629 Other real estate owned, net 13,783 8,423 5,177 6,074 Goodwill 14,047 15,968 15,968 15,968 Intangible assets, net 14,471 13,089 11,886 10,192 Bank-owned life insurance 28,554 29,083 29,535 29,786 Deferred tax assets, net 20,807 15,956 15,945 15,042 Other assets 13,390 14,563 37,652 34,548 Total Assets 1,288,239 1,447,898 1,691,313 1,783,395 Liabilities and Shareholders' Equity Liabilities Deposits Noninterest bearing 150,238 179,848 168,264 170,834 Interest bearing 894,616 985,381 1,080,686 1,104,320 Total Deposits 1,044,854 1,165,229 1,248,950 1,275,154 Customer repurchase agreements 11,330 9,282 9,317 13,635 Federal Home Loan Bank advances 21,000 3,000 130,000 180,500 Senior secured note 12,573 0 0 0 Junior subordinated debentures 24,171 24,423 24,687 24,823 Other liabilities 13,714 8,455 10,321 9,520 Total Liabilities 1,127,642 1,210,389 1,423,275 1,503,632 Stockholders' equity Preferred Stock Series A 4,550 4,550 4,550 4,550 Preferred Stock Series B 5,196 5,196 5,196 5,196 Common stock 98 180 181 182 Additional paid-in-capital 104,631 191,049 194,297 195,711 Treasury stock, at cost 0 (161) (560) (741) Retained earnings 18,992 35,744 64,097 73,340 Accumulated other comprehensive income 133 951 277 1,525 Total Stockholders' Equity 133,600 237,509 268,038 279,763 Noncontrolling interests 26,997 0 0 0 Total Equity 160,597 237,509 268,038 279,763 Total Liabilities and Stockholders' Equity 1,288,239 1,447,898 1,691,313 1,783,395
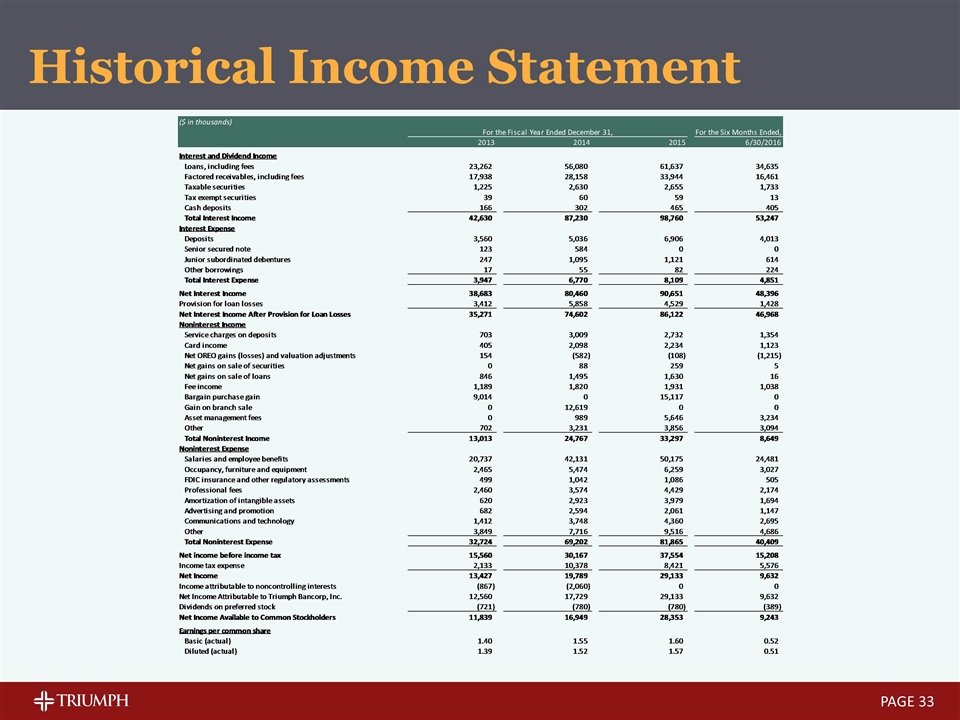
Historical Income Statement PAGE
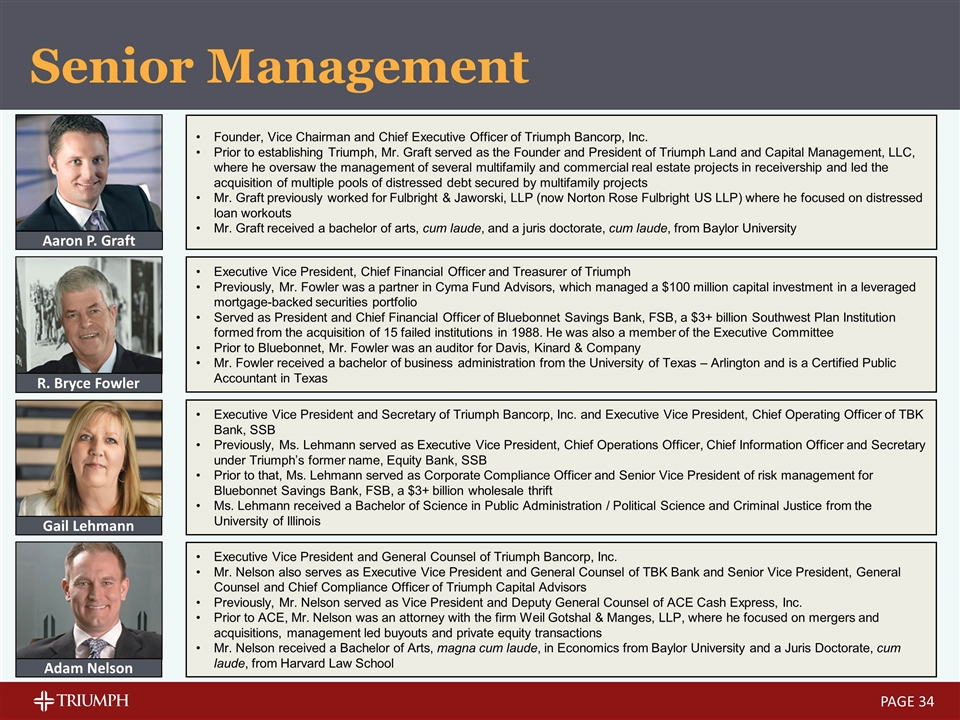
Executive Vice President and General Counsel of Triumph Bancorp, Inc. Mr. Nelson also serves as Executive Vice President and General Counsel of TBK Bank and Senior Vice President, General Counsel and Chief Compliance Officer of Triumph Capital Advisors Previously, Mr. Nelson served as Vice President and Deputy General Counsel of ACE Cash Express, Inc. Prior to ACE, Mr. Nelson was an attorney with the firm Weil Gotshal & Manges, LLP, where he focused on mergers and acquisitions, management led buyouts and private equity transactions Mr. Nelson received a Bachelor of Arts, magna cum laude, in Economics from Baylor University and a Juris Doctorate, cum laude, from Harvard Law School Adam Nelson Senior Management PAGE Executive Vice President, Chief Financial Officer and Treasurer of Triumph Previously, Mr. Fowler was a partner in Cyma Fund Advisors, which managed a $100 million capital investment in a leveraged mortgage-backed securities portfolio Served as President and Chief Financial Officer of Bluebonnet Savings Bank, FSB, a $3+ billion Southwest Plan Institution formed from the acquisition of 15 failed institutions in 1988. He was also a member of the Executive Committee Prior to Bluebonnet, Mr. Fowler was an auditor for Davis, Kinard & Company Mr. Fowler received a bachelor of business administration from the University of Texas – Arlington and is a Certified Public Accountant in Texas R. Bryce Fowler Founder, Vice Chairman and Chief Executive Officer of Triumph Bancorp, Inc. Prior to establishing Triumph, Mr. Graft served as the Founder and President of Triumph Land and Capital Management, LLC, where he oversaw the management of several multifamily and commercial real estate projects in receivership and led the acquisition of multiple pools of distressed debt secured by multifamily projects Mr. Graft previously worked for Fulbright & Jaworski, LLP (now Norton Rose Fulbright US LLP) where he focused on distressed loan workouts Mr. Graft received a bachelor of arts, cum laude, and a juris doctorate, cum laude, from Baylor University Aaron P. Graft Executive Vice President and Secretary of Triumph Bancorp, Inc. and Executive Vice President, Chief Operating Officer of TBK Bank, SSB Previously, Ms. Lehmann served as Executive Vice President, Chief Operations Officer, Chief Information Officer and Secretary under Triumph’s former name, Equity Bank, SSB Prior to that, Ms. Lehmann served as Corporate Compliance Officer and Senior Vice President of risk management for Bluebonnet Savings Bank, FSB, a $3+ billion wholesale thrift Ms. Lehmann received a Bachelor of Science in Public Administration / Political Science and Criminal Justice from the University of Illinois Gail Lehmann
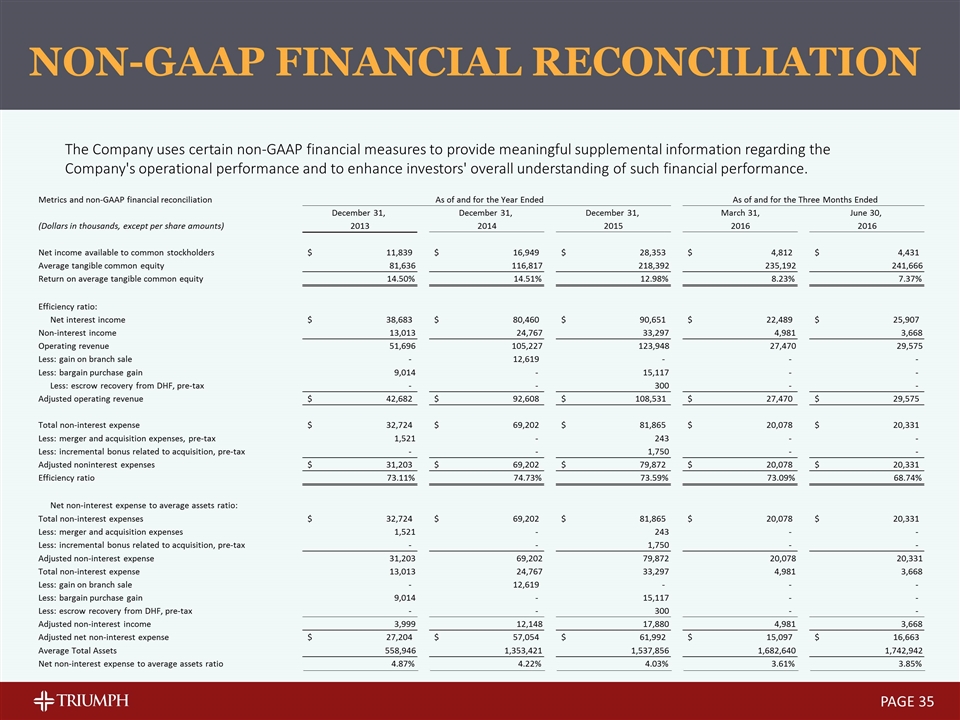
NON-GAAP FINANCIAL RECONCILIATION The Company uses certain non-GAAP financial measures to provide meaningful supplemental information regarding the Company's operational performance and to enhance investors' overall understanding of such financial performance. PAGE Metrics and non-GAAP financial reconciliation As of and for the Year Ended As of and for the Three Months Ended December 31, December 31, December 31, March 31, June 30, (Dollars in thousands, except per share amounts) 2013 2014 2015 2016 2016 Net income available to common stockholders 11,839 $ 16,949 $ 28,353 $ 4,812 $ 4,431 $ Average tangible common equity 81,636 116,817 218,392 235,192 241,666 Return on average tangible common equity 14.50% 14.51% 12.98% 8.23% 7.37% Efficiency ratio: Net interest income 38,683 $ 80,460 $ 90,651 $ 22,489 $ 25,907 $ Non-interest income 13,013 24,767 33,297 4,981 3,668 Operating revenue 51,696 105,227 123,948 27,470 29,575 Less: gain on branch sale - 12,619 - - - Less: bargain purchase gain 9,014 - 15,117 - - Less: escrow recovery from DHF, pre-tax - - 300 - - Adjusted operating revenue 42,682 $ 92,608 $ 108,531 $ 27,470 $ 29,575 $ Total non-interest expense 32,724 $ 69,202 $ 81,865 $ 20,078 $ 20,331 $ Less: merger and acquisition expenses, pre-tax 1,521 - 243 - - Less: incremental bonus related to acquisition, pre-tax - - 1,750 - - Adjusted noninterest expenses 31,203 $ 69,202 $ 79,872 $ 20,078 $ 20,331 $ Efficiency ratio 73.11% 74.73% 73.59% 73.09% 68.74% Net non-interest expense to average assets ratio: Total non-interest expenses 32,724 $ 69,202 $ 81,865 $ 20,078 $ 20,331 $ Less: merger and acquisition expenses 1,521 - 243 - - Less: incremental bonus related to acquisition, pre-tax - - 1,750 - - Adjusted non-interest expense 31,203 69,202 79,872 20,078 20,331 Total non-interest expense 13,013 24,767 33,297 4,981 3,668 Less: gain on branch sale - 12,619 - - - Less: bargain purchase gain 9,014 - 15,117 - - Less: escrow recovery from DHF, pre-tax - - 300 - - Adjusted non-interest income 3,999 12,148 17,880 4,981 3,668 Adjusted net non-interest expense 27,204 $ 57,054 $ 61,992 $ 15,097 $ 16,663 $ Average Total Assets 558,946 1,353,421 1,537,856 1,682,640 1,742,942 Net non-interest expense to average assets ratio 4.87% 4.22% 4.03% 3.61% 3.85%
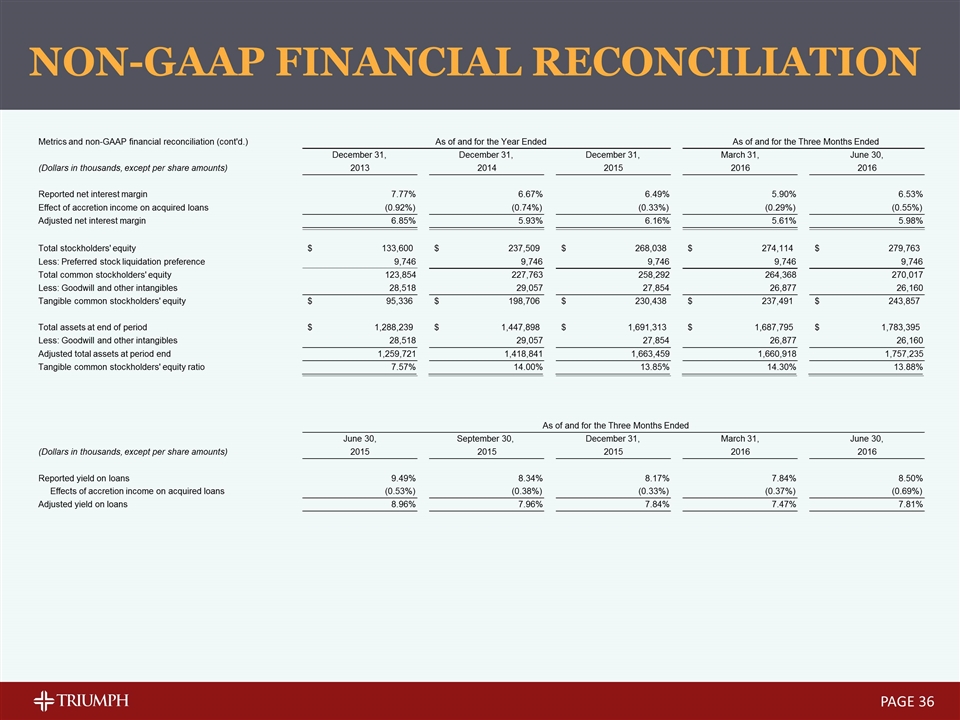
PAGE NON-GAAP FINANCIAL RECONCILIATION Metrics and non-GAAP financial reconciliation (cont'd.) As of and for the Year Ended As of and for the Three Months Ended December 31, December 31, December 31, March 31, June 30, (Dollars in thousands, except per share amounts) 2013 2014 2015 2016 2016 Reported net interest margin 7.77% 6.67% 6.49% 5.90% 6.53% Effect of accretion income on acquired loans (0.92%) (0.74%) (0.33%) (0.29%) (0.55%) Adjusted net interest margin 6.85% 5.93% 6.16% 5.61% 5.98% Total stockholders' equity 133,600 $ 237,509 $ 268,038 $ 274,114 $ 279,763 $ Less: Preferred stock liquidation preference 9,746 9,746 9,746 9,746 9,746 Total common stockholders' equity 123,854 227,763 258,292 264,368 270,017 Less: Goodwill and other intangibles 28,518 29,057 27,854 26,877 26,160 Tangible common stockholders' equity 95,336 $ 198,706 $ 230,438 $ 237,491 $ 243,857 $ Total assets at end of period 1,288,239 $ 1,447,898 $ 1,691,313 $ 1,687,795 $ 1,783,395 $ Less: Goodwill and other intangibles 28,518 29,057 27,854 26,877 26,160 Adjusted total assets at period end 1,259,721 1,418,841 1,663,459 1,660,918 1,757,235 Tangible common stockholders' equity ratio 7.57% 14.00% 13.85% 14.30% 13.88% As of and for the Three Months Ended June 30, September 30, December 31, March 31, June 30, (Dollars in thousands, except per share amounts) 2015 2015 2015 2016 2016 Reported yield on loans 9.49% 8.34% 8.17% 7.84% 8.50% Effects of accretion income on acquired loans (0.53%) (0.38%) (0.33%) (0.37%) (0.69%) Adjusted yield on loans 8.96% 7.96% 7.84% 7.47% 7.81%


