Exhibit 99.1
October 19, 2023
Fellow Shareholders,
For the third quarter, we earned net income to common stockholders of $12.0 million, or $0.51 per diluted share.
Discussion of the Quarter
To begin, there are four things that I want to highlight for our stakeholders:
•TriumphPay's momentum and financial performance has exceeded our expectations.
◦TriumphPay’s revenue grew by 16.7% this quarter. EBITDA margins improved to (15)%. This is improvement worth celebrating, but I want to caution investors from expecting this type of q/o/q performance in future periods. We had several positives accumulate in this quarter. Even with that qualifier, it is gratifying to see TriumphPay continue to thrive.
•We had a unique quarter from an expense perspective and do not expect that to repeat.
◦Our non-interest expenses this quarter declined about $4 million relative to last quarter. Some of this decline, such as lower contract labor costs related to offshoring efforts and some non-recurring items that elevated Q2 expenses, will be sustainable. Other parts of the decline, such as those related to timing of initiatives and related professional services costs, will prove transitory.
•The freight market has not rebounded, and it could get worse before it gets better.
◦It is difficult for anyone to predict short-term market movements, so take this prediction with a grain of salt. Further, not everyone at Triumph Financial shares my level of bearishness on the outlook for freight. I believe things will have to get worse in trucking before they get better. Indeed, in recent days we seen headlines that would support this outlook. I also believe that the leaks in the dam of commercial real estate are getting worse than people generally acknowledge, which could influence the economy and thus have an impact on freight.
•The things that make us uncomfortable in the short term should create value for us in the long term.
◦Assuming I am directionally correct on the point above, the freight market will continue to be force-fed unpleasant medicine over the next several quarters. Inevitably, the medicine of a supply/demand imbalance will bring a healthier market in future days. We do not wish for a deeper freight recession, but if it comes, I expect we will benefit from it. We have a diversified balance sheet, excess capital and offer a full suite of services: business automation, supply chain finance and integrated payments. This is a compelling proposition to those who have not yet joined the network and desire help to navigate a choppy freight market.
The tables on the following page outline some of our key operating metrics.
| | | | | | | | | | | | | | | | | | | | | | | | | | | | | | | | | |
| As of and for the Three Months Ended | | |
| (Dollars in thousands) | September 30,
2023 | | June 30,
2023 | | March 31,
2023 | | December 31,
2022 | | September 30,
2022 | | | | |
| Financial Highlights: | | | | | | | | | | | | | |
| Loans held for investment | $ | 4,371,528 | | | $ | 4,324,758 | | | $ | 4,310,006 | | | $ | 4,120,291 | | | $ | 4,433,304 | | | | | |
| Deposits | $ | 4,487,051 | | | $ | 4,293,466 | | | $ | 4,038,994 | | | $ | 4,171,336 | | | $ | 4,441,354 | | | | | |
| Net income available to common stockholders | $ | 11,993 | | | $ | 6,848 | | | $ | 10,209 | | | $ | 16,759 | | | $ | 15,428 | | | | | |
| Diluted earnings per common share | $ | 0.51 | | | $ | 0.29 | | | $ | 0.43 | | | $ | 0.67 | | | $ | 0.62 | | | | | |
Return on average assets(1) | 0.93 | % | | 0.56 | % | | 0.84 | % | | 1.27 | % | | 1.13 | % | | | | |
Yield on loans(1) | 9.16 | % | | 9.14 | % | | 9.22 | % | | 9.23 | % | | 8.95 | % | | | | |
Cost of total deposits(1) | 1.15 | % | | 0.68 | % | | 0.32 | % | | 0.28 | % | | 0.24 | % | | | | |
| Non-performing assets to total assets | 1.07 | % | | 0.68 | % | | 0.88 | % | | 1.02 | % | | 1.11 | % | | | | |
| ACL to total loans | 0.80 | % | | 0.81 | % | | 0.98 | % | | 1.04 | % | | 0.99 | % | | | | |
Total capital to risk-weighted assets(2) | 15.77 | % | | 15.59 | % | | 15.51 | % | | 17.66 | % | | 16.56 | % | | | | |
Common equity tier 1 capital to risk-weighted assets(2) | 11.18 | % | | 10.93 | % | | 10.77 | % | | 12.73 | % | | 11.93 | % | | | | |
(1) Current quarter ratios are annualized
(2) Current period ratios are preliminary
| | | | | | | | | | | | | | | | | | | | | | | | | | | | | | | | | | | | | | | | | | | | | | | | | | | | | |
| September 30,
2023 | | June 30,
2023 | | March 31,
2023 | | December 31,
2022 | | September 30,
2022 | | Current Quarter Q/Q | | Current Year Y/Y |
| For the Qtr Ending | | | | | | Change | | % Change | | Change | | % Change |
| Factoring: | | | | | | | | | | | | | | | | | |
| Invoice Volume | 1,428,463 | | | 1,494,963 | | | 1,491,763 | | | 1,596,843 | | | 1,681,489 | | | (66,500) | | | (4.4) | % | | (253,026) | | | (15.0) | % |
| Purchased Volume | $ | 2,606,323,000 | | | $ | 2,732,976,000 | | | $ | 2,927,104,000 | | | $ | 3,277,986,000 | | | $ | 3,599,771,000 | | | $ | (126,653,000) | | | (4.6) | % | | $ | (993,448,000) | | | (27.6) | % |
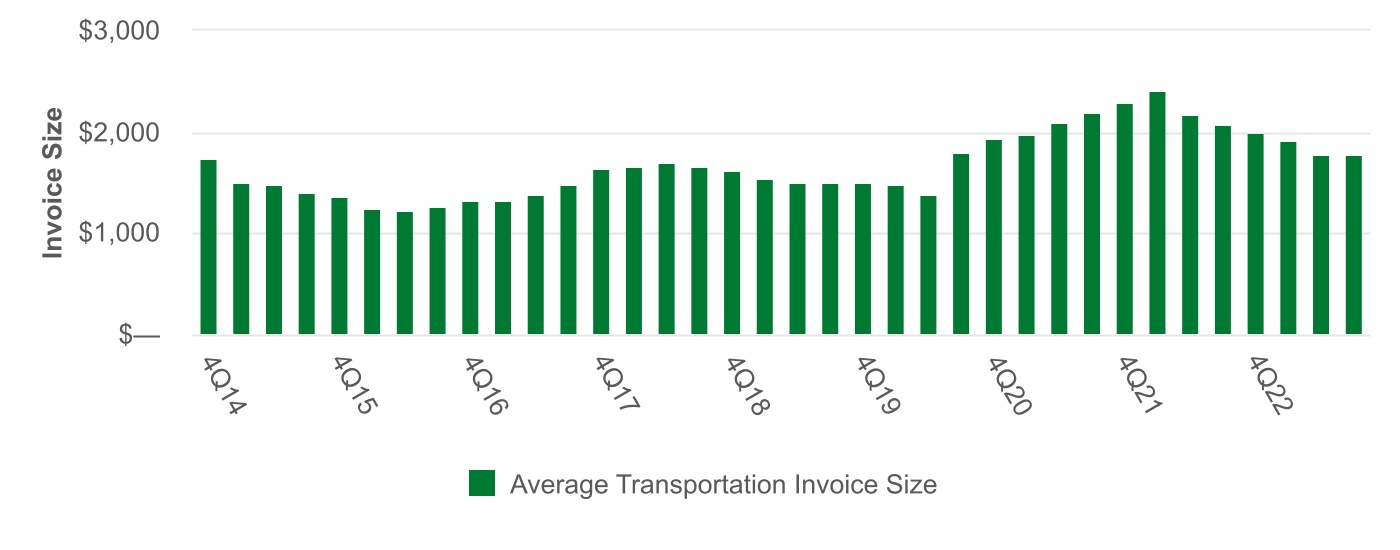
| Average Transportation Invoice Size | $ | 1,772 | | | $ | 1,773 | | | $ | 1,911 | | | $ | 2,002 | | | $ | 2,073 | | | $ | (1) | | | (0.1) | % | | $ | (301) | | | (14.5) | % |
| Payments: | | | | | | | | | | | | | | | | | |
| Invoice Volume | 5,037,841 | | | 4,526,629 | | | 4,260,654 | | | 4,605,020 | | | 4,676,249 | | | 511,212 | | | 11.3 | % | | 361,592 | | | 7.7 | % |
| Payment Volume | $ | 5,329,580,000 | | | $ | 4,940,317,000 | | | $ | 5,030,548,000 | | | $ | 5,577,014,000 | | | $ | 5,951,706,000 | | | $ | 389,263,000 | | | 7.9 | % | | $ | (622,126,000) | | | (10.5) | % |
| Network Invoice Volume | 303,300 | | | 181,904 | | | 159,353 | | | 157,004 | | | 144,253 | | | 121,396 | | | 66.7 | % | | 159,047 | | | 110.3 | % |
| Network Payment Volume | $ | 510,298,000 | | | $ | 299,948,000 | | | $ | 289,667,000 | | | $ | 301,366,000 | | | $ | 288,410,000 | | | $ | 210,350,000 | | | 70.1 | % | | $ | 221,888,000 | | | 76.9 | % |
| | | | | | | | | | | | | | | | | |
| | | | | | | | | | | | | | | | | |
Payments
For discussion of our Payments segment, we will cover the following topics:
1.Analysis of financial performance for the quarter.
2.Update on market penetration of the top-100 freight brokers.
3.Analysis of the revenue ramp for clients who have joined the network within the preceding 12 months.
4.Revenue generation and opportunities for the network.
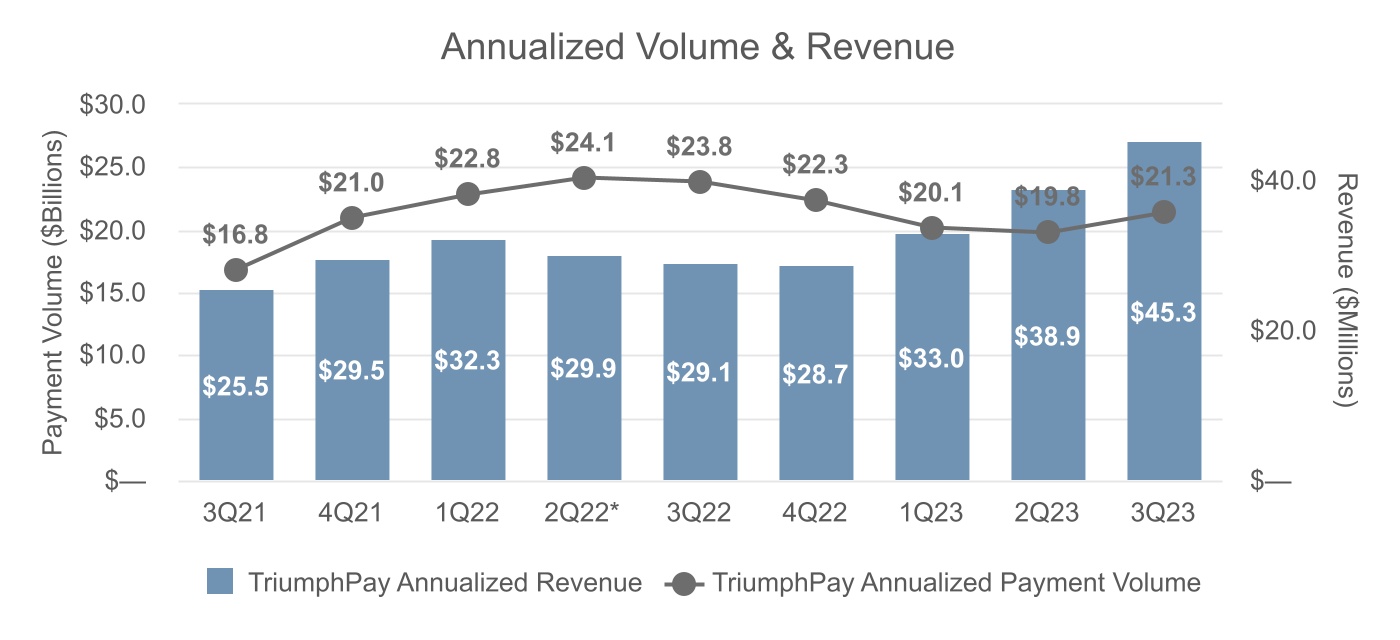
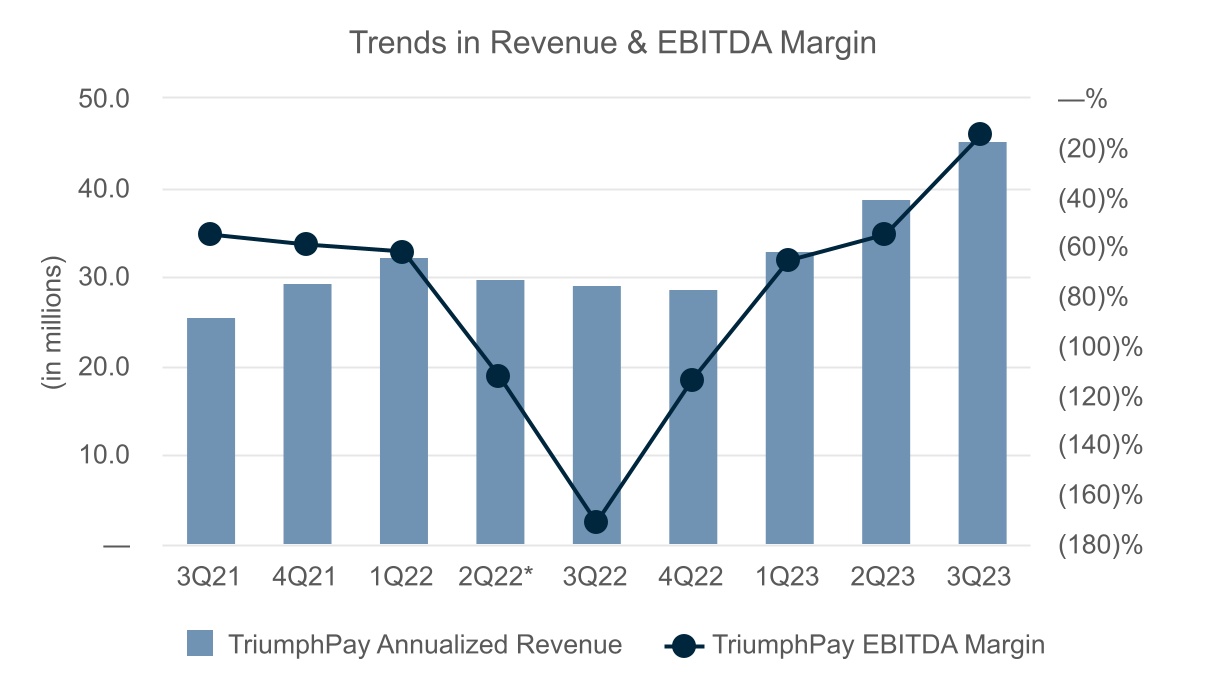
Analysis of financial performance for the quarter. TriumphPay took a material step towards profitability this quarter. Our EBITDA margin improved from (55)% to (15)%. For the quarter, TriumphPay’s invoice volume increased 11.3%, and total payment volume increased by 7.9% to $21.3 billion, annualized. Our broker clients represent $18.1 billion of that figure while the remaining $3.2 billion is related to shipper clients. The average invoice paid by TriumphPay decreased by 3.1% in size, our annualized unique broker audit dollar volume increased to $16 billion, and our annualized unique factor audit volume stands at $10 billion. This increase in total volume despite the decrease in average unit size demonstrates that we continue to outrun a freight market that is flat-to-falling. In total, TriumphPay touches about $47 billion in unique brokered freight transactions, which is a significant percentage of the market. The monetization of these touches should grow as network transactions continue to grow.
On that topic, network transactions increased 66.7% relative to Q2 volume. Of all the important metrics above, I would call investors’ attention to network transaction growth. I have spoken about them at length in previous letters. They are the heart of the network and the most profitable thing we do in TriumphPay. This very large increase was not driven solely by new volume (although that was part of it); it was also the result of improving our technology stack to widen the funnel for network transactions. Specifically, we expanded network participants to include verification-only brokers during Q3. This allowed us to generate network transactions from brokers that are integrated with our audit application, but who do not use our payments application. While we prefer to make the payment in addition to doing the audit work to enhance our revenue, serving audit only participants is not unusual for an open-loop network.
Our quickpay penetration average was 6.9%, and we generated service revenue on approximately 8.0% of our payments invoices. We also generated $265 million in float through payments made on behalf of our clients. That is valuable in an interest rate environment such as we are experiencing.
TriumphPay non-interest expenses this quarter were down 11.9%, or about $2 million, compared to the prior quarter. The largest driver of this decline was the elevated nonrecurring expense related to some very large freight brokers who went live on the platform in Q2. These expenses were not repeated in Q3 (but will gladly be repeated in future quarters). We also realized expenses in Q2 around our Trax investment and some consulting services around our offshoring projects. Those expenses did not recur in Q3. Because of our pipeline and various projects that are currently in-flight, it is likely TriumphPay expenses will return to and/or exceed Q2 levels for Q4 and beyond. Growth brings with it necessary onboarding costs. What I do expect is for revenue growth over any meaningful period to continue to exceed expense growth.
On the subject of operational efficiency, it is worth highlighting the results of some of our efforts this year in TriumphPay. In January, it cost our contact center and operations team roughly $0.64 to process an invoice.[1] As of September, utilizing artificial intelligence (AI), machine learning (ML), and some offshore resources, we have reduced that cost by 67% to $0.21 per invoice. In a prior letter, I referenced that we processed 26,000 Notice of Assignments (NOA) and Letters of Release (LORs) each day. Today, that figure is closer to 38,000, but with the AI/ML gains this year, over 25% of these submissions are now auto-processed with no human interaction on the first pass of a double blind process. Scale is a powerful force.
In the chart below, we highlight the continued revenue growth and its trend over the last eight quarters against the backdrop of our payment volumes. Our Q3 run rate was $45 million. We have generated a roughly 33% CAGR over the last two years. We will continue investing in TriumphPay to capture new revenue opportunities and efficiency gains as they present themselves. Even with those investments, we are closing in on our EBITDA-positive goal, which we have committed to achieve on or before the end of 2024. It is worth highlighting once again that these positive results for TriumphPay were generated within a freight market that was relatively flat.
*Annualized Revenue excludes $7.0 million net gain on minority investment mark-to-market
*Annualized Revenue and EBITDA Margin excludes $7.0 million net gain on minority investment mark-to-market
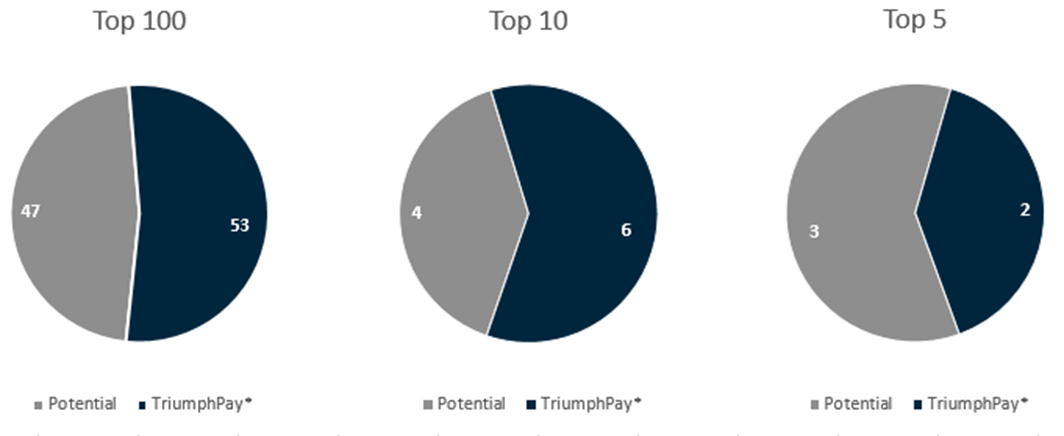
Update on market penetration for the top-100 freight brokers. We spend a significant amount of time with investors helping them dimension the market and our penetration of it. To be clear, when I use the term “market,” I am referring to the full truckload brokered freight market. That is a portion of the much larger trucking market, which includes the shipper market, less-than-truckload (LTL), parcel, etc. We are expanding into those portions of the market, but we remain primarily focused on the brokered truckload market until we achieve our target level of penetration. Our long-term target level of penetration is to process more than 50% of all transactions in the full truckload brokered freight market.
There are approximately 15,000 licensed freight brokers in the United States. Less than 10,000 of those are currently active. The top 1,000 contribute approximately 90% of the share in the truckload market, which we estimate to be $130 billion in total. The top 100 freight brokers account for about $90 billion in freight spend, or roughly 70% of that market. Of that, we believe the top five freight brokers represent about $33 billion, contributing to 25% of the total market and a little over a third of the top 100. Freight brokerage is a fragmented, but top-heavy, industry.
The chart on the following page is a summary of our market penetration which includes brokers who are currently live or are contracted to go live on the TriumphPay network. For the purposes of this chart, we do not distinguish between audit, payment or both. In the past, we have talked about the importance of the top 30 logistics firms, and we used the term “tier 1” as an internal designation based on freight spend (> $500 million). The Knight Swift/US Xpress merger is an example of how these metrics can confuse investors. Our volumes didn’t change because of that merger, but broker counts decreased by one. You may have noticed that we have dropped the broker and factor counts at the beginning of this letter. The reason is the same as when we dropped client counts from our factoring business several years ago. The business has reached sufficient size that the information is not valuable without further context. Adding a large broker over a small broker has a distinctly different impact on the business. As a result, we continue to encourage investors to watch the both the dollar and count volumes of invoices processed by TriumphPay and the growth in network transactions for a window into the business’ continuing success. Going forward, we will only refer to the top 100, the top ten and the top five for our penetration discussions. These designations are important as one of the top five brokers will be very different in size from others in the top 10, who may in turn be as different from the top 100 as those are from the next 1,000.
*Defined as TriumphPay clients who use payments, audit or both products in some capacity in their operations.
Notable go-lives for the quarter were Knight Swift and Bridgeway. Both of these additions are large brokers with over $500 million in annual carrier payments. Bridgeway combines over 15 smaller brands all going live on TriumphPay. Other large brokers that went live during Q3 were: Worldwide Logistics, ARL Logistics, and US1. We also expanded our business with Quantix by adding their Intermodal division and Canadian payments, showing that once brokers add their brokerage arm, they often add other divisions. Finally, we are set to announce the go live of a Top 5 broker in Q4, which we have previously referenced as under contract. If I may pause and brag about our team for a moment here: the execution that they have demonstrated by onboarding multiple large brokers with complex organizations to TriumphPay in a timely manner illustrates the depth of our industry knowledge, the excellence of their work product and the hustle attitude that has delivered these positive outcomes thus far.
Analysis of the revenue ramp for customers who have joined the network within the preceding 12 months. A consistent theme from our investor meetings is a desire for greater clarity regarding our revenue penetration for live customers who are using TriumphPay. It is complicated for us and certainly not intuitive for an outside investor to understand, as each of these client additions bring unique circumstances. We need to do a better job of communicating on the topic.
When a customer begins using TriumphPay, their volume can (i) be fully realized immediately, (ii) build over several quarters until the initial estimates are reached, or (iii) change over time. Below are a few examples to highlight these situations.
i.Clients who do not have customized TMS systems )or perhaps only one TMS system even if customized) often contribute all their volume to reported totals in the quarter they go live.
ii.Larger clients with complex organizations or multiple TMS installations tend to go live over several quarters. A client added in Q3, for example, contributed about $20 million of annualized volume during the quarter, but today’s run rate is north of $200 million annualized and growing. All of the volume should be on board in the next two quarters. Another client added in Q3 contributed about half of their expected volume annualized this quarter, and all of their volume should be realized exiting Q4. Generally speaking, we realize the initial expected volume in TriumphPay’s reported figures within twelve months.
iii.Client relationships evolve and available volumes expand as servicing opportunities expand. For example, in Q3, a large client for which we already had 100% of their available truckload volume, requested we provide the same service for their managed transportation division. As a result, the addressable opportunity increased. Using this new denominator, we now have about 75% of the volume available from this client but should have 100% again exiting Q4.
The point is that even if we did not onboard a new broker for the next 12 months, our volumes and revenue would likely grow as we more fully integrate and expand the relationships with brokers who have already gone live on TriumphPay.
Revenue generation opportunities for the network. In the third quarter of 2021, we rolled out our open-loop strategy for TriumphPay. As part of that conversation, we updated shareholders about our pricing and long-term goals for TriumphPay. We have learned a lot since that announcement, so it is time for us to update investors on our thinking and real-world experience thus far.
We are not, however, ready to give the market a pricing chart for all the services we provide. This is partially due to competitive intelligence concerns. We must also be candid and say that for some product offerings, we don’t have enough proven intelligence to speak with conviction on what pricing the market will bear. The best I can offer investors are some categories of revenue that we generate and how we think about the opportunities for additional revenue creation based on added value.
Let’s begin with network transactions, since those are the most (i) valuable to network constituents and (ii) profitable to Triumph. Once we reach critical mass on network volumes, we expect TriumphPay to generate approximately $5 in fees per transaction, with the combined cost borne by the broker and the factor. If we use $1,800 as the average invoice size, our take rate will be approximately 27 basis points. We expect network transactions to continue to grow as a percentage of total transactions. Due to legacy pricing and current market conditions, we are not currently generating $5 in fees per network transaction, but we expect that to be where the pricing settles for the long term.
In addition to network fees, what other revenue do we generate?
We generate revenue from brokers (payors) on the network through the following services:
•A/P automation. This is our audit product. It is paid on a per invoice basis.
•Quickpay fees. This is charged as a percentage of revenue for quickpays made to carriers. The structure of these fees depend on whether the quickpay remains on the broker’s balance sheet or whether it sits on Triumph’s.
•Supply chain finance. I spoke about this at length in our last letter. This is the movement of TriumphPay from managing A/P for brokers to assisting with their A/R. This is priced on a spread to SOFR.
•Intersegment interest on float. We calculate the value of the float by using Fed funds overnight rate.
We generate revenue from factors (payees) on the network through our audit services. This is billed as a subscription and calculated on a per-invoice basis. To be clear, this is an addition to network transaction fees. In the future, I believe we will also generate revenue by providing additional back office services to factors, which I cover further in the Factoring section below.
In addition to factors and brokers, we serve shippers. Shippers are also payors on the network. We earn intersegment interest on float from shippers as well as offering supply chain finance solutions.
The list above is an accurate representation of how we are going to market today. It is not; however, an exhaustive list of how we intend to monetize TriumphPay. For example, we have created and curated the largest single repository of settled truckload freight payment data in the U.S. Other data providers have posted lane/rate data, but only TriumphPay has the settled lane/rate data. This is an important distinction: posted data is what exists on a load board; settled data is the final settlement information that includes accessorial charges and adjustments leading to the actual amount paid on the load. We are working with our network customers to find ways to anonymize, aggregate and curate the data in a way that it can be packaged and licensed for purposes of business intelligence. We will continue to provide updates on these initiatives in future quarters.
A second opportunity – and one that is already live – is our ongoing commercial relationship with Highway to combat fraud and double brokering. We provide a limited license of our data to Highway to augment their carrier data, which allows us to spot trucking companies that are hauling more loads than their equipment profile suggests they should be able to haul (i.e., higher risk for double brokering). Our annualized run rate revenue for this relationship should approach $1 million per year in the next 12 -18 months. While that alone is not a material amount of revenue, it is very high margin piece of business for us and is also very valuable to our network constituents. This is yet another example of the ways in which a network creates value for its customers.
Factoring
For discussion of our Factoring segment, we will cover the following topics:
1.Analysis of financial performance for the quarter.
2.Analysis of technology enhancements and planned product offerings.
3.Expectations for the 2024 freight market.
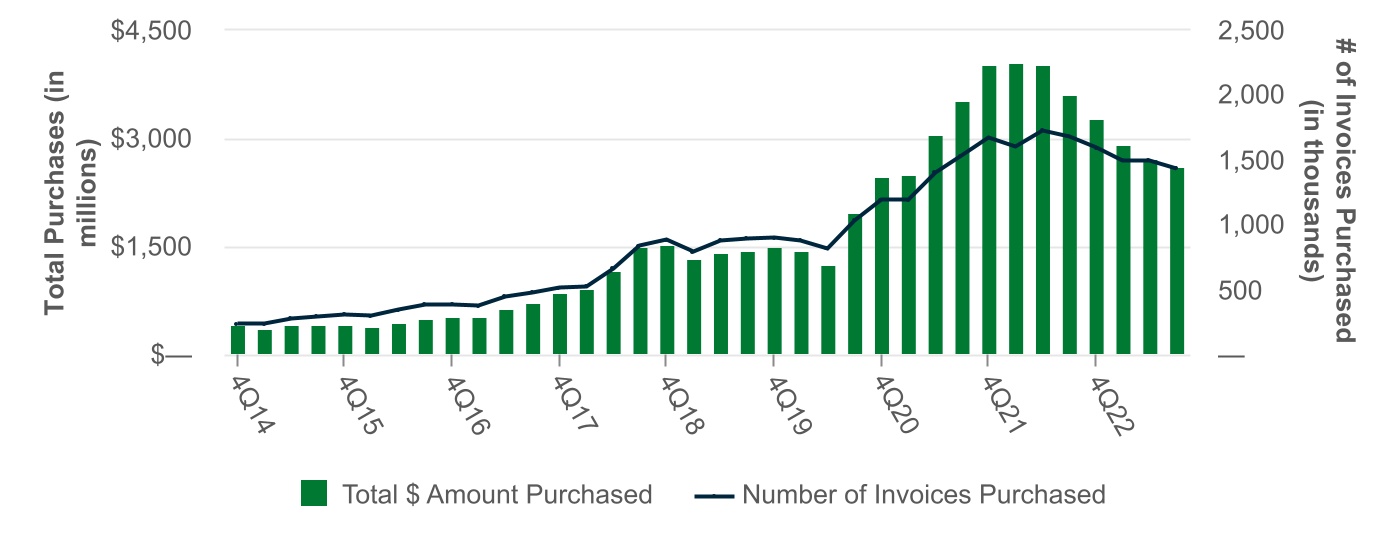
Analysis of financial performance for the quarter. Our average transportation invoice price dropped to $1,772, down $301 from the same quarter in 2022 and down $1 from 2Q23. Purchased volume declined 4.6% relative to the second quarter. The flat average transportation invoice sizes in Q3 are a potential source of concern when compared to the increased price of diesel fuel. In a normal environment, the average invoice will lag an increase in fuel cost one to two weeks, and subsequently adjust. During Q3, the catch up did not happen until late in the quarter. As we begin the month of October, invoice sizes have trended modestly higher. Through the date of the publishing of this letter, average transportation invoice sizes for October are $1,828. It remains to be seen whether these rates will hold.
In terms of utilization, the number of invoices per client and average daily purchases improved in Q3. The increase q/o/q was driven by our larger, fleet sized clients. Total active client counts decreased in Q3. We believe the market is decreasing in total carrier count with many small carriers failing or migrating to larger carriers. I believe this will continue until we see a sustained turn in the freight market. The remaining carriers on the road are picking up a portion of the market vacated by smaller carriers, but margins for them continue to be very tight.
Analysis of technology enhancements and planned product offerings. Transportation factoring is a people and technology intensive business. Most business days, we must get approximately $50 million of payments out to thousands of truckers. This requires talented people and sophisticated technology. A factor management system (FMS) is what facilitates this process; it is akin to the core platform of a bank. An FMS must be highly specialized for the nature of the business, and transportation requires more specialized design than other forms of factoring. Only a few transportation factoring companies have made the investment of time and money to build a ground-up FMS. We went live with our own custom-built FMS almost six years ago, and have continued to enhance it over time. We also built highly effective and efficient processes and teams that use it to meet all our customers’ needs.
As our overall go-to market strategy has shifted with the evolution of TriumphPay, we believe these investments in our FMS and factoring infrastructure will present opportunities to offer additional back-office services to factors and other lenders as part of our TriumphPay offerings in the future. We do not have the ability or desire to service the entire factoring market on our balance sheet. Leveraging our expertise in these areas to deepen our customer ties and fee-based revenue opportunities inside of TriumphPay is an exciting prospect and a logical step in our continued progression from a balance sheet first business to a network business. We will continue to provide updates on these initiatives in future quarters.
Expectations for the 2024 freight market. As to the freight outlook generally, I have reservations. We see a more challenged environment on the horizon. The interest rate environment appears to be higher for longer. While higher rates are not bad in and of themselves, we know that this (plus inflation) translates into higher operating costs for truckers. Unfortunately, the average revenue per mile has not kept pace. The chart below shows average factoring invoice sizes (which is a relevant proxy for revenue per mile) over the last several quarters.
Without an increase in spot rates, more trucking companies will fail or leave the system. I am surprised that the credit cycle has not advanced more quickly, although headlines in the last few days suggest it may now have arrived. Truckers have shown resilience in waiting for better days. Better days will only come if GDP grows and freight tonnage goes up or if capacity leaves the system. I will not be surprised if it is the latter. For our factoring segment, this will primarily unfold as pressure on revenue versus credit losses. We can always be surprised by a fraud or a business failure, but given the quick turn of our portfolio, the biggest headwinds are lower invoice prices, lower utilization and client attrition. Even so, factoring is our most profitable segment, and we do not make decisions based on a tough quarter or a tough year. We are prepared to endure and expect to be profitable whatever comes our way.
Banking
For discussion of our Banking segment, we will cover the following topics:
1.Analysis of financial performance for the quarter.
2.Analysis of deposit trends and liquidity
3.Analysis of credit trends and the overall lending environment.
Analysis of financial performance for the quarter. The Banking segment operating income increased 5.6% over prior quarter as lending yields rose faster than deposit costs while non-interest and credit expenses declined. Average lending yields were driven higher by an intentional mix shift toward higher yielding products while keeping total balances relatively flat. Our total funding costs rose slower than previous quarters primarily due to the replacement of FHLB borrowings with lower rate brokered CDs. Our efforts to reduce non-interest expenses continue and are generating improvement in our operating leverage, and we continue to pursue cost savings to offset the effects of elevated inflation. Credit costs remain low, but we are cognizant of the accumulating stress that higher interest rates and the freight recession are causing for our CRE and equipment finance clients.
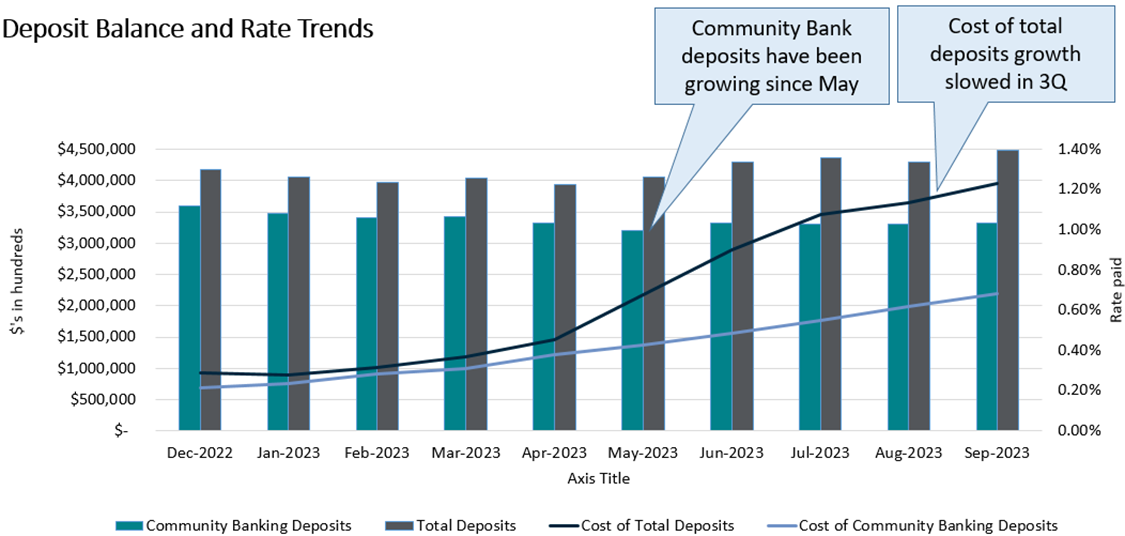
Analysis of deposit trends and liquidity. Community bank deposit balances stabilized in the Q3 as shown in the chart below. We continue to raise deposit rates for existing balances on an exception basis. At this point, since rates began rising, 46% of our community bank CDs have repriced, and 35% of our savings and money market balances have repriced to rates above 1%. We expect the balances that have not yet repriced to do so at the same pace as we’ve experienced the past several months, which should cause funding costs to continue to drift modestly higher.
We are increasingly using rate exceptions to bring in new deposits. This contributed to the lower use of wholesale funding last quarter, which dampened the increase in overall funding costs relative to core deposits. We are gathering new core deposits at rates modestly below wholesale funding costs to further reduce our use of wholesale funding and lower our total cost of funds and maximize liquidity availability. Generally, we have been able to do so at 50-100 bps below wholesale funding costs for CDs, 100-150 bps below wholesale funding costs for money market and savings accounts and 250-350 bps below wholesale funding for interest bearing DDA accounts.
Analysis of credit trends and the overall lending environment. As noted earlier in this letter, we expect building pressure on CRE and equipment finance borrowers to cause significant credit stress for many lenders in coming quarters. We maintain a relatively low concentration of CRE exposure. 46% of our CRE exposure is on variable rates and another 21% is on fixed rates maturing within the next year. These borrowers are already facing the realities of the higher rate environment. In a few cases, we have begun to experience missed payments and downgrades as variable-rate debt service exceeds underlying lease or rental income for some borrowers. Given our loan-to-value on these assets, we do not anticipate large future losses, but this is something we continue to monitor. To date, borrowers have been willing to inject additional equity and make other enhancements to allow us to restructure loan sizing, pricing and terms to sustainable levels. Their desire to do so is based on the strength and stability of the lease payments that substantiate their residual equity estimates. Our intent and desire is to help them preserve and rebuild as much of their equity as possible.
I cannot speak with conviction about the credit quality of other banks, but my strong suspicion is that many lenders have bigger problems than we do in their CRE book. A lot of banks grew rapidly over the last few years, and the debt yields they underwrote to and terminal cap rate assumptions they used are no longer market realities. My job is to worry about our bank; however, my concern is how this effects the economy as it unfolds. No one wants to see a recession that damages consumer confidence, but if it comes, we are well prepared for it.
Within equipment finance, we continue to work with carriers to provide short-term payment relief (e.g., extended terms resulting in lower payments) when justified by the value and condition of collateral along with the carrier’s operating history. These extensions are intended to serve as bridges to the end of the freight recession and a return to higher freight rates. As the freight recession drags on, more clients will need payment extensions, and some will also need to take further action, including right-sizing and selling equipment. When equipment sales become necessary, we intend to continue to act quickly and leverage industry connections to minimize losses as we have done in the past.
Expense Outlook
On balance, we expect Q4 expenses to be closer to what we saw in Q2. In 2024, we see full year expenses trending about 5% over 2023 with one important caveat: we are working on a few initiatives that we believe will materially expand the value and scope of the payments network. The catalyst for accelerating the development work on those projects would be the signing of a couple of very large brokers. If that happens, we will make investments to expedite the timing of these projects that were already in the development pipeline, and we will call those out as they come.
In closing, our job is to create value through the cycle, and there are many things that are coming our way because of the environment in which we find ourselves. We are well prepared and will continue to work to make sure we and our customers prosper through it.
With warm regards,
Aaron P. Graft Founder, Vice Chairman, and CEO
[1]TriumphPay contact center (phone/email/chat) and operations (NOA processing) absorb the carrier and factor payment status inquiries of our payor clients. Our contact center receives approximately 30,000 inquiries per month. Interactions per 100 invoices has been reduced by 23% since the first quarter of 2023.
Conference Call Information
Aaron P. Graft, Vice Chairman and CEO, and Brad Voss, CFO, will review the financial results in a conference call with investors and analysts beginning at 9:30 a.m. central time on Friday, October 20, 2023.
The live video conference option may be accessed directly through this link, https://triumph-financial-inc-earnings-q3fy23.open-exchange.net/ or via the Company's website at tfin.com through the News & Events, Events & Presentations links. Alternatively, a live conference call option is available by dialing 1-888-788-0099 (International: +1-800-031-5717) requesting to be joined to meeting ID 944 5479 5202 at the prompt. An archive of this conference call will subsequently be available at this same location, referenced above, on the Company’s website.
About Triumph Financial
Triumph Financial, Inc. (Nasdaq: TFIN) is a financial holding company focused on payments, factoring and banking. Headquartered in Dallas, Texas, its diversified portfolio of brands includes TriumphPay, Triumph and TBK Bank. www.tfin.com
Forward-Looking Statements
This letter to shareholders contains forward-looking statements. Any statements about our expectations, beliefs, plans, predictions, forecasts, objectives, assumptions or future events or performance are not historical facts and may be forward-looking. You can identify forward-looking statements by the use of forward-looking terminology such as “believes,” “expects,” “could,” “may,” “will,” “should,” “seeks,” “likely,” “intends,” “plans,” “pro forma,” “projects,” “estimates” or “anticipates” or the negative of these words and phrases or similar words or phrases that are predictions of or indicate future events or trends and that do not relate solely to historical matters. You can also identify forward-looking statements by discussions of strategy, plans or intentions. Forward-looking statements involve numerous risks and uncertainties and you should not rely on them as predictions of future events. Forward-looking statements depend on assumptions, data or methods that may be incorrect or imprecise and we may not be able to realize them. We do not guarantee that the transactions and events described will happen as described (or that they will happen at all). The following factors, among others, could cause actual results and future events to differ materially from those set forth or contemplated in the forward-looking statements: business and economic conditions generally and in the bank and non-bank financial services industries, nationally and within our local market areas; our ability to mitigate our risk exposures; our ability to maintain our historical earnings trends; changes in management personnel; interest rate risk; concentration of our products and services in the transportation industry; credit risk associated with our loan portfolio; lack of seasoning in our loan portfolio; deteriorating asset quality and higher loan charge-offs; time and effort necessary to resolve nonperforming assets; inaccuracy of the assumptions and estimates we make in establishing reserves for probable loan losses and other estimates; risks related to the integration of acquired businesses and any future acquisitions; our ability to successfully identify and address the risks associated with our possible future acquisitions, and the risks that our prior and possible future acquisitions make it more difficult for investors to evaluate our business, financial condition and results of operations, and impairs our ability to accurately forecast our future performance; lack of liquidity; fluctuations in the fair value and liquidity of the securities we hold for sale; impairment of investment securities, goodwill, other intangible assets or deferred tax assets; our risk management strategies; environmental liability associated with our lending activities; increased competition in the bank and non-bank financial services industries, nationally, regionally or locally, which may adversely affect pricing and terms; the accuracy of our financial statements and related disclosures; material weaknesses in our internal control over financial reporting; system failures or failures to prevent breaches of our network security; the institution and outcome of litigation and other legal proceedings against us or to which we become subject; changes in carry-forwards of net operating losses; changes in federal tax law or policy; the impact of recent and future legislative and regulatory changes, including changes in banking, securities and tax laws and regulations, such as the Dodd-Frank Act and their application by our regulators; governmental monetary and fiscal policies; changes in the scope and cost of FDIC, insurance and other coverages; failure to receive regulatory approval for future acquisitions; increases in our capital requirements and the impact of COVID-19 on our business.
While forward-looking statements reflect our good-faith beliefs, they are not guarantees of future performance. All forward-looking statements are necessarily only estimates of future results. Accordingly, actual results may differ materially from those expressed in or contemplated by the particular forward-looking statement, and, therefore, you are cautioned not to place undue reliance on such statements. Further, any forward-looking statement speaks only as of the date on which it is made, and we undertake no obligation to update any forward-looking statement to reflect events or circumstances after the date on which the statement is made or to reflect the occurrence of unanticipated events or circumstances, except as required by applicable law. For a discussion of such risks and uncertainties, which could cause actual results to differ from those contained in the forward-looking statements, see "Risk Factors" and the forward-looking statement disclosure contained in Triumph’s Annual Report on Form 10-K, filed with the Securities and Exchange Commission on February 15, 2023.
Non-GAAP Financial Measures
This letter to shareholders includes certain non‐GAAP financial measures intended to supplement, not substitute for, comparable GAAP measures. Reconciliations of non‐GAAP financial measures to GAAP financial measures are provided at the end of this letter to shareholders.
The following table sets forth key metrics used by Triumph Financial to monitor our operations. Footnotes in this table can be found in our definitions of non-GAAP financial measures at the end of this document.
| | | | | | | | | | | | | | | | | | | | | | | | | | | | | | | | | | | | | | | | | |
| As of and for the Three Months Ended | | As of and for the Nine Months Ended |
| (Dollars in thousands) | September 30,
2023 | | June 30,
2023 | | March 31,
2023 | | December 31,
2022 | | September 30,
2022 | | September 30,
2023 | | September 30,
2022 |
| Financial Highlights: | | | | | | | | | | | | | |
| Total assets | $ | 5,599,794 | | | $ | 5,652,721 | | | $ | 5,628,185 | | | $ | 5,333,783 | | | $ | 5,642,450 | | | $ | 5,599,794 | | | $ | 5,642,450 | |
| Loans held for investment | $ | 4,371,528 | | | $ | 4,324,758 | | | $ | 4,310,006 | | | $ | 4,120,291 | | | $ | 4,433,304 | | | $ | 4,371,528 | | | $ | 4,433,304 | |
| Deposits | $ | 4,487,051 | | | $ | 4,293,466 | | | $ | 4,038,994 | | | $ | 4,171,336 | | | $ | 4,441,354 | | | $ | 4,487,051 | | | $ | 4,441,354 | |
| Net income available to common stockholders | $ | 11,993 | | | $ | 6,848 | | | $ | 10,209 | | | $ | 16,759 | | | $ | 15,428 | | | $ | 29,050 | | | $ | 82,346 | |
| | | | | | | | | | | | | |
| Performance Ratios - Annualized: | | | | | | | | | | | | | |
| Return on average assets | 0.93 | % | | 0.56 | % | | 0.84 | % | | 1.27 | % | | 1.13 | % | | 0.78 | % | | 1.95 | % |
| Return on average total equity | 5.95 | % | | 3.64 | % | | 5.20 | % | | 7.66 | % | | 7.16 | % | | 4.94 | % | | 12.77 | % |
| Return on average common equity | 5.89 | % | | 3.45 | % | | 5.09 | % | | 7.69 | % | | 7.17 | % | | 4.82 | % | | 13.07 | % |
Return on average tangible common equity (1) | 8.70 | % | | 5.16 | % | | 7.56 | % | | 11.14 | % | | 10.47 | % | | 7.16 | % | | 19.28 | % |
Yield on loans(2) | 9.16 | % | | 9.14 | % | | 9.22 | % | | 9.23 | % | | 8.95 | % | | 9.17 | % | | 8.77 | % |
| Cost of interest bearing deposits | 1.83 | % | | 1.13 | % | | 0.55 | % | | 0.48 | % | | 0.41 | % | | 1.21 | % | | 0.35 | % |
| Cost of total deposits | 1.15 | % | | 0.68 | % | | 0.32 | % | | 0.28 | % | | 0.24 | % | | 0.73 | % | | 0.20 | % |
| Cost of total funds | 1.41 | % | | 1.23 | % | | 0.68 | % | | 0.49 | % | | 0.42 | % | | 1.12 | % | | 0.36 | % |
Net interest margin(2) | 7.48 | % | | 7.57 | % | | 8.08 | % | | 8.22 | % | | 7.71 | % | | 7.70 | % | | 7.69 | % |
| Net noninterest expense to average assets | 5.28 | % | | 5.79 | % | | 5.98 | % | | 5.38 | % | | 5.15 | % | | 5.68 | % | | 4.19 | % |
| | | | | | | | | | | | | |
| Efficiency ratio | 82.36 | % | | 87.80 | % | | 85.52 | % | | 76.90 | % | | 78.14 | % | | 85.21 | % | | 68.29 | % |
| | | | | | | | | | | | | |
| | | | | | | | | | | | | |
Asset Quality:(3) | | | | | | | | | | | | | |
| Past due to total loans | 1.94 | % | | 1.55 | % | | 1.67 | % | | 2.53 | % | | 2.33 | % | | 1.94 | % | | 2.33 | % |
| Non-performing loans to total loans | 1.22 | % | | 0.74 | % | | 1.01 | % | | 1.17 | % | | 1.26 | % | | 1.22 | % | | 1.26 | % |
| Non-performing assets to total assets | 1.07 | % | | 0.68 | % | | 0.88 | % | | 1.02 | % | | 1.11 | % | | 1.07 | % | | 1.11 | % |
| ACL to non-performing loans | 65.33 | % | | 109.41 | % | | 97.12 | % | | 88.76 | % | | 78.88 | % | | 65.33 | % | | 78.88 | % |
| ACL to total loans | 0.80 | % | | 0.81 | % | | 0.98 | % | | 1.04 | % | | 0.99 | % | | 0.80 | % | | 0.99 | % |
| Net charge-offs to average loans | 0.03 | % | | 0.25 | % | | 0.05 | % | | 0.05 | % | | 0.06 | % | | 0.34 | % | | 0.09 | % |
| | | | | | | | | | | | | |
| Capital: | | | | | | | | | | | | | |
Tier 1 capital to average assets(4) | 12.36 | % | | 12.01 | % | | 12.19 | % | | 13.00 | % | | 12.57 | % | | 12.36 | % | | 12.57 | % |
Tier 1 capital to risk-weighted assets(4) | 12.90 | % | | 12.68 | % | | 12.52 | % | | 14.57 | % | | 13.64 | % | | 12.90 | % | | 13.64 | % |
Common equity tier 1 capital to risk-weighted assets(4) | 11.18 | % | | 10.93 | % | | 10.77 | % | | 12.73 | % | | 11.93 | % | | 11.18 | % | | 11.93 | % |
| Total capital to risk-weighted assets | 15.77 | % | | 15.59 | % | | 15.51 | % | | 17.66 | % | | 16.56 | % | | 15.77 | % | | 16.56 | % |
| Total equity to total assets | 15.19 | % | | 14.74 | % | | 14.70 | % | | 16.67 | % | | 15.79 | % | | 15.19 | % | | 15.79 | % |
Tangible common stockholders' equity to tangible assets(1) | 10.21 | % | | 9.75 | % | | 9.63 | % | | 11.41 | % | | 10.75 | % | | 10.21 | % | | 10.75 | % |
| | | | | | | | | | | | | |
| Per Share Amounts: | | | | | | | | | | | | | |
| Book value per share | $ | 34.58 | | | $ | 33.88 | | | $ | 33.47 | | | $ | 35.09 | | | $ | 34.57 | | | $ | 34.58 | | | $ | 34.57 | |
Tangible book value per share (1) | $ | 23.41 | | | $ | 22.58 | | | $ | 22.09 | | | $ | 24.04 | | | $ | 23.60 | | | $ | 23.41 | | | $ | 23.60 | |
| Basic earnings per common share | $ | 0.52 | | | $ | 0.30 | | | $ | 0.44 | | | $ | 0.69 | | | $ | 0.64 | | | $ | 1.25 | | | $ | 3.36 | |
| Diluted earnings per common share | $ | 0.51 | | | $ | 0.29 | | | $ | 0.43 | | | $ | 0.67 | | | $ | 0.62 | | | $ | 1.23 | | | $ | 3.28 | |
| | | | | | | | | | | | | |
| Shares outstanding end of period | 23,291,693 | | | 23,269,885 | | | 23,370,515 | | | 24,053,585 | | | 24,478,288 | | | 23,291,693 | | | 24,478,288 | |
Unaudited consolidated balance sheet as of:
| | | | | | | | | | | | | | | | | | | | | | | | | | | | | |
| (Dollars in thousands) | September 30,
2023 | | June 30,
2023 | | March 31,
2023 | | December 31,
2022 | | September 30,
2022 |
| ASSETS | | | | | | | | | |
| Total cash and cash equivalents | $ | 337,583 | | | $ | 417,375 | | | $ | 417,715 | | | $ | 408,182 | | | $ | 421,729 | |
| Securities - available for sale | 292,324 | | | 303,779 | | | 317,097 | | | 254,504 | | | 238,434 | |
| Securities - held to maturity, net | 3,311 | | | 3,380 | | | 3,868 | | | 4,077 | | | 4,149 | |
| Equity securities with readily determinable fair value | 4,289 | | | 4,426 | | | 4,498 | | | 5,191 | | | 4,916 | |
| Loans held for sale | 6,416 | | | 95 | | | 3,954 | | | 5,641 | | | 78 | |
| Loans held for investment | 4,371,528 | | | 4,324,758 | | | 4,310,006 | | | 4,120,291 | | | 4,433,304 | |
| Allowance for credit losses | (34,815) | | | (34,970) | | | (42,245) | | | (42,807) | | | (44,111) | |
| Loans, net | 4,336,713 | | | 4,289,788 | | | 4,267,761 | | | 4,077,484 | | | 4,389,193 | |
| | | | | | | | | |
| FHLB and other restricted stock | 10,101 | | | 20,099 | | | 24,506 | | | 6,252 | | | 6,213 | |
| Premises and equipment, net | 113,062 | | | 114,673 | | | 115,639 | | | 103,339 | | | 104,272 | |
| Other real estate owned ("OREO"), net | — | | | — | | | — | | | — | | | — | |
| Goodwill and intangible assets, net | 260,109 | | | 262,958 | | | 265,959 | | | 265,767 | | | 268,604 | |
| Bank-owned life insurance | 41,822 | | | 41,702 | | | 41,594 | | | 41,493 | | | 41,390 | |
| Deferred tax asset, net | 9,594 | | | 7,306 | | | 11,562 | | | 16,473 | | | 14,663 | |
| Other assets | 184,470 | | | 187,140 | | | 154,032 | | | 145,380 | | | 148,809 | |
| Total assets | $ | 5,599,794 | | | $ | 5,652,721 | | | $ | 5,628,185 | | | $ | 5,333,783 | | | $ | 5,642,450 | |
| LIABILITIES | | | | | | | | | |
| Noninterest bearing deposits | $ | 1,632,559 | | | $ | 1,608,411 | | | $ | 1,727,749 | | | $ | 1,756,680 | | | $ | 1,897,309 | |
| Interest bearing deposits | 2,854,492 | | | 2,685,055 | | | 2,311,245 | | | 2,414,656 | | | 2,544,045 | |
| Total deposits | 4,487,051 | | | 4,293,466 | | | 4,038,994 | | | 4,171,336 | | | 4,441,354 | |
| | | | | | | | | |
| Customer repurchase agreements | — | | | — | | | 3,208 | | | 340 | | | 13,463 | |
| Federal Home Loan Bank advances | 30,000 | | | 280,000 | | | 530,000 | | | 30,000 | | | 30,000 | |
| Subordinated notes | 108,454 | | | 108,234 | | | 108,016 | | | 107,800 | | | 107,587 | |
| Junior subordinated debentures | 41,592 | | | 41,444 | | | 41,299 | | | 41,158 | | | 41,016 | |
| Other liabilities | 82,315 | | | 96,111 | | | 79,452 | | | 94,178 | | | 117,857 | |
| Total liabilities | 4,749,412 | | | 4,819,255 | | | 4,800,969 | | | 4,444,812 | | | 4,751,277 | |
| EQUITY | | | | | | | | | |
| Preferred Stock | 45,000 | | | 45,000 | | | 45,000 | | | 45,000 | | | 45,000 | |
| Common stock | 290 | | | 289 | | | 287 | | | 283 | | | 283 | |
| Additional paid-in-capital | 547,212 | | | 542,565 | | | 539,241 | | | 534,790 | | | 529,804 | |
| Treasury stock, at cost | (265,016) | | | (264,916) | | | (260,453) | | | (182,658) | | | (156,949) | |
| Retained earnings | 527,506 | | | 515,513 | | | 508,665 | | | 498,456 | | | 481,697 | |
| Accumulated other comprehensive income (loss) | (4,610) | | | (4,985) | | | (5,524) | | | (6,900) | | | (8,662) | |
| Total stockholders' equity | 850,382 | | | 833,466 | | | 827,216 | | | 888,971 | | | 891,173 | |
| Total liabilities and equity | $ | 5,599,794 | | | $ | 5,652,721 | | | $ | 5,628,185 | | | $ | 5,333,783 | | | $ | 5,642,450 | |
Unaudited consolidated statement of income:
| | | | | | | | | | | | | | | | | | | | | | | | | | | | | | | | | | | | | | | | | |
| For the Three Months Ended | | For the Nine Months Ended |
| (Dollars in thousands) | September 30,
2023 | | June 30,
2023 | | March 31,
2023 | | December 31,
2022 | | September 30,
2022 | | September 30,
2023 | | September 30,
2022 |
| Interest income: | | | | | | | | | | | | | |
| Loans, including fees | $ | 59,669 | | | $ | 57,258 | | | $ | 52,538 | | | $ | 51,282 | | | $ | 44,928 | | | $ | 169,465 | | | $ | 129,906 | |
| Factored receivables, including fees | 39,161 | | | 39,819 | | | 40,904 | | | 48,644 | | | 53,317 | | | 119,884 | | | 174,549 | |
| Securities | 5,205 | | | 5,234 | | | 4,113 | | | 3,372 | | | 2,308 | | | 14,552 | | | 4,815 | |
| FHLB and other restricted stock | 397 | | | 219 | | | 125 | | | 83 | | | 65 | | | 741 | | | 175 | |
| Cash deposits | 3,101 | | | 2,956 | | | 2,994 | | | 2,891 | | | 2,607 | | | 9,051 | | | 3,522 | |
| Total interest income | 107,533 | | | 105,486 | | | 100,674 | | | 106,272 | | | 103,225 | | | 313,693 | | | 312,967 | |
| Interest expense: | | | | | | | | | | | | | |
| Deposits | 12,474 | | | 6,877 | | | 3,202 | | | 3,028 | | | 2,743 | | | 22,553 | | | 7,010 | |
| Subordinated notes | 1,315 | | | 1,312 | | | 1,309 | | | 1,307 | | | 1,304 | | | 3,936 | | | 3,905 | |
| Junior subordinated debentures | 1,169 | | | 1,090 | | | 1,034 | | | 926 | | | 726 | | | 3,293 | | | 1,736 | |
| Other borrowings | 1,248 | | | 4,756 | | | 1,747 | | | 296 | | | 182 | | | 7,751 | | | 539 | |
| Total interest expense | 16,206 | | | 14,035 | | | 7,292 | | | 5,557 | | | 4,955 | | | 37,533 | | | 13,190 | |
| Net interest income | 91,327 | | | 91,451 | | | 93,382 | | | 100,715 | | | 98,270 | | | 276,160 | | | 299,777 | |
| Credit loss expense (benefit) | 812 | | | 2,643 | | | 2,613 | | | 877 | | | 2,646 | | | 6,068 | | | 6,048 | |
| Net interest income after credit loss expense (benefit) | 90,515 | | | 88,808 | | | 90,769 | | | 99,838 | | | 95,624 | | | 270,092 | | | 293,729 | |
| Noninterest income: | | | | | | | | | | | | | |
| Service charges on deposits | 1,728 | | | 1,769 | | | 1,713 | | | 1,659 | | | 1,558 | | | 5,210 | | | 5,185 | |
| Card income | 2,065 | | | 2,119 | | | 1,968 | | | 2,025 | | | 2,034 | | | 6,152 | | | 6,125 | |
| Net OREO gains (losses) and valuation adjustments | — | | | — | | | — | | | — | | | (19) | | | — | | | (133) | |
| Net gains (losses) on sale of securities | 5 | | | — | | | — | | | (2) | | | — | | | 5 | | | 2,514 | |
| Net gains (losses) on sale of loans | 203 | | | 87 | | | (84) | | | (82) | | | 1,107 | | | 206 | | | 18,310 | |
| Fee income | 8,108 | | | 7,462 | | | 6,150 | | | 6,126 | | | 6,120 | | | 21,720 | | | 18,096 | |
| Insurance commissions | 1,074 | | | 1,303 | | | 1,593 | | | 936 | | | 1,191 | | | 3,970 | | | 4,209 | |
| | | | | | | | | | | | | |
| Other | 227 | | | (1,229) | | | (318) | | | 1,457 | | | 677 | | | (1,320) | | | 17,643 | |
| Total noninterest income | 13,410 | | | 11,511 | | | 11,022 | | | 12,119 | | | 12,668 | | | 35,943 | | | 71,949 | |
| Noninterest expense: | | | | | | | | | | | | | |
| Salaries and employee benefits | 50,884 | | | 54,219 | | | 54,686 | | | 51,639 | | | 49,307 | | | 159,789 | | | 149,848 | |
| Occupancy, furniture and equipment | 7,542 | | | 7,292 | | | 6,703 | | | 7,005 | | | 6,826 | | | 21,537 | | | 19,769 | |
| FDIC insurance and other regulatory assessments | 682 | | | 868 | | | 418 | | | 439 | | | 454 | | | 1,968 | | | 1,376 | |
| Professional fees | 3,941 | | | 3,035 | | | 3,085 | | | 4,115 | | | 4,263 | | | 10,061 | | | 11,529 | |
| Amortization of intangible assets | 2,849 | | | 3,001 | | | 2,850 | | | 2,837 | | | 2,913 | | | 8,700 | | | 9,085 | |
| Advertising and promotion | 1,839 | | | 1,629 | | | 1,371 | | | 2,730 | | | 1,995 | | | 4,839 | | | 5,029 | |
| Communications and technology | 10,784 | | | 11,904 | | | 11,346 | | | 9,886 | | | 12,410 | | | 34,034 | | | 32,197 | |
| Other | 7,738 | | | 8,448 | | | 8,822 | | | 8,120 | | | 8,521 | | | 25,008 | | | 25,027 | |
| Total noninterest expense | 86,259 | | | 90,396 | | | 89,281 | | | 86,771 | | | 86,689 | | | 265,936 | | | 253,860 | |
| Net income before income tax | 17,666 | | | 9,923 | | | 12,510 | | | 25,186 | | | 21,603 | | | 40,099 | | | 111,818 | |
| Income tax expense | 4,872 | | | 2,273 | | | 1,500 | | | 7,625 | | | 5,374 | | | 8,645 | | | 27,068 | |
| Net income | $ | 12,794 | | | $ | 7,650 | | | $ | 11,010 | | | $ | 17,561 | | | $ | 16,229 | | | $ | 31,454 | | | $ | 84,750 | |
| Dividends on preferred stock | (801) | | | (802) | | | (801) | | | (802) | | | (801) | | | (2,404) | | | (2,404) | |
| Net income available to common stockholders | $ | 11,993 | | | $ | 6,848 | | | $ | 10,209 | | | $ | 16,759 | | | $ | 15,428 | | | $ | 29,050 | | | $ | 82,346 | |
Earnings per share:
| | | | | | | | | | | | | | | | | | | | | | | | | | | | | | | | | | | | | | | | | |
| For the Three Months Ended | | Nine Months Ended |
| (Dollars in thousands) | September 30,
2023 | | June 30,
2023 | | March 31,
2023 | | December 31,
2022 | | September 30,
2022 | | September 30,
2023 | | September 30,
2022 |
| Basic | | | | | | | | | | | | | |
| Net income to common stockholders | $ | 11,993 | | | $ | 6,848 | | | $ | 10,209 | | | $ | 16,759 | | | $ | 15,428 | | | $ | 29,050 | | | $ | 82,346 | |
| Weighted average common shares outstanding | 23,162,614 | | | 23,138,835 | | | 23,361,732 | | | 24,129,560 | | | 24,227,020 | | | 23,220,331 | | | 24,483,054 | |
| Basic earnings per common share | $ | 0.52 | | | $ | 0.30 | | | $ | 0.44 | | | $ | 0.69 | | | $ | 0.64 | | | $ | 1.25 | | | $ | 3.36 | |
| | | | | | | | | | | | | |
| Diluted | | | | | | | | | | | | | |
| Net income to common stockholders - diluted | $ | 11,993 | | | $ | 6,848 | | | $ | 10,209 | | | $ | 16,759 | | | $ | 15,428 | | | $ | 29,050 | | | $ | 82,346 | |
| Weighted average common shares outstanding | 23,162,614 | | | 23,138,835 | | | 23,361,732 | | | 24,129,560 | | | 24,227,020 | | | 23,220,331 | | | 24,483,054 | |
| Dilutive effects of: | | | | | | | | | | | | | |
| Assumed exercises of stock options | 82,909 | | | 71,658 | | | 76,129 | | | 72,183 | | | 85,239 | | | 77,286 | | | 95,252 | |
| Restricted stock awards | 80,841 | | | 90,645 | | | 140,006 | | | 120,328 | | | 122,723 | | | 101,842 | | | 162,883 | |
| Restricted stock units | 84,137 | | | 65,909 | | | 116,754 | | | 95,465 | | | 97,512 | | | 86,844 | | | 96,174 | |
| Performance stock units - market based | 47,248 | | | 87,360 | | | 121,047 | | | 115,744 | | | 117,358 | | | 85,218 | | | 122,526 | |
| Performance stock units - performance based | — | | | — | | | — | | | 341,732 | | | 327,016 | | | — | | | 163,508 | |
| Employee stock purchase plan | 1,165 | | | 1,064 | | | 496 | | | 4,042 | | | 2,389 | | | 908 | | | 2,245 | |
| Weighted average shares outstanding - diluted | 23,458,914 | | | 23,455,471 | | | 23,816,164 | | | 24,879,054 | | | 24,979,257 | | | 23,572,429 | | | 25,125,642 | |
| Diluted earnings per common share | $ | 0.51 | | | $ | 0.29 | | | $ | 0.43 | | | $ | 0.67 | | | $ | 0.62 | | | $ | 1.23 | | | $ | 3.28 | |
Shares that were not considered in computing diluted earnings per common share because they were antidilutive or have not met the thresholds to be considered in the dilutive calculation are as follows:
| | | | | | | | | | | | | | | | | | | | | | | | | | | | | | | | | | | | | | | | | |
| For the Three Months Ended | | Nine Months Ended |
| September 30,
2023 | | June 30,
2023 | | March 31,
2023 | | December 31,
2022 | | September 30,
2022 | | September 30,
2023 | | September 30,
2022 |
| Stock options | 101,138 | | | 107,309 | | | 49,379 | | | 49,379 | | | 52,878 | | | 104,114 | | | 52,878 | |
| Restricted stock awards | — | | | 4,232 | | | — | | | 6,348 | | | 6,348 | | | — | | | 6,348 | |
| Restricted stock units | 11,250 | | | 11,250 | | | 11,250 | | | 11,250 | | | 15,000 | | | 11,250 | | | 15,000 | |
| Performance stock units - market based | 14,424 | | | 42,056 | | | 42,056 | | | 45,296 | | | 45,296 | | | 14,424 | | | 45,296 | |
| Performance stock units - performance based | — | | | — | | | — | | | — | | | — | | | — | | | — | |
| Employee stock purchase plan | — | | | — | | | — | | | — | | | — | | | — | | | — | |
| Accelerated share repurchase | — | | | — | | | 203,352 | | | — | | | — | | | — | | | — | |
Loans held for investment summarized as of:
| | | | | | | | | | | | | | | | | | | | | | | | | | | | | |
| (Dollars in thousands) | September 30,
2023 | | June 30,
2023 | | March 31,
2023 | | December 31,
2022 | | September 30,
2022 |
| Commercial real estate | $ | 817,064 | | | $ | 768,711 | | | $ | 695,160 | | | $ | 678,144 | | | $ | 669,742 | |
| Construction, land development, land | 131,862 | | | 110,071 | | | 98,311 | | | 90,976 | | | 75,527 | |
| 1-4 family residential properties | 129,588 | | | 130,628 | | | 132,010 | | | 125,981 | | | 122,594 | |
| Farmland | 62,698 | | | 67,913 | | | 67,596 | | | 68,934 | | | 66,595 | |
| Commercial | 1,251,939 | | | 1,218,892 | | | 1,239,952 | | | 1,251,110 | | | 1,282,199 | |
| Factored receivables | 1,213,702 | | | 1,173,794 | | | 1,178,104 | | | 1,237,449 | | | 1,449,080 | |
| Consumer | 8,166 | | | 8,409 | | | 8,913 | | | 8,868 | | | 9,506 | |
| Mortgage warehouse | 756,509 | | | 846,340 | | | 889,960 | | | 658,829 | | | 758,061 | |
| Total loans | $ | 4,371,528 | | | $ | 4,324,758 | | | $ | 4,310,006 | | | $ | 4,120,291 | | | $ | 4,433,304 | |
Our banking loan portfolio consists of traditional community bank loans as well as commercial finance product lines focused on businesses that require specialized financial solutions and national lending product lines that further diversify our lending operations.
Banking loans held for investment are further summarized below:
| | | | | | | | | | | | | | | | | | | | | | | | | | | | | |
| (Dollars in thousands) | September 30,
2023 | | June 30,
2023 | | March 31,
2023 | | December 31,
2022 | | September 30,
2022 |
| Commercial real estate | $ | 817,064 | | | $ | 768,711 | | | $ | 695,160 | | | $ | 678,144 | | | $ | 669,742 | |
| Construction, land development, land | 131,862 | | | 110,071 | | | 98,311 | | | 90,976 | | | 75,527 | |
| 1-4 family residential | 129,588 | | | 130,628 | | | 132,010 | | | 125,981 | | | 122,594 | |
| Farmland | 62,698 | | | 67,913 | | | 67,596 | | | 68,934 | | | 66,595 | |
| Commercial - General | 306,389 | | | 295,159 | | | 319,978 | | | 316,364 | | | 319,016 | |
| Commercial - Paycheck Protection Program | 41 | | | 45 | | | 52 | | | 55 | | | 60 | |
| Commercial - Agriculture | 49,479 | | | 46,839 | | | 38,637 | | | 48,494 | | | 60,409 | |
| Commercial - Equipment | 486,110 | | | 493,763 | | | 483,911 | | | 454,117 | | | 439,604 | |
| Commercial - Asset-based lending | 271,623 | | | 231,265 | | | 230,326 | | | 229,754 | | | 238,119 | |
| Commercial - Liquid Credit | 138,297 | | | 151,821 | | | 167,048 | | | 202,326 | | | 224,991 | |
| Consumer | 8,166 | | | 8,409 | | | 8,913 | | | 8,868 | | | 9,506 | |
| Mortgage Warehouse | 756,509 | | | 846,340 | | | 889,960 | | | 658,829 | | | 758,061 | |
| Total banking loans held for investment | $ | 3,157,826 | | | $ | 3,150,964 | | | $ | 3,131,902 | | | $ | 2,882,842 | | | $ | 2,984,224 | |
The following table presents the Company’s operating segments:
| | | | | | | | | | | | | | | | | | | | | | | | | | | | | | | | |
| (Dollars in thousands) | | | | | | | | | | |
| Three months ended September 30, 2023 | | Banking | | Factoring | | Payments | | Corporate | | Consolidated |
| Total interest income | | $ | 68,328 | | | $ | 34,244 | | | $ | 4,917 | | | $ | 44 | | | $ | 107,533 | |
| Intersegment interest allocations | | 8,330 | | | (9,664) | | | 1,334 | | | — | | | — | |
| Total interest expense | | 13,723 | | | — | | | — | | | 2,483 | | | 16,206 | |
| Net interest income (expense) | | 62,935 | | | 24,580 | | | 6,251 | | | (2,439) | | | 91,327 | |
| Credit loss expense (benefit) | | 410 | | | 375 | | | 14 | | | 13 | | | 812 | |
| Net interest income after credit loss expense | | 62,525 | | | 24,205 | | | 6,237 | | | (2,452) | | | 90,515 | |
| Noninterest income | | 5,978 | | | 2,546 | | | 4,817 | | | 69 | | | 13,410 | |
| Noninterest expense | | 31,503 | | | 18,371 | | | 14,556 | | | 21,829 | | | 86,259 | |
Net intersegment noninterest income (expense)(1) | | — | | | 242 | | | (242) | | | — | | | — | |
| Operating income (loss) | | $ | 37,000 | | | $ | 8,622 | | | $ | (3,744) | | | $ | (24,212) | | | $ | 17,666 | |
| | | | | | | | | | | | | | | | | | | | | | | | | | | | | | | | |
| (Dollars in thousands) | | | | | | | | | | |
| Three months ended June 30, 2023 | | Banking | | Factoring | | Payments | | Corporate | | Consolidated |
| Total interest income | | $ | 65,624 | | | $ | 36,368 | | | $ | 3,451 | | | $ | 43 | | | $ | 105,486 | |
| Intersegment interest allocations | | 7,478 | | | (9,358) | | | 1,880 | | | — | | | — | |
| Total interest expense | | 11,634 | | | — | | | — | | | 2,401 | | | 14,035 | |
| Net interest income (expense) | | 61,468 | | | 27,010 | | | 5,331 | | | (2,358) | | | 91,451 | |
| Credit loss expense (benefit) | | 831 | | | 1,481 | | | 41 | | | 290 | | | 2,643 | |
| Net interest income after credit loss expense | | 60,637 | | | 25,529 | | | 5,290 | | | (2,648) | | | 88,808 | |
| Noninterest income | | 6,347 | | | 980 | | | 4,119 | | | 65 | | | 11,511 | |
| Noninterest expense | | 31,934 | | | 20,218 | | | 16,939 | | | 21,305 | | | 90,396 | |
Intersegment noninterest income (expense)(1) | | — | | | (97) | | | 97 | | | — | | | — | |
| Operating income (loss) | | $ | 35,050 | | | $ | 6,194 | | | $ | (7,433) | | | $ | (23,888) | | | $ | 9,923 | |
(1) Intersegment noninterest income (expense) includes:
| | | | | | | | | | | | | | |
| (Dollars in thousands) | | Factoring | | Payments |
| Three Months Ended September 30, 2023 | | | | |
| Factoring revenue received from Payments | | $ | 510 | | | $ | (510) | |
| Payments revenue received from Factoring | | (268) | | | 268 | |
| Intersegment noninterest income (expense) | | $ | 242 | | | $ | (242) | |
| | | | |
| Three Months Ended June 30, 2023 | | | | |
| Factoring revenue received from Payments | | $ | 170 | | | $ | (170) | |
| Payments revenue received from Factoring | | (267) | | | 267 | |
| Intersegment noninterest income (expense) | | $ | (97) | | | $ | 97 | |
Information pertaining to our factoring segment, which includes only factoring originated by our Triumph Financial Services, LLC subsidiary, summarized as of and for the quarters ended:
| | | | | | | | | | | | | | | | | | | | | | | | | | | | | | | | |
| Factoring | | September 30,
2023 | | June 30,
2023 | | March 31,
2023 | | December 31,
2022 | | September 30,
2022 |
| Factored receivable period end balance | | $ | 1,041,448,000 | | | $ | 997,842,000 | | | $ | 1,096,071,000 | | | $ | 1,151,727,000 | | | $ | 1,330,122,000 | |
| Yield on average receivable balance | | 13.59 | % | | 14.07 | % | | 13.94 | % | | 13.85 | % | | 14.11 | % |
Current quarter charge-off rate(1) | | 0.12 | % | | 0.54 | % | | 0.19 | % | | 0.14 | % | | 0.16 | % |
| Factored receivables - transportation concentration | | 96 | % | | 95 | % | | 95 | % | | 96 | % | | 96 | % |
| | | | | | | | | | |
| Interest income, including fees | | $ | 34,244,000 | | | $ | 36,368,000 | | | $ | 38,157,000 | | | $ | 45,325,000 | | | $ | 49,561,000 | |
Noninterest income(2) | | 2,546,000 | | | 980,000 | | | 1,578,000 | | | 1,939,000 | | | 2,941,000 | |
| Intersegment noninterest income | | 510,000 | | | 170,000 | | | — | | | — | | | — | |
| Factored receivable total revenue | | 37,300,000 | | | 37,518,000 | | | 39,735,000 | | | 47,264,000 | | | 52,502,000 | |
| Average net funds employed | | 898,989,000 | | | 918,439,000 | | | 976,216,000 | | | 1,148,595,000 | | | 1,242,133,000 | |
| Yield on average net funds employed | | 16.46 | % | | 16.38 | % | | 16.51 | % | | 16.33 | % | | 16.77 | % |
| | | | | | | | | | |
| Accounts receivable purchased | | $ | 2,606,323,000 | | | $ | 2,732,976,000 | | | $ | 2,927,104,000 | | | $ | 3,277,986,000 | | | $ | 3,599,771,000 | |
| Number of invoices purchased | | 1,428,463 | | | 1,494,963 | | | 1,491,763 | | | 1,596,843 | | | 1,681,489 | |
| Average invoice size | | $ | 1,825 | | | $ | 1,828 | | | $ | 1,962 | | | $ | 2,053 | | | $ | 2,141 | |
| Average invoice size - transportation | | $ | 1,772 | | | $ | 1,773 | | | $ | 1,911 | | | $ | 2,002 | | | $ | 2,073 | |
| Average invoice size - non-transportation | | $ | 5,631 | | | $ | 5,790 | | | $ | 5,205 | | | $ | 6,083 | | | $ | 5,701 | |
Metrics above include assets and deposits held for sale.
(1)June 30, 2023 includes a $3.3 million charge-off of an over-formula advance balance, which contributed approximately 0.32% to the net charge-off rate for the quarter. In accordance with the agreement reached with Covenant, Covenant has reimbursed us for $1.7 million of this charge-off.
(2)September 30, 2022 non-interest income includes a $1.0 million gain on sale of a portfolio of factored receivables, which contributed 0.33% to the yield on average net funds employed for the quarter.
Information pertaining to our Payments segment, which includes only our TriumphPay division, summarized as of and for the quarters ended:
| | | | | | | | | | | | | | | | | | | | | | | | | | | | | | | | |
| Payments | | September 30,
2023 | | June 30,
2023 | | March 31,
2023 | | December 31,
2022 | | September 30,
2022 |
| Supply chain financing factored receivables | | $ | 87,590,000 | | | $ | 93,751,000 | | | $ | 132,000 | | | $ | 118,000 | | | $ | 12,834,000 | |
| Quickpay and other factored receivables | | 84,664,000 | | | 82,201,000 | | | 81,901,000 | | | 85,604,000 | | | 106,124,000 | |
| Total factored receivable period end balance | | $ | 172,254,000 | | | $ | 175,952,000 | | | $ | 82,033,000 | | | $ | 85,722,000 | | | $ | 118,958,000 | |
| | | | | | | | | | |
| Total revenue | | | | | | | | | | |
| Supply chain finance interest income | | $ | 2,316,000 | | | $ | 820,000 | | | $ | 1,000 | | | $ | 246,000 | | | $ | 567,000 | |
| Quickpay interest income | | 2,601,000 | | | 2,631,000 | | | 2,746,000 | | | 3,073,000 | | | 3,189,000 | |
| Intersegment interest income allocation | | 1,334,000 | | | 1,880,000 | | | 1,542,000 | | | 311,000 | | | — | |
| Total interest income | | 6,251,000 | | | 5,331,000 | | | 4,289,000 | | | 3,630,000 | | | 3,756,000 | |
| Broker noninterest income | | 3,372,000 | | | 2,607,000 | | | 2,356,000 | | | 2,297,000 | | | 2,247,000 | |
| Factor noninterest income | | 1,312,000 | | | 1,367,000 | | | 1,276,000 | | | 1,182,000 | | | 1,269,000 | |
| Other noninterest income | | 133,000 | | | 145,000 | | | 75,000 | | | 72,000 | | | 2,000 | |
| Intersegment noninterest income | | 268,000 | | | 267,000 | | | 265,000 | | | — | | | — | |
| Total noninterest income | | 5,085,000 | | | 4,386,000 | | | 3,972,000 | | | 3,551,000 | | | 3,518,000 | |
| | $ | 11,336,000 | | | $ | 9,717,000 | | | $ | 8,261,000 | | | $ | 7,181,000 | | | $ | 7,274,000 | |
| | | | | | | | | | |
| Total expense | | | | | | | | | | |
| Intersegment interest expense allocation | | $ | — | | | $ | — | | | $ | — | | | $ | — | | | $ | 420,000 | |
| Credit loss expense (benefit) | | 14,000 | | | 41,000 | | | — | | | (187,000) | | | 235,000 | |
| Noninterest expense | | 14,556,000 | | | 16,939,000 | | | 15,417,000 | | | 17,169,000 | | | 14,066,000 | |
| Intersegment noninterest expense | | 510,000 | | | 170,000 | | | — | | | — | | | — | |
| | $ | 15,080,000 | | | $ | 17,150,000 | | | $ | 15,417,000 | | | $ | 16,982,000 | | | $ | 14,721,000 | |
| | | | | | | | | | |
| Pre-tax operating income (loss) | | $ | (3,744,000) | | | $ | (7,433,000) | | | $ | (7,156,000) | | | $ | (9,801,000) | | | $ | (7,447,000) | |
| Intersegment interest expense allocation | | — | | | — | | | — | | | — | | | 420,000 | |
| Depreciation and software amortization expense | | 358,000 | | | 368,000 | | | 193,000 | | | 178,000 | | | 120,000 | |
| Intangible amortization expense | | 1,703,000 | | | 1,729,000 | | | 1,548,000 | | | 1,451,000 | | | 1,450,000 | |
Earnings (losses) before interest, taxes, depreciation, and amortization(1) | | $ | (1,683,000) | | | $ | (5,336,000) | | | $ | (5,415,000) | | | $ | (8,172,000) | | | $ | (5,457,000) | |
| | | | | | | | | | |
| | | | | | | | | | |
| | | | | | | | | | |
| EBITDA Margin | | (15) | % | | (55) | % | | (66) | % | | (114) | % | | (75) | % |
| | | | | | | | | | |
| Number of invoices processed | | 5,037,841 | | 4,526,629 | | 4,260,654 | | 4,605,020 | | 4,676,249 |
| Amount of payments processed | | $5,329,580,000 | | $4,940,317,000 | | $5,030,548,000 | | $5,577,014,000 | | $5,951,706,000 |
| Network invoice volume | | 303,300 | | 181,904 | | 159,353 | | 157,004 | | 144,253 |
| Network payment volume | | $510,298,000 | | $299,948,000 | | $289,667,000 | | $301,366,000 | | $288,410,000 |
(1)Earnings (losses) before interest, taxes, depreciation, and amortization ("EBITDA") is a non-GAAP financial measure used as a supplemental measure to evaluate the performance of our Payments segment.
Deposits summarized as of:
| | | | | | | | | | | | | | | | | | | | | | | | | | | | | |
| (Dollars in thousands) | September 30,
2023 | | June 30,
2023 | | March 31,
2023 | | December 31,
2022 | | September 30,
2022 |
| Non-interest bearing demand | $ | 1,632,559 | | | $ | 1,608,411 | | | $ | 1,727,749 | | | $ | 1,756,680 | | | $ | 1,897,309 | |
| Interest bearing demand | 795,246 | | | 778,972 | | | 818,382 | | | 856,512 | | | 883,581 | |
| Individual retirement accounts | 55,296 | | | 57,575 | | | 62,030 | | | 68,125 | | | 74,423 | |
| Money market | 540,235 | | | 569,318 | | | 488,064 | | | 508,534 | | | 505,082 | |
| Savings | 542,985 | | | 524,210 | | | 535,796 | | | 551,780 | | | 546,862 | |
| Certificates of deposit | 269,416 | | | 270,273 | | | 286,153 | | | 319,150 | | | 373,734 | |
| Brokered time deposits | 451,273 | | | 484,666 | | | 120,820 | | | 110,555 | | | 160,363 | |
| Other brokered deposits | 200,041 | | | 41 | | | — | | | — | | | — | |
| Total deposits | $ | 4,487,051 | | | $ | 4,293,466 | | | $ | 4,038,994 | | | $ | 4,171,336 | | | $ | 4,441,354 | |
Net interest margin summarized for the three months ended:
| | | | | | | | | | | | | | | | | | | | | | | | | | | | | | | | | | | |
| September 30, 2023 | | June 30, 2023 |
| (Dollars in thousands) | Average
Balance | | Interest | | Average Rate(4) | | Average
Balance | | Interest | | Average Rate(4) |
| Interest earning assets: | | | | | | | | | | | |
| Interest earning cash balances | $ | 228,019 | | | $ | 3,101 | | | 5.40 | % | | $ | 227,696 | | | $ | 2,956 | | | 5.21 | % |
| Taxable securities | 305,665 | | | 5,173 | | | 6.71 | % | | 318,285 | | | 5,167 | | | 6.51 | % |
| Tax-exempt securities | 4,901 | | | 32 | | | 2.59 | % | | 10,399 | | | 67 | | | 2.58 | % |
| FHLB and other restricted stock | 19,552 | | | 397 | | | 8.06 | % | | 27,071 | | | 219 | | | 3.24 | % |
Loans(1) | 4,282,822 | | | 98,830 | | | 9.16 | % | | 4,262,170 | | | 97,077 | | | 9.14 | % |
| Total interest earning assets | $ | 4,840,959 | | | $ | 107,533 | | | 8.81 | % | | $ | 4,845,621 | | | $ | 105,486 | | | 8.73 | % |
| Non-interest earning assets: | | | | | | | | | | | |
| Other assets | 631,041 | | | | | | | 616,325 | | | | | |
| Total assets | $ | 5,472,000 | | | | | | | $ | 5,461,946 | | | | | |
| Interest bearing liabilities: | | | | | | | | | | | |
| Deposits: | | | | | | | | | | | |
| Interest bearing demand | $ | 776,812 | | | $ | 769 | | | 0.39 | % | | $ | 804,799 | | | $ | 715 | | | 0.36 | % |
| Individual retirement accounts | 56,265 | | | 134 | | | 0.94 | % | | 60,171 | | | 104 | | | 0.69 | % |
| Money market | 542,243 | | | 2,706 | | | 1.98 | % | | 506,782 | | | 1,685 | | | 1.33 | % |
| Savings | 537,980 | | | 723 | | | 0.53 | % | | 529,952 | | | 475 | | | 0.36 | % |
| Certificates of deposit | 270,535 | | | 1,256 | | | 1.84 | % | | 286,253 | | | 902 | | | 1.26 | % |
| Brokered time deposits | 501,221 | | | 6,717 | | | 5.32 | % | | 244,721 | | | 2,823 | | | 4.63 | % |
| Other brokered deposits | 12,231 | | | 169 | | | 5.48 | % | | 13,188 | | | 173 | | | 5.26 | % |
| Total interest bearing deposits | 2,697,287 | | | 12,474 | | | 1.83 | % | | 2,445,866 | | | 6,877 | | | 1.13 | % |
| Federal Home Loan Bank advances | 91,957 | | | 1,248 | | | 5.38 | % | | 363,901 | | | 4,756 | | | 5.24 | % |
| Subordinated notes | 108,336 | | | 1,315 | | | 4.82 | % | | 108,115 | | | 1,312 | | | 4.87 | % |
| Junior subordinated debentures | 41,520 | | | 1,169 | | | 11.17 | % | | 41,378 | | | 1,090 | | | 10.57 | % |
| Other borrowings | — | | | — | | | — | % | | 308 | | | — | | | — | % |
| Total interest bearing liabilities | $ | 2,939,100 | | | $ | 16,206 | | | 2.19 | % | | $ | 2,959,568 | | | $ | 14,035 | | | 1.90 | % |
| Noninterest bearing liabilities and equity: | | | | | | | | | | | |
| Non-interest bearing demand deposits | 1,615,697 | | | | | | | 1,598,733 | | | | | |
| Other liabilities | 63,828 | | | | | | | 61,666 | | | | | |
| Total equity | 853,375 | | | | | | | 841,979 | | | | | |
| Total liabilities and equity | $ | 5,472,000 | | | | | | | $ | 5,461,946 | | | | | |
| Net interest income | | | $ | 91,327 | | | | | | | $ | 91,451 | | | |
Interest spread(2) | | | | | 6.62 | % | | | | | | 6.83 | % |
Net interest margin(3) | | | | | 7.48 | % | | | | | | 7.57 | % |
(1) Loan balance totals include respective nonaccrual assets.
(2) Net interest spread is the yield on average interest earning assets less the rate on interest bearing liabilities.
(3) Net interest margin is the ratio of net interest income to average interest earning assets.
(4) Average rates have been annualized.
Additional information pertaining to our loan portfolio, including loans held for investment and loans held for sale, summarized for the quarters ended:
| | | | | | | | | | | | | | | | | | | | | | | | | | | | | |
| (Dollars in thousands) | September 30,
2023 | | June 30,
2023 | | March 31,
2023 | | December 31,
2022 | | September 30,
2022 |
| Average Banking loans | $ | 3,109,630 | | | $ | 3,120,594 | | | $ | 2,916,614 | | | $ | 2,891,412 | | | $ | 2,830,507 | |
| Average Factoring receivables | 999,345 | | | 1,036,922 | | | 1,110,203 | | | 1,298,286 | | | 1,393,141 | |
| Average Payments receivables | 173,847 | | | 104,654 | | | 83,312 | | | 105,101 | | | 131,484 | |
| Average total loans | $ | 4,282,822 | | | $ | 4,262,170 | | | $ | 4,110,129 | | | $ | 4,294,799 | | | $ | 4,355,132 | |
| Banking yield | 7.61 | % | | 7.36 | % | | 7.31 | % | | 7.04 | % | | 6.30 | % |
| Factoring yield | 13.59 | % | | 14.07 | % | | 13.94 | % | | 13.85 | % | | 14.11 | % |
| Payments yield | 11.22 | % | | 13.23 | % | | 13.37 | % | | 12.53 | % | | 11.33 | % |
| Total loan yield | 9.16 | % | | 9.14 | % | | 9.22 | % | | 9.23 | % | | 8.95 | % |
Metrics and non-GAAP financial:
| | | | | | | | | | | | | | | | | | | | | | | | | | | | | | | | | | | | | | | | | | | | |
| | As of and for the Three Months Ended | | As of and for the Nine Months Ended |
(Dollars in thousands,
except per share amounts) | | September 30,
2023 | | June 30,
2023 | | March 31,
2023 | | December 31,
2022 | | September 30,
2022 | | September 30,
2023 | | September 30,
2022 |
| | | | | | | | | | | | | | |
| | | | | | | | | | | | | | |
| | | | | | | | | | | | | | |
| | | | | | | | | | | | | | |
| | | | | | | | | | | | | | |
| | | | | | | | | | | | | | |
| | | | | | | | | | | | | | |
| | | | | | | | | | | | | | |
| | | | | | | | | | | | | | |
| Average total stockholders' equity | | $ | 853,375 | | | $ | 841,979 | | | $ | 858,112 | | | $ | 909,225 | | | $ | 898,845 | | | $ | 851,139 | | | $ | 887,497 | |
| Average preferred stock liquidation preference | | (45,000) | | | (45,000) | | | (45,000) | | | (45,000) | | | (45,000) | | | (45,000) | | | (45,000) | |
| Average total common stockholders' equity | | 808,375 | | | 796,979 | | | 813,112 | | | 864,225 | | | 853,845 | | | 806,139 | | | 842,497 | |
| Average goodwill and other intangibles | | (261,619) | | | (264,544) | | | (265,320) | | | (267,206) | | | (269,417) | | | (263,814) | | | (271,350) | |
| Average tangible common stockholders' equity | | $ | 546,756 | | | $ | 532,435 | | | $ | 547,792 | | | $ | 597,019 | | | $ | 584,428 | | | $ | 542,325 | | | $ | 571,147 | |
| | | | | | | | | | | | | | |
| Net income available to common stockholders | | $ | 11,993 | | | $ | 6,848 | | | $ | 10,209 | | | $ | 16,759 | | | $ | 15,428 | | | $ | 29,050 | | | $ | 82,346 | |
| Average tangible common equity | | 546,756 | | | 532,435 | | | 547,792 | | | 597,019 | | | 584,428 | | | 542,325 | | | 571,147 | |
| Return on average tangible common equity | | 8.70 | % | | 5.16 | % | | 7.56 | % | | 11.14 | % | | 10.47 | % | | 7.16 | % | | 19.28 | % |
| | | | | | | | | | | | | | |
| | | | | | | | | | | | | | |
| | | | | | | | | | | | | | |
| | | | | | | | | | | | | | |
| | | | | | | | | | | | | | |
| | | | | | | | | | | | | | |
| | | | | | | | | | | | | | |
| | | | | | | | | | | | | | |
| | | | | | | | | | | | | | |
| | | | | | | | | | | | | | |
| | | | | | | | | | | | | | |
| Net interest income | | $ | 91,327 | | | $ | 91,451 | | | $ | 93,382 | | | $ | 100,715 | | | $ | 98,270 | | | $ | 276,160 | | | $ | 299,777 | |
| Noninterest income | | 13,410 | | | 11,511 | | | 11,022 | | | 12,119 | | | 12,668 | | | 35,943 | | | 71,949 | |
| Operating revenue | | $ | 104,737 | | | $ | 102,962 | | | $ | 104,404 | | | $ | 112,834 | | | $ | 110,938 | | | $ | 312,103 | | | $ | 371,726 | |
| Noninterest expenses | | $ | 86,259 | | | $ | 90,396 | | | $ | 89,281 | | | $ | 86,771 | | | $ | 86,689 | | | $ | 265,936 | | | $ | 253,860 | |
| Efficiency ratio | | 82.36 | % | | 87.80 | % | | 85.52 | % | | 76.90 | % | | 78.14 | % | | 85.21 | % | | 68.29 | % |
| | | | | | | | | | | | | | |
| | | | | | | | | | | | | | |
| | | | | | | | | | | | | | |
| | | | | | | | | | | | | | |
| | | | | | | | | | | | | | |
| | | | | | | | | | | | | | |
| | | | | | | | | | | | | | |
| | | | | | | | | | | | | | |
| | | | | | | | | | | | | | |
| | | | | | | | | | | | | | |
| | | | | | | | | | | | | | |
| | | | | | | | | | | | | | |
| Net non-interest expense to average assets ratio: | | | | | | | | | | | | | | |
| Noninterest expenses | | $ | 86,259 | | | $ | 90,396 | | | $ | 89,281 | | | $ | 86,771 | | | $ | 86,689 | | | $ | 265,936 | | | $ | 253,860 | |
| Noninterest income | | $ | 13,410 | | | $ | 11,511 | | | $ | 11,022 | | | $ | 12,119 | | | $ | 12,668 | | | $ | 35,943 | | | $ | 71,949 | |
| Net noninterest expenses | | $ | 72,849 | | | $ | 78,885 | | | $ | 78,259 | | | $ | 74,652 | | | $ | 74,021 | | | $ | 229,993 | | | $ | 181,911 | |
| Average total assets | | $ | 5,472,000 | | | $ | 5,461,946 | | | $ | 5,310,024 | | | $ | 5,504,093 | | | $ | 5,700,547 | | | $ | 5,415,269 | | | $ | 5,806,933 | |
| Net noninterest expense to average assets ratio | | 5.28 | % | | 5.79 | % | | 5.98 | % | | 5.38 | % | | 5.15 | % | | 5.68 | % | | 4.19 | % |
| | | | | | | | | | | | | | |
| Total stockholders' equity | | $ | 850,382 | | | $ | 833,466 | | | $ | 827,216 | | | $ | 888,971 | | | $ | 891,173 | | | $ | 850,382 | | | $ | 891,173 | |
| Preferred stock liquidation preference | | (45,000) | | | (45,000) | | | (45,000) | | | (45,000) | | | (45,000) | | | (45,000) | | | (45,000) | |
| Total common stockholders' equity | | 805,382 | | | 788,466 | | | 782,216 | | | 843,971 | | | 846,173 | | | 805,382 | | | 846,173 | |
| Goodwill and other intangibles | | (260,109) | | | (262,958) | | | (265,959) | | | (265,767) | | | (268,604) | | | (260,109) | | | (268,604) | |
| Tangible common stockholders' equity | | $ | 545,273 | | | $ | 525,508 | | | $ | 516,257 | | | $ | 578,204 | | | $ | 577,569 | | | $ | 545,273 | | | $ | 577,569 | |
| Common shares outstanding | | 23,291,693 | | | 23,269,885 | | | 23,370,515 | | | 24,053,585 | | | 24,478,288 | | | 23,291,693 | | | 24,478,288 | |
| Tangible book value per share | | $ | 23.41 | | | $ | 22.58 | | | $ | 22.09 | | | $ | 24.04 | | | $ | 23.60 | | | $ | 23.41 | | | $ | 23.60 | |
| | | | | | | | | | | | | | |
| Total assets at end of period | | $ | 5,599,794 | | | $ | 5,652,721 | | | $ | 5,628,185 | | | $ | 5,333,783 | | | $ | 5,642,450 | | | $ | 5,599,794 | | | $ | 5,642,450 | |
| Goodwill and other intangibles | | (260,109) | | | (262,958) | | | (265,959) | | | (265,767) | | | (268,604) | | | (260,109) | | | (268,604) | |
| Tangible assets at period end | | $ | 5,339,685 | | | $ | 5,389,763 | | | $ | 5,362,226 | | | $ | 5,068,016 | | | $ | 5,373,846 | | | $ | 5,339,685 | | | $ | 5,373,846 | |
| Tangible common stockholders' equity ratio | | 10.21 | % | | 9.75 | % | | 9.63 | % | | 11.41 | % | | 10.75 | % | | 10.21 | % | | 10.75 | % |
1)Triumph Financial uses certain non-GAAP financial measures to provide meaningful supplemental information regarding Triumph Financial's operational performance and to enhance investors' overall understanding of such financial performance. The non-GAAP measures used by Triumph Financial include the following:
•"Tangible common stockholders' equity" is defined as common stockholders' equity less goodwill and other intangible assets.
•"Total tangible assets" is defined as total assets less goodwill and other intangible assets.
•"Tangible book value per share" is defined as tangible common stockholders' equity divided by total common shares outstanding. This measure is important to investors interested in changes from period-to-period in book value per share exclusive of changes in intangible assets.
•"Tangible common stockholders' equity ratio" is defined as the ratio of tangible common stockholders' equity divided by total tangible assets. We believe that this measure is important to many investors in the marketplace who are interested in relative changes from period-to period in common equity and total assets, each exclusive of changes in intangible assets.
•"Return on Average Tangible Common Equity" is defined as net income available to common stockholders divided by average tangible common stockholders' equity.
2)Performance ratios include discount accretion on purchased loans for the periods presented as follows:
| | | | | | | | | | | | | | | | | | | | | | | | | | | | | | | | | | | | | | | | | |
| For the Three Months Ended | | For the Nine Months Ended |
| (Dollars in thousands) | September 30,
2023 | | June 30,
2023 | | March 31,
2023 | | December 31,
2022 | | September 30,
2022 | | September 30,
2023 | | September 30,
2022 |
| Loan discount accretion | $ | 1,403 | | | $ | 990 | | | $ | 1,810 | | | $ | 2,011 | | | $ | 1,539 | | | $ | 4,203 | | | $ | 6,631 | |
3)Asset quality ratios exclude loans held for sale, except for non-performing assets to total assets.
4)Current quarter ratios are preliminary.
Source: Triumph Financial, Inc.
###
Investor Relations:
Luke Wyse
Senior Vice President, Finance & Investor Relations
lwyse@tfin.com
214-365-6936
Media Contact:
Amanda Tavackoli
Senior Vice President, Director of Corporate Communication
atavackoli@tfin.com
214-365-6930