 Investor Presentation Investor Presentation February 2014 February 2014 Exhibit 99.1 |
 1 Forward Looking Statements This presentation contains forward-looking statements within the meaning of Section 27A of the Securities Act of 1933 and Section 21E of the Securities Exchange Act of 1934. All statements, other than statements of historical fact, included in this presentation that address activities, events or developments that Diamondback Energy, Inc. (the “Company”) expects, believes or anticipates will or may occur in the future are forward-looking statements. The words “believe,” “expect,” “may,” “estimates,” “will,” “anticipate,” “plan,” “intend,” “foresee,” “should,” “would,” “could,” or other similar expressions are intended to identify forward-looking statements, which are generally not historical in nature. However, the absence of these words does not mean that the statements are not forward-looking. Without limiting the generality of the foregoing, forward-looking statements contained in this presentation specifically include the expectations of plans, strategies, objectives and anticipated financial and operating results of the Company, including as to the Company’s drilling program, production, hedging activities, capital expenditure levels and other guidance included in this presentation. These statements are based on certain assumptions made by the Company based on management's expectations and perception of historical trends, current conditions, anticipated future developments and other factors believed to be appropriate. Such statements are subject to a number of assumptions, risks and uncertainties, many of which are beyond the control of the Company, which may cause actual results to differ materially from those implied or expressed by the forward-looking statements. These include the factors discussed or referenced in the Company’s filings with the Securities and Exchange Commission (“SEC”), including its Forms 10-K, 10-Q and 8-K, risks relating to financial performance and results, current economic conditions and resulting capital restraints, prices and demand for oil and natural gas, availability of drilling equipment and personnel, availability of sufficient capital to execute the Company’s business plan, impact of compliance with legislation and regulations, successful results from the Company’s identified drilling locations, the Company’s ability to replace reserves and efficiently develop and exploit its current reserves and other important factors that could cause actual results to differ materially from those projected. Any forward-looking statement speaks only as of the date on which such statement is made and the Company undertakes no obligation to correct or update any forward-looking statement, whether as a result of new information, future events or otherwise, except as required by applicable law. The SEC generally permits oil and gas companies, in filings made with the SEC, to disclose proved reserves, which are reserve estimates that geological and engineering data demonstrate with reasonable certainty to be recoverable in future years from known reservoirs under existing economic and operating conditions and certain probable and possible reserves that meet the SEC’s definitions for such terms. In this communication, the Company may use the term “unproved reserves” which the SEC guidelines restrict from being included in filings with the SEC without strict compliance with SEC definitions. “Unproved reserves” refers to the Company’s internal estimates of hydrocarbon quantities that may be potentially discovered through exploratory drilling or recovered with additional drilling or recovery techniques. Unproved reserves may not constitute reserves within the meaning of the Society of Petroleum Engineer’s Petroleum Resource Management System or SEC rules and do not include any proved reserves. Actual quantities that may be ultimately recovered from the Company’s interests may differ substantially. Factors affecting ultimate recovery include the scope of the Company’s ongoing drilling program, which will be directly affected by the availability of capital, drilling and production costs, availability of drilling services and equipment, drilling results, lease expirations, transportation constraints, regulatory approvals and other factors; and actual drilling results, including geological and mechanical factors affecting recovery rates. Estimates of unproved reserves may change significantly as development of the Company’s assets provide additional data. In addition, the Company’s production forecasts and expectations for future periods are dependent upon many assumptions, including estimates of production decline rates from existing wells and the undertaking and outcome of future drilling activity, which may be affected by significant commodity price declines or drilling cost increases. This presentation contains guidance regarding our estimated future production, capital expenditures, expenses and other matters. This guidance is based on certain assumptions and analyses made by the Company and is affected by such factors as market demand for oil and natural gas, commodity price volatility and the Company's actual drilling program, which will be directly affected by the availability of capital, drilling and production costs, developmental drilling tests and results, commodity prices, availability of drilling services and equipment, lease expirations, transportation constraints, regulatory approvals, field spacing rules and actual drilling results. This guidance is speculative by its nature and, accordingly, is subject to great risk of not being actually realized by the Company. For additional information, we refer you to the Company's Annual Report on Form 10-K for the year ended December 31, 2012, its Quarterly Reports on Form 10-Q for the three months ended March 31, 2013, June 30, 2013 and September 30, 2013 and its Current Reports on Form 8-K. |
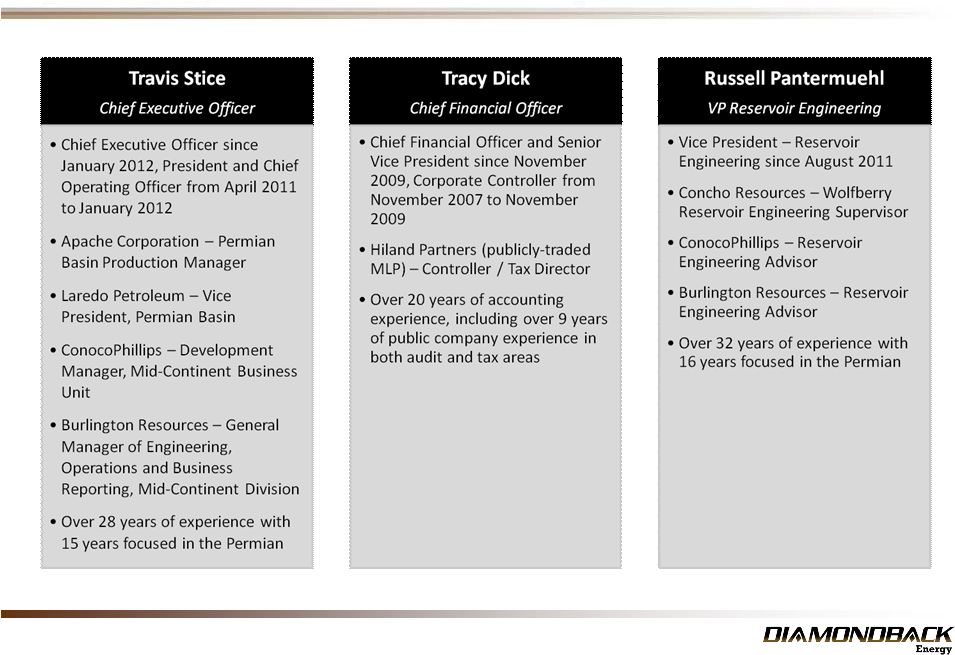 2 Diamondback Energy - Key Executives |
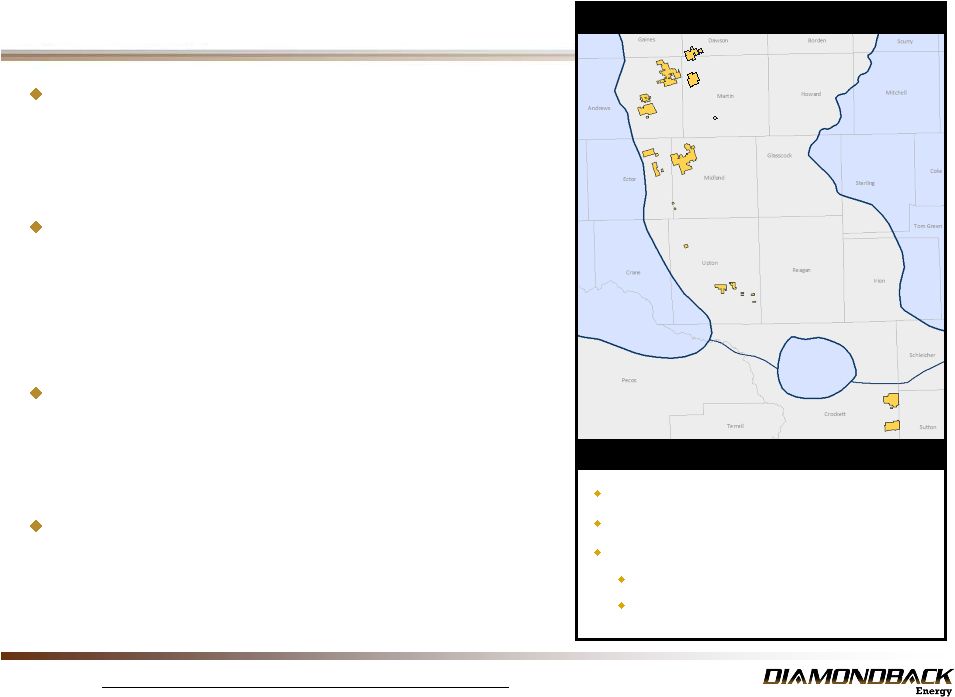 3 Central Basin Platform Eastern Shelf Ozona Arch Midland Basin Key Highlights Market capitalization of $2.7 billion (1) Over 67,000 net acres; ~99% operated Proved reserves: 63.6 MMBOE (12/31/13) (2) 67% Oil, 17% NGL, 16% Gas 47% Proved Developed Diamondback Energy Acreage Diamondback Energy Overview Aggressive Developer of Horizontal Inventory - Currently running 4 horizontal and 1 vertical rig - 5th horizontal rig expected in 2Q’14 - Execution focus drives peer leading performance Volume and Reserve Growth To Continue - 2013 volumes increased 149% y/y - 2014E forecasted to increase 112% y/y - Total reserves increased 58% y/y to 63.6 MMboe - Proved developed increased 143% y/y to 30.0 MMboe Peer Leading Cash Margin of Nearly $70/boe in 3Q’13 - Four consecutive quarters of double digit decline in LOE/BOE - 75% oil – highest among peers - Cash margins exceeded peers by nearly 50% in 3Q’13 Minerals Drive $70-$80 MM of Free Cash Flow - Forecasted free cash flow expected to grow - No additional capital required to generate free cash flow Source: Bloomberg, Ryder Scott, Company filings, management data and estimates. (1) Market data based on 47.1MM shares outstanding and$56.72 share price on February 7, 2014. (2) Based upon Diamondback Energy Inc. Estimated Future Reserves and Income Attributable to Certain Leasehold Interests, dated December 31, 2013, prepared by Ryder Scott Company. |
 4 A Growth Story Average Daily Net Production 1,2 (BOEPD) Total Reserves Growth 1,2,3 (MMBOE) 1P – By Commodity 3 Key Highlights 63.6 MMBOE 63.6 MMBOE 1P – By Category 3 Shift to horizontal development driving accelerated growth. Less than 5% of horizontal resource potential booked as PUDs. Continuing to prove up additional horizontal benches. Source: Company filings, Ryder Scott, management data and estimates. (1) 2012 numbers reflect pro forma information of Diamondback and its subsidiaries and includes the Permian Basin interests of Gulfport as if those interests had been contributed to Diamondback on January 1, 2012. (2) Based on 2014 guidance published on October 23, 2013, which is subject to numerous assumptions and risks. Midpoint of forecast shown for 2014E. See disclaimer at beginning of this presentation. (3) Based upon Diamondback Energy Inc. Estimated Future Reserves and Income Attributable to Certain Leasehold Interests, dated December 31, 2013, prepared by Ryder Scott Company. |
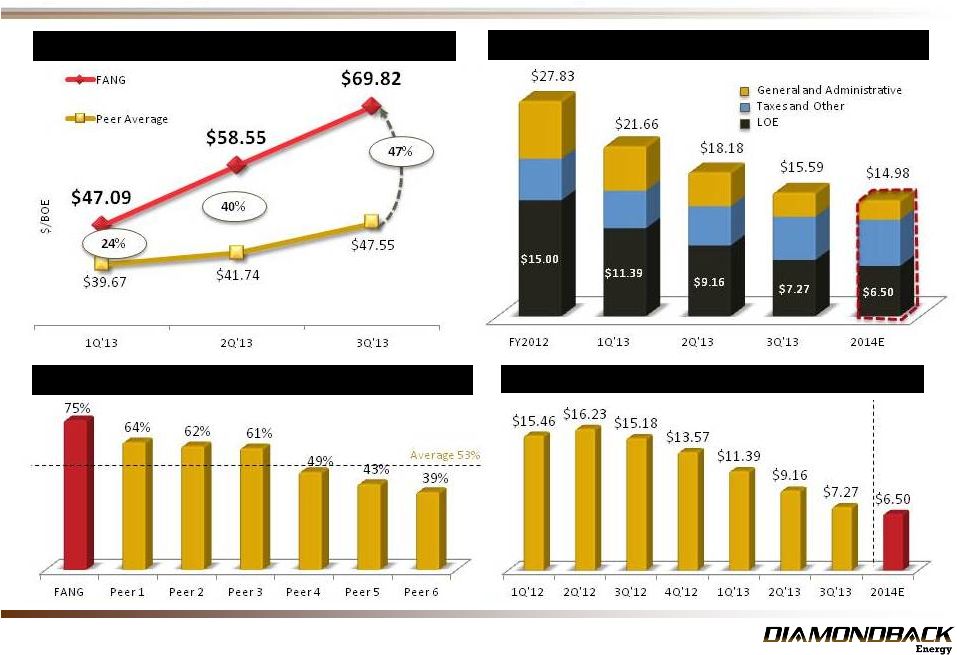 5 Peer Leading in Cash Margins Cash Margins Exceed Peers by Nearly 50% 2,3 FANG Operating Expenses Over Time 4 ($/BOE) FANG Percent Oil vs. Public Permian Peers 1,2 Quarterly LOE ($/BOE) 3,4 Source: Company filings, management data and estimates. (1) Represents latest reported production percentage of oil. (2) Peers include ATHL, AREX, CXO, LPI, PXD and CPE. (3) Cash margin represents publicly reported EBITDA divided by BOE production for the period. (4) 2012 numbers reflect pro forma information of Diamondback and its subsidiaries and includes the Permian Basin interests of Gulfport if such interests has been contributed to Diamondback on January 11, 2012. Based on 2014 guidance published on October 23, 2013, which is subject to numerous assumptions and risks. LOE reflects reclassification of as valorem taxes per published guidance. Midpoint of forecast shown for 2014E. See the disclaimer at the beginning of this presentation. |
 6 Advantaged Structure Increases Cash Flow through Minerals Ownership 20% average Royalty Interest across 15,000 gross acres. Traditional 75-80% Net Revenue Interest $250-$300 million 1 EBITDA $70-$80 million 1 Free Cash Flow Spanish Trail Minerals 2014 Guidance 2 Production: 2,750 Boe/d (Nasdaq: FANG) Diamondback Excluding Minerals 2014 Guidance 2 Production: 12,750 Boe/d LOE: $7.50/boe G&A: $3.00/boe 100% 100% LOE: $0.00/boe G&A: $0.00/boe (1) Projections based upon oil price range of $85-$100 per barrel (2) Guidance projected at midpoint of range – October 23, 2013. |
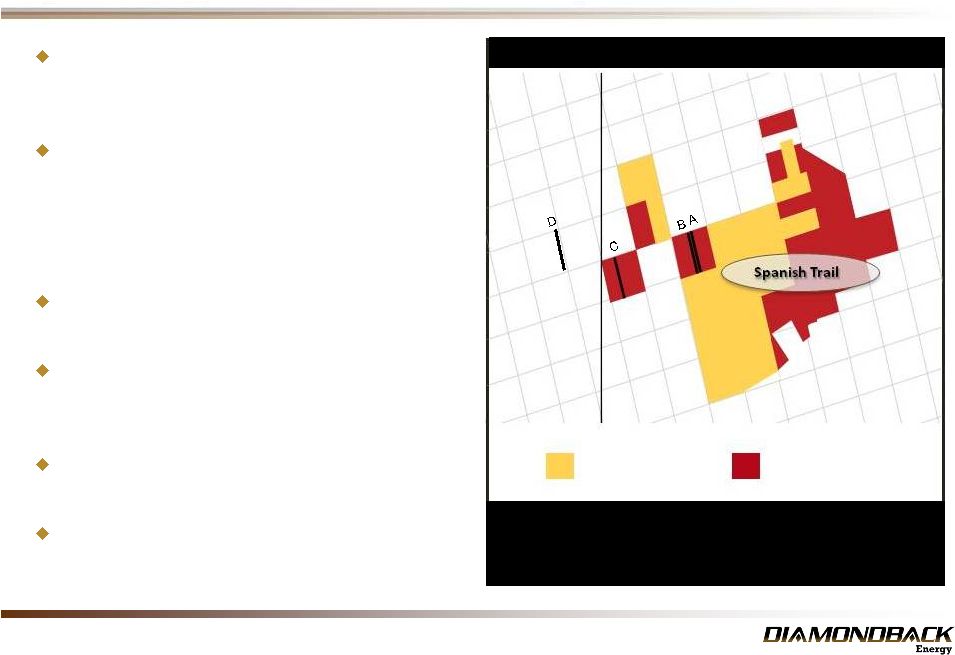 7 Two Dedicated Hz Drillers Diamondback Energy – Minerals Ownership Impact Completed the acquisition of mineral interests under ~15,000 gross (~12,500 net) acres in Midland County in September 2013 Diamondback receives an average ~20% royalty interest on all production from these ~15,000 gross acres¹ in Spanish Trail - Estimated net production of 2,100 BOEPD during January 2014 Free cash flow is expected to grow for the next several years No additional future capital or operating expenses required to receive run-rate cash flows Diamondback operates ~50% of the net acreage Anticipate will generate $70 – $80 MM of cash flow in 2014 2 FANG Operated Acreage (~7,500 Gross Acres) RSPP Operated Acreage (~7,500 Gross Acres) Midland Ector Source: Company filings, management data and estimates. (1) Standard Permian Basin royalty interest is 25% of revenue interest. Diamondback has acquired an average ~20% royalty interest (out of 25%) across the ~15,000 gross acres. Net revenue interest equals working interest multiplied by royalty interest. (2) Subject to numerous assumptions and risks. See the disclaimer at the beginning of this presentation. A. Kemmer 4210H Lower Spraberry B. Kemmer 4210WB Wolfcamp ‘B’ C. Sarah Ann 3814 Middle Spraberry D. Parks Bell 330LH Lower Spraberry |
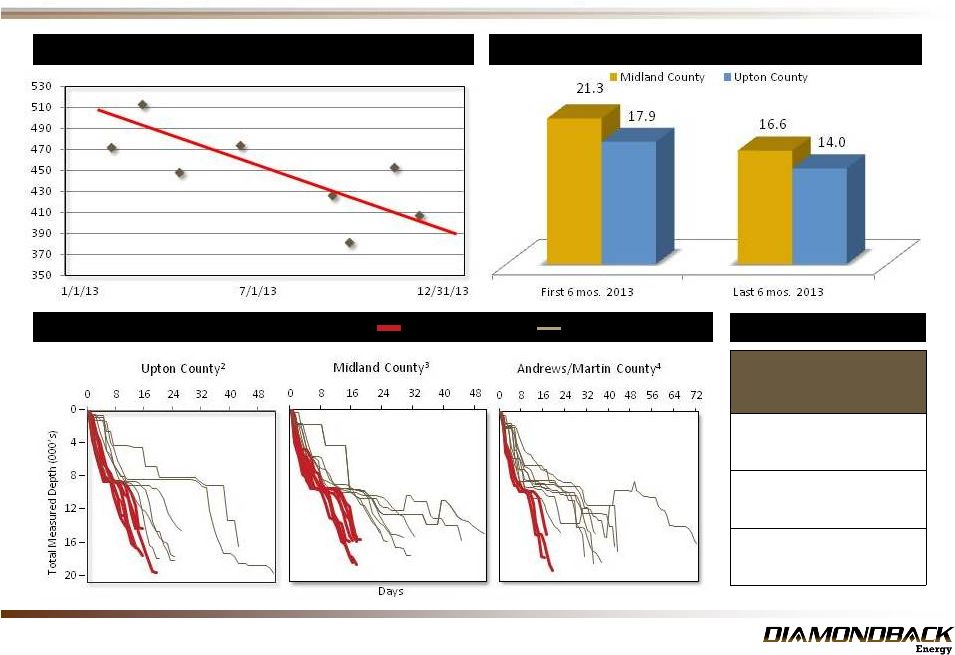 8 Days vs Depth Hz Diamondback Peers Spud to TD 1 (Days) Drilling $/Lateral Foot 1 (Midland County) Execution and Cost Structure – Peer Leading Performance Internal Records Lateral Length Days Cost $MM 5,000’ 11 $4.8 7,500’ 12 $5.9 10,000’ 17 $9.1 Source: Company filings, management data and estimates. (1) ~7,500’ laterals (2) Offset wells are from the following companies: CXO, PXD, CPE (3) Offset wells are from the following companies: RSPP, CPE, Henry Resources . (4) Offset wells are fromthe following companies: PXD, SM, and WTI |
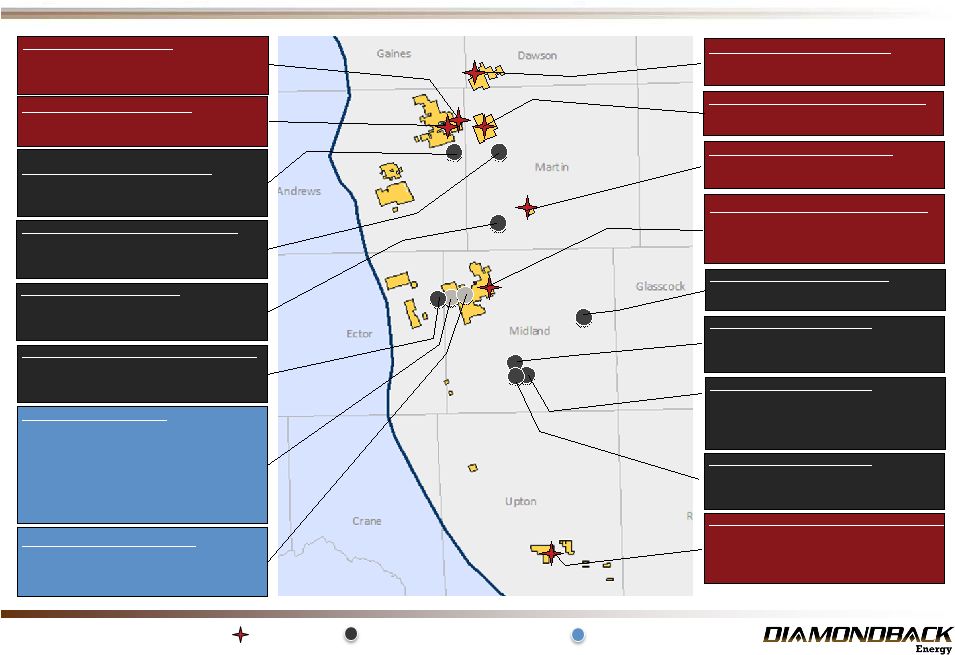 9 Diamondback Energy Acreage – Encouraging Results Represents Pioneer and other operator wells (Diamondback does not have any working interest in these wells) Source: Company and peer filings, management data and estimates Map locations are approximate. Midland Basin Central Basin Platform FANG - Mabee Breedlove 22-1H Wolfcamp B Flowback operations underway 8296’ Lateral Length PXD – University 7-43 10H Wolfcamp D 24-hr IP: 3,605 BOEPD ; ~74% oil 7,382’ lateral length PXD – Mabee K #1H Wolfcamp B 24-hr IP: 1,572 BOEPD Peak 30-day avg. rate: 1,040 BOEPD; ~76% oil 6,671’ lateral length RSPP/FANG Staggered Lateral Kemmer 4210H Lower Spraberry Peak 24-hr IP: 1,076 BOEPD ~ 91% oil Peak 30-day avg. rate: 955 BOEPD ~90% oil Kemmer 4210WB Wolfcamp B Peak 24-hr IP: 966 BOEPD ~89%oil Peak 30-day avg. rate: 657 BOEPD ~88% oil 5,043’ lateral length (both wells) RSPP – Parks Bell 3304 LS Lower Spraberry Shale Avg. 24-hr IP: 603 BOEPD Peak 30-day avg. rate: 547 BOEPD ~4,800’ lateral length RSPP/FANG Middle Spraberry Shale Sarah Ann 3814H Peak 24-hr IP: 733 BOEPD; 90% oil 5,041’ lateral length Peak 30-day avg. rate: 472 BOEPD ~78% oil PXD – DL Hutt C #2H Wolfcamp A 24-hr IP: 1,712 BOEPD Peak 30-day avg. rate: 1,107 BOEPD ~74% oil; 7,380’ lateral length FANG - Average Midland County Well Wolfcamp B Peak 24-hr IP: 899 BOEPD Peak 30-day rate on artificial lift: 650 BOEPD; ~88% oil ~5,591’ average lateral length PXD – DL Hutt C #1H Wolfcamp B Avg. 24-hr IP: 1,693 BOEPD Peak 30-day natural flow rate: 1,402 BOEPD; ~75% oil 7,380’ lateral length FANG - Average Upton County Well Wolfcamp B Peak 24-hr IP: 880 BOEPD Peak 30-day rate on artificial lift: 566 BOEPD; ~83% oil ~6,453’ avg. lateral length PXD – Scharbauer Ranch #201H Wolfcamp D 24-hr IP: 1,509 BOEPD Peak 30-day avg. rate: 662 BOEPD; ~60% oil 7,862’ lateral length PXD – DL Hutt C #4H Wolfcamp D 24-hr IP: 2,128 BOEPD Peak 30-day avg. rate: 856 BOEPD ~69% oil; 6,962’ lateral length PXD – E.T O’Daniel #2H Wolfcamp D Avg. 24-hr IP: 3,156 BOEPD ~69% oil 9,112’ lateral length FANG - Kent CSL A 17-1H Wolfcamp B Well drilled to 7,975’ lateral length Frac scheduled FANG - Nail Ranch 2601H Wolfcamp B Well drilled to ~5,000’ lateral length Frac scheduled Represents Diamondback well FANG - UL III 4-1H Wolfcamp B 24-hr IP: 613 BOEPD Peak 30-day avg. rate: 440 BOEPD; ~83% oil 4,051’ lateral length FANG - UL Mason #1H Wolfcamp B 7,500’ lateral length Drilling operations underway Diamondback non-op partner |
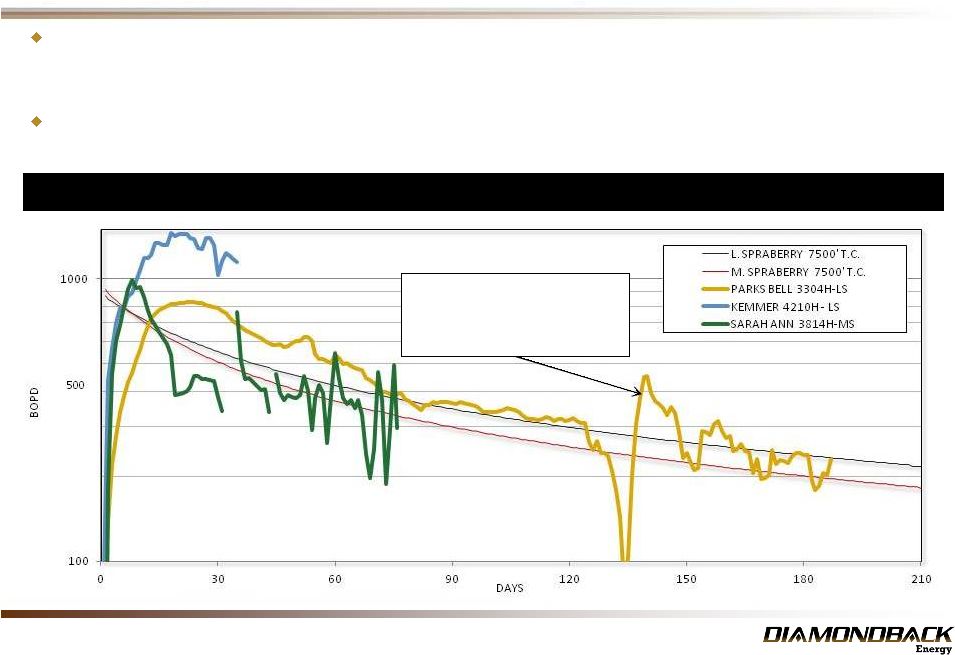 10 Midland County Lower and Middle Spraberry Results – Normalized to 7500’ Lateral Source: Company filings, management data and estimates. (1) As of February 1, 2014. Reflects averages only for actual periods of production. Spraberry Type Curve – Results Exceeding Expectations Lower Spraberry Type Curve is 650 MBOE (2 stream) with 81% oil (87% oil 1st year). 3 stream equivalent is 692 MBOE - Represents a 30% increase over previous EUR estimates and a 60% increase in PV10 - Type Curve is based on initial well. 2nd well (Kemmer 4210H) is significantly outperforming initial well Middle Spraberry Type Curve is 565 MBOE (2 stream) with 73% oil (82% oil 1st year). 3 stream equivalent is 617 MBOE - Represents a 13% increase over previous EUR estimates and a 27% increase in PV10 RSPP well in which Diamondback does not own an interest. Data was provided by RSPP for 4,814’completed lateral length (grossed up to an equivalent ~7,500’ lateral by Diamondback |
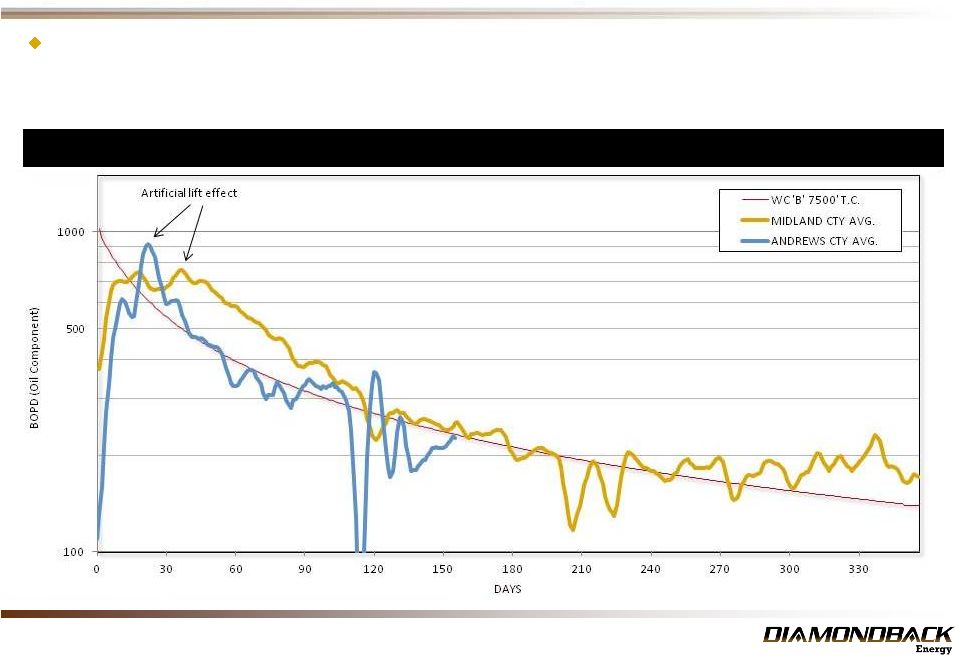 11 Type Curve is 638 MBOE (2 stream) with 74% oil (85% oil 1 year). 3 stream equivalent is 695 MBOE - Represents a 6% increase over previous EUR estimates and a 23% increase in PV10 - Oil portion of new type curve is a 10% increase over prior estimates Midland/Andrews County Type Curve (1) - Normalized to 7,500’ Lateral Wolfcamp B Type Curve – Positive Revisions to North Area Source: Company filings, management data and estimates. (1) As of February 1, 2014. Reflects averages only for actual periods of production. st |
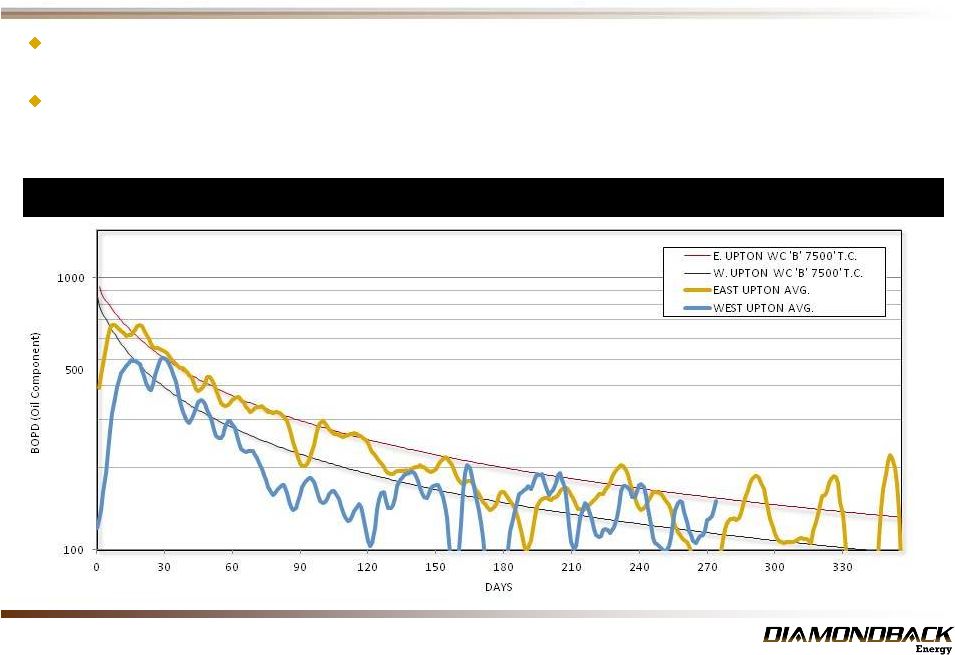 12 Wolfcamp B Type Curve – South Area Results Upton County Type Curve (1) - Normalized to 7,500’ Lateral East Upton Type Curve is 604 MBOE (2 stream), with 72% oil (80% oil 1 year). 3 stream equivalent is 671 MBOE - Represents no change to prior estimates West Upton Type Curve is 463 MBOE (2 stream), with 70% oil (78% oil 1 st year). 3 stream equivalent is 519 MBOE - Represents a 22% decrease to previous EUR estimates. - Projects are still economic and deliver a >30% ROR Source: Company filings, management data and estimates. (1) As of February 1, 2014. Reflects averages only for actual periods of production. st |
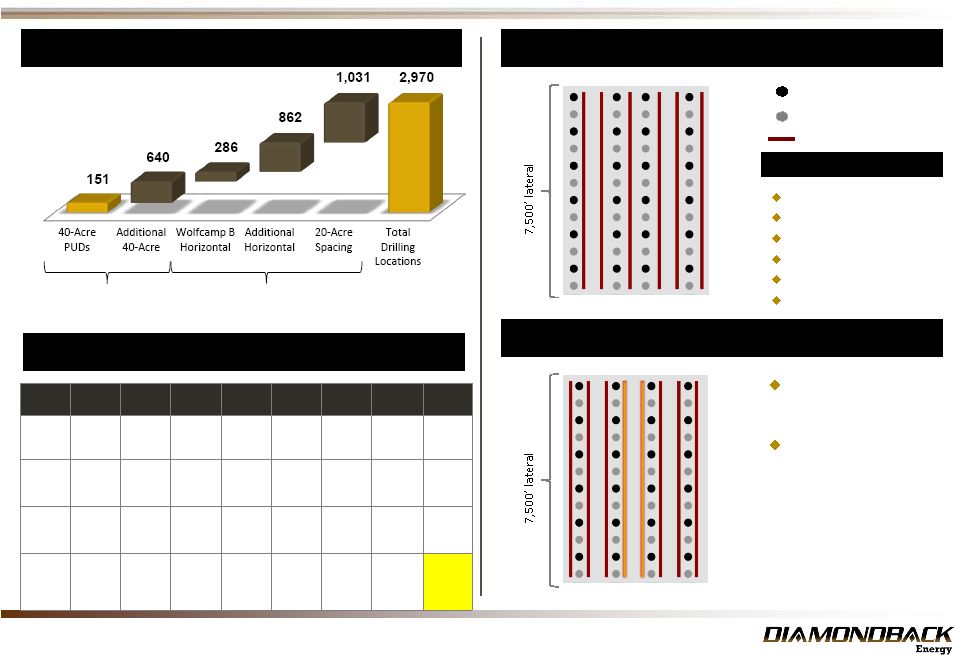 13 Multi-year Inventory Continues to Grow ~19% of 40-acre vertical locations booked as PUDs (1) Additional upside from horizontal locations (2) and vertical 20-acre locations Identified Net Potential Drilling Locations 160 Acre Hz Spacing Horizontal Resource Potential (excluding minerals) 40-acre spacing 20-acre infill spacing Horizontal (Wolfcamp B) Source:Company filings, management dataand estimates. Management estimatesasof December31,2013. (1)PUDs basedon Ryder Scottprepared estimates asof12/31/2013. (2) Twenty seven of the horizontallocationsare bookedas PUDs . (3) Laterallengths vary from ~5,000’ to10,00’ dependingon leasegeometry and other considerations (4) Aside from WolfcampB, EURsare based onmanagement estimatesbasedon wells drilledbyother operators. The Company’s results may varymaterially.All EUR estimatesare basedon 7,500’laterals. (5)Net potential assumingaverage 24% royaltyburden. Prospective Horizons: Horizontal Target Wolfcamp B Wolfcamp A Lower Spraberry Middle Spraberry Cline Clearfork Wolfcamp C Total Locations (gross / net) (3) 354/286 203/161 250/202 191/153 176/137 185/149 71/60 1430/1148 EUR / Well (MBOE) (4) 600 - 700 450 - 550 550-650 500 - 600 400 - 500 350 - 450 350 - 450 500 – 600 Average Lateral Length 6,460’ 6,190 6,210’ 6,220’ 6,130’ 6,300’ 6,100’ 6,270’ Resource Potential (MMboe) 122 50 76 53 38 38 15 393 (5) 120 Acre Hz Spacing Pilot test wells show no degradation in well performance 660’ test in Midland County ST NW 3602H and ST NW 3603H Clearfork Lower Spraberry Middle Spraberry Wolfcamp A, B and C Cline (Wolfcamp D) Atoka |
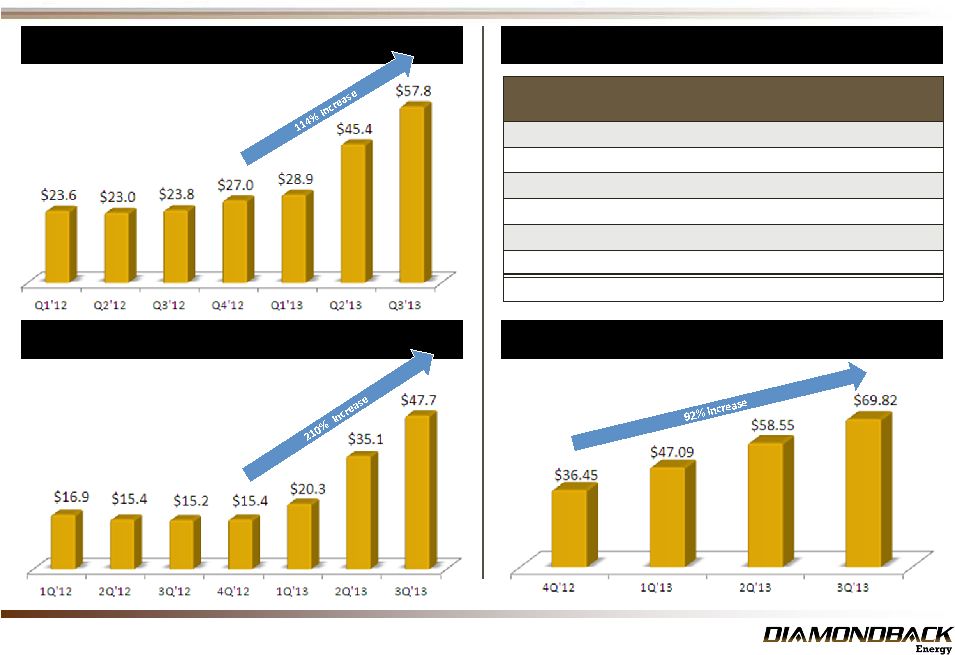 14 Diamondback Energy - Financial Summary EBITDA Growth 1 ($ in MMs) Revenue Growth 1 ($ in MMs) Source: Company filings, management data and estimates. (1) 2012 numbers reflect pro forma information of Diamondback and its subsidiaries and includes the Permian Basin interests of Gulfport as if those interests had been acquired by Diamondback on January 1, 2012. (2) Cash margin represents EBITDA/BOE production. Cash Margins 1 ($/BOE) (2) Hedging Oil Swaps 2014 Average Bbls Per Day Average Price Per Bbl First Quarter-LLS 2,311 $99.45 First Quarter-Brent 1,000 $109.70 Second Quarter-LLS 3,670 $98.86 Second Quarter-Brent 330 $109.70 Third Quarter-LLS 4,000 $97.64 Fourth Quarter-LLS 4,000 $97.64 2014 Average 3,830 $99.23 |
 15 Diamondback Energy - 2014 Capital Program 2014E Capital Expenditures Key Highlights Drilling Program 1 2014 capital budget fully financed based on current liquidity and cash flow Will generate additional liquidity throughout the year with expected growth in borrowing base over time 2014 budget 48% higher than 2013 Priorities are derisking & delineation 65-75 gross horizontal and 20-25 gross vertical wells planned for 2014 Average Hz lateral length (all wells) 6,660’ Expected cost range - $6.9 - $7.4MM for 7,500’ lateral horizontal well - $2.0 - $2.2MM for vertical wells $425-$475MM (1) As of October 23, 2013 Guidance |
 16 Diamondback Energy - 2014 Guidance Diamondback Excluding Minerals Minerals Diamondback Energy Total Net Production – MBoe/d 12.5 – 13.0 2.5 – 3.0 15.0 – 16.0 Unit costs ($/boe) Lease operating expenses 1 $7.00 - $8.00 $0.00 $6.00 - $7.00 G&A $2.50 - $3.50 $0.00 $2.00 - $3.00 DD&A $22.00-$24.00 $26.00-$28.00 $23.00 - $25.00 Production and Ad Val Taxes (% of Revenue) 2 7.0% 7.5% 7.1% $ - million Gross Horizontal Well Costs 3 $6.9 - $7.4 n/a $6.9 - $7.4 Horizontal Wells Drilled (net) 65-75 (52 – 60) n/a 65-75 (52 – 60) Gross Vertical Well Costs $2.0 - $2.2 n/a $2.0 - $2.2 Gross Vertical Wells Drilled (net) 20-25 (16 – 20) n/a 20-25 (16 – 20) Capital Expenditures $425 - $475 n/a $425 - $475 Net Interest expense n/a n/a $36.00 - $38.00 1 - 2013 guidance included ad-valorem taxes in lease operating expense. The Company has reclassified these taxes and these taxes will now be reported in production and ad valorem taxes. Corporate overhead, previously reported as indirect LOE, is now included as part of lease operating expenses. 2013 guidance has been adjusted to reflect this reclassification. 2 - Includes production taxes of 4.6% for crude oil and 7.5% for natural gas and NGLs and ad valorem taxes. 2013 guidance excluded estimated ad valorem taxes of $1.50/boe of lease operating expense. 3 - Assumes a 7,500’ average lateral length. |
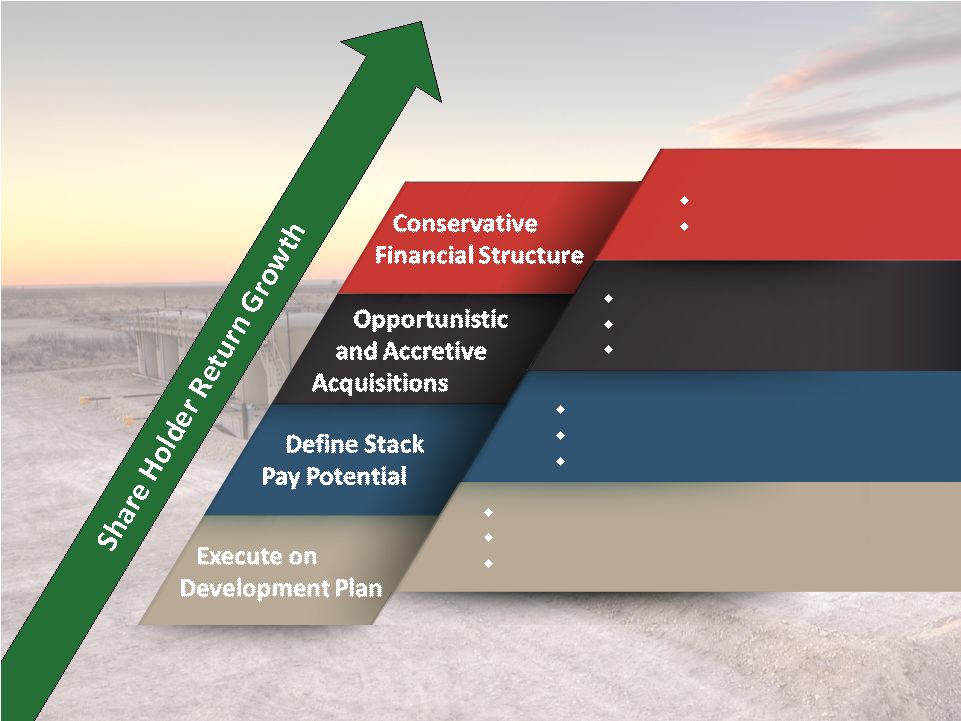 Continued D&C cost reduction Continued focus on cost structure (LOE & G&A) Aggressive development of minerals Additional testing in other shale benches Stacked laterals in multiple benches Increase inventory Complementary acreage additions Midland Basin focused Maintain operations excellence Efficient capital allocation Target Debt/EBITDA < 2X In Conclusion |
 18 APPENDIX |
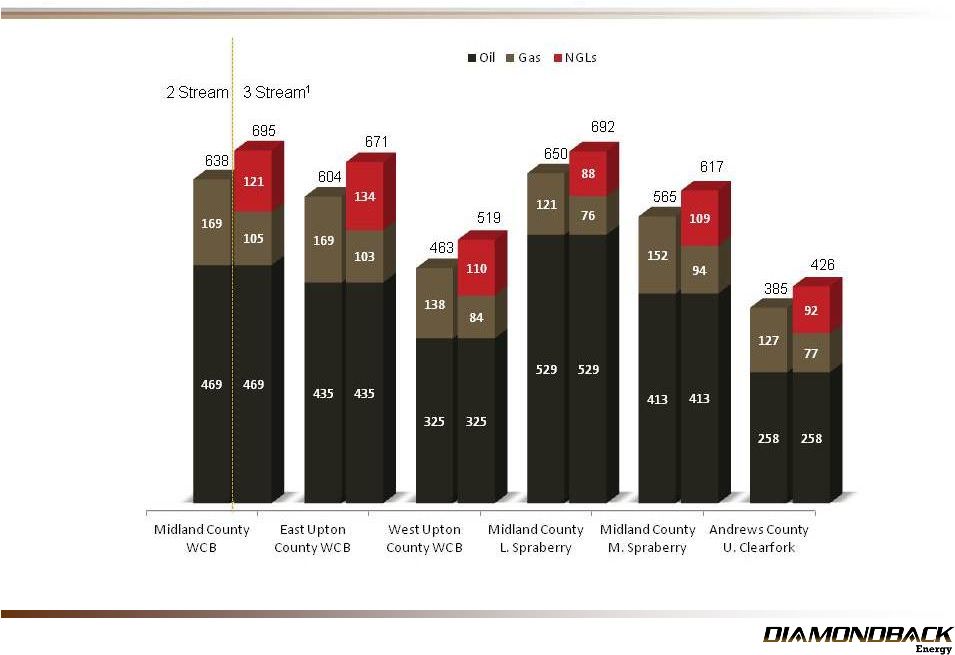 19 3 Stream Effect on EUR - MBOE (1) 3 stream volumes based on sales volumes after fuel, line loss and plant take. Midland County gas shrink = 38% and ngl yield = 120 bbl/MMcf. Andrews County shrink = 40% and yield = 120 bbl/MMcf. Upton County shrink = 39% and yield = 132 bbl/MMcf |