|
Free Writing Prospectus Filed pursuant to Rule 433 Registration No. 333-195495
Follow-on Offering
May 2014
|
Safe Harbor
The issuer has filed a registration statement (including a prospectus) with the SEC for the offering to which this communication relates. Before you invest, you should read the prospectus in that registration statement and other documents the issuer has filed with the SEC for more complete information about the issuer and this offering. You may get these documents for free by visiting EDGAR on the SEC Website at www.sec.gov. Alternatively, the issuer, any underwriter or any dealer participating in the offering will arrange to send you the prospectus if you request it by calling 1-866-805-4128.
Statements in this presentation, including the information set forth as to the future financial or operating performance of Atlas Financial Holdings, Inc., American Country Insurance Company, American Service Insurance Company and/or Gateway Insurance Company (collectively, “Atlas”), that are not current or historical factual statements may constitute “forward looking” information within the meaning of securities laws. Such forward looking statements involve known and unknown risks, uncertainties and other factors which may cause the actual results, performance or achievements of Atlas, or industry results, to be materially different from any future results, performance or achievements expressed or implied by such forward looking statements. When used in this presentation, such statements may include, among other terms, such words as “may,” “will,” “expect,” “believe,” “plan,” “anticipate,” “intend,” “estimate” and other similar terminology. These statements reflect current expectations, estimates and projections regarding future events and operating performance and speak only as to the date of this presentation. Readers should not place undue importance on forward looking statements and should not rely upon this information as of any other date. These forward looking statements involve a number of risks and uncertainties. Some of the factors facing Atlas that could cause actual results to differ materially from those expressed in or underlying such forward looking statements include: (i) market fluctuations, changes in interest rates or the need to generate liquidity; (ii) access to capital; (iii) recognition of future tax benefits on realized and unrealized investment losses; (iv) managing expansion effectively; (v) conditions affecting the industries in which we operate; (vi) competition from industry participants; (vii) attracting and retaining independent agents and brokers; (viii) comprehensive industry regulation; (ix) our holding company structure; (x) our ratings with A.M. Best; (xi) new claim and coverage issues; (xii) claims payments and related expenses; (xiii) reinsurance arrangements; (xiv) credit risk; (xv) our ability to retain key personnel; (xvi) our ability to replace or remove management or Directors; (xvii) future sales of common shares; (xviii) public company challenges; and (xix) failure to effectively execute our business plan. The foregoing list of factors is not exhaustive. See also “Risk Factors” listed in the Company’s most recent registration statement filed with the SEC. Many of these issues can affect Atlas’ actual results and could cause the actual results to differ materially from those expressed or implied in any forward looking statements made by, or on behalf of, Atlas. Readers are cautioned that forward looking statements are not guarantees of future performance, and should not place undue reliance on them. In formulating the forward looking statements contained in this presentation, it has been assumed that business and economic conditions affecting Atlas will continue substantially in the ordinary course. These assumptions, although considered reasonable at the time of preparation, may prove to be incorrect.
2
|
Offering Summary
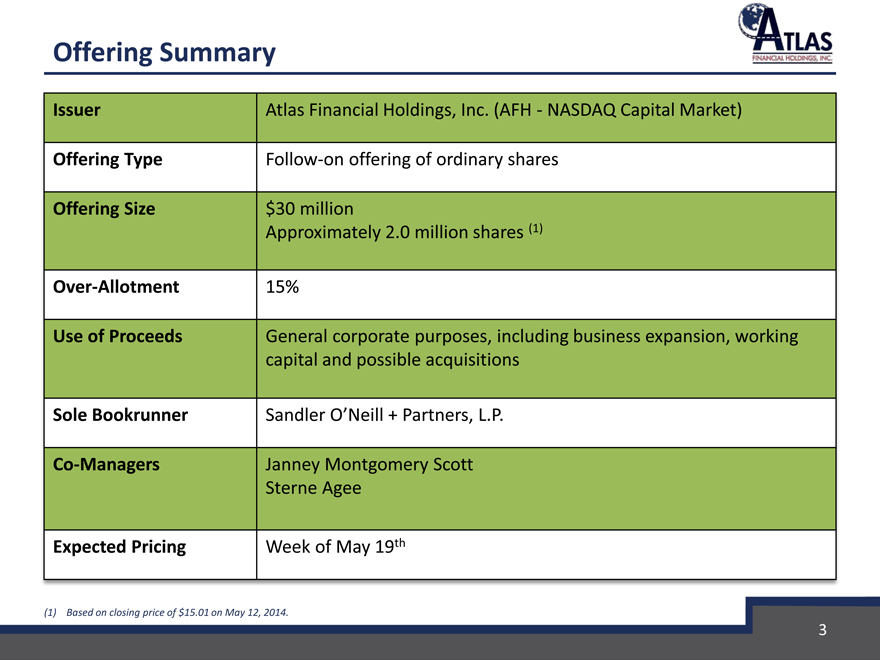
Issuer Atlas Financial Holdings, Inc. (AFH—NASDAQ Capital Market)
Offering Type Follow-on offering of ordinary shares
Offering Size $30 million
Approximately 2.0 million shares (1)
Over-Allotment 15%
Use of Proceeds General corporate purposes, including business expansion, working
capital and possible acquisitions
Sole Bookrunner Sandler O’Neill + Partners, L.P.
Co-Managers Janney Montgomery Scott
Sterne Agee
Expected Pricing Week of May 19th
(1) Based on closing price of $15.01 on May 12, 2014.
3
|
Atlas Overview
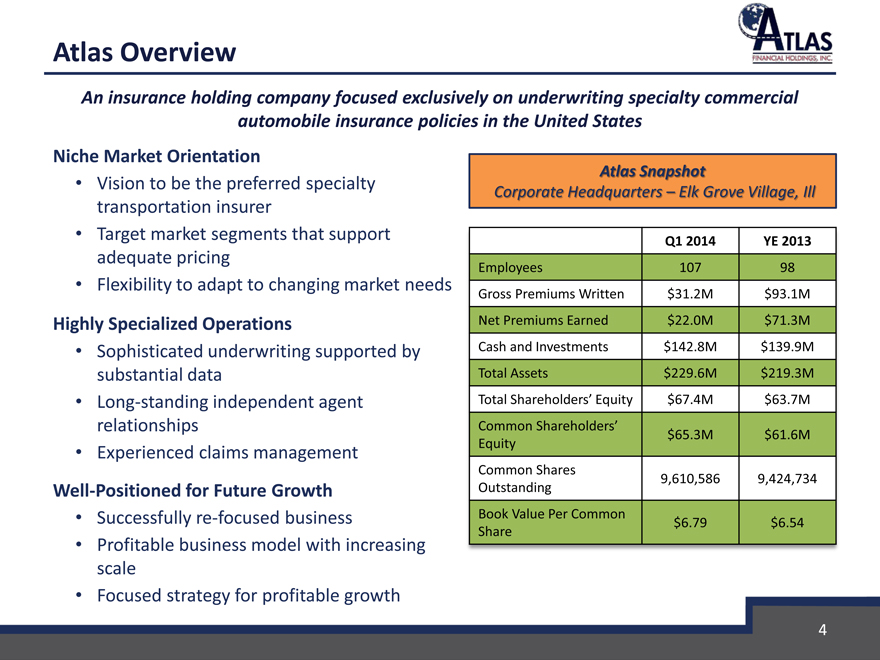
An insurance holding company focused exclusively on underwriting specialty commercial automobile insurance policies in the United States
Niche Market Orientation
Vision to be the preferred specialty transportation insurer
Target market segments that support adequate pricing
Flexibility to adapt to changing market needs
Highly Specialized Operations
Sophisticated underwriting supported by substantial data
Long-standing independent agent relationships
Experienced claims management
Well-Positioned for Future Growth
Successfully re-focused business
Profitable business model with increasing scale
Focused strategy for profitable growth
Atlas Snapshot
Corporate Headquarters – Elk Grove Village, Ill
Q1 2014 YE 2013
Employees 107 98
Gross Premiums Written $31.2M $93.1M
Net Premiums Earned $22.0M $71.3M
Cash and Investments $142.8M $139.9M
Total Assets $229.6M $219.3M
Total Shareholders’ Equity $67.4M $63.7M
Common Shareholders’ $65.3M $61.6M
Equity
Common Shares 9,610,586 9,424,734
Outstanding
Book Value Per Common $6.79 $6.54
Share
4
|
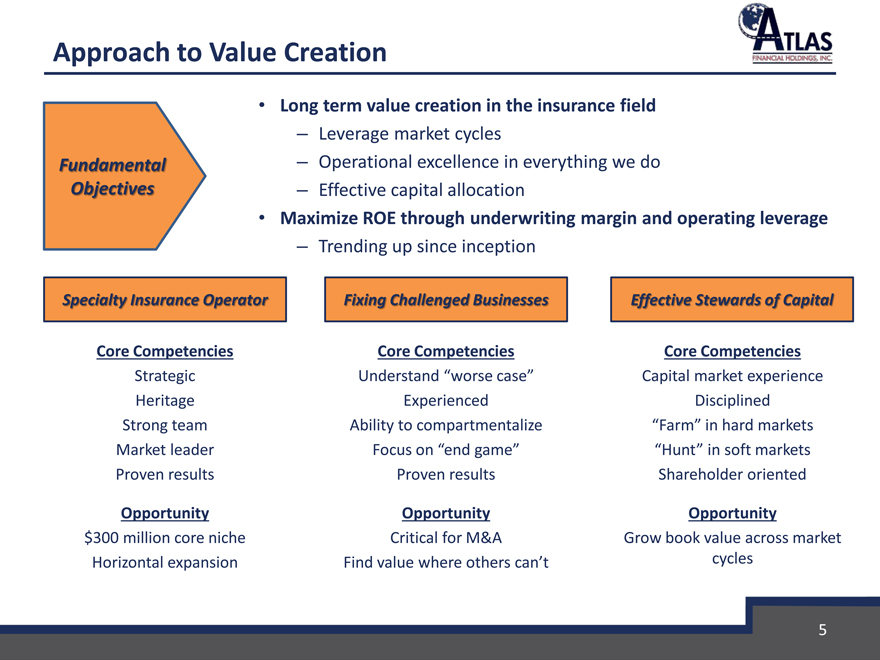
Approach to Value Creation
Long term value creation in the insurance field
– Leverage market cycles
Fundamental – Operational excellence in everything we do Objectives – Effective capital allocation
Maximize ROE through underwriting margin and operating leverage
– Trending up since inception
Specialty Insurance Operator Fixing Challenged Businesses Effective Stewards of Capital
Core Competencies Core Competencies Core Competencies
Strategic Understand “worse case” Capital market experience Heritage Experienced Disciplined Strong team Ability to compartmentalize “Farm” in hard markets Market leader Focus on “end game” “Hunt” in soft markets Proven results Proven results Shareholder oriented
Opportunity Opportunity Opportunity $300 million core niche Critical for M&A Grow book value across market Horizontal expansion Find value where others can’t cycles
5
|
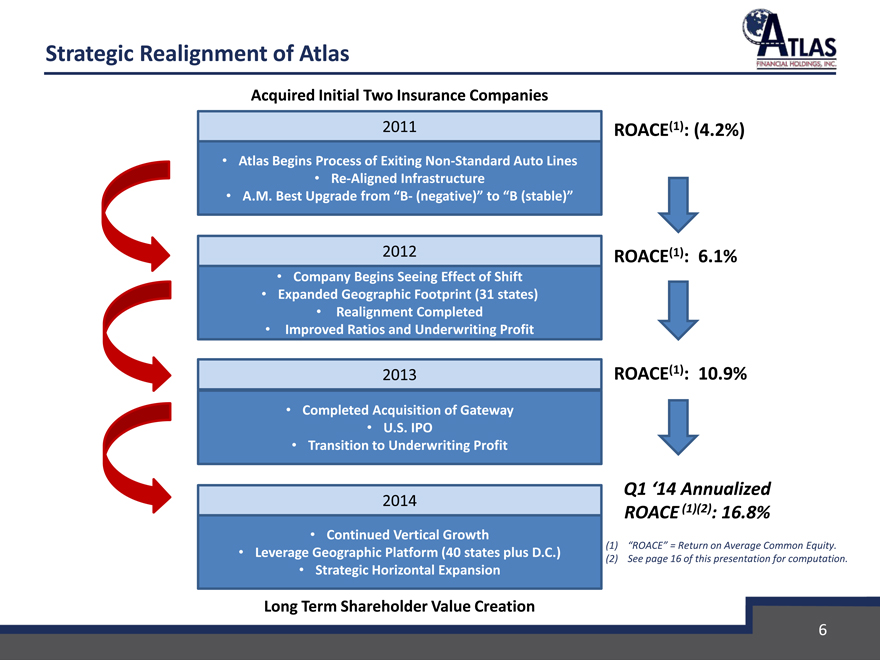
Strategic Realignment of Atlas
Acquired Initial Two Insurance Companies
2011 ROACE(1): (4.2%)
Atlas Begins Process of Exiting Non-Standard Auto Lines
Re-Aligned Infrastructure
A.M. Best Upgrade from “B- (negative)” to “B (stable)”
2012 ROACE(1): 6.1%
Company Begins Seeing Effect of Shift
Expanded Geographic Footprint (31 states)
Realignment Completed
Improved Ratios and Underwriting Profit
2013 ROACE(1): 10.9%
Completed Acquisition of Gateway
U.S. IPO
Transition to Underwriting Profit
Q1 ‘14 Annualized
2014
ROACE (1)(2): 16.8%
Continued Vertical Growth
Leverage Geographic Platform (40 states plus D.C.) (1) “ROACE” = Return on Average Common Equity.
(2) See page 16 of this presentation for computation.
Strategic Horizontal Expansion
Long Term Shareholder Value Creation
6
|
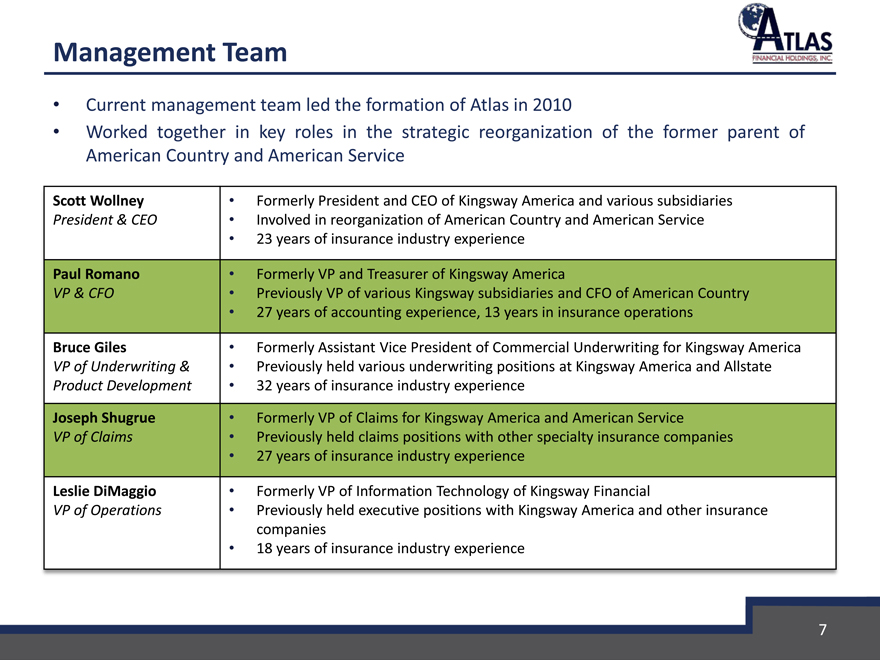
Management Team
Current management team led the formation of Atlas in 2010
Worked together in key roles in the strategic reorganization of the former parent of American Country and American Service
Scott Wollney
• Formerly President and CEO of Kingsway America and various subsidiaries President & CEO
• Involved in reorganization of American Country and American Service
23 years of insurance industry experience Paul Romano Formerly VP and Treasurer of Kingsway America
VP & CFO
• Previously VP of various Kingsway subsidiaries and CFO of American Country
27 years of accounting experience, 13 years in insurance operations
Bruce Giles
• Formerly Assistant Vice President of Commercial Underwriting for Kingsway America VP of Underwriting &
• Previously held various underwriting positions at Kingsway America and Allstate Product Development
• 32 years of insurance industry experience Joseph Shugrue
• Formerly VP of Claims for Kingsway America and American Service VP of Claims
• Previously held claims positions with other specialty insurance companies
27 years of insurance industry experience
Leslie DiMaggio
• Formerly VP of Information Technology of Kingsway Financial
VP of Operations
• Previously held executive positions with Kingsway America and other insurance companies
18 years of insurance industry experience
7
|
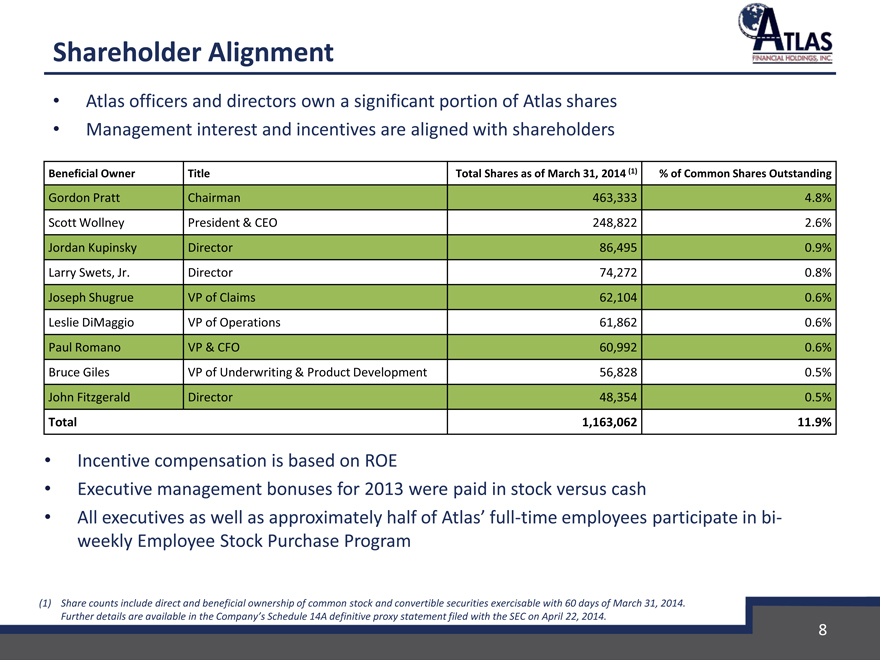
Shareholder Alignment
Atlas officers and directors own a significant portion of Atlas shares
Management interest and incentives are aligned with shareholders
Beneficial Owner Title Total Shares as of March 31, 2014 (1) % of Common Shares Outstanding
Gordon Pratt Chairman 463,333 4.8%
Scott Wollney President & CEO 248,822 2.6%
Jordan Kupinsky Director 86,495 0.9%
Larry Swets, Jr. Director 74,272 0.8%
Joseph Shugrue VP of Claims 62,104 0.6%
Leslie DiMaggio VP of Operations 61,862 0.6%
Paul Romano VP & CFO 60,992 0.6%
Bruce Giles VP of Underwriting & Product Development 56,828 0.5%
John Fitzgerald Director 48,354 0.5%
Total 1,163,062 11.9%
Incentive compensation is based on ROE
Executive management bonuses for 2013 were paid in stock versus cash
All executives as well as approximately half of Atlas’ full-time employees participate in bi-weekly Employee Stock Purchase Program
(1) Share counts include direct and beneficial ownership of common stock and convertible securities exercisable with 60 days of March 31, 2014. Further details are available in the Company’s Schedule 14A definitive proxy statement filed with the SEC on April 22, 2014.
8
|
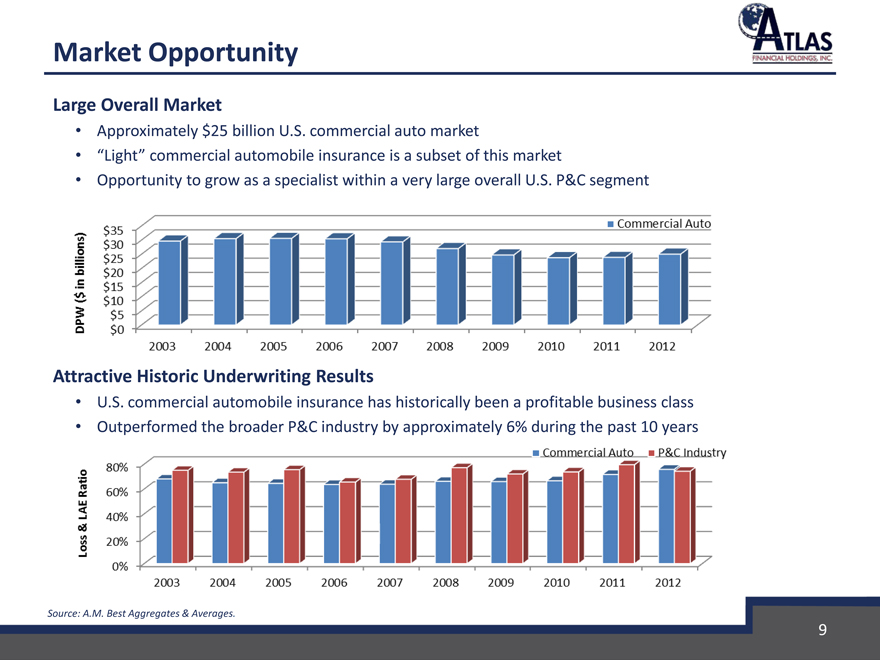
Market Opportunity
Large Overall Market
Approximately $25 billion U.S. commercial auto market
“Light” commercial automobile insurance is a subset of this market
Opportunity to grow as a specialist within a very large overall U.S. P&C segment
DPW ($ in billions)
2003 2004 2005 2006 2007 2008 2009 2010 2011 2012
$0 $5 $10 $15 $20 $25 $30 $35
Commercial Auto
Attractive Historic Underwriting Results
U.S. commercial automobile insurance has historically been a profitable business class
Outperformed the broader P&C industry by approximately 6% during the past 10 years
Loss & LAE Ratio
0% 20% 40% 60% 80%
2003 2004 2005 2006 2007 2008 2009 2010 2011 2012
Commercial Auto P&C Industry
Source: A.M. Best Aggregates & Averages.
9
|
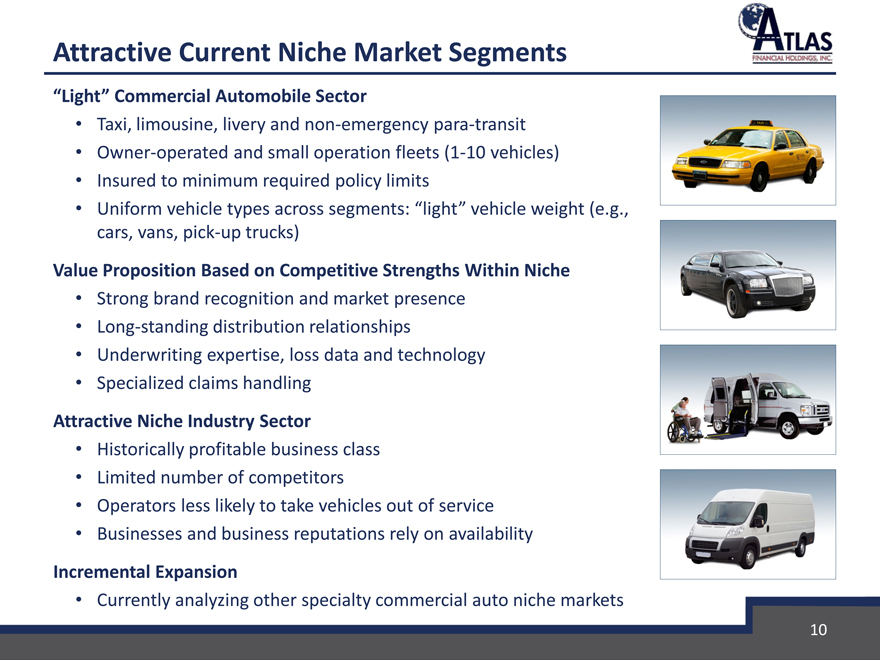
Attractive Current Niche Market Segments
“Light” Commercial Automobile Sector
Taxi, limousine, livery and non-emergency para-transit
Owner-operated and small operation fleets (1-10 vehicles)
Insured to minimum required policy limits
Uniform vehicle types across segments: “light” vehicle weight (e.g., cars, vans, pick-up trucks)
Value Proposition Based on Competitive Strengths Within Niche
Strong brand recognition and market presence
Long-standing distribution relationships
Underwriting expertise, loss data and technology
Specialized claims handling
Attractive Niche Industry Sector
Historically profitable business class
Limited number of competitors
Operators less likely to take vehicles out of service
Businesses and business reputations rely on availability
Incremental Expansion
Currently analyzing other specialty commercial auto niche markets
10
|
Strong Distribution Relationships
Distribution Channel Cultivated Over Many Years
In-force business has more than doubled in the past year
Volume of applications continues to accelerate
Strong Brand Recognition
Accelerates development of new distribution relationships in target markets
American Country: one of the oldest taxi insurers in the U.S., with roots dating back to 1925
American Service: commenced operations in 1983
Gateway Insurance Company: predecessor founded in 1946
Diversified Agent Network
2-5 strategic “cornerstone” partnerships in each state
Focus on Specialty Commercial Products
Significant marketing and advertising with a focus on brand recognition, value proposition and commitment to specialty commercial auto and related lines
Discontinued all non-core lines of business
– Florida personal auto in 2008
– MGA insurance programs in 2008 & 2009
– Private passenger non-standard auto in 2011
11
|
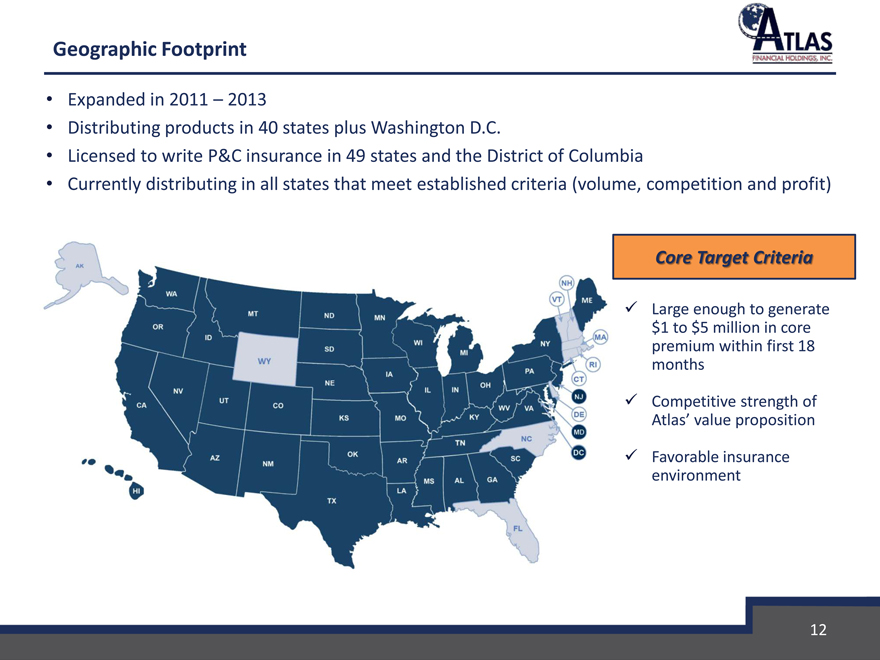
Geographic Footprint
Expanded in 2011 – 2013
Distributing products in 40 states plus Washington D.C.
Licensed to write P&C insurance in 49 states and the District of Columbia
Currently distributing in all states that meet established criteria (volume, competition and profit)
Core Target Criteria
Large enough to generate $1 to $5 million in core premium within first 18 months Competitive strength of Atlas’ value proposition Favorable insurance environment
12
|
Underwriting Expertise
Experienced
Underwriters average over 10 years of individual experience with a commitment to commercial auto insurance
Rich history and trusted brands
Deep data repository
Knowledgeable
Understanding of complex business processes and local protocols with extensive knowledge of municipal, state and federal requirements
Ability to identify profitable risks and set price to generate underwriting profits
Technology Initiatives
Predictive Underwriting Model - Data mining tool currently being deployed is expected to further enhance risk selection and improve underwriting results
Point-of-Sale System - Underwriting interface, easy to use and data feeds directly into system; works in conjunction with traditional rate filings and predictive model
Existing infrastructure will support POS submission and policy delivery in the future
Resources
Access to large universe of data from a much larger book of business, ensuring accurate pricing in target markets and ease of entry into new markets
Agent and policyholder services to support regulatory and operating requirements
13
|
Specialized Claims Handling
Knowledgeable and Geographically Dispersed Network of Adjusters
Employees located in key markets (Chicago, New York, St. Louis, and other strategic locations)
Large network of independent appraisers and other experienced vendors located in smaller markets (long-standing relationships)
Focus on Customer Priorities
Importance of processing claims quickly to repair and return vehicles back into service
Emphasis on driver training and, when applicable, support during claim process
In-depth Understanding of Insured Assets
Commercial vehicles
Special equipment
Customer business priorities
Risk management practices
Well-established Infrastructure and Long-standing Relationships
Allows for increased control over loss adjustment costs and fraud avoidance
Commitment to being an industry leading resource
14
|
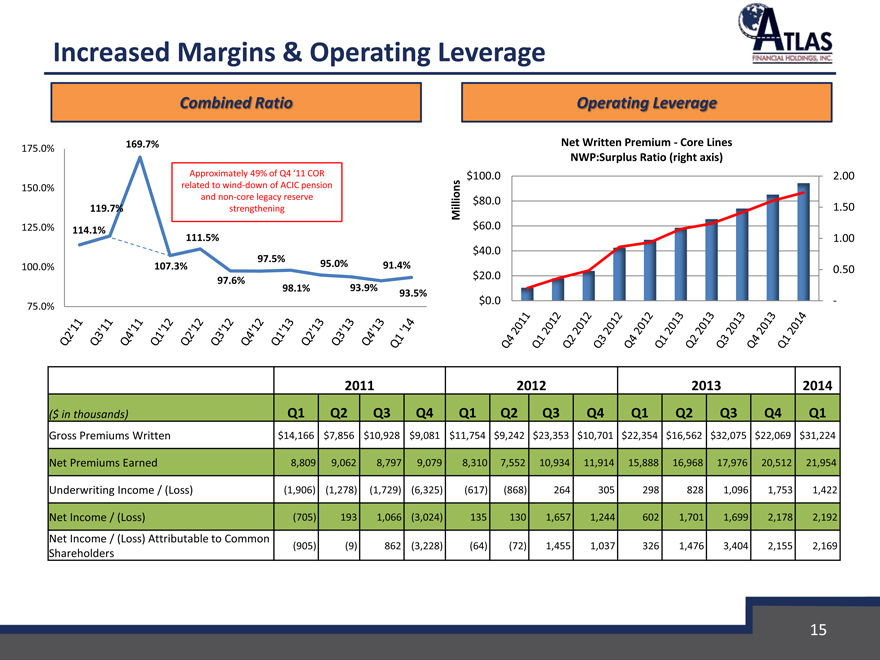
Increased Margins & Operating Leverage
Combined Ratio
175.0% 169.7%
Approximately 49% of Q4 ‘11 COR 150.0% related to wind-down of ACIC pension and non-core legacy reserve 119.7% strengthening
125.0% 114.1% 111.5%
97.5% 95.0%
100.0% 107.3% 91.4% 97.6% 98.1% 93.9% 93.5%
75.0%
Q2’11 Q3’11 Q4’11 Q1’12 Q2’12 Q3’12 Q4’12 Q1’13 Q2’13 Q3’13 Q4’13 Q1’14
Operating Leverage
Net Written Premium - Core Lines NWP:Surplus Ratio (right axis) $100.0 2.00 $80.0
Millions 1.50 $60.0
1.00 $40.0
0.50 $20.0
$0.0 -
Q4 2011 Q1 2012 Q2 2012 Q3 2012 Q4 2012 Q1 2013 Q2 2013 Q3 2013 Q4 2013 Q1 2014
2011 2012 2013 2014
($ in thousands) Q1 Q2 Q3 Q4 Q1 Q2 Q3 Q4 Q1 Q2 Q3 Q4 Q1
Gross Premiums Written $14,166 $7,856 $10,928 $9,081 $11,754 $9,242 $23,353 $10,701 $22,354 $16,562 $32,075 $22,069 $31,224
Net Premiums Earned 8,809 9,062 8,797 9,079 8,310 7,552 10,934 11,914 15,888 16,968 17,976 20,512 21,954
Underwriting Income / (Loss) (1,906) (1,278) (1,729) (6,325) (617) (868) 264 305 298 828 1,096 1,753 1,422
Net Income / (Loss) (705) 193 1,066 (3,024) 135 130 1,657 1,244 602 1,701 1,699 2,178 2,192
Net Income / (Loss) Attributable to Common
Shareholders (905) (9) 862 (3,228) (64) (72) 1,455 1,037 326 1,476 3,404 2,155 2,169
15
|
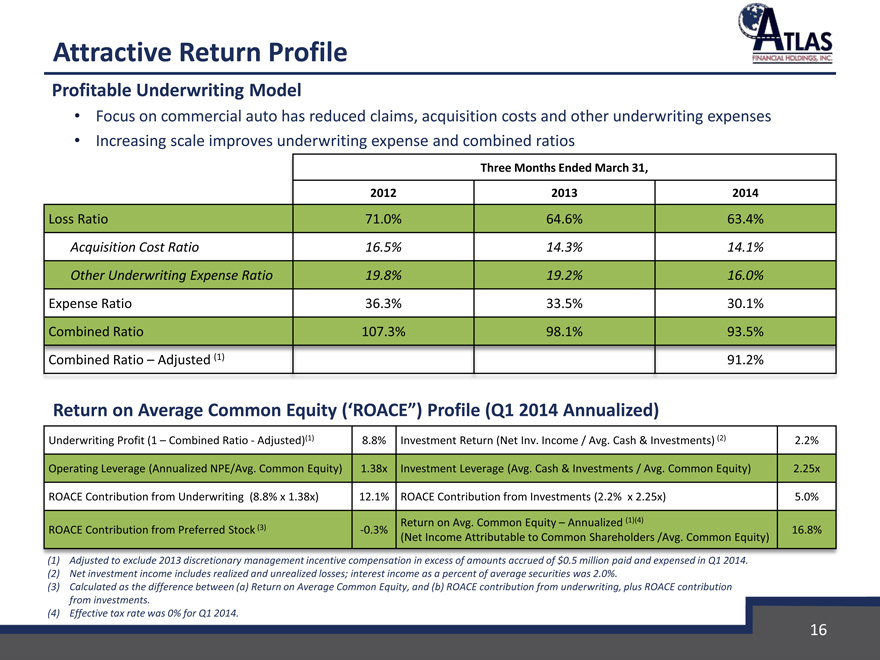
Attractive Return Profile
Profitable Underwriting Model
Focus on commercial auto has reduced claims, acquisition costs and other underwriting expenses
Increasing scale improves underwriting expense and combined ratios
Three Months Ended March 31,
2012 2013 2014
Loss Ratio 71.0% 64.6% 63.4%
Acquisition Cost Ratio 16.5% 14.3% 14.1%
Other Underwriting Expense Ratio 19.8% 19.2% 16.0%
Expense Ratio 36.3% 33.5% 30.1%
Combined Ratio 107.3% 98.1% 93.5%
Combined Ratio – Adjusted (1) 91.2%
Return on Average Common Equity (‘ROACE”) Profile (Q1 2014 Annualized)
Underwriting Profit (1 – Combined Ratio—Adjusted)(1) 8.8% Investment Return (Net Inv. Income / Avg. Cash & Investments) (2) 2.2%
Operating Leverage (Annualized NPE/Avg. Common Equity) 1.38x Investment Leverage (Avg. Cash & Investments / Avg. Common Equity) 2.25x
ROACE Contribution from Underwriting (8.8% x 1.38x) 12.1% ROACE Contribution from Investments (2.2% x 2.25x) 5.0%
Return on Avg. Common Equity – Annualized (1)(4)
ROACE Contribution from Preferred Stock (3) -0.3% 16.8%
(Net Income Attributable to Common Shareholders /Avg. Common Equity)
(1) Adjusted to exclude 2013 discretionary management incentive compensation in excess of amounts accrued of $0.5 million paid and expensed in Q1 2014. (2) Net investment income includes realized and unrealized losses; interest income as a percent of average securities was 2.0%.
(3) Calculated as the difference between (a) Return on Average Common Equity, and (b) ROACE contribution from underwriting, plus ROACE contribution from investments.
(4) Effective tax rate was 0% for Q1 2014.
16
|
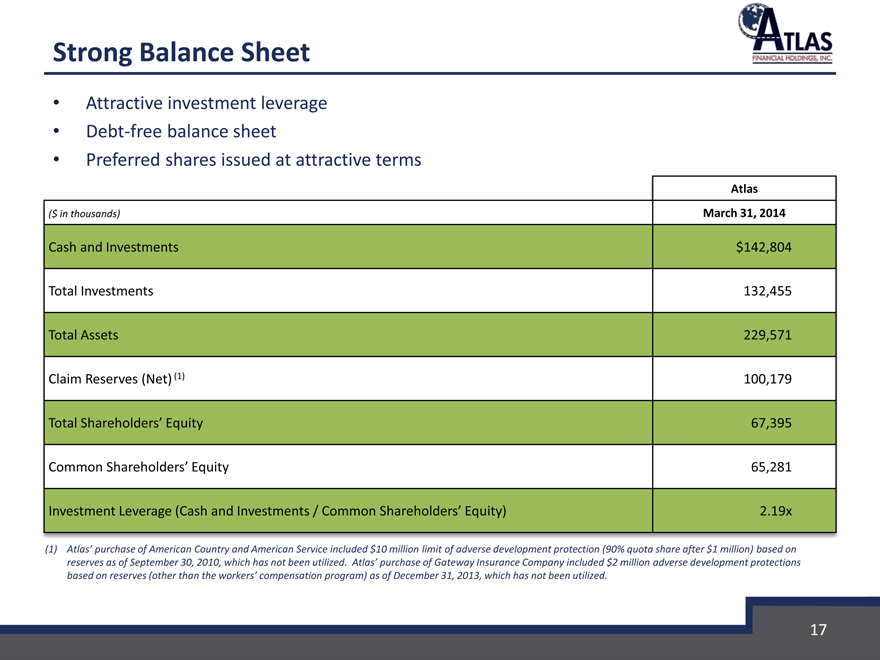
Strong Balance Sheet
Attractive investment leverage
Debt-free balance sheet
Preferred shares issued at attractive terms
Atlas
($ in thousands) March 31, 2014
Cash and Investments $142,804
Total Investments 132,455
Total Assets 229,571
Claim Reserves (Net) (1) 100,179
Total Shareholders’ Equity 67,395
Common Shareholders’ Equity 65,281
Investment Leverage (Cash and Investments / Common Shareholders’ Equity) 2.19x
(1) Atlas’ purchase of American Country and American Service included $10 million limit of adverse development protection (90% quota share after $1 million) based on reserves as of September 30, 2010, which has not been utilized. Atlas’ purchase of Gateway Insurance Company included $2 million adverse development protections based on reserves (other than the workers’ compensation program) as of December 31, 2013, which has not been utilized.
17
|
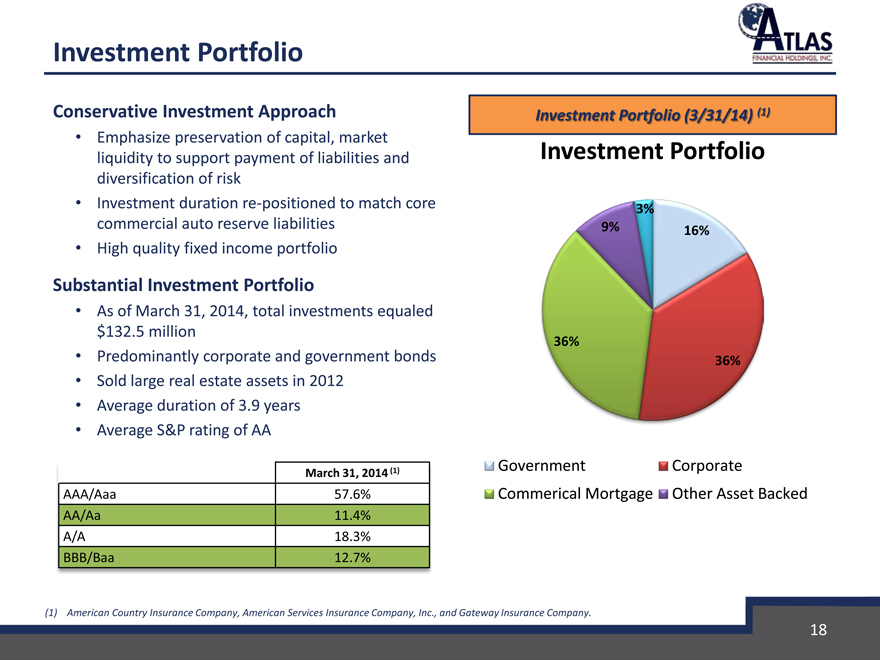
Investment Portfolio
Conservative Investment Approach
Emphasize preservation of capital, market liquidity to support payment of liabilities and diversification of risk
Investment duration re-positioned to match core commercial auto reserve liabilities
High quality fixed income portfolio
Substantial Investment Portfolio
As of March 31, 2014, total investments equaled $132.5 million
Predominantly corporate and government bonds
Sold large real estate assets in 2012
Average duration of 3.9 years
Average S&P rating of AA
Investment Portfolio (3/31/14) (1)
Investment Portfolio
3%
9% 16%
36%
36%
Government Corporate
Commerical Mortgage Other Asset Backed
March 31, 2014 (1)
AAA/Aaa 57.6%
AA/Aa 11.4%
A/A 18.3%
BBB/Baa 12.7%
(1) American Country Insurance Company, American Services Insurance Company, Inc., and Gateway Insurance Company.
18
|
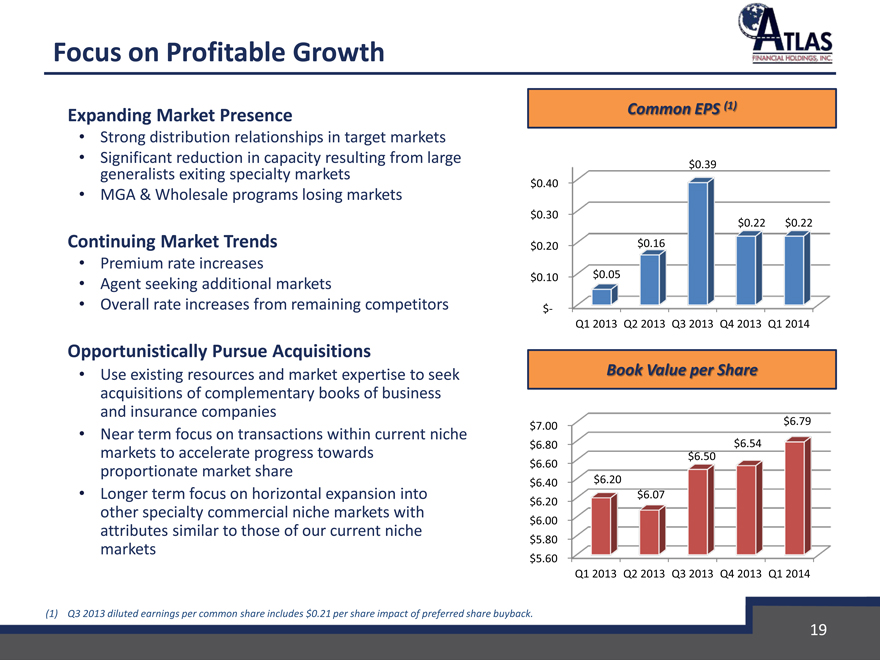
Focus on Profitable Growth
Expanding Market Presence
Strong distribution relationships in target markets
Significant generalists reduction exiting specialty in capacity markets resulting from large
MGA & Wholesale programs losing markets
Continuing Market Trends
Premium rate increases
Agent seeking additional markets
Overall rate increases from remaining competitors
Opportunistically Pursue Acquisitions
Use existing resources and market expertise to seek acquisitions of complementary books of business and insurance companies
Near term focus on transactions within current niche markets to accelerate progress towards proportionate market share
Longer term focus on horizontal expansion into other specialty commercial niche markets with attributes similar to those of our current niche markets
Common EPS (1)
$0.39
$0.40
$0.30
$0.22 $0.22
$0.20 $0.16
$0.10 $0.05
$-
Q1 2013 Q2 2013 Q3 2013 Q4 2013 Q1 2014
Book Value per Share
$7.00 $6.79
$6.80 $6.54
$6.50
$6.60
$6.40 $6.20
$6.07
$6.20
$6.00
$5.80
$5.60
Q1 2013 Q2 2013 Q3 2013 Q4 2013 Q1 2014
(1) Q3 2013 diluted earnings per common share includes $0.21 per share impact of preferred share buyback.
19
|
Investment Highlights
Niche Market Focus
Favorable market dynamics
Strong brands and deep distribution relationships
Specialized underwriting and claims handling expertise
Strong Financial Return Profile
Profitable underwriting model
Efficient operating structure
Substantial investment leverage
Scalable Operations Positioned for Growth
Re-establishing legacy agent relationships
Expanding market presence
Complementary acquisition opportunities
Entrepreneurial, Committed and Experienced Management Team
Leveraging core competencies
Interests aligned with shareholders
Attractive Outlook
Completed realignment to core focus
Recently expanded market footprint
20