
Third Quarter 2014 Conference Call November 11, 2014
Statements in this presentation, including the information set forth as to the future financial or operating performance of Atlas Financial Holdings, Inc., American Country Insurance Company, American Service Insurance Company and/or Gateway Insurance Company (collectively, “Atlas”), that are not current or historical factual statements may constitute “forward looking” information within the meaning of securities laws. Such forward looking statements involve known and unknown risks, uncertainties and other factors which may cause the actual results, performance or achievements of Atlas, or industry results, to be materially different from any future results, performance or achievements expressed or implied by such forward looking statements. When used in this presentation, such statements may include, among other terms, such words as “may,” “will,” “expect,” “believe,” “plan,” “anticipate,” “intend,” “estimate” and other similar terminology. These statements reflect current expectations, estimates and projections regarding future events and operating performance and speak only as to the date of this presentation. Readers should not place undue importance on forward looking statements and should not rely upon this information as of any other date. These forward looking statements involve a number of risks and uncertainties. Some of the factors facing Atlas that could cause actual results to differ materially from those expressed in or underlying such forward looking statements include: (i) market fluctuations, changes in interest rates or the need to generate liquidity; (ii) access to capital; (iii) recognition of future tax benefits on realized and unrealized investment losses; (iv) managing expansion effectively; (v) conditions affecting the industries in which we operate; (vi) competition from industry participants; (vii) attracting and retaining independent agents and brokers; (viii) comprehensive industry regulation; (ix) our holding company structure; (x) our ratings with A.M. Best; (xi) new claim and coverage issues; (xii) claims payments and related expenses; (xiii) reinsurance arrangements; (xiv) credit risk; (xv) our ability to retain key personnel; (xvi) our ability to replace or remove management or Directors; (xvii) future sales of common shares; (xviii) public company challenges; and (xix) failure to effectively execute our business plan. The foregoing list of factors is not exhaustive. See also “Risk Factors” listed in the Company’s most recent registration statement filed with the SEC. Many of these issues can affect Atlas’ actual results and could cause the actual results to differ materially from those expressed or implied in any forward looking statements made by, or on behalf of, Atlas. Readers are cautioned that forward looking statements are not guarantees of future performance, and should not place undue reliance on them. In formulating the forward looking statements contained in this presentation, it has been assumed that business and economic conditions affecting Atlas will continue substantially in the ordinary course. These assumptions, although considered reasonable at the time of preparation, may prove to be incorrect. When discussing our business operations, we may use certain terms of art which are not defined under U.S. GAAP. In the event of any unintentional difference between presentation materials and our GAAP results, investors should rely on the financial information in our public filings. Safe Harbor 2

Atlas Snapshot 3 NASDAQ: AFH (at 9/30/2014) Corporate Headquarters Elk Grove Village, IL (Chicago suburb) Subsidiaries / Brands (see below) American Country American Service Gateway (including Alano) Core Target Markets Taxi / Limo / Paratransit Cash and Investments $179.1 million Total Assets $274.3 million Total Shareholders’ Equity $99.5 million Common Shares Outstanding 11.8 million Book Value Per Common Share $8.24
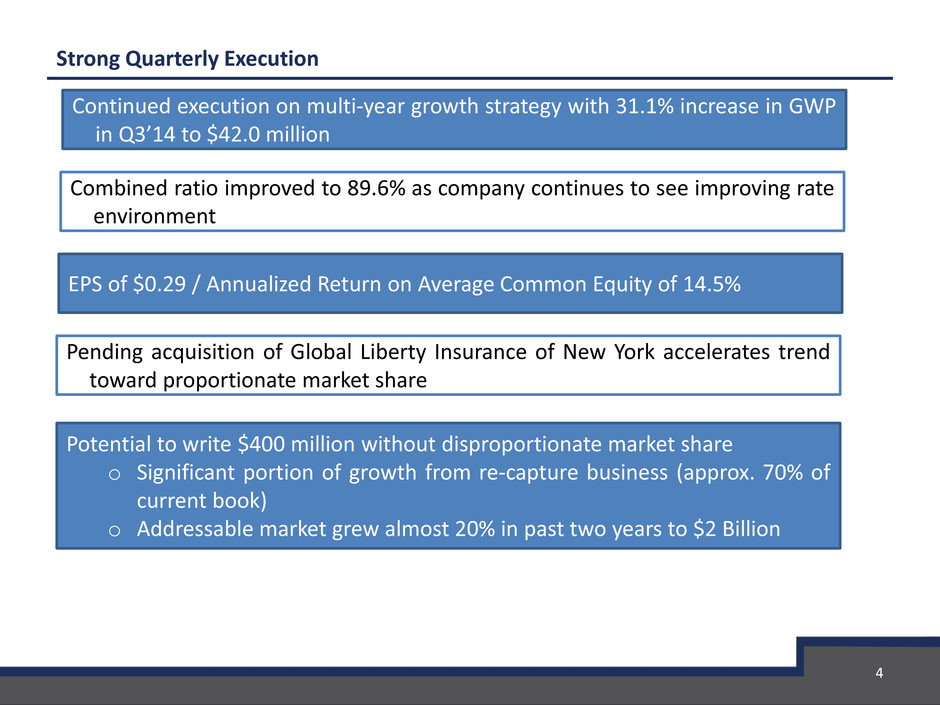
Strong Quarterly Execution 4 Continued execution on multi-year growth strategy with 31.1% increase in GWP in Q3’14 to $42.0 million Combined ratio improved to 89.6% as company continues to see improving rate environment EPS of $0.29 / Annualized Return on Average Common Equity of 14.5% Pending acquisition of Global Liberty Insurance of New York accelerates trend toward proportionate market share Potential to write $400 million without disproportionate market share o Significant portion of growth from re-capture business (approx. 70% of current book) o Addressable market grew almost 20% in past two years to $2 Billion
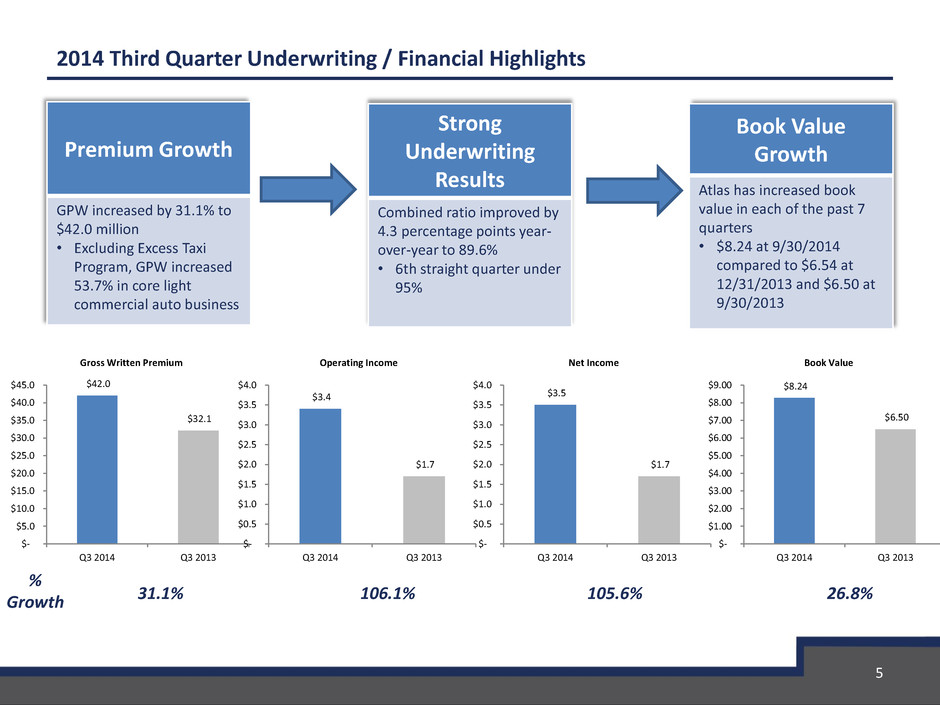
5 Premium Growth GPW increased by 31.1% to $42.0 million • Excluding Excess Taxi Program, GPW increased 53.7% in core light commercial auto business Strong Underwriting Results Combined ratio improved by 4.3 percentage points year- over-year to 89.6% • 6th straight quarter under 95% Book Value Growth Atlas has increased book value in each of the past 7 quarters • $8.24 at 9/30/2014 compared to $6.54 at 12/31/2013 and $6.50 at 9/30/2013 % Growth 31.1% 106.1% 105.6% 26.8% 2014 Third Quarter Underwriting / Financial Highlights $42.0 $32.1 $- $5.0 $10.0 $15.0 $20.0 $25.0 $30.0 $35.0 $40.0 $45.0 Q3 2014 Q3 2013 Gross Written Premium $3.4 $1.7 $- $0.5 $1.0 $1.5 $2.0 $2.5 $3.0 $3.5 $4.0 Q3 2014 Q3 2013 Operating Income $3.5 $1.7 $- $0.5 $1.0 $1.5 $2.0 $2.5 $3.0 $3.5 $4.0 Q3 2014 Q3 2013 Net Income $8.24 $6.50 $- $1.00 $2.00 $3.00 $4.00 $5.00 $6.00 $7.00 $8.00 $9.00 Q3 2014 Q3 2013 Book Value

Considerable Underwriting Margin Improvement Since 2013 U.S. IPO 6 Combined Operating Ratio (“COR”) 98.1% 95.0% 93.9% 91.4% 93.5% 91.9% 89.6% 84.0% 86.0% 88.0% 90.0% 92.0% 94.0% 96.0% 98.0% 100.0% Q1 2013 Q2 2013 Q3 2013 Q4 2013 Q1 2014 Q2 2014 Q3 2014
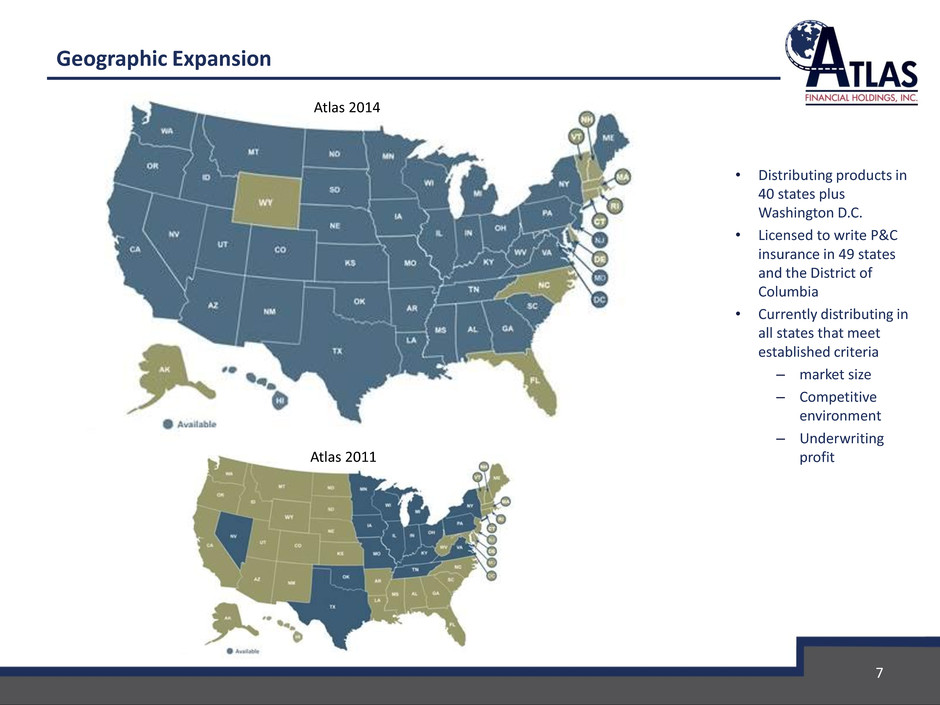
Geographic Expansion • Distributing products in 40 states plus Washington D.C. • Licensed to write P&C insurance in 49 states and the District of Columbia • Currently distributing in all states that meet established criteria – market size – Competitive environment – Underwriting profit 7 Atlas 2011 Atlas 2014
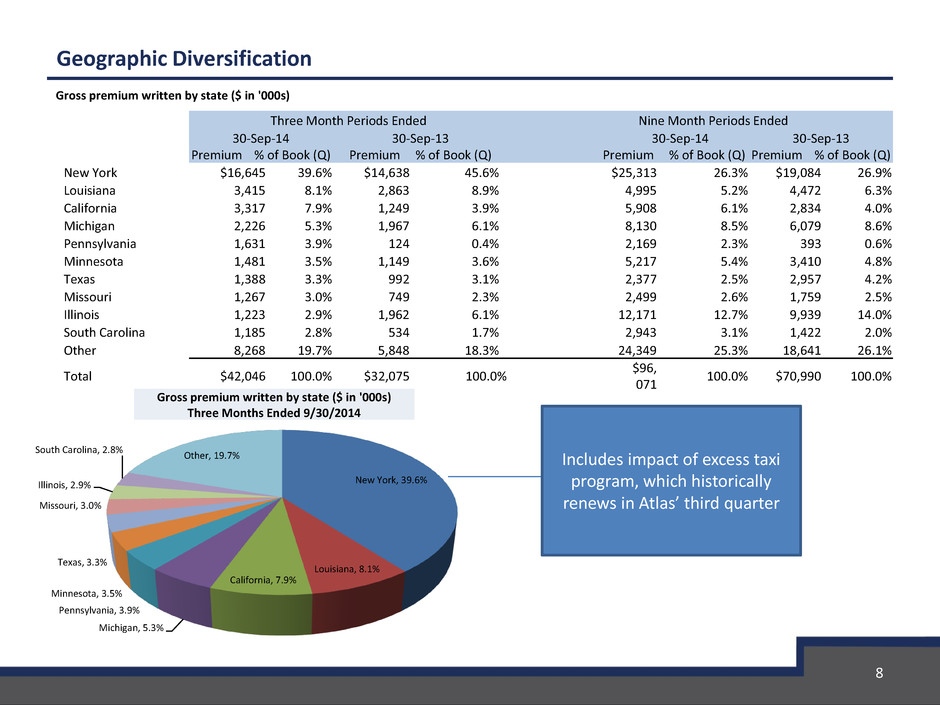
Geographic Diversification 8 Gross premium written by state ($ in '000s) Gross premium written by state ($ in '000s) Three Months Ended 9/30/2014 Three Month Periods Ended Nine Month Periods Ended 30-Sep-14 Premium % of Book (Q) 30-Sep-13 Premium % of Book (Q) 30-Sep-14 Premium % of Book (Q) 30-Sep-13 Premium % of Book (Q) New York $16,645 39.6% $14,638 45.6% $25,313 26.3% $19,084 26.9% Louisiana 3,415 8.1% 2,863 8.9% 4,995 5.2% 4,472 6.3% California 3,317 7.9% 1,249 3.9% 5,908 6.1% 2,834 4.0% Michigan 2,226 5.3% 1,967 6.1% 8,130 8.5% 6,079 8.6% Pennsylvania 1,631 3.9% 124 0.4% 2,169 2.3% 393 0.6% Minnesota 1,481 3.5% 1,149 3.6% 5,217 5.4% 3,410 4.8% Texas 1,388 3.3% 992 3.1% 2,377 2.5% 2,957 4.2% Missouri 1,267 3.0% 749 2.3% 2,499 2.6% 1,759 2.5% Illinois 1,223 2.9% 1,962 6.1% 12,171 12.7% 9,939 14.0% South Carolina 1,185 2.8% 534 1.7% 2,943 3.1% 1,422 2.0% Other 8,268 19.7% 5,848 18.3% 24,349 25.3% 18,641 26.1% Total $42,046 100.0% $32,075 100.0% $96, 071 100.0% $70,990 100.0% New York, 39.6% Louisiana, 8.1% California, 7.9% Michigan, 5.3% Pennsylvania, 3.9% Minnesota, 3.5% Texas, 3.3% Missouri, 3.0% Illinois, 2.9% South Carolina, 2.8% Other, 19.7% Includes impact of excess taxi program, which historically renews in Atlas’ third quarter

Operating Activities: Underwriting (commercial business only) Renewal Retention (Policy Count) New Business Submissions (Monthly Vehicles Submitted) Target of 85% based on current market conditions 9 1 2 3 4 5 6 7 8 9 10 11 12 VIF 2014 - Act & Frcst 24,9 25,8 26,3 25,7 26,1 26,5 27,3 27,7 28,5 29,8 30,7 31,5 VIF 2013 - Actual 11,7 12,8 13,5 14,2 15,3 15,7 16,1 17,1 18,0 19,4 20,7 21,9 - 5,000 10,000 15,000 20,000 25,000 30,000 35,000 Vehicles in Force - 1,000 2,000 3,000 4,000 5,000 6,000 7,000 Actual Last Year 0.00% 10.00% 20.00% 30.00% 40.00% 50.00% 60.00% 70.00% 80.00% 90.00% 100.00%

0 50 100 150 200 250 300 New Agents Existing Agents Bound/Application Ratio Operating Activities: Underwriting (commercial business only) Current target of 60%. Continuing incremental application volume from new and existing agents 10 Note: Stacked Line 0% 10% 20% 30% 40% 50% 60% 70% 80% 90%

Market Overview 11

General Market Observations • Atlas is continuing to see steady rate increases across all lines within its light commercial base (Taxi / Para-transit / Livery) • Company is now beginning to see full effects of competitors exiting its niche market 12 Small Accounts Medium Accounts Large Accounts Average Third Quarter 2014 1.1% 0.3% -1.1% 0.1% Second Quarter 2014 1.2% -0.2% -2.6% -0.5% First Quarter 2014 3.0% 1.6% -0.1% 1.5% Fourth Quarter 2013 2.6% 2.4% 1.4% 2.1% Third Quarter 2013 3.8% 3.7% 2.6% 3.4% High (2001,Q4) 20.8% 31.7% 33% 28.5% Low (2007,Q3) -10% (2008, Q1) -15% -15.9% -13.3% Majority of Atlas’ Target Market are Individual Entrepreneurs and Small Fleet Operators; Rate declined driven by larger accounts / Property BY LINE: Commercial Auto Third Quarter 2014 2.6% Second Quarter 2014 1.7% First Quarter 2014 3.3% Fourth Quarter 2013 3.0% Third Quarter 2013 3.3% High 28.6% Low --11.6%

Loss Ratio 70% Historical results from Atlas’ insurance subsidiaries have continued to produce loss ratios in the 70% range during soft market cycles Combined Ratio of 95 – 97%1 Current Investment Yield of 2.0% on total portfolio of 1.5X net premium earned Tax rate of 34%2 After tax ROE: 8% - 11% Loss Ratio 60% Consistent with Atlas ‘ current loss ratio of 62.2% in Q3 2014. Combined Ratio will drop as expenses continue to trend towards the following range. Combined Ratio of 85 – 87%1 Current Investment Yield of 2.0% on total portfolio of 1.5X net premium earned Tax rate of 34%2 After tax ROE: 21% - 24% Loss Ratio 50% Loss ratios for the insurance companies we own were in the low 50’s for multiple years in prior hard market cycles. Combined Ratio of 75 – 77%1 Current Investment Yield of 2.0% on total portfolio of 1.5X net premium earned Tax rate of 34%2 After tax ROE: 34% - 37% Impact of Pricing Progression for Atlas Financial Niche insurance business that produces underwriting profits through all market cycles 1 Assumptions: Expense ratio of between 25-27% (Acquisition Costs = 15% / OUE = 10-12%) Company operating at efficient scale with 2:1 NWP Surplus Ratio 2 Based on existing DTA’s, the 1st $2.6 mil of income is tax free from a cash perspective through 2032. 13 Carried loss ratio is approach 60% with new business pricing in 50’s

Financial Highlights 14

Q3 2014 Financial Highlights (comparisons to prior year period) • Gross premium written increased by 31.1% to $42.0 million • Underwriting results improved to $1.6 million, a 143.2% increase • Net income was up to $3.5 million from $1.7 million • Earnings per diluted common share were $0.29, representing a $0.12 increase from the third quarter of 2013 before the impact related to the $1.8 million discount upon redemption of preferred stock that occurred in the third quarter of 2013 • Combined ratio declined by 4.3 percentage points to 89.6%, which included costs related to an increase in hiring in anticipation of continuing growth 15 Three Month Period Ended Sept.30, 2014 Sept 30, 2013 Loss ratio 62.2 % 63.4 % Acquisition cost ratio 14.4 % 15.9 % Other underwriting expense ratio 13.0 % 14.6 % Combined ratio 89.6 % 93.9 %

16 Detailed Impact of Changes to Book Value per Common Share YTD 2014 Book Value Changed by $1.70 relative to December 31, 2013 Impacted by: $0.94 Increase related to issuance of 2,161,000 common shares during Q2 2014 0.46 Increase in net income after tax 0.11 Increase related to change in unrealized gains/losses after tax 0.24 Increase related to change in DTA valuation allowance (0.04) Reduction due share-based compensation (0.01) Accumulated preferred stock dividends $1.70 Total Change From December 31, 2013 Book Value per Common Share Book Value per Common Share (in '000s, except for shares and per share data) Sept.30, 2014 December 31, 2013 Shareholders' equity $99,474 $63,698 Less: Preferred stock in equity 2,000 2,000 Less: Accumulated dividends on preferred stock 160 90 Common equity $97,314 $61,608 Shares outstanding (includes Restricted Stock Units) 11,808,624 9,424,734 Book value per common share outstanding $8.24 $6.54

• Attractive investment leverage • Long Term Debt-free balance sheet • Acquisitions with adverse development protection ($ in millions) September 30, 2014 December 31, 2013 Cash and Investments $179.2 $139.9 Total Assets $274.3 $219.3 Claim Reserves (Gross of Reinsurance) (1) (2) $98.6 $101.4 Unearned Premiums $62.9 $44.2 Total Shareholders’ Equity $99.5 $63.7 17 (1) Atlas’ purchase of American Country and American Service included $10 million limit of adverse development protection (90% quota share after $1 million) based on reserves as of September 30, 2010, which has not been utilized. (2) Gateway Acquisition included $2 million of adverse development protection Strong Balance Sheet
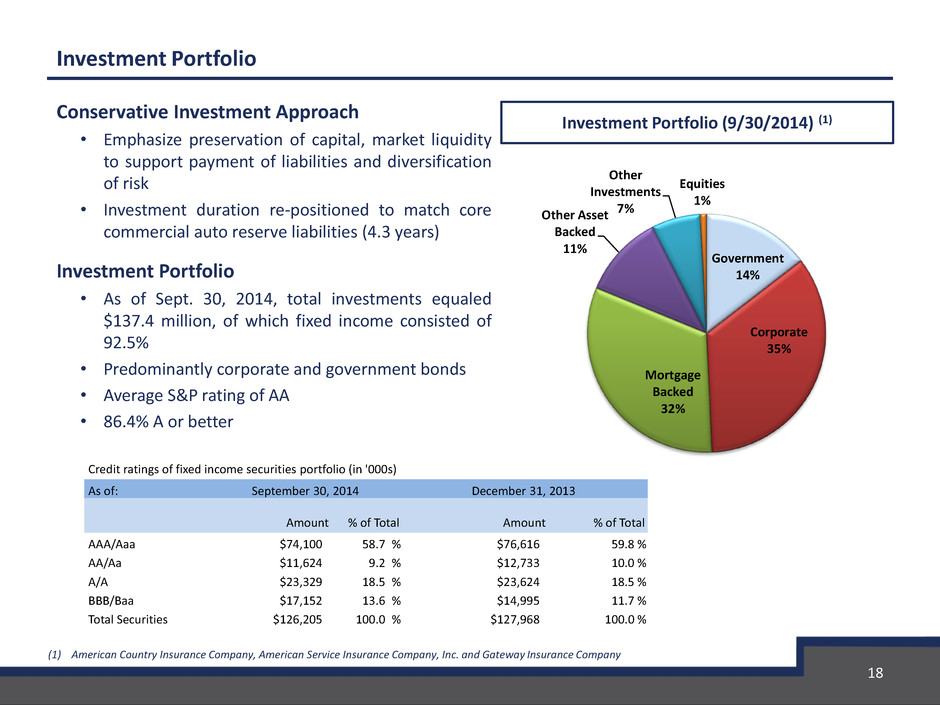
Investment Portfolio Conservative Investment Approach • Emphasize preservation of capital, market liquidity to support payment of liabilities and diversification of risk • Investment duration re-positioned to match core commercial auto reserve liabilities (4.3 years) Investment Portfolio • As of Sept. 30, 2014, total investments equaled $137.4 million, of which fixed income consisted of 92.5% • Predominantly corporate and government bonds • Average S&P rating of AA • 86.4% A or better 18 Government 14% Corporate 35% Mortgage Backed 32% Other Asset Backed 11% Other Investments 7% Equities 1% Investment Portfolio (9/30/2014) (1) (1) American Country Insurance Company, American Service Insurance Company, Inc. and Gateway Insurance Company Credit ratings of fixed income securities portfolio (in '000s) As of: September 30, 2014 December 31, 2013 Amount % of Total Amount % of Total AAA/Aaa $74,100 58.7 % $76,616 59.8 % AA/Aa $11,624 9.2 % $12,733 10.0 % A/A $23,329 18.5 % $23,624 18.5 % BBB/Baa $17,152 13.6 % $14,995 11.7 % Total Securities $126,205 100.0 % $127,968 100.0 %

Outlook for 2014 / 2015 19

Global Liberty Insurance Acquisition 20 Near term focus on transactions within current niche markets to accelerate progress towards proportionate market share Previously stated goal: • On October 17th, Atlas announced Definitive Agreement to Acquire Global Liberty Insurance Company of New York for approximately $25 million • Currently underwrites $40 million of annual commercial auto direct written premiums (majority in large New York market) • Estimated annual pre-tax income is approximately $4 million on a pro-forma basis • Based in Melville, NY • Founded in 2003 (founder has 25+ yrs experience) • Admitted carrier in 14 states • Focused on insuring limousine, black car, and luxury vehicles Benefits to Atlas − Highly complementary to existing infrastructure − Increases presence in largest U.S. commercial auto market − Accelerates ability to grow premium during the current favorable market cycle − Increases operating leverage with profitable premium in core niche market

Concluding Remarks Early Stages of Multi-year Growth Strategy • Company’s goal is focused on maximizing ROE potential in current market cycle • Expect to exceed previously discussed $200 million in gross premiums written in 2015 • $400 million in written premium is proportionate share Expanding Margins • Combined Ratio improved 430 bps year-over-year and 850 bps in past 18 months • Targets imply meaningful additional margin expansion with increased scale Cyclical Tailwinds • Market showing signs of entering a hard market • In previous hard market, Atlas’ core business experienced loss ratios in low 50’s four consecutive years • Atlas’ current loss ratio approaching 60% (62.2% in Q3 2014) and pricing to better than 60% M&A Opportunities to Accelerate Growth • Track record of successful transactions • Global Liberty Acquisition Expected to Accelerate Pace to Proportionate Market Share Attractive Valuation • Targets imply shares trading at low P/E 21

0.00 0.50 1.00 1.50 2.00 2.50 3.00 3.50 8.00 13.00 18.00 23.00 28.00 P/ B RevGr(Factor of 1) * ROE Atlas from a Peer Perspective 22 Criteria • Companies in Insurance / Financial Services with ROEs in excess of 10% • Non-Homeowners / Property • Comps include: ACE, WR Berkley, Chubb, Travelers, RLI, • As of November 7, 2014 – Source: Company Filings / Bloomberg

For Additional Information At the Company: Scott Wollney Chief Executive Officer swollney@atlas-fin.com 847-700-8600 Investor Relations: The Equity Group Inc. Adam Prior Senior Vice President APrior@equityny.com 212-836-9606 Terry Downs Associate TDowns@equityny.com 212-836-9615 Nasdaq: AFH