
ANCHOR HOLDINGS GROUP, INC. AND AFFILIATES COMBINED FINANCIAL STATEMENTS AS OF DECEMBER 31, 2014
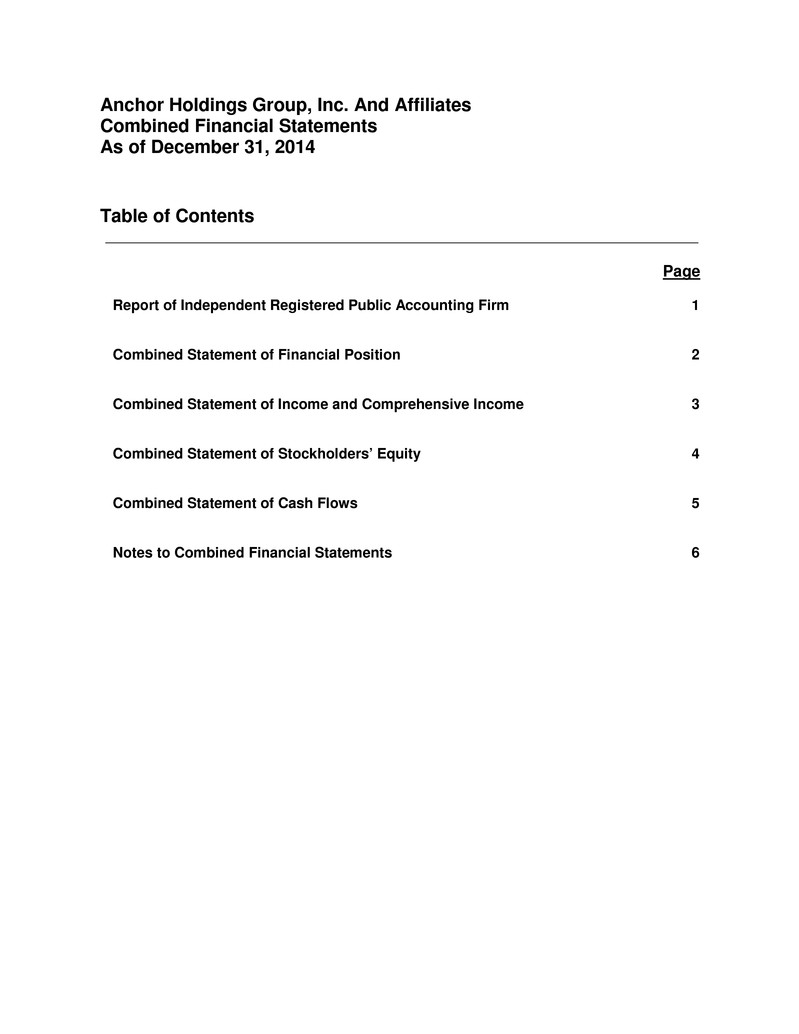
Anchor Holdings Group, Inc. And Affiliates Combined Financial Statements As of December 31, 2014 Table of Contents ____________________________________________________________________ Page Report of Independent Registered Public Accounting Firm Combined Statement of Financial Position 1 2 Combined Statement of Income and Comprehensive Income 3 Combined Statement of Stockholders’ Equity 4 Combined Statement of Cash Flows 5 Notes to Combined Financial Statements 6
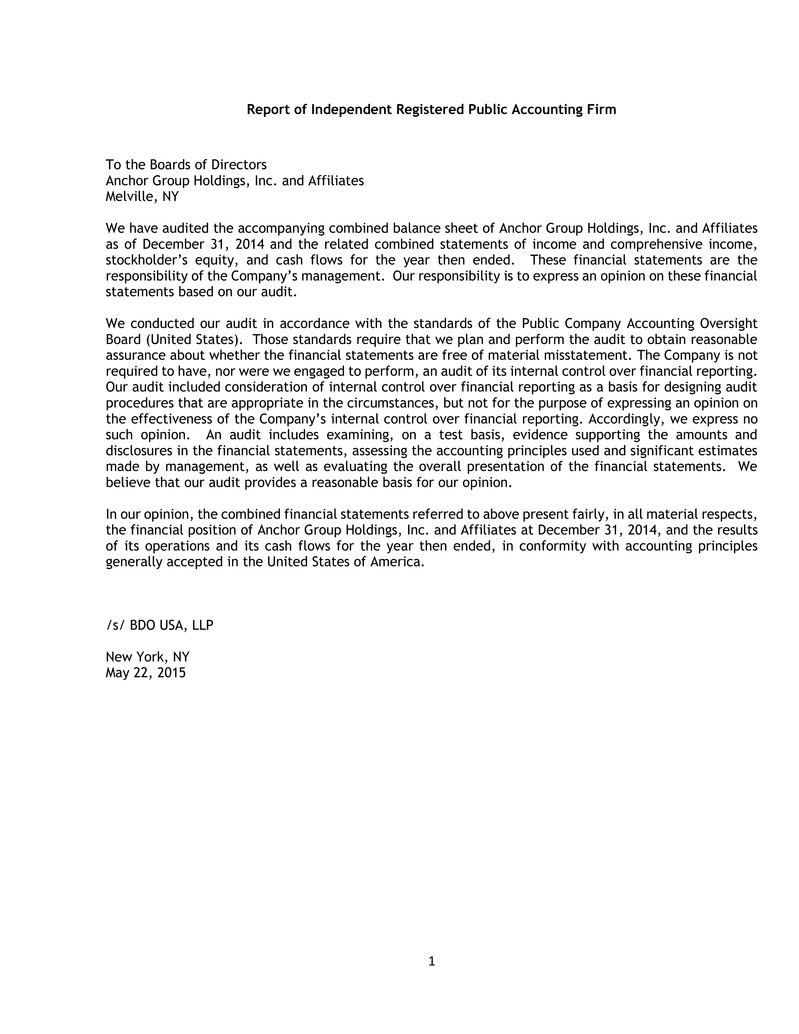
1 Report of Independent Registered Public Accounting Firm To the Boards of Directors Anchor Group Holdings, Inc. and Affiliates Melville, NY We have audited the accompanying combined balance sheet of Anchor Group Holdings, Inc. and Affiliates as of December 31, 2014 and the related combined statements of income and comprehensive income, stockholder’s equity, and cash flows for the year then ended. These financial statements are the responsibility of the Company’s management. Our responsibility is to express an opinion on these financial statements based on our audit. We conducted our audit in accordance with the standards of the Public Company Accounting Oversight Board (United States). Those standards require that we plan and perform the audit to obtain reasonable assurance about whether the financial statements are free of material misstatement. The Company is not required to have, nor were we engaged to perform, an audit of its internal control over financial reporting. Our audit included consideration of internal control over financial reporting as a basis for designing audit procedures that are appropriate in the circumstances, but not for the purpose of expressing an opinion on the effectiveness of the Company’s internal control over financial reporting. Accordingly, we express no such opinion. An audit includes examining, on a test basis, evidence supporting the amounts and disclosures in the financial statements, assessing the accounting principles used and significant estimates made by management, as well as evaluating the overall presentation of the financial statements. We believe that our audit provides a reasonable basis for our opinion. In our opinion, the combined financial statements referred to above present fairly, in all material respects, the financial position of Anchor Group Holdings, Inc. and Affiliates at December 31, 2014, and the results of its operations and its cash flows for the year then ended, in conformity with accounting principles generally accepted in the United States of America. /s/ BDO USA, LLP New York, NY May 22, 2015
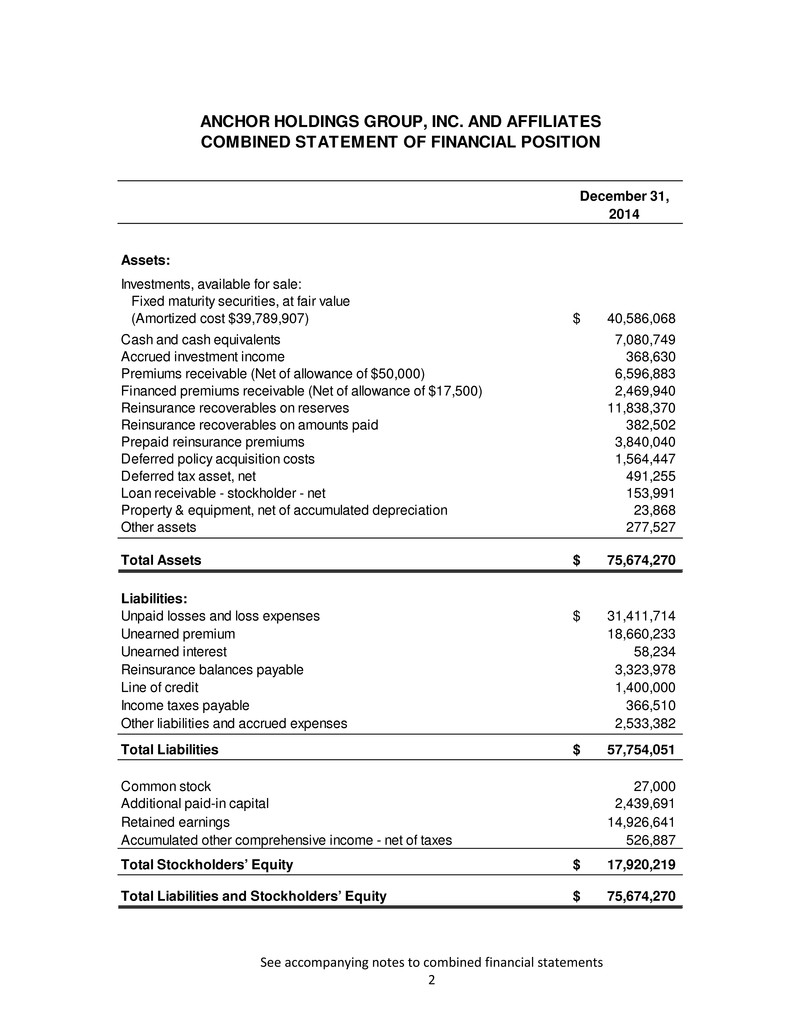
See accompanying notes to combined financial statements 2 December 31, 2014 Assets: Investments, available for sale: Fixed maturity securities, at fair value (Amortized cost $39,789,907) 40,586,068$ Cash and cash equivalents 7,080,749 Accrued investment income 368,630 Premiums receivable (Net of allowance of $50,000) 6,596,883 Financed premiums receivable (Net of allowance of $17,500) 2,469,940 Reinsurance recoverables on reserves 11,838,370 Reinsurance recoverables on amounts paid 382,502 Prepaid reinsurance premiums 3,840,040 Deferred policy acquisition costs 1,564,447 Deferred tax asset, net 491,255 Loan receivable - stockholder - net 153,991 Property & equipment, net of accumulated depreciation 23,868 Other assets 277,527 Total Assets 75,674,270$ Liabilities: Unpaid losses and loss expenses 31,411,714$ Unearned premium 18,660,233 Unearned interest 58,234 Reinsurance balances payable 3,323,978 Line of credit 1,400,000 Income taxes payable 366,510 Other liabilities and accrued expenses 2,533,382 Total Liabilities 57,754,051$ Common stock 27,000 Additional paid-in capital 2,439,691 Retained earnings 14,926,641 Accumulated other comprehensive income - net of taxes 526,887 Total Stockholders' Equity 17,920,219$ Total Liabilities and Stockholders' Equity 75,674,270$ ANCHOR HOLDINGS GROUP, INC. AND AFFILIATES COMBINED STATEMENT OF FINANCIAL POSITION
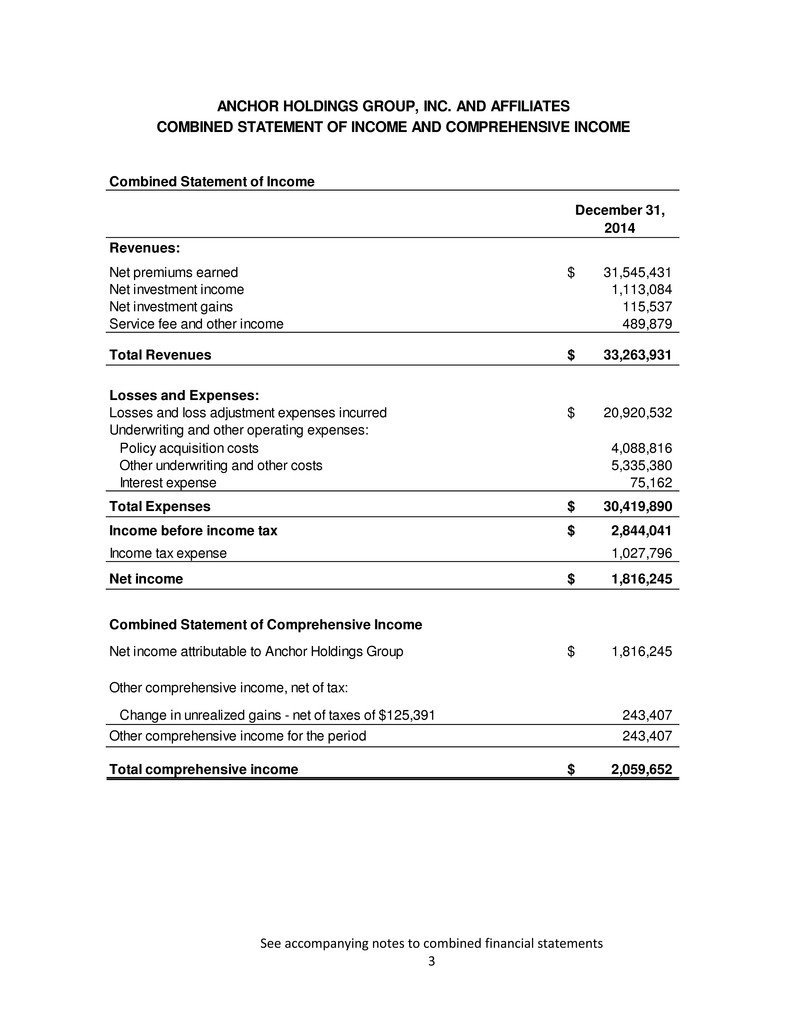
See accompanying notes to combined financial statements 3 Combined Statement of Income December 31, 2014 Revenues: Net premiums earned 31,545,431$ Net investment income 1,113,084 Net investment gains 115,537 Service fee and other income 489,879 Total Revenues 33,263,931$ Losses and Expenses: Losses and loss adjustment expenses incurred 20,920,532$ Underwriting and other operating expenses: Policy acquisition costs 4,088,816 Other underwriting and other costs 5,335,380 Interest expense 75,162 Total Expenses 30,419,890$ Income before income tax 2,844,041$ Income tax expense 1,027,796 Net income 1,816,245$ Combined Statement of Comprehensive Income Net income attributable to Anchor Holdings Group 1,816,245$ Other comprehensive income, net of tax: Change in unrealized gains - net of taxes of $125,391 243,407 Other comprehensive income for the period 243,407 Total comprehensive income 2,059,652$ ANCHOR HOLDINGS GROUP, INC. AND AFFILIATES COMBINED STATEMENT OF INCOME AND COMPREHENSIVE INCOME
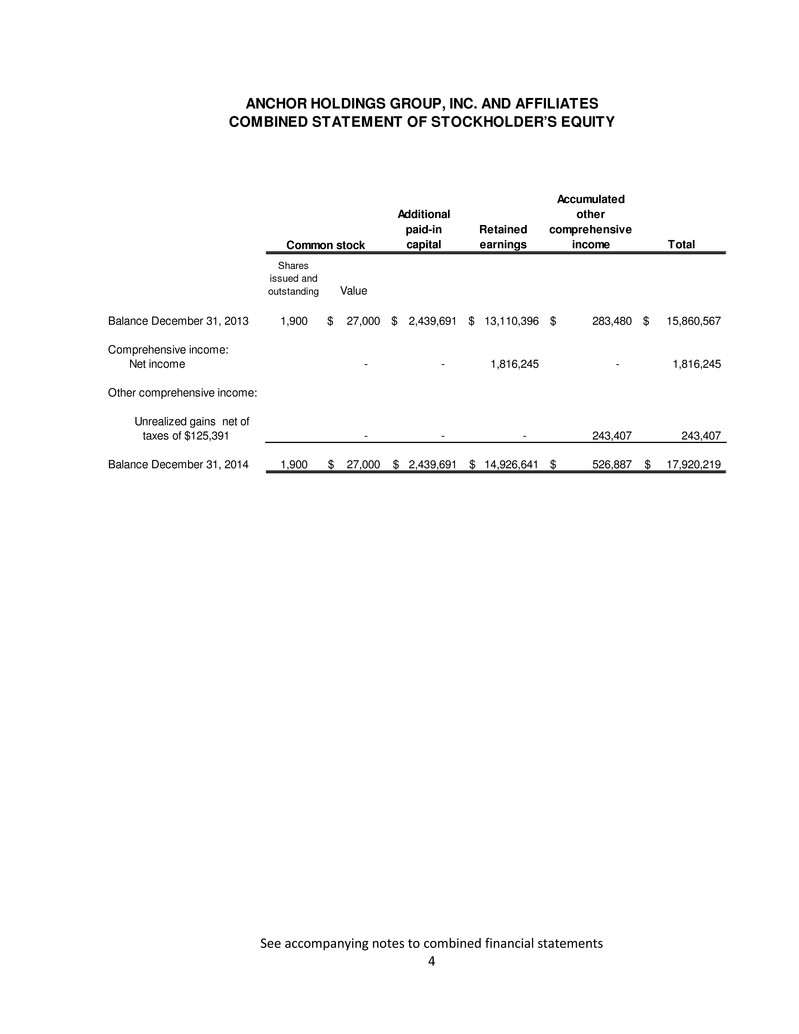
See accompanying notes to combined financial statements 4 Additional paid-in capital Retained earnings Accumulated other comprehensive income Total Shares issued and outstanding Value Balance December 31, 2013 1,900 27,000$ 2,439,691$ 13,110,396$ 283,480$ 15,860,567$ Comprehensive income: Net income - - 1,816,245 - 1,816,245 Other comprehensive income: Unrealized gains net of taxes of $125,391 - - - 243,407 243,407 Balance December 31, 2014 1,900 27,000$ 2,439,691$ 14,926,641$ 526,887$ 17,920,219$ ANCHOR HOLDINGS GROUP, INC. AND AFFILIATES COMBINED STATEMENT OF STOCKHOLDER'S EQUITY Common stock
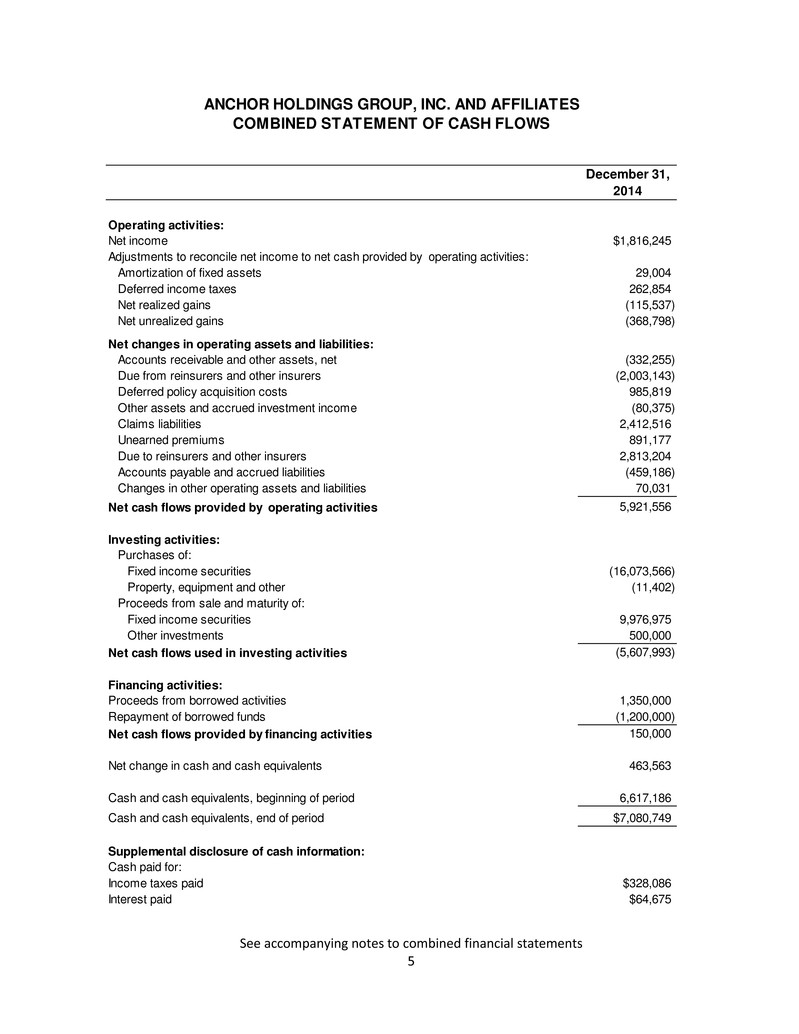
See accompanying notes to combined financial statements 5 December 31, 2014 Operating activities: Net income $1,816,245 Adjustments to reconcile net income to net cash provided by operating activities: Amortization of fixed assets 29,004 Deferred income taxes 262,854 Net realized gains (115,537) Net unrealized gains (368,798) Net changes in operating assets and liabilities: Accounts receivable and other assets, net (332,255) Due from reinsurers and other insurers (2,003,143) Deferred policy acquisition costs 985,819 Other assets and accrued investment income (80,375) Claims liabilities 2,412,516 Unearned premiums 891,177 Due to reinsurers and other insurers 2,813,204 Accounts payable and accrued liabilities (459,186) Changes in other operating assets and liabilities 70,031 Net cash flows provided by operating activities 5,921,556 Investing activities: Purchases of: Fixed income securities (16,073,566) Property, equipment and other (11,402) Proceeds from sale and maturity of: Fixed income securities 9,976,975 Other investments 500,000 Net cash flows used in investing activities (5,607,993) Financing activities: Proceeds from borrowed activities 1,350,000 Repayment of borrowed funds (1,200,000) Net cash flows provided by financing activities 150,000 Net change in cash and cash equivalents 463,563 Cash and cash equivalents, beginning of period 6,617,186 Cash and cash equivalents, end of period $7,080,749 Supplemental disclosure of cash information: Cash paid for: Income taxes paid $328,086 Interest paid $64,675 ANCHOR HOLDINGS GROUP, INC. AND AFFILIATES COMBINED STATEMENT OF CASH FLOWS
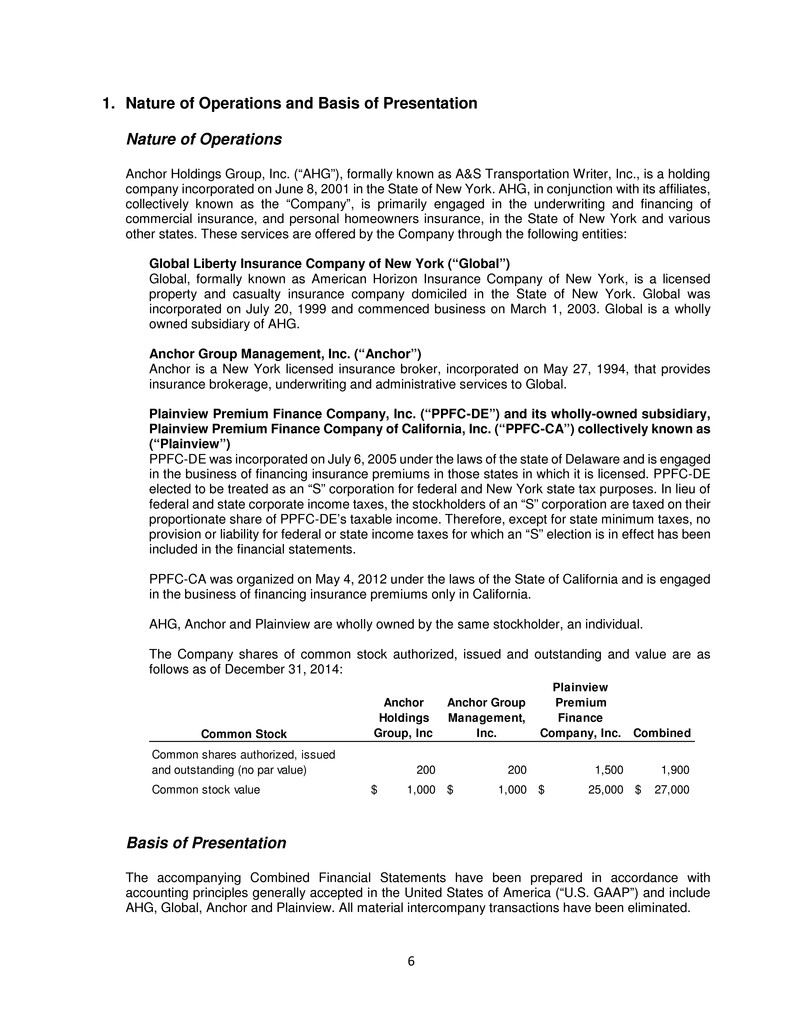
6 1. Nature of Operations and Basis of Presentation Nature of Operations Anchor Holdings Group, Inc. (“AHG”), formally known as A&S Transportation Writer, Inc., is a holding company incorporated on June 8, 2001 in the State of New York. AHG, in conjunction with its affiliates, collectively known as the “Company”, is primarily engaged in the underwriting and financing of commercial insurance, and personal homeowners insurance, in the State of New York and various other states. These services are offered by the Company through the following entities: Global Liberty Insurance Company of New York (“Global”) Global, formally known as American Horizon Insurance Company of New York, is a licensed property and casualty insurance company domiciled in the State of New York. Global was incorporated on July 20, 1999 and commenced business on March 1, 2003. Global is a wholly owned subsidiary of AHG. Anchor Group Management, Inc. (“Anchor”) Anchor is a New York licensed insurance broker, incorporated on May 27, 1994, that provides insurance brokerage, underwriting and administrative services to Global. Plainview Premium Finance Company, Inc. (“PPFC-DE”) and its wholly-owned subsidiary, Plainview Premium Finance Company of California, Inc. (“PPFC-CA”) collectively known as (“Plainview”) PPFC-DE was incorporated on July 6, 2005 under the laws of the state of Delaware and is engaged in the business of financing insurance premiums in those states in which it is licensed. PPFC-DE elected to be treated as an “S” corporation for federal and New York state tax purposes. In lieu of federal and state corporate income taxes, the stockholders of an “S” corporation are taxed on their proportionate share of PPFC-DE’s taxable income. Therefore, except for state minimum taxes, no provision or liability for federal or state income taxes for which an “S” election is in effect has been included in the financial statements. PPFC-CA was organized on May 4, 2012 under the laws of the State of California and is engaged in the business of financing insurance premiums only in California. AHG, Anchor and Plainview are wholly owned by the same stockholder, an individual. The Company shares of common stock authorized, issued and outstanding and value are as follows as of December 31, 2014: Basis of Presentation The accompanying Combined Financial Statements have been prepared in accordance with accounting principles generally accepted in the United States of America (“U.S. GAAP”) and include AHG, Global, Anchor and Plainview. All material intercompany transactions have been eliminated. Common Stock Anchor Holdings Group, Inc Anchor Group Management, Inc. Plainview Premium Finance Company, Inc. Combined Common shares authorized, issued and outstanding (no par value) 200 200 1,500 1,900 Common stock value 1,000$ 1,000$ 25,000$ 27,000$
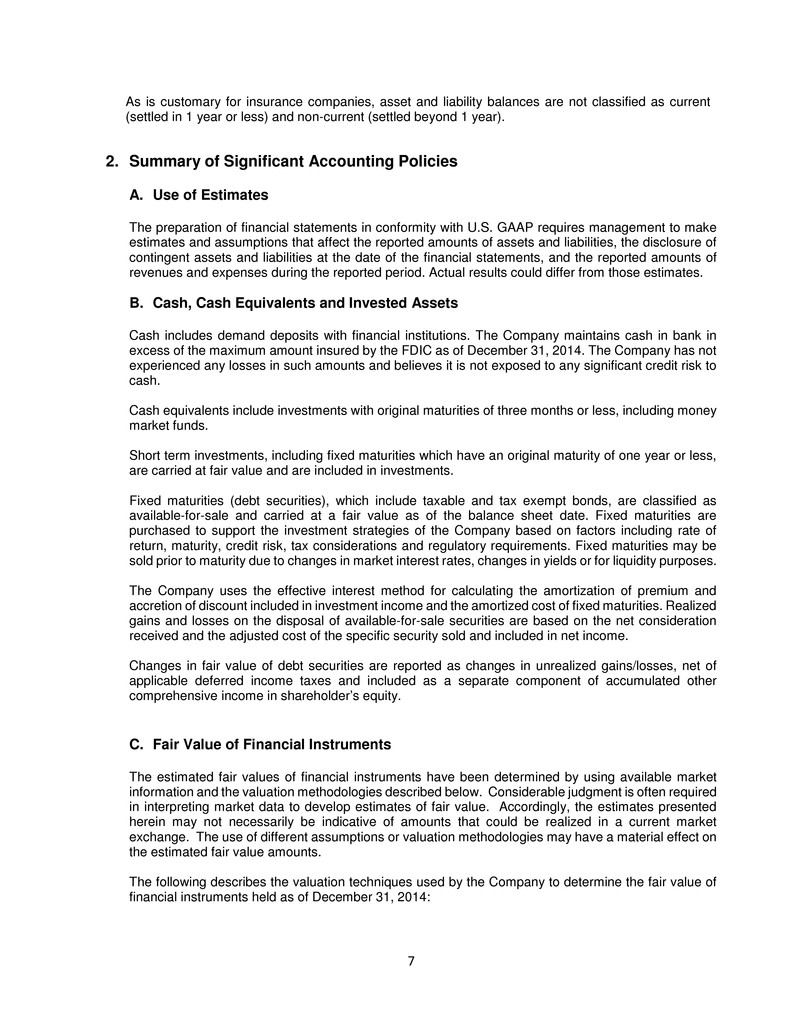
7 As is customary for insurance companies, asset and liability balances are not classified as current (settled in 1 year or less) and non-current (settled beyond 1 year). 2. Summary of Significant Accounting Policies A. Use of Estimates The preparation of financial statements in conformity with U.S. GAAP requires management to make estimates and assumptions that affect the reported amounts of assets and liabilities, the disclosure of contingent assets and liabilities at the date of the financial statements, and the reported amounts of revenues and expenses during the reported period. Actual results could differ from those estimates. B. Cash, Cash Equivalents and Invested Assets Cash includes demand deposits with financial institutions. The Company maintains cash in bank in excess of the maximum amount insured by the FDIC as of December 31, 2014. The Company has not experienced any losses in such amounts and believes it is not exposed to any significant credit risk to cash. Cash equivalents include investments with original maturities of three months or less, including money market funds. Short term investments, including fixed maturities which have an original maturity of one year or less, are carried at fair value and are included in investments. Fixed maturities (debt securities), which include taxable and tax exempt bonds, are classified as available-for-sale and carried at a fair value as of the balance sheet date. Fixed maturities are purchased to support the investment strategies of the Company based on factors including rate of return, maturity, credit risk, tax considerations and regulatory requirements. Fixed maturities may be sold prior to maturity due to changes in market interest rates, changes in yields or for liquidity purposes. The Company uses the effective interest method for calculating the amortization of premium and accretion of discount included in investment income and the amortized cost of fixed maturities. Realized gains and losses on the disposal of available-for-sale securities are based on the net consideration received and the adjusted cost of the specific security sold and included in net income. Changes in fair value of debt securities are reported as changes in unrealized gains/losses, net of applicable deferred income taxes and included as a separate component of accumulated other comprehensive income in shareholder’s equity. C. Fair Value of Financial Instruments The estimated fair values of financial instruments have been determined by using available market information and the valuation methodologies described below. Considerable judgment is often required in interpreting market data to develop estimates of fair value. Accordingly, the estimates presented herein may not necessarily be indicative of amounts that could be realized in a current market exchange. The use of different assumptions or valuation methodologies may have a material effect on the estimated fair value amounts. The following describes the valuation techniques used by the Company to determine the fair value of financial instruments held as of December 31, 2014:
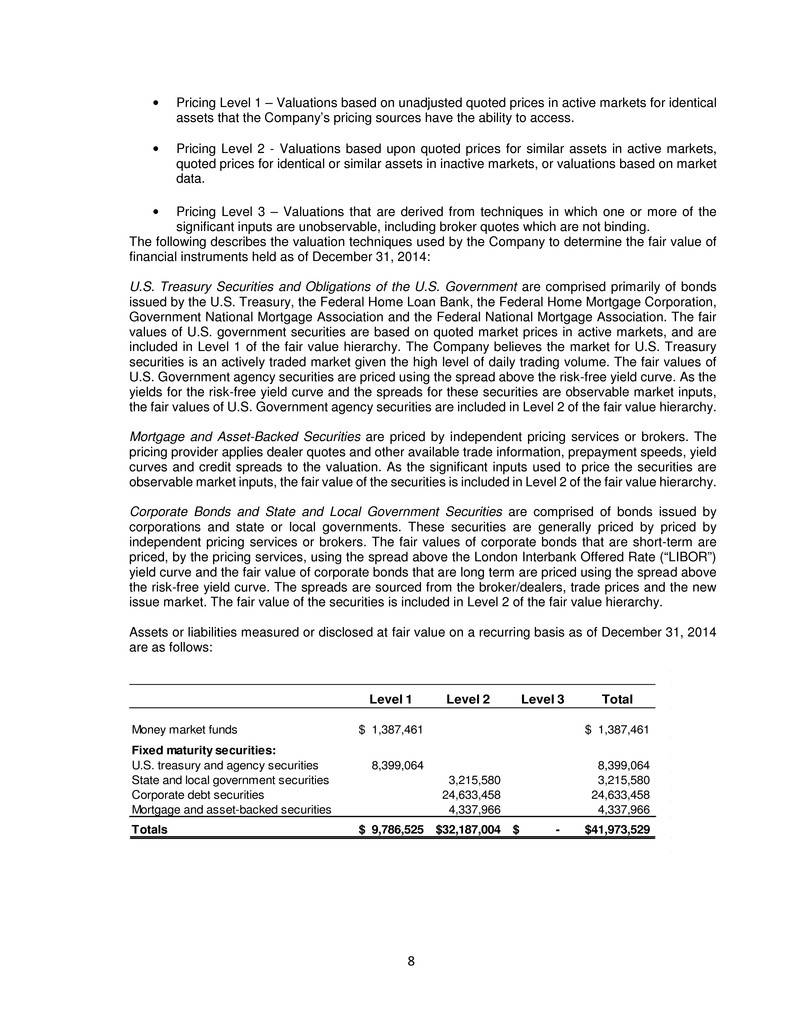
8 Pricing Level 1 – Valuations based on unadjusted quoted prices in active markets for identical assets that the Company’s pricing sources have the ability to access. Pricing Level 2 - Valuations based upon quoted prices for similar assets in active markets, quoted prices for identical or similar assets in inactive markets, or valuations based on market data. Pricing Level 3 – Valuations that are derived from techniques in which one or more of the significant inputs are unobservable, including broker quotes which are not binding. The following describes the valuation techniques used by the Company to determine the fair value of financial instruments held as of December 31, 2014: U.S. Treasury Securities and Obligations of the U.S. Government are comprised primarily of bonds issued by the U.S. Treasury, the Federal Home Loan Bank, the Federal Home Mortgage Corporation, Government National Mortgage Association and the Federal National Mortgage Association. The fair values of U.S. government securities are based on quoted market prices in active markets, and are included in Level 1 of the fair value hierarchy. The Company believes the market for U.S. Treasury securities is an actively traded market given the high level of daily trading volume. The fair values of U.S. Government agency securities are priced using the spread above the risk-free yield curve. As the yields for the risk-free yield curve and the spreads for these securities are observable market inputs, the fair values of U.S. Government agency securities are included in Level 2 of the fair value hierarchy. Mortgage and Asset-Backed Securities are priced by independent pricing services or brokers. The pricing provider applies dealer quotes and other available trade information, prepayment speeds, yield curves and credit spreads to the valuation. As the significant inputs used to price the securities are observable market inputs, the fair value of the securities is included in Level 2 of the fair value hierarchy. Corporate Bonds and State and Local Government Securities are comprised of bonds issued by corporations and state or local governments. These securities are generally priced by priced by independent pricing services or brokers. The fair values of corporate bonds that are short-term are priced, by the pricing services, using the spread above the London Interbank Offered Rate (“LIBOR”) yield curve and the fair value of corporate bonds that are long term are priced using the spread above the risk-free yield curve. The spreads are sourced from the broker/dealers, trade prices and the new issue market. The fair value of the securities is included in Level 2 of the fair value hierarchy. Assets or liabilities measured or disclosed at fair value on a recurring basis as of December 31, 2014 are as follows: Level 1 Level 2 Level 3 Total Money market funds 1,387,461$ 1,387,461$ Fixed maturity securities: U.S. treasury and agency securities 8,399,064 8,399,064 State and local government securities 3,215,580 3,215,580 Corporate debt securities 24,633,458 24,633,458 Mortgage and asset-backed securities 4,337,966 4,337,966 Totals 9,786,525$ 32,187,004$ -$ 41,973,529$
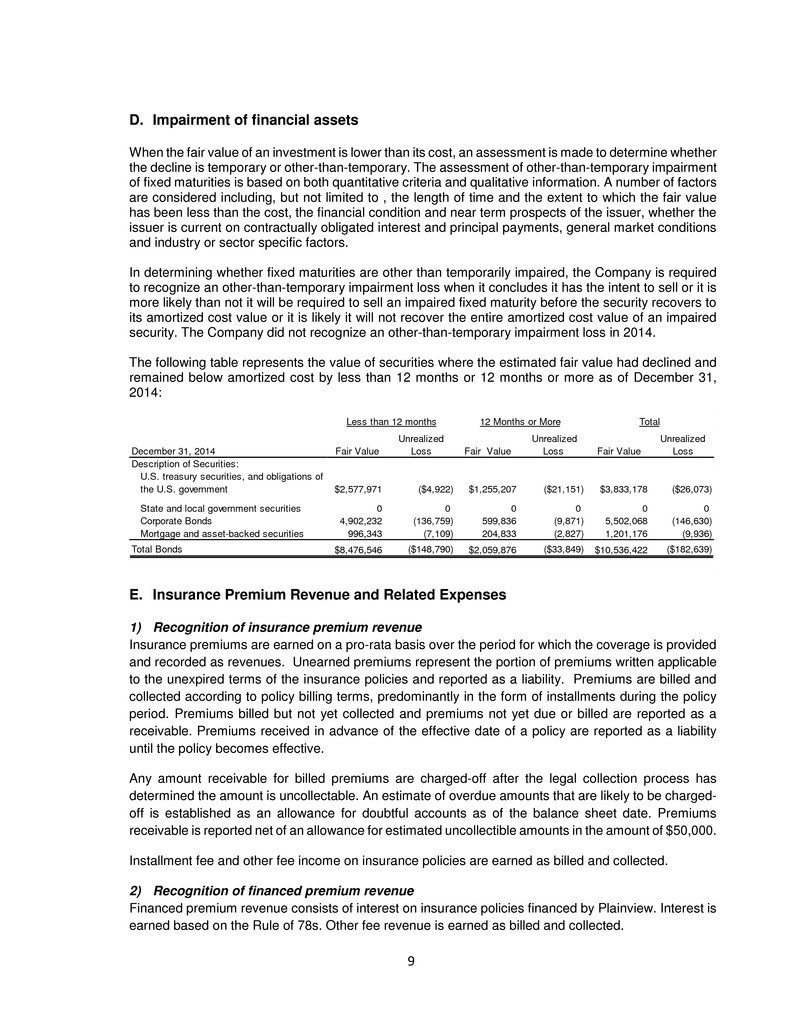
9 D. Impairment of financial assets When the fair value of an investment is lower than its cost, an assessment is made to determine whether the decline is temporary or other-than-temporary. The assessment of other-than-temporary impairment of fixed maturities is based on both quantitative criteria and qualitative information. A number of factors are considered including, but not limited to , the length of time and the extent to which the fair value has been less than the cost, the financial condition and near term prospects of the issuer, whether the issuer is current on contractually obligated interest and principal payments, general market conditions and industry or sector specific factors. In determining whether fixed maturities are other than temporarily impaired, the Company is required to recognize an other-than-temporary impairment loss when it concludes it has the intent to sell or it is more likely than not it will be required to sell an impaired fixed maturity before the security recovers to its amortized cost value or it is likely it will not recover the entire amortized cost value of an impaired security. The Company did not recognize an other-than-temporary impairment loss in 2014. The following table represents the value of securities where the estimated fair value had declined and remained below amortized cost by less than 12 months or 12 months or more as of December 31, 2014: E. Insurance Premium Revenue and Related Expenses 1) Recognition of insurance premium revenue Insurance premiums are earned on a pro-rata basis over the period for which the coverage is provided and recorded as revenues. Unearned premiums represent the portion of premiums written applicable to the unexpired terms of the insurance policies and reported as a liability. Premiums are billed and collected according to policy billing terms, predominantly in the form of installments during the policy period. Premiums billed but not yet collected and premiums not yet due or billed are reported as a receivable. Premiums received in advance of the effective date of a policy are reported as a liability until the policy becomes effective. Any amount receivable for billed premiums are charged-off after the legal collection process has determined the amount is uncollectable. An estimate of overdue amounts that are likely to be charged- off is established as an allowance for doubtful accounts as of the balance sheet date. Premiums receivable is reported net of an allowance for estimated uncollectible amounts in the amount of $50,000. Installment fee and other fee income on insurance policies are earned as billed and collected. 2) Recognition of financed premium revenue Financed premium revenue consists of interest on insurance policies financed by Plainview. Interest is earned based on the Rule of 78s. Other fee revenue is earned as billed and collected. December 31, 2014 Fair Value Unrealized Loss Fair Value Unrealized Loss Fair Value Unrealized Loss Description of Securities: U.S. treasury securities, and obligations of the U.S. government $2,577,971 ($4,922) $1,255,207 ($21,151) $3,833,178 ($26,073) State and local government securities 0 0 0 0 0 0 Corporate Bonds 4,902,232 (136,759) 599,836 (9,871) 5,502,068 (146,630) Mortgage and asset-backed securities 996,343 (7,109) 204,833 (2,827) 1,201,176 (9,936) Total Bonds $8,476,546 ($148,790) $2,059,876 ($33,849) $10,536,422 ($182,639) Less than 12 months 12 Months or More Total
10 Balances owed by policyholders who receive financing include the unearned financing charges, which will be amortized and recognized as income over the term of the funding agreement. Financed premiums receivable are stated at the amount that management expects it will collect as of the balance sheet date. A provision for doubtful accounts has been established based on management’s best estimate of probable losses inherent in the accounts receivable balance. Management determines the allowance based on known troubled accounts, historical experience and other currently available evidence. 3) Losses and Loss Adjustment Expenses Incurred Losses and loss adjustment expenses incurred include provisions for the amount the Company expects to ultimately pay for all reported and unreported claims. Loss adjustment expenses are the expenses applicable to the process of administering, settling and investigating claims, including related legal expenses. 4) Unpaid Losses and Loss Adjustment Expenses Unpaid losses and loss adjustment expenses (“loss reserves”) include the accumulation of individual case estimates for claims that have been reported and estimates of claims that have been incurred but not reported (“IBNR”) including estimates of the expenses associated with processing and settling all reported and unreported claims, less estimates of anticipated salvage and subrogation recoveries. Loss reserve estimates are based upon past loss experience modified for current trends. Reserves established for reported claims (“case reserves”) are continually monitored and revised in response to new information and for amounts paid. Loss reserves represent the amounts the Company expects to pay for the ultimate cost of reported and unreported claims as of the balance sheet date, but are inherently uncertain; they do not and cannot represent an exact measure of ultimate liability due to various factors such as changes in reporting patterns, claims settlement patterns, judicial decisions, legislation, and economic conditions. Loss reserves are not discounted to present value. The Company evaluates its loss reserves every quarter to reflect the most current data and judgments. Reserves estimates are updated as historical loss experience develops; additional claims are reported and/or settled and new information becomes available. 5) Deferred Policy Acquisition Costs (“DAC”) Policy acquisition costs, consisting of broker commissions and premium taxes that vary with premium written and are primarily related to the successful production of new or renewal business, are deferred and amortized as the related premiums are earned. Commissions received related to reinsurance premiums ceded are considered in determining net acquisition costs eligible for deferral. DAC is limited based upon its recoverability without any consideration for anticipated investment income. When anticipated losses, loss adjustment expenses, commissions and other acquisition costs exceed recorded unearned premium and any future installment premiums on existing policies, a premium deficiency reserve is recognized by recording a reduction to DAC with a corresponding charge to operations. The Company utilizes anticipated investment income as a factor in its premium deficiency calculation. The Company concluded that no premium deficiency adjustments were necessary for the year ended December 31, 2014.
11 6) Reinsurance Ceded The Company cedes insurance risks under various reinsurance agreements, on both a pro rata and excess of loss basis, including coverage for property exposures arising from catastrophes. The Company purchases reinsurance to protect itself against the impact of large, irregularly occurring losses to reduce the magnitude of such losses on net income and the capital of the Company. The Company acquires reinsurance only with large well-capitalized reinsurance companies and does not believe it is exposed to any material credit risk through its ceded reinsurance programs. Accordingly, the Company did not record an allowance for uncollectible recoverables from its reinsurers. Premiums earned and losses and loss adjustment expenses incurred are stated after the deduction of amounts ceded to reinsurers. Commissions paid to the Company by reinsurers on premium ceded have been accounted for as a reduction of policy acquisition costs. Balances due from reinsurers on unpaid losses, including an estimate of such recoverables related to reserves for IBNR losses, are reported as assets and are included in reinsurance recoverables on reserves even though amounts due on unpaid losses and loss adjustment expenses are not recoverable from the reinsurer until the losses are paid. Ceded unearned premiums related to written premium ceded to reinsurers are reported as an asset in prepaid reinsurance premiums. F. Income taxes Deferred income tax assets and liabilities are recognized for the expected future tax effects attributable to temporary differences between the financial reporting and tax bases of assets and liabilities, based on enacted tax rates and other provisions of the law. Deferred tax assets are recognized only to the extent that it is probable that future taxable income will be available against which they can be utilized. The tax asset is reduced by a valuation allowance if it is more likely than not that all or some portion of the deferred tax assets will not be realized. When considering the extent of the valuation allowance on the Company’s deferred tax asset, weight is given by management to both positive and negative evidence. U.S. GAAP states that a cumulative loss in recent years is a significant piece of negative evidence that is difficult to overcome in determining that a valuation allowance is not needed against deferred tax assets. However, the strength and trend of earnings, as well as other relevant factors are considered. The Company accounts for uncertain tax positions in accordance with the income taxes accounting guidance. The Company analyzes filing positions in the federal and state jurisdiction where it is required to file tax returns, as well as the open tax years in these jurisdictions. The Company would recognize interest and penalties related to unrecognized tax benefits as a component of the provision for federal income taxes. G. Property and equipment Capitalized furniture, autos, office equipment, computer equipment and software are stated at historical cost less depreciation. Assets are depreciated over their estimated useful lives of three to five years using the straight-line method. Repairs and maintenance are recognized as expense in the period incurred.
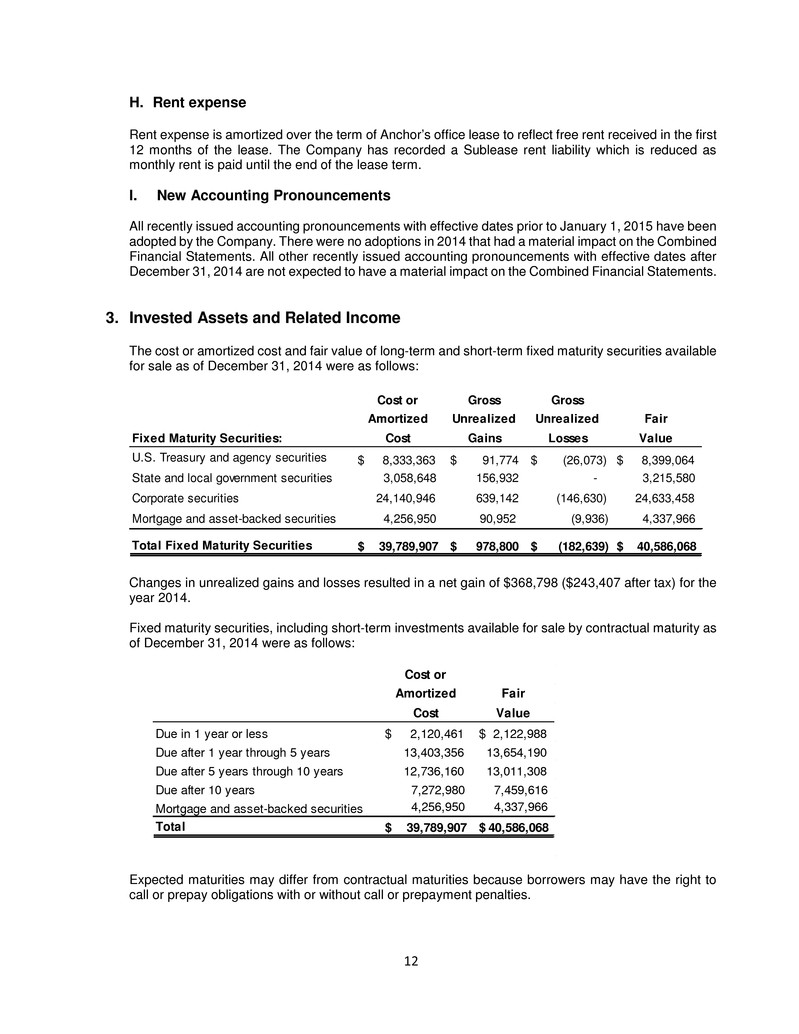
12 H. Rent expense Rent expense is amortized over the term of Anchor’s office lease to reflect free rent received in the first 12 months of the lease. The Company has recorded a Sublease rent liability which is reduced as monthly rent is paid until the end of the lease term. I. New Accounting Pronouncements All recently issued accounting pronouncements with effective dates prior to January 1, 2015 have been adopted by the Company. There were no adoptions in 2014 that had a material impact on the Combined Financial Statements. All other recently issued accounting pronouncements with effective dates after December 31, 2014 are not expected to have a material impact on the Combined Financial Statements. 3. Invested Assets and Related Income The cost or amortized cost and fair value of long-term and short-term fixed maturity securities available for sale as of December 31, 2014 were as follows: Changes in unrealized gains and losses resulted in a net gain of $368,798 ($243,407 after tax) for the year 2014. Fixed maturity securities, including short-term investments available for sale by contractual maturity as of December 31, 2014 were as follows: Expected maturities may differ from contractual maturities because borrowers may have the right to call or prepay obligations with or without call or prepayment penalties. Cost or Gross Gross Amortized Unrealized Unrealized Fair Fixed Maturity Securities: Cost Gains Losses Value U.S. Treasury and agency securities $ 8,333,363 $ 91,774 $ (26,073) $ 8,399,064 State and local government securities 3,058,648 156,932 - 3,215,580 Corporate securities 24,140,946 639,142 (146,630) 24,633,458 Mortgage and asset-backed securities 4,256,950 90,952 (9,936) 4,337,966 Total Fixed Maturity Securities 39,789,907$ 978,800$ (182,639)$ 40,586,068$ Cost or Amortized Fair Cost Value Due in 1 year or less $ 2,120,461 $ 2,122,988 Due after 1 year through 5 years 13,403,356 13,654,190 Due after 5 years through 10 years 12,736,160 13,011,308 Due after 10 years 7,272,980 7,459,616 Mortgage and asset-backed securities 4,256,950 4,337,966 Total 39,789,907$ 40,586,068$
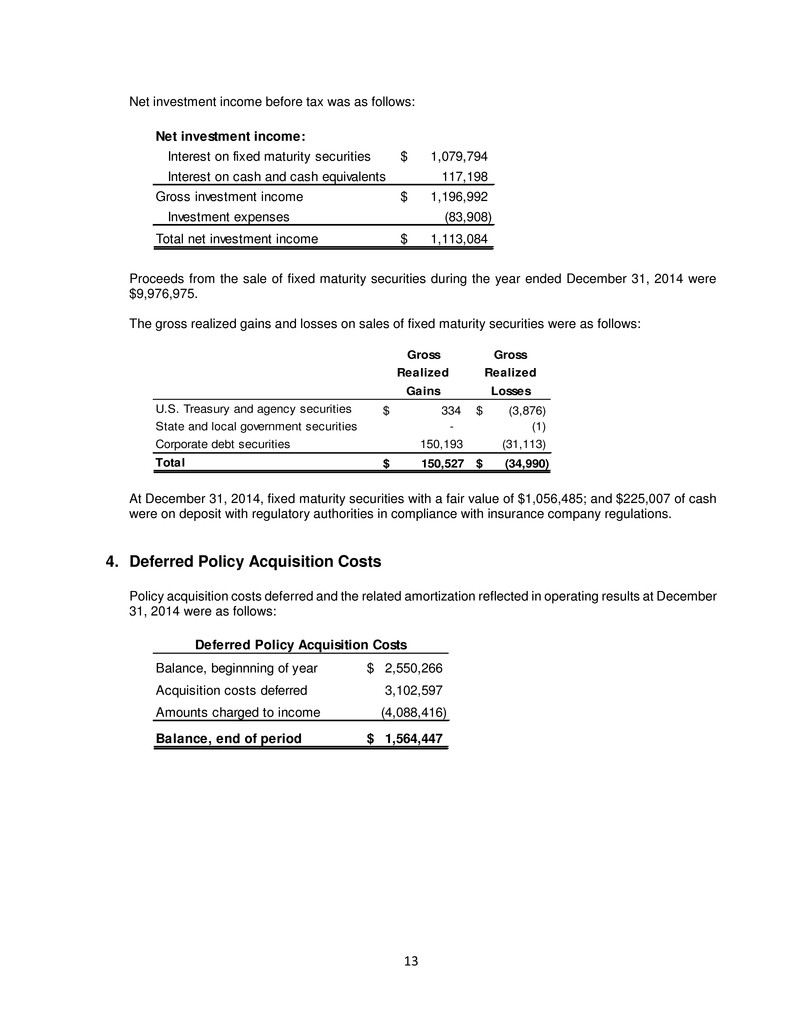
13 Net investment income before tax was as follows: Proceeds from the sale of fixed maturity securities during the year ended December 31, 2014 were $9,976,975. The gross realized gains and losses on sales of fixed maturity securities were as follows: At December 31, 2014, fixed maturity securities with a fair value of $1,056,485; and $225,007 of cash were on deposit with regulatory authorities in compliance with insurance company regulations. 4. Deferred Policy Acquisition Costs Policy acquisition costs deferred and the related amortization reflected in operating results at December 31, 2014 were as follows: Net investment income: Interest on fixed maturity securities 1,079,794$ Interest on cash and cash equivalents 117,198 Gross investment income 1,196,992$ Investment expenses (83,908) Total net investment income 1,113,084$ Gross Gross Realized Realized Gains Losses U.S. Treasury and agency securities $ 334 $ (3,876) State and local government securities - (1) Corporate debt securities 150,193 (31,113) Total 150,527$ (34,990)$ Balance, beginnning of year 2,550,266$ Acquisition costs deferred 3,102,597 Amounts charged to income (4,088,416) Balance, end of period 1,564,447$ Deferred Policy Acquisition Costs
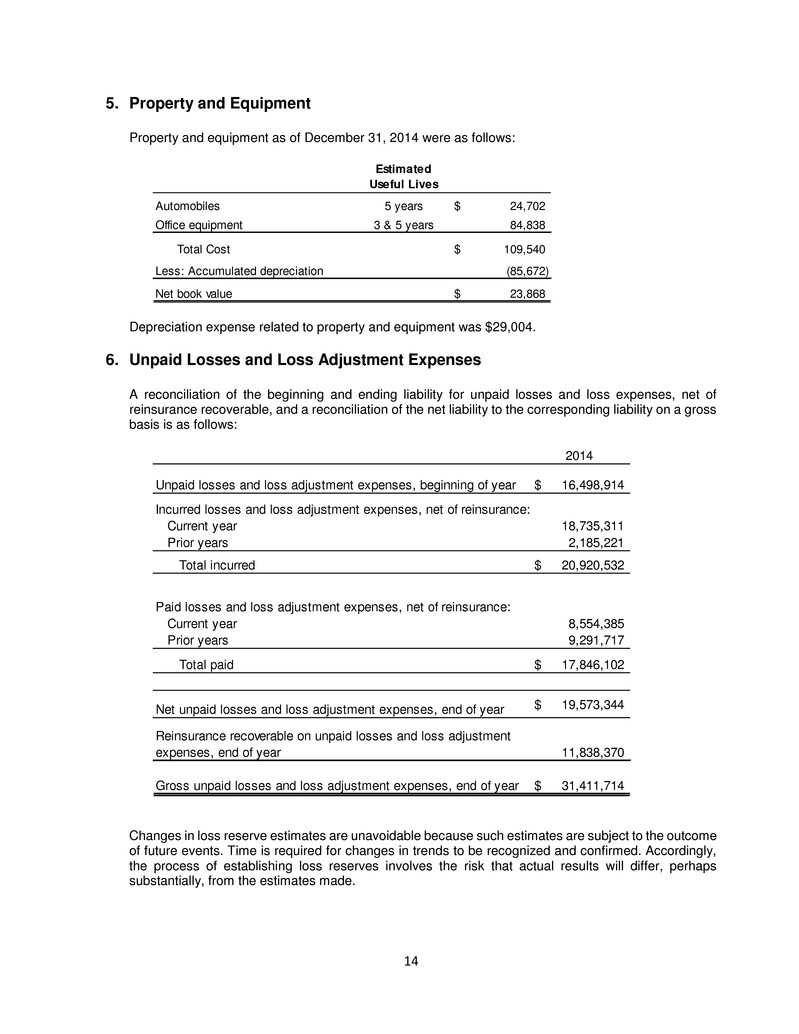
14 5. Property and Equipment Property and equipment as of December 31, 2014 were as follows: Depreciation expense related to property and equipment was $29,004. 6. Unpaid Losses and Loss Adjustment Expenses A reconciliation of the beginning and ending liability for unpaid losses and loss expenses, net of reinsurance recoverable, and a reconciliation of the net liability to the corresponding liability on a gross basis is as follows: Changes in loss reserve estimates are unavoidable because such estimates are subject to the outcome of future events. Time is required for changes in trends to be recognized and confirmed. Accordingly, the process of establishing loss reserves involves the risk that actual results will differ, perhaps substantially, from the estimates made. Estimated Useful Lives Automobiles 5 years 24,702$ Office equipment 3 & 5 years 84,838 Total Cost 109,540$ Less: Accumulated depreciation (85,672) Net book value 23,868$ 2014 Unpaid losses and loss adjustment expenses, beginning of year 16,498,914$ Incurred losses and loss adjustment expenses, net of reinsurance: Current year 18,735,311 Prior years 2,185,221 Total incurred 20,920,532$ Paid losses and loss adjustment expenses, net of reinsurance: Current year 8,554,385 Prior years 9,291,717 Total paid 17,846,102$ Net unpaid losses and loss adjustment expenses, end of year 19,573,344$ Reinsurance recoverable on unpaid losses and loss adjustment expenses, end of year 11,838,370 Gross unpaid losses and loss adjustment expenses, end of year 31,411,714$
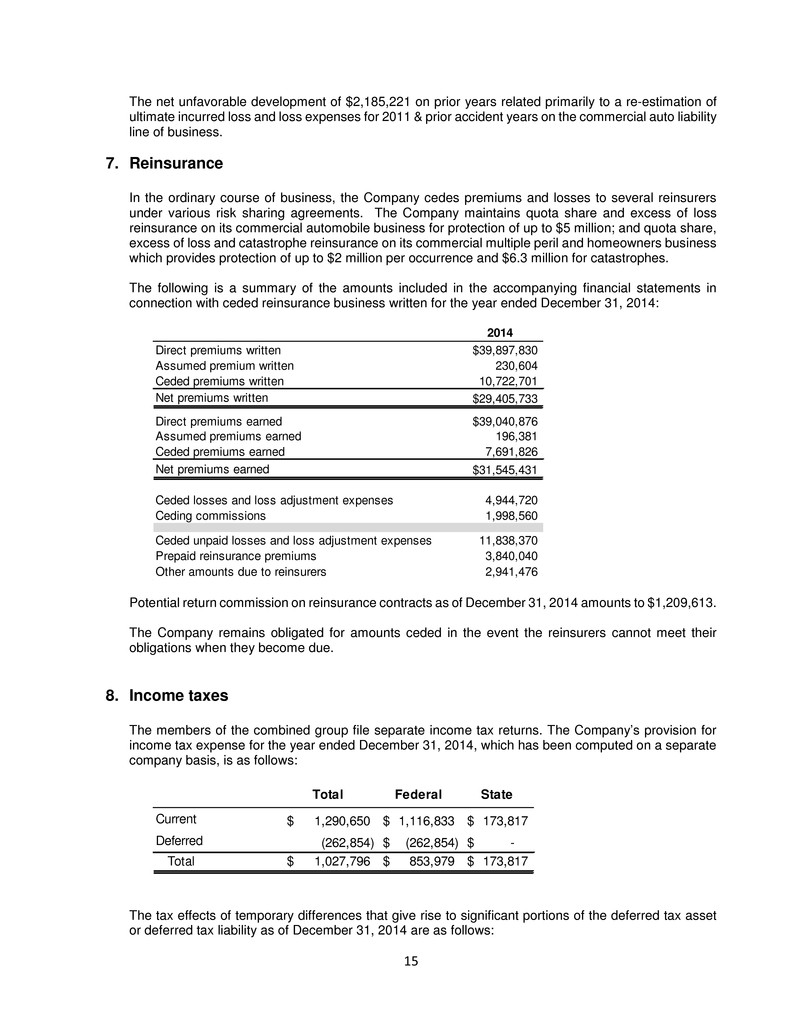
15 The net unfavorable development of $2,185,221 on prior years related primarily to a re-estimation of ultimate incurred loss and loss expenses for 2011 & prior accident years on the commercial auto liability line of business. 7. Reinsurance In the ordinary course of business, the Company cedes premiums and losses to several reinsurers under various risk sharing agreements. The Company maintains quota share and excess of loss reinsurance on its commercial automobile business for protection of up to $5 million; and quota share, excess of loss and catastrophe reinsurance on its commercial multiple peril and homeowners business which provides protection of up to $2 million per occurrence and $6.3 million for catastrophes. The following is a summary of the amounts included in the accompanying financial statements in connection with ceded reinsurance business written for the year ended December 31, 2014: Potential return commission on reinsurance contracts as of December 31, 2014 amounts to $1,209,613. The Company remains obligated for amounts ceded in the event the reinsurers cannot meet their obligations when they become due. 8. Income taxes The members of the combined group file separate income tax returns. The Company’s provision for income tax expense for the year ended December 31, 2014, which has been computed on a separate company basis, is as follows: The tax effects of temporary differences that give rise to significant portions of the deferred tax asset or deferred tax liability as of December 31, 2014 are as follows: 2014 Direct premiums written $39,897,830 Assumed premium written 230,604 Ceded premiums written 10,722,701 Net premiums written $29,405,733 Direct premiums earned $39,040,876 Assumed premiums earned 196,381 Ceded premiums earned 7,691,826 Net premiums earned $31,545,431 Ceded losses and loss adjustment expenses 4,944,720 Ceding commissions 1,998,560 Ceded unpaid losses and loss adjustment expenses 11,838,370 Prepaid reinsurance premiums 3,840,040 Other amounts due to reinsurers 2,941,476 Total Federal State Current 1,290,650$ 1,116,833$ 173,817$ Deferred (262,854) (262,854)$ -$ Total 1,027,796$ 853,979$ 173,817$
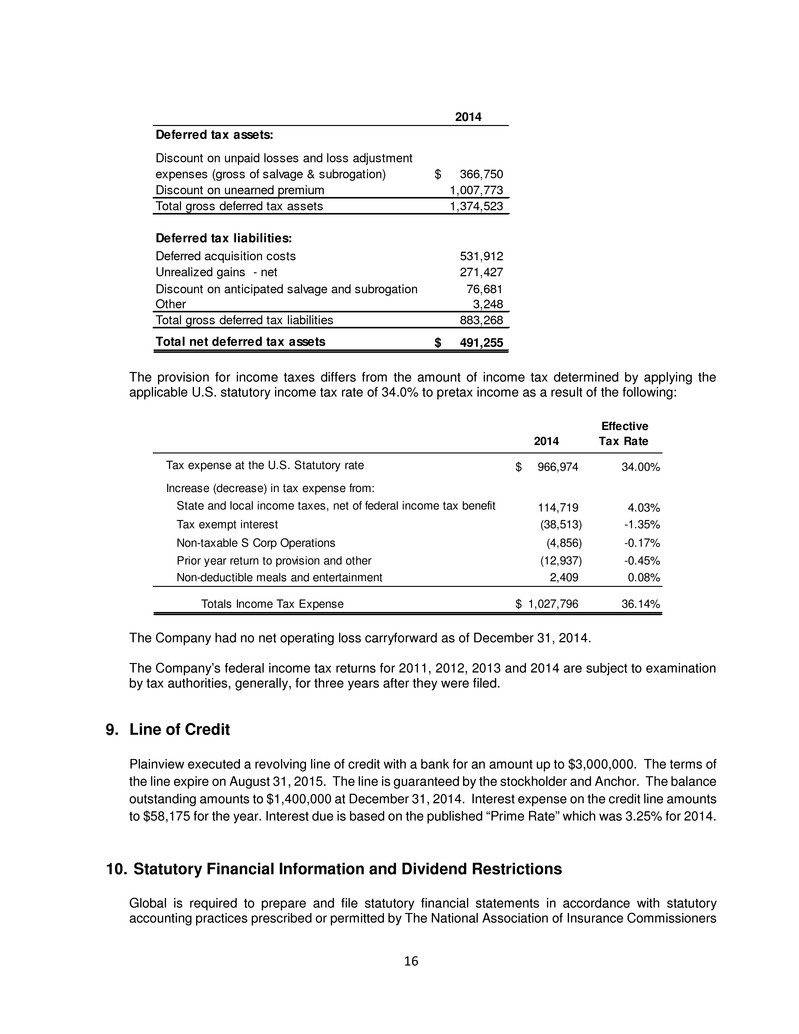
16 The provision for income taxes differs from the amount of income tax determined by applying the applicable U.S. statutory income tax rate of 34.0% to pretax income as a result of the following: The Company had no net operating loss carryforward as of December 31, 2014. The Company’s federal income tax returns for 2011, 2012, 2013 and 2014 are subject to examination by tax authorities, generally, for three years after they were filed. 9. Line of Credit Plainview executed a revolving line of credit with a bank for an amount up to $3,000,000. The terms of the line expire on August 31, 2015. The line is guaranteed by the stockholder and Anchor. The balance outstanding amounts to $1,400,000 at December 31, 2014. Interest expense on the credit line amounts to $58,175 for the year. Interest due is based on the published “Prime Rate” which was 3.25% for 2014. 10. Statutory Financial Information and Dividend Restrictions Global is required to prepare and file statutory financial statements in accordance with statutory accounting practices prescribed or permitted by The National Association of Insurance Commissioners 2014 Deferred tax assets: Discount on unpaid losses and loss adjustment expenses (gross of salvage & subrogation) 366,750$ Discount on unearned premium 1,007,773 Total gross deferred tax assets 1,374,523 Deferred tax liabilities: Deferred acquisition costs 531,912 Unrealized gains - net 271,427 Discount on anticipated salvage and subrogation 76,681 Other 3,248 Total gross deferred tax liabilities 883,268 Total net deferred tax assets 491,255$ 2014 Effective Tax Rate Tax expense at the U.S. Statutory rate 966,974$ 34.00% Increase (decrease) in tax expense from: State and local income taxes, net of federal income tax benefit 114,719 4.03% Tax exempt interest (38,513) -1.35% Non-taxable S Corp Operations (4,856) -0.17% Prior year return to provision and other (12,937) -0.45% Non-deductible meals and entertainment 2,409 0.08% Totals Income Tax Expense 1,027,796$ 36.14%
17 (“NAIC”) and the New York Department of Financial Services (“NYDFS”). As of and for the year ended December 31, 2014, Global’s statutory surplus and net income was $15,502,183 and $1,444,601, respectively. Global is required by New York State law to maintain a minimum of $3,550,000 of statutory policyholders’ surplus for the lines of business it is licensed to write. In addition, under the insurance laws of the State of New York, Global is restricted (on the basis of the lower of 10% of Global’s statutory surplus at the end of the preceding twelve-month period or 100% of Global’s adjusted net investment income for the preceding twelve-month period) as to the amount of dividends it may declare or pay in any twelve-month period without the prior approval of the NYDFS. Further, under New York State law, Global may pay cash dividends only from earned surplus determined on a statutory basis. Global has earned surplus of $11,588,339 from which dividends could be declared. The maximum dividend which could be declared without prior approval of the NYDFS was approximately $1,416,000. Global did not declare any dividends in 2014. The NAIC has a model law that establishes certain minimum risk-based capital (“RBC”) requirements for property/casualty insurance companies. The RBC calculation serves as a benchmark for the regulation of insurance companies by state insurance regulators. The calculation specifies various formulas and weighting factors that are applied to financial balances or various levels of activity, based on the perceived degree of risk and are set forth in the RBC requirements. At December 31, 2014, Global’s total statutory capital and surplus of $15,502,183 exceeded the NAIC’s RBC requirements. 11. Related Party Transactions For the year ended December 31, 2014, Global paid commission of approximately $7,737,572 to Anchor, which has been eliminated in combination. As of December 31, 2014, Anchor has made advances to its stockholder of $1,451,503. This balance bears interest at a rate of 1.40% per annum and is payable upon demand. Accrued and unpaid interest amounts to $31,495. Included in net investment income is accrued interest income for the current year on these advances of $18,082. As of December 31, 2014, the stockholder has made advances to the Company of $1,135,904. This balance bears interest at a rate of 1.40% per annum and is payable upon demand. Accrued and unpaid interest on this advance amounts to $193,103. Included in general and administrative expenses is accrued interest expense for 2014 of $15,903. In August 2014, the Company sold its internally developed policy administration and claims management software to American Horizon Software, LLC, (American Horizon) a limited liability company, owned by the Company’s sole stockholder. The sales price of $115,000 approximated book value. Anchor entered into a software license, support and services agreement with American Horizon whereby American Horizon granted a license for specific states and lines of business in exchange for a monthly fee beginning September 1, 2014. The Company incurred $140,000 under this agreement for 2014. 12. Commitments and Contingencies A. Cash The Company maintains cash balances (including overnight sweep accounts) at Federal Deposit Insurance Corporation (FDIC) insured institutions. The FDIC insures accounts up to $250,000 at these institutions. As of December 31, 2014 the Company had balances of $5,414,292 in one
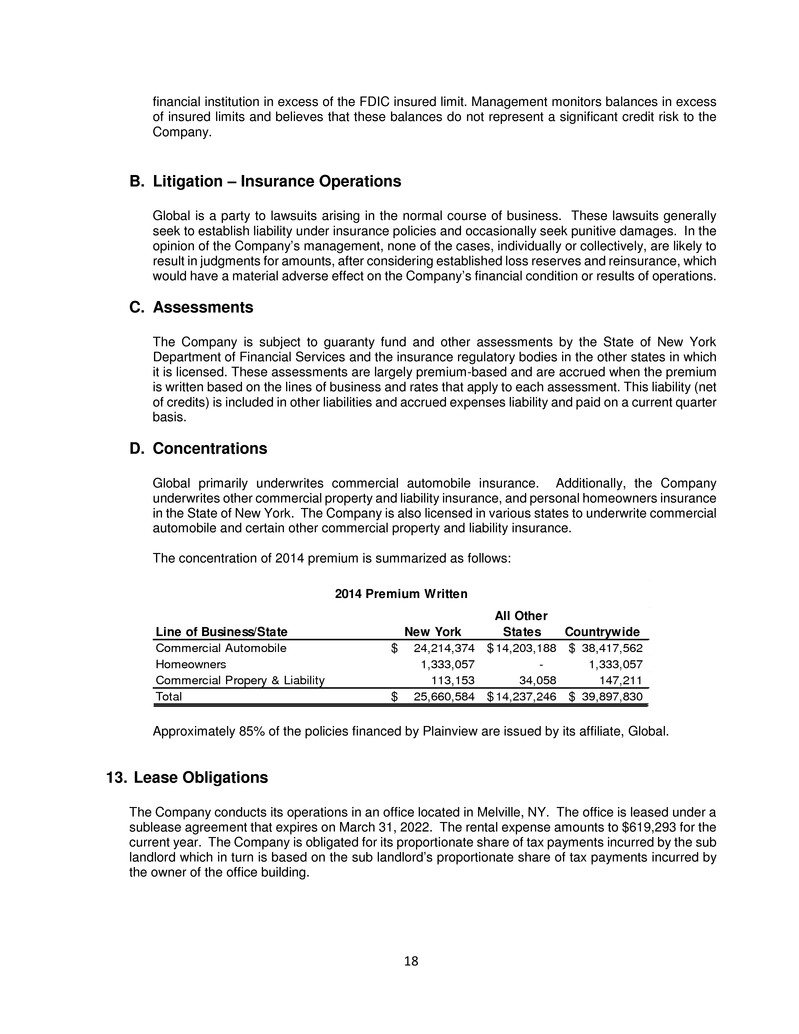
18 financial institution in excess of the FDIC insured limit. Management monitors balances in excess of insured limits and believes that these balances do not represent a significant credit risk to the Company. B. Litigation – Insurance Operations Global is a party to lawsuits arising in the normal course of business. These lawsuits generally seek to establish liability under insurance policies and occasionally seek punitive damages. In the opinion of the Company’s management, none of the cases, individually or collectively, are likely to result in judgments for amounts, after considering established loss reserves and reinsurance, which would have a material adverse effect on the Company’s financial condition or results of operations. C. Assessments The Company is subject to guaranty fund and other assessments by the State of New York Department of Financial Services and the insurance regulatory bodies in the other states in which it is licensed. These assessments are largely premium-based and are accrued when the premium is written based on the lines of business and rates that apply to each assessment. This liability (net of credits) is included in other liabilities and accrued expenses liability and paid on a current quarter basis. D. Concentrations Global primarily underwrites commercial automobile insurance. Additionally, the Company underwrites other commercial property and liability insurance, and personal homeowners insurance in the State of New York. The Company is also licensed in various states to underwrite commercial automobile and certain other commercial property and liability insurance. The concentration of 2014 premium is summarized as follows: Approximately 85% of the policies financed by Plainview are issued by its affiliate, Global. 13. Lease Obligations The Company conducts its operations in an office located in Melville, NY. The office is leased under a sublease agreement that expires on March 31, 2022. The rental expense amounts to $619,293 for the current year. The Company is obligated for its proportionate share of tax payments incurred by the sub landlord which in turn is based on the sub landlord’s proportionate share of tax payments incurred by the owner of the office building. Line of Business/State New York All Other States Countrywide Commercial Automobile 24,214,374$ 14,203,188$ 38,417,562$ Homeowners 1,333,057 - 1,333,057 Commercial Propery & Liability 113,153 34,058 147,211 Total 25,660,584$ 14,237,246$ 39,897,830$ 2014 Premium Written
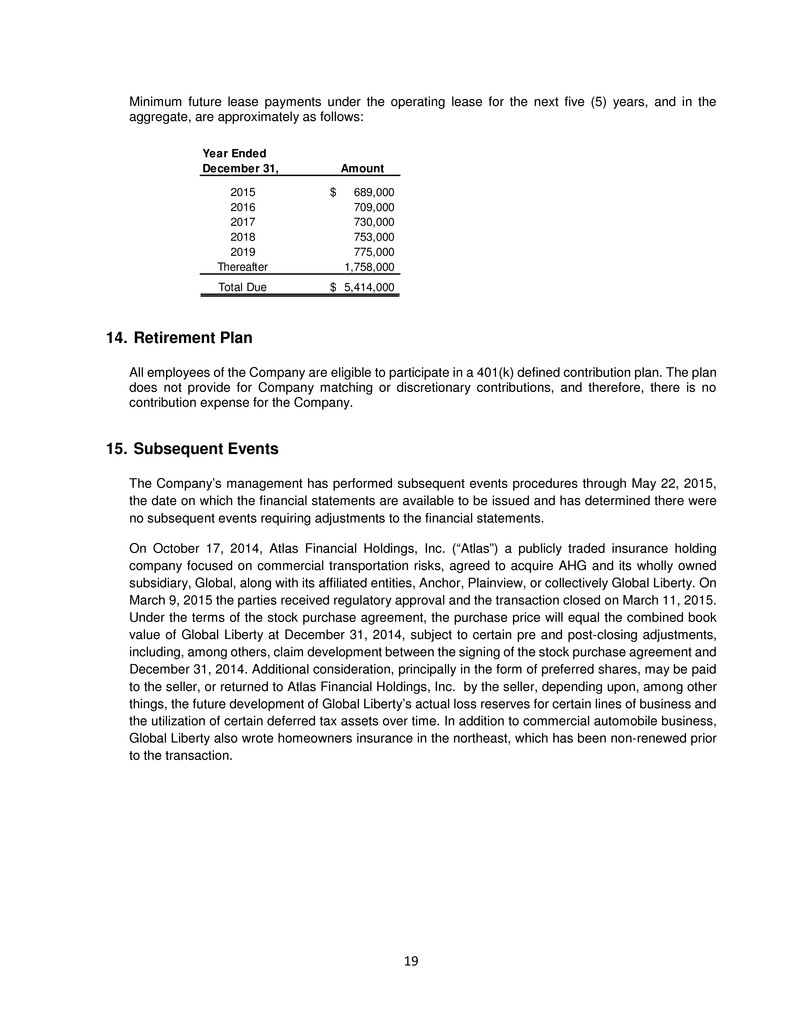
19 Minimum future lease payments under the operating lease for the next five (5) years, and in the aggregate, are approximately as follows: 14. Retirement Plan All employees of the Company are eligible to participate in a 401(k) defined contribution plan. The plan does not provide for Company matching or discretionary contributions, and therefore, there is no contribution expense for the Company. 15. Subsequent Events The Company’s management has performed subsequent events procedures through May 22, 2015, the date on which the financial statements are available to be issued and has determined there were no subsequent events requiring adjustments to the financial statements. On October 17, 2014, Atlas Financial Holdings, Inc. (“Atlas”) a publicly traded insurance holding company focused on commercial transportation risks, agreed to acquire AHG and its wholly owned subsidiary, Global, along with its affiliated entities, Anchor, Plainview, or collectively Global Liberty. On March 9, 2015 the parties received regulatory approval and the transaction closed on March 11, 2015. Under the terms of the stock purchase agreement, the purchase price will equal the combined book value of Global Liberty at December 31, 2014, subject to certain pre and post-closing adjustments, including, among others, claim development between the signing of the stock purchase agreement and December 31, 2014. Additional consideration, principally in the form of preferred shares, may be paid to the seller, or returned to Atlas Financial Holdings, Inc. by the seller, depending upon, among other things, the future development of Global Liberty’s actual loss reserves for certain lines of business and the utilization of certain deferred tax assets over time. In addition to commercial automobile business, Global Liberty also wrote homeowners insurance in the northeast, which has been non-renewed prior to the transaction. Year Ended December 31, Amount 2015 689,000$ 2016 709,000 2017 730,000 2018 753,000 2019 775,000 Thereafter 1,758,000 Total Due 5,414,000$


