UNITED STATES
SECURITIES AND EXCHANGE COMMISSION
WASHINGTON, D.C. 20549
FORM N-CSR
CERTIFIED SHAREHOLDER REPORT OF REGISTERED MANAGEMENT
INVESTMENT COMPANIES
Investment Company Act file number
811-22669
AmericaFirst Quantitative Funds
(Exact name of registrant as specified in charter)
17605 Wright Street, Omaha, Nebraska 68130
(Address of principal executive offices)
(Zip code)
James Ash, Gemini Fund Services, LLC.
80 Arkay Drive, Hauppauge, NY 11788
(Name and address of agent for service)
Registrant's telephone number, including area code:
631-470-2619
Date of fiscal year end:
6/30
Date of reporting period: 6/30/14
Item 1. Reports to Stockholders.
ANNUAL REPORT
AmericaFirst Defensive Growth Fund
AmericaFirst Income Trends Fund
AmericaFirst Absolute Return Fund
AmericaFirst Quantitative Strategies Fund
AmericaFirst Seasonal Trends Fund
June 30, 2014

AmericaFirst Quantitative Funds
c/o Gemini Fund Services, LLC
17605 Wright Street, Suite 2
Omaha, NE 68130
AmericaFirst Capital Management, LLC is located at 8150 Sierra College Blvd (Suite 290), Roseville, CA.The Funds’ distributor is Northern Lights Distributors, LLC. AmericaFirst Capital Management, LLC is an owner of Matrix Capital Group, Inc. AmericaFirst is not affiliated with Burlington Capital Group, LLC (formerly America First Companies) or any of its subsidiaries.
![[f2shareholderletter001.jpg]](https://capedge.com/proxy/N-CSR/0000910472-14-004108/f2shareholderletter001.jpg)
Dear Shareholder:
AmericaFirst Capital Management is pleased to announce the Fiscal Year 2014 annual report and performance for the AmericaFirst family of mutual funds.
Performance as of 6/30/20141
Fund (Without Sales Load) | Class | 1 Year | 3 Year | 5 Year | Since Inception |
Defensive Growth Fund | A | 16.22% | 13.33% |
| 12.82%2 |
Income Trends Fund | A | 7.83% | 4.06% |
| 5.12%3 |
Absolute Return Fund | A | 29.28% | 5.99% |
| 5.96%4 |
Quantitative Strategies Fund | A | 20.34% | 11.39% | 15.99% | 1.78%5 |
Seasonal Trends Fund | A | NA | NA | NA | 3.70%6 |
At AmericaFirst, we believe that emotion is a primary risk factor affecting investors. Greed prompts investors to buy high while fear causes them to sell low. There is also the risk of comfort creating a false sense of security resulting in inaction.
AmericaFirst’ s management team strongly believes in the discipline derived from performing extensive back testing of securities performance characteristics in any type of economic environment. The result of this quantitative research provides the basis for rules-based investment strategies and models. There is no guarantee that any investment strategy will achieve its objectives, generate profits or avoid losses.
We learn from history so you won’t have to!!
1 The performance data quoted here represents past performance. Current performance may be lower or higher than the performance data quoted. Past performance is no guarantee of future results. The investment return and principal value of an investment will fluctuate so that investors’ shares, when redeemed, may be worth more or less than their original cost. Review the Funds’ prospectus for more information regarding the Funds’ fees and expenses, including other share classes. For performance information current to the most recent month-end, call toll free (866) 960-1355.
2 Inception date – May 23, 2011
3 Inception date – July 1, 2010
4 Inception date February 26, 2010
5 Inception date – September 28, 2007
6 Inception Date – October 31, 2013
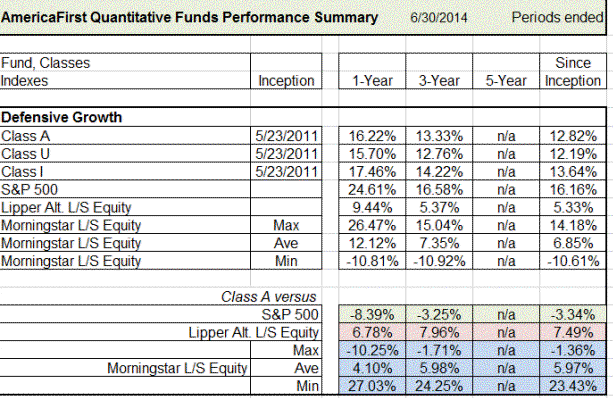
AmericaFirst Defensive Growth Fund
(A Shares: DGQAX, U Shares: DGQUX, I Shares: DGQIX)
Objective: The Fund seeks to provide capital appreciation with a focus on producing positive returns regardless of the directions of financial markets.
The Fund’s investment adviser has entered into an expense limitation agreement whereby the Advisor has contractually agreed to waive a portion of its fees and/or reimburse certain Fund expenses (exclusive, with respect to the Fund’s Class A and U Shares, of any front-end or contingent deferred loads, taxes, leverage interest, brokerage commissions, expenses incurred in connection with any merger or reorganization, dividend expense on securities sold short, underlying fund fees and expenses or extraordinary expenses such as litigation, and with respect to the Fund’s Class I shares, exclusive of any front-end or contingent deferred loads, taxes, brokerage commissions, expenses incurred in connection with any merger or reorganization, underlying fund fees and expenses or extraordinary expenses such as litigation) in order to limit annual fund operation expenses to 2.45%, 2.95% and 1.94% for Class A, Class U and Class I, respectively. These expense limitations will remain in effect until at least October 31, 2015. This agreement may be terminated by the Fund's Board of Trustees on 60 days’ written notice to the Advisor. These fee waivers and expense reimbursements are subject to possible recoupment from the Fund in future years on a rolling three-year basis (within the three years after the fees have been waived or reimbursed) if such recoupment can be achieved within the foregoing expense limits. This information was disclosed in the prospectus dated October 31, 2013.
In the Fiscal Year End June 2014, the AmericaFirst Defensive Growth Fund Class A shares returned 16.22%. This compares to the S&P 500, which returned 24.61%. Since inception, the Fund has returned an annualized 12.82%, underperforming the S&P 500 by 3.34%. The Fund has outperformed both its Lipper and Morningstar Long/Short Equity benchmarks for the 1 and 3 year periods as well as since inception.
The Defensive Growth Fund provides a unique approach to defensive equity investing by combining a portfolio of defensive, non-cyclical stocks with a portfolio of short positions designed to provide capital appreciation when equities are down.
Overall risk and portfolio statistics remain favorable. The Fund has experienced a 76% upside capture ratio and a 53% downside capture ratio since inception. Up-market correlation is 43% versus down correlation of 51%. Up Beta is 0.48 while down Beta is 0.54.
We continue to believe that the Defensive Growth Fund represents an excellent core selection for investors who are looking for a balanced portfolio of investments which are designed to provide favorable returns versus the S&P 500 through taking advantage of the long-term performance attributes of stocks in defensive industries. The Fund’s approximate 0% to 25% short position also provides potential benefit in volatile market environments.
AmericaFirst Income Trends Fund
(A Shares: AFPAX, U Shares: AFPUX, I Shares: AFPIX)
Objective: The Fund seeks to achieve a high rate of current income and total return with lower volatility than common stocks as measured by the standard deviation.
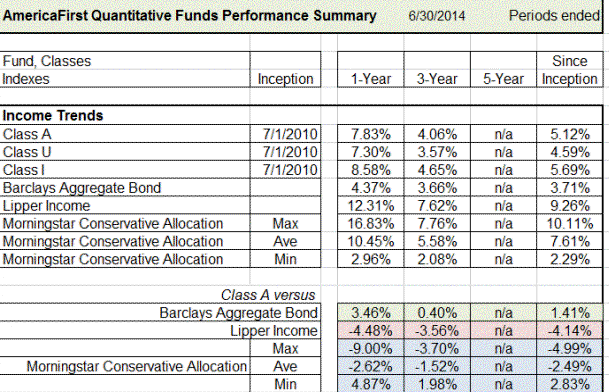
The Fund's investment adviser has entered into an expense limitation agreement whereby the Advisor has contractually agreed to waive a portion of its fees and/or reimburse certain Fund expenses (exclusive, with respect to the Fund’s Class A and U shares, of any front-end or contingent deferred loads, taxes, leverage interest, brokerage commissions, expenses incurred in connection with any merger or reorganization, dividend expense on securities sold short, underlying fund fees and expenses or extraordinary expenses such as litigation and with respect to the Fund’s Class I shares, exclusive of any front-end or contingent deferred loads, taxes, brokerage commissions, expenses incurred in connection with any merger or reorganization, underlying fund fees and expenses or extraordinary expenses such as litigation) in order to limit annual fund operation expenses to 2.20%, 2.70% and 1.40% for Class A, Class U and Class I, respectively. These expense limitations will remain in effect until at least October 31, 2015. This agreement may be terminated by the Fund's Board of Trustees on 60 days’ written notice to the Advisor. These fee waivers and expense reimbursements are subject to possible recoupment from the Fund in future years on a rolling three-year basis (within the three years after the fees have been waived or reimbursed) if such recoupment can be achieved within the foregoing expense limits. This information was disclosed in the prospectus dated October 31, 2013. For fiscal year ended June 30, 2014, the Fund distributed $0.66 Class A, $0.61 Class U, and $0.71 Class I in distributions. Of these amounts, a portion of these distributions has been categorized as Return of Capital.
In the Fiscal Year End June 2014, the AmericaFirst Income Trends Fund Class A shares returned 7.83%. This compares to the Barclay’s Aggregate Bond Index, which returned 4.37%. The Fund has outperformed the Barclay’s Aggregate Bond Index benchmark for the 1 year, 3 year and since inception time periods. The Fund has underperformed the Lipper Income and Morningstar Conservative Allocation benchmarks for the 1 year, 3 year and since inception periods.
Overall risk and portfolio statistics (versus the S&P 500) remain favorable. The Fund has experienced a 41% upside capture ratio and a 58% downside capture ratio since inception. Up-market correlation is 50% versus down-market correlation of 43%. Up Beta is 0.29 while down Beta is 0.46.
We continue to believe that the Income Trends Fund represents an excellent selection for clients who are looking for a balanced portfolio of income assets which are designed to provide a higher yield than the Barclays Aggregate Bond Index and mitigate the risk of a potential increase in market interest rates or inflation over time.
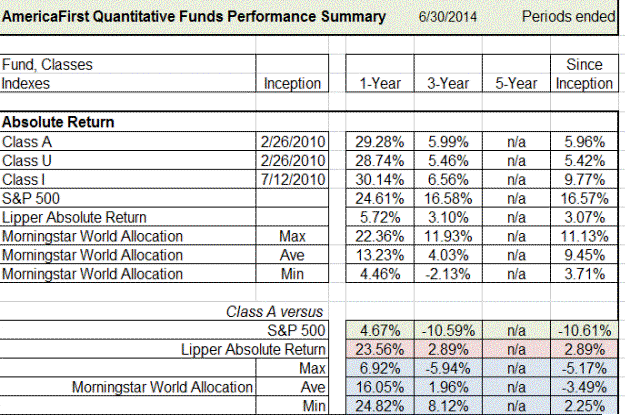
AmericaFirst Absolute Return Fund
(A Shares: ABRFX, U Shares: ABRUX, I Shares: ABRWX)
Objective: The Fund seeks to provide capital appreciation with a focus on producing positive returns regardless of the directions of financial markets.
The Fund's investment adviser has entered into an expense limitation agreement whereby the Advisor has contractually agreed to waive a portion of its fees and/or reimburse certain Fund expenses (exclusive, with respect to the Fund’s Class A and U shares, of any front-end or contingent deferred loads, taxes, leverage interest, brokerage commissions, expenses incurred in connection with any merger or reorganization, dividend expense on securities sold short, underlying fund fees and expenses or extraordinary expenses such as litigation and with respect to the Fund’s Class I shares, exclusive of any front-end or contingent deferred loads, taxes, brokerage commissions, expenses incurred in connection with any merger or reorganization, underlying fund fees and expenses or extraordinary expenses such as litigation) in order to limit annual fund operation expenses to 2.45%, 2.95% and 1.74% for Class A, Class U and Class I, respectively. These expense limitations will remain in effect until at least October 31, 2015. This agreement may be terminated by the Fund's Board of Trustees on 60 days’ written notice to the Advisor. These fee waivers and expense reimbursements are subject to possible recoupment from the Fund in future years on a rolling three-year basis (within the three years after the fees have been waived or reimbursed) if such recoupment can be achieved within the foregoing expense limits. This information was disclosed in the prospectus dated October 30, 2013.
In the Fiscal Year End June, 2014, the AmericaFirst Absolute Return Fund Class A shares returned 29.28%. This compares to the S&P 500, which returned 24.61%. Since inception, the Fund has returned an annualized 5.96%, underperforming the S&P 500 by 10.61%. The Fund has outperformed the Morningstar World Allocation benchmarks for the 1 and 3 year periods and has underperformed the benchmark since inception. The Fund outperformed the Lipper Absolute Return benchmark for the 1 year, 3 year and since inception periods.
The Absolute Return Fund follows a data-driven process to seek out the most attractive investment opportunities. The Fund is not limited to just stocks and bonds. The Fund invests in securities represented by the following investment indices:
·
Domestic Equity
o
Healthcare, Financial Services, Technology, Industrials, Oil & Gas, Basic Materials, Consumer Goods, Consumer Services, Utilities, Telecommunications.
·
Domestic Income
o
High Yield Bonds, Investment Grade Bonds, Preferred Stock
·
International Equity
o
Latin America, Western Europe, Australia, Asia, Russia, South Africa
·
International Income
o
Global Bonds (Established and Emerging Markets)
·
Alternative
o
Base Metals, Precious Metals, Energy Futures, Agricultural Futures, Currencies, REITS
The Fund also has the ability to short up to approximately 20% of its portfolio to provide an additional hedge against downward, spiraling markets.
We continue to believe that the Absolute Return Fund represents an excellent selection for long-term investors who are looking for a total return vehicle. As the Fund continues to season, we believe that performance will continue to improve relative to the broad market indices.
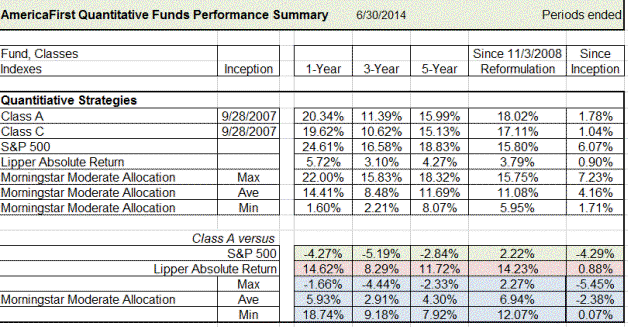
AmericaFirst Quantitative Strategies Fund
(A Shares: AFIAX, C Shares: AFISX)
Objective: The Fund seeks to provide capital appreciation with a focus on producing positive returns regardless of the directions of financial markets.
The Fund's investment adviser has entered into an expense limitation agreement whereby the Advisor has contractually agreed to waive a portion of its fees and/or reimburse certain Fund expenses (exclusive of any front-end or contingent deferred loads, taxes, leverage interest, brokerage commissions, expenses incurred in connection with any merger or reorganization, dividend expense on securities sold short, underlying fund fees and expenses or extraordinary expenses such as litigation) in order to limit annual fund operation expenses to 1.50% and 2.25% for Class A and Class C, respectively. These expense limitations will remain in effect until at least October 31, 2015. This agreement may be terminated by the Fund's Board of Trustees on 60 days’ written notice to the Advisor. These fee waivers and expense reimbursements are subject to possible recoupment from the Fund in future years on a rolling three-year basis (within the three years after the fees have been waived or reimbursed) if such recoupment can be achieved within the foregoing expense limits. This information was disclosed in the prospectus dated October 30, 2013.
In the Fiscal Year End June, 2014, the AmericaFirst Quantitative Strategies Fund Class A shares returned 20.34%. This compares to the S&P 500, which returned 24.61%. In the past five years the Fund class A shares have returned an annualized 15.99%, underperforming the S&P 500 by 2.84%. The Fund outperformed the Lipper Absolute Return benchmark for the 1, 3, 5 year periods as well as since inception. The Fund outperformed the Morningstar Moderate Allocation benchmark for the 1, 3 and 5 year periods, but underperformed for the since inception period.
The Fund’s strategy was reformulated in November 2008 to the current multi-strategy focus. Since the reformulation, the Fund has gained 18.02% versus an increase of 15.80% for the S&P 500 and 3.79% for the Lipper benchmark.
The Quantitative Strategies Fund currently employs the following five AmericaFirst Investment Models:
·
All Assets Model
o
With the ability to select from a starting universe of over 30 different investment indices and over 50,000 securities. The All Assets Model seeks diversification beyond stocks and bonds.
·
Seasonal Model
o
The Seasonal Model seeks to exploit seasonal trends dating back to the early 1900s by owning stocks November through April and bonds May through October.
·
Defensive Stock Model
o
The Defensive Stock Model seeks capital appreciation through all stock market cycles by investing in a portfolio of defensive, non-cyclical stocks of companies whose earnings are less impacted by economic conditions. Defensive sectors include Utilities, Healthcare and Consumer Staples.
·
Corporate Bond Model
o
The Corporate Bond Model provides an unemotional and time tested approach to selecting bonds. The Model selects from a historical database of over ½ million bonds based on traditional evaluation criteria combined with technical analysis typically reserved for the equity and commodity markets.
·
Master Limited Partnerships (MLP) Model
o
The MLP Model selects from the 25 most liquid limited partnerships by evaluating a company’s earnings, valuation and price momentum.
Overall risk and portfolio statistics remain favorable. The Fund has experienced a 96% upside capture ratio and a 67% downside capture ratio since inception. Up correlation is 73% versus down correlation of 71%. Up Beta is 0.94 while down Beta is 0.78.
We continue to believe that the Quantitative Strategies Fund represents an excellent selection for investors who are looking for a core portfolio allocation designed to provide favorable returns versus the S&P 500 and relevant benchmark indices that seeks less overall portfolio volatility and risk.
AmericaFirst Seasonal Trends Fund
(A Shares: STQAX, U Shares: STQUX, I Shares: STQIX)
Objective: The Fund seeks to achieve capital appreciation with a focus on producing positive returns regardless of the direction of the financial markets.
The Fund's investment adviser has entered into an expense limitation agreement whereby the Advisor has contractually agreed to waive a portion of its fees and/or reimburse certain Fund expenses (exclusive, with respect to the Fund’s Class A and U shares, of any front-end or contingent deferred loads, taxes, leverage interest, brokerage commissions, expenses incurred in connection with any merger or reorganization, dividend expense on securities sold short, underlying fund fees and expenses or extraordinary expenses such as litigation and with respect to the Fund’s Class I shares, exclusive of any front-end or contingent deferred loads, taxes, brokerage commissions, expenses incurred in connection with any merger or reorganization, underlying fund fees and expenses or extraordinary expenses such as litigation) in order to limit annual fund operation expenses to 2.45%, 2.95% and 1.95% for Class A, Class U and Class I, respectively. These expense limitations will remain in effect until at least October 31, 2015. This agreement may be terminated by the Fund's Board of Trustees on 60 days’ written notice to the Advisor. These fee waivers and expense reimbursements are subject to possible recoupment from the Fund in future years on a rolling three-year basis (within the three years after the fees have been waived or reimbursed) if such recoupment can be achieved within the foregoing expense limits.
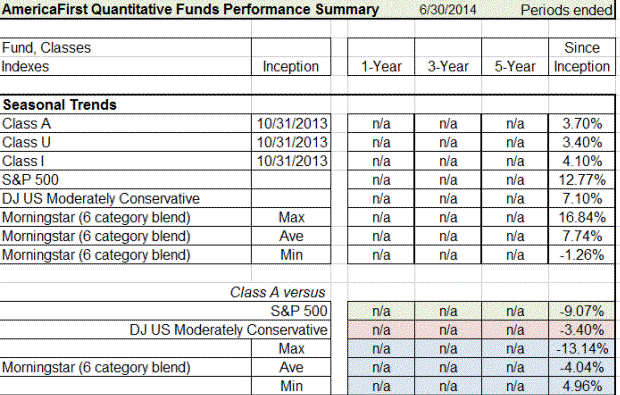
The Seasonal Trends Fund was launched on October 31, 2013. During the Fiscal Year 2014 stub period ending June 2014, the AmericaFirst Seasonal Trends Fund Class A shares gained 3.70%. This compares to the S&P 500 which increased 12.77%. The Fund has underperformed the Dow Jones US Moderately Conservative Index and the Morningstar (6 category blend) benchmarks in the since inception period.
The Seasonal Trends Fund employs a “Seasonal” strategy to allocate assets between equity and fixed income securities. This strategy is based upon the Advisor’s study of seasonal price patterns in asset classes over various time periods. The Advisor anticipates rebalancing Fund holdings to reduce equity exposure in May and increasing it in November.
Summary:
The Adviser, AmericaFirst Capital Management, was founded by a group of financial advisors with one primary goal in mind: to design and sponsor investment products which serve the needs and objectives of our peers, their clients and investors. As advisors, we understand that you are perpetually seeking to identify ways to maximize value for your investment portfolios, while at the same time sheltering them from excess risk. We also believe that one of the greatest risks in the investment process is relying on too little information or too much emotion when selecting securities. We therefore strive to create products that both fill a need in the investment community, while at the same time identifying the quantitative ‘fingerprints’ of success.
We want to thank you again for placing your trust in AmericaFirst’s investment process. In return, we will strive to continue providing the best products and solutions for you and your client’s needs.
Best Regards,
Rick Gonsalves
Portfolio Manager and CEO, AmericaFirst Capital Management, LLC
Definitions:
1.
Beta is a measure of a security's volatility relative to the market. Up Beta measures the relative volatility in positive markets while Down Beta measures the relative volatility in down markets.
2.
Correlation is a statistical measure of how investments move in relation to each other. Up Correlation measures the relationship of the Fund to stocks in positive markets while Down Correlation measures the relationship of the Fund to stocks in down markets.
3.
Up-capture compares an investment’s performance against its benchmark during periods when the benchmark’s performance is positive, while Down-capture compares the investment’s performance against the benchmark during periods when the benchmark’s performance is negative. A value of 100% for either ratio implies that the investment fully captures, or matches, the benchmark return during the period evaluated. A value of greater than 100% indicates that the investment captured more upside or downside than the benchmark.
4.
Standard Deviation shows how much variation or "dispersion" exists from the average (mean, or expected value). A low standard deviation indicates that the data points tend to be very close to the mean (or less volatile); whereas high standard deviation indicates that the data points are spread out over a large range of values (more volatile).
5.
S&P 500 Index - The S&P 500® has been widely regarded as the best single gauge of the large cap U.S. equities market since the index was first published in 1957. The index has over US$ 5.58 trillion benchmarked, with index assets comprising approximately US$ 1.31 trillion of this total. The index includes 500 leading companies in leading industries of the U.S. economy, capturing 75% coverage of U.S. equities.
6.
Morningstar Moderate Allocation: Moderate-allocation portfolios seek to provide both capital appreciation and income by investing in three major areas: stocks, bonds, and cash. These portfolios tend to hold larger positions in stocks than conservative-allocation portfolios. These portfolios typically have 50% to 70% of assets in equities and the remainder in fixed income and cash. For comparative purposes, the fund universe was filtered for funds with assets under management less than $50 million.
7.
Morningstar Conservative Allocation: Conservative-allocation portfolios seek to provide both capital appreciation and income by investing in three major areas: stocks, bonds, and cash. These portfolios tend to hold smaller positions in stocks than moderate-allocation portfolios. These portfolios typically have 20% to 50% of assets in equities and 50% to 80% of assets in fixed income and cash. For comparative purposes, the fund universe was filtered for funds with assets under management less than $25 million.
8.
Morningstar World Allocation: World-allocation portfolios seek to provide both capital appreciation and income by investing in three major areas: stocks, bonds, and cash. While these portfolios do explore the whole world, most of them focus on the U.S., Canada, Japan, and the larger markets in Europe. It is rare for such portfolios to invest more than 10% of their assets in emerging markets. These portfolios typically have at least 10% of assets in bonds, less than 70% of assets in stocks, and at least 40% of assets in non-U.S. stocks or bonds. For comparative purposes, the fund universe was filtered for funds with assets under management less than $25 million.
9.
Lipper Absolute Return: Absolute Return portfolios seek to achieve an absolute return in the reference currency within a certain value at risk quintile relative to that reference currency group.
10.
Lipper Long Short Equity: Long Short portfolios employ strategies combining long holdings of equities with short sales of equity, equity options, or equity index options. The funds may be either net long or net short, depending on the portfolio manager’s view of the market.
11.
The Barclays Aggregate Bond Index, which used to be called the "Lehman Aggregate Bond Index," is a broad base index, maintained by Barclays Capital, which took over the index business of the now defunct Lehman Brothers, and is often used to represent investment grade bonds being traded in United States. Index funds and exchange-traded funds are available that track this bond index.
12.
Morningstar U.S. Long/Short Equity: These funds primarily take long and short positions in U.S. equities. These funds follow a strategy in which at least 75% of the fund's gross exposure is in equities, and 75% of equities exposure is in U.S. equities. The fund may also include some derivative instruments. These funds tend to have betas of 0.3 and higher relative to broad U.S. indexes like the S&P 500 and DJ Wilshire 5000. For comparative purposes, the fund universe was filtered for funds with assets under management less than $25 million.
4324-NLD-8/27/2014
AMERICAFIRST QUANTITATIVE FUNDS ANNUAL REPORT
June 30, 2014
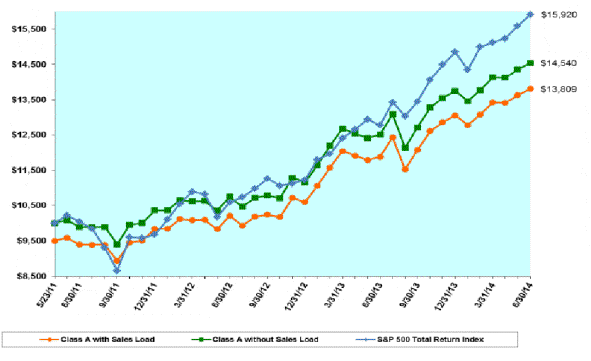
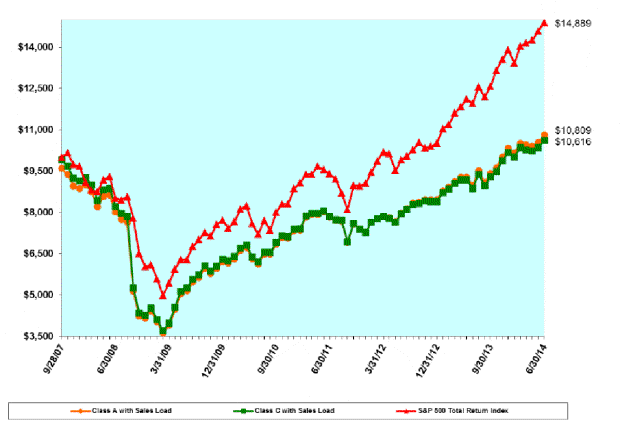
COMPARISON OF A $10,000 INVESTMENT IN THE AMERICAFIRST DEFENSIVE GROWTH FUND CLASS A SHARES AND THE S&P 500 TOTAL RETURN INDEX (Unaudited)
Average Annual Total Return
|
| One Year | 3 Year | Commencement of Operations | |
|
|
|
| through June 30, 2014 (1) | |
Class A | Without sales load | 16.22% | 13.33% | 12.82% | |
With sales load | 10.40% | 11.39% | 10.96% | ||
Class U | Without sales load | 15.70% | 12.76% | 12.19% | |
With sales load | 12.84% | 11.79% | 11.27% | ||
Class I | 17.46% | 14.22% | 13.64% | ||
S&P 500 Total Return Index | 24.61% | 16.58% | 16.16% | ||
(1)
AmericaFirst Defensive Growth Fund Class A, Class U and Class I shares commenced operations on May 23, 2011. Redemption fees are a 1% of amount redeemed, if sold within 90 days.
The performance information quoted in this annual report assumes the reinvestment of all dividend and capital gain distributions, if any, and represents past performance, which is not a guarantee of future results. The returns shown do not reflect taxes that a shareholder would pay on Fund distributions or on the redemption of Fund shares. The investment return and principal value of an investment will fluctuate and, therefore, an investor’s shares, when redeemed, may be worth more or less than their original cost. Updated performance data current to the most recent month-end can be obtained by calling 1-877-217-8363.
The above graph depicts the performance of the AmericaFirst Defensive Growth Fund Class A shares versus the S&P 500 Total Return Index. The S&P 500 Total Return Index by Standard and Poor’s Corp. is a capitalization-weighted index comprising 500 issues listed on various exchanges, representing the performance of the stock market generally. Please note that indices do not take into account any fees and expenses of investing in the individual securities that they track and individuals cannot invest directly in any index.
As with any fund, save an index fund, that commonly compares its performance to the S&P 500 Total Return Index, such a comparison may be said to be inappropriate because of the dissimilarity between the Fund’s investments and the securities comprising the index; so too with the AmericaFirst Defensive Growth Fund, which will not invest in certain securities comprising this index.
AMERICAFIRST QUANTITATIVE FUNDS ANNUAL REPORT
June 30, 2014
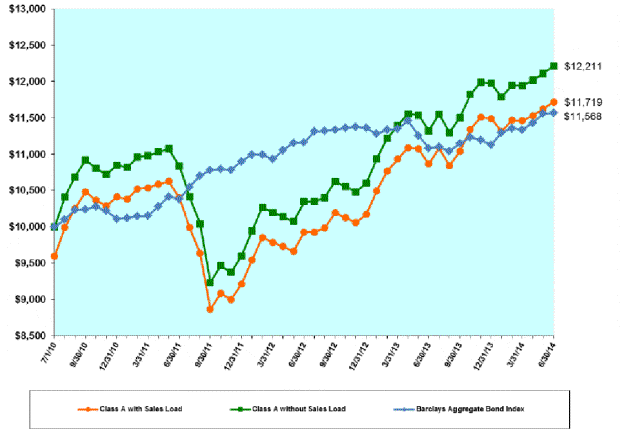
COMPARISON OF A $10,000 INVESTMENT IN THE AMERICAFIRST INCOME TRENDS FUND CLASS A SHARES AND THE BARCLAYS AGGREGATE BOND INDEX (Unaudited)
Average Annual Total Return
|
| One Year | Three Year | Commencement of Operations | |
|
|
|
| through June 30, 2014 (1) | |
Class A | Without sales load | 7.83% | 4.06% | 5.12% | |
With sales load | 3.56% | 2.66% | 4.05% | ||
Class U | Without sales load | 7.30% | 3.57% | 4.59% | |
With sales load | 5.14% | 2.86% | 4.08% | ||
Class I | 8.58% | 4.65% | 5.69% | ||
Barclays Aggregate Bond Index | 4.37% | 3.66% | 3.71% | ||
(1)
AmericaFirst Income Trends Fund Class A, Class U and Class I shares commenced operations on July 1, 2010.
The performance information quoted in this annual report assumes the reinvestment of all dividend and capital gain distributions, if any, and represents past performance, which is not a guarantee of future results. The returns shown do not reflect taxes that a shareholder would pay on Fund distributions or on the redemption of Fund shares. The investment return and principal value of an investment will fluctuate and, therefore, an investor’s shares, when redeemed, may be worth more or less than their original cost. Updated performance data current to the most recent month-end can be obtained by calling 1-877-217-8363.
The above graph depicts the performance of the AmericaFirst Income Trends Fund Class A shares versus the Barclays Aggregate Bond Index. The Barclays Aggregate Bond Index is an unmanaged index which represents the U.S. investment-grade fixed-rate bond market (including government and corporate securities, mortgage pass-through securities and asset-backed securities). Investors cannot invest directly in an index or benchmark.
As with any fund, save an index fund, that commonly compares its performance to the Barclays Aggregate Bond Index, such a comparison may be said to be inappropriate because of the dissimilarity between the Fund’s investments and the securities comprising the index; so too with the AmericaFirst Income Trends Fund, which will not invest in certain securities comprising this index.
AMERICAFIRST QUANTITATIVE FUNDS ANNUAL REPORT
June 30, 2014
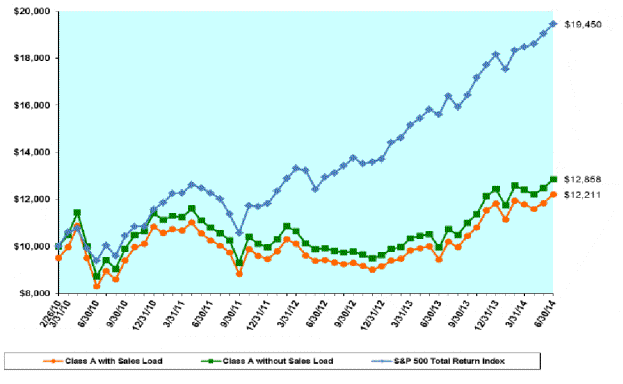
COMPARISON OF A $10,000 INVESTMENT IN THE AMERICAFIRST ABSOLUTE RETURN FUND CLASS A SHARES AND THE S&P 500 TOTAL RETURN INDEX (Unaudited)
Average Annual Total Return
|
| 1 Year | 3 Year | Commencement of Operations | |
|
|
|
| through June 30, 2014 (1) | |
Class A | Without sales load | 29.28% | 5.99% | 5.96% | |
With sales load | 22.80% | 4.19% | 4.71% | ||
Class U | Without sales load | 28.74% | 5.46% | 5.42% | |
With sales load | 25.59% | 4.59% | 4.80% | ||
Class I (2) | 30.14% | 6.56% | 9.77% | ||
S&P 500 Total Return Index | 24.61% | 16.58% | 16.57% | ||
(1)
AmericaFirst Absolute Return Fund Class A and Class U shares commenced operations on February 26, 2010. Benchmark since inception return assumes inception date of February 26, 2010.
(2)
AmericaFirst Absolute Return Fund Class I commenced operations on July 12, 2010.
The performance information quoted in this annual report assumes the reinvestment of all dividend and capital gain distributions, if any, and represents past performance, which is not a guarantee of future results. The returns shown do not reflect taxes that a shareholder would pay on Fund distributions or on the redemption of Fund shares. The investment return and principal value of an investment will fluctuate and, therefore, an investor’s shares, when redeemed, may be worth more or less than their original cost. Updated performance data current to the most recent month-end can be obtained by calling 1-877-217-8363.
The above graph depicts the performance of the AmericaFirst Absolute Return Fund Class A shares versus the S&P 500 Total Return Index. The S&P 500 Total Return Index by Standard and Poor’s Corp. is a capitalization-weighted index comprising 500 issues listed on various exchanges, representing the performance of the stock market generally. Please note that indices do not take into account any fees and expenses of investing in the individual securities that they track and individuals cannot invest directly in any index.
As with any fund, save an index fund, that commonly compares its performance to the S&P 500 Total Return Index, such a comparison may be said to be inappropriate because of the dissimilarity between the Fund’s investments and the securities comprising the index; so too with the AmericaFirst Absolute Return Fund, which will not invest in certain securities comprising this index.
AMERICAFIRST QUANTITATIVE FUNDS ANNUAL REPORT
June 30, 2014
COMPARISON OF A $10,000 INVESTMENT IN THE AMERICAFIRST QUANTITATIVE STRATEGIES FUND AND THE S&P 500 TOTAL RETURN INDEX (Unaudited)
Average Annual Total Return
|
|
|
|
| Commencement of Operations | |
|
| 1 Year | 3 Year | 5 Year | through June 30, 2014 (1) | |
Class A | Without sales load | 20.34% | 11.39% | 15.99% | 1.78% | |
With sales load | 15.56% | 9.88% | 15.04% | 1.16% | ||
Class C | Without sales load | 19.62% | 10.62% | 15.13% | 1.04% | |
With sales load | 18.49% | 10.23% | 14.90% | 0.89% | ||
S&P 500 Total Return Index | 24.61% | 16.58% | 18.83% | 6.07% | ||
(1)
AmericaFirst Quantitative Strategies Fund Class A and Class C shares commenced operations on September 28, 2007.
The performance information quoted in this annual report assumes the reinvestment of all dividend and capital gain distributions, if any, and represents past performance, which is not a guarantee of future results. The returns shown do not reflect taxes that a shareholder would pay on Fund distributions or on the redemption of Fund shares. The investment return and principal value of an investment will fluctuate and, therefore, an investor’s shares, when redeemed, may be worth more or less than their original cost. Updated performance data current to the most recent month-end can be obtained by calling 1-877-217-8363.
The above graph depicts the performance of the AmericaFirst Quantitative Strategies Fund Class A and C Shares versus the S&P 500 Total Return Index. The S&P 500 Total Return Index by Standard and Poor’s Corp. is a capitalization-weighted index comprising 500 issues listed on various exchanges, representing the performance of the stock market generally. Please note that indices do not take into account any fees and expenses of investing in the individual securities that they track and individuals cannot invest directly in any index.
As with any fund, save an index fund, that commonly compares its performance to the S&P 500 Total Return Index, such a comparison may be said to be inappropriate because of the dissimilarity between the Fund’s investments and the securities comprising the index; so too with the AmericaFirst Quantitative Strategies Fund, which will not invest in certain securities comprising this index.
AMERICAFIRST QUANTITATIVE FUNDS ANNUAL REPORT
June 30, 2014
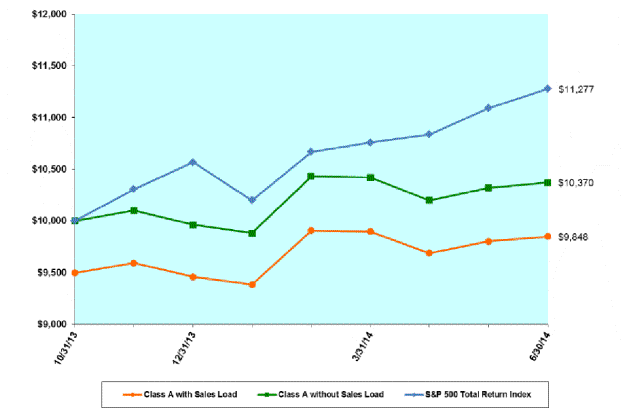
COMPARISON OF A $10,000 INVESTMENT IN THE AMERICAFIRST SEASONAL TRENDS FUND CLASS A SHARES AND THE S&P 500 TOTAL RETURN INDEX (Unaudited)
Total Return
|
| Commencement of Operations | |
|
| through June 30, 2014 (1) | |
Class A | Without sales load | 3.70% | |
With sales load | (1.52)% | ||
Class U | Without sales load | 3.40% | |
With sales load | 0.78% | ||
Class I (2) | 4.10% | ||
S&P 500 Total Return Index | 12.77% | ||
(1)
AmericaFirst Seasonal Trends Fund Class A, Class U, and Class I shares commenced operations on October 31, 2013. Benchmark since inception return assumes inception date of October 31, 2013.
The performance information quoted in this annual report assumes the reinvestment of all dividend and capital gain distributions, if any, and represents past performance, which is not a guarantee of future results. The returns shown do not reflect taxes that a shareholder would pay on Fund distributions or on the redemption of Fund shares. The investment return and principal value of an investment will fluctuate and, therefore, an investor’s shares, when redeemed, may be worth more or less than their original cost. Updated performance data current to the most recent month-end can be obtained by calling 1-877-217-8363.
The above graph depicts the performance of the AmericaFirst Seasonal Trends Fund Class A shares versus the S&P 500 Total Return Index. The S&P 500 Total Return Index by Standard and Poor’s Corp. is a capitalization-weighted index comprising 500 issues listed on various exchanges, representing the performance of the stock market generally. Please note that indices do not take into account any fees and expenses of investing in the individual securities that they track and individuals cannot invest directly in any index.
As with any fund, save an index fund, that commonly compares its performance to the S&P 500 Total Return Index, such a comparison may be said to be inappropriate because of the dissimilarity between the Fund’s investments and the securities comprising the index; so too with the AmericaFirst Seasonal Trends Fund, which will not invest in certain securities comprising this index.
AMERICAFIRST QUANTITATIVE FUNDS ANNUAL REPORT
EXPENSE EXAMPLE
Information About Your Fund’s Expenses (Unaudited)
Total Fund operating expense ratios as stated in the current Fund’s prospectus dated October 31, 2013 were as follows: | |
AmericaFirst Defensive Growth Fund Class A, gross of fee waivers or expense reimbursements | 3.39% |
AmericaFirst Defensive Growth Fund Class A, after waiver and reimbursement | 2.93% |
AmericaFirst Defensive Growth Fund Class U, gross of fee waivers or expense reimbursements | 3.91% |
AmericaFirst Defensive Growth Fund Class U, after waiver and reimbursement | 3.43% |
AmericaFirst Defensive Growth Fund Class I, gross of fee waivers or expense reimbursements | 2.84% |
AmericaFirst Defensive Growth Fund Class I, after waiver and reimbursement | 2.43% |
AmericaFirst Income Trends Fund Class A, gross of fee waivers or expense reimbursements | 3.07% |
AmericaFirst Income Trends Fund Class A, after waiver and reimbursement | 2.76% |
AmericaFirst Income Trends Fund Class U, gross of fee waivers or expense reimbursements | 3.57% |
AmericaFirst Income Trends Fund Class U, after waiver and reimbursement | 3.26% |
AmericaFirst Income Trends Fund Class I, gross of fee waivers or expense reimbursements | 2.57% |
AmericaFirst Income Trends Fund Class I, after waiver and reimbursement | 2.26% |
AmericaFirst Absolute Return Fund Class A, gross of fee waivers or expense reimbursements AmericaFirst Absolute Return Fund Class A, after fee waiver and reimbursements AmericaFirst Absolute Return Fund Class U, gross of fee waivers or expense reimbursements AmericaFirst Absolute Return Fund Class U, after fee waiver and reimbursements AmericaFirst Absolute Return Fund Class I, gross of fee waivers or expense reimbursements AmericaFirst Absolute Return Fund Class I, after fee waiver and reimbursements | 3.21% 2.96% 3.73% 3.46% 2.74% 2.46% |
AmericaFirst Quantitative Strategies Fund Class A, gross of fee waivers or expense reimbursements | 1.77% |
AmericaFirst Quantitative Strategies Fund Class A, after waiver and reimbursement | 1.54% |
AmericaFirst Quantitative Strategies Fund Class C, gross of fee waivers or expense reimbursements | 2.52% |
AmericaFirst Quantitative Strategies Fund Class C, after waiver and reimbursement | 2.29% |
AmericaFirst Seasonal Trends Fund Class A, gross of fee waivers or expense reimbursements AmericaFirst Seasonal Trends Fund Class A, after fee waiver and reimbursements AmericaFirst Seasonal Trends Fund Class U, gross of fee waivers or expense reimbursements AmericaFirst Seasonal Trends Fund Class U, after fee waiver and reimbursements AmericaFirst Seasonal Trends Fund Class I, gross of fee waivers or expense reimbursements AmericaFirst Seasonal Trends Fund Class I, after fee waiver and reimbursements | 4.24%* 2.45%* 4.67%* 2.95%* 3.86%* 1.95%* |
*From Financial Highlights. The Manager has contractually agreed to waive fees and/or reimburse expenses but only to the extent necessary to maintain the AmericaFirst Defensive Growth Fund’s total annual operating expenses (excluding brokerage costs; borrowing costs, such as (a) interest and (b) dividends on securities sold short; taxes; costs of investing in underlying funds, and extraordinary expenses) at 2.45% for Class A shares, 2.95% for Class U shares and 1.94% for Class I shares of the AmericaFirst Defensive Growth Fund’s average daily net assets through October 31, 2015. However, as of November 8, 2013, Class I shares do not exclude borrowing costs from the expense limitation. Total Gross Operating Expenses during the year ended June 30, 2014 were 3.59% for Class A, 4.09% for Class U, and 3.09% for Class I of the AmericaFirst Defensive Growth Fund. The Manager has contractually agreed to waive fees and/or reimburse expenses but only to the extent necessary to maintain the AmericaFirst Income Trends Fund’s total annual operating expenses (excluding brokerage costs; borrowing costs, such as (a) interest and (b) dividends on securities sold short; taxes; costs of investing in underlying funds, and extraordinary expenses) at 2.20% for Class A shares, 2.70% for Class U shares and 1.40% for Class I shares of the AmericaFirst Income Trends Fund’s average daily net assets through October 31, 2015. However, as of November 8, 2013, Class I shares do not exclude borrowing costs from the expense limitation. Total Gross Operating Expenses during the year ended June 30, 2014 were 2.44% for Class A, 2.94% for Class U, and 1.95% for Class I of the AmericaFirst Income Trends Fund. The Manager has contractually agreed to waive fees and/or reimburse expenses but only to the extent necessary to maintain the Absolute Return Fund’s total annual operating expenses (excluding brokerage costs; borrowing costs, such as (a) interest and (b) dividends on securities sold short; taxes; costs of investing in underlying funds, and extraordinary expenses) at 2.45% for Class A shares, 2.95% for Class U shares and 1.74% for Class I shares of the AmericaFirst Absolute Return Fund’s average daily net assets through October 31, 2015. However, as of November 8, 2013, Class I shares do not exclude borrowing costs from the expense limitation. Total Gross Operating Expenses during the year ended June 30, 2014 were 3.04% for Class A, 3.54% for Class U, and 2.55% for Class I of the AmericaFirst Absolute Return Fund. The Manager has contractually agreed to waive fees and/or reimburse expenses but only to the extent necessary to maintain the Quantitative Strategies Fund’s total annual operating expenses (excluding brokerage costs; borrowing costs, such as (a) interest and (b) dividends on securities sold short; taxes; costs of investing in underlying funds, and extraordinary expenses) at 1.50% for Class A shares and 2.25% for Class C shares of the AmericaFirst Quantitative Strategies Fund’s average daily net assets through October 31, 2015. Total Gross Operating Expenses during the year ended June 30, 2014 were 1.76% for Class A and 2.38% for Class C of the AmericaFirst Quantitative Strategies Fund. The Manager has contractually agreed to waive fees and/or reimburse expenses but only to the extent necessary to maintain the Seasonal Trends Fund’s total annual operating expenses (excluding brokerage costs; borrowing costs, such as (a) interest and (b) dividends on securities sold short; taxes; costs of investing in underlying funds, and extraordinary expenses) at 2.45% for Class A shares, 2.95% for Class U shares and 1.95% for Class I shares of the AmericaFirst Seasonal Trends Fund’s average daily net assets through October 31, 2015. Total Gross Operating Expenses during the year ended June 30, 2014 were 2.75% for Class A, 3.17% for Class U, and 2.05% for Class I of the AmericaFirst Seasonal Trends Fund. Please see the Information About Your Fund’s Expenses, the Financial Highlights and Notes to Financial Statements (Note 3) sections of this report for gross and net expense related disclosure during the year ended June 30, 2014. | |
AMERICAFIRST QUANTITATIVE FUNDS ANNUAL REPORT
EXPENSE EXAMPLE
Information About Your Fund’s Expenses (Unaudited) (Continued)
As a shareholder of the Funds, you incur two types of costs: (1) transaction costs, including sales charges (loads) on purchase payments, and redemption fees; and (2) ongoing costs, including management fees, distribution and/or service (12b-1) fees; and other Fund expenses. The example below is intended to help you understand your ongoing costs (in dollars) of investing in the Fund and to compare these costs with the ongoing costs of investing in other mutual funds.
The example below is based on an investment of $1,000 invested at the beginning of the period (1/1/14) and held for the entire period through 6/30/14.
Actual Expenses
The first section of each table provides information about actual account values and actual expenses. You may use the information in this section, together with the amount you invested, to estimate the expenses that you paid over the period. Simply divide your account value by $1,000 (for example, an $8,600 account value divided by $1,000 = 8.6), then multiply the result by the number in the first section under the heading entitled “Expenses Paid During Period” to estimate the expenses you paid on your account during this period/year.
Hypothetical Example for Comparison Purposes
The second section of each table provides information about the hypothetical account values and hypothetical expenses based on the Fund’s actual expense ratio and an assumed rate of return of 5% per year before expenses, which is not the Fund’s actual return. The hypothetical account values and expenses may not be used to estimate the actual ending account balance or expenses you paid for the period. You may use this information to compare the ongoing costs of investing in the Fund and other funds. To do so, compare this 5% hypothetical example with the 5% hypothetical examples that appear in the shareholder reports of the other funds.
Please note that the expenses shown in the tables are meant to highlight your ongoing costs only and do not reflect any transactional costs, such as sales charges (loads), redemption fees, or exchange fees. Therefore, the second section of the table is useful in comparing ongoing costs only, and will not help you determine the relative total costs of owning different funds. In addition, if these transactional costs were included, your costs would have been higher. For more information on transactional costs, please refer to the Fund’s prospectus.
Expenses and Value of a $1,000 Investment for the six month period from January 1, 2014 through June 30, 2014
Actual Fund Return (in parentheses) | Beginning Account Value 1/1/14 | Ending Account Value 6/30/14 | Expenses Paid During Period* |
AmericaFirst Defensive Growth Fund Class A (+5.74%) | $ 1,000.00 | $ 1,057.40 | $ 17.33 |
AmericaFirst Defensive Growth Fund Class U (+5.48%) | 1,000.00 | 1,054.80 | 19.88 |
AmericaFirst Defensive Growth Fund Class I (+6.48%) | 1,000.00 | 1,064.80 | 9.93 |
Hypothetical 5% Fund Return | Beginning Account Value 1/1/14 | Ending Account Value 6/30/14 | Expenses Paid During Period* |
AmericaFirst Defensive Growth Fund Class A | $ 1,000.00 | $ 1,007.95 | $ 16.92 |
AmericaFirst Defensive Growth Fund Class U | 1,000.00 | 1,005.45 | 19.40 |
AmericaFirst Defensive Growth Fund Class I | 1,000.00 | 1,015.17 | 9.69 |
*
Expenses are equal to the Fund’s annualized expense ratios of 3.40%, 3.90% and 1.94% for the AmericaFirst Defensive Growth Fund Class A, Class U and Class I shares, respectively; multiplied by the average account value over the period, multiplied by 181/365 to reflect the one-half year period.
AMERICAFIRST QUANTITATIVE FUNDS ANNUAL REPORT
EXPENSE EXAMPLE
Information About Your Fund’s Expenses (Unaudited) (Continued)
Expenses and Value of a $1,000 Investment for the six month period from January 1, 2014 through June 30, 2014
Actual Fund Return (in parentheses) | Beginning Account Value 1/1/14 | Ending Account Value 6/30/14 | Expenses Paid During Period* |
AmericaFirst Income Trends Fund Class A (+1.97%) | $ 1,000.00 | $ 1,019.70 | $ 11.11 |
AmericaFirst Income Trends Fund Class U (+1.83%) | 1,000.00 | 1,018.30 | 13.60 |
AmericaFirst Income Trends Fund Class I (+2.35%) | 1,000.00 | 1,023.50 | 7.02 |
Hypothetical 5% Fund Return | Beginning Account Value 1/1/14 | Ending Account Value 6/30/14 | Expenses Paid During Period* |
AmericaFirst Income Trends Fund Class A | $ 1,000.00 | $ 1,013.79 | $ 11.03 |
AmericaFirst Income Trends Fund Class U | 1,000.00 | 1,011.32 | 13.55 |
AmericaFirst Income Trends Fund Class I | 1,000.00 | 1,017.85 | 7.00 |
*
Expenses are equal to the Fund’s annualized expense ratios of 2.22%, 2.72% and 1.40% for the AmericaFirst Income Trends Fund Class A, Class U and Class I shares, respectively; multiplied by the average account value over the period, multiplied by 181/365 to reflect the one-half year period.
Expenses and Value of a $1,000 Investment for the six month period from January 1, 2014 through June 30, 2014
Actual Fund Return (in parentheses) | Beginning Account Value 1/1/14 | Ending Account Value 6/30/14 | Expenses Paid During Period** |
AmericaFirst Absolute Return Fund Class A (+3.36%) | $ 1,000.00 | $ 1,033.60 | $ 12.38 |
AmericaFirst Absolute Return Fund Class U (+3.15%) | 1,000.00 | 1,031.50 | 14.89 |
AmericaFirst Absolute Return Fund Class I (+3.82%) | 1,000.00 | 1,038.20 | 8.77 |
Hypothetical 5% Fund Return | Beginning Account Value 1/1/14 | Ending Account Value 6/30/14 | Expenses Paid During Period** |
AmericaFirst Absolute Return Fund Class A | $ 1,000.00 | $ 1,012.61 | $ 12.26 |
AmericaFirst Absolute Return Fund Class U | 1,000.00 | 1,010.14 | 14.73 |
AmericaFirst Absolute Return Fund Class I | 1,000.00 | 1,016.19 | 8.68 |
**
Expenses are equal to the Fund’s annualized expense ratios of 2.46%, 2.96% and 1.74% for the AmericaFirst Absolute Return Fund Class A, Class U and Class I shares, respectively; multiplied by the average account value over the period, multiplied by 181/365 to reflect the one-half year period.
AMERICAFIRST QUANTITATIVE FUNDS ANNUAL REPORT
EXPENSE EXAMPLE
Information About Your Fund’s Expenses (Unaudited) (Continued)
Expenses and Value of a $1,000 Investment for the six month period from January 1, 2014 through June 30, 2014
Actual Fund Return (in parentheses) | Beginning Account Value 1/1/14 | Ending Account Value 6/30/14 | Expenses Paid During Period* |
AmericaFirst Quantitative Strategies Fund Class A(+4.63%) | $ 1,000.00 | $ 1,046.30 | $ 7.63 |
AmericaFirst Quantitative Strategies Fund Class C (+4.28%) | 1,000.00 | 1,042.80 | 11.42 |
Hypothetical 5% Fund Return | Beginning Account Value 1/1/14 | Ending Account Value 6/30/14 | Expenses Paid During Period* |
AmericaFirst Quantitative Strategies Fund Class A | $ 1,000.00 | $ 1,017.34 | $ 7.52 |
AmericaFirst Quantitative Strategies Fund Class C | 1,000.00 | 1,013.61 | 11.26 |
*
Expenses are equal to the Fund’s annualized expense ratios of 1.50% and 2.25% for the AmericaFirst Quantitative Strategies Fund Class A and Class C shares, respectively; multiplied by the average account value over the period, multiplied by 181/365 to reflect the one-half year period.
Expenses and Value of a $1,000 Investment for the six month period from January 1, 2014 through June 30, 2014
Actual Fund Return (in parentheses) | Beginning Account Value 1/1/14 | Ending Account Value 6/30/14 | Expenses Paid During Period* |
AmericaFirst Seasonal Trends Fund Class A (+4.12%) | $ 1,000.00 | $ 1,041.20 | $ 12.30 |
AmericaFirst Seasonal Trends Fund Class U (+3.92%) | 1,000.00 | 1,039.20 | 14.77 |
AmericaFirst Seasonal Trends Fund Class I (+4.41%) | 1,000.00 | 1,044.10 | 9.80 |
Hypothetical 5% Fund Return | Beginning Account Value 1/1/14 | Ending Account Value 6/30/14 | Expenses Paid During Period* |
AmericaFirst Seasonal Trends Fund Class A | $ 1,000.00 | $ 1,012.74 | $ 12.13 |
AmericaFirst Seasonal Trends Fund Class U | 1,000.00 | 1,010.31 | 14.56 |
AmericaFirst Seasonal Trends Fund Class I | 1,000.00 | 1,015.21 | 9.66 |
*
Expenses are equal to the Fund’s annualized expense ratios of 2.43%, 2.92% and 1.93% for the AmericaFirst Seasonal Trends Fund Class A, Class U, and Class I shares, respectively; multiplied by the average account value over the period, multiplied by 181/365 to reflect the one-half year period for hypothetical expenses.
For more information on Fund expenses, please refer to the Fund’s prospectus, which can be obtained from your investment representative or by calling 1-877-217-8363. Please read it carefully before you invest or send money.
AmericaFirst Defensive Growth Fund | ||||
Schedule of Investments | ||||
June 30, 2014 | ||||
|
|
|
|
|
Shares |
|
|
| Value |
|
| COMMON STOCK - 103.77 % |
|
|
|
| AGRICULTURE - 8.03 % |
|
|
17,973 |
| Altria Group, Inc. (a) |
| $ 753,788 |
8,211 |
| Imperial Tobacco Group PLC - ADR (a) |
| 742,357 |
12,986 |
| Lorillard, Inc. (a) |
| 791,756 |
8,140 |
| Philip Morris International, Inc. (a) |
| 686,283 |
|
|
| 2,974,184 | |
|
| BEVERAGES - 10.95 % |
|
|
15,411 |
| Coca-Cola Enterprises, Inc. (a) |
| 736,338 |
5,364 |
| Diageo PLC - ADR (a) |
| 682,676 |
15,290 |
| Keurig Green Mountain, Inc. (a) |
| 1,905,287 |
8,178 |
| PepsiCo., Inc. (a) |
| 730,622 |
|
|
| 4,054,923 | |
|
| BIOTECHNOLOGY - 8.48 % |
|
|
5,974 |
| Amgen, Inc. (a) |
| 707,142 |
20,802 |
| Isis Pharmaceuticals, Inc. * (a) |
| 716,629 |
17,723 |
| Myriad Genetics, Inc. * (a) |
| 689,779 |
10,850 |
| Vertex Pharmaceuticals, Inc. * (a) |
| 1,027,278 |
|
|
|
| 3,140,828 |
|
| COSMETICS / PERSONAL CARE - 1.80 % |
|
|
8,498 |
| Procter & Gamble Co. (a) |
| 667,858 |
|
|
|
|
|
|
| ELECTRIC - 16.03 % |
|
|
32,179 |
| Calpine Corp. * (a) |
| 766,182 |
9,544 |
| Entergy Corp. (a) |
| 783,467 |
19,077 |
| Exelon Corp. (a) |
| 695,929 |
20,185 |
| FirstEnergy Corp. (a) |
| 700,823 |
27,750 |
| Hawaiian Electric Industries, Inc. (a) |
| 702,630 |
15,808 |
| NRG Yield, Inc. (a) |
| 822,807 |
21,106 |
| Portland General Electric Co. (a) |
| 731,745 |
20,679 |
| PPL Corp. (a) |
| 734,725 |
|
|
|
| 5,938,308 |
|
| FOOD - 12.86 % |
|
|
15,545 |
| Campbell Soup Co. (a) |
| 712,116 |
4,789 |
| Ingredion, Inc. (a) |
| 359,367 |
10,529 |
| Kellogg Co. (a) |
| 691,755 |
31,956 |
| Pilgrim's Pride Corp. * (a) |
| 874,316 |
8,689 |
| Sanderson Farms, Inc. (a) |
| 844,571 |
25,434 |
| Snyder's-Lance, Inc. (a) |
| 672,984 |
16,179 |
| Tyson Foods, Inc. - Class A (a) |
| 607,360 |
|
|
| 4,762,469 | |
|
| GAS - 1.99 % |
|
|
29,770 |
| Questar Corp. (a) |
| 738,296 |
|
|
|
|
|
|
| HEALTHCARE-PRODUCTS - 19.21 % |
|
|
9,364 |
| Baxter International, Inc. (a) |
| 677,017 |
The accompanying notes are an integral part of these financial statements. |
AmericaFirst Defensive Growth Fund | ||||
Schedule of Investments (Continued) | ||||
June 30, 2014 | ||||
|
|
|
|
|
Shares |
|
|
| Value |
|
| HEALTHCARE-PRODUCTS (CONTINUED) - 19.21 % |
|
|
4,939 |
| CR Bard, Inc. (a) |
| $ 706,326 |
8,510 |
| Edwards Lifesciences Corp. * (a) |
| 730,499 |
20,765 |
| Haemonetics Corp. * (a) |
| 732,589 |
15,270 |
| Integra LifeSciences Holdings Corp. * (a) |
| 718,606 |
40,986 |
| Luminex Corp. * (a) |
| 702,910 |
16,604 |
| Patterson Cos, Inc. (a) |
| 656,024 |
14,659 |
| ResMed, Inc. (a) |
| 742,185 |
10,867 |
| St. Jude Medical, Inc. (a) |
| 752,540 |
8,372 |
| Varian Medical Systems, Inc. * (a) |
| 696,048 |
|
|
|
| 7,114,744 |
|
| HOUSEHOLD PRODUCTS / WARES - 3.81 % |
|
|
12,387 |
| Jarden Corp. * (a) |
| 735,168 |
8,055 |
| Tupperware Brands Corp. (a) |
| 674,204 |
|
|
|
| 1,409,372 |
|
| MISCELLANEOUS MANUFACTURERS - 2.28 % |
|
|
59,885 |
| Blount International, Inc. * (a) |
| 844,977 |
|
|
|
|
|
|
| OIL & GAS - 2.11 % |
|
|
36,626 |
| BG Group PLC - ADR * (a) |
| 781,965 |
|
|
|
|
|
|
| PHARMACEUTICALS - 12.60 % |
|
|
10,215 |
| Cardinal Health, Inc. (a) |
| 700,340 |
12,519 |
| Herbalife Ltd. (a) |
| 807,976 |
28,551 |
| Impax Laboratories, Inc. * (a) |
| 856,245 |
14,843 |
| Mylan, Inc. * (a) |
| 765,305 |
8,772 |
| Questcor Pharmaceuticals, Inc. (a) |
| 811,322 |
13,837 |
| Teva Pharmaceutical Industries Ltd. - ADR (a) |
| 725,336 |
|
|
|
| 4,666,524 |
|
| PIPELINES - 1.92 % |
|
|
22,562 |
| EnLink Midstream Partners LP (a) |
| 709,124 |
|
|
|
|
|
|
| RETAIL - 1.70 % |
|
|
8,516 |
| Nu Skin Enterprises, Inc. (a) |
| 629,844 |
|
|
|
|
|
|
| TOTAL COMMON STOCK ( Cost - $35,086,462) |
| 38,433,416 |
|
|
|
|
|
|
| SHORT-TERM INVESTMENTS - 4.74 % |
|
|
|
| MONEY MARKET FUND - 4.74 % |
|
|
1,755,168 |
| Dreyfus Cash Management, Institutional Shares - 0.03% ** |
| 1,755,168 |
|
| TOTAL SHORT-TERM INVESTMENTS ( Cost - $1,755,168) |
|
|
|
|
|
|
|
|
| TOTAL INVESTMENTS IN SECURITIES HELD LONG - 108.51 % ( Cost - $36,841,630) (b) | $ 40,188,584 | |
|
| TOTAL INVESTMENTS IN SECURITIES SOLD SHORT - (25.04) % ( Proceeds - $7,419,326) | (9,274,709) | |
|
| OTHER ASSETS LESS LIABILITIES - 16.53 % |
| 6,124,507 |
|
| NET ASSETS - 100.0% |
| $ 37,038,382 |
The accompanying notes are an integral part of these financial statements. |
AmericaFirst Defensive Growth Fund | ||||
Schedule of Investments (Continued) | ||||
June 30, 2014 | ||||
|
|
|
|
|
Shares |
|
|
| Value |
|
| INVESTMENTS IN SECURITIES SOLD SHORT* - (25.04) % |
|
|
|
| COMMON STOCK - (23.50) % |
|
|
|
| BEVERAGES - (2.77) % |
|
|
(8,235) |
| Keurig Green Mountain, Inc. |
| $ (1,026,163) |
|
|
|
|
|
|
| BIOTECHNOLOGY - (5.63) % |
|
|
(6,977) |
| Alnylam Pharmaceuticals, Inc. * |
| (440,737) |
(16,184) |
| Isis Pharmaceuticals, Inc. * |
| (557,539) |
(4,849) |
| Synageva BioPharma Corp. * |
| (508,175) |
(6,112) |
| Vertex Pharmaceuticals, Inc. * |
| (578,684) |
|
|
|
| (2,085,135) |
|
| COMPUTERS - (2.52) % |
|
|
(11,959) |
| CGI Group, Inc. * |
| (424,305) |
(4,470) |
| Stratasys Ltd. * |
| (507,926) |
|
|
|
| (932,231) |
|
| DIVERSIFIED FINANCIAL SERVICES - (1.14) % |
|
|
(11,211) |
| Eaton Vance Corp. |
| (423,664) |
|
|
|
|
|
|
| ENVIRONMENTAL CONTROL - (1.16) % |
|
|
(6,659) |
| Clean Harbors, Inc. * |
| (427,841) |
|
|
|
|
|
|
| FOOD - (0.97) % |
|
|
(4,789) |
| Ingredion, Inc. |
| (359,367) |
|
|
|
|
|
|
| HOLDING COMPANIES - DIVERSIFIED - (1.13) % |
|
|
(15,998) |
| Leucadia National Corp. |
| (419,468) |
|
|
|
|
|
|
| INSURANCE - (3.30) % |
|
|
(4,318) |
| Chubb Corp. |
| (397,990) |
(852) |
| Fairfax Financial Holdings Ltd. |
| (402,572) |
(9,093) |
| WR Berkley Corp. |
| (421,097) |
|
|
|
| (1,221,659) |
|
| INTERNET - (2.79) % |
|
|
(14,016) |
| FireEye, Inc. * |
| (568,349) |
(2,702) |
| LinkedIn Corp. * |
| (463,312) |
|
|
|
| (1,031,661) |
|
| MEDIA - (1.10) % |
|
|
(11,896) |
| Grupo Televisa SAB - ADR |
| (408,152) |
|
|
|
|
|
|
| PIPELINES - (0.01) % |
|
|
^ |
| Kinder Morgan Management LLC * |
| (37) |
|
|
|
|
|
|
| TRANSPORTATION - (0.98) % |
|
|
(6,112) |
| Golar LNG Ltd. |
| (367,331) |
|
| TOTAL COMMON STOCK SOLD SHORT (Proceeds - ($6,815,653) | (8,702,709) | |
The accompanying notes are an integral part of these financial statements. |
AmericaFirst Defensive Growth Fund | ||||
Schedule of Investments (Continued) | ||||
June 30, 2014 | ||||
|
|
|
|
|
Shares |
|
|
| Value |
|
| EXCHANGE TRADED NOTES* - (1.54) % |
|
|
|
| EQUITY FUND - (1.54) % |
|
|
(20,000) |
| iPath S&P 500 VIX Short-Term Futures ETN * |
| $ (572,000) |
|
| TOTAL EXCHANGE TRADED NOTES SOLD SHORT (Proceeds $603,673) |
| |
|
|
|
|
|
|
| TOTAL INVESTMENTS IN SECURITIES SOLD SHORT (Proceeds $7,419,326) | $ (9,274,709) | |
|
|
|
|
|
ADR - American Depositary Receipt |
|
| ||
LP - Limited Partnership |
|
| ||
PLC - Public Limited Company. |
|
| ||
* Non-income producing security. |
|
| ||
** The rate shown represents the rate at June 30, 2014 and is subject to change daily. |
| |||
^ Less than one Share |
|
| ||
(a) All or a portion of the security is segregated as collateral for securities sold short at June 30, 2014. |
| |||
(b) Represents cost for financial reporting purposes. Aggregate cost for federal tax purposes, including short sales, is $29,492,815 and differs from market value by net unrealized appreciation (depreciation) of securities as follows: |
| |||
|
|
| Unrealized appreciation: | $ 3,758,823 |
|
|
| Unrealized depreciation: | (2,337,763) |
|
|
| Net unrealized appreciation: | $ 1,421,060 |
|
|
|
|
|
The Fund's holdings were divided among the following economic sectors: | ||||
|
|
| Value | Percentage |
|
| HEALTHCARE-PRODUCTS | $ 7,114,744 | 23.02% |
|
| ELECTRIC | 5,938,308 | 19.21% |
|
| PHARMACEUTICALS | 4,666,524 | 15.10% |
|
| FOOD | 4,403,102 | 14.24% |
|
| BEVERAGES | 3,028,760 | 9.80% |
|
| AGRICULTURE | 2,974,184 | 9.62% |
|
| MONEY MARKET FUND | 1,755,168 | 5.68% |
|
| HOUSEHOLD PRODUCTS / WARES | 1,409,372 | 4.56% |
|
| BIOTECHNOLOGY | 1,055,693 | 3.41% |
|
| MISCELLANEOUS MANUFACTURERS | 844,977 | 2.73% |
|
| OIL & GAS | 781,965 | 2.53% |
|
| GAS | 738,296 | 2.39% |
|
| PIPELINES | 709,087 | 2.29% |
|
| COSMETICS / PERSONAL CARE | 667,858 | 2.16% |
|
| RETAIL | 629,844 | 2.04% |
|
| TRANSPORTATION | (367,331) | -1.19% |
|
| MEDIA | (408,152) | -1.32% |
|
| HOLDING COMPANIES - DIVERSIFIED | (419,468) | -1.36% |
|
| DIVERSIFIED FINANCIAL SERVICES | (423,664) | -1.37% |
|
| ENVIRONMENTAL CONTROL | (427,841) | -1.38% |
|
| EQUITY FUND | (572,000) | -1.85% |
|
| COMPUTERS | (932,231) | -3.02% |
|
| INTERNET | (1,031,661) | -3.34% |
|
| INSURANCE | (1,221,659) | -3.95% |
|
| Total Portfolio Holdings | $ 30,913,875 | 100.00% |
|
|
|
|
|
The percentages in the above table are based on market value of the Fund's portfolio holdings as of June 30, 2014 and are subject to change. | ||||
The accompanying notes are an integral part of these financial statements. |
AmericaFirst Income Trends Fund | ||||
Schedule Of Investments | ||||
|
| June 30, 2014 |
| |
Shares |
|
|
| Value |
|
| COMMON STOCK - 30.26 % |
|
|
|
| AUTO PARTS & EQUIPMENT - 0.93 % |
|
|
4,185 |
| Icahn Enterprises LP |
| $ 417,245 |
|
|
|
|
|
|
| DIVERSIFIED FINANCIAL SERVICES - 0.98 % |
|
|
7,641 |
| Evercore Partners, Inc. |
| 440,427 |
|
|
|
| |
|
| MEDIA - 0.93 % |
|
|
15,308 |
| LIN Media LLC * |
| 417,143 |
|
|
|
|
|
|
| PIPELINES - 4.38 % |
|
|
5,769 |
| Buckeye Partners LP |
| 479,173 |
6,307 |
| Enterprise Products Partners LP |
| 493,775 |
5,744 |
| Magellan Midstream Partners LP |
| 482,726 |
6,956 |
| Targa Resources Partners LP |
| 500,275 |
|
|
|
| 1,955,949 |
|
| PRIVATE EQUITY - 2.95 % |
|
|
12,561 |
| Blackstone Group LP |
| 420,040 |
12,599 |
| Carlyle Group LP |
| 427,862 |
19,297 |
| KKR & Co. LP |
| 469,496 |
|
|
|
| 1,317,398 |
|
| REAL ESTATE INVESTMENT TRUSTS - 20.09 % |
|
|
68,212 |
| Capstead Mortgage Corp. |
| 896,988 |
39,136 |
| Chatham Lodging Trust |
| 857,078 |
287,106 |
| Chimera Investment Corp. |
| 915,868 |
52,235 |
| CubeSmart |
| 956,945 |
44,858 |
| First Industrial Realty Trust, Inc. |
| 845,125 |
82,124 |
| Inland Real Estate Corp. |
| 872,978 |
45,771 |
| Parkway Properties, Inc. |
| 945,171 |
17,933 |
| Saul Centers, Inc. |
| 871,544 |
37,146 |
| Starwood Property Trust, Inc. |
| 882,961 |
62,485 |
| Sunstone Hotel Investors, Inc. |
| 932,901 |
|
|
| 8,977,559 | |
|
|
|
|
|
|
| TOTAL COMMON STOCK ( Cost - $13,225,043) |
| 13,525,721 |
|
|
|
|
|
|
| PREFERRED STOCK - 19.33 % |
|
|
|
| BANKS - 11.42 % |
|
|
74,550 |
| Capital One Financial Corp. |
| 1,799,637 |
72,431 |
| Goldman Sachs Group, Inc. |
| 1,774,560 |
54,171 |
| U.S. Bancorp |
| 1,530,872 |
|
|
|
| 5,105,069 |
|
| HAND/MACHINE TOOLS - 3.94 % |
|
|
72,207 |
| Stanley Black & Decker, Inc. |
| 1,759,685 |
|
|
|
|
|
|
| INSURANCE - 3.97 % |
|
|
69,409 |
| Aegon NV |
| 1,774,094 |
|
|
|
|
|
|
| TOTAL PREFERRED STOCK ( Cost - $8,582,784) |
| 8,638,848 |
The accompanying notes are an integral part of these financial statements. |
AmericaFirst Income Trends Fund | |||||
Schedule Of Investments (Continued) | |||||
June 30, 2014 | |||||
Principal |
|
|
| Value | |
|
| BONDS & NOTES - 47.93 % |
|
| |
|
| ADVERTISING - 1.99 % |
|
| |
$ 951,000 |
| Visant Corp., 10.00%, 10/1/17 |
| $ 891,563 | |
|
|
|
| ||
|
| AEROSPACE/DEFENSE - 2.08 % |
|
| |
869,000 |
| TransDigm, Inc., 7.75%, 12/15/18 |
| 930,221 | |
|
|
|
|
|
|
|
| AUTO MANUFACTURERS - 2.10 % |
|
| |
895,000 |
| Navistar International Corp., 8.25%, 11/1/21 |
| 937,513 | |
|
|
|
| ||
|
| COMMERCIAL SERVICES - 2.06 % |
|
| |
863,000 |
| Hertz Corp., 6.75%, 4/15/19 |
| 919,095 | |
|
|
|
|
| |
|
| DISTRIBUTION / WHOLESALE - 4.18 % |
|
| |
786,000 |
| HD Supply, Inc., 11.50%, 7/15/20 |
| 947,130 | |
870,000 |
| VWR Funding, Inc., 7.25%, 9/15/17 |
| 923,287 | |
|
|
|
| 1,870,417 | |
|
| DIVERSIFIED FINANCIAL SERVICES - 2.23 % |
|
| |
895,000 |
| Springleaf Financial Corp., 6.90%, 12/15/17 |
| 995,688 | |
|
|
|
|
|
|
|
| ENTERTAINMENT - 2.06 % |
|
| |
852,000 |
| Pinnacle Entertainment, Inc., 7.50%, 4/15/21 |
| 920,160 | |
|
|
|
|
|
|
|
| HEALTHCARE-PRODUCTS - 2.06 % |
|
| |
814,000 |
| Kinetic Concepts, Inc., 10.50%, 11/1/18 |
| 921,855 | |
|
|
|
|
|
|
|
| HEALTHCARE-SERVICES - 2.09 % |
|
| |
852,000 |
| HCA Holdings, Inc., 7.75%, 5/15/21 |
| 936,135 | |
|
|
|
|
| |
|
| HOUSEHOLD PRODUCTS / WARES - 2.14 % |
|
| |
900,000 |
| Reynolds Group Issuer, Inc., 9.00%, 4/15/19 |
| 957,375 | |
|
|
|
| ||
|
| LODGING - 3.70 % |
|
| |
1,912,000 |
| Caesars Entertainment Operating Co., Inc., 10.00%, 12/15/18 |
| 742,095 | |
865,000 |
| MGM Resorts International, 6.625%, 7/15/15 |
| 910,412 | |
|
|
|
| 1,652,507 | |
|
| MEDIA - 2.19 % |
|
| |
911,000 |
| Clear Channel Communications, Inc., 9.00%, 3/1/21 |
| 978,186 | |
|
|
|
|
|
|
|
| OIL & GAS - 8.52 % |
|
| |
896,000 |
| Concho Resources, Inc., 5.50%, 4/1/23 |
| 967,680 | |
857,000 |
| Linn Energy LLC, 8.625%, 4/15/20 |
| 929,845 | |
885,000 |
| SandRidge Energy, Inc., 7.50%, 3/15/21 |
| 963,544 | |
873,000 |
| W&T Offshore, Inc., 8.50%, 6/15/19 |
| 947,205 | |
|
|
|
| 3,808,274 | |
The accompanying notes are an integral part of these financial statements. |
The accompanying notes are an integral part of these financial statements. |
AmericaFirst Absolute Return Fund | ||||
Schedule of Investments | ||||
June 30, 2014 | ||||
|
|
|
|
|
Shares |
|
|
| Value |
|
| COMMON STOCK - 98.88 % |
|
|
|
| AEROSPACE/DEFENSE - 3.87 % |
|
|
2,463 |
| Alliant Techsystems, Inc. |
| $ 329,845 |
2,959 |
| L-3 Communications Holdings, Inc. |
| 357,299 |
|
|
|
| 687,144 |
|
| AUTO MANUFACTURERS - 2.09 % |
|
|
3,096 |
| Toyota Motor Corp. - ADR |
| 370,467 |
|
|
|
|
|
|
| AUTO PARTS & EQUIPMENT - 10.37 % |
|
|
18,865 |
| American Axle & Manufacturing Holdings, Inc. * |
| 356,360 |
13,369 |
| Goodyear Tire & Rubber Co. |
| 371,391 |
3,403 |
| Icahn Enterprises LP |
| 339,279 |
3,632 |
| Magna International, Inc. |
| 391,348 |
4,283 |
| TRW Automotive Holdings Corp. * |
| 383,414 |
|
|
|
| 1,841,792 |
|
| BANKS - 1.97 % |
|
|
6,879 |
| HSBC Holdings PLC - ADR |
| 349,453 |
|
|
|
|
|
|
| CHEMICALS - 2.15 % |
|
|
3,517 |
| Ashland, Inc. |
| 382,439 |
|
|
|
|
|
|
| COMMERCIAL SERVICES - 5.34 % |
|
|
4,913 |
| Global Payments, Inc. |
| 357,912 |
46,463 |
| Monster Worldwide, Inc. * |
| 303,868 |
7,075 |
| Vistaprint NV * |
| 286,255 |
|
|
|
| 948,035 |
|
| COMPUTERS - 8.29 % |
|
|
3,687 |
| DST Systems, Inc. |
| 339,831 |
1,816 |
| International Business Machines Corp. |
| 329,186 |
4,311 |
| SanDisk Corp. |
| 450,198 |
6,213 |
| Seagate Technology PLC |
| 353,023 |
|
|
|
| 1,472,238 |
|
| DISTRIBUTION/WHOLESALE - 2.00 % |
|
|
5,882 |
| Arrow Electronics, Inc. * |
| 355,332 |
|
|
|
|
|
|
| ELECTRONICS - 2.36 % |
|
|
37,856 |
| Flextronics International Ltd. * |
| 419,066 |
|
|
|
|
|
|
| ENERGY-ALTERNATE SOURCES - 2.16 % |
|
|
11,652 |
| Green Plains, Inc. |
| 383,001 |
|
|
|
|
|
|
| ENGINEERING & CONSTRUCTION - 2.00 % |
|
|
15,964 |
| Ferrovial SA |
| 355,441 |
|
|
|
|
|
|
| HOLDING COMPANIES-DIVERSIFIED - 2.06 % |
|
|
29,720 |
| Swire Pacific Ltd. |
| 365,829 |
The accompanying notes are an integral part of these financial statements. |
AmericaFirst Absolute Return Fund | ||||
Schedule of Investments (Continued) | ||||
June 30, 2014 | ||||
|
|
|
|
|
Shares |
|
|
| Value |
|
| HOME BUILDERS - 1.88 % |
|
|
14,860 |
| Taylor Morrison Home Corp. * |
| $ 333,161 |
|
|
|
|
|
|
| INSURANCE - 3.74 % |
|
|
6,601 |
| Sampo |
| 333,884 |
3,715 |
| Swiss Re AG |
| 330,492 |
|
|
|
| 664,376 |
|
| LEISURE TIME - 1.96 % |
|
|
9,243 |
| Carnival Corp. |
| 347,999 |
|
|
|
|
|
|
| LODGING - 1.84 % |
|
|
1,571 |
| Wynn Resorts Ltd. |
| 326,077 |
|
|
|
|
|
|
| MEDIA - 6.22 % |
|
|
20,726 |
| Cablevision Systems Corp. |
| 365,814 |
6,011 |
| John Wiley & Sons, Inc. |
| 364,206 |
4,369 |
| Walt Disney Co. |
| 374,598 |
|
|
|
| 1,104,618 |
|
| MISCELLANEOUS MANUFACTURER - 2.39 % |
|
|
9,716 |
| Trinity Industries, Inc. |
| 424,783 |
|
|
|
|
|
|
| OIL & GAS - 17.35 % |
|
|
13,664 |
| Bill Barrett Corp. * |
| 365,922 |
2,306 |
| CNOOC Ltd. - ADR |
| 413,443 |
4,980 |
| ConocoPhillips |
| 426,935 |
6,975 |
| Eni SpA - ADR |
| 382,927 |
4,494 |
| National Oilwell Varco, Inc. |
| 370,081 |
1,123 |
| NOW, Inc. * |
| 40,664 |
12,413 |
| Statoil ASA - ADR |
| 382,693 |
5,350 |
| Unit Corp. * |
| 368,241 |
6,594 |
| Valero Energy Corp. |
| 330,359 |
|
|
|
| 3,081,265 |
|
| REAL ESTATE INVESTMENT TRUSTS - 6.55 % |
|
|
71,256 |
| The Link REIT |
| 383,388 |
46,026 |
| Scentre Group * |
| 138,917 |
1,351 |
| Unibail-Rodamco SE |
| 392,902 |
36,939 |
| Westfield Corp. |
| 249,112 |
|
|
|
| 1,164,319 |
|
| RETAIL - 4.05 % |
|
|
7,443 |
| Foot Locker, Inc. |
| 377,509 |
5,891 |
| Macy's, Inc. |
| 341,796 |
|
|
|
| 719,305 |
|
| SOFTWARE - 4.10 % |
|
|
17,110 |
| Activision Blizzard, Inc. |
| 381,553 |
8,547 |
| Oracle Corp. |
| 346,410 |
|
|
|
| 727,963 |
The accompanying notes are an integral part of these financial statements. |
AmericaFirst Absolute Return Fund | ||||
Schedule of Investments (Continued) | ||||
June 30, 2014 | ||||
|
|
|
|
|
Shares |
|
|
| Value |
|
| TELECOMMUNICATIONS - 4.14 % |
|
|
7,675 |
| China Mobile Ltd. - ADR |
| $ 373,083 |
4,782 |
| Harris Corp. |
| 362,237 |
|
|
|
| 735,320 |
|
|
|
|
|
|
| TOTAL COMMON STOCK ( Cost - $16,894,589) |
| 17,559,423 |
|
|
|
|
|
|
| SHORT-TERM INVESTMENTS - 1.17 % |
|
|
|
| MONEY MARKET FUND - 1.17 % |
|
|
207,413 |
| Dreyfus Cash Management, Institutional Shares - 0.03% ** |
| 207,413 |
|
| TOTAL SHORT-TERM INVESTMENTS ( Cost - $207,413) |
|
|
|
|
|
|
|
|
| TOTAL INVESTMENTS - 100.05 % ( Cost - $17,102,002) (a) |
| $ 17,766,836 |
|
| LIABILITIES IN EXCESS OF OTHER ASSETS - (0.05) % |
| (8,323) |
|
| NET ASSETS - 100.0% |
| $ 17,758,513 |
|
|
|
|
|
ADR - American Depositary Receipts. |
|
| ||
LP - Limited Partnership. |
|
| ||
PLC - Public Limited Company. |
|
| ||
* Non-income producing security. |
|
| ||
** The rate shown represents the rate at June 30, 2014 and is subject to change daily. |
|
| ||
(a) Represent cost for financial reporting purposes. Aggregate cost for federal tax purposes is $17,096,897 and |
| |||
differs from market value by new unrealized appreciation (depreciation) of securities as follows: |
| |||
|
|
|
|
|
|
|
| Unrealized appreciation: | $ 982,123 |
|
|
| Unrealized depreciation: | (312,184) |
|
|
| Net unrealized appreciation: | $ 669,939 |
|
|
|
|
|
|
|
|
|
|
The Fund's holdings were divided among the following economic sectors: | ||||
|
|
| Value | Percentage |
|
| OIL & GAS | $ 3,081,265 | 17.34% |
|
| AUTO PARTS & EQUIPMENT | 1,841,792 | 10.37% |
|
| COMPUTERS | 1,472,238 | 8.29% |
|
| REAL ESTATE INVESTMENT TRUSTS | 1,164,319 | 6.55% |
|
| MEDIA | 1,104,618 | 6.22% |
|
| COMMERCIAL SERVICES | 948,035 | 5.33% |
|
| TELECOMMUNICATIONS | 735,320 | 4.14% |
|
| SOFTWARE | 727,963 | 4.10% |
|
| RETAIL | 719,305 | 4.05% |
|
| AEROSPACE/DEFENSE | 687,144 | 3.87% |
|
| INSURANCE | 664,376 | 3.74% |
|
| MISCELLANEOUS MANUFACTURER | 424,783 | 2.39% |
|
| ELECTRONICS | 419,066 | 2.36% |
|
| ENERGY-ALTERNATE SOURCES | 383,001 | 2.16% |
|
| CHEMICALS | 382,439 | 2.15% |
|
| AUTO MANUFACTURERS | 370,467 | 2.08% |
|
| HOLDING COMPANIES-DIVERSIFIED | 365,829 | 2.06% |
|
| ENGINEERING & CONSTRUCTION | 355,441 | 2.00% |
|
| DISTRIBUTION/WHOLESALE | 355,332 | 2.00% |
|
| BANKS | 349,453 | 1.97% |
|
| LEISURE TIME | 347,999 | 1.96% |
|
| HOME BUILDERS | 333,161 | 1.87% |
|
| LODGING | 326,077 | 1.83% |
|
| MONEY MARKET FUND | 207,413 | 1.17% |
|
| Total Portfolio Holdings | $ 17,766,836 | 100.00% |
|
|
|
|
|
The percentages in the above table are based on market value of the Fund's portfolio holdings as of June 30, 2014 and are subject to change. | ||||
The accompanying notes are an integral part of these financial statements. |
AmericaFirst Quantitative Strategies Fund | ||||||
Schedule Of Investments | ||||||
June 30, 2014 | ||||||
Shares |
|
|
|
| Value | |
|
| COMMON STOCK - 59.62 % |
|
|
| |
|
| AEROSPACE/DEFENSE - 0.78 % |
|
|
| |
2,148 |
| Alliant Techsystems, Inc. |
|
| $ 287,660 | |
2,638 |
| L-3 Communications Holdings, Inc. |
|
| 318,539 | |
|
|
|
| 606,199 | ||
|
| AGRICULTURE - 0.39 % |
|
|
| |
2,569 |
| British American Tobacco PLC - ADR |
|
| 305,917 | |
|
|
|
|
|
|
|
|
| AIRLINES - 0.19 % |
|
|
| |
80,929 |
| AMR Corp. *^# |
|
| 149,719 | |
|
|
|
|
| ||
|
| AUTO MANUFACTURERS - 0.42 % |
|
|
| |
2,723 |
| Toyota Motor Corp. - ADR |
|
| 325,834 | |
|
|
|
|
|
|
|
|
| AUTO PARTS & EQUIPMENT - 2.63 % |
|
|
| |
17,398 |
| American Axle & Manufacturing Holdings, Inc. * |
|
| 328,648 | |
11,924 |
| Goodyear Tire & Rubber Co. |
|
| 331,249 | |
7,381 |
| Icahn Enterprises LP |
|
| 735,886 | |
3,051 |
| Magna International, Inc. |
|
| 328,745 | |
3,685 |
| TRW Automotive Holdings Corp. * |
|
| 329,881 | |
|
|
|
|
| 2,054,409 | |
|
| BEVERAGES - 0.42 % |
|
|
| |
3,766 |
| Constellation Brands, Inc. * |
|
| 331,898 | |
|
|
|
|
|
|
|
|
| BIOTECHNOLOGY - 0.36 % |
|
|
| |
7,310 |
| Myriad Genetics, Inc. * |
|
| 284,505 | |
|
|
|
|
|
|
|
|
| CHEMICALS - 0.81 % |
|
|
| |
3,218 |
| Agrium, Inc. |
|
| 294,866 | |
3,099 |
| Ashland, Inc. |
|
| 336,985 | |
|
|
|
| 631,851 | ||
|
| COMMERCIAL SERVICES - 1.66 % |
|
|
| |
3,591 |
| Chemed Corp. |
|
| 336,549 | |
4,442 |
| Global Payments, Inc. |
|
| 323,599 | |
49,133 |
| Monster Worldwide, Inc. * |
|
| 321,330 | |
7,724 |
| Vistaprint NV * |
|
| 312,513 | |
|
|
|
|
| 1,293,991 | |
|
| COMPUTERS - 1.63 % |
|
|
| |
3,253 |
| DST Systems, Inc. |
|
| 299,829 | |
1,531 |
| International Business Machines Corp. |
|
| 277,524 | |
3,516 |
| SanDisk Corp. |
|
| 367,176 | |
5,845 |
| Seagate Technology PLC |
|
| 332,113 | |
|
|
|
|
| 1,276,642 | |
|
| DISTRIBUTION / WHOLESALE - 0.80 % |
|
|
| |
5,443 |
| Arrow Electronics, Inc. * |
|
| 328,812 | |
2,808 |
| Fossil Group, Inc. * |
|
| 293,492 | |
|
|
|
|
| 622,304 | |
| The accompanying notes are an integral part of these financial statements.
| ||||||
AmericaFirst Quantitative Strategies Fund | ||||||
Schedule Of Investments (Continued) | ||||||
June 30, 2014 | ||||||
Shares |
|
|
|
| Value | |
|
| DIVERSIFIED FINANCIAL SERVICES - 1.03 % |
|
|
| |
14,020 |
| Evercore Partners, Inc. |
|
| $ 808,113 | |
|
|
|
|
|
|
|
|
| ELECTRIC - 3.19 % |
|
|
|
|
5,165 |
| Consolidated Edison, Inc. |
|
| 298,227 | |
3,834 |
| DTE Energy Co. |
|
| 298,553 | |
4,133 |
| Entergy Corp. |
|
| 339,278 | |
11,200 |
| Great Plains Energy, Inc. |
|
| 300,944 | |
4,893 |
| Integrys Energy Group, Inc. |
|
| 348,039 | |
8,996 |
| Portland Gerneral Electric Co. |
|
| 311,891 | |
7,340 |
| Public Service Enterprise Group, Inc. |
|
| 299,399 | |
6,636 |
| Southern Co. |
|
| 301,142 | |
|
|
|
| 2,497,473 | ||
|
| ELECTRICAL COMPONENTS & EQUIPMENT - 0.40 % |
|
|
|
|
4,247 |
| Hitachi Ltd. - ADR |
|
| 311,687 | |
|
|
|
|
|
|
|
|
| ELECTRONICS - 0.46 % |
|
|
| |
32,418 |
| Flextronics International Ltd. * |
|
| 358,867 | |
|
|
|
|
|
|
|
|
| ENERGY-ALTERNATE SOURCES - 0.82 % |
|
|
|
|
9,956 |
| Green Plains, Inc. |
|
| 327,254 | |
20,280 |
| Pacific Ethanol, Inc. * |
|
| 310,081 | |
|
|
|
|
| 637,335 | |
|
| FOOD - 1.64 % |
|
|
| |
9,860 |
| ConAgra Foods, Inc. |
|
| 292,645 | |
4,328 |
| Ingredion, Inc. |
|
| 324,773 | |
4,498 |
| Kellogg Co. |
|
| 295,519 | |
123 |
| Seaboard Corp. * |
|
| 371,493 | |
|
|
|
| 1,284,430 | ||
|
| FOREST PRODUCTS & PAPER - 0.73 % |
|
|
| |
6,482 |
| Domtar Corp. |
|
| 277,754 | |
17,641 |
| Resolute Forest Products, Inc. * |
|
| 296,016 | |
|
|
|
| 573,770 | ||
|
| GAS - 0.40 % |
|
|
| |
7,409 |
| Vectren Corp. |
|
| 314,883 | |
|
|
|
|
|
|
|
|
| HEALTHCARE-PRODUCTS - 1.68 % |
|
|
| |
7,708 |
| CareFusion Corp. * |
|
| 341,850 | |
3,784 |
| Edwards Lifesciences Corp. * |
|
| 324,818 | |
8,037 |
| Hill-Rom Holdings, Inc. |
|
| 333,616 | |
3,786 |
| Varian Medical Systems, Inc. * |
|
| 314,768 | |
|
|
|
|
| 1,315,052 | |
|
| HEALTHCARE-SERVICES - 3.28 % |
|
|
| |
3,602 |
| Cigna Corp. |
|
| 331,276 |
|
8,667 |
| HealthSouth Corp. |
|
| 310,885 |
|
The accompanying notes are an integral part of these financial statements.
AmericaFirst Quantitative Strategies Fund | |||||
Schedule Of Investments (Continued) | |||||
June 30, 2014 | |||||
Shares |
|
|
|
| Value |
|
| HEALTHCARE-SERVICES - 3.28 % (Continued) |
|
|
|
2,707 |
| Humana, Inc. |
|
| $ 345,738 |
3,017 |
| Laboratory Corp. of America Holdings * |
|
| 308,941 |
5,339 |
| Quest Diagnostics, Inc. |
|
| 313,346 |
6,648 |
| Tenet Healthcare Corp. * |
|
| 312,057 |
3,989 |
| UnitedHealth Group, Inc. |
|
| 326,101 |
2,967 |
| WellPoint, Inc. |
|
| 319,279 |
|
|
|
|
| 2,567,623 |
|
| HOME BUILDERS - 0.40 % |
|
|
|
14,087 |
| Taylor Morrison Home Corp. * |
|
| 315,831 |
|
|
|
|
|
|
|
| HOME FURNISHINGS - 0.71 % |
|
|
|
5,565 |
| Electrolux AB - ADR |
|
| 281,700 |
1,958 |
| Whirlpool Corp. |
|
| 272,593 |
|
|
|
| 554,293 | |
|
| INSURANCE - 0.37 % |
|
|
|
6,556 |
| Axis Capital Holdings Ltd. |
|
| 290,300 |
|
|
|
|
|
|
|
| INTERNET - 1.28 % |
|
|
|
6,313 |
| Ctrip.com International Ltd. - ADR * |
|
| 404,284 |
17,340 |
| MagicJack VocalTec Ltd. * |
|
| 262,181 |
6,864 |
| WebMD Health Corp. * |
|
| 331,531 |
|
|
|
| 997,996 | |
|
| LEISURE TIME - 0.77 % |
|
|
|
7,444 |
| Brunswick Corp. |
|
| 313,616 |
7,624 |
| Carnival Corp. |
|
| 287,043 |
|
|
|
| 600,659 | |
|
| LODGING - 0.39 % |
|
|
|
1,467 |
| Wynn Resorts Ltd. |
|
| 304,491 |
|
|
|
|
|
|
|
| MEDIA - 2.53 % |
|
|
|
17,763 |
| Cablevision Systems Corp. |
|
| 313,517 |
7,875 |
| John Wiley & Sons, Inc. |
|
| 477,146 |
31,823 |
| LIN Media LLC * |
|
| 867,177 |
3,763 |
| Walt Disney Co. |
|
| 322,640 |
|
|
|
| 1,980,480 | |
|
| MISCELLANEOUS MANUFACTURERS - 0.88 % |
|
|
|
12,018 |
| FUJIFILM Holdings Corp. - ADR |
|
| 335,543 |
8,020 |
| Trinity Industries, Inc. |
|
| 350,634 |
|
|
|
| 686,177 | |
|
| OIL & GAS - 2.82 % |
|
|
|
12,642 |
| Bill Barrett Corp. * |
|
| 338,553 |
3,987 |
| ConocoPhillips |
|
| 341,806 |
5,765 |
| Eni SpA - ADR |
|
| 316,498 |
9,829 |
| Statoil ASA - ADR |
|
| 303,028 |
7,800 |
| Suncor Energy, Inc. |
|
| 332,514 |
4,557 |
| Unit Corp. * |
|
| 313,658 |
5,232 |
| Valero Energy Corp. |
|
| 262,123 |
|
|
|
|
| 2,208,180 |
The accompanying notes are an integral part of these financial statements.
| |||||
AmericaFirst Quantitative Strategies Fund | |||||
Schedule Of Investments (Continued) | |||||
June 30, 2014 | |||||
Shares |
|
|
|
| Value |
|
| OIL & GAS SERVICES - 0.45 % |
|
|
|
3,808 |
| National Oilwell Varco, Inc. |
|
| $ 313,589 |
950 |
| NOW, Inc. * |
|
| 34,399 |
|
|
|
|
| 347,988 |
|
| PACKAGING & CONTAINERS - 2.05 % |
|
|
|
7,712 |
| Bemis Co., Inc. |
|
| 313,570 |
29,311 |
| Graphic Packaging Holding Co. * |
|
| 342,939 |
4,502 |
| Packaging Corp. of America |
|
| 321,848 |
6,065 |
| Silgan Holdings, Inc. |
|
| 308,223 |
7,146 |
| Sonoco Products Co. |
|
| 313,924 |
|
|
|
|
| 1,600,504 |
|
| PHARMACEUTICALS - 1.97 % |
|
|
|
4,527 |
| Express Scripts Holding Co. * |
|
| 313,857 |
4,987 |
| Herbalife Ltd. |
|
| 321,861 |
5,789 |
| Mylan, Inc. * |
|
| 298,481 |
9,651 |
| Pfizer, Inc. |
|
| 286,442 |
6,022 |
| Teva Pharmaceutical Industries Ltd. - ADR |
|
| 315,673 |
|
|
|
| 1,536,314 | |
|
| PIPELINES - 14.74 % |
|
|
|
23,713 |
| Atlas Pipeline Partners LP |
|
| 815,727 |
9,824 |
| Buckeye Partners LP |
|
| 815,981 |
14,014 |
| DCP Midstream Partners LP |
|
| 798,798 |
24,948 |
| Enbridge Energy Partners LP |
|
| 921,330 |
16,213 |
| Energy Transfer Equity LP |
|
| 955,594 |
13,711 |
| Energy Transfer Partners LP |
|
| 794,827 |
26,242 |
| EnLink Midstream Partners LP |
|
| 824,786 |
10,258 |
| Enterprise Products Partners LP |
|
| 803,099 |
13,550 |
| Genesis Energy LP |
|
| 759,342 |
9,915 |
| Kinder Morgan Energy Partners LP |
|
| 815,112 |
10,051 |
| Magellan Midstream Partners LP |
|
| 844,686 |
12,837 |
| NuStar Energy LP |
|
| 796,022 |
13,185 |
| ONEOK Partners LP |
|
| 772,641 |
13,452 |
| Plains All American Pipeline LP |
|
| 807,792 |
|
|
|
| 11,525,737 | |
|
| PRIVATE EQUITY - 2.09 % |
|
|
|
25,067 |
| Blackstone Group LP |
|
| 838,240 |
32,676 |
| KKR & Co. LP |
|
| 795,007 |
|
|
|
| 1,633,247 | |
|
| RETAIL - 2.48 % |
|
|
|
16,601 |
| AmeriGas Partners LP |
|
| 753,519 |
6,432 |
| Foot Locker, Inc. |
|
| 326,231 |
11,143 |
| Guess?, Inc. |
|
| 300,861 |
5,214 |
| Macy's, Inc. |
|
| 302,516 |
3,495 |
| Nu Skin Enterprises, Inc. |
|
| 258,490 |
|
|
|
|
| 1,941,617 |
| The accompanying notes are an integral part of these financial statements.
| |||||
AmericaFirst Quantitative Strategies Fund | |||||
Schedule Of Investments (Continued) | |||||
June 30, 2014 | |||||
Shares |
|
|
|
| Value |
|
| SOFTWARE - 0.81 % |
|
|
|
14,940 |
| Activision Blizzard, Inc. |
|
| $ 333,162 |
7,313 |
| Oracle Corp. |
|
| 296,396 |
|
|
|
|
| 629,558 |
|
| TELECOMMUNICATIONS - 1.16 % |
|
|
|
4,080 |
| Harris Corp. |
|
| 309,060 |
6,879 |
| Plantronics, Inc. |
|
| 330,536 |
8,095 |
| Vodafone Group PLC - ADR |
|
| 270,292 |
|
|
|
|
| 909,888 |
|
|
|
|
|
|
|
| TOTAL COMMON STOCK ( Cost - $44,624,871) |
|
| 46,615,762 |
|
|
|
|
|
|
|
| EXCHANGE TRADED FUNDS - 25.07 % |
|
|
|
|
| DEBT FUNDS - 25.07 % |
|
|
|
45,213 |
| iShares Core U.S. Credit Bond ETF |
|
| 5,038,537 |
37,735 |
| iShares iBoxx $ Investment Grade Corporate Bond ETF |
|
| 4,500,276 |
121,142 |
| SPDR Barclays High Yield Bond ETF |
|
| 5,055,255 |
161,881 |
| SPDR Barclays Short Term High Yield Bond ETF |
|
| 5,011,836 |
|
| TOTAL EXCHANGE TRADED FUNDS (Cost - $19,479,853) |
|
| 19,605,904 |
|
|
|
|
|
|
Principal |
|
|
|
|
|
|
| BONDS & NOTES - 13.03 % |
|
|
|
|
| ADVERTISING - 1.23 % |
|
|
|
$ 1,025,000 |
| Visant Corp., 10.00%, 10/1/2017 |
|
| 960,938 |
|
|
|
|
| |
|
| AUTO MANUFACTURERS - 1.27 % |
|
|
|
950,000 |
| Navistar International Corp., 8.25%, 11/1/2021 |
|
| 995,125 |
|
|
|
|
| |
|
| BANKS - 0.03 % |
|
|
|
20,000 |
| Banco Hipotecario SA, 9.75%, 4/27/2016 |
|
| 19,925 |
|
|
|
|
|
|
|
| DISTRIBUTION / WHOLESALE - 1.26 % |
|
|
|
925,000 |
| VWR Funding, Inc., 7.25%, 9/15/2017 |
|
| 981,656 |
|
|
|
|
| |
|
| HOUSEHOLD PRODUCTS / WARES - 1.22 % |
|
|
|
900,000 |
| Reynolds Group Issuer, Inc., 9.00%, 4/15/2019 |
|
| 957,375 |
|
|
|
|
| |
|
| LODGING - 0.99 % |
|
|
|
2,000,000 |
| Caesars Entertainment Operation Co., Inc., 10.00%, 12/15/2018 |
|
| 776,250 |
|
|
|
|
| |
|
| MEDIA - 1.34 % |
|
|
|
975,000 |
| Clear Channel Communications, Inc., 9.00%, 3/1/2021 |
|
| 1,046,906 |
|
|
|
|
| |
|
| OIL & GAS - 1.32 % |
|
|
|
1,000,000 |
| EXCO Resources, Inc., 7.50%, 9/15/2018 |
|
| 1,030,000 |
|
|
|
|
| |
The accompanying notes are an integral part of these financial statements.
| |||||
AmericaFirst Quantitative Strategies Fund | |||||
Schedule Of Investments (Continued) | |||||
June 30, 2014 | |||||
Principal |
|
|
|
| Value |
|
| RETAIL - 2.49 % |
|
|
|
$ 900,000 |
| Burger King Corp., 9.875%, 10/15/2018 |
|
| $ 967,500 |
925,000 |
| Michaels Stores, Inc., 7.75%, 11/1/2018 |
|
| 980,500 |
|
|
|
|
| 1,948,000 |
|
| TELECOMMUNICATIONS - 1.88 % |
|
|
|
950,000 |
| MetroPCS Wireless, Inc., 7.875%, 9/1/2018 |
|
| 998,735 |
1,500,000 |
| NII Capital Corp., 10.00%, 8/15/2016 |
|
| 472,500 |
|
|
|
| 1,471,235 | |
|
|
|
|
|
|
|
| TOTAL BONDS & NOTES ( Cost - $10,915,881) |
|
| 10,187,410 |
Shares |
|
|
|
|
|
|
| SHORT-TERM INVESTMENTS - 2.01 % |
|
|
|
|
| MONEY MARKET FUND - 2.01 % |
|
|
|
1,568,284 |
| Dreyfus Cash Management, Institutional Shares, 0.03% ** |
|
| 1,568,284 |
|
| TOTAL SHORT-TERM INVESTMENTS ( Cost - $1,568,284) |
|
|
|
|
|
|
|
|
|
|
| TOTAL INVESTMENTS - 99.73 % ( Cost - $76,588,889) (a) |
|
| $ 77,977,360 |
|
| OTHER ASSETS LESS LIABILITIES - 0.27 % |
|
| 213,914 |
|
| NET ASSETS - 100.00 % |
|
| $ 78,191,274 |
|
|
|
|
|
|
ADR - American Depositary Receipt. | |||||
LP - Limited Partnership. | |||||
PLC - Public Limited Company. | |||||
* Non-income producing security. |
|
|
| ||
# Illiquid Security | |||||
^ Fair value estimated using fair value procedures adopted by the Board of Trustees. See Note 1 in the Notes to Financial Statements. | |||||
** The rate shown represents the rate at June 30, 2014 and is subject to change daily. |
|
|
| ||
(a) Represents cost for financial reporting purposes. Aggregate cost for federal tax purposes is $76,362,343 and differs from market value by net unrealized appreciation (depreciation) of securities as follows: | |||||
|
|
| Unrealized appreciation: | $ 3,833,797 | |
|
|
| Unrealized depreciation: | (2,218,780) | |
|
|
| Net unrealized appreciation: | $ 1,615,017 | |
|
|
|
|
|
|
The Fund's holdings were divided among the following economic sectors: |
|
|
| ||
|
|
| Value | Percentage | |
|
| DEBT FUND | $ 19,605,904 |
| 25.14% |
|
| PIPELINES | 11,525,737 |
| 14.78% |
|
| RETAIL | 3,889,617 |
| 4.99% |
|
| OIL & GAS | 3,238,180 |
| 4.15% |
|
| MEDIA | 3,027,386 |
| 3.88% |
|
| HEALTHCARE-SERVICES | 2,567,623 |
| 3.29% |
|
| ELECTRIC | 2,497,473 |
| 3.20% |
|
| TELECOMMUNICATIONS | �� 2,381,123 |
| 3.05% |
|
| AUTO PARTS & EQUIPMENT | 2,054,409 |
| 2.63% |
|
| PRIVATE EQUITY | 1,633,247 |
| 2.09% |
|
| DISTRIBUTION / WHOLESALE | 1,603,960 |
| 2.06% |
|
| PACKAGING & CONTAINERS | 1,600,504 |
| 2.05% |
|
| MONEY MARKET FUND | 1,568,284 |
| 2.01% |
The accompanying notes are an integral part of these financial statements.
| |||||
AmericaFirst Quantitative Strategies Fund | |||||
Schedule Of Investments (Continued) | |||||
June 30, 2014 | |||||
The Fund's holdings were divided among the following economic sectors: (Continued) |
|
|
| ||
|
| PHARMACEUTICALS | 1,536,314 |
| 1.97% |
|
| AUTO MANUFACTURERS | 1,320,959 |
| 1.69% |
|
| HEALTHCARE-PRODUCTS | 1,315,052 |
| 1.69% |
|
| COMMERCIAL SERVICES | 1,293,991 |
| 1.66% |
|
| FOOD | 1,284,430 |
| 1.65% |
|
| COMPUTERS | 1,276,642 |
| 1.64% |
|
| LODGING | 1,080,741 |
| 1.39% |
|
| INTERNET | 997,996 |
| 1.28% |
|
| ADVERTISING | 960,938 |
| 1.23% |
|
| HOUSEHOLD PRODUCTS / WARES | 957,375 |
| 1.23% |
|
| DIVERSIFIED FINANCIAL SERVICES | 808,113 |
| 1.04% |
|
| MISCELLANEOUS MANUFACTURERS | 686,177 |
| 0.88% |
|
| ENERGY-ALTERNATE SOURCES | 637,335 |
| 0.82% |
|
| CHEMICALS | 631,851 |
| 0.81% |
|
| SOFTWARE | 629,558 |
| 0.81% |
|
| AEROSPACE/DEFENSE | 606,199 |
| 0.78% |
|
| LEISURE TIME | 600,659 |
| 0.77% |
|
| FOREST PRODUCTS & PAPER | 573,770 |
| 0.74% |
|
| HOME FURNISHINGS | 554,293 |
| 0.71% |
|
| ELECTRONICS | 358,867 |
| 0.46% |
|
| OIL & GAS SERVICES | 347,988 |
| 0.45% |
|
| BEVERAGES | 331,898 |
| 0.43% |
|
| HOME BUILDERS | 315,831 |
| 0.41% |
|
| GAS | 314,883 |
| 0.40% |
|
| ELECTRICAL COMPONENTS & EQUIPMENT | 311,687 |
| 0.40% |
|
| AGRICULTURE | 305,917 |
| 0.39% |
|
| INSURANCE | 290,300 |
| 0.37% |
|
| BIOTECHNOLOGY | 284,505 |
| 0.36% |
|
| AIRLINES | 149,719 |
| 0.19% |
|
| BANKS | 19,925 |
| 0.03% |
|
| Total Portfolio Holdings | $ 77,977,360 |
| 100.00% |
|
|
|
|
|
|
The percentages in the above table are based on market value of the Fund's portfolio holdings as of June 30, 2014 and are subject to change. | |||||
The accompanying notes are an integral part of these financial statements.
The accompanying notes are an integral part of these financial statements.
AmericaFirst Quantitative Funds | ||||||||||
Statements of Assets and Liabilities | ||||||||||
June 30, 2014 | ||||||||||
|
| Defensive Growth Fund |
| Income Trends Fund |
| Absolute Return Fund |
| Quantitative Strategies Fund |
| Seasonal Trends Fund |
ASSETS: |
|
|
|
|
|
|
|
|
| |
Investments in securities, at value: | $ 40,188,584 |
| $ 44,268,665 |
| $ 17,766,836 |
| $ 77,977,360 |
| $ 30,794,644 | |
Cash | - |
| - |
| 5,131 |
| 95 |
| - | |
Deposit at broker for securities sold short | 6,015,277 |
| - |
| 146 |
| - |
| - | |
Receivables: |
|
|
|
|
|
|
|
|
| |
Capital shares sold | 108,280 |
| 55,748 |
| 58 |
| 142,193 |
| 79,842 | |
Securities sold | - |
| - |
| - |
| - |
| 1,073,870 | |
Dividends | 62,183 |
| 116,327 |
| 47,157 |
| 33,172 |
| 424 | |
Interest | 35 |
| 374,896 |
| 2 |
| 248,436 |
| 408,629 | |
Due from manager | 285 |
| - |
| - |
| - |
| - | |
Prepaid expenses | 32,544 |
| 30,468 |
| 27,537 |
| 27,658 |
| 16,476 | |
Total assets | 46,407,188 |
| 44,846,104 |
| 17,846,867 |
| 78,428,914 |
| 32,373,885 | |
|
|
|
|
|
|
|
|
|
|
|
LIABILITIES: |
|
|
|
|
|
|
|
|
| |
Securities sold short, at value | 9,274,709 |
| - |
| - |
| - |
| - | |
Payables: |
|
|
|
|
|
|
|
|
| |
Distribution and/or service (12b-1) fees | 6,743 |
| 14,839 |
| 2,661 |
| 41,809 |
| 7,637 | |
Due to manager | - |
| 21,889 |
| 5,619 |
| 19,814 |
| 24,545 | |
Due to custodian | - |
| - |
| - |
| - |
| 552,999 | |
Capital shares redeemed | 49,690 |
| 82,635 |
| 57,691 |
| 5,163 |
| 51,300 | |
Dividends on securities sold short | 7,922 |
|
|
|
|
|
|
|
| |
Due to administrator and other related parties | 2,278 |
| 4,770 |
| 1,263 |
| 8,426 |
| 1,883 | |
Accrued interest expense | 6,878 |
| - |
| - |
| - |
| - | |
Other liabilities and accrued expenses | 20,586 |
| 26,852 |
| 21,120 |
| 162,428 |
| 18,850 | |
Total liabilities | 9,368,806 |
| 150,985 |
| 88,354 |
| 237,640 |
| 657,214 | |
|
|
|
|
|
|
|
|
|
|
|
NET ASSETS | $ 37,038,382 |
| $ 44,695,119 |
| $ 17,758,513 |
| $ 78,191,274 |
| $ 31,716,671 | |
|
|
|
|
|
|
|
|
|
|
|
Investments in securities, at cost | $ 36,841,630 |
| $ 43,919,958 |
| $ 17,102,002 |
| $ 76,588,889 |
| $ 30,512,489 | |
Securities sold short, at proceeds | (7,419,326) |
| - |
| - |
| - |
| - | |
|
|
|
|
|
|
|
|
|
|
|
NET ASSETS CONSIST OF: |
|
|
|
|
|
|
|
|
| |
Paid-in capital | $ 32,466,845 |
| $ 49,078,194 |
| $ 23,348,345 |
| $ 70,448,979 |
| $ 31,396,791 | |
Accumulated/Undistributed net investment income (loss) | 1,212 |
| 107,701 |
| (28,522) |
| 377,618 |
| - | |
Accumulated net realized capital gain (loss) | 3,078,754 |
| (4,839,483) |
| (6,226,176) |
| 5,976,206 |
| 37,725 | |
Net unrealized appreciation on investments and foreign currency | 1,491,571 |
| 348,707 |
| 664,866 |
| 1,388,471 |
| 282,155 | |
NET ASSETS | $ 37,038,382 |
| $ 44,695,119 |
| $ 17,758,513 |
| $ 78,191,274 |
| $ 31,716,671 | |
The accompanying notes are an integral part of these financial statements. |
AmericaFirst Quantitative Funds | |||||||||||
Statements of Assets and Liabilities (Continued) | |||||||||||
June 30, 2014 | |||||||||||
|
| Defensive Growth Fund |
| Income Trends Fund |
| Absolute Return Fund |
| Quantitative Strategies Fund |
| Seasonal Trends Fund | |
Net Asset Value Per Share |
|
|
|
|
|
|
|
|
| ||
| Class A Shares |
|
|
|
|
|
|
|
|
| |
| Net Assets | $ 13,826,437 |
| $ 15,308,890 |
| $ 8,671,927 |
| $ 40,418,735 |
| $ 10,060,046 | |
| Shares of Beneficial Interest Outstanding (no par value; unlimited shares authorized) | 1,103,322 |
| 1,655,265 |
| 722,116 |
| 5,796,897 |
| 970,018 | |
| Net Asset Value per share | $ 12.53 |
| $ 9.25 |
| $ 12.01 |
| $ 6.97 |
| $ 10.37 | |
| Maximum offering price per share (maximum sales load of 5%, 4%, 5%, 4% and 5%, respectively) | $ 13.19 |
| $ 9.64 |
| $ 12.64 |
| $ 7.26 |
| $ 10.92 | |
| Minimum redemption price per share (1) | $ 12.40 |
| $ 9.16 |
| $ 11.89 |
| $ 6.90 |
| $ 10.27 | |
|
|
|
|
|
|
|
|
|
|
| |
| Class I Shares |
|
|
|
|
|
|
|
|
| |
| Net Assets | $ 14,159,663 |
| $ 15,032,708 |
| $ 1,120,993 |
| $ - |
| $ 17,563,476 | |
| Shares of Beneficial Interest Outstanding (no par value; unlimited shares authorized) | 1,104,666 |
| 1,621,388 |
| 91,769 |
| - |
| 1,687,867 | |
| Net Asset Value and offering price per share | $ 12.82 |
| $ 9.27 |
| $ 12.22 |
| $ - |
| $ 10.41 | |
| Minimum redemption price per share (3) | $ 12.69 |
| $ 9.18 |
| $ 12.10 |
| $ - |
| $ 10.31 | |
|
|
|
|
|
|
|
|
|
|
| |
| Class U Shares |
|
|
|
|
|
|
|
|
| |
| Net Assets | $ 9,052,282 |
| $ 14,353,521 |
| $ 7,965,593 |
| $ - |
| $ 4,093,149 | |
| Shares of Beneficial Interest Outstanding (no par value; unlimited shares authorized) | 735,484 |
| 1,552,563 |
| 676,237 |
| - |
| 395,918 | |
| Net Asset Value per share | $ 12.31 |
| $ 9.25 |
| $ 11.78 |
| $ - |
| $ 10.34 | |
| Maximum offering price per share (maximum sales load of 2.50%, 2.00%, 2.50%, 0% and 2.50%, respectively) | $ 12.63 |
| $ 9.44 |
| $ 12.08 |
| $ - |
| $ 10.61 | |
| Minimum redemption price per share (1) | $ 12.19 |
| $ 9.16 |
| $ 11.66 |
| $ - |
| $ 10.24 | |
|
|
|
|
|
|
|
|
|
|
| |
| Class C Shares |
|
|
|
|
|
|
|
|
| |
| Net Assets | $ - |
| $ - |
| $ - |
| $ 37,772,539 |
| $ - | |
| Shares of Beneficial Interest Outstanding (no par value; unlimited shares authorized) | - |
| - |
| - |
| 5,454,473 |
| - | |
| Net Asset Value per share | $ - |
| $ - |
| $ - |
| $ 6.93 |
| $ - | |
| Maximum offering price per share (maximum sales load of 0%, 0%, 0% 1%, and 0% respectively) | $ - |
| $ - |
| $ - |
| $ 7.00 |
| $ - | |
| Minimum redemption price per share (2)(3) | $ - |
| $ - |
| $ - |
| $ 6.86 |
| $ - | |
|
|
|
|
|
|
|
|
|
|
| |
(1) | Investment in Class A and Class U shares made at or above the $1 million breakpoint are not subject to an initial sales charge and may be subject to a 1% contingent deferred sales |
|
| ||||||||
| charge ("CDSC") on shares redeemed less than one year after the date of purchase (excluding shares purchased with reinvested dividends and/or distributions). |
|
|
| |||||||
| The Fund charges a fee of 1.00% on redemptions of shares held less than 90 days. |
|
|
|
|
|
|
|
| ||
(2) | A CDSC of 1.00% is imposed in the event of certain redemption transactions of Class C shares less than one year after the date of purchase (excluding shares purchased with |
|
| ||||||||
| reinvested dividends and/or distributions). |
|
|
|
|
|
|
|
|
|
|
(3) | The Fund charges a fee of 1.00% on redemptions of shares held less than 90 days. |
|
|
|
|
|
|
|
| ||
The accompanying notes are an integral part of these financial statements. |
AmericaFirst Quantitative Funds | ||||||||||
Statements of Operations | ||||||||||
For the Year or Period Ended June 30, 2014 | ||||||||||
|
|
|
|
|
|
|
|
|
|
|
|
| For the Year Ended June 30, 2014 |
| For the Period* Ended June 30, 2014 | ||||||
|
| Defensive Growth Fund |
| Income Trends Fund |
| Absolute Return Fund |
| Quantitative Strategies Fund |
| Seasonal Trends Fund |
|
|
|
|
|
|
|
|
|
|
|
INVESTMENT INCOME: |
|
|
|
|
|
|
|
|
| |
Dividend income (net of foreign withholding taxes of $8,740, $7,070, $12,177, $10,760 and $651, respectively) | $ 669,622 |
| $ 1,332,947 |
| $ 372,168 |
| $ 1,276,862 |
| $ 101,280 | |
Income earned from affiliated securities (See note 6) | 6,842 |
| 63,370 |
| 11,702 |
| 71,841 |
| - | |
Interest income | 257 |
| 920,787 |
| 18 |
| 770,672 |
| 191,642 | |
Total investment income | 676,721 |
| 2,317,104 |
| 383,888 |
| 2,119,375 |
| 292,922 | |
|
|
|
|
|
|
|
|
|
|
|
EXPENSES: |
|
|
|
|
|
|
|
|
| |
Management fees | 461,360 |
| 468,769 |
| 275,012 |
| 585,062 |
| 199,938 | |
Distribution and/or service (12b-1) fees - Class A | 62,036 |
| 67,987 |
| 45,549 |
| 71,182 |
| 19,679 | |
Distribution and/or service (12b-1) fees - Class C | - |
| - |
| - |
| 300,333 |
| - | |
Distribution and/or service (12b-1) fees - Class U | 74,150 |
| 121,317 |
| 83,284 |
| - |
| 16,026 | |
Administrator and related party fees | 47,878 |
| 61,320 |
| 34,773 |
| 87,783 |
| 25,798 | |
Registration fees | 67,500 |
| 71,998 |
| 67,500 |
| 72,000 |
| 1,672 | |
Custody fees | 16,736 |
| 13,261 |
| 16,457 |
| 13,894 |
| 3,347 | |
Legal Fees | 15,805 |
| 13,928 |
| 7,157 |
| 23,044 |
| 10,692 | |
Audit and tax fees | 12,500 |
| 13,500 |
| 13,502 |
| 13,000 |
| 11,199 | |
Compliance officer compensation | 15,508 |
| 15,425 |
| 15,227 |
| 15,619 |
| 10,096 | |
Interest expense | 186,386 |
| 3,947 |
| 2,159 |
| 1,644 |
| - | |
Trustees' fees | 11,352 |
| 10,062 |
| 5,174 |
| 14,961 |
| 2,944 | |
Printing fees | 11,097 |
| 30,323 |
| 10,735 |
| 18,037 |
| 4,796 | |
Insurance fees | 6,237 |
| 6,225 |
| 6,456 |
| 12,879 |
| 1,951 | |
Dividend expenses on securities sold short | 85,183 |
| - |
| - |
| - |
| - | |
Miscellaneous | 14,066 |
| 21,556 |
| 11,622 |
| 25,573 |
| 11,617 | |
|
|
|
|
|
|
|
|
|
|
|
Total expenses | 1,087,794 |
| 919,618 |
| 594,607 |
| 1,255,011 |
| 319,755 | |
Less fees waived and expenses absorbed | (147,212) |
| (114,214) |
| (107,501) |
| (149,421) |
| (25,579) | |
|
|
|
|
|
|
|
|
|
|
|
Net expenses | 940,582 |
| 805,404 |
| 487,106 |
| 1,105,590 |
| 294,176 | |
|
|
|
|
|
|
|
|
|
|
|
Net investment income (loss) | (263,861) |
| 1,511,700 |
| (103,218) |
| 1,013,785 |
| (1,254) | |
|
|
|
|
|
|
|
|
|
|
|
REALIZED AND UNREALIZED GAIN (LOSS) ON INVESTMENTS: |
|
|
|
|
|
|
|
|
| |
Net realized gain (loss) on: |
|
|
|
|
|
|
|
|
| |
| Investments and foreign currency transactions | 5,625,689 |
| 840,144 |
| 3,452,202 |
| 9,119,543 |
| 38,979 |
| Securities sold short | (1,046,769) |
| - |
| - |
| - |
| - |
| Affiliates (See note 6) | (1,640) |
| (59,665) |
| (11,105) |
| (44,385) |
| - |
Change in net unrealized appreciation (depreciation) on: |
|
|
|
|
|
|
|
|
| |
| Investments and foreign currency transactions | 1,165,421 |
| 447,553 |
| 1,374,581 |
| 96,760 |
| 282,155 |
| Securities sold short | (812,116) |
| - |
| - |
| - |
| - |
| Affiliates (See note 6) | - |
| 28,302 |
| - |
| 60,274 |
| - |
|
|
|
|
|
|
|
|
|
|
|
Net realized and unrealized gain on investments | 4,930,585 |
| 1,256,334 |
| 4,815,678 |
| 9,232,192 |
| 321,134 | |
|
|
|
|
|
|
|
|
|
|
|
NET INCREASE IN NET ASSETS RESULTING FROM OPERATIONS | $ 4,666,724 |
| $ 2,768,034 |
| $ 4,712,460 |
| $ 10,245,977 |
| $ 319,880 | |
|
|
|
|
|
|
|
|
|
|
|
* Commenced operations on October 31, 2013. |
|
|
|
|
|
|
|
|
| |
The accompanying notes are an integral part of these financial statements. |
AmericaFirst Quantitative Funds | ||||||||||
Statements of Changes in Net Assets | ||||||||||
|
|
|
|
|
|
|
|
|
|
|
|
|
| Defensive Growth Fund |
|
| Income Trends Fund | ||||
|
| Year | Year |
| Year | Year | ||||
|
| Ended | Ended |
| Ended | Ended | ||||
|
| June 30, 2014 | June 30, 2013 |
| June 30, 2014 | June 30, 2013 | ||||
|
|
|
|
|
|
|
|
|
|
|
INCREASE (DECREASE) IN NET ASSETS |
|
|
|
|
|
|
|
|
|
|
OPERATIONS: |
|
|
|
|
|
|
|
|
|
|
Net investment income (loss) |
|
| $ (263,861) |
| $ (104,046) |
|
| $ 1,511,700 |
| $ 1,518,667 |
Net realized gain on investments. options written and securities sold short |
|
| 4,577,280 |
| 1,397,773 |
|
| 780,479 |
| 517,479 |
Change in net unrealized appreciation (depreciation) on investments and securities sold short |
|
| 353,305 |
| 868,890 |
|
| 475,855 |
| (141,394) |
Net increase in net assets resulting from operations |
|
| 4,666,724 |
| 2,162,617 |
|
| 2,768,034 |
| 1,894,752 |
|
|
|
|
|
|
|
|
|
|
|
DISTRIBUTIONS TO SHAREHOLDERS FROM: |
|
|
|
|
|
|
|
|
|
|
Net realized gain - Class A |
|
| (864,905) |
| (400,109) |
|
| - |
| - |
Net realized gain - Class I |
|
| (746,497) |
| (153,077) |
|
| - |
| - |
Net realized gain - Class U |
|
| (533,621) |
| (312,144) |
|
| - |
| - |
Net investment income - Class A |
|
| - |
| (39,645) |
|
| (379,682) |
| (434,126) |
Net investment income - Class I |
|
| - |
| (14,862) |
|
| (357,299) |
| (407,929) |
Net investment income - Class U |
|
| - |
| (29,972) |
|
| (313,830) |
| (528,430) |
Return of capital - Class A |
|
| - |
| - |
|
| (601,254) |
| (108,132) |
Return of capital - Class I |
|
| - |
| - |
|
| (565,808) |
| (100,276) |
Return of capital - Class U |
|
| - |
| - |
|
| (496,970) |
| (124,150) |
Total distributions to shareholders |
|
| (2,145,023) |
| (949,809) |
|
| (2,714,843) |
| (1,703,043) |
|
|
|
|
|
|
|
|
|
|
|
CAPITAL SHARE TRANSACTIONS: |
|
|
|
|
|
|
|
|
|
|
Class A Shares |
|
|
|
|
|
|
|
|
|
|
Proceeds from shares sold |
|
| 6,209,200 |
| 6,866,571 |
|
| 7,312,001 |
| 6,538,898 |
Reinvestment of distributions |
|
| 803,479 |
| 417,838 |
|
| 676,865 |
| 379,463 |
Cost of shares redeemed |
|
| (4,895,615) |
| (2,904,216) |
|
| (3,022,034) |
| (2,196,297) |
Redemption fees |
|
| 1,434 |
| 1,226 |
|
| 1,372 |
| 139 |
Total Class A Transactions |
|
| 2,118,498 |
| 4,381,419 |
|
| 4,968,204 |
| 4,722,203 |
|
|
|
|
|
|
|
|
|
|
|
Class I |
|
|
|
|
|
|
|
|
|
|
Proceeds from shares sold |
|
| 7,069,435 |
| 6,941,096 |
|
| 11,089,305 |
| 5,544,826 |
Reinvestment of distributions |
|
| 616,425 |
| 152,915 |
|
| 785,592 |
| 362,308 |
Cost of shares redeemed |
|
| (2,941,854) |
| (1,655,191) |
|
| (5,754,997) |
| (1,776,463) |
Redemption fees |
|
| 1,187 |
| 1,936 |
|
| 1,209 |
| 883 |
Total Class I Transactions |
|
| 4,745,193 |
| 5,440,756 |
|
| 6,121,109 |
| 4,131,554 |
|
|
|
|
|
|
|
|
|
|
|
Class U |
|
|
|
|
|
|
|
|
|
|
Proceeds from shares sold |
|
| 3,009,872 |
| 2,663,564 |
|
| 5,110,772 |
| 3,453,208 |
Reinvestment of distributions |
|
| 524,424 |
| 319,917 |
|
| 527,118 |
| 379,971 |
Cost of shares redeemed |
|
| (1,187,014) |
| (2,874,087) |
|
| (2,135,648) |
| (3,466,241) |
Redemption fees |
|
| 841 |
| 500 |
|
| 1,229 |
| 199 |
Total Class U Transactions |
|
| 2,348,123 |
| 109,894 |
|
| 3,503,471 |
| 367,137 |
|
|
|
|
|
|
|
|
|
|
|
|
|
|
|
|
|
|
|
|
|
|
Net increase from capital share transactions |
|
| 9,211,814 |
| 9,932,069 |
|
| 14,592,784 |
| 9,220,894 |
|
|
|
|
|
|
|
|
|
|
|
TOTAL INCREASE IN NET ASSETS |
|
| 11,733,515 |
| 11,144,877 |
|
| 14,645,975 |
| 9,412,603 |
|
|
|
|
|
|
|
|
|
|
|
NET ASSETS: |
|
|
|
|
|
|
|
|
|
|
Beginning of year |
|
| 25,304,867 |
| 14,159,990 |
|
| 30,049,144 |
| 20,636,541 |
End of year** |
|
| $ 37,038,382 |
| $ 25,304,867 |
|
| $ 44,695,119 |
| $ 30,049,144 |
|
|
|
|
|
|
|
|
|
|
|
** Includes undistributed net investment income of: |
|
| $ 1,212 |
| $ - |
|
| $ 107,701 |
| $ 46,052 |
The accompanying notes are an integral part of these financial statements. |
AmericaFirst Quantitative Funds | ||||||||||
Statements of Changes in Net Assets (Continued) | ||||||||||
|
|
|
|
|
|
|
|
|
|
|
|
|
| Defensive Growth Fund |
|
| Income Trends Fund | ||||
|
| Year | Year |
| Year | Year | ||||
|
| Ended | Ended |
| Ended | Ended | ||||
|
| June 30, 2014 | June 30, 2013 |
| June 30, 2014 | June 30, 2013 | ||||
SHARE ACTIVITY: |
|
|
|
|
|
|
|
|
|
|
Class A |
|
|
|
|
|
|
|
|
|
|
Shares sold |
|
| 515,893 |
| 608,569 |
|
| 786,037 |
| 705,303 |
Reinvested distributions |
|
| 68,615 |
| 39,788 |
|
| 73,140 |
| 41,304 |
Shares redeemed |
|
| (410,090) |
| (263,401) |
|
| (324,897) |
| (237,699) |
Net increase |
|
| 174,418 |
| 384,956 |
|
| 534,280 |
| 508,908 |
|
|
|
|
|
|
|
|
|
|
|
Class I |
|
|
|
|
|
|
|
|
|
|
Shares sold |
|
| 579,628 |
| 609,337 |
|
| 1,190,870 |
| 594,244 |
Reinvested distributions |
|
| 51,844 |
| 14,438 |
|
| 84,831 |
| 39,410 |
Shares redeemed |
|
| (244,814) |
| (154,695) |
|
| (620,158) |
| (192,420) |
Net increase |
|
| 386,658 |
| 469,080 |
|
| 655,543 |
| 441,234 |
|
|
|
|
|
|
|
|
|
|
|
Class U |
|
|
|
|
|
|
|
|
|
|
Shares sold |
|
| 252,988 |
| 241,383 |
|
| 550,391 |
| 369,336 |
Reinvested distributions |
|
| 45,483 |
| 30,752 |
|
| 57,000 |
| 41,415 |
Shares redeemed |
|
| (100,216) |
| (268,238) |
|
| (230,382) |
| (379,357) |
Net increase |
|
| 198,255 |
| 3,897 |
|
| 377,009 |
| 31,394 |
The accompanying notes are an integral part of these financial statements. |
| AmericaFirst Quantitative Funds | ||||||||||||
| Statements of Changes in Net Assets (Continued) | ||||||||||||
|
|
|
|
|
|
|
|
|
|
|
|
|
|
|
|
| Absolute Return Fund |
|
| Quantitative Strategies Fund |
|
| Seasonal Trends Fund | ||||
|
| Year |
| Year |
| Year | Year |
|
| Period** | |||
|
| Ended |
| Ended |
| Ended | Ended |
|
| Ended | |||
|
| June 30, 2014 |
| June 30, 2013 |
| June 30, 2014 | June 30, 2013 |
|
| June 30, 2014 | |||
|
|
|
|
|
|
|
|
|
|
|
|
|
|
| INCREASE (DECREASE) IN NET ASSETS |
|
|
|
|
|
|
|
|
|
|
|
|
| OPERATIONS: |
|
|
|
|
|
|
|
|
|
|
|
|
| Net investment income (loss) |
| $ (103,218) |
| $ 23,611 |
|
| $ 1,013,785 |
| $ 1,249,632 |
|
| $ (1,254) |
| Net realized gain on investments. options written and securities sold short |
| 3,441,097 |
| 767,275 |
|
| 9,075,158 |
| 2,999,062 |
|
| 38,979 |
| Change in net unrealized appreciation (depreciation) on investments and securities sold short |
| 1,374,581 |
| (1,126,360) |
|
| 157,034 |
| 764,540 |
|
| 282,155 |
| Net increase (decrease) in net assets resulting from operations |
| 4,712,460 |
| (335,474) |
|
| 10,245,977 |
| 5,013,234 |
|
| 319,880 |
|
|
|
|
|
|
|
|
|
|
|
|
|
|
| DISTRIBUTIONS TO SHAREHOLDERS FROM: |
|
|
|
|
|
|
|
|
|
|
|
|
| Net realized gain - Class A |
| - |
| - |
|
| (1,518,956) |
| - |
|
| - |
| Net realized gain - Class I |
| - |
| - |
|
| - |
| - |
|
| - |
| Net realized gain - Class U |
| - |
| - |
|
| - |
| - |
|
| - |
| Net realized gain - Class C |
| - |
| - |
|
| (1,852,097) |
| - |
|
| - |
| Net investment income - Class A |
| - |
| - |
|
| (596,856) |
| (661,492) |
|
| - |
| Net investment income - Class I |
| - |
| - |
|
| - |
| - |
|
| - |
| Net investment income - Class U |
| - |
| - |
|
| - |
| - |
|
| - |
| Net investment income - Class C |
| - |
| - |
|
| (388,251) |
| (618,123) |
|
| - |
| Return of capital - Class A |
| - |
| (52,725) |
|
| - |
| - |
|
| �� - |
| Return of capital - Class I |
| - |
| (9,545) |
|
| - |
| - |
|
| - |
| Return of capital - Class U |
| - |
| (5,098) |
|
| - |
| - |
|
| - |
| Total distributions to shareholders |
| - |
| (67,368) |
|
| (4,356,160) |
| (1,279,615) |
|
| - |
|
|
|
|
|
|
|
|
|
|
|
|
|
|
| CAPITAL SHARE TRANSACTIONS: |
|
|
|
|
|
|
|
|
|
|
|
|
| Class A Shares |
|
|
|
|
|
|
|
|
|
|
|
|
| Proceeds from shares sold |
| 991,326 |
| 1,672,529 |
|
| 24,083,126 |
| 10,093,721 |
|
| 10,945,998 |
| Reinvestment of distributions |
| - |
| 42,380 |
|
| 1,966,586 |
| 587,940 |
|
| - |
| Cost of shares redeemed |
| (3,503,848) |
| (14,880,589) |
|
| (12,019,183) |
| (6,301,364) |
|
| (1,044,563) |
| Redemption fees |
| 489 |
| 1,583 |
|
| 1,916 |
| 4,483 |
|
| 833 |
| Total Class A Transactions |
| (2,512,033) |
| (13,164,097) |
|
| 14,032,445 |
| 4,384,780 |
|
| 9,902,268 |
|
|
|
|
|
|
|
|
|
|
|
|
|
|
| Class I |
|
|
|
|
|
|
|
|
|
|
|
|
| Proceeds from shares sold |
| 603,575 |
| 276,226 |
|
| - |
| - |
|
| 23,312,536 |
| Reinvestment of distributions |
| - |
| 8,282 |
|
| - |
| - |
|
| - |
| Cost of shares redeemed |
| (375,640) |
| (4,439,685) |
|
| - |
| - |
|
| (5,852,084) |
| Redemption fees |
| 41 |
| 36 |
|
| - |
| - |
|
| 1,479 |
| Total Class I Transactions |
| 227,976 |
| (4,155,141) |
|
| - |
| - |
|
| 17,461,931 |
|
|
|
|
|
|
|
|
|
|
|
|
|
|
| Class U |
|
|
|
|
|
|
|
|
|
|
|
|
| Proceeds from shares sold |
| 301,180 |
| 138,635 |
|
| - |
| - |
|
| 4,094,781 |
| Reinvestment of distributions |
| - |
| 4,280 |
|
| - |
| - |
|
| - |
| Cost of shares redeemed |
| (3,241,858) |
| (12,539,620) |
|
| - |
| - |
|
| (62,506) |
| Redemption fees |
| 460 |
| 659 |
|
| - |
| - |
|
| 317 |
| Total Class U Transactions |
| (2,940,218) |
| (12,396,046) |
|
| - |
| - |
|
| 4,032,592 |
|
|
|
|
|
|
|
|
|
|
|
|
|
|
| Class C |
|
|
|
|
|
|
|
|
|
|
|
|
| Proceeds from shares sold |
| - |
| - |
|
| 10,258,829 |
| 3,109,128 |
|
| - |
| Reinvestment of distributions |
| - |
| - |
|
| 2,144,131 |
| 569,773 |
|
| - |
| Cost of shares redeemed |
| - |
| - |
|
| (3,504,883) |
| (5,024,715) |
|
| - |
| Redemption fees |
| - |
| - |
|
| 1,874 |
| 242 |
|
| - |
| Total Class C Transactions |
| - |
| - |
|
| 8,899,951 |
| (1,345,572) |
|
| - |
|
|
|
|
|
|
|
|
|
|
|
|
|
|
| Net increase (decrease) from capital share transactions |
| (5,224,275) |
| (29,715,284) |
|
| 22,932,396 |
| �� 3,039,208 |
|
| 31,396,791 |
|
|
|
|
|
|
|
|
|
|
|
|
|
|
| TOTAL INCREASE (DECREASE) IN NET ASSETS |
| (511,815) |
| (30,118,126) |
|
| 28,822,213 |
| 6,772,827 |
|
| 31,716,671 |
|
|
|
|
|
|
|
|
|
|
|
|
|
|
| ** Commenced operations on October 31, 2013. |
|
|
|
|
|
|
|
|
|
|
|
|
The accompanying notes are an integral part of these financial statements. |
| AmericaFirst Quantitative Funds | ||||||||||||
| Statements of Changes in Net Assets (Continued) | ||||||||||||
|
|
|
|
|
|
|
|
|
|
|
|
|
|
|
|
| Absolute Return Fund |
|
| Quantitative Strategies Fund |
|
| Seasonal Trends Fund | ||||
|
| Year |
| Year |
| Year | Year |
|
| Period** | |||
|
| Ended |
| Ended |
| Ended | Ended |
|
| Ended | |||
|
| June 30, 2014 |
| June 30, 2013 |
| June 30, 2014 | June 30, 2013 |
|
| June 30, 2014 | |||
|
|
|
|
|
|
|
|
|
|
|
|
|
|
| NET ASSETS: |
|
|
|
|
|
|
|
|
|
|
|
|
| Beginning of year or period |
| 18,270,328 |
| 48,388,454 |
|
| 49,369,061 |
| 42,596,234 |
|
| - |
| End of year or period* |
| $ 17,758,513 |
| $ 18,270,328 |
|
| $ 78,191,274 |
| $ 49,369,061 |
|
| $ 31,716,671 |
|
|
|
|
|
|
|
|
|
|
|
|
|
|
| * Includes undistributed net investment income (loss) of: |
| $ (28,522) |
| $ (1,931) |
|
| $ 377,618 |
| $ - |
|
| $ - |
|
|
|
|
|
|
|
|
|
|
|
|
|
|
|
|
|
|
|
|
|
|
|
|
|
|
|
|
|
|
|
|
|
|
|
|
|
|
|
|
|
|
| SHARE ACTIVITY: |
|
|
|
|
|
|
|
|
|
|
|
|
| Class A |
|
|
|
|
|
|
|
|
|
|
|
|
| Shares sold |
| 92,250 |
| 180,119 |
|
| 3,542,470 |
| 1,610,819 |
|
| 1,070,619 |
| Reinvested distributions |
| - |
| 4,536 |
|
| 295,621 |
| 94,072 |
|
| - |
| Shares redeemed |
| (320,351) |
| (1,610,102) |
|
| (1,783,468) |
| (1,008,789) |
|
| (100,601) |
| Net increase (decrease) |
| (228,101) |
| (1,425,447) |
|
| 2,054,623 |
| 696,102 |
|
| 970,018 |
|
|
|
|
|
|
|
|
|
|
|
|
|
|
| Class I |
|
|
|
|
|
|
|
|
|
|
|
|
| Shares sold |
| 52,743 |
| 29,392 |
|
| - |
| - |
|
| 2,253,733 |
| Reinvested distributions |
| - |
| 887 |
|
| - |
| - |
|
| - |
| Shares redeemed |
| (34,287) |
| (477,198) |
|
| - |
| - |
|
| (565,866) |
| Net increase (decrease) |
| 18,456 |
| (446,919) |
|
| - |
| - |
|
| 1,687,867 |
|
|
|
|
|
|
|
|
|
|
|
|
|
|
| Class U |
|
|
|
|
|
|
|
|
|
|
|
|
| Shares sold |
| 27,951 |
| 15,081 |
|
| - |
| - |
|
| 401,989 |
| Reinvested distributions |
| - |
| 452 |
|
| - |
| - |
|
| - |
| Shares redeemed |
| (308,578) |
| (1,386,267) |
|
| - |
| - |
|
| (6,071) |
| Net increase (decrease) |
| (280,627) |
| (1,370,734) |
|
| - |
| - |
|
| 395,918 |
|
|
|
|
|
|
|
|
|
|
|
|
|
|
| Class C |
|
|
|
|
|
|
|
|
|
|
|
|
| Shares sold |
| - |
| - |
|
| 1,526,224 |
| 502,562 |
|
| - |
| Reinvested distributions |
| - |
| - |
|
| 325,234 |
| 91,461 |
|
| - |
| Shares redeemed |
| - |
| - |
|
| (527,479) |
| (820,806) |
|
| - |
| Net increase (decrease) |
| - |
| - |
|
| 1,323,979 |
| (226,783) |
|
| - |
|
|
|
|
|
|
|
|
|
|
|
|
|
|
| ** Commenced operations on October 31, 2013. |
|
|
|
|
|
|
|
|
|
|
|
|
The accompanying notes are an integral part of these financial statements. |
AmericaFirst Defensive Growth Fund | ||||||||||||||||||
Financial Highlights | ||||||||||||||||||
For a Fund Share Outstanding Throughout Each Year or Period | ||||||||||||||||||
|
|
|
|
|
|
|
|
|
|
|
|
|
|
|
|
|
|
|
| ||||||||||||||||||
|
|
| Class A |
| Class I |
| ||||||||||||
|
|
| For the Year |
| For the Year |
| For the Year |
| For the Period |
| For the Year |
| For the Year |
| For the Year |
| For the Period |
|
|
|
| Ended |
| Ended |
| Ended |
| Ended |
| Ended |
| Ended |
| Ended |
| Ended |
|
|
|
| June 30, 2014 |
| June 30, 2013 |
| June 30, 2012 |
| June 30, 2011(1) |
| June 30, 2014 |
| June 30, 2013 |
| June 30, 2012 |
| June 30, 2011(1) |
|
|
|
|
|
|
|
|
|
|
|
|
|
|
|
|
|
|
|
|
Net asset value, beginning of period |
| $ 11.58 |
| $ 10.70 |
| $ 9.99 |
| $ 10.00 |
| $ 11.71 |
| $ 10.77 |
| $ 9.98 |
| $ 10.00 |
| |
|
|
|
|
|
|
|
|
|
|
|
|
|
|
|
|
|
|
|
Investment operations: |
|
|
|
|
|
|
|
|
|
|
|
|
|
|
|
|
| |
Net investment loss |
| (0.14) |
| (0.06) |
| (0.16) |
| - | (c) | - |
| (0.06) |
| (0.12) |
| - | (c) | |
Net realized and unrealized gain (loss) on investments |
| 1.96 |
| 1.72 |
| 0.92 |
| (0.01) |
| 1.98 |
| 1.79 |
| 0.93 |
| (0.02) |
| |
Total from investment operations |
| 1.82 |
| 1.66 |
| 0.76 |
| (0.01) |
| 1.98 |
| 1.73 |
| 0.81 |
| (0.02) |
| |
|
|
|
|
|
|
|
|
|
|
|
|
|
|
|
|
|
|
|
Distributions from: |
|
|
|
|
|
|
|
|
|
|
|
|
|
|
|
|
| |
Net investment income |
| - |
| (0.07) |
| - |
| - |
| - |
| (0.09) |
| - |
| - |
| |
Net realized gain |
| (0.87) |
| (0.71) |
| (0.05) |
| - |
| (0.87) |
| (0.71) |
| (0.05) |
| - |
| |
Total distributions |
| (0.87) |
| (0.78) |
| (0.05) |
| - |
| (0.87) |
| (0.80) |
| (0.05) |
| - |
| |
|
|
|
|
|
|
|
|
|
|
|
|
|
|
|
|
|
|
|
Paid in Capital from Redemption Fees |
| - | (c) | - | (c) | - | (c) | - | (c) | - | (c) | 0.01 |
| 0.03 |
| - | (c) | |
|
|
|
|
|
|
|
|
|
|
|
|
|
|
|
|
|
|
|
Net asset value, end of period |
| $ 12.53 |
| $ 11.58 |
| $ 10.70 |
| $ 9.99 |
| $ 12.82 |
| $ 11.71 |
| $ 10.77 |
| $ 9.98 |
| |
|
|
|
|
|
|
|
|
|
|
|
|
|
|
|
|
|
|
|
Total return (a) |
| 16.22% |
| 16.35% |
| 7.64% |
| (0.10)% | (f) | 17.46% |
| 16.97% |
| 8.45% |
| (0.20)% | (f) | |
|
|
|
|
|
|
|
|
|
|
|
|
|
|
|
|
|
|
|
Ratios/Supplemental Data |
|
|
|
|
|
|
|
|
|
|
|
|
|
|
|
|
| |
Net assets, end of period (in 000's) |
| $ 13,826 |
| $ 10,754 |
| $ 5,818 |
| $ 1,469 |
| $ 14,160 |
| $ 8,406 |
| $ 2,681 |
| $ 3,001 |
| |
Ratio of expenses to average net assets:(b) |
|
|
|
|
|
|
|
|
|
|
|
|
|
|
|
|
| |
| Before fees waived and expenses absorbed (d) |
| 3.59% |
| 3.38% |
| 4.06% |
| 5.96% | (e) | 3.09% |
| 2.83% |
| 3.36% |
| 5.46% | (e) |
| After fees waived and expenses absorbed (d) |
| 3.33% |
| 2.92% |
| 3.43% |
| 2.59% | (e) | 2.01% |
| 2.41% |
| 2.76% |
| 2.09% | (e) |
Ratio of net investment loss to average net assets:(b) |
|
|
|
|
|
|
|
|
|
|
|
|
|
|
|
|
| |
| Before fees waived and expenses absorbed (d) |
| (1.41)% |
| (1.02)% |
| (2.20)% |
| (3.95)% | (e) | (0.87)% |
| (0.93)% |
| (1.74)% |
| (3.57)% | (e) |
| After fees waived and expenses absorbed (d) |
| (1.15)% |
| (0.57)% |
| (1.57)% |
| (0.58)% | (e) | 0.00% |
| (0.50)% |
| (1.14)% |
| (0.20)% | (e) |
Portfolio turnover rate |
| 586.64% |
| 330.29% |
| 492.70% |
| 41.02% | (f) | 586.64% |
| 330.29% |
| 492.70% |
| 41.02% | (f) | |
|
|
|
|
|
|
|
|
|
|
|
|
|
|
|
|
|
|
|
|
|
| Class U |
|
|
|
|
|
|
|
|
| ||||||
|
|
| For the Year |
| For the Year |
| For the Year |
| For the Period |
|
|
|
|
|
|
|
|
|
|
|
| Ended |
| Ended |
| Ended |
| Ended |
|
|
|
|
|
|
|
|
|
|
|
| June 30, 2014 |
| June 30, 2013 |
| June 30, 2012 |
| June 30, 2011(1) |
|
|
|
|
|
|
|
|
|
|
|
|
|
|
|
|
|
|
|
|
|
|
|
|
|
|
|
|
Net asset value, beginning of period |
| $ 11.44 |
| $ 10.62 |
| $ 9.97 |
| $ 10.00 |
|
|
|
|
|
|
|
|
| |
|
|
|
|
|
|
|
|
|
|
|
|
|
|
|
|
|
|
|
Investment operations: |
|
|
|
|
|
|
|
|
|
|
|
|
|
|
|
|
| |
Net investment loss |
| (0.19) |
| (0.09) |
| (0.21) |
| (0.01) |
|
|
|
|
|
|
|
|
| |
Net realized and unrealized gain (loss) on investments |
| 1.93 |
| 1.68 |
| 0.90 |
| (0.02) |
|
|
|
|
|
|
|
|
| |
Total from investment operations |
| 1.74 |
| 1.59 |
| 0.69 |
| (0.03) |
|
|
|
|
|
|
|
|
| |
|
|
|
|
|
|
|
|
|
|
|
|
|
|
|
|
|
|
|
Distributions from: |
|
|
|
|
|
|
|
|
|
|
|
|
|
|
|
|
| |
Net investment income |
| - |
| (0.06) |
| - |
| - |
|
|
|
|
|
|
|
|
| |
Net realized gain |
| (0.87) |
| (0.71) |
| (0.05) |
| - |
|
|
|
|
|
|
|
|
| |
Total distributions |
| (0.87) |
| (0.77) |
| (0.05) |
| - |
|
|
|
|
|
|
|
|
| |
|
|
|
|
|
|
|
|
|
|
|
|
|
|
|
|
|
|
|
Paid in Capital from Redemption Fees |
| - | (c) | - | (c) | 0.01 |
| - | (c) |
|
|
|
|
|
|
|
| |
|
|
|
|
|
|
|
|
|
|
|
|
|
|
|
|
|
|
|
Net asset value, end of period |
| $ 12.31 |
| $ 11.44 |
| $ 10.62 |
| $ 9.97 |
|
|
|
|
|
|
|
|
| |
|
|
|
|
|
|
|
|
|
|
|
|
|
|
|
|
|
|
|
Total return (a) |
| 15.70% |
| 15.74% |
| 7.05% |
| (0.30)% | (f) |
|
|
|
|
|
|
|
| |
|
|
|
|
|
|
|
|
|
|
|
|
|
|
|
|
|
|
|
Ratios/Supplemental Data |
|
|
|
|
|
|
|
|
|
|
|
|
|
|
|
|
| |
Net assets, end of period (in 000's) |
| $ 9,052 |
| $ 6,146 |
| $ 5,661 |
| $ 3,575 |
|
|
|
|
|
|
|
|
| |
Ratio of expenses to average net assets:(b) |
|
|
|
|
|
|
|
|
|
|
|
|
|
|
|
|
| |
| Before fees waived and expenses absorbed (d) |
| 4.09% |
| 3.90% |
| 4.47% |
| 6.46% | (e) |
|
|
|
|
|
|
|
|
| After fees waived and expenses absorbed (d) |
| 3.83% |
| 3.43% |
| 3.85% |
| 3.09% | (e) |
|
|
|
|
|
|
|
|
Ratio of net investment loss to average net assets:(b) |
|
|
|
|
|
|
|
|
|
|
|
|
|
|
|
|
| |
| Before fees waived and expenses absorbed (d) |
| (1.89)% |
| (1.32)% |
| (2.73)% |
| (4.23)% | (e) |
|
|
|
|
|
|
|
|
| After fees waived and expenses absorbed (d) |
| (1.63)% |
| (0.86)% |
| (2.11)% |
| (0.86)% | (e) |
|
|
|
|
|
|
|
|
Portfolio turnover rate |
| 586.64% |
| 330.29% |
| 492.70% |
| 41.02% | (f) |
|
|
|
|
|
|
|
| |
|
|
|
|
|
|
|
|
|
|
|
|
|
|
|
|
|
|
|
(a) | Aggregate total return, not annualized. Total return in the above table represents the rate that the investor would have earned or lost on an investment in the Fund |
|
|
|
|
| ||||||||||||
| assuming reinvestment of distributions and excludes all sales charges. |
|
|
|
|
|
|
|
|
|
|
|
|
|
|
| ||
(b) | These ratios exclude the impact of the expenses of the underlying exchange-traded funds. |
|
|
|
|
|
|
|
|
|
|
|
|
| ||||
(c) | Less than $0.01 per share. |
|
|
|
|
|
|
|
|
|
|
|
|
|
|
|
|
|
(d) | The ratios include 0.61% for the year ended June 30, 2014, 0.40% for the year ended June 30, 2013, 0.82% for the year ended June 30, 2012 and 0.14% for the period ended June 30, 2011 |
| ||||||||||||||||
| attributed to interest expense. The ratios include 0.28% for the year ended June 30, 2014, 0.07% for the year ended June 30, 2013 and 0.08% for the year ended June 30, 2012 |
|
|
| ||||||||||||||
| attributed to dividends on securities sold short. From the period starting November 8, 2013, these ratios were included in the expense cap for Class I. (See note 3) |
|
|
|
|
| ||||||||||||
(e) | Annualized. |
|
|
|
|
|
|
|
|
|
|
|
|
|
|
|
|
|
(f) | Not annualized. |
|
|
|
|
|
|
|
|
|
|
|
|
|
|
|
|
|
(1) | The AmericaFirst Defensive Growth Fund commenced operations on May 23, 2011. |
|
|
|
|
|
|
|
|
|
|
|
|
| ||||
The accompanying notes are an integral part of these financial statements. |
AmericaFirst Income Trends Fund | ||||||||||||||||||
Financial Highlights | ||||||||||||||||||
For a Fund Share Outstanding Throughout Each Year or Period | ||||||||||||||||||
|
|
|
|
|
|
|
|
|
|
|
|
|
|
|
|
|
|
|
| ||||||||||||||||||
|
|
| Class A |
| Class I |
| ||||||||||||
|
|
| For the Year |
| For the Year |
| For the Year |
| For the Period |
| For the Year |
| For the Year |
| For the Year |
| For the Period |
|
|
|
| Ended |
| Ended |
| Ended |
| Ended |
| Ended |
| Ended |
| Ended |
| Ended |
|
|
|
| June 30, 2014 |
| June 30, 2013 |
| June 30, 2012 |
| June 30, 2011(1) |
| June 30, 2014 |
| June 30, 2013 |
| June 30, 2012 |
| June 30, 2011(1) |
|
|
|
|
|
|
|
|
|
|
|
|
|
|
|
|
|
|
|
|
Net asset value, beginning of period |
| $ 9.21 |
| $ 9.05 |
| $ 10.09 |
| $ 10.00 |
| $ 9.21 |
| $ 9.05 |
| $ 10.09 |
| $ 10.00 |
| |
|
|
|
|
|
|
|
|
|
|
|
|
|
|
|
|
|
|
|
Investment operations: |
|
|
|
|
|
|
|
|
|
|
|
|
|
|
|
|
| |
Net investment income |
| 0.36 |
| 0.60 |
| 0.52 |
| 0.54 |
| 0.43 |
| 0.65 |
| 0.52 |
| 0.59 |
| |
Net realized and unrealized gain (loss) on investments |
| 0.34 |
| 0.23 |
| (1.00) |
| 0.30 | (g) | 0.34 |
| 0.23 |
| (0.96) |
| 0.30 | (g) | |
Total from investment operations |
| 0.70 |
| 0.83 |
| (0.48) |
| 0.84 |
| 0.77 |
| 0.88 |
| (0.44) |
| 0.89 |
| |
|
|
|
|
|
|
|
|
|
|
|
|
|
|
|
|
|
|
|
Distributions from: |
|
|
|
|
|
|
|
|
|
|
|
|
|
|
|
|
| |
Net investment income |
| (0.25) |
| (0.56) |
| (0.55) |
| (0.55) |
| (0.26) |
| (0.60) |
| (0.59) |
| (0.60) |
| |
Net realized gain |
| - |
| - |
| (0.01) |
| (0.20) |
| - |
| - |
| (0.01) |
| (0.20) |
| |
Return of capital |
| (0.41) |
| (0.11) |
| - |
| - |
| (0.45) |
| (0.12) |
| - |
| - |
| |
Total distributions |
| (0.66) |
| (0.67) |
| (0.56) |
| (0.75) |
| (0.71) |
| (0.72) |
| (0.60) |
| (0.80) |
| |
|
|
|
|
|
|
|
|
|
|
|
|
|
|
|
|
|
|
|
Paid in Capital from Affiliate Payment |
| - |
| - |
| - | (c) | - |
| - |
| - |
| - | (c) | - |
| |
|
|
|
|
|
|
|
|
|
|
|
|
|
|
|
|
|
|
|
Paid in Capital from Redemption Fees |
| - | (c) | - | (c) | - | (c) | - | (c) | - | (c) | - | (c) | - | (c) | - | (c) | |
|
|
|
|
|
|
|
|
|
|
|
|
|
|
|
|
|
|
|
Net asset value, end of period |
| $ 9.25 |
| $ 9.21 |
| $ 9.05 |
| $ 10.09 |
| $ 9.27 |
| $ 9.21 |
| $ 9.05 |
| $ 10.09 |
| |
|
|
|
|
|
|
|
|
|
|
|
|
|
|
|
|
|
|
|
Total return (a) |
| 7.83% |
| 9.44% |
| (4.51)% |
| 8.36% | (f) | 8.58% |
| 9.96% |
| (4.01)% |
| 8.86% | (f) | |
|
|
|
|
|
|
|
|
|
|
|
|
|
|
|
|
|
|
|
Ratios/Supplemental Data |
|
|
|
|
|
|
|
|
|
|
|
|
|
|
|
|
| |
Net assets, end of period (in 000's) |
| $ 15,309 |
| $ 10,325 |
| $ 5,539 |
| $ 8,477 |
| $ 15,033 |
| $ 8,900 |
| $ 4,749 |
| $ 13,277 |
| |
Ratio of expenses to average net assets:(b) |
|
|
|
|
|
|
|
|
|
|
|
|
|
|
|
|
| |
| Before fees waived and expenses absorbed (d) |
| 2.44% |
| 2.52% |
| 2.43% |
| 2.31% | (e) | 1.95% |
| 2.02% |
| 1.93% |
| 1.81% | (e) |
| After fees waived and expenses absorbed (d) |
| 2.20% |
| 2.21% |
| 2.25% |
| 2.21% | (e) | 1.49% |
| 1.71% |
| 1.73% |
| 1.71% | (e) |
Ratio of net investment income to average net assets:(b) |
|
|
|
|
|
|
|
|
|
|
|
|
|
|
|
|
| |
| Before fees waived and expenses absorbed (d) |
| 3.71% |
| 6.23% |
| 5.64% |
| 5.14% | (e) | 4.27% |
| 6.76% |
| 5.53% |
| 5.94% | (e) |
| After fees waived and expenses absorbed (d) |
| 3.94% |
| 6.54% |
| 5.82% |
| 5.24% | (e) | 4.73% |
| 7.07% |
| 5.73% |
| 6.04% | (e) |
Portfolio turnover rate |
| 336.01% |
| 315.48% |
| 411.30% |
| 309.01% | (f) | 336.01% |
| 315.48% |
| 411.30% |
| 309.01% | (f) | |
|
|
|
|
|
|
|
|
|
|
|
|
|
|
|
|
|
|
|
|
|
| Class U |
|
|
|
|
|
|
|
|
| ||||||
|
|
| For the Year |
| For the Year |
| For the Year |
| For the Period |
|
|
|
|
|
|
|
|
|
|
|
| Ended |
| Ended |
| Ended |
| Ended |
|
|
|
|
|
|
|
|
|
|
|
| June 30, 2014 |
| June 30, 2013 |
| June 30, 2012 |
| June 30, 2011(1) |
|
|
|
|
|
|
|
|
|
|
|
|
|
|
|
|
|
|
|
|
|
|
|
|
|
|
|
|
Net asset value, beginning of period |
| $ 9.21 |
| $ 9.04 |
| $ 10.07 |
| $ 10.00 |
|
|
|
|
|
|
|
|
| |
|
|
|
|
|
|
|
|
|
|
|
|
|
|
|
|
|
|
|
Investment operations: |
|
|
|
|
|
|
|
|
|
|
|
|
|
|
|
|
| |
Net investment income |
| 0.31 |
| 0.55 |
| 0.46 |
| 0.50 |
|
|
|
|
|
|
|
|
| |
Net realized and unrealized gain (loss) on investments |
| 0.34 |
| 0.24 |
| (0.99) |
| 0.28 | (g) |
|
|
|
|
|
|
|
| |
Total from investment operations |
| 0.65 |
| 0.79 |
| (0.53) |
| 0.78 |
|
|
|
|
|
|
|
|
| |
|
|
|
|
|
|
|
|
|
|
|
|
|
|
|
|
|
|
|
Distributions from: |
|
|
|
|
|
|
|
|
|
|
|
|
|
|
|
|
| |
Net investment income |
| (0.23) |
| (0.52) |
| (0.49) |
| (0.51) |
|
|
|
|
|
|
|
|
| |
Net realized gain |
| - |
| - |
| (0.01) |
| (0.20) |
|
|
|
|
|
|
|
|
| |
Return of capital |
| (0.38) |
| (0.10) |
| - |
| - |
|
|
|
|
|
|
|
|
| |
Total distributions |
| (0.61) |
| (0.62) |
| (0.50) |
| (0.71) |
|
|
|
|
|
|
|
|
| |
|
|
|
|
|
|
|
|
|
|
|
|
|
|
|
|
|
|
|
Paid in Capital from Affiliate Payment |
| - |
| - |
| - | (c) | - |
|
|
|
|
|
|
|
|
| |
|
|
|
|
|
|
|
|
|
|
|
|
|
|
|
|
|
|
|
Paid in Capital from Redemption Fees |
| - | (c) | - | (c) | - | (c) | - | (c) |
|
|
|
|
|
|
|
| |
|
|
|
|
|
|
|
|
|
|
|
|
|
|
|
|
|
|
|
Net asset value, end of period |
| $ 9.25 |
| $ 9.21 |
| $ 9.04 |
| $ 10.07 |
|
|
|
|
|
|
|
|
| |
|
|
|
|
|
|
|
|
|
|
|
|
|
|
|
|
|
|
|
Total return (a) |
| 7.30% |
| 8.98% |
| (4.99)% |
| 7.71% | (f) |
|
|
|
|
|
|
|
| |
|
|
|
|
|
|
|
|
|
|
|
|
|
|
|
|
|
|
|
Ratios/Supplemental Data |
|
|
|
|
|
|
|
|
|
|
|
|
|
|
|
|
| |
Net assets, end of period (in 000's) |
| $ 14,354 |
| $ 10,825 |
| $ 10,349 |
| $ 23,799 |
|
|
|
|
|
|
|
|
| |
Ratio of expenses to average net assets:(b) |
|
|
|
|
|
|
|
|
|
|
|
|
|
|
|
|
| |
| Before fees waived and expenses absorbed (d) |
| 2.94% |
| 3.02% |
| 2.93% |
| 2.81% | (e) |
|
|
|
|
|
|
|
|
| After fees waived and expenses absorbed (d) |
| 2.70% |
| 2.71% |
| 2.75% |
| 2.71% | (e) |
|
|
|
|
|
|
|
|
Ratio of net investment income to average net assets:(b) |
|
|
|
|
|
|
|
|
|
|
|
|
|
|
|
|
| |
| Before fees waived and expenses absorbed (d) |
| 3.21% |
| 5.71% |
| 4.88% |
| 5.25% | (e) |
|
|
|
|
|
|
|
|
| After fees waived and expenses absorbed (d) |
| 3.44% |
| 6.01% |
| 5.06% |
| 5.35% | (e) |
|
|
|
|
|
|
|
|
Portfolio turnover rate |
| 336.01% |
| 315.48% |
| 411.30% |
| 309.01% | (f) |
|
|
|
|
|
|
|
| |
|
|
|
|
|
|
|
|
|
|
|
|
|
|
|
|
|
|
|
(a) | Aggregate total return, not annualized. Total return in the above table represents the rate that the investor would have earned or lost on an investment in the Fund |
| ||||||||||||||||
| assuming reinvestment of distributions and excludes all sales charges. |
| ||||||||||||||||
(b) | These ratios exclude the impact of the expenses of the underlying exchange-traded funds. |
| ||||||||||||||||
(c) | Less than $0.01 per share. |
|
|
|
|
|
|
|
|
|
|
|
|
|
|
|
|
|
(d) | The ratios include 0.01% for the year ended June 30, 2014, 0.01% for the year ended June 30, 2013, 0.04% for the year ended June 30, 2012 and 0.01% for the period ended June 30, 2011 attributed to interest expense. From the period starting November 8, 2013, these ratios were included in the expense cap for Class I. (See note 3) | |||||||||||||||||
(e) | Annualized. |
|
|
|
|
|
|
|
|
|
|
|
|
|
|
|
|
|
(f) | Not annualized. |
|
|
|
|
|
|
|
|
|
|
|
|
|
|
|
|
|
(g) | As required by SEC standard per share data calculation methodology, this represents a balancing figure derived from the other amounts in the financial highlights tables that captures all other changes affecting net asset value per share. This per share gain amount does not correlate to the aggregate of the net realized and unrealized loss in the Statement of Operations for the year ending June 30, 2011, primarily due to the timing of sales and repurchases of the Fund's shares in relation to fluctuating market values for the Fund's portfolio. | |||||||||||||||||
(1) | The AmericaFirst Income Trends Fund commenced operations on July 1, 2010. |
| ||||||||||||||||
The accompanying notes are an integral part of these financial statements. |
AmericaFirst Absolute Return Fund | ||||||||||||||||||||
Financial Highlights | ||||||||||||||||||||
For a Fund Share Outstanding Throughout Each Year or Period | ||||||||||||||||||||
|
|
|
|
|
|
|
|
|
|
|
|
|
|
|
|
|
|
|
|
|
| ||||||||||||||||||||
|
|
| Class A |
| Class I |
| ||||||||||||||
|
|
| For the Year |
| For the Year |
| For the Year |
| For the Year |
| For the Period |
| For the Year |
| For the Year |
| For the Year |
| For the Period |
|
|
|
| Ended |
| Ended |
| Ended |
| Ended |
| Ended |
| Ended |
| Ended |
| Ended |
| Ended |
|
|
|
| June 30, 2014 |
| June 30, 2013 |
| June 30, 2012 |
| June 30, 2011 |
| June 30, 2010(1) |
| June 30, 2014 |
| June 30, 2013 |
| June 30, 2012 |
| June 30, 2011(2) |
|
|
|
|
|
|
|
|
|
|
|
|
|
|
|
|
|
|
|
|
|
|
Net asset value, beginning of period |
| $ 9.29 |
| $ 9.31 |
| $ 10.80 |
| $ 8.73 |
| $ 10.00 |
| $ 9.39 |
| $ 9.40 |
| $ 10.85 |
| $ 9.07 |
| |
|
|
|
|
|
|
|
|
|
|
|
|
|
|
|
|
|
|
|
|
|
Investment operations: |
|
|
|
|
|
|
|
|
|
|
|
|
|
|
|
|
|
|
| |
Net investment income (loss) |
| (0.04) |
| 0.03 |
| (0.11) |
| (0.09) |
| (0.01) |
| 0.05 | (h) | 0.06 |
| (0.07) |
| (0.01) |
| |
Net realized and unrealized gain (loss) on investments |
| 2.76 |
| (0.01) |
| (0.76) |
| 2.16 |
| (1.26) |
| 2.78 |
| 0.01 | (g) | (0.76) |
| 1.79 |
| |
Total from investment operations |
| 2.72 |
| 0.02 |
| (0.87) |
| 2.07 |
| (1.27) |
| 2.83 |
| 0.07 |
| (0.83) |
| 1.78 |
| |
|
|
|
|
|
|
|
|
|
|
|
|
|
|
|
|
|
|
|
|
|
Distributions from: |
|
|
|
|
|
|
|
|
|
|
|
|
|
|
|
|
|
|
| |
Net realized gain |
| - |
| - |
| (0.62) |
| - |
| - |
| - |
| - |
| (0.62) |
| - |
| |
Return of capital |
| - |
| (0.04) |
| - |
| - |
| - |
| - |
| (0.08) |
| - |
| - |
| |
Total distributions |
| - |
| (0.04) |
| (0.62) |
| - |
| - |
| - |
| (0.08) |
| (0.62) |
| - |
| |
|
|
|
|
|
|
|
|
|
|
|
|
|
|
|
|
|
|
|
|
|
Paid in Capital from Redemption Fees |
| - | (c) | - | (c) | - | (c) | - | (c) | - |
| - | (c) | - | (c) | - | (c) | - | (c) | |
|
|
|
|
|
|
|
|
|
|
|
|
|
|
|
|
|
|
|
|
|
Net asset value, end of period |
| $ 12.01 |
| $ 9.29 |
| $ 9.31 |
| $ 10.80 |
| $ 8.73 |
| $ 12.22 |
| $ 9.39 |
| $ 9.40 |
| $ 10.85 |
| |
|
|
|
|
|
|
|
|
|
|
|
|
|
|
|
|
|
|
|
|
|
Total return (a) |
| 29.28% |
| 0.21% |
| (8.10)% |
| 23.71% |
| (12.70)% | (f) | 30.14% |
| 0.72% |
| (7.68)% |
| 19.63% | (f) | |
|
|
|
|
|
|
|
|
|
|
|
|
|
|
|
|
|
|
|
|
|
Ratios/Supplemental Data |
|
|
|
|
|
|
|
|
|
|
|
|
|
|
|
|
|
|
| |
Net assets, end of period (in 000's) |
| $ 8,672 |
| $ 8,823 |
| $ 22,113 |
| $ 42,773 |
| $ 34,043 |
| $ 1,121 |
| $ 688 |
| $ 4,890 |
| $ 13,774 |
| |
Ratio of expenses to average net assets:(b) |
|
|
|
|
|
|
|
|
|
|
|
|
|
|
|
|
|
|
| |
| Before fees waived and expenses absorbed (d) |
| 3.04% |
| 3.00% |
| 3.41% |
| 2.40% |
| 2.78% | (e) | 2.55% |
| 2.53% |
| 2.86% |
| 1.90% | (e) |
| After fees waived and expenses absorbed (d) |
| 2.45% |
| 2.74% |
| 3.41% |
| 2.46% |
| 2.45% | (e) | 1.81% |
| 2.24% |
| 2.86% |
| 1.96% | (e) |
Ratio of net investment income (loss) to average net assets:(b) |
|
|
|
|
|
|
|
|
|
|
|
|
|
|
|
|
|
| ||
| Before fees waived and expenses absorbed (d) |
| (0.96)% |
| 0.01% |
| (1.15)% |
| (0.71)% |
| (0.97)% | (e) | (0.27)% |
| 0.45% |
| (0.72)% |
| (0.02)% | (e) |
| After fees waived and expenses absorbed (d) |
| (0.37)% |
| 0.28% |
| (1.15)% |
| (0.77)% |
| (0.64)% | (e) | 0.47% |
| 0.65% |
| (0.72)% |
| (0.08)% | (e) |
Portfolio turnover rate |
| 374.70% |
| 601.59% |
| 680.35% |
| 575.17% |
| 347.59% | (f) | 374.70% |
| 601.59% |
| 680.35% |
| 575.17% | (f) | |
|
|
|
|
|
|
|
|
|
|
|
|
|
|
|
|
|
|
|
|
|
|
|
|
|
|
|
|
|
|
|
|
|
|
|
|
|
|
|
|
|
|
|
|
| Class U |
|
|
|
|
|
|
|
|
| ||||||||
|
|
| For the Year |
| For the Year |
| For the Year |
| For the Year |
| For the Period |
|
|
|
|
|
|
|
|
|
|
|
| Ended |
| Ended |
| Ended |
| Ended |
| Ended |
|
|
|
|
|
|
|
|
|
|
|
| June 30, 2014 |
| June 30, 2013 |
| June 30, 2012 |
| June 30, 2011 |
| June 30, 2010(1) |
|
|
|
|
|
|
|
|
|
|
|
|
|
|
|
|
|
|
|
|
|
|
|
|
|
|
|
|
|
|
Net asset value, beginning of period |
| $ 9.15 |
| $ 9.19 |
| $ 10.72 |
| $ 8.72 |
| $ 10.00 |
|
|
|
|
|
|
|
|
| |
|
|
|
|
|
|
|
|
|
|
|
|
|
|
|
|
|
|
|
|
|
Investment operations: |
|
|
|
|
|
|
|
|
|
|
|
|
|
|
|
|
|
|
| |
Net investment loss |
| (0.09) |
| (0.02) |
| (0.16) |
| (0.13) |
| (0.03) |
|
|
|
|
|
|
|
|
| |
Net realized and unrealized gain (loss) on investments |
| 2.72 |
| (0.02) |
| (0.75) |
| 2.13 |
| (1.25) |
|
|
|
|
|
|
|
|
| |
Total from investment operations |
| 2.63 |
| (0.04) |
| (0.91) |
| 2.00 |
| (1.28) |
|
|
|
|
|
|
|
|
| |
|
|
|
|
|
|
|
|
|
|
|
|
|
|
|
|
|
|
|
|
|
Distributions from: |
|
|
|
|
|
|
|
|
|
|
|
|
|
|
|
|
|
|
| |
Net realized gain |
| - |
| - |
| - |
| - |
| - |
|
|
|
|
|
|
|
|
| |
Return of capital |
| - |
| - |
| (0.62) |
| - |
| - |
|
|
|
|
|
|
|
|
| |
Total distributions |
| - |
| - |
| (0.62) |
| - |
| - |
|
|
|
|
|
|
|
|
| |
|
|
|
|
|
|
|
|
|
|
|
|
|
|
|
|
|
|
|
|
|
Paid in Capital from Redemption Fees |
| - | (c) | - | (c) | - | (c) | - | (c) | - |
|
|
|
|
|
|
|
|
| |
|
|
|
|
|
|
|
|
|
|
|
|
|
|
|
|
|
|
|
|
|
Net asset value, end of period |
| $ 11.78 |
| $ 9.15 |
| $ 9.19 |
| $ 10.72 |
| $ 8.72 |
|
|
|
|
|
|
|
|
| |
|
|
|
|
|
|
|
|
|
|
|
|
|
|
|
|
|
|
|
|
|
Total return (a) |
| 28.74% |
| (0.38)% |
| (8.54)% |
| 22.94% |
| (12.80)% | (f) |
|
|
|
|
|
|
|
| |
|
|
|
|
|
|
|
|
|
|
|
|
|
|
|
|
|
|
|
|
|
Ratios/Supplemental Data |
|
|
|
|
|
|
|
|
|
|
|
|
|
|
|
|
|
|
| |
Net assets, end of period (in 000's) |
| $ 7,966 |
| $ 8,759 |
| $ 21,385 |
| $ 47,319 |
| $ 30,751 |
|
|
|
|
|
|
|
|
| |
Ratio of expenses to average net assets:(b) |
|
|
|
|
|
|
|
|
|
|
|
|
|
|
|
|
|
|
| |
| Before fees waived and expenses absorbed (d) |
| 3.54% |
| 3.52% |
| 3.90% |
| 2.90% |
| 3.28% | (e) |
|
|
|
|
|
|
|
|
| After fees waived and expenses absorbed (d) |
| 2.95% |
| 3.25% |
| 3.90% |
| 2.96% |
| 2.95% | (e) |
|
|
|
|
|
|
|
|
Ratio of net investment loss to average net assets:(b) |
|
|
|
|
|
|
|
|
|
|
|
|
|
|
|
|
|
|
| |
| Before fees waived and expenses absorbed (d) |
| (1.47)% |
| (0.48)% |
| (1.68)% |
| (1.21)% |
| (1.47)% | (e) |
|
|
|
|
|
|
|
|
| After fees waived and expenses absorbed (d) |
| (0.88)% |
| (0.21)% |
| (1.68)% |
| (1.27)% |
| (1.14)% | (e) |
|
|
|
|
|
|
|
|
Portfolio turnover rate |
| 374.70% |
| 601.59% |
| 680.35% |
| 575.17% |
| 347.59% | (f) |
|
|
|
|
|
|
|
| |
|
|
|
|
|
|
|
|
|
|
|
|
|
|
|
|
|
|
|
|
|
(a) | Aggregate total return, not annualized. Total return in the above table represents the rate that the investor would have earned or lost on an investment in the Fund assuming reinvestment of distributions and excludes all sales charges. | |||||||||||||||||||
| ||||||||||||||||||||
(b) | These ratios exclude the impact of the expenses of the underlying exchange-traded funds. |
| ||||||||||||||||||
(c) | Less than $0.01 per share. |
|
|
|
|
|
|
|
|
|
|
|
|
|
|
|
|
|
|
|
(d) | The ratios include 0.01% for the year ended June 30, 2014, 0.26% for the year ended June 30, 2013, 0.77% for the year ended June 30, 2012 and 0.01% for the period ended June 30, 2011 attributed to interest expense. The ratios include 0.04% for the year ended June 30, 2013 and 0.17% for the year ended June 30, 2012 attributed to dividends on securities sold short. From the period starting November 8, 2013, these ratios were included in the expense cap for Class I. (See note 3) |
| ||||||||||||||||||
(e) | Annualized. |
|
|
|
|
|
|
|
|
|
|
|
|
|
|
|
|
|
|
|
(f) | Not annualized. |
|
|
|
|
|
|
|
|
|
|
|
|
|
|
|
|
|
|
|
(g) | As required by SEC standard per share data calculation methodology, this represents a balancing figure derived from the other amounts in the financial highlights tables that captures all other changes affecting net asset value per share. This per share gain amount does not correlate to the aggregate of the net realized and unrealized loss in the Statement of Operations for the year ending June 30, 2013, primarily due to the timing of sales and repurchases of the Fund's shares in relation to fluctuating market values for the Fund's portfolio. |
| ||||||||||||||||||
(h) | The amount of net investment income (loss) per share does not accord with the amounts reported in the Statements of Operations due to the timing of purchases and redemptions of Fund shares during the year. | |||||||||||||||||||
(1) | The AmericaFirst Absolute Return Fund Class A and Class U commenced operations on February 26, 2010. | |||||||||||||||||||
(2) | The AmericaFirst Absolute Return Fund Class I commenced operations on July 12, 2010. |
| ||||||||||||||||||
The accompanying notes are an integral part of these financial statements. |
AmericaFirst Quantitative Strategies Fund | |||||||||||||||
Financial Highlights | |||||||||||||||
For a Fund Share Outstanding Throughout Each Year or Period | |||||||||||||||
|
|
|
|
|
|
|
|
|
|
|
|
| |||
| |||||||||||||||
|
|
| Class A | ||||||||||||
|
|
| For the Year |
| For the Year |
| For the Year |
| For the Year | For the Year | |||||
|
|
| Ended |
| Ended |
| Ended |
| Ended | Ended | |||||
|
|
| June 30, 2014 |
| June 30, 2013 |
| June 30, 2012 |
| June 30, 2011 | June 30, 2010 | |||||
|
|
|
|
|
|
|
|
|
|
|
|
| |||
Net asset value, beginning of period |
| $ 6.29 |
| $ 5.77 |
| $ 6.67 |
| $ 5.58 |
| $ 4.81 |
| ||||
|
|
|
|
|
|
|
|
|
|
|
|
| |||
Investment operations: |
|
|
|
|
|
|
|
|
|
|
| ||||
Net investment income |
| 0.14 |
| 0.19 |
| 0.17 |
| 0.19 |
| 0.15 |
| ||||
Net realized and unrealized gain (loss) on investments |
| 1.10 |
| 0.52 |
| (0.13) |
| 1.33 |
| 0.76 |
| ||||
Total from investment operations |
| 1.24 |
| 0.71 |
| 0.04 |
| 1.52 |
| 0.91 |
| ||||
|
|
|
|
|
|
|
|
|
|
|
|
| |||
Distributions from: |
|
|
|
|
|
|
|
|
|
|
| ||||
Net investment income |
| (0.11) |
| (0.19) |
| (0.18) |
| (0.19) |
| (0.14) |
| ||||
Net realized gain |
| (0.45) |
| - |
| (0.77) |
| (0.24) |
| - |
| ||||
Total distributions |
| (0.56) |
| (0.19) |
| (0.95) |
| (0.43) |
| (0.14) |
| ||||
|
|
|
|
|
|
|
|
|
|
|
|
| |||
Paid in Capital from Affiliate Payment |
| - |
| - |
| 0.01 |
| - |
| - |
| ||||
|
|
|
|
|
|
|
|
|
|
|
|
| |||
Paid in Capital from Redemption Fees |
| - | (c) | - | (c) | - | (c) | - |
| - |
| ||||
|
|
|
|
|
|
|
|
|
|
|
|
| |||
Net asset value, end of period |
| $ 6.97 |
| $ 6.29 |
| $ 5.77 |
| $ 6.67 |
| $ 5.58 |
| ||||
|
|
|
|
|
|
|
|
|
|
|
|
| |||
Total return (a) |
| 20.34% |
| 12.43% |
| 2.16% | (f) | 27.66% |
| 18.96% |
| ||||
|
|
|
|
|
|
|
|
|
|
|
|
| |||
Ratios/Supplemental Data |
|
|
|
|
|
|
|
|
|
|
| ||||
Net assets, end of period (in 000's) |
| $ 40,419 |
| $ 23,521 |
| $ 17,566 |
| $ 23,856 |
| $ 16,669 |
| ||||
Ratio of expenses to average net assets:(b) |
|
|
|
|
|
|
|
|
|
|
| ||||
| Before fees waived and expenses absorbed (d) |
| 1.76% |
| 1.73% |
| 1.74% |
| 1.78% |
| 2.46% | (e) | |||
| After fees waived and expenses absorbed (d) |
| 1.50% |
| 1.50% |
| 1.52% |
| 1.51% |
| 1.59% | (e) | |||
Ratio of net investment income to average net assets:(b) |
|
|
|
|
|
|
|
|
|
|
| ||||
| Before fees waived and expenses absorbed (d) |
| 1.88% |
| 2.86% |
| 2.69% |
| 2.65% |
| 2.55% | (e) | |||
| After fees waived and expenses absorbed (d) |
| 2.14% |
| 3.09% |
| 2.91% |
| 2.92% |
| 3.42% | (e) | |||
Portfolio turnover rate |
| 306.73% |
| 228.87% |
| 346.05% |
| 284.37% |
| 76.67% |
| ||||
|
|
|
|
|
|
|
|
|
|
|
|
| |||
|
|
|
|
|
|
|
|
|
|
|
|
| |||
|
|
| Class C | ||||||||||||
|
|
| For the Year |
| For the Year |
| For the Year |
| For the Year | For the Year | |||||
|
|
| Ended |
| Ended |
| Ended |
| Ended | Ended | |||||
|
|
| June 30, 2014 |
| June 30, 2013 |
| June 30, 2012 |
| June 30, 2011 | June 30, 2010 | |||||
|
|
|
|
|
|
|
|
|
|
|
|
| |||
Net asset value, beginning of period |
| $ 6.26 |
| $ 5.74 |
| $ 6.64 |
| $ 5.56 |
| $ 4.81 |
| ||||
|
|
|
|
|
|
|
|
|
|
|
|
| |||
Investment operations: |
|
|
|
|
|
|
|
|
|
|
| ||||
Net investment income |
| 0.09 |
| 0.15 |
| 0.14 |
| 0.14 |
| 0.11 |
| ||||
Net realized and unrealized gain (loss) on investments |
| 1.11 |
| 0.52 |
| (0.14) |
| 1.33 |
| 0.76 |
| ||||
Total from investment operations |
| 1.20 |
| 0.67 |
| 0.00 |
| 1.47 |
| 0.87 |
| ||||
|
|
|
|
|
|
|
|
|
|
|
|
| |||
Distributions from: |
|
|
|
|
|
|
|
|
|
|
| ||||
Net investment income |
| (0.08) |
| (0.15) |
| (0.13) |
| (0.15) |
| (0.12) |
| ||||
Net realized gain |
| (0.45) |
| - |
| (0.77) |
| (0.24) |
| - |
| ||||
Total distributions |
| (0.53) |
| (0.15) |
| (0.90) |
| (0.39) |
| (0.12) |
| ||||
|
|
|
|
|
|
|
|
|
|
|
|
| |||
Paid in Capital from Affiliate Payment |
| - |
| - |
| - |
| - |
| - |
| ||||
|
|
|
|
|
|
|
|
|
|
|
|
| |||
Paid in Capital from Redemption Fees |
| - | (c) | - | (c) | - | (c) | - |
| - |
| ||||
|
|
|
|
|
|
|
|
|
|
|
|
| |||
Net asset value, end of period |
| $ 6.93 |
| $ 6.26 |
| $ 5.74 |
| $ 6.64 |
| $ 5.56 |
| ||||
|
|
|
|
|
|
|
|
|
|
|
|
| |||
Total return (a) |
| 19.62% |
| 11.68% |
| 1.32% |
| 26.73% |
| 17.95% |
| ||||
|
|
|
|
|
|
|
|
|
|
|
|
| |||
Ratios/Supplemental Data |
|
|
|
|
|
|
|
|
|
|
| ||||
Net assets, end of period (in 000's) |
| $ 37,773 |
| $ 25,848 |
| $ 25,030 |
| $ 39,703 |
| $ 16,428 |
| ||||
Ratio of expenses to average net assets:(b) |
|
|
|
|
|
|
|
|
|
|
| ||||
| Before fees waived and expenses absorbed (d) |
| 2.50% |
| 2.48% |
| 2.49% |
| 2.53% |
| 3.22% | (e) | |||
| After fees waived and expenses absorbed (d) |
| 2.25% |
| 2.25% |
| 2.27% |
| 2.26% |
| 2.34% | (e) | |||
Ratio of net investment income to average net assets:(b) |
|
|
|
|
|
|
|
|
|
|
| ||||
| Before fees waived and expenses absorbed (d) |
| 1.09% |
| 2.16% |
| 2.08% |
| 2.09% |
| 1.96% | (e) | |||
| After fees waived and expenses absorbed (d) |
| 1.34% |
| 2.39% |
| 2.30% |
| 2.36% |
| 2.84% | (e) | |||
Portfolio turnover rate |
| 306.73% |
| 228.87% |
| 346.05% |
| 284.37% |
| 76.67% |
| ||||
|
|
|
|
|
|
|
|
|
|
|
|
| |||
|
|
|
|
|
|
|
|
|
|
|
|
| |||
(a) | Aggregate total return, not annualized. Total return in the above table represents the rate that the investor would have earned or lost on an investment in the Fund |
| |||||||||||||
| assuming reinvestment of distributions and excludes all sales charges. |
|
|
|
|
|
|
|
|
| |||||
(b) | These ratios exclude the impact of the expenses of the underlying exchange-traded funds. |
|
|
|
|
|
|
| |||||||
(c) | Less than $0.01 per share. |
|
|
|
|
|
|
|
|
|
|
| |||
(d) | The ratios include 0.02% for the year ended June 30, 2012 and 0.01% for the year ended June 30, 2011 attributed to interest expense. |
|
|
| |||||||||||
(e) | The ratios include the impact of the consolidation of America First Growth Portfolio, Series 2 of 0.09% | ||||||||||||||
| These ratios exclude the impact of expenses of the underlying unit investment trusts other than America First Growth Portfolio. | ||||||||||||||
(f) | For the year ended June 30, 2012, 0.27% of the Fund's Class A shares' total return consists of a voluntary reimbursement by the Advisor of a realized investment loss incurred on a trading error. | ||||||||||||||
| Excluding this item, total return would have been 1.89%. |
|
|
|
|
|
|
|
|
|
|
|
|
|
|
The accompanying notes are an integral part of these financial statements. |
AmericaFirst Seasonal Trends Fund |
| |||||||
Financial Highlights |
| |||||||
For a Fund Share Outstanding Throughout the Period |
| |||||||
|
|
|
|
|
|
|
|
|
|
|
| ||||||
|
|
| Class A |
| Class I |
| Class U |
|
|
|
| For the Period |
| For the Period |
| For the Period |
|
|
|
| Ended |
| Ended |
| Ended |
|
|
|
| June 30, 2014 (1) |
| June 30, 2014 (1) |
| June 30, 2014 (1) |
|
|
|
|
|
|
|
|
|
|
Net asset value, beginning of period |
| $ 10.00 |
| $ 10.00 |
| $ 10.00 |
| |
|
|
|
|
|
|
|
|
|
Investment operations: |
|
|
|
|
|
|
| |
Net investment income (loss) |
| (0.02) |
| 0.02 | (f) | (0.06) |
| |
Net realized and unrealized gain (loss) on investments |
| 0.39 |
| 0.39 |
| 0.40 |
| |
Total from investment operations |
| 0.37 |
| 0.41 |
| 0.34 |
| |
|
|
|
|
|
|
|
|
|
Distributions from: |
|
|
|
|
|
|
| |
Net investment income |
| - |
| - |
| - |
| |
Net realized gain |
| - |
| - |
| - |
| |
Total distributions |
| - |
| - |
| - |
| |
|
|
|
|
|
|
|
|
|
Paid in Capital from Redemption Fees |
| - | (c) | - | (c) | - | (c) | |
|
|
|
|
|
|
|
|
|
Net asset value, end of period |
| $ 10.37 |
| $ 10.41 |
| $ 10.34 |
| |
|
|
|
|
|
|
|
|
|
Total return (a)(e) |
| 3.70% |
| 4.10% |
| 3.40% |
| |
|
|
|
|
|
|
|
|
|
Ratios/Supplemental Data |
|
|
|
|
|
|
| |
Net assets, end of period (in 000's) |
| $ 10,060 |
| $ 17,563 |
| $ 4,093 |
| |
Ratio of expenses to average net assets:(b) |
|
|
|
|
|
|
| |
| Before fees waived and expenses absorbed (d) |
| 2.74% |
| 2.04% |
| 3.15% |
|
| After fees waived and expenses absorbed (d) |
| 2.45% |
| 1.95% |
| 2.95% |
|
Ratio of net investment income (loss) to average net assets:(b) |
|
|
|
|
|
|
| |
| Before expense reimbursement (d) |
| (0.51)% |
| 0.17% |
| (1.01)% |
|
| After expense reimbursement (d) |
| (0.22)% |
| 0.26% |
| (0.81)% |
|
Portfolio turnover rate (e) |
| 317.87% |
| 317.87% |
| 317.87% |
| |
|
|
|
|
|
|
|
|
|
(a) | Aggregate total return, not annualized. Total return in the above table represents the rate that the investor would have earned or lost on an investment in the Fund | |||||||
| assuming reinvestment of dividends and excludes all sales charges. | |||||||
(b) | These ratios exclude the impact of the expenses of the underlying exchange-traded funds. | |||||||
(c) | Less than $0.01 per share. |
|
|
|
|
|
|
|
(d) | Annualized. |
|
|
|
|
|
|
|
(e) | Not annualized. |
|
|
|
|
|
|
|
(f) | The amount of net investment income (loss) per share does not accord with the amounts reported in the Statements of Operations due to the timing of purchases and redemptions of Fund shares during the year. | |||||||
(1) | The AmericaFirst Seasonal Trends Fund commenced operations on October 31, 2013. | |||||||
|
|
|
|
|
|
|
|
|
The accompanying notes are an integral part of these financial statements. |
AMERICAFIRST QUANTITATIVE FUNDS
NOTES TO FINANCIAL STATEMENTS
June 30, 2014
ANNUAL REPORT
(1) ORGANIZATION AND SIGNIFICANT ACCOUNTING POLICIES
AmericaFirst Quantitative Funds (the “Trust”) was reorganized as a Delaware statutory trust on January 4, 2013. Prior to January 4, 2013, the Trust was a part of the Mutual Fund Series Trust, an Ohio business trust organized on February 27, 2006. The Trust is registered as an open-end management investment company under the Investment Company Act of 1940, as amended (the “1940 Act”). The Trust currently consists of five series. These financial statements include the following five series: AmericaFirst Defensive Growth Fund, AmericaFirst Income Trends Fund, AmericaFirst Absolute Return Fund, AmericaFirst Quantitative Strategies Fund and AmericaFirst Seasonal Trends Fund (each a “Fund” and collectively, the “Funds”). The Funds, except for AmericaFirst Defensive Growth Fund, are registered as diversified series of the Trust. The investment objectives of each Fund are set forth below. AmericaFirst Capital Management, LLC (the “Manager”) is investment advisor to the Funds and the AmericaFirst Defensive Growth & Income Portfolio, Series 1 (the “UIT1”), AmericaFirst Defensive Growth & Income Portfolio, Series 2 (the “UIT2”) and AmericaFirst Defensive Growth & Income Portfolio, Series 3 (the “UIT3”) (collectively, the "UITs"). .
AmericaFirst Defensive Growth Fund (“Defensive Growth Fund”) commenced operations on May 23, 2011. The Fund’s investment objective is to achieve capital appreciation through all market cycles.
AmericaFirst Income Trends Fund (“Income Trends Fund”) commenced operations on July 1, 2010. The Fund’s investment objective is to achieve total return with a high rate of current income and total return with lower volatility than common stocks as measured by standard deviation.
AmericaFirst Absolute Return Fund (“Absolute Return Fund”) commenced operations on February 26, 2010. The Fund’s investment objective is to achieve capital appreciation with a focus on producing positive returns regardless of the direction of financial markets.
AmericaFirst Quantitative Strategies Fund (“Quantitative Strategies Fund”) commenced operations on
September 28, 2007. Prior to November 3, 2008, the Fund was named the AmericaFirst Income Strategies Fund. The Fund’s investment objective is to achieve long-term capital appreciation and to achieve positive returns through all market cycles.
AmericaFirst Seasonal Trends Fund (“Seasonal Trends Fund”) commenced operations on October 31, 2013. The Fund’s investment objective is to achieve capital appreciation with a focus on producing positive returns regardless of the direction of the financial markets.
The Defensive Growth Fund, Income Trends Fund, Absolute Return Fund and Seasonal Trends Fund offer three classes of shares, Class A, Class I and Class U. The Quantitative Strategies Fund offers two classes of shares, Class A and Class C. Each class differs as to sales and redemption charges and ongoing fees.
The following is a summary of significant accounting policies consistently followed by the Funds and are in accordance with accounting principles generally accepted in the United States of America (“GAAP”).
a)
Securities Valuation - Securities listed on an exchange are valued at the last reported sale price at the close of the regular trading session of the primary exchange on the business day the value is being determined, or in the case of securities listed on NASDAQ at the NASDAQ Official Closing Price. In the absence of a sale, such securities shall be valued at the mean between the current bid and ask prices on the day of valuation. Debt securities (other than short-term obligations) are valued each day by an independent pricing service approved by the Board of Trustees (the “Board”) based on methods which include consideration of: yields or prices of securities of comparable quality, coupon, maturity and type, indications as to values from dealers, and general market conditions or market quotations from a major market maker in the securities. Short-term debt obligations having 60 days or less remaining until maturity, at time of purchase, are valued at amortized cost, provided each such valuations represent fair value. The Funds may invest in portfolios of open-end or closed-end investment companies and exchange traded funds (the “underlying funds”). Open-end funds are valued at their respective net asset values as reported by such investment companies. The underlying funds value securities in their portfolios for which market quotations are readily available at their market values (generally the last reported sale price) and all other securities and assets at their fair value by the methods established by the Boards of the underlying funds. The shares of many closed-end investment companies and exchange traded funds, after their initial public offering, frequently trade at a price per share, which is different than the net asset value per share. The difference represents a market premium or market discount of such shares. There can be no assurances that the market discount or market premium on shares of any closed-end investment company or exchange traded fund purchased by the Funds will not change.
In unusual circumstances, instead of valuing securities in the usual manner, the Funds may value securities at “fair value” as determined in good faith by the Funds’ Board of Trustees, pursuant to the procedures (the “Procedures”) approved by the Board. The Procedures consider, among others, the following factors to determine a security’s fair value: the nature and pricing history (if any) of the security; whether any dealer quotations for the security are available; and possible valuation methodologies that could be used to determine the fair value of the security. Fair value may also be used by the Board if extraordinary events occur after the close of the relevant world market but prior to the NYSE close.
Each Fund utilizes various methods to measure the fair value of most of its investments on a recurring basis. GAAP establishes a hierarchy that prioritizes inputs to valuation methods. The three levels of input are:
AMERICAFIRST QUANTITATIVE FUNDS
NOTES TO FINANCIAL STATEMENTS
June 30, 2014
ANNUAL REPORT
(1) ORGANIZATION AND SIGNIFICANT ACCOUNTING POLICIES (continued)
Level 1 – Unadjusted quoted prices in active markets for identical assets and liabilities that the Funds have the ability to access.
Level 2 – Observable inputs other than quoted prices included in Level 1 that are observable for the asset or liability, either directly or indirectly. These inputs may include quoted prices for the identical instrument in an inactive market, prices for similar instruments, interest rates, prepayment speeds, credit risk, yield curves, default rates and similar data.
Level 3 – Unobservable inputs for the asset or liability, to the extent relevant observable inputs are not available, representing the Funds’ own assumptions about the assumptions a market participant would use in valuing the asset or liability, and would be based on the best information available.
The availability of observable inputs can vary from security to security and is affected by a wide variety of factors, including, for example, the type of security, whether the security is new and not yet established in the marketplace, the liquidity of markets, and other characteristics particular to the security. To the extent that valuation is based on models or inputs that are less observable or unobservable in the market, the determination of fair value requires more judgment. Accordingly, the degree of judgment exercised in determining fair value is greatest for instruments categorized in Level 3.
The inputs used to measure fair value may fall into different levels of the fair value hierarchy. In such cases, for disclosure purposes, the level in the fair value hierarchy within which the fair value measurement falls in its entirety, is determined based on the lowest level input that is significant to the fair value measurement in its entirety.
The inputs or methodology used for valuing securities are not necessarily an indication of the risk associated with investing in those securities. The following tables summarize the inputs used as of June 30, 2014 for each Fund’s assets and liabilities measured at fair value:
Defensive Growth Fund
Assets |
|
|
|
|
|
|
|
|
Security Classification (1) |
| Value |
| Level 1 |
| Level 2 |
| Level 3 |
Common Stock (2) |
| $ 38,433,416 |
| $ 38,433,416 |
| $ - |
| $ - |
Short Term Investment |
| 1,755,168 |
| 1,755,168 |
| - |
| - |
Total |
| $ 40,188,584 |
| $ 40,188,584 |
| $ - |
| $ - |
Liabilities |
|
|
|
|
|
|
|
|
Security Classification (1) |
| Value |
| Level 1 |
| Level 2 |
| Level 3 |
Common Stock Sold Short (2) |
| $ 8,702,709 |
| $ 8,702,709 |
| $ - |
| $ - |
Exchange Traded Notes |
| 572,000 |
| 572,000 |
|
|
|
|
Total |
| $ 9,274,709 |
| $ 9,274,709 |
| $ - |
| $ - |
Income Trends Fund
Security Classification (1) |
| Value |
| Level 1 |
| Level 2 |
| Level 3 |
Common Stock (2) |
| $ 13,525,721 |
| $ 13,525,721 |
| $ - |
| $ - |
Preferred Stock (2) |
| 8,638,848 |
| 8,638,848 |
| - |
| - |
Bonds & Notes (2) |
| 21,423,251 |
| - |
| 21,423,251 |
| - |
Short Term Investment |
| 680,845 |
| 680,845 |
| - |
| - |
Total |
| $ 44,268,665 |
| $ 22,845,414 |
| $ 21,423,251 |
| $ - |
Absolute Return Fund
Assets |
|
|
|
|
|
|
|
| |||||||||
Security Classification (1) |
| Value |
| Level 1 |
| Level 2 |
| Level 3 | |||||||||
Common Stock (2) |
| $ 17,559,423 |
| $ 17,559,423 |
| $ - |
| $ - | |||||||||
Short Term Investment |
| 207,413 |
| 207,413 |
| - |
| - | |||||||||
Total |
| $ 17,766,836 |
| $ 17,766,836 |
| $ - |
| $ - | |||||||||
AMERICAFIRST QUANTITATIVE FUNDS
NOTES TO FINANCIAL STATEMENTS
June 30, 2014
ANNUAL REPORT
(1) ORGANIZATION AND SIGNIFICANT ACCOUNTING POLICIES (continued)
Quantitative Strategies Fund
|
|
|
|
|
|
|
|
|
Security Classification (1) |
| Value |
| Level 1 |
| Level 2 |
| Level 3 |
Common Stock (2) |
| $ 46,615,762 |
| $ 46,466,043 |
| $ 149,719 |
| $ - |
Exchange Traded Funds |
| 19,605,904 |
| 19,605,904 |
| - |
| - |
Bonds & Notes (2 |
| 10,187,410 |
| - |
| 10,187,410 |
| - |
Short Term Investment |
| 1,568,284 |
| 1,568,284 |
| - |
| - |
Total |
| $ 77,977,360 |
| $ 67,640,231 |
| $ 10,337,129 |
| $ - |
Seasonal Trends Fund
|
|
|
|
|
|
|
|
|
Security Classification (1) |
| Value |
| Level 1 |
| Level 2 |
| Level 3 |
Bonds & Notes (2) |
| $ 28,877,969 |
| $ - |
| $ 28,877,969 |
| $ - |
Exchange Traded Funds |
| 1,916,675 |
| 1,916,675 |
| - |
| - |
Total |
| $ 30,794,644 |
| $ 1,916,675 |
| $ 28,877,969 |
| $ - |
(1) As of and during the year/period ended June 30, 2014, the Funds held no securities that were considered to be “Level 3” securities (those valued using significant unobservable inputs). Therefore, a reconciliation of assets in which significant unobservable inputs (Level 3) were used in determining fair value is not applicable.
(2) For a detailed break-out of common stocks, preferred stocks, and bonds & notes by investment industry please refer to the Schedules of Investments.
The Funds had no transfers between Level 1 and Level 2 during the year ended June 30, 2014. It is the Funds’ policy to record transfers into or out of Level 1 and Level 2 at the end of the reporting period.
b)
Short Sales – A "short sale" is a transaction in which a fund sells a security it does not own, but has borrowed in anticipation that the market price of that security will decline. A Fund is obligated to replace the security borrowed by purchasing it on the open market at a later date. If the price of the security sold short increases between the time of the short sale and the time a fund replaces the borrowed security, the Fund will incur a loss, unlimited in size. Conversely, if the price declines, the Fund will realize a gain, limited to the price at which a fund sold the security short.
c)
Federal Income Tax - The Funds intend to continue to comply with the requirements of Subchapter M of the Internal Revenue Code applicable to regulated investment companies and will distribute all of their taxable income, if any, to shareholders. Accordingly, no provision for Federal income taxes is required in the financial statements. The Funds recognize the tax benefits of uncertain tax positions only when the position is “more likely than not” to be sustained assuming examination by tax authorities. Management has analyzed the Funds’ tax positions, and has concluded that no liability for unrecognized tax benefits should be recorded related to uncertain tax positions on returns filed for open tax years (2010-2012) or expected to be taken in the Funds’ 2013 tax returns. The Funds identified their major tax jurisdictions as U.S. Federal and foreign jurisdictions where the Funds make significant investments; however, the Funds are not aware of any tax positions for which it is reasonably possible that the total amounts of unrecognized tax benefits will change materially in the next twelve months.
d)
Distribution to Shareholders - Distributions from investment income and net realized capital gains, if any, are declared and paid at least annually and are recorded on the ex-dividend date. The character of income and gains to be distributed is determined in accordance with income tax regulations, which may differ from GAAP. These “book/tax” differences are considered either temporary (e.g., deferred losses, mark-to-market on open Section 1256 contracts) or permanent in nature. To the extent these differences are permanent in nature, such amounts are reclassified within the composition of net assets based on their federal tax-basis treatment; temporary differences do not require reclassification.
e)
Other - Investment and shareholder transactions are recorded on trade date. The Funds determine the gain or loss realized from the investment transactions by comparing the original cost of the security lot sold with the net sales proceeds. Dividend income is recognized on the ex-dividend date or as soon as information is available to the Funds and interest income is recognized on an accrual basis using the effective interest method. Discounts and premiums on debt securities are amortized over their respective lives. Withholding taxes on foreign dividends have been provided for in accordance with the Funds’ understanding of the applicable country’s tax rules and rates.
f)
Multiple Class Allocations – Income, non-class specific expenses and realized/unrealized gains or losses are allocated to each class based on relative share balances. Distribution fees are charged to each respective share class in accordance with the distribution plan. Expenses of the Trust that are directly identifiable to a specific fund are charged to that fund. Expenses, which are not readily identifiable to a specific fund, are allocated in such a manner as deemed equitable, taking into consideration the nature and type of expense and the relative sizes of the funds in the Trust.
AMERICAFIRST QUANTITATIVE FUNDS
NOTES TO FINANCIAL STATEMENTS
June 30, 2014
ANNUAL REPORT
(1) ORGANIZATION AND SIGNIFICANT ACCOUNTING POLICIES (continued)
g)
Credit Facility – The Defensive Growth, Income Trends, Quantitative Strategies and Absolute Return Funds have entered into a revolving line of credit agreement with Union Bank for the purpose of covering redemptions in the Funds subject to the limitations of the 1940 Act for borrowings. The maximum amount of borrowing allowed in total under the agreement is $5,000,000. The Funds will be charged an interest rate of 3.25%. During the period from January 10, 2014 to January 21, 2014, the Defensive Growth Fund, Income Trends Fund, and Absolute Return Fund utilized their line of credit. The average amount of borrowing for this period was for $110,615, $1,787,310, and $94,499 for Defensive Growth Fund, Income Trends Fund, and Absolute Return Fund, respectively. The total interest expense for the period was $108, $1,775, $95 for Defensive Growth Fund, Income Trends Fund, and Absolute Return Fund, respectively The Quantitative Strategies Fund did not utilize its line of credit during the year. As of June 30, 2014, there were no outstanding loans.
h)
Foreign Currency – The accounting records of each Fund is maintained in U.S. dollars. Investment securities and other assets and liabilities denominated in a foreign currency, and income receipts and expense payments are translated into U.S. dollars using the prevailing exchange rate at the London market close. Purchases and sales of securities are translated into U.S. dollars at the contractual currency rates established at the approximate time of the trade. Net realized gains and losses on foreign currency transactions represent net gains and losses from currency realized between the trade and settlement dates on securities transactions and the difference between income accrued versus income received. The effects of changes in foreign currency exchange rates on investments in securities are included with the net realized and unrealized gain or loss on investment securities.
i)
Use of Estimates - The preparation of financial statements in conformity with GAAP requires management to make estimates and assumptions that affect the reported amounts of assets and liabilities and disclosure of contingent assets and liabilities at the date of the financial statements and the reported amounts of revenues and expenses during the reporting period. Actual results could differ from those estimates.
j)
Commitments and Contingencies - In the normal course of business, the Trust may enter into contracts that contain a variety of representations and warranties and provide general indemnifications. The Funds’ maximum exposure under these arrangements is dependent on future claims that may be made against the Funds and, therefore, cannot be estimated; however, management considers the risk of loss from such claims to be remote.
(2)
INVESTMENT TRANSACTIONS
For the year or period ended June 30, 2014, aggregate purchases and sales of investment securities (excluding short-term investments) for the Funds were as follows:
| Purchases |
| Sales |
Defensive Growth Fund | $ 151,857,421 |
| $ 147,475,678 |
Income Trends Fund | 136,894,456 |
| 123,058,423 |
Absolute Return Fund | 67,710,211 |
| 72,741,705 |
Quantitative Strategies Fund | 197,481,907 |
| 178,913,142 |
Seasonal Trends Fund | 97,680,645 |
| 67,184,925 |
There were no government securities purchased or sold by the Funds during the period.
(3)
INVESTMENT MANAGEMENT AGREEMENT AND OTHER RELATED PARTY TRANSACTIONS
AmericaFirst Capital Management, LLC (“AFCM” or the “Manager”) acts as investment advisor for the Funds pursuant to the terms of the Investment Management Agreements (the “Management Agreements”). Under the terms of the Management Agreements, AFCM is responsible for formulating the Funds’ investment policies, making ongoing investment decisions and engaging in portfolio transactions. The Management Agreements provide that the Manager will provide the Funds with investment advice and supervision and will continuously furnish an investment program for the Funds consistent with the investment objectives and policies of the Funds. For its services under the Management Agreements, the Manager is paid a bi-monthly management fee at the annual rate of 1.50%, 1.25%, 1.50%, 1.00% and 1.50% of the average daily net assets of the Defensive Growth Fund, Income Trends Fund, Absolute Return Fund, Quantitative Strategies Fund and Seasonal Trends Fund, respectively. For the year/period ended June 30, 2014, the Defensive Growth Fund, Income Trends Fund, Absolute Return Fund, Quantitative Strategies Fund and Seasonal Trends Fund incurred $461,360, $468,769, $275,012, $585,062 and $199,938 of management fees, before waiver and reimbursements described below.
AFCM and the Funds have entered into Expense Limitation Agreements (“Expense Limits”) under which the Manager has contractually agreed to waive fees and/or reimburse expenses but only to the extent necessary to maintain total annual operating expenses (exclusive, with respect to the Funds’ Class A, Class C, Class U and Class I Shares of the Seasonal Trends Fund, of any front-end or contingent deferred loads, taxes, leverage interest, brokerage commissions, expenses incurred in connection with any merger or reorganization, dividend expense on securities sold short, underlying fund fees and expenses or extraordinary expenses such as litigation, and with respect to the Funds’ Class I Shares except the Seasonal Trends Fund, exclusive of any front-end or contingent deferred loads, taxes, brokerage commissions, expenses incurred in connection with any merger or reorganization, underlying fund fees and expenses or extraordinary expenses such as litigation) at 2.45% for Class A, 1.94% for Class I and 2.95% for Class U of the Defensive Growth Fund’s average daily net assets through October 31, 2015; at 2.20% for Class A, 1.40% for Class I and 2.70% for Class U of the Income Trends Fund’s average daily net assets through October 31, 2015; at 2.45% for Class A, 1.74% for Class I and 2.95% for the Class U of the Absolute Return Fund’s average daily net assets through October 31, 2015 and 1.50% for Class A and 2.25% for Class C of the Quantitative Strategies Fund’s average daily net assets through October 31, 2015; at 2.45% for Class A, 1.95% for Class I and 2.95% for the Class U of the Seasonal Trends Fund’s average daily net assets through October 31, 2015. Through
AMERICAFIRST QUANTITATIVE FUNDS
NOTES TO FINANCIAL STATEMENTS (Continued)
June 30, 2014
ANNUAL REPORT
(3) INVESTMENT MANAGEMENT AGREEMENT AND OTHER RELATED PARTY TRANSACTIONS (continued)
November 7, 2013, the Expense Limits for Class I under which the Manager had contractually agreed to waive fees and/or reimburse expenses but only to the extent necessary to maintain total annual operating expenses (excluding brokerage costs; borrowing costs, such as (a) interest and
(b) dividends on securities sold short; taxes; underlying fund expenses and extraordinary expenses) were 1.95%, 1.95% and 1.70% of the average daily net assets of the Absolute Return Fund, Defensive Growth Fund and Income Trends Fund, respectively. However, as of November 8, 2013, Class I shares of the Defensive Growth Fund, Income Trends Fund and Absolute Return Fund do not exclude borrowing costs or dividends on securities sold short from the Expense Limits.
Each waiver or reimbursement by the Manager is subject to repayment by the Funds within the three fiscal years following the fiscal year in which those particular expenses are incurred, if the Funds are able to make the repayments without exceeding the expense limitations in effect at that time and the repayments are approved by the Board of Trustees. For the year ended June 30, 2014, the Manager waived management fees of $147,212 for the Defensive Growth Fund. The Manager may recapture $74,769, $72,989, and $147,212 no later than June 30, 2015, June 30, 2016, and June 30, 2017 respectively, subject to the terms of the Expense Limitation Agreement. For the year ended June 30, 2014, the Manager waived management fees of $114,214 for the Income Trends Fund. The Manager may recapture $51,974, $72,391, and $114,214 no later than June 30, 2015, June 30, 2016, and June 30, 2017 respectively, subject to the terms of the Expense Limitation Agreement.
For the year ended June 30, 2014, the Manager waived management fees of $107,501 for the Absolute Return Fund. The Manager may recapture $3,266, $80,241, and $107,501 no later than June 30, 2015, June 30, 2016, and June 30, 2017 respectively, subject to the terms of the Expense Limitation Agreement. For the year ended June 30, 2014, the Manager waived management fees of $149,421 for the Quantitative Strategies Fund. The Manager may recapture $109,711, $105,032, and $149,421 no later than June 30, 2015, June 30, 2016 and June 30, 2017, respectively, subject to the terms of the Expense Limitation Agreement. For the period ended June 30, 2014, the Manager waived management fees of $25,579 for the Seasonal Trends Fund. The Manager may recapture $25,579 no later than June 30, 2017, subject to the terms of the Expense Limitation Agreement.
The Funds have employed Gemini Fund Services, LLC (“GFS”) to provide administration, fund accounting and transfer agent services. A Trustee and certain officers of the Funds are also officers of GFS, and are not paid any fees directly by the Funds for serving in such capacities.
Pursuant to separate servicing agreements with GFS, the Funds pay GFS customary fees for providing administration, fund accounting and transfer agency services to the Funds. GFS provides a Principal Executive Officer and a Principal Financial Officer to the Funds.
In addition, Gemcom, LLC (“Gemcom”) – Gemcom, an affiliate of GFS, provides EDGAR conversion and filing services as well as print management services for the Funds on an ad-hoc basis. For the provision of these services, Gemcom receives customary fees from the Funds.
The Trust has adopted a Distribution Plan (“Plan”) pursuant to rule 12b-1 under the 1940 Act for each class of shares, that allows the Funds to pay to the distributor a monthly fee for distribution and shareholder servicing expenses. Under the Plan, the Funds may pay up to 0.50% for Class A and 1.00% for Class U, respectively, per year of its average daily net assets of the Defensive Growth Fund, the Income Trends Fund, the Absolute Return Fund and the Seasonal Trends Fund for such distribution and shareholder service activities. The Quantitative Strategies Fund may pay up to 0.25% for Class A and 1.00% for Class C, respectively, per year of its average daily net assets for such distribution and shareholder service activities. The Distribution Plan is a compensation plan, which means that compensation is provided regardless of 12b-1 expenses incurred. During the year/period ended June 30, 2014, $136,186, $189,304, $128,833, $371,515 and $35,705 were incurred under the Plan for the Defensive Growth Fund, the Income Trends Fund, the Absolute Return Fund, Quantitative Strategies Fund and Seasonal Trends Fund, respectively.
Distributor – The distributor of the Funds is Northern Lights Distributors, LLC (the “Distributor”), an affiliate of GFS. The Distributor acts as the Funds’ principal underwriter in a continuous public offering of the Funds’ shares. For the year/period ended June 30, 2014, the Distributor received underwriter commissions of $1,115,907 for sales of Class A, Class C and Class U shares, of which $147,770 was retained by the principal underwriter or other affiliated broker-dealers.
Officers of the Trust and Trustees who are "interested persons" of the Trust or the Manager will receive no salary or fees from the Trust. Trustees who are not "interested persons" as that term is defined in the 1940 Act, will be paid $2,500 per meeting attended in-person or $100 per telephonic meeting attended, at the discretion of the Chairman of the Trust. The Trust reimburses each Trustee and officer for his or her travel and other expenses relating to attendance at such meetings
Garfield Holdings, LLC, (“Garfield”) an affiliate of an affiliated person of the Manager, provides compliance services to the Funds. Garfield charges a monthly fee of $1,250 per Fund.
(4) REDEMPTION FEES
The Funds may assess a short-term redemption fee of 1.00% of the total redemption amount if a shareholder sells their shares after holding them for less than 90 days. The redemption fee is paid directly to the specific Fund in which the short-term redemption occurs. For the year ended June 30, 2014, the Defensive Growth Fund, Income Trends Fund, Absolute Return Fund, Quantitative Strategies Fund and Seasonal Trends Fund assessed $3,462, $3,810, $990, $3,790 and $2,629, respectively, in redemption fees.
AMERICAFIRST QUANTITATIVE FUNDS
NOTES TO FINANCIAL STATEMENTS (Continued)
June 30, 2014
ANNUAL REPORT
(5) DISTRIBUTIONS TO SHAREHOLDERS AND TAX COMPONENTS OF CAPITAL
The tax character of fund distributions paid for the year or period ended June 30, 2014 and June 30, 2013 was as follows:
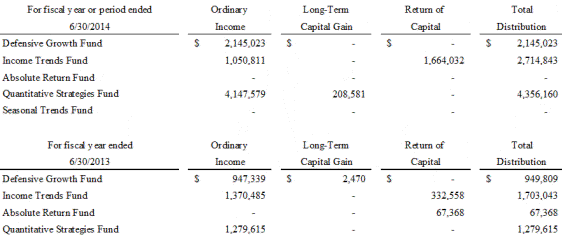
As of June 30, 2014, the components of accumulated earnings/(deficit) on a tax basis were as follows:
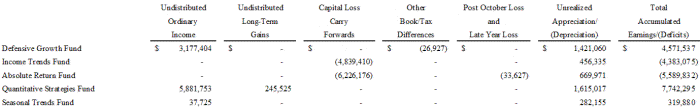
The difference between book basis and tax basis unrealized appreciation/ (depreciation), undistributed net investment income/ (loss) and accumulated net realized gains/ (losses) from investments is primarily attributable to the tax deferral of losses on wash sales and straddles, and adjustments for real estate investment trusts, partnerships and constructive sales.
Late year losses incurred after December 31 within the fiscal year are deemed to arise on the first business day of the following fiscal year for tax purposes. The Absolute Return Fund incurred and elected to defer such late year losses of $33,627.
At June 30, 2014, the Funds below had capital loss carry forwards for federal income tax purposes available to offset future capital gains as follows:
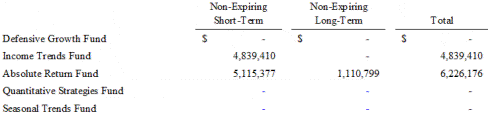
Permanent book and tax differences, primarily attributable to the book/ tax basis treatment of foreign currency gains/ (losses), reclass of net operating losses and income distributions, adjustments for real estate investment trusts, partnerships, and the capitalization of in lieu of dividend payments, resulted in reclassification for the following Funds for the year or period ended June 30, 2014 as follows:
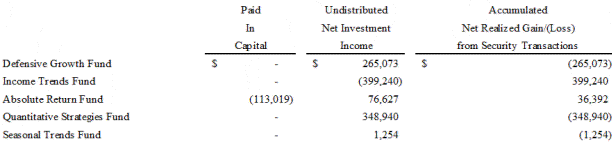
AMERICAFIRST QUANTITATIVE FUNDS
NOTES TO FINANCIAL STATEMENTS (Continued)
June 30, 2014
ANNUAL REPORT
(6) INVESTMENTS IN AFFILIATED COMPANIES
Investments representing 5% or more of the outstanding voting securities of a portfolio company result in the company being considered an affiliated company, as defined in the 1940 Act. As of the year ended June 30, 2014, none of the Fund’s held such affiliated companies. Transactions during the year with companies which are affiliates are as follows:
Description | Fair Value 6/30/2013 |
| Purchases |
| Sales |
| Dividend Income |
| Change in Unrealized Appreciation/Depreciation |
| Net realized gains & losses |
| Return of Capital Distributions |
| Fair Value 6/30/2014 |
Defensive Growth Fund |
|
|
|
|
|
|
|
|
|
|
|
|
|
|
|
UIT2 | $ - |
| $ 506,979 |
| $ 447,541 |
| $ 6,842 |
| $ - |
| $ (1,640) |
| $ 59,438 |
| $ - |
TOTAL | $ - |
| $ 506,979 |
| $ 447,541 |
| $ 6,842 |
| $ - |
| $ (1,640) |
| $ 59,438 |
| $ - |
|
|
|
|
|
|
|
|
|
|
|
|
|
|
|
|
Income Trends Fund |
|
|
|
|
|
|
|
|
|
|
|
|
|
|
|
UIT1 | $ 1,235,536 |
| $ - |
| $ 1,197,580 |
| $ 32,173 |
| $ 28,302 |
| $ (20,391) |
| $ 66,258 |
| $ - |
UIT2 | - |
| 499,984 |
| 441,335 |
| 6,752 |
| - |
| (1,364) |
| 58,649 |
| - |
UIT3 | - |
| 1,635,560 |
| 1,631,447 |
| 24,445 |
| - |
| (37,910) |
| 4,113 |
| - |
TOTAL | $ 1,235,536 |
| $ 2,135,544 |
| $ 3,270,362 |
| $ 63,370 |
| $ 28,302 |
| $ (59,665) |
| $ 129,020 |
| $ - |
|
|
|
|
|
|
|
|
|
|
|
|
|
|
|
|
Absolute Return Fund |
|
|
|
|
|
|
|
|
|
|
|
|
|
|
|
UIT2 | $ - |
| $ 649,986 |
| $ 574,260 |
| $ 8,717 |
| $ - |
| $ (6,178) |
| $ 75,726 |
| $ - |
UIT3 | - |
| 199,992 |
| 199,490 |
| 2,985 |
| - |
| (4,927) |
| 502 |
| - |
TOTAL | $ - |
| $ 849,978 |
| $ 773,750 |
| $ 11,702 |
| $ - |
| $ (11,105) |
| $ 76,228 |
| $ - |
|
|
|
|
|
|
|
|
|
|
|
|
|
|
|
|
Quantitative Strategies Fund |
|
|
|
|
|
|
|
|
|
|
|
|
|
|
|
UIT1 | $ 2,391,399 |
| $ - |
| $ 2,323,432 |
| $ 62,273 |
| $ 60,274 |
| $ (44,963) |
| $ 128,241 |
| $ - |
UIT2 | - |
| 564,946 |
| 498,271 |
| 7,676 |
| - |
| 1,918 |
| 66,675 |
| - |
UIT3 | - |
| 124,999 |
| 124,681 |
| 1,892 |
| - |
| (1,340) |
| 318 |
| - |
TOTAL | $ 2,391,399 |
| $ 689,945 |
| $ 2,946,384 |
| $ 71,841 |
| $ 60,274 |
| $ (44,385) |
| $ 195,234 |
| $ - |
|
|
|
|
|
|
|
|
|
|
|
|
|
|
|
|
(7)
SUBSEQUENT EVENTS
Subsequent events after the Statements of Assets and Liabilities date have been evaluated through the date the financial statements were issued. Management has concluded that there is no impact requiring adjustment or disclosure in the financial statements.
(8)
SUBSEQUENT DISTRIBUTIONS
On July 30, 2014, the Income Trends Fund paid an ordinary income dividend of $0.0550, $0.0513, and $0.0587 per share for Class A, U and I respectively.
REPORT OF INDEPENDENT REGISTERED PUBLIC ACCOUNTING FIRM
To the Board of Trustees of AmericaFirst Quantitative Funds
and the Shareholders of AmericaFirst Defensive Growth Fund, AmericaFirst Income Trends Fund, AmericaFirst Absolute Return Fund, AmericaFirst Quantitative Strategies Fund and AmericaFirst Seasonal Trends Fund
We have audited the accompanying statements of assets and liabilities of the AmericaFirst Defensive Growth Fund, AmericaFirst Income Trends Fund, AmericaFirst Absolute Return Fund, AmericaFirst Quantitative Strategies Fund and AmericaFirst Seasonal Trends Fund (the "Funds"), each a series of shares of beneficial interest of the AmericaFirst Quantitative Funds, including the schedules of investments, as of June 30, 2014, and the related statements of operations for the year or period then ended, the statements of changes in net assets for each of the years or period in the two-year period then ended and the financial highlights for each of the respective years or periods presented. These financial statements and financial highlights are the responsibility of the Funds' management. Our responsibility is to express an opinion on these financial statements and financial highlights based on our audits.
We conducted our audits in accordance with the standards of the Public Company Accounting Oversight Board (United States). Those standards require that we plan and perform the audits to obtain reasonable assurance about whether the financial statements and financial highlights are free of material misstatement. An audit includes examining, on a test basis, evidence supporting the amounts and disclosures in the financial statements. Our procedures included confirmation of securities owned as of June 30, 2014 by correspondence with the custodian and brokers. An audit also includes assessing the accounting principles used and significant estimates made by management, as well as evaluating the overall financial statement presentation. We believe that our audits provide a reasonable basis for our opinion.
In our opinion, the financial statements and financial highlights referred to above present fairly, in all material respects, the financial position of the AmericaFirst Defensive Growth Fund, AmericaFirst Income Trends Fund, AmericaFirst Absolute Return Fund, AmericaFirst Quantitative Strategies Fund and AmericaFirst Seasonal Trends Fund as of June 30, 2014, and the results of their operations for the year or period then ended, the changes in their net assets for each of the years or period in the two-year period then ended and their financial highlights for each of the years or periods presented, in conformity with accounting principles generally accepted in the United States of America.

BBD, LLP
Philadelphia, Pennsylvania
August 28, 2014
TRUSTEES AND OFFICERS (Unaudited)
Management Information. Following are the Trustees and Officers of the Trust, their address and year of birth, their present position with the Trust, and their principal occupation during the past five years. In case a vacancy or an anticipated vacancy on the Board of Trustees shall for any reason exist, the vacancy shall be filled by the affirmative vote of a majority of the remaining Trustees, subject to certain restrictions under the 1940 Act. Those Trustees and Officers, who are “interested persons” (as defined in the 1940 Act) by virtue of their affiliation with either the Trust or the Manager, are indicated in the table. The address of each Trustee and Officer is 17605 Wright Street, Suite 2, Omaha, Nebraska 68130 unless otherwise noted.
Independent Trustees
|
|
|
|
|
Name, Address and Age | Position(s) Held with AmericaFirst Term of Office Length of Time Served | Principal Occupation(s) During Past 5 Years | Number of Portfolios in AmericaFirst Overseen by AmericaFirst Trustee | Other Directorships Held by AmericaFirst Trustee During the Past Five Years |
INDEPENDENT TRUSTEES | ||||
Michael G. Dencavage Year of Birth: 1954 | Trustee– 2012 to present | Chief Financial Officer, San Juan Unified School District, (2004 to 2011) | 4 | None |
Kathleen T. Barr Year of Birth: 1955 | Independent Chair of the Board of Trustees – 2012 to present | Retired: formerly, President, Productive Capital Management, Inc. (registered investment adviser to public entities) and owner, KT Barr Consulting, LLC (mutual fund and investment management consulting) 2010 to 2013; prior thereto, Chief Administrative Officer, Senior Managing Director of Allegiant Asset Management Company (merged with PNC Capital Advisors, LLC in 2009) from 2004 to 2010; Chief Administrative Officer and Chief Compliance Officer and Senior Vice Present of PNC Funds and PNC Advantage Funds (f/k/a Allegiant Funds 2003 to 2010 | 5 | William Blair Funds (25 portfolios) |
Interested Trustee** and Officers
|
|
|
|
| |
Name, Address and Age | Position(s) Held with AmericaFirst Term of Office Length of Time Served | Principal Occupation(s) During Past 5 Years | Number of Portfolios in AmericaFirst Overseen by AmericaFirst Trustee | Other Directorships Held by AmericaFirst Trustee During the Past Five Years | |
INTERESTED TRUSTEE | |||||
Rick A. Gonsalves 8150 Sierra College Blvd., Suite 290, Roseville, CA 95661 Year of Birth: 1968 | Trustee – 2012 to present | President & Chief Executive Officer, AmericaFirst Capital Management, LLC (2007 – present) (investment adviser to the Funds and New Funds; President & Chief Executive Officer, Renaissance Investment Services (2005 to 2008); Registered Broker Representative, Brecek & Young Advisors, Inc. (January 2007 to December 2007); Registered Broker Representative, WRP Investments, Inc. (2005 to 2006). | 5 | None | |
OFFICERS OF THE TRUST | |||||
Andrew Rogers Year of Birth: 1969 | President – 2012 to present | Chief Executive Officer, Gemini Fund Services, LLC (since 2012); President and Manager, Gemini Fund Services, LLC (2006 - 2012); Formerly Manager, Northern Lights Compliance Services, LLC (2006 - 2008); and President and Manager, GemCom LLC (2004-2011). | n/a | n/a | |
Robert G. Roach, Jr. 8150 Sierra College Blvd., Suite 290, Roseville, CA 95661 Year of Birth: 1962 | Chief Compliance Officer of the Trust 2012 - present | Chief Compliance Officer, AmericaFirst Capital Management, LLC (2012 – present); Managing Director & Chief Compliance Officer, AmericaFirst Securities, Inc. (2012 – present); COO, CFO & CCO, Nile Capital Management, LLC (2009 – 2012), Interested Trustee, Nile Capital Investment Trust (2012 - present), Treasurer & Chief Compliance Officer, Nile Capital Investment Trust (2010 – 2012); CEO, CFO & CCO, Nile Capital, LLC (2003 – 2011). | n/a | Trustee, Nile Capital Investment Trust (2012 – present) | |
James Colantino Year of Birth: 1969 | Treasurer 2012 – present | Senior Vice President from 2004 to Present; Senior Fund Administrator from 1999 to 2004, Gemini Fund Services, LLC. | n/a | n/a | |
Dawn M. Dennis Year of Birth: 1966 | Secretary 2014 - present | Senior Paralegal, Gemini Fund Services (since May 2013), Paralegal (from July 2011 through April 2013) | n/a | n/a | |
* The term of office of each Trustee is indefinite.
** The Trustee who is an “interested person” of the Trust as defined in the 1940 Act is an interested person by virtue of being an officer of an advisor that manages a series of the Trust.
The Trust’s Statement of Additional Information includes additional information about the Trustees and Officers and is available, without charge, upon request by calling 1-877-217-8363.
PRIVACY NOTICE | Rev. Jan 2013 | ||||||||||
FACTS | WHAT DOES AMERICAFIRST QUANTITATIVE FUNDS DO WITH YOUR PERSONAL INFORMATION? | ||||||||||
|
| ||||||||||
Why? | Financial companies choose how they share your personal information. Federal law gives consumers the right to limit some but not all sharing. Federal law also requires us to tell you how we collect, share, and protect your personal information. Please read this notice carefully to understand what we do. | ||||||||||
|
| ||||||||||
What? | The types of personal information we collect and share depend on the product or service you have with us. This information can include: § Social Security number § Purchase History § Assets § Account Balances § Retirement Assets § Account Transactions § Transaction History § Wire Transfer Instructions § Checking Account Information When you are no longer our customer, we continue to share your information as described in this notice. | ||||||||||
|
| ||||||||||
How? | All financial companies need to share customers’ personal information to run their everyday business. In the section below, we list the reasons financial companies can share their customers’ personal information; the reasons AmericaFirst Quantitative Funds chooses to share; and whether you can limit this sharing. | ||||||||||
|
|
|
| ||||||||
Reasons we can share your personal information | Does AmericaFirst Quantitative Funds share? | Can you limit this sharing? | |||||||||
For our everyday business purposes – such as to process your transactions, maintain your account(s), respond to court orders and legal investigations, or report to credit bureaus | Yes | No | |||||||||
For our marketing purposes – to offer our products and services to you | No | We don’t share | |||||||||
For joint marketing with other financial companies | No | We don’t share | |||||||||
For our affiliates’ everyday business purposes – information about your transactions and experiences | No | We don’t share | |||||||||
For our affiliates’ everyday business purposes – information about your creditworthiness | No | We don’t share | |||||||||
For nonaffiliates to market to you | No | We don’t share | |||||||||
|
| ||||||||||
Questions? | Call 1-877-217-8363 | ||||||||||
|
| ||||||||||
Who we are | |||||||||||
Who is providing this notice? | AmericaFirst Quantitative Funds | ||||||||||
What we do | |||||||||||
How does AmericaFirst Quantitative Funds protect my personal information? | To protect your personal information from unauthorized access and use, we use security measures that comply with federal law. These measures include computer safeguards and secured files and buildings. Our service providers are held accountable for adhering to strict policies and procedures to prevent any misuse of your nonpublic personal information. | ||||||||||
How does AmericaFirst Quantitative Funds collect my personal information? | We collect your personal information, for example, when you § Open an account § Provide account information § Give us your contact information § Make deposits or withdrawals from your account § Make a wire transfer § Tell us where to send the money § Tells us who receives the money § Show your government-issued ID § Show your driver’s license We also collect your personal information from other companies. | ||||||||||
Why can’t I limit all sharing? | Federal law gives you the right to limit only ▪ Sharing for affiliates’ everyday business purposes – information about your creditworthiness ▪ Affiliates from using your information to market to you ▪ Sharing for nonaffiliates to market to you State laws and individual companies may give you additional rights to limit sharing. | ||||||||||
Definitions | |||||||||||
Affiliates | Companies related by common ownership or control. They can be financial and nonfinancial companies. § AmericaFirst Quantitative Funds does not share with our affiliates. | ||||||||||
Nonaffiliates | Companies not related by common ownership or control. They can be financial and nonfinancial companies § AmericaFirst Quantitative Funds does not share with nonaffiliates so they can market to you. | ||||||||||
Joint marketing | A formal agreement between nonaffiliated financial companies that together market financial products or services to you. § AmericaFirst Quantitative Funds does not jointly market. | ||||||||||
AmericaFirst Quantitative Funds MANAGER AmericaFirst Capital Management, LLC 8150 Sierra College Blvd. Suite 290 Roseville, CA 95661 ADMINISTRATOR Gemini Fund Services, LLC 17605 Wright Street, Suite 2 Omaha, NE 68130
|
How to Obtain Proxy Voting Information
Information regarding how the Funds vote proxies relating to portfolio securities during the most recent 12-month period ending June 30th as well as a description of the policies and procedures that the Funds used to determine how to vote proxies is available without charge, upon request, by calling 1-877-213-8363 or by referring to the Securities and Exchange Commission’s (“SEC”) website at http://www.sec.gov.
How to Obtain 1st and 3rd Fiscal Quarter Portfolio Holdings
Each Fund files its complete schedule of portfolio holdings with the SEC for the first and third quarters of each fiscal year on Form N-Q. Form N-Q is available on the SEC’s website at http://www.sec.gov and may be reviewed and copied at the SEC’s Public Reference Room in Washington, DC (1-800-SEC-0330). The information on Form N-Q is available without charge, upon request, by calling 1-877-213-8363
Item 2. Code of Ethics.
(a)
As of the end of the period covered by this report, the registrant has adopted a code of ethics that applies to the registrant's principal executive officer, principal financial officer, principal accounting officer or controller, or persons performing similar functions, regardless of whether these individuals are employed by the registrant or a third party.
(b)
For purposes of this item, “code of ethics” means written standards that are reasonably designed to deter wrongdoing and to promote:
(1)
Honest and ethical conduct, including the ethical handling of actual or apparent conflicts of interest between personal and professional relationships;
(2)
Full, fair, accurate, timely, and understandable disclosure in reports and documents that a registrant files with, or submits to, the Commission and in other public communications made by the registrant;
(3)
Compliance with applicable governmental laws, rules, and regulations;
(4)
The prompt internal reporting of violations of the code to an appropriate person or persons identified in the code; and
(5)
Accountability for adherence to the code.
(c)
Amendments: During the period covered by the report, there have not been any amendments to the provisions of the code of ethics.
(d)
Waivers: During the period covered by the report, the registrant has not granted any express or implicit waivers from the provisions of the code of ethics.
(e) The Code of Ethics is not posted on Registrant’ website.
(f) A copy of the Code of Ethics is attached as an exhibit.
Item 3. Audit Committee Financial Expert.
(a)(1)ii The board of directors of the fund has determined that the fund does not have an audit committee financial expert serving on its audit committee.
(a)(2) Not applicable.
(a)(3) In this regard, no member of the audit committee was identified as having all of the required technical attributes identified in instruction 2 (b) to item 3 of Form N-CSR to qualify as an “audit committee financial expert,” whether through the type of specialized education or experience required by that instruction. At this time, the board believes the experience provided by each member of the audit committee collectively offers the fund adequate oversight by its audit committee given the fund’s level of financial complexity. The board will from time to time reexamine such belief.
Item 4. Principal Accountant Fees and Services.
(a)
Audit Fees
2014 – $52,700
2013 – $52,500
(b)
Audit-Related Fees
2014 – None
2013 – None
(c)
Tax Fees
2014 – $11,000
2013 – $8,000
Preparation of Federal & State income tax returns, assistance with calculation of required income, capital gain and excise distributions and preparation of Federal excise tax returns.
(d)
All Other Fees
2014 - None
2013 - None
(e)
(1)
Audit Committee’s Pre-Approval Policies
The registrant’s Audit Committee is required to pre-approve all audit services and, when appropriate, any non-audit services (including audit-related, tax and all other services) to the registrant. The registrant’s Audit Committee also is required to pre-approve, when appropriate, any non-audit services (including audit-related, tax and all other services) to its adviser, or any entity controlling, controlled by or under common control with the adviser that provides ongoing services to the registrant, to the extent that the services may be determined to have an impact on the operations or financial reporting of the registrant. Services are reviewed on an engagement by engagement basis by the Audit Committee.
(2)
Percentages of Services Approved by the Audit Committee
2014
2013
Audit-Related Fees:
0.00%
0.00%
Tax Fees:
0.00%
0.00%
All Other Fees:
0.00%
0.00%
(f)
During the audit of registrant's financial statements for the most recent fiscal year, less than 50 percent of the hours expended on the principal accountant's engagement were attributed to work performed by persons other than the principal accountant's full-time, permanent employees.
(g)
The aggregate non-audit fees billed by the registrant's accountant for services rendered to the registrant, and rendered to the registrant's investment adviser (not including any sub-adviser whose role is primarily portfolio management and is subcontracted with or overseen by another investment adviser), and any entity controlling, controlled by, or under common control with the adviser that provides ongoing services to the registrant:
2014 - $11,000
2013 - $8,000
(h)
The registrant's audit committee has considered whether the provision of non-audit services to the registrant's investment adviser (not including any sub-adviser whose role is primarily portfolio management and is subcontracted with or overseen by another investment adviser), and any entity controlling, controlled by, or under common control with the investment adviser that provides ongoing services to the registrant, that were not pre-approved pursuant to paragraph (c)(7)(ii) of Rule 2-01 of Regulation S-X, is compatible with maintaining the principal accountant's independence.
Item 5. Audit Committee of Listed Companies. Not applicable to open-end investment companies.
Item 6. Schedule of Investments. Schedule of investments in securities of unaffiliated issuers is included under Item 1.
Item 7. Disclosure of Proxy Voting Policies and Procedures for Closed-End Funds. Not applicable to open-end investment companies.
Item 8. Portfolio Managers of Closed-End Management Investment Companies. Not applicable to open-end investment companies.
Item 9. Purchases of Equity Securities by Closed-End Funds. Not applicable to open-end investment companies.
Item 10. Submission of Matters to a Vote of Security Holders. None
Item 11. Controls and Procedures.
(a)
Based on an evaluation of the Registrant’s disclosure controls and procedures as of a date within 90 days of filing date of this Form N-CSR, the principal executive officer and principal financial officer of the Registrant have concluded that the disclosure controls and procedures of the Registrant are reasonably designed to ensure that the information required in filings on Form N-CSR is recorded, processed, summarized, and reported by the filing date, including that information required to be disclosed is accumulated and communicated to the Registrant’s management, including the Registrant’s principal executive officer and principal financial officer, as appropriate to allow timely decisions regarding required disclosure.
(b)
There were no significant changes in the Registrant’s internal control over financial reporting that occurred during the Registrant’s last fiscal half-year that have materially affected, or are reasonably likely to materially affect, the Registrant’s internal control over financial reporting.
Item 12. Exhibits.
(a)(1)
Code of Ethics filed herewith.
(a)(2)
Certifications required by Section 302 of the Sarbanes-Oxley Act of 2002 (and Item 11(a)(2) of Form N-CSR) are filed herewith.
(a)(3)
Not applicable for open-end investment companies.
(b)
Certifications required by Section 906 of the Sarbanes-Oxley Act of 2002 (and Item 11(b) of Form N-CSR) are filed herewith.
SIGNATURES
Pursuant to the requirements of the Securities Exchange Act of 1934 and the Investment Company Act of 1940, the registrant has duly caused this report to be signed on its behalf by the undersigned, thereunto duly authorized.
(Registrant) AmericaFirst Quantitative Funds
By (Signature and Title)
/s/Andrew B. Rogers
Andrew B. Rogers, President
Date
9/8/14
Pursuant to the requirements of the Securities Exchange Act of 1934 and the Investment Company Act of 1940, this report has been signed below by the following persons on behalf of the registrant and in the capacities and on the dates indicated.
By (Signature and Title)
/s/Andrew B. Rogers
Andrew B. Rogers, President
Date
9/8/14
By (Signature and Title)
/s/Jim Colantino
James Colantino, Treasurer
Date
9/8/14