The Brinsmere Fund - Conservative ETF
The Brinsmere Fund - Growth ETF
Annual Financial Statements and Additional Information
September 30, 2024
UNITED STATES
SECURITIES AND EXCHANGE COMMISSION
Washington, D.C. 20549
FORM N-CSR
CERTIFIED SHAREHOLDER REPORT OF REGISTERED
MANAGEMENT INVESTMENT COMPANIES
Investment Company Act file number 811-22668
ETF Series Solutions
(Exact name of registrant as specified in charter)
615 East Michigan Street
Milwaukee, WI 53202
(Address of principal executive offices) (Zip code)
Kristina R. Nelson
ETF Series Solutions
615 East Michigan Street
Milwaukee, WI 53202
(Name and address of agent for service)
414-516-1645
Registrant’s telephone number, including area code
Date of fiscal year end: September 30
Date of reporting period: September 30, 2024
Item 1. Reports to Stockholders.
| (a) |
 | The Brinsmere Fund - Conservative ETF |  |
| TBFC (Principal U.S. Listing Exchange: NYSE) | ||
| Annual Shareholder Report | September 30, 2024 |
Fund Name | Costs of a $10,000 investment | Costs paid as a percentage of a $10,000 investment |
| The Brinsmere Fund - Conservative ETF | $26 | 0.35% |
Since Inception (01/12/2024) | |
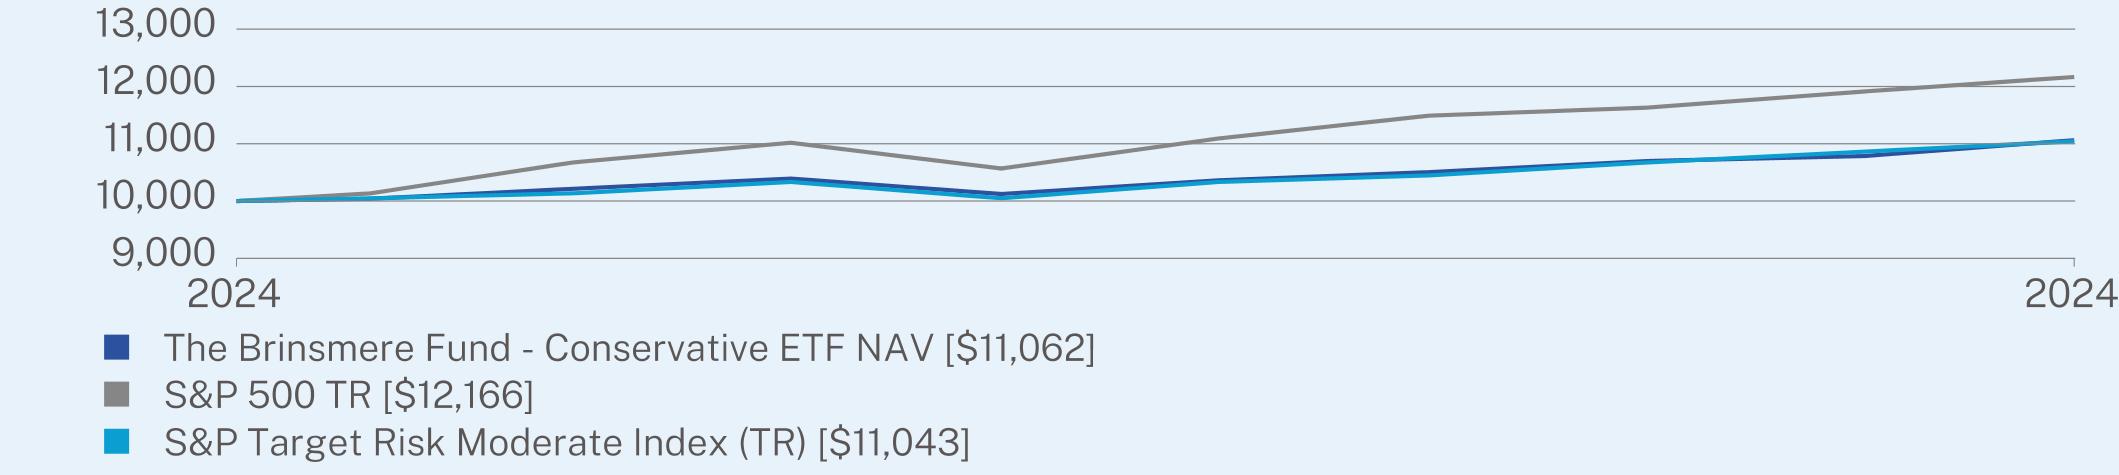
The Brinsmere Fund - Conservative ETF NAV | 10.62 |
S&P 500 TR | 21.66 |
S&P Target Risk Moderate Index (TR) | 10.43 |
| * | The Fund’s past performance is not a good predictor of how the Fund will perform in the future. The graph and table do not reflect the deduction of taxes that a shareholder would pay on Fund distributions or redemption of Fund shares. |
| The Brinsmere Fund - Conservative ETF | PAGE 1 | TSR-AR-26922B493 |
Net Assets | $296,281,338 |
Number of Holdings | 27 |
Net Advisory Fee | $701,306 |
Portfolio Turnover | 85% |
30-Day SEC Yield | 2.51% |
30-Day SEC Yield Unsubsidized | 2.51% |
Top 10 Securities | (%) |
Invesco S&P 500 Equal Weight ETF | 13.0% |
Vanguard Short-Term Treasury ETF | 12.7% |
Vanguard Short-Term Bond ETF | 8.5% |
Vanguard Growth ETF | 6.0% |
Vanguard Intermediate-Term Corporate Bond ETF | 5.7% |
Vanguard Value ETF | 5.5% |
Vanguard Intermediate-Term Bond ETF | 4.7% |
Vanguard Total Bond Market ETF | 4.3% |
Vanguard FTSE Pacific ETF | 3.9% |
Vanguard FTSE Europe ETF | 3.9% |
Security Type | (%) |
Exchange Traded Funds | 96.5% |
Money Market Funds | 3.5% |
Cash & Other | 0.0%* |
Top Ten Countries | (%) |
United States | 100.0% |
Cash & Other | 0.0%* |
| * | Represents less than 0.05% of net assets. |
| The Brinsmere Fund - Conservative ETF | PAGE 2 | TSR-AR-26922B493 |
| The Brinsmere Fund - Conservative ETF | PAGE 3 | TSR-AR-26922B493 |
 | The Brinsmere Fund - Growth ETF |  |
| TBFG (Principal U.S. Listing Exchange: NYSE) | ||
| Annual Shareholder Report | September 30, 2024 |
Fund Name | Costs of a $10,000 investment | Costs paid as a percentage of a $10,000 investment |
| The Brinsmere Fund - Growth ETF | $27 | 0.35% |
Since Inception (01/12/2024) | |
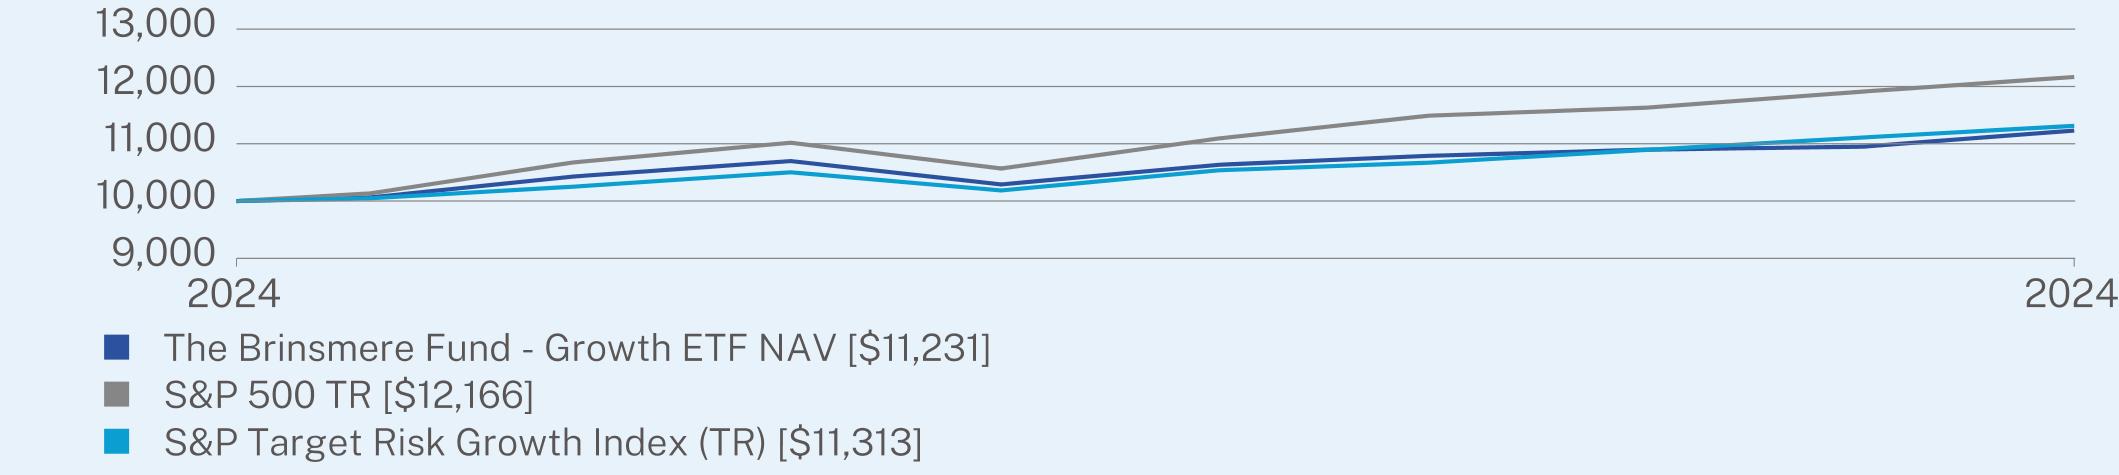
The Brinsmere Fund - Growth ETF NAV | 12.31 |
S&P 500 TR | 21.66 |
S&P Target Risk Growth Index (TR) | 13.13 |
| * | The Fund’s past performance is not a good predictor of how the Fund will perform in the future. The graph and table do not reflect the deduction of taxes that a shareholder would pay on Fund distributions or redemption of Fund shares. |
| The Brinsmere Fund - Growth ETF | PAGE 1 | TSR-AR-26922B519 |
Net Assets | $288,772,948 |
Number of Holdings | 27 |
Net Advisory Fee | $682,393 |
Portfolio Turnover | 138% |
30-Day SEC Yield | 2.06% |
30-Day SEC Yield Unsubsidized | 2.06% |
Top 10 Securities | (%) |
Invesco S&P 500 Equal Weight ETF | 16.8% |
Vanguard Value ETF | 7.7% |
Vanguard Growth ETF | 7.3% |
Vanguard Short-Term Treasury ETF | 6.8% |
Vanguard FTSE Pacific ETF | 5.9% |
Vanguard FTSE Europe ETF | 5.8% |
First American Treasury Obligations Fund | 5.4% |
Vanguard Small-Cap ETF | 4.9% |
Columbia EM Core ex-China ETF | 4.7% |
iShares MSCI China ETF | 3.7% |
Security Type | (%) |
Exchange Traded Funds | 95.1% |
Money Market Funds | 5.4% |
Cash & Other | -0.5% |
Top Ten Countries | (%) |
United States | 100.5% |
Cash & Other | -0.5% |
| The Brinsmere Fund - Growth ETF | PAGE 2 | TSR-AR-26922B519 |
| The Brinsmere Fund - Growth ETF | PAGE 3 | TSR-AR-26922B519 |
| (b) | Not applicable. |
Item 2. Code of Ethics.
The registrant has adopted a code of ethics that applies to the registrant’s principal executive officer and principal financial officer. The registrant has not made any substantive amendments to its code of ethics during the period covered by this report. The registrant has not granted any waivers from any provisions of the code of ethics during the period covered by this report.
A copy of the registrant’s Code of Ethics is filed herewith.
Item 3. Audit Committee Financial Expert.
The registrant’s board of trustees has determined that there is at least one audit committee financial expert serving on its audit committee. Mr. Leonard Rush is the “audit committee financial expert” and is considered to be “independent” as each term is defined in Item 3 of Form N-CSR.
Item 4. Principal Accountant Fees and Services.
The registrant has engaged its principal accountant to perform audit services, audit-related services, tax services and other services during the past two fiscal years. “Audit services” refer to performing an audit of the registrant’s annual financial statements or services that are normally provided by the accountant in connection with statutory and regulatory filings or engagements for those fiscal years. “Audit-related services” refer to the assurance and related services by the principal accountant that are reasonably related to the performance of the audit. “Tax services” refer to professional services rendered by the principal accountant for tax compliance, tax advice, and tax planning. There were no “other services” provided by the principal accountant. The following table details the aggregate fees billed or expected to be billed for each of the last two fiscal years for audit fees, audit-related fees, tax fees and other fees by the principal accountant.
| FYE 9/30/2024 | FYE 9/30/2023 | |
| (a) Audit Fees | $ 37,000 | N/A |
| (b) Audit-Related Fees | $ 0 | N/A |
| (c) Tax Fees | $ 7,000 | N/A |
| (d) All Other Fees | $ 0 | N/A |
(e)(1) The audit committee has adopted pre-approval policies and procedures that require the audit committee to pre-approve all audit and non-audit services of the registrant, including services provided to any entity affiliated with the registrant.
(e)(2) The percentage of fees billed by Cohen & Company, Ltd. applicable to non-audit services pursuant to waiver of pre-approval requirement were as follows:
| FYE 9/30/2024 | FYE 9/30/2023 | |
| Audit-Related Fees | 0% | N/A |
| Tax Fees | 0% | N/A |
| All Other Fees | 0% | N/A |
(f) N/A.
(g) The following table indicates the non-audit fees billed or expected to be billed by the registrant’s accountant for services to the registrant and to the registrant’s investment adviser (and any other controlling entity, etc.—not sub-adviser) for the last two years.
| Non-Audit Related Fees | FYE 9/30/2024 | FYE 9/30/2023 |
| Registrant | N/A | N/A |
| Registrant’s Investment Adviser | N/A | N/A |
(h) The audit committee of the board of trustees has considered whether the provision of non-audit services that were rendered to the registrant’s investment adviser is compatible with maintaining the principal accountant’s independence and has concluded that the provision of such non-audit services by the accountant has not compromised the accountant’s independence.
(i) The registrant has not been identified by the U.S. Securities and Exchange Commission as having filed an annual report issued by a registered public accounting firm branch or office that is located in a foreign jurisdiction where the Public Company Accounting Oversight Board is unable to inspect or completely investigate because of a position taken by an authority in that jurisdiction.
(j) The registrant is not a foreign issuer.
Item 5. Audit Committee of Listed Registrants.
(a) The registrant is an issuer as defined in Rule 10A-3 under the Securities Exchange Act of 1934, (the “Act”) and has a separately-designated standing audit committee established in accordance with Section 3(a)(58)(A) of the Act. The independent members of the committee are as follows: Leonard M. Rush, David A. Massart, and Janet D. Olsen.
(b) Not applicable
Item 6. Investments.
| (a) | Schedule of Investments is included within the financial statements filed under Item 7 of this Form. | |
| (b) | Not Applicable. |
Item 7. Financial Statements and Financial Highlights for Open-End Investment Companies.
| (a) |
Page | |||
Shares | Value | |||||
EXCHANGE TRADED FUNDS - 96.5%(a) | ||||||
Commodities - 0.8% | ||||||
SPDR Gold Shares(b) | 10,000 | $2,430,600 | ||||
Commodities Broad Basket - 1.5% | ||||||
abrdn Bloomberg All Commodity Strategy K-1 Free ETF | 180,921 | 3,698,025 | ||||
Invesco Optimum Yield Diversified Commodity Strategy No K-1 ETF | 54,956 | 738,059 | ||||
4,436,084 | ||||||
Domestic Equity - 31.1% | ||||||
Invesco S&P 500 Equal Weight ETF | 215,234 | 38,561,323 | ||||
iShares Core S&P Mid-Cap ETF | 42,061 | 2,621,242 | ||||
Real Estate Select Sector SPDR Fund | 96,242 | 4,299,130 | ||||
SPDR S&P 500 ETF Trust | 3,919 | 2,248,565 | ||||
Vanguard Growth ETF | 46,351 | 17,795,539 | ||||
Vanguard Small-Cap ETF | 43,224 | 10,253,165 | ||||
Vanguard Value ETF | 93,823 | 16,378,681 | ||||
92,157,645 | ||||||
Domestic Fixed Income - 49.7% | ||||||
iShares 20+ Year Treasury Bond ETF | 76,461 | 7,500,824 | ||||
iShares 7-10 Year Treasury Bond ETF | 76,939 | 7,549,255 | ||||
iShares iBoxx $ High Yield Corporate Bond ETF | 46,254 | 3,714,196 | ||||
iShares MBS ETF | 105,176 | 10,076,913 | ||||
Vanguard High Dividend Yield ETF | 25,239 | 3,235,640 | ||||
Vanguard Intermediate-Term Bond ETF | 176,422 | 13,826,192 | ||||
Vanguard Intermediate-Term Corporate Bond ETF | 201,729 | 16,894,804 | ||||
Vanguard Long-Term Corporate Bond ETF | 62,866 | 5,106,605 | ||||
Vanguard Short-Term Bond ETF | 320,436 | 25,215,109 | ||||
Vanguard Short-Term Corporate Bond ETF | 46,213 | 3,670,236 | ||||
Vanguard Short-Term Treasury ETF | 638,704 | 37,696,310 | ||||
Vanguard Total Bond Market ETF | 168,042 | 12,621,635 | ||||
147,107,719 | ||||||
Foreign Equity - 13.4% | ||||||
iShares MSCI China ETF | 147,491 | 7,508,767 | ||||
iShares MSCI Emerging Markets ex China ETF | 152,226 | 9,302,531 | ||||
Vanguard FTSE Europe ETF | 160,901 | 11,440,061 | ||||
Vanguard FTSE Pacific ETF | 146,848 | 11,511,415 | ||||
39,762,774 | ||||||
TOTAL EXCHANGE TRADED FUNDS (Cost $261,494,884) | 285,894,822 | |||||
1 |
Shares | Value | |||||
SHORT-TERM INVESTMENTS - 3.5% | ||||||
Money Market Funds - 3.5% | ||||||
First American Treasury Obligations Fund - Class X, 4.79%(c) | 10,407,955 | $10,407,955 | ||||
TOTAL SHORT-TERM INVESTMENTS (Cost $10,407,955) | 10,407,955 | |||||
TOTAL INVESTMENTS - 100.0% (Cost $271,902,839) | $296,302,777 | |||||
Liabilities in Excess of Other Assets - (0.0)%(d) | (21,439) | |||||
TOTAL NET ASSETS - 100.0% | $296,281,338 | |||||
(a) | The risks of investing in investment companies, such as the underlying ETFs, typically reflect the risks of the types of investments in which the investment companies invest. See Note 7 in Notes to Financial Statements. |
(b) | Non-income producing security. |
(c) | The rate shown represents the 7-day annualized effective yield as of September 30, 2024. |
(d) | Represents less than 0.05% of net assets. |
2 |
Shares | Value | |||||
EXCHANGE TRADED FUNDS - 95.1%(a) | ||||||
Commodities - 1.5% | ||||||
SPDR Gold Shares(b) | 17,526 | $4,259,869 | ||||
Commodities Broad Basket - 2.5% | ||||||
abrdn Bloomberg All Commodity Strategy K-1 Free ETF | 269,506 | 5,508,703 | ||||
Invesco Optimum Yield Diversified Commodity Strategy No K-1 ETF | 116,834 | 1,569,081 | ||||
7,077,784 | ||||||
Domestic Equity - 43.2% | ||||||
Invesco S&P 500 Equal Weight ETF | 270,861 | 48,527,457 | ||||
iShares Core S&P Mid-Cap ETF | 62,889 | 3,919,242 | ||||
iShares Core S&P Small-Cap ETF | 31,484 | 3,682,369 | ||||
Real Estate Select Sector SPDR Fund | 152,411 | 6,808,199 | ||||
SPDR S&P 500 ETF Trust | 6,985 | 4,007,714 | ||||
Vanguard Growth ETF | 55,052 | 21,136,114 | ||||
Vanguard Small-Cap ETF | 60,215 | 14,283,600 | ||||
Vanguard Value ETF | 127,566 | 22,269,197 | ||||
124,633,892 | ||||||
Domestic Fixed Income - 27.8% | ||||||
iShares 20+ Year Treasury Bond ETF | 63,570 | 6,236,217 | ||||
iShares 7-10 Year Treasury Bond ETF | 63,967 | 6,276,442 | ||||
iShares iBoxx $ High Yield Corporate Bond ETF | 37,942 | 3,046,743 | ||||
iShares MBS ETF | 87,443 | 8,377,914 | ||||
Vanguard High Dividend Yield ETF | 38,046 | 4,877,497 | ||||
Vanguard Intermediate-Term Corporate Bond ETF | 90,804 | 7,604,835 | ||||
Vanguard Long-Term Corporate Bond ETF | 52,266 | 4,245,567 | ||||
Vanguard Short-Term Bond ETF | 84,575 | 6,655,207 | ||||
Vanguard Short-Term Corporate Bond ETF | 36,013 | 2,860,152 | ||||
Vanguard Short-Term Treasury ETF | 334,048 | 19,715,513 | ||||
Vanguard Total Bond Market ETF | 139,710 | 10,493,618 | ||||
80,389,705 | ||||||
Foreign Equity - 20.1% | ||||||
Columbia EM Core ex-China ETF | 419,546 | 13,706,568 | ||||
iShares MSCI China ETF | 208,762 | 10,628,073 | ||||
Vanguard FTSE Europe ETF | 237,075 | 16,856,033 | ||||
Vanguard FTSE Pacific ETF | 216,518 | 16,972,846 | ||||
58,163,520 | ||||||
TOTAL EXCHANGE TRADED FUNDS (Cost $249,326,727) | 274,524,770 | |||||
3 |
Shares | Value | |||||
SHORT-TERM INVESTMENTS - 5.4% | ||||||
Money Market Funds - 5.4% | ||||||
First American Treasury Obligations Fund - Class X, 4.79%(c) | 15,702,256 | $15,702,256 | ||||
TOTAL SHORT-TERM INVESTMENTS (Cost $15,702,256) | 15,702,256 | |||||
TOTAL INVESTMENTS - 100.5% (Cost $265,028,983) | $290,227,026 | |||||
Liabilities in Excess of Other Assets - 0.5% | (1,454,078) | |||||
TOTAL NET ASSETS - 100.0% | $288,772,948 | |||||
(a) | The risks of investing in investment companies, such as the underlying ETFs, typically reflect the risks of the types of investments in which the investment companies invest. See Note 7 in Notes to Financial Statements. |
(b) | Non-income producing security. |
(c) | The rate shown represents the 7-day annualized effective yield as of September 30, 2024. |
4 |
Conservative ETF | Growth ETF | |||||
ASSETS: | ||||||
Investments, at value | $296,302,777 | $290,227,026 | ||||
Dividends receivable | 37,301 | 54,626 | ||||
Interest receivable | 26,010 | 30,152 | ||||
Total assets | 296,366,088 | 290,311,804 | ||||
LIABILITIES: | ||||||
Payable to adviser | 84,750 | 82,077 | ||||
Due to Custodian | — | 1,456,779 | ||||
Total liabilities | 84,750 | 1,538,856 | ||||
NET ASSETS | $296,281,338 | $288,772,948 | ||||
NET ASSETS CONSISTS OF: | ||||||
Paid-in capital | $271,129,693 | $262,918,997 | ||||
Total distributable earnings | 25,151,645 | 25,853,951 | ||||
Total net assets | $296,281,338 | $288,772,948 | ||||
Net assets | $296,281,338 | $288,772,948 | ||||
Shares issued and outstanding | 10,894,000 | 10,399,000 | ||||
Net asset value per share | $27.20 | $27.77 | ||||
COST: | ||||||
Investments, at cost | $271,902,839 | $265,028,983 | ||||
5 |
Conservative ETF | Growth ETF | |||||
INVESTMENT INCOME: | ||||||
Dividend income | $5,555,519 | $3,970,428 | ||||
Interest income | 127,648 | 60,805 | ||||
Total investment income | 5,683,167 | 4,031,233 | ||||
EXPENSES: | ||||||
Investment advisory fee | 701,306 | 682,393 | ||||
Total expenses | 701,306 | 682,393 | ||||
NET INVESTMENT INCOME | 4,981,861 | 3,348,840 | ||||
REALIZED AND UNREALIZED GAIN | ||||||
Net realized gain from: | ||||||
Investments | 513,664 | 200,099 | ||||
In-kind redemptions | 15,518,359 | 20,460,979 | ||||
Net realized gain | 16,032,023 | 20,661,078 | ||||
Net change in unrealized appreciation on: | ||||||
Investments | 7,212,097 | 6,887,493 | ||||
Net change in unrealized appreciation | 7,212,097 | 6,887,493 | ||||
Net realized and unrealized gain | 23,244,120 | 27,548,571 | ||||
NET INCREASE IN NET ASSETS RESULTING FROM OPERATIONS | $28,225,981 | $30,897,411 | ||||
(a) | Inception date of the Funds was January 12, 2024. |
6 |
Conservative ETF | Growth ETF | |||||
OPERATIONS: | ||||||
Net investment income | $4,981,861 | $3,348,840 | ||||
Net realized gain | 16,032,023 | 20,661,078 | ||||
Net change in unrealized appreciation | 7,212,097 | 6,887,493 | ||||
Net increase in net assets from operations | 28,225,981 | 30,897,411 | ||||
DISTRIBUTIONS TO SHAREHOLDERS: | ||||||
Distributions to shareholders | (4,834,843) | (3,130,483) | ||||
Total distributions to shareholders | (4,834,843) | (3,130,483) | ||||
CAPITAL TRANSACTIONS: | ||||||
Proceeds from shares issued in connection with in-kind contribution (Note 7) | 270,106,363 | 247,472,989 | ||||
Subscriptions | 158,216,525 | 210,203,498 | ||||
Redemptions | (155,432,688) | (196,670,467) | ||||
Net increase in net assets from capital transactions | 272,890,200 | 261,006,020 | ||||
NET INCREASE IN NET ASSETS | 296,281,338 | 288,772,948 | ||||
NET ASSETS: | ||||||
Beginning of the period | — | — | ||||
End of the period | $296,281,338 | $288,772,948 | ||||
SHARE TRANSACTIONS | ||||||
Shares issued in connection with in-kind contribution (Note 7) | 10,804,000 | 9,899,000 | ||||
Subscriptions | 6,070,000 | 8,010,000 | ||||
Redemptions | (5,980,000) | (7,510,000) | ||||
Total increase in shares outstanding | 10,894,000 | 10,399,000 | ||||
(a) | Inception date of the Funds was January 12, 2024. |
7 |
Period Ended September 30, 2024(a) | |||
PER SHARE DATA: | |||
Net asset value, beginning of period | $25.00 | ||
INVESTMENT OPERATIONS: | |||
Net investment income(b)(c) | 0.46 | ||
Net realized and unrealized gain on investments(d) | 2.18 | ||
Total from investment operations | 2.64 | ||
LESS DISTRIBUTIONS FROM: | |||
Net investment income | (0.44) | ||
Total distributions | (0.44) | ||
Net asset value, end of period | $27.20 | ||
TOTAL RETURN(e) | 10.62% | ||
SUPPLEMENTAL DATA AND RATIOS: | |||
Net assets, end of period (in thousands) | $296,281 | ||
Ratio of expenses to average net assets(f)(g) | 0.35% | ||
Ratio of net investment income to average net assets(f)(g) | 2.48% | ||
Portfolio turnover rate(e)(h) | 85% | ||
(a) | Inception date of the Fund was January 12, 2024. |
(b) | Net investment income per share has been calculated based on average shares outstanding during the period. |
(c) | Recognition of net investment income by the Fund is affected by the timing of the declaration of dividends by the underlying exchange traded funds in which the Fund invests. The ratio does not include net investment income of the exchange traded funds in which the Fund invests. |
(d) | Realized and unrealized gains and losses per share in the caption are balancing amounts necessary to reconcile the change in net asset value per share for the period, and may not reconcile with the aggregate gains and losses in the Statement of Operations due to share transactions for the period. |
(e) | Not annualized for periods less than one year. |
(f) | Annualized for periods less than one year. |
(g) | These ratios exclude the impact of expenses of the underlying exchange traded funds as represented in the Schedule of Investments. Recognition of net investment income by the Fund is affected by the timing of the declaration of dividends by the underlying exchange traded funds in which the Fund invests. |
(h) | Portfolio turnover rate excludes in-kind transactions. |
8 |
Period Ended September 30, 2024(a) | |||
PER SHARE DATA: | |||
Net asset value, beginning of period | $25.00 | ||
INVESTMENT OPERATIONS: | |||
Net investment income(b)(c) | 0.32 | ||
Net realized and unrealized gain on investments(d) | 2.75 | ||
Total from investment operations | 3.07 | ||
LESS DISTRIBUTIONS FROM: | |||
Net investment income | (0.30) | ||
Total distributions | (0.30) | ||
Net asset value, end of period | $27.77 | ||
TOTAL RETURN(e) | 12.31% | ||
SUPPLEMENTAL DATA AND RATIOS: | |||
Net assets, end of period (in thousands) | $288,773 | ||
Ratio of expenses to average net assets(f)(g) | 0.35% | ||
Ratio of net investment income to average net assets(f)(g) | 1.71% | ||
Portfolio turnover rate(e)(h) | 138% | ||
(a) | Inception date of the Fund was January 12, 2024. |
(b) | Net investment income per share has been calculated based on average shares outstanding during the period. |
(c) | Recognition of net investment income by the Fund is affected by the timing of the declaration of dividends by the underlying exchange traded funds in which the Fund invests. The ratio does not include net investment income of the exchange traded funds in which the Fund invests. |
(d) | Realized and unrealized gains and losses per share in the caption are balancing amounts necessary to reconcile the change in net asset value per share for the period, and may not reconcile with the aggregate gains and losses in the Statement of Operations due to share transactions for the period. |
(e) | Not annualized for periods less than one year. |
(f) | Annualized for periods less than one year. |
(g) | These ratios exclude the impact of expenses of the underlying exchange traded funds as represented in the Schedule of Investments. Recognition of net investment income by the Fund is affected by the timing of the declaration of dividends by the underlying exchange traded funds in which the Fund invests. |
(h) | Portfolio turnover rate excludes in-kind transactions. |
9 |
| A. | Security Valuation. All equity securities, including domestic and foreign common stocks, preferred stocks and exchange traded funds that are traded on a national securities exchange, except those listed on the Nasdaq Global Market®, Nasdaq Global Select Market®, and the Nasdaq Capital Market® exchanges (collectively, “Nasdaq”), are valued at the last reported sale price on the exchange on which the security is principally traded. Securities traded on Nasdaq will be valued at the Nasdaq Official Closing Price (“NOCP”). If, on a particular day, an exchange-traded or Nasdaq security does not trade, then the mean between the most recent quoted bid and asked prices will be used. All equity securities that are not traded on a listed exchange are valued at the last sale price in the over-the-counter market. If a non-exchange traded security does not trade on a particular day, then the mean between the last quoted closing bid and asked price will be used. Prices denominated in foreign currencies are converted to U.S. dollar equivalents at the current exchange rate, which approximates fair value. |
| Level 1 – | Unadjusted quoted prices in active markets for identical assets or liabilities that the Funds have the ability to access. |
| Level 2 – | Observable inputs other than quoted prices included in Level 1 that are observable for the asset or liability, either directly or indirectly. These inputs may include quoted prices for the identical instrument on an inactive market, prices for similar instruments, interest rates, prepayment speeds, credit risk, yield curves, default rates and similar data. |
10 |
| Level 3 – | Unobservable inputs for the asset or liability, to the extent relevant observable inputs are not available; representing the Funds’ own assumptions about the assumptions a market participant would use in valuing the asset or liability, and would be based on the best information available. |
Assets^ | Level 1 | Level 2 | Level 3 | Total | ||||||||
Exchange Traded Funds | $285,894,822 | $— | $— | $285,894,822 | ||||||||
Short-Term Investments | 10,407,955 | — | — | 10,407,955 | ||||||||
Total Investments in Securities | $296,302,777 | $— | $— | $296,302,777 | ||||||||
Assets^ | Level 1 | Level 2 | Level 3 | Total | ||||||||
Exchange Traded Funds | $274,524,770 | $— | $— | $274,524,770 | ||||||||
Short-Term Investments | 15,702,256 | — | — | 15,702,256 | ||||||||
Total Investments in Securities | $290,227,026 | $— | $— | $290,227,026 | ||||||||
| ^ | See Schedule of Investments for further disaggregation of investment categories. |
| B. | Federal Income Taxes. The Funds’ policy is to comply with the requirements of Subchapter M of the Internal Revenue Code of 1986, as amended, applicable to regulated investment companies and to distribute substantially all of their net investment income and net capital gains to shareholders. Therefore, no federal income tax provision is required. Each Fund plans to file U.S. Federal and applicable state and local tax returns. |
| C. | Security Transactions and Investment Income. Investment securities transactions are accounted for on the trade date. Gains and losses realized on sales of securities are determined on a specific identification basis. Dividend income is recorded on the ex-dividend date. Non-cash dividends included in dividend income or |
11 |
| D. | Distributions to Shareholders. Distributions to shareholders from net investment income and realized gains, if any, are declared and paid at least annually by the Funds. Distributions are recorded on the ex-dividend date. |
| E. | Use of Estimates. The preparation of financial statements in conformity with U.S. GAAP requires management to make estimates and assumptions that affect the reported amounts of assets and liabilities and disclosure of contingent assets and liabilities at the date of the financial statements, as well as the reported amounts of revenues and expenses during the current fiscal period. Actual results could differ from those estimates. |
| F. | Share Valuation. The NAV per share of each Fund is calculated by dividing the sum of the value of the securities held by each Fund, plus cash and other assets, minus all liabilities (including estimated accrued expenses) by the total number of shares outstanding of each Fund, rounded to the nearest cent. The Funds’ shares will not be priced on the days on which the New York Stock Exchange (“NYSE”) is closed for trading. The offering and redemption price per share of each Fund is equal to each Fund’s NAV per share. |
| G. | Guarantees and Indemnifications. In the normal course of business, the Funds enter into contracts with service providers that contain general indemnification clauses. The Funds’ maximum exposure under these arrangements is unknown as this would involve future claims that may be against the Funds that have not yet occurred. However, based on experience, the Funds expect the risk of loss to be remote. |
| H. | Reclassification of Capital Accounts. U.S. GAAP requires that certain components of net assets relating to permanent differences be reclassified between financial and tax reporting. These reclassifications have no effect on net assets or NAV per share and primarily relate to differing book and tax treatments of redemptions in-kind. |
Distributable Earnings (Accumulated Deficit) | Paid-In Capital | |||||
The Brinsmere Fund - Conservative ETF | $(15,427,334) | $15,427,334 | ||||
The Brinsmere Fund - Growth ETF | $(20,223,527) | $20,223,527 | ||||
| I. | Subsequent Events. In preparing these financial statements, management has evaluated events and transactions for potential recognition or disclosure through the date the financial statements were issued. There were no events or transactions that occurred during the period subsequent to the end of the current fiscal period that materially impacted the amounts or disclosures in the Funds’ financial statements. |
12 |
Purchases | Sales | |||||
The Brinsmere Fund - Conservative ETF | $245,318,063 | $237,180,962 | ||||
The Brinsmere Fund - Growth ETF | $390,073,208 | $377,418,142 | ||||
In-Kind Purchases | In-Kind Sales | |||||
The Brinsmere Fund - Conservative ETF | $138,783,160 | $154,375,921 | ||||
The Brinsmere Fund - Growth ETF | $182,025,982 | $195,177,838 | ||||
The Brinsmere Fund - Conservative ETF | The Brinsmere Fund - Growth ETF | |||||
Tax cost of investments | $272,378,130 | $265,710,159 | ||||
Gross tax unrealized appreciation | $24,399,938 | $25,198,043 | ||||
Gross tax unrealized depreciation | (475,291) | (681,176) | ||||
Net tax unrealized appreciation (depreciation) | 23,924,647 | 24,516,867 | ||||
Undistributed ordinary income | 1,432,454 | 355,469 | ||||
Undistributed long-term capital gains | 4,543 | 1,454,304 | ||||
Other accumulated gain (loss) | (209,999) | (472,689) | ||||
Distributable Earnings (accumulated deficit) | $25,151,645 | $25,853,951 | ||||
13 |
Period Ended September 30, 2024 | ||||||
Ordinary Income | Capital Gains | |||||
The Brinsmere Fund - Conservative ETF | $4,834,843 | $ — | ||||
The Brinsmere Fund - Growth ETF | $3,130,483 | $— | ||||
14 |
15 |

16 |
The Brinsmere Fund - Conservative ETF | 19.95% | ||
The Brinsmere Fund - Growth ETF | 56.84% | ||
The Brinsmere Fund - Conservative ETF | 3.09% | ||
The Brinsmere Fund - Growth ETF | 5.91% | ||
The Brinsmere Fund - Conservative ETF | 0.00% | ||
The Brinsmere Fund - Growth ETF | 0.00% | ||
17 |
| (b) | Financial Highlights are included within the financial statements filed under Item 7 of this Form. |
Item 8. Changes in and Disagreements with Accountants for Open-End Investment Companies.
There were no changes in or disagreements with accountants during the period covered by this report.
Item 9. Proxy Disclosure for Open-End Investment Companies.
There were no matters submitted to a vote of shareholders during the period covered by this report.
Item 10. Remuneration Paid to Directors, Officers, and Others of Open-End Investment Companies.
All fund expenses, including Trustee compensation is paid by the Investment Adviser pursuant to the Investment Advisory Agreement. Additional information related to those fees is available in the Funds’ Statement of Additional Information.
Item 11. Statement Regarding Basis for Approval of Investment Advisory Contract.
Not Applicable
Item 12. Disclosure of Proxy Voting Policies and Procedures for Closed-End Management Investment Companies.
Not applicable to open-end investment companies.
Item 13. Portfolio Managers of Closed-End Management Investment Companies.
Not applicable to open-end investment companies.
Item 14. Purchases of Equity Securities by Closed-End Management Investment Company and Affiliated Purchasers.
Not applicable to open-end investment companies.
Item 15. Submission of Matters to a Vote of Security Holders.
There have been no material changes to the procedures by which shareholders may recommend nominees to the registrant’s board of trustees.
Item 16. Controls and Procedures.
| (a) | The Registrant’s President (principal executive officer) and Treasurer (principal financial officer) have reviewed the Registrant’s disclosure controls and procedures (as defined in Rule 30a-3(c) under the Investment Company Act of 1940 (the “Act”)) as of a date within 90 days of the filing of this report, as required by Rule 30a-3(b) under the Act and Rules 13a-15(b) or 15d-15(b) under the Securities Exchange Act of 1934. Based on their review, such officers have concluded that the disclosure controls and procedures are effective in ensuring that information required to be disclosed in this report is appropriately recorded, processed, summarized and reported and made known to them by others within the Registrant and by the Registrant’s service provider. |
| (b) | There were no changes in the Registrant’s internal control over financial reporting (as defined in Rule 30a-3(d) under the Act) that occurred during the period covered by this report that have materially affected, or are reasonably likely to materially affect, the Registrant’s internal control over financial reporting. |
Item 17. Disclosure of Securities Lending Activities for Closed-End Management Investment Companies
Not applicable to open-end investment companies.
Item 18. Recovery of Erroneously Awarded Compensation.
(a) Not Applicable.
(b) Not Applicable.
Item 19. Exhibits.
(2) Any policy required by the listing standards adopted pursuant to Rule 10D-1 under the Exchange Act (17 CFR 240.10D-1) by the registered national securities exchange or registered national securities association upon which the registrant’s securities are listed. Not Applicable.
(4) Any written solicitation to purchase securities under Rule 23c-1 under the Act sent or given during the period covered by the report by or on behalf of the registrant to 10 or more persons. Not applicable to open-end investment companies.
(5) Change in the registrant’s independent public accountant. Not applicable to open-end investment companies and ETFs.
| (b) | Certifications pursuant to Section 906 of the Sarbanes-Oxley Act of 2002. Furnished herewith. |
SIGNATURES
Pursuant to the requirements of the Securities Exchange Act of 1934 and the Investment Company Act of 1940, the registrant has duly caused this report to be signed on its behalf by the undersigned, thereunto duly authorized.
| (Registrant) | ETF Series Solutions |
| By (Signature and Title)* | /s/ Kristina R. Nelson | ||
| Kristina R. Nelson, President (principal executive officer) |
| Date | 12/06/2024 |
Pursuant to the requirements of the Securities Exchange Act of 1934 and the Investment Company Act of 1940, this report has been signed below by the following persons on behalf of the registrant and in the capacities and on the dates indicated.
| By (Signature and Title)* | /s/ Kristina R. Nelson | ||
| Kristina R. Nelson, President (principal executive officer) |
| Date | 12/06/2024 |
| By (Signature and Title)* | /s/ Kristen M. Weitzel | ||
| Kristen M. Weitzel, Treasurer (principal financial officer) |
| Date | 12/06/2024 |
* Print the name and title of each signing officer under his or her signature.