UNITED STATES
SECURITIES AND EXCHANGE COMMISSION
Washington, D.C. 20549
FORM N-CSR
CERTIFIED SHAREHOLDER REPORT OF REGISTERED MANAGEMENT INVESTMENT COMPANIES
Investment Company Act file number 811-22668
ETF Series Solutions
(Exact name of registrant as specified in charter)
615 East Michigan Street
Milwaukee, WI 53202
(Address of principal executive offices) (Zip code)
Kristina R. Nelson
ETF Series Solutions
615 East Michigan Street
Milwaukee, WI 53202
(Name and address of agent for service)
(414) 765-6076
Registrant's telephone number, including area code
Date of fiscal year end: December 31
Date of reporting period: December 31, 2021
Item 1. Reports to Stockholders.
| (a) |

Annual Report
December 31, 2021
Defiance Quantum ETF
Ticker: QTUM
Defiance Next Gen Connectivity ETF
Ticker: FIVG
Defiance Next Gen SPAC Derived ETF
Ticker: SPAK
Defiance Next Gen H2 ETF
Ticker: HDRO
Defiance Next Gen Altered Experience ETF
Ticker: PSY
Defiance Hotel, Airline, and Cruise ETF
Ticker: CRUZ
Defiance Next Gen Big Data ETF
Ticker: BIGY
Defiance Digital Revolution ETF
Ticker: NFTZ
Defiance ETFs
TABLE OF CONTENTS
Page | |
Letters to Shareholders | 1 |
Fund Performance | 17 |
Portfolio Allocations | 25 |
Schedules of Investments | 29 |
Statements of Assets and Liabilities | 45 |
Statements of Operations | 47 |
Statements of Changes in Net Assets | 49 |
Financial Highlights | 57 |
Notes to Financial Statements | 65 |
Report of Independent Registered Public Accounting Firm | 78 |
Trustees and Officers | 80 |
Expense Examples | 82 |
Review of Liquidity Risk Management Program | 84 |
Approval of Advisory Agreements and Board Considerations | 85 |
Federal Tax Information | 88 |
Information About Portfolio Holdings | 88 |
Information About Proxy Voting | 89 |
Frequency Distribution of Premiums and Discounts | 89 |
Defiance Quantum ETF
Letters to Shareholders
(Unaudited)
Dear Shareholders,
On behalf of the entire team, we want to express our appreciation for the confidence you have placed in the Defiance Quantum ETF (“QTUM” or the “Fund”). The following information pertains to the fiscal period of January 1, 2021 through December 31, 2021 (the “current fiscal period”).
The Fund seeks to track the total return performance, before fees and expenses, of the BlueStar Quantum Computing and Machine Learning Index® (the “Index”). The Index is a rules-based index that tracks the performance of a group of globally-listed stocks of companies involved in a range of industries, collectively defined, by BlueStar Indexes, as quantum computing and machine learning companies. Index components are reviewed semi-annually for eligibility, and the weights are re-set accordingly.
The Fund had positive performance during the current fiscal period. The market price for QTUM increased 35.17% and the Net Asset Value (“NAV”) increased 35.27%, while the S&P 500®, a broad market index, increased 28.71% over the same period. The Fund’s Index increased 36.29%. Meanwhile, outstanding shares ended the period at 3,200,000.
For the current fiscal period, the largest positive contributor to return was Synaptics, Inc., adding 2.31% to the return of the Fund, gaining 200.32% with an average weighting of 1.88%. The second largest contributor to return was Ambarella, Inc., adding 1.69% to the return of the Fund, gaining 120.96% with an average weighting of 1.68%. The third largest contributor to return was NVIDIA Corporation, adding 1.48% to the return of the Fund, gaining 125.48% with an average weighting of 1.53%.
For the current fiscal period, the largest negative contributor to return was Alteryx, Inc. - Class A, detracting 0.91% from the return of the Fund, declining 50.32% with an average weighting of 1.12%. The security contributing second-most negatively was Atos SE, detracting 0.86% from the return of the Fund, and declining 52.72% with an average weighting of 1.03%. The third largest negative contributor to return was Alibaba Group Holding, Ltd. - ADR, detracting 0.75% from the return of the Fund, and declining 48.96% with an average weight of 1.07%.
We look forward to keeping you well informed as things progress.
Sincerely,
Matthew Bielski, Chief Executive Officer
Defiance ETFs LLC, Adviser to the Fund
Matthew Bielski is registered with Foreside Fund Services, LLC which is not affiliated with Defiance ETFs, LLC or its affiliates.
Important Disclosures:
Fund holdings and sector allocations are subject to change at any time and should not be considered recommendations to buy or sell any security.
The Fund’s investment objectives, risks, charges, and expenses must be considered carefully before investing. The prospectus contains this and other important information about the investment company. Please read it carefully before investing. A hard copy of the prospectus can be requested by calling 833.333.9383 or at defianceetfs.com.
Investing involves risk. Principal loss is possible. As an ETF, the Fund may trade at a premium or discount to NAV. Shares of any ETF are bought and sold at market price (not NAV) and are not individually redeemed from the Fund. The Fund is not actively managed and would not sell a security due to current or projected under performance unless that security is removed from the Index or is required upon a reconstitution of the Index. A portfolio concentrated in a single industry or country, may be subject to a higher degree of risk. The value of stocks of information technology companies are particularly vulnerable to rapid changes in technology product cycles, rapid product obsolescence, government regulation and competition. The Fund is considered to be non-diversified, so it may invest more of its assets in the securities of a single issuer or a smaller number of issuers. Investments in foreign securities involve certain risks including risk of loss due to foreign currency fluctuations or to political or economic instability. This risk is magnified in emerging markets. Small and mid-cap companies are subject to greater and more unpredictable price changes than securities of large-cap companies.
The possible applications of quantum computing are only in the exploration stages, and the possibility of returns is uncertain and may not be realized in the near future.
1
Defiance Quantum ETF
Letters to Shareholders
(Unaudited) (Continued)
The “BlueStar Quantum Computing and Machine Learning Index™”, “BQTUM™ Index” (collectively “Quantum Computing and Machine Learning Index”), is the exclusive property and a trademark of BlueStar Global Investors LLC d/b/a BlueStar Indexes® and has been licensed for use for certain purposes by Defiance ETFs LLC. Products based on the Quantum Computing and Machine Learning Index are not sponsored, endorsed, sold, or promoted by BlueStar Global Investors, LLC or BlueStar Indexes®, and BlueStar Global Investors, LLC and BlueStar Indexes® makes no representation regarding the advisability of trading in such product(s). It is not possible to invest directly in an index.
Total return represents changes to the NAV and accounts for distributions from the Fund.
Median 30-Day Spread is a calculation of Fund’s median bid-ask spread, expressed as a percentage rounded to the nearest hundredth, computed by: identifying the Fund’s national best bid and national best offer as of the end of each 10 second interval during each trading day of the last 30 calendar days; dividing the difference between each such bid and offer by the midpoint of the national best bid and national best offer; and identifying the median of those values.
Diversification does not ensure a profit nor protect against loss in a declining market.
Commissions may be charged on trades.
Go to defianceetfs.com/QTUM to read more about QTUM including current performance and holdings information. Fund holdings are subject to change and should not be considered recommendations to buy or sell any securities.
QTUM is distributed by Foreside Fund Services, LLC.
2
Defiance Next Gen Connectivity ETF
Letters to Shareholders
(Unaudited) (Continued)
Dear Shareholders,
On behalf of the entire team, we want to express our appreciation for the confidence you have placed in the Defiance Next Gen Connectivity ETF (“FIVG” or the “Fund”). The following information pertains to the fiscal period of January 1, 2021 through December 31, 2021 (the “current fiscal period”).
The Fund seeks to track the total return performance, before fees and expenses, of the BlueStar 5G Communications IndexTM (the “Index”). The Index is a rules-based index that tracks the performance of a group of US-listed stocks, of global companies that are involved in the development of, or are otherwise instrumental in the rollout of 5G networks. Index components are reviewed semi-annually for eligibility, and the weights are re-set accordingly.
The Fund had positive performance during the current fiscal period. The market price for FIVG increased 25.66% and the Net Asset Value (“NAV”) increased 25.63%, while the S&P 500®, a broad market index, increased 28.71% over the same period. The Fund’s Index increased 26.04%. Meanwhile, outstanding shares ended the period at 33,200,000.
For the current fiscal period, the largest positive contributor to return was Advanced Micro Devices, Inc., adding 3.88% to the return of the Fund, gaining 56.91% with an average weighting of 4.00%. The second largest contributor to return was NXP Semiconductors NV, adding 1.92% to the return of the Fund, gaining 44.84% with an average weighting of 4.35%. The third largest contributor to return was Marvell Technology Group, Ltd., adding 1.80% to the return of the Fund, gaining 84.62% with an average weighting of 2.37%.
For the current fiscal period, the largest negative contributor to return was Inseego Corporation, detracting 0.50% from the return of the Fund, declining 62.31% with an average weighting of 0.45%. The security contributing second-most negatively was GDS Holdings, Ltd. - ADR, detracting 0.34% from the return of the Fund, and declining 49.64% with an average weighting of 0.47%. The third largest negative contributor to return was T-Mobile US, Inc., detracting 0.31% from the return of the Fund, and declining 13.99% with an average weight of 2.24%.
We look forward to keeping you well informed as things progress.
Sincerely,
Matthew Bielski, Chief Executive Officer
Defiance ETFs LLC, Adviser to the Fund
Matthew Bielski is registered with Foreside Fund Services, LLC which is not affiliated with Defiance ETFs, LLC or its affiliates.
Important Disclosures:
Fund holdings and sector allocations are subject to change at any time and should not be considered recommendations to buy or sell any security.
The Fund’s investment objectives, risks, charges, and expenses must be considered carefully before investing. The prospectus contains this and other important information about the investment company. Please read carefully before investing. A hard copy of the prospectuses can be requested by calling 833.333.9383 or at defianceetfs.com.
Investing involves risk. Principal loss is possible. As an ETF, the Fund may trade at a premium or discount to NAV. Shares of any ETF are bought and sold at market price (not NAV) and are not individually redeemed from the Fund. The Fund is not actively managed and would not sell a security due to current or projected under performance unless that security is removed from the Index or is required upon a reconstitution of the Index. A portfolio concentrated in a single industry or country, may be subject to a higher degree of risk. The value of stocks of information technology companies are particularly vulnerable to rapid changes in technology product cycles, rapid product obsolescence, government regulation and competition. The Fund is considered to be non-diversified, so it may invest more of its assets in the securities of a single issuer or a smaller number of issuers. Investments in foreign securities involve certain risks including risk of loss due to foreign currency fluctuations or to political or economic instability. This risk is magnified in emerging markets. Small and mid-cap companies are subject to greater and more unpredictable price changes than securities of large-cap companies.
3
Defiance Next Gen Connectivity ETF
Letters to Shareholders
(Unaudited) (Continued)
The possible applications of 5G technologies are only in the exploration stages, and the possibility of returns is uncertain and may not be realized in the near future.
The “BlueStar 5G Communications Index™”, “BFIVGTR™ Index” (collectively “5G Communications Index”), is the exclusive property and a trademark of BlueStar Global Investors LLC d/b/a BlueStar Indexes® and has been licensed for use for certain purposes by Defiance ETFs LLC. Products based on the Global 5G Communications Index* are not sponsored, endorsed, sold or promoted by BlueStar Global Investors, LLC or BlueStar Indexes®, and BlueStar Global Investors, LLC and BlueStar Indexes® makes no representation regarding the advisability of trading in such product(s). It is not possible to invest directly in an index.
The Defiance Next Gen Connectivity ETF is the first ETF to emphasize securities whose products and services are predominantly tied to the development of 5G networking and communication technologies. The Fund does this by tracking The BlueStar 5G Communications Index. The Fund attempts to invest all, or substantially all, of its assets in the component securities that make up the Index.
Total return represents changes to the NAV and accounts for distributions from the Fund.
Median 30-Day Spread is a calculation of Fund’s median bid-ask spread, expressed as a percentage rounded to the nearest hundredth, computed by: identifying the Fund’s national best bid and national best offer as of the end of each 10 second interval during each trading day of the last 30 calendar days; dividing the difference between each such bid and offer by the midpoint of the national best bid and national best offer; and identifying the median of those values.
Diversification does not ensure a profit nor protect against loss in a declining market.
Commissions may be charged on trades.
Go to defianceetfs.com/FIVG to read more about FIVG including current performance and holdings information. Fund holdings are subject to change and should not be considered recommendations to buy or sell any securities.
FIVG is distributed by Foreside Fund Services, LLC.
4
Defiance Next Gen SPAC Derived ETF
Letters to Shareholders
(Unaudited) (Continued)
Dear Shareholders,
On behalf of the entire team, we want to express our appreciation for the confidence you have placed in the Defiance Next Gen SPAC Derived ETF (“SPAK” or the “Fund”). The following information pertains to the fiscal period of January 1, 2021 through December 31, 2021 (the “current fiscal period”).
The Fund seeks to track the total return performance, before fees and expenses, of the Indxx SPAC & NextGen IPO Index (the “Index”). The Index is a passive rules-based index that tracks the performance of the common stock of newly listed Special Purpose Acquisition Companies (“SPACs”), ex-warrants, and initial public offerings (“IPOs”) derived from Acquisition Companies.
The Fund had negative performance during the current fiscal period. The market price for SPAK decreased 24.83% and the Net Asset Value (“NAV”) decreased 24.72%, while the S&P 500®, a broad market index, increased 28.71% over the same period. The Fund’s Index decreased 24.32%. Meanwhile, outstanding shares ended the period at 1,325,000.
For the current fiscal period, the largest positive contributor to return was Lucid Group, Inc., adding 4.10% to the return of the Fund, gaining 242.54% with an average weighting of 4.95%. The second largest contributor to return was Virgin Galactic Holdings, Inc., adding 2.27% to the return of the Fund, declining 43.62% with an average weighting of 1.96%. The third largest contributor to return was Vertiv Holdings Company, adding 1.00% to the return of the Fund, gaining 33.80% with an average weighting of 2.56%.
For the current fiscal period, the largest negative contributor to return was Opendoor Technologies, Inc., detracting 1.85% from the return of the Fund, declining 35.72% with an average weighting of 3.49%. The security contributing second-most negatively was Paysafe, Ltd., detracting 1.43% from the return of the Fund, and declining 72.94% with an average weighting of 1.53%. The third largest negative contributor to return was Skillz, Inc., detracting 1.15% from the return of the Fund, and declining 62.80% with an average weight of 1.33%.
We look forward to keeping you well informed as things progress.
Sincerely,
Matthew Bielski, Chief Executive Officer
Defiance ETFs LLC, Adviser to the Fund
Matthew Bielski is registered with Foreside Fund Services, LLC which is not affiliated with Defiance ETFs, LLC or its affiliates.
Important Disclosures:
Fund holdings and sector allocations are subject to change at any time and should not be considered recommendations to buy or sell any security.
The Fund’s investment objectives, risks, charges, and expenses must be considered carefully before investing. The prospectus contains this and other important information about the investment company. Please read carefully before investing. A hard copy of the prospectuses can be requested by calling 833.333.9383 or at defianceetfs.com.
Investing involves risk. Principal loss is possible. As an ETF, the Fund may trade at a premium or discount to NAV. Shares of any ETF are bought and sold at market price (not NAV) and are not individually redeemed from the Fund. Brokerage commissions will reduce returns. The Fund is not actively managed and would not sell a security due to current or projected under performance unless that security is removed from the Index or is required upon a reconstitution of the Index. A portfolio concentrated in a single industry or country, may be subject to a higher degree of risk. The Fund is considered to be non-diversified, so it may invest more of its assets in the securities of a single issuer or a smaller number of issuers. Small and mid-cap companies are subject to greater and more unpredictable price changes than securities of large-cap companies.
The Fund invests in equity securities of SPACs, which raise assets to seek potential acquisition opportunities. Unless and until an acquisition is completed, a SPAC generally invests its assets in U.S. government securities, money market securities, and cash. There is no guarantee that the SPACs in which the Fund invests will complete an acquisition or that any acquisitions that are completed will be profitable. Investors who purchase SPAC shares in the secondary market after an acquisition announcement may suffer a loss if the value of the shares subsequently declines. Because SPACs have no operating history or ongoing business
5
Defiance Next Gen SPAC Derived ETF
Letters to Shareholders
(Unaudited) (Continued)
other than seeking acquisitions, the value of their securities is particularly dependent on the ability of the entity’s management to identify and complete a profitable acquisition. The potential risk of SPAC managers who are inexperienced or unqualified can be made more pronounced by this lack of any operating history or past performance of the SPAC.
Public stockholders of SPACs may not be afforded a meaningful opportunity to vote on a proposed initial business combination because certain stockholders, including stockholders affiliated with the management of the SPAC, may have sufficient voting power, and a financial incentive, to approve such a transaction without support from public stockholders. As a result, a SPAC may complete a business combination even though a majority of its public stockholders do not support such a combination. Some SPACs may pursue acquisitions only within certain industries or regions, which may increase the volatility of their prices.
The Fund invests in companies that have recently completed an IPO or are derived from a SPAC. These companies may be unseasoned and lack a trading history, a track record of reporting to investors, and widely available research coverage. IPOs are thus often subject to extreme price volatility and speculative trading. These stocks may have above-average price appreciation in connection with the IPO prior to inclusion in the Index. The price of stocks included in the Index may not continue to appreciate and the performance of these stocks may not replicate the performance exhibited in the past. In addition, IPOs may share similar illiquidity risks of private equity and venture capital. The free float shares held by the public in an IPO are typically a small percentage of the market capitalization. The ownership of many IPOs often includes large holdings by venture capital and private equity investors who seek to sell their shares in the public market in the months following an IPO when shares restricted by lock-up are released, causing greater volatility and possible downward pressure during the time that locked-up shares are released.
SPAK is new with a limited operating history.
Alpha is a measure of the active return on an investment compared with a suitable market index.
Total return represents changes to the NAV and accounts for distributions from the Fund.
Median 30-Day Spread is a calculation of a Fund’s median bid-ask spread, expressed as a percentage rounded to the nearest hundredth, computed by: identifying the Fund’s national best bid and national best offer as of the end of each 10 second interval during each trading day of the last 30 calendar days; dividing the difference between each such bid and offer by the midpoint of the national best bid and national best offer; and identifying the median of those values.
Diversification does not ensure a profit nor protect against loss in a declining market.
Commissions may be charged on trades.
Go to defianceetfs.com/SPAK to read more about SPAK including current performance and holdings information. Fund holdings are subject to change and should not be considered recommendations to buy or sell any securities.
SPAK is distributed by Foreside Fund Services, LLC
6
Defiance Next Gen H2 ETF
Letters to Shareholders
(Unaudited) (Continued)
Dear Shareholders,
On behalf of the entire team, we want to express our appreciation for the confidence you have placed in the Defiance Next Gen H2 ETF (“HDRO” or the “Fund”). The following information pertains to the period from inception on March 9, 2021 through December 31, 2021 (the “current fiscal period”).
The Fund seeks to track the total return performance, before fees and expenses, of the BlueStar Hydrogen & Next Gen Fuel Cell Index (the “Index”). The index is a rules-based index that tracks the performance of a group of globally listed equities and of companies involved in the development of hydrogen-based energy sources and fuel cell technologies. Index components are reviewed quarterly for eligibility, and the weights are re-set accordingly.
The Fund had negative performance during the current fiscal period. The market price for HDRO decreased 29.59% and the Net Asset Value (“NAV”) decreased 29.68%, while the S&P 500®, a broad market index, increased 24.38% over the same period. The Fund’s Index decreased 28.76%. Meanwhile, outstanding shares ended the period at 3,450,000.
For the current fiscal period, the largest positive contributor to return was Linde plc, adding 0.98% to the return of the Fund, gaining 31.74% with an average weighting of 4.46%. The second largest contributor to return was Air Liquide SA, adding 0.60% to the return of the Fund, gaining 16.24% with an average weighting of 1.80%. The third largest contributor to return was SFC Energy AG, adding 0.59% to the return of the Fund, gaining 12.43% with an average weighting of 3.50%.
For the period, the largest negative contributor to return was FuelCell Energy, Inc., detracting 4.62% from the return of the Fund, declining 68.06% with an average weighting of 5.40%. The security contributing second-most negatively was Plug Power, Inc., detracting 3.45% from the return of the Fund, and declining 34.09% with an average weighting of 10.05%. The third largest negative contributor to return was NEL ASA, detracting 2.39% from the return of the Fund, and declining 38.40% with an average weight of 5.77%.
We look forward to keeping you well informed as things progress.
Sincerely,
Matthew Bielski, Chief Executive Officer
Defiance ETFs LLC, Adviser to the Fund
Matthew Bielski is registered with Foreside Fund Services, LLC which is not affiliated with Defiance ETFs, LLC or its affiliates.
Important Disclosures:
Fund holdings and sector allocations are subject to change at any time and should not be considered recommendations to buy or sell any security.
The Fund’s investment objectives, risks, charges, and expenses must be considered carefully before investing. The prospectus contains this and other important information about the investment company. Please read carefully before investing. A hard copy of the prospectuses can be requested by calling 833.333.9383 or at defianceetfs.com.
Investing involves risk. Principal loss is possible. As an ETF, the Fund may trade at a premium or discount to NAV. Shares of any ETF are bought and sold at market price (not NAV) and are not individually redeemed from the Fund. The Fund is not actively managed and would not sell a security due to current or projected under-performance unless that security is removed from the Index or is required upon a reconstitution of the Index. A portfolio concentrated in a single industry or country, may be subject to a higher degree of risk. Specifically, the Index (and as a result, the Fund) is expected to be concentrated in hydrogen and fuel cell companies. Such companies may depend largely on the availability of hydrogen gas, certain third-party key suppliers for components in their products, and a small number of customers for a significant portion of their business. The Fund is considered to be non-diversified, so it may invest more of its assets in the securities of a single issuer or a smaller number of issuers. Investments in foreign securities involve certain risks including risk of loss due to foreign currency fluctuations or to political or economic instability. This risk is magnified in emerging markets. Small and mid-cap companies are subject to greater and more unpredictable price changes than securities of large-cap companies.
7
Defiance Next Gen H2 ETF
Letters to Shareholders
(Unaudited) (Continued)
The BlueStar Hydrogen & Next Gen Fuel Cell Index is the exclusive property and a trademark of BlueStar Global Investors LLC d/b/a BlueStar Indexes® and has been licensed for use for certain purposes by Defiance ETFs LLC. Products based on the Global Hydrogen & Next Gen Fuel Cell Index are not sponsored, endorsed, sold or promoted by BlueStar Global Investors, LLC or BlueStar Indexes®, and BlueStar Global Investors, LLC and BlueStar Indexes® makes no representation regarding the advisability of trading in such product(s).
HDRO is new with a limited operating history.
Total return represents changes to the NAV and accounts for distributions from the Fund.
Median 30-Day Spread is a calculation of a Fund’s median bid-ask spread, expressed as a percentage rounded to the nearest hundredth, computed by: identifying the Fund’s national best bid and national best offer as of the end of each 10 second interval during each trading day of the last 30 calendar days; dividing the difference between each such bid and offer by the midpoint of the national best bid and national best offer; and identifying the median of those values.
Commissions may be charged on trades.
Go to defianceetfs.com/HDRO to read more about HDRO including current performance and holdings information. Fund holdings are subject to change and should not be considered recommendations to buy or sell any securities.
HDRO is distributed by Foreside Fund Services, LLC
8
Defiance Next Gen Altered Experience ETF
Letters to Shareholders
(Unaudited) (Continued)
Dear Shareholders,
On behalf of the entire team, we want to express our appreciation for the confidence you have placed in the Defiance Next Gen Altered Experience ETF (“PSY” or the “Fund”). The following information pertains to the period from inception on May 27, 2021 through December 31, 2021 (the “current fiscal period”).
The Fund seeks to track the total return performance, before fees and expenses, of the BITA Medical Psychedelics, Cannabis, and Ketamine Index (the “Index”). The Index is a passive rules-based index that tracks the performance of public listed life sciences companies on North American Exchanges conducting federally legal medical activities in the Psychedelic, Medical cannabis, Hemp and CBD industries.
The Fund had negative performance during the current fiscal period. The market price for PSY decreased 52.36% and the Net Asset Value (“NAV”) decreased 52.43%, while the S&P 500®, a broad market index, increased 14.38% over the same period. The Fund’s Index decreased 52.63%. Meanwhile, outstanding shares ended the period at 700,000.
For the current fiscal period, the largest positive contributor to return was GH Research plc, adding 1.78% to the return of the Fund, gaining 43.14% with an average weighting of 4.86%. The second largest contributor to return was Cybin, Inc., adding 0.86% to the return of the Fund, gaining 23.41% with an average weighting of 4.66%. The third largest contributor to return was Cardiol Therapeutics, Inc. - Class A, adding 0.51% to the return of the Fund, gaining 9.94% with an average weighting of 5.48%.
For the current fiscal period, the largest negative contributor to return was Charlottes Web Holdings, Inc., detracting 5.35% from the return of the Fund, declining 79.92% with an average weighting of 4.86%. The security contributing second-most negatively was Corbus Pharmaceuticals Holdings, Inc., detracting 3.90% from the return of the Fund, and declining 71.63% with an average weighting of 4.45%. The third largest negative contributor to return was Neptune Wellness Solutions, Inc., detracting 3.42% from the return of the Fund, and declining 63.00% with an average weight of 4.51%.
We look forward to keeping you well informed as things progress.
Sincerely,
Matthew Bielski, Chief Executive Officer
Defiance ETFs LLC, Adviser to the Fund
Matthew Bielski is registered with Foreside Fund Services, LLC which is not affiliated with Defiance ETFs, LLC or its affiliates.
Important Disclosures:
Fund holdings and sector allocations are subject to change at any time and should not be considered recommendations to buy or sell any security.
The Fund’s investment objectives, risks, charges, and expenses must be considered carefully before investing. The prospectus contains this and other important information about the investment company. Please read carefully before investing. A hard copy of the prospectuses can be requested by calling 833.333.9383 or at defianceetfs.com.
Investing involves risk. Principal loss is possible. As an ETF, the Fund may trade at a premium or discount to NAV. Shares of any ETF are bought and sold at market price (not NAV) and are not individually redeemed from the Fund. The Fund is not actively managed and would not sell a security due to current or projected under-performance unless that security is removed from the Index or is required upon a reconstitution of the Index.
A portfolio concentrated in a single industry or country, may be subject to a higher degree of risk. Specifically, the Index (and as a result, the Fund) is expected to be concentrated in Psychedelics Healthcare and Medical Cannabis companies. Such companies may depend largely on the government regulation and their profitability can be significantly affected by restriction on government reimbursements for medical expenses, rising costs of products and services, pricing pressure, limited product lines, intellectual property rights, and long and costly government product approval processes. The investments rely on U.S. and Canadian regulation of psychedelic, healthcare and cannabis, and the Fund could be adversely affected by changes in these regulations.
9
Defiance Next Gen Altered Experience ETF
Letters to Shareholders
(Unaudited) (Continued)
The Fund will not invest directly in or hold ownership in any companies that engage in cannabis- or psychedelics-related business unless permitted by national and local laws of the relevant jurisdiction, including U.S. federal and state laws. Accordingly, the Fund does not currently invest (directly or indirectly) in companies located in the United States if their cannabis- or psychedelics-related business activities are illegal under U.S. federal law, even if such activities are legal under state law. In the United States and Canada, the medical and recreational use of certain psychedelic drugs, including psilocybin, is currently illegal. There is no guarantee that psychedelic drugs or psychedelic inspired drugs will ever be approved as medicines in either jurisdiction.
The Fund is considered to be non-diversified, so it may invest more of its assets in the securities of a single issuer or a smaller number of issuers. Investments in foreign securities involve certain risks including risk of loss due to foreign currency fluctuations or to political or economic instability. Small and mid-cap companies are subject to greater and more unpredictable price changes than securities of large-cap companies.
PSY is new with a limited operating history.
Total return represents changes to the NAV and accounts for distributions from the Fund.
Median 30-Day Spread is a calculation of a Fund’s median bid-ask spread, expressed as a percentage rounded to the nearest hundredth, computed by: identifying the Fund’s national best bid and national best offer as of the end of each 10 second interval during each trading day of the last 30 calendar days; dividing the difference between each such bid and offer by the midpoint of the national best bid and national best offer; and identifying the median of those values.
The BITA Medical Psychedelics, Cannabis, and Ketamine Index is owned, calculated, administered and disseminated by BITA GmbH. It is not possible to invest directly in an index.
Commissions may be charged on trades.
Go to defianceetfs.com/PSY to read more about CRUZ including current performance and holdings information. Fund holdings are subject to change and should not be considered recommendations to buy or sell any securities.
PSY is distributed by Foreside Fund Services, LLC.
10
Defiance Hotel, Airline, and Cruise ETF
Letters to Shareholders
(Unaudited) (Continued)
Dear Shareholders,
On behalf of the entire team, we want to express our appreciation for the confidence you have placed in the Defiance Hotel, Airline and Cruise ETF (“CRUZ” or the “Fund”). The following information pertains to the period from inception on June 3, 2021 through December 31, 2021 (the “current fiscal period”).
The Fund seeks to track the total return performance, before fees and expenses, of the BlueStar Global Hotels, Airlines, and Cruises Index (the “Index”). The Index is a rules-based weighted index of companies primarily engaged in the passenger airline, hotel, and cruise industries. The Index is reconstituted on a semi-annual basis and rebalanced quarterly.
The Fund had negative performance during the current fiscal period. The market price for CRUZ decreased 12.82% and the Net Asset Value (“NAV”) decreased 13.12%, while the S&P 500®, a broad market index, increased 14.55% over the same period. The Fund’s Index decreased 13.07%. Meanwhile, outstanding shares ended the period at 1,075,000.
For the current fiscal period, the largest positive contributor to return was Hilton Worldwide Holdings, Inc., adding 1.52% to the return of the Fund, gaining 25.04% with an average weighting of 7.21%. The second largest contributor to return was Marriot International, Inc. - Class A, adding 1.15% to the return of the Fund, gaining 16.32% with an average weighting of 8.71%. The third largest contributor to return was China Airlines, Ltd., adding 0.30% to the return of the Fund, gaining 64.31% with an average weighting of 0.28%.
For the current fiscal period, the largest negative contributor to return was Carnival Corporation, detracting 2.33% from the return of the Fund, declining 34.12% with an average weighting of 6.13%. The security contributing second-most negatively was Southwest Airlines Company, detracting 1.52% from the return of the Fund, and declining 26.83% with an average weighting of 5.59%. The third largest negative contributor to return was Norwegian Cruise Line Holdings, Ltd., detracting 1.13% from the return of the Fund, and declining 35.43% with an average weight of 2.87%.
We look forward to keeping you well informed as things progress.
Sincerely,
Matthew Bielski, Chief Executive Officer
Defiance ETFs LLC, Adviser to the Fund
Matthew Bielski is registered with Foreside Fund Services, LLC which is not affiliated with Defiance ETFs, LLC or its affiliates.
Important Disclosures:
Fund holdings and sector allocations are subject to change at any time and should not be considered recommendations to buy or sell any security.
The Fund’s investment objectives, risks, charges, and expenses must be considered carefully before investing. The prospectus contains this and other important information about the investment company. Please read it carefully before investing. A hard copy of the prospectus can be requested by calling 833.333.9383 or at defianceetfs.com.
Investing involves risk. Principal loss is possible. As an ETF, the Fund may trade at a premium or discount to NAV. Shares of any ETF are bought and sold at market price (not NAV) and are not individually redeemed from the Fund. Brokerage commissions will reduce returns. The Fund is not actively managed and would not sell a security due to current or projected under-performance unless that security is removed from the Index or is required upon a reconstitution of the Index.
A portfolio concentrated in a single industry or country, may be subject to a higher degree of risk. Specifically, the Index (and as a result, the Fund) is expected to be concentrated in passenger airline, hotel and resort, and cruise industries (“Travel Companies”). Travel Company revenues are heavily influenced by the condition of the U.S. and foreign economies and may be adversely affected by a downturn in economic conditions that can result in decreased demand for leisure and business travel. Travel Companies may be significantly affected by uncertainty in travel, including guest safety, security and privacy, changes in labor relations and insurance costs, issues affecting equipment reliability and longevity, changes in fuel prices, and shortages of experienced personnel.
11
Defiance Hotel, Airline, and Cruise ETF
Letters to Shareholders
(Unaudited) (Continued)
Beginning in the first quarter of 2020, financial markets in the United States and around the world experienced extreme volatility and severe losses due to the global pandemic caused by COVID-19, a novel coronavirus. The pandemic has resulted in a wide range of social and economic disruptions, including closed borders and reduced or prohibited domestic or international travel. Some sectors of the economy and individual issuers, including Travel Companies, have experienced particularly large losses. Such disruptions may continue for an extended period of time or reoccur in the future to a similar or greater extent.
The Fund is considered to be non-diversified, so it may invest more of its assets in the securities of a single issuer or a smaller number of issuers. To the extent the Fund is invested in companies of a single country or region, local political and economic conditions and changes in regulatory, tax, or economic policy could significantly affect the market in that country and in surrounding or related countries and have a negative impact on the Fund’s performance. Investments in foreign securities involve certain risks including risk of loss due to foreign currency fluctuations or to political or economic instability, and these risks are magnified in emerging markets. Small and mid-cap companies are subject to greater and more unpredictable price changes than securities of large-cap companies.
The BlueStar Global Hotels, Airlines, and Cruises Index (the “Index”) is a rules-based index that consists of globally-listed stocks of companies that derive at least 50% of their revenues from the passenger airline, hotel and resort, or cruise industries (“Travel Companies”) as determined by MV Index Solutions. The Index is a registered trademark of MV Index Solutions and is protected through various intellectual property rights and unfair competition and misappropriation laws and has been licensed for use for certain purposes by Defiance ETFs LLC. Products based on the Index are not sponsored, endorsed, sold or promoted by MV Index Solutions, no representation is made regarding the advisability of trading in such product(s). It is not possible to invest directly in an index.
CRUZ is new with a limited operating history.
Go to defianceetfs.com/CRUZ to read more about CRUZ including current performance and holdings information. Fund holdings are subject to change and should not be considered recommendations to buy or sell any securities.
CRUZ is distributed by Foreside Fund Services, LLC.
12
Defiance Next Gen Big Data ETF
Letters to Shareholders
(Unaudited) (Continued)
Dear Shareholders,
On behalf of the entire team, we want to express our appreciation for the confidence you have placed in the Defiance Next Gen Big Data ETF (“BIGY” or the “Fund”). The following information pertains to the period from inception on July 13, 2021 through December 31, 2021 (the “current fiscal period”).
The Fund seeks to track the total return performance, before fees and expenses, of the BlueStar Big Data & Analytics Index (the “Index”). The index is a rules-based index that tracks the performance of tracks the performance of companies that are involved in the Big Data industry. Index components are reviewed semi-annually for eligibility, and the weights are re-set accordingly.
The Fund had negative performance during the current fiscal period. The market price for BIGY decreased 4.53% and the Net Asset Value (“NAV”) decreased 4.74%, while the S&P 500®, a broad market index, increased 9.79% over the same period. The Fund’s Index decreased 4.94%. Meanwhile, outstanding shares ended the period at 100,000.
For the current fiscal period, the largest positive contributor to return was New Relic, Inc. adding 1.89% to the return of the Fund, gaining 69.90% with an average weighting of 4.11%. The second largest contributor to return was MongoDB, Inc., adding 1.71% to the return of the Fund, gaining 56.08% with an average weighting of 4.40%. The third largest contributor to return was Perficient, Inc., adding 1.71% to the return of the Fund, gaining 54.34% with an average weighting of 5.00%.
For the current fiscal period, the largest negative contributor to return was Domo, Inc. - Class B, detracting 1.54% from the return of the Fund, declining 39.70% with an average weighting of 3.74%. The security contributing second-most negatively was Appian Corporation, detracting 1.42% from the return of the Fund, and declining 44.86% with an average weighting of 2.78%. The third largest negative contributor to return was Twilio, Inc. - Class A, detracting 1.11% from the return of the Fund, and declining 29.84% with an average weight of 3.43%.
We look forward to keeping you well informed as things progress.
Sincerely,
Matthew Bielski, Chief Executive Officer
Defiance ETFs LLC, Adviser to the Fund
Matthew Bielski is registered with Foreside Fund Services, LLC which is not affiliated with Defiance ETFs, LLC or its affiliates.
Important Disclosures:
Fund holdings and sector allocations are subject to change at any time and should not be considered recommendations to buy or sell any security.
The Fund’s investment objectives, risks, charges, and expenses must be considered carefully before investing. The prospectus contains this and other important information about the investment company. Please read it carefully before investing. A hard copy of the prospectus can be requested by calling 833.333.9383 or at defianceetfs.com.
Investing involves risk. Principal loss is possible. As an ETF, the Fund may trade at a premium or discount to NAV. Shares of any ETF are bought and sold at market price (not NAV) and are not individually redeemed from the Fund. The Fund is not actively managed and would not sell a security due to current or projected under-performance unless that security is removed from the Index or is required upon a reconstitution of the Index.
A portfolio concentrated in a limited number of industries or sectors may be subject to a higher degree of risk. Specifically, the Index (and as a result, the Fund) is expected to be concentrated in the equity securities of companies involved with solutions for the creation, management, analysis, storage, or transmission of large sets of data (“Big Data Companies”). Risks associated with Big Data Companies include small or limited markets for such products or services, rapid changes in technology product business cycles, technological progress, rapid obsolescence, and government regulation.
Securities of Big Data Companies tend to be more volatile than securities of companies that do not rely heavily on technology, and rapid change to technologies that affect a company’s products could have a material adverse effect on such company’s operating results. While Big Data Companies may rely on a combination of patents, copyrights, trademarks, and trade secret laws
13
Defiance Next Gen Big Data ETF
Letters to Shareholders
(Unaudited) (Continued)
to establish and protect their proprietary product rights, there can be no assurance that these steps will be adequate to prevent the misappropriation of their technology or that competitors will not independently develop technologies that are substantially equivalent or superior to such companies’ technology.
The Fund is considered to be non-diversified, so it may invest more of its assets in the securities of a single issuer or a smaller number of issuers and will therefore be more exposed to risks associated with these issuers that a fund that invests more widely. Foreign securities have additional risk, including but not limited to, exchange rate changes and volatility, political and economic upheaval, and differences in accounting methods. Small and mid-cap companies are subject to greater and more unpredictable price changes than securities of large-cap companies.
The BlueStar Big Data & Analytics Index (the “Index”) is a rules-based index that consists of globally-listed stocks and depositary receipts of companies that, at the time of being added to the Index, derive at least 50% of their revenues or operating activity from solutions for the creation, management, analysis, storage, or transmission of large sets of data (“big data”) (“Big Data Companies”) as determined by MV Index Solutions (the “Index Provider”). The Index is owned and maintained by the Index Provider, who partnered with the Fund’s investment adviser to co-develop the methodology used to determine the securities included in the Index. The Index Provider is not affiliated with the Fund or its investment adviser, sub-adviser, or distributor, and does not sponsor, endorse, sell, or promote products based on the Index. It is not possible to invest directly in an index.
BIGY is new with a limited operating history.
Go to defianceetfs.com/BIGY to read more about BIGY including current performance and holdings information. Fund holdings are subject to change and should not be considered recommendations to buy or sell any securities.
BIGY is distributed by Foreside Fund Services, LLC.
14
Defiance Digital Revolution ETF
Letters to Shareholders
(Unaudited) (Continued)
Dear Shareholders,
On behalf of the entire team, we want to express our appreciation for the confidence you have placed in the Defiance Digital Revolution ETF (“NFTZ” or the “Fund”). The following information pertains to the period from inception on December 1, 2021 through December 31, 2021 (the “current fiscal period”).
The Fund seeks to track the total return performance, before fees and expenses, The BITA NFT and Blockchain Select Index (the “Index”). The Index aims to track the performance of a portfolio of publicly listed companies with relevant thematic exposure to the NFT (Non-Fungible Tokens), blockchain and cryptocurrency ecosystems. The index is rebalanced on a quarterly basis.
The Fund had negative performance during the current fiscal period. The market price for NFTZ decreased 23.75% and the Net Asset Value (“NAV”) decreased 23.93%, while the S&P 500®, a broad market index, increased 5.72% over the same period. The Fund’s Index decreased 24.00%. Meanwhile, outstanding shares ended the period at 540,000.
For the current fiscal period, the largest positive contributor to return was Funko, Inc. - Class A adding 0.36% to the return of the Fund, gaining 15.83% with an average weighting of 3.02%. The second largest contributor to return was SBI Holdings, Inc., adding 0.18% to the return of the Fund, gaining 6.25% with an average weighting of 4.81%. The third largest contributor to return was Ether Capital Corporation, adding 0.03% to the return of the Fund, gaining 4.93% with an average weighting of 0.32%.
For the current fiscal period, the largest negative contributor to return was Silvergate Capital Corporation - Class A, detracting 1.74% from the return of the Fund, declining 23.71% with an average weighting of 5.18%. The security contributing second-most negatively was Cleanspark, Inc., detracting 1.58% from the return of the Fund, and declining 40.57% with an average weighting of 3.28%. The third largest negative contributor to return was Marathon Digital Holdings, Inc., detracting 1.58% from the return of the Fund, and declining 33.03% with an average weight of 4.11%.
We look forward to keeping you well informed as things progress.
Sincerely,
Matthew Bielski, Chief Executive Officer
Defiance ETFs LLC, Adviser to the Fund
Matthew Bielski is registered with Foreside Fund Services, LLC which is not affiliated with Defiance ETFs, LLC or its affiliates.
Important Disclosures:
Fund holdings and sector allocations are subject to change at any time and should not be considered recommendations to buy or sell any security.
The Fund’s investment objectives, risks, charges, and expenses must be considered carefully before investing. The prospectus contains this and other important information about the investment company. Please read carefully before investing. A hard copy of the prospectuses can be requested by calling 833.333.9383 or at defianceetfs.com.
Investing involves risk. Principal loss is possible. As an ETF, the Fund may trade at a premium or discount to NAV. Shares of any ETF are bought and sold at market price (not NAV) and are not individually redeemed from the Fund. The Fund is not actively managed and would not sell a security due to current or projected under-performance unless that security is removed from the Index or is required upon a reconstitution of the Index.
The Index, and consequently the Fund, is expected to concentrate its investments (i.e., hold more than 25% of its total assets) in the securities of Crypto and Blockchain Companies. As a result, the value of the Fund’s shares may rise and fall more than the value of shares of a fund that invests in securities of companies in a broader range of industries.
The mechanics of using blockchain technology to transact in digital or other types of assets, such as securities or derivatives, is relatively new and untested. There is no assurance that widespread adoption will occur. A lack of expansion in the usage of blockchain technology could adversely affect Crypto and Blockchain Companies. Transacting on a blockchain depends in part specifically on the use of cryptographic keys that are required to access a user’s account (or “wallet”). The theft, loss, or destruction of these keys could adversely affect a user’s ownership claims over an asset or a company’s business or operations if it was dependent on the blockchain.
15
Defiance Digital Revolution ETF
Letters to Shareholders
(Unaudited) (Continued)
The Fund is considered to be non-diversified, which means that it may invest more of its assets in the securities of a single issuer or a smaller number of issuers than if it were a diversified fund. As a result, the Fund may be more exposed to the risks associated with and developments affecting an individual issuer or a smaller number of issuers than a fund that invests more widely. This may increase the Fund’s volatility and cause the performance of a relatively smaller number of issuers to have a greater impact on the Fund’s performance.
Investments in non-U.S. securities involve certain risks that may not be present with investments in U.S. securities. For example, investments in non-U.S. securities may be subject to risk of loss due to foreign currency fluctuations or to political or economic instability. There may be less information publicly available about a non-U.S. issuer than a U.S. issuer.
The BITA NFT and Blockchain Select Index is a rules-based index that consists of the common stock (or depositary receipts) of companies that are building a platform for developing technology to use, or have at least one use or test case for using, NFT (Non-Fungible Token), cryptocurrency trading platforms, cryptocurrency mining, cryptocurrency banking or related services, or blockchain-related technology, as well as companies that have announced publicly that they intend to enter such space or have begun working on such products (collectively, “Crypto and Blockchain Companies”). The Index consists of companies listed on North American and European exchanges and aims to capture the potential upside generated by earnings related to the adoption of crypto- and blockchain-related technologies, including NFTs and cryptocurrency.
Neither the Fund nor its relative Index will invest directly in NFTs or any funds investing in NFTs. The Index, and as a result the Fund, are currently limited to investments in companies with exposure to the NFT ecosystem. As a result, the Fund’s price movement will not track individual or collections of NFTs. Since NFTs are an emerging technology, the Index is currently expected to consist of companies whose activities in the NFT ecosystem comprise a smaller portion of their revenues, profits, or investments relative to other activities or industries in which they engage. There can be no guarantee that a company’s activities in the NFT ecosystem will become significant for the company or that its economic fortunes will be tied to such activities in the future.
NFTZ is new with a limited operating history.
Go to defianceetfs.com/NFTZ to read more about NFT including current performance and holdings information. Fund holdings are subject to change and should not be considered recommendations to buy or sell any securities.
NFTZ is distributed by Foreside Fund Services, LLC.
16
Defiance Quantum ETF
Performance Summary
(Unaudited)
Growth of $10,000

Average Annual Returns | One Year | Three Years | Since Inception |
Defiance Quantum ETF - NAV | 35.27% | 41.73% | 28.10% |
Defiance Quantum ETF - Market | 35.17% | 41.67% | 28.13% |
BlueStar Quantum Computing and Machine Learning Index® | 36.29% | 42.56% | 28.81% |
S&P 500® Index | 28.71% | 26.07% | 18.25% |
This chart illustrates the performance of a hypothetical $10,000 investment made on September 4, 2018, and is not intended to imply any future performance. The returns shown do not reflect the deduction of taxes that a shareholder would pay on Fund distributions or the redemption of Fund shares. The chart assumes reinvestment of capital gains and dividends.
17
Defiance Next Gen Connectivity ETF
Performance Summary
(Unaudited)
Growth of $10,000

Average Annual Returns | One Year | Since Inception |
Defiance Next Gen Connectivity ETF - NAV | 25.63% | 21.20% |
Defiance Next Gen Connectivity ETF - Market | 25.66% | 21.21% |
BlueStar 5G Communications IndexTM | 26.04% | 21.62% |
S&P 500® Index | 28.71% | 22.91% |
This chart illustrates the performance of a hypothetical $10,000 investment made on March 4, 2019, and is not intended to imply any future performance. The returns shown do not reflect the deduction of taxes that a shareholder would pay on Fund distributions or the redemption of Fund shares. The chart assumes reinvestment of capital gains and dividends.
18
Defiance Next Gen SPAC Derived ETF
Performance Summary
(Unaudited)
Growth of $10,000
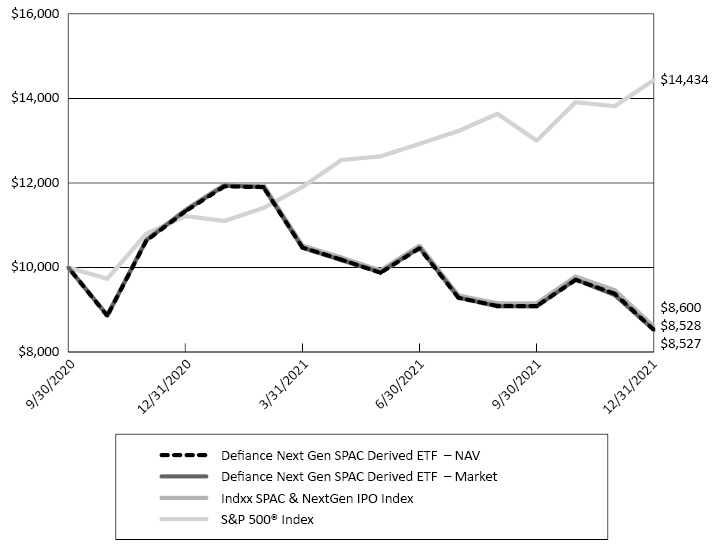
Average Annual Returns | One Year | Since Inception |
Defiance Next SPAC Derived ETF - NAV | -24.72% | -11.94% |
Defiance Next SPAC Derived ETF - Market | -24.83% | -11.95% |
Indxx SPAC & NextGen IPO Index | -24.32% | -11.35% |
S&P 500® Index | 28.71% | 34.06% |
This chart illustrates the performance of a hypothetical $10,000 investment made on September 30, 2020, and is not intended to imply any future performance. The returns shown do not reflect the deduction of taxes that a shareholder would pay on Fund distributions or the redemption of Fund shares. The chart assumes reinvestment of capital gains and dividends.
19
Defiance Next Gen H2 ETF
Performance Summary
(Unaudited)
Growth of $10,000

Cumulative Returns | Since Inception |
Defiance Next Gen H2 ETF - NAV | -29.68% |
Defiance Next Gen H2 ETF - Market | -29.59% |
BlueStar Hydrogen & NextGen Fuel Cell Index | -28.76% |
S&P 500® Index | 24.38% |
This chart illustrates the performance of a hypothetical $10,000 investment made on March 9, 2021, and is not intended to imply any future performance. The returns shown do not reflect the deduction of taxes that a shareholder would pay on Fund distributions or the redemption of Fund shares. The chart assumes reinvestment of capital gains and dividends.
20
Defiance Next Gen Altered Experience ETF
Performance Summary
(Unaudited)
Growth of $10,000
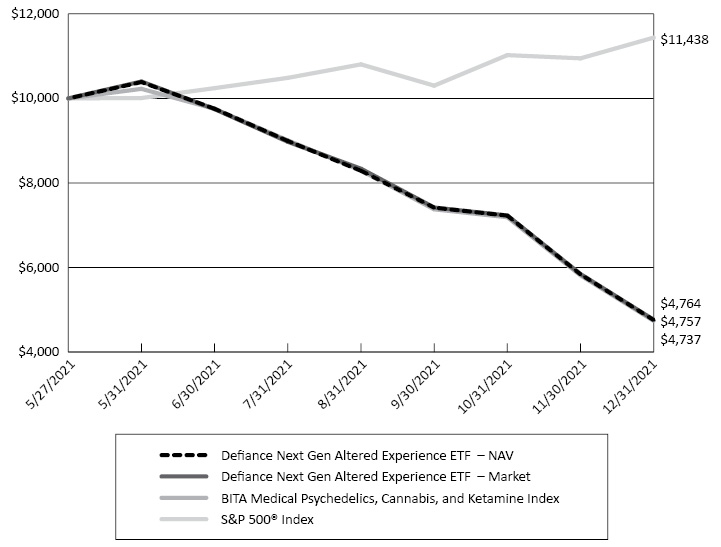
Cumulative Returns | Since Inception |
Defiance Next Gen Altered Experience ETF - NAV | -52.43% |
Defiance Next Gen Altered Experience ETF - Market | -52.36% |
BITA Medical Psychedelics, Cannabis, and Ketamine Index | -52.63% |
S&P 500® Index | 14.38% |
This chart illustrates the performance of a hypothetical $10,000 investment made on May 27, 2021, and is not intended to imply any future performance. The returns shown do not reflect the deduction of taxes that a shareholder would pay on Fund distributions or the redemption of Fund shares. The chart assumes reinvestment of capital gains and dividends.
21
Defiance Hotel, Airline, and Cruise ETF
Performance Summary
(Unaudited)
Growth of $10,000
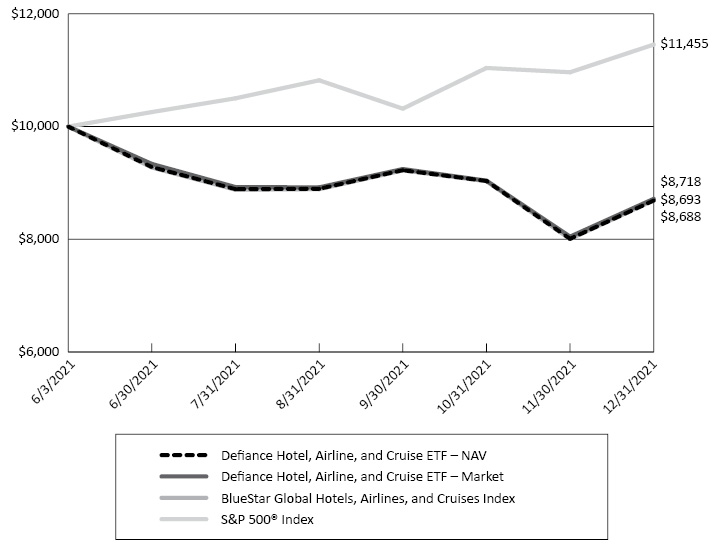
Cumulative Returns | Since Inception |
Defiance Hotel, Airline, and Cruise ETF - NAV | -13.12% |
Defiance Hotel, Airline, and Cruise ETF - Market | -12.82% |
BlueStar Global Hotels, Airlines, and Cruises Index | -13.07% |
S&P 500® Index | 14.55% |
This chart illustrates the performance of a hypothetical $10,000 investment made on June 3, 2021, and is not intended to imply any future performance. The returns shown do not reflect the deduction of taxes that a shareholder would pay on Fund distributions or the redemption of Fund shares. The chart assumes reinvestment of capital gains and dividends.
22
Defiance Next Gen Big Data ETF
Performance Summary
(Unaudited)
Growth of $10,000
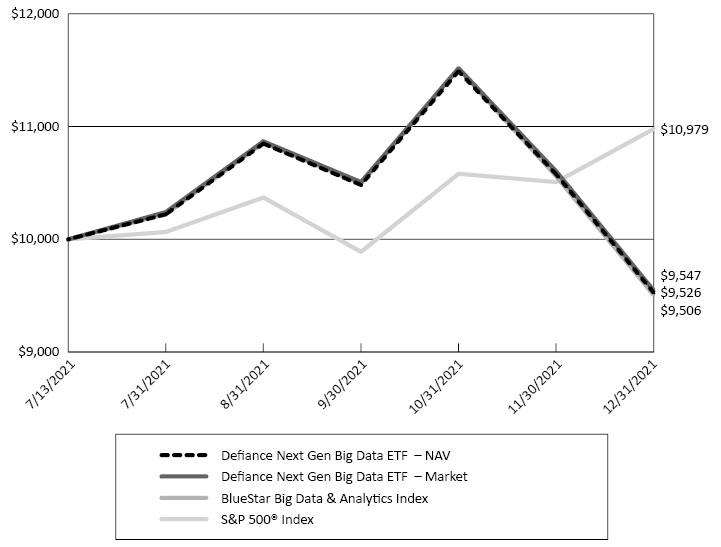
Cumulative Returns | Since Inception |
Defiance Next Gen Big Data ETF - NAV | -4.74% |
Defiance Next Gen Big Data ETF - Market | -4.53% |
BlueStar Big Data & Analytics Index | -4.94% |
S&P 500® Index | 9.79% |
This chart illustrates the performance of a hypothetical $10,000 investment made on July 13, 2021, and is not intended to imply any future performance. The returns shown do not reflect the deduction of taxes that a shareholder would pay on Fund distributions or the redemption of Fund shares. The chart assumes reinvestment of capital gains and dividends.
23
Defiance Digital Revolution ETF
Performance Summary
(Unaudited)
Growth of $10,000

Cumulative Returns | Since Inception |
Defiance Digital Revolution ETF - NAV | -23.93% |
Defiance Digital Revolution ETF - Market | -23.75% |
BITA NFT and Blockchain Select Index | -24.00% |
S&P 500® Index | 5.72% |
This chart illustrates the performance of a hypothetical $10,000 investment made on December 1, 2021, and is not intended to imply any future performance. The returns shown do not reflect the deduction of taxes that a shareholder would pay on Fund distributions or the redemption of Fund shares. The chart assumes reinvestment of capital gains and dividends.
24
Defiance ETFs
Portfolio Allocations
As of December 31, 2021 (Unaudited)
Defiance Quantum ETF
Country | Percentage of |
United States | 59.2% |
Japan | 12.5 |
Netherlands | 5.9 |
Taiwan | 4.5 |
France | 2.9 |
China | 2.8 |
India | 1.6 |
Ireland | 1.6 |
Finland | 1.5 |
Israel | 1.5 |
Italy | 1.5 |
Canada | 1.4 |
Germany | 1.4 |
Switzerland | 1.4 |
Short-Term Investments and Other Assets and Liabilities | 0.3 |
Total | 100.0% |
Defiance Next Gen Connectivity ETF
Sector | Percentage of |
Information Technology (a) | 72.4% |
Communication Services | 16.6 |
Real Estate | 9.3 |
Consumer Discretionary | 0.9 |
Short-Term Investments and Other Assets and Liabilities | 0.8 |
Total | 100.0% |
(a) | To the extent that the Fund invests more heavily in particular sectors of the economy, its performance will be especially sensitive to developments that significantly affect those sectors. See Note 8 in Notes to Financial Statements. |
25
Defiance ETFs
Portfolio Allocations
As of December 31, 2021 (Unaudited) (Continued)
Defiance Next Gen SPAC Derived ETF
Sector | Percentage of |
Special Purpose Acquisition Companies | 39.6% |
Consumer Discretionary | 13.9 |
Industrials | 12.9 |
Health Care | 10.5 |
Information Technology | 8.4 |
Financials | 5.5 |
Consumer Staples | 2.6 |
Communication Services | 2.4 |
Materials | 2.2 |
Real Estate | 1.2 |
Utilities | 0.4 |
Energy | 0.2 |
Short-Term Investments and Other Assets and Liabilities | 0.2 |
Total | 100.0% |
Defiance Next Gen H2 ETF
Country | Percentage of |
United States | 21.5% |
United Kingdom | 20.4 |
Canada | 10.1 |
France | 9.1 |
Republic of Korea | 8.9 |
Norway | 7.9 |
Sweden | 7.8 |
Ireland | 5.5 |
Germany | 5.2 |
Israel | 2.0 |
Denmark | 0.9 |
Short-Term Investments and Other Assets and Liabilities | 0.7 |
Total | 100.0% |
Defiance Next Gen Altered Experience ETF
Country | Percentage of |
Canada | 47.5% |
United States | 33.3 |
Ireland | 8.9 |
United Kingdom | 5.5 |
Germany | 3.7 |
Short-Term Investments and Other Assets and Liabilities | 1.1 |
Total | 100.0% |
26
Defiance ETFs
Portfolio Allocations
As of December 31, 2021 (Unaudited) (Continued)
Defiance Hotel, Airline, and Cruise ETF
Country | Percentage of |
United States | 65.1% |
United Kingdom | 8.5 |
Ireland | 4.3 |
Japan | 3.6 |
China | 2.3 |
France | 2.2 |
Taiwan | 2.0 |
Australia | 2.0 |
Canada | 1.7 |
Singapore | 1.5 |
Republic of Korea | 1.5 |
Germany | 1.3 |
Switzerland | 1.0 |
Thailand | 0.9 |
Hong Kong | 0.6 |
Mexico | 0.5 |
Short-Term Investments and Other Assets and Liabilities | 0.4 |
Panama | 0.3 |
Brazil | 0.3 |
Total | 100.0% |
Defiance Next Gen Big Data ETF
Country | Percentage of |
United States | 79.6% |
United Kingdom | 4.2 |
France | 3.9 |
Australia | 3.7 |
China | 3.6 |
Israel | 3.4 |
Germany | 1.3 |
Short-Term Investments and Other Assets and Liabilities | 0.3 |
Total | 100.0% |
27
Defiance ETFs
Portfolio Allocations
As of December 31, 2021 (Unaudited) (Continued)
Defiance Digital Revolution ETF
Country | Percentage of |
United States | 51.2% |
Canada | 19.5 |
Australia | 7.1 |
Germany | 4.9 |
Japan | 4.7 |
China | 4.4 |
United Kingdom | 3.7 |
Hong Kong | 1.6 |
Sweden | 0.7 |
France | 0.7 |
Short-Term Investments and Other Assets and Liabilities | 0.6 |
Switzerland | 0.5 |
Singapore | 0.4 |
Total | 100.0% |
28
Defiance Quantum ETF
Schedule of Investments
December 31, 2021
Shares | Security Description | Value | ||||||
COMMON STOCKS — 99.7% | ||||||||
Communication Services — 7.2% | ||||||||
| 859 | Alphabet, Inc. - Class A (a) | $ | 2,488,557 | |||||
| 17,106 | Baidu, Inc. - ADR (a) | 2,545,202 | ||||||
| 867,882 | Koninklijke KPN NV | 2,694,397 | ||||||
| 92,700 | Nippon Telegraph & Telephone Corporation | 2,535,756 | ||||||
| 245,902 | Orange SA - ADR (b) | 2,594,266 | ||||||
| 12,858,178 | ||||||||
Consumer Discretionary — 1.4% | ||||||||
| 20,367 | Alibaba Group Holding, Ltd. - ADR (a) | 2,419,396 | ||||||
Industrials — 12.9% | ||||||||
| 21,045 | Airbus SE (a) | 2,689,050 | ||||||
| 29,800 | Booz Allen Hamilton Holding Corporation | 2,526,742 | ||||||
| 43,600 | Hitachi, Ltd. | 2,358,803 | ||||||
| 12,448 | Honeywell International, Inc. | 2,595,533 | ||||||
| 7,469 | Lockheed Martin Corporation | 2,654,557 | ||||||
| 196,200 | Mitsubishi Electric Corporation | 2,484,979 | ||||||
| 6,997 | Northrop Grumman Corporation | 2,708,329 | ||||||
| 29,452 | Raytheon Technologies Corporation | 2,534,639 | ||||||
| 61,200 | Toshiba Corporation | 2,513,794 | ||||||
| 23,066,426 | ||||||||
Information Technology — 76.8% (c) | ||||||||
| 6,802 | Accenture plc - Class A | 2,819,769 | ||||||
| 17,540 | Advanced Micro Devices, Inc. (a) | 2,524,006 | ||||||
| 37,972 | Alteryx, Inc. - Class A (a)(b) | 2,297,306 | ||||||
| 11,748 | Ambarella, Inc. (a) | 2,383,552 | ||||||
| 13,677 | Analog Devices, Inc. | 2,404,006 | ||||||
| 16,196 | Applied Materials, Inc. | 2,548,603 | ||||||
| 3,168 | ASML Holding NV - NY | 2,522,172 | ||||||
| 196,000 | Asustek Computer, Inc. | 2,663,679 | ||||||
| 62,427 | Atos SE | 2,654,399 | ||||||
| 23,153 | Azenta, Inc. | 2,387,306 | ||||||
| 273,639 | BlackBerry, Ltd. (a)(b) | 2,558,525 | ||||||
| 13,830 | Cadence Design Systems, Inc. (a) | 2,577,220 | ||||||
| 28,828 | Cirrus Logic, Inc. (a) | 2,652,753 | ||||||
| 19,855 | Elastic NV (a) | 2,443,952 | ||||||
| 57,120 | FormFactor, Inc. (a)(b) | 2,611,526 | ||||||
| 14,700 | Fujitsu, Ltd. | 2,518,614 | ||||||
| 163,515 | Hewlett Packard Enterprise Company | 2,578,632 | ||||||
| 55,172 | Infineon Technologies AG | 2,557,356 | ||||||
| 49,228 | Intel Corporation | 2,535,242 | ||||||
| 20,709 | International Business Machines Corporation | 2,767,965 | ||||||
| 121,487 | IonQ, Inc. (a)(b) | 2,028,833 | ||||||
| 6,047 | KLA Corporation | 2,600,875 | ||||||
| 3,568 | Lam Research Corporation | $ | 2,565,927 | |||||
| 31,980 | Lattice Semiconductor Corporation (a) | 2,464,379 | ||||||
| 27,906 | Marvell Technology, Inc. (b) | 2,441,496 | ||||||
| 64,000 | MediaTek, Inc. | 2,752,738 | ||||||
| 29,168 | Microchip Technology, Inc. | 2,539,366 | ||||||
| 29,616 | Micron Technology, Inc. | 2,758,730 | ||||||
| 7,605 | Microsoft Corporation | 2,557,714 | ||||||
| 4,002 | MicroStrategy, Inc. - Class A (a)(b) | 2,179,049 | ||||||
| 15,351 | MKS Instruments, Inc. (b) | 2,673,684 | ||||||
| 58,111 | National Instruments Corporation | 2,537,707 | ||||||
| 53,400 | NEC Corporation | 2,462,368 | ||||||
| 434,739 | Nokia Corporation - ADR (a) | 2,704,077 | ||||||
| 119,000 | NTT Data Corporation | 2,548,339 | ||||||
| 8,004 | NVIDIA Corporation | 2,354,056 | ||||||
| 11,168 | NXP Semiconductors NV | 2,543,847 | ||||||
| 39,657 | ON Semiconductor Corporation (a) | 2,693,503 | ||||||
| 25,980 | Onto Innovation, Inc. (a)(b) | 2,629,955 | ||||||
| 18,609 | Perficient, Inc. (a)(b) | 2,405,958 | ||||||
| 13,949 | QUALCOMM, Inc. | 2,550,854 | ||||||
| 192,900 | Renesas Electronics Corporation (a) | 2,383,715 | ||||||
| 12,660 | Reply SpA | 2,572,743 | ||||||
| 21,331 | Splunk, Inc. (a) | 2,468,423 | ||||||
| 51,853 | STMicroelectronics NV - NY (b) | 2,534,575 | ||||||
| 8,765 | Synaptics, Inc. (a)(b) | 2,537,555 | ||||||
| 6,992 | Synopsys, Inc. (a) | 2,576,552 | ||||||
| 20,915 | Taiwan Semiconductor Manufacturing Company, Ltd. - ADR | 2,516,284 | ||||||
| 57,992 | Teradata Corporation (a)(b) | 2,462,920 | ||||||
| 15,881 | Teradyne, Inc. (b) | 2,597,020 | ||||||
| 12,971 | Texas Instruments, Inc. | 2,444,644 | ||||||
| 66,169 | Tower Semiconductor, Ltd. (a) | 2,625,586 | ||||||
| 290,819 | Wipro, Ltd. - ADR | 2,838,393 | ||||||
| 11,335 | Xilinx, Inc. | 2,403,360 | ||||||
| 136,961,808 | ||||||||
Materials — 1.4% | ||||||||
| 66,600 | JSR Corporation | 2,530,285 | ||||||
TOTAL COMMON STOCKS (Cost $147,394,911) | 177,836,093 | |||||||
The accompanying notes are an integral part of these financial statements.
29
Defiance Quantum ETF
Schedule of Investments
December 31, 2021 (Continued)
Shares | Security Description | Value | ||||||
SHORT-TERM INVESTMENTS — 0.3% | ||||||||
| 582,884 | First American Government Obligations Fund - Class X, 0.03% (d) | $ | 582,884 | |||||
TOTAL SHORT-TERM INVESTMENTS (Cost $582,884) | 582,884 | |||||||
Units | ||||||||
INVESTMENTS PURCHASED WITH PROCEEDS FROM SECURITIES LENDING — 15.0% | ||||||||
| 26,811,367 | Mount Vernon Liquid Assets Portfolio, LLC, 0.12% (d)(e) | 26,811,367 | ||||||
TOTAL INVESTMENTS PURCHASED WITH PROCEEDS FROM SECURITIES LENDING (Cost $26,811,367) | 26,811,367 | |||||||
TOTAL INVESTMENTS — 115.0% (Cost $174,789,162) | 205,230,344 | |||||||
Liabilities in Excess of Other Assets — (15.0)% | (26,811,973 | ) | ||||||
NET ASSETS — 100.0% | $ | 178,418,371 | ||||||
Percentages are stated as a percentage of net assets. | |
ADR | American Depositary Receipt. |
NY | New York Registry Shares. |
(a) | Non-income producing security. |
(b) | All or part of this security is on loan as of December 31, 2021. The total value of securities on loan is $25,853,031. |
(c) | To the extent that the Fund invests more heavily in particular sectors of the economy, its performance will be especially sensitive to developments that significantly affect those sectors. See Note 8 in Notes to Financial Statements. |
(d) | Rate shown is the annualized seven-day yield as of December 31, 2021. |
(e) | Privately offered liquidity fund. See Note 4 in Notes to Financial Statements. |
The Global Industry Classification Standard (GICS®) was developed by and/or is the exclusive property of MSCI, Inc. (“MSCI”) and Standard & Poor’s Financial Services LLC (“S&P”). GICS® is a service mark of MSCI and S&P and has been licensed for use by U.S. Bancorp Fund Services, LLC.
The accompanying notes are an integral part of these financial statements.
30
Defiance Next Gen Connectivity ETF
Schedule of Investments
December 31, 2021
Shares | Security Description | Value | ||||||
COMMON STOCKS — 99.2% | ||||||||
Communication Services — 16.6% | ||||||||
| 426,239 | Altice USA, Inc. - Class A (a) | $ | 6,896,547 | |||||
| 1,750,581 | AT&T, Inc. | 43,064,293 | ||||||
| 339,751 | BCE, Inc. | 17,680,642 | ||||||
| 37,886 | Charter Communications, Inc. - Class A (a)(b) | 24,700,535 | ||||||
| 504,489 | IHS Holding, Ltd. (a) | 7,113,295 | ||||||
| 516,832 | KT Corporation - ADR (a) | 6,496,578 | ||||||
| 559,154 | Lumen Technologies, Inc. (b) | 7,017,383 | ||||||
| 767,494 | Orange SA - ADR (b) | 8,097,062 | ||||||
| 145,850 | Rogers Communications, Inc. - Class B | 6,946,835 | ||||||
| 151,742 | SK Telecom Company, Ltd. - ADR (b) | 4,046,961 | ||||||
| 2,291,160 | Telefonica SA - ADR (b) | 9,714,518 | ||||||
| 269,019 | T-Mobile US, Inc. (a) | 31,200,824 | ||||||
| 803,346 | Verizon Communications, Inc. | 41,741,858 | ||||||
| 987,747 | Vodafone Group plc - ADR | 14,747,063 | ||||||
| 229,464,394 | ||||||||
Consumer Discretionary — 0.9% | ||||||||
| 3,836 | Amazon.com, Inc. (a) | 12,790,528 | ||||||
Information Technology — 72.4% (c) | ||||||||
| 447,401 | A10 Networks, Inc. (b) | 7,417,909 | ||||||
| 323,297 | ADTRAN, Inc. | 7,380,871 | ||||||
| 465,446 | Advanced Micro Devices, Inc. (a) | 66,977,679 | ||||||
| 449,347 | Airgain, Inc. (a)(b) | 4,776,559 | ||||||
| 328,575 | Akamai Technologies, Inc. (a)(b) | 38,456,418 | ||||||
| 954,824 | Akoustis Technologies, Inc. (a)(b) | 6,378,224 | ||||||
| 557,771 | Allot, Ltd.(a) | 6,626,319 | ||||||
| 237,063 | Amdocs, Ltd. | 17,741,795 | ||||||
| 362,941 | Analog Devices, Inc. | 63,794,140 | ||||||
| 77,223 | Apple, Inc. | 13,712,488 | ||||||
| 107,748 | Arista Networks, Inc. (a) | 15,488,775 | ||||||
| 22,971 | Broadcom, Inc. | 15,285,133 | ||||||
| 123,658 | Calix, Inc. (a) | 9,888,930 | ||||||
| 258,514 | Cambium Networks Corporation (a) | 6,625,714 | ||||||
| 1,310,109 | Casa Systems, Inc. (a)(b) | 7,428,318 | ||||||
| 2,414,344 | Ceragon Networks, Ltd. (a) | 6,229,008 | ||||||
| 155,635 | CEVA, Inc. (a)(b) | 6,729,657 | ||||||
| 286,100 | Ciena Corporation (a) | 22,021,117 | ||||||
| 237,115 | Cisco Systems, Inc. | 15,025,978 | ||||||
| 101,962 | Clearfield, Inc. (a) | 8,607,632 | ||||||
| 609,572 | CommScope Holding Company, Inc. (a) | 6,729,675 | ||||||
| 267,623 | Comtech Telecommunications Corporation (b) | 6,339,989 | ||||||
| 235,826 | Corning, Inc. | 8,779,802 | ||||||
| 123,205 | CSG Systems International, Inc. (b) | $ | 7,099,072 | |||||
| 186,950 | CTS Corporation | 6,864,804 | ||||||
| 229,747 | Dell Technologies, Inc. - Class C (a) | 12,904,889 | ||||||
| 481,151 | DZS, Inc. (a) | 7,804,269 | ||||||
| 979,733 | EMCORE Corporation (a) | 6,838,536 | ||||||
| 490,589 | Extreme Networks, Inc. (a) | 7,702,247 | ||||||
| 100,890 | F5, Inc. (a)(b) | 24,688,792 | ||||||
| 124,610 | GDS Holdings, Ltd. - ADR (a) | 5,876,608 | ||||||
| 867,799 | Hewlett Packard Enterprise Company | 13,685,190 | ||||||
| 100,867 | II-VI, Inc. (a)(b) | 6,892,242 | ||||||
| 801,916 | Infinera Corporation (a)(b) | 7,690,374 | ||||||
| 1,064,042 | Inseego Corporation (a)(b) | 6,203,365 | ||||||
| 261,261 | Intel Corporation | 13,454,942 | ||||||
| 108,604 | InterDigital, Inc. | 7,779,305 | ||||||
| 39,551 | IPG Photonics Corporation (a)(b) | 6,808,309 | ||||||
| 322,927 | Juniper Networks, Inc. | 11,531,723 | ||||||
| 200,608 | Keysight Technologies, Inc. (a) | 41,427,558 | ||||||
| 137,086 | Lattice Semiconductor Corporation (a) | 10,563,847 | ||||||
| 2,299,387 | Limelight Networks, Inc. (a)(b) | 7,886,897 | ||||||
| 72,369 | Lumentum Holdings, Inc. (a)(b) | 7,654,469 | ||||||
| 86,402 | MACOM Technology Solutions Holdings, Inc. (a)(b) | 6,765,277 | ||||||
| 531,468 | Marvell Technology, Inc. | 46,498,135 | ||||||
| 91,107 | MaxLinear, Inc. (a) | 6,868,557 | ||||||
| 199,852 | National Instruments Corporation | 8,727,537 | ||||||
| 439,828 | NeoPhotonics Corporation (a) | 6,760,156 | ||||||
| 215,022 | NetScout Systems, Inc. (a) | 7,112,928 | ||||||
| 5,091,239 | Nokia Corporation - ADR (a) | 31,667,507 | ||||||
| 42,481 | NVIDIA Corporation | 12,494,087 | ||||||
| 205,565 | NXP Semiconductors NV | 46,823,596 | ||||||
| 84,149 | Qorvo, Inc. (a) | 13,160,062 | ||||||
| 370,155 | QUALCOMM, Inc. | 67,690,245 | ||||||
| 219,061 | Radware, Ltd. (a) | 9,121,700 | ||||||
| 3,330,129 | Resonant, Inc. (a)(b) | 5,694,521 | ||||||
| 1,190,176 | Ribbon Communications, Inc. (a) | 7,200,565 | ||||||
| 415,591 | Sierra Wireless, Inc. (a) | 7,322,713 | ||||||
| 140,592 | Silicom, Ltd. (a) | 7,254,547 | ||||||
| 126,265 | Skyworks Solutions, Inc. | 19,588,752 | ||||||
| 2,932,051 | Telefonaktiebolaget LM Ericsson - ADR | 31,871,394 | ||||||
| 23,830 | Ubiquiti, Inc. (b) | 7,308,661 | ||||||
| 419,123 | Viavi Solutions, Inc. (a)(b) | 7,384,947 | ||||||
| 117,793 | VMware, Inc. - Class A | 13,649,853 | ||||||
| 191,611 | Xilinx, Inc. | 40,627,280 | ||||||
| 1,001,392,588 | ||||||||
The accompanying notes are an integral part of these financial statements.
31
Defiance Next Gen Connectivity ETF
Schedule of Investments
December 31, 2021 (Continued)
Shares | Security Description | Value | ||||||
COMMON STOCKS — 99.2% (Continued) | ||||||||
Real Estate — 9.3% | ||||||||
| 147,039 | American Tower Corporation | $ | 43,008,907 | |||||
| 119,431 | Crown Castle International Corporation | 24,930,027 | ||||||
| 75,641 | CyrusOne, Inc. | 6,786,510 | ||||||
| 66,887 | Digital Realty Trust, Inc. | 11,830,304 | ||||||
| 27,076 | Equinix, Inc. | 22,901,964 | ||||||
| 33,153 | SBA Communications Corporation | 12,897,180 | ||||||
| 502,613 | Uniti Group, Inc. (b) | 7,041,608 | ||||||
| 129,396,500 | ||||||||
TOTAL COMMON STOCKS (Cost $1,108,828,507) | 1,373,044,010 | |||||||
SHORT-TERM INVESTMENTS — 0.7% | ||||||||
| 9,554,244 | First American Government Obligations Fund - Class X, 0.03% (d) | 9,554,244 | ||||||
TOTAL SHORT-TERM INVESTMENTS (Cost $9,554,244) | 9,554,244 | |||||||
Units | ||||||||
INVESTMENTS PURCHASED WITH PROCEEDS FROM SECURITIES LENDING — 9.6% | ||||||||
| 133,207,282 | Mount Vernon Liquid Assets Portfolio, LLC, 0.12% (d)(e) | 133,207,282 | ||||||
TOTAL INVESTMENTS PURCHASED WITH PROCEEDS FROM SECURITIES LENDING (Cost $133,207,282) | 133,207,282 | |||||||
TOTAL INVESTMENTS — 109.5% (Cost $1,251,590,033) | 1,515,805,536 | |||||||
Liabilities in Excess of Other Assets — (9.5)% | (132,070,892 | ) | ||||||
NET ASSETS — 100.0% | $ | 1,383,734,644 | ||||||
Percentages are stated as a percent of net assets. | |
ADR | American Depositary Receipt. |
(a) | Non-income producing security. |
(b) | All or part of this security is on loan as of December 31, 2021. The total value of securities on loan is $128,825,716. |
(c) | To the extent that the Fund invests more heavily in particular sectors of the economy, its performance will be especially sensitive to developments that significantly affect those sectors. See Note 8 in Notes to Financial Statements. |
(d) | Rate shown is the annualized seven-day yield as of December 31, 2021. |
(e) | Privately offered liquidity fund. See Note 4 in Notes to Financial Statements. |
The Global Industry Classification Standard (GICS®) was developed by and/or is the exclusive property of MSCI, Inc. (“MSCI”) and Standard & Poor’s Financial Services LLC (“S&P”). GICS® is a service mark of MSCI and S&P and has been licensed for use by U.S. Bancorp Fund Services, LLC.
The accompanying notes are an integral part of these financial statements.
32
Defiance Next Gen SPAC Derived ETF
Schedule of Investments
December 31, 2021
Shares | Security Description | Value | ||||||
COMMON STOCKS — 60.2% | ||||||||
Communication Services — 2.4% | ||||||||
| 6,557 | AdTheorent Holding Company Inc. (a) | $ | 38,490 | |||||
| 5,018 | Advantage Solutions, Inc. (a) | 40,244 | ||||||
| 2,657 | AST SpaceMobile, Inc. (a) | 21,097 | ||||||
| 5,990 | BuzzFeed, Inc. (a) | 31,927 | ||||||
| 2,856 | CuriosityStream, Inc. (a) | 16,936 | ||||||
| 6,508 | Genius Sports, Ltd. (a) | 49,461 | ||||||
| 5,248 | Innovid Corporation (a) | 34,899 | ||||||
| 4,453 | KORE Group Holdings, Inc. (a) | 30,013 | ||||||
| 8,344 | Nextdoor Holdings, Inc. (a) | 65,834 | ||||||
| 3,272 | Nexters, Inc. (a) | 26,372 | ||||||
| 6,461 | Playstudios, Inc. (a) | 25,521 | ||||||
| 2,423 | Redbox Entertainment, Inc. (a) | 17,954 | ||||||
| 3,344 | Reservoir Media, Inc. (a) | 26,451 | ||||||
| 15,182 | Skillz, Inc. (a) | 112,954 | ||||||
| 8,106 | Taboola.com, Ltd. (a) | 63,065 | ||||||
| 3,955 | Vacasa, Inc. - Class A (a) | 32,906 | ||||||
| 4,730 | Wejo Group, Ltd. (a) | 32,353 | ||||||
| 666,477 | ||||||||
Consumer Discretionary — 13.9% | ||||||||
| 4,095 | Accel Entertainment, Inc. (a) | 53,317 | ||||||
| 4,404 | Arko Corporation (a) | 38,623 | ||||||
| 9,711 | Arrival SA (a) | 72,056 | ||||||
| 4,484 | BARK, Inc. (a) | 18,923 | ||||||
| 6,616 | Beachbody Company, Inc. (a) | 15,680 | ||||||
| 1,115 | Betterware de Mexico SAB de CV | 23,370 | ||||||
| 5,299 | Bowlero Corporation (a) | 47,797 | ||||||
| 5,377 | Boxed, Inc. (a) | 73,665 | ||||||
| 6,246 | Canoo, Inc. (a) | 48,219 | ||||||
| 8,098 | CarLotz, Inc. (a) | 18,382 | ||||||
| 4,949 | Cazoo Group, Ltd. (a) | 29,842 | ||||||
| 20,683 | DraftKings, Inc. - Class A (a) | 568,162 | ||||||
| 3,508 | Electric Last Mile Solutions I (a) | 24,661 | ||||||
| 9,616 | Enjoy Technology, Inc. (a) | 44,426 | ||||||
| 6,305 | Ermenegildo Zegna Holditalia SpA (a) | 66,076 | ||||||
| 3,788 | EVgo, Inc. (a) | 37,653 | ||||||
| 6,957 | Faraday Future Intelligent Electric, Inc. (a) | 37,011 | ||||||
| 10,017 | Fisker, Inc. (a) | 157,567 | ||||||
| 2,665 | Golden Nugget Online Gaming, Inc. (a) | 26,517 | ||||||
| 10,290 | Grab Holdings, Ltd. - Class A (a) | 73,368 | ||||||
| 13,358 | Hall of Fame Resort & Entertainment Company (a) | 20,304 | ||||||
| 2,733 | Holley, Inc. (a) | 35,502 | ||||||
| 7,134 | Lordstown Motors Corporation - Class A (a) | 24,612 | ||||||
| 4,215 | Lottery.com, Inc. (a) | $ | 26,850 | |||||
| 33,156 | Lucid Group, Inc. (a) | 1,261,586 | ||||||
| 12,734 | Luminar Technologies, Inc. (a) | 215,332 | ||||||
| 4,710 | Nerdy, Inc. (a) | 21,195 | ||||||
| 1,277 | PLBY Group, Inc. (a) | 34,019 | ||||||
| 4,619 | Porch Group, Inc. (a) | 72,010 | ||||||
| 12,910 | QuantumScape Corporation (a) | 286,473 | ||||||
| 7,153 | REE Automotive, Ltd. - Class A (a) | 39,699 | ||||||
| 5,075 | Rover Group, Inc. (a) | 49,481 | ||||||
| 3,294 | Rush Street Interactive, Inc. (a) | 54,351 | ||||||
| 4,280 | Shift Technologies, Inc. (a) | 14,595 | ||||||
| 7,165 | Signa Sports United NV (a) | 60,759 | ||||||
| 7,382 | Solid Power, Inc. (a) | 64,519 | ||||||
| 3,452 | Vivid Seats, Inc. - Class A | 37,558 | ||||||
| 3,428 | Vivint Smart Home, Inc. (a) | 33,526 | ||||||
| 7,282 | Volta, Inc. (a) | 53,450 | ||||||
| 5,965 | XL Fleet Corporation (a) | 19,744 | ||||||
| 3,900,880 | ||||||||
Consumer Staples — 2.6% | ||||||||
| 5,685 | AppHarvest, Inc. (a) | 22,115 | ||||||
| 5,335 | Beauty Health Company (a) | 128,893 | ||||||
| 8,092 | Benson Hill, Inc. (a) | 58,991 | ||||||
| 4,817 | CompoSecure, Inc. (a) | 39,547 | ||||||
| 11,478 | EQRx, Inc. (a) | 78,280 | ||||||
| 4,296 | Hyperfine, Inc. (a) | 31,146 | ||||||
| 17,083 | Local Bounti Corporation (a) | 110,185 | ||||||
| 6,596 | P3 Health Partners, Inc. (a) | 46,436 | ||||||
| 3,140 | Pardes Biosciences, Inc. (a) | 51,402 | ||||||
| 3,009 | Tattooed Chef, Inc. (a) | 46,760 | ||||||
| 3,580 | Utz Brands, Inc. | 57,101 | ||||||
| 2,916 | Vintage Wine Estates, Inc. (a) | 34,467 | ||||||
| 2,447 | Whole Earth Brands, Inc. (a) | 26,281 | ||||||
| 731,604 | ||||||||
Energy — 0.2% | ||||||||
| 3,309 | Archaea Energy, Inc. (a) | 60,489 | ||||||
Financials — 5.5% | ||||||||
| 1,273 | Bakkt Holdings, Inc. (a) | 10,833 | ||||||
| 20,596 | Blue Owl Capital, Inc. | 307,086 | ||||||
| 7,973 | Broadmark Realty Capital, Inc. | 75,185 | ||||||
| 6,203 | Finance Of America Companies, Inc. - Class A (a) | 24,626 | ||||||
| 2,548 | GCM Grosvenor, Inc. - Class A | 26,754 | ||||||
| 5,444 | Hagerty, Inc. - Class A (a) | 77,196 | ||||||
| 17,375 | Hippo Holdings, Inc. (a) | 49,171 | ||||||
The accompanying notes are an integral part of these financial statements.
33
Defiance Next Gen SPAC Derived ETF
Schedule of Investments
December 31, 2021 (Continued)
Shares | Security Description | Value | ||||||
COMMON STOCKS — 60.2% (Continued) | ||||||||
Financials — 5.5% (Continued) | ||||||||
| 3,499 | International General Insurance Holdings, Ltd. | $ | 28,342 | |||||
| 6,361 | Katapult Holdings, Inc. (a) | 21,437 | ||||||
| 3,958 | MarketWise, Inc. (a) | 29,843 | ||||||
| 9,329 | MetroMile, Inc. (a) | 20,431 | ||||||
| 8,303 | Moneylion, Inc. (a) | 33,461 | ||||||
| 4,508 | OppFi, Inc. (a) | 20,466 | ||||||
| 2,180 | Perella Weinberg Partners | 28,035 | ||||||
| 31,060 | SoFi Technologies, Inc. (a) | 491,059 | ||||||
| 5,558 | Sunlight Financial Holdings, Inc. (a) | 26,567 | ||||||
| 5,964 | UWM Holdings Corporation | 35,307 | ||||||
| 26,861 | WeWork, Inc. - Class A (a) | 231,005 | ||||||
| 1,536,804 | ||||||||
Health Care — 10.5% | ||||||||
| 3,695 | 23andMe Holding Company - Class A (a) | 24,609 | ||||||
| 4,600 | AdaptHealth Corporation (a) | 112,516 | ||||||
| 2,096 | AirSculpt Technologies, Inc. (a) | 36,030 | ||||||
| 10,205 | ATI Physical Therapy, Inc. (a) | 34,595 | ||||||
| 22,270 | Babylon Holdings, Ltd. - Class A (a) | 129,834 | ||||||
| 8,716 | Butterfly Network, Inc. (a) | 58,310 | ||||||
| 10,387 | Cano Health, Inc. (a) | 92,548 | ||||||
| 3,291 | CareMax, Inc. (a) | 25,275 | ||||||
| 4,310 | Celularity, Inc. (a) | 22,067 | ||||||
| 3,447 | Cerevel Therapeutics Holdings, Inc. (a) | 111,752 | ||||||
| 5,288 | Clene, Inc. (a) | 21,681 | ||||||
| 4,286 | Clever Leaves Holdings, Inc. (a) | 13,287 | ||||||
| 13,620 | Clover Health Investments Corporation (a) | 50,666 | ||||||
| 1,544 | DermTech, Inc. (a) | 24,395 | ||||||
| 5,121 | DocGo, Inc. (a) | 47,881 | ||||||
| 2,844 | eFFECTOR Therapeutics, Inc. (a) | 23,548 | ||||||
| 8,031 | Gemini Therapeutics, Inc. (a) | 23,370 | ||||||
| 61,125 | Ginkgo Bioworks Holdings, Inc. (a) | 507,949 | ||||||
| 4,857 | Hims & Hers Health, Inc. (a) | 31,813 | ||||||
| 3,356 | Humacyte, Inc. (a) | 24,331 | ||||||
| 2,622 | Immatics NV (a) | 35,240 | ||||||
| 3,685 | Immunovant, Inc. (a) | 31,396 | ||||||
| 4,304 | Intercure, Ltd. (a) | 27,890 | ||||||
| 2,583 | Jasper Therapeutics, Inc. (a) | 20,277 | ||||||
| 3,377 | LumiraDx, Ltd. (a) | 30,022 | ||||||
| 16,268 | Multiplan Corporation (a) | 72,067 | ||||||
| 5,547 | Nautilus Biotechnology, Inc. (a) | 28,733 | ||||||
| 3,229 | New Frontier Health Corporation (a) | 37,004 | ||||||
| 2,956 | NRX Pharmaceuticals, Inc. (a) | 14,130 | ||||||
| 9,822 | Nuvation Bio, Inc. (a) | 83,487 | ||||||
| 4,771 | Oncology Institute, Inc. (a) | 46,517 | ||||||
| 8,187 | Owlet, Inc. (a) | 21,859 | ||||||
| 5,728 | Pear Therapeutics, Inc. (a) | 35,514 | ||||||
| 4,385 | Point Biopharma Global, Inc. (a) | 24,556 | ||||||
| 2,998 | Procaps Group SA (a) | 29,231 | ||||||
| 5,144 | Quantum-Si, Inc. (a) | 40,483 | ||||||
| 45,476 | Roivant Sciences, Ltd. (a) | 458,398 | ||||||
| 3,300 | SAB Biotherapeutics, Inc. (a) | 25,773 | ||||||
| 7,055 | Science 37 Holdings, Inc. (a) | 87,976 | ||||||
| 7,025 | Sema4 Holdings Corporation (a) | 31,332 | ||||||
| 16,709 | Sharecare, Inc. (a) | 75,023 | ||||||
| 14,266 | SOC Telemed, Inc. (a) | 18,260 | ||||||
| 8,043 | SomaLogic, Inc. (a) | 93,621 | ||||||
| 4,247 | Surrozen, Inc. (a) | 27,351 | ||||||
| 8,278 | Talkspace, Inc. (a) | 16,308 | ||||||
| 2,279 | Tango Therapeutics, Inc. (a) | 24,932 | ||||||
| 16,148 | UpHealth, Inc. (a) | 36,172 | ||||||
| 3,405 | Vicarious Surgical, Inc. (a) | 36,161 | ||||||
| 2,128 | Vincerx Pharma, Inc. (a) | 21,684 | ||||||
| 2,947,854 | ||||||||
Industrials — 12.9% | ||||||||
| 3,334 | Advent Technologies Holdings, Inc. (a) | 23,371 | ||||||
| 1,537 | AerSale Corporation (a) | 27,266 | ||||||
| 16,195 | Alight, Inc. - Class A (a) | 175,068 | ||||||
| 2,087 | Alta Equipment Group, Inc. (a) | 30,554 | ||||||
| 8,513 | Archer Aviation, Inc. - Class A (a) | 51,418 | ||||||
| 7,183 | Astra Space, Inc. (a) | 49,778 | ||||||
| 2,901 | Atlas Technical Consultants, Inc. (a) | 24,426 | ||||||
| 20,192 | Aurora Innovation, Inc. (a) | 227,362 | ||||||
| 4,931 | Berkshire Grey, Inc. (a) | 27,120 | ||||||
| 6,498 | Bird Global, Inc. - Class A (a) | 40,093 | ||||||
| 4,081 | BlackSky Technology, Inc. (a) | 18,324 | ||||||
| 2,985 | Blade Air Mobility, Inc. (a) | 26,358 | ||||||
| 10,707 | ChargePoint Holdings, Inc. (a) | 203,968 | ||||||
| 3,360 | Custom Truck One Source, Inc. (a) | 26,880 | ||||||
| 10,148 | Desktop Metal, Inc. - Class A (a) | 50,233 | ||||||
| 5,699 | Enovix Corporation (a) | 155,469 | ||||||
| 2,798 | Eos Energy Enterprises, Inc. (a) | 21,041 | ||||||
| 8,475 | ESS Tech, Inc. (a) | 96,954 | ||||||
| 7,099 | Fathom Digital Manufacturing Corporation (a) | 56,224 | ||||||
| 5,507 | FREYR Battery SA (a) | 61,568 | ||||||
| 3,057 | Helbiz, Inc. (a) | 16,783 | ||||||
| 5,693 | Hillman Solutions Corporation (a) | 61,200 | ||||||
The accompanying notes are an integral part of these financial statements.
34
Defiance Next Gen SPAC Derived ETF
Schedule of Investments
December 31, 2021 (Continued)
Shares | Security Description | Value | ||||||
COMMON STOCKS — 60.2% (Continued) | ||||||||
Industrials — 12.9% (Continued) | ||||||||
| 6,958 | Hyliion Holdings Corporation (a) | $ | 43,140 | |||||
| 5,622 | Hyzon Motors, Inc. (a) | 36,487 | ||||||
| 4,461 | Janus International Group, Inc. (a) | 55,852 | ||||||
| 16,807 | Joby Aviation, Inc. (a) | 122,691 | ||||||
| 6,396 | Li-Cycle Holdings Corporation (a) | 63,704 | ||||||
| 3,768 | Lightning eMotors, Inc. (a) | 22,646 | ||||||
| 8,099 | Lilium NV (a) | 56,126 | ||||||
| 2,854 | Lion Electric Company (a) | 28,369 | ||||||
| 4,489 | Markforged Holding Corporation (a) | 24,106 | ||||||
| 8,183 | Microvast Holdings, Inc. (a) | 46,316 | ||||||
| 4,730 | Momentus, Inc. (a) | 19,771 | ||||||
| 2,474 | Nuvve Holding Corporation (a) | 32,954 | ||||||
| 5,810 | Otonomo Technologies, Ltd. (a) | 23,763 | ||||||
| 3,987 | PAE, Inc. (a) | 39,591 | ||||||
| 7,131 | Planet Labs PBC (a) | 43,856 | ||||||
| 10,250 | Proterra, Inc. (a) | 90,507 | ||||||
| 2,229 | Redwire Corporation (a) | 15,046 | ||||||
| 11,727 | Rocket Lab USA, Inc. (a) | 144,008 | ||||||
| 7,050 | Romeo Power, Inc. (a) | 25,732 | ||||||
| 4,421 | Sarcos Technology and Robotics Corporation (a) | 44,122 | ||||||
| 3,741 | Shapeways Holdings, Inc. (a) | 13,879 | ||||||
| 4,027 | Skillsoft Corporation (a) | 36,847 | ||||||
| 6,560 | Spire Global, Inc. (a) | 22,173 | ||||||
| 6,674 | Stem, Inc. (a) | 126,606 | ||||||
| 3,758 | Velo3D, Inc. (a) | 29,350 | ||||||
| 6,350 | Vertical Aerospace, Ltd. (a) | 42,735 | ||||||
| 17,502 | Vertiv Holdings Company | 437,025 | ||||||
| 7,394 | View, Inc. (a) | 28,911 | ||||||
| 12,056 | Virgin Galactic Holdings, Inc. (a) | 161,309 | ||||||
| 7,913 | Virgin Orbit Holdings, Inc. (a) | 63,620 | ||||||
| 8,627 | Wallbox NV (a) | 140,965 | ||||||
| 10,628 | Wheels Up Experience, Inc. (a) | 49,314 | ||||||
| 6,650 | Xos, Inc. (a) | 20,947 | ||||||
| 3,623,926 | ||||||||
Information Technology — 8.4% | ||||||||
| 5,734 | Aeva Technologies, Inc. (a) | 43,349 | ||||||
| 6,346 | AEye, Inc. (a) | 30,715 | ||||||
| 3,844 | AgileThought, Inc. (a) | 18,144 | ||||||
| 3,989 | Airspan Networks Holdings, Inc. (a) | 15,118 | ||||||
| 3,899 | Arbe Robotics, Ltd. (a) | 36,261 | ||||||
| 1,826 | Arqit Quantum, Inc. (a) | 43,733 | ||||||
| 6,414 | AvePoint, Inc. (a) | 40,344 | ||||||
| 7,514 | BigBear.ai Holdings, Inc. (a) | 42,529 | ||||||
| 4,310 | BTRS Holdings, Inc. - Class A (a) | 33,704 | ||||||
| 4,932 | CCC Intelligent Solutions Holdings, Inc. (a) | 56,176 | ||||||
| 2,660 | Cellebrite DI, Ltd. (a) | 21,333 | ||||||
| 3,356 | Cipher Mining, Inc. (a) | 15,538 | ||||||
| 5,639 | Cvent Holding Corporation (a) | 46,071 | ||||||
| 3,706 | Cyxtera Technologies, Inc. (a) | 46,733 | ||||||
| 11,748 | E2open Parent Holdings, Inc. (a) | 132,283 | ||||||
| 8,609 | Embark Technology, Inc. (a) | 74,726 | ||||||
| 5,444 | Evolv Technologies Holdings, Inc. (a) | 24,280 | ||||||
| 2,393 | Grid Dynamics Holdings, Inc. (a) | 90,862 | ||||||
| 3,180 | indie Semiconductor, Inc. - Class A (a) | 38,128 | ||||||
| 6,087 | Innoviz Technologies, Ltd. (a) | 38,592 | ||||||
| 8,501 | IonQ, Inc. (a) | 141,967 | ||||||
| 2,856 | IronNet, Inc. (a) | 11,995 | ||||||
| 19,807 | ironSource, Ltd. - Class A (a) | 153,306 | ||||||
| 2,587 | Kaleyra, Inc. (a) | 25,973 | ||||||
| 6,195 | Latch, Inc. (a) | 46,896 | ||||||
| 4,826 | LiveVox Holdings, Inc. (a) | 24,854 | ||||||
| 11,403 | Matterport, Inc. (a) | 235,358 | ||||||
| 12,179 | Mirion Technologies, Inc. (a) | 127,514 | ||||||
| 9,652 | Navitas Semiconductor Corporation (a) | 164,181 | ||||||
| 3,705 | NextNav, Inc. (a) | 32,456 | ||||||
| 4,389 | Ouster, Inc. (a) | 22,823 | ||||||
| 4,983 | Paya Holdings, Inc. (a) | 31,592 | ||||||
| 13,217 | Payoneer Global, Inc. (a) | 97,145 | ||||||
| 21,604 | Paysafe, Ltd. (a) | 84,472 | ||||||
| 4,782 | Repay Holdings Corporation (a) | 87,367 | ||||||
| 6,069 | Rockley Photonics Holdings, Ltd. (a) | 26,400 | ||||||
| 4,732 | SmartRent, Inc. (a) | 45,806 | ||||||
| 4,407 | Triterras, Inc. - Class A (a) | 10,356 | ||||||
| 5,986 | Valens Semiconductor, Ltd. (a) | 46,092 | ||||||
| 6,332 | Velodyne Lidar, Inc. (a) | 29,380 | ||||||
| 3,029 | WM Technology, Inc. (a) | 18,113 | ||||||
| 2,352,665 | ||||||||
Materials — 2.2% | ||||||||
| 6,658 | Algoma Steel Group, Inc. (a) | 71,973 | ||||||
| 7,090 | Ardagh Metal Packaging SA (a) | 64,023 | ||||||
| 4,961 | Danimer Scientific, Inc. (a) | 42,268 | ||||||
| 7,283 | MP Materials Corporation (a) | 330,794 | ||||||
| 6,860 | Origin Materials, Inc. (a) | 44,247 | ||||||
| 4,445 | PureCycle Technologies, Inc. (a) | 42,538 | ||||||
| 9,389 | TMC the metals company, Inc. (a) | 19,529 | ||||||
| 615,372 | ||||||||
Real Estate — 1.2% | ||||||||
| 5,815 | Doma Holdings, Inc. (a) | 29,540 | ||||||
| 5,170 | Offerpad Solutions, Inc. (a) | 33,088 | ||||||
The accompanying notes are an integral part of these financial statements.
35
Defiance Next Gen SPAC Derived ETF
Schedule of Investments
December 31, 2021 (Continued)
Shares | Security Description | Value | ||||||
COMMON STOCKS — 60.2% (Continued) | ||||||||
Real Estate — 1.2% (Continued) | ||||||||
| 19,377 | Opendoor Technologies, Inc. (a) | $ | 283,098 | |||||
| 345,726 | ||||||||
Utilities — 0.4% | ||||||||
| 8,364 | Altus Power, Inc. (a) | 87,404 | ||||||
| 5,198 | ReNew Energy Global plc, Class A (a) | 40,440 | ||||||
| 127,844 | ||||||||
TOTAL COMMON STOCKS (Cost $23,920,753) | 16,909,641 | |||||||
SPECIAL PURPOSE ACQUISITION COMPANIES — 39.6% | ||||||||
| 4,293 | 26 Capital Acquisition Corporation - Class A (a) | 42,286 | ||||||
| 3,589 | ACE Convergence Acquisition Corporation - Class A (a) | 35,746 | ||||||
| 2,771 | Adit EdTech Acquisition Corporation (a) | 27,433 | ||||||
| 3,286 | AEA-Bridges Impact Corporation - Class A (a) | 32,827 | ||||||
| 10,399 | AltC Acquisition Corporation - Class A (a) | 102,430 | ||||||
| 8,663 | Altimeter Growth Corporation 2 - Class A (a) | 85,417 | ||||||
| 6,238 | Altitude Acquisition Corporation - Class A (a) | 61,756 | ||||||
| 12,572 | Apollo Strategic Growth Capital - Class A (a) | 124,086 | ||||||
| 14,243 | Apollo Strategic Growth Capital II - Class A (a) | 139,297 | ||||||
| 2,733 | ArcLight Clean Transition Corporation II - Class A (a) | 27,275 | ||||||
| 20,459 | Ares Acquisition Corporation - Class A (a) | 199,271 | ||||||
| 2,745 | Artisan Acquisition Corporation - Class A (a) | 27,203 | ||||||
| 2,762 | Aurora Acquisition Corporation - Class A (a) | 27,344 | ||||||
| 14,038 | Austerlitz Acquisition Corporation I - Class A (a) | 136,309 | ||||||
| 28,123 | Austerlitz Acquisition Corporation II - Class A (a) | 273,356 | ||||||
| 10,919 | Avanti Acquisition Corporation - Class A (a) | 107,225 | ||||||
| 2,972 | Biotech Acquisition Company - Class A (a) | 29,244 | ||||||
| 12,631 | Bluescape Opportunities Acquisition Corporation - Class A (a) | 123,658 | ||||||
| 3,260 | Bridgetown 2 Holdings, Ltd. - Class A (a) | 32,307 | ||||||
| 10,808 | Bridgetown Holdings, Ltd. - Class A (a) | 106,135 | ||||||
| 7,163 | Burgundy Technology Acquisition Corporation - Class A (a) | 71,702 | ||||||
| 2,742 | Capstar Special Purpose Acquisition Corporation - Class A (a) | 27,310 | ||||||
| 5,403 | Cartesian Growth Corporation - Class A (a) | 53,382 | ||||||
| 16,999 | CC Neuberger Principal Holdings II - Class A (a) | 168,290 | ||||||
| 4,363 | CF Acquisition Corporation IV - Class A (a) | 42,757 | ||||||
| 5,212 | CF Acquisition Corporation V - Class A (a) | 50,556 | ||||||
| 10,391 | Churchill Capital Corporation V - Class A (a) | 102,247 | ||||||
| 2,981 | Churchill Capital Corporation VI - Class A (a) | 29,154 | ||||||
| 28,141 | Churchill Capital Corporation VII - Class A (a) | 276,626 | ||||||
| 5,739 | CITIC Capital Acquisition Corporation - Class A (a) | 57,447 | ||||||
| 17,115 | Cohn Robbins Holdings Corporation - Class A (a) | 168,240 | ||||||
| 16,264 | Compute Health Acquisition Corporation - Class A (a) | 158,249 | ||||||
| 5,778 | Concord Acquisition Corporation - Class A (a) | 60,091 | ||||||
| 15,326 | Conx Corporation - Class A (a) | 150,501 | ||||||
| 8,235 | Decarbonization Plus Acquisition Corporation II - Class A (a) | 82,103 | ||||||
| 4,325 | Digital World Acquisition Corporation - Class A (a) | 222,435 | ||||||
| 6,093 | DPCM Capital, Inc. - Class A (a) | 59,833 | ||||||
| 8,367 | Dragoneer Growth Opportunities Corporation III - Class A (a) | 81,746 | ||||||
| 12,347 | E.Merge Technology Acquisition Corporation - Class A (a) | 121,495 | ||||||
| 7,174 | ECP Environmental Growth Opportunities Corporation - Class A (a) | 70,736 | ||||||
| 2,764 | EJF Acquisition Corporation - Class A (a) | 27,447 | ||||||
| 4,248 | Environmental Impact Acquisition Corporation - Class A (a) | 42,140 | ||||||
| 8,557 | Equity Distribution Acquisition Corporation - Class A (a) | 84,030 | ||||||
The accompanying notes are an integral part of these financial statements.
36
Defiance Next Gen SPAC Derived ETF
Schedule of Investments
December 31, 2021 (Continued)
Shares | Security Description | Value | ||||||
SPECIAL PURPOSE ACQUISITION COMPANIES — 39.6% (Continued) | ||||||||
| 6,132 | Executive Network Partnering Corporation - Class A (a) | $ | 60,155 | |||||
| 12,335 | Far Peak Acquisition Corporation - Class A (a) | 124,090 | ||||||
| 4,160 | Fast Acquisition Corporation - Class A (a) | 42,266 | ||||||
| 5,161 | Fintech Acquisition Corporation V - Class A (a) | 51,197 | ||||||
| 2,762 | First Reserve Sustainable Growth Corporation - Class A (a) | 27,344 | ||||||
| 8,609 | FirstMark Horizon Acquisition Corporation - Class A (a) | 85,143 | ||||||
| 7,266 | FTAC Hera Acquisition Corporation - Class A (a) | 70,989 | ||||||
| 5,315 | G Squared Ascend I, Inc. - Class A (a) | 52,512 | ||||||
| 11,899 | GO Acquisition Corporation - Class A (a) | 117,086 | ||||||
| 16,408 | Gores Guggenheim, Inc. - Class A (a) | 191,974 | ||||||
| 11,324 | Gores Holdings VII, Inc. - Class A (a) | 110,749 | ||||||
| 9,128 | Gores Metropoulos II, Inc. - Class A (a) | 91,006 | ||||||
| 9,613 | Health Assurance Acquisition Corporation - Class A (a) | 93,919 | ||||||
| 4,248 | Healthcare Capital Corporation - Class A (a) | 41,928 | ||||||
| 5,199 | Heliogen, Inc. (a) | 80,688 | ||||||
| 7,161 | Hennessy Capital Investment Corporation V - Class A (a) | 69,748 | ||||||
| 8,535 | HH&L Acquisition Company - Class A (a) | 83,046 | ||||||
| 5,672 | HIG Acquisition Corporation - Class A (a) | 55,472 | ||||||
| 6,240 | Highland Transcend Partners I Corporation - Class A (a) | 61,901 | ||||||
| 10,775 | Horizon Acquisition Corporation II - Class A (a) | 105,918 | ||||||
| 6,231 | IG Acquisition Corporation - Class A (a) | 61,126 | ||||||
| 5,698 | Ivanhoe Capital Acquisition Corporation - Class A (a) | 56,695 | ||||||
| 21,327 | Jaws Mustang Acquisition Corporation - Class A (a) | 207,938 | ||||||
| 3,584 | JOFF Fintech Acquisition Corporation - Class A (a) | 34,944 | ||||||
| 6,951 | Khosla Ventures Acquisition Company (a) | 67,425 | ||||||
| 11,262 | Khosla Ventures Acquisition Company III - Class A (a) | 109,917 | ||||||
| 28,524 | KKR Acquisition Holdings I Corporation - Class A (a) | 277,824 | ||||||
| 11,841 | Lazard Growth Acquisition Corporation I (a) | 115,213 | ||||||
| 11,667 | Liberty Media Acquisition Corporation - Class A (a) | 119,937 | ||||||
| 4,823 | Lionheart Acquisition Corporation II - Class A (a) | 48,037 | ||||||
| 14,275 | Longview Acquisition Corporation II - Class A (a) | 140,466 | ||||||
| 7,189 | Lux Health Tech Acquisition Corporation - Class A (a) | 70,452 | ||||||
| 8,180 | M3-Brigade Acquisition II Corporation - Class A (a) | 81,064 | ||||||
| 4,394 | Mason Industrial Technology, Inc. - Class A (a) | 42,885 | ||||||
| 5,635 | MDH Acquisition Corporation - Class A (a) | 55,223 | ||||||
| 5,199 | MedTech Acquisition Corporation - Class A (a) | 51,366 | ||||||
| 8,600 | Motive Capital Corporation - Class A (a) | 84,624 | ||||||
| 6,575 | Mudrick Capital Acquisition Corporation II - Class A (a) | 65,356 | ||||||
| 8,263 | Northern Star Investment Corporation II - Class A (a) | 80,151 | ||||||
| 5,980 | Novus Capital Corporation II - Class A (a) | 59,202 | ||||||
| 2,765 | Oaktree Acquisition Corporation II - Class A (a) | 27,318 | ||||||
| 2,796 | Omnichannel Acquisition Corporation - Class A (a) | 27,820 | ||||||
| 6,733 | Pathfinder Acquisition Corporation - Class A (a) | 65,310 | ||||||
| 41,538 | Pershing Square Tontine Holdings, Ltd. - Class A (a) | 819,129 | ||||||
| 8,309 | Pioneer Merger Corporation - Class A (a) | 82,010 | ||||||
| 7,163 | Poema Global Holdings Corporation - Class A (a) | 70,770 | ||||||
| 6,055 | Pontem Corporation - Class A (a) | 59,339 | ||||||
| 7,174 | Power & Digital Infrastructure Acquisition Corporation - Class A (a) | 78,555 | ||||||
| 8,485 | Primavera Capital Acquisition Corporation - Class A (a) | 82,389 | ||||||
| 7,156 | Queen’s Gambit Growth Capital - Class A (a) | 70,844 | ||||||
The accompanying notes are an integral part of these financial statements.
37
Defiance Next Gen SPAC Derived ETF
Schedule of Investments
December 31, 2021 (Continued)
Shares | Security Description | Value | ||||||
SPECIAL PURPOSE ACQUISITION COMPANIES — 39.6% (Continued) | ||||||||
| 11,772 | RedBall Acquisition Corporation - Class A (a) | $ | 116,778 | |||||
| 8,381 | Ribbit LEAP, Ltd. - Class A (a) | 83,894 | ||||||
| 2,997 | Ross Acquisition Corporation II - Class A (a) | 29,251 | ||||||
| 11,913 | ScION Tech Growth I - Class A (a) | 116,271 | ||||||
| 4,717 | SCVX Corporation - Class A (a) | 47,123 | ||||||
| 8,587 | Senior Connect Acquisition Corporation I - Class A (a) | 83,637 | ||||||
| 7,118 | Silver Crest Acquisition Corporation - Class A (a) | 69,828 | ||||||
| 3,021 | SilverBox Engaged Merger Corporation I - Class A (a) | 30,663 | ||||||
| 7,133 | Simon Property Group Acquisition Holdings, Inc. - Class A (a) | 69,475 | ||||||
| 11,882 | Slam Corporation - Class A (a) | 115,850 | ||||||
| 9,500 | Social Capital Hedosophia Holdings Corporation IV - Class A (a) | 97,090 | ||||||
| 23,711 | Social Capital Hedosophia Holdings Corporation VI - Class A (a) | 241,615 | ||||||
| 3,926 | Social Capital Suvretta Holdings Corp I - Class A (a) | 38,985 | ||||||
| 4,017 | Social Capital Suvretta Holdings Corp II - Class A (a) | 39,728 | ||||||
| 5,333 | Social Capital Suvretta Holdings Corp IV - Class A (a) | 52,370 | ||||||
| 11,298 | Spartan Acquisition Corporation III - Class A (a) | 111,511 | ||||||
| 9,299 | Sports Entertainment Acquisition Corporation - Class A (a) | 92,246 | ||||||
| 4,218 | Spring Valley Acquisition Corporation - Class A (a) | 42,307 | ||||||
| 2,958 | Supernova Partners Acquisition Company II, Ltd. - Class A (a) | 30,438 | ||||||
| 12,027 | SVF Investment Corporation - Class A (a) | 120,751 | ||||||
| 4,875 | SVF Investment Corporation 2 - Class A (a) | 48,458 | ||||||
| 6,818 | SVF Investment Corporation 3 - Class A (a) | 68,180 | ||||||
| 6,692 | Tailwind Acquisition Corporation - Class A (a) | 65,849 | ||||||
| 2,762 | Tailwind Two Acquisition Corporation - Class A (a) | 27,316 | ||||||
| 3,407 | TCV Acquisition Corporation - Class A (a) | 33,593 | ||||||
| 3,978 | TCW Special Purpose Acquisition Corporation - Class A (a) | 38,825 | ||||||
| 7,278 | TPG Pace Beneficial Finance Corporation - Class A (a) | 71,397 | ||||||
| 10,567 | Trebia Acquisition Corporation - Class A (a) | 105,247 | ||||||
| 4,466 | USHG Acquisition Corporation - Class A (a) | 46,312 | ||||||
| 4,772 | Velocity Acquisition Corporation - Class A (a) | 46,408 | ||||||
| 3,525 | Virgin Group Acquisition Corporation II - Class A (a) | 34,792 | ||||||
| 10,156 | Vy Global Growth - Class A (a) | 99,630 | ||||||
| 4,309 | Zanite Acquisition Corporation - Class A (a) | 43,866 | ||||||
| 11,139,266 | ||||||||
TOTAL SPECIAL PURPOSE ACQUISITION COMPANIES (Cost $11,999,848) | 11,139,266 | |||||||
SHORT-TERM INVESTMENTS — 0.3% | ||||||||
| 69,147 | First American Government Obligations Fund - Class X, 0.03% (b) | 69,147 | ||||||
TOTAL SHORT-TERM INVESTMENTS (Cost $69,147) | 69,147 | |||||||
TOTAL INVESTMENTS — 100.1% (Cost $35,989,748) | 28,118,054 | |||||||
Liabilities in Excess of Other Assets (0.1)% | (20,934 | ) | ||||||
NET ASSETS — 100.0% | $ | 28,097,120 | ||||||
Percentages are stated as a percent of net assets. | |
(a) | Non-income producing security. |
(b) | Rate shown is the annualized seven-day yield as of December 31, 2021. |
The Global Industry Classification Standard (GICS®) was developed by and/or is the exclusive property of MSCI, Inc. (“MSCI”) and Standard & Poor Financial Services LLC (“S&P”). GICS® is a service mark of MSCI and S&P and has been licensed for use by U.S. Bancorp Global Fund Services, LLC.
The accompanying notes are an integral part of these financial statements.
38
Defiance Next Gen H2 ETF
Schedule of Investments
December 31, 2021
Shares | Security Description | Value | ||||||
COMMON STOCKS — 99.3% | ||||||||
Energy — 0.9% | ||||||||
| 142,694 | Everfuel AS (a) | $ | 617,813 | |||||
Industrials — 88.3% (b) | ||||||||
| 435,864 | Advent Technologies Holdings, Inc. (a) | 3,055,407 | ||||||
| 5,003,003 | AFC Energy plc (a) | 3,340,711 | ||||||
| 287,451 | Ballard Power Systems, Inc. (a) | 3,610,384 | ||||||
| 136,930 | Bloom Energy Corporation - Class A (a) | 3,002,875 | ||||||
| 734,498 | Cell Impact AB (a) | 2,166,050 | ||||||
| 259,912 | Ceres Power Holdings plc (a) | 3,508,043 | ||||||
| 87,571 | Doosan Fuel Cell Company, Ltd. (a) | 3,535,990 | ||||||
| 495,966 | FuelCell Energy, Inc. (a) | 2,579,023 | ||||||
| 77,465 | Fusion Fuel Green plc - Class A (a) | 641,410 | ||||||
| 389,474 | Gencell, Ltd. (a) | 1,326,444 | ||||||
| 330,309 | Hexagon Purus ASA (a) | 809,076 | ||||||
| 678,062 | ITM Power plc (a) | 3,618,486 | ||||||
| 129,776 | McPhy Energy SA (a) | 3,193,669 | ||||||
| 2,037,055 | NEL ASA (a) | 3,513,558 | ||||||
| 196,373 | Plug Power, Inc. (a) | 5,543,610 | ||||||
| 144,397 | PowerCell Sweden AB (a) | 2,952,102 | ||||||
| 36,773,989 | Powerhouse Energy Group plc (a) | 2,191,567 | ||||||
| 2,719,010 | Proton Motor Power Systems plc (a) | 773,377 | ||||||
| 105,820 | SFC Energy AG (a) | 3,417,624 | ||||||
| 99,977 | S-Fuelcell Company, Ltd. | 2,346,463 | ||||||
| 1,531,834 | Xebec Adsorption, Inc. (a) | 3,043,901 | ||||||
| 58,169,770 | ||||||||
Materials — 10.1% | ||||||||
| 16,331 | Air Liquide SA | 2,847,409 | ||||||
| 1,297,340 | Aker Clean Hydrogen AS (a) | 841,521 | ||||||
| 8,628 | Linde plc | 2,988,998 | ||||||
| 6,677,928 | ||||||||
TOTAL COMMON STOCKS (Cost $74,634,724) | 65,465,511 | |||||||
SHORT-TERM INVESTMENTS — 0.3% | ||||||||
| 180,933 | First American Government Obligations Fund - Class X, 0.03% (c) | $ | 180,933 | |||||
TOTAL SHORT-TERM INVESTMENTS (Cost $180,933) | 180,933 | |||||||
TOTAL INVESTMENTS — 99.6% (Cost $74,815,657) | 65,646,444 | |||||||
Other Assets in Excess of Liabilities — 0.4% | 236,364 | |||||||
NET ASSETS — 100.0% | $ | 65,882,808 | ||||||
Percentages are stated as a percent of net assets. |
(a) | Non-income producing security. |
(b) | To the extent that the Fund invests more heavily in particular sectors of the economy, its performance will be especially sensitive to developments that significantly affect those sectors. See Note 8 in Notes to Financial Statements. |
(c) | Rate shown is the annualized seven-day yield as of December 31, 2021. |
The Global Industry Classification Standard (GICS®) was developed by and/or is the exclusive property of MSCI, Inc. (“MSCI”) and Standard & Poor’s Financial Services LLC (“S&P”). GICS® is a service mark of MSCI and S&P and has been licensed for use by U.S. Bancorp Fund Services, LLC.
The accompanying notes are an integral part of these financial statements.
39
Defiance Next Gen Altered Experience ETF
Schedule of Investments
December 31, 2021
Shares | Security Description | Value | ||||||
COMMON STOCKS — 98.9% | ||||||||
Consumer Staples — 4.8% | ||||||||
| 963,424 | Neptune Wellness Solutions, Inc. (a) | $ | 395,004 | |||||
Health Care — 94.1% (b) | ||||||||
| 2,105,920 | Aleafia Health, Inc. (a) | 225,072 | ||||||
| 10,690 | ALT House Cannabis, Inc. (a)(c)(d) | 0 | ||||||
| 40,180 | ATAI Life Sciences NV (a) | 306,573 | ||||||
| 93,016 | Aurora Cannabis, Inc. (a) | 504,421 | ||||||
| 168,532 | Cardiol Therapeutics, Inc. - Class A (a) | 310,873 | ||||||
| 267,092 | cbdMD, Inc. (a) | 288,459 | ||||||
| 288,876 | Charlottes Web Holdings, Inc. (a) | 292,730 | ||||||
| 20,748 | Compass Pathways plc - ADR (a) | 458,531 | ||||||
| 537,236 | Corbus Pharmaceuticals Holdings, Inc. (a) | 330,776 | ||||||
| 98,056 | Cronos Group, Inc. (a) | 386,588 | ||||||
| 261,380 | Cybin, Inc. (a) | 313,656 | ||||||
| 133,140 | Field Trip Health, Ltd. (a) | 322,534 | ||||||
| 59,416 | Forian, Inc. (a) | 535,932 | ||||||
| 31,332 | GH Research plc (a) | 730,976 | ||||||
| 242,116 | Mind Medicine MindMed, Inc. (a) | 334,120 | ||||||
| 1,274,500 | Mydecine Innovations Group, Inc. (a) | 141,258 | ||||||
| 824,600 | Numinus Wellness, Inc. (a) | 345,991 | ||||||
| 657,484 | PharmaCielo, Ltd. (a) | 510,101 | ||||||
| 320,068 | Seelos Therapeutics, Inc. (a) | 521,711 | ||||||
| 168,308 | Skylight Health Group, Inc. (a) | 220,483 | ||||||
| 2,465,000 | Tetra Bio-Pharma, Inc. (a) | 243,934 | ||||||
| 154,588 | Zynerba Pharmaceuticals, Inc. (a) | 445,213 | ||||||
| 7,769,932 | ||||||||
TOTAL COMMON STOCKS (Cost $13,700,705) | 8,164,936 | |||||||
SHORT-TERM INVESTMENTS — 0.2% | ||||||||
| 16,079 | First American Government Obligations Fund - Class X, 0.03% (e) | $ | 16,079 | |||||
TOTAL SHORT-TERM INVESTMENTS (Cost $16,079) | 16,079 | |||||||
TOTAL INVESTMENTS — 99.1% (Cost $13,716,784) | 8,181,015 | |||||||
Other Assets in Excess of Liabilities — 0.9% | 76,689 | |||||||
NET ASSETS — 100.0% | $ | 8,257,704 | ||||||
Percentages are stated as a percent of net assets. | |
ADR | American Depositary Receipt. |
(a) | Non-income producing security. |
(b) | To the extent that the Fund invests more heavily in particular sectors of the economy, its performance will be especially sensitive to developments that significantly affect those sectors. See Note 8 in Notes to Financial Statements. |
(c) | Value determined using significant unobservable inputs. Classified as Level 3 in the fair value hierarchy. |
(d) | This security has been deemed illiquid according to the Fund’s liquidity guidelines. The value of this security is $0 which represents 0.00% of net assets. |
(e) | Rate shown is the annualized seven-day yield as of December 31, 2021. |
The Global Industry Classification Standard (GICS®) was developed by and/or is the exclusive property of MSCI, Inc. (“MSCI”) and Standard & Poor’s Financial Services LLC (“S&P”). GICS® is a service mark of MSCI and S&P and has been licensed for use by U.S. Bancorp Fund Services, LLC.
The accompanying notes are an integral part of these financial statements.
40
Defiance Hotel, Airline, and Cruise ETF
Schedule of Investments
December 31, 2021
| Shares | Security Description | Value | ||||||
| COMMON STOCKS — 99.3% | ||||||||
| Consumer Discretionary — 45.6% (a) | ||||||||
| 12,169 | Accor SA (b) | $ | 393,709 | |||||
| 71,638 | Carnival Corporation (b) | 1,441,356 | ||||||
| 2,107 | Choice Hotels International, Inc. | 328,671 | ||||||
| 11,567 | Hilton Worldwide Holdings, Inc. (b) | 1,804,336 | ||||||
| 10,062 | Huazhu Group, Ltd. - ADR (b) | 375,715 | ||||||
| 2,408 | Hyatt Hotels Corporation - Class A (b) | 230,927 | ||||||
| 9,632 | InterContinental Hotels Group plc - ADR (b) | 628,103 | ||||||
| 11,395 | Marriott International, Inc. - Class A (b) | 1,882,910 | ||||||
| 237,100 | Minor International pcl (b) | 204,060 | ||||||
| 16,900 | Minor International pcl - Foreign Shares (b) | 14,545 | ||||||
| 31,519 | Norwegian Cruise Line Holdings, Ltd. (b) | 653,704 | ||||||
| 7,100 | Resorttrust, Inc. | 115,852 | ||||||
| 17,071 | Royal Caribbean Cruises, Ltd. (b) | 1,312,760 | ||||||
| 154,000 | Shangri-La Asia, Ltd. (b) | 128,592 | ||||||
| 11,653 | Whitbread plc (b) | 472,711 | ||||||
| 4,386 | Wyndham Hotels & Resorts, Inc. | 393,205 | ||||||
| 10,381,156 | ||||||||
| Industrials — 45.1% (a) | ||||||||
| 22,790 | Air Canada (b) | 381,232 | ||||||
| 138,000 | Air China, Ltd. - H-Shares (b) | 96,292 | ||||||
| 23,736 | Air France-KLM (b) | 104,489 | ||||||
| 6,708 | Alaska Air Group, Inc. (b) | 349,487 | ||||||
| 731 | Allegiant Travel Company (b) | 136,726 | ||||||
| 37,582 | American Airlines Group, Inc. (b) | 674,973 | ||||||
| 11,100 | ANA Holdings, Inc. (b) | 231,774 | ||||||
| 222,000 | China Airlines, Ltd. (b) | 221,061 | ||||||
| 102,000 | China Southern Airlines Company, Ltd. - H-Shares (b) | 61,098 | ||||||
| 5,934 | Controladora Vuela Cia de Aviacion SAB de CV - ADR (b) | 106,634 | ||||||
| 860 | Copa Holdings SA - Class A (b) | 71,088 | ||||||
| 37,195 | Delta Air Lines, Inc. (b) | 1,453,580 | ||||||
| 40,936 | Deutsche Lufthansa AG (b) | 287,695 | ||||||
| 45,193 | easyJet plc (b) | 340,335 | ||||||
| 232,000 | Eva Airways Corporation (b) | 234,373 | ||||||
| 860 | Hanjin Kal Corporation (b) | 44,420 | ||||||
| 259,849 | International Consolidated Airlines Group SA (b) | 503,534 | ||||||
| 10,200 | Japan Airlines Company, Ltd. (b) | 194,513 | ||||||
| 14,620 | JetBlue Airways Corporation (b) | 208,189 | ||||||
| 11,911 | Korean Air Lines Company, Ltd. (b) | 294,080 | ||||||
| 124,442 | Qantas Airways, Ltd. (b) | 453,283 | ||||||
| 9,546 | Ryanair Holdings plc - ADR (b) | 976,842 | ||||||
| 93,400 | Singapore Airlines, Ltd. (b) | 345,708 | ||||||
| 2,150 | SkyWest, Inc. (b) | 84,495 | ||||||
| 28,595 | Southwest Airlines Company (b) | 1,225,010 | ||||||
| 5,848 | Spirit Airlines, Inc. (b) | 127,779 | ||||||
| 18,619 | United Airlines Holdings, Inc. (b) | 815,140 | ||||||
| 4,128 | Wizz Air Holdings plc (b) | 234,157 | ||||||
| 10,257,987 | ||||||||
| Real Estate — 8.6% | ||||||||
| 13,287 | Apple Hospitality REIT, Inc. | 214,585 | ||||||
| 10,492 | DiamondRock Hospitality Company (b) | 100,828 | ||||||
| 26,617 | Host Hotels & Resorts, Inc. (b) | 462,870 | ||||||
| 387 | Invincible Investment Corporation | 122,329 | ||||||
| 301 | Japan Hotel REIT Investment Corporation | 146,900 | ||||||
| 10,535 | Park Hotels & Resorts, Inc. (b) | 198,901 | ||||||
| 6,149 | Pebblebrook Hotel Trust | 137,553 | ||||||
| 7,353 | RLJ Lodging Trust | 102,427 | ||||||
| 2,795 | Ryman Hospitality Properties, Inc. (b) | 257,028 | ||||||
| 9,976 | Service Properties Trust | 87,689 | ||||||
| 11,223 | Sunstone Hotel Investors, Inc. (b) | 131,646 | ||||||
| 1,962,756 | ||||||||
| TOTAL COMMON STOCKS (Cost $23,121,254) | 22,601,899 | |||||||
| PREFERRED STOCKS — 0.3% | ||||||||
| Industrials — 0.3% | ||||||||
| 5,074 | Azul SA - ADR (b) | 66,977 | ||||||
| TOTAL PREFERRED STOCKS (Cost $99,776) | 66,977 | |||||||
The accompanying notes are an integral part of these financial statements.
41
Defiance Hotel, Airline, and Cruise ETF
Schedule of Investments
December 31, 2021 (Continued)
| Shares | Security Description | Value | ||||||
| SHORT-TERM INVESTMENTS — 0.4% | ||||||||
| 82,904 | First American Government Obligations Fund - Class X, 0.03% (c) | $ | 82,904 | |||||
| TOTAL SHORT-TERM INVESTMENTS (Cost $82,904) | 82,904 | |||||||
| TOTAL INVESTMENTS — 100.0% (Cost $23,303,934) | 22,751,780 | |||||||
| Liabilities in Excess of Other Assets — (0.0)% (d) | (880 | ) | ||||||
| NET ASSETS — 100.0% | $ | 22,750,900 | ||||||
Percentages are stated as a percent of net assets. | |
ADR | American Depositary Receipt. |
(a) | To the extent that the Fund invests more heavily in particular sectors of the economy, its performance will be especially sensitive to developments that significantly affect those sectors. See Note 8 in Notes to Financial Statements. |
(b) | Non-income producing security. |
(c) | Rate shown is the annualized seven-day yield as of December 31, 2021. |
(d) | Represents less than 0.05% of net assets. |
The Global Industry Classification Standard (GICS®) was developed by and/or is the exclusive property of MSCI, Inc. (“MSCI”) and Standard & Poor’s Financial Services LLC (“S&P”). GICS® is a service mark of MSCI and S&P and has been licensed for use by U.S. Bancorp Fund Services, LLC.
The accompanying notes are an integral part of these financial statements.
42
Defiance Next Gen Big Data ETF
Schedule of Investments
December 31, 2021
| Shares | Security Description | Value | ||||||
| COMMON STOCKS — 99.7% | ||||||||
| Industrials — 3.5% | ||||||||
| 3,548 | Clarivate plc (a) | $ | 83,449 | |||||
| Information Technology — 96.2% (b) | ||||||||
| 1,320 | Alteryx, Inc. - Class A (a) | 79,860 | ||||||
| 1,212 | Appian Corporation (a) | 79,035 | ||||||
| 228 | Atlassian Corporation plc - Class A (a) | 86,934 | ||||||
| 2,160 | Atos SE | 91,843 | ||||||
| 552 | Cloudflare, Inc. - Class A (a) | 72,588 | ||||||
| 1,284 | Confluent, Inc. - Class A (a) | 97,892 | ||||||
| 1,684 | Domo, Inc. - Class B (a) | 83,526 | ||||||
| 1,364 | Dynatrace, Inc. (a) | 82,317 | ||||||
| 688 | Elastic NV (a) | 84,686 | ||||||
| 2,048 | Fastly, Inc. - Class A (a) | 72,602 | ||||||
| 1,592 | GB Group plc | 15,924 | ||||||
| 2,032 | Informatica, Inc. - Class A (a) | 75,143 | ||||||
| 2,732 | JFrog, Ltd. (a) | 81,140 | ||||||
| 5,372 | Kingsoft Cloud Holdings, Ltd. - ADR (a) | 84,609 | ||||||
| 140 | MicroStrategy, Inc. - Class A (a) | 76,229 | ||||||
| 168 | MongoDB, Inc. (a) | 88,931 | ||||||
| 836 | New Relic, Inc. (a) | 91,927 | ||||||
| 2,376 | PagerDuty, Inc. (a) | 82,566 | ||||||
| 4,464 | Palantir Technologies, Inc. - Class A (a) | 81,289 | ||||||
| 644 | Perficient, Inc. (a) | 83,263 | ||||||
| 1,748 | Progress Software Corporation | 84,376 | ||||||
| 240 | Snowflake, Inc. - Class A (a) | 81,300 | ||||||
| 776 | Software AG | 30,957 | ||||||
| 3,836 | SolarWinds Corporation | 54,433 | ||||||
| 740 | Splunk, Inc. (a) | 85,633 | ||||||
| 828 | Sprout Social, Inc. - Class A (a) | 75,091 | ||||||
| 2,012 | Teradata Corporation (a) | 85,450 | ||||||
| 320 | Twilio, Inc. - Class A (a) | 84,269 | ||||||
| 772 | VMware, Inc. - Class A | 89,459 | ||||||
| 2,263,272 | ||||||||
| TOTAL COMMON STOCKS (Cost $2,497,793) | 2,346,721 | |||||||
| SHORT-TERM INVESTMENTS — 0.3% | ||||||||
| 7,128 | First American Government Obligations Fund - Class X, 0.03% (c) | $ | 7,128 | |||||
| TOTAL SHORT-TERM INVESTMENTS (Cost $7,128) | 7,128 | |||||||
| TOTAL INVESTMENTS — 100.0% (Cost $2,504,921) | 2,353,849 | |||||||
| Liabilities in Excess of Other Assets — (0.0)% (d) | (917 | ) | ||||||
| NET ASSETS — 100.0% | $ | 2,352,932 | ||||||
Percentages are stated as a percent of net assets. | |
ADR | American Depositary Receipt. |
(a) | Non-income producing security. |
(b) | To the extent that the Fund invests more heavily in particular sectors of the economy, its performance will be especially sensitive to developments that significantly affect those sectors. See Note 8 in Notes to Financial Statements. |
(c) | Rate shown is the annualized seven-day yield as of December 31, 2021. |
(d) | Represents less than 0.05% of net assets. |
The Global Industry Classification Standard (GICS®) was developed by and/or is the exclusive property of MSCI, Inc. (“MSCI”) and Standard & Poor’s Financial Services LLC (“S&P”). GICS® is a service mark of MSCI and S&P and has been licensed for use by U.S. Bancorp Fund Services, LLC.
The accompanying notes are an integral part of these financial statements.
43
Defiance Digital Revolution ETF
Schedule of Investments
December 31, 2021
| Shares | Security Description | Value | ||||||
| COMMON STOCKS — 99.4% | ||||||||
| Communication Services — 0.7% | ||||||||
| 163,719 | Atari SA (a) | $ | 70,470 | |||||
| Consumer Discretionary — 17.4% | ||||||||
| 15,910 | DraftKings, Inc. - Class A (a) | 437,048 | ||||||
| 6,732 | eBay, Inc. | 447,678 | ||||||
| 15,734 | Funko, Inc. - Class A (a) | 295,799 | ||||||
| 12,717 | PLBY Group, Inc. (a) | 338,781 | ||||||
| 85,662 | Vinco Ventures, Inc. (a) | 203,875 | ||||||
| 1,723,181 | ||||||||
| Financials — 22.8% | ||||||||
| 2,602 | Bitcoin Group SE (a) | 120,432 | ||||||
| 1,698 | Coinbase Global, Inc. - Class A (a) | 428,524 | ||||||
| 117,084 | DeFi Technologies, Inc. (a) | 279,930 | ||||||
| 23,243 | EQONEX, Ltd. (a) | 43,464 | ||||||
| 42,583 | Mogo, Inc. (a) | 145,298 | ||||||
| 20,944 | Robinhood Markets, Inc. - Class A (a) | 371,965 | ||||||
| 17,200 | SBI Holdings, Inc. | 468,256 | ||||||
| 2,748 | Silvergate Capital Corporation - Class A (a) | 407,254 | ||||||
| 2,265,123 | ||||||||
| Industrials — 1.3% | ||||||||
| 157,552 | SOS, Ltd. - ADR (a) | 129,539 | ||||||
| Information Technology — 57.2% (b) | ||||||||
| 3,973,342 | Arcane Crypto AB (a) | 71,797 | ||||||
| 277,566 | Argo Blockchain plc (a) | 367,677 | ||||||
| 23,548 | Banxa Holdings, Inc. (a) | 56,300 | ||||||
| 154,486 | BIGG Digital Assets, Inc. (a) | 127,194 | ||||||
| 25,576 | BIT Mining, Ltd. - ADR (a) | 157,037 | ||||||
| 71,980 | Bitfarms, Ltd. (a) | 363,561 | ||||||
| 2,489 | Block, Inc. (a) | 401,998 | ||||||
| 59,968 | Canaan, Inc. - ADR (a) | 308,835 | ||||||
| 23,923 | Cleanspark, Inc. (a) | 227,747 | ||||||
| 2,826 | Cloudflare, Inc. - Class A (a) | 371,619 | ||||||
| 11,989 | Digihost Technology, Inc. (a) | 56,663 | ||||||
| 113,572 | DMG Blockchain Solutions, Inc. (a) | 71,030 | ||||||
| 22,275 | Ether Capital Corporation (a) | 78,826 | ||||||
| 144,321 | Hive Blockchain Technologies, Ltd. (a) | 378,184 | ||||||
| 48,389 | Hut 8 Mining Corporation (a) | 380,400 | ||||||
| 29,249 | Iris Energy, Ltd. (a) | 472,956 | ||||||
| 10,839 | Marathon Digital Holdings, Inc. (a) | 356,170 | ||||||
| 34,551 | Mawson Infrastructure Group, Inc. (a) | 229,073 | ||||||
| 4,124 | Northern Data AG (a) | 361,117 | ||||||
| 15,759 | Riot Blockchain, Inc. (a) | 351,899 | ||||||
| 34,567 | Voyager Digital, Ltd. (a) | 432,105 | ||||||
| 56,436 | WISeKey International Holding, Ltd. (a) | $ | 46,826 | |||||
| 5,669,014 | ||||||||
| TOTAL COMMON STOCKS (Cost $11,304,002) | 9,857,327 | |||||||
| SHORT-TERM INVESTMENTS — 0.6% | ||||||||
| 58,394 | First American Government Obligations Fund - Class X, 0.03% (c) | 58,394 | ||||||
| TOTAL SHORT-TERM INVESTMENTS (Cost $58,394) | 58,394 | |||||||
| TOTAL INVESTMENTS — 100.0% (Cost $11,362,396) | 9,915,721 | |||||||
| Liabilities in Excess of Other Assets — (0.0)% (d) | (4,094 | ) | ||||||
| NET ASSETS — 100.0% | $ | 9,911,627 | ||||||
Percentages are stated as a percent of net assets. | |
ADR | American Depositary Receipt. |
(a) | Non-income producing security. |
(b) | To the extent that the Fund invests more heavily in particular sectors of the economy, its performance will be especially sensitive to developments that significantly affect those sectors. See Note 8 in Notes to Financial Statements. |
(c) | Rate shown is the annualized seven-day yield as of December 31, 2021. |
(d) | Represents less than 0.05% of net assets. |
The Global Industry Classification Standard (GICS®) was developed by and/or is the exclusive property of MSCI, Inc. (“MSCI”) and Standard & Poor’s Financial Services LLC (“S&P”). GICS® is a service mark of MSCI and S&P and has been licensed for use by U.S. Bancorp Fund Services, LLC.
The accompanying notes are an integral part of these financial statements.
44
Defiance ETFs
Statements of Assets and Liabilities
December 31, 2021
Defiance | Defiance | Defiance | Defiance | |||||||||||||
ASSETS | ||||||||||||||||
Investments in securities, at value * + (Note 2) | $ | 205,230,344 | $ | 1,515,805,536 | $ | 28,118,054 | $ | 65,646,444 | ||||||||
Foreign currency, at value* | — | — | — | 18,042 | ||||||||||||
Reclaims receivable | 43,332 | 216,015 | — | 3,191 | ||||||||||||
Dividends and interest receivable | 8,865 | 1,240,109 | 1,488 | 6,895 | ||||||||||||
Securities lending income receivable | 6,277 | 25,457 | — | — | ||||||||||||
Transaction fees receivable | 12 | — | — | — | ||||||||||||
Receivable for securities sold | — | — | 2,460,750 | 302,052 | ||||||||||||
Receivable for capital shares sold | — | 270 | — | — | ||||||||||||
Total assets | 205,288,830 | 1,517,287,387 | 30,580,292 | 65,976,624 | ||||||||||||
LIABILITIES | ||||||||||||||||
Collateral received for securities loaned (Note 4) | 26,811,367 | 133,207,282 | — | — | ||||||||||||
Management fees payable | 59,092 | 345,461 | 12,657 | 17,250 | ||||||||||||
Payable for securities purchased | — | — | 880,013 | 76,566 | ||||||||||||
Payable for capital shares redeemed | — | — | 1,590,502 | — | ||||||||||||
Total liabilities | 26,870,459 | 133,552,743 | 2,483,172 | 93,816 | ||||||||||||
NET ASSETS | $ | 178,418,371 | $ | 1,383,734,644 | $ | 28,097,120 | $ | 65,882,808 | ||||||||
Net Assets Consist of: | ||||||||||||||||
Paid-in capital | $ | 148,723,847 | $ | 1,132,016,935 | $ | 46,187,293 | $ | 82,960,150 | ||||||||
Total distributable earnings (accumulated deficit) | 29,694,524 | 251,717,709 | (18,090,173 | ) | (17,077,342 | ) | ||||||||||
Net assets | $ | 178,418,371 | $ | 1,383,734,644 | $ | 28,097,120 | $ | 65,882,808 | ||||||||
Net Asset Value: | ||||||||||||||||
Net assets | $ | 178,418,371 | $ | 1,383,734,644 | $ | 28,097,120 | $ | 65,882,808 | ||||||||
Shares outstanding ^ | 3,200,000 | 33,200,000 | 1,325,000 | 3,450,000 | ||||||||||||
Net asset value, offering and redemption price per share | $ | 55.76 | $ | 41.68 | $ | 21.21 | $ | 19.10 | ||||||||
* Identified cost: | ||||||||||||||||
Investments in securities | $ | 174,789,162 | $ | 1,251,590,033 | $ | 35,989,748 | $ | 74,815,657 | ||||||||
Foreign currency | — | — | — | 17,868 | ||||||||||||
+ Includes loaned securities with a value of | $ | 25,853,031 | $ | 128,825,716 | $ | — | $ | — | ||||||||
^ | No par value, unlimited number of shares authorized. |
The accompanying notes are an integral part of these financial statements.
45
Defiance ETFs
Statements of Assets and Liabilities
December 31, 2021 (Continued)
Defiance | Defiance | Defiance | Defiance | |||||||||||||
ASSETS | ||||||||||||||||
Investments in securities, at value * + (Note 2) | $ | 8,181,015 | $ | 22,751,780 | $ | 2,353,849 | $ | 9,915,721 | ||||||||
Foreign currency, at value* | — | 5,523 | — | — | ||||||||||||
Reclaims receivable | — | 32 | — | — | ||||||||||||
Dividends and interest receivable | — | 774 | — | 1 | ||||||||||||
Securities lending income receivable | — | — | — | — | ||||||||||||
Transaction fees receivable | — | 163 | — | — | ||||||||||||
Receivable for securities sold | 82,329 | — | — | — | ||||||||||||
Receivable for capital shares sold | — | — | — | — | ||||||||||||
Total assets | 8,263,344 | 22,758,272 | 2,353,849 | 9,915,722 | ||||||||||||
LIABILITIES | ||||||||||||||||
Collateral received for securities loaned (Note 4) | — | — | — | — | ||||||||||||
Management fees payable | 5,640 | 7,372 | 917 | 4,095 | ||||||||||||
Payable for securities purchased | — | — | — | — | ||||||||||||
Payable for capital shares redeemed | — | — | — | — | ||||||||||||
Total liabilities | 5,640 | 7,372 | 917 | 4,095 | ||||||||||||
NET ASSETS | $ | 8,257,704 | $ | 22,750,900 | $ | 2,352,932 | $ | 9,911,627 | ||||||||
Net Assets Consist of: | ||||||||||||||||
Paid-in capital | $ | 15,582,978 | $ | 23,636,411 | $ | 2,482,000 | $ | 11,777,934 | ||||||||
Total distributable earnings (accumulated deficit) | (7,325,274 | ) | (885,511 | ) | (129,068 | ) | (1,866,307 | ) | ||||||||
Net assets | $ | 8,257,704 | $ | 22,750,900 | $ | 2,352,932 | $ | 9,911,627 | ||||||||
Net Asset Value: | ||||||||||||||||
Net assets | $ | 8,257,704 | $ | 22,750,900 | $ | 2,352,932 | $ | 9,911,627 | ||||||||
Shares outstanding ^ | 700,000 | 1,075,000 | 100,000 | 540,000 | ||||||||||||
Net asset value, offering and redemption price per share | $ | 11.80 | $ | 21.16 | $ | 23.53 | $ | 18.35 | ||||||||
* Identified cost: | ||||||||||||||||
Investments in securities | $ | 13,716,784 | $ | 23,303,934 | $ | 2,504,921 | $ | 11,362,396 | ||||||||
Foreign currency | — | 5,488 | — | — | ||||||||||||
+ Includes loaned securities with a value of | $ | — | $ | — | $ | — | $ | — | ||||||||
^ | No par value, unlimited number of shares authorized. |
The accompanying notes are an integral part of these financial statements.
46
Defiance ETFs
Statements of Operations
For the Year/Period Ended December 31, 2021
Defiance | Defiance | Defiance | Defiance | |||||||||||||
INCOME | ||||||||||||||||
Dividends* | $ | 1,153,278 | $ | 19,104,061 | $ | 43,687 | $ | 50,603 | ||||||||
Securities lending income, net (Note 4) | 19,022 | 292,817 | — | — | ||||||||||||
Interest | 184 | 1,016 | 54 | 40 | ||||||||||||
Total investment income | 1,172,484 | 19,397,894 | 43,741 | 50,643 | ||||||||||||
EXPENSES | ||||||||||||||||
Management fees | 463,873 | 3,664,995 | 253,409 | 99,173 | ||||||||||||
Miscellaneous expense | — | — | — | — | ||||||||||||
Net expenses | 463,873 | 3,664,995 | 253,409 | 99,173 | ||||||||||||
Net investment income (loss) | 708,611 | 15,732,899 | (209,668 | ) | (48,530 | ) | ||||||||||
REALIZED AND UNREALIZED GAIN (LOSS) ON INVESTMENTS | ||||||||||||||||
Net realized gain (loss) on: | ||||||||||||||||
Investments | 10,881,724 | 125,188,763 | (10,865,909 | ) | (7,921,474 | ) | ||||||||||
Foreign currency | (35,164 | ) | (340 | ) | — | (53,662 | ) | |||||||||
Change in unrealized appreciation (depreciation) on: | ||||||||||||||||
Investments | 19,162,359 | 129,985,117 | (11,731,293 | ) | (9,169,213 | ) | ||||||||||
Foreign currency | (1,169 | ) | 2,389 | — | 10 | |||||||||||
Net realized and unrealized gain (loss) on investments | 30,007,750 | 255,175,929 | (22,597,202 | ) | (17,144,339 | ) | ||||||||||
Net increase (decrease) in net assets resulting from operations | $ | 30,716,361 | $ | 270,908,828 | $ | (22,806,870 | ) | $ | (17,192,869 | ) | ||||||
* Net of foreign withholding taxes | $ | 99,637 | $ | 538,647 | $ | 498 | $ | 5,390 | ||||||||
(1) | The Fund commenced operations on March 9, 2021. The information presented is for the period from March 9, 2021 to December 31, 2021. |
The accompanying notes are an integral part of these financial statements.
47
Defiance ETFs
Statements of Operations
For the Year/Period Ended December 31, 2021 (Continued)
Defiance | Defiance | Defiance | Defiance | |||||||||||||
INCOME | ||||||||||||||||
Dividends* | $ | — | $ | 5,627 | $ | 9,956 | $ | — | ||||||||
Securities lending income, net (Note 4) | — | — | — | — | ||||||||||||
Interest | 4 | 6 | 3 | 1 | ||||||||||||
Total investment income | 4 | 5,633 | 9,959 | 1 | ||||||||||||
EXPENSES | ||||||||||||||||
Management fees | 36,850 | 32,664 | 5,543 | 4,095 | ||||||||||||
Miscellaneous expense | 245 | — | — | — | ||||||||||||
Net expenses | 37,095 | 32,664 | 5,543 | 4,095 | ||||||||||||
Net investment income (loss) | (37,091 | ) | (27,031 | ) | 4,416 | (4,094 | ) | |||||||||
REALIZED AND UNREALIZED GAIN (LOSS) ON INVESTMENTS | ||||||||||||||||
Net realized gain (loss) on: | ||||||||||||||||
Investments | (1,481,550 | ) | (533,893 | ) | 29,478 | (415,289 | ) | |||||||||
Foreign currency | (7,882 | ) | (5,069 | ) | (250 | ) | (249 | ) | ||||||||
Change in unrealized appreciation (depreciation) on: | ||||||||||||||||
Investments | (5,535,769 | ) | (552,154 | ) | (151,072 | ) | (1,446,675 | ) | ||||||||
Foreign currency | 391 | 33 | — | — | ||||||||||||
Net realized and unrealized gain (loss) on investments | (7,024,810 | ) | (1,091,083 | ) | (121,844 | ) | (1,862,213 | ) | ||||||||
Net increase (decrease) in net assets resulting from operations | $ | (7,061,901 | ) | $ | (1,118,114 | ) | $ | (117,428 | ) | $ | (1,866,307 | ) | ||||
* Net of foreign withholding taxes | $ | — | $ | 129 | $ | — | $ | — | ||||||||
(2) | The Fund commenced operations on May 27, 2021. The information presented is for the period from May 27, 2021 to December 31, 2021. |
(3) | The Fund commenced operations on June 3, 2021. The information presented is for the period from June 3, 2021 to December 31, 2021. |
(4) | The Fund commenced operations on July 13, 2021. The information presented is for the period from July 13, 2021 to December 31, 2021. |
(5) | The Fund commenced operations on December 1, 2021. The information presented is for the period from December 1, 2021 to December 31, 2021. |
The accompanying notes are an integral part of these financial statements.
48
Defiance Quantum ETF
Statements of Changes in Net Assets
Year | Year | |||||||
OPERATIONS | ||||||||
Net investment income (loss) | $ | 708,611 | $ | 229,549 | ||||
Net realized gain (loss) on investments | 10,846,560 | 4,444,925 | ||||||
Change in unrealized appreciation (depreciation) on investments | 19,161,190 | 9,097,521 | ||||||
Net increase (decrease) in net assets resulting from operations | 30,716,361 | 13,771,995 | ||||||
DISTRIBUTIONS TO SHAREHOLDERS | ||||||||
Net distributions to shareholders | (690,361 | ) | (221,124 | ) | ||||
Total distributions to shareholders | (690,361 | ) | (221,124 | ) | ||||
CAPITAL SHARE TRANSACTIONS | ||||||||
Proceeds from shares sold | 117,576,090 | 33,659,285 | ||||||
Payments for shares redeemed | (25,162,790 | ) | (11,832,470 | ) | ||||
Transaction fees (Note 7) | 38,397 | 4,983 | ||||||
Net increase (decrease) in net assets derived from capital share transactions (a) | 92,451,697 | 21,831,798 | ||||||
Net increase (decrease) in net assets | $ | 122,477,697 | $ | 35,382,669 | ||||
NET ASSETS | ||||||||
Beginning of year | $ | 55,940,674 | $ | 20,558,005 | ||||
End of year | $ | 178,418,371 | $ | 55,940,674 | ||||
(a) | A summary of capital share transactions is as follows: |
Shares | Shares | |||||||
Shares sold | 2,350,000 | 950,000 | ||||||
Shares redeemed | (500,000 | ) | (300,000 | ) | ||||
Net increase (decrease) | 1,850,000 | 650,000 | ||||||
The accompanying notes are an integral part of these financial statements.
49
Defiance Next Gen Connectivity ETF
Statements of Changes in Net Assets
Year | Year | |||||||
OPERATIONS | ||||||||
Net investment income (loss) | $ | 15,732,899 | $ | 5,446,296 | ||||
Net realized gain (loss) on investments and foreign currency | 125,188,423 | 4,957,822 | ||||||
Change in unrealized appreciation (depreciation) on investments and foreign currency | 129,987,506 | 131,041,762 | ||||||
Net increase (decrease) in net assets resulting from operations | 270,908,828 | 141,445,880 | ||||||
DISTRIBUTIONS TO SHAREHOLDERS | ||||||||
Net distributions to shareholders | (15,735,900 | ) | (5,446,296 | ) | ||||
Tax return of capital to shareholders | (525,022 | ) | (407,082 | ) | ||||
Total distributions to shareholders | (16,260,922 | ) | (5,853,378 | ) | ||||
CAPITAL SHARE TRANSACTIONS | ||||||||
Proceeds from shares sold | 561,836,190 | 615,223,530 | ||||||
Payments for shares redeemed | (323,041,080 | ) | (22,985,155 | ) | ||||
Transaction fees (Note 7) | — | 193 | ||||||
Net increase (decrease) in net assets derived from capital share transactions (a) | 238,795,110 | 592,238,568 | ||||||
Net increase (decrease) in net assets | $ | 493,443,016 | $ | 727,831,070 | ||||
NET ASSETS | ||||||||
Beginning of year | $ | 890,291,628 | $ | 162,460,558 | ||||
End of year | $ | 1,383,734,644 | $ | 890,291,628 | ||||
(a) | A summary of capital share transactions is as follows: |
Shares | Shares | |||||||
Shares sold | 15,150,000 | 21,050,000 | ||||||
Shares redeemed | (8,450,000 | ) | (750,000 | ) | ||||
Net increase (decrease) | 6,700,000 | 20,300,000 | ||||||
The accompanying notes are an integral part of these financial statements.
50
Defiance Next Gen SPAC Derived ETF
Statements of Changes in Net Assets
Year | Period | |||||||
OPERATIONS | ||||||||
Net investment income (loss) | $ | (209,668 | ) | $ | (10,642 | ) | ||
Net realized gain (loss) on investments and foreign currency | (10,865,909 | ) | (1,783,336 | ) | ||||
Change in unrealized appreciation (depreciation) on investments and foreign currency | (11,731,293 | ) | 3,859,599 | |||||
Net increase (decrease) in net assets resulting from operations | (22,806,870 | ) | 2,065,621 | |||||
DISTRIBUTIONS TO SHAREHOLDERS | ||||||||
Net distributions to shareholders | (448,838 | ) | — | |||||
Total distributions to shareholders | (448,838 | ) | — | |||||
CAPITAL SHARE TRANSACTIONS | ||||||||
Proceeds from shares sold | 95,397,415 | 51,598,750 | ||||||
Payments for shares redeemed | (94,792,882 | ) | (2,917,278 | ) | ||||
Transaction fees (Note 7) | 1,149 | 53 | ||||||
Net increase (decrease) in net assets derived from capital share transactions (a) | 605,682 | 48,681,525 | ||||||
Net increase (decrease) in net assets | $ | (22,650,026 | ) | $ | 50,747,146 | |||
NET ASSETS | ||||||||
Beginning of year/period | $ | 50,747,146 | $ | — | ||||
End of year/period | $ | 28,097,120 | $ | 50,747,146 | ||||
(a) | A summary of capital share transactions is as follows: |
Shares | Shares | |||||||
Shares sold | 3,300,000 | 1,900,000 | ||||||
Shares redeemed | (3,750,000 | ) | (125,000 | ) | ||||
Net increase (decrease) | (450,000 | ) | 1,775,000 | |||||
(1) | The Fund commenced operations on September 30, 2020. The information shown is for the period from September 30, 2020 to December 31, 2020. |
The accompanying notes are an integral part of these financial statements.
51
Defiance Next Gen H2 ETF
Statement of Changes in Net Assets
Period | ||||
OPERATIONS | ||||
Net investment income (loss) | $ | (48,530 | ) | |
Net realized gain (loss) on investments | (7,975,136 | ) | ||
Change in unrealized appreciation (depreciation) on investments | (9,169,203 | ) | ||
Net increase (decrease) in net assets resulting from operations | (17,192,869 | ) | ||
DISTRIBUTIONS TO SHAREHOLDERS | ||||
Net distributions to shareholders | — | |||
Tax return of capital to shareholders | (6,902 | ) | ||
Total distributions to shareholders | (6,902 | ) | ||
CAPITAL SHARE TRANSACTIONS | ||||
Proceeds from shares sold | 83,719,170 | |||
Payments for shares redeemed | (654,260 | ) | ||
Transaction fees (Note 7) | 17,669 | |||
Net increase (decrease) in net assets derived from capital share transactions (a) | 83,082,579 | |||
Net increase (decrease) in net assets | $ | 65,882,808 | ||
NET ASSETS | ||||
Beginning of period | $ | — | ||
End of period | $ | 65,882,808 | ||
(a) | A summary of capital share transactions is as follows: |
Shares | ||||
Shares sold | 3,475,000 | |||
Shares redeemed | (25,000 | ) | ||
Net increase (decrease) | 3,450,000 | |||
(1) | The Fund commenced operations on March 9, 2021. The information shown is for the period from March 9, 2021 to December 31, 2021. |
The accompanying notes are an integral part of these financial statements.
52
Defiance Next Gen Altered Experience ETF
Statement of Changes in Net Assets
Period | ||||
OPERATIONS | ||||
Net investment income (loss) | $ | (37,091 | ) | |
Net realized gain (loss) on investments | (1,489,432 | ) | ||
Change in unrealized appreciation (depreciation) on investments | (5,535,378 | ) | ||
Net increase (decrease) in net assets resulting from operations | (7,061,901 | ) | ||
DISTRIBUTIONS TO SHAREHOLDERS | ||||
Net distributions to shareholders | (233,167 | ) | ||
Total distributions to shareholders | (233,167 | ) | ||
CAPITAL SHARE TRANSACTIONS | ||||
Proceeds from shares sold | 16,811,130 | |||
Payments for shares redeemed | (1,293,245 | ) | ||
Transaction fees (Note 7) | 34,887 | |||
Net increase (decrease) in net assets derived from capital share transactions (a) | 15,552,772 | |||
Net increase (decrease) in net assets | $ | 8,257,704 | ||
NET ASSETS | ||||
Beginning of period | $ | — | ||
End of period | $ | 8,257,704 | ||
(a) | A summary of capital share transactions is as follows: |
Shares | ||||
Shares sold | 750,000 | |||
Shares redeemed | (50,000 | ) | ||
Net increase (decrease) | 700,000 | |||
(1) | The Fund commenced operations on May 27, 2021. The information shown is for the period from May 27, 2021 to December 31, 2021. |
The accompanying notes are an integral part of these financial statements.
53
Defiance Hotel, Airline, and Cruise ETF
Statement of Changes in Net Assets
Period | ||||
OPERATIONS | ||||
Net investment income (loss) | $ | (27,031 | ) | |
Net realized gain (loss) on investments | (538,962 | ) | ||
Change in unrealized appreciation (depreciation) on investments | (552,121 | ) | ||
Net increase (decrease) in net assets resulting from operations | (1,118,114 | ) | ||
CAPITAL SHARE TRANSACTIONS | ||||
Proceeds from shares sold | 25,848,695 | |||
Payments for shares redeemed | (1,981,580 | ) | ||
Transaction fees (Note 7) | 1,899 | |||
Net increase (decrease) in net assets derived from capital share transactions (a) | 23,869,014 | |||
Net increase (decrease) in net assets | $ | 22,750,900 | ||
NET ASSETS | ||||
Beginning of period | $ | — | ||
End of period | $ | 22,750,900 | ||
(a) | A summary of capital share transactions is as follows: |
Shares | ||||
Shares sold | 1,175,000 | |||
Shares redeemed | (100,000 | ) | ||
Net increase (decrease) | 1,075,000 | |||
(1) | The Fund commenced operations on June 3, 2021. The information shown is for the period from June 3, 2021 to December 31, 2021. |
The accompanying notes are an integral part of these financial statements.
54
Defiance Next Gen Big Data ETF
Statement of Changes in Net Assets
Period | ||||
OPERATIONS | ||||
Net investment income (loss) | $ | 4,416 | ||
Net realized gain (loss) on investments | 29,228 | |||
Change in unrealized appreciation (depreciation) on investments | (151,072 | ) | ||
Net increase (decrease) in net assets resulting from operations | (117,428 | ) | ||
DISTRIBUTIONS TO SHAREHOLDERS | ||||
Net distributions to shareholders | (11,640 | ) | ||
Total distributions to shareholders | (11,640 | ) | ||
CAPITAL SHARE TRANSACTIONS | ||||
Proceeds from shares sold | 2,482,000 | |||
Payments for shares redeemed | — | |||
Net increase (decrease) in net assets derived from capital share transactions (a) | 2,482,000 | |||
Net increase (decrease) in net assets | $ | 2,352,932 | ||
NET ASSETS | ||||
Beginning of period | $ | — | ||
End of period | $ | 2,352,932 | ||
(a) | A summary of capital share transactions is as follows: |
Shares | ||||
Shares sold | 100,000 | |||
Shares redeemed | — | |||
Net increase (decrease) | 100,000 | |||
(1) | The Fund commenced operations on July 13, 2021. The information shown is for the period from July 13, 2021 to December 31, 2021. |
The accompanying notes are an integral part of these financial statements.
55
Defiance Digital Revolution ETF
Statement of Changes in Net Assets
Period | ||||
OPERATIONS | ||||
Net investment income (loss) | $ | (4,094 | ) | |
Net realized gain (loss) on investments | (415,538 | ) | ||
Change in unrealized appreciation (depreciation) on investments | (1,446,675 | ) | ||
Net increase (decrease) in net assets resulting from operations | (1,866,307 | ) | ||
CAPITAL SHARE TRANSACTIONS | ||||
Proceeds from shares sold | 11,777,934 | |||
Payments for shares redeemed | — | |||
Net increase (decrease) in net assets derived from capital share transactions (a) | 11,777,934 | |||
Net increase (decrease) in net assets | $ | 9,911,627 | ||
NET ASSETS | ||||
Beginning of period | $ | — | ||
End of period | $ | 9,911,627 | ||
(a) | A summary of capital share transactions is as follows: |
Shares | ||||
Shares sold | 540,000 | |||
Shares redeemed | — | |||
Net increase (decrease) | 540,000 | |||
* | The Fund commenced operations on December 1, 2021. The information shown is for the period from December 1, 2021 to December 31, 2021. |
The accompanying notes are an integral part of these financial statements.
56
Defiance Quantum ETF
Financial Highlights
For a capital share outstanding throughout the year/period
Year Ended December 31, | Period | |||||||||||||||
2021 | 2020 | 2019 | 2018 (1) | |||||||||||||
Net asset value, beginning of year/period | $ | 41.44 | $ | 29.37 | $ | 19.96 | $ | 25.00 | ||||||||
INCOME (LOSS) FROM INVESTMENT OPERATIONS: | ||||||||||||||||
Net investment income (loss) (2) | 0.31 | 0.22 | 0.22 | 0.05 | ||||||||||||
Net realized and unrealized gain (loss) on investments (3) | 14.26 | 12.06 | 9.36 | (5.05 | ) | |||||||||||
Total from investment operations | 14.57 | 12.28 | 9.58 | (5.00 | ) | |||||||||||
DISTRIBUTIONS TO SHAREHOLDERS: | ||||||||||||||||
Distributions from: | ||||||||||||||||
Net investment income | (0.24 | ) | (0.19 | ) | (0.18 | ) | (0.03 | ) | ||||||||
From realized gains | (0.03 | ) | (0.02 | ) | — | — | ||||||||||
Tax return of capital to shareholders | — | — | — | (0.01 | ) | |||||||||||
Total distributions to shareholders | (0.27 | ) | (0.21 | ) | (0.18 | ) | (0.04 | ) | ||||||||
CAPITAL SHARE TRANSACTIONS | ||||||||||||||||
Transaction fees (Note 7) | 0.02 | 0.00 | (4) | 0.01 | 0.00 | (4) | ||||||||||
Net asset value, end of year/period | $ | 55.76 | $ | 41.44 | $ | 29.37 | $ | 19.96 | ||||||||
Total return | 35.27 | % | 42.01 | % | 48.20 | % | -20.01 | %(5) | ||||||||
SUPPLEMENTAL DATA: | ||||||||||||||||
Net assets at end of year/period (000’s) | $ | 178,418 | $ | 55,941 | $ | 20,558 | $ | 2,993 | ||||||||
RATIOS TO AVERAGE NET ASSETS: | ||||||||||||||||
Expenses to average net assets | 0.40 | % | 0.40 | % | 0.40 | %(6) | 0.65 | %(7) | ||||||||
Net investment income (loss) to average net assets | 0.61 | % | 0.71 | % | 0.87 | % | 0.70 | %(7) | ||||||||
Portfolio turnover rate (8) | 35 | % | 40 | % | 45 | % | 22 | %(5) | ||||||||
(1) | Commencement of operations on September 4, 2018. |
(2) | Calculated based on average shares outstanding during the year/period. |
(3) | Realized and unrealized gains and losses per share in this caption are balancing amounts necessary to reconcile the change in net asset value per share for the period, and may not reconcile with the aggregate gains and losses in the Statement of Operations due to share transactions for the period. |
(4) | Less than $0.005. |
(5) | Not annualized. |
(6) | Effective January 14, 2019, the Adviser reduced its management fee from 0.65% to 0.40%. |
(7) | Annualized |
(8) | Excludes the impact of in-kind transactions. |
The accompanying notes are an integral part of these financial statements.
57
Defiance Next Gen Connectivity ETF
Financial Highlights
For a capital share outstanding throughout the year/period
Year Ended December 31, | Period | |||||||||||
2021 | 2020 | 2019 (1) | ||||||||||
Net asset value, beginning of year/period | $ | 33.60 | $ | 26.20 | $ | 25.00 | ||||||
INCOME (LOSS) FROM INVESTMENT OPERATIONS: | ||||||||||||
Net investment income (loss) (2) | 0.48 | 0.38 | 0.25 | |||||||||
Net realized and unrealized gain (loss) on investments (3) | 8.09 | 7.35 | 1.15 | |||||||||
Total from investment operations | 8.57 | 7.73 | 1.40 | |||||||||
DISTRIBUTIONS TO SHAREHOLDERS: | ||||||||||||
Distributions from: | ||||||||||||
Net investment income | (0.47 | ) | (0.31 | ) | (0.20 | ) | ||||||
Tax return of capital to shareholders | (0.02 | ) | (0.02 | ) | — | |||||||
Total distributions to shareholders | (0.49 | ) | (0.33 | ) | (0.20 | ) | ||||||
CAPITAL SHARE TRANSACTIONS | ||||||||||||
Transaction fees (Note 7) | — | 0.00 | (4) | — | ||||||||
Net asset value, end of year/period | $ | 41.68 | $ | 33.60 | $ | 26.20 | ||||||
Total return | 25.63 | % | 29.77 | % | 5.64 | %(5) | ||||||
SUPPLEMENTAL DATA: | ||||||||||||
Net assets at end of year/period (000’s) | $ | 1,383,735 | $ | 890,292 | $ | 162,461 | ||||||
RATIOS TO AVERAGE NET ASSETS: | ||||||||||||
Expenses to average net assets | 0.30 | % | 0.30 | % | 0.30 | %(6) | ||||||
Net investment income (loss) to average net assets | 1.29 | % | 1.35 | % | 1.22 | %(6) | ||||||
Portfolio turnover rate (7) | 24 | % | 28 | % | 54 | %(5) | ||||||
(1) | Commencement of operations on March 4, 2019. |
(2) | Calculated based on average shares outstanding during the period. |
(3) | Realized and unrealized gains and losses per share in this caption are balancing amounts necessary to reconcile the change in net asset value per share for the period, and may not reconcile with the aggregate gains and losses in the Statement of Operations due to share transactions for the period. |
(4) | Less than $0.005. |
(5) | Not annualized. |
(6) | Annualized |
(7) | Excludes the impact of in-kind transactions. |
The accompanying notes are an integral part of these financial statements.
58
Defiance Next Gen SPAC Derived ETF
Financial Highlights
For a capital share outstanding throughout the year/period
Year | Period | |||||||
Net asset value, beginning of year/period | $ | 28.59 | $ | 25.24 | ||||
INCOME (LOSS) FROM INVESTMENT OPERATIONS: | ||||||||
Net investment income (loss) (2) | (0.09 | ) | (0.01 | ) | ||||
Net realized and unrealized gain (loss) on investments (3) | (6.97 | ) | 3.36 | |||||
Total from investment operations | (7.06 | ) | 3.35 | |||||
DISTRIBUTIONS TO SHAREHOLDERS: | ||||||||
Distributions from: | ||||||||
Net investment income | (0.27 | ) | — | |||||
From realized gains | (0.05 | ) | — | |||||
Total distributions to shareholders | (0.32 | ) | — | |||||
CAPITAL SHARE TRANSACTIONS | ||||||||
Transaction fees (Note 7) | 0.00 | (4) | 0.00 | (4) | ||||
Net asset value, end of year/period | $ | 21.21 | $ | 28.59 | ||||
Total return | -24.72 | % | 13.29 | %(5) | ||||
SUPPLEMENTAL DATA: | ||||||||
Net assets at end of year/period (000’s) | $ | 28,097 | $ | 50,747 | ||||
RATIOS TO AVERAGE NET ASSETS: | ||||||||
Expenses to average net assets | 0.45 | % | 0.45 | %(6) | ||||
Net investment income (loss) to average net assets | -0.37 | % | -0.16 | %(6) | ||||
Portfolio turnover rate (7) | 149 | % | 64 | %(5) | ||||
(1) | Commencement of operations on September 30, 2020. |
(2) | Calculated based on average shares outstanding during the period. |
(3) | Realized and unrealized gains and losses per share in this caption are balancing amounts necessary to reconcile the change in net asset value per share for the period, and may not reconcile with the aggregate gains and losses in the Statement of Operations due to share transactions for the period. |
(4) | Less than $0.005. |
(5) | Not annualized. |
(6) | Annualized |
(7) | Excludes the impact of in-kind transactions. |
The accompanying notes are an integral part of these financial statements.
59
Defiance Next Gen H2 ETF
Financial Highlights
For a capital share outstanding throughout the period
Period | ||||
Net asset value, beginning of period | $ | 27.16 | ||
INCOME (LOSS) FROM INVESTMENT OPERATIONS: | ||||
Net investment income (loss) (2) | (0.03 | ) | ||
Net realized and unrealized gain (loss) on investments (3) | (8.04 | ) | ||
Total from investment operations | (8.07 | ) | ||
DISTRIBUTIONS TO SHAREHOLDERS: | ||||
Distributions from: | ||||
Net investment income | — | |||
Tax return of capital to shareholders | (0.00 | )(4) | ||
Total distributions to shareholders | (0.00 | )(4) | ||
CAPITAL SHARE TRANSACTIONS | ||||
Transaction fees (Note 7) | 0.01 | |||
Net asset value, end of period | $ | 19.10 | ||
Total return | -29.68 | %(5) | ||
SUPPLEMENTAL DATA: | ||||
Net assets at end of period (000’s) | $ | 65,883 | ||
RATIOS TO AVERAGE NET ASSETS: | ||||
Expenses to average net assets | 0.30 | %(6) | ||
Net investment income (loss) to average net assets | -0.15 | %(6) | ||
Portfolio turnover rate (7) | 69 | %(5) | ||
(1) | Commencement of operations on March 9, 2021. |
(2) | Calculated based on average shares outstanding during the period. |
(3) | Realized and unrealized gains and losses per share in this caption are balancing amounts necessary to reconcile the change in net asset value per share for the period, and may not reconcile with the aggregate gains and losses in the Statement of Operations due to share transactions for the period. |
(4) | Less than $0.005. |
(5) | Not annualized. |
(6) | Annualized |
(7) | Excludes the impact of in-kind transactions. |
The accompanying notes are an integral part of these financial statements.
60
Defiance Next Gen Altered Experience ETF
Financial Highlights
For a capital share outstanding throughout the period
Period | ||||
Net asset value, beginning of period | $ | 25.51 | ||
INCOME (LOSS) FROM INVESTMENT OPERATIONS: | ||||
Net investment income (loss) (2) | (0.08 | ) | ||
Net realized and unrealized gain (loss) on investments (3) | (13.38 | ) | ||
Total from investment operations | (13.46 | ) | ||
DISTRIBUTIONS TO SHAREHOLDERS: | ||||
Distributions from: | ||||
Net investment income | (0.33 | ) | ||
Total distributions to shareholders | (0.33 | ) | ||
CAPITAL SHARE TRANSACTIONS | ||||
Transaction fees (Note 7) | 0.08 | |||
Net asset value, end of period | $ | 11.80 | ||
Total return | -52.43 | %(4) | ||
SUPPLEMENTAL DATA: | ||||
Net assets at end of period (000’s) | $ | 8,258 | ||
RATIOS TO AVERAGE NET ASSETS: | ||||
Expenses to average net assets | 0.75 | %(5) | ||
Net investment income (loss) to average net assets | -0.75 | %(5) | ||
Portfolio turnover rate (6) | 58 | %(4) | ||
(1) | Commencement of operations on May 27, 2021. |
(2) | Calculated based on average shares outstanding during the period. |
(3) | Realized and unrealized gains and losses per share in this caption are balancing amounts necessary to reconcile the change in net asset value per share for the period, and may not reconcile with the aggregate gains and losses in the Statement of Operations due to share transactions for the period. |
(4) | Not annualized. |
(5) | Annualized |
(6) | Excludes the impact of in-kind transactions. |
The accompanying notes are an integral part of these financial statements.
61
Defiance Hotel, Airline, and Cruise ETF
Financial Highlights
For a capital share outstanding throughout the period
Period | ||||
Net asset value, beginning of period | $ | 24.36 | ||
INCOME (LOSS) FROM INVESTMENT OPERATIONS: | ||||
Net investment income (loss) (2) | (0.05 | ) | ||
Net realized and unrealized gain (loss) on investments (3) | (3.15 | ) | ||
Total from investment operations | (3.20 | ) | ||
CAPITAL SHARE TRANSACTIONS | ||||
Transaction fees (Note 7) | 0.00 | (4) | ||
Net asset value, end of period | $ | 21.16 | ||
Total return | -13.12 | %(5) | ||
SUPPLEMENTAL DATA: | ||||
Net assets at end of period (000’s) | $ | 22,751 | ||
RATIOS TO AVERAGE NET ASSETS: | ||||
Expenses to average net assets | 0.45 | %(6) | ||
Net investment income (loss) to average net assets | -0.37 | %(6) | ||
Portfolio turnover rate (7) | 26 | %(5) | ||
(1) | Commencement of operations on June 3, 2021. |
(2) | Calculated based on average shares outstanding during the period. |
(3) | Realized and unrealized gains and losses per share in this caption are balancing amounts necessary to reconcile the change in net asset value per share for the period, and may not reconcile with the aggregate gains and losses in the Statement of Operations due to share transactions for the period. |
(4) | Less than $0.005. |
(5) | Not annualized. |
(6) | Annualized |
(7) | Excludes the impact of in-kind transactions. |
The accompanying notes are an integral part of these financial statements.
62
Defiance Next Gen Big Data ETF
Financial Highlights
For a capital share outstanding throughout the period
Period | ||||
Net asset value, beginning of period | $ | 24.82 | ||
INCOME (LOSS) FROM INVESTMENT OPERATIONS: | ||||
Net investment income (loss) (2) | 0.04 | |||
Net realized and unrealized gain (loss) on investments (3) | (1.22 | ) | ||
Total from investment operations | (1.18 | ) | ||
DISTRIBUTIONS TO SHAREHOLDERS: | ||||
Distributions from: | ||||
Net investment income | (0.04 | ) | ||
From realized gains | (0.07 | ) | ||
Total distributions to shareholders | (0.11 | ) | ||
Net asset value, end of period | $ | 23.53 | ||
Total return | -4.74 | %(4) | ||
SUPPLEMENTAL DATA: | ||||
Net assets at end of period (000’s) | $ | 2,353 | ||
RATIOS TO AVERAGE NET ASSETS: | ||||
Expenses to average net assets | 0.45 | %(5) | ||
Net investment income (loss) to average net assets | 0.36 | %(5) | ||
Portfolio turnover rate (6) | 36 | %(4) | ||
(1) | Commencement of operations on July 13, 2021. |
(2) | Calculated based on average shares outstanding during the period. |
(3) | Realized and unrealized gains and losses per share in this caption are balancing amounts necessary to reconcile the change in net asset value per share for the period, and may not reconcile with the aggregate gains and losses in the Statement of Operations due to share transactions for the period. |
(4) | Not annualized. |
(5) | Annualized |
(6) | Excludes the impact of in-kind transactions. |
The accompanying notes are an integral part of these financial statements.
63
Defiance Digital Revolution ETF
Financial Highlights
For a capital share outstanding throughout the period
Period | ||||
Net asset value, beginning of period | $ | 24.13 | ||
INCOME (LOSS) FROM INVESTMENT OPERATIONS: | ||||
Net investment income (loss) (2) | (0.01 | ) | ||
Net realized and unrealized gain (loss) on investments (3) | (5.77 | ) | ||
Total from investment operations | (5.78 | ) | ||
Net asset value, end of period | $ | 18.35 | ||
Total return | -23.93 | %(4) | ||
SUPPLEMENTAL DATA: | ||||
Net assets at end of period (000’s) | $ | 9,912 | ||
RATIOS TO AVERAGE NET ASSETS: | ||||
Expenses to average net assets | 0.65 | %(5) | ||
Net investment income (loss) to average net assets | -0.65 | %(5) | ||
Portfolio turnover rate (6) | 17 | %(4) | ||
(1) | Commencement of operations on December 1, 2021. |
(2) | Calculated based on average shares outstanding during the period. |
(3) | Realized and unrealized gains and losses per share in this caption are balancing amounts necessary to reconcile the change in net asset value per share for the period, and may not reconcile with the aggregate gains and losses in the Statement of Operations due to share transactions for the period. |
(4) | Not annualized. |
(5) | Annualized |
(6) | Excludes the impact of in-kind transactions. |
The accompanying notes are an integral part of these financial statements.
64
Defiance ETFs
Notes to Financial Statements
December 31, 2021
NOTE 1 – ORGANIZATION
Defiance Quantum ETF, Defiance Next Gen Connectivity ETF, Defiance Next Gen SPAC Derived ETF, Defiance Next Gen H2 ETF, Defiance Next Gen Altered Experience ETF, Defiance Hotel, Airline, and Cruise ETF, Defiance Next Gen Big Data ETF and Defiance Digital Revolution ETF (individually each a “Fund” or collectively the “Funds”) are each a non-diversified series of ETF Series Solutions (“ESS” or the “Trust”), an open-end management investment company consisting of multiple investment series, organized as a Delaware statutory trust on February 9, 2012. The Trust is registered with the Securities and Exchange Commission (“SEC”) under the Investment Company Act of 1940, as amended (the “1940 Act”), as an open-end management investment company and the offering of the Funds’ shares is registered under the Securities Act of 1933, as amended (the “Securities Act”). The investment objective of Defiance Quantum ETF is to track the total return performance, before fees and expenses, of the BlueStar Quantum Computing and Machine Learning Index®. The investment objective of Defiance Next Gen Connectivity ETF is to track the total return performance, before fees and expenses, of the BlueStar 5G Communications Index™. The investment objective of Defiance Next Gen SPAC Derived ETF is to track the total return performance, before fees and expenses, of the Indxx SPAC & NextGen IPO Index. The investment objective of Defiance Next Gen H2 ETF is to track the total return performance, before fees and expenses, of the BlueStar Hydrogen & NextGen Fuel Cell Index. The investment objective of Defiance Next Gen Altered Experience ETF is to track the total return performance, before fees and expenses, of the BITA Medical Psychedelics, Cannabis, and Ketamine Index. The investment objective of Defiance Hotel, Airline, and Cruise ETF is to track the total return performance, before fees and expenses, of the BlueStar Global Hotels, Airlines, and Cruises Index. The investment objective of Defiance Next Gen Big Data ETF is to track the total return performance, before fees and expenses, of the BlueStar Big Data & Analytics Index. The investment objective of Defiance Digital Revolution ETF is to track the total return performance, before fees and expenses, of the BITA NFT and Blockchain Select Index. The table below shows the date each fund commenced operations:
Fund | Date of Commencement | |||
Defiance Quantum ETF | September 4, 2018 | |||
Defiance Next Gen Connectivity ETF | March 4, 2019 | |||
Defiance Next Gen SPAC Derived ETF | September 30, 2020 | |||
Defiance Next Gen H2 ETF | March 9, 2021 | |||
Defiance Next Gen Altered Experience ETF | May 27, 2021 | |||
Defiance Hotel, Airline, and Cruise ETF | June 3, 2021 | |||
Defiance Next Gen Big Data ETF | July 13, 2021 | |||
Defiance Digital Revolution ETF | December 1, 2021 | |||
The end of the reporting period for the Funds is December 31, 2021, and the period covered by these Notes to Financial Statements is the period from January 1, 2021 through December 31, 2021 for Defiance Quantum ETF, Defiance Next Gen Connectivity ETF, and Defiance Next Gen SPAC Derived ETF, the period from March 9, 2021 through December 31, 2021 for Defiance Next Gen H2 ETF, the period from May 27, 2021 through December 31, 2021 for Defiance Next Gen Altered Experience ETF, the period from June 3, 2021 through December 31, 2021 for Defiance Hotel, Airline, and Cruise ETF, the period from July 13, 2021 through December 31, 2021 for Defiance Next Gen Big Data ETF and the period from December 1, 2021 through December 31, 2021 for Defiance Digital Revolution ETF (each, respectively, the “current fiscal period”).
NOTE 2 – SIGNIFICANT ACCOUNTING POLICIES
The Funds are investment companies and accordingly follow the investment company accounting and reporting guidance of the Financial Accounting Standards Board (“FASB”) Accounting Standards Codification (“ASC”) Topic 946 Financial Services – Investment Companies.
The following is a summary of significant accounting policies consistently followed by the Funds. These policies are in conformity with accounting principles generally accepted in the United States of America (“U.S. GAAP”).
A. | Security Valuation. All equity securities, including domestic and foreign common stocks, preferred stocks, special purchase acquisition companies (“SPAC”) and exchange-traded funds, that are traded on a national securities exchange, except those listed on the Nasdaq Global Market®, Nasdaq Global Select Market® and the Nasdaq Capital Market® exchanges (collectively, “Nasdaq”) are valued at the last reported sale price on the exchange on which the security is principally |
65
Defiance ETFs
Notes to Financial Statements
December 31, 2021 (Continued)
traded. Securities traded on Nasdaq will be valued at the Nasdaq Official Closing Price (“NOCP”). If, on a particular day, an exchange-traded or Nasdaq security does not trade, then the mean between the most recent quoted bid and asked prices will be used. All equity securities that are not traded on a listed exchange are valued at the last sale price in the over-the counter market. If a non-exchange traded security does not trade on a particular day, then the mean between the last quoted closing bid and asked price will be used. Prices denominated in foreign currencies are converted to U.S. dollar equivalents at the current exchange rate, which approximates fair value.
Investments in mutual funds, including money market funds, are valued at their net asset value (“NAV”) per share.
Units of Mount Vernon Liquid Assets Portfolio, LLC are not traded on an exchange and are valued at the investment company’s NAV per share as provided by the underlying fund’s administrator. These shares are generally classified as Level 2 Investments.
Securities for which quotations are not readily available are valued at their respective fair values in accordance with pricing procedures adopted by the Funds’ Board of Trustees (the “Board”). When a security is “fair valued,” consideration is given to the facts and circumstances relevant to the particular situation, including a review of various factors set forth in the pricing procedures adopted by the Board. The use of fair value pricing by the Funds may cause the NAV of their shares to differ significantly from the NAV that would be calculated without regard to such considerations.
As described above, the Funds utilize various methods to measure the fair value of their investments on a recurring basis. U.S. GAAP establishes a hierarchy that prioritizes inputs to valuations methods. The three levels of inputs are:
Level 1 – | Unadjusted quoted prices in active markets for identical assets or liabilities that the Funds have the ability to access. |
Level 2 – | Observable inputs other than quoted prices included in Level 1 that are observable for the asset or liability, either directly or indirectly. These inputs may include quoted prices for the identical instrument on an inactive market, prices for similar instruments, interest rates, prepayment speeds, credit risk, yield curves, default rates and similar data. |
Level 3 – | Unobservable inputs for the asset or liability, to the extent relevant observable inputs are not available; representing the Funds’ own assumptions about the assumptions a market participant would use in valuing the asset or liability and would be based on the best information available. |
The availability of observable inputs can vary from security to security and is affected by a wide variety of factors, including, for example, the type of security, whether the security is new and not yet established in the marketplace, the liquidity of markets, and other characteristics particular to the security. To the extent that valuation is based on models or inputs that are less observable or unobservable in the market, the determination of fair value requires more judgment. Accordingly, the degree of judgment exercised in determining fair value is greatest for instruments categorized in Level 3. |
The inputs used to measure fair value may fall into different levels of the fair value hierarchy. In such cases, for disclosure purposes, the level in the fair value hierarchy within which the fair value measurement falls in its entirety, is determined based on the lowest level input that is significant to the fair value measurement in its entirety.
The following is a summary of the inputs used to value the Funds’ investments as of the end of the current fiscal period:
Defiance Quantum ETF
Assets^ | Level 1 | Level 2 | Level 3 | Total | ||||||||||||
Common Stocks | $ | 177,836,093 | $ | — | $ | — | $ | 177,836,093 | ||||||||
Short-Term Investments | 582,884 | — | — | 582,884 | ||||||||||||
Investments Purchased with Proceeds from Securities Lending | — | 26,811,367 | — | 26,811,367 | ||||||||||||
Total Investments in Securities, at value | $ | 178,418,977 | $ | 26,811,367 | $ | — | $ | 205,230,344 | ||||||||
66
Defiance ETFs
Notes to Financial Statements
December 31, 2021 (Continued)
Defiance Next Gen Connectivity ETF
Assets^ | Level 1 | Level 2 | Level 3 | Total | ||||||||||||
Common Stocks | $ | 1,373,044,010 | $ | — | $ | — | $ | 1,373,044,010 | ||||||||
Short-Term Investments | 9,554,244 | — | — | 9,554,244 | ||||||||||||
Investments Purchased with Proceeds from Securities Lending | — | 133,207,282 | — | 133,207,282 | ||||||||||||
Total Investments in Securities, at value | $ | 1,382,598,254 | $ | 133,207,282 | $ | — | $ | 1,515,805,536 | ||||||||
Defiance Next Gen SPAC Derived ETF
Assets^ | Level 1 | Level 2 | Level 3 | Total | ||||||||||||
Common Stocks | $ | 16,909,641 | $ | — | $ | — | $ | 16,909,641 | ||||||||
Special Purpose Acquisition Companies | 11,139,266 | — | — | 11,139,266 | ||||||||||||
Short-Term Investments | 69,147 | — | — | 69,147 | ||||||||||||
Total Investments in Securities, at value | $ | 28,118,054 | $ | — | $ | — | $ | 28,118,054 | ||||||||
Defiance Next Gen H2 ETF
Assets^ | Level 1 | Level 2 | Level 3 | Total | ||||||||||||
Common Stocks | $ | 65,465,511 | $ | — | $ | — | $ | 65,465,511 | ||||||||
Short-Term Investments | 180,933 | — | — | 180,933 | ||||||||||||
Total Investments in Securities, at value | $ | 65,646,444 | $ | — | $ | — | $ | 65,646,444 | ||||||||
Defiance Next Gen Altered Experience ETF
Assets^ | Level 1 | Level 2 | Level 3 | Total | ||||||||||||
Common Stocks | $ | 8,164,936 | $ | — | 0 | (1) | $ | 8,164,936 | ||||||||
Short-Term Investments | 16,079 | — | — | 16,079 | ||||||||||||
Total Investments in Securities, at value | $ | 8,181,015 | $ | — | $ | 0 | (1) | $ | 8,181,015 | |||||||
Defiance Hotel, Airline, and Cruise ETF
Assets^ | Level 1 | Level 2 | Level 3 | Total | ||||||||||||
Common Stocks | $ | 22,601,899 | $ | — | $ | — | $ | 22,601,899 | ||||||||
Preferred Stocks | 66,977 | — | — | 66,977 | ||||||||||||
Short-Term Investments | 82,904 | — | — | 82,904 | ||||||||||||
Total Investments in Securities, at value | $ | 22,751,780 | $ | — | $ | — | $ | 22,751,780 | ||||||||
Defiance Next Gen Big Data ETF
Assets^ | Level 1 | Level 2 | Level 3 | Total | ||||||||||||
Common Stocks | $ | 2,346,721 | $ | — | $ | — | $ | 2,346,721 | ||||||||
Short-Term Investments | 7,128 | — | — | 7,128 | ||||||||||||
Total Investments in Securities, at value | $ | 2,353,849 | $ | — | $ | — | $ | 2,353,849 | ||||||||
67
Defiance ETFs
Notes to Financial Statements
December 31, 2021 (Continued)
Defiance Digital Revolution ETF
Assets^ | Level 1 | Level 2 | Level 3 | Total | ||||||||||||
Common Stocks | $ | 9,857,327 | $ | — | $ | — | $ | 9,857,327 | ||||||||
Short-Term Investments | 58,394 | — | — | 58,394 | ||||||||||||
Total Investments in Securities, at value | $ | 9,915,721 | $ | — | $ | — | $ | 9,915,721 | ||||||||
^ | See Schedule of Investments for breakout of investments by sector classification. |
(1) | Represents less than $0.50. |
During the current fiscal period, the Funds did not recognize any transfers to or from Level 3.
B. | Federal Income Taxes. The Funds’ policy is to comply with the requirements of Subchapter M of the Internal Revenue Code of 1986, as amended, applicable to regulated investment companies and to distribute substantially all net taxable investment income and net capital gains to shareholders. Therefore, no federal income tax provision is required. The Funds plan to file U.S. Federal and various state and local tax returns. |
The Funds recognize the tax benefits of uncertain tax positions only when the position is more likely than not to be sustained. Management has analyzed the Funds’ uncertain tax positions and concluded that no liability for unrecognized tax benefits should be recorded related to uncertain tax positions. Management is not aware of any tax positions for which it is reasonably possible that the total amounts of unrecognized tax benefits will change materially in the next 12 months. Income and capital gain distributions are determined in accordance with federal income tax regulations, which may differ from U.S. GAAP. The Funds recognize interest and penalties, if any, related to unrecognized tax benefits on uncertain tax positions as income tax expense in the Statements of Operations. During the current fiscal period, the Funds did not incur any interest or penalties.
C. | Foreign Currency. Investment securities and other assets and liabilities denominated in foreign currencies are translated into U.S. dollar amounts at the date of valuation. Purchases and sales of investment securities and income and expense items denominated in foreign currencies are translated into U.S. dollar amounts on the respective dates of such transactions. The Funds do not isolate that portion of the results of operations resulting from changes in foreign exchange rates on investments and currency gains or losses realized between trade and settle dates on security transactions from the fluctuations arising from changes in market prices of securities held. Such fluctuations are included with the net realized and unrealized gain or loss from investments. The Funds report net realized foreign exchange gains or losses that arise from sales of foreign currencies, currency gains or losses realized between the trade and settlement dates on foreign currency transactions, and the difference between the amounts of dividends, interest, and foreign withholding taxes recorded on the Funds’ books and the U.S. dollar equivalent of the amounts actually received or paid. Net unrealized foreign exchange gains and losses arise from changes in the fair values of assets and liabilities, other than investments in securities at fiscal period end, resulting from changes in exchange rates. |
D. | Security Transactions and Investment Income. Investment securities transactions are accounted for on the trade date. Gains and losses realized on sales of securities are determined on a specific identification basis. Dividend income is recorded on the ex-dividend date. Interest income is recorded on an accrual basis. Withholding taxes on foreign dividends, if any, have been provided for in accordance with the Funds’ understanding of the applicable tax rules and regulations. |
Distributions received from the Funds’ investments in real estate investment trusts (“REITs”) may be characterized as ordinary income, net capital gain, or a return of capital. The proper characterization of REIT distributions is generally not known until after the end of each calendar year. As such, the Funds must use estimates in reporting the character of their income and distributions received during the current calendar year for financial statement purposes. The actual character of distributions to the Funds’ shareholders will be reflected on the Form 1099 received by shareholders after the end of the calendar year. Due to the nature of REIT investments, a portion of the distributions received by the Funds’ shareholders may represent a return of capital.
68
Defiance ETFs
Notes to Financial Statements
December 31, 2021 (Continued)
E. | Distributions to Shareholders. Distributions to shareholders from net investment income and net realized gains on securities for the Funds are declared and paid at least annually by each Fund. Distributions are recorded on the ex-dividend date. |
F. | Use of Estimates. The preparation of financial statements in conformity with U.S. GAAP requires management to make estimates and assumptions that affect the reported amounts of assets and liabilities and disclosure of contingent assets and liabilities at the date of the financial statements, as well as the reported amounts of revenues and expenses during the current fiscal period. Actual results could differ from those estimates. |
G. | Share Valuation. The NAV per share of each Fund is calculated by dividing the sum of the value of the securities held by each Fund, plus cash and other assets, minus all liabilities (including estimated accrued expenses) by the total number of shares outstanding for each Fund, rounded to the nearest cent. The Funds’ shares will not be priced on the days on which the New York Stock Exchange (“NYSE”) is closed for trading. The offering and redemption price per share for creation units of each Fund is equal to each Fund’s NAV per share. |
H. | Guarantees and Indemnifications. In the normal course of business, the Funds enter into contracts with service providers that contain general indemnification clauses. The Funds’ maximum exposure under these arrangements is unknown as this would involve future claims that may be against the Funds that have not yet occurred. However, based on experience, the Funds expect the risk of loss to be remote. |
I. | Reclassification of Capital Accounts. U.S. GAAP requires that certain components of net assets relating to permanent differences be reclassified between financial and tax reporting. These reclassifications have no effect on net assets or NAV per share and are primarily due to differing book and tax treatments for in-kind transactions and net operating losses. For the current fiscal period, the following table shows the reclassifications made: |
Distributable | Paid-In | |||||||
Defiance Quantum ETF | $ | (11,542,209 | ) | $ | 11,542,209 | |||
Defiance Next Gen Connectivity ETF | (127,978,138 | ) | 127,978,138 | |||||
Defiance Next Gen SPAC Derived ETF | 3,074,595 | (3,074,595 | ) | |||||
Defiance Next Gen H2 ETF | 115,527 | (115,527 | ) | |||||
Defiance Next Gen Altered Experience ETF | (30,206 | ) | 30,206 | |||||
Defiance Hotel, Airline, and Cruise ETF | 232,603 | (232,603 | ) | |||||
Defiance Next Gen Big Data ETF | — | — | ||||||
Defiance Digital Revolution ETF | — | — | ||||||
During the fiscal period ended December 31, 2021, the Funds realized the following net capital gains (losses) resulting from in-kind redemptions, in which shareholders exchanged Fund shares for securities held by the Funds rather than for cash. Because such gains (losses) are not taxable to the Funds, and gains are not distributed to shareholders, they have been reclassified from distributable earnings (accumulated deficit) to paid-in capital.
Defiance Quantum ETF | $ | 11,542,209 | ||
Defiance Next Gen Connectivity ETF | 127,978,138 | |||
Defiance Next Gen SPAC Derived ETF | (3,074,595 | ) | ||
Defiance Next Gen H2 ETF | 15,562 | |||
Defiance Next Gen Altered Experience ETF | 30,213 | |||
Defiance Hotel, Airline, and Cruise ETF | (204,063 | ) | ||
Defiance Next Gen Big Data ETF | — | |||
Defiance Digital Revolution ETF | — |
69
Defiance ETFs
Notes to Financial Statements
December 31, 2021 (Continued)
J. | Subsequent Events. In preparing these financial statements, management has evaluated events and transactions for potential recognition or disclosure through the date the financial statements were issued. There were no events or transactions that occurred during the period subsequent to the end of the current fiscal period that materially impacted the amounts or disclosures in the Funds’ financial statements. |
NOTE 3 – COMMITMENTS AND OTHER RELATED PARTY TRANSACTIONS
Defiance ETFs, LLC (the “Adviser”), serves as the investment adviser to the Funds. Pursuant to an Investment Advisory Agreement (“Advisory Agreement”) between the Trust, on behalf of the Funds, and the Adviser, the Adviser provides investment advice to the Funds and oversees the day-to-day operations of the Funds, subject to the direction and control of the Board and the officers of the Trust. Under the Advisory Agreement, the Adviser is also responsible for arranging, in consultation with Penserra Capital Management LLC, (the “Sub-Adviser”), transfer agency, custody, fund administration and accounting, and other non-distribution related services necessary for the Funds to operate. Under the Advisory Agreement, the Adviser has agreed to pay all expenses of the Funds except for: the fee paid to the Adviser pursuant to the Advisory Agreement, interest charges on any borrowings, dividends, and other expenses on securities sold short, taxes, brokerage commissions and other expenses incurred in placing orders for the purchase and sale of securities and other investment instruments, acquired fund fees and expenses, accrued deferred tax liability, extraordinary expenses, and distribution (12b-1) fees and expenses.
The Funds pay the Adviser the following annual rate based on each Fund’s average daily net assets:
Defiance Quantum ETF | 0.40 | % | ||
Defiance Next Gen Connectivity ETF | 0.30 | % | ||
Defiance Next Gen SPAC Derived ETF | 0.45 | % | ||
Defiance Next Gen H2 ETF | 0.30 | % | ||
Defiance Next Gen Altered Experience ETF | 0.75 | % | ||
Defiance Hotel, Airline, and Cruise ETF | 0.45 | % | ||
Defiance Next Gen Big Data ETF | 0.45 | % | ||
Defiance Digital Revolution ETF | 0.65 | % |
U.S. Bancorp Fund Services, LLC, doing business as U.S. Bank Global Fund Services (“Fund Services” or “Administrator”), acts as the Funds’ Administrator and, in that capacity, performs various administrative and accounting services for the Funds. The Administrator prepares various federal and state regulatory filings, reports and returns for the Funds, including regulatory compliance monitoring and financial reporting; prepares reports and materials to be supplied to the Board and monitors the activities of the Funds’ Custodian, transfer agent and fund accountant. Fund Services also serves as the transfer agent and fund accountant to the Funds. U.S. Bank N.A. (the “Custodian”), an affiliate of Fund Services, serves as the Funds’ Custodian.
The Custodian acts as the securities lending agent (the “Securities Lending Agent”) for Defiance Quantum ETF and Defiance Next Gen Connectivity ETF.
A Trustee and all officers of the Trust are affiliated with the Administrator and Custodian.
NOTE 4 – SECURITIES LENDING
Defiance Quantum ETF and Defiance Next Gen Connectivity ETF may lend up to 33⅓ percent of the value of the securities in their portfolios to brokers, dealers and financial institutions (but not individuals) under terms of participation in a securities lending program administered by the Securities Lending Agent. The securities lending agreement requires that loans are collateralized at all times in an amount equal to at least 102% of the value of any domestic loaned securities at the time of the loan plus accrued interest. The use of loans of foreign securities, which are denominated and payable in U.S. dollars, shall be collateralized in an amount equal to 105% of the value of any loaned securities at the time of the loan plus accrued interest. The Funds receive compensation in the form of fees and earn interest on the cash collateral. The amount of fees depends on a number of factors including the type of security and length of the loan. The Funds continue to receive interest payments or dividends on
70
Defiance ETFs
Notes to Financial Statements
December 31, 2021 (Continued)
the securities loaned during the borrowing period. Gain or loss in the value of securities loaned that may occur during the term of the loan will be for the account of the Funds. The Funds have the right under the terms of the securities lending agreements to recall the securities from the borrower on demand.
The securities lending agreement provides that, in the event of a borrower’s material default, the Securities Lending Agent shall take all actions the Securities Lending Agent deems appropriate to liquidate the collateral, purchase replacement securities at the Securities Lending Agent’s expense, or pay the Fund an amount equal to the market value of the loaned securities, subject to certain limitations which are set forth in detail in the securities lending agreement between the Funds and the Securities Lending Agent.
As of the end of the current fiscal period, the Funds had loaned securities and received cash collateral for the loans. The cash collateral is invested by the Securities Lending Agent in accordance with the Trust approved investment guidelines. Those guidelines require the cash collateral to be invested in readily marketable, high quality, short-term obligations; however, such investments are subject to risk of payment delays or default on the part of the issuer or counterparty or otherwise may not generate sufficient interest to support the costs associated with securities lending. The Funds could also experience delays in recovering their securities and possible loss of income or value if the borrower fails to return the borrowed securities, although the Funds are indemnified from this risk by contract with the Securities Lending Agent.
As of the end of the current fiscal period, the values of the securities on loan and payable for collateral due to broker were as follows:
Fund | Value of | Payable for | ||||||
Defiance Quantum ETF | $ | 25,853,031 | $ | 26,811,367 | ||||
Defiance Next Gen Connectivity ETF | 128,825,716 | 133,207,282 | ||||||
* | The cash collateral received was invested in Mount Vernon Liquid Assets Portfolio, LLC as shown on the Schedules of Investments, a short-term investment portfolio with an overnight and continuous maturity. The investment objective is to seek to maximize current income to the extent consistent with the preservation of capital and liquidity and maintain a stable NAV of $1.00 per unit. |
The interest income earned by the Funds on the investment of cash collateral received from borrowers for the securities loaned to them (“Securities Lending Income”) is reflected in the Funds’ Statements of Operations. Fees and interest income earned on collateral investments and recognized by the Funds during the current fiscal period were as follows:
Fund | Fees and | |||
Defiance Quantum ETF | $ | 19,022 | ||
Defiance Next Gen Connectivity ETF | 292,817 | |||
Due to the absence of a master netting agreement related to the Funds’ participation in securities lending, no offsetting disclosures have been made on behalf of the Funds.
71
Defiance ETFs
Notes to Financial Statements
December 31, 2021 (Continued)
NOTE 5 – PURCHASES AND SALES OF SECURITIES
During the current fiscal period, purchases and sales of securities by the Funds, excluding short-term securities and in-kind transactions, were as follows:
Purchases | Sales | |||||||
Defiance Quantum ETF | $ | 46,750,913 | $ | 40,433,022 | ||||
Defiance Next Gen Connectivity ETF | 290,898,901 | 290,206,463 | ||||||
Defiance Next Gen SPAC Derived ETF | 80,380,862 | 80,726,797 | ||||||
Defiance Next Gen H2 ETF | 44,740,279 | 30,237,264 | ||||||
Defiance Next Gen Altered Experience ETF | 5,293,970 | 4,755,585 | ||||||
Defiance Hotel, Airline, and Cruise ETF | 3,944,464 | 3,558,449 | ||||||
Defiance Next Gen Big Data ETF | 930,389 | 932,175 | ||||||
Defiance Digital Revolution ETF | 1,663,186 | 1,704,435 | ||||||
During the current fiscal period, there were no purchases or sales of U.S. Government securities by the Funds.
During the current fiscal period, the in-kind security transactions associated with creations and redemptions were as follows:
In-Kind | In-Kind | |||||||
Defiance Quantum ETF | $ | 109,784,687 | $ | 23,964,461 | ||||
Defiance Next Gen Connectivity ETF | 549,441,079 | 318,111,979 | ||||||
Defiance Next Gen SPAC Derived ETF | 94,833,274 | 94,389,156 | ||||||
Defiance Next Gen H2 ETF | 68,600,149 | 575,862 | ||||||
Defiance Next Gen Altered Experience ETF | 15,929,513 | 1,292,055 | ||||||
Defiance Hotel, Airline, and Cruise ETF | 25,281,524 | 1,910,775 | ||||||
Defiance Next Gen Big Data ETF | 2,478,978 | — | ||||||
Defiance Digital Revolution ETF | 11,758,882 | — | ||||||
72
Defiance ETFs
Notes to Financial Statements
December 31, 2021 (Continued)
NOTE 6 – INCOME TAX INFORMATION
The components of distributable earnings (accumulated deficit) and cost basis of investments for federal income tax purposes at December 31, 2021 were as follows:
Defiance | Defiance | Defiance Next | Defiance Next | |||||||||||||
Tax cost of investments | $ | 175,582,525 | $ | 1,259,867,636 | $ | 37,270,542 | $ | 78,002,164 | ||||||||
Gross tax unrealized appreciation | $ | 36,279,690 | $ | 319,289,633 | $ | 1,407,706 | $ | 1,643,986 | ||||||||
Gross tax unrealized depreciation | (6,632,858 | ) | (63,349,344 | ) | (10,560,194 | ) | (13,999,696 | ) | ||||||||
Net tax unrealized appreciation (depreciation) | 29,646,832 | 255,940,289 | (9,152,488 | ) | (12,355,710 | ) | ||||||||||
Undistributed ordinary income | 72,198 | — | 265,176 | — | ||||||||||||
Undistributed long-term capital gain | — | — | — | — | ||||||||||||
Other accumulated gain (loss) | (24,506 | ) | (4,222,580 | ) | (9,202,861 | ) | (4,721,632 | ) | ||||||||
Distributable earnings (accumulated deficit) | $ | 29,694,524 | $ | 251,717,709 | $ | (18,090,173 | ) | $ | (17,077,342 | ) | ||||||
Defiance Next | Defiance Hotel, | Defiance Next | Defiance Digital | |||||||||||||
Tax cost of investments | $ | 14,388,663 | $ | 23,577,029 | $ | 2,513,350 | $ | 11,782,676 | ||||||||
Gross tax unrealized appreciation | $ | 74,725 | $ | 1,070,009 | $ | 185,802 | $ | 54,268 | ||||||||
Gross tax unrealized depreciation | (6,281,981 | ) | (1,895,225 | ) | (345,303 | ) | (1,921,223 | ) | ||||||||
Net tax unrealized appreciation (depreciation) | (6,207,256 | ) | (825,216 | ) | (159,501 | ) | (1,866,955 | ) | ||||||||
Undistributed ordinary income | — | — | 30,433 | 648 | ||||||||||||
Undistributed long-term capital gain | — | — | — | — | ||||||||||||
Other accumulated gain (loss) | (1,118,018 | ) | (60,295 | ) | — | — | ||||||||||
Distributable earnings (accumulated deficit) | $ | (7,325,274 | ) | $ | (885,511 | ) | $ | (129,068 | ) | $ | (1,866,307 | ) | ||||
The difference between the cost basis for financial statement and federal income tax purposes is due primarily to timing differences in recognizing wash sales and unrealized gains on investments in passive foreign investment companies.
For the fiscal year/period ended December 31, 2021, the Funds had no post-October capital losses and the following late-year ordinary losses:
Late-Year Losses | ||||
Defiance Quantum ETF | $ | — | ||
Defiance Next Gen Connectivity ETF | — | |||
Defiance Next Gen SPAC Derived ETF | — | |||
Defiance Next Gen H2 ETF | — | |||
Defiance Next Gen Altered Experience ETF | 159,352 | |||
Defiance Hotel, Airline, and Cruise ETF | 2,869 | |||
Defiance Next Gen Big Data ETF | — | |||
Defiance Digital Revolution ETF | — | |||
73
Defiance ETFs
Notes to Financial Statements
December 31, 2021 (Continued)
As of December 31, 2021, the Funds had the following capital loss carryforwards with no expiration date:
Short-Term | Long-Term | |||||||
Defiance Quantum ETF | $ | 24,506 | $ | — | ||||
Defiance Next Gen Connectivity ETF | 3,919,160 | 303,420 | ||||||
Defiance Next Gen SPAC Derived ETF | 9,031,753 | 171,108 | ||||||
Defiance Next Gen H2 ETF | 4,721,632 | — | ||||||
Defiance Next Gen Altered Experience ETF | 958,666 | — | ||||||
Defiance Hotel, Airline, and Cruise ETF | 57,426 | — | ||||||
Defiance Next Gen Big Data ETF | — | — | ||||||
Defiance Digital Revolution ETF | — | — | ||||||
During the current fiscal year, Defiance Next Gen Connectivity ETF utilized $733,336 of long-term capital loss carryforward that was available as of December 31, 2020.
The tax character of distributions paid by the Funds during the fiscal period ended December 31, 2021, were as follows:
Ordinary | Long-Term | Return of | ||||||||||
Defiance Quantum ETF | $ | 590,541 | $ | 99,820 | $ | — | ||||||
Defiance Next Gen Connectivity ETF | 15,735,900 | — | 525,022 | |||||||||
Defiance Next Gen SPAC Derived ETF | 448,838 | — | — | |||||||||
Defiance Next Gen H2 ETF | — | — | 6,902 | |||||||||
Defiance Next Gen Altered Experience ETF | 233,167 | — | — | |||||||||
Defiance Hotel, Airline, and Cruise ETF | — | — | — | |||||||||
Defiance Next Gen Big Data ETF | 11,640 | — | — | |||||||||
Defiance Digital Revolution ETF | — | — | — | |||||||||
The tax character of distributions paid by the Funds during the fiscal period ended December 31, 2020, were as follows:
Ordinary | Return of | |||||||
Defiance Quantum ETF | $ | 221,124 | $ | — | ||||
Defiance Next Gen Connectivity ETF | 5,446,296 | 407,082 | ||||||
Defiance Next Gen SPAC Derived ETF | — | — | ||||||
Defiance Next Gen H2 ETF | N/A | N/A | ||||||
Defiance Next Gen Altered Experience ETF | N/A | N/A | ||||||
Defiance Hotel, Airline, and Cruise ETF | N/A | N/A | ||||||
Defiance Next Gen Big Data ETF | N/A | N/A | ||||||
Defiance Digital Revolution ETF | N/A | N/A | ||||||
NOTE 7 – SHARE TRANSACTIONS
Shares of the Funds are listed and traded on the New York Stock Exchange Arca, Inc. (“NYSE Arca”). Market prices for the shares may be different from their NAV. The Funds issue and redeem shares on a continuous basis at NAV generally in blocks of shares, called “Creation Units.” The Funds generally issue Creation Units in blocks of 50,000 shares, except for Defiance Next Gen Altered Experience ETF, Defiance Hotel, Airline, and Cruise ETF, and Defiance Next Gen Big Data ETF that generally issues Creation Units in blocks of 25,000 shares and Defiance Digital Revolution ETF that generally issue Creation Units in blocks of 10,000 shares.
74
Defiance ETFs
Notes to Financial Statements
December 31, 2021 (Continued)
Creation Units are issued and redeemed principally in-kind for securities included in a specified universe. Once created, shares generally trade in the secondary market at market prices that change throughout the day. Except when aggregated in Creation Units, shares are not redeemable securities of the Funds. Creation Units may only be purchased or redeemed by certain financial institutions (“Authorized Participants”). An Authorized Participant is either (i) a broker-dealer or other participant in the clearing process through the Continuous Net Settlement System of the National Securities Clearing Corporation or (ii) a Depository Trust Company participant and, in each case, must have executed a Participant Agreement with the Distributor. Most retail investors do not qualify as Authorized Participants nor have the resources to buy and sell whole Creation Units. Therefore, they are unable to purchase or redeem shares directly from the Funds. Rather, most retail investors may purchase shares in the secondary market with the assistance of a broker and are subject to customary brokerage commissions or fees.
The Funds each currently offer one class of shares, which has no front-end sales load, no deferred sales charge, and no redemption fee. A fixed transaction fee is imposed for the transfer and other transaction costs associated with the purchase or sale of Creation Units. The standard fixed transaction fee for the Funds is $500, payable to the Custodian, except for Defiance Next Gen Altered Experience ETF and Defiance Next Gen Big Data ETF whose standard fixed transaction fee is $250. The fixed transaction fee may be waived on certain orders if the Funds’ Custodian has determined to waive some or all of the costs associated with the order or another party, such as the Adviser, has agreed to pay such fee. In addition, a variable fee may be charged on all cash transactions or substitutes for Creation Units of up to a maximum of 2% of the value of the Creation Units subject to the transaction. Variable fees are imposed to compensate the Funds for transaction costs associated with the cash transactions. Variable fees received by the Funds, if any, are displayed in the capital shares transactions section of the Statements of Changes in Net Assets. The Funds may issue an unlimited number of shares of beneficial interest, with no par value. All shares of the Funds have equal rights and privileges.
NOTE 8 – PRINCIPAL RISKS
Covid-19 Risk. The recent global outbreak of COVID-19 has disrupted economic markets and the prolonged economic impact is uncertain. The operational and financial performance of the issuers of securities in which the Funds invest depends on future developments, including the duration and spread of the outbreak, and such uncertainty may in turn impact the value of the Funds’ investments.
Sector Risk. To the extent that a Fund invests more heavily in particular sectors of the economy, its performance will be especially sensitive to developments that significantly affect those sectors.
Information Technology Sector Risk. (Defiance Quantum ETF) The Fund is generally expected to invest significantly in companies in the information technology sector, including the semiconductor industry, and therefore the performance of the Fund could be negatively impacted by events affecting this sector. Market or economic factors impacting information technology companies and companies that rely heavily on technological advances could have a significant effect on the value of the Fund’s investments. The value of stocks of information technology companies and companies that rely heavily on technology is particularly vulnerable to rapid changes in technology product cycles, rapid product obsolescence, government regulation and competition, both domestically and internationally, including competition from foreign competitors with lower production costs. Stocks of information technology companies and companies that rely heavily on technology, especially those of smaller, less-seasoned companies, tend to be more volatile than the overall market. Information technology companies are heavily dependent on patent and intellectual property rights, the loss or impairment of which may adversely affect profitability. Information technology companies and companies that rely heavily on technology may also be prone to operational and information security risks resulting from cyber-attacks and/or technological malfunctions.
5G Investment Risk. (Defiance Next Gen Connectivity ETF) Companies across a wide variety of industries, primarily in the technology sector, are exploring the possible applications of 5G technologies. The extent of such technologies’ versatility has not yet been fully explored. Consequently, the Fund’s holdings may include equity securities of operating companies that focus on or have exposure to a wide variety of industries, and the economic fortunes of certain companies held by the Fund may not be significantly tied to such technologies. Currently, there are few public companies for which 5G technologies represent an attributable and significant revenue or profit stream, and such technologies may not ultimately have a material effect on the economic returns of companies in which the Fund invests.
75
Defiance ETFs
Notes to Financial Statements
December 31, 2021 (Continued)
Associated Risks of SPAC-Derived Companies. (Defiance Next Gen SPAC Derived ETF) The Fund invests in companies that are derived from a SPAC. These companies may be unseasoned and lack a trading history, a track record of reporting to investors, and widely available research coverage. SPAC-derived companies are thus often subject to extreme price volatility and speculative trading. These stocks may have above-average price appreciation in connection with a potential business combination with a SPAC prior to inclusion in the Index. The price of stocks included in the Index may not continue to appreciate and the performance of these stocks may not replicate the performance exhibited in the past. In addition, SPAC-derived companies may share similar illiquidity risks of private equity and venture capital. The free float shares held by the public in a SPAC-derived company are typically a small percentage of the market capitalization. The ownership of many SPAC-derived companies often includes large holdings by venture capital and private equity investors who seek to sell their shares in the public market in the months following a business combination transaction when shares restricted by lock.
Concentration in Hydrogen and Fuel Cell Companies Risk. (Defiance Next Gen H2 ETF) The Fund’s investments will be concentrated in an industry or group of industries to the extent that the Index is so concentrated. In such event, the value of the Shares may rise and fall more than the value of shares of a fund that invests in securities of companies in a broader range of industries. The Index is expected to be concentrated in hydrogen and fuel cell companies. Such companies may depend largely on the availability of hydrogen gas, certain third-party key suppliers for components in their products, and a small number of customers for a significant portion of their business. Hydrogen and fuel cell companies are also subject to risks related to the obsolescence of existing technology, short product cycles, falling prices and profits, competition from new market entrants, and general economic conditions that significantly affect the hydrogen, fuel cell, and overall clean energy industry. Risks associated with hazardous materials, fluctuations in energy prices and supply and demand of alternative energy fuels, energy conservation, the success of exploration projects and tax and other government regulations can also significantly affect this industry. Shares in the companies involved in this industry may be significantly more volatile than shares of companies operating in other, more established industries.
Concentration in Medical Cannabis Companies Risk. (Defiance Next Gen Altered Experience ETF) The companies in which the Fund invests are subject to various laws, regulations and guidelines relating to the cultivation, production, manufacture, management, transportation, storage and disposal of cannabis, as well as those relating to health and safety, the conduct of operations and the protection of the environment. Even if a company’s operations are permitted under current law, they may not be permitted in the future or they may not be permitted under federal law, in which case such company may not be in a position to carry on its operations in its current locations or may be subject to administrative, civil, or criminal enforcement action brought by regulatory, law enforcement, or governmental authorities. Additionally, controlled substance legislation differs between countries, and legislation in certain countries may restrict or limit the ability of certain companies in which the Fund invests to develop, produce, or sell their products. These laws and regulations may significantly affect a cannabis-related company’s ability to secure financing, impact the market for sales and services, and set limitations on cannabis use, production, processing, transportation, sale, marketing, and storage. In addition to regulatory action, litigation initiated by private citizens or companies could have a negative impact on the financial and/or operational status of cannabis-related companies. Cannabis-related companies may also be required to secure permits and authorizations from government agencies to cultivate, process, transport, store, market, sell, or research cannabis-based products. In addition, cannabis-related companies are subject to the risks associated with the agricultural, biotechnology, and pharmaceutical industries.
Concentration in Travel Companies Risk. (Defiance Hotel, Airline, and Cruise ETF) The Fund’s investments will be concentrated in an industry or group of industries to the extent that the Index is so concentrated. In such event, the value of the Shares may rise and fall more than the value of shares of a fund that invests in securities of companies in a broader range of industries. Travel Companies may be adversely affected by a downturn in economic conditions that can result in decreased demand for leisure and business travel. Due to the discretionary nature of business and leisure travel spending, Travel Company revenues are heavily influenced by the condition of the U.S. and foreign economies. Travel Companies may also be significantly affected by changes in labor relations and insurance costs. Travel Companies in the airline and cruise industries may also be significantly affected by changes in fuel prices, which may be very volatile and may not be able to be passed on to customers by increasing fares. Airline companies may also be highly dependent on aircraft or related equipment from a small number of suppliers, and consequently, issues affecting the availability, reliability, safety, or longevity of such aircraft or equipment (e.g., the inability of a supplier to meet aircraft demand or the grounding of an aircraft due to safety concerns) may have a significant effect on the operations and profitability of airline companies. Companies in the hotel and lodging industry, as well as the cruise industry, are subject to various
76
Defiance ETFs
Notes to Financial Statements
December 31, 2021 (Continued)
risks that may cause significant losses, which includes risks related to uncertainty in travel (due to global, regional or local events), guest safety, security, and privacy, changing consumer demands, shortages of experienced personnel, consumer perception of risk (for example, due to terrorist attacks, pandemics, and political or social violence), and changing or increased regulations.
Concentration in Big Data Companies Risk. (Defiance Next Gen Big Data ETF) The Fund’s investments will be concentrated in an industry or group of industries to the extent that the Index is so concentrated. In such event, the value of the Shares may rise and fall more than the value of shares of a fund that invests in securities of companies in a broader range of industries. The Fund invests primarily in the equity securities of Big Data Companies and, as such, is particularly sensitive to the risks associated with those types of companies. These risks include, but are not limited to, small or limited markets for such products or services, changes in business cycles, world economic growth, technological progress, rapid obsolescence, and government regulation. Securities of Big Data Companies, especially smaller, start-up companies, tend to be more volatile than securities of companies that do not rely heavily on technology. Rapid change to technologies that affect a company’s products could have a material adverse effect on such company’s operating results. Big Data Companies may rely on a combination of patents, copyrights, trademarks, and trade secret laws to establish and protect their proprietary rights in their products and technologies. There can be no assurance that the steps taken by these companies to protect their proprietary rights will be adequate to prevent the misappropriation of their technology or that competitors will not independently develop technologies that are substantially equivalent or superior to such companies’ technology.
Concentration in Digital Revolution Companies Risk. (Defiance Digital Revolution ETF) The Index, and consequently the Fund, is expected to concentrate its investments (i.e., hold more than 25% of its total assets) in the securities of Digital Revolution Companies. As a result, the value of the Fund’s shares may rise and fall more than the value of shares of a fund that invests in securities of companies in a broader range of industries. In addition, at times, Digital Revolution Companies may be out of favor and underperform other industries or groups of industries or the market as a whole. In such event, the value of the Shares may rise and fall more than the value of shares of a fund that invests in securities of companies in a broader range of industries.
77
Defiance ETFs
Report of Independent Registered Public Accounting Firm
To the Shareholders of Defiance ETFs and
Board of Trustees of ETF Series Solutions
Opinion on the Financial Statements
We have audited the accompanying statements of assets and liabilities, including the schedules of investments, of Defiance ETFs comprising the funds listed below (the “Funds”), each a series of ETF Series Solutions, as of December 31, 2021, the related statements of operations, the statements of changes in net assets, the related notes, and the financial highlights for each of the periods indicated below (collectively referred to as the “financial statements”). In our opinion, the financial statements present fairly, in all material respects, the financial position of each of the Funds as of December 31, 2021, the results of their operations, the changes in net assets, and the financial highlights for each of the periods indicated below in conformity with accounting principles generally accepted in the United States of America.
Fund Name | Statements of | Statements of Changes | Financial |
Defiance Quantum ETF | For the year ended December 31, 2021 | For the years ended December 31, 2021 and 2020 | For the years ended December 31, 2021, 2020, and 2019 and for the period from September 4, 2018 (commencement of operations) through December 31, 2018 |
Defiance Next Gen Connectivity ETF | For the year ended December 31, 2021 | For the years ended December 31, 2021 and 2020 | For the years ended December 31, 2021 and 2020 and for the period from March 4, 2019 (commencement of operations) through December 31, 2019 |
Defiance Next Gen SPAC Derived ETF | For the year ended December 31, 2021 | For the year ended December 31, 2021 and for the period from September 30, 2020 (commencement of operations) through December 31, 2020 | |
Defiance Next Gen H2 ETF | For the period from March 9, 2021 (commencement of operations) through December 31, 2021 | ||
Defiance Next Gen Altered Experience ETF | For the period from May 27, 2021 (commencement of operations) through December 31, 2021 | ||
Defiance Hotel, Airline, and Cruise ETF | For the period from June 3, 2021 (commencement of operations) through December 31, 2021 | ||
Defiance Next Gen Big Data ETF | For the period from July 13, 2021 (commencement of operations) through December 31, 2021 | ||
Defiance Digital Revolution ETF | For the period from December 1, 2021 (commencement of operations) through December 31, 2021 | ||
Basis for Opinion
These financial statements are the responsibility of the Funds’ management. Our responsibility is to express an opinion on the Funds’ financial statements based on our audits. We are a public accounting firm registered with the Public Company Accounting Oversight Board (United States) (“PCAOB”) and are required to be independent with respect to the Funds in accordance with the U.S. federal securities laws and the applicable rules and regulations of the Securities and Exchange Commission and the PCAOB.
We conducted our audits in accordance with the standards of the PCAOB. Those standards require that we plan and perform the audit to obtain reasonable assurance about whether the financial statements are free of material misstatement whether due to error or fraud.
78
Defiance ETFs
Report of Independent Registered Public Accounting Firm
(Continued)
Our audits included performing procedures to assess the risks of material misstatement of the financial statements, whether due to error or fraud, and performing procedures that respond to those risks. Such procedures included examining, on a test basis, evidence regarding the amounts and disclosures in the financial statements. Our procedures included confirmation of securities owned as of December 31, 2021, by correspondence with the custodian and brokers; when replies were not received from brokers, we performed other auditing procedures. Our audits also included evaluating the accounting principles used and significant estimates made by management, as well as evaluating the overall presentation of the financial statements. We believe that our audits provide a reasonable basis for our opinion.
We have served as the Funds’ auditor since 2018.

COHEN & COMPANY, LTD.
Milwaukee, Wisconsin
March 1, 2022
79
Defiance ETFs
Trustees and Officers
(Unaudited)
Additional information about each Trustee of the Trust is set forth below. The address of each Trustee of the Trust is c/o U.S. Bank Global Fund Services, 615 E. Michigan Street, Milwaukee, WI 53202.
Name and | Position | Term of | Principal Occupation(s) | Number of Portfolios | Other |
Independent Trustees | |||||
Leonard M. Rush, CPA Born: 1946 | Lead Independent Trustee and Audit Committee Chairman | Indefinite term; since 2012 | Retired; formerly Chief Financial Officer, Robert W. Baird & Co. Incorporated (wealth management firm) (2000–2011). | 60 | Independent Trustee, Managed Portfolio Series (33 portfolios) (since 2011). |
David A. Massart Born: 1967 | Trustee | Indefinite term; since 2012 | Partner and Manager Director, Beacon Pointe Advisors, LLC (since 2022); Co-Founder, President, and Chief Investment Strategist, Next Generation Wealth Management, Inc. (2005-2021). | 60 | Independent Trustee, Managed Portfolio Series (33 portfolios) (since 2011). |
Janet D. Olsen Born: 1956 | Trustee | Indefinite term; since 2018 | Retired; formerly Managing Director and General Counsel, Artisan Partners Limited Partnership (investment adviser) (2000–2013); Executive Vice President and General Counsel, Artisan Partners Asset Management Inc. (2012–2013); Vice President and General Counsel, Artisan Funds, Inc. (investment company) (2001–2012). | 60 | Independent Trustee, PPM Funds (3 portfolios) (since 2018). |
Interested Trustee | |||||
Michael A. Castino Born: 1967 | Trustee and Chairman | Indefinite term; Trustee since 2014; Chairman since 2013 | Senior Vice President, U.S. Bancorp Fund Services, LLC (since 2013); Managing Director of Index Services, Zacks Investment Management (2011–2013). | 60 | None |
80
Defiance ETFs
Trustees and Officers
(Unaudited) (Continued)
The officers of the Trust conduct and supervise its daily business. The address of each officer of the Trust is c/o U.S. Bank Global Fund Services, 615 E. Michigan Street, Milwaukee, WI 53202. Additional information about the Trust’s officers is as follows:
Name and | Position(s) | Term of | Principal Occupation(s) |
Principal Officers of the Trust | |||
Kristina R. Nelson | President | Indefinite term; since 2019 | Senior Vice President, U.S. Bancorp Fund Services, LLC (since 2020); Vice President, U.S. Bancorp Fund Services, LLC (2014–2020). |
Michael D. Barolsky | Vice President | Indefinite term; since 2014 (other roles since 2013) | Senior Vice President, U.S. Bancorp Fund Services, LLC (since 2019); Vice President, U.S. Bancorp Fund Services, LLC (2012-2019); Associate, Thompson Hine LLP (law firm) (2008–2012). |
Alyssa M. Bernard | Vice President | Indefinite term; since 2021 | Vice President, U.S. Bancorp Fund Services, LLC (since 2021); Assistant Vice President, U.S. Bancorp Fund Services, LLC (2018–2021); Attorney, Waddell & Reed Financial, Inc. (2017–2018); Attorney, American Century Companies, Inc. (2014–2017) |
Elizabeth B. Scalf | Chief Compliance Officer and Anti-Money Laundering Officer | Indefinite term; since 2021 | Senior Vice President, U.S. Bancorp Fund Services, LLC (since 2017); Vice President and Assistant CCO, Heartland Advisors, Inc. (2016–2017); Vice President and CCO, Heartland Group, Inc. (2016). |
Kristen M. Weitzel, | Treasurer | Indefinite term; since 2014 (other roles since 2013) | Vice President, U.S. Bancorp Fund Services, LLC (since 2015); Assistant Vice President, U.S. Bancorp Fund Services, LLC (2011–2015); Manager, PricewaterhouseCoopers LLP (accounting firm) (2005–2011). |
Isabella K. Zoller | Secretary | Indefinite term; since 2021 (other roles since 2020) | Assistant Vice President, U.S. Bancorp Fund Services, LLC (since 2021), Regulatory Administration Attorney, U.S. Bancorp Fund Services, LLC (since 2019), Regulatory Administration Intern, U.S. Bancorp Fund Services, LLC (2018-2019) and Law Student (2016-2019). |
Elizabeth A. Winske | Assistant Treasurer | Indefinite term; since 2017 | Vice President, U.S. Bancorp Fund Services, LLC (since 2020); Assistant Vice President, U.S. Bancorp Fund Services, LLC (2016–2020). |
Jason E. Shlensky | Assistant Treasurer | Indefinite term; since 2019 | Assistant Vice President, U.S. Bancorp Fund Services, LLC (since 2019); Officer, U.S. Bancorp Fund Services, LLC (2014–2019). |
Jessica L. Vorbeck | Assistant Treasurer | Indefinite term; since 2020 | Officer, U.S. Bancorp Fund Services, LLC (since 2018, 2014-2017). |
Cynthia L. Andrae | Deputy Chief Compliance Officer | Indefinite term; Since 2021 | Vice President, U.S. Bancorp Fund Services, LLC (since 2019); Compliance Officer, U.S. Bancorp Fund Services, LLC (2015-2019). |
The Statement of Additional Information (“SAI”) includes additional information about the Trustees and is available without charge, upon request, by calling toll free at (800) 617-0004, or by accessing the SEC’s website at www.sec.gov, or by accessing the Fund’s website at www.defianceetfs.com.
81
Defiance ETFs
Expense Examples
For the Six-Months Ended December 31, 2021 (Unaudited)
As a shareholder of the Funds, you incur two types of costs: (1) transaction costs, including brokerage commissions on purchases and sales of Fund shares, and (2) ongoing costs, including management fees and other Fund expenses. This example is intended to help you understand your ongoing costs (in dollars) of investing in the Funds and to compare these costs with the ongoing costs of investing in other funds. The example is based on an investment of $1,000 invested at the beginning of the period and held for the entire period as indicated in the following Expense Example tables.
Actual Expenses
The first line of the table provides information about actual account values based on actual returns and actual expenses. You may use the information in this line, together with the amount you invested, to estimate the expenses that you paid over the period. Simply divide your account value by $1,000 (for example, an $8,600 account value divided by $1,000 = 8.6), then, multiply the result by the number in the first line under the heading entitled “Expenses Paid During the Period’’ to estimate the expenses you paid on your account during this period.
Hypothetical Example for Comparison Purposes
The second line of the table provides information about hypothetical account values based on a hypothetical return and hypothetical expenses based on the Funds’ actual expense ratio and an assumed rate of return of 5% per year before expenses, which is not the Funds’ actual return. The hypothetical account values and expenses may not be used to estimate the actual ending account balance or expenses you paid for the period. You may use this information to compare the ongoing costs of investing in the Funds and other funds. To do so, compare this 5% hypothetical example with the 5% hypothetical examples that appear in the shareholder reports of the other funds. Please note that the expenses shown in the table are meant to highlight your ongoing costs only and do not reflect any transactional costs, such as brokerage commissions paid on purchases and sales of Fund shares. Therefore, the second line of the table is useful in comparing ongoing costs only and will not help you determine the relative total costs of owning different funds. If these transactional costs were included, your costs would have been higher.
Defiance Quantum ETF
Beginning | Ending | Expenses | |
Actual | $1,000.00 | $ 1,123.50 | $2.14 |
Hypothetical (5% annual return before expenses) | $1,000.00 | $ 1,023.19 | $2.04 |
(1) | The dollar amounts shown as expenses paid during the period are equal to the annualized expense ratio, 0.40%, multiplied by the average account value during the six-month period, multiplied by 184/365, to reflect the one-half year period. |
Defiance Next Gen Connectivity ETF
Beginning | Ending | Expenses | |
Actual | $1,000.00 | $ 1,104.70 | $1.59 |
Hypothetical (5% annual return before expenses) | $1,000.00 | $ 1,023.69 | $1.53 |
(2) | The dollar amounts shown as expenses paid during the period are equal to the annualized expense ratio, 0.30%, multiplied by the average account value during the six-month period, multiplied by 184/365, to reflect the one-half year period. |
Defiance Next Gen SPAC Derived ETF
Beginning | Ending | Expenses | |
Actual | $1,000.00 | $ 815.70 | $2.06 |
Hypothetical (5% annual return before expenses) | $1,000.00 | $ 1,022.94 | $2.29 |
(3) | The dollar amounts shown as expenses paid during the period is equal to the annualized expense ratio, 0.45%, multiplied by the average account value during the six-month period, multiplied by 184/365, to reflect the one-half year period. |
82
Defiance ETFs
Expense Examples
For the Six-Months Ended December 31, 2021 (Unaudited) (Continued)
Defiance Next Gen H2 ETF
Beginning | Ending | Expenses | |
Actual | $1,000.00 | $ 787.60 | $1.35 |
Hypothetical (5% annual return before expenses) | $1,000.00 | $ 1,023.69 | $1.53 |
(4) | The dollar amounts shown as expenses paid during the period is equal to the annualized expense ratio, 0.30%, multiplied by the average account value during the six-month period, multiplied by 184/365, to reflect the one-half year period. |
Defiance Next Gen Altered Experience ETF
Beginning | Ending | Expenses | |
Actual | $1,000.00 | $ 487.60 | $2.81 |
Hypothetical (5% annual return before expenses) | $1,000.00 | $ 1,021.42 | $3.82 |
(5) | The dollar amount shown as expenses paid during the period is equal to the annualized expense ratio, 0.75%, multiplied by the average account value during the six-month period, multiplied by 184/365, to reflect the one-half year period. |
Defiance Hotel, Airline, and Cruise ETF
Beginning | Ending | Expenses | |
Actual | $1,000.00 | $ 936.10 | $2.20 |
Hypothetical (5% annual return before expenses) | $1,000.00 | $ 1,022.94 | $2.29 |
(6) | The dollar amount shown as expenses paid during the period is equal to the annualized expense ratio, 0.45%, multiplied by the average account value during the six-month period, multiplied by 184/365, to reflect the one-half year period. |
Defiance Next Gen Big Data ETF
Beginning | Ending | Expenses | |
Actual | $1,000.00 | $ 952.60 | $2.06(8) |
Hypothetical (5% annual return before expenses) | $1,000.00 | $ 1,022.94 | $2.29(9) |
(7) | Fund commencement. |
(8) | The dollar amount shown as expenses paid during the period is equal to the annualized expense ratio, 0.45%, multiplied by the average account value during the period, multiplied by 171/365, to reflect the period. |
(9) | The dollar amount shown as expenses paid during the period is equal to the annualized expense ratio, 0.45%, multiplied by the average account value during the six-month period, multiplied by 184/365, to reflect the one-half year period. |
Defiance Digital Revolution ETF
Beginning | Ending | Expenses | |
Actual | $1,000.00 | $ 760.70 | $0.47(11) |
Hypothetical (5% annual return before expenses) | $1,000.00 | $ 1,021.93 | $3.31(12) |
(10) | Fund commencement. |
(11) | The dollar amount shown as expenses paid during the period is equal to the annualized expense ratio, 0.65%, multiplied by the average account value during the period, multiplied by 30/365, to reflect the period. |
(12) | The dollar amount shown as expenses paid during the period is equal to the annualized expense ratio, 0.65%, multiplied by the average account value during the six-month period, multiplied by 184/365, to reflect the one-half year period. |
83
Defiance ETFs
Review of Liquidity Risk Management Program
(Unaudited)
Pursuant to Rule 22e-4 under the Investment Company Act of 1940, the Trust, on behalf of the series of the Trust covered by this shareholder report (the “Series”), has adopted a liquidity risk management program to govern the Trust’s approach to managing liquidity risk. Rule 22e-4 seeks to promote effective liquidity risk management, thereby reducing the risk that a fund will be unable to meet its redemption obligations and mitigating dilution of the interests of fund shareholders. The Trust’s liquidity risk management program is tailored to reflect the Series’ particular risks, but not to eliminate all adverse impacts of liquidity risk, which would be incompatible with the nature of such Series.
The investment adviser to the Series has adopted and implemented its own written liquidity risk management program (the “Program”) tailored specifically to assess and manage the liquidity risk of the Series.
At a recent meeting of the Board of Trustees of the Trust, the Trustees received a report pertaining to the operation, adequacy, and effectiveness of implementation of the Program for the period ended December 31, 2020. The report concluded that the Program is reasonably designed to assess and manage the Series’ liquidity risk and has operated adequately and effectively to manage such risk. The report reflected that there were no liquidity events that impacted the Series’ ability to timely meet redemptions without dilution to existing shareholders. The report further noted that no material changes have been made to the Program since its implementation.
There can be no assurance that the Program will achieve its objectives in the future. Please refer to the prospectus for more information regarding the Series’ exposure to liquidity risk and other principal risks to which an investment in the Series may be subject.
84
Defiance Next Gen Big Data ETF
Defiance Digital Revolution ETF
Approval of Advisory Agreements and Board Considerations
(Unaudited)
Pursuant to Section 15(c) of the Investment Company Act of 1940 (the “1940 Act”), at a meeting held on April 20-21, 2021 (the “Meeting”), the Board of Trustees (the “Board”) of ETF Series Solutions (the “Trust”) considered the approval of the Investment Advisory Agreement (the “Advisory Agreement”) between Defiance ETFs, LLC (the “Adviser”) and the Trust, on behalf of the Defiance Next Gen Big Data ETF and Defiance Digital Revolution ETF (each, a “Fund” and together, the “Funds”), and the Investment Sub-Advisory Agreement (the “Sub-Advisory Agreement”) (together, the “Agreements”) among the Adviser, the Trust, on behalf of the Funds, and Penserra Capital Management LLC (“Penserra” or the “Sub-Adviser”).
Prior to the Meeting, the Board, including the Trustees who are not parties to the Agreements or “interested persons” of any party thereto, as defined in the 1940 Act (the “Independent Trustees”), reviewed written materials from the Adviser and Sub-Adviser (the “Materials”) regarding, among other things: (i) the nature, extent, and quality of the services to be provided by the Adviser and Sub-Adviser; (ii) the cost of the services to be provided and the profits expected to be realized by the Adviser, Sub-Adviser, or their affiliates from services rendered to the Funds; (iii) comparative fee and expense data for each Fund and other investment companies with similar investment objectives; (iv) the extent to which economies of scale might be realized as each Fund grows and whether the advisory fee for each Fund reflects these economies of scale for the benefit of the applicable Fund; and (v) any other financial benefits to the Adviser, Sub-Adviser, and their affiliates resulting from services rendered to the Funds.
Additionally, representatives from the Adviser and Sub-Adviser provided an oral overview of the Fund’s strategy, the services to be provided to the Fund by the Adviser and Sub-Adviser, and additional information about the Adviser’s and Sub-Adviser’s personnel and operations. The Board also considered that the Adviser and Sub-Adviser, along with other service providers of the Funds, had provided written updates on the firm over the course of the year with respect to their roles as adviser and sub-adviser to other series in the Trust, and the Board considered that information alongside the Materials in its evaluation of the Adviser’s and Sub-Adviser’s fees and other aspects of the Agreements. The Board then discussed the Materials, the Adviser’s oral presentation, and any other information that the Board received at the Meeting, and deliberated on the approval of the Agreements in light of this information.
Approval of the Advisory Agreement with the Adviser
Nature, Extent, and Quality of Services to be Provided. The Trustees considered the scope of services to be provided under the Advisory Agreement, noting that the Adviser will be providing investment management services to each Fund. In considering the nature, extent, and quality of the services to be provided by the Adviser, the Board considered the quality of the Adviser’s compliance program and past reports from the Trust’s Chief Compliance Officer (“CCO”) regarding his review of the Adviser’s compliance program, as well as the Board’s experience with the Adviser as the investment adviser to other series of the Trust. The Board noted that it had previously received a copy of the Adviser’s registration form, as well as the response of the Adviser to a detailed series of questions that included, among other things, information about the Adviser’s decision-making process, details about the Funds, and the services to be provided by the Adviser.
The Board also considered other services to be provided to the Funds, such as monitoring adherence to each Fund’s investment restrictions, oversight of the Sub-Adviser, monitoring compliance with various Fund policies and with applicable requirements, and monitoring the extent to which each Fund achieves its investment objective as a passively managed fund. The Board further considered the oral information provided by the Adviser with respect to the impact of the COVID-19 pandemic on the Adviser’s operations.
Historical Performance. The Board noted that each Fund had not yet commenced operations and concluded that the performance of each Fund, thus, was not a relevant factor in the context of the Board’s deliberations on the Advisory Agreement. The Board also considered that each Fund is designed to track the performance of an index. Consequently, with respect to each Fund’s performance, the Board in the future would focus on the Adviser’s services, including its oversight of the Sub-Adviser’s day-to-day management of each Fund in seeking to track the index as closely as possible.
85
Defiance Next Gen Big Data ETF
Defiance Digital Revolution ETF
Approval of Advisory Agreements and Board Considerations
(Unaudited) (Continued)
Cost of Services to be Provided and Economies of Scale. The Board then reviewed each Fund’s proposed expense ratio, the full amount of which was anticipated to be the “unified fee” described below, and compared each Fund’s expense ratio to its respective Category Peer Group and Selected Peer Group (each defined below) as follows:
Defiance Next Gen Big Data ETF: The Board noted that the expense ratio for the Fund was lower than the median of the universe of Technology ETFs as reported by Morningstar (the “Category Peer Group”). The Board further noted that the Fund’s proposed expense ratio was significantly lower than the expense ratio for the Fund’s sole competitor identified by the Adviser that is focused on artificial intelligence technology.
Defiance Digital Revolution ETF: The Board noted that the expense ratio for the Fund was slightly higher than the median of the universe of Miscellaneous ETFs as reported by Morningstar (the “Category Peer Group”). The Board also noted that due to the wide spectrum of strategies reflected in the Category Peer Group, the Category Peer Group may not allow for an apt comparison by which to judge the Fund’s expense ratio. The Board further noted that the Fund’s proposed expense ratio was lower than the expense ratio for the Fund’s sole competitor identified by the Adviser that is focused on blockchain technology.
The Board took into consideration that the Adviser would charge a “unified fee,” meaning the Funds would pay no expenses other than the advisory fee and certain other costs such as interest, brokerage, acquired fund fees and expenses, extraordinary expenses and, to the extent it is implemented, fees pursuant to a Distribution and/or Shareholder Servicing (12b 1) Plan. The Board noted that the Adviser would be responsible for compensating the Trust’s other service providers and paying each Fund’s other expenses out of its own fee and resources. The Board also evaluated the compensation and benefits expected to be received by the Adviser from its relationship with the Funds, taking into account an analysis of the Adviser’s anticipated profitability with respect to each Fund and the financial resources the Adviser had committed and proposed to commit to its business. The Board determined such analyses were not a significant factor given that the Funds had not yet commenced operations and consequently, the future size of each Fund and the Adviser’s future profitability were generally unpredictable.
The Board expressed the view that the Adviser might realize economies of scale in managing the Funds as assets grow in size. The Board further determined that, based on the amount and structure of each Fund’s unitary fee, such economies of scale would be shared the respective Fund shareholders in the initial period of such Fund’s operations, although the Board intends to monitor fees as each Fund grows in size and assess whether fee breakpoints may be warranted.
Conclusion. No single factor was determinative of the Board’s decision to approve the Advisory Agreement; rather, the Board based its determination on the total mix of information available to it. Based on a consideration of all the factors in their totality, the Board, including a majority of the Independent Trustees, determined that the Advisory Agreement, including the compensation payable under the agreement, was fair and reasonable to each Fund. The Board, including a majority of the Independent Trustees, therefore determined that the approval of the Advisory Agreement was in the best interests of each Fund and its shareholders.
Approval of the Sub-Advisory Agreement with the Sub-Adviser
Nature, Extent, and Quality of Services to be Provided. The Board considered the scope of services to be provided to the Funds under the Sub-Advisory Agreement, noting that the Sub-Adviser would provide investment management services to each Fund. The Board noted the responsibilities that the Sub-Adviser would have as the Funds’ investment sub-adviser, including: responsibility for the general management of the day-to-day investment and reinvestment of the assets of the Fund; determining the daily baskets of deposit securities and cash components; executing portfolio security trades for purchases and redemptions of each Fund’s shares conducted on a cash-in-lieu basis; oversight of general portfolio compliance with applicable securities laws, regulations, and investment restrictions; responsibility for daily monitoring of portfolio exposures and quarterly reporting to the Board; and implementation of Board directives as they relate to each Fund.
In considering the nature, extent, and quality of the services to be provided by the Sub-Adviser, the Board considered reports of the Trust’s CCO with respect to the Sub-Adviser’s compliance program and the Sub-Adviser’s experience providing investment management services to other ETFs, including other series of the Trust. The Trustees further noted that they had received and reviewed the Materials with regard to the Sub-Adviser and they had reviewed additional detailed information about the Sub-Adviser at previous Board meetings. The Board also considered the Sub-Adviser’s resources and capacity with respect to portfolio
86
Defiance Next Gen Big Data ETF
Defiance Digital Revolution ETF
Approval of Advisory Agreements and Board Considerations
(Unaudited) (Continued)
management, compliance, and operations given the number of funds for which it would be providing sub-advisory services. The Board further considered information provided by the Sub-Adviser with respect to the impact of the COVID-19 pandemic on the Sub-Adviser’s operations.
Historical Performance. The Board noted that the Funds had not yet commenced operations. Consequently, the Board determined that performance was not a relevant consideration in the context of the Board’s deliberations on the Sub-Advisory Agreement. The Board also considered that each Fund is designed to track the performance of an index. Consequently, with respect to each Fund’s performance, the Board in the future would focus on the Sub-Adviser’s services, including whether each Fund’s performance exhibited significant tracking error.
Costs of Services to be Provided and Economies of Scale. The Board reviewed the advisory fee to be paid by the Adviser to the Sub-Adviser for its services to the Funds. The Board considered the fees to be paid to the Sub-Adviser would be paid by the Adviser from the fee the Adviser receives from each Fund and noted that the fee reflected an arm’s-length negotiation between the Adviser and the Sub-Adviser. The Board further determined the fee reflected an appropriate allocation of the advisory fee paid to each adviser given the work performed by each firm and noted that the fees were generally in line with those charged by the Sub-Adviser in connection with other funds managed by the Sub-Adviser. The Board noted that the Sub-Adviser has an affiliated broker-dealer that was expected to execute some or all of the brokerage transactions for each Fund, and consequently, the Sub-Adviser would indirectly benefit from commissions paid to such affiliated broker-dealer. The Board also evaluated the compensation and benefits expected to be received by the Sub-Adviser from its relationship with the Funds, taking into account an analysis of the Sub-Adviser’s estimated profitability with respect to each Fund.
The Board expressed the view that the Sub-Adviser might realize economies of scale in managing the Funds as assets grow in size. The Board further noted that because the Fund pays the Adviser a unified fee, any benefits from breakpoints in the sub-advisory fee schedule would accrue to the Adviser, rather than Fund shareholders Consequently, the Board determined that it would monitor fees as each Fund’s assets grow to determine whether economies of scale were being effectively shared with such Fund and its shareholders.
Conclusion. No single factor was determinative of the Board’s decision to approve the Sub-Advisory Agreement; rather, the Board based its determination on the total mix of information available to it. Based on a consideration of all the factors in their totality, the Board, including a majority of the Independent Trustees, determined that the Sub-Advisory Agreement, including the compensation payable under the agreement, was fair and reasonable to the Fund. The Board, including a majority of the Independent Trustees, therefore determined that the approval of the Sub-Advisory Agreement was in the best interests of each Fund and its shareholders.
87
Defiance ETFs
Federal Tax Information
(Unaudited)
For the fiscal year/period ended December 31, 2021, certain dividends paid by the Funds may be subject to a maximum rate of 23.8%, as provided for by the Jobs and Growth Tax Relief Reconciliation Act of 2003. The percentage of dividends declared from ordinary income designated as qualified dividend income was as follows:
Defiance Quantum ETF | 100.00% |
Defiance Next Gen Connectivity ETF | 100.00% |
Defiance Next Gen SPAC Derived ETF | 0.54% |
Defiance Next Gen H2 ETF | 0.00% |
Defiance Next Gen Altered Experience ETF | 0.00% |
Defiance Hotel, Airline, and Cruise ETF | 0.00% |
Defiance Next Gen Big Data ETF | 85.05% |
Defiance Digital Revolution ETF | 0.00% |
For corporate shareholders, the percent of ordinary income distributions qualifying for the corporate dividend received deduction for the year/period ended December 31, 2021 was as follows:
Defiance Quantum ETF | 85.00% |
Defiance Next Gen Connectivity ETF | 69.17% |
Defiance Next Gen SPAC Derived ETF | 0.00% |
Defiance Next Gen H2 ETF | 0.00% |
Defiance Next Gen Altered Experience ETF | 0.00% |
Defiance Hotel, Airline, and Cruise ETF | 0.00% |
Defiance Next Gen Big Data ETF | 85.54% |
Defiance Digital Revolution ETF | 0.00% |
The percentage of taxable ordinary income distributions that are designated as short-term capital gain distributions under Internal Revenue Section 871(k)(2)(C) for each Fund was as follows:
Defiance Quantum ETF | 1.21% |
Defiance Next Gen Connectivity ETF | 0.00% |
Defiance Next Gen SPAC Derived ETF | 14.92% |
Defiance Next Gen H2 ETF | 0.00% |
Defiance Next Gen Altered Experience ETF | 0.00% |
Defiance Hotel, Airline, and Cruise ETF | 0.00% |
Defiance Next Gen Big Data ETF | 64.29% |
Defiance Digital Revolution ETF | 0.00% |
Information About Portfolio Holdings
(Unaudited)
The Funds file their complete schedules of portfolio holdings for their first and third fiscal quarters with the SEC on Part F of Form N-PORT. The Funds’ Part F of Form N-PORT is available without charge, upon request, by calling toll-free at (800) 617-0004 or by accessing the Funds’ website at www.defianceetfs.com. Furthermore, you may obtain the Part F of Form N-PORT on the SEC’s website at www.sec.gov or the Funds’ website at www.defianceetfs.com. Each Fund’s portfolio holdings are posted on their website at www.defianceetfs.com daily.
88
Defiance ETFs
Information About Proxy Voting
(Unaudited)
A description of the policies and procedures the Funds use to determine how to vote proxies relating to portfolio securities is provided in the Statement of Additional Information (“SAI”). The SAI is available without charge, upon request, by calling toll-free at (800) 617-0004, by accessing the SEC’s website at www.sec.gov, or by accessing the Funds’ website at www.defianceetfs.com.
When available, information regarding how the Funds voted proxies relating to portfolio securities during the period ending June 30 is available by calling toll-free at (800) 617-0004 or by accessing the SEC’s website at www.sec.gov.
Frequency Distribution of Premiums and Discounts
(Unaudited)
Information regarding how often shares of the Funds trade on the exchange at a price above (i.e., at a premium) or below (i.e., at a discount) the Funds’ NAV is available, without charge, on the Funds’ website at www.defianceetfs.com.
89
Adviser Defiance ETFs, LLC
| Distributor Foreside Fund Services, LLC |
Sub-Adviser Penserra Capital Management LLC
| Custodian U.S. Bank National Association |
Index Provider (QTUM, FIVG) BlueStar Global Investors, LLC
| Transfer Agent U.S. Bancorp Fund Services, LLC |
Index Provider (SPAK) Indxx, LLC
| Independent Registered Public Accounting Firm Cohen & Company, Ltd. |
Index Provider (HDRO, CRUZ, BIGY) MV Index Solutions GmbH
| Legal Counsel Morgan, Lewis & Bockius LLP |
Index Provider (PSY, NFTZ) BITA GmbH |
Defiance Quantum ETF Symbol – QTUM | Defiance Next Gen Connectivity ETF Symbol – FIVG
| Defiance Next Gen SPAC Derived ETF |
Defiance Next Gen H2 ETF | Defiance Next Gen Altered Experience ETF Symbol – PSY | Defiance Hotel, Airlines, and Cruise ETF Symbol – CRUZ |
Defiance Next Gen Big Data ETF Symbol – BIGY | Defiance Digital Revolution ETF Symbol – NFTZ |
| (b) | Not applicable. |
Item 2. Code of Ethics.
The registrant has adopted a code of ethics that applies to the registrant’s principal executive officer and principal financial officer. The registrant has not made any amendments to its code of ethics during the period covered by this report. The registrant has not granted any waivers from any provisions of the code of ethics during the period covered by this report. A copy of the registrant’s Code of Ethics is filed herewith.
Item 3. Audit Committee Financial Expert.
The registrant’s board of trustees has determined that there is at least one audit committee financial expert serving on its audit committee. Mr. Leonard Rush is the “audit committee financial expert” and is considered to be “independent” as each term is defined in Item 3 of Form N-CSR.
Item 4. Principal Accountant Fees and Services.
The registrant has engaged its principal accountant to perform audit services, audit-related services, tax services and other services during the past two fiscal years. “Audit services” refer to performing an audit of the registrant's annual financial statements or services that are normally provided by the accountant in connection with statutory and regulatory filings or engagements for those fiscal years. “Audit-related services” refer to the assurance and related services by the principal accountant that are reasonably related to the performance of the audit. “Tax services” refer to professional services rendered by the principal accountant for tax compliance, tax advice, and tax planning. There were no “Other services” provided by the principal accountant. The following table details the aggregate fees billed or expected to be billed for the last two fiscal years for audit fees, audit-related fees, tax fees and other fees by the principal accountant.
Defiance Quantum ETF
| FYE 12/31/2021 | FYE 12/31/2020 | |
| Audit Fees | $12,500 | $14,500 |
| Audit-Related Fees | $0 | $0 |
| Tax Fees | $3,500 | $3,000 |
| All Other Fees | $0 | $0 |
Defiance Next Gen Connectivity ETF
| FYE 12/31/2021 | FYE 12/31/2020 | |
| Audit Fees | $12,500 | $14,500 |
| Audit-Related Fees | $0 | $0 |
| Tax Fees | $3,500 | $3,000 |
| All Other Fees | $0 | $0 |
Defiance Next Gen SPAC Derived ETF
| FYE 12/31/2021 | FYE 12/31/2020 | |
| Audit Fees | $12,000 | $14,000 |
| Audit-Related Fees | $0 | $0 |
| Tax Fees | $3,500 | $3,000 |
| All Other Fees | $0 | $0 |
Defiance Next Gen H2 ETF
| FYE 12/31/2021 | |
| Audit Fees | $12,500 |
| Audit-Related Fees | $0 |
| Tax Fees | $3,500 |
| All Other Fees | $0 |
Defiance Next Gen Altered Experience ETF
| FYE 12/31/2021 | |
| Audit Fees | $12,000 |
| Audit-Related Fees | $0 |
| Tax Fees | $3,500 |
| All Other Fees | $0 |
Defiance Hotel, Airline, and Cruise ETF
| FYE 12/31/2021 | |
| Audit Fees | $12,500 |
| Audit-Related Fees | $0 |
| Tax Fees | $3,500 |
| All Other Fees | $0 |
Defiance Next Gen Big Data ETF
| FYE 12/31/2021 | |
| Audit Fees | $12,500 |
| Audit-Related Fees | $0 |
| Tax Fees | $3,500 |
| All Other Fees | $0 |
Defiance Digital Revolution ETF
| FYE 12/31/2021 | |
| Audit Fees | $10,000 |
| Audit-Related Fees | $0 |
| Tax Fees | $3,500 |
| All Other Fees | $0 |
The audit committee has adopted pre-approval policies and procedures that require the audit committee to pre-approve all audit and non-audit services of the registrant, including services provided to any entity affiliated with the registrant.
The percentage of fees billed by Cohen & Company, Ltd. applicable to non-audit services pursuant to waiver of pre-approval requirement were as follows:
Defiance Quantum ETF
| FYE 12/31/2021 | FYE 12/31/2020 | |
| Audit-Related Fees | 0% | 0% |
| Tax Fees | 0% | 0% |
| All Other Fees | 0% | 0% |
Defiance Next Gen Connectivity ETF
| FYE 12/31/2021 | FYE 12/31/2020 | |
| Audit-Related Fees | 0% | 0% |
| Tax Fees | 0% | 0% |
| All Other Fees | 0% | 0% |
Defiance Next Gen SPAC Derived ETF
| FYE 12/31/2021 | FYE 12/31/2020 | |
| Audit-Related Fees | 0% | 0% |
| Tax Fees | 0% | 0% |
| All Other Fees | 0% | 0% |
Defiance Next Gen H2 ETF
| FYE 12/31/2021 | |
| Audit-Related Fees | 0% |
| Tax Fees | 0% |
| All Other Fees | 0% |
Defiance Next Gen Altered Experience ETF
| FYE 12/31/2021 | |
| Audit-Related Fees | 0% |
| Tax Fees | 0% |
| All Other Fees | 0% |
Defiance Hotel, Airline, and Cruise ETF
| FYE 12/31/2021 | |
| Audit-Related Fees | 0% |
| Tax Fees | 0% |
| All Other Fees | 0% |
Defiance Next Gen Big Data ETF
| FYE 12/31/2021 | |
| Audit-Related Fees | 0% |
| Tax Fees | 0% |
| All Other Fees | 0% |
Defiance Next Gen Digital Revolution ETF
| FYE 12/31/2021 | |
| Audit-Related Fees | 0% |
| Tax Fees | 0% |
| All Other Fees | 0% |
All of the principal accountant’s hours spent on auditing the registrant’s financial statements were attributed to work performed by full-time permanent employees of the principal accountant.
The following table indicates the non-audit fees billed or expected to be billed by the registrant’s accountant for services to the registrant and to the registrant’s investment adviser (and any other controlling entity, etc.—not sub-adviser) for the last two years. The audit committee of the board of trustees/directors has considered whether the provision of non-audit services that were rendered to the registrant's investment adviser is compatible with maintaining the principal accountant's independence and has concluded that the provision of such non-audit services by the accountant has not compromised the accountant’s independence.
Defiance Quantum ETF
| Non-Audit Related Fees | FYE 12/31/2021 | FYE 12/31/2020 |
| Registrant | N/A | N/A |
| Registrant’s Investment Adviser | N/A | N/A |
Defiance Next Gen Connectivity ETF
| Non-Audit Related Fees | FYE 12/31/2021 | FYE 12/31/2020 |
| Registrant | N/A | N/A |
| Registrant’s Investment Adviser | N/A | N/A |
Defiance Next Gen SPAC Derived ETF
| Non-Audit Related Fees | FYE 12/31/2021 | FYE 12/31/2020 |
| Registrant | N/A | N/A |
| Registrant’s Investment Adviser | N/A | N/A |
Defiance Next Gen H2 ETF
| Non-Audit Related Fees | FYE 12/31/2021 |
| Registrant | N/A |
| Registrant’s Investment Adviser | N/A |
Defiance Next Gen Altered Experience ETF
| Non-Audit Related Fees | FYE 12/31/2021 |
| Registrant | N/A |
| Registrant’s Investment Adviser | N/A |
Defiance Hotel, Airline, and Cruise ETF
| Non-Audit Related Fees | FYE 12/31/2021 |
| Registrant | N/A |
| Registrant’s Investment Adviser | N/A |
Defiance Next Gen Big Data ETF
| Non-Audit Related Fees | FYE 12/31/2021 |
| Registrant | N/A |
| Registrant’s Investment Adviser | N/A |
Defiance Digital Revolution ETF
| Non-Audit Related Fees | FYE 12/31/2021 |
| Registrant | N/A |
| Registrant’s Investment Adviser | N/A |
The registrant has not been identified by the U.S. Securities and Exchange Commission as having filed an annual report issued by a registered public accounting firm branch or office that is located in a foreign jurisdiction where the Public Company Accounting Oversight Board is unable to inspect or completely investigate because of a position taken by an authority in that jurisdiction.
The registrant is not a foreign issuer.
Item 5. Audit Committee of Listed Registrants.
The registrant is an issuer as defined in Rule 10A-3 under the Securities Exchange Act of 1934, (the “Act”) and has a separately-designated standing audit committee established in accordance with Section 3(a)(58)(A) of the Act. The independent members of the committee are as follows: Leonard M. Rush, David A. Massart, and Janet D. Olsen.
Item 6. Investments.
Schedule of Investments is included as part of the report to shareholders filed under Item 1 of this Form.
Item 7. Disclosure of Proxy Voting Policies and Procedures for Closed-End Management Investment Companies.
Not applicable to open-end investment companies.
Item 8. Portfolio Managers of Closed-End Management Investment Companies.
Not applicable to open-end investment companies.
Item 9. Purchases of Equity Securities by Closed-End Management Investment Company and Affiliated Purchasers.
Not applicable to open-end investment companies.
Item 10. Submission of Matters to a Vote of Security Holders.
There have been no material changes to the procedures by which shareholders may recommend nominees to the registrant’s board of trustees.
Item 11. Controls and Procedures.
| (a) | The Registrant’s President (principal executive officer) and Treasurer (principal financial officer) have reviewed the Registrant's disclosure controls and procedures (as defined in Rule 30a-3(c) under the Investment Company Act of 1940 (the “Act”)) as of a date within 90 days of the filing of this report, as required by Rule 30a-3(b) under the Act and Rules 13a-15(b) or 15d-15(b) under the Securities Exchange Act of 1934. Based on their review, such officers have concluded that the disclosure controls and procedures are effective in ensuring that information required to be disclosed in this report is appropriately recorded, processed, summarized and reported and made known to them by others within the Registrant and by the Registrant’s service provider. |
| (b) | There were no changes in the Registrant's internal control over financial reporting (as defined in Rule 30a-3(d) under the Act) that occurred during the period covered by this report that has materially affected, or is reasonably likely to materially affect, the Registrant's internal control over financial reporting. |
Item 12. Disclosure of Securities Lending Activities for Closed-End Management Investment Companies.
Not applicable to open-end investment companies.
Item 13. Exhibits.
(3) Any written solicitation to purchase securities under Rule 23c-1 under the Act sent or given during the period covered by the report by or on behalf of the registrant to 10 or more persons. Not applicable to open-end investment companies.
(4) Change in registrant’s independent public accountant. There was no change in the registrant’s public accountant for the period covered by this report.
| (b) | Certifications pursuant to Section 906 of the Sarbanes-Oxley Act of 2002. Furnished herewith. |
SIGNATURES
Pursuant to the requirements of the Securities Exchange Act of 1934 and the Investment Company Act of 1940, the registrant has duly caused this report to be signed on its behalf by the undersigned, thereunto duly authorized.
| (Registrant) | ETF Series Solutions | |
| By (Signature and Title) | /s/ Kristina R. Nelson | |
| Kristina R. Nelson, President (principal executive officer) | ||
| Date | 3/10/2022 |
Pursuant to the requirements of the Securities Exchange Act of 1934 and the Investment Company Act of 1940, this report has been signed below by the following persons on behalf of the registrant and in the capacities and on the dates indicated.
| By (Signature and Title)* | /s/ Kristina R. Nelson | |
| Kristina R. Nelson, President (principal executive officer) | ||
| Date | 3/10/2022 | |
| By (Signature and Title)* | /s/ Kristen M. Weitzel | |
| Kristen M. Weitzel, Treasurer (principal financial officer) | ||
| Date | 3/10/2022 |
* Print the name and title of each signing officer under his or her signature.