As filed with the U.S. Securities and Exchange Commission on September 8, 2022
UNITED STATES
SECURITIES AND EXCHANGE COMMISSION
Washington, D.C. 20549
FORM N-CSR
CERTIFIED SHAREHOLDER REPORT OF REGISTERED
MANAGEMENT INVESTMENT COMPANIES
Investment Company Act file number 811-22668
ETF Series Solutions
(Exact name of registrant as specified in charter)
615 East Michigan Street
Milwaukee, WI 53202
(Address of principal executive offices) (Zip code)
Kristina R. Nelson
ETF Series Solutions
615 East Michigan Street
Milwaukee, WI 53202
(Name and address of agent for service)
(414) 765-6076
Registrant's telephone number, including area code
Date of fiscal year end: May 31
Date of reporting period: May 31, 2022
Item 1. Reports to Stockholders.
| (a) |

Annual Report
May 31, 2022
ClearShares OCIO ETF
Ticker: OCIO
ClearShares Ultra-Short Maturity ETF
Ticker: OPER
ClearShares Piton Intermediate Fixed Income ETF
Ticker: PIFI
ClearShares ETFs
TABLE OF CONTENTS
Page | |
Letter to Shareholders | 1 |
Performance Summaries | 4 |
Portfolio Allocations | 10 |
Schedules of Investments | 11 |
Statements of Assets and Liabilities | 21 |
Statements of Operations | 22 |
Statements of Changes in Net Assets | 23 |
Financial Highlights | 26 |
Notes to Financial Statements | 30 |
Report of Independent Registered Public Accounting Firm | 45 |
Trustees and Officers | 47 |
Expense Example | 49 |
Review of Liquidity Risk Management Program | 51 |
Approval of Advisory Agreement & Board Considerations | 52 |
Approval of Sub-Advisory Agreement & Board Considerations | 56 |
Federal Tax Information | 59 |
Information About Portfolio Holdings | 61 |
Information About Proxy Voting | 61 |
Frequency Distribution of Premiums and Discounts | 61 |
ClearShares ETFs
July 12, 2022
Dear Shareholder,
The ClearShares team is pleased to provide you with the annual report for the ClearShares OCIO ETF (“OCIO”), the ClearShares Ultra-Short Maturity ETF (“OPER”) and the ClearShares Piton Intermediate Fixed Income ETF (“PIFI”). OCIO launched on June 26, 2017, OPER launched on July 10, 2018 and PIFI launched on October 1, 2020. This report reflects the Funds’ performance for the period of June 1, 2021 through May 31, 2022 (the “current fiscal period”).
OCIO’s performance for the current fiscal period was -4.66% measured in the market price of the Fund and -4.65% measured in the net asset value (NAV). By comparison, OCIO’s benchmark, the S&P Target Risk Growth Index, returned -6.76% for the current fiscal period.
OPER’s performance for the current fiscal period was +0.38% measured in the market price of the Fund and +0.39% measured in NAV. By comparison, OPER’s benchmark, the ICE BofA Merrill Lynch 0-3 Month U.S. Treasury Bill Index, returned +0.14% for the current fiscal period.
PIFI’s performance for the current fiscal period was -5.06% measured in the market price of the Fund and -5.05% measured in NAV. By comparison, PIFI’s benchmark, the Bloomberg Barclays U.S. Intermediate Government/Credit Bond Index returned -6.16% for the current fiscal period.
OCIO generated a negative performance over the current fiscal period as global markets declined due to concerns of a global recession and quantitative tightening. OCIO outperformed its benchmark due to a more conservative risk posture during the second half of 2021. Using our models, we moved the bulk of the fixed income exposure to short-dated bonds which reduced our duration and the drawdown from the bond side of the portfolio. We also shifted much of the U.S. equity exposure to a value factor tilt which has held up better than the broad U.S. equity markets. Finally, we drew down our international exposure in both developed and emerging markets to their base levels as they began underperforming U.S. equity markets late last year.
OPER experienced strong relative performance against fixed income ETFs during the current fiscal period, especially in the final quarter. As the U.S. Federal Reserve Board (the Fed) began the journey in March to a higher rate environment in the hopes of choking inflation, the successive, rapid rate increases put significant pressure on the fixed income markets. In addition to strong performance, OPER experienced virtually no share price volatility during the period. While there could be a bumpy road ahead for fixed income, we believe OPER may be a beneficiary of a continued rising rate environment.
PIFI generated significant relative outperformance versus the Bloomberg Barclays U.S. Intermediate Government/Credit Bond Index over the current fiscal period. Fixed income markets incurred a historically negative period as the Federal Open Market
1
ClearShares ETFs
Committee (“FOMC”) pivoted away from a very accommodative monetary policy. In addition, both fiscal and monetary forces pushed inflation to its highest level in over four decades. Despite the sharp shift higher in the U.S. yield curve, PIFI was able to maintain a defensive interest rate risk posture, along with high credit quality. These factors allowed the portfolio to perform relatively well as the bond market repriced. In 2022, high inflation persists, and the Fed remains “hawkish” on short-term rates. Bond yields are currently grappling with a more restrictive policy and the potential for a recessionary environment to begin. PIFI will strategically take advantage of higher yields to increase the income and total return for future periods.
The ClearShares team looks forward to serving your investment needs and we thank you for your continued trust.
Sincerely,
Thomas E. Deegan
Chief Executive Officer
The opinions expressed are those of the Portfolio Manager and are subject to change, are not guaranteed and should not be considered recommendations to buy or sell any security.
Must be preceded or accompanied by a prospectus.
The market price is the Mid-Point between the Bid and Ask price as of the close of exchange. Since the Funds’ shares typically do not trade in the secondary market until several days after the Funds’ inception, for the period from inception to the first day of secondary market trading in shares, the beginning NAV of the Fund is used to calculate market returns.
Past performance is not indicative of future results.
Investing involves risk, including the possible loss of principal. Shares of an ETF are bought and sold at market price (not NAV) and may trade at a discount or premium to NAV. Shares are not individually redeemable from the Funds and may only be acquired or redeemed from the Funds in creation units. Brokerage commissions will reduce returns. Additional risks include, but are not limited to, investments in debt securities including high yield and mortgage and asset backed securities, foreign and emerging markets securities, REITs, MLPs, small-and mid-cap securities, and investment in other ETFs. The Funds invest in other investment companies and bear the proportionate share of fees and expenses of other investment companies. Please refer to the prospectus for additional risks of investing in the Funds.
OCIO’s benchmark of S&P Target Risk Growth Index is designed to measure the performance of equity allocations, while seeking to provide limited fixed income exposure to diversify risk. The benchmark is rebalanced monthly.
S&P 500® Index: An unmanaged, market capitalization-weighted index of 500 stocks of leading large-cap U.S. companies in leading industries; gives a broad look at the U.S. equities market and those companies’ stock price performance. It is not possible to invest directly in an index.
OPER’s benchmark of ICE BofA Merrill Lynch 0-3 Month U.S. Treasury Bill Index tracks the performance of the U.S. dollar denominated U.S. Treasury Bills publicly issued in the U.S. domestic market with a remaining term to final maturity of less than 3 months.
PIFI’s benchmark of Bloomberg Barclays U.S. Intermediate Government/Credit Bond Index is a broad-based flagship benchmark that measures the non-securitized component of the U.S. Aggregate Index with less than 10 years to maturity.
2
ClearShares ETFs
Federal Open Market Committee: a branch of the Federal Reserve System that determines the direction of monetary policy.
The definition of duration in reference to Fixed Income is the measure of the sensitivity of the price of a security to a change in interest rates. Duration is expressed as a number of years.
ClearShares LLC is the investment adviser to ClearShares OCIO ETF, ClearShares Ultra-Short Maturity ETF and ClearShares Piton Intermediate Fixed Income ETF.
The ClearShares OCIO ETF, ClearShares Ultra-Short Maturity ETF and ClearShares Piton Intermediate Fixed Income ETF are distributed by Quasar Distributors, LLC.
3
ClearShares OCIO ETF
Performance Summary
(Unaudited)

This chart illustrates the performance of a hypothetical $10,000 investment made on June 26, 2017, and is not intended to imply any future performance. The returns shown do not reflect the deduction of taxes that a shareholder would pay on Fund distributions or the redemption of Fund shares. The chart assumes reinvestment of capital gains and dividends. It is not possible to invest directly in an index.
Average Annual Returns | One Year | Since | |
ClearShares OCIO ETF - NAV | -4.65% | 6.02% | |
ClearShares OCIO ETF - Market | -4.66% | 6.04% | |
S&P Target Risk Growth Index | -6.76% | 6.04% |
The Performance data quoted is historical. Past performance is no guarantee of future results. Current performance may be higher or lower than the performance data quoted. The principal value and investment return of an investment will fluctuate so that your shares, when redeemed, may be worth more or less than their original cost. The returns shown do not reflect the deduction of taxes that a shareholder would pay on Fund distributions or on the redemptions of Fund shares. The total operating
4
ClearShares OCIO ETF
PERFORMANCE SUMMARY
(Unaudited) (Continued)
expenses as stated in the fee table to the Fund’s prospectus dated September 30, 2021, as supplemented October 1, 2021, is 0.62%. The Adviser has contractually agreed to waive certain amounts of the Fund’s management fee when the Fund invests in the ClearShares Ultra-Short Maturity ETF, for which the Adviser also serves as investment advisor. With respect to assets of the Fund invested in the ClearShares Ultra-Short Maturity ETF, the Adviser will waive the Fund’s management fee in an amount equal to the management fee of the ClearShares Ultra-Short Maturity ETF, at least through September 30, 2022. This arrangement may only be changed or eliminated by the Fund’s Board of Trustees upon 60 days written notice to the Adviser. The total annual operating expenses less fee waiver as stated in the fee table to the Fund’s prospectus dated September 30, 2021, as supplemented October 1, 2021, is 0.61%. For performance information current to the most recent month-end, please call 1-800-617-0004.
(a) | Inception date is June 26, 2017. |
5
ClearShares Ultra-Short Maturity ETF
Performance Summary
(Unaudited)

This chart illustrates the performance of a hypothetical $10,000 investment made on July 10, 2018, and is not intended to imply any future performance. The returns shown do not reflect the deduction of taxes that a shareholder would pay on Fund distributions or the redemption of Fund shares. The chart assumes reinvestment of capital gains and dividends. It is not possible to invest directly in an index.
Average Annual Returns | One Year | Since | |
ClearShares Ultra-Short Maturity ETF - NAV | 0.39% | 1.09% | |
ClearShares Ultra-Short Maturity ETF - Market | 0.38% | 1.09% | |
ICE BofA Merrill Lynch 0-3 Month U.S. Treasury Bill Index (b) | 0.14% | 1.06% |
The Performance data quoted is historical. Past performance is no guarantee of future results. Current performance may be higher or lower than the performance data quoted. The principal value and investment return of an investment will fluctuate so that your shares, when redeemed, may be worth more or less than their original cost. The returns shown do not reflect the deduction of taxes that a
6
ClearShares Ultra-Short Maturity ETF
PERFORMANCE SUMMARY
(Unaudited) (Continued)
shareholder would pay on Fund distributions or on the redemptions of Fund shares. The total operating expenses as stated in the fee table to the Fund’s prospectus dated September 30, 2021, as supplemented October 1, 2021, is 0.20%. For performance information current to the most recent month-end, please call 1-800-617-0004.
(a) | Inception date is July 10, 2018. |
(b) | ICE BofA Merrill Lynch 0-3 Month U.S. Treasury Bill Index tracks the performance of the U.S. dollar denominated U.S. Treasury Bills publicly issued in the U.S. domestic market with a remaining term to final maturity of less than 3 months. |
7
ClearShares Piton Intermediate Fixed Income ETF
Performance Summary
(Unaudited)
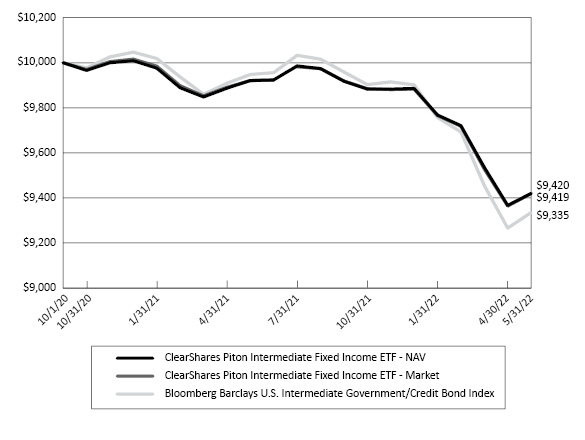
This chart illustrates the performance of a hypothetical $10,000 investment made on October 1, 2020, and is not intended to imply any future performance. The returns shown do not reflect the deduction of taxes that a shareholder would pay on Fund distributions or the redemption of Fund shares. The chart assumes reinvestment of capital gains and dividends. It is not possible to invest directly in an index.
Average Annual Returns | One Year | Since | |
ClearShares Piton Intermediate Fixed Income ETF - NAV | -5.05% | -3.53% | |
ClearShares Piton Intermediate Fixed Income ETF - Market | -5.06% | -3.53% | |
Bloomberg Barclays U.S. Intermediate Government/Credit Bond Index | -6.16% | -4.05% |
The Performance data quoted is historical. Past performance is no guarantee of future results. Current performance may be higher or lower than the performance data quoted. The principal value and investment return of an investment will fluctuate so that your shares, when redeemed, may be worth more or less than their original cost. The returns shown do not reflect the deduction of taxes that a shareholder would
8
ClearShares Piton Intermediate Fixed Income ETF
PERFORMANCE SUMMARY
(Unaudited) (Continued)
pay on Fund distributions or on the redemptions of Fund shares. The total operating expenses as stated in the fee table to the Fund’s prospectus dated September 30, 2021, supplemented October 1, 2021, is 0.46%. The Adviser has contractually agreed to waive certain amounts of the Fund’s management fee when the Fund invests in the ClearShares Ultra-Short Maturity ETF, for which the Adviser also serves as investment advisor. With respect to assets of the Fund invested in the ClearShares Ultra-Short Maturity ETF, the Adviser will waive the Fund’s management fee in an amount equal to the management fee of the ClearShares Ultra-Short Maturity ETF, at least through September 30, 2022. This arrangement can only be changed or eliminated by the Fund’s Board of Trustees upon 60 days written notice to the Adviser. The total annual operating expenses less fee waiver as stated in the fee table to the Fund’s prospectus dated September 30, 2021, as supplemented October 1, 2021, is 0.45%. For performance information current to the most recent month-end, please call 1-800-617-0004.
(a) | Inception date is October 1, 2020. |
9
ClearShares ETFs
Portfolio Allocations
As of May 31, 2022 (Unaudited)
ClearShares OCIO ETF | |
Security Type | Percentage of |
Exchange-Traded Funds - Domestic Equity | 44.7% |
Exchange-Traded Funds - Fixed Income | 44.4 |
Exchange-Traded Funds - Global Equity | 9.9 |
Short-Term Investments | 0.8 |
Investments Purchased with Proceeds from Securities Lending | 19.0 |
Liabilities in Excess of Other Assets | (18.8) |
Total | 100.0% |
ClearShares Ultra-Short Maturity ETF | |
Security Type | Percentage of |
Repurchase Agreements | 100.0% |
Short-Term Investments | 0.0(a) |
Other Assets in Excess of Liabilities | 0.0(a) |
Total | 100.0% |
(a) | Less than 0.05%. |
ClearShares Piton Intermediate Fixed Income ETF | |
Security Type | Percentage of |
Corporate Bonds | 46.9% |
U.S. Government Notes/Bonds | 28.8 |
U.S. Government Agency Issues | 18.4 |
Short-Term Investments | 2.8 |
Municipal Bonds | 2.4 |
Other Assets in Excess of Liabilities | 0.4 |
Certificates of Deposit | 0.2 |
Foreign Government Notes/Bonds | 0.1 |
Total | 100.0% |
10
ClearShares OCIO ETF
Schedule of Investments
May 31, 2022
Shares | Security Description | Value | ||||||
EXCHANGE-TRADED FUNDS — 99.0% (a) | ||||||||
Domestic Equity — 44.7% | ||||||||
| 51,678 | iShares Cohen & Steers REIT ETF (b) | $ | 3,367,338 | |||||
| 10,628 | iShares Core S&P 500 ETF | 4,409,238 | ||||||
| 5,026 | iShares Core S&P Mid-Cap ETF (b) | 1,262,431 | ||||||
| 12,578 | iShares Core S&P Small-Cap ETF | 1,273,900 | ||||||
| 76,882 | iShares MSCI USA Min Vol Factor ETF (b) | 5,647,752 | ||||||
| 78,903 | Schwab 1000 Index ETF | 3,152,175 | ||||||
| 76,111 | Schwab U.S. Dividend Equity ETF | 5,981,564 | ||||||
| 99,130 | SPDR Portfolio S&P 1500 Composite Stock Market ETF | 5,049,682 | ||||||
| 46,887 | SPDR Portfolio S&P 500 Value ETF | 1,891,890 | ||||||
| 3,172 | SPDR S&P 500 ETF Trust (b) | 1,309,814 | ||||||
| 12,295 | Vanguard Growth ETF (b) | 2,997,890 | ||||||
| 45,983 | Vanguard High Dividend Yield ETF (b) | 5,118,368 | ||||||
| 10,898 | Vanguard S&P 500 ETF | 4,137,753 | ||||||
| 22,654 | Vanguard Total Stock Market ETF | 4,674,879 | ||||||
| 43,265 | Vanguard Value ETF | 6,234,054 | ||||||
| 56,508,728 | ||||||||
Fixed Income — 44.4% | ||||||||
| 62,540 | ClearShares Ultra-Short Maturity ETF (b)(d) | 6,259,941 | ||||||
| 75,600 | iShares 1-3 Year Treasury Bond ETF | 6,301,260 | ||||||
| 1 | iShares Core Total USD Bond Market ETF | 48 | ||||||
| 33,674 | iShares Core U.S. Aggregate Bond ETF | 3,484,249 | ||||||
| 122,230 | iShares Floating Rate Bond ETF (b) | 6,156,725 | ||||||
| 26,808 | iShares Intermediate Government/Credit Bond ETF (b) | 2,864,435 | ||||||
| 56,889 | iShares Short Treasury Bond ETF (b) | 6,271,443 | ||||||
| 122,750 | JPMorgan Ultra-Short Income ETF | 6,157,140 | ||||||
| 19,000 | PIMCO Enhanced Short Maturity Active Exchange-Traded Fund | 1,893,350 | ||||||
| 2 | Schwab U.S. Aggregate Bond ETF | 97 | ||||||
| 21,480 | Schwab U.S. TIPS ETF | 1,250,136 | ||||||
| 68,571 | SPDR Bloomberg 1-3 Month T-Bill ETF (c) | 6,270,818 | ||||||
| 36,689 | Vanguard Short-Term Bond ETF (b) | 2,844,865 | ||||||
| 23,257 | Vanguard Short-Term Corporate Bond ETF | 1,800,092 | ||||||
The accompanying notes are an integral part of these financial statements.
11
ClearShares OCIO ETF
Schedule of Investments
May 31, 2022 (Continued)
Shares | Security Description | Value | ||||||
EXCHANGE-TRADED FUNDS — 99.0% (Continued) (a) | ||||||||
Fixed Income — 44.4% (Continued) | ||||||||
| 32,000 | Vanguard Short-Term Treasury ETF | $ | 1,896,000 | |||||
| 35,972 | Vanguard Total Bond Market ETF | 2,758,333 | ||||||
| 56,208,932 | ||||||||
Global Equity — 9.9% | ||||||||
| 57,406 | iShares Core MSCI EAFE ETF | 3,783,055 | ||||||
| 43,160 | iShares Core MSCI Total International Stock ETF | 2,720,375 | ||||||
| 92,134 | Vanguard FTSE Developed Markets ETF (b) | 4,193,018 | ||||||
| 42,570 | Vanguard FTSE Emerging Markets ETF | 1,857,755 | ||||||
| 12,554,203 | ||||||||
Total Exchange-Traded Funds (Cost $110,720,312) | 125,271,863 | |||||||
SHORT-TERM INVESTMENTS — 0.8% | ||||||||
| 966,840 | First American Government Obligations Fund, Class X — 0.66% (e) | 966,840 | ||||||
TOTAL SHORT-TERM INVESTMENTS (Cost $966,840) | 966,840 | |||||||
Units | ||||||||
INVESTMENTS PURCHASED WITH PROCEEDS FROM SECURITIES LENDING — 19.0% | ||||||||
| 24,074,993 | Mount Vernon Liquid Assets Portfolio, LLC, 0.92% (e)(f) | 24,074,993 | ||||||
TOTAL INVESTMENTS PURCHASED WITH PROCEEDS FROM SECURITIES LENDING (Cost $24,074,993) | 24,074,993 | |||||||
TOTAL INVESTMENTS — 118.8% (Cost $135,762,145) | 150,313,696 | |||||||
Liabilities in Excess of Other Assets — (18.8)% | (23,832,455 | ) | ||||||
NET ASSETS — 100.0% | $ | 126,481,241 | ||||||
Percentages are stated as a percent of net assets. | |
(a) | The risks of investing in investment companies, such as the underlying ETFs, typically reflect the risks of the types of investments in which the investment companies invest. See Note 11 in Notes to Financial Statements. |
(b) | All or a portion of this security is out on loan as of May 31, 2022. Total value of securities on loan is $23,409,216 or 18.5% of net assets. |
(c) | Non-income producing security. |
(d) | Affiliated exchange-traded fund. See Note 7 in Notes to Financial Statements. |
(e) | The rate shown is the annualized seven-day yield as of May 31, 2022. |
(f) | Privately offered liquidity fund. See Note 2 in Notes to Financial Statements. |
The accompanying notes are an integral part of these financial statements.
12
ClearShares Ultra-Short Maturity ETF
SCHEDULE OF INVESTMENTS
May 31, 2022
Principal | Security Description | Value | ||||||
REPURCHASE AGREEMENTS — 100.0% | ||||||||
| $ | 40,625,000 | Cantor Fitzgerald & Company, 1.00%, dated 5/25/2022, matures 6/01/2022, repurchase price $ 40,632,899 | ||||||
(collateralized by various U.S. government treasury notes and mortgage backed securities: Total Value $42,529,509) | $ | 40,625,000 | ||||||
| 30,000,000 | CF Secured, LLC, 0.92%, dated 5/12/2022, matures 6/16/2022, repurchase price $ 30,026,833 | |||||||
(collateralized by various U.S. government mortgage backed securities: Total Value $30,665,671) | 30,000,000 | |||||||
| 65,000,000 | Chimera RMBS, LLC, 1.10%, dated 5/05/2022, matures 6/06/2022, repurchase price $65,063,556 | |||||||
(collateralized by various U.S. government mortgage backed securities: Total Value $75,325,401) | 65,000,000 | |||||||
| 49,000,000 | Chimera RMBS, LLC, 1.10%, dated 5/18/2022, matures 6/21/2022, repurchase price $49,050,906 | |||||||
(collateralized by various U.S. government mortgage backed securities: Total Value $56,891,938) | 49,000,000 | |||||||
| 15,500,000 | Daiwa Securities Americas, 0.80%, dated 5/31/2022, matures 6/01/2022, repurchase price $15,500,344 | |||||||
(collateralized by various U.S. government treasury bills, notes, bonds and mortgage backed securities: Total Value $15,935,626) | 15,500,000 | |||||||
TOTAL REPURCHASE AGREEMENTS (Cost $200,125,000) | 200,125,000 | |||||||
Shares | ||||||||
SHORT-TERM INVESTMENTS — 0.0% (a) | ||||||||
| 6,930 | First American Government Obligations Fund, Class X — 0.66% (b) | 6,930 | ||||||
TOTAL SHORT-TERM INVESTMENTS (Cost $6,930) | 6,930 | |||||||
TOTAL INVESTMENTS — 100.0% (Cost $200,131,930) | 200,131,930 | |||||||
Other Assets in Excess of Liabilities — 0.0% (a) | 66,066 | |||||||
NET ASSETS — 100.0% | $ | 200,197,996 | ||||||
Percentages are stated as a percent of net assets. | |
(a) | Less than 0.05% of net assets. |
(b) | Rate shown is the annualized seven-day yield as of May 31, 2022. |
The accompanying notes are an integral part of these financial statements.
13
ClearShares Piton Intermediate Fixed Income ETF
SCHEDULE OF INVESTMENTS
May 31, 2022
Par Value | Security Description | Value | ||||||
CERTIFICATES OF DEPOSIT — 0.2% | ||||||||
Greenstate Credit Union | ||||||||
| $ | 250,000 | 7/29/2022, 0.300% | $ | 249,679 | ||||
TOTAL CERTIFICATES OF DEPOSIT (Cost $249,437) | 249,679 | |||||||
CORPORATE BONDS — 46.9% | ||||||||
Administrative and Support and Waste Management and Remediation Services — 2.2% | ||||||||
Mastercard, Inc. | ||||||||
| 1,500,000 | 04/01/2024, 3.375% | 1,517,065 | ||||||
Private Export Funding Corporation | ||||||||
| 685,000 | Series PP, 07/15/2028, 1.400% | 618,594 | ||||||
Waste Management, Inc. | ||||||||
| 795,000 | 09/15/2022, 2.900% | 795,330 | ||||||
| 2,930,989 | ||||||||
Educational Services — 1.1% | ||||||||
Yale University | ||||||||
| 1,560,000 | Series 2020, 04/15/2025, 0.873% | 1,472,197 | ||||||
Finance and Insurance — 19.0% | ||||||||
American Express Company | ||||||||
| 645,000 | 02/22/2024, 3.400% | 648,410 | ||||||
| 515,000 | 05/03/2029, 4.050% | 514,557 | ||||||
Bank of America Corporation | ||||||||
| 940,000 | Series GMTN, 01/11/2023, 3.300% | 946,631 | ||||||
Bank of New York Mellon Corporation | ||||||||
| 1,350,000 | Series MTN, 08/16/2023, 2.200% | 1,349,363 | ||||||
Bank of Nova Scotia | ||||||||
| 1,025,000 | Series FRN, 04/15/2024, 1.106% (a) | 1,019,783 | ||||||
Berkshire Hathaway, Inc. | ||||||||
| 1,500,000 | 03/15/2026, 3.125% | 1,499,312 | ||||||
BlackRock, Inc. | ||||||||
| 1,612,000 | 03/15/2027, 3.200% | 1,606,475 | ||||||
Capital One Financial Corporation | ||||||||
| 1,500,000 | 01/29/2024, 3.900% | 1,516,012 | ||||||
Citigroup, Inc. | ||||||||
| 1,500,000 | 03/09/2026, 4.600% | 1,522,945 | ||||||
CORPORATE BONDS — 46.9% (Continued) | ||||||||
The accompanying notes are an integral part of these financial statements.
14
ClearShares Piton Intermediate Fixed Income ETF
SCHEDULE OF INVESTMENTS
May 31, 2022 (Continued)
Par Value | Security Description | Value | ||||||
Finance and Insurance — 19.0% (Continued) | ||||||||
Goldman Sachs Group, Inc. | ||||||||
| $ | 1,650,000 | 03/08/2024, 0.673% (b) | $ | 1,617,230 | ||||
Intercontinental Exchange, Inc. | ||||||||
| 1,500,000 | 10/15/2023, 4.000% | 1,519,533 | ||||||
John Deere Capital Corporation | ||||||||
| 900,000 | Series MTN, 07/10/2023, 0.728% (a) | 896,737 | ||||||
JPMorgan Chase & Company | ||||||||
| 1,500,000 | 02/16/2025, 0.563% (b) | 1,430,412 | ||||||
MetLife, Inc. | ||||||||
| 1,400,000 | 04/10/2024, 3.600% | 1,417,714 | ||||||
Morgan Stanley | ||||||||
| 1,500,000 | Series MTN, 11/10/2023, 0.560% (b) | 1,484,481 | ||||||
Royal Bank of Canada | ||||||||
| 1,000,000 | Series GMTN, 10/05/2023, 3.700% | 1,014,024 | ||||||
State Street Corporation | ||||||||
| 1,500,000 | 08/18/2025, 3.550% | 1,516,911 | ||||||
Toyota Motor Credit Corporation | ||||||||
| 750,000 | Series MTN, 10/14/2022, 0.350% | 745,329 | ||||||
UnitedHealth Group, Inc. | ||||||||
| 1,600,000 | 05/15/2030, 2.000% | 1,411,217 | ||||||
US Bancorp | ||||||||
| 1,910,000 | Series MTN, 01/27/2028, 2.215% (b) | 1,784,406 | ||||||
| 25,461,482 | ||||||||
Information — 2.3% | ||||||||
Microsoft Corporation | ||||||||
| 800,000 | 02/06/2024, 2.875% | 804,275 | ||||||
Oracle Corporation | ||||||||
| 850,000 | 10/15/2022, 2.500% | 849,553 | ||||||
Verizon Communications, Inc. | ||||||||
| 1,500,000 | 03/22/2030, 3.150% | 1,402,530 | ||||||
| 3,056,358 | ||||||||
The accompanying notes are an integral part of these financial statements.
15
ClearShares Piton Intermediate Fixed Income ETF
SCHEDULE OF INVESTMENTS
May 31, 2022 (Continued)
Par Value | Security Description | Value | ||||||
CORPORATE BONDS — 46.9% (Continued) | ||||||||
Manufacturing — 14.5% | ||||||||
Alphabet, Inc. | ||||||||
| $ | 1,500,000 | 08/15/2026, 1.998% | $ | 1,442,060 | ||||
Anheuser-Busch Companies, LLC / Anheuser-Busch InBev Worldwide, Inc. | ||||||||
| 1,550,000 | 02/01/2026, 3.650% | 1,554,030 | ||||||
Apple, Inc. | ||||||||
| 800,000 | 05/03/2023, 2.400% | 801,026 | ||||||
Bristol-Myers Squibb Company | ||||||||
| 1,500,000 | 02/27/2027, 3.250% | 1,497,085 | ||||||
Exxon Mobil Corporation | ||||||||
| 1,500,000 | 03/19/2025, 2.992% | 1,500,512 | ||||||
General Dynamics Corporation | ||||||||
| 1,550,000 | 06/01/2026, 1.150% | 1,421,294 | ||||||
Hershey Company | ||||||||
| 1,500,000 | 11/15/2024, 2.050% | 1,477,012 | ||||||
Honeywell International, Inc. | ||||||||
| 1,500,000 | 09/01/2031, 1.750% | 1,279,428 | ||||||
Intel Corporation | ||||||||
| 1,500,000 | 07/29/2025, 3.700% | 1,524,776 | ||||||
J.M. Smucker Company | ||||||||
| 1,500,000 | 03/15/2025, 3.500% | 1,499,932 | ||||||
McCormick & Company, Inc. | ||||||||
| 1,000,000 | 08/15/2022, 2.700% | 1,001,078 | ||||||
NIKE, Inc. | ||||||||
| 1,500,000 | 03/27/2027, 2.750% | 1,471,463 | ||||||
PepsiCo, Inc. | ||||||||
| 500,000 | 03/01/2024, 3.600% | 506,992 | ||||||
Pfizer, Inc. | ||||||||
| 1,085,000 | 06/03/2026, 2.750% | 1,067,987 | ||||||
Procter & Gamble Company | ||||||||
| 1,500,000 | 10/29/2025, 0.550% | 1,388,584 | ||||||
| 19,433,259 | ||||||||
The accompanying notes are an integral part of these financial statements.
16
ClearShares Piton Intermediate Fixed Income ETF
SCHEDULE OF INVESTMENTS
May 31, 2022 (Continued)
Par Value | Security Description | Value | ||||||
CORPORATE BONDS — 46.9% (Continued) | ||||||||
Mining, Quarrying, and Oil and Gas Extraction — 0.5% | ||||||||
Shell International Finance BV | ||||||||
| $ | 700,000 | 11/07/2029, 2.375% | $ | 636,960 | ||||
Professional, Scientific, and Technical Services — 0.4% | ||||||||
VMware, Inc. | ||||||||
| 500,000 | 08/15/2024, 1.000% | 473,100 | ||||||
Retail Trade — 4.6% | ||||||||
Amazon.com, Inc. | ||||||||
| 1,040,000 | 04/13/2032, 3.600% | 1,033,513 | ||||||
Chevron Corporation | ||||||||
| 400,000 | 05/11/2023, 1.141% | 395,484 | ||||||
Costco Wholesale Corporation | ||||||||
| 1,754,000 | 06/20/2027, 1.375% | 1,602,510 | ||||||
Home Depot, Inc. | ||||||||
| 300,000 | 04/15/2027, 2.875% | 294,638 | ||||||
Target Corporation | ||||||||
| 1,400,000 | 04/15/2029, 3.375% | 1,374,091 | ||||||
Walgreens Boots Alliance, Inc. | ||||||||
| 1,500,000 | 11/17/2023, 0.950% | 1,457,465 | ||||||
| 6,157,701 | ||||||||
Transportation and Warehousing — 1.1% | ||||||||
United Parcel Service, Inc. | ||||||||
| 1,500,000 | 11/15/2024, 2.800% | 1,498,320 | ||||||
Wholesale Trade — 1.2% | ||||||||
Sysco Corporation | ||||||||
| 1,500,000 | 04/01/2030, 5.950% | 1,648,593 | ||||||
TOTAL CORPORATE BONDS (Cost $66,126,760) | 62,768,959 | |||||||
FOREIGN GOVERNMENT NOTES/BONDS — 0.1% | ||||||||
Israel Government AID Bond | ||||||||
| 120,000 | 04/26/2024, 5.500% | 126,128 | ||||||
TOTAL FOREIGN GOVERNMENT NOTES/BONDS (Cost $131,788) | 126,128 | |||||||
The accompanying notes are an integral part of these financial statements.
17
ClearShares Piton Intermediate Fixed Income ETF
SCHEDULE OF INVESTMENTS
May 31, 2022 (Continued)
Par Value | Security Description | Value | ||||||
MUNICIPAL BONDS — 2.4% | ||||||||
City of Austin Texas Electric Utility Revenue - Class A | ||||||||
| $ | 325,000 | 11/15/2025, 2.677% | $ | 318,138 | ||||
City of Pasadena, California | ||||||||
| 245,000 | 05/01/2030, 4.050% | 252,706 | ||||||
Massachusetts School Building Authority | ||||||||
| 1,530,000 | 08/15/2030, 1.753% | 1,337,446 | ||||||
Salt Lake City Redevelopment Agency | ||||||||
| 1,200,000 | 04/01/2026, 5.111% | 1,242,558 | ||||||
TOTAL MUNICIPAL BONDS (Cost $3,337,564) | 3,150,848 | |||||||
U.S. GOVERNMENT AGENCY ISSUES — 18.4% | ||||||||
Federal Farm Credit Banks Funding Corporation | ||||||||
| 1,000,000 | 12/01/2023, 0.500% | 972,084 | ||||||
| 250,000 | 11/18/2024, 0.875% | 239,322 | ||||||
| 150,000 | 02/10/2025, 0.320% | 140,293 | ||||||
| 1,820,000 | 09/28/2026, 0.940% | 1,665,066 | ||||||
Federal Home Loan Banks | ||||||||
| 750,000 | 10/21/2022, 0.125% | 746,380 | ||||||
| 1,175,000 | 11/15/2024, 1.100% | 1,129,686 | ||||||
| 1,500,000 | 01/13/2025, 1.100% | 1,437,795 | ||||||
| 1,696,500 | 03/23/2026, 1.000% | 1,574,200 | ||||||
| 300,000 | 02/26/2027, 0.900% | 271,915 | ||||||
| 5,000,000 | 11/16/2028, 3.250% | 5,085,273 | ||||||
Federal Home Loan Mortgage Corporation | ||||||||
| 500,000 | 04/20/2023, 0.375% | 492,741 | ||||||
| 500,000 | 05/15/2024, 0.360% | 479,765 | ||||||
| 750,000 | 10/28/2024, 0.410% | 710,024 | ||||||
| 1,000,000 | Series USD, 07/21/2025, 0.375% | 928,932 | ||||||
Federal National Mortgage Association | ||||||||
| 2,750,000 | 04/22/2025, 0.625% | 2,588,104 | ||||||
| 3,000,000 | 10/08/2027, 0.750% | 2,682,466 | ||||||
| 3,050,000 | 08/05/2030, 0.875% | 2,554,663 | ||||||
The accompanying notes are an integral part of these financial statements.
18
ClearShares Piton Intermediate Fixed Income ETF
SCHEDULE OF INVESTMENTS
May 31, 2022 (Continued)
Par Value | Security Description | Value | ||||||
U.S. GOVERNMENT AGENCY ISSUES — 18.4% (Continued) | ||||||||
Tennessee Valley Authority | ||||||||
| $ | 565,000 | Series A, 02/01/2027, 2.875% | $ | 564,252 | ||||
| 500,000 | 09/15/2031, 1.500% | 429,076 | ||||||
TOTAL U.S. GOVERNMENT AGENCY ISSUES (Cost $25,969,724) | 24,692,037 | |||||||
U.S. GOVERNMENT NOTES/BONDS — 28.8% | ||||||||
U.S. Treasury Bonds — 2.5% | ||||||||
United States Treasury Inflation Indexed Bonds | ||||||||
| 1,682,025 | 07/15/2030, 0.125% | 1,682,744 | ||||||
| 1,609,035 | 07/15/2031, 0.125% | 1,606,741 | ||||||
| 3,289,485 | ||||||||
U.S. Treasury Notes — 26.3% | ||||||||
United States Treasury Notes | ||||||||
| 1,000,000 | 06/30/2023, 0.125% | 978,255 | ||||||
| 2,000,000 | 10/15/2023, 0.125% | 1,942,149 | ||||||
| 1,000,000 | 10/31/2023, 0.375% | 973,516 | ||||||
| 1,000,000 | 08/15/2024, 0.375% | 953,047 | ||||||
| 1,300,000 | 11/15/2024, 0.750% | 1,241,500 | ||||||
| 3,000,000 | 12/15/2024, 1.000% | 2,878,594 | ||||||
| 2,275,000 | 04/15/2025, 2.625% | 2,269,490 | ||||||
| 1,000,000 | 09/30/2025, 0.250% | �� | 920,234 | |||||
| 500,000 | 09/30/2026, 0.875% | 460,420 | ||||||
| 2,500,000 | 11/30/2026, 1.250% | 2,334,912 | ||||||
| 3,000,000 | 12/31/2026, 1.250% | 2,797,676 | ||||||
| 600,000 | 03/31/2027, 0.625% | 540,691 | ||||||
| 4,000,000 | 04/30/2027, 2.750% | 3,987,031 | ||||||
| 2,000,000 | 03/31/2028, 1.250% | 1,826,016 | ||||||
| 1,000,000 | 06/30/2028, 1.250% | 909,258 | ||||||
| 2,000,000 | 08/31/2028, 1.125% | 1,799,766 | ||||||
| 2,750,000 | 02/28/2029, 1.875% | 2,585,430 | ||||||
| 500,000 | 08/15/2030, 0.625% | 419,453 | ||||||
| 3,000,000 | 11/15/2031, 1.375% | 2,635,781 | ||||||
| 3,000,000 | 02/15/2032, 1.875% | 2,753,906 | ||||||
| 35,207,125 | ||||||||
TOTAL U.S. GOVERNMENT NOTES/BONDS (Cost $40,584,883) | 38,496,610 | |||||||
The accompanying notes are an integral part of these financial statements.
19
ClearShares Piton Intermediate Fixed Income ETF
SCHEDULE OF INVESTMENTS
May 31, 2022 (Continued)
Shares | Security Description | Value | ||||||
SHORT-TERM INVESTMENTS — 2.8% | ||||||||
| 3,709,265 | First American Government Obligations Fund, Class X - 0.66% (c) | $ | 3,709,265 | |||||
TOTAL SHORT-TERM INVESTMENTS (Cost $3,709,265) | 3,709,265 | |||||||
TOTAL INVESTMENTS — 99.6% (Cost $140,109,421) | 133,193,526 | |||||||
Other Assets in Excess of Liabilities — 0.4% | 474,391 | |||||||
NET ASSETS — 100.0% | $ | 133,667,917 | ||||||
Percentages are stated as a percent of net assets. | |
(a) | Floating rate security based on a reference index and spread. Rate disclosed is the rate in effect as of May 31, 2022. |
(b) | Fixed to variable rate security based on a reference index and spread. Security is currently in the fixed phase. Rate disclosed is the rate in effect as of May 31, 2022. |
(c) | Rate shown is the annualized seven-day yield as of May 31, 2022. |
The accompanying notes are an integral part of these financial statements.
20
ClearShares ETFs
Statements of Assets and Liabilities
May 31, 2022
ClearShares | ClearShares | ClearShares | ||||||||||
ASSETS | ||||||||||||
Investments in unaffiliated securities, at value*+ | $ | 144,053,755 | $ | 200,131,930 | $ | 133,193,526 | ||||||
Investments in affiliated securities, at value* | 6,259,941 | — | — | |||||||||
Interest receivable | 483 | 98,376 | 525,032 | |||||||||
Receivable for securities sold | 10,139,961 | — | — | |||||||||
Securities lending income receivable | 7,650 | — | — | |||||||||
Total assets | 160,461,790 | 200,230,306 | 133,718,558 | |||||||||
LIABILITIES | ||||||||||||
Payable for securities purchased | 9,848,459 | — | — | |||||||||
Collateral received for securities loaned (See Note 4) | 24,074,993 | — | — | |||||||||
Management fees payable, net of waiver | 57,097 | 32,310 | 50,641 | |||||||||
Total liabilities | 33,980,549 | 32,310 | 50,641 | |||||||||
NET ASSETS | $ | 126,481,241 | $ | 200,197,996 | $ | 133,667,917 | ||||||
Net Assets Consist of: | ||||||||||||
Paid-in capital | $ | 109,841,543 | $ | 200,164,290 | $ | 140,847,997 | ||||||
Total distributable earnings (accumulated deficit) | 16,639,698 | 33,706 | (7,180,080 | ) | ||||||||
Net assets | $ | 126,481,241 | $ | 200,197,996 | $ | 133,667,917 | ||||||
Net Asset Value: | ||||||||||||
Net assets | $ | 126,481,241 | $ | 200,197,996 | $ | 133,667,917 | ||||||
Shares outstanding ^ | 4,250,000 | 2,000,000 | 1,425,000 | |||||||||
Net asset value, offering and redemption price per share | $ | 29.76 | $ | 100.10 | $ | 93.80 | ||||||
* Identified Cost: | ||||||||||||
Investments in unaffiliated securities | $ | 129,502,097 | $ | 200,131,930 | $ | 140,109,421 | ||||||
Investments in affiliated securities | 6,260,048 | — | — | |||||||||
+ Includes loaned securities with a value of | $ | 23,409,216 | $ | — | $ | — | ||||||
^ | No par value, unlimited number of shares authorized. |
The accompanying notes are an integral part of these financial statements.
21
ClearShares ETFs
Statements of Operations
For the Year Ended May 31, 2022
ClearShares | ClearShares | ClearShares | ||||||||||
INCOME | ||||||||||||
Dividends from unaffiliated investments | $ | 2,442,293 | $ | — | $ | — | ||||||
Dividends from affiliated investments | 13,728 | — | 5,885 | |||||||||
Securities lending income, net (See Note 4) | 172,543 | — | — | |||||||||
Interest | 865 | 1,092,195 | 968,005 | |||||||||
Total investment income | 2,629,429 | 1,092,195 | 973,890 | |||||||||
EXPENSES | ||||||||||||
Management fees | 726,218 | 372,973 | 371,233 | |||||||||
Total expenses before waiver | 726,218 | 372,973 | 371,233 | |||||||||
Less management fees waived (See Note 3) | (7,027 | ) | — | (3,916 | ) | |||||||
Net expenses | 719,191 | 372,973 | 367,317 | |||||||||
Net investment income (loss) | 1,910,238 | 719,222 | 606,573 | |||||||||
REALIZED AND UNREALIZED GAIN (LOSS) ON INVESTMENTS | ||||||||||||
Net realized gain (loss) on: | ||||||||||||
Investments in unaffiliated securities | 2,849,720 | — | (427,136 | ) | ||||||||
Investments in affiliated securities | — | — | (1,472 | ) | ||||||||
Change in unrealized appreciation (depreciation) on: | ||||||||||||
Investments in unaffiliated securities | (10,906,671 | ) | — | (6,835,240 | ) | |||||||
Investments in affiliated securities | (845 | ) | — | — | ||||||||
Net realized and unrealized gain (loss) on investments | (8,057,796 | ) | — | (7,263,848 | ) | |||||||
Net increase (decrease) in net assets resulting from operations | $ | (6,147,558 | ) | $ | 719,222 | $ | (6,657,275 | ) | ||||
The accompanying notes are an integral part of these financial statements.
22
ClearShares OCIO ETF
Statements of Changes in Net Assets
Year Ended | Year Ended | |||||||
OPERATIONS | ||||||||
Net investment income (loss) | $ | 1,910,238 | $ | 1,671,825 | ||||
Net realized gain (loss) on investments | 2,849,720 | 2,899,317 | ||||||
Change in unrealized appreciation (depreciation) of investments | (10,907,516 | ) | 20,601,213 | |||||
Net increase (decrease) in net assets resulting from operations | (6,147,558 | ) | 25,172,355 | |||||
DISTRIBUTIONS TO SHAREHOLDERS | ||||||||
Net distributions to shareholders | (3,876,671 | ) | (2,839,146 | ) | ||||
Total distributions to shareholders | (3,876,671 | ) | (2,839,146 | ) | ||||
CAPITAL SHARE TRANSACTIONS | ||||||||
Proceeds from shares sold | 9,640,540 | — | ||||||
Net increase (decrease) in net assets derived from capital share transactions (a) | 9,640,540 | — | ||||||
Net increase (decrease) in net assets | $ | (383,689 | ) | $ | 22,333,209 | |||
NET ASSETS | ||||||||
Beginning of year | $ | 126,864,930 | $ | 104,531,721 | ||||
End of year | $ | 126,481,241 | $ | 126,864,930 | ||||
(a) | A summary of capital share transactions is as follows: |
Shares | Shares | |||||||
Shares sold | 300,000 | — | ||||||
Net increase (decrease) | 300,000 | — | ||||||
The accompanying notes are an integral part of these financial statements.
23
ClearShares Ultra-Short Maturity ETF
Statements OF CHANGES IN NET ASSETS
Year Ended | Year Ended | |||||||
OPERATIONS | ||||||||
Net investment income (loss) | $ | 719,222 | $ | 514,606 | ||||
Net increase (decrease) in net assets resulting from operations | 719,222 | 514,606 | ||||||
DISTRIBUTIONS TO SHAREHOLDERS | ||||||||
Net distributions to shareholders | (696,252 | ) | (529,631 | ) | ||||
Total distributions to shareholders | (696,252 | ) | (529,631 | ) | ||||
CAPITAL SHARE TRANSACTIONS | ||||||||
Proceeds from shares sold | 165,161,575 | 20,019,380 | ||||||
Payments for shares redeemed | (85,085,810 | ) | (15,013,730 | ) | ||||
Net increase (decrease) in net assets derived from capital share transactions (a) | 80,075,765 | 5,005,650 | ||||||
Net increase (decrease) in net assets | $ | 80,098,735 | $ | 4,990,625 | ||||
NET ASSETS | ||||||||
Beginning of year | $ | 120,099,261 | $ | 115,108,636 | ||||
End of year | $ | 200,197,996 | $ | 120,099,261 | ||||
(a) | A summary of capital share transactions is as follows: |
Shares | Shares | |||||||
Shares sold | 1,650,000 | 200,000 | ||||||
Shares redeemed | (850,000 | ) | (150,000 | ) | ||||
Net increase (decrease) | 800,000 | 50,000 | ||||||
The accompanying notes are an integral part of these financial statements.
24
ClearShares Piton Intermediate Fixed Income ETF
Statements OF CHANGES IN NET ASSETS
Year Ended | Period Ended | |||||||
OPERATIONS | ||||||||
Net investment income (loss) | $ | 606,573 | $ | 23,789 | ||||
Net realized gain (loss) on investments | (428,608 | ) | (99,130 | ) | ||||
Change in unrealized appreciation (depreciation) of investments | (6,835,240 | ) | (80,655 | ) | ||||
Net increase (decrease) in net assets resulting from operations | (6,657,275 | ) | (155,996 | ) | ||||
DISTRIBUTIONS TO SHAREHOLDERS | ||||||||
Net distributions to shareholders | (361,216 | ) | (5,593 | ) | ||||
Total distributions to shareholders | (361,216 | ) | (5,593 | ) | ||||
CAPITAL SHARE TRANSACTIONS | ||||||||
Proceeds from shares sold | 130,339,380 | 62,117,128 | ||||||
Payments for shares redeemed | (21,935,575 | ) | (29,742,430 | ) | ||||
Transaction fees (See Note 10) | 45,683 | 23,811 | ||||||
Net increase (decrease) in net assets derived from capital share transactions (b) | 108,449,488 | 32,398,509 | ||||||
Net increase (decrease) in net assets | $ | 101,430,997 | $ | 32,236,920 | ||||
NET ASSETS | ||||||||
Beginning of year/period | $ | 32,236,920 | $ | — | ||||
End of year/period | $ | 133,667,917 | $ | 32,236,920 | ||||
(a) | The Fund commenced operations on October 1, 2020. The information presented is for the period from October 1, 2020 to May 31, 2021. |
(b) | A summary of capital share transactions is as follows: |
Shares | Shares | |
Shares sold | 1,325,000 | 625,000 |
Shares redeemed | (225,000) | (300,000) |
Net increase (decrease) | 1,100,000 | 325,000 |
The accompanying notes are an integral part of these financial statements.
25
ClearShares OCIO ETF
Financial Highlights
For a capital share outstanding throughout the year/period
Year Ended May 31, | Period | |||||||||||||||||||
2022 | 2021 | 2020 | 2019 | 2018 (1) | ||||||||||||||||
Net asset value, beginning of year/period | $ | 32.12 | $ | 26.46 | $ | 25.66 | $ | 26.51 | $ | 25.00 | ||||||||||
INCOME (LOSS) FROM INVESTMENT OPERATIONS: | ||||||||||||||||||||
Net investment income (loss) (2)(3) | 0.46 | 0.42 | 0.59 | 0.49 | 0.36 | |||||||||||||||
Net realized and unrealized gain (loss) on investments (4) | (1.88 | ) | 5.96 | 1.04 | (0.82 | ) | 1.38 | |||||||||||||
Total from investment operations | (1.42 | ) | 6.38 | 1.63 | (0.33 | ) | 1.74 | |||||||||||||
DISTRIBUTIONS TO SHAREHOLDERS: | ||||||||||||||||||||
Distributions from: | ||||||||||||||||||||
Net investment income | (0.49 | ) | (0.48 | ) | (0.83 | ) | (0.31 | ) | (0.23 | ) | ||||||||||
Net realized gains | (0.45 | ) | (0.24 | ) | — | (0.21 | ) | — | ||||||||||||
Total distributions to shareholders | (0.94 | ) | (0.72 | ) | (0.83 | ) | (0.52 | ) | (0.23 | ) | ||||||||||
CAPITAL SHARE TRANSACTIONS | ||||||||||||||||||||
Capital contributions (2) | — | — | 0.00 | (5) | — | — | ||||||||||||||
Net asset value, end of year/period | $ | 29.76 | $ | 32.12 | $ | 26.46 | $ | 25.66 | $ | 26.51 | ||||||||||
Total return | -4.65 | % | 24.38 | % | 6.34 | % | -1.11 | % | 6.95 | %(6) | ||||||||||
SUPPLEMENTAL DATA: | ||||||||||||||||||||
Net assets at end of year/period (000’s) | $ | 126,481 | $ | 126,865 | $ | 104,532 | $ | 106,498 | $ | 112,678 | ||||||||||
RATIOS TO AVERAGE NET ASSETS: | ||||||||||||||||||||
Expenses to average net assets (before management fees waived) (7) | 0.55 | % | 0.55 | % | 0.55 | % | 0.57 | %(8) | 0.75 | %(9) | ||||||||||
Expenses to average net assets (after management fees waived) (7) | 0.54 | % | 0.54 | % | 0.54 | % | 0.54 | %(8) | 0.55 | %(9) | ||||||||||
The accompanying notes are an integral part of these financial statements.
26
ClearShares OCIO ETF
FINANCIAL HIGHLIGHTS
For a capital share outstanding throughout the year/period
Year Ended May 31, | Period | |||||||||||||||||||
2022 | 2021 | 2020 | 2019 | 2018 (1) | ||||||||||||||||
Net investment income (loss) to average net assets (before management fees waived) (3) | 1.44 | % | 1.43 | % | 2.17 | % | 1.86 | % | 1.27 | %(9) | ||||||||||
Net investment income (loss) to average net assets (after management fees waived) (3) | 1.45 | % | 1.44 | % | 2.18 | % | 1.89 | % | 1.47 | %(9) | ||||||||||
Portfolio turnover rate (10) | 51 | % | 24 | % | 50 | % | 28 | % | 31 | %(6) | ||||||||||
(1) | Commencement of operations on June 26, 2017. |
(2) | Calculated based on average shares outstanding during the period. |
(3) | Recognition of net investment income by the Fund is affected by the timing of the declaration of dividends by the underlying investment companies in which the Fund invests. The ratio does not include net investment income of the underlying companies in which the Fund invests. |
(4) | Net realized and unrealized gain (loss) per share in this caption are balancing amounts necessary to reconcile the change in net asset value per share for the period, and may not reconcile with the aggregate gain (loss) in the Statement of Operations due to share transactions for the period. |
(5) | Less than $0.005. |
(6) | Not annualized. |
(7) | Does not include expenses of the investment companies in which the Fund invests. |
(8) | Prior to July 16, 2018, ClearShares OCIO ETF paid the Adviser a management fee of 0.75% and contractually waived 0.20% of its management fee for the Fund, resulting in $27,866 waived for the year ended May 31, 2019. |
(9) | Annualized. |
(10) | Excludes the impact of in-kind transactions. |
The accompanying notes are an integral part of these financial statements.
27
ClearShares Ultra-Short Maturity ETF
FINANCIAL HIGHLIGHTS
For a capital share outstanding throughout the year/period
Year Ended May 31, | Period | |||||||||||||||
2022 | 2021 | 2020 | 2019 (1) | |||||||||||||
Net asset value, beginning of year/period | $ | 100.08 | $ | 100.09 | $ | 100.48 | $ | 100.00 | ||||||||
INCOME (LOSS) FROM INVESTMENT OPERATIONS: | ||||||||||||||||
Net investment income (loss) (2) | 0.39 | 0.42 | 1.25 | 1.87 | ||||||||||||
Net realized and unrealized gain (loss) on investments (3) | — | — | 0.29 | — | ||||||||||||
Total from investment operations | 0.39 | 0.42 | 1.54 | 1.87 | ||||||||||||
DISTRIBUTIONS TO SHAREHOLDERS: | ||||||||||||||||
Distributions from: | ||||||||||||||||
Net investment income | (0.37 | ) | (0.43 | ) | (1.93 | ) | (1.39 | ) | ||||||||
Total distributions to shareholders | (0.37 | ) | (0.43 | ) | (1.93 | ) | (1.39 | ) | ||||||||
Net asset value, end of year/period | $ | 100.10 | $ | 100.08 | $ | 100.09 | $ | 100.48 | ||||||||
Total return | 0.39 | % | 0.42 | % | 1.56 | % | 1.88 | %(4) | ||||||||
SUPPLEMENTAL DATA: | ||||||||||||||||
Net assets at end of year/period (000’s) | $ | 200,198 | $ | 120,099 | $ | 115,109 | $ | 30,145 | ||||||||
RATIOS TO AVERAGE NET ASSETS: | ||||||||||||||||
Expenses to average net assets | 0.20 | % | 0.20 | % | 0.20 | % | 0.28 | %(5)(6) | ||||||||
Net investment income (loss) to average net assets | 0.39 | % | 0.42 | % | 1.25 | % | 2.12 | %(5) | ||||||||
Portfolio turnover rate (7) | 0 | % | 0 | % | 0 | % | 0 | %(4) | ||||||||
(1) | Commencement of operations on July 10, 2018. |
(2) | Calculated based on average shares outstanding during the period. |
(3) | Net realized and unrealized gain (loss) per share in this caption are balancing amounts necessary to reconcile the change in net asset value per share for the period, and may not reconcile with the aggregate gain (loss) in the Statement of Operations due to share transactions for the period. |
(4) | Not annualized. |
(5) | Annualized. |
(6) | Prior to April 1, 2019, ClearShares Ultra-Short Maturity ETF paid the adviser a management fee of 0.30%. |
(7) | Excludes the impact of in-kind transactions. |
The accompanying notes are an integral part of these financial statements.
28
ClearShares Piton Intermediate Fixed Income ETF
FINANCIAL HIGHLIGHTS
For a capital share outstanding throughout the year/period
Year | Period | |||||||
Net asset value, beginning of year/period | $ | 99.19 | $ | 100.00 | ||||
INCOME (LOSS) FROM INVESTMENT OPERATIONS: | ||||||||
Net investment income (loss) (2) | 0.71 | 0.07 | ||||||
Net realized and unrealized gain (loss) on investments (3) | (5.75 | ) | (0.94 | ) | ||||
Total from investment operations | (5.04 | ) | (0.87 | ) | ||||
DISTRIBUTIONS TO SHAREHOLDERS: | ||||||||
Distributions from: | ||||||||
Net investment income | (0.40 | ) | (0.02 | ) | ||||
Total distributions to shareholders | (0.40 | ) | (0.02 | ) | ||||
CAPITAL SHARE TRANSACTIONS | ||||||||
Transaction fees (See Note 10) | 0.05 | 0.08 | ||||||
Net asset value, end of year/period | $ | 93.80 | $ | 99.19 | ||||
Total return | -5.05 | % | -0.79 | %(4) | ||||
SUPPLEMENTAL DATA: | ||||||||
Net assets at end of year/period (000’s) | $ | 133,668 | $ | 32,237 | ||||
RATIOS TO AVERAGE NET ASSETS: | ||||||||
Expenses to average net assets (before management fees waived) | 0.45 | % | 0.45 | %(5) | ||||
Expenses to average net assets (after management fees waived) | 0.45 | % | 0.44 | %(5) | ||||
Net investment income (loss) to average net assets (before management fees waived) | 0.73 | % | 0.10 | %(5) | ||||
Net investment income (loss) to average net assets (after management fees waived) | 0.73 | % | 0.11 | %(5) | ||||
Portfolio turnover rate (6) | 42 | % | 80 | %(4) | ||||
(1) | Commencement of operations on October 1, 2020. |
(2) | Calculated based on average shares outstanding during the period. |
(3) | Net realized and unrealized gain (loss) per share in this caption are balancing amounts necessary to reconcile the change in net asset value per share for the period, and may not reconcile with the aggregate gain (loss) in the Statement of Operations due to share transactions for the period. |
(4) | Not annualized. |
(5) | Annualized. |
(6) | Excludes the impact of in-kind transactions. |
The accompanying notes are an integral part of these financial statements.
29
ClearShares ETFs
Notes to Financial Statements
May 31, 2022
NOTE 1 – ORGANIZATION
ClearShares OCIO ETF, ClearShares Ultra-Short Maturity ETF and ClearShares Piton Intermediate Fixed Income ETF (individually each a “Fund” or collectively the “Funds”) are series of ETF Series Solutions (“ESS” or the “Trust”), an open-end management investment company consisting of multiple investment series, organized as a Delaware statutory trust on February 9, 2012. The Trust is registered with the Securities and Exchange Commission (“SEC”) under the Investment Company Act of 1940, as amended (the “1940 Act”), as an open-end management investment company and the offering of the Funds’ shares is registered under the Securities Act of 1933, as amended (the “Securities Act”). ClearShares OCIO ETF is a diversified “fund of funds” that seeks to outperform a traditional 60/40 mix of global equity and fixed-income investments and commenced operations on June 26, 2017. ClearShares Ultra-Short Maturity ETF is a diversified fund that seeks current income and commenced operations on July 10, 2018. ClearShares Piton Intermediate Fixed Income ETF is a non-diversified fund that seeks current income consistent with the long-term preservation of capital and commenced operations on October 1, 2020.
The end of the reporting period for the Funds is May 31, 2022. The period covered by these Notes to Financial Statements for the Funds is the fiscal year ended May 31, 2022 (the “current fiscal period”).
NOTE 2 – SIGNIFICANT ACCOUNTING POLICIES
The Funds are investment companies and accordingly follow the investment company accounting and reporting guidance of the Financial Accounting Standards Board (“FASB”) Accounting Standards Codification (“ASC”) Topic 946 Financial Services - Investment Companies.
The following is a summary of significant accounting policies consistently followed by the Funds. These policies are in conformity with accounting principles generally accepted in the United States of America (“U.S. GAAP”).
A. | Security Valuation. All equity securities, including domestic and foreign common stocks, preferred stocks, and exchange-traded funds that are traded on a national securities exchange, except those listed on the Nasdaq Global Market® Nasdaq Global Select Market® and Nasdaq Capital Market Exchange® (collectively “Nasdaq”) are valued at the last reported sale price on the exchange on which the security is principally traded. Securities traded on Nasdaq will be valued at the Nasdaq Official Closing Price (“NOCP”). If, on a particular day, an exchange-traded or Nasdaq security does not trade, then the mean between the most recent quoted bid and asked prices will be used. All equity securities that are not traded on a listed exchange are valued at |
30
ClearShares ETFs
NOTES TO FINANCIAL STATEMENTS
May 31, 2022 (Continued)
the last sale price in the over-the-counter market. If a non-exchange traded security does not trade on a particular day, then the mean between the last quoted closing bid and asked price will be used. Prices denominated in foreign currencies are converted to U.S. dollar equivalents at the current exchange rate, which approximates fair value.
Debt securities, including short-term debt instruments, are valued in accordance with prices provided by a pricing service. Pricing services may use various valuation methodologies such as the mean between the bid and asked prices, matrix pricing and other analytical pricing models as well as market transactions and dealer quotations.
Investments in mutual funds, including money market funds, are valued at their net asset value (“NAV”) per share.
Units of Mount Vernon Liquid Assets Portfolio, LLC are not traded on an exchange and are valued at the investment company’s NAV per share as provided by the underlying fund’s administrator. These shares are generally classified as Level 2 Investments.
The Funds price repurchase agreements at cost, which approximates fair value.
Securities for which quotations are not readily available are valued at their respective fair values in accordance with pricing procedures adopted by the Funds’ Board of Trustees (the “Board”). When a security is “fair valued,” consideration is given to the facts and circumstances relevant to the particular situation, including a review of various factors set forth in the pricing procedures adopted by the Board. The use of fair value pricing by a Fund may cause the NAV of its shares to differ significantly from the NAV that would be calculated without regard to such considerations.
As described above, the Funds utilize various methods to measure the fair value of their investments on a recurring basis. U.S. GAAP establishes a hierarchy that prioritizes inputs to valuations methods. The three levels of inputs are:
Level 1 – | Unadjusted quoted prices in active markets for identical assets or liabilities that the Funds have the ability to access. |
Level 2 – | Observable inputs other than quoted prices included in Level 1 that are observable for the asset or liability, either directly or indirectly. These inputs may include quoted prices for the identical instrument |
31
ClearShares ETFs
NOTES TO FINANCIAL STATEMENTS
May 31, 2022 (Continued)
on an inactive market, prices for similar instruments, interest rates, prepayment speeds, credit risk, yield curves, default rates and similar data.
Level 3 – | Unobservable inputs for the asset or liability, to the extent relevant observable inputs are not available; representing the Funds’ own assumptions about the assumptions a market participant would use in valuing the asset or liability and would be based on the best information available. |
The availability of observable inputs can vary from security to security and is affected by a wide variety of factors, including, for example, the type of security, whether the security is new and not yet established in the marketplace, the liquidity of markets, and other characteristics particular to the security. To the extent that valuation is based on models or inputs that are less observable or unobservable in the market, the determination of fair value requires more judgment. Accordingly, the degree of judgment exercised in determining fair value is greatest for instruments categorized in Level 3.
The inputs used to measure fair value may fall into different levels of the fair value hierarchy. In such cases, for disclosure purposes, the level in the fair value hierarchy within which the fair value measurement falls in its entirety, is determined based on the lowest level input that is significant to the fair value measurement in its entirety.
The following is a summary of the inputs used to value the Funds’ investments as of the end of the current fiscal period:
ClearShares OCIO ETF | ||||||||||||||||
Assets^ | Level 1 | Level 2 | Level 3 | Total | ||||||||||||
Exchange-Traded Funds | $ | 125,271,863 | $ | — | $ | — | $ | 125,271,863 | ||||||||
Short-Term Investments | 966,840 | — | — | 966,840 | ||||||||||||
Investments Purchased with Proceeds from Securities Lending | — | 24,074,993 | — | 24,074,993 | ||||||||||||
Total Investments in Securities | $ | 126,238,703 | $ | 24,074,993 | $ | — | $ | 150,313,696 | ||||||||
32
ClearShares ETFs
NOTES TO FINANCIAL STATEMENTS
May 31, 2022 (Continued)
ClearShares Ultra-Short Maturity ETF | ||||||||||||||||
Assets | Level 1 | Level 2 | Level 3 | Total | ||||||||||||
Repurchase Agreements | $ | — | $ | 200,125,000 | $ | — | $ | 200,125,000 | ||||||||
Short-Term Investments | 6,930 | — | — | 6,930 | ||||||||||||
Total Investments in Securities | $ | 6,930 | $ | 200,125,000 | $ | — | $ | 200,131,930 | ||||||||
ClearShares Piton Intermediate Fixed Income ETF | ||||||||||||||||
Assets^ | Level 1 | Level 2 | Level 3 | Total | ||||||||||||
Certificates of Deposit | $ | — | $ | 249,679 | $ | — | $ | 249,679 | ||||||||
Corporate Bonds | — | 62,768,959 | — | 62,768,959 | ||||||||||||
Foreign Government Notes/Bonds | — | 126,128 | — | 126,128 | ||||||||||||
Municipal Bonds | — | 3,150,848 | — | 3,150,848 | ||||||||||||
U.S. Government Agency Issues | — | 24,692,037 | — | 24,692,037 | ||||||||||||
U.S. Government Notes/Bonds | — | 38,496,610 | — | 38,496,610 | ||||||||||||
Short-Term Investments | 3,709,265 | — | — | 3,709,265 | ||||||||||||
Total Investments in Securities | $ | 3,709,265 | $ | 129,484,261 | $ | — | $ | 133,193,526 | ||||||||
^ | See Schedule of Investments for further disaggregation of investment categories. |
During the current fiscal period, the Funds did not recognize any transfers to or from Level 3.
B. | Federal Income Taxes. The Funds’ policy is to comply with the requirements of Subchapter M of the Internal Revenue Code of 1986, as amended, applicable to regulated investment companies and to distribute substantially all of their net investment income and net capital gains to shareholders. Therefore, no federal income tax provision is required. The Funds plan to file U.S. Federal and various state and local tax returns. |
The Funds recognize the tax benefits of uncertain tax positions only when the position is more likely than not to be sustained. Management has analyzed the Funds’ uncertain tax positions and concluded that no liability for unrecognized tax benefits should be recorded related to uncertain tax positions. Management is not aware of any tax positions for which it is reasonably possible that the total amounts of unrecognized tax benefits will
33
ClearShares ETFs
NOTES TO FINANCIAL STATEMENTS
May 31, 2022 (Continued)
change materially in the next 12 months. Income and capital gain distributions are determined in accordance with federal income tax regulations, which may differ from U.S. GAAP. The Funds recognize interest and penalties, if any, related to unrecognized tax benefits on uncertain tax positions as income tax expenses in the Statements of Operations. During the current fiscal period, the Funds did not incur any interest or penalties.
C. | Foreign Currency. Investment securities and other assets and liabilities denominated in foreign currencies are translated into U.S. dollar amounts at the date of valuation. Purchases and sales of investment securities and income and expense items denominated in foreign currencies are translated into U.S. dollar amounts on the respective dates of such transactions. The Funds do not isolate that portion of the results of operations resulting from changes in foreign exchange rates on investments and currency gains or losses realized between trade and settle dates on security transactions from the fluctuations arising from changes in market prices of securities held. Such fluctuations are included with the net realized and unrealized gain or loss from investments. The Funds report net realized foreign exchange gains or losses that arise from sales of foreign currencies, currency gains or losses realized between the trade and settlement dates on foreign currency transactions, and the difference between the amounts of dividends, interest, and foreign withholding taxes recorded on the Funds’ books and the U.S. dollar equivalent of the amounts actually received or paid. Net unrealized foreign exchange gains and losses arise from the changes in the fair values of assets and liabilities, other than investments in securities at fiscal period end, resulting from changes in exchange rates. |
D. | Security Transactions and Investment Income. Investment transactions are accounted for on the trade date. Gains and losses realized from investment transactions are determined on a specific identification basis. Dividend income is recorded on the ex-dividend date. Non-cash dividends included in dividend income or separately disclosed, if any, are recorded at the fair value of the security received. Withholding taxes on foreign dividends, if any, have been provided for in accordance with the Funds’ understanding of the applicable tax rules and regulations. Interest income is recorded on an accrual basis. Discounts and premiums on securities purchased are accreted and amortized using the effective yield method. Paydown gains and losses on mortgage-related and other asset-backed securities are recorded as interest income on the Statements of Operations. |
E. | Distributions to Shareholders. Distributions to shareholders from net investment income on securities are declared and paid by ClearShares Ultra-Short Maturity ETF on a monthly basis and by ClearShares OCIO ETF |
34
ClearShares ETFs
NOTES TO FINANCIAL STATEMENTS
May 31, 2022 (Continued)
and ClearShares Piton Intermediate Fixed Income ETF on a quarterly basis. Distributions to shareholders from net realized gains on securities are declared and paid by the Funds on an annual basis. Distributions are recorded on the ex-dividend date.
F. | Use of Estimates. The preparation of financial statements in conformity with U.S. GAAP requires management to make estimates and assumptions that affect the reported amounts of assets and liabilities and disclosure of contingent assets and liabilities at the date of the financial statements, as well as the reported amounts of revenues and expenses during the period. Actual results could differ from those estimates. |
G. | Share Valuation. The NAV per share of each Fund is calculated by dividing the sum of the value of the securities held by the Fund, plus cash and other assets, minus all liabilities (including estimated accrued expenses) by the total number of shares outstanding of each Fund, rounded to the nearest cent. The Funds’ shares will not be priced on the days on which the New York Stock Exchange (“NYSE”) is closed for trading. The offering and redemption price per share of each Fund is equal to the Fund’s NAV per share. |
H. | Guarantees and Indemnifications. In the normal course of business, the Funds enter into contracts with service providers that contain general indemnification clauses. Each Fund’s maximum exposure under these arrangements is unknown as this would involve future claims that may be against the Funds that have not yet occurred. However, based on experience, the Funds expect the risk of loss to be remote. |
I. | Reclassification of Capital Accounts. U.S. GAAP requires that certain components of net assets relating to permanent differences be reclassified between financial and tax reporting. These reclassifications have no effect on net assets or NAV per share. For the current fiscal period, there were no reclassifications made. |
During the current fiscal period, the Funds realized no net capital gains resulting from in-kind redemptions in which shareholders exchanged Fund shares for securities held by the Funds rather than for cash.
J. | Subsequent Events. In preparing these financial statements, management has evaluated events and transactions for potential recognition or disclosure through the date the financial statements were issued. There were no events or transactions that occurred during the period subsequent to the end of the current fiscal period, that materially impacted the amounts or disclosures in the Funds’ financial statements. |
35
ClearShares ETFs
NOTES TO FINANCIAL STATEMENTS
May 31, 2022 (Continued)
NOTE 3 – COMMITMENTS AND OTHER RELATED PARTY TRANSACTIONS
ClearShares LLC (the “Adviser”), serves as the investment adviser to the Funds. Pursuant to an Investment Advisory Agreement (“Advisory Agreement”) between the Trust, on behalf of the Funds, and the Adviser, the Adviser provides investment advice to the Funds and oversees the day-to-day operations of the Funds, subject to the direction and control of the Board and the officers of the Trust. Under the Advisory Agreement, the Adviser is also responsible for arranging, in consultation with each Fund’s respective sub-adviser: transfer agency, custody, fund administration and accounting, and other non-distribution related services necessary for the Funds to operate. Effective October 1, 2021, Blueprint Investment Partners, LLC serves as the sub-adviser for ClearShares OCIO ETF. Piton Investment Management, LP serves as the sub-adviser for ClearShares Ultra-Short Maturity ETF (effective October 1, 2021) and ClearShares Piton Intermediate Fixed Income ETF (each, respectively, the “Sub-Adviser”). Under the Advisory Agreement, the Adviser has agreed to pay all expenses incurred by the Funds, except for: the fee paid to the Adviser pursuant to the Advisory Agreement, interest charges on any borrowings, dividends and other expenses on securities sold short, taxes, brokerage commissions and other expenses incurred in placing orders for the purchase and sale of securities and other investment instruments, acquired fund fees and expenses, accrued deferred tax liability, extraordinary expenses, and distribution (12b-1) fees and expenses. For the services it provides to the Funds, the Funds pay the Adviser a unified management fee, which is calculated daily and paid monthly, at the annual rates of each Fund’s average daily net assets listed below.
ClearShares OCIO ETF | 0.55 | % | ||
ClearShares Ultra-Short Maturity ETF | 0.20 | % | ||
ClearShares Piton Intermediate Fixed Income ETF | 0.45 | % |
The Adviser is responsible for paying the sub-advisers. The Adviser has contractually agreed to waive the proportionate amount of the ClearShares OCIO ETF’s management fee and the ClearShares Piton Intermediate Fixed Income ETF’s management fee as applied to the net assets of each Fund invested in ClearShares Ultra-Short Maturity ETF, for which the Adviser also serves as investment adviser, at least through September 30, 2022, resulting in $7,027 waived from ClearShares OCIO ETF and $3,916 waived from ClearShares Piton Intermediate Fixed Income ETF during the current fiscal period. As a result, the Adviser receives a management fee of 0.35% from assets of ClearShares OCIO ETF invested in ClearShares Ultra-Short Maturity ETF and 0.25% from assets of ClearShares Piton Intermediate Fixed Income ETF invested in ClearShares Ultra-Short Maturity ETF. The contractual arrangement for ClearShares OCIO ETF may only be
36
ClearShares ETFs
NOTES TO FINANCIAL STATEMENTS
May 31, 2022 (Continued)
changed or eliminated by the Board upon 60 days’ written notice to the Adviser. The fee waivers during the current fiscal period are not subject to recoupment by the Adviser.
U.S. Bancorp Fund Services, LLC (“Fund Services” or “Administrator”), doing business as U.S. Bank Global Fund Services, acts as the Funds’ Administrator and, in that capacity, performs various administrative and accounting services for the Funds. The Administrator prepares various federal and state regulatory filings, reports and returns for the Funds, including regulatory compliance monitoring and financial reporting; prepares reports and materials to be supplied to the trustees; monitors the activities of the Funds’ Custodian, transfer agent and fund accountant. Fund Services also serves as the transfer agent and fund accountant to the Funds. U.S. Bank N.A. (the “Custodian”), an affiliate of the Administrator, serves as the Funds’ Custodian.
The Custodian acts as the securities lending agent (the “Securities Lending Agent”) for the ClearShares OCIO ETF.
A Trustee and all officers of the Trust are affiliated with the Administrator and Custodian.
NOTE 4 – SECURITIES LENDING
ClearShares OCIO ETF may lend up to 33⅓% of the value of the securities in its portfolio to brokers, dealers and financial institutions (but not individuals) under terms of participation in a securities lending program administered by the Securities Lending Agent. The securities lending agreement requires that loans are collateralized at all times in an amount equal to at least 102% of the value of any domestic loaned securities at the time of the loan, plus accrued interest. The use of loans of foreign securities, which are denominated and payable in U.S. dollars, shall be collateralized in an amount equal to 105% of the value of any loaned securities at the time of the loan plus accrued interest. ClearShares OCIO ETF receives compensation in the form of fees and earns interest on the cash collateral. The amount of fees depends on a number of factors including the type of security and length of the loan. ClearShares OCIO ETF continues to receive interest payments or dividends on the securities loaned during the borrowing period. Gain or loss on the value of securities loaned that may occur during the term of the loan will be for the account of ClearShares OCIO ETF. ClearShares OCIO ETF has the right under the terms of the securities lending agreement to recall the securities from the borrower on demand.
The securities lending agreement provides that, in the event of a borrower’s material default, the Securities Lending Agent shall take all actions the Securities Lending Agent deems appropriate to liquidate the collateral, purchase replacement securities at the Securities Lending Agent’s expense, or pay the Fund an amount equal
37
ClearShares ETFs
NOTES TO FINANCIAL STATEMENTS
May 31, 2022 (Continued)
to the market value of the loaned securities, subject to certain limitations which are set forth in detail in the securities lending agreement between the Fund and the Securities Lending Agent.
As of the end of the current fiscal period, ClearShares OCIO ETF had loaned securities and received cash collateral for the loans. The cash collateral is invested by the Securities Lending Agent in accordance with the Trust approved investment guidelines. Those guidelines require the cash collateral to be invested in readily marketable, high quality, short-term obligations; however, such investments are subject to risk of payment delays or default on the part of the issuer or counterparty or otherwise may not generate sufficient interest to support the costs associated with securities lending. ClearShares OCIO ETF could also experience delays in recovering its securities and possible loss of income or value if the borrower fails to return the borrowed securities, although ClearShares OCIO ETF is indemnified from this risk by contract with the Securities Lending Agent.
As of the end of the current fiscal period, the values of the securities on loan and payable for collateral due to broker for the ClearShares OCIO ETF were as follows:
Value of | Payable for |
$ 23,409,216 | $ 24,074,993 |
* | The cash collateral received was invested in Mount Vernon Liquid Assets Portfolio, LLC as shown on the Schedule of Investments, a short-term investment portfolio with an overnight and continuous maturity. The investment objective is to seek to maximize current income to the extent consistent with the preservation of capital and liquidity and maintain a stable NAV of $1.00 per unit. |
The interest income earned by ClearShares OCIO ETF on the investment of cash collateral received from borrowers for the securities loaned to it (“Securities Lending Income, Net”) is reflected in the Statement of Operations. Net securities lending income earned on collateral investments and recognized by ClearShares OCIO ETF during the current fiscal period was $172,543.
NOTE 5 – REPURCHASE AGREEMENTS
The Funds may invest in repurchase agreements to generate income from excess cash balances and to invest securities lending cash collateral. A repurchase agreement is an agreement under which the Funds acquire a financial instrument (e.g., a security issued by the U.S. government or an agency thereof, a banker’s acceptance or a certificate of deposit) from a seller, subject to resale to the seller at an agreed upon price and date. A repurchase agreement may be considered a loan collateralized by
38
ClearShares ETFs
NOTES TO FINANCIAL STATEMENTS
May 31, 2022 (Continued)
securities. The resale price reflects an agreed upon interest rate effective for the period the instrument is held by the Funds and is unrelated to the interest rate on the underlying collateral instruments. The Funds require the fair value of collateral underlying the repurchase agreement to be at least 102% of the repurchase price, including an amount representing accrued interest. The fair value of the underlying collateral instruments is marked to market daily by the Funds’ Tri-Party Custodian, The Bank of New York Mellon. If the fair value of the instruments is less than 102% of the repurchase price, the seller will transfer additional securities to The Bank of New York Mellon to cure the deficit. In the event of a seller default, the seller’s obligation to repurchase all securities at the repurchase price on the maturity date becomes immediately due and payable to the Funds, all income paid after the default will be retained by the Funds and applied to the aggregate unpaid repurchase price, and The Bank of New York Mellon will deliver the underlying collateral instruments to the Funds. The Funds could experience both delays in liquidating the underlying security and losses. These losses could result from: (a) possible decline in the value of the underlying security while the Funds are seeking to enforce their rights under the repurchase agreement; (b) possible reduced levels or income or lack of access to income during this period; and (c) expenses of enforcing their rights.
Due to the absence of a master netting agreement related to the Funds’ participation in securities lending and repurchase agreements, no additional offsetting disclosures have been made on behalf of the Funds.
As of the end of the current fiscal period, the Funds had repurchase agreements with the following weighted average maturity by seller.
Fund Name | Seller | Weighted Average |
ClearShares OCIO ETF | N/A | N/A |
ClearShares Ultra-Short Maturity ETF | Cantor Fitzgerald & Company | 0.20 |
CF Secured, LLC | 2.40 | |
Chimera RMBS, LLC | 7.09 | |
Daiwa Securities Americas | 0.08 | |
ClearShares Piton Intermediate Fixed Income ETF | N/A | N/A |
39
ClearShares ETFs
NOTES TO FINANCIAL STATEMENTS
May 31, 2022 (Continued)
NOTE 6 – PURCHASES AND SALES OF SECURITIES
During the current fiscal period, purchases and sales of securities by the Funds, excluding short-term securities and in-kind transactions, were as follows:
Purchases | Sales | |||||||
ClearShares OCIO ETF | $ | 66,352,344 | $ | 69,160,034 | ||||
ClearShares Ultra-Short Maturity ETF | $ | — | $ | — | ||||
ClearShares Piton Intermediate Fixed Income ETF | $ | 134,666,204 | $ | 31,030,047 | ||||
There were no purchases or sales of U.S. Government securities in ClearShares OCIO ETF or ClearShares Ultra-Short Maturity ETF during the current fiscal period. Included in the amounts for ClearShares Piton Intermediate Fixed Income ETF are $59,211,139 of purchases and $22,588,622 of sales in long-term U.S. Government securities during the current fiscal period.
During the current fiscal period, in-kind transactions associated with creations and redemptions were as follows:
Creations | Redemptions | |||||||
ClearShares OCIO ETF | $ | 9,589,100 | $ | — | ||||
ClearShares Ultra-Short Maturity ETF | — | — | ||||||
ClearShares Piton Intermediate Fixed Income ETF | — | — | ||||||
NOTE 7 – TRANSACTIONS WITH AFFILIATED SECURITIES
Investments in issuers considered to be affiliate(s) of the Funds during the current fiscal period for purposes of Section 2(a)(3) of the 1940 Act were as follows:
Investments in ClearShares Ultra-Short Maturity ETF | ClearShares | ClearShares | ||||||
Value at May 31, 2021 | $ | 2,120,106 | $ | — | ||||
Purchases at Cost | 4,140,680 | 5,761,177 | ||||||
Proceeds from Sales | — | (5,759,705 | ) | |||||
Net Realized Gain (Loss) | — | (1,472 | ) | |||||
Change in Unrealized Appreciation (Depreciation) | (845 | ) | — | |||||
Value at May 31, 2022 | $ | 6,259,941 | $ | — | ||||
Shares held at May 31, 2022 | 64,540 | — | ||||||
Dividend Income | $ | 13,728 | $ | 5,885 | ||||
40
ClearShares ETFs
NOTES TO FINANCIAL STATEMENTS
May 31, 2022 (Continued)
NOTE 8 – INCOME TAX INFORMATION
The components of distributable earnings (accumulated deficit) and cost basis of investments for federal income tax purposes as of May 31, 2022 in the Funds, were as follows:
ClearShares | ClearShares | ClearShares | ||||||||||
Tax cost of investments | $ | 135,784,014 | $ | 200,131,930 | $ | 140,182,674 | ||||||
Gross tax unrealized appreciation | $ | 15,860,230 | $ | — | $ | 49,316 | ||||||
Gross tax unrealized depreciation | (1,330,548 | ) | — | (7,038,464 | ) | |||||||
Net tax unrealized appreciation (depreciation) | 14,529,682 | — | (6,989,148 | ) | ||||||||
Undistributed ordinary income | — | 33,706 | 263,553 | |||||||||
Undistributed long-term capital gains | 2,110,016 | — | — | |||||||||
Other accumulated gain (loss) | — | — | (454,485 | ) | ||||||||
Distributable Earnings (accumulated deficit) | $ | 16,639,698 | $ | 33,706 | $ | (7,180,080 | ) | |||||
The difference between book and tax-basis cost is attributable to wash sales.
A regulated investment company may elect for any taxable year to treat any portion of any qualified late year loss as arising on the first day of the next taxable year. Qualified late year losses are certain capital and ordinary losses which occur during the portion of the Fund’s taxable year subsequent to October 31 and December 31, respectively. For the taxable year ended May 31, 2022, the Funds did not have any Post-October losses or late-year ordinary losses.
At May 31, 2022, the Funds had the following capital loss carryforwards:
Short Term | Long Term | Expires | ||||||||||
ClearShares OCIO ETF | $ | — | $ | — | N/A | |||||||
ClearShares Ultra-Short Maturity ETF | $ | — | $ | — | N/A | |||||||
ClearShares Piton Intermediate Fixed Income ETF | $ | 409,164 | $ | 45,321 | Indefinite | |||||||
During the year ended May 31, 2022, no capital loss carryforwards were utilized by the Funds.
41
ClearShares ETFs
NOTES TO FINANCIAL STATEMENTS
May 31, 2022 (Continued)
The tax character of distributions paid by the Funds during the year ended May 31, 2022 and the year/period ended May 31, 2021, was as follows:
Year Ended May 31, 2022 | Year/Period Ended May 31, 2021 | |||||||||||||||
Ordinary | Capital | Ordinary | Capital | |||||||||||||
ClearShares OCIO ETF | $ | 1,951,069 | $ | 1,925,602 | $ | 1,880,639 | $ | 958,507 | ||||||||
ClearShares Ultra-Short Maturity ETF | $ | 696,252 | $ | — | $ | 529,631 | $ | — | ||||||||
ClearShares Piton Intermediate Fixed Income ETF | $ | 361,216 | $ | — | $ | 5,593 | $ | — | ||||||||
NOTE 9 – BENEFICIAL OWNERSHIP
The beneficial ownership, either directly or indirectly, of 25% or more of the voting securities of a Fund creates presumption of control of the Fund, under section 2(a)(9) of the 1940 Act. At the end of the current fiscal period, there is one shareholder who owned, of record or beneficially, more than 25% of ClearShares OCIO ETF’s shares.
NOTE 10 – SHARE TRANSACTIONS
Shares of the Funds are listed and traded on the New York Stock Exchange Arca, Inc. (“NYSE Arca”). Market prices for the shares may be different from their NAV. The Funds issue and redeem shares on a continuous basis at NAV generally in blocks of 50,000 shares, for ClearShares OCIO ETF and ClearShares Ultra-Short Maturity ETF and 25,000 shares for ClearShares Piton Intermediate Fixed Income ETF, called “Creation Units.” Creation Units are issued and redeemed principally in-kind for securities included in a specified universe. Once created, shares generally trade in the secondary market at market prices that change throughout the day. Except when aggregated in Creation Units, shares are not redeemable securities of a Fund. Shares of a Fund may only be purchased or redeemed by certain financial institutions (“Authorized Participants”). An Authorized Participant is either (i) a broker-dealer or other participant in the clearing process through the Continuous Net Settlement System of the National Securities Clearing Corporation or (ii) a Depository Trust Company participant and, in each case, must have executed a Participant Agreement with the Distributor. Most retail investors do not qualify as Authorized Participants nor have the resources to buy and sell whole Creation Units. Therefore, they are unable to purchase or redeem shares directly from a Fund. Rather, most retail investors may purchase shares in the secondary market with the assistance of a broker and are subject to customary brokerage commissions or fees.
42
ClearShares ETFs
NOTES TO FINANCIAL STATEMENTS
May 31, 2022 (Continued)
The Funds currently offer one class of shares, which have no front end-sales load, no deferred sales charge, and no redemption fee. A fixed transaction fee is imposed for the transfer and other transaction costs associated with the creation or redemption of Creation Units. The standard fixed transaction fee for the Funds is $300 and is payable to the Custodian. The standard fixed transaction fee may be waived on certain orders if the Funds’ Custodian has determined to waive some or all of the Creation Order costs associated with the order or another party, such as the Adviser, has agreed to pay such fee. In addition, a variable fee may be charged on all cash transactions or substitutes for Creation Units of up to a maximum of 2% as a percentage of the value of the Creation Units subject to the transaction. Variable fees received by the Funds, if any, are displayed in the Capital Shares Transactions section of the Statements of Changes in Net Assets. The Funds may issue an unlimited number of shares of beneficial interest, with no par value. All shares of the Funds have equal rights and privileges.
NOTE 11 – RISKS
Interest rate risk. The market value of debt securities generally varies in response to changes in prevailing interest rates. Interest rate changes can be sudden and unpredictable. In addition, short-term and long-term rates are not necessarily correlated to each other as short-term rates tend to be influenced by government monetary policy while long-term rates are market driven and may be influenced by macroeconomic events (such as economic expansion or contraction), inflation expectations, as well as supply and demand. During periods of declining interest rates, the market value of debt securities generally increases. Conversely, during periods of rising interest rates, the market value of debt securities generally declines. This occurs because new debt securities are likely to be issued with higher interest rates as interest rates increase, making the old or outstanding debt securities less attractive. In general, the market prices of long-term debt securities or securities that make little (or no) interest payments are more sensitive to interest rate fluctuations than shorter-term debt securities. The longer the Fund’s average weighted portfolio duration, the greater the potential impact a change in interest rates will have on its share price. Also, certain segments of the fixed income markets, such as high quality bonds, tend to be more sensitive to interest rate changes than other segments, such as lower-quality bonds.
Investment Company Risk. The risks of investing in investment companies typically reflect the risks of the types of instruments in which the investment companies invest. By investing in another investment company, the Funds become a shareholder of that investment company and bear their proportionate share of the fees and expenses of the other investment company. The Funds may be subject to statutory limits with respect to the amount they can invest in other ETFs, which may adversely affect the Funds’ ability to achieve their investment objective. Investments in ETFs are also
43
ClearShares ETFs
NOTES TO FINANCIAL STATEMENTS
May 31, 2022 (Continued)
subject to the following risks: (i) the market price of an ETF’s shares may trade above or below their NAV; (ii) an active trading market for an ETF’s shares may not develop or be maintained; and (iii) trading of an ETF’s shares may be halted for a number of reasons.
COVID-19 Risk. The recent global outbreak of COVID-19 has disrupted economic markets and the prolonged economic impact is uncertain. The operational and financial performance of the issuers of securities in which the Funds invest depends on future developments, including the duration and spread of the outbreak, and such uncertainty may in turn impact the value of the Funds’ investments.
44
ClearShares ETFs
Report of Independent Registered Public Accounting Firm
To the Shareholders of ClearShares ETFs and
Board of Trustees of ETF Series Solutions
Opinion on the Financial Statements
We have audited the accompanying statements of assets and liabilities, including the schedules of investments, of ClearShares OCIO ETF, ClearShares Ultra-Short Maturity ETF, and ClearShares Piton Intermediate Fixed Income ETF (the “Funds”), each a series of ETF Series Solutions, as of May 31, 2022, the related statements of operations and changes in net assets, the related notes, and the financial highlights for each of the periods indicated below (collectively referred to as the “financial statements”). In our opinion, the financial statements present fairly, in all material respects, the financial position of each of the Funds as of May 31, 2022, the results of their operations, the changes in net assets and the financial highlights for each of the periods indicated below, in conformity with accounting principles generally accepted in the United States of America.
Fund Name | Statements of | Statements | Financial Highlights |
ClearShares OCIO ETF | For the year ended May 31, 2022 | For the years ended May 31, 2022 and 2021 | For the years ended May 31, 2022, 2021, 2020 and 2019 and for the period from June 26, 2017 (commencement of operations) through May 31, 2018 |
ClearShares Ultra-Short Maturity ETF | For the year ended May 31, 2022 | For the years ended May 31, 2022 and 2021 | For the years ended May 31, 2022, 2021 and 2020 and for the period from July 10, 2018 (commencement of operations) through May 31, 2019 |
ClearShares Piton Intermediate Fixed Income ETF | For the year ended May 31, 2022 | For the year ended May 31, 2022 and for the period from October 1, 2020 (commencement of operations) through May 31, 2021 | |
Basis for Opinion
These financial statements are the responsibility of the Funds’ management. Our responsibility is to express an opinion on the Funds’ financial statements based on our audits. We are a public accounting firm registered with the Public Company Accounting
45
ClearShares ETFs
Report of Independent Registered Public Accounting Firm
(Continued)
Oversight Board (United States) (“PCAOB”) and are required to be independent with respect to the Funds in accordance with the U.S. federal securities laws and the applicable rules and regulations of the Securities and Exchange Commission and the PCAOB.
We conducted our audits in accordance with the standards of the PCAOB. Those standards require that we plan and perform the audit to obtain reasonable assurance about whether the financial statements are free of material misstatement whether due to error or fraud.
Our audits included performing procedures to assess the risks of material misstatement of the financial statements, whether due to error or fraud, and performing procedures that respond to those risks. Such procedures included examining, on a test basis, evidence regarding the amounts and disclosures in the financial statements. Our procedures included confirmation of securities owned as of May 31, 2022, by correspondence with the custodian and brokers. Our audits also included evaluating the accounting principles used and significant estimates made by management, as well as evaluating the overall presentation of the financial statements. We believe that our audits provide a reasonable basis for our opinion.
We have served as the Funds’ auditor since 2017.

COHEN & COMPANY, LTD.
Milwaukee, Wisconsin
July 28, 2022
46
ClearShares ETFs
Trustees and Officers
(Unaudited)
Additional information about each Trustee of the Trust is set forth below. The address of each Trustee of the Trust is c/o U.S. Bank Global Fund Services, 615 E. Michigan Street, Milwaukee, WI 53202.
Name and | Position | Term of | Principal | Number of | Other |
Independent Trustees | |||||
Leonard M. Rush, CPA Born: 1946 | Lead Independent Trustee and Audit Committee Chairman | Indefinite term; since 2012 | Retired; formerly Chief Financial Officer, Robert W. Baird & Co. Incorporated (wealth management firm) (2000–2011). | 57 | Independent Trustee, Managed Portfolio Series (34 portfolios) (since 2011). |
David A. Massart Born: 1967 | Trustee | Indefinite term; since 2012 | Partner and Managing Director, Beacon Pointe Advisors, LLC (since 2022); Co-Founder, President, and Chief Investment Strategist, Next Generation Wealth Management, Inc. (2005-2021). | 57 | Independent Trustee, Managed Portfolio Series (34 portfolios) (since 2011). |
Janet D. Olsen Born: 1956 | Trustee | Indefinite term; since 2018 | Retired; formerly Managing Director and General Counsel, Artisan Partners Limited Partnership (investment adviser) (2000–2013); Executive Vice President and General Counsel, Artisan Partners Asset Management Inc. (2012–2013); Vice President and General Counsel, Artisan Funds, Inc. (investment company) (2001–2012). | 57 | Independent Trustee, PPM Funds (2 portfolios) (since 2018). |
Interested Trustee | |||||
Michael A. Castino | Trustee and Chairman | Indefinite term; Trustee since 2014; Chairman since 2013 | Senior Vice President, U.S. Bancorp Fund Services, LLC (since 2013); Managing Director of Index Services, Zacks Investment Management (2011–2013). | 57 | None |
The officers of the Trust conduct and supervise its daily business. The address of each officer of the Trust is c/o U.S. Bank Global Fund Services, 615 E. Michigan Street, Milwaukee, WI 53202. Additional information about the Trust’s officers is as follows.
47
ClearShares ETFs
TRUSTEES AND OFFICERS
(Unaudited) (Continued)
Name and | Position(s) | Term of | Principal Occupation(s) |
Kristina R. Nelson | President | Indefinite term; since 2019 | Senior Vice President, U.S. Bancorp Fund Services, LLC (since 2020); Vice President, U.S. Bancorp Fund Services, LLC (2014–2020). |
Alyssa M. Bernard | Vice President | Indefinite term; since 2021 | Vice President, U.S. Bancorp Fund Services, LLC (since 2021); Assistant Vice President, U.S. Bancorp Fund Services, LLC (2018–2021); Attorney, Waddell & Reed Financial, Inc. (2017–2018). |
Cynthia L. Andrae | Chief Compliance Officer and Anti-Money Laundering Officer | Indefinite term; since 2022 (other roles since 2021) | Vice President, U.S. Bancorp Fund Services, LLC (since 2019); Compliance Officer, U.S. Bancorp Fund Services, LLC (2015-2019). |
Kristen M. Weitzel | Treasurer | Indefinite term; since 2014 (other roles since 2013) | Vice President, U.S. Bancorp Fund Services, LLC (since 2015); Assistant Vice President, U.S. Bancorp Fund Services, LLC (2011–2015). |
Isabella K. Zoller | Secretary | Indefinite term; since 2021 (other roles since 2020) | Assistant Vice President, U.S. Bancorp Fund Services, LLC (since 2021); Regulatory Administration Attorney, U.S. Bancorp Fund Services, LLC (since 2019); Regulatory Administration Intern, U.S. Bancorp Fund Services, LLC (2018–2019); Law Student (2016–2019). |
Elizabeth A. Winske Born: 1983 | Assistant Treasurer | Indefinite term; since 2017 | Vice President, U.S. Bancorp Fund Services, LLC (since 2020); Assistant Vice President, U.S. Bancorp Fund Services, LLC (2016–2020). |
Jason E. Shlensky | Assistant Treasurer | Indefinite term; since 2019 | Assistant Vice President, U.S. Bancorp Fund Services, LLC (since 2019); Officer, U.S. Bancorp Fund Services, LLC (2014–2019). |
Jessica L. Vorbeck | Assistant Treasurer | Indefinite term; since 2020 | Officer, U.S. Bancorp Fund Services, LLC (since 2018; 2014-2017). |
The Statement of Additional Information (“SAI”) includes additional information about the Trustees and is available without charge, upon request, by calling toll free at (800) 617-0004, or by accessing the SEC’s website at www.sec.gov, or by accessing the Funds’ website at www.clear-shares.com.
48
ClearShares ETFs
Expense Example
For the Six-Months Ended May 31, 2022 (Unaudited)
As a shareholder of the Funds you incur two types of costs: (1) transaction costs, including brokerage commissions on purchases and sales of Fund shares, and (2) ongoing costs, including management fees and other Fund expenses. This example is intended to help you understand your ongoing costs (in dollars) of investing in the Funds and to compare these costs with the ongoing costs of investing in other funds. The example is based on an investment of $1,000 invested at the beginning of the period and held for the entire period as indicated below in the Expense Example tables.
Actual Expenses
The first line of the table provides information about actual account values based on actual returns and actual expenses. You may use the information in this line, together with the amount you invested, to estimate the expenses that you paid over the period. Simply divide your account value by $1,000 (for example, an $8,600 account value divided by $1,000 = 8.6), then, multiply the result by the number in the first line under the heading entitled “Expenses Paid During the Period” to estimate the expenses you paid on your account during this period.
Hypothetical Example for Comparison Purposes
The second line of the table provides information about hypothetical account values based on a hypothetical return and hypothetical expenses based on the Funds’ actual expense ratios and an assumed rate of return of 5% per year before expenses, which is not the Funds’ actual returns. The hypothetical account values and expenses may not be used to estimate the actual ending account balance or expenses you paid for the period. You may use this information to compare the ongoing costs of investing in the Funds and other funds. To do so, compare this 5% hypothetical example with the 5% hypothetical examples that appear in the shareholder reports of the other funds. Please note that the expenses shown in the table are meant to highlight your ongoing costs only and do not reflect any transactional costs, such as brokerage commissions paid on purchases and sales of Fund shares. Therefore, the second line of the table is useful in comparing ongoing costs only and will not help you determine the relative total costs of owning different funds. If these transactional costs were included, your costs would have been higher.
49
ClearShares ETFs
EXPENSE EXAMPLE
For the Six-Months Ended May 31, 2022 (Unaudited) (Continued)
ClearShares OCIO ETF | ||||
Beginning | Ending | Expenses | Annualized | |
Actual | $1,000.00 | $ 937.10 | $2.61 | 0.54% |
Hypothetical (5% annual return before expenses) | $1,000.00 | $ 1,022.24 | $2.72 | 0.54% |
ClearShares Ultra-Short Maturity ETF | ||||
Beginning | Ending | Expenses | Annualized | |
Actual | $1,000.00 | $ 1,002.00 | $1.00 | 0.20% |
Hypothetical (5% annual return before expenses) | $1,000.00 | $ 1,023.93 | $1.01 | 0.20% |
ClearShares Piton Intermediate Fixed Income ETF | ||||
Beginning | Ending | Expenses | Annualized | |
Actual | $1,000.00 | $ 953.10 | $2.19 | 0.45% |
Hypothetical (5% annual return before expenses) | $1,000.00 | $ 1,022.69 | $2.27 | 0.45% |
(a) | The dollar amounts shown as expenses paid during the period are equal to the annualized six-month net expense ratio multiplied by the average account value during the period, multiplied by 182/365 (to reflect the one-half year period). |
50
ClearShares ETFs
Review of Liquidity Risk Management Program
(Unaudited)
Pursuant to Rule 22e-4 under the Investment Company Act of 1940, the Trust, on behalf of the series of the Trust covered by this shareholder report (the “Series”), has adopted a liquidity risk management program to govern the Trust’s approach to managing liquidity risk. Rule 22e-4 seeks to promote effective liquidity risk management, thereby reducing the risk that a fund will be unable to meet its redemption obligations and mitigating dilution of the interests of fund shareholders. The Trust’s liquidity risk management program is tailored to reflect the Series’ particular risks, but not to eliminate all adverse impacts of liquidity risk, which would be incompatible with the nature of such Series.
The investment adviser to the Series has adopted and implemented its own written liquidity risk management program (the “Program”) tailored specifically to assess and manage the liquidity risk of the Series.
At a recent meeting of the Board of Trustees of the Trust, the Trustees received a report pertaining to the operation, adequacy, and effectiveness of implementation of the Program for the period ended December 31, 2021. The report concluded that the Program is reasonably designed to assess and manage the Series’ liquidity risk and has operated adequately and effectively to manage such risk. The report reflected that there were no liquidity events that impacted the Series’ ability to timely meet redemptions without dilution to existing shareholders. The report further noted that no material changes have been made to the Program since its implementation.
There can be no assurance that the Program will achieve its objectives in the future. Please refer to the prospectus for more information regarding the Series’ exposure to liquidity risk and other principal risks to which an investment in the Series may be subject.
51
ClearShares Piton Intermediate Fixed Income ETF
ClearShares OCIO ETF
ClearShares Ultra-Short Maturity ETF
Approval of Advisory Agreement & Board Considerations
(Unaudited)
Pursuant to Section 15(c) of the Investment Company Act of 1940 (the “1940 Act”), at a meeting held on April 20-21, 2022 (the “Meeting”), the Board of Trustees (the “Board”) of ETF Series Solutions (the “Trust”) approved the continuance of the Investment Advisory Agreement (the “Advisory Agreement”) between ClearShares, LLC (the “Adviser”) and the Trust, on behalf of the ClearShares Piton Intermediate Fixed Income ETF, ClearShares OCIO ETF, and ClearShares Ultra-Short Maturity ETF (each, a “Fund” and, collectively, the “Funds”).
Prior to the Meeting, the Board, including the Trustees who are not parties to the Advisory Agreement or “interested persons” of any party thereto, as defined in the 1940 Act (the “Independent Trustees”), reviewed written materials (the “Materials”), including: information from the Adviser regarding, among other things: (i) the nature, extent, and quality of the services provided by the Adviser; (ii) the historical performance of the Funds; (iii) the cost of the services provided and the profits realized by the Adviser from services rendered to each Fund; (iv) comparative fee and expense data for the Funds and other investment companies with similar investment objectives; (v) the extent to which any economies of scale realized by the Adviser in connection with its services to each Fund are shared with Fund shareholders; (vi) any other financial benefits to the Adviser and its affiliates resulting from services rendered to the Fund; and (vii) other factors the Board deemed to be relevant; and a reported prepared by Barrington Partners, an independent third party, (the “Barrington Report”) relating to the Funds’ investment performance and fees and expenses, including comparisons to relevant market benchmarks and peer groups.
The Board also considered that the Adviser, along with other service providers of the Funds, had provided written and oral updates on the firm over the course of the year with respect to its role as investment adviser to the Funds, and the Board considered that information alongside the Materials in its consideration of whether the Advisory Agreement should be continued. Additionally, a representative from the Adviser provided an oral overview of each Fund’s strategy, the services provided to the Funds by the Adviser, and additional information about the Adviser’s personnel and business operations. The Board then discussed the Materials and oral presentations that it had received and any other information that the Board received at the Meeting and deliberated on the approval of continuation of the Advisory Agreement in light of this information.
Approval of the Continuation of the Advisory Agreement with the Adviser
Nature, Extent, and Quality of Services Provided. The Trustees considered the scope of services provided under the Advisory Agreement, noting that the Adviser had provided and would continue to provide investment management services to the
52
ClearShares Piton Intermediate Fixed Income ETF
ClearShares OCIO ETF
ClearShares Ultra-Short Maturity ETF
Approval of Advisory Agreement & Board Considerations
(Unaudited) (Continued)
Funds. In considering the nature, extent, and quality of the services provided by the Adviser, the Board considered the quality of the Adviser’s compliance program and past reports from the Trust’s Chief Compliance Officer (“CCO”) regarding the CCO’s review of the Adviser’s compliance program. The Board also considered its previous experience with the Adviser providing investment management services to the Funds. The Board noted that it had received a copy of the Adviser’s registration form and financial statements, as well as the Adviser’s response to a detailed series of questions that included, among other things, information about the Adviser’s decision-making process, the background and experience of the firm’s key personnel, and the firm’s compliance policies, marketing practices, and brokerage information.
The Board also considered other services provided by the Adviser to the Funds, including oversight of the Funds’ sub-advisers, monitoring the Funds’ adherence to their investment restrictions and compliance with the Funds’ policies and procedures and applicable securities regulations, as well as the extent to which each Fund achieves its investment objective.
Historical Performance. The Board noted that the Barrington Report contained information regarding each Fund’s performance for various time periods ended December 31, 2021, and compared each Fund’s performance results with (i) the returns of a group of comparable funds selected by Barrington (each, a “Peer Group”) and (ii) the returns of funds from each Fund’s Morningstar category (each, a “Category Peer Group”). Additionally, at the Board’s request, the Adviser identified the funds the Adviser considered to be each Fund’s most direct competitors (each, a “Selected Peer Group”), and provided the Selected Peer Group’s performance results. The Board considered each Fund’s past investment performance in light of these reports.
ClearShares Piton Intermediate Fixed Income ETF: The Board considered that the Fund slightly outperformed its broad-based benchmark, the Bloomberg Intermediate Government/Credit Index for the one-year period. The Board further noted that the Fund slightly underperformed its Peer Group over the one-year period. With respect to its Category Peer Group, the universe of U.S. Intermediate Core Bond ETFs, however, the Board observed that the Fund slightly outperformed its Category Peer Group over the one-year period, finishing in the second quartile of the Group. In addition, the Board noted that the Fund generally performed within the range of the Selected Peer Group for the one-year period. The Board also considered that the Fund commenced operations on October 2, 2020, and thus had been operating for less than two years, which was a relatively short period of time over which to evaluate the Fund’s performance and draw meaningful conclusions.
53
ClearShares Piton Intermediate Fixed Income ETF
ClearShares OCIO ETF
ClearShares Ultra-Short Maturity ETF
Approval of Advisory Agreement & Board Considerations
(Unaudited) (Continued)
ClearShares OCIO ETF: The Board considered that the Fund slightly outperformed its broad-based benchmark, the S&P Target Risk Growth Index for the one- and three-year periods, but the Fund slightly underperformed the same benchmark for the since inception period. The Board further noted that the Fund underperformed its Peer Group over the one-year period but outperformed its Peer Group over the three-year period. With respect to its Category Peer Group, the universe of 50-70% Equity Allocation U.S. ETFs, the Board observed that the Fund slightly underperformed its Category Peer Group over the one- and three-year periods, finishing the one-year period in the third quartile of the Group. In addition, the Board noted that the Fund generally performed within the range of the Selected Peer Group for the one-year period, but the Fund’s performance was above the range of funds in the Selected Peer Group for the three-year period.
ClearShares Ultra-Short Maturity ETF: The Board considered that the Fund slightly outperformed its broad-based benchmark, the ICE BofA Merrill Lynch 3 Month Treasury Bill for the one-year, three-year, and since inception periods. The Board further noted that the Fund slightly outperformed its Peer Group over the one-year period but slightly underperformed its Peer Group over the three-year period. With respect to its Category Peer Group, the universe of U.S. Ultrashort Bond ETFs, the Board observed that the Fund slightly outperformed its Category Peer Group over the one-year period, finishing in the top quartile of the Group, but slightly underperformed its Category Peer Group over the three-year period. In addition, the Board noted that the Fund generally performed within the range of the Selected Peer Group for the three-year period, but the Fund’s performance was above the range of funds in the Selected Peer Group for the one-year period.
Cost of Services Provided and Economies of Scale. The Board reviewed the net expense ratio for each of the Funds, the full amount of which was the “unified fee” (described below) less any fee waivers, and compared each Fund’s net expense ratio to its respective Peer Group, Category Peer Group and Selected Peer Group. The Board noted that the net expense ratio for each Fund was within the range of net expense ratios for the funds in such Fund’s Peer Group, Category Peer Group and Selected Peer Group. In particular, the net expense ratio of each Fund was lower than the average net expense ratio of its Category Peer Group. With respect to the applicable fee waivers, the Board considered that the Adviser has contractually agreed to waive certain amounts of its management fee for the ClearShares Piton Intermediate Fixed Income ETF and ClearShares OCIO ETF when those Funds invest in the ClearShares Ultra-Short Maturity ETF.
54
ClearShares Piton Intermediate Fixed Income ETF
ClearShares OCIO ETF
ClearShares Ultra-Short Maturity ETF
Approval of Advisory Agreement & Board Considerations
(Unaudited) (Continued)
The Board took into consideration that the Adviser would continue to charge a “unified fee,” meaning each Fund pays no expenses other than the advisory fee and, if applicable, certain other costs such as interest, brokerage, acquired fund fees and expenses, extraordinary expenses, and, to the extent it is implemented, fees pursuant to a Distribution and/or Shareholder Servicing (12b-1) Plan. The Board noted that the Adviser continued to be responsible for compensating the Trust’s other service providers and paying each Fund’s other expenses out of its own fee and resources. In this regard, the Board considered the Adviser’s financial resources and information regarding the Adviser’s ability to support its management of the Fund and obligations under the “unified fee” arrangement. The Board also evaluated the compensation and benefits received by the Adviser from its relationship with the Funds, taking into account analyses of the Adviser’s profitability with respect to each Fund at various Fund asset levels.
The Board expressed the view that it currently appeared that the Adviser might realize economies of scale in managing a Fund as assets grow in size. The Board noted that, should the Adviser realize economies of scale in the future, the Board would evaluate whether those economies were appropriately shared with Fund shareholders, whether through the structure and amount of the fee or by other means.
Conclusion. No single factor was determinative of the Board’s decision to approve the continuation of the Advisory Agreement; rather, the Board based its determination on the total mix of information available to it. Based on a consideration of all the factors in their totality, the Board, including the Independent Trustees, unanimously determined that the Advisory Agreement, including the compensation payable under the agreement, was fair and reasonable to each Fund. The Board, including the Independent Trustees, unanimously determined that the approval of the continuation of the Advisory Agreement was in the best interests of each Fund and its shareholders.
55
ClearShares Piton Intermediate Fixed Income ETF
Approval of Sub-Advisory Agreement & Board Considerations
(Unaudited)
Pursuant to Section 15(c) of the Investment Company Act of 1940 (the “1940 Act”), at a meeting held on April 20-21, 2022 (the “Meeting”), the Board of Trustees (the “Board”) of ETF Series Solutions (the “Trust”) approved the continuance of the Investment Sub-Advisory Agreement (the “Sub-Advisory Agreement”) by and among ClearShares, LLC (the “Adviser”), Piton Investment Management, L.P. (the “Sub-Adviser”), and the Trust, on behalf of the ClearShares Piton Intermediate Fixed Income ETF (the “Fund”).
Prior to the Meeting, the Board, including the Trustees who are not parties to the Sub-Advisory Agreement or “interested persons” of any party thereto, as defined in the 1940 Act (the “Independent Trustees”), reviewed written materials (the “Materials”), including: information from the Sub-Adviser regarding, among other things: (i) the nature, extent, and quality of the services provided by the Sub-Adviser; (ii) the historical performance of the Fund; (iii) the cost of the services provided and the profits realized by the Sub-Adviser from services rendered to the Fund; (iv) the extent to which any economies of scale realized by the Sub-Adviser in connection with its services to the Fund are shared with Fund shareholders; (v) any other financial benefits to the Sub-Adviser and its affiliates resulting from services rendered to the Fund; and (vi) other factors the Board deemed to be relevant; and a reported prepared by Barrington Partners, an independent third party, (the “Barrington Report”) relating to the Funds’ investment performance and fees and expenses, including comparisons to relevant market benchmarks and peer groups.
The Board also considered that the Sub-Adviser, along with other service providers of the Fund, had provided written updates on the firm over the course of the year with respect to its role as investment sub-adviser to the Fund, and the Board considered that information alongside the Materials in its evaluation of the Sub-Adviser’s fees and other aspects of the Sub-Advisory Agreement. Additionally, representatives from the Adviser provided an oral overview of the services provided to the Fund by the Adviser and Sub-Adviser. The Board then discussed the Sub-Adviser’s written materials and the Adviser’s oral presentation and any other information that the Board received at the Meeting and deliberated on the approval of continuation of the Sub-Advisory Agreement in light of this information.
Approval of the Continuation of the Sub-Advisory Agreement with the Sub-Adviser
Nature, Extent, and Quality of Services Provided. The Trustees considered the scope of services provided under the Sub-Advisory Agreement, noting that the Sub-Adviser had provided and would continue to provide investment management services to the Fund. In considering the nature, extent, and quality of the services provided by the Sub-Adviser, the Board considered the quality of the Sub-Adviser’s compliance program and past reports from the Trust’s Chief Compliance Officer (“CCO”) regarding the CCO’s review of the Sub-Adviser’s compliance program. The Board also considered
56
ClearShares Piton Intermediate Fixed Income ETF
Approval of Sub-Advisory Agreement & Board Considerations
(Unaudited) (Continued)
its previous experience with the Sub-Adviser providing investment management services to the Fund. The Board noted that it had received a copy of the Sub-Adviser’s registration form and financial statements, as well as the Sub-Adviser’s response to a detailed series of questions that included, among other things, information about the Sub-Adviser’s decision-making process, the background and experience of the firm’s key personnel, and the firm’s compliance policies, and marketing practices.
The Board noted the responsibilities that the Sub-Adviser has as the Fund’s investment sub-adviser, including: responsibility for the general management of the day-to-day investment and reinvestment of the assets of the Fund; determining the daily basket of deposit securities and cash components; executing portfolio security trades for purchases and redemptions of the Fund’s shares conducted on a cash-in-lieu basis; oversight of general portfolio compliance with applicable securities laws, regulations, and investment restrictions; responsibility for quarterly reporting to the Board; and implementation of Board directives as they relate to the Fund. The Board also considered the Sub-Adviser’s resources and capacity with respect to portfolio management, compliance, and operations given the number of funds and/or accounts for which it provides sub-advisory services.
Historical Performance. The Board noted that the Barrington Report contained information regarding the Fund’s performance for various time periods ended December 31, 2021, had been included in the Materials, including a report comparing the Fund’s performance results with (i) the returns of a group of comparable funds selected by Barrington (the “Peer Group”) and (ii) the returns of funds from the Fund’s Morningstar category (the “Category Peer Group”). Additionally, at the Board’s request, the Adviser identified the funds the Adviser considered to be the Fund’s most direct competitors (the “Selected Peer Group”), and provided the Selected Peer Group’s performance results. The Board considered the Fund’s past investment performance in light of these reports.
The Board considered that the Fund slightly outperformed its broad-based benchmark, the Bloomberg Intermediate Government/Credit Index, before fees and expenses, for the one-year period. The Board further noted that the Fund slightly underperformed its Peer Group over the one-year period. With respect to its Category Peer Group, the universe of U.S. Intermediate Core Bond ETFs, however, the Board observed that the Fund slightly outperformed its Category Peer Group over the one-year period, finishing in the second quartile of the Group. In addition, the Board noted that the Fund generally performed within the range of the Selected Peer Group for the one-year period. The Board also considered that the Fund commenced operations on October 2, 2020, and thus had been operating for less than two years, which was a relatively short period of time over which to evaluate the Fund’s performance and draw meaningful conclusions.
57
ClearShares Piton Intermediate Fixed Income ETF
Approval of Sub-Advisory Agreement & Board Considerations
(Unaudited) (Continued)
Cost of Services Provided and Economies of Scale. The Board reviewed the sub-advisory fees paid by the Adviser to the Sub-Adviser for its services to the Fund. The Board considered that the fees paid to the Sub-Adviser are paid by the Adviser and noted that the fee reflected an arm’s-length negotiation between the Adviser and the Sub-Adviser. The Board further determined that the fees reflected an appropriate allocation of the advisory fee paid to each firm given the work performed by each firm and noted that the fees were generally lower than or in line with those charged by the Sub-Adviser in connection with other exchange-traded funds managed by the Sub-Adviser. The Board also evaluated the compensation and benefits received by the Sub-Adviser from its relationship with the Fund, taking into account an analysis of the Sub-Adviser’s profitability with respect to the Fund at various actual and projected Fund asset levels.
The Board expressed the view that it currently appeared that the Sub-Adviser might realize economies of scale in managing the Fund as assets grow in size. The Board further noted that because the Fund pays the Adviser a unified fee, any benefits from breakpoints in the sub-advisory fee schedule would accrue to the Adviser, rather than the Fund’s shareholders. Consequently, the Board determined that it would monitor fees as the Fund grows to determine whether economies of scale were being effectively shared with the Fund and its shareholders.
Conclusion. No single factor was determinative of the Board’s decision to approve the continuation of the Sub-Advisory Agreement; rather, the Board based its determination on the total mix of information available to it. Based on a consideration of all the factors in their totality, the Board, including the Independent Trustees, unanimously determined that the Sub-Advisory Agreement, including the compensation payable under the agreement, was fair and reasonable to the Fund. The Board, including the Independent Trustees, unanimously determined that the approval of the continuation of the Sub-Advisory Agreement was in the best interests of the Fund and its shareholders.
58
ClearShares ETFs
Federal Tax Information
(Unaudited)
QUALIFIED DIVIDEND INCOME/DIVIDENDS RECEIVED DEDUCTION
For the fiscal year ended May 31, 2022, certain dividends paid by the Funds may be subject to a maximum tax rate of 23.8%, as provided for by the Jobs and Growth Tax Relief Reconciliation Act of 2003. The percentage of dividends declared from ordinary income designated as qualified dividend income was as follows:
ClearShares OCIO ETF | 69.86% |
ClearShares Ultra-Short Maturity ETF | 0.00% |
ClearShares Piton Intermediate Fixed Income ETF | 0.00% |
For corporate shareholders, the percent of ordinary income distributions qualifying for the corporate dividends received deduction for the fiscal year ended May 31, 2022, was as follows:
ClearShares OCIO ETF | 28.09% |
ClearShares Ultra-Short Maturity ETF | 0.00% |
ClearShares Piton Intermediate Fixed Income ETF | 0.00% |
SHORT-TERM CAPITAL GAIN
The percentage of taxable ordinary income distributions that are designated as short-term capital gain distributions under Internal Revenue Section 871(k)(2)(C) for each Fund were as follows:
ClearShares OCIO ETF | 0.00% |
ClearShares Ultra-Short Maturity ETF | 0.00% |
ClearShares Piton Intermediate Fixed Income ETF | 0.00% |
59
ClearShares ETFs
Federal Tax Information
(Unaudited) (Continued)
FOREIGN TAX CREDIT PASS THROUGH
Pursuant to Section 853 of the Internal Revenue code, the Funds designate the following amounts as foreign taxes paid for the year ended May 31, 2022. Foreign taxes paid for purposes of Section 853 may be less than actual foreign taxes paid for financial statement purposes.
Creditable | Per Share | Portion of | |
ClearShares OCIO ETF | $36,359 | 0.02866084 | 19.84% |
ClearShares Ultra-Short Maturity ETF | — | — | — |
ClearShares Piton Intermediate Fixed Income ETF | — | — | — |
Foreign taxes paid or withheld should be included in taxable income with an offsetting deduction from gross income or as a credit for taxes paid to foreign governments.
Above figures may differ from those cited elsewhere in this report due to difference in the calculation of income and gains for GAAP purposes and Internal Revenue Service purposes.
Shareholders are strongly advised to consult their own tax advisers with respect to the tax consequences of their investments in the Funds.
60
ClearShares ETFs
Information About Portfolio Holdings
(Unaudited)
The Funds file their complete schedules of portfolio holdings for their first and third fiscal quarters with the SEC on Part F of Form N-PORT. The Funds’ Part F of Form N-PORT is available without charge, upon request, by calling toll-free at (800) 617-0004. Furthermore, you may obtain the Part F of Form N-PORT on the SEC’s website at www.sec.gov. Each Fund’s portfolio holdings are posted on their website at www.clear-shares.com daily.
Information About Proxy Voting
(Unaudited)
A description of the policies and procedures the Funds use to determine how to vote proxies relating to portfolio securities is provided in the Statement of Additional Information (“SAI”). The SAI is available without charge upon request by calling toll-free at (800) 617-0004, by accessing the SEC’s website at www.sec.gov, or by accessing the Funds’ website at www.clear-shares.com.
When available, information regarding how the Funds voted proxies relating to portfolio securities during the twelve months ending June 30 will be (1) available by calling toll-free at (800) 617-0004 and (2) the SEC’s website at www.sec.gov.
Frequency Distribution of Premiums and Discounts
(Unaudited)
Information regarding how often shares of the Funds trade on the exchange at a price above (i.e., at a premium) or below (i.e., at a discount) their daily net asset value (NAV) is available, without charge, on the Funds’ website at www.clear-shares.com.
61
Adviser
ClearShares, LLC
420 Lexington Avenue, Suite 428
New York, New York 10170
Sub-Adviser (to OCIO only)
Blueprint Investment Partners LLC
1250 Revolution Mill Drive, Suite 150
Greensboro, North Carolina 27405
Sub-Adviser (to OPER and PIFI)
Piton Investment Management, LP
420 Lexington Avenue, Suite 428
New York, New York 10170
Distributor
Quasar Distributors, LLC
111 East Kilbourn Avenue, Suite 2200
Milwaukee, Wisconsin 53202
Custodian
U.S. Bank National Association
1555 North Rivercenter Drive, Suite 302
Milwaukee, Wisconsin 53212
Transfer Agent
U.S. Bancorp Fund Services, LLC
615 East Michigan Street
Milwaukee, Wisconsin 53202
Independent Registered Public Accounting Firm
Cohen & Company, Ltd.
342 North Water Street, Suite 830
Milwaukee, Wisconsin 53202
Legal Counsel
Morgan, Lewis & Bockius LLP
1111 Pennsylvania Avenue, NW
Washington, DC 20004-2541
ClearShares OCIO ETF
Symbol – OCIO
CUSIP – 26922A727
ClearShares Ultra-Short Maturity ETF
Symbol – OPER
CUSIP – 26922A453
ClearShares Piton Intermediate Fixed Income ETF
Symbol – PIFI
CUSIP — 26922A131
| (b) | Not applicable. |
Item 2. Code of Ethics.
The registrant has adopted a code of ethics that applies to the registrant’s principal executive officer and principal financial officer. The registrant has not made any substantive amendments to its code of ethics during the period covered by this report. The registrant has not granted any waivers from any provisions of the code of ethics during the period covered by this report.
A copy of the registrant’s Code of Ethics is filed herewith.
Item 3. Audit Committee Financial Expert.
The registrant’s board of trustees has determined that there is at least one audit committee financial expert serving on its audit committee. Mr. Leonard Rush is the “audit committee financial expert” and is considered to be “independent” as each term is defined in Item 3 of Form N-CSR.
Item 4. Principal Accountant Fees and Services.
The registrant has engaged its principal accountant to perform audit services, audit-related services, tax services and other services during the past two fiscal years. “Audit services” refer to performing an audit of the registrant's annual financial statements or services that are normally provided by the accountant in connection with statutory and regulatory filings or engagements for those fiscal years. “Audit-related services” refer to the assurance and related services by the principal accountant that are reasonably related to the performance of the audit. “Tax services” refer to professional services rendered by the principal accountant for tax compliance, tax advice, and tax planning. There were no “Other services” provided by the principal accountant. The following table details the aggregate fees billed or expected to be billed for each of the last two fiscal years for audit fees, audit-related fees, tax fees and other fees by the principal accountant.
ClearShares OCIO ETF
| FYE 5/31/2022 | FYE 5/31/2021 | |
| Audit Fees | $14,000 | $12,333 |
| Audit-Related Fees | $0 | $0 |
| Tax Fees | $3,500 | $3,500 |
| All Other Fees | $0 | $0 |
ClearShares Ultra-Short Maturity ETF
| FYE 5/31/2022 | FYE 5/31/2021 | |
| Audit Fees | $13,500 | $14,833 |
| Audit-Related Fees | $0 | $0 |
| Tax Fees | $3,500 | $3,500 |
| All Other Fees | $0 | $0 |
ClearShares Piton Intermediate Fixed Income ETF
| FYE 5/31/2022 | FYE 5/31/2021 | |
| Audit Fees | $16,000 | $14,334 |
| Audit-Related Fees | $0 | $0 |
| Tax Fees | $3,500 | $3,500 |
| All Other Fees | $0 | $0 |
The audit committee has adopted pre-approval policies and procedures that require the audit committee to pre-approve all audit and non-audit services of the registrant, including services provided to any entity affiliated with the registrant.
The percentage of fees billed by Cohen & Company, Ltd. applicable to non-audit services pursuant to waiver of pre-approval requirement were as follows:
ClearShares OCIO ETF
| FYE 5/31/2022 | FYE 5/31/2021 | |
| Audit-Related Fees | 0% | 0% |
| Tax Fees | 0% | 0% |
| All Other Fees | 0% | 0% |
ClearShares Ultra-Short Maturity ETF
| FYE 5/31/2022 | FYE 5/31/2021 | |
| Audit-Related Fees | 0% | 0% |
| Tax Fees | 0% | 0% |
| All Other Fees | 0% | 0% |
ClearShares Piton Intermediate Fixed Income ETF
| FYE 5/31/2022 | FYE 5/31/2021 | |
| Audit-Related Fees | 0% | 0% |
| Tax Fees | 0% | 0% |
| All Other Fees | 0% | 0% |
All of the principal accountant’s hours spent on auditing the registrant’s financial statements were attributed to work performed by full-time permanent employees of the principal accountant.
The following table indicates the non-audit fees billed or expected to be billed by the registrant’s accountant for services to the registrant and to the registrant’s investment adviser (and any other controlling entity, etc.—not sub-adviser) for the last two years.
ClearShares OCIO ETF
| Non-Audit Related Fees | FYE 5/31/2022 | FYE 5/31/2021 |
| Registrant | N/A | N/A |
| Registrant’s Investment Adviser | N/A | N/A |
ClearShares Ultra-Short Maturity ETF
| Non-Audit Related Fees | FYE 5/31/2022 | FYE 5/31/2021 |
| Registrant | N/A | N/A |
| Registrant’s Investment Adviser | N/A | N/A |
ClearShares Piton Intermediate Fixed Income ETF
| Non-Audit Related Fees | FYE 5/31/2022 | FYE 5/31/2021 |
| Registrant | N/A | N/A |
| Registrant’s Investment Adviser | N/A | N/A |
The audit committee of the board of trustees has considered whether the provision of non-audit services that were rendered to the registrant's investment adviser is compatible with maintaining the principal accountant's independence and has concluded that the provision of such non-audit services by the accountant has not compromised the accountant’s independence.
The registrant has not been identified by the U.S. Securities and Exchange Commission as having filed an annual report issued by a registered public accounting firm branch or office that is located in a foreign jurisdiction where the Public Company Accounting Oversight Board is unable to inspect or completely investigate because of a position taken by an authority in that jurisdiction.
The registrant is not a foreign issuer.
Item 5. Audit Committee of Listed Registrants.
| a) | The registrant is an issuer as defined in Rule 10A-3 under the Securities Exchange Act of 1934, (the “Act”) and has a separately-designated standing audit committee established in accordance with Section 3(a)(58)(A) of the Act. The independent members of the committee are as follows: David A. Massart, Leonard M. Rush, and Janet D. Olsen. |
| b) | Not applicable. |
Item 6. Investments.
Schedule of Investments is included as part of the report to shareholders filed under Item 1 of this Form.
Item 7. Disclosure of Proxy Voting Policies and Procedures for Closed-End Management Investment Companies.
Not applicable to open-end investment companies.
Item 8. Portfolio Managers of Closed-End Management Investment Companies.
Not applicable to open-end investment companies.
Item 9. Purchases of Equity Securities by Closed-End Management Investment Company and Affiliated Purchasers.
Not applicable to open-end investment companies.
Item 10. Submission of Matters to a Vote of Security Holders.
There have been no material changes to the procedures by which shareholders may recommend nominees to the registrant’s board of Trustees.
Item 11. Controls and Procedures.
| (a) | The Registrant’s President (principal executive officer) and Treasurer (principal financial officer) have reviewed the Registrant's disclosure controls and procedures (as defined in Rule 30a-3(c) under the Investment Company Act of 1940 (the “Act”)) as of a date within 90 days of the filing of this report, as required by Rule 30a-3(b) under the Act and Rules 13a-15(b) or 15d-15(b) under the Securities Exchange Act of 1934. Based on their review, such officers have concluded that the disclosure controls and procedures are effective in ensuring that information required to be disclosed in this report is appropriately recorded, processed, summarized and reported and made known to them by others within the Registrant and by the Registrant’s service provider. |
| (b) | There were no changes in the Registrant's internal control over financial reporting (as defined in Rule 30a-3(d) under the Act) that occurred during the period covered by this report that have materially affected, or are reasonably likely to materially affect, the Registrant's internal control over financial reporting. |
Item 12. Disclosure of Securities Lending Activities for Closed-End Management Investment Companies
Not applicable to open-end investment companies.
Item 13. Exhibits.
| (a) | (1) Any code of ethics or amendment thereto, that is the subject of the disclosure required by Item 2, to the extent that the registrant intends to satisfy Item 2 requirements through filing an exhibit. Filed herewith. |
(2) A separate certification for each principal executive officer and principal financial officer pursuant to Section 302 of the Sarbanes-Oxley Act of 2002. Filed herewith.
(3) Any written solicitation to purchase securities under Rule 23c-1 under the Act sent or given during the period covered by the report by or on behalf of the registrant to 10 or more persons. Not applicable to open-end investment companies.
(4) Change in the registrant’s independent public accountant. There was no change in the registrant’s independent public accountant for the period covered by this report.
| (b) | Certifications pursuant to Section 906 of the Sarbanes-Oxley Act of 2002. Furnished herewith. |
SIGNATURES
Pursuant to the requirements of the Securities Exchange Act of 1934 and the Investment Company Act of 1940, the registrant has duly caused this report to be signed on its behalf by the undersigned, thereunto duly authorized.
| (Registrant) | ETF Series Solutions | |
| By (Signature and Title)* | /s/ Kristina R. Nelson | |
| Kristina R. Nelson, President (principal executive officer) | ||
| Date | 9/7/2022 |
Pursuant to the requirements of the Securities Exchange Act of 1934 and the Investment Company Act of 1940, this report has been signed below by the following persons on behalf of the registrant and in the capacities and on the dates indicated.
| By (Signature and Title)* | /s/ Kristina R. Nelson | |
| Kristina R. Nelson, President (principal executive officer) |
| Date | 9/7/2022 |
| By (Signature and Title)* | /s/ Kristen M. Weitzel | |
| Kristen M. Weitzel, Treasurer (principal financial officer) |
| Date | 9/7/2022 |
| * | Print the name and title of each signing officer under his or her signature. |