Exhibit 96.1
S-K 1300 TECHNICAL REPORT SUMMARY
RIO PIRACICABA PROJECT
APOLLO RESOURCES CORPORATION
Prepared by Qualified Persons
Volodymyr Myadzel, PhD
Orlando Garcia Rocha Filho
First Issued on March 30, 2022
Revised on June 3, 2022
| S-K 1300 Technical Report Summary | |
| Rio Piracicaba Project | Page 2 |
LIST OF CONTENTS
| 1. Executive Summary | 7 |
| 1.1. Introduction | 7 |
| 1.2. Property Description and Location | 7 |
| 1.3. Geology and Mineralization | 7 |
| 1.4. Exploration and Drilling | 8 |
| 1.5. Mineral Resource Estimate | 8 |
| 1.6. Conclusions and Recommendations | 8 |
| 2. Introduction | 9 |
| 2.1. Terms of Reference and Purpose of the Report | 9 |
| 2.2. Qualifications of Consultants | 10 |
| 2.3. Details of Inspection | 11 |
| 2.4. Sources of Information | 11 |
| 2.5. Effective Date | 11 |
| 2.6. Units of Measure | 11 |
| 3. Property Description | 11 |
| 3.1. Project Location | 11 |
| 3.2. Permit Status | 12 |
| 3.3. History of the Mineral Right | 14 |
| 3.3.1. Mineral Right 832.945/1995 | 14 |
| 3.3.2. Mineral Right 833.114/2012 | 16 |
| 3.4. Legal Status | 18 |
| 3.5. Brazilian Mineral Legislation | 18 |
| 3.5.1. The Right of Priority and the Free Area | 18 |
| 3.5.2. Research Authorization | 18 |
| 3.5.3. Exploration Permit | 19 |
| 3.5.4. Final Research Report | 20 |
| 3.5.5. Maintenance of the Mineral Right | 20 |
| 3.6. Environmental Liabilities and Permitting | 21 |
| 3.7. Other Significant Factors and Risks | 21 |
| 4. Accessibility, Climate, Local Resources, Infrastructure and Physiography | 21 |
| 4.1. Accessibility | 21 |
| S-K 1300 Technical Report Summary | |
| Rio Piracicaba Project | Page 3 |
| 4.2. Climate | 22 |
| 4.3. Physiography | 22 |
| 4.4. Local Resources and Infrastructure | 25 |
| 5. History | 26 |
| 5.1. Geological Exploration and Research History | 26 |
| 5.1.1. History of Mining in the region | 26 |
| 5.1.2. Implementation of Mining Undertakings in Rio Piracicaba | 27 |
| 5.1.3. Importance of Iron Ore to the Region | 29 |
| 6. Geological Setting, Mineralization and Deposit | 29 |
| 6.1. Regional Geology | 29 |
| 6.1.1. Minas Supergroup | 32 |
| 6.2. Local Geology | 33 |
| 6.3. Typologies of Ferriferous Formations | 35 |
| 6.3.1. Colluvium/Rolled – CR | 36 |
| 6.3.2. Friable Siliceous Itabirite - IFS | 38 |
| 6.3.3. Semi-Compact Itabirite - ISC | 39 |
| 6.3.4. Compact Itabirite - IC | 41 |
| 6.3.5. Manganese - Mn | 42 |
| 6.3.6. Quartzites - QZT | 42 |
| 6.4. Deposit Types | 44 |
| 6.5. Local Iron Metallogeny | 49 |
| 6.6. Banded Iron Formations (BIF) | 50 |
| 6.7. Hydrothermal Alteration of Banded Iron Formations | 55 |
| 6.8. Surface Alteration Deposits (Lateritic) | 55 |
| 7. Exploration | 55 |
| 7.1. Exploration Infrastructure | 59 |
| 7.1.1. Project Staff | 59 |
| 7.1.2. Support Equipment | 59 |
| 7.2. Geological Mapping | 59 |
| 7.3. Channel and Well Sampling | 61 |
| 7.4. Planialtimetric Topographic Survey | 65 |
| 7.4.1. Base and Control Points | 67 |
| 7.5. Drillholes Cadastral Survey | 70 |
| 7.6. Density | 71 |
| S-K 1300 Technical Report Summary | |
| Rio Piracicaba Project | Page 4 |
| 8. Sample Preparation, Analysis and Security | 73 |
| 8.1. Sampling Method | 73 |
| 8.2. Sample Assay | 73 |
| 8.3. Sample Security | 73 |
| 8.4. Results | 74 |
| 9. Data Verification | 79 |
| 9.1. Site Visit | 79 |
| 9.2. GeoAnalabs QA/QC (Quality Assurance and Quality Control) | 82 |
| 9.3. QA/QC Methodology | 82 |
| 9.4. QA/QC Results | 84 |
| 9.5. Data Import and Validation | 89 |
| 9.5.1. Database | 89 |
| 9.5.2. Database Verification by the Micromine System | 92 |
| 9.6. QA/QC Conclusions | 92 |
| 10. Mineral Processing and Metallurgical Testing | 93 |
| 10.1. Samples Preparation | 93 |
| 10.2. Granulometric Assays | 94 |
| 10.3. Granulochemical Assays | 94 |
| 10.4. Mineralogical Assay | 95 |
| 10.5. Wet Magnetic Separation | 96 |
| 10.6. Quantitative Minerography | 99 |
| 10.7. Metallurgical Testing | 101 |
| 10.7.1. Executive Summary | 101 |
| 10.7.2. Objective | 102 |
| 10.7.3. Scope | 103 |
| 10.7.4. Equipment | 105 |
| 10.7.5. Experimental Results | 105 |
| 10.7.6. Mass Balancing | 108 |
| 10.7.7. Selection of the Best Magnetic Separation Route | 109 |
| 10.7.8. Conclusions | 111 |
10.8. Conclusion | 124 |
| S-K 1300 Technical Report Summary | |
| Rio Piracicaba Project | Page 5 |
| 11. Mineral Resource Estimates | 124 |
| 11.1. Introduction | 124 |
| 11.1.1 Point of Reference | 124 |
| 11.2. Statistical Analysis | 124 |
| 11.3. Interpretation | 126 |
| 11.4. Triangulation | 127 |
| 11.4.1. Topography | 127 |
| 11.4.2. Soil Zone | 128 |
| 11.4.3. Wireframe Closed | 128 |
| 11.5. Data Selection | 130 |
| 11.6. Capping | 131 |
| 11.7. Modelling | 131 |
| 11.8. Grade Interpolation and Mineral Resource Classification | 131 |
| 11.9. Mineral Resource Classification | 133 |
| 11.10. Density Values for the Block Model | 133 |
| 11.11. Block Model Verification | 134 |
| 11.12. Resource Evaluation Results | 136 |
| 11.13. Uncertainty Factors | 136 |
| 12. Mineral Reserves Estimates | 136 |
| 13. Mining Methods | 136 |
| 14. Process and Recovery Methods | 136 |
| 15. Infrastructure | 137 |
| S-K 1300 Technical Report Summary | |
| Rio Piracicaba Project | Page 6 |
| 16. Market Studies | 137 |
| 17. Environmental Studies, Permitting, and Plants, Negotiations, or Agreements with Local Individuals or Groups | 137 |
| 18. Capital and Operating Costs | 137 |
| 19. Economic Analysis | 137 |
| 20. Adjacent Properties | 137 |
| 21. Other Relevant Data and Information | 137 |
| 22. Interpretation and Conclusions | 138 |
| 23. Recommendations | 138 |
| 24. References | 139 |
| 25. Reliance on Information Provided by the Registrant | 141 |
| S-K 1300 Technical Report Summary | |
| Rio Piracicaba Project | Page 7 |
1. Executive Summary
1.1. Introduction
Mineração Apollo Ltda is a Brazilian company wholly owned by Apollo Resources Corporation and is the operating entity for all projects in Brazil, including the Rio Piracicaba Project (the “Project”) described herein. Apollo Resources Corporation is a private company incorporated in the Republic of the Marshall Islands in 2020, whose focus is iron projects in Brazil. Hereinafter, Mineração Apollo Ltda and Apollo Resources Corporation shall be referred to simply as “Apollo Resources”.
The purpose of this Technical Report Summary under Regulation S-K 1300 (“TRS S-K 1300” or “TRS”) is to present a Mineral Resource Estimation Report, including the initial geological exploration work, the drilling campaign, core logging and sample assaying results. It also includes preliminary mineral processing and metallurgical studies.
1.2. Property Description and Location
The Rio Piracicaba Project is in the rural area of the municipality of Rio Piracicaba, state of Minas Gerais in Brazil, at coordinates 19°56’23.9 “S / 43°12’01.7 “W. The Project is located 130 km from Belo Horizonte, capital of the state of Minas Gerais, and is served by paved roads and is also intersected by a railroad used by several mining companies to transport iron ore to the coast.
Apollo Resources holds the title of the mineral right number 833.114/2012, inside of which the Rio Piracicaba Project was developed. This is an area of 259.56 hectares, located next to the Água Limpa iron mine that belongs to Vale S.A.
In Brazil, mineral rights and surface rights are dissociated. Apollo Resources is not the owner of the land on which the exploration permit is held but has the right to access the Project area through agreements with the landowner and permission to conduct exploratory research in the area.
Research work in the area began in 2015, when mineral right 833.114/2012 still belonged to Mr. André Martinez, a Brazilian geologist and unrelated third-party to Apollo Resources. In 2020, Apollo Resources acquired it and became the 100% owner of the mineral right 833.114/2012 and continued the exploratory work.
1.3. Geology and Mineralization
The Rio Piracicaba Project is in the Iron Quadrangle, the largest mineral province in Brazil. It contains the Cauê Formation, main iron mineralized materials unit that occurs in the region, consisting of itabirites and other rocks with a high iron content, represented mainly by hematite and magnetite.
The Cauê Formation has its genesis based on chemical sedimentation under stable platform conditions, which made the Lake Superior type iron deposits. The entire Project area falls within the same geological formation, but three iron mineralized lithologies were defined, thus characterizing the deposit: colluvial coverage, friable itabirite and semi-compact itabirite. In the Project area, there is an occurrence of compact itabirite, not considered of economic interest in this context, and an inexpressive manganese mineralization.
| S-K 1300 Technical Report Summary | |
| Rio Piracicaba Project | Page 8 |
1.4. Exploration and Drilling
The investigation into the existence of a mineral potential began in 2012, but in 2015, with the mineral right already in possession of the previous holder before Apollo Resources, who began to conduct research on the property.
Between 2015 and 2020, prospective studies were carried out consisting of geological mapping, surface sampling for technological characterization of the outcropping ore and geophysical work. The last one consists of twelve magnetometer lines, totalizing 4.2 km in a SW-NE grid. With the samples collected, granulochemical and concentration tests were performed in an exploratory way. Based on the positive results of this preliminary phase, a drilling campaign and detailed exploratory work was started.
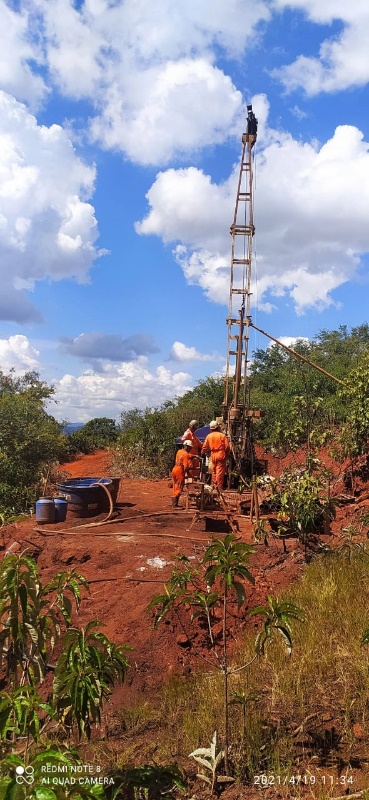
In February 2021, the preparatory activities for the research of the Rio Piracicaba Project began. Field activities started in March 2021 and drilling began in April 2021, when eleven diamond drill holes were drilled with drill core recovery, totaling 384 m. During this work, nineteen test pits were developed manually and mechanically with a backhoe loader, totalizing 60 m. Twenty-seven hectares were also mapped in detail. The diamond drilling generated fifty-five samples and the sampling of the test pits, fifteen samples, all analyzed in the same laboratory in four granulometric ranges. During this geological exploration work forty-eight density measurements of different lithotypes were made.
1.5. Mineral Resource Estimate
The statement has been classified by Qualified Person Volodymyr Myadzel. It has an effective date of March 30, 2022.
| | | | | VOLUME | | | TONNES | | | DENSITY | | | Fe | | | Si | | | Al | | | Mn | | | P | | | PPC | |
| CLASS | | | TYPE | | M³ | | | t | | | (t/m³) | | | pct | | | pct | | | pct | | | pct | | | pct | | | pct | |
| Indicated | | | FRIABLE ITABIRITE | | | 853593 | | | | 2,646,141 | | | | 3.10 | | | | 33.74 | | | | 46.50 | | | | 1.97 | | | | 1.04 | | | | 0.02 | | | | 1,21 | |
| | | | COLLUVIUM | | | 67,725 | | | | 121,905 | | | | 1.80 | | | | 31.11 | | | | 33.17 | | | | 10.99 | | | | 1.03 | | | | 0.05 | | | | 8.06 | |
| Inferred | | | FRIABLE ITABIRITE | | | 1,025,538 | | | | 3,179,166 | | | | 3.10 | | | | 31.61 | | | | 44.97 | | | | 2.92 | | | | 3.14 | | | | 0.02 | | | | 1.75 | |
| | | | COMPACT ITABIRITE | | | 581,006 | | | | 1,905,701 | | | | 3.28 | | | | 28.35 | | | | 57.68 | | | | 0.92 | | | | 0.06 | | | | 0.01 | | | | 0,30 | |
| TOTAL | | | 2,527,863 | | | | 7,852,912 | | | | 3.11 | | | | 31.53 | | | | 48.39 | | | | 2.24 | | | | 1.65 | | | | 0.02 | | | | 1.31 | |
Table 1.5-1: Rio Piracicaba Project –Mineral Resource Grade Tonnage Report
The following disclosures apply to the summary table above:
| | 1. | The definitions for Mineral Resources in S-K 1300 were followed for Mineral Resources. |
| | 2. | Mineral Resources are estimated at a cut-off grade of 20% iron. |
| 3. | Mineral Resources are estimated using a long-term iron ore price of US$90 per dry metric tonne for the Platts/IODEX 62% iron fines CFR China, and US$/BRL exchange rate of 5.25. |
| 4. | Reasonable prospects for economic extraction were determined by benchmarking similar operations and developing a 20% iron cut-off grade based on operating costs. |
| 5. | The effective date is March 30, 2022. |
The resources were classified as Indicated and Inferred according to the degree of reliability of the different rounds and data used for the interpolation of the block model.
1.6. Conclusions and Recommendations
The works and results of this research presented refer to the mineral right 833.114/2012, exploration permit No. 12.891, published in the Official Gazette on 10/26/2015, extended on 03/23/2020 owned by Apollo Resources. Out of a total of 259.56 hectares of the mineral right area, only 23.2 ha were explored and presented in this report (less than 10% of the total).
The Rio Piracicaba Project is an iron ore deposit, inserted in Fm. Cauê: the occurrence of iron is constituted by siliceous friable itabirite, semi-compact friable itabirite and colluvium/rolled with less expression. These iron formations cover practically 23.2 ha of researched area. Even though they were not exposed, all the drill holes intercepted them. The thickness of these potentially mineralized formations ranges from 16m to 20m, dipping at a low angle (<30°) to SE. Considering these thicknesses and density of 2.7g/cm³, the potential varies from 10 to 13 million tons of in situ material. The global iron content ranges from 31 to 32% Fe, based on the global results of chemical analyzes presented in item 11 of this report.
Sample preparation, assaying and security are acceptable at this exploration stage.
| S-K 1300 Technical Report Summary | |
| Rio Piracicaba Project | Page 9 |
No duplicates were applied in the QA/QC program of Apollo Resources in the Rio Piracicaba Project, which makes the program incomplete, as the analysis precision (the ability to consistently reproduce a measurement in similar conditions) cannot be verified.
For exploration next phases, the QA/QC program must be improved, including field duplicates, coarse and pulp duplicates. Blanks must be inserted as coarse samples as the first sample of the lots. There must also be a medium grade standard inserted in the QA/QC program. In the QP’s opinion, the sample preparation, analysis, security procedures and database verification at Rio Piracicaba Project comply with industry standards and are adequate for use in the estimation of Mineral Resources
Wet granulochemical tests and a preliminary concentration study were carried out in surface samples. Based on the results obtained, it is possible to demonstrate that friable itabirite presents characteristics that allow the application of magnetic separation as a concentration methodology.
The best magnetic separation route was to pre-concentrate the ore at top size of 2 mm using a DryMAG at 3000 Gauss, then grinding to P80 of 0.300 mm followed by wet magnetic separation at 4000 Gauss using a MIMS and at 11000 using a WHIMS (equipment shown in Figure 2). Final concentrate grade yield by this route was 64.2% Fe and iron recovery of 83.4%. The QP is of the opinion that the data derived from the testing activities described above are adequate for the purposes of defining a Mineral Resource.
It is necessary to carry on with exploration works up to a minimum 100m x 100m drillholes grid spacing and to develop a more in-depth process route study for the types of itabirites: siliceous friable itabirite - IFS and semi-compact itabirite - ISC, seeking gravimetric, magnetic and flotation concentration options.
A validation procedure is in progress for all the exploration work carried out so far, in order to guarantee compliance with the best technical practices in the industry. The validation includes checks on the quality of the topographic surveys, the execution of the drilling, drill core logging, sampling, and the practices in the contracted laboratory. In addition, the validity of using samples from wells and channels will be verified.
After this validation process, a geological model will be developed to support the continued exploration work.
Estimated costs of the work program are shown in the table below.
| Item | | Cost (US$) | |
| Additional Diamond Drilling | | | 120,000.00 | |
| Additional Chemical Analysis and QA/QC | | | 15,000.00 | |
| Technical Services for Mineral Resource Estimation | | | 30,000.00 | |
| Other Direct and Indirect Costs | | | 10,000.00 | |
| TOTAL | | | 175,000.00 | |
Table 1.6-1 Proposed Budget for Recommended Work
2. Introduction
2.1. Terms of Reference and Purpose of the Report
Apollo Resources commissioned Volodymyr Myadzel to prepare a Technical Report Summary (“TRS”) compliant with Regulation S-K 1300 for a Mineral Resource Estimation Report of the Rio Piracicaba Project (Rio Piracicaba Project or the Project) located in Brazil. The quality of information, conclusions, and estimates contained herein are consistent with the level of effort involved in the Consultant’s services, based on: i) information available at the time of preparation, ii) data supplied by outside sources, and iii) the assumptions, conditions, and qualifications set forth in this report. This report is intended for use by Apollo Resources subject to the terms and conditions of its contract with the Consultant’s and relevant securities legislation. Except for the purposes legislated under provincial securities law, any other uses of this report by any third party is at that party’s sole risk. The responsibility for this disclosure remains with Apollo Resources. The user of this document should ensure that this is the most recent Technical Report for the property as it is not valid if a new Technical Report has been issued.
| S-K 1300 Technical Report Summary | |
| Rio Piracicaba Project | Page 10 |
The purpose of this technical report is to present a Mineral Resource Estimation Report, including: the initial geological exploration work, the drilling campaign, core logging and sample assaying results, preliminary mineral processing and metallurgical and environmental studies, permitting and social or community impact.
In addition, the document intends to suggest some recommendations for further development of the Rio Piracicaba Project and to document the data obtained so far, in order to focus on the search for investors and to continue the exploration work.
The technical information, on which this report is based, represents a compilation of work already carried out by Apollo Resources and independent consulting firms. The geological exploration was executed by RCS Geologia e Meio Ambiente Ltda (“RCS”); this work included geological mapping, topography, drilling supervision, description and the drill core and wells sampling. Regarding the mineral technology development activities, tests and assays were made by two research centers, the Gorceix Foundation and CIT Senai. For environmental issues, a company specialized in the subject is carrying out the environmental studies on the property, Geoline, was used.
Information on the mineral right title history was obtained from the National Mining Agency (Agência Nacional de Mineração – ANM).
2.2. Qualifications of Consultants
The Consultants preparing this technical report are specialists in the fields of geology, exploration, mineral resource and mineral reserve estimation and classification.
The following individuals, by virtue of their education, experience and professional association, are each considered a Qualified Person (QP) as defined in Regulation S-K 1300 and are members in good standing of appropriate professional institutions.
| | ● | QP Volodymyr Myadzel, PhD, MAIG, Geologist, is responsible for items 1, 2, and 10 through 25 of this TRS. |
| S-K 1300 Technical Report Summary | |
| Rio Piracicaba Project | Page 11 |
Mr. Myadzel is a Principal Geologist of VMG Consultoria e Soluções Ltda., located at Av. do Contorno, 2905, Suite 406, Belo Horizonte, MG 30110-915, Brazil. He graduated with a degree in Geology from Kryvyi Rih National University, Kryvyi Rih, Ukraine in 1999. In addition, he obtained a PhD in Geology from Kryvyi Rih National University, Kryvyi Rih, Ukraine in 2004. He is Member #3974 of the Australasian Institute of Geoscientists. Mr. Myadzel has been working as a Geologist for a total of 22 years since graduation from university. His relevant experience includes modeling and resource and reserve estimation of deposits, prospecting and surveying, geological mapping, mineralogy and petrology of metamorphic rocks and ore deposits, and in particular iron deposits.
| | ● | QP Orlando Garcia Rocha Filho, GAC, CREA, Geologist, is responsible for items 3 through 10 of this TRS. |
Mr. Rocha is a Principal Geologist at RCS Geologia e Meio Ambiente Ltda, located at Rua João Mota, nº 372, Suite 301, Centro, Santa Bárbara, MG 35.960-000, Brazil, since 2011. He graduated in Geology from the Federal University of Rio Grande do Norte, Brazil in 1992. He is Member #20708 of the Geological Association of Canada. He is Member # 3484D/MG of CREA (Regional Council of Engineering and Agronomy) of the state of Minas Gerais in Brazil. Mr. Rocha has been actively working as a Geologist for 29 years. His relevant experience includes modeling and estimating resource and deposit reserves, prospecting and surveying, geological mapping, mineralogy and petrology of metamorphic rocks and ore deposits, particularly of iron ore deposits.
2.3. Details of Inspection
The exploration works of the Rio Piracicaba Iron Project occurred over the March to July 2021 time period.
RCS, the company hired by Apollo Resources to oversee the exploration, kept its own technical team dedicated to the Project and used local labor for support.
During this period, several works were developed, from the first geological and topographical recognition to the drilling. Besides the technician that followed full time the drilling process, guiding about operational, safety and environmental issues, RCS provided a geologist and a senior geologist for the geological mapping, description and sampling of drill cores, channel samples and research test pits.
2.4. Sources of Information
Information used to support this TRS are included within the body of this TRS or in the documents listed in the References section of this TRS.
2.5. Effective Date
The effective date of the data stated herein is March 30, 2022.
2.6. Units of Measure
Unless otherwise indicated, all measurements reported herein are in metric units, tons, and all costs, revenues and amounts are expressed in U.S. dollars (USD or US$) at the foreign exchange rate of $1 USD = 5.25 BRL as of the report’s effective date.
Some data with units of measurement used in Brazil will be preserved to maintain the originality of the work.
3. Property Description
3.1. Project Location
The property is located in the rural area of the Rio Piracicaba city, in the central-eastern part of the state of Minas Gerais, more precisely near Morro do Elegant, and adjacent to Vale’s Mina Aqua Limpa. (Figure 3.1-1).
| S-K 1300 Technical Report Summary | |
| Rio Piracicaba Project | Page 12 |

Figure 3.1-1: Situation map and mineral right location
As it can be seen on Figure 3.1-1, the access, from Belo Horizonte, is on highway BR-381, traveling 115 km east, until the intersection of Bela Vista de Minas city, then 15 km south on MG-123, until the municipality of Rio Piracicaba.
3.2. Permit Status
Apollo Resources is not the owner of the property referring to the surface area of the exploration permit site, shown on Figure 3.2-1. Apollo Resources is the owner of the subsurface mineral right, and the owner of the surface land is a third-party enterprise, described below.
| S-K 1300 Technical Report Summary | |
| Rio Piracicaba Project | Page 13 |
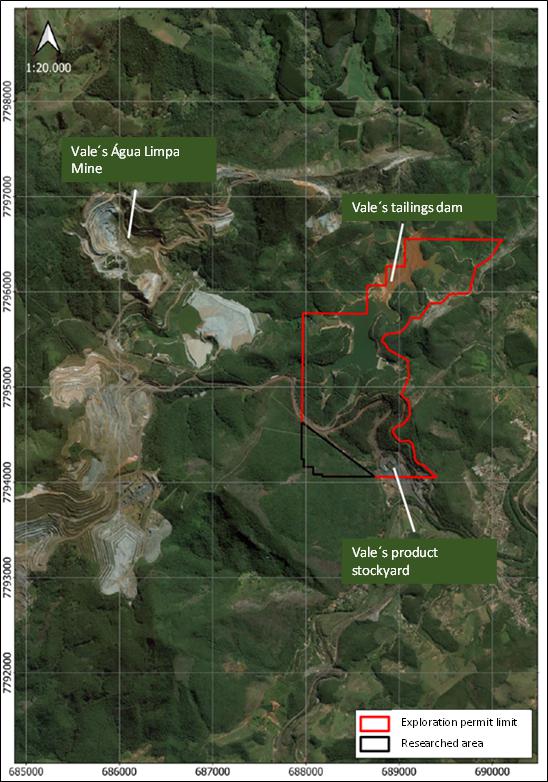
Figure 3.2-1: Exploration Permit Limit and researched area
The surface landowner in the researched area is the company W. Martins Representações Imobiliárias Ltda. The company is a real estate company based in Nova Lima, state of Minas Gerais. There is an access agreement to the researched area, between Apollo Resources and the company that owns the property and, therefore, it was possible to carry out the mineral exploration work (or research work) described.
| S-K 1300 Technical Report Summary | |
| Rio Piracicaba Project | Page 14 |
The remaining mineral right is owned by the mining company Vale S.A. In this area coinciding with the polygon of Apollo Resources’ exploration permit, Vale S.A. has facilities to support the operation of the Morro Agudo and Água Limpa Mine, such as a tailings dam, rail terminal and operational and service roads. After numerous attempts, it was not possible to conclude an access agreement to the area with Vale S.A., therefore, Apollo Resources took legal action to have its rights upheld.
3.3. History of the Mineral Right
The area was originally requested in 2010, by Mr. André Luis Martinez Ferreira, generating in the former National Department of Mineral production (Departamento Nacional de Produção Mineral – DNPM), later renamed National Mining Agency (Agência Nacional de Mineração – ANM), the mineral right 833.114/2012, after a unique qualification to an Availability Notice.
On November 20, 2020, a request was made to transfer the mining right to Apollo Resources. This transfer was approved by ANM, on April 16, 2021, and is currently fully under the responsibility and rights of Apollo Resources.
3.3.1. Mineral Right 832.945/1995
In the 1990’s, the exploration work was carried out by the contractor Herbert Engler. The research request was filed incomplete on May 5, 1995 and complemented on July 5, 1995.
On January 11, 1999 they filed a request for reconsideration, which was again rejected.
On February 9, 2000 the contractor’s desistance of the area was published, then the area was available again.
On October 23, 2000, the area was requested by the J. Mendes Mineração group. The exploration permit has been published on May 9, 2001, valid for 3 years.
On October 1, 2004, the company requested an extension of the deadline for the exploration permit and on August 25, 2006, the start of the research work was announced.
On October 21, 2008, there was an approved transfer of rights to the company JMN Mineração S/A.
On February 6, 2009, the company submitted a negative survey report, as it ended up not doing the surveys because at the time it concentrated its efforts on selling its mines to Usiminas Mineração S.A.
Thus, on October 5, 2010, the availability notice was released and Mr. André Martinez was the only bidder in this call for proposals.
The summary of the mineral right is presented on Figure 3.3.1-1 and Figure 3.3.1-2, taken from the Mining Register of ANM:
| S-K 1300 Technical Report Summary | |
| Rio Piracicaba Project | Page 15 |
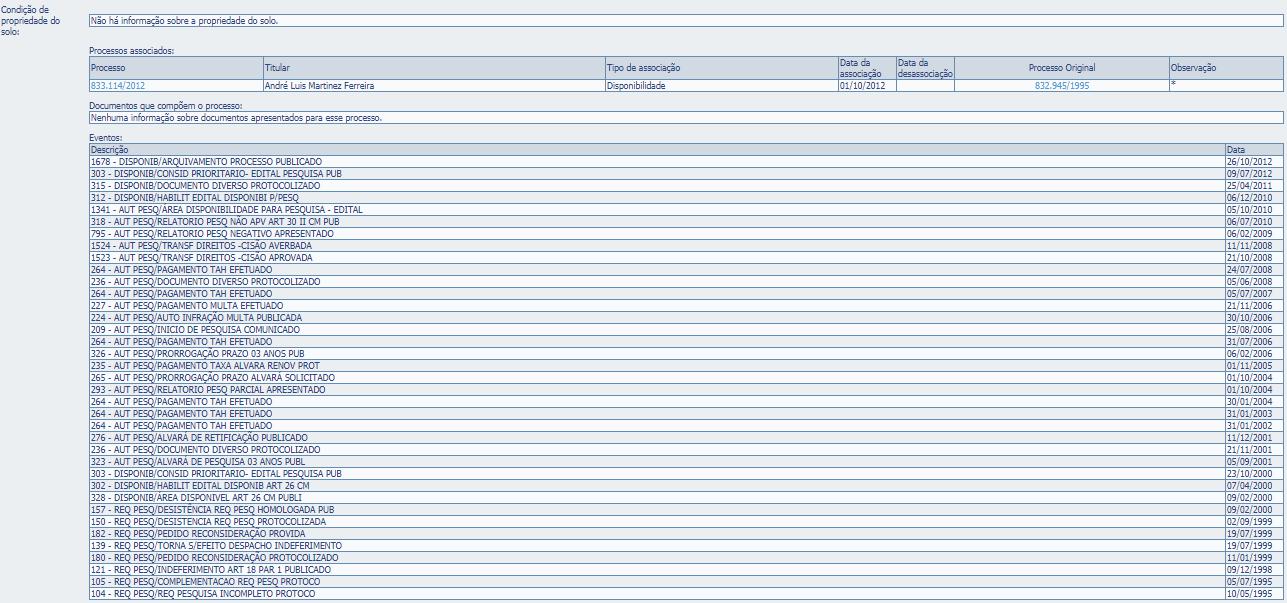
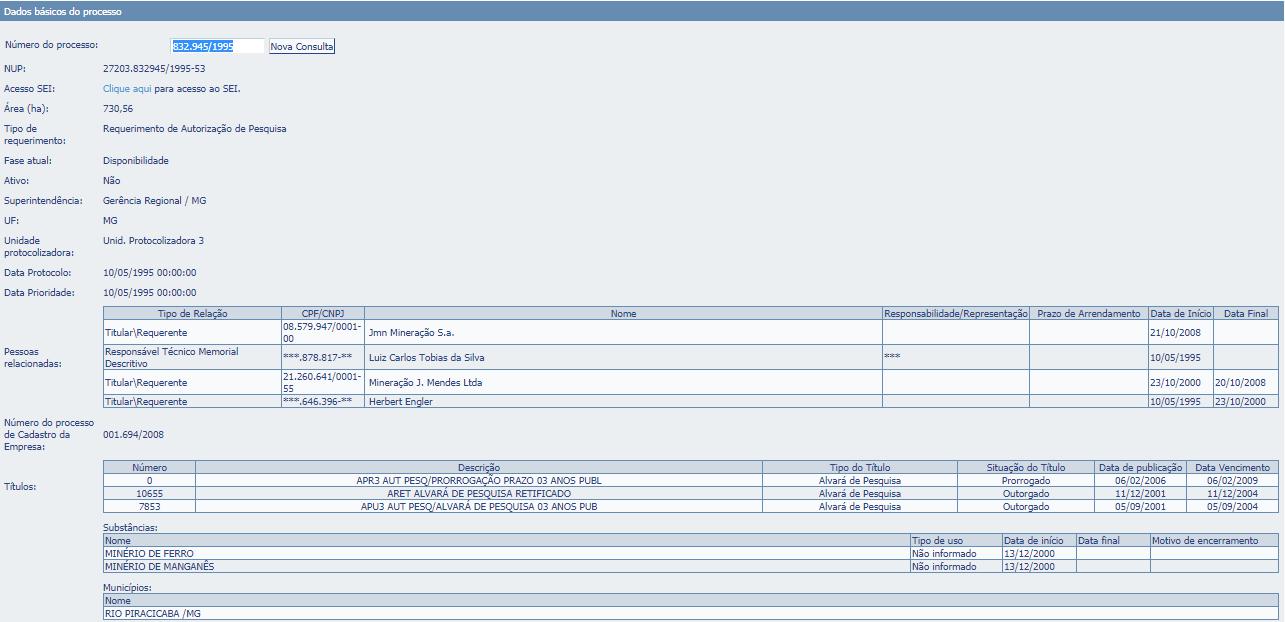
Figure 3.3.1-1: Summary of mineral right 832.945/1995, owned by Herbert Engler and the company JMN Mineração S/A.
| S-K 1300 Technical Report Summary | |
| Rio Piracicaba Project | Page 16 |
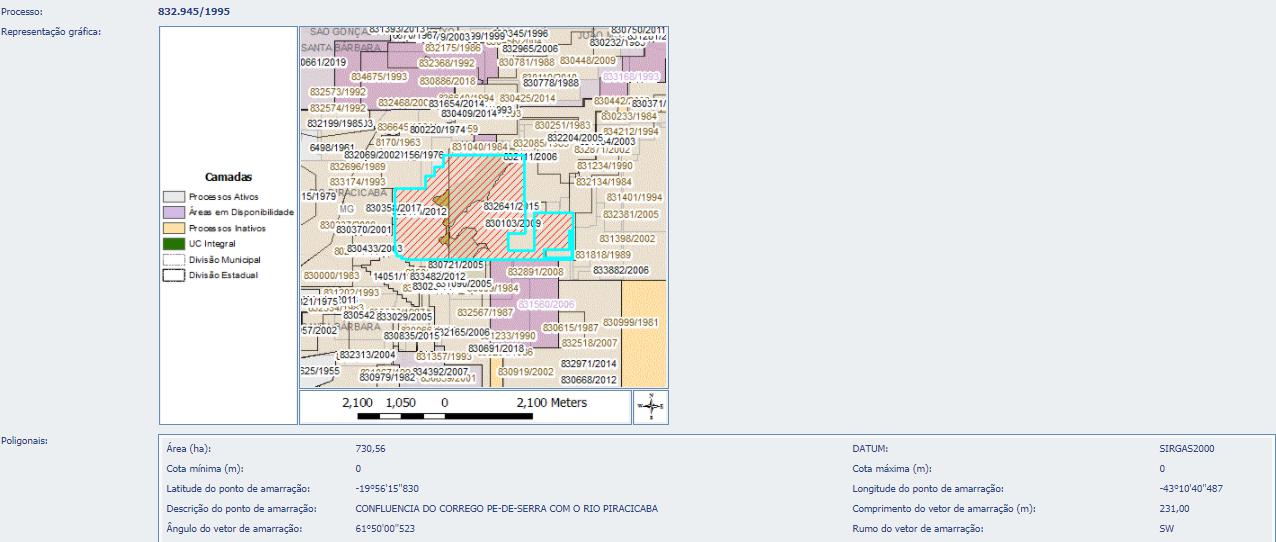
Figure 3.3.1-2: Polygonal of mineral right 832.945/1995, owned by Herbert Engler and the company JMN Mineração S/A.
3.3.2. Mineral Right 833.114/2012
With availability having a single proponent, it becomes a common research request. Thus, in 2012, the research request no. 833.114/2012 was generated.
The research request was generated on October 1, 2012 along with the proof of collection of emoluments and the Research Work Plans, having its exploration permit for 3 years published on October 26, 2015, and extended on March 23, 2020.
The research work then began to be carried out, where geological recognition, soil geochemistry, opening of test pits and trenches, auger holes, geological mapping, chemical analyses, and processing tests were performed.
On August 27, 2018, the permit extension request was submitted, delivering a Partial Exploration Report, and on March 23, 2020, the deadline extension was published for another 2 years, until March 23, 2022.
On November 20, 2020, a request was made to transfer the mining right to Apollo Resources. This transfer was approved by ANM, and the mineral right is currently fully under the responsibility and rights of Apollo Resources.
The summary of the mineral right appears on Figure 3.3.2-1 and Figure 3.3.2-2, taken from the Mining Register of ANM:
| S-K 1300 Technical Report Summary | |
| Rio Piracicaba Project | Page 17 |

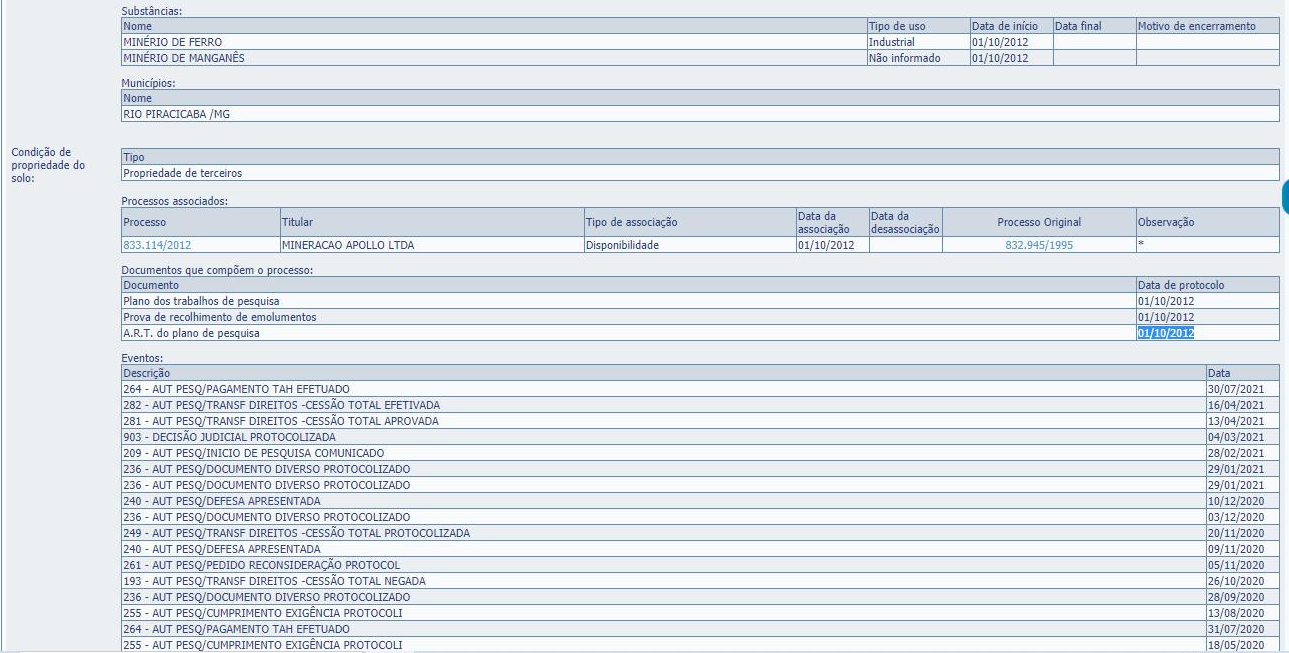
Figure 3.3.2-1: Summary of mineral right 833.114/2012, owned by Apollo Resources.

Figure 3.3.2-2: Polygonal of mineral right 833.114/2012, owned by Apollo Resources.
| S-K 1300 Technical Report Summary | |
| Rio Piracicaba Project | Page 18 |
3.4. Legal Status
The research area is within the limits the Exploration Permit No. 12.891 published in the Federal Official Gazette (Diário Oficial da União - DOU) on October 26, 2015, and ANM mineral right No. 833.114/2012 with an area of 259.56 ha, under the ownership of Apollo Resources.
A Partial Research Report (Relatório Parcial de Pesquisa - RPP) was filed on July 25, 2019, having its exploration permit renewed on March 23, 2020, for 2 more years, when a final research report must be submitted to ANM. It would have expired on March 23, 2022, except that because of Covid-19 the timeline for all such filings has been extended for approximately 1½ years.
3.5. Brazilian Mineral Legislation
According to the Brazilian Constitution, the right to explore and exploit mineral resources can only occur with federal authorization or concession and only Brazilian citizens or companies organized under Brazilian law and headquartered in the country may be able to exercise such activities and thus obtain mineral rights.
Additionally, the mineral right in Brazil is governed by the Mining Code and its rules are regulated by the ANM, which is the government agency that controls mining activities throughout the country.
The ANM is “responsible for organizing the administration of mineral resources, the mineral production industry and the distribution, trade and consumption of mineral products” (Art. 3 – Decree N° 9406/2018 - Mining Code Regulation).
3.5.1. The Right of Priority and the Free Area
The Mining Code Regulation states that:
“Art. 7: The interested party whose mineral right application has as its object an area considered free for the intended purpose on the date of the filing of the application at ANM, is assured the right of priority to obtain the mining title, provided that the other requirements established in Decree-Law No. 227 of 1967 - Mining Code, this Decree and related legislation are met.”
“Art. 16 - Authorization for research shall be granted to a Brazilian individual, a company incorporated under Brazilian law with its head office and administration in Brazil or a cooperative, upon application to the ANM, which shall contain the instruction elements in the art. 16 of Decree-Law No. 227 of 1967 - Mining Code and shall comply with the requirements established in a Resolution issued by the ANM.”
3.5.2. Research Authorization
“Art. 20 – The research authorization shall have the title of permit, an extract of which shall be published in the Federal Official Gazette and the contents of which shall be transcribed to the ANM register.”
“Art. 21 - The validity period of the research authorization shall not be shorter than one year, nor longer than three years, at the discretion of the ANM, taking into account the special characteristics of the area and the mineral research objectivated, a single extension being allowed under the following conditions:
I - The extension may be granted for up to the same period, based on the evaluation of the development of the works; and
| S-K 1300 Technical Report Summary | |
| Rio Piracicaba Project | Page 19 |
II - The extension must be requested up to sixty days before the term of the authorization in effect expires and the request must be accompanied by a report on the work carried out and justification for continuing with the research.
§ 1° The extension shall not depend on the issuance of a new permission and its term shall be counted from the date of publication of the decision that grants it in the Federal Official Gazette*.
§ 2° More than one extension of the period of the research authorization is allowed exclusively in the cases of impediment of access to the research area or lack of consent or license from the competent environmental agency, provided that the holder demonstrates, by means of supporting documents, that:
I - complied with the steps and notifications made in the course of the judicial evaluation process or determined by the competent environmental agency, according to the hypothesis; and
II - failed to contribute, by action or omission, to the failure to enter the area or issue the consent or environmental license.
§ 3° Until there is a decision on the application to extend the deadline presented in a timely manner, the research authorization will remain valid.”
“Art. 24 - The extraction of mineral substances is admitted, exceptionally, in an area titled before the granting of the mining concession, by means of previous authorization by ANM, observing the pertinent environmental legislation.
Sole paragraph. The authorization referred to in the caput will be issued once, for a period of one to three years, with an extension for up to the same period, according to the particularities of the mineral substance, under the terms of a Resolution of ANM.
(*) Federal Official Gazette: The official journal of the federal government of Brazil (Diário Oficial da União - DOU).
3.5.3. Exploration Permit
The research is part of the Mineral Exploration Authorization Regime in which the works intended for the definition of the deposit, its evaluation, and the determination of the feasibility of its economic exploitation are performed. The exploration authorization phase precedes the mining concession phase.
According to the Mining Code, mineral research includes, among others, the following field and laboratory work: detailed geological research of the area to be investigated, on a convenient scale; studies of outcrops and their correlations; geophysical and geochemical research; opening of visitable excavations and execution of drillings in the ore body; systematic sampling; physical and chemical assays of the samples and drill cores; and tests for processing the ores or useful mineral substances, to obtain concentrates in accordance with market specifications or for industrial use.
The authorizing tenure is the Exploration Permit, granted by the ANM Director General and published in the Federal Official Gazette (Diário Oficial da União - DOU). The period to carry out the research will be 2 or 3 years, depending on the special characteristics of the area’s location and the nature of the mineral substance.
The maximum areas granted vary from 50 to 2,000 hectares, depending on the mineral substance and its use. Only in the legal Amazon, whose area is considered difficult to access, that the maximum area is 10,000 hectares. Substances classified as monopoly (oil, gas and radioactive elements, such as uranium) cannot be applied for at ANM.
Under this regime the applicant does not need to be the owner of the land, but to have his authorization to enter the property and comply with the research plan established in the application.
| S-K 1300 Technical Report Summary | |
| Rio Piracicaba Project | Page 20 |
3.5.4. Final Research Report
“Art. 25 - Upon conclusion of the work, the titleholder shall submit to the ANM a final report of the research work carried out, in accordance with the provisions of an ANM Resolution.
§ 1° The title holder of an authorization is obliged to present, within the period of its validity, a final report of the work carried out regardless of the result of the research.
§ 2° The minimum content and guidelines for the preparation of the final report shall be defined in an ANM Resolution, in accordance with international best practices.
§ 3° If, at the end of the period of validity of the authorization or its extension, the holder fails to submit the report referred to in this article, the transcript of the research authorization will be discharged and the area declared available for research, as provided for in art. 26 of Decree-Law No. 227 of 1967 - Mining Code, without prejudice to the provisions of art. 55 of this Decree.”
Art. 26 - Once the research is executed and the final report referred to in Art. 25 is presented, the ANM shall verify its accuracy and, in view of a conclusive opinion, shall issue an order of:
I - Approval of the report, when the existence of a technically and economically usable deposit is demonstrated.
II - non-approval of the report, when the insufficiency of the research work or technical deficiency in its elaboration is verified, which makes it impossible to evaluate the deposit.
III - filing of the report, when the inexistence of a deposit that is technically and economically usable is proven, and the area becomes free for future application; or
IV - suspension of the decision on the report, when it is characterized as an impossibility of sensibility of the technical and economic feasibility of the mining, according to the provisions of art. 23, caput, item III, of Decree-Law No. 227, of 1967 - Mining Code.
§ 1° The ANM will establish, in a Resolution, the criteria and procedures for verifying the accuracy of the final research report, including the hypotheses in which the on-site inspection will be waived.
§ 2° In the case provided for in item II of the caput, verified the technical deficiency in the preparation of the report, the ANM may require a form to be fulfilled by the titleholder of the mineral right within a period of sixty days, extendable for an equal period, at the discretion of the ANM, from that the application for extension is justified and presented within the period granted to comply with the requirement.
§ 3° Once the period has expired without the application having complied with the requirement referred to in § 2°, the ANM must deny approval of the final report and declare the area available, as provided for in art. 26 of Decree-Law No. 227 of 1967 - Mining Code.
§ 4° In the event provided for in item IV of the caput, the ANM shall establish, in the act of suspension, a period for the interest to present a new study of the technical-economic feasibility of the mining, under penalty of filing the report.
§ 5° If the new study referred to in § 4° proves the technical-economic feasibility of the mine, the ANM will issue an order approving the report.”
3.5.5. Maintenance of the Mineral Right
In order to maintain valid exploration permits, the holder must:
| | ● | communicate the start of the research work (or exploration work) |
| S-K 1300 Technical Report Summary | |
| Rio Piracicaba Project | Page 21 |
| ● | pay the annual fee per hectare (TAH) each year to ANM until the end of the permit’s validity. The TAH is due in the amount of (i) R$3.70/ha during the original permit´s term and (ii) R$5.56/ha during the permit extension term. Note that the costs per hectare are in Brazilian reais (the adjustment of the value is annual, determined by resolution). |
| | | |
| | ● | pay for the expenses incurred by the ANM during inspections of the research areas. |
| | | |
| | ● | submit a report (partial and/or final) of the research work before the expiration date. |
3.6. Environmental Liabilities and Permitting
See item 20 of this report.
3.7. Other Significant Factors and Risks
There are no other risks or significant factors known at this time that may affect access, title, or the right or ability to form work on the Project.
4. Accessibility, Climate, Local Resources, Infrastructure and Physiography
4.1. Accessibility
The access from Belo Horizonte city, capital of Minas Gerais state, can be made by road through BR-381, until the intersection of Bela Vista de Minas city, from which it follows through MG-123, until Rio Piracicaba city, totalizing about 130 km of travel (Figure 4.1-1).
There is a railway line that passes within the limits of the mineral right, used by the mining company Vale to transport its iron ore to the coast.

Figure 3.5.5-1: Access roads to Rio Piracicaba city from Belo Horizonte city
| S-K 1300 Technical Report Summary | |
| Rio Piracicaba Project | Page 22 |
4.2. Climate
According to Köppen’s climate classification, part of the area has Cwa climate characteristics (humid, subtropical), while the higher regions have Cwb type characteristics (dry savannah). However, it is worth mentioning that, for Belo Horizonte and surroundings, due to anthropic actions and environmental changes, today’s climate is of the Aw or tropical type.
The local temperature variability of the region can be considered low as can be seen by the thermal amplitude values that vary from 5.3°C (average temperature), 5.1°C (minimum temperature) and 6°C (maximum temperature). This behavior reflects the tropical nature of the local climate, even though a significant seasonal variation is verified.
The highest average maximum temperatures throughout the year are recorded in the January-February-March quarter, with temperatures of 27.6°C, 28.2°C and 27.9°C, respectively. The lowest average minimum temperatures throughout the year are recorded in the winter months of June, July and August, with temperatures of 13.3°C, 12.3°C and 13.5°C, respectively. The absolute maximum temperatures usually occur in the months of February and March, with records higher than 27.9°C. These temperatures occur in the summer, a period that typically presents higher temperatures. The absolute minimum temperatures occur in the months of June to September, with records lower than 13°C.
Regarding precipitation, the average total rainfall throughout the year for the region is 1,265.6 mm, which in turn is marked by a large inter-annual variation (one dry and one rainy period) with a monthly average of 105.5 mm. The rainiest months extend from October to March. The months of June through August, in turn, are months marked by the dry season in the region. However, due to the atmospheric dynamics and the action of various elements interacting and altering this dynamic, both the dry and rainy seasons can suffer intra and inter-annual variations.
The months of the November-December-January quarter present the highest precipitation in the period, a total of 703.7 mm. On the other hand, in the June-July-August quarter, due to low convective activity, the values do not exceed 38.6 mm in total, as the region is under the action of the South Atlantic Anticyclone, inducing a characteristic dry period.
4.3. Physiography
Three large geomorphological domains can be observed in the region, which were denominated Peripheral Depression of the São Francisco, Iron Quadrilateral and the Mountains, Levels and Espinhaço scarps.
Part of the area is framed morphologically in the São Francisco Depression, with tabular hills and karstic modeling in the domains of the Bambuí Group. Further north in the Project region, there are areas of high topography (up to 1,300m) that characterize the Iron Quadrangle, with dissections and erosive scarps. At the eastern limit occur the high modeled surfaces of the Espinhaço with erosive scarps, as shown on Figure 4.3-1.
Geomorphologically, two main domains occur: zones of hills and flattened surfaces.
The first unit corresponds to the relief forms sculpted in the granite-gneiss rocks, constituting hills with flattened or not tops, hills with into valleys and sparse ridges and, finally, hills with ravined slopes and inserted valleys resulting from the pediplanation of the Velhas Cycle (Upper Tertiary to Pleistocene).
The second unit corresponds to the relief forms sculpted in rocks of the Bambuí Group, corresponding to the hills with ravinated slopes and fitted valleys in the Jaboticatubas region, occurring to the south wavy surfaces in depressions (karstic), hills with fitted valleys or, still, hills with flattened tops from the South American Cycle (Lower Tertiary).
| S-K 1300 Technical Report Summary | |
| Rio Piracicaba Project | Page 23 |
The geomorphological unit of the Iron Quadrangle corresponds to the shapes carved in the rocks of the Minas and Rio das Velhas supergroups, which are the top of the Curral mountain range and ridges with ravinated slopes and fitted valleys, besides the planed surfaces with peaks in the Cambotas mountain range. The top of the Curral mountain range, where it is above 1,000 m, is attributed to the Post-Gondwana Cycle, while most of the area with dissected surfaces corresponds to the Velhas Cycle.
The Mountains, Levels and Espinhaço scarps unit corresponds to the shapes carved in rocks of the Macaúbas Group and Espinhaço Supergroup, with altitudes of up to 1,400 m. The dominant forms correspond to ridges with ravined slopes and embedded valleys, and locally occur flattened surfaces with sporadic ridges and pontoons.
To the west occur the foothills of Cordilheira do Espinhaço, which is separated from the mountain ranges that constitute the Iron Quadrangle by a depression formed by hills of a more or less rounded type, discretely oriented in a north-northeast direction, interspersed by drainages fitted in V-shaped valleys.
To the northeast, following the structured direction of the Iron Quadrangle, the predominant relief is of the “sea of hills” type with accentuated slopes and flat bottom valleys (U-shaped profile).
In summary, the geomorphological structuring of the region is conditioned to the geological substratum. The property of interest is inserted in a region, which in its great part is supported by a sequence of itabirite rocks in altitudes that reach around 1,500 m in the crests of the mountains.
This surface, partly flattened or slightly undulated, corresponds to the planning surface defined by King (1956) as the post-Gondwana Surface. The surrounding, lower areas correspond to portions of the terrain underlain by less competent and more friable lithologies, such as dolomitic rocks to the north and pelitic rocks to the south. These areas have an accentuated to abrupt topographic step in relation to the one dominated by itabirites (leveled around 1000 m). Such surface would be inserted in the compartment called South American Surface, which, as well as the former, would constitute remnants of a wider regional context.
The surrounding areas are leveled off at a lower altitude and juvenile surface, known as the Velhas Surface. This compartment is characterized by an accentuated fit of drainages and constant retreat promoted by erosion.
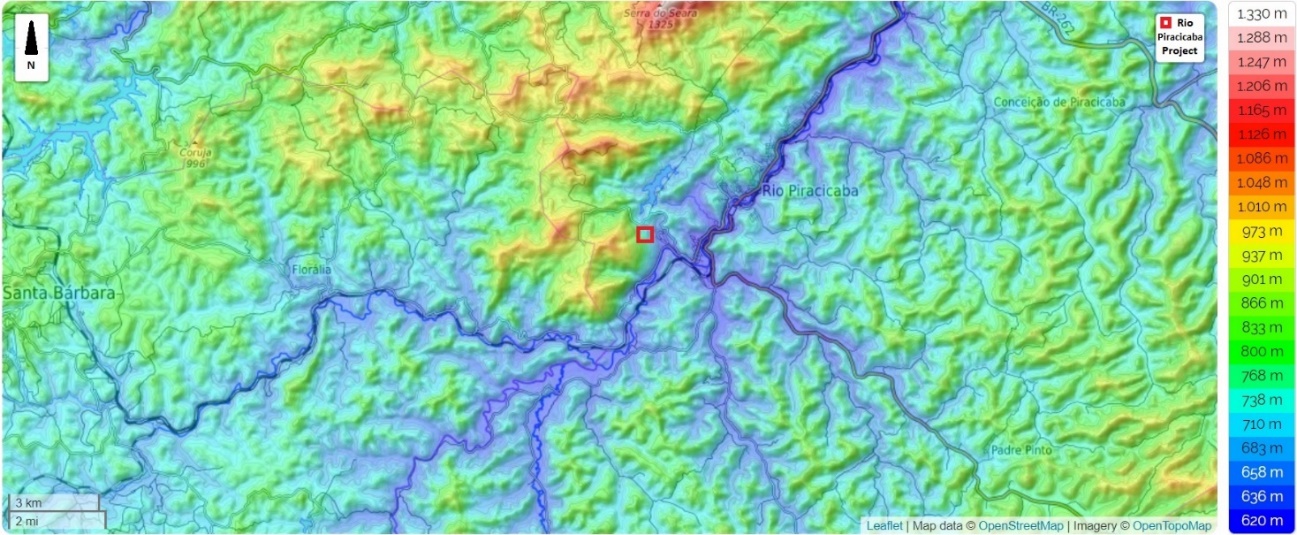
Figure 3.5.5-1: Topography map of the Rio Piracicaba Project region
| S-K 1300 Technical Report Summary | |
| Rio Piracicaba Project | Page 24 |
The existing soil types in the area are completely conditioned to the lithological compartments present. The predominance of an unstable geodynamic environment has favored the formation of poorly developed soils associated with shallow levels of surface alteration of the recurrent lithologies and exposure of rock outcroppings. In the highest parts the vegetation characteristics are cerrado and campo.
Due to lithostructural and topographic factors, there is the presence of dystrophic cambisols, red-yellowish dystrophic latosols and red-yellowish dystrophic or eutrophic podzolic soils. In the higher regions there is an association of cambisols and lithosols.
Thus, the soils characterized in the area surrounding the Project are as follows (IBRAM, 2003):
| | ● | Red Ferriferous Latosol: these are soils with latsolic B horizon and high iron content (above 36%). These soils are associated with the outcropping areas of the Itabiritic sequences and in their lower areas with accumulation of sediments (detrital soils). |
| | | |
| | ● | Goethitic Laterite Coverages: associated to the transition areas between the itabiritic and dolomitic units there is a laterite covering composed essentially of goethitic material. These coverages occur in situ covering altered/hydrothermal rocks of ochre color. This material is possibly associated with the intemperate alteration of this subsequent lithology, where the variation of the water table promoted the intense lateritization of the coverages. |
The vegetation presents residual portions of tropical subcaducifolia forest, which represent remnants of the mighty forest whose destruction was initiated in the XVIII century due to human occupation. In the median NW region of the region, the vegetation presents characteristics of cerrado, while most of it falls into the field characteristics, due to anthropic actions, occurring strips of subperenifolia forest.
The explored region is north of the Piracicaba River, which flows only about 100 m from the mineral right, belonging then to its Sub-basin subordinated to the Rio Doce Basin (Figure 4.3-2).
The Rio Doce Basin is a Brazilian hydrographic basin located in the Southeast Region of the country. It belongs to the Southeast Atlantic hydrographical region and comprises a drainage area of 83,400 km², of which 86% belongs to the state of Minas Gerais, in the so-called Rio Doce Valley, and 14% to the state of Espirito Santo, reaching 222 counties.
The headwaters of the Doce river are in Minas Gerais, in the Mantiqueira and Espinhaço Mountains, and its waters travel 853 km until reaching the Atlantic Ocean in the town of Regência, in Espirito Santo.
The main affluents of the Doce river are the Carmo, Piracicaba, Santo Antônio, Corrente Grande, Suaçuí Pequeno, Suaçuí Grande, São José and Pancas rivers (left margin); Casca, Matipó, Caratinga/Cuieté, Manhuaçu, Guandu and Santa Joana rivers (right margin).
The average flows in the basin are higher in the affluents of the left margin, in the high and medium sections (15 to 35 L/s.km²). On the other hand, the region with the lowest average specific outflows (5 to 10 l/s.km²) corresponds to the Suaçuí Grande basin.
| S-K 1300 Technical Report Summary | |
| Rio Piracicaba Project | Page 25 |
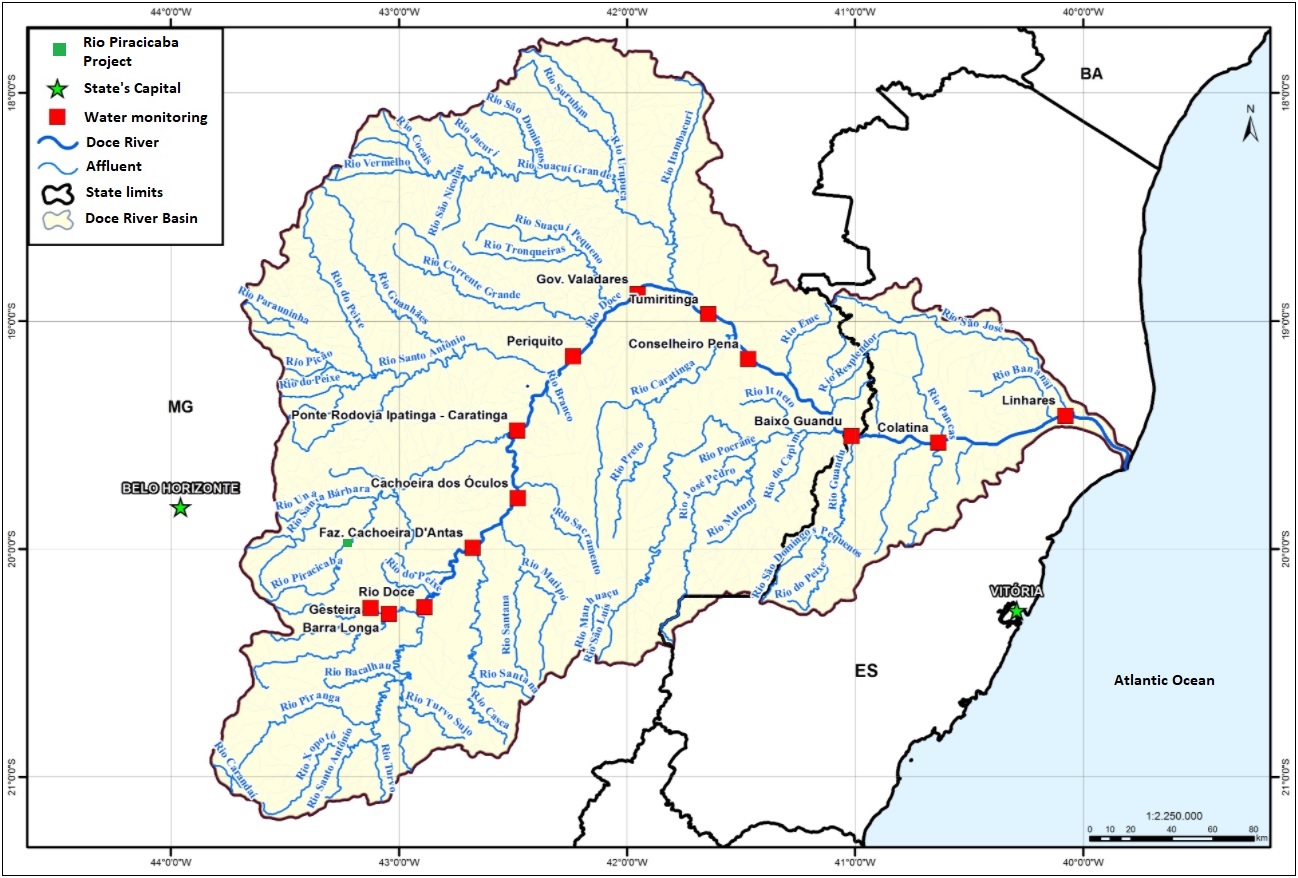
Figure 3.5.5-2: Map of the Rio Doce Basin
4.4. Local Resources and Infrastructure
The Rio Piracicaba city has an estimated population of 14,332 inhabitants, with a demographic density of 37.93 inhabitants per km². It has a GDP per capita of US$6,542.19, and an HDI of 0.685. The city has 6 SUS health facilities (IBGE, 2020).
The region’s economy is mainly driven by iron ore mining, concentrated in the Barão de Cocais, Rio Piracicaba, João Monlevade, and Itabira regions, and gold mining in the Santa Bárbara region.
Some of the biggest Brazilian iron ore deposits (excluding Carajás) are located regionally and are being explored by large mining companies such as Vale and SAMITRI (now part of Vale), besides other smaller ones.
The iron ore extracted in the region is loaded at the rail loop called “Pera Ferroviária de Bicas”, and then taken by train to the port of Tubarão, in the state of Espírito Santo, from where it is exported. The Vitória-Minas Railroad (Figure 4.4-1), crosses and serves the city, and is also the only one to offer passenger train services that are still running daily. The railroad station is located on the main avenue of the city a few meters from the bus station. The Rio Piracicaba Project region also has an expressive highway network, which links the large industrial and mining centers.
The mineral vocation of Minas Gerais propitiated the development of an industrial park, strongly based on the steel industry, where large companies stand out among the largest national producers.
The region is also home to emerald and alexandrite exploration properties and mines.
As a secondary activity, reforestation is developed for charcoal production, in addition to subsistence agriculture and dairy farming.
Civil construction is a great consumer of materials such as gravel, coming from gneiss or limestone quarries, and sand coming from the alluvial deposits and terraces of the local rivers.
| S-K 1300 Technical Report Summary | |
| Rio Piracicaba Project | Page 26 |
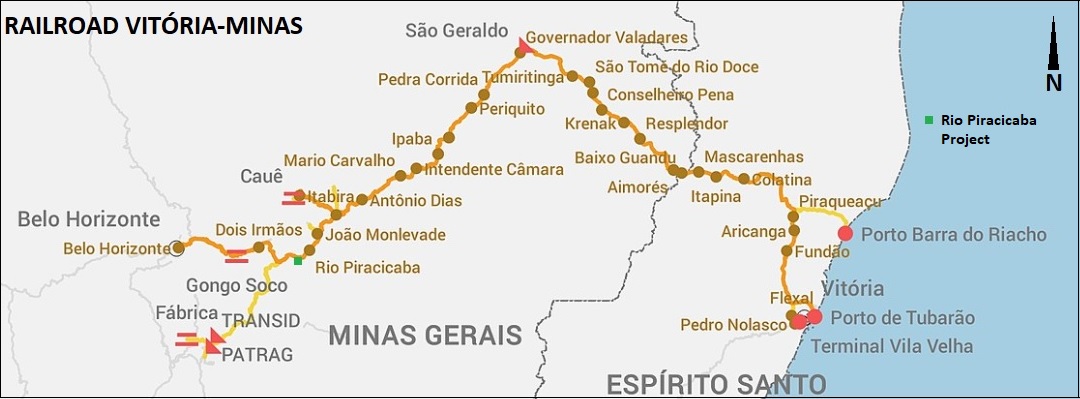
Figure 3.5.5-1: Vitória-Minas Railroad, responsible for taking iron ore shipments from the Rio Piracicaba Project region to the Tubarão port
5. History
Apollo Resources is 100% owner of the exploration permit for mineral right 833.114/2012 and declares that it is not aware of previous exploration work carried out in the area presented in this report.
The information described below in this item do not refers to work conducted inside the current property boundaries.
5.1. Geological Exploration and Research History
5.1.1. History of Mining in the region
During the late 17th century until the mid-18th century, the mining economy was in full swing, driven mainly by the extraction of gold and other minerals in the province of Minas Gerais, which also caused important social transformations. What was until then a little inhabited and unknown portion of the Brazilian territory, started to receive noblemen interested in its newly discovered precious metals and a large contingent of slave labor to work the gold, especially in the region that encompasses the cities of Ouro Preto and Mariana. A large number of prospectors, merchants and entire families also came to the entire Iron Quadrangle, in search of a better quality of life.
The province of Minas Gerais was then responsible for most of the gold production in Brazil, establishing itself as the hub of Brazilian mining at that time and as an important political and administrative region. The existence of a large amount of mineral wealth strengthened the ties between the Portuguese Crown and the Colony, and it was of significant importance to establish a capital for the province, which came about with the choice of Vila Rica (now Ouro Preto) in 1720 for such a function. From then on, the control and management of the auriferous production began to consolidate, guaranteeing for centuries the sovereignty of the Portuguese Empire over the Colony.
In the colonial period, the configuration of the mining cities differed from the reality of life on the sugar cane and coffee plantations, structured to meet the demands and needs of their inhabitants, both in the big house and the slave quarters. In the midst of the urbanized centers that were beginning to emerge, blacks and whites, free or not, lived together in search of the riches that were prominent in the lands of Minas Gerais. The enslaved individuals, even subordinated to their masters, saw in mining the possibility of achieving more than wealth, freedom itself. This could come through the loss of gold or through escape, made easier by the fact that they were not under their master’s supervision at all times.
| S-K 1300 Technical Report Summary | |
| Rio Piracicaba Project | Page 27 |
The Monlevade and Rio Piracicaba quadrangles are known for containing two large iron ore deposits and several smaller ones, as well as a small manganese deposit and numerous prospects for manganese. Other valuable mineral resources include alluvial deposits of gold, mica, semi-precious stones, building stones and clay.
During this study, from 1957 to 1959, only the Andrade, the largest of the known iron ore deposits, was being mined; the other deposits, although known for many years, were idle. The Água Limpa Manganese deposit was being mined, and several of the smaller manganese occurrences were being prospected. Mica was being produced from the Pé de Serra pegmatite mine, and the Talho Aberto pegmatite mine was operating intermittently for semi-precious stones, mainly phenacite and amazonite.
Three quarries were operated for stone and road metal construction, and several clay deposits were being worked to provide raw material for bricks and tiles. Sand and gravel were obtained as needed along the main rivers, but no organized or sustained operations were observed.
In the context of the Iron Quadrangle, iron ore can be singled out as the successor to gold in the process of mineral exploration. After the gold rush of the 18th century, with its full steam extraction, the 19th century was marked by the decadence of such extraction process in Brazil. The exploration of iron ore happened lately, since it was already known that this mineral existed in Brazilian lands, as it is possible to conclude from what Silva (1995) writes.
Most of the currently commercial iron ore deposits of the Iron Quadrangle are high grade hematite bodies associated with and formed from itabirite; “canga” was formerly an important ore, and a small amount is still used locally. Debris ore consisting of rocks and (or) fragments of high-grade hematite is used domestically and is exported. All known deposits are related to the Cauê Itabirite; none are known to have formed from the itabirite of the Monlevade Gneiss or the Elefante Formation. In addition to the hematite and “canga” deposits, itabirite, especially that disaggregated by weathering and thus easily concentrated, can be considered a potential source of iron ore.
Nevertheless, among the possible shortage of metals to be mined, studies on the country’s iron ore reserves advanced, even though more investments were needed to develop technologies to beneficiate and mine this ore.
Thus, mainly in what refers to the beginning of the 20th century, we move on to a new period, a new moment for the Minas Gerais economy based on mineral extraction: the steel cycle. About this period that extends until today, Silva (1995) also exposes in his text “Mining in Minas Gerais: past, present and future”: “However, it was exactly in this historical period (First Republic) that the economic world became aware of the large reserves of iron ore existing in the heart of the state of Minas Gerais”.
With the development of technology, brought by North Americans interested in the large deposits existing in Brazilian soil, the extraction of iron ore became more intense and took place in increasingly large pits, especially from the 20th century on. Large open-pit mines were spreading throughout the cities of the Iron Quadrangle, bringing with them the “development” and also the impacts to their populations and environment. Rio Piracicaba - MG is among the cities that had in its history the discovery of gold as the beginning of its formation and engine of the local economy, and after the decline of this activity, it started to have as its economic base the exploitation of iron ore existing in its lands.
5.1.2. Implementation of mining undertakings in Rio Piracicaba – MG
S/A Mineração da Trindade - Samitri was a private company, which was founded in 1939 with its headquarters in Belo Horizonte, having mines in various regions of Minas Gerais state, but started its mining activities in Rio Piracicaba in the year 1961. In 1952, the Companhia Siderúrgica Belgo-Mineira bought Samitri and became the company’s main shareholder. Starting in 1963, it began producing rich ores, placing Samitri among the main iron ore exporting companies operating in Brazil. (SAMITRI, 2015).
| S-K 1300 Technical Report Summary | |
| Rio Piracicaba Project | Page 28 |
The first mine to be opened in Rio Piracicaba was the Morro Agudo mine, from which ore is still extracted today, by Vale. In the city are still in operation to this day besides Morro Agudo, the Água Limpa and Cururu mines. It is important to note that the Água Limpa complex, as the set of three mines located in the geographical coordinates latitude 19º 56’ 49.4” and longitude 43º 14’ 37.5”, is located partly in Rio Piracicaba - MG (SAMITRI, 2015), having as bordering communities in its territory the Bicas neighborhood, Santa Isabel neighborhood, Louis Ensch neighborhood - where the entrance gate to the mining area is located - and the rural area called Morro Agudo. Another part of the mining area is already inserted in Santa Barbara city, more specifically half of the Água Limpa mine, covering part of the rural community of Florália.
Still in the 60’s, Samitri, together with another mining company, Companhia de Mineração de Ferro e Carvão Ferteco (Ferteco), signed a contract with Companhia Vale do Rio Doce (CVRD), for the disposal of the ore produced by the two companies, by means of the Vitória-Minas railway to the port of Tubarão, in Vitória - ES, to be sent abroad, that can be seen on Figure 5.1.2-1. “The contract provided for the export of four million tons/year to Belgium, Luxembourg, and the Saarland region (belonging to West Germany).” (VALE, 2012). From such an agreement with the two companies that already had major contacts with foreign steelmakers, CVRD also hoped to achieve visibility for the foreign market.
In addition, such move would also make CVRD expand its railroad network to have access to the Rio Piracicaba region, which already had in its surroundings the stations of Costa Lacerda, in Santa Bárbara - MG and Desembargador Drummond in Nova Era - MG, of the Vitória-Minas line. The connection between Rio Piracicaba and these stations was made from a branch of the Estrada de Ferro Central do Brasil, which became controlled by CVRD in 1961.

Figure 5.1.2-1: Samitri Mines on the Iron Quadrangle Map
With the coming of the company to Rio Piracicaba, many workers from cities in the region came to explore the iron ore. To accommodate the new residents coming to the city, the Samitri Village was built, as depicted in Figure 5.1.1-2.
| S-K 1300 Technical Report Summary | |
| Rio Piracicaba Project | Page 29 |
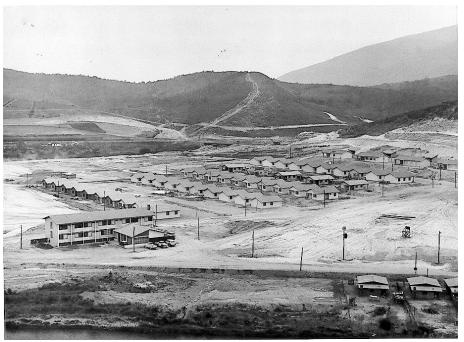
Figure 5.1.2-2: The Samitri Village
In May of 2000, CVRD began to control Samitri’s activities, after obtaining 79.27% of the voting capital of the company for R$971 million, which was previously held by Companhia Siderúrgica Belgo-Mineira. At the same time CVRD also owned 51% of Samarco Mineração and the capacity to produce 17.5 million tons of iron ore per year.
To boost its expansion CVRD also acquired 63.06% of the total capital of the Belgo-Mineira Group, since the latter decided to invest only in the steel sector, selling all its mining areas. Samarco was also acquired in this same transaction, since it was previously controlled by Samitri. (VALE, 2012).
5.1.3. Importance of Iron Ore to the Region
Iron ore is of crucial importance to the historical development of the state of Minas Gerais. It is one of the most important mineral assets for the industrial development of the nation, since it is an essential part of the steel industry, where worldwide about 98% of all extracted iron ore is used, the rest being used in ferroalloy and cement industries.
Rio Piracicaba is geologically inserted in an area called Iron Quadrangle. The region is rich in iron ore, which places the extraction of this ore as the dominant economic activity in the city, with Vale as the main company in the segment, operating the Água Limpa Mine, and also responsible for the Vitória-Minas Railroad.
Iron ore is the most important mineral commodity in Brazil exports. Since the year 2000, exports have increased by more than 100%. The value of exports reached 17.7 billion dollars in 2017.
6. Geological Setting, Mineralization and Deposit
6.1. Regional Geology
The area of insertion of the Project is the metallogenetic province (set of rocks with the same genetic characteristics) of the Iron Quadrangle (IQ), southwest region of the State of Minas Gerais. Its contour, on a map, is approximately that of a four-sided polygon, covering an area of approximately 7,000 km². Furthermore, it is inserted in the geotectonic context of the Meridional Sector of the São Francisco Craton (western portion of the IQ) and of the southern portion of the Araçuaí Belt (east of the IQ) (Figure 6.1-1).
| S-K 1300 Technical Report Summary | |
| Rio Piracicaba Project | Page 30 |
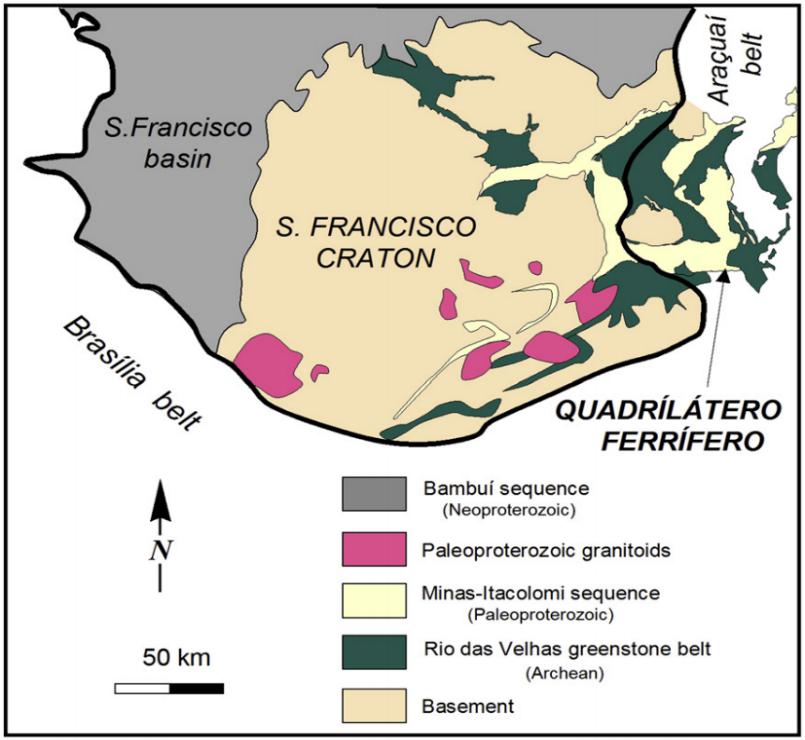
Figure 5.1.3-1: Geological map of the Iron Quadrangle (modified from Alkmim&Marshak, 1998)
The great advance in the geological knowledge of the Iron Quadrangle is due to the project of systematic geological mapping, carried out from 1946 onwards, provided by the agreement between the National Department of Mineral Production (DNPM, current ANM – Mining National Agency) and the United States Geological Survey (USGS). As a result, base maps of great precision were obtained and the final collection consisted of the publication of forty-three geological plots in the scale 1:25,000 - compiled in the work of Dorr (1969) - most of them with detailed reports and in which the large iron ore deposits were mapped and several other mineral deposits (Au, Mn, etc.) were inventoried.
From this pioneer-modern work by Dorr (1969), the geological knowledge of the IQ grew substantially, due to the re-evaluation of the local geological patrimony, reformulation of the stratigraphic column, introduction of new structural concepts, of geotectonic behavior, as well as studies of sedimentary origin (Marshak & Alkmim, 1989; Alkmim & Marshak, 1998; Ladeira 1998; Alkmim & Noce, 2006) (Figure 6.1-2). Among these reformulations, the most relevant are those proposed by Schorscher (1978), of stratigraphic character, and those of Ladeira (1980 and 1985), more specifically, substantiated in the stratigraphic column proposed in 1980.
| S-K 1300 Technical Report Summary | |
| Rio Piracicaba Project | Page 31 |
According to Alkmim & Marshak (1998), the Precambrian rocks of the Iron Quadrangle can be individualized according to main lithostratigraphic units, as follows:
| | ● | Phanerozoic sedimentary coverages. |
| | | |
| | ● | Post-Itacolomi intrusions. |
| | | |
| | ● | The Supergroup Minas and the Itacolomi Group, constituted by Paleoproterozoic age metasediments. |
| | | |
| | ● | The Rio das Velhas Supergroup, formed by volcano-sedimentary sequences of the Greenstone Belt type. |
| | | |
| | ● | Archean Basement. |
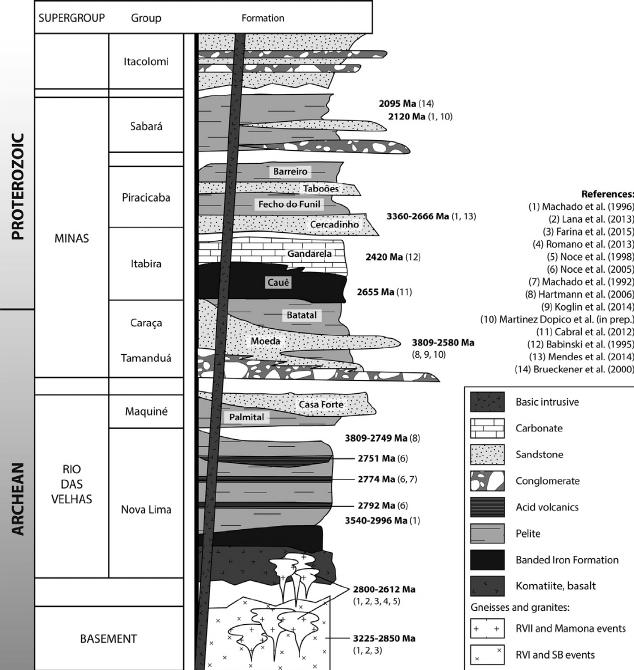
Figure 5.1.3-2: Stratigraphic column of the Iron Quadrangle.
| S-K 1300 Technical Report Summary | |
| Rio Piracicaba Project | Page 32 |
At the end of the Archean (~2600 Ma), the taphrogenetic event that originated the Minas basin (Minas Rift) began, followed by the deposition of the Minas Supergroup itself (Alkmim & Martins-Neto, 2012) in the Paleoproterozoic (2580 to 2100 Ma). In the final stages of deposition of the Paleoproterozoic Supergroup and during the sedimentation of the Itacolomi (more specifically during the sedimentation of the Sabará and Itacolomi Groups), there was the collision between the São Francisco and Congo proto cratons. This collision consists of the Transamazonic Orogenetic event (or the Minas Acrescionary Orogen, in the recent literature - Teixeira et al. 2015; Farina et al., 2016). This orogenetic event (~ 2050 Ma) is responsible for the deformation of the previous rocks and subsequent initial formation of the synformal and antiform mega-structures of the IQ (e.g., Moeda Syncline, Dom Bosco Syncline, Gandarela Syncline) (Alkmim & Marshak, 1998; Cutts et al., 2019).
At the end of the Paleoproterozoic (Estherian, ~ 1700 Ma), the Espinhaço rift was responsible for the injection of mafic dikes into the Quadrangle, as the result of a distensive stress field from the collapse of the previous orogen (Transamazonian).
In the Neoproterozoic, a second orogenic event occurred, responsible for a westward-vergent thrust belt, deforming, and reworking the previous structures in the IQ. This event, known as the Brasiliana Orogeny, is the same that originated the Araçuaí Belt and is also responsible for the fusion of Gondwana (Alkmim & Marshak, 1998).
6.1.1. Minas Supergroup
In the area of this research, the rocks of the Minas Supergroup (Paleoproterozoic) occur in general, which is subdivided, from bottom to top in 4 Groups: Caraça, Itabira, Piracicaba and Sabará. It is worth mentioning that Cenozoic units of alluvial, colluvial and lateritic deposits also occur with certain frequency. A summary (Gonçalves, 2020) of the main lithofacies of its stratigraphic units follows:
Caraça Group
The Caraça Group, basal unit of the Sg. Minas in erosional/tectonic contact with the Sg. Rio das Velhas is composed by the Moeda and Batatal Formations. The first Formation has predominantly two lithofacies, the first being thicker and coarse-grained, with frequent conglomeratic lenses and subordinate pelitic lenses. The second facies of the Moeda Formation have an abrupt contact with the first and corresponds to a relatively more homogeneous package of clay and quartz materials, without conglomeratic lenses. The sedimentary setting for this Formation is continental to transitional, with Dorr II (1969) classifying it as deltaic and Renger et al. (1994) classifying it as alluvial to fluvial fans. Batatal Formation, mostly pelitic and quartz-free, already represents a deposition in a shallow marine transgressive environment in abrupt contact with the Moeda Formation (Dorr, 1969; Alkmim & Martins-Neto, 2012).
Itabira Group
The Itabira Group, composed of the Cauê and Gandarela Formations, both in abrupt contact with each other and with the underlying Group, is predominantly composed of itabirites in the basal unit, and of carbonate rocks, phyllites and subordinate banded iron formations in the upper unit (all banded iron formations / itabirites are Lake Superior kind). The sedimentary environment of these rocks is marine platform (passive margin), which also explains the large area extension of this Group (Dorr, 1969; Rosière & Chemale Jr., 2000).
Piracicaba Group
The Piracicaba Group is subdivided in the Cercadinho, Fecho do Funil, Taboões and Barreiro Formations. The Cercadinho Formation has basal contact with the Itabira Group by erosional discordance and comprises thick to thin quartzites, rich in hematite, ferruginous phyllites and subordinate dolomites. In gradual contact, the Fecho do Funil Formation overlaps the Cercadinho Formation and consists of dolomitic phyllites, argillite-quartz dolomites and phyllites. Its contact is also gradual with the overlying Formation (Taboões), which is composed of fine-grained quartzite. In turn, this unit is also in gradual contact with the Piracicaba Group top Formation (i.e., Barreiro). The last one, consists of schists, phyllites and graphitic phyllites. The sedimentary environment of the Piracicaba Group is the same as that of the Itabira Group, i.e., marine platform with tectonic quiescence (Dorr, 1969; Farina et al., 2016).
| S-K 1300 Technical Report Summary | |
| Rio Piracicaba Project | Page 33 |
Sabará Group
The Sabará Group, whose contact with the Piracicaba Group is by erosional discordance, was elevated to this stratigraphic category by Renger et al. (1994). It represents a flysch suite deposited in a eugeosincline environment (related to the Transamazonian Orogen), being composed of schists, grauvaques, subgrauvaques, phyllites, sandstones, tuffs and subordinately by conglomerates, diamictites and itabirites (Dorr, 1969; Almeida et al., 2005).
Plio-Pleistocene sediments (N23ca)
Canga coverages are common and occur in the Gandarela Syncline, in the region of Barão de Cocais, originating from lateritization and/or pedogenesis of the outcropping Iron-rich rocks.
6.2. Local Geology
The area that is the object of the present report is inserted in the Minas Supergroup (Figure 6.2-1), having in its basement the predominance of the Monlevade gneiss, lithological structure considered to be the oldest in this region. The iron-rich formation found in the area is derived from itabirites and hematites of the Cauê Formation (Itabira Group), while the phyllites and quartzites common to the site belong to the Piracicaba Group. There are also pelitic rocks of the Batatal Formation and quartzite rocks of the Moeda Formation, the last two belonging to the Caraça Group. The area is also characterized by itabirite/quartzite ridges surrounded by gneissic domains (IEF, 2011).
| S-K 1300 Technical Report Summary | |
| Rio Piracicaba Project | Page 34 |

Figure 6.1.1-1: Regional geological map of the Iron Quadrangle with emphasis on the focus area of this report. Source: Adapted from Alkmim and Marshak (1998)
Based on the integration of the data obtained in the detailed geological mapping, excavations, drilling and granulochemical analysis it was possible to build a geological map of the Project (Figure 6.2-2).
A large part of the delimited polygonal extension of ANM mineral right No. 833.114/2012 is covered by lithologies of the Cauê and Piracicaba Formation, finding them from east to west, in contact with the quartzites of the Cercadinho Formation. These units, in the deposit, are organized according to an inverted flank structure.
This flank has a general direction N60-70E, dipping SSE with a low angle of less than 30°. (Figure 6.2-2).
| S-K 1300 Technical Report Summary | |
| Rio Piracicaba Project | Page 35 |

Figure 6.1.1-2: Geological Map of the Area
6.3. Typologies of Ferriferous Formations
Based on the descriptive, granulometric and chemical data of the lithotypes intercepted in the drilling and excavations, it was possible to classify the iron formations. Thus, a decision tree was created for classification of the orebody. Table 6.3-1 presents the parameters used for detailed typological and economic classification.
| S-K 1300 Technical Report Summary | |
| Rio Piracicaba Project | Page 36 |
TYPOLOGICAL CLASSIFICATION OF THE RIO PIRACICABA PROJECT
| Lithology | Code | Grain size | Chemical & Minerology | Global Assays | Type |
| | | | | | | |
| Itabirites | IFS | Friable Siliceous Itabirite | 50% < 6.30mm | Siliceous | Fe >= 25% < 58% | Mineralized material |
| ISC | Semi Compact Itabirite | 40% a 50% - 6.30mm | Siliceous | Fe >= 25% < 58% | Mineralized Material |
| IC | Compact Itabirite | 50% > 6.30mm | Siliceous | Fe >= 25% < 58% | waste |
| Manganese | Mn | Manganese | 50% > 6.30mm | | Mn >=30% | Mineralized Material |
| | | | | | | |
| Coverages | CR | Colluvium/rolled Iron mineralized material fragments | Fe >=25% e Al2O3 <-10% | Mineralized Material |
| LT | Laterite, unconsolidated, clayey, magnetic | Fe <=30% e/ou Al2O3>=10% | waste |
| | | | | | | |
| Schist | XI | Friable rock. Medium to coarse foliated. Chlorite/ Sericite | waste | waste |
| Quartzite | QZT | Friable or compact, altered, siliceous rock with Sericite | waste | waste |
Tabela 6.3-1: Parameters for typological classification
The following describes the main rock units identified in the Project.
6.3.1. Colluvium/Rolled – CR
Unconsolidated friable material of reddish and orange coloration formed by fragments of hematite and/or itabirite in the middle of a structureless ferruginous clay matrix. Its fragments can reach up to ten centimeters. It is an iron-poor coverage that varies from 2 to 6 m thick that covers the friable itabirites (Figure 6.3.1-1). This material is highly magnetic.
Its occurrence is exposed in small portions of the area, especially in the SW end of the mineral right area, according to the Geological Map (Figure 6.2-2).
| S-K 1300 Technical Report Summary | |
| Rio Piracicaba Project | Page 37 |

Figure 6.3.1-1: Colluvium / Rolled magnetic unconsolidated material.
This iron mineralized unit presents granular fraction poor in Fe having average contents of 45%, and SIO2 not liberated. The fractions < 6.30mm are more enriched than the friable itabirites. With a quality of these fines ranging from 36 to 42% Fe, they can certainly be blended with the itabirites.
Laterite – LT
Unconsolidated friable material of reddish coloration, clayey and variably magnetic. This cover was generated mainly from the decomposition of friable itabirites and to a lesser extent schist and quartzite. It is an iron-poor covering ranging from 1.10m to 3.45m in thickness that covers the friable itabirites and schists (Figure 6.3.1-2). This coverage was considered sterile.
Its occurrence is exposed in substantial portions of the area, especially in the extreme NW and south center of the researched area, according to the Geological Map – Annex A.

Figure 6.3.1-2: Laterite reddish clayey material – PRP -18 well.
| S-K 1300 Technical Report Summary | |
| Rio Piracicaba Project | Page 38 |
6.3.2. Friable Siliceous Itabirite - IFS
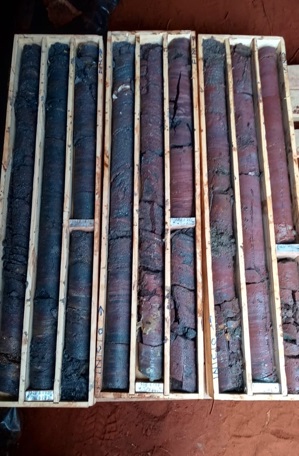
The Friable Siliceous Itabirite – IFS is light gray to whitish, friable compact rocks, disposed in a millimetric banding, compositional, formed by intercalations of dark bands rich in hematite and martite (little magnetic), and light bands containing quartz (Figure 6.3.2-1).
The IFS outcrops or is covered by a thin layer of laterite in the extreme southern and central portion of the surveyed area (Figure 6.2-2). The IFS was intersected in 10 (ten) drillholes and in 7 (seven) test pits. The IFS is up to 30 m thick.
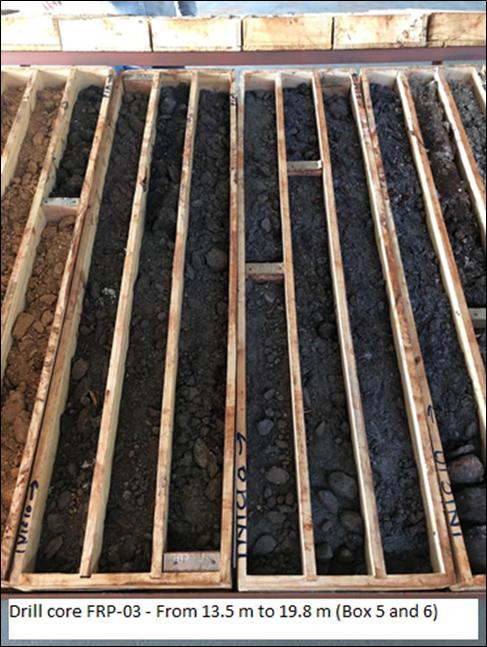
Figure 6.3.2-1: Friable Siliceous Itabirite. Drill core: FRP 03.
| S-K 1300 Technical Report Summary | |
| Rio Piracicaba Project | Page 39 |
The friable siliceous itabirites - IFS were classified as all material that is at least 50% passing 6.30mm and has iron contents greater than or equal to 25% Fe. This criterion may be adjusted in the future due to commercial and production issues, especially involving its processing. Associated and hosted by the FSI, there are lenses of semi-compact hematitic itabirite, semi-compact siliceous itabirites and, more rarely, compact itabirites.
The IFS has a homogeneous granulochemical quality throughout the surveyed area, as shown in Figure 6.3.2-2, where the IFS was intersected in ten of the eleven drill cores. It can be seen that the Fe content is quite constant within the particle size ranges.

Figure 6.3.2-2: Granulochemical distribution of Iron in drill cores samples - IFS.
It is observed that the fraction between 1.00mm and 6.30mm is the most Fe rich fraction and the fraction < 1.00mm even though it is less rich, visually, it is possible to see that SiO2 is liberated.
The only real contaminant is silica (SiO2) and less commonly Alumina (Al2O3), associated with rare clayey passages. This is the main iron mineralization in the area.
Due to these lower contents and the granulochemical characteristics, the friable siliceous itabirites as well as the semi compact itabirites - ISC will need to be wet screened, grinded, and the throughs of approximately 1.0 mm destined for magnetic concentration. This lithology is 100% mineralized material.
The granulo-chemical quality of the friable siliceous itabirites has entered in the database and proven in the certificates of analysis.
6.3.3. Semi-Compact Itabirite - ISC
The semi-compact itabirites - ISC, are light gray to whitish colored rocks, sometimes of compactness, with a transition from friable to compact material, arranged in a millimetric banding, compositional, formed by intercalations of dark bands rich in hematite and martite (little magnetic), and light bands containing quartz. It is similar to the FSI, being a little more resistant (Figure 6.3.3-1).
The ISC outcrops partially or is covered by a thin layer of laterite. (Figure 6.2-2). In addition, the ISC was intersected in 06 drillholes and in 04 wells.
| S-K 1300 Technical Report Summary | |
| Rio Piracicaba Project | Page 40 |

Figure 6.3.3-1: Semi-compact Itabirite outcrop - ISC.
Semi-compact itabirites - ISC were classified as all material that is 40 to 50% passing 6.30mm and has iron contents greater than or equal to 25% Fe. Similar to IFS, these criteria can be adjusted for commercial and production reasons.
Associated and enclosed within the ISC is a lens of semi-compact hematitic itabirite (Figure 6.3.3-2), which is actually a localized enrichment with thicker bands of hematite, but of restricted location.

Figure 6.3.3-2: Centimetric lens of hematite interspersed in the ISC.
| S-K 1300 Technical Report Summary | |
| Rio Piracicaba Project | Page 41 |
Unlike the IFS, the ISC has a less homogeneous granulochemical quality. It can be seen that the Fe content is variable within the particle size ranges. In drill core FRP 04 there is also a slight enrichment in Fe.
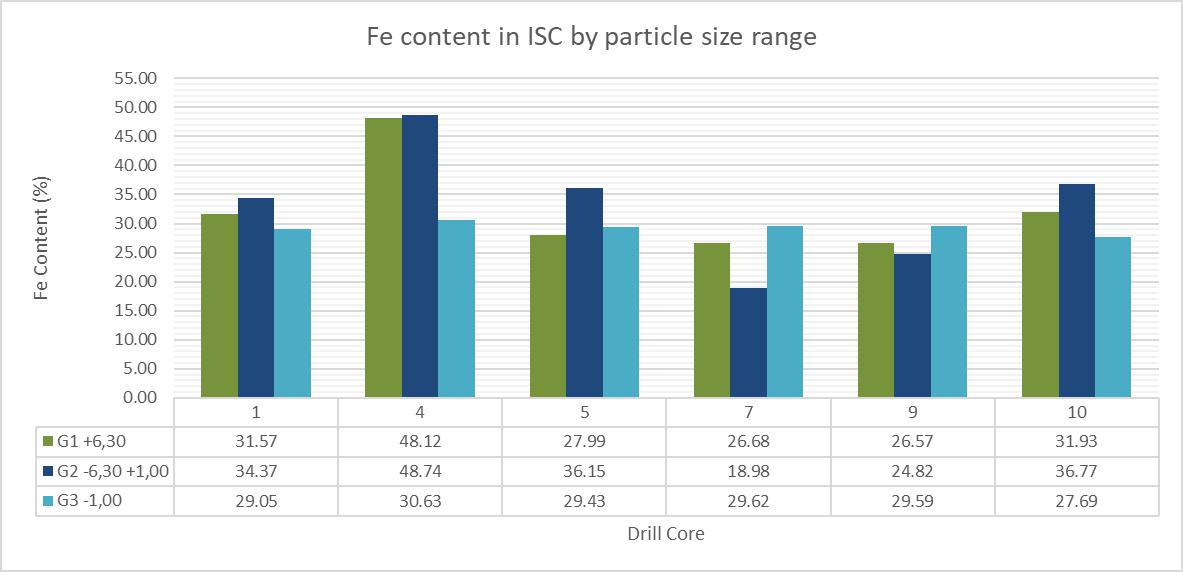
Figure 6.3.3-3: Granulo-chemical distribution of Iron in drill cores - ISC.
The only real contaminant is SiO2 and less commonly Al2O3, associated with rare clay passages.
Due to this lower content and the granulochemical, as seen on Figure 6.3.3-3, characteristics, the semi compact itabirites ISC will need to be wet screened and the 1.00 or 2.00mm through go to magnetic concentration. This lithology is 100% mineralized material.
The granulo-chemical quality of the semi-compact itabirites has entered in the database and proven in the certificates of analysis.
6.3.4. Compact Itabirite - IC
The Compact Itabirites - IC, are light gray metallic rocks, of high compactness, arranged in a millimetric banding, compositional, formed by intercalations of dark bands rich in hematite and martite (little magnetic), and light bands containing quartz.
The IC outcrops in some points of the surveyed area, forming slabs (Figure 6.2-2) or are covered by a thin layer of laterite (Figure 6.3.4-1). Their thickness varies from 1.0 to 5.5m. The CI was intercepted in 05 (five) drillholes and in 03 wells.
The IC was not considered as mineralized material since it needs a grinding process to obtain the necessary liberation grade to concentrate the Iron (Fe).
| S-K 1300 Technical Report Summary | |
| Rio Piracicaba Project | Page 42 |

Figure 6.3.4-1: Compact itabirite outcrop - IC.
6.3.5. Manganese - Mn
These are compact, massive, poorly fractured, dark gray to black rocks. This rock unit was observed in well PRP 15, central portion of the mapped area, extreme SW of the area. It occurs in the form of a metric lens. Contacts are abrupt with the itabirite.
Only 1 (one) channel sample was collected in the pit due to lack of exposures. Drillholes did not intersect this unit. Below is a summary of the Manganese grades.
This is a high Mn content rock and low Fe, SiO2 and Al2O3 content for this type of mineralization. This rock has an average Mn content in the lump size fraction of 35.18% and SiO2 of 5.92%. Because it is compact it generates few fines, on the order of 16%. The quality of these fines is poorer because there is a migration of SiO2 to the < 1.00mm fraction, generating a SiO2 content of 15.82% and Mn content of 26.25%. This product must be crushed and dry screened. The lump fraction generates a direct product, and the fines can be blended with the fines from the itabirites. This lithology is 100% mineralized material.
The granulochemical quality of the manganese mineralized material has entered in the database and proven in the certificates of analysis.
6.3.6. Quartzites - QZT
Quartzites are commonly compact rocks, being composed, besides quartz, of sericite and more rarely of iron contamination (Figure 6.3.6-1). This unit is the base of the sequence of iron formations in the area. It was intersected in all drill cores and its thickness is up to 56m. Sericite phyllite lenses of centimeter thickness occur in the quartzite. Both are associated with the Cercadinho Formation. This unit is 100% waste.
| S-K 1300 Technical Report Summary | |
| Rio Piracicaba Project | Page 43 |

Figure 6.3.6-1: Compact Quartzite.
| S-K 1300 Technical Report Summary | |
| Rio Piracicaba Project | Page 44 |
6.4. Deposit Types
This topic is a compilation of the Program of Basic Geological Surveys of Brazil (PLGB), prepared by the Geological Service of Brazil (CPRM) in the region that encompasses the Rio Piracicaba Project, and was of utmost importance to start the exploratory work in the area.
For the elaboration of the metallogenetic/previsional chart, a broad multidisciplinary integration of data was carried out, with compilation and subsequent treatment of geological, structural, petrographic, geochemical, scintillometric (radiometric), geophysical and mineral cadastre information. This activity followed the standards established, nationally, for the PLGB surveys. The geochemical data, as well as that of a significant portion of the mineral deposits, resulted from consultations with the research work developed by several companies that operate in the region.
The mineral cadastre, even though it has only a partial meaning, led to the accounting of a considerable number of deposits (about three hundred), covering a broad spectrum of metallic (iron, gold, manganese, aluminum, etc.) and non-metallic substances (sands, gems, gravel, etc.), grouped according to their respective geological contexts. In the representation of these deposits, suitable symbols were used for the mapping of the classes of deposits and their morphological characteristics (on a genetic-descriptive basis), as well as the current situation in terms of economic utilization and size of the deposits.
Some special units and/or lithotypes were highlighted in the aforementioned chart, in general favoring areas of occurrence of supracrustal rocks (Archean metavolcanosedimentary sequences and Paleoproterozoic chemical metasediments) and, to a lesser extent, of mafic or metaultramafic rocks.
Several mineralized/previsional areas (or areas of mineral potentiality) characterized as probable and potential were also delineated in the chart. The probable areas, usually with much direct and indirect evidence of mineralization, highlight segments bearing deposits of iron, gold, silver, manganese, aluminum (bauxite), chromium, titanium, special sands, and gems. A single potential area has been established for base metals (copper, zinc, and lead) based on the rather high geochemical concentrations of these elements in the drainage.
The mineral production of the region is of great economic importance, with iron ores, gold and gems standing out. A factor of basically geological nature, allied to a long local tradition in mining enterprises, contributes decisively to the notable economic exploitation of the mineral resources found in the region, which is its partial insertion in the Iron Quadrangle, where it occupies the northeast quadrant. In general, the production structure within what can be considered a mining district is already well developed, with large and traditional investments in the iron and gold mining industries. During the last decades, the Itabira mining complex (mines Cauê, Dois Córregos, Conceição, etc) has been world renowned for the large-scale production of iron ore, with amounts reaching several tens of millions of tons.
The considerable distance in relation to the Metropolitan Region of Belo Horizonte has prevented a greater demand for non-metallic mineral substances, such as construction materials. Only the production of gravel, destined almost exclusively to meet the development needs of urban centers such as Itabira, João Monlevade and Santa Barbara, stands out.
Next, the main geological and economic data relative to the metallic mineral substance of interest will be presented, registered in the metallogenetic chart of the Rio Piracicaba Project region (Figure 6.4-1).
| S-K 1300 Technical Report Summary | |
| Rio Piracicaba Project | Page 45 |
The iron deposits represent the main mineral substance in the surveyed region and are distributed in seven distinct geographic segments, namely: in the Gandarela syncline (Barão de Cocais and Tamanduá mountain range); in the Itabira region; in the belt extending from Rio Piracicaba beyond João Monlevade; southwest of Santa Bárbara (Donana hill); in Candidópolis; in the Nova Era region; and, finally, south of Hematita (Piçarrão).
There are three primary typologies of iron deposits: Fe-Ti ore in a bedded complex, Algoma-type iron formations and Lake Superior-type iron formations, each of which presents subtypes and surface concentrations (cangas, eluvium and colluvium).
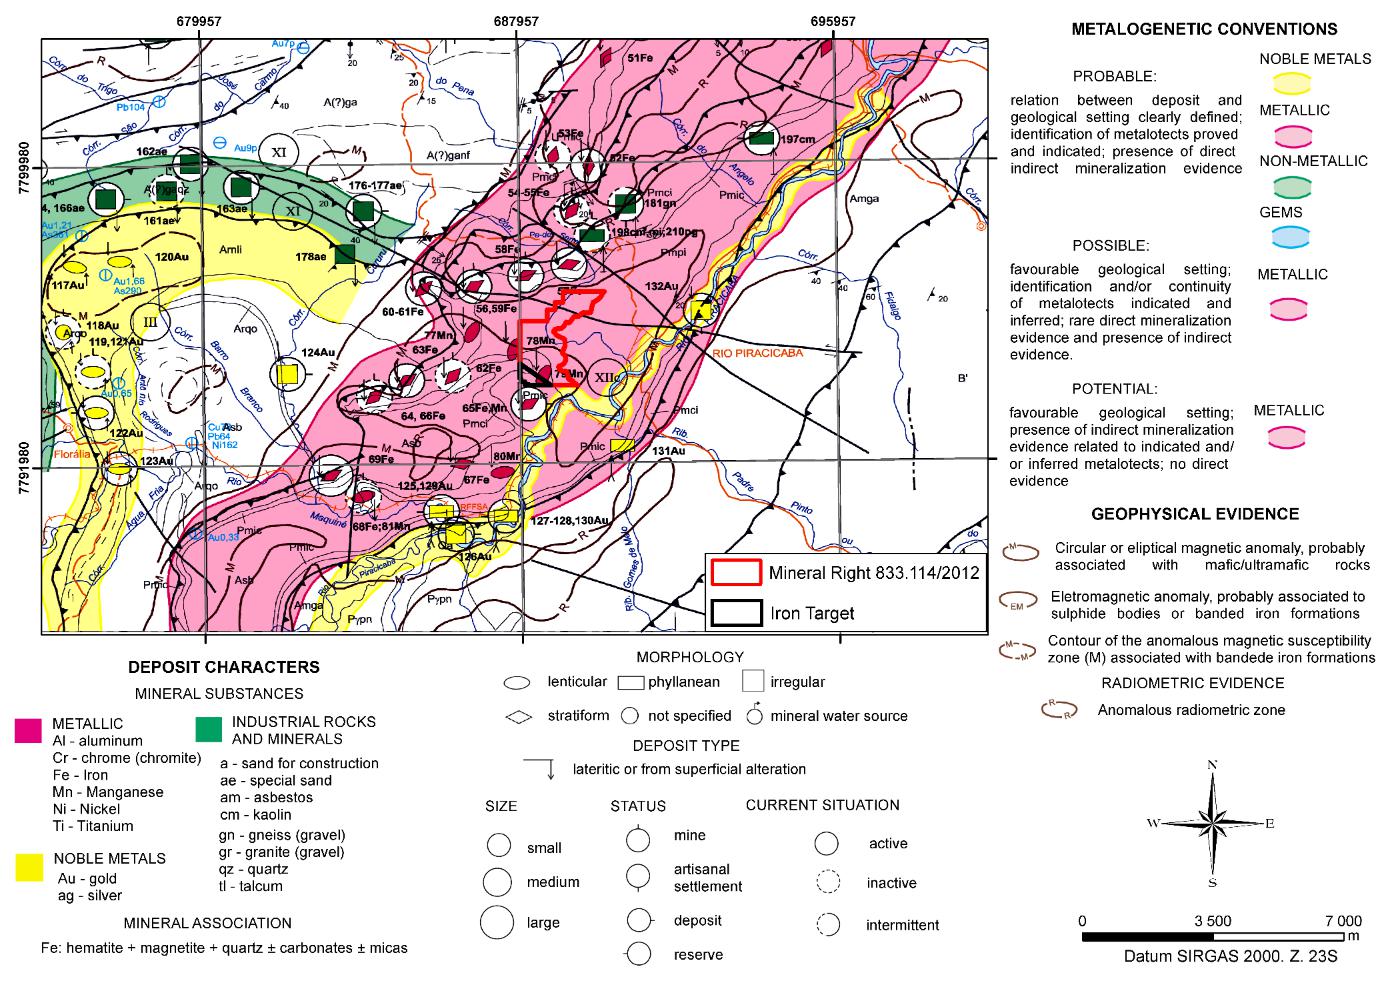
Figure 6.3.6-1: Detail of the metallogenetic/previsional chart, framing the Rio Piracicaba Project region
The Fe-Ti ore occurs associated with metagabros (amphibolites) and metanorthosites (feldspathic rocks) and its outcrops are found in a peripheral position within an elongated body of metamorphic and metaultramafic rocks, about 1.5 km long and located immediately south of the Candidópolis locality; It presents a massive structure (when composed of about 90% magnetite and ilmenite) or banded (in case of increasing volume percentage of minerals such as chlorite and hornblende); another relatively common ore type is the mineralized amphibolite, which experiences increases in the contents of mafics and exhibits some plagioclase. The (total) iron contents most commonly found in the different ore types range from 27 to 47% and the mineral inventory exceeds two million tons (data at the time of the survey).
As it occurs in the rest of the Iron Quadrangle, the vast majority of the iron deposits are in intimate stratigraphic association with the Paleoproterozoic metasedimentary sequence of the Minas Supergroup. Also, here the spatial relation with the Archean metavolcanosedimentary sequences (Supergroup Rio das Velhas and Guanhães Complex), which are sotopically or tectonically imbricated with those. It is worth mentioning that based on lithological associations, the current geological cartography that involves the region proposes the inclusion of the Hematite (Piçarrão) and Nova Era iron formations in the Guanhães Complex, although these rocks can also be correlated with those of the Itabira Group.
| S-K 1300 Technical Report Summary | |
| Rio Piracicaba Project | Page 46 |
The Algoma type iron formations are present in practically all the area of occurrence of the metavolcanosedimentary sequence of the Nova Lima Group (Santa Quitéria and Córrego do Sítio units) and define alignments denominated São Bento, Brumal, etc. These rocks do not present a favorable history in terms of their exploitation as iron ore, but in the region of the Donana hill, southwest of Santa Barbara, a work was done to evaluate the potential of ferruginous canga that covers schists and ferriferous formations. At this site, the mineral inventory, with forty-five million tons, seem to be exaggerated, but perhaps the biggest problem lies in the high phosphorus content (greater than 0.1%) of the mineralized material, a strongly restrictive factor for its use in steelmaking. Anyway, there were some attempts to exploit them in the remote past, which is one of the few documented cases of mining, even if not very expressive, aiming iron ore inside the Nova Lima Group. As for the iron material bodies of Nova Era and Piçarrão, there are no data yet to place them with certainty among the Archean deposits; in the case of the latter, the ore reserves were practically exhausted about two decades ago, leaving now about one million tons.
In the Cauê Formation, of the Itabira Group (Minas Supergroup), the Lake Superior type iron formations occur, which present a stratiform morphology, with great lateral persistence of the layers and iron contents. The predominant lithologies are itabirites, which correspond to mixtures, in variable proportions, of oxidized iron minerals (hematite and magnetite, with some martite) and quartz (metachert); the accessory mineralogy also comprises some sericite, carbonates (calcite and dolomite) and amphiboles, besides limonite and manganese oxides and hydroxides. Within the Cauê Formation it is worth noting the close association of the itabirites with other chemical (such as dolomites) and clastic-chemical (dolomitic phyllites and paraderivative amphibolites) metasediments, and, in particular, with large lenticular bodies of compact to powdery hematite, holders of the richest concentrations of iron. Due to their great resistance to erosion, the itabirites of this unit remain with a typical relief of ridges that denounce the structuring of the sedimentary package resulting from several deformation events. In the region of Rio Piracicaba, as well as in the rest of the Iron Quadrangle, the structures generated during the Proterozoic, are not rare, of the synclinal type, sometimes with rupture of hinges and the development of thrust scales, in part integrating the external zone of a mobile Neoproterozoic belt denominated as Araçuaí Belt.
The large quantity of iron deposits attests to the importance of this substance in the mineral scenario of the region and even of the country. The intense exploration activity of the itabirites of the Cauê Formation is well characterized in this context, where open-pit mines account for about 50% of the national production. Most of the remaining mineral deposits are small.
The economic history of the Itabira region, currently marked by intense exploration for iron deposits, began, however, with gold mining, from the pioneering discoveries made by the bandeirantes (explorers and fortune hunters in early Colonial Brazil) in the 18th century.
The exploitation of iron ore from the mining district known worldwide as the Iron Quadrangle, used in Catalan forges, only started around 1830, and this first phase lasted until 1932. In 1903 the construction of the Vitória-Minas Railroad began and in 1908 it was absorbed by the Itabira Iron Co., which also acquired the Cauê, Dois Córregos and Conceição ore deposits.
With the creation of the Vale do Rio Doce Company, in 1942, the stock control became Brazilian, and the railroad was extended to the towns of Nova Era and Itabira, completing the railroad connection between the iron mines and the port of Vitória. In the first half of the current century some reserve evaluations were carried out within the techniques recommended by the mining legislation, followed, in the 50s and 60s, by the first systematic detailed geological mapping of the area of this district by teams from the USGS (United States Geological Survey) and, at the time, the DNPM, with the establishment of a complete stratigraphy for the units that compose the Minas Supergroup.
| S-K 1300 Technical Report Summary | |
| Rio Piracicaba Project | Page 47 |
From there, most of the economic evaluation work of the ore existing in the QF was carried out, the most important bodies were located in terms of volume, content and favorability for exploitation, and the development of the most important and ambitious projects in terms of iron ore mining was started.
All the iron ore is extracted from the itabirite layers of the Cauê Formation, sedimented during the transition from Archean to Paleoproterozoic times, more precisely at the beginning of the latter period. The Cauê Formation is represented by a set of stratiform deposits where a great variation in average metal contents is observed (35.3% in itabirites to 68.2% of Fe in hematite), according to the results exposed in reserve evaluations carried out by several companies.
The rocks targeted within the Cauê Formation are lenticular bodies of hematite (compact or pulverulent) and layers of itabirites, whose mineralogy is mainly composed of hematite, magnetite, martite, quartz (metachert), carbonates (calcite and dolomite) and sericite, in addition to limonite and manganese oxides and hydroxides. In the case of the richest ores, with about 67 % Fe, the other compositional parameters, of chemical nature and that are sometimes determinant in the quality of the ore, even with increasing demands by the consumer market, are: SiO2 = 0.8%, Al2O3 = 0.9-1.7% and P = 0.03-0.04%. It is the average Fe content, together with some mineralogical and petrographic criteria, which define the different denominations given to the ores produced in the Iron Quadrangle:
Hematite: > 64% Fe
Rich Itabirite: 60 - 64% Fe
Itabirite: < 60% Fe
The following types of iron formations can be recognized in the Iron Quadrangle: itabirites, hematite phyllites, Fe-dolomites and, subordinately, pyritic phyllites (Table 6.4-1) (Rosière et al., 1993).
TYPES OF IRON FORMATION | | MAIN MINERALOGICAL COMPONENTS | | ACCESSORIES COMPONENTS |
| Common Itabirite | | hematite, martite, kenomagnetite, quartz. | | chlorite, sericite, ferroan dolomite, kaolinite, kyanite, Mn oxides, sulphides, apatite, pyrophyllite. |
| Dolomitic Itabirite | | martite, hematite, kenomagnetite, Fe-dolomite | | calcite, grunerite-cummingtonite, chlorite, stilpnomelane, biotite, tremolite, actinolite, quartz (chert), sulphides, pyrophilite. |
| Amphibolitic Itabirite | | martite, hematite, kenomagnetite, maghemite, grunerite-cummingtonite, tremolite, actinolite, quartz. | | carbonate, talc, Fe-dolomite, egirine, biotite, Mg-riebeckite, kupferite, sulphides. |
| Hematite-phyllite | | hematite, sericite. | | quartz, chlorite. |
| Pyrite phyllite | | pyrite, carbonaceous material. | | - |
Table 6.3.6-1: Mineralogy of the different compositional types of iron formations
| S-K 1300 Technical Report Summary | |
| Rio Piracicaba Project | Page 48 |
Itabirites are rocks that are characterized by a banded structure, of remarkable continuity and where dark laminae rich in iron minerals, mainly hematite and magnetite, alternate with light laminae formed on the basis of quartz. When submitted to hydrothermal alteration processes such as silicification, the original carbonates are partially transformed into amphiboles (tremolite and actinolite).
The local predominance of these carbonates over iron minerals determines the intercalation of more or less ferruginous dolomitic lenses amidst the itabirites, as well as the rapid, albeit gradual, passage to the Gandarela Formation, immediately overlying the Cauê Formation, within what constitutes the Itabira Group, in the classical stratigraphy of the Iron Quadrangle.
Another important characterizing factor in mineralization are the tectonic structures, which resulted in a rich variety of textural features due to the development of specularite plaques whose distribution characterizes cleavages of varied types and morphology and defines tectonic types (Table 6.4-2) with different textures and microstructures (Rosière et al., 1993).
| TECTONIC TYPES * | | MAIN FEATURES |
| Itabirites and schist ores | | Strongly oriented, protomilonitic to milonitic texture with martite porphyroclasts and granoblastic hematite aggregates surrounded by specularite plaques. Oriented amphibole crystals. Partial or complete transposition of the primary banding. Unrooted folds. Carbonates and quartz show granoblastic weave. |
| Breccia | | Non-oriented banded itabirite fragments and compact mineralized material in matrix consisting of sacaroidal quartz, carbonates, or hematite. Non-oriented banded itabirite fragments and compact hematite in matrix consisting of sacaroidal quartz, carbonates, or hematite. |
Cataclasites (Blue dust) | | Fine crystals of specularite showing weak or no preferential orientation. Evidence of hydrothermalism. Associated gold mineralization. |
Table 6.3.6-2: Main characteristics of the tectonic types (*hematite is the dominant phase in all types)
It is noteworthy that, although they have not been object of reserves quantification so far, due to the small dimensions of the bodies, it is worth mentioning the presence of itabirite lenses also inside the Gandarela Formation. Banded iron formations also occur in the basal and middle units of the Nova Lima Group, but they have never been object of exploration activities due to their smaller dimensions (especially thickness) and lower Fe contents, compared to the itabirites of the Cauê Formation.
The pace of exploration of the large iron deposits has been quite intense in the last decades, basically concentrated in the mines of the region (with total mineral inventory of itabirites and hematite over two billion tons).
Due to their greater resistance to erosion, the ferriferous rocks are highlighted in the topography, almost always constituting the crests of large longitudinal mountains and greatly favoring bench mining techniques, carried out in the open pit and with well-established exhaustion pits. This is done with variable blasting of an iron-rich (and therefore almost always utilized) lateritic canga capping and the adjacent non mineralized strata.
Iron ore mining is entirely mechanized and usually involves the use of explosives. The treatment of the ore, for enrichment by eliminating most of the silica, is performed in easement areas located near the mines, and the tailings from this processing are largely retained in the tailing dams. More recently, an environmental recovery of the areas exhausted by mining has been initiated through programs that apply a new vegetation cover, mainly grasses, over them.
| S-K 1300 Technical Report Summary | |
| Rio Piracicaba Project | Page 49 |
Depending on its granulometric characteristics, the beneficiated material produced in the mines is called: lumpy ore (2” - ¼”), sinter feed (¼” - 100#), pellet feed fine (100# - 325#). Most of the iron ore produced is shipped, via railroad, to export ports, such as the Tubarão terminal, located near Vitória, in the state of Espírito Santo.
6.5. Local Iron Metallogeny
Two main types of iron mineralizations are present in the region, in the form of large stratiform deposits of banded iron formations, namely: the deposits contained in the Archean metavolcanosedimentary sequence of the Nova Lima Group (greenstone belt Rio das Velhas) and those corresponding to the Cauê Formation, Minas Super Group. Due to gigantic reserves, high average metal contents and favorable topography, among other factors, only the second of these types has been economically exploited during the current century.
However, the differences between the two types of iron formations go far beyond the question of their utilization by the mining industry. For the iron mineral rich lithologies found in the Nova Lima Group a link with proximal to distal exhalative phenomena associated with the initial oceanic background magmatism that built part of the supracrustal stack of the greenstone belt can be easily assumed.
This association characterizes the banded iron formations of the Algoma type, which have an expressive presence in the basal (Ouro Fino) and medium (Santa Quitéria) units of the Nova Lima Group; in the first one, the banded iron formations would be of the proximal or vulcex (volcanic-exhalative) type, and in the other case they can be framed in the medial to distal or sedex (sedimentary-exhalative) types.
As for the Cauê Unit, chemical sedimentation in stable platform conditions, equivalent to the tectonic environment of passive margins advocated by modern plate tectonics, is observed, thus typifying iron deposits of the Lake Superior type.
The traces of this continental paleoplatform, on which the Cauê itabirites were settled, are still found from the southernmost portion of the São Francisco Craton, where they integrate the Jeceaba-Bonsucesso Lineament, extending certainly up to the reworked ancient core, in the Rio Piracicaba region, in the northeast of the Iron Quadrangle.
If the chronocorrelation character of the itabirite formations found in the Serro-Morro do Pilar belt and in the Guanhães region is confirmed, the minimum extent of this Paleoproterozoic marginal basin was approximately 400 km. The region under study also presents large discontinuities in the occurrences, attributable to intrusions (domes) of granitoids of the Borrachudos Suite, as well as to compressional tectonic events that produced a large number of thrust scales.
The absence of present-day deposits comparable to these huge Archean to Paleoproterozoic accumulations has been imposing serious restrictions on the hypotheses (Barry-Maynard, 1983) about the origin of the mineralogical precursors of the banded iron formations (in the case of the original chert and iron hydroxides). Doubts also exist about the physical-chemical conditions (reducing or oxidizing atmosphere) dominant in the Neoarchean and Paleoproterozoic, as well as problems in identifying the sources of the metal (volcanic-exhalative, continental erosion, etc.) and the intensity of the biological (bacterial?) influence. Still, these bodies have been considered syngenetic since iron accumulations occurred along with sedimentation.
| S-K 1300 Technical Report Summary | |
| Rio Piracicaba Project | Page 50 |
Many iron ore bodies of the Cauê Formation are essentially composed of compact and hard hematite, in which case they always present high iron contents (above 64%) and constitute many of the topographically highlighted peaks in the profile of the mountains that outline the complex structure of the Iron Quadrangle, integrating themselves with the history of human occupation of the region from the 17th century on.
For such bodies, the most accepted hypothesis about their genesis is the one that favors the diagenetic concentration phenomena from the itabirite layers, in opposition to the theories supported essentially in hydrothermal-metasomatic concentration processes.
A particular type of ferriferous formation also found in the Cauê Unit refers to the so called “jacutingas”, intercalated in the itabirite layers and distinguished by its friable to powdery aspect, and that in great part can be attributed to superficial (meteoric) alterations
As for the third type of iron deposit, in Candidopolis, its origin is clearly magmatic and resulted from fractionation inside a relatively large chamber, with an original diameter of perhaps a little more than a kilometer. It is a bedded complex of basic nature, later transformed into amphibolic rocks, where the Fe-Ti ore occurs in repetitive cycles in rhythmically banded zones, where it alternates with feldspathic rocks (metanorthosites) and fine to coarse grained amphibolites (metagabros).
The iron enrichment in the magma, translated by the magnetite- and ilmenite-based mineralogy of the orebody, was a consequence of the withdrawal of Al and Ca, elements necessary for the crystallization of the feldspars (the plagioclase-rich or metanorthositic layers). For this bedded complex, a petrotectonic association of gabbroic bodies (tholeiitic magma) in a synvolcanic environment (Archean greenstone belt) can be suggested, following the example of the Dore Lake Complex in Quebec (Canada).
According to the conceptualized metallogenesis, some areas in the region present high mineral potentiality, when it comes to iron. According to the survey carried out by CPRM, areas of occurrence of the Cauê Formation were delimited, notable for the large stratiform and eventually lenticular deposits of iron ore consisting of banded iron formations of the Lake Superior type (itabirites and pulverulent to compact hematite), with about 5 billion tons.
At João Monlevade - Rio Piracicaba, such lithic records, which represent the remains of Paleoproterozoic platform sedimentation, are delineated by their mineralogical composition, together with the enhanced relief, lateritic coverings (canga) and the magnetometric anomalies.
Manganese is another element with potential for deposit formation in the area, but further exploratory research is needed. The manganese deposits mentioned in this unit of the Itabira Group are generally not very expressive, in terms of reserves (up to about 200,000 t) and in the Rio Piracicaba region there are gondite bodies intercalated in granatiferous schists.
However, it is known that in the Itabira region several manganese ore bodies associated with the iron formations were mined and they extended from the Dois Córregos region to the Chacrinha mine.
6.6. Banded Iron Formations (BIF)
The largest and most important iron deposits in the world are hosted in Banded Iron Formations (BIF), rocks of chemical sedimentary origin. Hydrothermal alteration of these rocks, which generally have about 30 to 35% Fe in their composition, can raise their Fe content to above 60%, generating so-called high-grade deposits, the most important source of iron in the world.
In addition to hypogenic hydrothermal alteration, BIF-hosted iron deposits can also undergo supergene alteration, generating laterite-type deposits. The other types of iron deposits (Kiruna / Lahn-Dill, Skarn, Clinton-Minette) are of secondary importance to the BIF hosted deposits.
| S-K 1300 Technical Report Summary | |
| Rio Piracicaba Project | Page 51 |
BIFs were classically defined by James (1954) as chemical sedimentary rocks, typically banded, or laminated, containing 15% or more iron of sedimentary origin. Commonly, the alternating bands or laminae are a few millimeters to a few centimeters thick (Figure 6.6-1), interspersing reddish or dark bands rich in iron oxides (magnetite and hematite) with light bands composed almost exclusively of microcrystalline silica (chert).

Figure 6.3.6-1: Examples of banded Ferrous Formations: a) Paleoproterozoic folded BIF of the Cauê Formation, Iron Quadrangle; b) BIF with fallen clast of the Santa Cruz Formation, Urucum district, Corumbá - MS, deposited under glacial influence in the Neoproterozoic (Photos: F. Caxito).
According to the predominant iron mineral, James (1954) further suggested a division into four main facies: oxide facies (magnetite and hematite), carbonate facies (rich in ankerite and siderite), silicate facies (rich in stilpnomelane, greenalite and rhyebeckite) and sulfide facies (rich in pyrite, chalcopyrite and other iron sulfides), with the last facies no longer considered today as BIF but rather as pyrite-rich carbonaceous shale (Bekker et al. 2010). These facies typically present gradational passages from one to the other and have intermediate terms between them, according to the relative proportions of each mineral in a BIF.
The deposition of a BIF is a geological event dependent on the complex interaction between several geochemical, biological, tectonic, and magmatic factors (Bekker et al. 2010). For this reason, although it occurs throughout the geologic record, deposition of BIFs is highly concentrated in specific periods (Figure 6.6-2), with more than 90% of the world’s BIFs being deposited between 2.0 and 2.5 billion years ago (James & Trendall, 1982).
| S-K 1300 Technical Report Summary | |
| Rio Piracicaba Project | Page 52 |
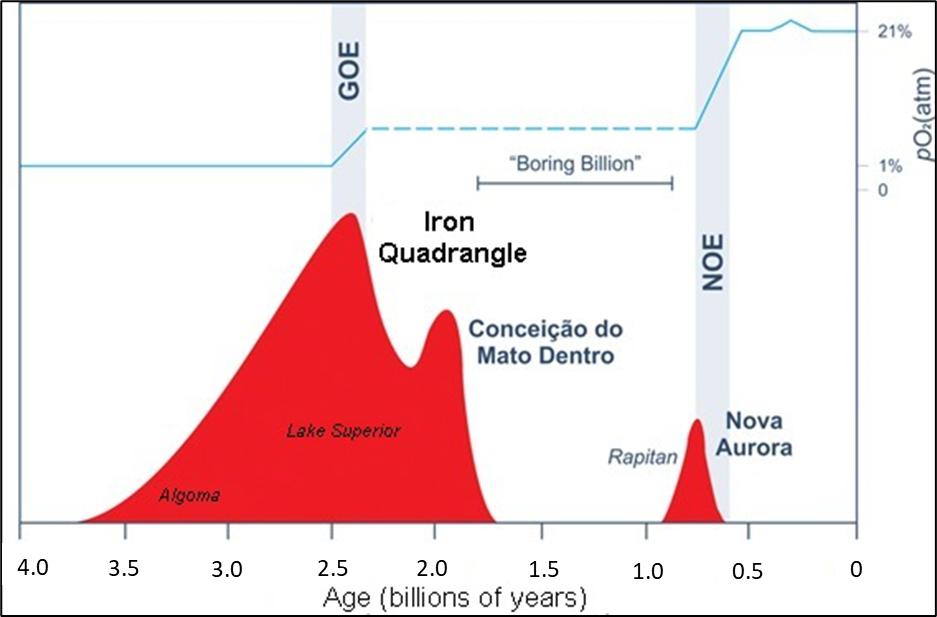
Figure 6.3.6-2: Major periods of BIF deposition in geologic time. The red curves represent the relative amount of BIF deposited in each interval. The blue line represents the relative amount of oxygen in the atmosphere (pO2, in%) in geologic time to the present day, where it makes up about 21% of its composition. GOE = Great Oxygenation Event; NOE = Neoproterozoic Oxygenation Event. The main periods of deposition of BIF of the Algoma, Lake Superior and Rapitan type are indicated, as well as the main deposits of Minas Gerais.
Since the classical works of Cloud (1965, 1973), it has been considered that, in order to deposit a BIF, it is necessary to oxidize the Fe (II), soluble in seawater, into Fe (III), insoluble, which in this way precipitates on the ocean floor forming the sedimentary deposits (Figure 6.6-3a).
During the Archean and up to the beginning of the Paleoproterozoic (about 4 to 2.5 billion years ago) a large amount of Fe (II) could be accumulated in solution in the planet’s oceans, because the atmosphere was basically free of oxygen (Figure 6.6-3). This Fe (II) came mainly from submarine volcanic activity, especially in periods of high magmatic fertility due to mantle shifts, when the Large Igneous Provinces were developed (Klein & Beukes, 1989; Beukes et al., 1990; Bekker et al., 2010).
The emergence of photosynthetic organisms (cyanobacteria) generated a large amount of O2 as a byproduct of their metabolism, which eventually accumulated in the atmosphere, causing the oxygen catastrophe that eliminated a large number of microorganisms that had no protection against an environment rich in this reagent. Thus, the main period of BIF deposition, through the oxygenation of dissolved Fe (II) by oxygen produced by cyanobacteria, is considered robust evidence for a Great Oxygenation Event (GOE) approximately 2.4 billion years ago (Figure 6.6-3). This event is also suggested by several geochemical and biological lines of evidence (Canfield, 1998, Bekker et al., 2004, Scott et al., 2008, Frei et al., 2009, Farquhar et al., 2011).
| S-K 1300 Technical Report Summary | |
| Rio Piracicaba Project | Page 53 |
Alternative models have been proposed for BIF deposition. An entirely abiological model was proposed by Cairns-Smith (1978) and Braterman et al. (1983), where the oxidation of Fe (II) in surface waters would be caused by a photochemical effect through interaction with ultraviolet radiation, since the planet did not yet have a protective ozone layer (Figure 6.6-3b). Tosca et al. (2016) propose that the lack of organisms using silica as a raw material for skeleton manufacture in the Archean may have promoted a variety of reactions between Fe (II) and dissolved silica and suggest that changes in water pH could promote these reactions and the deposition of BIF.
Anyway, the main period of BIF deposition is followed by almost a billion years in which BIF become extremely rare, the so-called “Boring Billion”, between about 1.8 and 0.8 billion years ago (Figure 6.6-3). Then, during the Neoproterozoic, planet Earth would experience the greatest and most extreme climatic, biological, tectonic and chemical variations in its history, including periods of extreme glaciation (Snowball Earth) and extreme greenhouse effect (Greenhouse Earth), the break-up of a supercontinent (Rodinia) and the dispersion of its fragments until they reassembled into a new supercontinent (Gondwana), a new global oxygenation event (NOE) and, at the culmination of the Ediacaran period, the enormous diversification of complex life forms that resulted in the Cambrian explosion that followed. The Neoproterozoic also marks the return of the deposition of large amounts of BIF in the geologic record, following the Boring Billion (Figure 6.6-3).
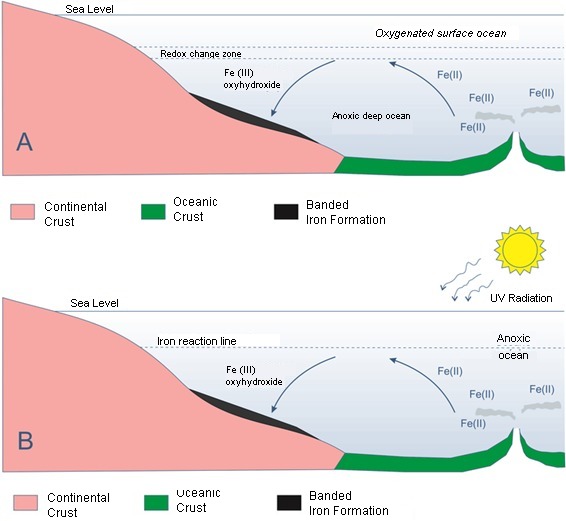
Figure 6.3.6-3: Models of BIF deposition: a) oxygenation of the atmosphere causes a stratification of the ocean, with an oxygenated upper layer and an anoxic deep layer. The free oxygen may have been generated as a byproduct of photosynthesis carried out by cyanobacteria, which allowed the accumulation of sufficient amount to carry out large-scale oxidation of Fe (II) to Fe (III) about 2.4 billion years ago; B) alternative model where the oxidation of Fe (II) in surface waters would be caused by a photochemical effect through interaction with ultraviolet radiation, due to the absence of the protective ozone layer in the Archean / Paleoproterozoic atmosphere. In this model a stratified ocean with respect to the amount of dissolved oxygen is not required.
| S-K 1300 Technical Report Summary | |
| Rio Piracicaba Project | Page 54 |
Recently, the role of microbial life in the precipitation and post-depositional alteration of BIFs has been gaining much attention, since Fe (II) bearing minerals such as magnetite and iron-rich carbonates are common end-products of iron dissimilatory reduction, a common type of metabolism for some bacteria and Archaea (Walker, 1984; Lovley et al., 1987; Teixeira et al., 2017).
According to geological features and the inferred depositional and tectonic environment, Gross (1980, 1983) divided BIFs into two categories, Algoma, and Lake Superior. A third type, the Rapitan type (Young, 1976; Klein & Beukes, 1993), with glaciogenic influence in the Neoproterozoic, was also suggested (Figure 6.6-4).
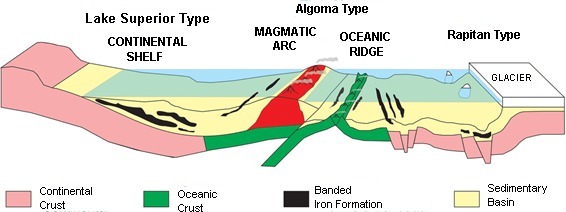
Figure 6.3.6-4: Banded Ferritic Formation types and their respective depositional environments. Original figure inspired by models proposed by Gross (1983), Young (1976) and Klein & Beukes (1993).
The Lake Superior type BIF, which fits the depositional model of the Project area, are associated with thick layers of sedimentary rocks deposited on marine continental shelves and in rift basins, in a passive margin environment, mainly in the Paleoproterozoic. In these environments they are associated with dolomites, quartzites, black shales and, in smaller quantities, tuffs and other rocks of volcanic origin. BIFs of this type are home to some of the largest and most potent iron deposits in the world. The settlement of the first continents and supercontinents in the late Archean, through the amalgamation of smaller continental blocks, allowed the development for the first time in the early Paleoproterozoic of extensive continental shelf areas where large passive margin basins could be developed. The availability of this accommodation space was very important for the deposition of the substantial amounts of Lake Superior-type BIF between 2.5 and 2.0 Ga.
According to the texture and composition, the iron formations can be further classified into another type, the Granular Iron Formations (GIF). The GIF is rich in debris, predominantly sand-sized, and exhibit cross-stratification and wave marks, indicating a shallow, high-energy environment. They are considered to be shallow equivalents of BIF deposited in deeper environments. When deposited in shallower environments, GIF can be reworked by waves and tensile currents, which do not reach the deep environments. BIF are dominant in Archean to early Paleoproterozoic age successions, whereas GIF is much more common in Proterozoic successions later than the GOE (Trendall, 2002; Bekker et al., 2010).
| S-K 1300 Technical Report Summary | |
| Rio Piracicaba Project | Page 55 |
6.7. Hydrothermal Alteration of Banded Iron Formations
In general, for an iron deposit to be economically viable, reconcentration of the iron in the BIF must have occurred by post-depositional processes, usually hydrothermalism associated with large structures such as faults and folds. In these hydrothermal processes silica is leached out, concentrating the iron which can occur in the form of neoformed minerals such as specularite hematite. Through hydrothermal processes, BIF that have reasonable amounts of Fe, between 30 and 35% (Klein, 2005) can reach concentrations above 60% iron, thus characterizing high grade deposits (Hagemann et al., 2015).
The so-called BIF-hosted iron ore system (Hagemann et al., 2015) represents the largest and highest iron grade deposits in the world. This system is typically structurally controlled, mainly through kilometer fault systems, which allow large volumes of hydrothermal fluids to flow between BIFs during late deformational events or even during extensional events related to basin formation. Supergene fluids can also access these structures during the Cenozoic, generating a second remobilization of the elements and the laterite-type deposits.
The transformation of BIFs to iron ore deposits is controlled by structural permeability and hypogenic alteration caused by deep fluids (magmatic or basinal) and ancient meteoric waters, and supergene enrichment that may follow. In most large deposits, three main hypogene stages and one supergene stage are observed (Hagemann et al, 2015): I) leaching of silica and formation of magnetite and locally carbonate; II) oxidation of magnetite to hematite (martitization), further dissolution of quartz and formation of carbonate; III) further martitization, replacement of Fe silicates by hematite, microtabular or specular, and dissolution of carbonates; and IV) replacement of magnetite and remaining carbonates by goethite and magnetite and formation of fibrous quartz minerals and argilominerals.
6.8. Surface Alteration Deposits (Lateritic)
They are formed by weathering and surface alteration of iron-rich rocks, especially BIF, through preferential leaching of silica-rich layers and secondary accumulation of iron-rich minerals. Iron minerals are generally hydrated, which presents a problem in geometallurgical terms because they have high contents of other elements in their crystalline structure (Santos & Brandão, 2003). The lateritic cangas that develop on top of the landscapes of the Iron Quadrangle are examples of surface alteration deposits. They normally form hard, dark layers that are more resistant to erosion processes and therefore can be found on mountain tops and preserved reliefs.
The classical model of lateritic crust evolution (Ramanaidou & Morris, 2009) explains the large volume of supergene ore, up to 200 m thick, that occurs both in Brazil (e.g., in Iron Quadrangle and Carajás) and in other regions of the world such as in the districts of Hamersley in Australia and Simandou in Guinea (Hagemann et al., 2015). These deposits occur on hills and plateaus where BIF layers form erosion-resistant tops that have been subjected to periods of Cenozoic meteoric water uplift and infiltration, according to climatic and geomorphological conditions. Silica and carbonates are leached out by cold meteoric waters, and iron is concentrated under oxidizing conditions both as residual minerals (hematite, magnetite) and as neoformed minerals (hematite, maguemite and goethite), locally with gibbsite, kaolinite and Al and Fe rich phosphates and Mn oxyhydroxides.
Lateritization causes the formation of friable, powdery ores, and locally can cause the preservation of hematite/magnetite-rich primary ore bodies. For supergene enrichment to be effective, the BIF layers must function as an aquifer confined or partially confined by impermeable units such as shales, massive mafic rocks, or milonitized zones. The flow of recent meteoric waters is controlled by the structural permeability of BIF caused by fracturing and the collapse of structures due to leaching of carbonates and quartz. Phosphorus, one of the main contaminant elements in iron ore, is subject to rapid remobilization during supergene, due to dissolution of fine-grained apatite in BIFs (Hagemann et al., 2015).
Geochronological studies using the 40Ar/39Ar and (U-Th)/He systems in lateritic (canga) crusts of the Iron Quadrangle (Spier et al., 2006; Monteiro et al., 2014) show that dissolution and precipitation of iron oxyhydroxides began in the Paleogen, about 48.1 ± 4.8 Ma ago, and continues to the present, being less effective during the Neogene. These ages are also consistent with the formation of Fe-rich lateritic crusts in the Carajás region and East Africa, with most ages accumulating between 46-47 Ma, although some older ages show that the evolution of Mn-rich lateritic crusts may have begun as early as the Upper Cretaceous (Hagemann et al., 2015).
7. Exploration
All the activities performed during the mineral exploration campaign for iron and manganese mineralized material are summarized in Table 7-1 below and presented in detail in Figure 7-1 and Figure 7-2. Geological mapping work was performed over the entire target area of the survey. Rotary drilling and sampling of channel and exploration test pits or wells were also carried out.
| S-K 1300 Technical Report Summary | |
| Rio Piracicaba Project | Page 56 |
| Main Activities Conducted | | Unity | | Quantity |
| Semi-detail mapping (1:2,000) | | Ha | | 27 |
| Detail Topography (Vant) | | Ha | | 30 |
| Rotary drilling | | Drill Cores / Meters | | 11 / 383.91 |
| Topographic survey of drill cores | | Drill Cores | | 11 |
| Drill cores logging | | Meters | | 383.91 |
| Drill cores sampling | | Samples | | 55 |
| Exploration test pits | | Pits / Meters | | 19 / 59.45 |
| Topographic survey of exploration test pits | | Pits | | 19 |
| Exploration test pit lithological description | | Meters | | 59.45 |
| Exploration test pit sampling | | Samples | | 15 |
| Channel sampling | | Samples | | 4 |
| Particle size analyzes for iron mineralized material | | Unity | | 74 |
| Chemical assays for iron mineralized material | | Unity | | 220 |
| QA/QC Assays | | Unity | | 40 |
| Density Samples | | Unity | | 48 |
Table 7.0-1: Services performed in the Project
| S-K 1300 Technical Report Summary | |
| Rio Piracicaba Project | Page 57 |

Figure 7.0-2: Map of the target area of the Project
| S-K 1300 Technical Report Summary | |
| Rio Piracicaba Project | Page 58 |

Figure 7.0-3: Detailed map of services conducted 2010/2011
| S-K 1300 Technical Report Summary | |
| Rio Piracicaba Project | Page 59 |
7.1. Exploration Infrastructure
7.1.1. Project Staff
The personnel employed in the research work were professionals from RCS and local labor. Summary of the Project staff:
| | ● | 1 Senior Geologist. |
| | | |
| | ● | 1 Geologist. |
| | | |
| | ● | 1 Geology Technician / Drilling Inspector |
| | | |
| | ● | 1 Technical Assistant for sampling. |
| | | |
| | ● | 2 College level interns. |
| | | |
| | ● | Diamond Drilling Team (Subcontractor: 1 driller and 2 assistants). |
| | | |
| | ● | Topography works team (Subcontractor: 1 engineer and 1 assistant). |
7.1.2. Support Equipment
| | ● | Rotary Drill (Subcontractor). |
| | | |
| | ● | Laboratory for ore quality analyses (Subcontractor). |
| | | |
| | ● | Lease of one water tanker, wheel loader and one tire loader for 3 months to support the drilling and opening of the exploration test pits. |
| | | |
| | ● | Rental of two support vehicles. |
| | | |
| | ● | Warehouse for storing samples and drill cores. |
7.2. Geological Mapping
The geological mapping was carried out in one stage, from April to May 2021. Exclusively developed to search for iron and manganese. The data were integrated in the same cartographic base in Sirgas 2000 Datum, generating a single geological map (Figure 7.2-2).
The mapping work was done in semi - detail and, occasionally, in detail. In both situations, the objective was to understand the context and lithostructural controls of the iron formations, defining their geometry, contacts, and existing typologies. The works were executed along the existing exposures in surface and accesses. In this context, a total of 38 geological points were described, all of which were registered with GPS (Garmin 60CSx), which has an accuracy of up to 3m (Figure 7.2-1, Figure 7.2-2 and Figure 7.2-3.
This mapping subsidized the map and geological sections. To assist this mapping, regional and detailed topography data, satellite images, and samples from channels and research test pits were used.
The data collected in the field mapping were organized in a database and enabled the preparation of the Geological Map in semi-detail scale 1:5,000 (Figure 7.2-2).
| S-K 1300 Technical Report Summary | |
| Rio Piracicaba Project | Page 60 |

Glauconitic Siltstone Outcrops
Figure 7.2-1: Geological Map Area - compact itabirite outcrop

Figure 7.2-2: Geological Map Area
| S-K 1300 Technical Report Summary | |
| Rio Piracicaba Project | Page 61 |
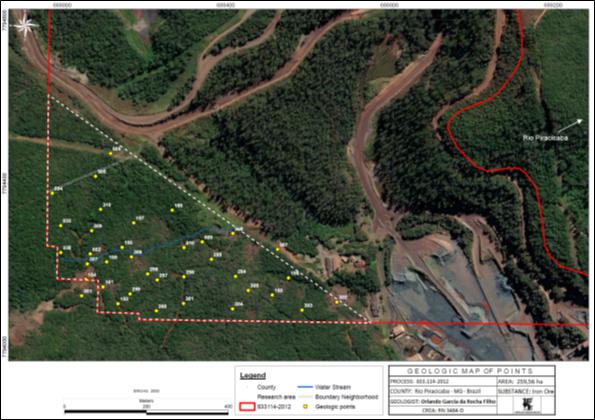
Figure 7.2-3: Map of geological spots
7.3. Channel and Test Pit Sampling
One excavation sampling campaign was conducted distributed throughout the target area. Nineteen research test pits were made either manually or mechanically dug by excavator to expose the lithologies in the subsurface, with depths varying from 1.50 m to 10.0 m and an average of 3.13 m, totaling 59.45 m in length. Test Pits 8 and 9, although planned, were not carried out due safety concerns.
Four channel samples were also made along the access and natural cuts. The average length of the channels was 5.49 m. Table 7.3-1 and Table 7.3-2 summarize the activities described above.
| S-K 1300 Technical Report Summary | |
| Rio Piracicaba Project | Page 62 |
| Test Pit ID | | UTM N | | UTM E | | Altitude | | Length (m) |
| PRP 01 | | 688089 | | 7794102 | | 789 | | 1.50 |
| PRP 02 | | 688026 | | 7794162 | | 791 | | 1.85 |
| PRP 03 | | 688051 | | 7794180 | | 784 | | 1.10 |
| PRP 04 | | 688068 | | 7794186 | | 779 | | 2.50 |
| PRP 05 | | 688050 | | 7794223 | | 780 | | 1.00 |
| PRP 06 | | 688036 | | 7794257 | | 780 | | 2.50 |
| PRP 07 | | 688017 | | 7794230 | | 789 | | 3.40 |
| PRP 10 | | 688268 | | 7794172 | | 734 | | 3.20 |
| PRP 11 | | 688266 | | 7794247 | | 718 | | 1.30 |
| PRP 12 | | 688306 | | 7794261 | | 709 | | 2.00 |
| PRP 13 | | 688623 | | 7794105 | | 644 | | 1.00 |
| PRP 14 | | 688586 | | 7794152 | | 646 | | 0.80 |
| PRP 15 | | 688173 | | 7794295 | | 736 | | 3.50 |
| PRP 16 | | 688224 | | 7794327 | | 719 | | 2.30 |
| PRP 17 | | 688082 | | 7794295 | | 763 | | 5.50 |
| PRP 18 | | 688010 | | 7794341 | | 784 | | 10.00 |
| PRP 19 | | 688137 | | 7794371 | | 737 | | 6.80 |
| PRP 20 | | 688048 | | 7794394 | | 771 | | 2.50 |
| PRP 21 | | 687979 | | 7794438 | | 793 | | 6.80 |
| TOTAL - 19 test pits | | | | | | | | 59.55 |
Table 7.3-1: Identification and location of the exploration test pits
| Channel ID | | UTM N | | UTM E | | Altitude | | Length (m) |
| ARP 01 | | 7794277 | | 688407 | | 700 | | 5.50 |
| ARP 02 | | 7794214 | | 688355 | | 714 | | 6.30 |
| ARP 03 | | 7794178 | | 688199 | | 760 | | 5.20 |
| ARP 04 | | 7794138 | | 688445 | | 695 | | 4.80 |
| Total - 4 channel samples | | | | | | | | |
Table 7.3-2: Identification and location of the channel samples
| S-K 1300 Technical Report Summary | |
| Rio Piracicaba Project | Page 63 |
Next, Figure 7.3-1 and Figure 7.3-2 present the activities of exploration test pit description and sampling.
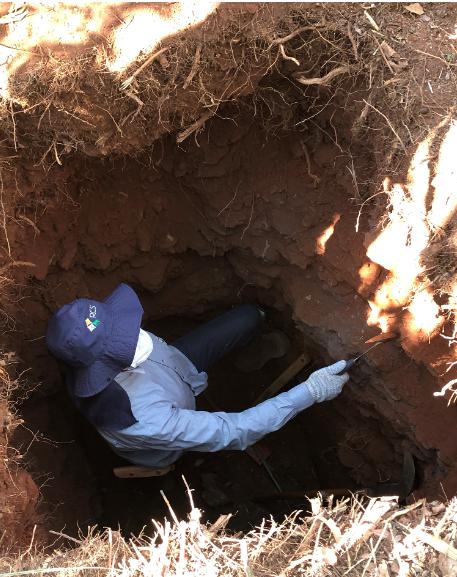
Figure 7.3-1: Exploration well sampling
| S-K 1300 Technical Report Summary | |
| Rio Piracicaba Project | Page 64 |

Figure 7.3-2: Exploration test pit sampling
All samples collected in the channel and in the test pits were submitted to the same preparation protocol and granulochemical analyses as the drill cores. When collecting the samples, special attention was given to representativeness in relation to the sampling area, avoiding deviations. The samples collected on the surface were sent to the Geoanalabs laboratory, located in Jardim Canadá - Nova Lima, MG.
| S-K 1300 Technical Report Summary | |
| Rio Piracicaba Project | Page 65 |
7.4. Planialtimetric Topographic Survey
Planialtimetric topographic survey work carried out in the city of Rio Piracicaba/MG on May 18, 2021. For this work, the Sirgas 2000 Coordinate System was used. The survey area has 22.7 ha and is shown in the Figure 7.4-1.
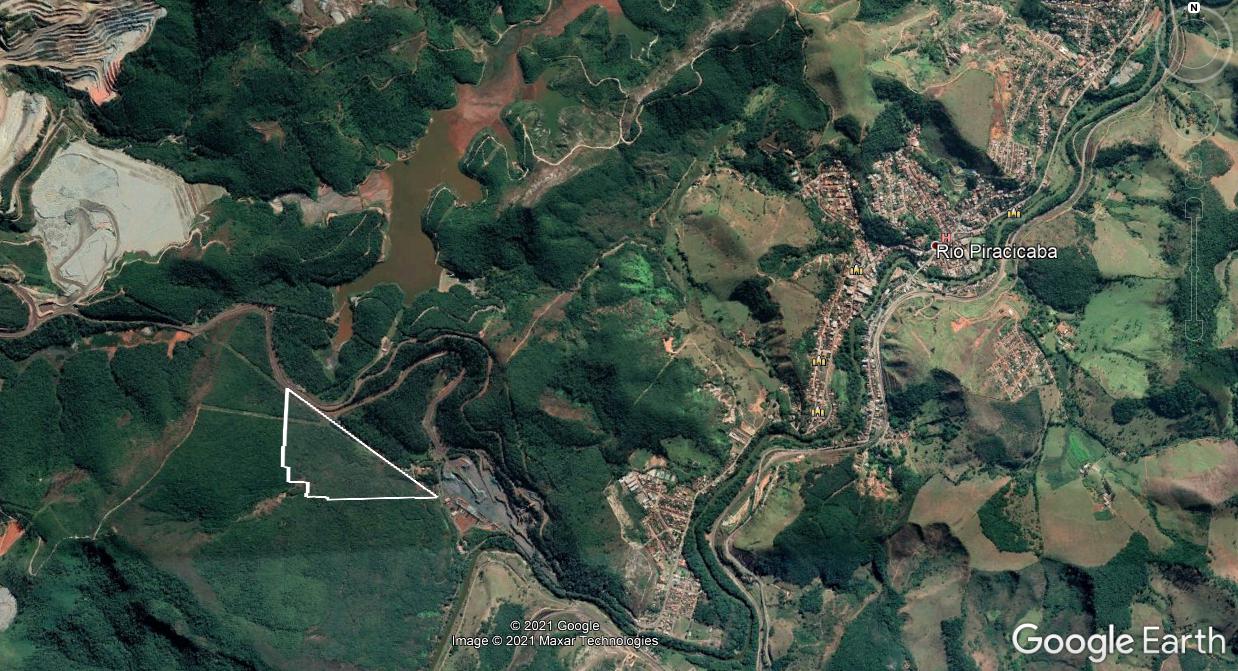
Figure 7.4-1: Location of the study areas
The site has direct access for vehicles, and its predominant cover is dense forest (Figure 7.4-2).

Figure 7.4-2: Access and vegetation cover
| S-K 1300 Technical Report Summary | |
| Rio Piracicaba Project | Page 66 |
To perform this work, we adopted the method of aerophotogrammetric survey by UAV (Unmanned Aerial Vehicle) using topographic reference points (control points) checked with GPS/RTK (Base and Rover) used in post-processing to check the positioning (Figure 7.4-3 and Figure 7.4-4).
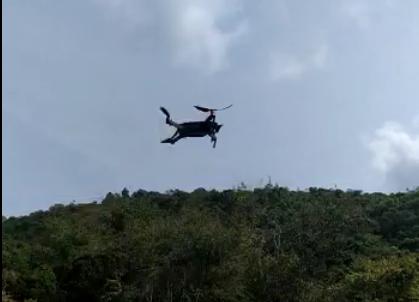
Figure 7.4-3: Drone/ UAV
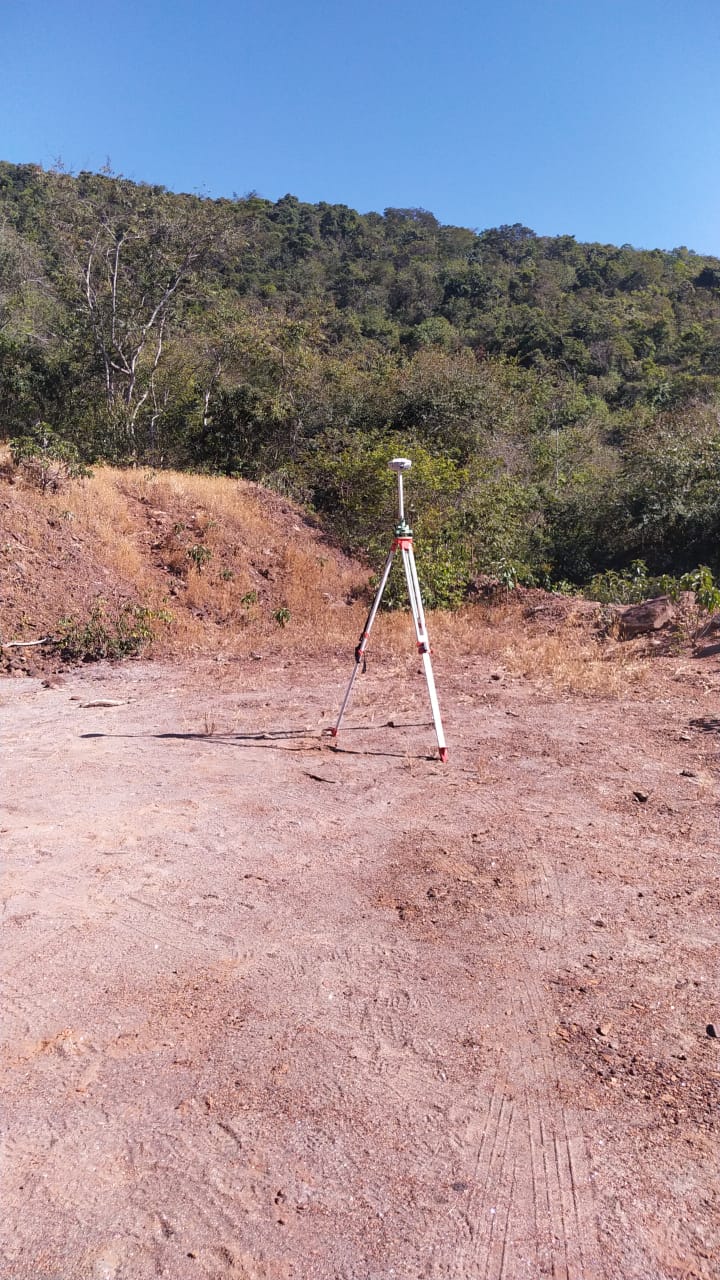
Figure 7.4-4: GPS (Base)
| S-K 1300 Technical Report Summary | |
| Rio Piracicaba Project | Page 67 |
7.4.1. Base and Control Points
The GPS base was installed at the highest point of the terrain and its coordinates are:
| SIRGAS Coordinates |
| | | Latitude (gms) | | Longitude (gms) | | Alt. Geo (m) | | UTM N (m) | | MC |
| Em 2000.4 (that needs to be used) 4 | | - 19° | 56’ | 25.7899” | | - 43° | 12’ | 14.6977” | | 811.71 | | 7794098,400 | | -45 |
| On the survey date 5 | | - 19° | 56’ | 25.7817” | | - 43° | 12’ | 14.6999” | | 811.71 | | 7794098,653 | | -45 |
| Sigma (95%)6 (m) | | 0.003 | | | | 0.008 | | | | 0.016 | | | | |
| Geoidal Model | | MAPGEO2015 | | | | | | | | | | | | |
| Geoidal Waveform (m) | | -8.35 | | | | | | | | | | | | |
| Orthometric Altitude (m) | | 820.06 | | | | | | | | | | | | |
Table 7.4.1-1: GPS base coordinates
Eight control points were surveyed for tying and gauging the aerophotogrammetric study (Figure 7.4.1-1).
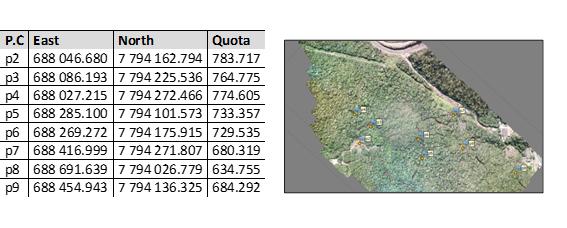
Figure 7.4.1-1: Control points studied
| S-K 1300 Technical Report Summary | |
| Rio Piracicaba Project | Page 68 |
A DJI Mavic Pro model was used to take the photos. The photos were set with lateral overlap of 70% and frontal overlap of 75%. A total of 246 photos were taken during the survey
After the work is done, the images are processed together with the control points (surveyed with GPS). From this processing a Digital Terrain Model (DTM) is generated from which the contour lines are extracted (Figure 7.4.1-2).
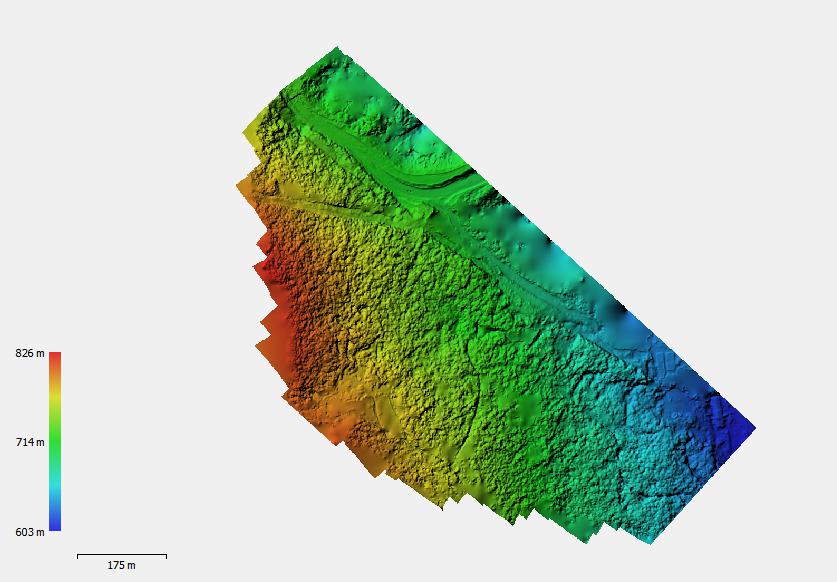
Figure 7.4.1-2: Digital terrain model (DTM)
Note: Appendix 1 presents the detailed report of the image processing for the generation of the DTM that later generated the contour lines.
It is important to emphasize that due to the intense vegetation cover presented at the site, the topographic restitution by image, may present an over-elevation in relation to the natural terrain (Figure 7.4.1-3).
| S-K 1300 Technical Report Summary | |
| Rio Piracicaba Project | Page 69 |

Figure 7.4.1-3: Location of the control points in relation to the generated image
As a result, the georeferenced ortho-photo and level curves were obtained in digital format, represented in the Figure 7.4.1-4 and Figure 7.4.1-5

Figure 7.4.1-4: Georreferenced Ortho-photo
| S-K 1300 Technical Report Summary | |
| Rio Piracicaba Project | Page 70 |
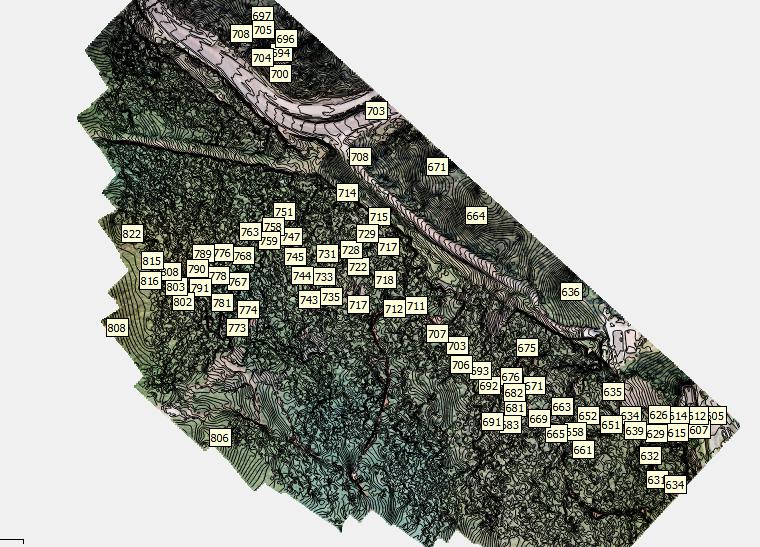
Figure 7.4.1-5: Contour Lines in Digital Format with 1-Meter Gap
7.5. Drillholes Cadastral Survey
Topographic planialtimetric cadastral survey for positioning of drillholes and Test Pits were performed in Rio Piracicaba/MG on June 28, 2021 (Figure 7.5-1).
The Sirgas 2000 Coordinate System was adopted as standard, zoning 23 South.
Precision GPS/RTK (Base and Rover) equipment was used to perform this work and with points post processed in the IBGE database.
Equipment:
Data Collector R20030342506
GPS COMNAV Base T330 6095
GPS Rover COMNAV T330 6048
With all the data downloaded from the collector and GPS base, they are sent for correction to the IBGE database. In response we have a Reading Stabilization report for precision coordinate readings.
After obtaining the Base point with the IBGE correction, the data is entered into the collector and the correction is made by the device itself, which delivers the definitive list of the points surveyed.
| S-K 1300 Technical Report Summary | |
| Rio Piracicaba Project | Page 71 |
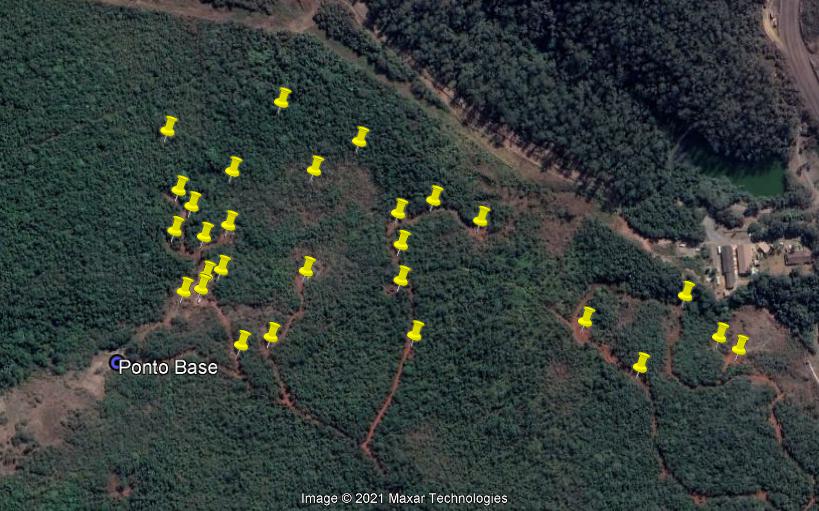
Figure 7.5-1: Points studied
7.6. Density
The density of a rock is defined as the quotient between its mass and volume. That is, density measures the degree of mass concentration in a given volume (d = m/v).
Based on the displacement of volume by the Archimedes principle, it is assumed that every material, partially or totally submerged in a liquid, is subject to a buoyant force E of the liquid, in a vertical direction, from the bottom to the top, and with an intensity equal to the weight of liquid displaced. For this, a vessel with water of known volume and a scale were used.
Steps to measure densities:
| | ● | Selection of sample intervals in drillholes and types of lithologies. |
| | | |
| | ● | Each sample was wrapped in a plastic film, filling all the voids and external irregularities. |
| | | |
| | ● | The sample was weighed, and the mass (kg) registered in an Excel spreadsheet. |
| | | |
| | ● | The sample was then placed in the container with water, determining its total volume = Total Vol (l). |
| | | |
| | ● | The variation of the total volume (Total Vol.) minus the initial volume (Initial Vol.) of each sample was registered in the spreadsheet. |
| | | |
| | ● | At the end, the density calculation was performed according to the photos below (Figure 7.6-1). |
d = Total Mass (kg) / Total Vol. (lt) – Initial Vol. (lt)
| S-K 1300 Technical Report Summary | |
| Rio Piracicaba Project | Page 72 |

Figure 7.6-1: Density tests procedure
To carry out the density tests, different samples from drill cores and from different lithologies were selected and tested (18 samples of siliceous friable itabirite, 4 semi-compact itabirite, 10 compact itabirite, 1 laterite, 2 schist and 13 quartzite samples) (Table 7.6-1 and Table 7.6-2).
| Sample | | Hole ID | | From (m) | | To (m) | | LITO | | Wet weight (kg) | | Volume (l) | | Density (kg/l) |
| | | | | | | | | | | | | | | |
| DRP01 | | FRP 01 | | 17.40 | | 17.50 | | ISC | | 0.755 | | 0.250 | | 3.02 |
| DRP02 | | FRP 01 | | 21.30 | | 21.40 | | ISC | | 0.58 | | 0.180 | | 3.22 |
| DRP03 | | FRP 02 | | 13.20 | | 13.30 | | ISC | | 0.708 | | 0.230 | | 3.08 |
| DRP04 | | FRP 02 | | 3.90 | | 4.00 | | ISC | | 0.652 | | 0.200 | | 3.26 |
| DRP05 | | FRP 02 | | 4.30 | | 4.40 | | IFS | | 0.565 | | 0.200 | | 2.83 |
| DRP06 | | FRP 02 | | 8.50 | | 8.60 | | IFS | | 0.661 | | 0.220 | | 3.00 |
| DRP07 | | FRP 02 | | 16.50 | | 16.60 | | IFS | | 0.704 | | 0.220 | | 3.20 |
| DRP08 | | FRP 02 | | 19.60 | | 19.75 | | IFS | | 0.920 | | 0.310 | | 2.97 |
| DRP09 | | FRP 03 | | 1.60 | | 1.70 | | LT | | 0.446 | | 0.260 | | 1.72 |
| DRP10 | | FRP 03 | | 4.40 | | 4.50 | | IFS | | 0.677 | | 0.200 | | 3.4 |
| DRP11 | | FRP 03 | | 6.30 | | 6.40 | | IFS | | 0.576 | | 0.280 | | 2.06 |
| DRP12 | | FRP 03 | | 19.80 | | 19.90 | | IFS | | 0.424 | | 0.160 | | 2.65 |
| DRP13 | | FRP 03 | | 30.40 | | 30.50 | | IFS | | 0.481 | | 0.240 | | 2.00 |
| DRP14 | | FRP 03 | | 35.40 | | 35.50 | | QZT | | 0.688 | | 0.250 | | 2.8 |
| DRP15 | | FRP 03 | | 43.95 | | 44.05 | | QZT | | 0.473 | | 0.190 | | 2.5 |
| DRP 16 | | FRP 04 | | 7.60 | | 7.70 | | IFS | | 0.603 | | 0.180 | | 3.4 |
| DRP 17 | | FRP 04 | | 7.20 | | 7.30 | | IFS | | 0.467 | | 0.110 | | 4.2 |
| DRP 18 | | FRP 04 | | 21.68 | | 21.75 | | IC | | 0.558 | | 0.190 | | 2.9 |
| DRP 19 | | FRP 04 | | 24.50 | | 24.57 | | IC | | 0.604 | | 0.200 | | 3.0 |
| DRP 20 | | FRP 04 | | 29.85 | | 29.95 | | QZT | | 0.375 | | 0.140 | | 2.7 |
| DRP 21 | | FRP 04 | | 40.35 | | 40.45 | | QZT | | 0.717 | | 0.260 | | 2.8 |
| DRP 22 | | FRP 05 | | 14.70 | | 14.75 | | IFS | | 0.422 | | 0.110 | | 3.8 |
| DRP 23 | | FRP 05 | | 10.29 | | 10.35 | | IFS | | 0.600 | | 0.170 | | 3.5 |
| DRP 24 | | FRP 05 | | 18.05 | | 18.12 | | IC | | 0.616 | | 0.190 | | 3.2 |
| DRP 25 | | FRP 05 | | 18.20 | | 18.30 | | IC | | 0.735 | | 0.210 | | 3.5 |
| DRP 26 | | FRP 05 | | 23.60 | | 23.66 | | QZT | | 0.392 | | 0.140 | | 2.8 |
| DRP 27 | | FRP 05 | | 24.25 | | 24.32 | | QZT | | 0.408 | | 0.190 | | 2.1 |
| DRP 28 | | FRP 05 | | 31.25 | | 31.30 | | QZT | | 0.348 | | 0.110 | | 3.2 |
| DRP 29 | | FRP 05 | | 32.80 | | 32.90 | | QZT | | 0.677 | | 0.250 | | 2.7 |
| DRP 30 | | FRP 06 | | 5.21 | | 5.27 | | IFS | | 0.537 | | 0.150 | | 3.6 |
| DRP 31 | | FRP 06 | | 9.12 | | 9.20 | | QZT | | 0.555 | | 0.240 | | 2.3 |
| DRP 32 | | FRP 07 | | 4.00 | | 4.10 | | IFS | | 0.610 | | 0.190 | | 3.2 |
| DRP 33 | | FRP 07 | | 6.00 | | 6.05 | | IC | | 0.621 | | 0.170 | | 3.7 |
| DRP 34 | | FRP 07 | | 14.27 | | 14.35 | | QZT | | 0.584 | | 0.210 | | 2.8 |
| DRP 35 | | FRP 07 | | 17.78 | | 17.85 | | QZT | | 0.591 | | 0.200 | | 3.0 |
| DRP 36 | | FRP 08 | | 4.00 | | 4.05 | | IFS | | 0.452 | | 0.160 | | 2.83 |
| DRP 37 | | FRP 08 | | 8.30 | | 8.35 | | IFS | | 0.550 | | 0.190 | | 2.89 |
| DRP 38 | | FRP 08 | | 12.25 | | 12.34 | | IC | | 0.823 | | 0.240 | | 3.43 |
| DRP 39 | | FRP 08 | | 14.25 | | 14.30 | | IC | | 0.461 | | 0.140 | | 3.29 |
| DRP 40 | | FRP 08 | | 19.86 | | 19.93 | | QZT | | 0.621 | | 0.210 | | 2.96 |
| DRP 41 | | FRP 08 | | 23.13 | | 23.20 | | XI | | 0.562 | | 0.210 | | 2.68 |
| DRP 42 | | FRP 09 | | 2.30 | | 2.35 | | IFS | | 0.469 | | 0.150 | | 3.13 |
| DRP 43 | | FRP 09 | | 6.42 | | 6.48 | | IFS | | 0.483 | | 0.160 | | 3.02 |
| DRP 44 | | FRP 09 | | 9.93 | | 9.98 | | IC | | 0.412 | | 0.120 | | 3.43 |
| DRP 45 | | FRP 09 | | 13.80 | | 13.90 | | IC | | 0.897 | | 0.290 | | 3.09 |
| DRP 46 | | FRP 09 | | 17.31 | | 17.40 | | IC | | 0.847 | | 0.260 | | 3.26 |
| DRP 47 | | FRP 09 | | 18.15 | | 18.25 | | QZT | | 0.751 | | 0.280 | | 2.68 |
| DRP 48 | | FRP 09 | | 24.30 | | 24.36 | | XI | | 0.456 | | 0.190 | | 2.40 |
Table 7.6-1: Data summary
| S-K 1300 Technical Report Summary | |
| Rio Piracicaba Project | Page 73 |
| Lithology | | Density (t/m³) |
| Friable Silicious Itabirite | IFS | | 3.10 |
| Semi-compact Itabirite | ISC | | 3.15 |
| Compact Itabirite | IC | | 3.30 |
| Quartzite | QZT | | 2.26 |
| Laterite | LT | | 2.70 |
| Schist | XI | | 2.54 |
Table 7.6-2: Average density values by lithology
8. Sample Preparation, Analysis and Security
Apollo Resources contracted GeoAnalabs Laboratórios Ltda for drill cores, test pits and channel samples granulochemical analysis. GeoAnalabs has international certification ISO 9001:2015 for samples preparation and chemical assays of rocks and soils by SAS, a certifier recognized by the IAF - International Accreditation Forum (Australia) and by INMETRO (Brazil).
A total of fifty-five drill core samples, fifteen test pit samples, and four channel samples were generated, totaling seventy-four granulometric analyses, 222 chemical assay analyses.
The chemical analysis certificates files obtained from the drill cores, wells, and channels samples are available at Apollo Resources’ office, as long as drill core logs and sampling plans original documents.
8.1. Sampling Method
The procedure for preparation and analyses of drill core samples was the same as that applied for the channel and research well samples as shown below.
The samples were dried at 105°C and dry screened in the ranges: 19.00mm; 6.30mm; 3.35mm; 1.00mm; 0.150mm; 0.075mm.
After screening, they were grouped to be analyzed in the following ranges: +6.30mm; -6.30mm +1.00mm; -1.00 mm.
The samples, then homogenized in the presented ranges were crushed to 3mm with 95% passing < 3.00mm. The samples were homogenized, quartered from 100 to 200 g, and pulverized to a minimum of 95% < 0.106mm, according to ABNT (Associação Brasileira de Normas Técnicas) and ISO standards.
8.2. Sample Assay
The Fe%, Mn%, SiO2%, P%, Al2O3%, CaO%, MgO%, TiO2%, Na2O%, K2O%, Cr2O3% contents were determined by fusion / X-ray Fluorescence (XRF) Spectrometry.
Assays of the major oxides by XRF
The sample was dried at 105oC and a 0.5 to 1g sample was mixed with lithium tetraborate flux, which was melted and poured into a mold to form a glassy disk. The samples were analyzed by Wavelength X-Ray Fluorescence Spectrometer.
The loss on ignition (LOI) was analyzed by placing 1.5 to 2g of the sample in a crucible, heating at 1000oC for one hour, cooling and weighing the sample.
After checking the results, the reserve samples from the drill cores were returned to the core shed and archived along with the remaining half of the drill cores.
8.3. Sample Security
Apollo Resources maintains samples control protocol. Individual samples were sealed in packages at the Project site. These packages, after proper labeling and identification, were sent in pre-determined lots to the Laboratory in Nova Lima - MG for preparation and assaying,
Apollo Resources retains the pulps and coarse tailings of its samples in a secure warehouse in Rio Piracicaba, MG, close to the exploration site.
| S-K 1300 Technical Report Summary | |
| Rio Piracicaba Project | Page 74 |
8.4. Results
Table 8.4-2 contains all the samples taken for chemical assaying, their respective intervals, lengths, and chemical calculated global results, as well as the lithology codes per interval. Table 8.4-1 presents the lithology codes.
The global results for Fe%, SiO2%, Al2O3%, Mn%, P%, LOI% contents were calculated from the chemical assays in fractions G1 > 6.3mm, 1mm > G2 < 6.3mm and G3 <1mm, weighted average by the mass recovery in each fraction.
| Lithology codes |
| Friable Silicious Itabirite | IFS |
| Semi-compact Itabirite | ISC |
| Compact Itabirite | IC |
| Quartzite | QZT |
| Colluvium /rolled | CR |
| Laterite | LT |
| Manganese | Mn |
| Hematite | HC |
| Schist | XI |
Table 8.4-1: Lithology codes
NS = not sampled
| Drill Cores | | Samples | | From (m) | | To (m) | | Thickness (m) | | Lithology | | Fe% | | SiO2% | | Al2O3% | | Mn% | | P% | | LOI% |
| FRP 01 | | FRP 01_01 | | 0.00 | | 2.50 | | 2.50 | | CR | | 42.02 | | 23.33 | | 7.01 | | 1.20 | | 0.090 | | 6.64 |
| FRP 01 | | FRP 01_02 | | 2.50 | | 6.50 | | 4.00 | | IFS | | 33.38 | | 47.63 | | 0.99 | | 1.61 | | 0.019 | | 1.31 |
| FRP 01 | | FRP 01_03 | | 6.50 | | 10.50 | | 4.00 | | IFS | | 33.38 | | 49.67 | | 1.24 | | 0.03 | | 0.009 | | 0.56 |
| FRP 01 | | FRP 01_04 | | 10.50 | | 14,50 | | 4,00 | | IFS | | 35.90 | | 47.46 | | 0.47 | | 0.06 | | <0.004 | | 0.18 |
| FRP 01 | | FRP 01_05 | | 14.50 | | 19.00 | | 4.50 | | ISC | | 32.43 | | 52.11 | | 0.56 | | 0.29 | | <0.004 | | 0.43 |
| FRP 01 | | FRP 01_06 | | 19.00 | | 22.35 | | 3.35 | | ISC | | 29.18 | | 56.58 | | 0.97 | | 0.01 | | <0.004 | | 0.21 |
| FRP 01 | | NS | | 22.35 | | 78.30 | | 55.95 | | QZT | | - | | - | | - | | - | | - | | - |
| FRP 02 | | NS | | 0.00 | | 1.10 | | 1.10 | | LT | | - | | - | | - | | - | | - | | - |
| FRP 02 | | FRP-02_01 | | 1.10 | | 4.00 | | 2.90 | | IC | | 29.78 | | 56.90 | | 0.15 | | 0.04 | | 0.010 | | 0.17 |
| FRP 02 | | FRP-02_02 | | 4.00 | | 7.80 | | 3.80 | | IFS | | 34.75 | | 49.71 | | 0.09 | | 0.02 | | 0.005 | | 0.43 |
| FRP 02 | | FRP-02_03 | | 7.80 | | 12.50 | | 4.70 | | IFS | | 31.01 | | 55.13 | | 0.34 | | 0.01 | | <0.004 | | 0.09 |
| FRP 02 | | FRP-02_04 | | 12.50 | | 16.60 | | 4.10 | | IFS | | 31.48 | | 54.31 | | 0.48 | | 0.02 | | <0.004 | | 0.12 |
| FRP 02 | | FRP-02_05 | | 16.60 | | 20.00 | | 3.40 | | IFS | | 34.64 | | 50.30 | | 0.09 | | 0.01 | | <0.004 | | 0.04 |
| FRP 02 | | FRP-02_06 | | 20.00 | | 25.00 | | 5.00 | | IFS | | 34.78 | | 49.59 | | 0.40 | | 0.02 | | <0.004 | | 0.15 |
| FRP 02 | | FRP-02_07 | | 25.00 | | 30.00 | | 5.00 | | IFS | | 33.35 | | 51.52 | | 0.43 | | 0.04 | | <0.004 | | 0.17 |
| S-K 1300 Technical Report Summary | |
| Rio Piracicaba Project | Page 75 |
| Drill Cores | | Samples | | From (m) | | To (m) | | Thickness (m) | | Lithology | | Fe% | | SiO2% | | Al2O3% | | Mn% | | P% | | LOI% |
| FRP 02 | | FRP-02_08 | | 30.00 | | 34.20 | | 4.20 | | IFS | | 30.74 | | 55.18 | | 0.47 | | 0.01 | | <0.004 | | 0.17 |
| FRP 02 | | NS | | 34.20 | | 44.55 | | 10.35 | | QZT | | - | | - | | - | | - | | - | | - |
| FRP 03 | | NS | | 0.00 | | 3.45 | | 3.45 | | LT | | - | | - | | - | | - | | - | | - |
| FRP 03 | | FRP-03_01 | | 3.45 | | 6.05 | | 2.60 | | IFS | | 36.87 | | 32.65 | | 6.98 | | 1.91 | | 0.022 | | 4.52 |
| FRP 03 | | NS | | 6.05 | | 13.10 | | 7.05 | | QZT | | - | | - | | - | | - | | - | | - |
| FRP 03 | | FRP-03_02 | | 13.10 | | 17.10 | | 4.00 | | IFS | | 32.03 | | 51.88 | | 1.10 | | 0.02 | | <0.004 | | 0.23 |
| FRP 03 | | FRP-03_03 | | 17.10 | | 21.35 | | 4.25 | | IFS | | 31.26 | | 52.13 | | 1.45 | | 0.03 | | 0.008 | | 0.36 |
| FRP 03 | | NS | | 21.35 | | 45.60 | | 24.25 | | QZT | | - | | - | | - | | - | | - | | - |
| FRP 04 | | FRP-04_01 | | 0.00 | | 3.25 | | 3.25 | | LT | | 32.89 | | 33.47 | | 9.53 | | 1.49 | | 0.035 | | 6.55 |
| FRP 04 | | FRP-04_02 | | 3.25 | | 6.85 | | 3.60 | | IFS | | 39.03 | | 40.76 | | 2.01 | | 0.16 | | 0.009 | | 0.97 |
| FRP 04 | | FRP-04_03 | | 6.85 | | 9.80 | | 2.95 | | ISC | | 41.81 | | 31.38 | | 4.81 | | 0.65 | | 0.060 | | 2.80 |
| FRP 04 | | FRP-04_04 | | 9.80 | | 14.00 | | 4.20 | | IFS | | 30.33 | | 55.01 | | 0.55 | | 0.06 | | 0.009 | | 0.59 |
| FRP 04 | | FRP-04_05 | | 14.00 | | 19.20 | | 5.20 | | IFS | | 29.69 | | 56.48 | | 0.24 | | 0.05 | | 0.015 | | 0.35 |
| FRP 04 | | FRP-04_06 | | 19.20 | | 25.10 | | 5.90 | | IC | | 29.74 | | 56.64 | | 0.44 | | 0.04 | | 0.012 | | 0.11 |
| FRP 04 | | FRP-04_07 | | 25.10 | | 25.75 | | 0.65 | | QZT | | 2.81 | | 83.29 | | 8.17 | | 0.17 | | <0.004 | | 1.45 |
| FRP 04 | | NS | | 25.75 | | 47.60 | | 21.85 | | - | | - | | - | | - | | - | | - | | - |
| FRP 05 | | FRP-05_01 | | 0.00 | | 1.20 | | 1.20 | | LT | | 32.87 | | 33.51 | | 9.40 | | 0.26 | | 0.058 | | 8.54 |
| FRP 05 | | FRP-05_02 | | 1.20 | | 3.05 | | 1.85 | | IFS | | 33.06 | | 42.60 | | 4.70 | | 1.86 | | 0.023 | | 2.53 |
| FRP 05 | | NS | | 3.05 | | 8.10 | | 5.05 | | - | | - | | - | | — | | | | — | | |
| FRP 05 | | FRP-05_03 | | 8.10 | | 11.85 | | 3.75 | | IFS | | 35.62 | | 44.81 | | 1.77 | | 0.90 | | 0.011 | | 1.03 |
| FRP 05 | | FRP-05_04 | | 11.85 | | 15.40 | | 3.55 | | IFS | | 32.73 | | 52.18 | | 0.49 | | 0.05 | | <0.004 | | 0.27 |
| FRP 05 | | FRP-05_05 | | 15.40 | | 19.20 | | 3.80 | | SCI | | 29.26 | | 56.25 | | 0.87 | | 0.04 | | 0.008 | | 0.34 |
| S-K 1300 Technical Report Summary | |
| Rio Piracicaba Project | Page 76 |
| Drill Cores | | Samples | | From (m) | | To (m) | | Thickness (m) | | Lithology | | Fe% | | SiO2% | | Al2O3% | | Mn% | | P% | | LOI% |
| FRP 05 | | FRP-05_06 | | 19.20 | | 20.50 | | 1.30 | | QZT | | 3.41 | | 84.23 | | 7.24 | | <0.01 | | 0.005 | | 1.16 |
| FRP 05 | | NS | | 20.50 | | 34.95 | | 14.45 | | - | | - | | - | | - | | - | | - | | - |
| FRP 06 | | FRP-06_01 | | 0.00 | | 1.70 | | 1.70 | | LT | | 27.70 | | 23.46 | | 20.06 | | 0.04 | | 0.049 | | 14.88 |
| FRP 06 | | FRP-06_02 | | 1.70 | | 3.10 | | 1.40 | | IC | | 28.43 | | 46.06 | | 5.20 | | 4.23 | | 0.047 | | 1.11 |
| FRP 06 | | FRP-06_03 | | 3.10 | | 6.50 | | 3.40 | | IFS | | 30.87 | | 54.19 | | 0.74 | | 0.07 | | 0.006 | | 0.67 |
| FRP 06 | | FRP-06_04 | | 6.50 | | 7.25 | | 0.75 | | QZT | | 6.04 | | 82.25 | | 5.74 | | 0.14 | | <0.004 | | 1.22 |
| FRP 06 | | NS | | 7.25 | | 26.15 | | 18.90 | | - | | - | | - | | - | | - | | - | | - |
| FRP 07 | | FRP-07_01 | | 0.00 | | 1.50 | | 1.50 | | LT | | 24.71 | | 37.81 | | 12.98 | | 0.03 | | 0.044 | | 12.05 |
| FRP 07 | | FRP-07_02 | | 1.50 | | 4.00 | | 2.50 | | IC | | 27.15 | | 56.05 | | 2.67 | | 0.69 | | 0.012 | | 1.11 |
| FRP 07 | | FRP-07_03 | | 4.00 | | 7.15 | | 3.15 | | ISC | | 27.58 | | 59.83 | | 0.29 | | 0.02 | | 0.006 | | 0.22 |
| FRP 07 | | FRP-07_04 | | 7.15 | | 8.15 | | 1.00 | | QZT | | 3.95 | | 80.58 | | 8.80 | | 0.02 | | 0.006 | | 1.43 |
| FRP 07 | | NS | | 8.15 | | 20.30 | | 12.15 | | - | | - | | - | | - | | - | | - | | - |
| FRP 08 | | FRP-08_01 | | 0.00 | | 3.35 | | 3.35 | | LT | | 28.12 | | 35.92 | | 14.30 | | 0.07 | | 0.036 | | 8.22 |
| FRP 08 | | FRP-08_02 | | 3.35 | | 8.35 | | 5.00 | | IFS | | 31.36 | | 53.33 | | 0.93 | | 0.04 | | <0.004 | | 0.27 |
| FRP 08 | | FRP-08_03 | | 8.35 | | 11.60 | | 3.25 | | IFS | | 27.20 | | 58.33 | | 1.49 | | 0.04 | | 0.006 | | 0.38 |
| FRP 08 | | FRP-08_04 | | 11.60 | | 17.10 | | 5.50 | | IC | | 29.31 | | 57.71 | | 0.10 | | 0.04 | | 0.008 | | 0.04 |
| FRP 08 | | FRP-08_05 | | 17.10 | | 19.20 | | 2.10 | | IC | | 22.25 | | 62.95 | | 3.32 | | 0.02 | | 0.007 | | 0.53 |
| FRP 08 | | FRP-08_06 | | 19.20 | | 20.20 | | 1.00 | | QZT | | 2.22 | | 76.42 | | 12.97 | | 0.16 | | 0.015 | | 1.88 |
| FRP 08 | | NS | | 20.20 | | 23.70 | | 3.50 | | QZT | | - | | - | | - | | - | | - | | - |
| FRP 09 | | FRP-09_01 | | 0.00 | | 3.40 | | 3.40 | | IFS | | 31.49 | | 52.34 | | 1.20 | | 0.40 | | 0.021 | | 0.60 |
| FRP 09 | | FRP-09_02 | | 3.40 | | 6.75 | | 3.35 | | IFS | | 30.80 | | 55.24 | | 0.43 | | 0.03 | | 0.005 | | 0.15 |
| S-K 1300 Technical Report Summary | |
| Rio Piracicaba Project | Page 77 |
| Drill Cores | | Samples | | From (m) | | To (m) | | Thickness (m) | | Lithology | | Fe% | | SiO2% | | Al2O3% | | Mn% | | P% | | LOI% |
| FRP 09 | | FRP-09_03 | | 6.75 | | 9.00 | | 2.25 | | IFS | | 28.58 | | 56.67 | | 1.23 | | 0.04 | | 0.023 | | 0.59 |
| FRP 09 | | FRP-09_04 | | 9.00 | | 12.40 | | 3.40 | | IFS | | 29.35 | | 57.41 | | 0.22 | | 0.02 | | 0.005 | | 0.01 |
| FRP 09 | | FRP-09_05 | | 12.40 | | 17.70 | | 5.30 | | ISC | | 27.96 | | 57.12 | | 1.87 | | 0.02 | | <0.004 | | 0.25 |
| FRP 09 | | FRP-09_06 | | 17.70 | | 18.25 | | 0.55 | | QZT | | 18.59 | | 66.31 | | 4.19 | | 0.02 | | <0.004 | | 1.23 |
| FRP 09 | | FRP-09_07 | | 18.25 | | 24.70 | | 6.45 | | QZT | | 2.23 | | 79.65 | | 10.96 | | 0.02 | | 0.004 | | 1.62 |
| FRP 10 | | FRP-10_01 | | 0.00 | | 4.95 | | 4.95 | | ISC | | 30.62 | | 42.52 | | 7.86 | | 0.27 | | 0.059 | | 4.93 |
| FRP 10 | | FRP-10_02 | | 4.95 | | 9.25 | | 4.30 | | IFS | | 30.06 | | 52.66 | | 1.73 | | 0.97 | | 0.049 | | 0.96 |
| FRP 10 | | FRP-10_03 | | 9.25 | | 14.50 | | 5.25 | | IFS | | 34.33 | | 50.22 | | 0.28 | | 0.04 | | 0.022 | | 0.07 |
| FRP 10 | | FRP-10_04 | | 14.50 | | 19.90 | | 5.40 | | IFS | | 29.95 | | 55.74 | | 0.63 | | 0.26 | | 0.008 | | 0.31 |
| FRP 10 | | FRP-10_05 | | 19.90 | | 22.35 | | 2.45 | | IFS | | 30.85 | | 54.10 | | 1.15 | | 0.04 | | 0.006 | | 0.07 |
| FRP 10 | | FRP-10_06 | | 22.35 | | 28.30 | | 5.95 | | QZT | | 3.62 | | 78.31 | | 10.76 | | 0.04 | | 0.010 | | 1.42 |
| FRP 11 | | FRP-11_01 | | 0.00 | | 4.65 | | 4.65 | | CI | | 29.87 | | 56.46 | | 0.28 | | 0.04 | | 0.009 | | 0.19 |
| FRP 11 | | FRP-11_02 | | 4.65 | | 9.60 | | 4.95 | | QZT | | 2.24 | | 79.28 | | 11.73 | | 0.06 | | 0.016 | | 2.02 |
| PRP 01 | | PRP 01_01 | | 0.50 | | 1.50 | | 1.00 | | IFS | | 32.15 | | 48.25 | | 1.81 | | 0.07 | | 0.012 | | 1.47 |
| PRP 02 | | PRP 02_01 | | 0.30 | | 0.80 | | 0.50 | | CR | | 46.49 | | 11.96 | | 9.00 | | 0.41 | | 0.082 | | 7.91 |
| PRP 02 | | PRP 02_02 | | 0.80 | | 1.65 | | 0.85 | | CR | | 48.57 | | 10.97 | | 8.09 | | 0.61 | | 0.066 | | 6.97 |
| PRP 03 | | PRP 03_01 | | 0.00 | | 0.70 | | 0.70 | | CR | | 40.43 | | 28.91 | | 3.52 | | 2.12 | | 0.071 | | 3.63 |
| PRP 03 | | PRP 03_02 | | 0.70 | | 1.10 | | 0.40 | | IF | | 44.67 | | 17.05 | | 6.85 | | 0.16 | | 0.086 | | 8.12 |
| PRP 04 | | PRP 04_01 | | 0.00 | | 0.40 | | 0.40 | | CR | | 36.69 | | 39.51 | | 1.84 | | 1.80 | | 0.018 | | 1.06 |
| PRP 04 | | PRP 04_02 | | 0.40 | | 0.80 | | 0.40 | | ISC | | 30.41 | | 37.04 | | 6.98 | | 3.77 | | 0.072 | | 5.03 |
| S-K 1300 Technical Report Summary | |
| Rio Piracicaba Project | Page 78 |
| Drill Cores | | Samples | | From (m) | | To (m) | | Thickness (m) | | Lithology | | Fe% | | SiO2% | | Al2O3% | | Mn% | | P% | | LOI% |
| PRP 04 | | PRP 04_03 | | 0.80 | | 2.50 | | 1.70 | | IFS | | 36.76 | | 24.82 | | 10.22 | | 0.43 | | 0.058 | | 7.22 |
| PRP 05 | | NS | | 0.00 | | 1.00 | | 1.00 | | ISC | | - | | - | | - | | - | | - | | - |
| PRP 06 | | NS | | 0.00 | | 2.50 | | 2.50 | | LT | | - | | - | | - | | - | | - | | - |
| PRP 07 | | PRP 07_01 | | 2.55 | | 3.40 | | 0.85 | | IFS | | 39.66 | | 34.71 | | 2.79 | | 0.45 | | 0.039 | | 2.13 |
| PRP 10 | | NS | | 0.00 | | 3.20 | | 3.20 | | LT | | - | | - | | - | | - | | - | | - |
| PRP 11 | | PRP 11_01 | | 0.20 | | 1.30 | | 1.10 | | CR | | 37.61 | | 26.99 | | 7.80 | | 2.34 | | 0.068 | | 5.12 |
| PRP 12 | | PRP 12_01 | | 0.80 | | 2.00 | | 1.20 | | CR | | 26.82 | | 40.40 | | 9.30 | | 1.61 | | 0.076 | | 6.72 |
| PRP 13 | | NS | | 0.00 | | 0.9 | | 0.90 | | LT | | - | | - | | - | | - | | - | | - |
| PRP 13 | | NS | | 0.90 | | 1.00 | | 0.10 | | IC | | - | | - | | - | | - | | - | | - |
| PRP 14 | | NS | | 0.00 | | 0.8 | | 0.80 | | IC | | - | | - | | - | | - | | - | | - |
| PRP 15 | | PRP 15_01 | | 0.00 | | 2.00 | | 2.00 | | IC | | 34.18 | | 31.52 | | 5.60 | | 6.34 | | 0.061 | | 4.80 |
| PRP 15 | | PRP 15_02 | | 2.00 | | 2.50 | | 0.50 | | IFS | | 40.63 | | 38.22 | | 1.28 | | 0.92 | | 0.022 | | 1.00 |
| PRP 15 | | PRP 15_03 | | 2.50 | | 3.50 | | 1.00 | | Mn | | 19.76 | | 5.92 | | 3.93 | | 35.18 | | 0.028 | | 12.22 |
| PRP 16 | | NS | | 0.00 | | 1.20 | | 1.20 | | LT | | - | | - | | - | | - | | - | | - |
| PRP 16 | | NS | | 1.20 | | 2.30 | | 1.10 | | IC | | - | | - | | - | | - | | - | | - |
| PRP 17 | | PRP 17_01 | | 5.00 | | 5.50 | | 0.50 | | IFS | | 31.93 | | 50.73 | | 2.14 | | 0.10 | | 0.006 | | 1.14 |
| PRP 18 | | NS | | 0.00 | | 2.50 | | 2.50 | | SO | | - | | - | | - | | - | | - | | - |
| PRP 18 | | NS | | 2.50 | | 10.00 | | 7.50 | | XI | | - | | - | | - | | - | | - | | - |
| PRP 19 | | NS | | 0.00 | | 5.30 | | 5.30 | | LT | | - | | - | | - | | - | | - | | - |
| PRP 19 | | PRP 19 _01 | | 5.30 | | 6.80 | | 1.50 | | XI | | 12.03 | | 41.93 | | 21.83 | | 1.92 | | 0.094 | | 14.59 |
| PRP 20 | | NS | | 0.00 | | 2.00 | | 2.00 | | XI | | - | | - | | - | | - | | - | | - |
| PRP 20 | | PRP 20_01 | | 2.00 | | 2.80 | | 0.80 | | XI | | 11.79 | | 50.57 | | 22.75 | | 0.15 | | 0.063 | | 7.99 |
| PRP 21 | | NS | | 0.00 | | 6.80 | | 6.80 | | XI | | - | | - | | - | | - | | - | | - |
| ARP 01 | | ARP 01 | | 0.00 | | 5.00 | | 5.00 | | XI | | 13.29 | | 55.47 | | 11.84 | | 5.04 | | 0.053 | | 1.98 |
| ARP 02 | | ARP 02 | | 0.00 | | 5.30 | | 5.30 | | IC | | 22.53 | | 19.15 | | 8.73 | | 21.78 | | 0.078 | | 8.31 |
| ARP 03 | | ARP 03 | | 0.00 | | 2.20 | | 2.20 | | HC | | 64.82 | | 1.71 | | 0.69 | | 0.14 | | 0.007 | | 0.32 |
| ARP 04 | | ARP 04 | | 0.00 | | 4.30 | | 4.30 | | IC | | 28.71 | | 39.80 | | 7.44 | | 5.35 | | 0.032 | | 0.80 |
Table 8.4-2: Global calculated contents
| S-K 1300 Technical Report Summary | |
| Rio Piracicaba Project | Page 79 |
9. Data Verification
9.1. Site Visit
Dr. Volodymyr Myadzel, geologist, visited the Project area on November 11, 2021. The visit was attended by Joel Monteiro (VP, Administration & Operations, Apollo Resources) and Orlando Garcia da Rocha Filho (geologist and co-author of this Report).
The purpose of the visit was to get to know the Project and verify the work done in the field, in terms of geological exploration, in accordance with the basic principles governing the application and operation of the S-K 1300 TRS format: transparency, materiality and competence, and also in accordance with the best practices of the mineral industry.
The technical visit covered the core storage shack, the Project area, and the mineralized zone in the field.
The images below show photos taken during the site visit (Figure 9.1-1 and Figure 9.1-2).

Figure 9.1-1: Example of core sample box
| S-K 1300 Technical Report Summary | |
| Rio Piracicaba Project | Page 80 |
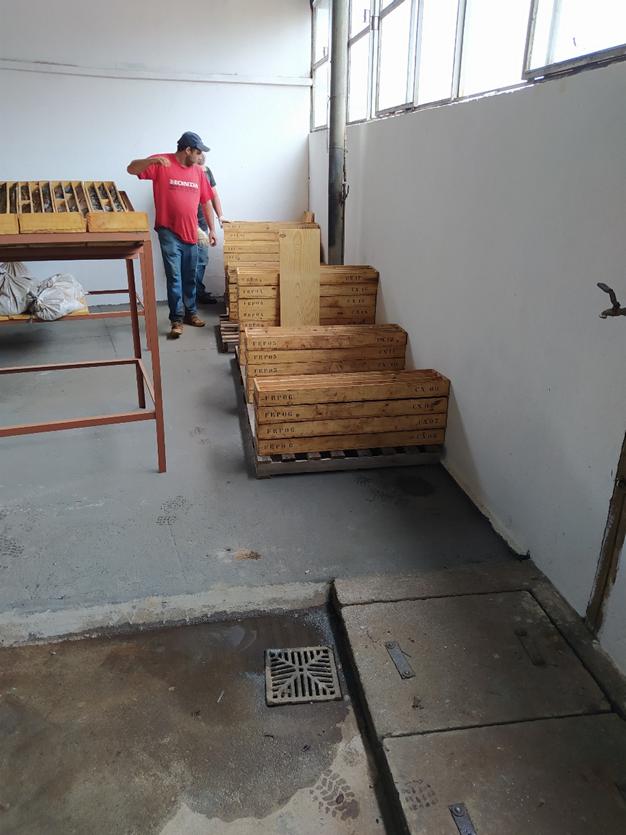
Figure 9.1-2: Core sample shed storage
The drill hole collars are identified; however, all marks of the drill holes have been embedded by request of the area owner (Figure 9.1-3).
| S-K 1300 Technical Report Summary | |
| Rio Piracicaba Project | Page 81 |

Figure 9.1-3: Drill hole collar - technical site visit
During the visit, it was observed that the Apollo Resources technical team has been developing the work following the best practices of the mining industry.
| S-K 1300 Technical Report Summary | |
| Rio Piracicaba Project | Page 82 |
9.2. GeoAnalabs QA/QC (Quality Assurance and Quality Control)
| | ● | GeoAnalabs’ internal QA/QC procedures consist of: |
| | | |
| | ● | LIMS software is used during data acquisition in the laboratory to eliminate manual data input errors. The software is also used in the statistical treatment of Quality controls. |
| | | |
| | ● | Periodically calibration of all critical equipment. |
| | | |
| | ● | Verification every 20 (twenty) samples with international standards. |
| | | |
| | ● | Five percent of the samples have the sample particle size evaluated during to ensure preparation with 95% passing the specified screen size. |
| | | |
| | ● | The lot size is 25 (twenty-five) samples. Duplicate samples are prepared for every 20 (twenty) samples, reference standard samples are inserted into the same stream at a minimum rate of 1 (one) in 20 (twenty) samples and a blank sample is inserted into each batch. |
| | | |
| | ● | Samples with anomalous results are repeated. If the repetition does not duplicate the original value, then a new sample is prepared from the reserve sample. |
9.3. QA/QC Methodology
QA/QC practices of Apollo Resources’ Rio Piracicaba Project was carried out using standard samples, to verify the analysis accuracy (the closeness of those measurements to the “true” or accepted value), and blank samples, to verify contamination (the inadvertent transference of material from one sample, or the environment to another sample).
No duplicates were applied in the QA/QC program of Apollo Resources in the Rio Piracicaba Project, which makes the program incomplete, as the analysis precision (the ability to consistently reproduce a measurement in similar conditions) cannot be verified.
| | ● | Insertion of internationally certified standard with high iron ore content as blind sample every twenty-five samples regardless of drillhole - EURO 0135 -R00 standard. |
Total of 10 samples analyzed for Fe+.
Below are the values of the certificates for Fe + that guided the QA/QC study by Apollo Resources (Table 9.3-1).
| Analysis certificate 170010 – CTRS | | Main elements |
| QA/QC EURO - 0135 - Fe + | | Fe % | | SiO2 % | | Al2O3 % | | Mn % | | P % |
| Certified value | | 54.15 | | 4.85 | | 1.60 | | 7.59 | | 0.038 |
| Upper limit | | 54.76 | | 5.05 | | 1.69 | | 9.09 | | 0.046 |
| Lower limit | | 53.54 | | 4.65 | | 1.51 | | 6.09 | | 0.030 |
| Standard deviation | | 0.31 | | 0.10 | | 0.05 | | 0.75 | | 0.004 |
| Expanded uncertainty | | 0.61 | | 0.20 | | 0.09 | | 1.50 | | 0.008 |
Table 9.3-1: Summary of the analysis
| | ● | Insertion of internationally certified standard with low iron ore content as blind sample every twenty-five samples independent of drillhole - EURO Standard 0109-R00. |
Total of 09 samples analyzed for Fe-.
| S-K 1300 Technical Report Summary | |
| Rio Piracicaba Project | Page 83 |
Below are the values of the certificates for Fe that guided the QA/QC study by Apollo Resources (Table 9.3-2).
| Analysis certificate 170002 - CTRS | | Main elements |
| QA/QC EURO - 0109 - Fe - | | Fe % | | SiO2 % | | Al2O3 % | | Mn % | | P % |
| Certified value | | 34.33 | | 35.42 | | 3.65 | | 0.59 | | 0.086 |
| Upper limit | | 34.72 | | 35.90 | | 3.86 | | 0.65 | | 0.103 |
| Lower limit | | 33.94 | | 34.94 | | 3.44 | | 0.53 | | 0.069 |
| Standard deviation | | 0.19 | | 0.24 | | 0.11 | | 0.03 | | 0.008 |
| Expanded uncertainty | | 0.39 | | 0.48 | | 0.21 | | 0.06 | | 0.017 |
Table 9.3-2: Summary of the analysis
| | ● | Insertion of blank as blind sample by drillhole – EURO Standard 0415-R00. |
Total of 10 blank samples analyzed.
Below are the values of the certificates for white that guided the QA/QC study by Apollo Resources (Table 9.3-3).
| Analysis certificate 170017 - CTRS | | Main elements |
| QA/QC EURO - 0415 - Branco | | Fe % | | SiO2 % | | Al2O3 % | | Mn % | | P % |
| Certified value | | 0.02 | | 99.25 | | 0.40 | | <0.01 | | <0.004 |
| Upper limit | | 0.04 | | 99.93 | | 0.48 | | 0.02 | | 0.006 |
| Lower limit | | <0.01 | | 98.57 | | 0.32 | | <0.01 | | <0.004 |
| Standard deviation | | 0.01 | | 0.34 | | 0.04 | | - | | - |
| Expanded uncertainty | | 0.02 | | 0.68 | | 0.08 | | - | | - |
Table 9.3-3: Summary of the analysis
All standard and blank analysis certificates are available on the Apollo Resources database.
| | ● | QA/QC monitoring was used to validate each of the eleven batches analyzed in GeoAnalabs. Every batch received a minimum of control standards depending on the number of samples analyzed. |
Below are the XX and YY tables with the total, Fe +, Fe- and blank analyzed by drillholes and drillholes with their respective samples (Table 9.3-4 and Table 9.3-5):
| Drillhole | | Standard Fe + | | Standard Fe - | | Blank |
| FRP 01 | | 2 | | 1 | | 1 |
| FRP 02 | | 2 | | 2 | | 1 |
| FRP 03 | | 1 | | 1 | | 1 |
| FRP 04 | | 1 | | 1 | | 1 |
| FRP 05 | | 0 | | 1 | | 1 |
| FRP 06 | | 1 | | 0 | | 1 |
| FRP 07 | | 0 | | 1 | | 1 |
| FRP 08 | | 1 | | 0 | | 1 |
| FRP 09 | | 1 | | 1 | | 1 |
| FRP 10 | | 0 | | 1 | | 1 |
| FRP 11 | | 1 | | 0 | | 0 |
| TOTAL | | 10 | | 9 | | 10 |
| S-K 1300 Technical Report Summary | |
| Rio Piracicaba Project | Page 84 |
Table 9.3-4: Totals of Fe+, Fe- and blank samples by drillholes
| Standard samples Fe+ | | Standard samples Fe - | | Blank samples |
| FRP 01 | FRP 01 _01_05 | | FRP 01 | FRP 01 _04_05 | | FRP 01 | FRP 01 _09_05 |
| FRP 01 | FRP 01 _07_05 | | FRP 02 | FRP 02_01_05 | | FRP 02 | FRP 02_11_05 |
| FRP 02 | FRP 02_04_05 | | FRP 02 | FRP 02_07_05 | | FRP 03 | FRP 03_06 _05 |
| FRP 02 | FRP 02_10_05 | | FRP 03 | FRP 03_01 _05 | | FRP 04 | FRP 04_08_05 |
| FRP 03 | FRP 03_04 _01 | | FRP 04 | FRP 04_01_05 | | FRP 05 | FRP 05_07_05 |
| FRP 04 | FRP 04_06_05 | | FRP 05 | FRP 05_03_05 | | FRP 06 | FRP 06_04_05 |
| FRP 06 | FRP 06_01_05 | | FRP 07 | FRP 07_02_05 | | FRP 07 | FRP 07_04_05 |
| FRP 08 | FRP 08_03_05 | | FRP 09 | FRP 09_01_05 | | FRP 08 | FRP 08_07_05 |
| FRP 09 | FRP 09_03_05 | | FRP 10 | FRP 10_03_05 | | FRP 09 | FRP 09_07_05 |
| FRP 11 | FRP 11_01_05 | | | | | FRP 10 | FRP 10_07_05 |
Table 9.3-5: Totals of Fe+, Fe- and blank samples by drillholes
9.4. QA/QC Results

Figure 9.4-1: QA/QC charts Monitoring International Standard with Fe+ content
| S-K 1300 Technical Report Summary | |
| Rio Piracicaba Project | Page 85 |
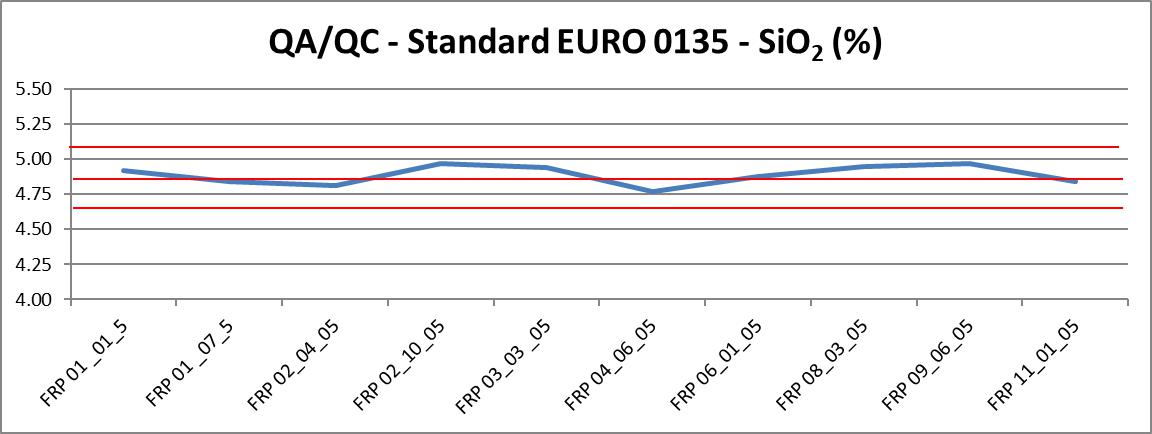
Figure 9.4-2: QA/QC charts Monitoring International Standard with SiO2+ content

Figure 9.4-3: QA/QC charts Monitoring International Standard with AL2O3+ content
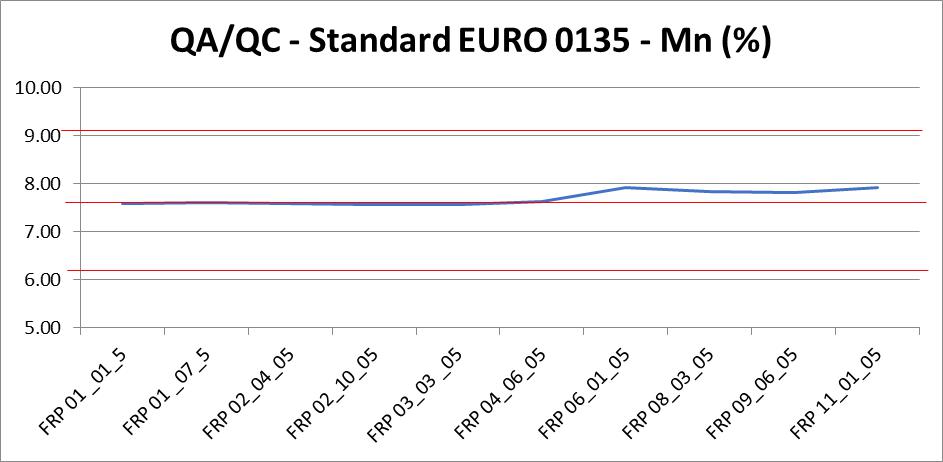
Figure 9.4-4: QA/QC charts Monitoring International Standard with Mn+ content
| S-K 1300 Technical Report Summary | |
| Rio Piracicaba Project | Page 86 |
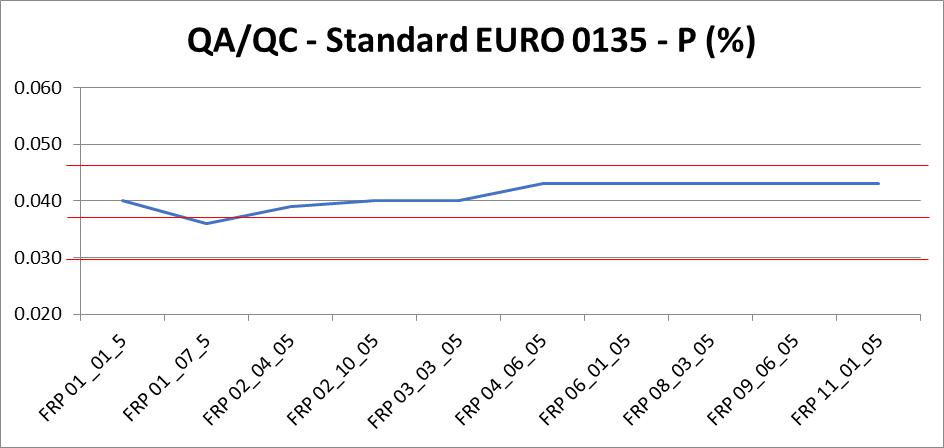
Figure 9.4-5: QA/QC charts Monitoring International Standard with P+ content

Figure 9.4-6: QA/QC charts monitoring International Standard with Fe- content

Figure 9.4-7: QA/QC charts monitoring International Standard with SiO2- content
| S-K 1300 Technical Report Summary | |
| Rio Piracicaba Project | Page 87 |
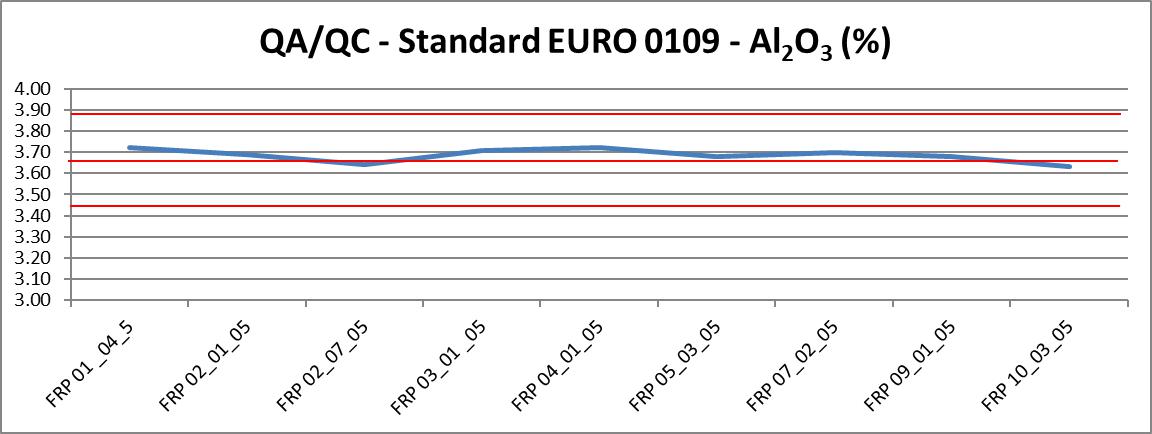
Figure 9.4-8: QA/QC charts monitoring International Standard with AL2O3- content

Figure 9.4-9: QA/QC charts monitoring International Standard with Mn- content
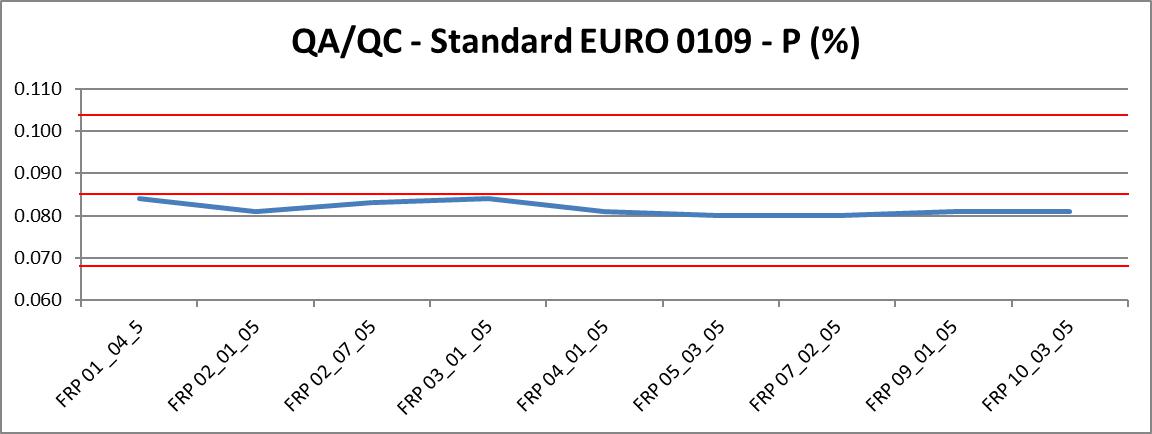
Figure 9.4-10: QA/QC charts monitoring International Standard with P- content
| S-K 1300 Technical Report Summary | |
| Rio Piracicaba Project | Page 88 |

Figure 9.4-11 QA/QC charts monitoring blank samples results

Figure 9.4-12: QA/QC charts monitoring blank samples results
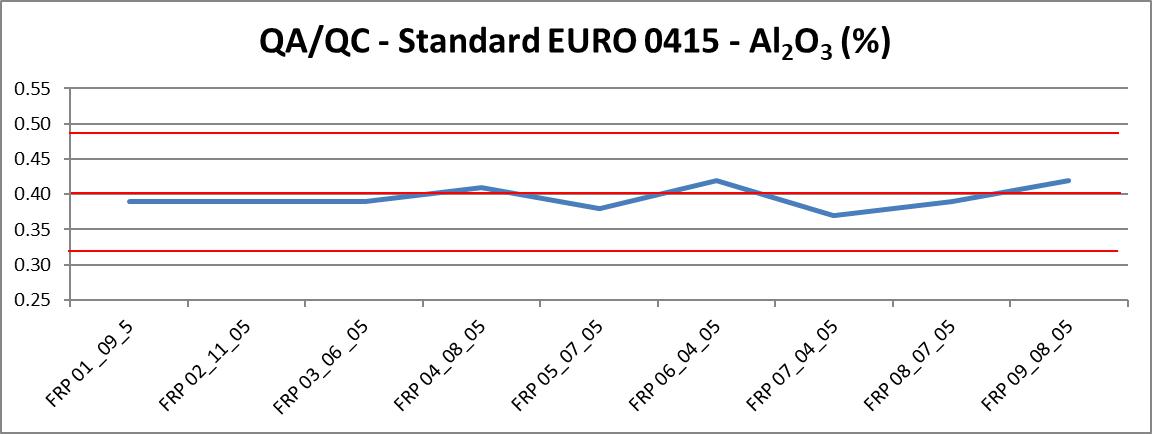
Figure 9.4-13: QA/QC charts monitoring blank samples results
| S-K 1300 Technical Report Summary | |
| Rio Piracicaba Project | Page 89 |

Figure 9.4-14: QA/QC charts monitoring blank samples results
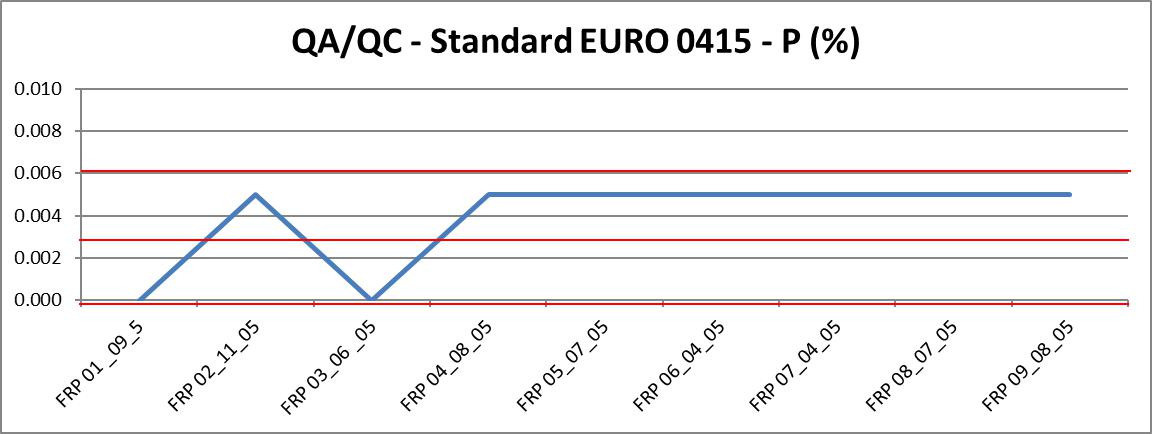
Figure 9.4-15: QA/QC charts monitoring blank samples results
9.5. Data Import and Validation
9.5.1. Database
The database used for Geological Modeling includes topographical data, information from the drillhole database and data for each sampling interval (test values for each controlled variable, lithological descriptions and deviation measures when appropriate). This data was obtained by application of best industry practices and verified by a consistent QA/QC routine, which was applied not only to data but also to the methodology of work as a whole.
The data provided is described in the topics below.:
| | ● | File in *.xlsx format, referring to the database used for the modeling, which consisted of: |
| | ○ | Banco de Dados Rio Piracicaba Oficial.xlsx – project database; |
| | | |
| | ○ | Descricao de Pocos.xlsx – geological description of the wells; |
| | | |
| | ○ | Descricao de sondagem Ferro Piracicaba.xlsx – geological description of drill holes; |
| | | |
| | ○ | Graficos Rio Piracicaba_14_08 (1).xlsx – various graphics; |
| S-K 1300 Technical Report Summary | |
| Rio Piracicaba Project | Page 90 |
| | ● | Files in *.dwg format referring to topographic survey and geological interpretation: |
| | ○ | Aerofotogrametria_curvas_rio_piracicaba_01.dwg – topographic surface; |
The main database used in this work is Excel file Banco de Dados Rio Piracicaba Oficial.xlsx, which consists of tables:
| | ● | Collar Furos Rotativos – Collar of drill hole; |
| | | |
| | ● | Collar Canal – Collar of trench; |
| | | |
| | ● | Collar Poços – Collar of test pit |
| | | |
| | ● | Classificação Litologias – Lithology; |
| | | |
| | ● | Densidades – Density tests results; |
| | | |
| | ● | Banco de Dados – Assay; |
In relation to the topographic surface, the data was given in a file in *.DXF format, called topo_sem_vegetacao_1.dxf.
Apollo Resources has provided in separate files all assay certificates in Excel and Adobe pdf format.
The information about the initial data of the database is presented in Table 9.5.1-1.
| Description | | Quantity |
| Diamond Drill Holes | | 11 |
| Rotary Diamond Drilling metreage | | 383.91 |
| Trench | | 4 |
| Trench metreage | | 21.80 |
| Test Pits | | 19 |
| Test Pit, metreage | | 59.75 |
| Notes on drill holes geological database | | 100 |
| Drill hole sampling notes | | 80 |
| Density Analyses | | 48 |
Table 9.5.1-1: Presentation of initial data
The drill holes are distributed in an irregular grid, with distances between holes that vary between 75 and 150 m. vertical sections with NE-SW orientation, with an average distance of 75 m between sections. The provided drill holes and the vertical sections used in the interpretation are shown in Figure 9.5.1-1 below.
| S-K 1300 Technical Report Summary | |
| Rio Piracicaba Project | Page 91 |

Figure 9.5.1-1: Holes and vertical sections used for the interpretation of the Rio Piracicaba Project
The batch list of analyzed iron and descriptive statistics is presented in Table 9.5.1-2 and other analyzed chemical elements are presented in Table 9.5.1-3.
| Chemical analyses | | Quantity | | Minimum | | Maximum | | Average |
| Fe global % | | 80 | | 2.22 | | 64.82 | | 28.96 |
Table 9.5.1-2: Iron Analysis for all samples in the database
| Chemical analyses | | Quantity | | Minimum | | Maximum | | Average |
| Si | | 80 | | 1.71 | | 84.23 | | 48.02 |
| Al | | 80 | | 0.09 | | 22.75 | | 4.65 |
| Mn | | 80 | | 0 | | 35.18 | | 1.37 |
| P | | 80 | | 0 | | 0.094 | | 0.02 |
| PPC | | 80 | | 0.01 | | 14.88 | | 2.62 |
| G1 +6.30 | | 80 | | 1.2 | | 90.54 | | 36.75 |
| Fe1 | | 80 | | 1.76 | | 65.05 | | 30.24 |
| Si1 | | 80 | | 1.52 | | 89.1 | | 44.80 |
| Al1 | | 80 | | 0 | | 26.21 | | 5.11 |
| Mn1 | | 80 | | 0 | | 37.35 | | 1.74 |
| P1 | | 80 | | 0.004 | | 0.165 | | 0.03 |
| PPC1 | | 80 | | 0.04 | | 15.51 | | 3.10 |
| G2 -6.30 +1.00 | | 80 | | 2.96 | | 28.71 | | 11.49 |
| Fe2 | | 80 | | 2.03 | | 63.12 | | 34.23 |
| Si2 | | 80 | | 3.22 | | 81.27 | | 40.47 |
| Al2 | | 80 | | 0.09 | | 23.8 | | 4.52 |
| Mn2 | | 80 | | 0 | | 37.16 | | 1.49 |
| P2 | | 80 | | 0.004 | | 0.117 | | 0.03 |
| PPC2 | | 80 | | -0.01 | | 15.18 | | 2.54 |
| G3 -1.00 | | 80 | | 3.33 | | 92.1 | | 51.76 |
| Fe3 | | 80 | | 1.91 | | 64.4 | | 27.03 |
| Si3 | | 80 | | 2 | | 84.16 | | 52.19 |
| Al3 | | 80 | | 0.06 | | 22.21 | | 4.30 |
| Mn3 | | 80 | | 0 | | 26.25 | | 0.88 |
| P3 | | 80 | | 0.004 | | 0.084 | | 0.02 |
| PPC3 | | 80 | | -0.09 | | 16.95 | | 2.27 |
Table 9.5.1-3: Analyzed elements for all samples in the database
| S-K 1300 Technical Report Summary | |
| Rio Piracicaba Project | Page 92 |
It is important to note that, for sampling intervals without sampling, no numerical values were assigned.
9.5.2. Database Verification by the Micromine System
The database was tested using specific processes to verify the existence of the errors listed below:
| | ● | The name of the drill hole is present in the collar file but is missing from the analytical database. |
| | | |
| | ● | The name of the drill hole is present in the analytical database but is absent in the collar file. |
| | | |
| | ● | The name of the drill hole appears repeated in the analytical database and in the collar file. |
| | | |
| | ● | The name of the drill hole does not appear in the collar file and in the analytical database. |
| | | |
| | ● | One or more coordinate notes are absent from the collar file. |
| | | |
| | ● | FROM or TO are not present in the analytical database. |
| | | |
| | ● | FROM>TO in the analytical database. |
| | | |
| | ● | Sampling intervals are not continuous in the analytical database (there are gaps between the logs). |
| | | |
| | ● | Sampling intervals overlap in the analytical database. |
| | | |
| | ● | The first sample does not correspond to 0 m in the analytical database. |
| | | |
| | ● | The azimuth is not in the range of 0-360 degrees. |
| | | |
| | ● | The dip is not in the range of 0-90 degrees. |
| | | |
| | ● | Azimuth or dip of the hole is missing. |
| | | |
| | ● | The total depth of the hole is shallower than the depth of the last sample. |
Some minor errors were identified, mainly due to incorrectly entered intervals. The errors were checked with the Project geologist and the database was thereafter updated.
9.6. QA/QC Conclusions
The main conclusions are:
| | ● | The eleven lots had standard results within the expected range of the certificates and were approved. |
| | | |
| | ● | The results of the low- and high-grade standards, and blank samples, for Fe%, SiO2% and A2O3% showed low variation compared to the acceptance range, indicating stability and reliability of the critical parameters. |
| S-K 1300 Technical Report Summary | |
| Rio Piracicaba Project | Page 93 |
| | ● | The results of the low- and high-grade standards, and blank samples, for Mn% and P% showed reasonable variation and within the acceptance ranges. |
| | | |
| | ● | Sample preparation, assaying and security are acceptable at this exploration stage. |
No duplicates were applied in the QA/QC program of Apollo Resources in the Rio Piracicaba Project, which makes the program incomplete, as the analysis precision (the ability to consistently reproduce a measurement in similar conditions) cannot be verified.
For exploration continuity, the QA/QC program must be improved, including field duplicates, coarse and pulp duplicates. Blanks must be inserted as coarse samples as the first sample of the lots. The must be a medium grade standard inserted in the QA/QC program.
In the QP’s opinion, the sample preparation, analysis, security procedures and database verification at Rio Piracicaba Project comply with industry standards and are adequate for use in the estimation of Mineral Resources.
10. Mineral Processing and Metallurgical Testing
For the development of mineral processing and technological characterization studies. a 100 kg sample of the friable siliceous itabirite was composed of aliquots collected from the test pits as shown in the table below. It should be noted that this stage consisted of exploratory tests and, therefore, did not include the semi-compact itabirite, nor the colluvium, nor did it aim to evaluate the variability of mineralogical contents and compositions. Since this is an exploratory phase, the focus is on understanding the concentrability of the mineralized material by means of magnetic separation, without worrying about process optimization. Thus, the focus was on friable itabirite as it is the most relevant lithology in the deposit and, theoretically, the simplest material to concentrate. Based on this exploratory study, the results should be replicated and adjusted for other types of mineralized materials (Table 10-1).
| Hole | | From | | To | | Mass (kg) |
| PRP03 | | 0.5 | | 1.8 | | 23 |
| PRP15 | | 1.8 | | 3.5 | | 27 |
| PRP16 | | 1.2 | | 2.3 | | 24 |
| PRP17 | | 3.5 | | 5.1 | | 24 |
Table 10.0-1 Composition of the sample tested
For the studies, the Gorceix Foundation, a renowned research institute in the natural resources sector, located in Ouro Preto, was contracted. This sample was sent to the laboratory on June 29, 2021, when the technological characterization work began. In this study, after sample preparation, granulochemical tests were performed (more detailed than those performed with the drill cores), mineralogical assays and wet magnetic separation tests.
10.1. Samples Preparation
The sample was initially weighed and dried in an oven at 105 ºC. Then, the material was crushed in a 100% passing particle size at 6.35 mm. The entire sample was homogenized and quartered for subsequent tests, 50% of which was reserved for Apollo Resources.
| S-K 1300 Technical Report Summary | |
| Rio Piracicaba Project | Page 94 |
10.2. Granulometric Assays
From the crushed material (passing 6.35mm), about 1 kg was separated for granulometric assays. For this, seventeen screens were used, as shown in the table below. The result was that the retained and passing screen of 1.0 mm are, respectively, 32.44% and 67.56% (Table 10.2-1).
| GRAIN | | GRAIN | | DRY | | MASS |
| SIZE | | SIZE | | WEIGHT | | DISTRIBUTION (%) |
| (µm) | | (mm) | | (grams) | | RETAINED | | ACCUMULATED |
| 4750 | | 4.750 | | 66.42 | | 6.29 | | 6.29 |
| 3350 | | 3.350 | | 82.11 | | 7.77 | | 14.06 |
| 2360 | | 2.360 | | 67.49 | | 6.39 | | 20.44 |
| 1700 | | 1.700 | | 50.64 | | 4.79 | | 25.24 |
| 1400 | | 1.400 | | 33.03 | | 3.13 | | 28.36 |
| 1000 | | 1.000 | | 43.06 | | 4.07 | | 32.44 |
| 850 | | 0.850 | | 20.26 | | 1.92 | | 34.36 |
| 600 | | 0.600 | | 56.95 | | 5.39 | | 39.75 |
| 425 | | 0.425 | | 74.20 | | 7.02 | | 46.77 |
| 300 | | 0.300 | | 94.35 | | 8.93 | | 55.70 |
| 212 | | 0.212 | | 132.92 | | 12.58 | | 68.28 |
| 150 | | 0.150 | | 115.10 | | 10.89 | | 79.17 |
| 106 | | 0.106 | | 80.57 | | 7.63 | | 86.79 |
| 75 | | 0.075 | | 47.65 | | 4.51 | | 91.30 |
| 53 | | 0.053 | | 28.08 | | 2.66 | | 93.96 |
| 38 | | 0.038 | | 7.93 | | 0.75 | | 94.71 |
| <38 | | <0.038 | | 55.87 | | 5.29 | | 100.00 |
| | | | | 1056.63 | | 100.00 | | |
Table 10.2-1: Granulometric assay of the material performed by the Gorceix Foundation
10.3. Granulochemical Assays
With an aliquot of the crushed sample, a dry screening test was done on the following fractions: 4.75 mm; 3.35 mm; 2.36 mm; 1.70 mm; 1.40 mm; 1.00 mm; 0.850 mm; 0.600 mm; 0.425 mm; 0.300 mm; 0.212 mm; 0.150 mm; 0.160 mm; 0.075 mm; 0.053 mm; and 0.038 mm. Then, the fractions were composed generating the following samples for chemical assays:
| | ● | +3.0 mm; |
| | | |
| | ● | -3.0 mm and +1.0 mm; |
| | | |
| | ● | -1.0 mm and +0.425 mm; |
| | | |
| | ● | -0.425 mm and +0.150 mm; |
| | | |
| | ● | -0.150 mm and +0.038 mm; and |
| | | |
| | ● | -0.038 mm. |
The results are presented in the Table 10.3-1.
| S-K 1300 Technical Report Summary | |
| Rio Piracicaba Project | Page 95 |

Table 10.3-1: Results of the granulochemical assays
In relation to the average content of the deposit, this sample presents a higher concentration of iron, however, it consists basically of siliceous friable itabirite, representing most of the mineralized material. The result of the granulochemical test of the crushed sample indicates a variation of iron content, higher in the coarse and fine fractions and lower in the intermediate fraction (0.4 to 0.1 mm). This result converges with those of the drilling. indicating the impossibility of commercialization of this iron mineralized material without concentration.
10.4. Mineralogical Assay
With different grain size fractions. mineralogical assays were performed by optical microscopy. In this case, 08 aliquots of varied sizes were described using the microscope model DM750P, from Leica Microsystems, illustrated on Figure 10.4-1.

Figure 10.4-1: Microscope model DM750P, from Leica Microsystems.
| S-K 1300 Technical Report Summary | |
| Rio Piracicaba Project | Page 96 |
The results, presented in the following table, indicate a greater presence of quartz in the intermediate fraction, converging with the results of the granulochemical assay and different compositions for the iron mineralized material. In the coarse fractions, there is a predominance of goethite, martite and magnetite as iron-bearing minerals, an unusual situation, since there is a very oxidized/hydrated mineral (goethite) occurring together with a little altered mineral (magnetite). In the fine fraction, there is a predominance of hematite, especially tabular, probably comminuted in the previous crushing stage since there is visually very friable specularite in the ore (Table 10.4-1).

Table 10.4-1: Mineral composition
10.5. Wet Magnetic Separation
As a starting point for the concentration studies, the material was crushed by 1.0 mm and wet magnetic separation of 100 g of the comminuted material was performed. Initially, orientational tests were performed with hand magnets at 800G, 2,000G and 7,500G (Figure 10.5-1). At this stage, even a scavenger test was done, from the low-field test reject, using 7,500 G.
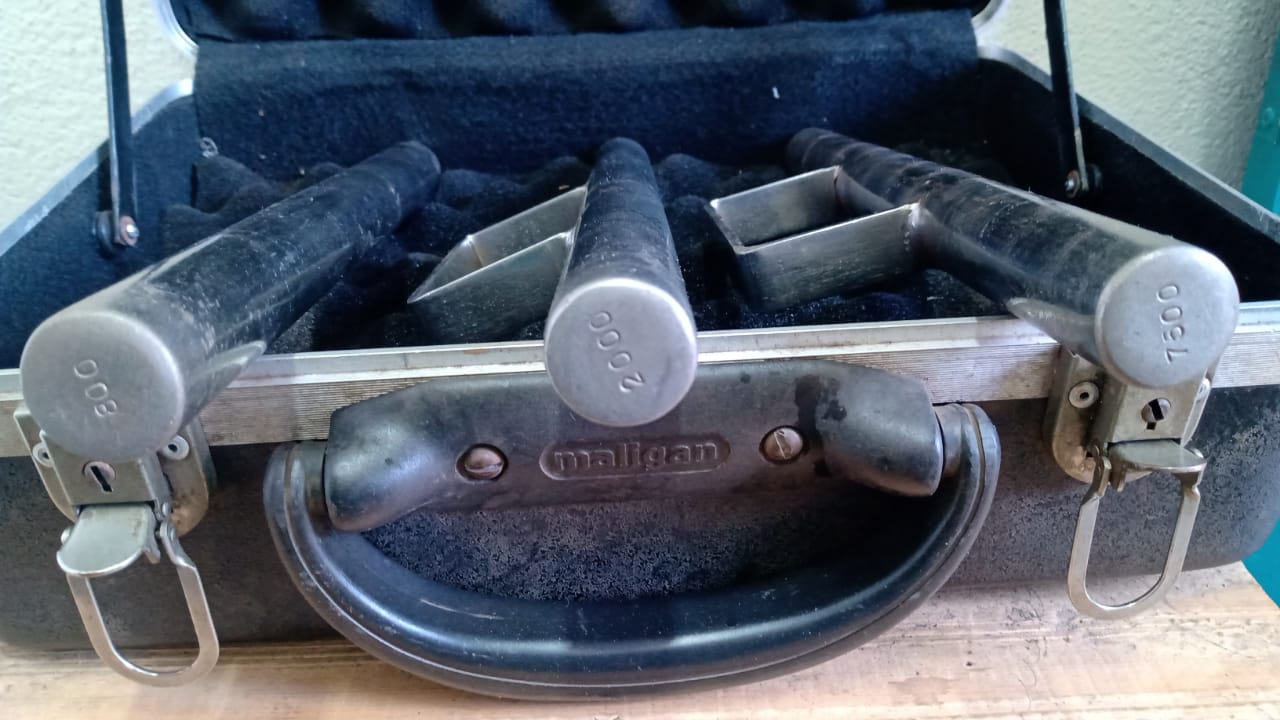
Figure 10.5-1: Hand magnets used in the wet magnetic separation test.
| S-K 1300 Technical Report Summary | |
| Rio Piracicaba Project | Page 97 |
Based on the mass recovery result and the visual appearance of the samples, it was defined that the indicated field to start the work is 2,000 G, probably recovering most of the magnetite contained in the sample. Next, the tailings were subjected to a 7,500 G hand magnet scavenger step. This scavenger tailings were then reconcentrated in successive steps in a WHC-type concentrator (Figure 10.5-2), with a GAP of 2.5 mm and variable fields of 4,000 G, 8,000 G, and 12,000 G. Finally, cleaner steps were performed.
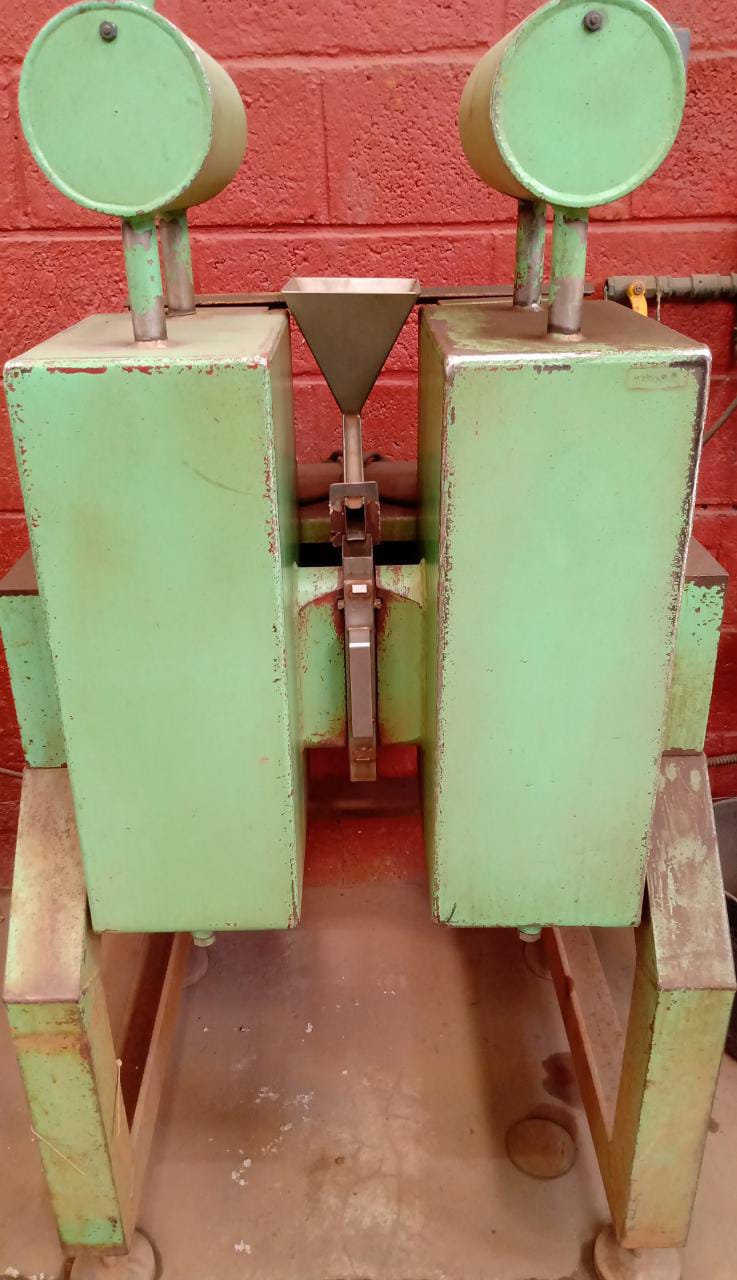
Figure 10.5-2: WHC-type concentrator used in the magnetic concentration tests.
According to the results presented in the following table (Table 10.5-1), it is possible to generate a concentrate with about 60.9% Fe after going through the rougher and cleaner steps, with mass recovery of 22.8%. The scavenger step generated a concentrate with 55.2% Fe and mass recovery of 23.1%. While its cleaner step generated a concentrate with 54.81% Fe content and 12.1% mass recovery.
Finally, the scavenger tailings fed the WHC, which in turn went through a cleaner stage and generated a concentrate with 59.2% Fe and mass recovery of 13.01%.
Thus, the final concentrate generated a content of 58.6% Fe and 9.3% SiO2 and mass recovery of 40.9%. The mass recovery, in turn, was 57.6% (Table 10.5-1).
| S-K 1300 Technical Report Summary | |
| Rio Piracicaba Project | Page 98 |

Table 10.5-1: Results of the wet magnetic separation tests
Dry magnetic separation using hand magnets was also performed. In the first test, qualitative analysis of the material was not performed. The feed concentrate generated 35.68% mass recovery with a 2000G field, and the scavenger concentrate generated 41.26% recovery with a 7500G field. The mass recovery of the concentrates was 76.94% Fe (Table 10.5-2).
| | | Mass Pull | | | | |
| ID | | STAGE | | TOTAL | | EQUIPMENT | | MAGNETIC FIELD |
| | | | | | | | | |
| Rougher Feed | | 100.00 | | 100.00 | | | | |
| Rougher Concentrate | | 35.68 | | 35.68 | | HAND MAGNET | | 2000 |
| Rougher Tailings | | 64.32 | | 64.32 | | | | |
| Rougher Feed | | 100.00 | | 64.32 | | | | |
| Rougher Concentrate | | 64.15 | | 41.26 | | HAND MAGNET | | 7500 |
| Rougher Tailings | | 35.85 | | 23.05 | | | | |
Table 10.5-2: Two-stage dry magnetic separation test at 2000G and 7500G
The second test was performed with only one stage, generating a concentrate with mass recovery of 47.13% Fe using a 4500G field. There was also a qualitative analysis of the concentrate and tailings, with contents of 52.8% and 27.8% Fe, respectively (Table 10.5-3).

Table 10.5-3: One-step dry magnetic separation test at 4500G
These results point out that one stage at 4500G does not generate a product with appropriate quality for commercialization. The first test with the two stages, despite generating higher mass recovery, does not bring the quality of the concentrates, preventing any conclusion about the material.
| S-K 1300 Technical Report Summary | |
| Rio Piracicaba Project | Page 99 |
10.6. Quantitative Minerography
The Gorceix Foundation also conducted a study of quantitative iron ore minerography using reflected light optical microscopy. The sample used was crushed to 1.00 mm and concentrated with magnetic separators of 1000G, 4500G and 3000G, generating three samples: COD17, COD18 and COD19 (
Figure 10.6 1).
The determination of the degree of liberation indicated that the hematite and magnetite in the three samples have at least 95% degree of liberation, while the quartz showed a higher degree of liberation in the samples that went through the reclean stages, reaching 61%.

Figure 10.6-1: Samples degree of liberation.
The COD17 sample (Figure 10.6-1) presents different magnetic minerals. Magnetite is the first, which is sometimes in the beginning of martitization process (the process of transformation of magnetite into hematite through oxidation) and the second mineral cannot be defined by the reflected light microscopy technique. This unidentified mineral shows alteration to goethite in a disseminated way (Figure 10.6-2 and Figure 10.6-6). The main mineral in this sample is martite, followed by the sum of these two magnetic minerals.
Both sample COD18 (Figure 10.6-3) and COD19 (Figure 10.6-4) do not show significant values of magnetite and the unidentified mineral. The main iron mineral in these samples is lamellar hematite. The liberation of the iron and the unknown mineral from the ganga is above 95%.
According to the study, low intensity magnetic separation would be sufficient to separate the magnetic minerals from the others. Sample COD 18 and COD9 show an intermediate to low magnetic susceptibility, probably resulting from the martites that appear in these samples. Quartz liberation is considered low for all samples analyzed.
| S-K 1300 Technical Report Summary | |
| Rio Piracicaba Project | Page 100 |
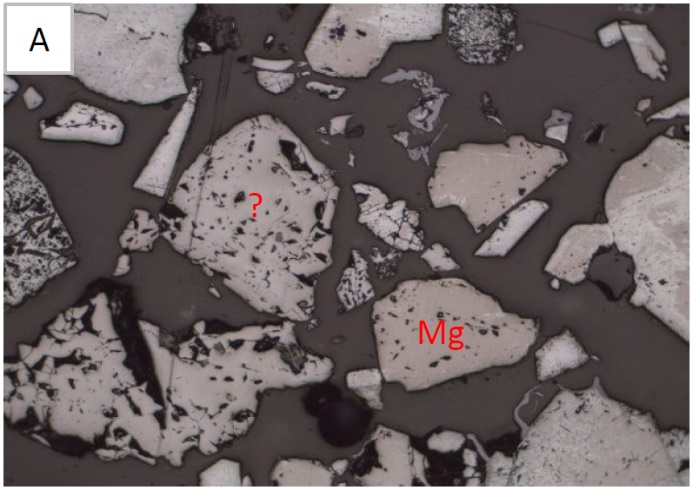
Figure 10.6-2: Sample of COD17 - seen through reflected light microscopy

Figure 10.6-3: Sample COD18 - seen through reflected light microscopy
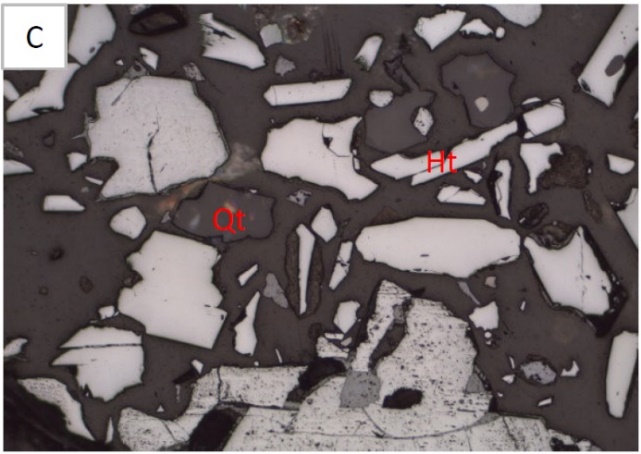
Figure 10.6-4: Sample COD19 - as seen through reflected light microscopy
| S-K 1300 Technical Report Summary | |
| Rio Piracicaba Project | Page 101 |

Figure 10.6-5: Unidentified mineral in sample COD17 with disseminated change to goethite - seen through reflected light microscopy
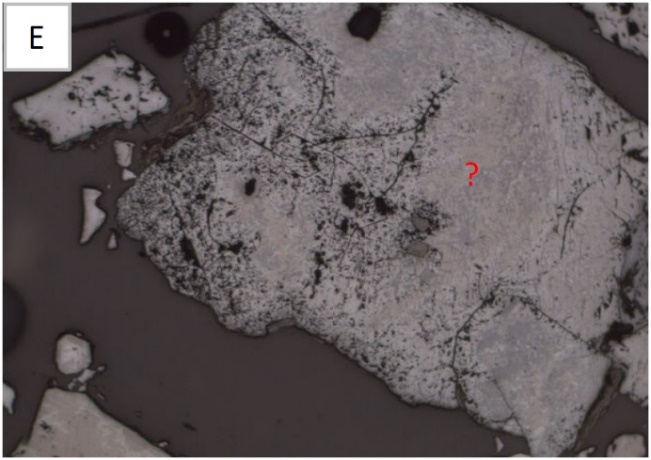
Figure 10.6-6: Unidentified mineral in sample COD17 with disseminated alteration to goethite – view
10.7. Metallurgical Testing
10.7.1. Executive Summary
At the request of Apollo Resources, an iron ore sample was submitted to beneficiation testwork at SGS-Geosol, an independent and well-known analytical laboratory in Vespasiano, state of Minas Gerais in Brazil, from October to November 2021, including sample preparation, chemical analysis, Bond BWi and magnetic separation at low and high intensity fields. Main contacts for the job were Joel Monteiro, VP, Administration and Operations for Apollo Resources, as well as Leonardo Moura, Project Metallurgist, and Renato Ferreira, Project Supervisor for SGS-Geosol. The principal objective of the work was to define the best magnetic separation route for the sample supplied by Apollo Resources.
| S-K 1300 Technical Report Summary | |
| Rio Piracicaba Project | Page 102 |
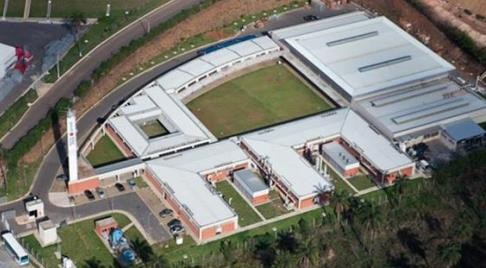
Figure 10.7.1-1 SGS-Geosol analytical laboratories in Vespasiano, Minas Gerais, Brazil
Results of the testwork reported here indicate that:
| | ● | The head assay of the sample was 34.9% iron, 48.0% silica, 1.5% alumina, 0.02 % phosphorous, 0.27% manganese and 0.9% LOI at 1000 Celsius, with titanium, potassium, barium and calcium lower than 0.1%; |
| | | |
| | ● | The Bond work index was 26.4 kWh / metric ton, which is extremely high for iron ore. This result justifies the inclusion of a pre-concentration stage to reduce the silica content of the ore and thus decrease the energy required for grinding; |
| | | |
| | ● | Best magnetic separation route was to pre-concentrate the ore at top size of 2 mm using a DryMAG at 3000 Gauss, then grinding to P80 of 0.300 mm followed by wet magnetic separation at 4000 Gauss using a MIMS and at 11000 using a WHIMS (equipment shown in Figure 2). Final concentrate grade yield by this route was 64.2% Fe and iron recovery 83.4%; |
| | | |
| | ● | The DryMAG tail, however, represented more than 40% of the feed mass and contained less than 5% iron. Beyond demonstrating the benefit of pre-concentrating the ore, this result also suggests that the sample used for testwork had an excess of sterile material. |
10.7.2. Objective
The main objective of the testwork reported here was to define the best magnetic separation route for the sample supplied by Apollo Resources. As indicated in Figure 1, four options were tested:
| | ● | ROUTE A – grinding to P80 of 0.300 mm, magnetic separation MIMS at 4000 Gauss followed |
| | | by WHIMS at 11000 Gauss, without any type of pre-concentration; |
| | | |
| | ● | ROUTE B – grinding to P80 of 0.150 mm, magnetic separation MIMS at 4000 Gauss followed |
| | | by WHIMS at 11000 Gauss without any type of pre-concentration; |
| S-K 1300 Technical Report Summary | |
| Rio Piracicaba Project | Page 103 |
| | ● | ROUTE C – pre-concentration at 3000 Gauss, grind to P80 of 0.300 mm, magnetic separation |
| | | MIMS at 4000 Gauss and WHIMS at 11000 Gauss; |
| | | |
| | ● | ROUTE D – pre-concentration at 3000 Gauss, grind to P80 of 0.150 mm, magnetic separation |
| | | MIMS at 4000 Gauss and WHIMS at 11000 Gauss; |
10.7.3. Scope
As per Figure 10.7.3-1, the experimental procedure encompassed the following steps:
| | ● | Receive the original iron ore sample, approximately 400 kg weight; |
| | | |
| | ● | Stage crush to 3.35 mm and homogenize by means of a chevron pile; |
| | | |
| | ● | Separate 10 kg of the original sample for the Bond BWi standard test; |
| | | |
| | ● | Crush the remaining material to top size of 2 mm and homogenize by forming a new pile; |
| | | |
| | ● | Separate another 10 kg of the original sample for chemical analysis, as well as determination of the size distribution and grinding times. In addition, separate two charges of 50 kg and one charge of 100 kg for the magnetic separation testwork. Reserve the remainder; |
| | | |
| | ● | Grind the two charges of the original sample to P80 of 0.30 mm and 0.15 mm and determine the size distribution of the sample in each case; |
| | | |
| | ● | Submit the two charges of the original sample to magnetic separation, with the MIMS operating at 4.000 Gauss followed by the WHIMS at 11.000 Gauss and matrix of 2.5 mm; |
| | | |
| | ● | Submit the 100 kg charge of the original sample to pre-concentration using the DryMAG; |
| | | |
| | ● | Homogenize the pre-concentrate and separate 10 kg for chemical analysis, as well as determination of the grinding times; |
| | | |
| | ● | Divide the remaining mass of pre-concentrate into two charges; |
| | | |
| | ● | Grind the two charges of pre-concentrate to P80 of 0.30 mm and 0.15 mm; |
| | | |
| | ● | Submit the two charges of pre-concentrate to magnetic separation, with the MIMS operating at 4.000 Gauss followed by the WHIMS at 11.000 Gauss; |
| | | |
| | ● | Analyze all concentrates and tailings via XRF; |
| | | |
| | ● | Mass balance the raw data in order to estimate iron recovery in each test. |
| S-K 1300 Technical Report Summary | |
| Rio Piracicaba Project | Page 104 |

Figure 10.7.3 1: Testwork flowsheet
Overall, testwork encompassed: crushing 400 kg of the original sample to top size of 3.35 mm and then to 2 mm, two stages of homogenization, standard Bond BWi test, pre-concentration using the DryMAG, grinding to P80 of 0.300 and 0.150 mm and magnetic separation using the MIMS and WHIMS. The experimental data were mass balanced by means of the BILMAT program to reconcile masses and assays and allow comparison between the results generated by means of routes A to D.
| S-K 1300 Technical Report Summary | |
| Rio Piracicaba Project | Page 105 |
10.7.4. Equipment
As shown in Figure 10.7.4-1, the work reported here was conducted by means of the following equipment:
| | ● | Jaw crusher BRASCRUSHER, Brastorno; |
| | | |
| | ● | DryMAG (medium intensity magnetic separator, dry drum), CARPCO RED 25; |
| | | |
| | ● | Bench scale mill, 20 cm x 30 cm, Brastorno; |
| | | |
| | ● | MIMS (medium intensity magnetic separator, wet drum), Mineral Technologies; |
WHIMS (high intensity magnetic separator, carousel), WHC01S, Inbras-Eriez.
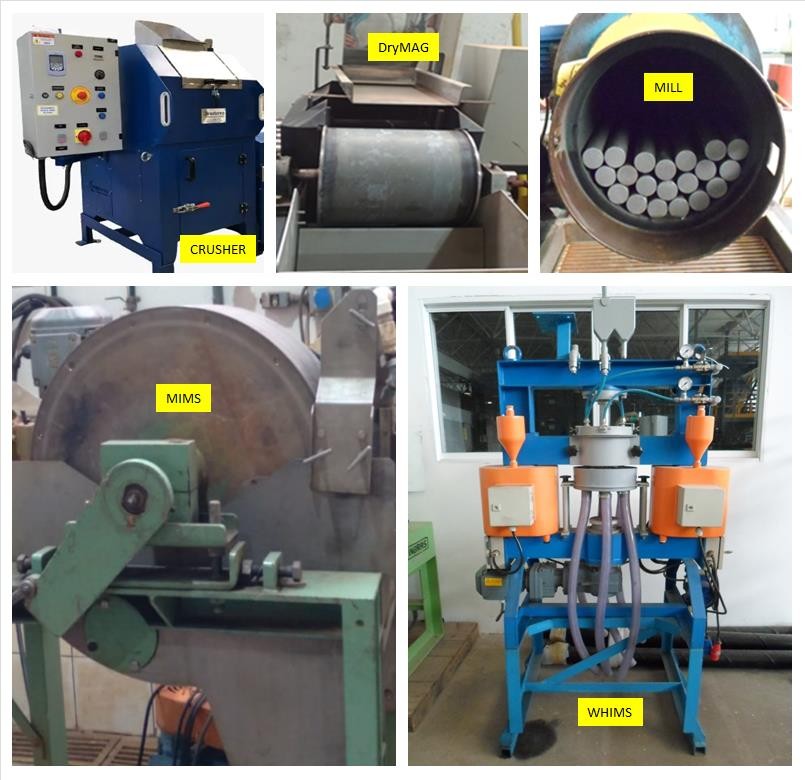
Figure 10.7.4-1: Testwork equipment
10.7.5. Experimental Results
Chemical analysis in triplicate of the original sample, summarized in Table 10.7.5-1, indicates 34.9% iron, 48.0% silica, 1.5% alumina, 0.02 % phosphorous, 0.27% manganese and 0.9% LOI at 1000 Celsius. Titanium, potassium, barium and calcium are lower than 0.1%. In qualitative terms, these results indicate silica and alumina as the main contaminants of the sample. All other contaminants, especially phosphorus, are already very low prior to magnetic separation.
| S-K 1300 Technical Report Summary | |
| Rio Piracicaba Project | Page 106 |

Table 10.7.5-1
The grinding curves of the original sample are shown in Figure 10.7.5-1. According to these results, grinding for 3:00 minutes was required to reach P80 of 0.300 mm, and 16:00 minutes for P80 of 0.150 mm.

Figure 10.7.5-1: Grinding curves of the original sample
Aliquots of the original sample were sized at different points of the testwork flowsheet in order to measure / confirm the P80. The results in Figure 4 indicate P80 of 0.500 mm for the original sample crushed to top size of 2 mm and confirm P80 of 0.300 mm and 0.150 mm for the original sample ground for the times given by the grinding curves.
| S-K 1300 Technical Report Summary | |
| Rio Piracicaba Project | Page 107 |

Table 10.7.5-2: Size distribution of the original sample at different P80s
Results of the Bond BWi standard comminution test for the original sample are summarized in Table 10.7.5-2, indicating a value of 26.4 kWh / metric ton for the work index. This is extremely high for iron ore and justifies the inclusion of a pre-concentration stage to reduce the silica content of the ore and thus decrease the energy required for grinding.
Chemical analysis of the DryMAG pre-concentrate is summarized in Table 10.7.5-3, indicating 56.4% iron, 14.5% silica, 2.0% alumina, 0.02 % phosphorous, 0.41% manganese and 1.4% LOI at 1000 Celsius. As compared to the original sample, the pre-concentrate had less than one third of the silica content and was more than 20 percentage points higher in iron assay. It is also important to note that the DryMAG tail exhibited less than 5% iron assay.
| S-K 1300 Technical Report Summary | |
| Rio Piracicaba Project | Page 108 |

Table 10.7.5-3
The grinding curves of the pre-concentrate generated by the DryMAG are shown in Figure 10.7.5-3. As can be seen, after reducing the silica content of the ore, the grinding time dropped to 2:00 minutes for a target P80 of 0.300 mm and 11:00 minutes for 0.150 mm.

Figure 10.7.5-2: Grinding curves of the pre-concentrate
10.7.6. Mass Balancing
The results of the magnetic separation testwork were mass balanced using the BILMAT software to reconcile the experimental masses and assays, allowing more reliable estimation of the iron recovery. The comparison shown in Figure 10.7.6-1 demonstrates that the experimental data balances very well, with just a few outliers. Further details are given in the Appendix.
| S-K 1300 Technical Report Summary | |
| Rio Piracicaba Project | Page 109 |

Figure 10.7.6-1: Mass balanced versus experimental assays
10.7.7. Selection of the Best Magnetic Separation Route
The results of the magnetic separation testwork summarized in Table 10.7.7-1 indicate that:
| | ● | ROUTE A and ROUTE B, without pre-concentration, yielded very poor results, with final concentrate grade below 55% Fe and iron recovery below 80%; |
| | | |
| | ● | ROUTE C, encompassing pre-concentration, grinding to P80 of 300 microns followed by MIMS at 4000 Gauss and WHIMS at 11000 Gauss, was proved to be the best option, leading to a final concentrate grade of 64.2% Fe and iron recovery 83.4%; |
| | | |
| | ● | The DryMAG tail, however, represented more than 40% of the feed mass and contained less than 5% iron. Beyond demonstrating the benefit of pre-concentrating the ore, this result also suggests that the sample used for testwork had an excess of sterile material; |
| S-K 1300 Technical Report Summary | |
| Rio Piracicaba Project | Page 110 |
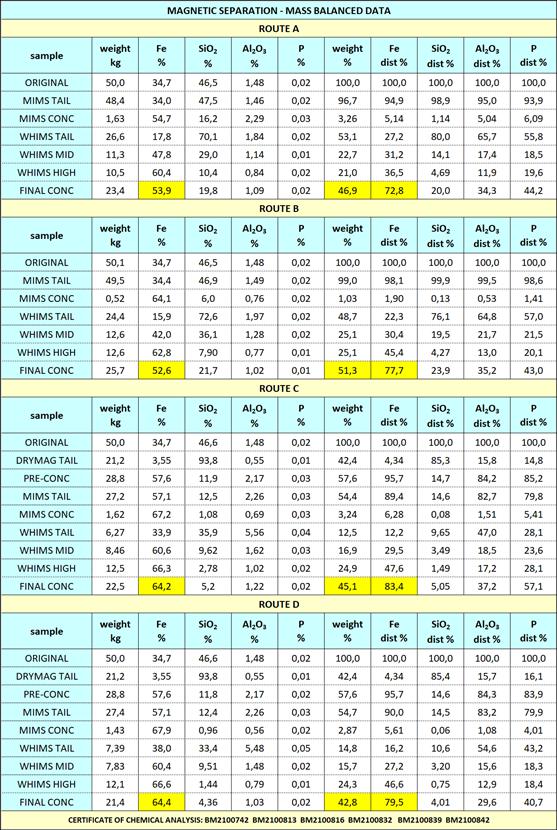
Table 10.7.7-1
| S-K 1300 Technical Report Summary | |
| Rio Piracicaba Project | Page 111 |
10.7.8. Conclusions
Results of the testwork reported here indicate that:
| | ● | The head assay of the sample was 34.9% iron, 48.0% silica, 1.5% alumina, 0.02 % phosphorous, 0.27% manganese and 0.9% LOI at 1000 Celsius, with titanium, potassium, barium and calcium lower than 0.1%; |
| | | |
| | ● | The Bond work index was 26.4 kWh / metric ton, which is extremely high for iron ore. This result justifies the inclusion of a pre-concentration stage to reduce the silica content of the ore and thus reduce the energy required for grinding; |
| | | |
| | ● | Best magnetic separation route was to pre-concentrate the ore at top size of 2 mm using a DryMAG at 3000 Gauss, then grinding to P80 of 0.300 mm followed by wet magnetic separation at 4000 Gauss using a MIMS and at 11000 using a WHIMS (equipment shown in Figure 2). Final concentrate grade yield by this route was 64.2% Fe and iron recovery 83.4%; |
| | | |
| | ● | The DryMAG tail, however, represented more than 40% of the feed mass and contained less than 5% iron. Beyond demonstrating the benefit of pre-concentrating the ore, this result also suggests that the sample used for testwork had an excess of sterile material. |

| S-K 1300 Technical Report Summary | |
| Rio Piracicaba Project | Page 112 |
| S-K 1300 Technical Report Summary | |
| Rio Piracicaba Project | Page 113 |

| S-K 1300 Technical Report Summary | |
| Rio Piracicaba Project | Page 114 |

| S-K 1300 Technical Report Summary | |
| Rio Piracicaba Project | Page 115 |

| S-K 1300 Technical Report Summary | |
| Rio Piracicaba Project | Page 116 |

| S-K 1300 Technical Report Summary | |
| Rio Piracicaba Project | Page 117 |
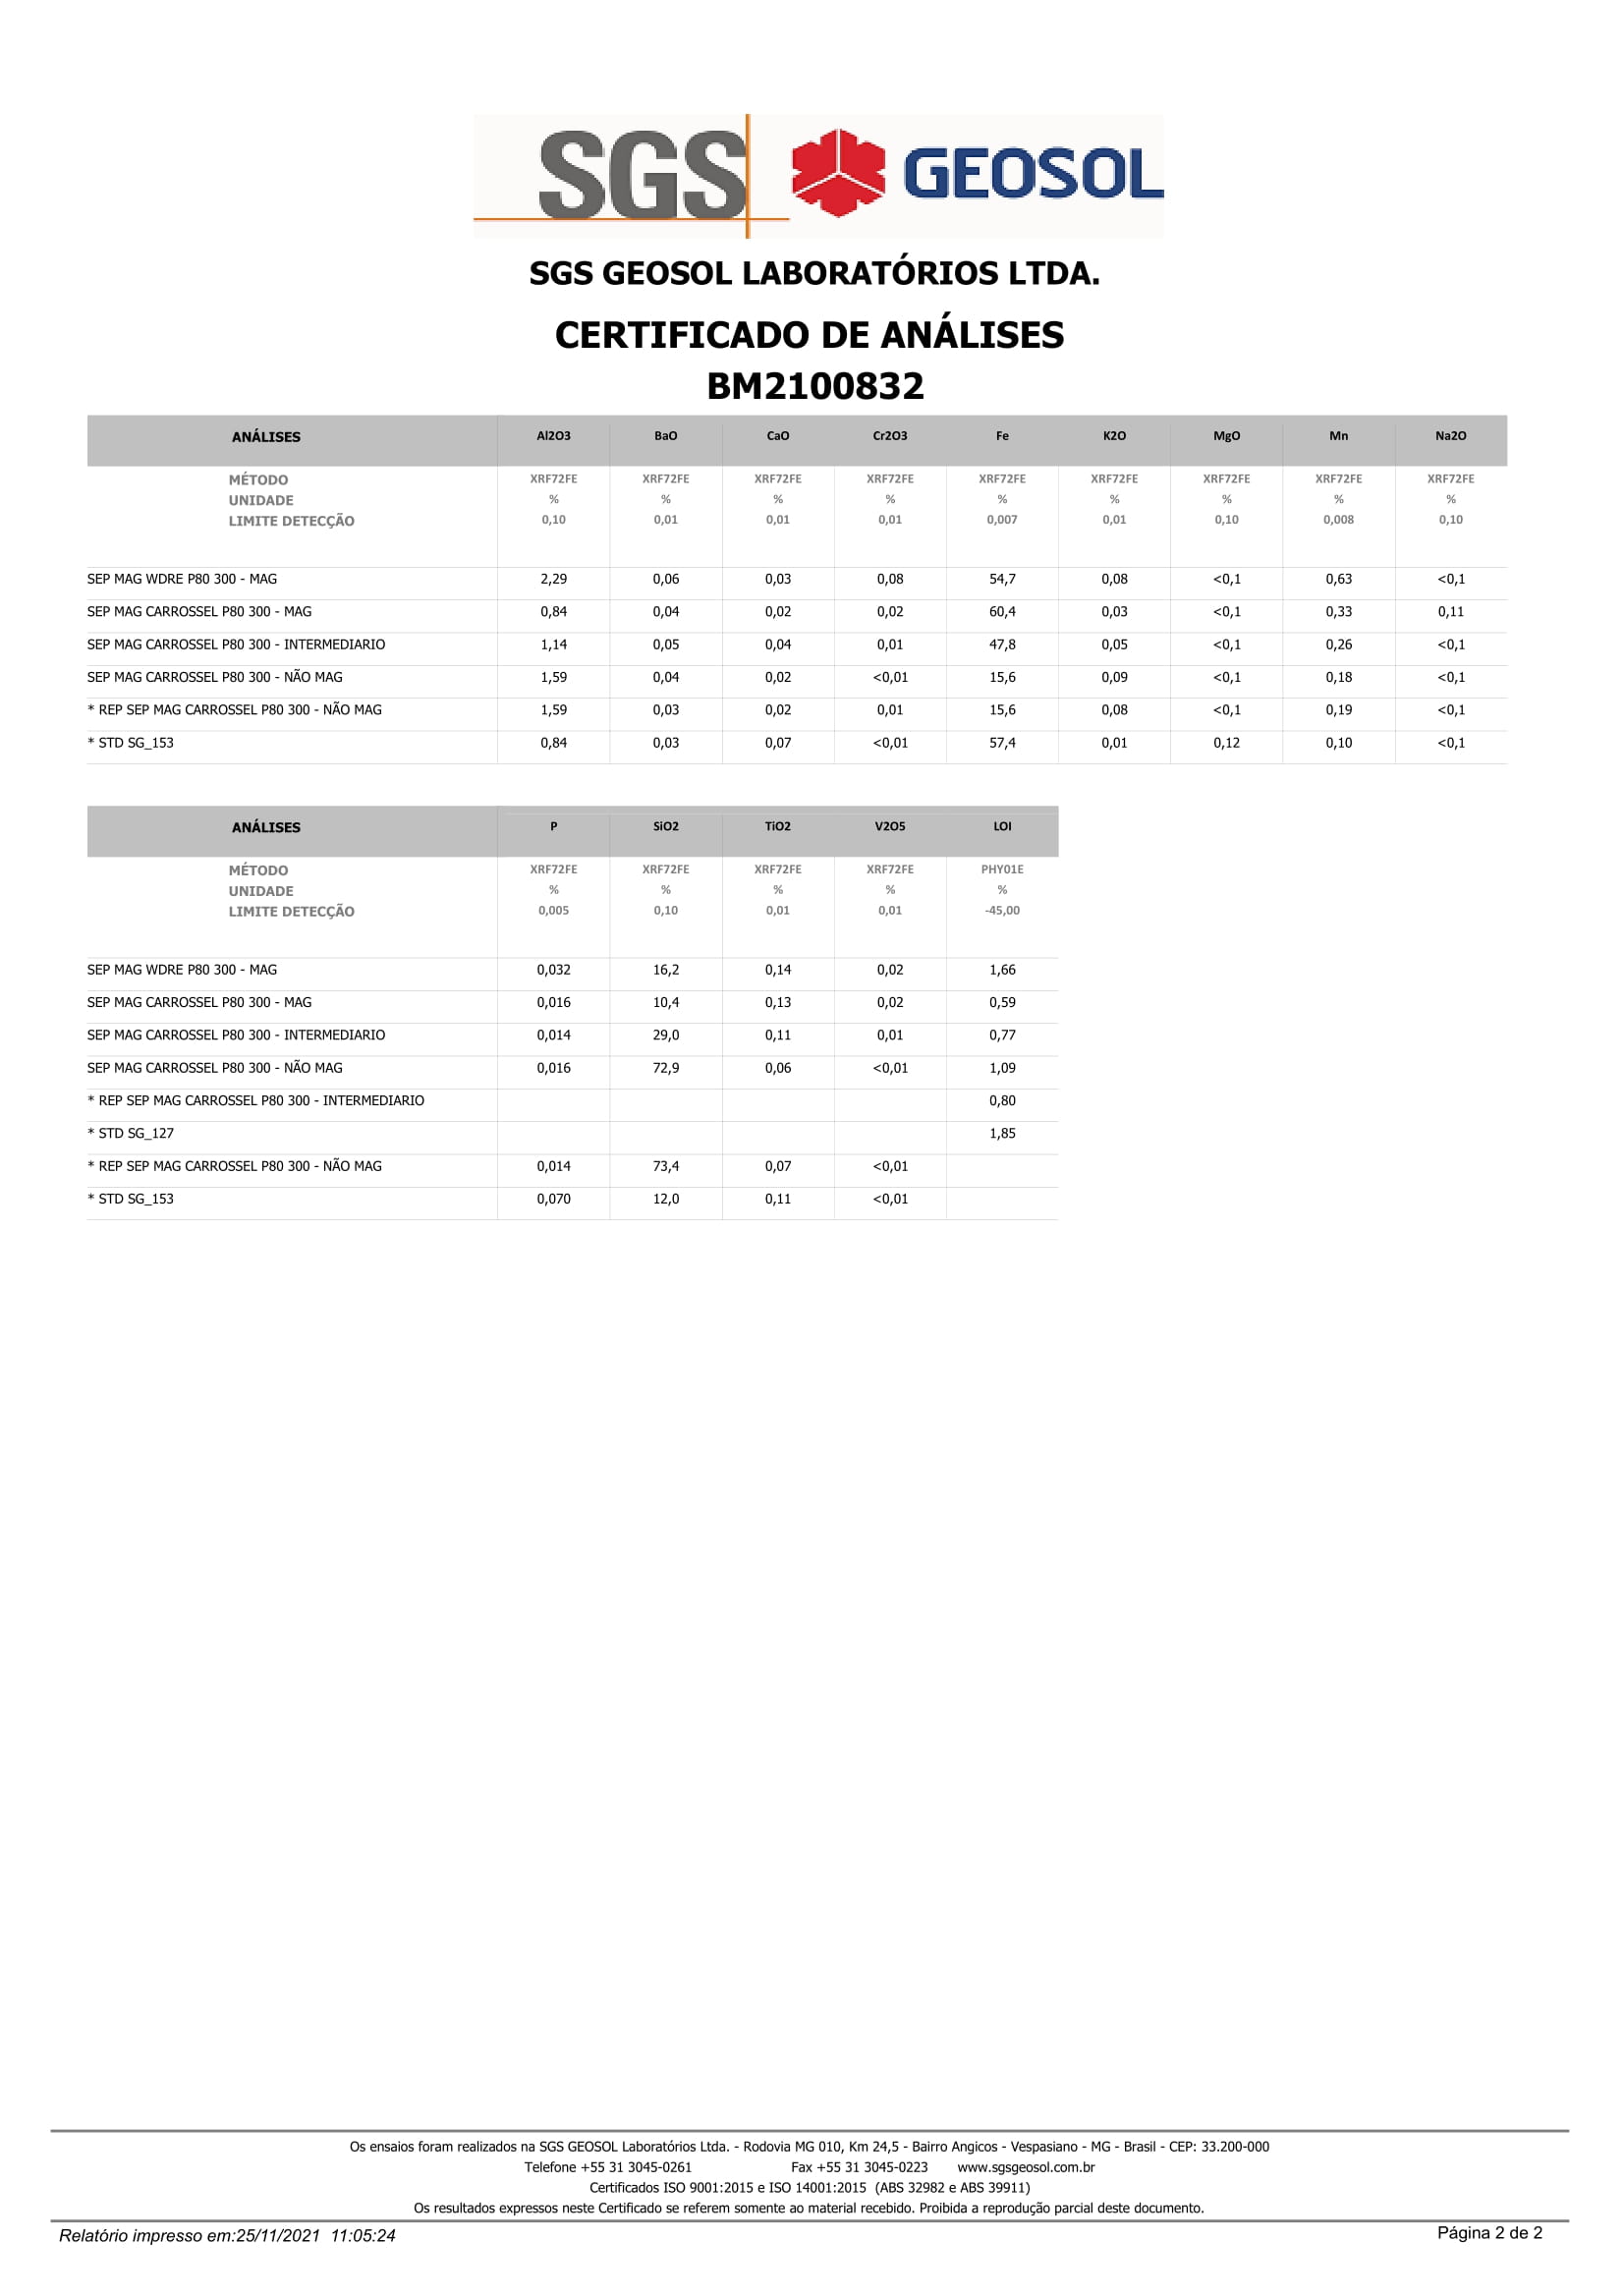
| S-K 1300 Technical Report Summary | |
| Rio Piracicaba Project | Page 118 |

| S-K 1300 Technical Report Summary | |
| Rio Piracicaba Project | Page 119 |

| S-K 1300 Technical Report Summary | |
| Rio Piracicaba Project | Page 120 |

| S-K 1300 Technical Report Summary | |
| Rio Piracicaba Project | Page 121 |

| S-K 1300 Technical Report Summary | |
| Rio Piracicaba Project | Page 122 |

| S-K 1300 Technical Report Summary | |
| Rio Piracicaba Project | Page 123 |

| S-K 1300 Technical Report Summary | |
| Rio Piracicaba Project | Page 124 |
10.8. Conclusion
Based on the results obtained, it is possible to demonstrate that friable itabirite presents characteristics that allow the application of magnetic separation as a concentration methodology. Based on Figure 10.6-1, it is possible to verify that there are highly magnetic particles (which are concentrated in low-intensity magnetic fields), but also low-magnetic particles, with a 20 to 30% mass pull distribution for each rougher test at different intensities.
The results show that, without a grinding stage, it is not possible to obtain sufficient quality to meet market demand (+62% Fe). At 1.0 mm particle size, it was possible to obtain a compound concentrate with about 56% Fe and mass pull of 52%. Rio Piracicaba Iron Project is already developing a second phase of testing drill core samples with grinding in an attempt to obtain better results.
The QP is of the opinion that the data derived from the testing activities described above are adequate for the purposes of defining a Mineral Resource. The results from ROUTE C, encompassing pre-concentration, grinding to P80 of 300 microns followed by MIMS at 4000 Gauss and WHIMS at 11000 Gauss, was proved to be the best option, leading to a final concentrate grade of 64.2% Fe and iron recovery of 83.4% with silica and alumina concentrations below the penalty levels.
11. Mineral Resource Estimates
11.1. Introduction
This topic describes the methodology and devices used in the mineral resource estimation of the Iron deposit from the Rio Piracicaba Project, located in the city of Rio Piracicaba, Minas Gerais, Brazil.
Dr. Myadzel is responsible for the resource estimation methodology.
The resource estimate was made in accordance with the standards accepted by Regulation S-K 1300.
The effective date of this estimate is the receipt date of the latest data on the resource estimate, which is March 30, 2022.
11.1.1 Point of Reference
The specific point of reference for the mineral resources estimated in the RP Project has the following coordinates: 19o 56’ 24.40” S and 43o 12’ 7.58” W. The specific point of reference is also identified in the map below.
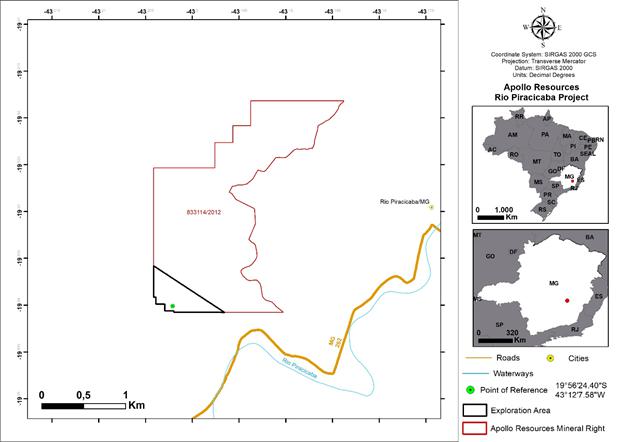
11.2. Statistical Analysis
This TRS used a classical statistical analysis to perform the following tasks:
| | ● | Assess the need to separate populations if there is more than one population. |
| | | |
| | ● | Evaluate the effect of population mixing. |
| | | |
| | ● | Determine the grade distribution. |
Statistical analysis was performed for Fe global (%) samples grouped throughout the data matrix (Figure 11.2-1). Then the analysis was performed for the samples internal to the mineralized zone (Figure 11.2-2).
| S-K 1300 Technical Report Summary | |
| Rio Piracicaba Project | Page 125 |

Figure 11.2-1: Histogram of Fe global (%) grade distribution for all samples
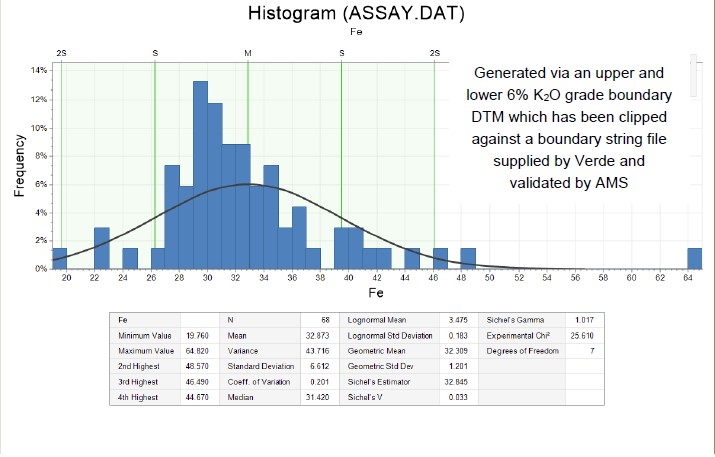
Figure 11.2-2: Histogram of Fe global (%) grade distribution for samples inside the mineralization zone
| S-K 1300 Technical Report Summary | |
| Rio Piracicaba Project | Page 126 |
Table 11.2-1 shows the summary of the statistical analysis for the iron present in the provided work data.
| Substance | | Sample Quantity | | Minimum | | Maximum | | Mean | | Median | | Variance | | Std. Deviation |
| All samples |
| Fe (%) | | 80 | | 2.22 | | 64.82 | | 28.97 | | 30.77 | | 128.832 | | 11.350 |
| Samples inside the mineralization zone |
| Fe (%) | | 68 | | 19.76 | | 64.82 | | 32.87 | | 31.42 | | 43.716 | | 6.612 |
Table 11.2-1: Summary of the statistical analysis of the provided grades
11.3. Interpretation
The geological interpretation was generated by using the 3D software package Micromine. Wireframe surfaces were generated by connecting cross-sectional interpretations to model the topography, supergene alteration zones of rocks and mineralization zone limits.
Rotary Diamond (DD) drilling data were used to perform the orebodies interpretation. The drill hole grid in the work area is characterized by its irregularity. The interpretation lines were created in the string format (*.str) of the Micromine software. All interpretation strings have a close connection to the sampling intervals.
For the definition of mineralization zone were applied the criteria of Grade Compositing and Lithology description. Intervals grading above 28% (Fe global) and lithology description Itabirito were interpreted as mineralization. The geological interpretation was made through the interpretation of all ore bodies by 9 vertical sections.
All strings of interpretation have a close connection with the sampling intervals, as shown in Figure 11.3-1.

Figure 11.3-1: Geological interpretation. section 02
| S-K 1300 Technical Report Summary | |
| Rio Piracicaba Project | Page 127 |
All strings interpreted were extrapolated above the topographic surface to ensure that between the topographic surface and the top of the body there was no voids. Strings scanned were used to assist in visualizing the overall geological structure of the deposit.
When interpreting geological boundaries of the ore bodies, interpolation was performed at half-distance grid operating in each area while maintaining the thickness of the ore.
The following conditions were used in the interpretation of the ore bodies:
| | ● | The interpretation was based on the element iron and lithological code originally described. |
| | | |
| | ● | All strings were interpreted accurately connected to the appropriate holes. |
| | | |
| | ● | The interpretation was built up to half the distance of the exploitation grid. corresponding to the first and last section probed. |
| | | |
| | ● | Also considered the structural position of the mineralization zone. |
In vertical sections the bodies of the iron formation were interpreted according to the sampling data.
11.4. Triangulation
The triangulation may be divided into closed wireframe (orebodies) and building surface (topography and alteration zone).
11.4.1. Topography
For the construction of a Digital Surface Model (DSM) data files *.STR were used. As a result, the present topographic surface in Figure 11.4.1-1 was obtained.
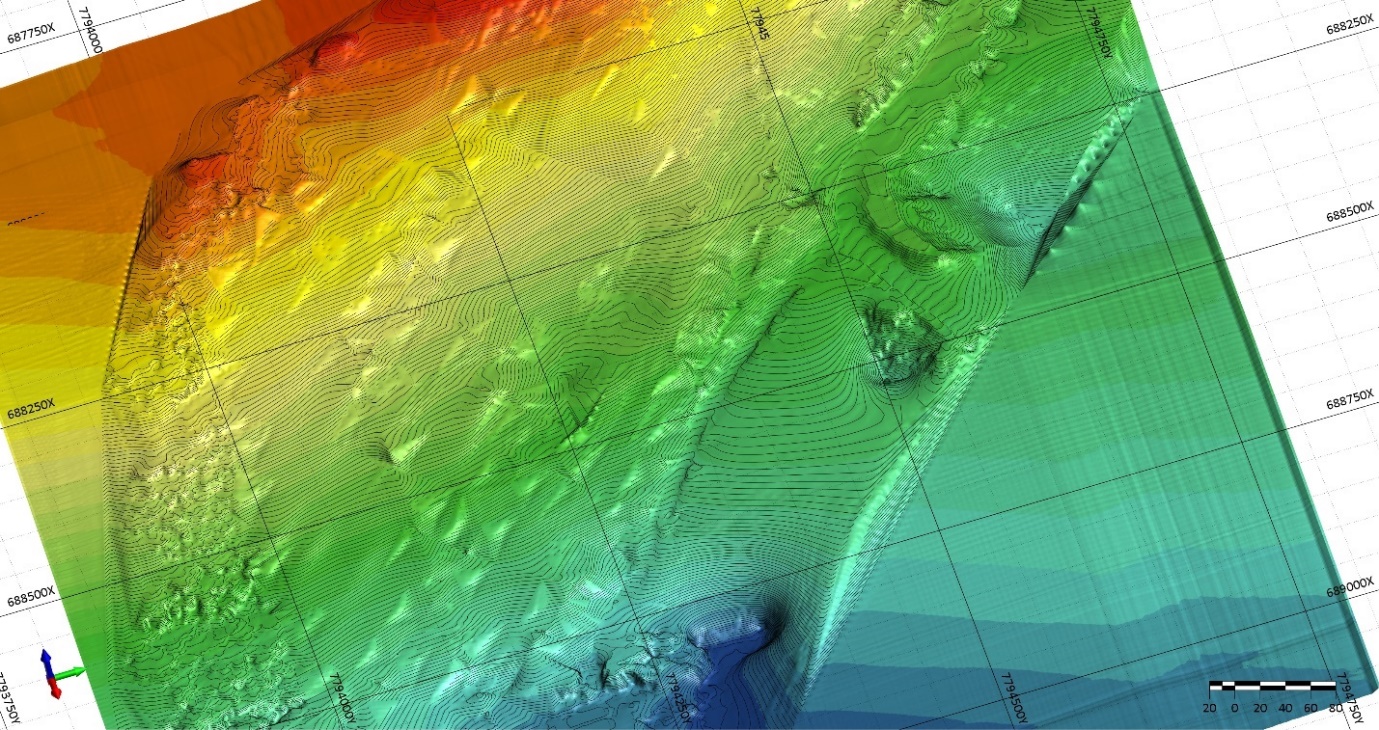
Figure 11.4.1-1: Surface digital topographic base.
| S-K 1300 Technical Report Summary | |
| Rio Piracicaba Project | Page 128 |
11.4.2. Soil Zone
The soil zone that determines the separation of friable and compact ore was based primarily on the hardness and friability logging from the geological log, as well as revisiting the drill core photos. There was an alteration zone contact interpreted on the contact between friable and compact material.
From the file GEOLOGY.DAT, which was corrected manually, base surfaces of the alteration zone were created. From the file SOIL.STR, which was corrected manually, base surfaces of the alteration zone were created. Grid creation method was used with IDW2 (inverse distance weighting with power 2) interpolation method. Cell size is 1×1 meters. Grids were converted into digital surfaces DTM (Digital Terrain Model), as shown in Figure 11.4.2-1.

Figure 11.4.2-1: Surface digital soil zone.
11.4.3. Wireframe Closed
The strings were used in the interpretation model to generate a continuous three-dimensional triangulated mesh for each of the ore bodies. The strings of the sections are shown on the screen, consequently, intertwine with strings interpretation of subsequent sections (Figure 11.4.3-1).
The interpretation of the ore bodies was extrapolated above topography. After triangulation extrapolated bodies, the solids were cut by the topographic surface and soil surface. With this, the continuity of the bodies to the topography without loss of volume and mass was insured. In Figure 11.4.3-2 is the triangulation result of all orebodies cut by the topographic surface.
| S-K 1300 Technical Report Summary | |
| Rio Piracicaba Project | Page 129 |
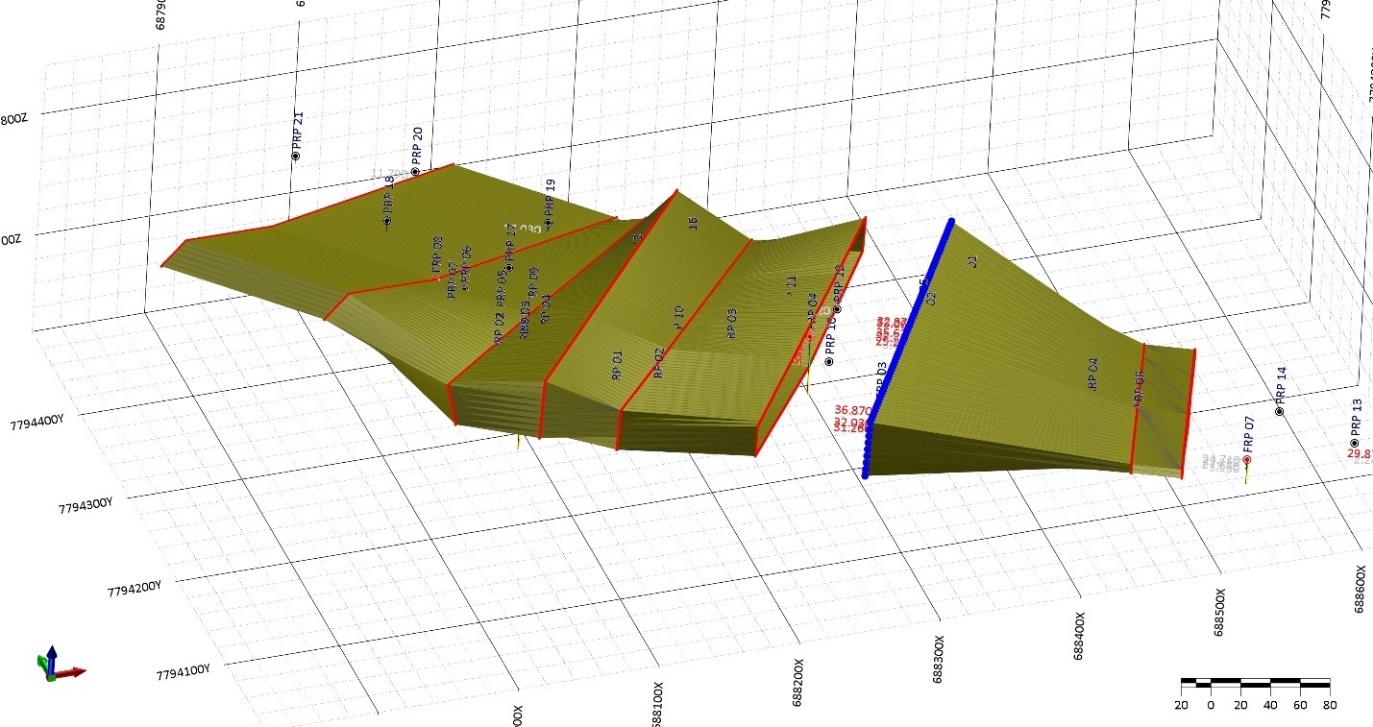
Figure 11.4.3-1: Triangulation of orebodies.

Figure 11.4.3-2: Triangulation of the ore bodies cut by topographic surface and soil surface. View all ore bodies in the area.
| S-K 1300 Technical Report Summary | |
| Rio Piracicaba Project | Page 130 |
11.5. Data Selection
The selection of drillhole data is a standard certification procedure. It is essential that, in classical statistical analysis, geostatistics and the grade interpolation process, the correct samples are used. The solids of the element to be analyzed were used for the drill holes sample selection.
In order that the samples used for the interpolation had the same weight by size, analyzes were carried out to define the size of the composites. According to the analysis made for the size of the samples analyzed, values ranging from 0.40 to 5.90 m were found, with a mean of 2.97 m. The graph of sampling lengths distribution is shown in Figure 11.5-1.
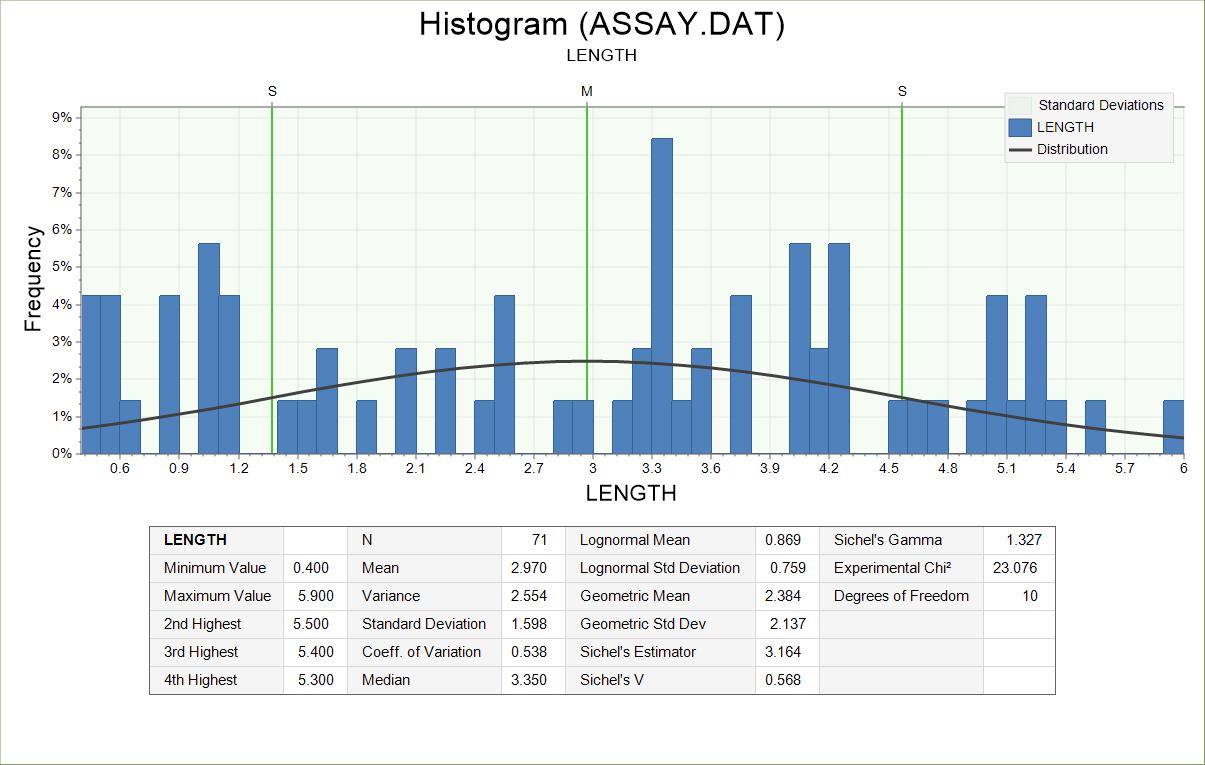
Figure 11.5-1: Histogram of size distribution of samples inside the mineralized zone
The length of 1 m was adopted for sediment iron rock (colluvium, canga) composite samples, converting the size of all samples into 1 m. The process of creating the composite intervals started at the hole collar and proceeded in the direction of drilling (downwards). Intervals below 0.40 m were excluded.
For metamorphic iron rock (Itabirite) composite samples, all sample sizes were converted to 3 m. The process of creating the composite intervals started at the hole collar and proceeded in the direction of drilling (downwards). Intervals below 1.00 m were excluded.
The results of statistical analyses of composited samples are shown in Table 11.5-1.
| Element | | Number of
samples | | Minimum | | Maximum | | Mean | | Median | | Variance | | Standard
deviation |
| Samples composited (colluvium. canga) |
| Fe global | | 20 | | 24.71 | | 47.53 | | 33.134 | | 32.88 | | 46.65397 | | 6.830371 |
| Samples composited (friable itabirite) |
| Fe global | | 52 | | 22.53 | | 64.82 | | 32.56941 | | 31.69967 | | 31.12212 | | 5.57872 |
| Samples composited (compact itabirite) |
| Fe global | | 16 | | 22.25 | | 30.33 | | 28.64935 | | 29.33 | | 3.824173 | | 1.955549 |
Table 11.5-1: Results of statistical analysis performed
| S-K 1300 Technical Report Summary | |
| Rio Piracicaba Project | Page 131 |
11.6. Capping
After analysis of the data, it was defined not to use capping, since its influence on the calculation will not be significant.
11.7. Modelling
The block model was generated from the discretization of the three-dimensional solids into blocks of defined dimensions. The parameters of the blocks are listed below. in Table 11.7-1.
| Directions | | Minimum | | Maximum | | Block Size (m) | | Minimum sub-block
size (m) | | Number of primary blocks |
| East | | 687750 | | 688750 | | 25 | | 2.50 | | 21 |
| North | | 7794000 | | 7794500 | | 25 | | 2.50 | | 11 |
| RL - Elevation | | 500 | | 900 | | 5 | | 1.00 | | 81 |
Table 11.7-1: Block model parameters
The process of discretization of the solid included the sub-blocking process. Initially, the model was filled with blocks measuring 25 (X) by 25 (Y) by 5 (Z) m, which were divided into subunits of smaller size, with a factor for size subdivision of 10 by 10 by 5 in contact with the surrounding three-dimensional solids.
As a result, at the limit with solids, the size of the blocks became 2.5 (X) by 2.5 (Y) by 1.0 (Z) m. The initial size of the blocks was chosen based on the morphology of the orebodies and the size of the exploration grid. This model contains 46,763 blocks.
The solid was used to create a block model within the mineralized geological body. This solid was used to encode the respective blocks. The digital model of the topographic surface was used to limit the block models by the vertical axis. The blocks were generated with faces parallel to the North/South and East/West axes.
11.8. Grade Interpolation and Mineral Resource Classification
Iron (Fe global %) and other elements were interpolated to the empty block model using IDW2 (Inverse Distance Weighting with weight 2) and IDW3 (Inverse Distance Weighting with weight 3) methods. The parameters used for all three methods were the same and are described below.
The grade estimation was performed in four consecutive steps (rounds) using different sizes of search radius, criteria of number of composite samples and number of holes.
The definition of the search ellipse parameters was based on the morphology of the orebodies and the size of the exploration grid. The search ellipsoid was divided into four sectors. The orientation of the search ellipsoid and the axes sizes for interpolated element are described in Figure 11.8-1, Table 11.8-1 and Table 11.8-2. The parameters of the search ellipse radii and interpolation parameters for each step (round) of the grade estimation are described in Table 11.8-3.
| S-K 1300 Technical Report Summary | |
| Rio Piracicaba Project | Page 132 |
| Element | | First axis azimuth | | First axis dip | | Second axis dip |
| Fe (%) | | 40 | | 14 | | 6 |
Table 11.8-1: Direction of the search ellipsoid axes for Fe global (%)
| Element | | Axis | | Length (meters) |
| Fe (%) | | 1 | | 75 |
| | 2 | | 50 |
| | 3 | | 5 |
Table 11.8-2: Direction of the search ellipsoid axes and search ellipse parameters for Fe (%)
| Round | | Search ellipse size factor | | Minimum
composites | | Maximum
composites | | Minimum hole
number |
| 1 | | 1 | | 2 | | 12 | | 2 |
| 2 | | 2 | | 2 | | 12 | | 1 |
| 3 | | 3 | | 1 | | 12 | | 1 |
| 4 | | 100 | | 1 | | 12 | | 1 |
Table 11.8-3: Search radius and interpolation parameters for Fe (%) and interpolation methods
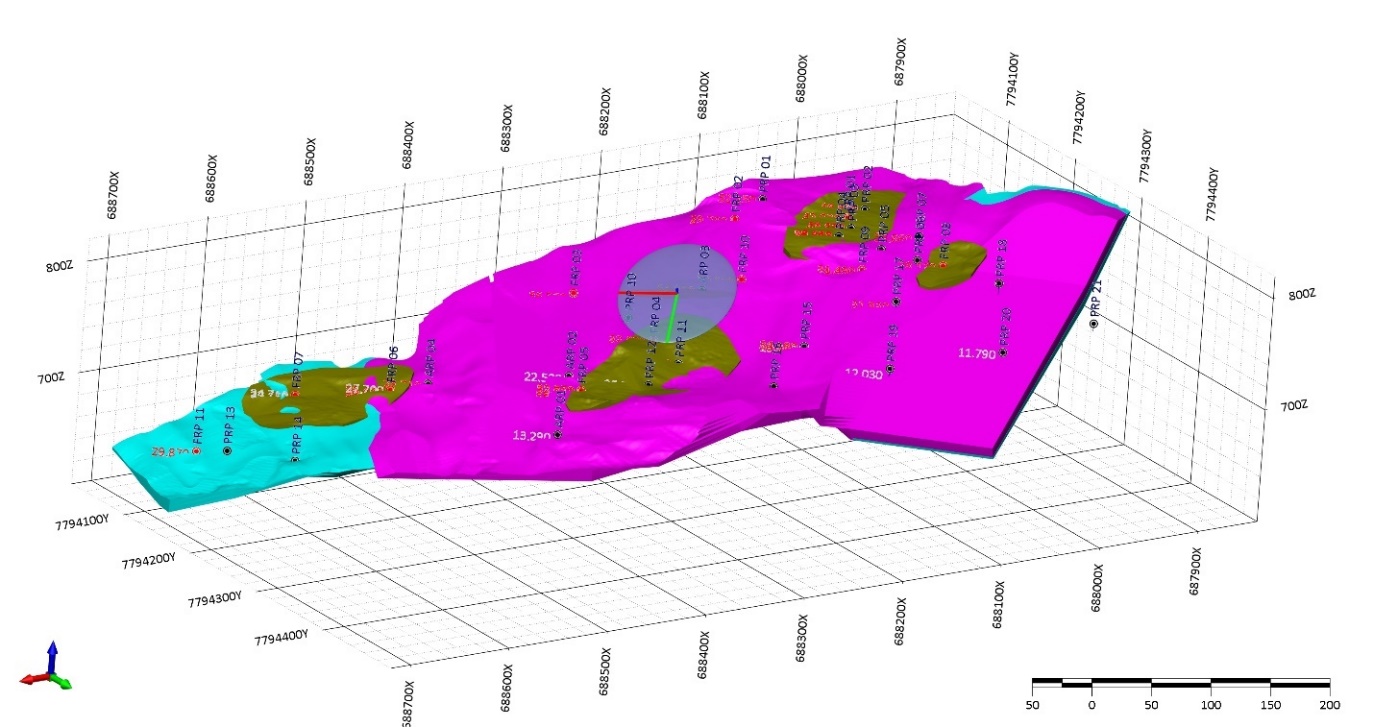
Figure 11.8-1: The orientation of the search ellipsoid and the axes sizes for interpolated
The blocks for each zone of the ore body were interpolated using only composite samples belonging to the corresponding part of the mineralized body, i.e., the waste samples were not used. During the interpolation, the discretization process for each block, evaluated by the X, Y and Z axes with a factor of 2, was used. This makes it possible to evaluate each block in eight (8) positions and assign to the center of the block an average of these evaluations. This increases the precision of the grade estimation in each block.
The limitations presented by each sector of a search ellipse were the maximum number of points in the sector and the minimum total number of points in the interpolation that varies depending on the size of the ellipse, from 3 to 1. Thus, the maximum total number of samples involved in the interpolation was 12 samples.
| S-K 1300 Technical Report Summary | |
| Rio Piracicaba Project | Page 133 |
11.9. Mineral Resource Classification
The resources were classified as Indicated and Inferred according to the degree of reliability of the different rounds and data used for the interpolation of the block model. Solids were created and were used to stamp the inner blocks to each of these reliability zones.
For the Indicated Resource, a solid that encompasses the blocks Friable Itabirite that were stamped in the second round of interpolation and based on the regular 100-meter drilling grid was created. For interpolation, a minimum of 2 holes and 2 composite samples were used, average distance of interpolation samples is 65 meters.
The other blocks were classified as Inferred Resource.
The three-dimensional visualization of the block model with the spatial distribution of the resource classes is shown in the three-dimensional visualization of the block model in Figure 11.9-1.

Figure 11.9-1: Resources classified as Indicated and Inferred
11.10. Density Values for the Block Model
Allocation of density values to the block models was made by direction allocation of the value 3.28 t/m³ for compact itabirite, 3.10 t/m³ for friable itabirite and 1.80 t/m³ for colluvium to each value block. It was considered the same density to all petrographic types of ore, which was obtained from the average of all density measurements.
| S-K 1300 Technical Report Summary | |
| Rio Piracicaba Project | Page 134 |
11.11. Block Model Verification
The comparison histograms and probability plots are illustrated in Figure 11.11-1.
Figure 11.11-1: Histogram and graph of the probability of distribution of Fe (%) in composite samples (left) and block model interpolated by the IDW2 method (right)
In addition, the interpolated grades were compared visually with the actual samples’ grades. A comparison between the actual samples and interpolated grades shows an approximate relation, indicating the precision of the estimated grades of the block model. Several sections were constructed showing the grades of the block model and the grades along the drill holes. The visual comparison is illustrated in the following figures (Figure 11.11-2 through Figure 11.11-4).
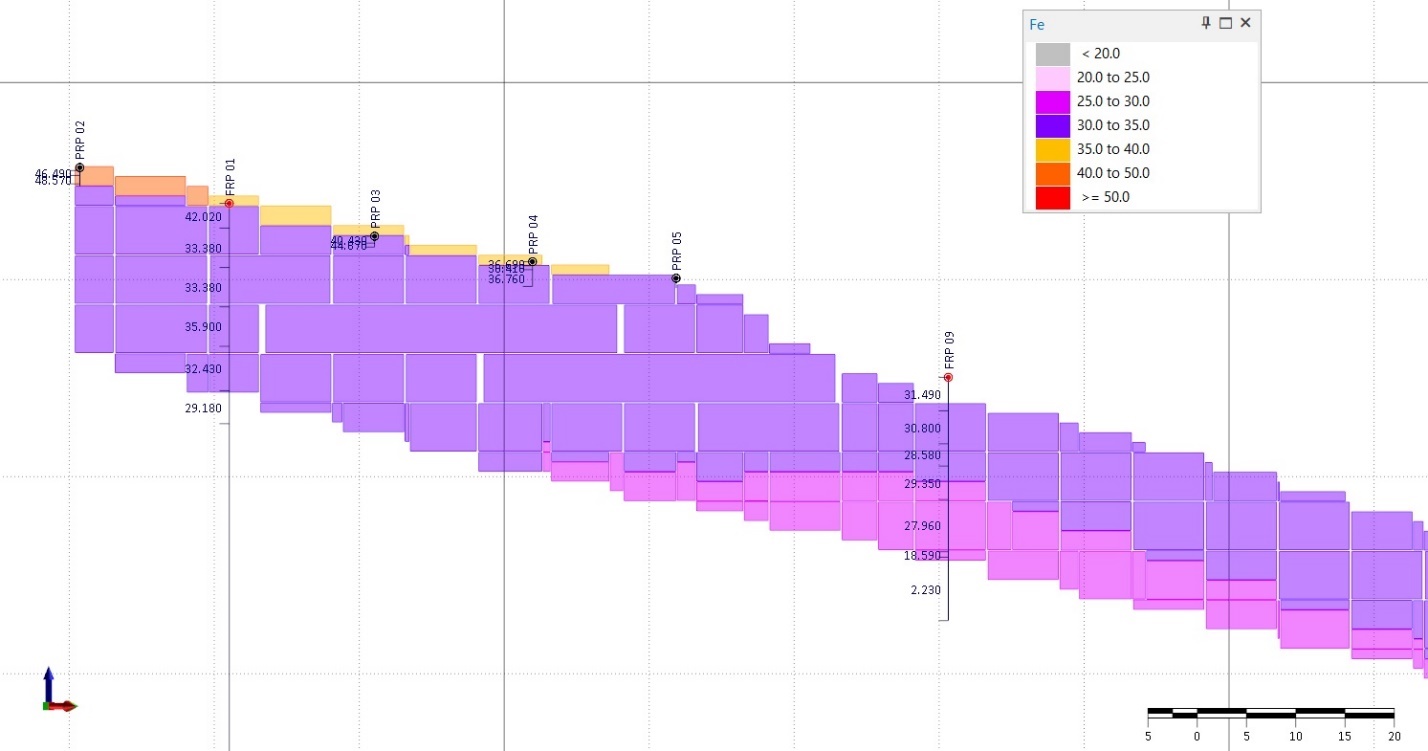
Figure 11.11-2: Fe (%) visualization with block model - Section 2.
| S-K 1300 Technical Report Summary | |
| Rio Piracicaba Project | Page 135 |
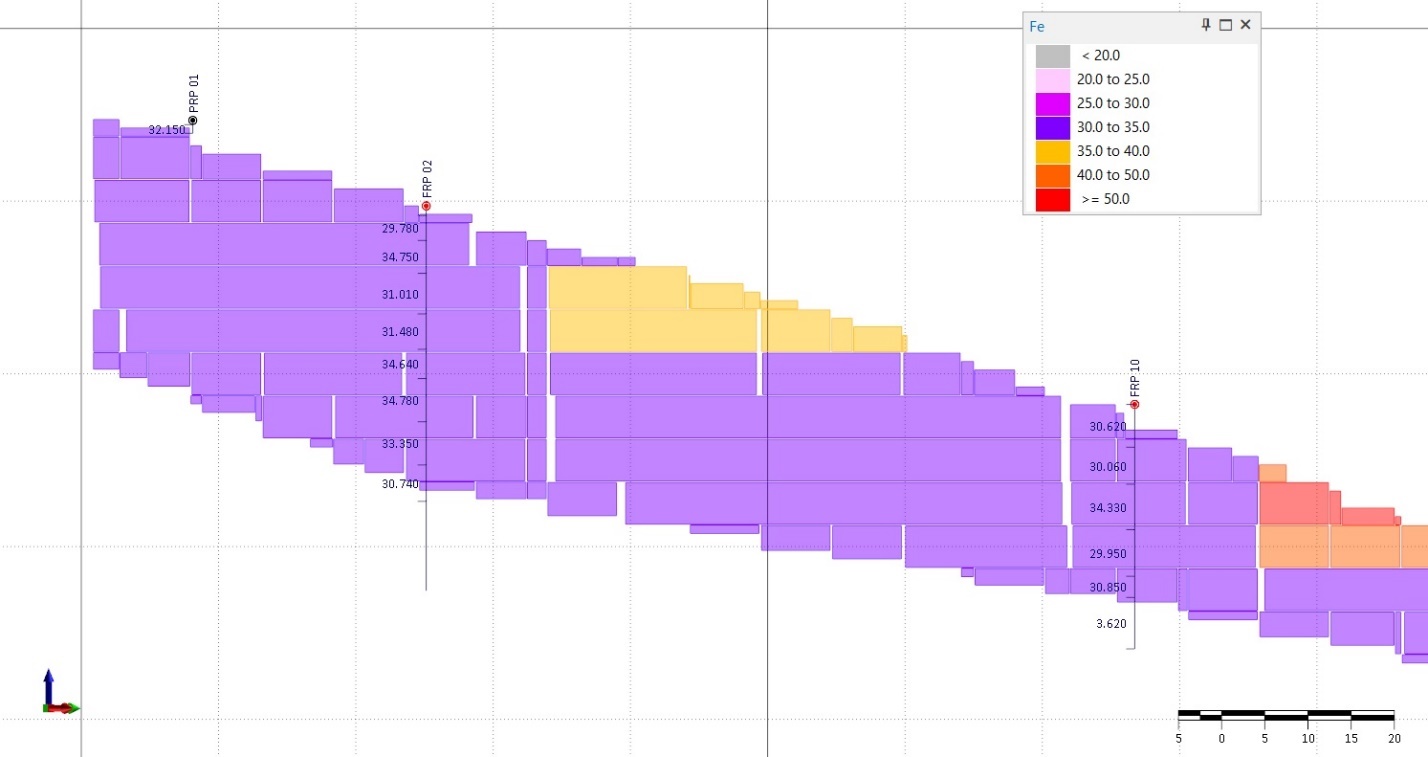
Figure 11.11-3: Fe (%) visualization with block model – Section 4
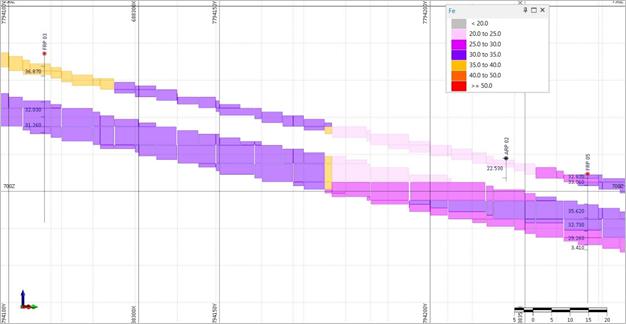
Figure 11.11-4: Fe (%) visualization with block model – Section 6
The average grade of the chemical variable from the model was compared with the average grade of the chemical variable from the sampling interval file for all elements interpolated by the three used methods. The comparison showed a very satisfactory result.
A comparison was made between a provisional polygonal estimation using the “interval” weighting method and the interpolation data by the IDW2 and IDW3 methods for orebodies. This comparison is presented in Table 11.11-1. The average difference between the average grades of Fe (%) for all interpolation methods, in relative percentages, lower than 0.25% and the difference between the volumes of the solid and of the block model is less than 0.012%. These results confirm the good convergence and high reliability of the estimated block model data.
| S-K 1300 Technical Report Summary | |
| Rio Piracicaba Project | Page 136 |
| | VOLUME | | TON. | | DENSITY | | Fe |
| ESTIMATION METHOD | | m³ | | t | | t/m³ | | % |
| Block Model (IDW2) | | 2228581.25 | | 6908601.875 | | 3.1 | | 32.50571988 |
| Block Model (IDW3) | | 2228581.25 | | 6908601.875 | | 3.1 | | 32.58822368 |
| Relative difference % | | 0 | | 0 | | 0 | | -0.253813159 |
| | | | | | | | | |
| Solid | | 2228298.36 | | 6907724.917 | | 3.1 | | 32.61253037 |
| Block Model (IDW2) | | 2228581.25 | | 6908601.875 | | 3.1 | | 32.50571988 |
| Relative difference % | | -0.012695326 | | -0.012695326 | | 0 | | 0.327513656 |
Table 11.11-1: Data comparison between different estimation methods for Fe (%)
11.12. Resource Evaluation Results
The results of the evaluation of resources, based on the block model interpolated by the Inverse Distance Weighting with weight 2 method of iron ore of the Rio Piracicaba Project is presented in the following Table 11.12-1.
| | | | VOLUME | | TONNES | | DENSITY | | Fe | | Si | | Al | | Mn | | P | | PPC |
| CLASS | | TYPE | | M³ | | t | | (t/m³) | | pct | | pct | | pct | | pct | | pct | | pct |
| Indicated | | FRIABLE ITABIRITE | | 853593 | | 2,646,141 | | 3.10 | | 33.74 | | 46.50 | | 1.97 | | 1.04 | | 0.02 | | 1,21 |
| Inferred | | COLLUVIUM | | 67,725 | | 121,905 | | 1.80 | | 31.11 | | 33.17 | | 10.99 | | 1.03 | | 0.05 | | 8.06 |
| | FRIABLE ITABIRITE | | 1,025,538 | | 3,179,166 | | 3.10 | | 31.61 | | 44.97 | | 2.92 | | 3.14 | | 0.02 | | 1.75 |
| | COMPACT ITABIRITE | | 581,006 | | 1,905,701 | | 3.28 | | 28.35 | | 57.68 | | 0.92 | | 0.06 | | 0.01 | | 0,30 |
| TOTAL | | 2,527,863 | | 7,852,912 | | 3.11 | | 31.53 | | 48.39 | | 2.24 | | 1.65 | | 0.02 | | 1.31 |
| | 1. | The definitions for Mineral Resources in S-K 1300 were followed for Mineral Resources. |
| | 2. | Mineral Resources are estimated at a cut-off grade of 20% Fe. |
| 3. | Mineral Resources are estimated using a long-term iron ore price of US$90 per dry metric tonne for the Platts/IODEX 62% Fe fines CFR China, and US$/BRL exchange rate of 5.25. |
| 4. | Reasonable prospects for economic extraction were determined by benchmarking similar operations and developing a 20% Fe cut-off grade based on operating costs. |
| 5. | The effective date is March 30, 2022 |
Table 11.12-1: Resources of Rio Piracicaba Project
The resources were classified as Indicated and Inferred according to the degree of reliability of the different rounds and data used for the interpolation of the block model.
11.13 Uncertainty Factors
Uncertainty factors that may affect the indicated and inferred mineral resources estimates for the PR Project include:
| | ● | Variance in the grade and continuity of mineralization from what was interpreted by drilling and estimation techniques; and |
| | | |
| | ● | Density measurements. |
Mineral resources do not have demonstrated economic viability, but they have technical and economic constraints applied to them to establish reasonable prospects for economic extraction.
The geological evidence supporting indicated mineral resources is derived from adequately detailed and reliable exploration, sampling, and testing, and is sufficient to reasonably assume geological and grade continuity. The indicated mineral resources are estimated with sufficient confidence to allow the application of technical, economic, marketing, legal, environmental, social and government factors to support mine planning and economic evaluation of the economic viability of the Project.
The inferred mineral resources are estimated on the basis of limited geological evidence and sampling, but the information is sufficient to imply, but not verify geological grade and continuity.
The qualified person expects that the majority of the inferred mineral resources could be upgraded to indicated mineral resources with additional drilling.
The qualified person is of the opinion that all issues relating to all relevant technical and economic factors likely to influence the prospect of economic extraction under the base case scenario for the RP Project – selling unprocessed raw iron ore – have been sufficiently resolved with the information available at this time.
12. Mineral Reserves Estimates
There are no Mineral Reserves at this time.
13. Mining Methods
It is assumed based on the depth of the deposit that open pit mining is most appropriate. A cut-off grade has been determined based on operating costs at neighboring mines.
The cut-off grade can be calculated by taking the operating costs and dividing by the revenue. This is typically referred to as an external cut-off grade. The formula is:
External Cut-off = ((Mining + Process Costs) in US$/t product)/((Price US$/t product-transport costs))
Benchmarking other mines in the Iron Quadrangle, Standard & Poor Market Intelligence Data Base shows the following average costs:
| Mining | $3.69/dmt of concentrate |
| Processing | $5.13/dmt of concentrate |
| Rail | $1.72/dmt of concentrate |
| Port | $0.72/dmt of concentrate |
| Shipping | $12.98/dmt of concentrate |
Using a price of US$90 per dry metric tonne for the Platts/IODEX 62% Fe fines CFR China, and assuming an average Itabirite feed grade of 35% Fe to produce a 62% Fe concentrate, we can develop an upgrade factor to adjust the costs based on lower feed grades. For Rio Piracicaba, a 34.9% Fe Itabirite grade produced a 64.2% Fe product at an 83.4% recovery. Adjusting for feed grade, the upgrade factor is 64.2/34.9/0.834 = 2.2. Therefore it takes 2.2 tonnes of feed to make 1 tonne of concentrate. Using this factor, operating costs are adjusted to:
| Mining | $8.12/t mined |
| Process | $11.29/t processed |
| Revenue | $90/dmt – 15.42/dmt transport costs = $74.58/dmt |
Based on operating costs of $19.41 and revenue of $74.58, the operating costs breakeven when the upgrade factor is 8.8. For a 62% product grade, and an 8.8 upgrade factor (8.8 tonnes of feed per tonne of concentrate), the cut-off grade is 62/8.8/0.834= 8.4% Fe. As the surrounding properties are larger producers, a cut-off grade of 20% Fe has been applied to the Mineral Resource to account for economies of scale and to demonstrate reasonable prospects for eventual economic extraction.
14. Process and Recovery Methods
As discussed in Section 10, metallurgical test work has shown a 64% Fe product can be produced from the Itabirite. Processing would include fine grinding to a P80 of 300 microns followed by MIMS and WHIMS magnetic circuits.
| S-K 1300 Technical Report Summary | |
| Rio Piracicaba Project | Page 137 |
15. Infrastructure
With the existing neighboring Minas Agua Limpia owned by Vale, all necessary infrastructure including rail is within close proximity.
16. Market Studies and Contracts
Iron ore is freely traded, at prices that are widely known, so that prospects for sale of any production are virtually assured. A long-term iron ore price of US$90 per dry metric tonne for the Platts/IODEX 62% Fe fines CFR China has been assumed based on a review of an iron ore forecast from Knoema. Knoema, shows data out to 2030, available in the link below:
https://knoema.com/wxgcxde/commodity-price-forecasts-2020-2030-data-and-charts.
Iron ore is the fundamental raw material in steelmaking, the world’s largest metals industry. Global crude steel production of 1.88 billion tonnes in 2020 generated a demand for 2.34 billion tonnes of iron ore, and the two industries are inextricably linked. Regularly-published market assessments by independent commercial price reporting agencies are provided on subscription basis or available for public access from a wide range of sources. These groups include S&P Global Platts Metal (Platts), Fastmarkets (previously Metal Bulletin), Argus Media, and Shanghai Metals Market.
Most indices are estimated and published as prices denominated in US$/dmt basis CFR China.
17. Environmental Studies, Permitting, and Plants, Negotiations, or Agreements with Local Individuals or Groups
The current Rio Piracicaba Project is operating under an Exploration license. Additional environmental baseline and permitting would be required to advance the Project.
18. Capital and Operating Costs
This section is not relevant to this TRS.
19. Economic Analysis
This section is not relevant to this TRS.
20. Adjacent Properties
The Rio Piracicaba Project is located within the historic Iron Quadrangle, close to Morro Agudo and Água Limpa mines, both operated by Vale SA.
The authors have not independently verified that the mineralization at these surrounding mines is similar in characteristics to the Rio Piracicaba Project.
21. Other Relevant Data and Information
The authors are not aware of any data or information that has not been included in this TRS.
| S-K 1300 Technical Report Summary | |
| Rio Piracicaba Project | Page 138 |
22. Interpretation and Conclusions
The works and results of this research presented refer to the mineral right 833.114/2012, exploration permit No. 12.891, published in the Official Gazette on 10/26/2015, extended on 03/23/2020 owned by Apollo Resources.
It is an iron ore deposit, inserted in Fm. Cauê: the occurrence of iron is constituted by siliceous friable itabirite. semi-compact friable itabirite and colluvium/rolled with less expression. These iron formations cover practically all the twenty-five hectares of researched area, which is: 250.000 m². Even though they were not exposed, all the drill holes intercepted them. The thickness of these potentially mineralized formations ranges from 16m to 20m, dipping at a low angle (<30°) to SE. Considering these thicknesses and density of 2.7g/cm³, the potential varies from 10 to 13 million tons of in situ material. The global contents range from 31 to 32% Fe, based on the global results of chemical analyzes presented in item 11 of this TRS.
Sample preparation, assaying and security are acceptable at this exploration stage.
No duplicates were applied in the QA/QC program of Apollo Resources in the Rio Piracicaba Project, which makes the program incomplete, as the analysis precision (the ability to consistently reproduce a measurement in similar conditions) cannot be verified.
For exploration next phases, the QA/QC program must be improved, including field duplicates, coarse and pulp duplicates. Blanks must be inserted as coarse samples as the first sample of the lots. There must be a medium grade standard inserted in the QA/QC program. In the QP’s opinion, the sample preparation, analysis, security procedures and database verification at Rio Piracicaba Project comply with industry standards and are adequate for use in the estimation of Mineral Resources.
Wet granulochemical tests and a preliminary concentration study were carried out in surface samples. Based on the results obtained, it is possible to demonstrate that friable itabirite presents characteristics that allow the application of magnetic separation as a concentration methodology.
The QP is of the opinion that the data derived from the metallurgical testing activities are adequate for the purposes of defining a Mineral Resource. The results from ROUTE C, encompassing pre-concentration, grinding to P80 of 300 microns followed by MIMS at 4000 Gauss and WHIMS at 11000 Gauss, was proved to be the best option, leading to a final concentrate grade of 64.2% Fe and iron recovery of 83.4% with silica and alumina concentrations below the penalty levels.
23. Recommendations
Out of a total of 259.56 hectares of the mineral right area, only 23.2 ha were explored and presented in this TRS (less than 10% of the total). The remaining surface area belongs to Vale S.A. which at the time did not allow exploration activities in its property. Therefore. it is essential to Apollo Resources to obtain the legal required authorization and extend the exploration work to this portion.
It is necessary to carry on with exploration works up to a minimum 100m x 100m drillholes grid spacing and to develop a more in-depth process route study for the types of itabirites: siliceous friable itabirite - IFS and semi-compact itabirite - ISC. seeking gravimetric. magnetic and flotation concentration options.
A validation procedure is in progress for all the exploration work carried out so far. in order to guarantee compliance with the best technical practices in the industry. The validation includes checks on the quality of the topographic surveys. the execution of the drilling. drill core logging. sampling. and the practices in the contracted laboratory. In addition. the validity of using samples from wells and channels will be verified.
After this validation process. a geological model will be developed to support the continued exploration work.
| S-K 1300 Technical Report Summary | |
| Rio Piracicaba Project | Page 139 |
Estimated costs of the work program are shown in the table below.
| Item | | Cost (US$) | |
| Additional Diamond Drilling | | | 120,000.00 | |
| Additional Chemical Analysis and QA/QC | | | 15,000.00 | |
| Technical Services for Mineral Resource Estimation | | | 30,000.00 | |
| Other Direct and Indirect Costs | | | 10,000.00 | |
| TOTAL | | | 175,000.00 | |
Table 23-1: Proposed Budget for Recommended Work
24. References
Alkmim F.F. & Martins-Neto M.A. 2001. A bacia intracratônica do São Francisco: arcabouço estrutural e cenários evolutivos. In: C.P. Pinto & M.A. Martins-Neto (eds.). A Bacia do São Francisco geologia e recursos naturais. SBG, Belo Horizonte, p.: 9-30.
Alkmim F.F., Marshak S., Pedrosa-Soares A.C., Peres G.G., Cruz S., Whittington A. 2006. Kinematic evolution of the Araçuaí-West Congo orogen in Brazil and Africa: Nutcracker tectonics during the Neoproterozoic assembly of Gondwana. Precambrian Res., 149: 43-64.
ALMEIDA, L. G. et al. O Grupo Sabará no Sinclinal Dom Bosco, Quadrilátero Ferrífero: Uma revisão estratigráfica. Revista Brasileira de Geociências, Ouro Preto, v. 35, p. 177-186, jun. 2005.
Babinski, M., Gradim, R.J., Pedrosa-Soares, A.C., Alkmim, F.F., Noce, C.M. & Liu, D. 2005. Geocronologia U–Pb (SHRIMP) e Sm–Nd de xistos verdes basálticos do Orógeno Araçuaí: Implicações para a idade do Grupo Macaúbas. Revista Brasileira de Geociências, 35 (4-suplemento): 77-81.
Becker, EW, 2004. The nutricional of microalgae for aquaculture. In: Richmond, A. (Ed). Handbook of Microalgal Culture: Biotechnology and Applied Phycology, Blackwell Publishing Ltd: 380-291
BEUKES, Nicolas J.; KLEIN, Cornelis. Geochemistry and sedimentology of a facies transition — from microbanded to granular iron-formation — in the early Proterozoic Transvaal Supergroup, South Africa. Precambrian Research, [S.L.], v. 47, n. 1-2, p. 99-139, abr. 1990. Elsevier BV.
Brueckner H., Cunningham W.D., Alkmim F.F., Marshak S. 2000. Tectonic implications of Precambrian Sm-Nd dates from the southern São Francisco craton and adjacent Araçuaí and Ribeira belts, Brazil. Precambrian Research, 99(3-4):255-269.
Cabral A.R., Zeh A., Koglin N., Gomes Jr. A.A.S., Viana D.J., Lehmann D. 2012. Dating the Itabira iron formation, Quadrilátero Ferrífero of Minas Gerais, Brazil, at 2.65 Ga: Depositional U-Pb age of zircon from a metavolcanic layer. Precambrian Research, 204-205:40-45.
Canfield. D. E. (1998) A new model for Proterozoic Ocean chemistry. Nature 396, 450-453.
Cloud, P., 1965. Significance of the Gunflint (Precambrian) microflora. Ciência, 148, 27-35.
Cloud, P., 1973. Significado paleoecológico da formação de ferro em faixas. Economic Geology, 68, 1135-1143.
CUTTS, K. A.; LANA, C. de C. The complex tale of Mantiqueira and Juiz de Fora: a comment on “Eoarchean to Neoproterozoic crustal evolution of the Mantiqueira and the Juiz de Fora Complexes, SE Brazil: petrology, geochemistry, zircon U-Pb geochronology and Lu-Hf isotopes”. Precambrian Research v. 332, p. 105305, set. 2019.
| S-K 1300 Technical Report Summary | |
| Rio Piracicaba Project | Page 140 |
DOPICO, C. I. M. et al. U–Pb ages and Hf-isotope data of detrital zircons from the late Neoarchean-Paleoproterozoic Minas Basin, SE Brazil. Precambrian Research, v. 291, p. 143-161, 2017.
FARINA, F. et al. The Archeane-Paleoproterozoic evolution of the Quadrilátero Ferrífero, Brasil: current models and open questions. Journal of South American Earth Sciences, v. 68, p. 4-21, 2016.
FARQUHAR, M. C.; EWING, G.; BOOTH, S. Using mixed methods to develop and evaluate complex interventions in palliative care research. Sage Journals, Cambridge, 1 ago. 2011.
Frei, R., Gaucher, C., Poulton, SW e Canfield, DE, 2009, Fluctuations in Precambrian atmosfpheric oxigenation registrado por isótopos de cromo: Nature, v. 461, no. 7261, pág. 250–253.
Gonçalves G.O., Lana C., Buick I.S., Alkmim F.F., Scholz R., Queiroga G. 2020. Twenty million years of post-orogenic fluid production and hydrothermal mineralization across the external Araçuaí orogen and adjacent São Francisco craton, SE Brazil. Lithos, 342-343:557-572.
Gross, G.A. 1983. Tectonic systems and the deposition of iron-formation. Precambrian Research, 20: 171-187.
Hagemann S.G., Angerer T., Duuring P., Rosière C.A., Figueiredo e Silva R.C., Lobato L., Hensler A.S., Walde D.H.G. 2015. BIF-hosted iron mineral system: A review. Ore Geology Reviews, 76:317-359. doi: 10.1016/j.oregeorev.2015.11.004.
Hartmann L.A., Endo I., Suita M.T.F., Santos J.O.S., Frantz J.C., Carneiro M.A., McNaughton N.J., Barley M.E. (prelo). Provenance and age delimitation of Quadrilatero Ferrifero sandstones based on zircon U-Pb isotopes. Jour. South Am. Earth Sci.
James, H. L., 1954, Sedimentary facies of ironformations: Econ. Geol., v. 49, p. 235-293 and Trendall, A. F., 1982, Banded iron formation: distribution in time and paleoenvironmental significance, in Holland, H. D., and Schidlowski, M., eds., Mineral Deposits and the Evolution of the Biosphere: New York, Springer-Verlag, p. 199-218.
Klein, C. & Beukes, N.J. 1993. Sedimentology and Geochemistry of the Glaciogenic Late Proterozoic Rapitan Iron-Formation in Canada. Economic Geology, 88:542-565.
Koglin N., Zeh A., Cabral A.R., Gomes Jr. A.A.S., Correa Neto A.V., Brunetto W.J., Galbiatti H. 2014. Depositional age and sediment source of the auriferous Moeda Formation, Quadrilátero Ferrífero of Minas Gerais Brazil: new constraints from U-Pb–Hf isotopes in zircon and xenotime. Precambrian Research, 255:96-108.
LADEIRA, Eduardo Antonio. Metallogenesis of Gold at the MorroVelho Mine and in the Nova Lima District, Quadrilátero Ferrífero, Minas Gerais, Brazil. 1980. 272 f. Tese (Doutorado) - Department of Geology, University of Western Ontario, London, 1980.
LANA, C. et al. The ancestry and magmatic evolution of Archaean TTG rocks of the Quadrilátero Ferrífero province, southeast Brazil. Precambrian Research, v. 230, p. 1-30, 2013.
Lovely D. R., Stolz J. F., Nord G. L., and Phillips E. J. P. (1987) Anaerobic production of magnetite dissimilatory iron-reducing microorganism. Nature 330, 252-254.
MACHADO, N., NOCE, C. M., LADEIRA, E. A., BELO De OLIVEIRA, O. A. U-Pb geochronology of Archean magmatism and Proterozoic metamorphism in the Quadrilatero Ferrifero, southern Sao Francisco craton, Brazil. Geological Society of America Bulletin, v. 104, p. 1221-1227. 1992.
Machado N., Schrank A., Noce C.M., Galthier G. 1996. Ages of detrital zircon fron Archean-Paleoproterozoic sequences: Implications for Greenstone Belt setting and evolution of a Transamazonian foreland basin in Quadrilátero Ferrífero, southeast Brazil. Earth Planet. Sci. Lett., 141:259-276.
| S-K 1300 Technical Report Summary | |
| Rio Piracicaba Project | Page 141 |
MARSHAK, S. & ALKMIN, F.F. 1989. Proterozoic contraction/extension tectonics of the southem São Francisco region, Minas Gerais, Brazil. Tectonics, 8: 555-571.
Mendes M.C.O., Lobato L.M., Suckau V., Lana C. 2014. In situ LA-ICPMS U-Pb dating of detrital zircons from the Cercadinho Formation, Minas Supergroup. Geologia USP – Série Científica, 14(1):55-68.
MONTEIRO, Lena Virgínia Soares; XAVIER, Roberto Perez; SOUZA FILHO, Carlos Roberto de; MORETO, Carolina Penteado Natividade. Metalogênese da Província Carajás. In: Metalogênese das províncias tectônicas brasileiras [S.l: s.n.], p. 43-92, 2014.
NOCE, C. M., MACHADO, N., TEIXEIRA, W. UPb Geochronology of gneisses and granitoids in the Quadrilatero Ferrifero (Southern São Francisco Craton): age constraints for Archean and Paleoproterozoic magmatism and metamorphism. Revista Brasileira de Geociencias, v. 28, p. 95–102. 1998.
Noce C., Zuccheti M., Baltazar O., Armstrong R., Dantas E., Renger F., Lobato L. 2005. Age of felsic volcanism and the role of ancient continental crust in the evolution of the Neoarchean Rio das Velhas Greenstone belt (Quadrilátero Ferrífero, Brazil): U-Pb zircon dating of volcanoclastic graywackes. Precambrian Research, 141(1):67-82. http://dx.doi. org/10.1016/j.precamres.2005.08.002
PLANAVSKY, Noah; BEKKER, Andrey; ROUXEL, Olivier J.; KAMBER, Balz; HOFMANN, Axel; KNUDSEN, Andrew; LYONS, Timothy W. Rare Earth Element and yttrium compositions of Archean and Paleoproterozoic Fe formations revisited: new perspectives on the significance and mechanisms of deposition. Geochimica Et Cosmochimica Acta, [S.L.], v. 74, n. 22, p. 6387-6405, nov. 2010.
Ramanaidou, E. R. and Morris, R. C., Thornber, 2009. Genesis of lateritic iron ore from banded iron-formation in the Capanema mine (Minas Gerais, Brazil), Aust. J. Sci., 56, (4), 603–618.
RENGER, Friedrich E.; NOCE, Carlos Maurício; ROMANO, Antônio Wilson.; MACHADO, Nuno. Evolução sedimentar do Supergrupo Minas: 500 Ma de registro geológico no Quadrilátero Ferrífero, Minas Gerais, Brasil. Geonomos, Belo Horizonte, v. 2, n. 1, p. 1-11, 1994.
Romano R., Lana C., Alkmim F.F., Stevens G.S., Armstrong R. 2013. Stabilization of the southern portion of the São Francisco Craton, SE Brazil, through a long-lived period of potassic magmatism. Precambrian Research, 224:143-159.
ROSIÈRE, Carlos A.; CHEMALE JUNIOR, Farid. Itabiritos e minérios de ferro de alto teor do Quadrilátero Ferrífero – uma visão geral e discussão. Geonomos, [S.L.], p. 27-43, 1 dez. 2000. Geonomos.
Scott, PT; Pregelj, L.; Chen, N.; Hadler, JS; Djordjevic, MA; Gresshoff, PM, 2008. Um recurso inexplorado para a indústria de biocombustíveis do futuro. BioEnergy Res. (1 (1): 2-11
Schorscher H. D. 1978. Komatiitos na estrutura greenstone belt da Série Rio das Velhas, Quadrilátero Ferrífero, Minas Gerais, Brasil. In: CONGRESSO BRASILEIRO DE GEOLOGIA, 30. Recife, 1978. Anais .... Recife, SBG. 1, p.292-293.
SPIER, C.A.; VASCONCELOS, P.M. & OLIBEIRA, S.M.B. 40Ar/39Ar geochronological constraints on the evolution of lateritic iron deposits in the Quadrilátero Ferrífero, Minas Gerais, Brazil. Chem. Geol., 234:79-104, 2006.
Trendall, A.F. The significance of iron-formations the Precambrian stratigraphic record. Spec. Publs int. Ass. Sediment., 33: 33-66.
Teixeira, FK, Sanchez, CG, Hurd, TR, Seifert, JR, Czech, B., Preall, JB, Hannon, GJ, Lehmann, R. (2015). A ATP sintase promove a diferenciação das células germinativas independente da fosforilação oxidativa.
WALKER, R. G. Facies Models: Second Edition. Geological Association of Canada, Canada, p. 1-318, jun. 1984.
Young, G.M. 1976. Iron-formation and glaciogenic rocks of the Rapitan Group, Northwest Territories, Canada. Precambrian Research, 3: 137-158.
25. Reliance on Information Provided by the Registrant
This section is not relevant to this TRS.
