
Sound Financial Bancorp, Inc. NASDAQ: SFBC Laurie Stewart President & CEO Daphne Kelley CFO July 2019 Sponsored By: Keefe, Bruyette & Woods Community Bank Investor Conference
Important Disclosures Forward-Looking Statements Except for the historical information contained in this presentation, the matters discussed in this presentation may be deemed to be forward-looking statements, within the meaning of the Private Securities Litigation Reform Act of 1995, that involve risks and uncertainties. Forward-looking statements can be identified by the fact that they do not relate strictly to historical or current facts. They often include words like “believe,” “expect,” “anticipate,” “estimate” and “intend” or future or conditional verbs such as “will,” “would,” “should,” “could” or “may”. Forward-looking statements, by their nature, are subject to risks and uncertainties. Certain factors that could cause actual results to differ materially from expected results include increased competitive pressures; changes in the interest rate environment; demand for loans in our market area; adverse changes in general economic conditions, either nationally or in our market areas; adverse changes within the securities markets; legislative and regulatory changes that could adversely affect the business in which we are engaged; our future earnings and capital levels; and other risks detailed from time to time in the Company’s Securities and Exchange Commission filings. We caution readers not to place undue reliance on forward-looking statements contained in this presentation. The Company disclaims any obligation to revise or update any forward-looking statements contained in this presentation to reflect future events or developments. 2

Senior Management 3
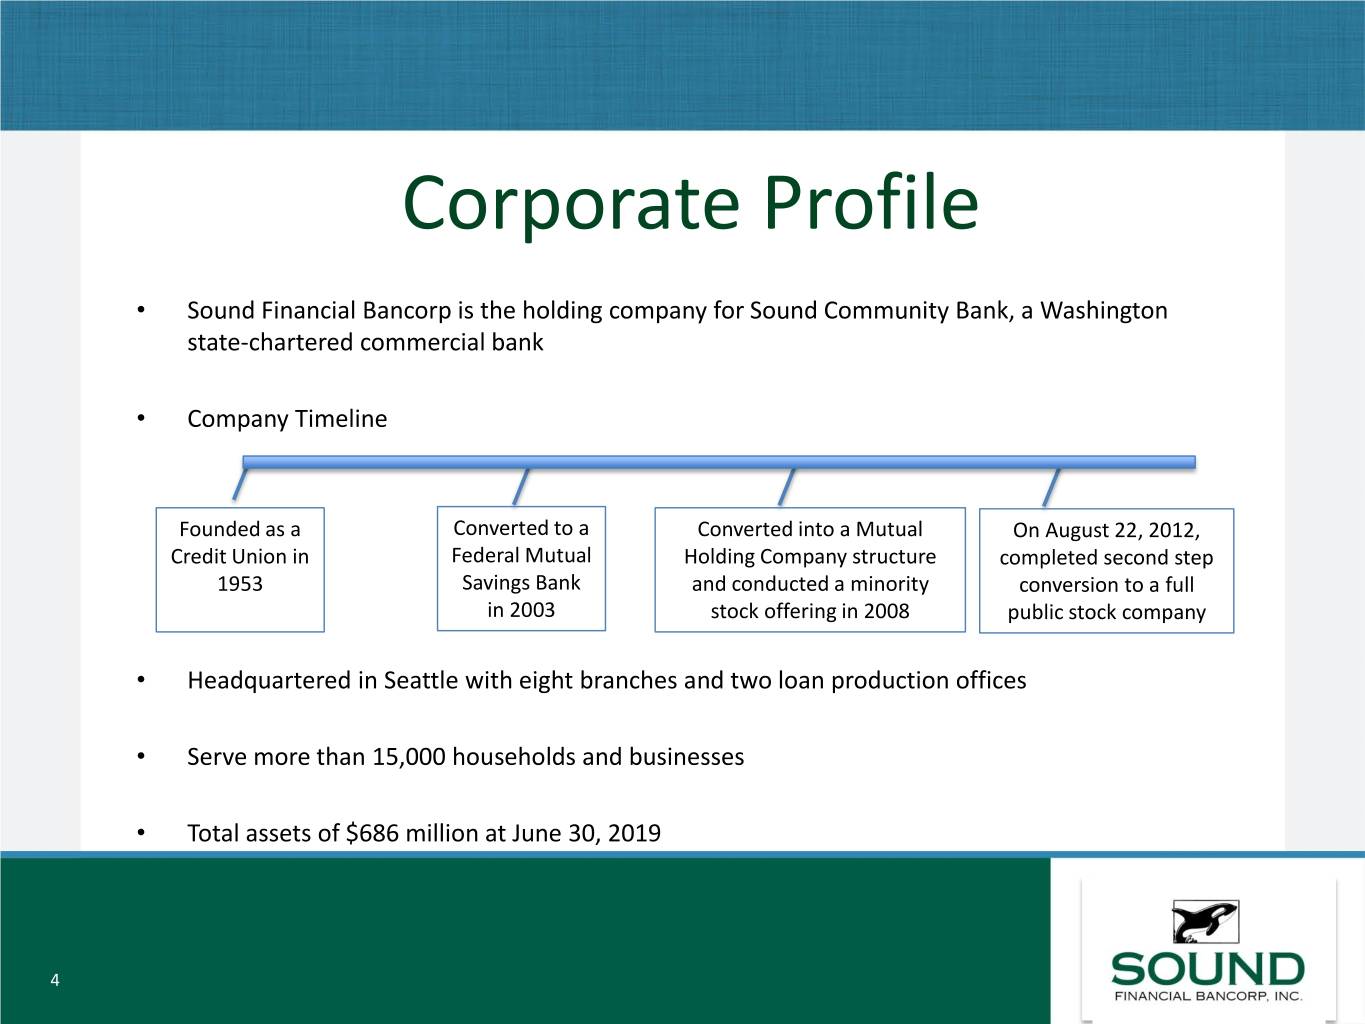
Corporate Profile • Sound Financial Bancorp is the holding company for Sound Community Bank, a Washington state-chartered commercial bank • Company Timeline Founded as a Converted to a Converted into a Mutual On August 22, 2012, Credit Union in Federal Mutual Holding Company structure completed second step 1953 Savings Bank and conducted a minority conversion to a full in 2003 stock offering in 2008 public stock company • Headquartered in Seattle with eight branches and two loan production offices • Serve more than 15,000 households and businesses • Total assets of $686 million at June 30, 2019 4
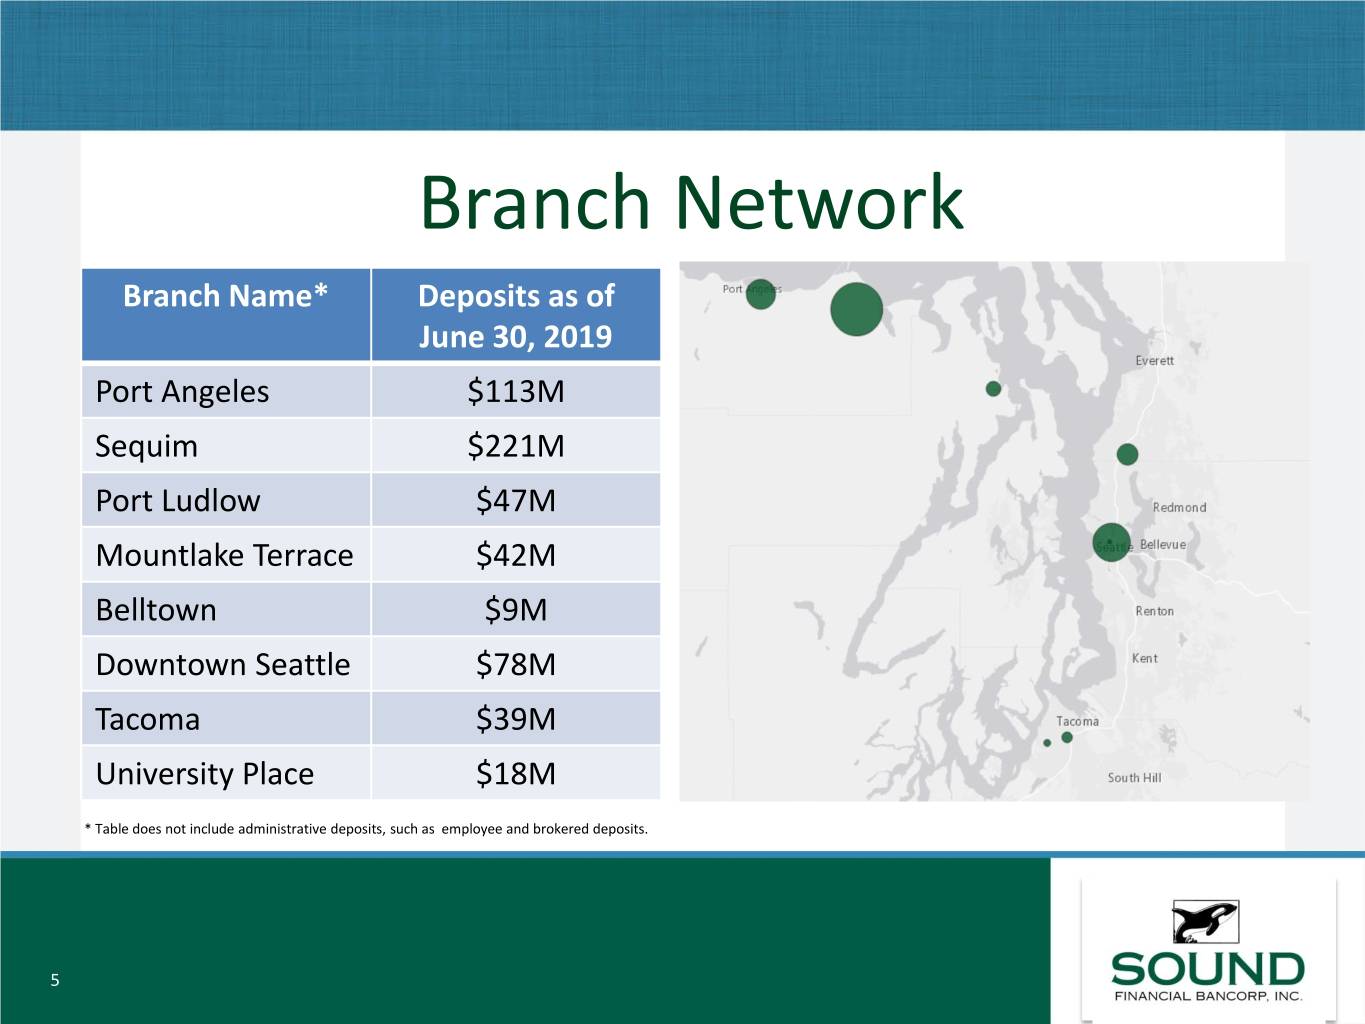
Branch Network Branch Name* Deposits as of June 30, 2019 Port Angeles $113M Sequim $221M Port Ludlow $47M Mountlake Terrace $42M Belltown $9M Downtown Seattle $78M Tacoma $39M University Place $18M * Table does not include administrative deposits, such as employee and brokered deposits. 5

Our Strategy • Attract retail and commercial deposits from the general public through Deposit Growth expansion in product offerings and distribution channels, including our digital strategy. Invest in Loans • Secured by first and second mortgages on one- to four-family residences (including home equity loans and lines of credit), commercial and multifamily real estate, construction and land, consumer and commercial business loans. Operating Efficiency • Focus on improving efficiency ratio specifically through cost containment as well as reduction in cost of funds. Shareholder Return • Maintain prudent levels of capital above regulatory requirements. • Achieve long-term total shareholder return and provide consistent dividends. 6

Strong Economic Region in US • Annual increase of 82,300 in employment as Major Employers in Western Washington of May 20191 • Washington unemployment rate 4.7%, Seattle area 3.5%1 • Median Household income of $84,000 for Washington with a projected five year growth rate of 2.6%2 • Five year population change in Washington projected at 6.2%, or almost 500,000 increase2 Source 1: Washington State Monthly Employment Report for May 2019 Source 2: S&P Global Market Intelligence 7
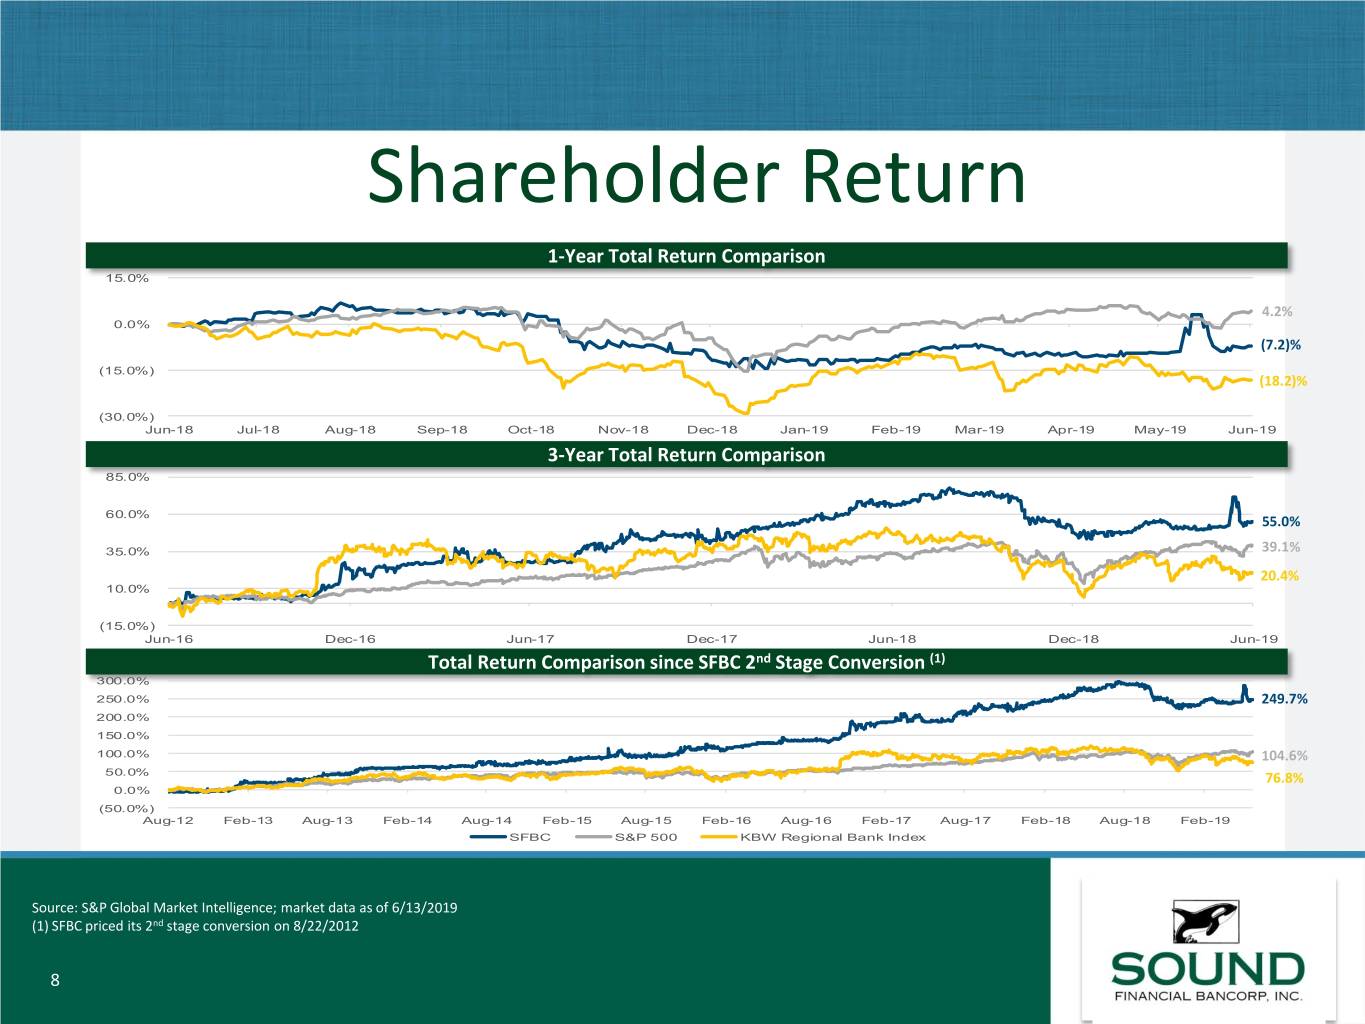
Shareholder Return 1-Year Total Return Comparison 15.0% 4.2% 0.0% (7.2)% (15.0%) (18.2)% (30.0%) Jun-18 Jul-18 Aug-18 Sep-18 Oct-18 Nov-18 Dec-18 Jan-19 Feb-19 Mar-19 Apr-19 May-19 Jun-19 3-Year Total Return Comparison 85.0% 60.0% 55.0% 35.0% 39.1% 20.4% 10.0% (15.0%) Jun-16 Dec-16 Jun-17 Dec-17 Jun-18 Dec-18 Jun-19 Total Return Comparison since SFBC 2nd Stage Conversion (1) 300.0% 250.0% 249.7% 200.0% 150.0% 100.0% 104.6% 50.0% 76.8% 0.0% (50.0%) Aug-12 Feb-13 Aug-13 Feb-14 Aug-14 Feb-15 Aug-15 Feb-16 Aug-16 Feb-17 Aug-17 Feb-18 Aug-18 Feb-19 SFBC S&P 500 KBW Regional Bank Index Source: S&P Global Market Intelligence; market data as of 6/13/2019 (1) SFBC priced its 2nd stage conversion on 8/22/2012 8
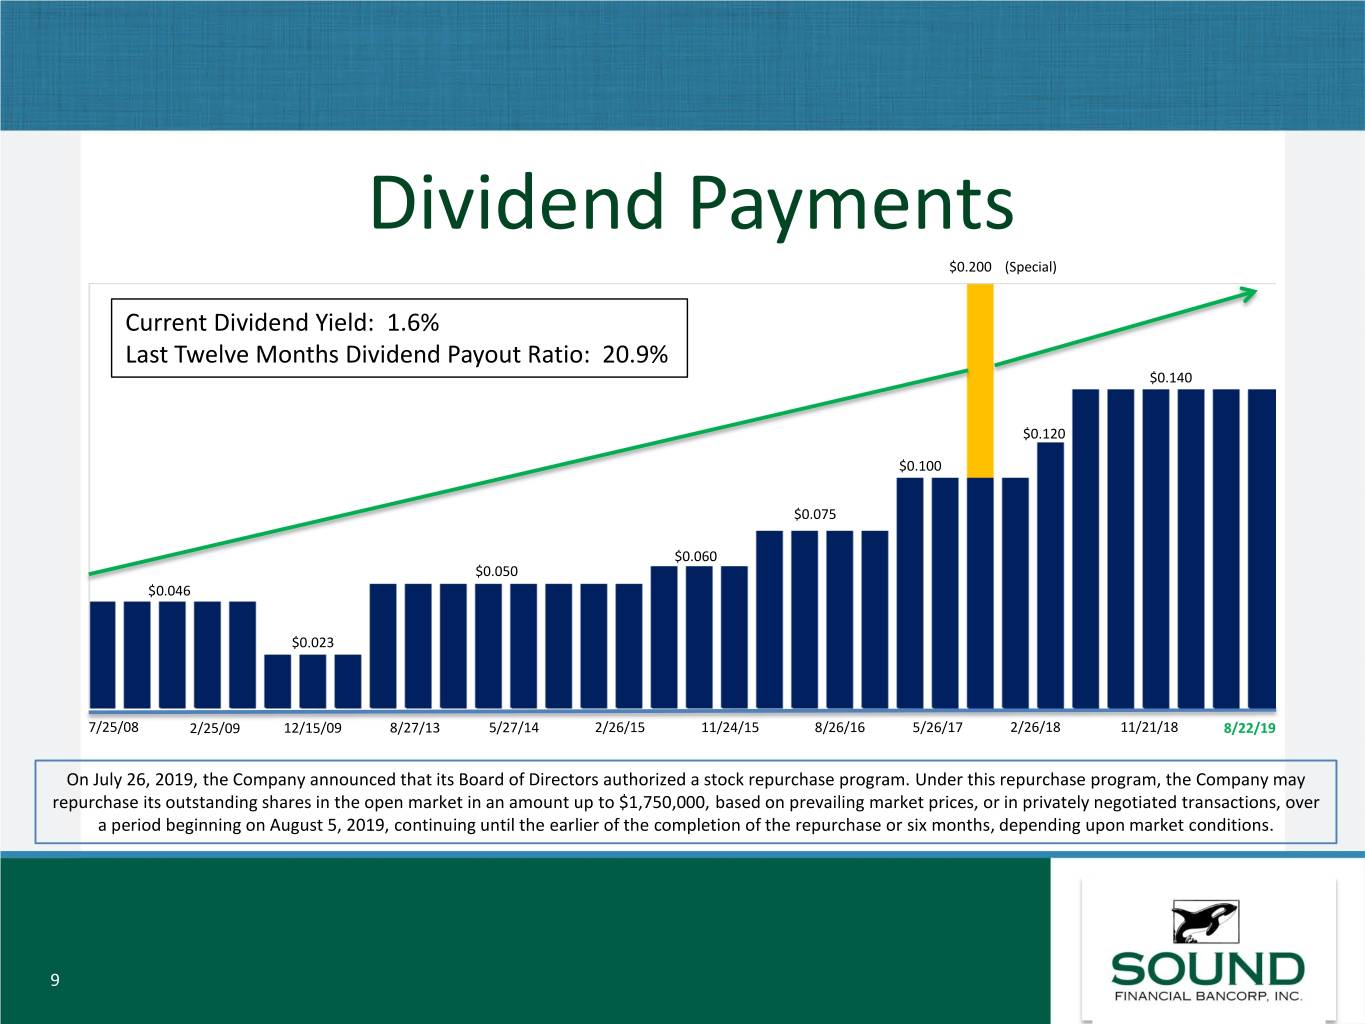
Dividend Payments $0.200 (Special) Current Dividend Yield: 1.6% Last Twelve Months Dividend Payout Ratio: 20.9% $0.140 $0.120 $0.100 $0.075 $0.060 $0.050 $0.046 $0.023 7/25/08 2/25/09 12/15/09 8/27/13 5/27/14 2/26/15 11/24/15 8/26/16 5/26/17 2/26/18 11/21/18 8/22/19 On July 26, 2019, the Company announced that its Board of Directors authorized a stock repurchase program. Under this repurchase program, the Company may repurchase its outstanding shares in the open market in an amount up to $1,750,000, based on prevailing market prices, or in privately negotiated transactions, over a period beginning on August 5, 2019, continuing until the earlier of the completion of the repurchase or six months, depending upon market conditions. 9
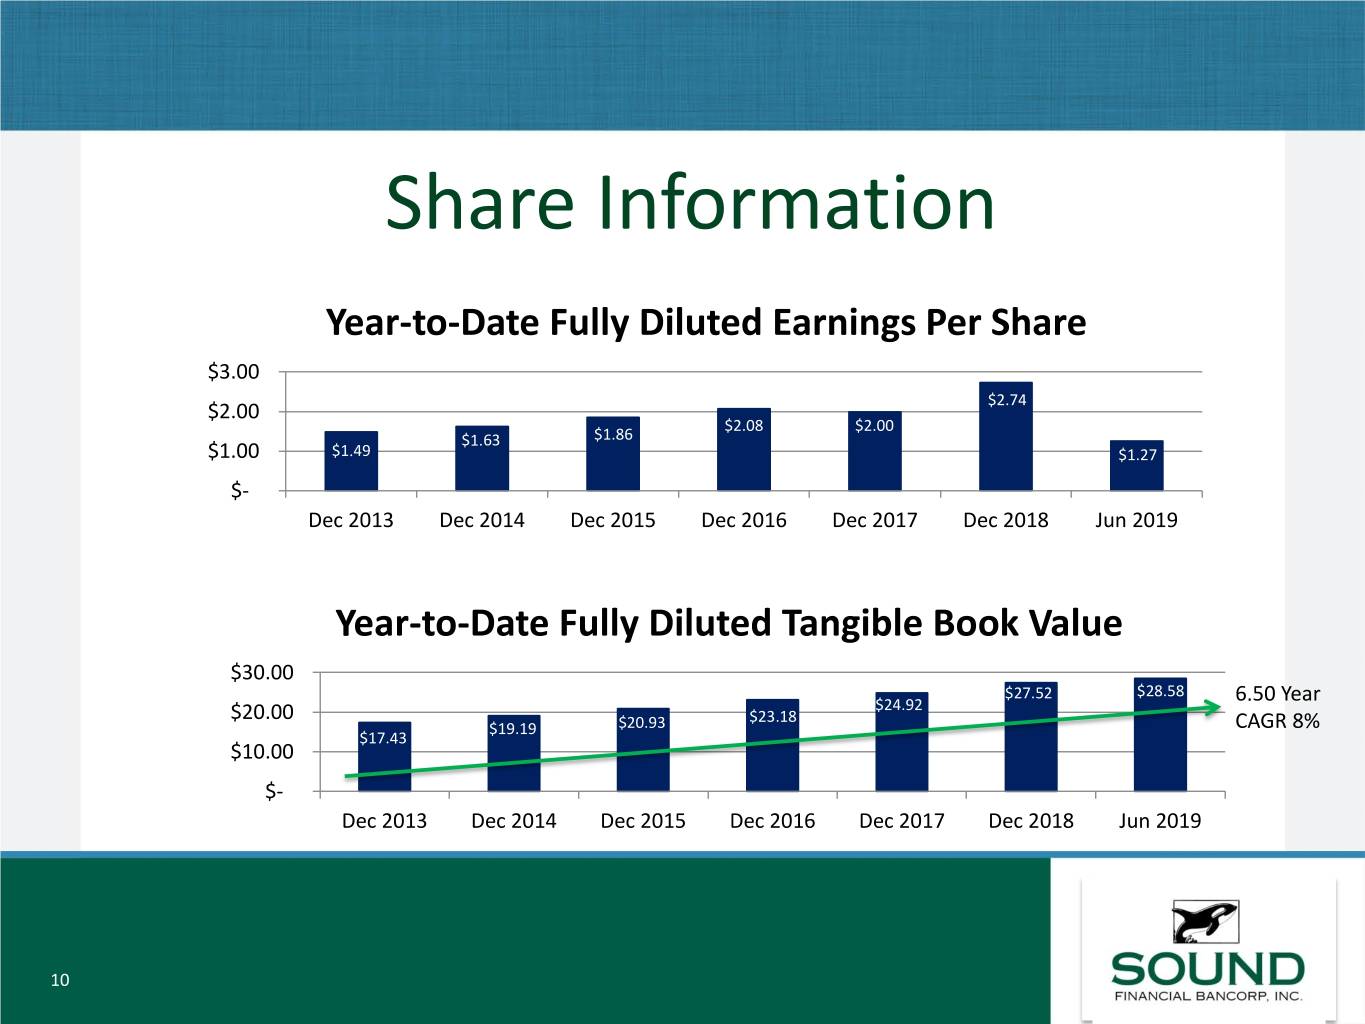
Share Information Year-to-Date Fully Diluted Earnings Per Share $3.00 $2.74 $2.00 $2.08 $2.00 $1.63 $1.86 $1.00 $1.49 $1.27 $- Dec 2013 Dec 2014 Dec 2015 Dec 2016 Dec 2017 Dec 2018 Jun 2019 Year-to-Date Fully Diluted Tangible Book Value $30.00 $27.52 $28.58 $24.92 6.50 Year $20.00 $23.18 $19.19 $20.93 CAGR 8% $17.43 $10.00 $- Dec 2013 Dec 2014 Dec 2015 Dec 2016 Dec 2017 Dec 2018 Jun 2019 10

Financial Highlights Line Item or Ratio Dec 2013 Dec 2014 Dec 2015 Dec 2016 Dec 2017 Dec 2018 Jun 2019 Annual Annual Annual Annual Annual Annual 6 Months Total Assets $443M $495M $541M $588M $645M $717M $686M Interest Bearing Deposits $314M $363M $389M $404M $442M $458M $483M Non-interest Bearing Deposits $35M $44M $51M $64M $72M $96M $96M Loans, net $387M $426M $455M $495M $543M $614M $560M Serviced Loans $363M $373M $381M $440M $421M $383M $391M Loan-to-Deposit Ratio 111.74% 104.93% 103.37% 105.87% 105.63% 112.12% 97.69% Net Interest Margin 4.55% 4.49% 4.17% 4.26% 4.35% 4.25% 4.08% Efficiency Ratio 63.29% 66.97% 68.71% 68.71% 68.89% 71.12% 75.92% Net Income $3.9M $4.2M $4.8M $5.4M $5.1M $7.0M $3.3M 11
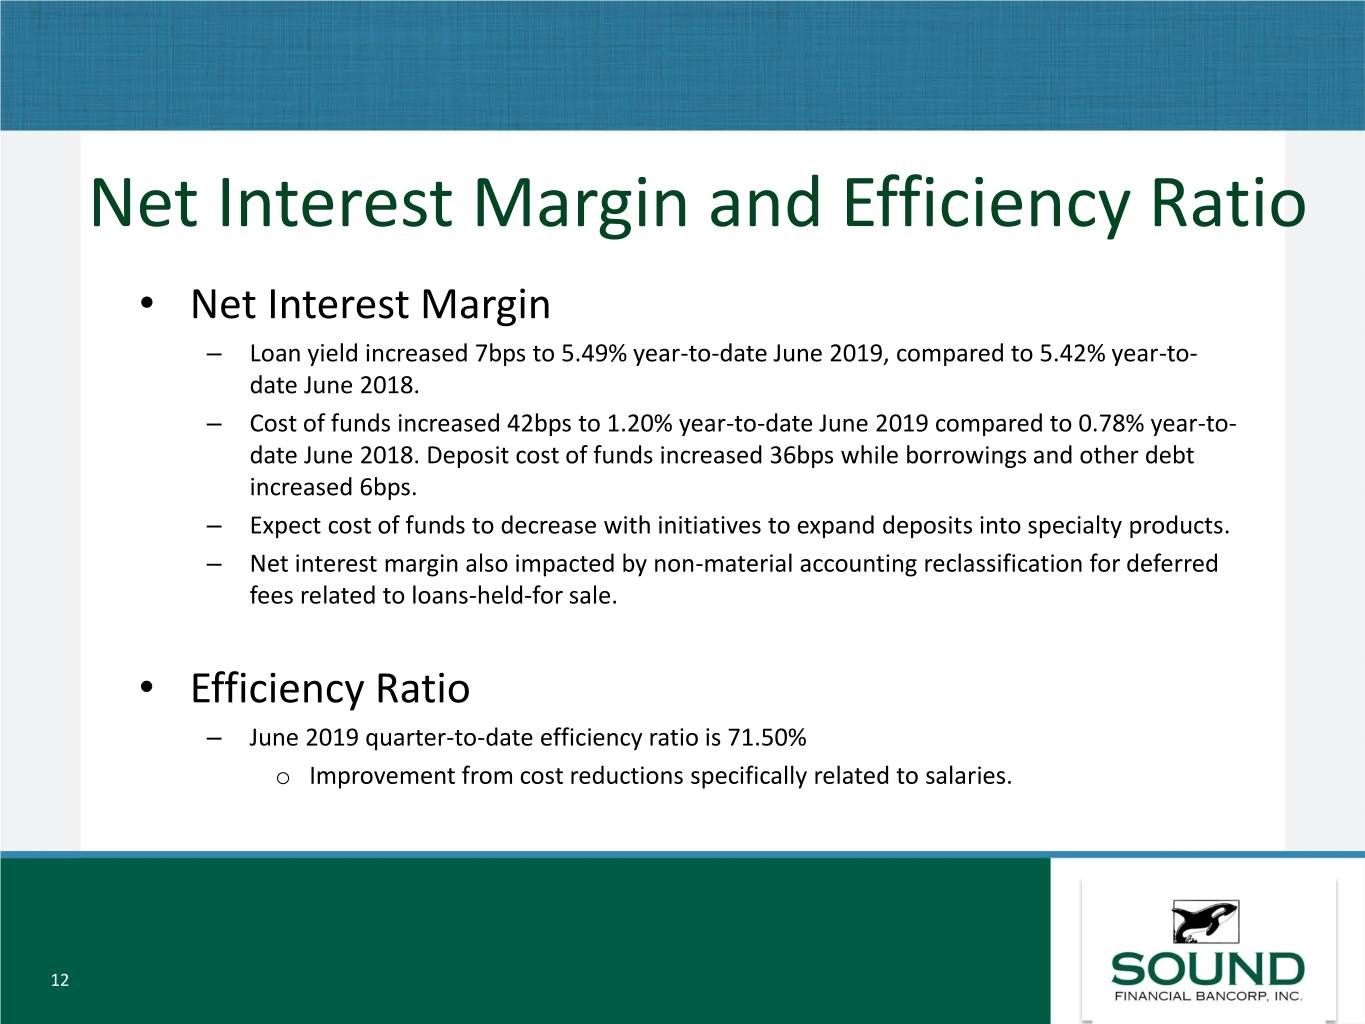
Net Interest Margin and Efficiency Ratio • Net Interest Margin – Loan yield increased 7bps to 5.49% year-to-date June 2019, compared to 5.42% year-to- date June 2018. – Cost of funds increased 42bps to 1.20% year-to-date June 2019 compared to 0.78% year-to- date June 2018. Deposit cost of funds increased 36bps while borrowings and other debt increased 6bps. – Expect cost of funds to decrease with initiatives to expand deposits into specialty products. – Net interest margin also impacted by non-material accounting reclassification for deferred fees related to loans-held-for sale. • Efficiency Ratio – June 2019 quarter-to-date efficiency ratio is 71.50% o Improvement from cost reductions specifically related to salaries. 12
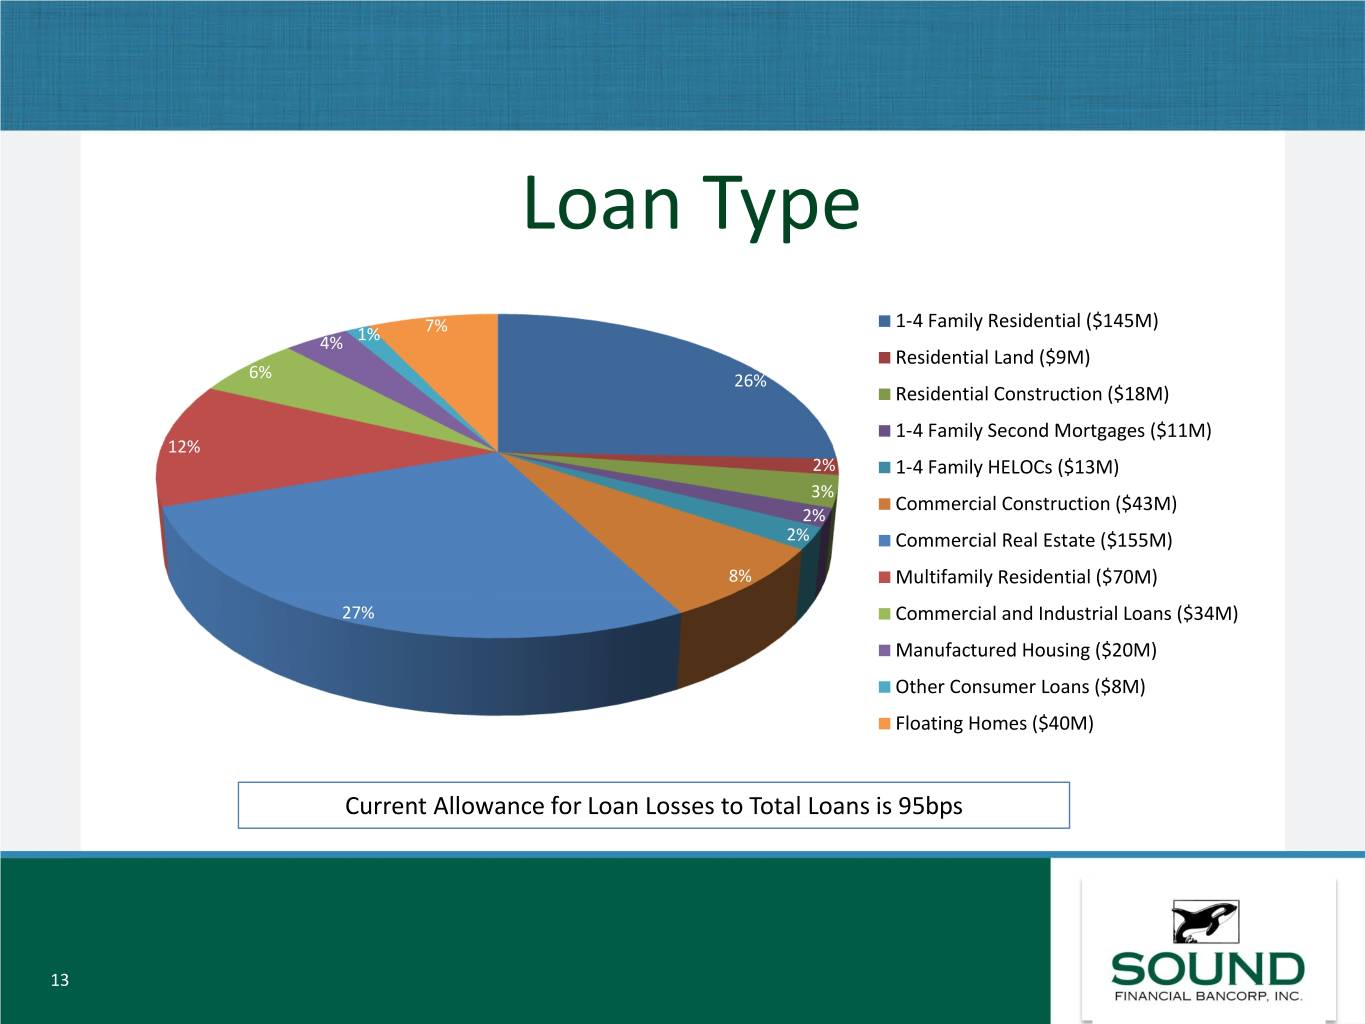
Loan Type 7% 1-4 Family Residential ($145M) 4% 1% Residential Land ($9M) 6% 26% Residential Construction ($18M) 1-4 Family Second Mortgages ($11M) 12% 2% 1-4 Family HELOCs ($13M) 3% Commercial Construction ($43M) 2% 2% Commercial Real Estate ($155M) 8% Multifamily Residential ($70M) 27% Commercial and Industrial Loans ($34M) Manufactured Housing ($20M) Other Consumer Loans ($8M) Floating Homes ($40M) Current Allowance for Loan Losses to Total Loans is 95bps 13
Q&A 14


