| FREE WRITING PROSPECTUS | ||
| FILED PURSUANT TO RULE 433 | ||
| REGISTRATION FILE NO.: 333-226850-01 | ||
| Dated November 26, 2018 | BBCMS 2018-C2 |
Free Writing Prospectus Structural and Collateral Term Sheet | ||
BBCMS Mortgage Trust 2018-C2
| ||
$891,853,554 (Approximate Mortgage Pool Balance) | ||
$788,175,578 (Approximate Offered Certificates) | ||
Barclays Commercial Mortgage Securities LLC Depositor | ||
| | ||
COMMERCIAL MORTGAGE PASS-THROUGH CERTIFICATES, SERIES 2018-C2 | ||
| | ||
Barclays Bank PLC Starwood Mortgage Capital LLC Cantor Commercial Real Estate Lending, L.P. KeyBank National Association Mortgage Loan Sellers | ||
| Barclays Co-Lead Manager and Joint Bookrunner | Cantor Fitzgerald & Co. Co-Lead Manager and Joint Bookrunner | |
KeyBanc Capital Markets Co-Manager
| Drexel Hamilton Co-Manager | |
THE INFORMATION IN THIS STRUCTURAL AND COLLATERAL TERM SHEET IS NOT COMPLETE AND MAY BE AMENDED PRIOR TO THE TIME OF SALE. THIS TERM SHEET IS NOT AN OFFER TO SELL THESE SECURITIES AND IT IS NOT A SOLICITATION OF AN OFFER TO BUY THESE SECURITIES IN ANY JURISDICTION WHERE THE OFFER OR SALE IS NOT PERMITTED.
 |  |
| Dated November 26, 2018 | BBCMS 2018-C2 |
This material is for your information, and none of Barclays Capital Inc., Cantor Fitzgerald & Co., KeyBanc Capital Markets Inc. and Drexel Hamilton, LLC (the “Underwriters”) are soliciting any action based upon it. This material is not to be construed as an offer to sell or the solicitation of any offer to buy any security in any jurisdiction where such an offer or solicitation would be illegal.
The depositor has filed a registration statement (including the prospectus) with the Securities and Exchange Commission (File No. 333-226850) for the offering to which this communication relates. Before you invest, you should read the prospectus in the registration statement and other documents the depositor has filed with the Securities and Exchange Commission for more complete information about the depositor, the issuing entity and this offering. You may get these documents for free by visiting EDGAR on the SEC website at www.sec.gov. Alternatively, the depositor or Barclays Capital Inc., any other underwriter, or any dealer participating in this offering will arrange to send you the prospectus if you request it by calling 1-888-603-5847. The Offered Certificates referred to in these materials, and the asset pool backing them, are subject to modification or revision (including the possibility that one or more Classes of Certificates may be split, combined or eliminated at any time prior to issuance or availability of a final prospectus) and are offered on a “when, as and if issued” basis. You understand that, when you are considering the purchase of these Certificates, a contract of sale will come into being no sooner than the date on which the relevant Class has been priced and we have verified the allocation of Certificates to be made to you; any “indications of interest” expressed by you, and any “soft circles” generated by us, will not create binding contractual obligations for you or us.
Neither this document nor anything contained in this document shall form the basis for any contract or commitment whatsoever. The information contained in this document is preliminary as of the date of this document, supersedes any previous such information delivered to you and will be superseded by any such information subsequently delivered prior to the time of sale. These materials are subject to change, completion or amendment from time to time. The information should be reviewed only in conjunction with the entire offering document relating to the Commercial Mortgage Pass-Through Certificates, Series 2018-C2 (the “Offering Document”). All of the information contained herein is subject to the same limitations and qualifications contained in the Offering Document. The information contained herein does not contain all relevant information relating to the underlying mortgage loans or mortgaged properties. Such information is described elsewhere in the Offering Document. The information contained herein will be more fully described elsewhere in the Offering Document. The information contained herein should not be viewed as projections, forecasts, predictions or opinions with respect to value. Prior to making any investment decision, prospective investors are strongly urged to read the Offering Document its entirety. Neither the Securities and Exchange Commission nor any state securities commission has approved or disapproved of these securities or determined if this free writing prospectus is truthful or complete. Any representation to the contrary is a criminal offense.
This document has been prepared by the Underwriters for information purposes only and does not constitute, in whole or in part, a prospectus for the purposes of Directive 2003/71/EC (as amended) and/or Part VI of the Financial Services and Markets Act 2000 (as amended) or other offering document.
The attached information contains certain tables and other statistical analyses (the “Computational Materials”) which have been prepared in reliance upon information furnished by the Mortgage Loan Sellers. Numerous assumptions were used in preparing the Computational Materials, which may or may not be reflected herein. As such, no assurance can be given as to the Computational Materials’ accuracy, appropriateness or completeness in any particular context; or as to whether the Computational Materials and/or the assumptions upon which they are based reflect present market conditions or future market performance. The Computational Materials should not be construed as either projections or predictions or as legal, tax, financial or accounting advice. You should consult your own counsel, accountant and other advisors as to the legal, tax, business, financial and related aspects of a purchase of these securities. Any weighted average lives, yields and principal payment periods shown in the Computational Materials are based on prepayment and/or loss assumptions, and changes in such prepayment and/or loss assumptions may dramatically affect such weighted average lives, yields and principal payment periods. In addition, it is possible that prepayments or losses on the underlying assets will occur at rates higher or lower than the rates shown in the attached Computational Materials. The specific characteristics of the securities may differ from those shown in the Computational Materials due to differences between the final underlying assets and the preliminary underlying assets used in preparing the Computational Materials. The principal amount and designation of any security described in the Computational Materials are subject to change prior to issuance. None of the Underwriters or any of their respective affiliates make any representation or warranty as to the actual rate or timing of payments or losses on any of the underlying assets or the payments or yield on the securities. The information in this presentation is based upon management forecasts and reflects prevailing conditions and management’s views as of this date, all of which are subject to change. In preparing this presentation, we have relied upon and assumed, without independent verification, the accuracy and completeness of all information available from public sources or which was provided to us by or on behalf of the Mortgage Loan Sellers or which was otherwise reviewed by us.
This document contains forward-looking statements. If and when included in this document, the words “expects”, “intends”, “anticipates”, “estimates” and analogous expressions and all statements that are not historical facts, including statements about our beliefs or expectations, are intended to identify forward-looking statements. Any forward-looking statements are made subject to risks and uncertainties which could cause actual results to differ materially from those stated. Those risks and uncertainties include, among other things, declines in general economic and business conditions, increased competition, changes in demographics, changes in political and social conditions, regulatory initiatives and changes in consumer preferences, many of which are beyond our control and the control of any other person or entity related to this offering. The forward-looking statements made in this document are made as of the date hereof. We have no obligation to update or revise any forward-looking statement.
IMPORTANT NOTICE RELATING TO AUTOMATICALLY-GENERATED EMAIL DISCLAIMERS
Any legends, disclaimers or other notices that may appear at the bottom of any email communication to which this document is attached relating to (1) these materials not constituting an offer (or a solicitation of an offer), (2) no representation that these materials are accurate or complete and may not be updated or (3) these materials possibly being confidential, are not applicable to these materials and should be disregarded. Such legends, disclaimers or other notices have been automatically generated as a result of these materials having been sent via Bloomberg or another system.
THE CERTIFICATES REFERRED TO IN THESE MATERIALS ARE SUBJECT TO MODIFICATION OR REVISION (INCLUDING THE POSSIBILITY THAT ONE OR MORE CLASSES OF CERTIFICATES MAY BE SPLIT, COMBINED OR ELIMINATED AT ANY TIME PRIOR TO ISSUANCE OR AVAILABILITY OF A FINAL PROSPECTUS) AND ARE OFFERED ON A “WHEN, AS AND IF ISSUED” BASIS.
THE UNDERWRITERS MAY FROM TIME TO TIME PERFORM INVESTMENT BANKING SERVICES FOR, OR SOLICIT INVESTMENT BANKING BUSINESS FROM, ANY COMPANY NAMED IN THESE MATERIALS. THE UNDERWRITERS AND/OR THEIR AFFILIATES OR RESPECTIVE EMPLOYEES MAY FROM TIME TO TIME HAVE A LONG OR SHORT POSITION IN ANY CERTIFICATE OR CONTRACT DISCUSSED IN THESE MATERIALS.
THE INFORMATION IN THIS STRUCTURAL AND COLLATERAL TERM SHEET IS NOT COMPLETE AND MAY BE AMENDED PRIOR TO THE TIME OF SALE. THIS TERM SHEET IS NOT AN OFFER TO SELL THESE SECURITIES AND IT IS NOT A SOLICITATION OF AN OFFER TO BUY THESE SECURITIES IN ANY JURISDICTION WHERE THE OFFER OR SALE IS NOT PERMITTED.
| | 2 | |
| Structural and Collateral Term Sheet | BBCMS 2018-C2 | |
| Indicative Capital Structure | ||
Publicly Offered Certificates
| Class | Expected Ratings (S&P / Fitch / DBRS) | Approximate Initial Certificate Balance or Notional Amount(1) | Approximate Initial Available Certificate Balance or Notional Amount(1) | Approximate Initial Retained Certificate Balance or Notional Amount(1)(2) | Approximate Initial Credit Support(3) | Expected Weighted Avg. Life (years)(4) | Expected Principal Window(4) | Certificate Principal to Value Ratio(5) | Underwritten NOI Debt Yield(6) |
| A-1 | AAA(sf) / AAAsf / AAA(sf) | $12,775,374 | $12,286,000 | $489,374 | 30.000% | 2.70 | 1/19 – 5/23 | 41.1% | 16.6% |
| A-2 | AAA(sf) / AAAsf / AAA(sf) | $10,398,254 | $10,000,000 | $398,254 | 30.000% | 4.40 | 5/23 – 5/23 | 41.1% | 16.6% |
| A-3 | AAA(sf) / AAAsf / AAA(sf) | $30,154,934 | $29,000,000 | $1,154,934 | 30.000% | 6.90 | 11/25 – 11/25 | 41.1% | 16.6% |
| A-4 | AAA(sf) / AAAsf / AAA(sf) | (7) | (7) | (7) | 30.000% | (7) | (7) | 41.1% | 16.6% |
| A-5 | AAA(sf) / AAAsf / AAA(sf) | (7) | (7) | (7) | 30.000% | (7) | (7) | 41.1% | 16.6% |
| A-SB | AAA(sf) / AAAsf / AAA(sf) | $34,314,800 | $33,000,000 | $1,314,800 | 30.000% | 7.07 | 5/23 – 4/28 | 41.1% | 16.6% |
| X-A(8) | AAA(sf) / AAAsf / AAA(sf) | $624,297,488 | $600,386,000 | $23,911,488 | N/A | N/A | N/A | N/A | N/A |
| X-B(9) | NR / A-sf / AA(sf) | $163,878,090 | $157,601,000 | $6,277,090 | N/A | N/A | N/A | N/A | N/A |
| A-S | AA(sf) / AAAsf / AAA(sf) | $84,726,087 | $81,481,000 | $3,245,087 | 20.500% | 9.99 | 12/28 – 12/28 | 46.7% | 14.6% |
| B | NR / AA-sf / AA(high)(sf) | $40,133,410 | $38,596,000 | $1,537,410 | 16.000% | 9.99 | 12/28 – 12/28 | 49.3% | 13.8% |
| C | NR / A-sf / AA(low)(sf) | $39,018,593 | $37,524,000 | $1,494,593 | 11.625% | 9.99 | 12/28 – 12/28 | 51.9% | 13.1% |
Privately Offered Certificates(10)
| Class | Expected Ratings (S&P / Fitch / DBRS) | Approximate Initial Certificate Balance or Notional Amount(1) | Approximate Initial Available Certificate Balance or Notional Amount(1) | Approximate Initial Retained Certificate Balance or Notional Amount(1)(2) | Approximate Initial Credit Support | Expected Weighted Avg. Life (years)(4) | Expected Principal Window(4) | Certificate Principal to Value Ratio(5) | Underwritten NOI Debt Yield(6) | |||
| X-D(11) | NR / BBB-sf / BBB(high)(sf) | $43,477,861 | $41,812,000 | $1,665,861 | N/A | N/A | N/A | N/A | N/A | |||
| X-F(12) | NR / BB-sf / BBB(low)(sf) | $20,066,705 | $19,298,000 | $768,705 | N/A | N/A | N/A | N/A | N/A | |||
| X-G(13) | NR / B-sf / BB(low)(sf) | $8,918,535 | $8,576,000 | $342,535 | N/A | N/A | N/A | N/A | N/A | |||
| D | NR / BBBsf / A(sf) | $24,525,973 | $23,586,000 | $939,973 | 8.875% | 9.99 | 12/28 – 12/28 | 53.5% | 12.7% | |||
| E | NR / BBB-sf / BBB(sf) | $18,951,888 | $18,226,000 | $725,888 | 6.750% | 9.99 | 12/28 – 12/28 | 54.7% | 12.4% | |||
| F | NR / BB-sf / BB(high)(sf) | $20,066,705 | $19,298,000 | $768,705 | 4.500% | 9.99 | 12/28 – 12/28 | 56.1% | 12.1% | |||
| G | NR / B-sf / B(high)(sf) | $8,918,535 | $8,576,000 | $342,535 | 3.500% | 9.99 | 12/28 – 12/28 | 56.6% | 12.0% | |||
| H-RR | NR / NR / B(low)(sf) | $7,803,719 | $7,504,000 | $299,719 | 2.625% | 9.99 | 12/28 – 12/28 | 57.2% | 11.9% | |||
| J-RR | NR / NR / NR | $23,411,156 | $22,514,000 | $897,156 | 0.000% | 9.99 | 12/28 – 12/28 | 58.7% | 11.6% | |||
| (1) | In the case of each such Class, subject to a permitted variance of plus or minus 5%, including in connection with any variation in the certificate balances and notional amounts of the classes comprising the VRR Interest following the calculation of the actual fair value of the ABS interests (as such term is defined in Regulation RR) issued by the issuing entity. |
| (2) | On the Closing Date, SMC will cause a majority-owned affiliate to purchase from the underwriters the certificates (other than the Class S and Class R certificates) with the initial certificate balances or notional amounts, as applicable, as set forth in the table above under “Approximate Initial Retained Certificate Balance or Notional Amount” as well as an approximately 3.83% interest in the Class S certificates, as further described in “Credit Risk Retention” in the Preliminary Prospectus. |
| (3) | The credit support percentages set forth for Class A-1, Class A-2, Class A-3, Class A-4, Class A-5 and Class A-SB Certificates represent the approximate initial credit support for the Class A-1, Class A-2, Class A-3, Class A-4, Class A-5 and Class A-SB Certificates in the aggregate. |
| (4) | Assumes 0% CPR / 0% CDR and a December 20, 2018 closing date. Based on modeling assumptions as described in the Preliminary Prospectus dated November 27, 2018 (the “Preliminary Prospectus”). |
| (5) | The “Certificate Principal to Value Ratio” for any Class of Principal Balance Certificates (other than the Class A-1, Class A-2, Class A-3, Class A-4, Class A-5 and Class A-SB Certificates) is calculated as the product of (a) the weighted average Cut-off Date LTV Ratio for the mortgage loans, multiplied by (b) a fraction, the numerator of which is the total initial Certificate Balance of such Class of Certificates and all Classes of Principal Balance Certificates senior to such Class of Certificates and the denominator of which is the total initial Certificate Balance of all of the Principal Balance Certificates. The Class A-1, Class A-2, Class A-3, Class A-4, Class A-5 and Class A-SB Certificate Principal to Value Ratios are calculated in the aggregate for those Classes as if they were a single Class. Investors should note, however, that excess mortgaged property value associated with a mortgage loan will not be available to offset losses on any other mortgage loan. |
| (6) | The “Underwritten NOI Debt Yield” for any Class of Principal Balance Certificates (other than the Class A-1, Class A-2, Class A-3, Class A-4, Class A-5 and Class A-SB Certificates) is calculated as the product of (a) the weighted average UW NOI Debt Yield for the mortgage loans and (b) the total initial Certificate Balance of all of the Classes of Principal Balance Certificates divided by the total initial Certificate Balance for such Class and all Classes of Principal Balance Certificates senior to such Class of Certificates. The Underwritten NOI Debt Yield for each of the Class A-1, Class A-2, Class A-3, Class A-4, Class A-5 and Class A-SB Certificates is calculated in the aggregate for those Classes as if they were a single Class. Investors should note, however, that net operating income from any mortgaged property supports only the related mortgage loan and will not be available to support any other mortgage loan. |
THE INFORMATION IN THIS STRUCTURAL AND COLLATERAL TERM SHEET IS NOT COMPLETE AND MAY BE AMENDED PRIOR TO THE TIME OF SALE. THIS TERM SHEET IS NOT AN OFFER TO SELL THESE SECURITIES AND IT IS NOT A SOLICITATION OF AN OFFER TO BUY THESE SECURITIES IN ANY JURISDICTION WHERE THE OFFER OR SALE IS NOT PERMITTED.
| | 3 | |
| Structural and Collateral Term Sheet | BBCMS 2018-C2 | |
| Indicative Capital Structure | ||
| (7) | The exact initial certificate balances of the Class A-4 and Class A-5 certificates are unknown and will be determined based on the final pricing of those classes of certificates. However, the respective initial certificate balances, weighted average lives and expected principal windows of the Class A-4 and Class A-5 certificates are expected to be within the applicable ranges reflected in the following chart. The aggregate initial available certificate balance of the Class A-4 and Class A-5 certificates is expected to be approximately $516,100,000, subject to a variance of plus or minus 5%. |
| Class of Certificates | Expected Range of Initial Certificate Balance | Expected Range of Initial Available Certificate Balance | Expected Range of Initial Retained Certificate Balance | Expected Range of Weighted Avg. Life (Yrs) | Expected Principal | |||||
| Class A-4 | $103,982,531 – $249,558,075 | $100,000,000 – $240,000,000 | $3,982,531 – $9,558,075 | 9.59 – 9.71 | 4/28 – 8/28 / 4/28 – 10/28 | |||||
| Class A-5 | $287,096,051 – $432,671,595 | $276,100,000 – $416,100,000 | $10,996,051 – $16,571,595 | 9.87 – 9.84 | 10/28 – 12/28 / 8/28 – 12/28 |
| (8) | The Notional Amount of the Class X-A Certificates will be equal to the aggregate Certificate Balance of the Class A-1, Class A-2, Class A-3, Class A-4, Class A-5 and Class A-SB Certificates outstanding from time to time. |
| (9) | The Notional Amount of the Class X-B Certificates will be equal to the aggregate Certificate Balance of the Class A-S, Class B and Class C Certificates outstanding from time to time. |
| (10) | The Class X-D, Class X-F, Class X-G, Class D, Class E, Class F, Class G, Class H-RR and Class J-RR Certificates are not being offered by the Preliminary Prospectus and this Term Sheet. The Class S and Class R Certificates are not shown above. |
| (11) | The Notional Amount of the Class X-D Certificates will be equal to the aggregate Certificate Balance of the Class D and Class E Certificates outstanding from time to time. |
| (12) | The Notional Amount of the Class X-F Certificates will be equal to the Certificate Balance of the Class F Certificates outstanding from time to time. |
| (13) | The Notional Amount of the Class X-G Certificates will be equal to the Certificate Balance of the Class G Certificates outstanding from time to time. |
THE INFORMATION IN THIS STRUCTURAL AND COLLATERAL TERM SHEET IS NOT COMPLETE AND MAY BE AMENDED PRIOR TO THE TIME OF SALE. THIS TERM SHEET IS NOT AN OFFER TO SELL THESE SECURITIES AND IT IS NOT A SOLICITATION OF AN OFFER TO BUY THESE SECURITIES IN ANY JURISDICTION WHERE THE OFFER OR SALE IS NOT PERMITTED.
| | 4 | |
| Structural and Collateral Term Sheet | BBCMS 2018-C2 | |
| Summary of Transaction Terms | ||
| Securities Offered: | $788,175,578 monthly pay, multi-class, commercial mortgage REMIC Pass-Through Certificates. |
| Co-Lead Managers and Joint Bookrunners: | Barclays Capital Inc. and Cantor Fitzgerald & Co.. |
| Co-Managers: | KeyBanc Capital Markets Inc. and Drexel Hamilton, LLC |
| Mortgage Loan Sellers: | Starwood Mortgage Capital LLC (“SMC”) (34.0%), Barclays Bank PLC (“Barclays”) (33.6%), Cantor Commercial Real Estate Lending, L.P. (“CCRE”) (16.9%), and KeyBank National Association (“KeyBank”) (15.4%). |
| Master Servicer: | Wells Fargo Bank, National Association. |
| Special Servicer: | LNR Partners, LLC (“LNR”). |
| Directing Certificateholder: | LNR Securities Holdings, LLC (or its affiliate). |
| Trustee: | Wilmington Trust, National Association. |
| Certificate Administrator: | Wells Fargo Bank, National Association. |
| Operating Advisor: | Park Bridge Lender Services LLC. |
| Asset Representations Reviewer: | Park Bridge Lender Services LLC. |
| Rating Agencies: | S&P Global Ratings, acting through Standard & Poor’s Financial Services LLC (“S&P”), Fitch Ratings, Inc. (“Fitch”) and DBRS, Inc. (“DBRS”). |
| U.S. Credit Risk Retention: | SMC, an indirect wholly-owned subsidiary of Starwood Property Trust, Inc., is expected to act as the “retaining sponsor” for this securitization and intends to satisfy the U.S. credit risk retention requirements (i) through the purchase by Starwood Conduit CMBS Vertical Retention I LLC, a “majority-owned affiliate,” of an “eligible vertical interest” (each as defined in Regulation RR), which will consist of approximately 3.83% of the certificate balance, notional amount or percentage interest of each class of certificates (other than the Class R Certificates) (the “VRR Interest”) issued by the issuing entity and (ii) through the purchase by Starwood Conduit CMBS Horizontal BBCMS 2018-C2 LLC, a “majority-owned affiliate,” of an “eligible horizontal residual interest” (each as defined in Regulation RR), which will consist of the portion of the Class H-RR and Class J-RR Certificates not included in the VRR Interest.
SMC, in its capacity as the “retaining sponsor” for this transaction, will be required to comply with the hedging, transfer and financing restrictions applicable to a “retaining sponsor” under the credit risk retention rules, which generally prohibit the transfer of the applicable certificates except to a “majority-owned affiliate” of the “retaining sponsor”. The restrictions on hedging and transfer under the credit risk retention rules as in effect on the closing date of this transaction will expire on and after the date that is the latest of (i) the date on which the aggregate principal balance of the mortgage loans has been reduced to 33% of the aggregate principal balance of the mortgage loans as of the Cut-off Date; (ii) the date on which the total unpaid principal obligations under the certificates has been reduced to 33% of the aggregate total unpaid principal obligations under the certificates as of the Closing Date; or (iii) two years after the Closing Date.
For additional information, see “Credit Risk Retention” in the Preliminary Prospectus.
|
| EU Credit Risk Retention: | The transaction is not structured to satisfy the EU risk retention and due diligence requirements. |
| Closing Date: | On or about December 20, 2018. |
| Cut-off Date: | With respect to each mortgage loan, the related due date in December 2018, or with respect to any mortgage loan that has its first due date in January 2019, the date that would otherwise have been the related due date in December 2018. |
| Distribution Date: | The 4th business day after the Determination Date in each month, commencing in January 2019. |
| Determination Date: | 11thday of each month, or if the 11th day is not a business day, the next succeeding business day, commencing in January 2019. |
| Assumed Final Distribution Date: | The Distribution Date in December 2028 which is the latest anticipated repayment date of the Certificates. |
| Rated Final Distribution Date: | The Distribution Date in December 2051. |
| Tax Treatment: | The Publicly Offered Certificates are expected to be treated as REMIC “regular interests” for U.S. federal income tax purposes. |
| Form of Offering: | The Class A-1, Class A-2, Class A-3, Class A-4, Class A-5, Class A-SB, Class X-A, Class X-B, Class A-S, Class B and Class C Certificates (the “Publicly Offered Certificates”) will be offered publicly. The Class X-D, Class X-F, Class X-G, Class D, Class E, Class F, Class G, Class H-RR, Class J-RR, Class S and Class R Certificates (the “Privately Offered Certificates”) will be offered domestically to Qualified Institutional Buyers and to Institutional Accredited Investors and to institutions that are not U.S. Persons pursuant to Regulation S. |
| SMMEA Status: | The Certificates will not constitute “mortgage related securities” for purposes of SMMEA. |
| ERISA: | The Publicly Offered Certificates are expected to be ERISA eligible. |
THE INFORMATION IN THIS STRUCTURAL AND COLLATERAL TERM SHEET IS NOT COMPLETE AND MAY BE AMENDED PRIOR TO THE TIME OF SALE. THIS TERM SHEET IS NOT AN OFFER TO SELL THESE SECURITIES AND IT IS NOT A SOLICITATION OF AN OFFER TO BUY THESE SECURITIES IN ANY JURISDICTION WHERE THE OFFER OR SALE IS NOT PERMITTED.
| | 5 | |
| Structural and Collateral Term Sheet | BBCMS 2018-C2 | |
| Summary of Transaction Terms | ||
| Optional Termination: | On any Distribution Date on which the aggregate principal balance of the pool of mortgage loans is less than 1% of the aggregate principal balance of the mortgage loans as of the cut-off date, certain entities specified in the Preliminary Prospectus will have the option to purchase all of the remaining mortgage loans (and all property acquired through exercise of remedies in respect of any mortgage loan) at the price specified in the Preliminary Prospectus. Refer to “Pooling and Servicing Agreement—Termination; Retirement of Certificates” in the Preliminary Prospectus. |
| Minimum Denominations: | The Publicly Offered Certificates (other than the Class X-A and Class X-B Certificates) will be issued in minimum denominations of $10,000 and integral multiples of $1 in excess of $10,000. The Class X-A and Class X-B Certificates will be issued in minimum denominations of $1,000,000 and in integral multiples of $1 in excess of $1,000,000. |
| Settlement Terms: | DTC, Euroclear and Clearstream Banking. |
| Analytics: | The transaction is expected to be modeled by Intex Solutions, Inc. and Trepp, LLC and is expected to be available on Bloomberg L.P., BlackRock Financial Management, Inc., Interactive Data Corporation, CMBS.com, Inc., Markit Group Limited, Moody’s Analytics, MBS Data, LLC and Thomson Reuters Corporation. |
| Risk Factors: | THE CERTIFICATES INVOLVE CERTAIN RISKS AND MAY NOT BE SUITABLE FOR ALL INVESTORS. REFER TO THE “RISK FACTORS” SECTION OF THE PRELIMINARY PROSPECTUS. |
THE INFORMATION IN THIS STRUCTURAL AND COLLATERAL TERM SHEET IS NOT COMPLETE AND MAY BE AMENDED PRIOR TO THE TIME OF SALE. THIS TERM SHEET IS NOT AN OFFER TO SELL THESE SECURITIES AND IT IS NOT A SOLICITATION OF AN OFFER TO BUY THESE SECURITIES IN ANY JURISDICTION WHERE THE OFFER OR SALE IS NOT PERMITTED.
| | 6 | |
| Structural and Collateral Term Sheet | BBCMS 2018-C2 | |
| Collateral Characteristics | ||
Mortgage Loan Seller | Number of Mortgage Loans | Number of Mortgaged Properties | Aggregate | % of IPB |
| SMC | 16 | 46 | $303,274,768 | 34.0% |
| Barclays | 16 | 19 | 274,947,456 | 30.8 |
| KeyBank | 5 | 11 | 137,656,330 | 15.4 |
| CCRE | 6 | 9 | 125,975,000 | 14.1 |
| Barclays/CCRE(1) | 1 | 2 | 50,000,000 | 5.6 |
| Total: | 44 | 87 | $891,853,554 | 100.0% |
| (1) | In the case of Loan No. 4, Barclays is acting as loan seller with respect to Note A-4 with a principal balance of $25,000,000, and CCRE is acting as loan seller with respect to Note A-6 with a principal balance of $25,000,000. |
| Loan Pool | ||
| Initial Pool Balance (“IPB”): | $891,853,554 | |
| Number of Mortgage Loans: | 44 | |
| Number of Mortgaged Properties: | 87 | |
| Average Cut-off Date Balance per Mortgage Loan: | $20,269,399 | |
| Weighted Average Current Mortgage Rate: | 4.99123% | |
| 10 Largest Mortgage Loans as % of IPB: | 48.8% | |
| Weighted Average Remaining Term to Maturity(1): | 116 months | |
| Weighted Average Seasoning: | 1 month | |
| Credit Statistics | ||
| Weighted Average UW NCF DSCR(2)(3): | 1.95x | |
| Weighted Average UW NOI Debt Yield(2): | 11.6% | |
| Weighted Average Cut-off Date Loan-to-Value Ratio (“LTV”)(2)(4): | 58.7% | |
| Weighted Average Maturity Date/ARD LTV(1)(2)(4): | 55.0% | |
| Other Statistics | ||
| % of Mortgage Loans with Additional Debt: | 12.6% | |
| % of Mortgaged Properties with Single Tenants: | 16.2% | |
| Amortization | ||
| Weighted Average Original Amortization Term(5): | 359 months | |
| Weighted Average Remaining Amortization Term(5): | 359 months | |
| % of Mortgage Loans with Interest-Only: | 47.6% | |
| % of Mortgage Loans with Partial Interest-Only followed by Amortizing Balloon: | 36.2% | |
| % of Mortgage Loans with Amortizing Balloon: | 12.8% | |
| % of Mortgage Loans with Interest-Only followed by ARD-Structure: | 3.4% | |
| Lockboxes(6) | ||
| % of Mortgage Loans with Hard Lockboxes: | 52.3% | |
| % of Mortgage Loans with Springing Lockboxes: | 36.3% | |
| % of Mortgage Loans with Soft Lockboxes: | 7.9% | |
| % of Mortgage Loans with No Lockbox: | 3.6% | |
| Reserves | ||
| % of Mortgage Loans Requiring Monthly Tax Reserves: | 73.6% | |
| % of Mortgage Loans Requiring Monthly Insurance Reserves: | 48.1% | |
| % of Mortgage Loans Requiring Monthly CapEx Reserves(7): | 71.4% | |
| % of Mortgage Loans Requiring Monthly TI/LC Reserves(8): | 34.8% | |
| (1) | In the case of Loan No. 10 with an anticipated repayment date, as of the related anticipated repayment date. |
| (2) | In the case of Loan Nos. 2, 3, 4, 5, 10, 11, 12, 13, 14, 16, 19, 23, 24 and 30, the UW NCF DSCR, UW NOI Debt Yield, Cut-off Date LTV and Maturity Date/ARD LTV calculations include the related Pari Passu Companion Loan(s). In the case of Loan Nos. 2 and 30, the UW NCF DSCR, UW NOI Debt Yield, Cut-off Date LTV and Maturity Date/ARD LTV calculations exclude the related Subordinate Companion Loans. |
| (3) | In the case of Loan No. 30, the UW NCF DSCR is calculated using the sum of principal and interest payments over the first 12 months following the Cut-off Date based on the assumed principal payment schedule provided on Annex F to the Preliminary Prospectus. |
| (4) | In the case of Loan Nos. 3, 11.02, 12, 16 and 41, the Cut-off Date LTV and the Maturity Date/ARD LTV are calculated by using an appraised value based on certain hypothetical or as stabilized assumptions. Refer to “Description of the Mortgage Pool—Assessments of Property Value and Condition” and “—Appraised Value” in the Preliminary Prospectus for additional details. |
| (5) | Excludes 17 mortgage loans that are interest-only for the entire term or until the anticipated repayment date, as applicable. |
| (6) | For a more detailed description of Lockboxes, refer to “Description of the Mortgage Pool—Certain Terms of the Mortgage Loans—Mortgaged Property Accounts” in the Preliminary Prospectus. |
| (7) | CapEx Reserves include FF&E reserves for hotel properties. |
| (8) | Calculated only with respect to the Cut-off Date Balance of mortgage loans secured or partially secured by office, retail, mixed use and industrial properties. |
THE INFORMATION IN THIS STRUCTURAL AND COLLATERAL TERM SHEET IS NOT COMPLETE AND MAY BE AMENDED PRIOR TO THE TIME OF SALE. THIS TERM SHEET IS NOT AN OFFER TO SELL THESE SECURITIES AND IT IS NOT A SOLICITATION OF AN OFFER TO BUY THESE SECURITIES IN ANY JURISDICTION WHERE THE OFFER OR SALE IS NOT PERMITTED.
| | 7 | |
| Structural and Collateral Term Sheet | BBCMS 2018-C2 | |
| Collateral Characteristics | ||
| Ten Largest Mortgage Loans | |||||||||||||
| No. | Loan Name | City, State | Mortgage Loan Seller | No. of Prop. | Cut-off Date Balance | % of IPB | Square Feet / Rooms | Property Type | UW NCF DSCR(1) | UW NOI Debt Yield(1) | Cut-off Date LTV(1)(2) | Maturity Date/ARD LTV(1)(2)(3) | |
| 1 | Dream Inn | Santa Cruz, CA | KeyBank | 1 | $55,000,000 | 6.2% | 165 | Hotel | 2.38x | 13.3% | 55.0% | 55.0% | |
| 2 | Christiana Mall | Newark, DE | Barclays | 1 | $54,840,000 | 6.1% | 779,084 | Retail | 3.15x | 13.8% | 32.5% | 32.5% | |
| 3 | GNL Portfolio | Various, Various | KeyBank | 7 | $54,175,000 | 6.1% | 647,713 | Various | 2.08x | 11.0% | 57.2% | 57.2% | |
| 4 | Liberty Portfolio | Various, AZ | Barclays/CCRE | 2 | $50,000,000 | 5.6% | 805,746 | Office | 1.77x | 9.1% | 64.6% | 64.6% | |
| 5 | Fidelis Portfolio | Various, TX | SMC | 3 | $49,188,389 | 5.5% | 885,707 | Retail | 1.74x | 11.9% | 63.7% | 52.5% | |
| 6 | Troy Place | Troy, MI | SMC | 1 | $40,000,000 | 4.5% | 756,845 | Office | 2.47x | 15.2% | 53.0% | 53.0% | |
| 7 | West Covina Village | West Covina, CA | SMC | 1 | $36,000,000 | 4.0% | 220,000 | Mixed Use | 1.37x | 10.0% | 58.4% | 53.3% | |
| 8 | AVR Embassy Suites Fort Worth | Fort Worth, TX | CCRE | 1 | $35,200,000 | 3.9% | 156 | Hotel | 1.70x | 12.9% | 64.6% | 60.1% | |
| 9 | Residence Inn by Marriott Phoenix Desert View at Mayo Clinic | Phoenix, AZ | SMC | 1 | $31,000,000 | 3.5% | 208 | Hotel | 1.56x | 12.3% | 59.5% | 52.2% | |
| 10 | Home Depot Technology Center | Marietta, GA | Barclays | 1 | $30,000,000 | 3.4% | 347,498 | Office | 1.77x | 9.3% | 66.5% | 66.5% | |
| Top 3 Total/Weighted Average | 9 | $164,015,000 | 18.4% | 2.54x | 12.7% | 48.2% | 48.2% | ||||||
| Top 5 Total/Weighted Average | 14 | $263,203,389 | 29.5% | 2.24x | 11.9% | 54.2% | 52.1% | ||||||
| Top 10 Total/Weighted Average | 19 | $435,403,389 | 48.8% | 2.07x | 12.0% | 56.5% | 53.9% | ||||||
| Non-Top 10 Total/Weighted Average | 68 | $456,450,165 | 51.2% | 1.84x | 11.3% | 60.7% | 55.9% | ||||||
| (1) | In the case of Loan Nos. 2, 3, 4, 5 and 10, the UW NCF DSCR, UW NOI Debt Yield, Cut-off Date LTV and Maturity Date/ARD LTV calculations include the related Pari Passu Companion Loan(s). In the case of Loan No. 2, the UW NCF DSCR, UW NOI Debt Yield, Cut-off Date LTV and Maturity Date/ARD LTV calculations exclude the related Subordinate Companion Loans. |
| (2) | In the case of Loan No. 3, the Cut-off Date LTV and the Maturity Date/ARD LTV are calculated by using an appraised value based on certain hypothetical assumptions. Refer to “Description of the Mortgage Pool—Assessments of Property Value and Condition” and “—Appraised Value” in the Preliminary Prospectus for additional details. |
| (3) | In the case of Loan No.10 with an anticipated repayment date, Maturity Date/ARD LTV is calculated as of the related anticipated repayment date. |
THE INFORMATION IN THIS STRUCTURAL AND COLLATERAL TERM SHEET IS NOT COMPLETE AND MAY BE AMENDED PRIOR TO THE TIME OF SALE. THIS TERM SHEET IS NOT AN OFFER TO SELL THESE SECURITIES AND IT IS NOT A SOLICITATION OF AN OFFER TO BUY THESE SECURITIES IN ANY JURISDICTION WHERE THE OFFER OR SALE IS NOT PERMITTED.
| | 8 | |
| Structural and Collateral Term Sheet | BBCMS 2018-C2 | |
| Collateral Characteristics | ||
| Pari Passu Companion Loan Summary | |||||||||
No. | Loan Name | Mortgage Loan Seller | Trust Cut-off Date Balance | Pari Passu Loan(s) Cut-off Date Balance | Total Mortgage Loan Cut-off Date Balance(1) | Controlling Pooling/Trust & Servicing Agreement | Master Servicer | Special Servicer | Control Rights |
| 2 | Christiana Mall | Barclays | $54,840,000 | $283,160,000 | $338,000,000 | BBCMS 2018-CHRS | Wells Fargo | Wells Fargo | BBCMS 2018-CHRS |
| 3 | GNL Portfolio | KeyBank | $54,175,000 | $44,325,000 | $98,500,000 | BBCMS 2018-C2 | Wells Fargo | LNR | BBCMS 2018-C2 |
| 4 | Liberty Portfolio | Barclays/CCRE | $50,000,000 | $115,700,000 | $165,700,000 | BMARK 2018-B7 | KeyBank | LNR | BMARK 2018-B7 |
| 5 | Fidelis Portfolio | SMC | $49,188,389 | $44,898,124 | $94,086,513 | BBCMS 2018-C2 | Wells Fargo | LNR | BBCMS 2018-C2 |
| 10 | Home Depot Technology Center | Barclays | $30,000,000 | $14,300,000 | $44,300,000 | BBCMS 2018-C2 | Wells Fargo | LNR | BBCMS 2018-C2 |
| 11 | Virginia Beach Hotel Portfolio | Barclays | $30,000,000 | $60,000,000 | $90,000,000 | WFCM 2018-C47 | Wells Fargo | Midland | WFCM 2018-C47 |
| 12 | Moffett Towers - Buildings E,F,G | CCRE | $25,000,000 | $259,000,000 | $284,000,000 | DBGS 2018-C1 | Wells Fargo | Rialto | DBGS 2018-C1 |
| 13 | Shelbourne Global Portfolio II | CCRE | $25,000,000 | $30,000,000 | $55,000,000 | BBCMS 2018-C2 | Wells Fargo | LNR | BBCMS 2018-C2 |
| 14 | Zenith Ridge | SMC | $25,000,000 | $65,000,000 | $90,000,000 | CD 2018-CD7 | KeyBank | Rialto | CD 2018-CD7 |
| 16 | Moffett Towers II - Building 1 | Barclays | $22,000,000 | $146,000,000 | $168,000,000 | BMARK 2018-B6 | KeyBank | Midland | BMARK 2018-B6 |
| 19 | The Shops at Solaris | CCRE | $20,000,000 | $50,000,000 | $70,000,000 | BMARK 2018-B7 | KeyBank | LNR | BMARK 2018-B7 |
| 23 | One River Place | Barclays | $15,000,000 | $10,000,000 | $25,000,000 | BBCMS 2018-C2 | Wells Fargo | LNR | BBCMS 2018-C2 |
| 24 | Alex Park South | KeyBank | $14,900,000 | $28,000,000 | $42,900,000 | MSC 2018-L1 | Midland | Midland | MSC 2018-L1 |
| 30 | Fair Oaks Mall | Barclays | $10,918,207 | $162,780,537 | $173,698,743 | BANK 2018-BNK12 | Wells Fargo | Midland | BANK 2018-BNK12(2) |
| (1) | In the case of Loan Nos. 2 and 30, the Total Mortgage Loan Cut-off Date Balance excludes the related Subordinate Companion Loans. |
| (2) | Currently exercised by Annaly CRE LLC, as holder of the Subordinate Companion Loans until the occurrence and during the a Fair Oaks Mall B Note Control Appraisal Period, as described under “Description of the Mortgage Pool—The Whole Loans—The Non-Serviced AB Whole Loans—The Fair Oaks Mall Whole Loan—Consultation and Control”in the Preliminary Prospectus. |
THE INFORMATION IN THIS STRUCTURAL AND COLLATERAL TERM SHEET IS NOT COMPLETE AND MAY BE AMENDED PRIOR TO THE TIME OF SALE. THIS TERM SHEET IS NOT AN OFFER TO SELL THESE SECURITIES AND IT IS NOT A SOLICITATION OF AN OFFER TO BUY THESE SECURITIES IN ANY JURISDICTION WHERE THE OFFER OR SALE IS NOT PERMITTED.
| | 9 | |
| Structural and Collateral Term Sheet | BBCMS 2018-C2 | |
| Collateral Characteristics | ||
| Additional Debt Summary |
No. | Loan Name | Trust | Pari Passu Loan(s) Cut-off Date Balance | Subordinate Debt Cut-off Date Balance(1) | Total Debt Cut-off Date Balance | Mortgage Loan UW NCF DSCR(2) | Total Debt UW NCF DSCR | Mortgage Loan | Total Debt Cut-off Date LTV(3) | Mortgage Loan UW NOI Debt Yield(2) | Total Debt UW NOI Debt Yield |
| 2 | Christiana Mall | $54,840,000 | $283,160,000 | $212,000,000 | $550,000,000 | 3.15x | 1.93x | 32.5% | 52.9% | 13.8% | 8.5% |
| 12 | Moffett Towers - Buildings E,F,G | $25,000,000 | $259,000,000 | $216,000,000 | $500,000,000 | 2.97x | 1.41x | 40.2% | 70.8% | 12.6% | 7.2% |
| 16 | Moffett Towers II - Building 1 | $22,000,000 | $146,000,000 | $112,000,000 | $280,000,000 | 2.00x | 1.17x | 46.8% | 78.1% | 11.5% | 6.9% |
| 30 | Fair Oaks Mall | $10,918,207 | $162,780,537 | $84,367,961 | $258,066,704 | 2.89x | 1.64x | 31.8% | 47.3% | 17.2% | 11.6% |
| (1) | In the case of Loan Nos. 2 and 30, subordinate debt represents one or more Subordinate Companion Loans. In the case of Loan Nos. 12 and 16, subordinate debt represents one or more mezzanine loans. |
| (2) | In the case of Loan Nos. 2 and 30, Mortgage Loan UW NCF DSCR, Mortgage Loan Cut-off Date LTV and Mortgage Loan UW NOI Debt Yield calculations include any related Pari Passu Companion Loans, but exclude the related Subordinate Companion Loans. |
| (3) | In the case of Loan Nos. 12 and 16, the Mortgage Loan Cut-off Date LTV and the Total Cut-off Date LTV are calculated by using an appraised value based on certain hypothetical assumptions. Refer to “Description of the Mortgage Pool—Assessments of Property Value and Condition” and “—Appraised Value” in the Preliminary Prospectus for additional details. |
THE INFORMATION IN THIS STRUCTURAL AND COLLATERAL TERM SHEET IS NOT COMPLETE AND MAY BE AMENDED PRIOR TO THE TIME OF SALE. THIS TERM SHEET IS NOT AN OFFER TO SELL THESE SECURITIES AND IT IS NOT A SOLICITATION OF AN OFFER TO BUY THESE SECURITIES IN ANY JURISDICTION WHERE THE OFFER OR SALE IS NOT PERMITTED.
| | 10 | |
| Structural and Collateral Term Sheet | BBCMS 2018-C2 | |
| Collateral Characteristics | ||
| Mortgaged Properties by Type(1) |
Weighted Average | ||||||||
| Property Type | Property Subtype | Number of Properties | Cut-off Date Principal Balance | % of IPB | UW NCF DSCR(2)(3) | UW NOI Debt Yield(2) | Cut-off Date LTV(2)(4) | Maturity Date/ARD LTV(2)(4)(5) |
| Office | Suburban | 16 | $293,453,992 | 32.9% | 1.90x | 11.1% | 60.4% | 58.4% |
| CBD | 2 | 27,482,682 | 3.1 | 2.89x | 12.5% | 41.7% | 41.7% | |
| R&D Lab | 2 | 9,325,975 | 1.0 | 2.08x | 11.0% | 57.2% | 57.2% | |
| Subtotal: | 20 | $330,262,649 | 37.0% | 1.99x | 11.2% | 58.8% | 57.0% | |
| Retail | Anchored | 9 | $123,850,605 | 13.9% | 1.73x | 11.2% | 65.0% | 57.9% |
| Super Regional Mall | 2 | 65,758,207 | 7.4 | 3.11x | 14.4% | 32.4% | 32.0% | |
| Lifestyle Center | 1 | 20,000,000 | 2.2 | 2.46x | 11.1% | 46.7% | 46.7% | |
| Unanchored | 1 | 6,750,000 | 0.8 | 1.76x | 9.9% | 56.3% | 56.3% | |
| Freestanding | 1 | 5,016,614 | 0.6 | 1.65x | 9.5% | 59.0% | 59.0% | |
| Subtotal: | 14 | $221,375,426 | 24.8% | 2.21x | 12.1% | 53.2% | 49.2% | |
| Hotel | Full Service | 4 | $120,200,000 | 13.5% | 2.05x | 13.1% | 61.3% | 57.6% |
| Extended Stay | 1 | 31,000,000 | 3.5 | 1.56x | 12.3% | 59.5% | 52.2% | |
| Limited Service | 3 | 19,478,007 | 2.2 | 2.04x | 15.3% | 59.8% | 48.9% | |
| Subtotal: | 8 | $170,678,007 | 19.1% | 1.96x | 13.2% | 60.8% | 55.7% | |
| Mixed Use | Retail/Office | 2 | $57,025,000 | 6.4% | 1.37x | 9.7% | 62.2% | 57.2% |
| Office/Industrial | 1 | 16,454,545 | 1.8 | 1.89x | 11.4% | 58.7% | 58.7% | |
| Subtotal: | 3 | $73,479,545 | 8.2% | 1.49x | 10.1% | 61.4% | 57.5% | |
| Multifamily | Garden | 26 | $37,462,498 | 4.2% | 1.64x | 10.0% | 60.9% | 57.7% |
| Mid-Rise | 2 | 2,217,502 | 0.2 | 2.00x | 10.7% | 59.9% | 59.9% | |
| Subtotal: | 28 | $39,680,000 | 4.4% | 1.66x | 10.1% | 60.8% | 57.9% | |
| Industrial | Warehouse | 4 | $20,730,540 | 2.3% | 1.50x | 10.9% | 70.5% | 61.1% |
| Flex | 5 | 16,397,846 | 1.8 | 1.45x | 10.6% | 69.8% | 58.0% | |
| Warehouse/Distribution | 1 | 1,949,543 | 0.2 | 2.08x | 11.0% | 57.2% | 57.2% | |
| Subtotal: | 10 | $39,077,928 | 4.4% | 1.51x | 10.8% | 69.5% | 59.6% | |
| Self Storage | Self Storage | 4 | $17,300,000 | 1.9% | 1.42x | 9.7% | 64.0% | 56.0% |
| Total / Weighted Average: | 87 | $891,853,554 | 100.0% | 1.95x | 11.6% | 58.7% | 55.0% | |
| (1) | Because this table presents information relating to the mortgaged properties and not mortgage loans, the information for mortgage loans secured by more than one mortgaged property is based on allocated loan amounts. |
| (2) | In the case of Loan Nos. 2, 3, 4, 5, 10, 11, 12, 13, 14, 16, 19, 23, 24 and 30, the UW NCF DSCR, UW NOI Debt Yield, Cut-off Date LTV and Maturity Date/ARD LTV calculations include the related Pari Passu Companion Loan(s). In the case of Loan Nos. 2 and 30 the UW NCF DSCR, UW NOI Debt Yield, Cut-off Date LTV and Maturity Date/ARD LTV calculations exclude the related Subordinate Companion Loans. |
| (3) | In the case of Loan No. 30, the UW NCF DSCR is calculated using the sum of principal and interest payments over the first 12 months following the Cut-off Date based on the assumed principal payment schedule provided on Annex F to the Preliminary Prospectus. |
| (4) | In the case of Loan Nos. Nos. 3, 11.02, 12, 16 and 41, the Cut-off Date LTV and the Maturity Date/ARD LTV are calculated by using an appraised value based on certain hypothetical assumptions. Refer to “Description of the Mortgage Pool—Assessments of Property Value and Condition” and “—Appraised Value” in the Preliminary Prospectus for additional details. |
| (5) | In the case of Loan No.10 with an anticipated repayment date, Maturity Date/ARD LTV are calculated as of the related anticipated repayment date. |
THE INFORMATION IN THIS STRUCTURAL AND COLLATERAL TERM SHEET IS NOT COMPLETE AND MAY BE AMENDED PRIOR TO THE TIME OF SALE. THIS TERM SHEET IS NOT AN OFFER TO SELL THESE SECURITIES AND IT IS NOT A SOLICITATION OF AN OFFER TO BUY THESE SECURITIES IN ANY JURISDICTION WHERE THE OFFER OR SALE IS NOT PERMITTED.
| | 11 | |
| Structural and Collateral Term Sheet | BBCMS 2018-C2 | |
| Collateral Characteristics | ||
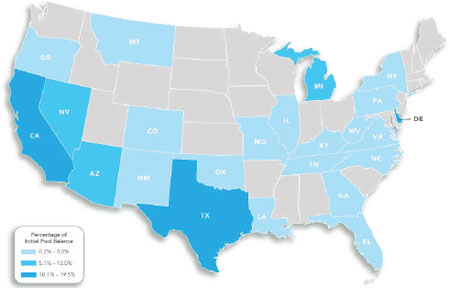
| Mortgaged Properties by Location(1) |
Weighted Average | ||||||||||
State | Number of Properties | Cut-off Date | % of | UW NCF DSCR(2)(3) | UW NOI Debt Yield(2) | Cut-off Date LTV(2)(4) | Maturity Date/ARD LTV(2)(4)(5) | |||
| California | 8 | $174,075,607 | 19.5% | 2.11x | 11.8% | 52.9% | 51.0% | |||
| Texas | 12 | 122,366,276 | 13.7 | 1.75x | 12.0% | 63.2% | 55.7% | |||
| Delaware | 4 | 94,840,000 | 10.6 | 2.72x | 13.1% | 42.3% | 42.3% | |||
| Arizona | 3 | 81,000,000 | 9.1 | 1.69x | 10.3% | 62.6% | 59.9% | |||
| Nevada | 4 | 66,935,000 | 7.5 | 1.43x | 9.8% | 69.5% | 63.4% | |||
| Michigan | 4 | 54,025,000 | 6.1 | 2.16x | 13.7% | 56.9% | 54.7% | |||
| Virginia | 3 | 40,918,207 | 4.6 | 2.12x | 14.2% | 59.1% | 51.6% | |||
| Illinois | 27 | 40,709,114 | 4.6 | 1.71x | 10.4% | 66.1% | 61.9% | |||
| Georgia | 3 | 39,200,000 | 4.4 | 1.69x | 9.4% | 65.4% | 63.7% | |||
| Pennsylvania | 3 | 33,400,625 | 3.7 | 1.60x | 10.8% | 67.5% | 61.2% | |||
| West Virginia | 1 | 24,700,000 | 2.8 | 2.11x | 11.6% | 60.3% | 60.3% | |||
| Colorado | 1 | 20,000,000 | 2.2 | 2.46x | 11.1% | 46.7% | 46.7% | |||
| Missouri | 2 | 15,765,731 | 1.8 | 1.73x | 11.2% | 66.5% | 60.7% | |||
| Tennessee | 2 | 15,565,137 | 1.7 | 1.85x | 13.4% | 66.9% | 55.2% | |||
| New York | 1 | 14,900,000 | 1.7 | 1.32x | 10.1% | 65.0% | 58.1% | |||
| Oregon | 1 | 13,400,000 | 1.5 | 2.24x | 11.0% | 59.3% | 59.3% | |||
| Louisiana | 2 | 11,000,000 | 1.2 | 1.51x | 9.7% | 55.3% | 53.3% | |||
| North Carolina | 1 | 8,500,000 | 1.0 | 1.72x | 12.8% | 59.4% | 49.5% | |||
| Oklahoma | 1 | 5,584,686 | 0.6 | 1.32x | 9.8% | 68.9% | 57.5% | |||
| Florida | 1 | 5,400,000 | 0.6 | 1.84x | 10.4% | 56.8% | 56.8% | |||
| New Mexico | 1 | 4,308,386 | 0.5 | 1.65x | 9.5% | 59.0% | 59.0% | |||
| Kentucky | 1 | 3,310,244 | 0.4 | 2.08x | 11.0% | 57.2% | 57.2% | |||
| Montana | 1 | 1,949,543 | 0.2 | 2.08x | 11.0% | 57.2% | 57.2% | |||
| Total / Weighted Average: | 87 | $891,853,554 | 100.0% | 1.95x | 11.6% | 58.7% | 55.0% | |||
| (1) | Because this table presents information relating to the mortgaged properties and not mortgage loans, the information for mortgage loans secured by more than one mortgaged property is based on allocated loan amounts. |
| (2) | In the case of Loan Nos. 2, 3, 4, 5, 10, 11, 12, 13, 14, 16, 19, 23, 24 and 30, the UW NCF DSCR, UW NOI Debt Yield, Cut-off Date LTV and Maturity Date/ARD LTV calculations include the related Pari Passu Companion Loan(s). In the case of Loan Nos. 2 and 30 the UW NCF DSCR, UW NOI Debt Yield, Cut-off Date LTV and Maturity Date/ARD LTV calculations exclude the related Subordinate Companion Loans. |
| (3) | In the case of Loan No. 30, the UW NCF DSCR is calculated using the sum of principal and interest payments over the first 12 months following the Cut-off Date based on the assumed principal payment schedule provided on Annex F to the Preliminary Prospectus. |
| (4) | In the case of Loan Nos. Nos. 3, 11.02, 12, 16 and 41, the Cut-off Date LTV and the Maturity Date/ARD LTV are calculated by using an appraised value based on certain hypothetical assumptions. Refer to “Description of the Mortgage Pool—Assessments of Property Value and Condition” and “—Appraised Value” in the Preliminary Prospectus for additional details. |
| (5) | In the case of Loan No.10 with an anticipated repayment date, Maturity Date/ARD LTV are calculated as of the related anticipated repayment date. |
THE INFORMATION IN THIS STRUCTURAL AND COLLATERAL TERM SHEET IS NOT COMPLETE AND MAY BE AMENDED PRIOR TO THE TIME OF SALE. THIS TERM SHEET IS NOT AN OFFER TO SELL THESE SECURITIES AND IT IS NOT A SOLICITATION OF AN OFFER TO BUY THESE SECURITIES IN ANY JURISDICTION WHERE THE OFFER OR SALE IS NOT PERMITTED.
| | 12 | |
| Structural and Collateral Term Sheet | BBCMS 2018-C2 | |
| Collateral Characteristics | ||
| Original Amortization Term in Months |
| Weighted Average | |||||||||
| Original Amortization Term in Months | Number of Loans | Cut-off Date Principal Balance | % of IPB | Mortgage Rate | Remaining Loan Term(1) | UW NCF DSCR(2)(3)(4) | UW NOI DY(2) | Cut-off Date LTV(2)(3) | Maturity Date/ARD LTV(1)(2)(3) |
| Interest Only | 17 | $454,245,000 | 50.9% | 4.83891% | 116 | 2.27x | 11.8% | 53.7% | 53.7% |
| 300 | 1 | 3,994,200 | 0.4 | 5.96900% | 119 | 2.22x | 19.0% | 53.3% | 41.3% |
| 360 | 26 | 433,614,354 | 48.6 | 5.14179% | 117 | 1.61x | 11.3% | 63.9% | 56.4% |
| Total / Weighted Average: | 44 | $891,853,554 | 100.0% | 4.99123% | 116 | 1.95x | 11.6% | 58.7% | 55.0% |
| Remaining Amortization Term in Months |
| Weighted Average | |||||||||||
| Range of Remaining Amortization Term in Months | Number of Loans | Cut-off Date Principal Balance | % of IPB | Mortgage Rate | Remaining Loan Term(1) | UW NCF DSCR(2)(3)(4) | UW NOI DY(2) | Cut-off Date LTV(2)(3) | Maturity Date/ARD LTV(1)(2)(3) | ||
| Interest Only | 17 | $454,245,000 | 50.9% | 4.83891% | 116 | 2.27x | 11.8% | 53.7% | 53.7% | ||
| 299 | - | 300 | 1 | 3,994,200 | 0.4 | 5.96900% | 119 | 2.22x | 19.0% | 53.3% | 41.3% |
| 353 | - | 360 | 26 | 433,614,354 | 48.6 | 5.14179% | 117 | 1.61x | 11.3% | 63.9% | 56.4% |
| Total / Weighted Average: | 44 | $891,853,554 | 100.0% | 4.99123% | 116 | 1.95x | 11.6% | 58.7% | 55.0% | ||
| Amortization Types |
Weighted Average | |||||||||
| Amortization Types | Number of Loans | Cut-off Date Principal Balance | % of IPB | Mortgage Rate | Remaining Loan Term(1) | UW NCF DSCR(2)(3)(4) | UW NOI DY(2) | Cut-off Date LTV(2)(3) | Maturity Date/ARD LTV(1)(2)(3) |
| Interest Only | 16 | $424,245,000 | 47.6% | 4.82745% | 119 | 2.31x | 12.0% | 52.8% | 52.8% |
| IO-Balloon | 19 | 323,047,500 | 36.2 | 5.17295% | 118 | 1.55x | 11.0% | 64.6% | 58.0% |
| Balloon | 8 | 114,561,054 | 12.8 | 5.08275% | 112 | 1.80x | 12.6% | 61.7% | 51.3% |
| ARD-Interest Only | 1 | 30,000,000 | 3.4 | 5.00100% | 83 | 1.77x | 9.3% | 66.5% | 66.5% |
| Total / Weighted Average: | 44 | $891,853,554 | 100.0% | 4.99123% | 116 | 1.95x | 11.6% | 58.7% | 55.0% |
| Underwritten Net Cash Flow Debt Service Coverage Ratios(2)(4) |
| Weighted Average | |||||||||||
| Range of Underwritten Net Cash Flow Debt Service Coverage Ratios | Number of Loans | Cut-off Date Principal Balance | % of IPB | Mortgage Rate | Remaining Loan Term(1) | UW NCF DSCR(2)(3)(4) | UW NOI DY(2) | Cut-off Date LTV(2)(3) | Maturity Date/ARD LTV(1)(2)(3) | ||
| 1.29x | - | 1.39x | 7 | $121,777,179 | 13.7% | 5.35812% | 119 | 1.35x | 9.7% | 64.7% | 57.8% |
| 1.40x | - | 1.49x | 5 | 49,643,830 | 5.6 | 5.24425% | 118 | 1.42x | 10.1% | 71.6% | 62.4% |
| 1.50x | - | 1.59x | 6 | 98,385,000 | 11.0 | 5.20346% | 118 | 1.54x | 11.1% | 64.2% | 58.0% |
| 1.60x | - | 1.69x | 2 | 15,242,942 | 1.7 | 5.22013% | 119 | 1.66x | 10.5% | 63.8% | 58.9% |
| 1.70x | 1.79x | 6 | 179,638,389 | 20.1 | 5.07708% | 113 | 1.75x | 10.8% | 64.1% | 59.7% | |
| 1.80x | - | 1.99x | 4 | 63,400,000 | 7.1 | 5.23251% | 118 | 1.87x | 12.2% | 62.6% | 58.0% |
| 2.00x | - | 2.99x | 13 | 308,926,214 | 34.6 | 4.75431% | 116 | 2.34x | 12.7% | 52.8% | 52.1% |
| 3.00x | - | 3.15x | 1 | 54,840,000 | 6.1 | 4.27750% | 116 | 3.15x | 13.8% | 32.5% | 32.5% |
| Total / Weighted Average: | 44 | $891,853,554 | 100.0% | 4.99123% | 116 | 1.95x | 11.6% | 58.7% | 55.0% | ||
| (1) | In the case of Loan No. 10 with an anticipated repayment date, as of the related anticipated repayment date. |
| (2) | In the case of Loan Nos. 2, 3, 4, 5, 10, 11, 12, 13, 14, 16, 19, 23, 24 and 30, the UW NCF DSCR, UW NOI Debt Yield, Cut-off Date LTV and Maturity Date/ARD LTV calculations include the related Pari Passu Companion Loan(s). In the case of Loan Nos. 2 and 30, the UW NCF DSCR, UW NOI Debt Yield, Cut-off Date LTV and Maturity Date/ARD LTV calculations exclude the related Subordinate Companion Loans. |
| (3) | In the case of Loan Nos. 3, 11.02, 12, 16 and 41, the Cut-off Date LTV and the Maturity Date/ARD LTV are calculated by using an appraised value based on certain hypothetical or as stabilized assumptions. Refer to “Description of the Mortgage Pool—Assessments of Property Value and Condition” and “—Appraised Value” in the Preliminary Prospectus for additional details. |
| (4) | In the case of Loan No. 30, the UW NCF DSCR is calculated using the sum of principal and interest payments over the first 12 months following the Cut-off Date based on the assumed principal payment schedule provided on Annex F to the Preliminary Prospectus. |
THE INFORMATION IN THIS STRUCTURAL AND COLLATERAL TERM SHEET IS NOT COMPLETE AND MAY BE AMENDED PRIOR TO THE TIME OF SALE. THIS TERM SHEET IS NOT AN OFFER TO SELL THESE SECURITIES AND IT IS NOT A SOLICITATION OF AN OFFER TO BUY THESE SECURITIES IN ANY JURISDICTION WHERE THE OFFER OR SALE IS NOT PERMITTED.
| | 13 | |
| Structural and Collateral Term Sheet | BBCMS 2018-C2 | |
| Collateral Characteristics | ||
| LTV Ratios as of the Cut-off Date(2)(3) |
| Weighted Average | |||||||||||
| Range of Cut-off Date LTVs | Number of Loans | Cut-off Date Principal Balance | % of IPB | Mortgage Rate | Remaining Loan Term(1) | UW NCF DSCR(2)(3)(4) | UW NOI DY(2) | Cut-off Date LTV(2)(3) | Maturity Date/ARD LTV(1)(2)(3) | ||
| 31.8% | - | 49.9% | 6 | $135,758,207 | 15.2% | 4.22339% | 111 | 2.78x | 13.1% | 38.5% | 37.6% |
| 50.0% | - | 59.9% | 16 | 331,699,200 | 37.2 | 5.16646% | 120 | 2.01x | 12.0% | 56.5% | 54.8% |
| 60.0% | - | 64.9% | 7 | 183,322,196 | 20.6 | 5.07653% | 118 | 1.78x | 11.2% | 63.8% | 58.8% |
| 65.0% | - | 69.9% | 11 | 191,793,509 | 21.5 | 5.09136% | 112 | 1.54x | 10.4% | 67.9% | 61.4% |
| 70.0% | - | 75.0% | 4 | 49,280,442 | 5.5 | 5.21995% | 119 | 1.48x | 10.6% | 73.7% | 64.2% |
| Total / Weighted Average: | 44 | $891,853,554 | 100.0% | 4.99123% | 116 | 1.95x | 11.6% | 58.7% | 55.0% | ||
| LTV Ratios as of the Maturity Date/ARD(1)(2)(3) |
Weighted Average | |||||||||||
| Range of Maturity Date LTVs | Number of Loans | Cut-off Date Principal Balance | % of IPB | Mortgage Rate | Remaining Loan Term(1) | UW NCF DSCR(2)(3)(4) | UW NOI DY(2) | Cut-off Date LTV(2)(3) | Maturity Date/ARD LTV(1)(2)(3) | ||
| 29.7% | - | 49.9% | 9 | $150,752,407 | 16.9% | 4.35450% | 112 | 2.69x | 13.2% | 40.3% | 38.5% |
| 50.0% | - | 54.9% | 7 | 186,072,196 | 20.9 | 5.20519% | 119 | 1.87x | 12.5% | 58.0% | 52.4% |
| 55.0% | - | 59.9% | 17 | 304,656,452 | 34.2 | 5.12469% | 119 | 1.87x | 11.3% | 61.2% | 57.7% |
| 60.0% | - | 64.9% | 8 | 191,010,000 | 21.4 | 5.03260% | 118 | 1.68x | 10.6% | 65.9% | 62.5% |
| 65.0% | - | 66.6% | 3 | 59,362,500 | 6.7 | 5.11946% | 101 | 1.59x | 9.6% | 70.7% | 66.2% |
| Total / Weighted Average: | 44 | $891,853,554 | 100.0% | 4.99123% | 116 | 1.95x | 11.6% | 58.7% | 55.0% | ||
| Prepayment Protection |
Weighted Average | |||||||||
| Prepayment Protection | Number of Loans | Cut-off Date Principal Balance | % of IPB | Mortgage Rate | Remaining Loan Term(1) | UW NCF DSCR(2)(3)(4) | UW NOI DY(2) | Cut-off Date LTV(2)(3) | Maturity Date/ARD LTV(1)(2)(3) |
| Defeasance | 36 | $688,212,986 | 77.2% | 5.04957% | 116 | 1.93x | 11.7% | 59.0% | 55.6% |
| Yield Maintenance | 6 | 156,640,568 | 17.6 | 5.02629% | 119 | 1.84x | 11.1% | 61.7% | 56.3% |
| Defeasance or Yield Maintenance | 2 | $47,000,000 | 5.3 | 4.02004% | 115 | 2.52x | 12.1% | 43.3% | 41.4% |
| Total / Weighted Average: | 44 | $891,853,554 | 100.0% | 4.99123% | 116 | 1.95x | 11.6% | 58.7% | 55.0% |
| Loan Purpose |
Weighted Average | |||||||||
| Loan Purpose | Number of Loans | Cut-off Date Principal Balance | % of IPB | Mortgage Rate | Remaining Loan Term(1) | UW NCF DSCR(2)(3)(4) | UW NOI DY(2) | Cut-off Date LTV(2)(3) | Maturity Date/ARD LTV(1)(2)(3) |
| Refinance | 27 | $542,747,544 | 60.9% | 4.96347% | 117 | 2.14x | 12.2% | 54.3% | 52.0% |
| Acquisition | 15 | 324,606,010 | 36.4 | 5.10931% | 115 | 1.63x | 10.6% | 66.8% | 60.8% |
| Recapitalization | 2 | 24,500,000 | 2.7 | 4.04152% | 113 | 1.95x | 11.4% | 47.4% | 43.0% |
| Total / Weighted Average: | 44 | $891,853,554 | 100.0% | 4.99123% | 116 | 1.95x | 11.6% | 58.7% | 55.0% |
| (1) | In the case of Loan No. 10 with an anticipated repayment date, as of the related anticipated repayment date. |
| (2) | In the case of Loan Nos. 2, 3, 4, 5, 10, 11, 12, 13, 14, 16, 19, 23, 24 and 30, the UW NCF DSCR, UW NOI Debt Yield, Cut-off Date LTV and Maturity Date/ARD LTV calculations include the related Pari Passu Companion Loan(s). In the case of Loan Nos. 2 and 30, the UW NCF DSCR, UW NOI Debt Yield, Cut-off Date LTV and Maturity Date/ARD LTV calculations exclude the related Subordinate Companion Loan. |
| (3) | In the case of Loan Nos. 3, 11.02, 12, 16 and 41, the Cut-off Date LTV and the Maturity Date/ARD LTV are calculated by using an appraised value based on certain hypothetical or as stabilized assumptions. Refer to “Description of the Mortgage Pool—Assessments of Property Value and Condition” and “—Appraised Value” in the Preliminary Prospectus for additional details. |
| (4) | In the case of Loan No. 30, the UW NCF DSCR is calculated using the sum of principal and interest payments over the first 12 months following the Cut-off Date based on the assumed principal payment schedule provided on Annex F to the Preliminary Prospectus. |
THE INFORMATION IN THIS STRUCTURAL AND COLLATERAL TERM SHEET IS NOT COMPLETE AND MAY BE AMENDED PRIOR TO THE TIME OF SALE. THIS TERM SHEET IS NOT AN OFFER TO SELL THESE SECURITIES AND IT IS NOT A SOLICITATION OF AN OFFER TO BUY THESE SECURITIES IN ANY JURISDICTION WHERE THE OFFER OR SALE IS NOT PERMITTED.
| | 14 | |
| Structural and Collateral Term Sheet | BBCMS 2018-C2 | |
| Collateral Characteristics | ||
| Previous Securitization History(1) |
| No. | Mortgage Loan Seller | Loan Name | Location | Property Type | Cut-off Date Principal Balance | % of IPB | Previous Securitization |
| 2 | Barclays | Christiana Mall | Newark, DE | Retail | $54,840,000 | 6.1% | MSC 2011-C1 |
| 7 | SMC | West Covina Village | West Covina, CA | Mixed Use | $36,000,000 | 4.0% | CSMC 2006-C5 |
| 8 | CCRE | AVR Embassy Suites Fort Worth | Fort Worth, TX | Hotel | $35,200,000 | 3.9% | WFCM 2010-C1 |
| 9 | SMC | Residence Inn by Marriott Phoenix Desert View at Mayo Clinic | Phoenix, AZ | Hotel | $31,000,000 | 3.5% | UBSBB 2012-C3 |
| 11 | Barclays | Virginia Beach Hotel Portfolio | Virginia Beach, VA | Hotel | $30,000,000 | 3.4% | JPMBB 2014-C21 |
| 12 | CCRE | Moffett Towers - Buildings E,F,G | Sunnyvale, CA | Office | $25,000,000 | 2.8% | COMM 2013-CR8 |
| 19 | CCRE | The Shops at Solaris | Vail, CO | Retail | $20,000,000 | 2.2% | CFCRE 2011-C2 |
| 21.01 | SMC | 808 West 76th Street | Chicago, IL | Multifamily | $1,423,397 | 0.2% | GSMS 2012-GC6 |
| 21.02 | SMC | 6000 South Prairie Avenue | Chicago, IL | Multifamily | $1,228,616 | 0.1% | GSMS 2012-GCJ9 |
| 21.03 | SMC | 9244 South Saginaw Avenue | Chicago, IL | Multifamily | $1,153,700 | 0.1% | GSMS 2012-GCJ9 |
| 21.04 | SMC | 4853 South Prairie Avenue | Chicago, IL | Multifamily | $1,063,802 | 0.1% | GSMS 2012-GCJ9 |
| 21.05 | SMC | 7348 South Dr. Martin Luther King Jr. Drive | Chicago, IL | Multifamily | $973,903 | 0.1% | GSMS 2012-GCJ9 |
| 21.06 | SMC | 7944 South Paulina Street | Chicago, IL | Multifamily | $958,920 | 0.1% | GSMS 2012-GC6 |
| 21.07 | SMC | 7801 South Saginaw Avenue | Chicago, IL | Multifamily | $794,105 | 0.1% | GSMS 2012-GCJ9 |
| 21.08 | SMC | 8200 South Ingleside Avenue | Chicago, IL | Multifamily | $779,122 | 0.1% | GSMS 2012-GCJ9 |
| 21.09 | SMC | 1514 West 77th Street | Chicago, IL | Multifamily | $764,139 | 0.1% | GSMS 2012-GC6 |
| 21.10 | SMC | 8000 South Drexel Avenue | Chicago, IL | Multifamily | $764,139 | 0.1% | GSMS 2012-GCJ9 |
| 21.11 | SMC | 8001 South Marshfield Avenue | Chicago, IL | Multifamily | $734,173 | 0.1% | GSMS 2012-GC6 |
| 21.12 | SMC | 1717 West 77th Street | Chicago, IL | Multifamily | $689,224 | 0.1% | GSMS 2012-GC6 |
| 21.13 | SMC | 1815 West 77th Street | Chicago, IL | Multifamily | $659,257 | 0.1% | GSMS 2012-GC6 |
| 21.14 | SMC | 1704 West 77th Street | Chicago, IL | Multifamily | $629,291 | 0.1% | GSMS 2012-GC6 |
| 21.15 | SMC | 1738 West 77th Street | Chicago, IL | Multifamily | $614,308 | 0.1% | GSMS 2012-GC6 |
| 21.16 | SMC | 8231 South Ellis Avenue | Chicago, IL | Multifamily | $599,325 | 0.1% | GSMS 2012-GCJ9 |
| 21.17 | SMC | 1735 West 79th Street | Chicago, IL | Multifamily | $569,359 | 0.1% | GSMS 2012-GC6 |
| 21.18 | SMC | 1448 West 83rd Street | Chicago, IL | Multifamily | $554,376 | 0.1% | GSMS 2012-GC6 |
| 21.19 | SMC | 8155 South Maryland Avenue | Chicago, IL | Multifamily | $554,376 | 0.1% | GSMS 2012-GCJ9 |
| 21.20 | SMC | 8515 South Green Street | Chicago, IL | Multifamily | $494,443 | 0.1% | GSMS 2012-GC6 |
| 21.21 | SMC | 8001 South Carpenter Street | Chicago, IL | Multifamily | $449,494 | 0.1% | GSMS 2012-GC6 |
| 21.22 | SMC | 7914 South Kingston Avenue | Chicago, IL | Multifamily | $449,494 | 0.1% | GSMS 2012-GCJ9 |
| 21.23 | SMC | 8255 South Maryland Avenue | Chicago, IL | Multifamily | $449,494 | 0.1% | GSMS 2012-GCJ9 |
| 21.24 | SMC | 8514 South Crandon Avenue | Chicago, IL | Multifamily | $404,544 | 0.0% | GSMS 2012-GCJ9 |
| 28 | Barclays | Bridgeport Center | Tigard, OR | Office | $13,400,000 | 1.5% | JPMBB 2013-C15 |
| 29 | SMC | Southern Highlands Corporate Center | Las Vegas, NV | Office | $12,250,000 | 1.4% | GSMS 2007-GG10 |
| 32 | KeyBank | Marketplace Center at Murfreesboro | Murfreesboro, TN | Retail | $8,581,330 | 1.0% | FORT CRE 2016-1 |
| (1) | The table above represents the properties for which the previously existing debt was most recently securitized, based on information provided by the related borrower or obtained through searches of a third-party database. |
THE INFORMATION IN THIS STRUCTURAL AND COLLATERAL TERM SHEET IS NOT COMPLETE AND MAY BE AMENDED PRIOR TO THE TIME OF SALE. THIS TERM SHEET IS NOT AN OFFER TO SELL THESE SECURITIES AND IT IS NOT A SOLICITATION OF AN OFFER TO BUY THESE SECURITIES IN ANY JURISDICTION WHERE THE OFFER OR SALE IS NOT PERMITTED.
| | 15 | |
| Structural and Collateral Term Sheet | BBCMS 2018-C2 |
| Class A-2(1) | |
No. | Loan Name | Location | Cut-off Date Balance | % of | Maturity Date/ARD Balance | % of Certificate Class(2) | Original Loan Term | Remaining Loan Term | UW NCF | UW NOI Debt | Cut-off Date | Maturity Date/ARD |
| 30 | Fair Oaks Mall | Fairfax, VA | $10,918,207 | 1.2% | $10,193,150 | 98.0% | 60 | 53 | 2.89x | 17.2% | 31.8% | 29.7% |
| Total / Weighted Average: | $10,918,207 | 1.2% | $10,193,150 | 98.0% | 60 | 53 | 2.89x | 17.2% | 31.8% | 29.7% | ||
| (1) | The table above presents the mortgage loan whose balloon payment would be applied to pay down the certificate balance of the Class A-2 Certificates, assuming a 0% CPR and applying the “Modeling Assumptions” described in the Preliminary Prospectus, including the assumptions that (i) none of the mortgage loans in the pool experience prepayments, defaults or losses; (ii) there are no extensions of maturity dates of any mortgage loans in the pool; and (iii) each mortgage loan in the pool is paid in full on its stated maturity date. Each Class of Certificates, including the Class A-2 Certificates, evidences undivided ownership interests in the entire pool of mortgage loans. Debt service coverage ratio, debt yield and loan-to-value ratio information does not take into account subordinate debt (whether or not secured by the mortgaged property), if any, that is allowed under the terms of any mortgage loan. See Annex A-1 to the Preliminary Prospectus. |
| (2) | Reflects the percentage equal to the Maturity Date/ARD Balance divided by the initial Class A-2 Certificate Balance. |
| (3) | The UW NCF DSCR is calculated using the sum of principal and interest payments over the first 12 months following the Cut-off Date based on the assumed principal payment schedule provided on Annex F to the Preliminary Prospectus. |
| (4) | The UW NCF DSCR, UW NOI Debt Yield, Cut-off Date LTV and Maturity Date/ARD LTV calculations include the related Pari Passu Companion Loans. The UW NCF DSCR, UW NOI Debt Yield, Cut-off Date LTV and Maturity Date/ARD LTV calculations exclude the related Subordinate Companion Loans. |
THE INFORMATION IN THIS STRUCTURAL AND COLLATERAL TERM SHEET IS NOT COMPLETE AND MAY BE AMENDED PRIOR TO THE TIME OF SALE. THIS TERM SHEET IS NOT AN OFFER TO SELL THESE SECURITIES AND IT IS NOT A SOLICITATION OF AN OFFER TO BUY THESE SECURITIES IN ANY JURISDICTION WHERE THE OFFER OR SALE IS NOT PERMITTED.
| | 16 | |
| Structural and Collateral Term Sheet | BBCMS 2018-C2 | |
| Class A-3(1) | ||
No. | Loan Name | Location | Cut-off Date Balance | % of | Maturity Date/ARD Balance | % of Certificate Class(2) | Original Loan Term | Remaining Loan Term | UW NCF | UW NOI Debt | Cut-off Date | Maturity Date/ARD |
| 10 | Home Depot Technology Center | Marietta, GA | $30,000,000 | 3.4% | $30,000,000 | 99.5% | 84 | 83 | 1.77x | 9.3% | 66.5% | 66.5% |
| Total / Weighted Average: | $30,000,000 | 3.4% | $30,000,000 | 99.5% | 84 | 83 | 1.77x | 9.3% | 66.5% | 66.5% | ||
| (1) | The table above presents the mortgage loan whose balloon payment would be applied to pay down the certificate balance of the Class A-3 Certificates, assuming a 0% CPR and applying the “Modeling Assumptions” described in the Preliminary Prospectus, including the assumptions that (i) none of the mortgage loans in the pool experience prepayments, defaults or losses; (ii) there are no extensions of maturity dates of any mortgage loans in the pool; and (iii) each mortgage loan in the pool is paid in full on its stated maturity date. Each Class of Certificates, including the Class A-3 Certificates, evidences undivided ownership interests in the entire pool of mortgage loans. Debt service coverage ratio, debt yield and loan-to-value ratio information does not take into account subordinate debt (whether or not secured by the mortgaged property), if any, that is allowed under the terms of any mortgage loan. See Annex A-1 to the Preliminary Prospectus. |
| (2) | Reflects the percentage equal to the Maturity Date/ARD Balance divided by the initial Class A-3 Certificate Balance. |
| (3) | The UW NCF DSCR, UW NOI Debt Yield, Cut-off Date LTV and Maturity Date/ARD LTV calculations include the related Pari Passu Companion Loan. |
THE INFORMATION IN THIS STRUCTURAL AND COLLATERAL TERM SHEET IS NOT COMPLETE AND MAY BE AMENDED PRIOR TO THE TIME OF SALE. THIS TERM SHEET IS NOT AN OFFER TO SELL THESE SECURITIES AND IT IS NOT A SOLICITATION OF AN OFFER TO BUY THESE SECURITIES IN ANY JURISDICTION WHERE THE OFFER OR SALE IS NOT PERMITTED.
| | 17 | |
| Structural and Collateral Term Sheet | BBCMS 2018-C2 | |
| Structural Overview | ||
| ■ Accrual: | Each Class of Certificates (other than the Class S and Class R Certificates) will accrue interest on a 30/360 basis. The Class S and Class R Certificates will not accrue interest. On each Distribution Date, any excess interest collected in respect of any mortgage loan in the trust with an anticipated repayment date, solely to the extent received from the related borrower during the related collection period will be distributed to the holders of the Class S Certificates. | |
| ■ Distribution of Interest: | On each Distribution Date, accrued interest for each Class of Certificates (other than the Class S and Class R Certificates) at the applicable pass-through rate will be distributed in the following order of priority to the extent of available funds: first, to the Class A-1, Class A-2, Class A-3, Class A-4, Class A-5, Class A-SB, Class X-A, Class X-B, Class X-D, Class X-F and Class X-G Certificates (the “Senior Certificates”), on apro rata basis, based on the interest entitlement for each such Class on such date, and then to the Class A-S, Class B, Class C, Class D, Class E, Class F, Class G, Class H-RR and Class J-RR Certificates, in that order, in each case until the interest entitlement for such date payable to each such Class is paid in full.
The pass-through rate applicable to each of the Class A-1, Class A-2, Class A-3, Class A-4, Class A-5, Class A-SB, Class A-S, Class B, Class C, Class D, Class E, Class F, Class G, Class H-RR and Class J-RR Certificates on each Distribution Date, will be aper annum rate equal to one of (i) a fixed rate, (ii) the weighted average of the net mortgage rates on the mortgage loans (in each case adjusted, if necessary, to accrue on the basis of a 360-day year consisting of twelve 30-day months), (iii) the lesser of a specified fixed pass-through rate and the rate described in clause (ii) above or (iv) the rate described in clause (ii) above less a specified percentage.
The pass-through rate for the Class X-A Certificates for any Distribution Date will be aper annum rate equal to the excess, if any, of (a) the weighted average of the net mortgage rates on the mortgage loans (in each case adjusted, if necessary, to accrue on the basis of a 360-day year consisting of twelve 30-day months), over (b) the weighted average of the pass-through rates on the Class A-1, Class A-2, Class A-3, Class A-4, Class A-5 and Class A-SB Certificates for the related Distribution Date, weighted on the basis of their respective Certificate Balances outstanding immediately prior to that Distribution Date.
The pass-through rate for the Class X-B Certificates for any Distribution Date will be aper annum rate equal to the excess, if any, of (a) the weighted average of the net mortgage rates on the mortgage loans (in each case adjusted, if necessary, to accrue on the basis of a 360-day year consisting of twelve 30-day months), over (b) the weighted average of the pass-through rates on the Class A-S, Class B and Class C Certificates for the related Distribution Date, weighted on the basis of their respective Certificate Balances outstanding immediately prior to the Distribution Date.
The pass-through rate for the Class X-D Certificates for any Distribution Date will be aper annum rate equal to the excess, if any, of (a) the weighted average of the net mortgage rates on the mortgage loans (in each case adjusted, if necessary, to accrue on the basis of a 360-day year consisting of twelve 30-day months), over (b) the weighted average of the pass-through rates on the Class D and Class E Certificates for the related Distribution Date, weighted on the basis of their respective Certificate Balances outstanding immediately prior to the Distribution Date.
The pass-through rate for the Class X-F Certificates for any Distribution Date will be aper annum rate equal to the excess, if any, of (a) the weighted average of the net mortgage rates on the mortgage loans (in each case adjusted, if necessary, to accrue on the basis of a 360-day year consisting of twelve 30-day months), over (b) the pass-through rate on the Class F Certificates for the related Distribution Date.
The pass-through rate for the Class X-G Certificates for any Distribution Date will be aper annum rate equal to the excess, if any, of (a) the weighted average of the net mortgage rates on the mortgage loans (in each case adjusted, if necessary, to accrue on the basis of a 360-day year consisting of twelve 30-day months), over (b) the pass-through rate on the Class G Certificates for the related Distribution Date.
The Class S Certificates will not have a pass-through rate. On each Distribution Date, any excess interest collected in respect of any mortgage loan in the trust with an anticipated |
THE INFORMATION IN THIS STRUCTURAL AND COLLATERAL TERM SHEET IS NOT COMPLETE AND MAY BE AMENDED PRIOR TO THE TIME OF SALE. THIS TERM SHEET IS NOT AN OFFER TO SELL THESE SECURITIES AND IT IS NOT A SOLICITATION OF AN OFFER TO BUY THESE SECURITIES IN ANY JURISDICTION WHERE THE OFFER OR SALE IS NOT PERMITTED.
| | 18 | |
| Structural and Collateral Term Sheet | BBCMS 2018-C2 | |
| Structural Overview | ||
| repayment date, solely to the extent received from the related borrower during the related collection period, will be distributed to the holders of the Class S Certificates.
See “Description of the Certificates—Distributions” in the Preliminary Prospectus. | ||
| ■ Distribution of Principal: | On any Distribution Date prior to the Cross-Over Date, payments in respect of principal of the Certificates will be distributed:
first, to the Class A-SB Certificates until the Certificate Balance of the Class A-SB Certificates is reduced to the Class A-SB planned principal balance for the related Distribution Date set forth in Annex E to the Preliminary Prospectus, second, to the Class A-1 Certificates, until the Certificate Balance of such Class is reduced to zero, third, to the Class A-2 Certificates, until the Certificate Balance of such Class is reduced to zero, fourth, to the Class A-3 Certificates, until the Certificate Balance of such Class is reduced to zero, fifth, to the Class A-4 Certificates, until the Certificate Balance of such Class is reduced to zero, sixth, to the Class A-5 Certificates, until the Certificate Balance of such Class is reduced to zero and seventh, to the Class A-SB Certificates, until the Certificate Balance of such Class is reduced to zero and then to the Class A-S, Class B, Class C, Class D, Class E, Class F, Class G, Class H-RR and Class J-RR Certificates, in that order, until the Certificate Balance of each such Class is reduced to zero.
On any Distribution Date on or after the Cross-Over Date, payments in respect of principal of the Certificates will be distributed to the Class A-1, Class A-2, Class A-3, Class A-4, Class A-5 and Class A-SB Certificates,pro rata based on the Certificate Balance of each such Class until the Certificate Balance of each such Class is reduced to zero.
The “Cross-Over Date” means the Distribution Date on which the aggregate Certificate Balances of the Class A-S, Class B, Class C, Class D, Class E, Class F, Class G, Class H-RR and Class J-RR Certificates have been reduced to zero as a result of the allocation of realized losses to such Classes.
The Class X-A, Class X-B, Class X-D, Class X-F and Class X-G Certificates (the “Class X Certificates”) will not be entitled to receive distributions of principal; however, the notional amount of the Class X-A Certificates will be reduced by the aggregate amount of principal distributions, realized losses and trust fund expenses, if any, allocated to the Class A-1, Class A-2, Class A-3, Class A-4, Class A-5 and Class A-SB Certificates, the notional amount of the Class X-B Certificates will be reduced by the aggregate amount of principal distributions, realized losses and trust fund expenses, if any, allocated to the Class A-S, Class B and Class C Certificates, the notional amount of the Class X-D Certificates will be reduced by the aggregate amount of principal distributions, realized losses and trust fund expenses, if any, allocated to the Class D and Class E Certificates, the notional amount of the Class X-F Certificates will be reduced by the amount of principal distributions, realized losses and trust fund expenses, if any, allocated to the Class F Certificates and the notional amount of the Class X-G Certificates will be reduced by the amount of principal distributions, realized losses and trust fund expenses, if any, allocated to the Class G Certificates.
The Class S Certificates have no certificate balance, notional amount, credit support, pass-through rate, rated final distribution date or rating, and will not be entitled to distributions of principal. The Class S Certificates are entitled to distributions of excess interest collected on the mortgage loan with an anticipated repayment date solely to the extent received from the related borrower and will represent beneficial ownership of the grantor trust, as further described in “Description of the Certificates—Distributions” in the Preliminary Prospectus.
| |
| ■ Yield Maintenance / Fixed Penalty Allocation: | For purposes of the distribution of Yield Maintenance Charges on any Distribution Date, Yield Maintenance Charges collected in respect of the mortgage loans will first be allocated pro rata among four groups (based on the aggregate amount of principal distributed to the Principal Balance Certificates in each group), consisting of (a) the Class A-1, Class A-2, Class A-3, Class A-4, Class A-5, Class A-SB, and Class X-A Certificates (“YM Group A”), (b) the Class A-S, Class B, Class C and Class X-B Certificates (“YM Group BC”), (c) the Class D, Class E and Class X-D Certificates (“YM Group DE”), (d) the Class F and Class X-F Certificates (“YM Group F”), (e) the Class G and Class X-G Certificates (“YM Group G”) and (f) the Class H-RR and the Class J-RR Certificates (“YM Group HJ-RR”). As among the Classes of Certificates in each YM |
THE INFORMATION IN THIS STRUCTURAL AND COLLATERAL TERM SHEET IS NOT COMPLETE AND MAY BE AMENDED PRIOR TO THE TIME OF SALE. THIS TERM SHEET IS NOT AN OFFER TO SELL THESE SECURITIES AND IT IS NOT A SOLICITATION OF AN OFFER TO BUY THESE SECURITIES IN ANY JURISDICTION WHERE THE OFFER OR SALE IS NOT PERMITTED.
| | 19 | |
| Structural and Collateral Term Sheet | BBCMS 2018-C2 | |
| Structural Overview | ||
Group, other than the YM Group HJ-RR, each Class of Certificates entitled to distributions of principal will receive an amount calculated generally in accordance with the formula described in the Preliminary Prospectus, with any remaining Yield Maintenance Charges on such Distribution Date being distributed to the class of Class X Certificates in such YM Group.
With respect to the YM Group HJ-RR, the Certificates in such YM Group entitled to distributions of principal will receive an amount calculated as specifically described in the Preliminary Prospectus. No Yield Maintenance Charges will be distributed to the Class S or Class R Certificates.
| ||
| ■ Realized Losses: | Losses on the mortgage loans will be allocated first to the Class J-RR, Class H-RR, Class G, Class F, Class E, Class D, Class C, Class B and Class A-S Certificates, in that order, in each case until the Certificate Balance of all such Classes have been reduced to zero, and then, to the Class A-1, Class A-2, Class A-3, Class A-4, Class A-5 and Class A-SB Certificates,pro rata, based on the Certificate Balance of each such Class, until the Certificate Balance of each such Class has been reduced to zero. The notional amounts of the Class X-A, Class X-B, Class X-D, Class X-F and Class X-G Certificates will be reduced by the aggregate amount of realized losses allocated to Certificates that are components of the notional amounts of the Class X-A, Class X-B, Class X-D, Class X-F and Class X-G Certificates, respectively.
Losses on eachpari passu Whole Loan will be allocated,pro rata, between the related mortgage loan and the relatedPari Passu Companion Loan(s), based upon their respective principal balances and with respect to any Whole Loan with one or more subordinate companion loans, first to the related Subordinate Companion Loan(s) and then to the related mortgage loan and any relatedPari Passu Companion loans (if any).
| |
| ■ Interest Shortfalls: | A shortfall with respect to the amount of available funds distributable in respect of interest can result from, among other sources: (a) delinquencies and defaults by borrowers; (b) shortfalls resulting from the application of appraisal reductions to reduce P&I Advances; (c) shortfalls resulting from interest on Advances made by the Master Servicer, the Special Servicer or the Trustee; (d) shortfalls resulting from the payment of Special Servicing Fees and other additional compensation that the Special Servicer is entitled to receive; (e) shortfalls resulting from extraordinary expenses of the trust, including indemnification payments payable to the Depositor, the Master Servicer, the Special Servicer, the Certificate Administrator, the Trustee, the Operating Advisor and the Asset Representations Reviewer; (f) shortfalls resulting from a modification of a mortgage loan’s interest rate or principal balance; and (g) shortfalls resulting from other unanticipated or default-related expenses of the trust. Any such shortfalls that decrease the amount of available funds distributable in respect of interest to the Certificateholders will reduce distributions to the classes of Certificates (other than the Class S and Class R Certificates) beginning with those with the lowest payment priorities, in reverse sequential order. See “Description of the Certificates—Distributions—Priority of Distributions” in the Preliminary Prospectus. | |
| ■ Appraisal Reduction Amounts: | With respect to mortgage loans serviced under the Pooling and Servicing Agreement, upon the occurrence of certain trigger events with respect to a mortgage loan, which are generally tied to certain events of default under the related mortgage loan documents, the Special Servicer will be obligated to obtain an appraisal of the related mortgaged property and the Master Servicer will calculate the Appraisal Reduction Amount. The “Appraisal Reduction Amount” is generally the amount by which the current principal balance of the related mortgage loan or Serviced Whole Loan, plus outstanding advances, real estate taxes, unpaid servicing fees and certain similar amounts exceeds the sum of (a) 90% of the appraised value of the related mortgaged property, (b) the amount of any escrows and letters of credit and reserves and (c) all insurance and casualty proceeds and condemnation awards that are collateral for the related mortgage loan.
With respect to the Non-Serviced Whole Loans, any Appraisal Reduction Amount will be similarly determined pursuant to the related trust and servicing agreement or pooling and servicing agreement, as applicable, under which it is serviced.
In general, the Appraisal Reduction Amounts that are allocated to the mortgage loans are notionally allocated to reduce, in reverse sequential order, the Certificate Balance of each Class of Certificates (other than the Class A-1, Class A-2, Class A-3, Class A-4, Class A-5 and Class A-SB Certificates) beginning with the Class J-RR Certificates for certain purposes, including |
THE INFORMATION IN THIS STRUCTURAL AND COLLATERAL TERM SHEET IS NOT COMPLETE AND MAY BE AMENDED PRIOR TO THE TIME OF SALE. THIS TERM SHEET IS NOT AN OFFER TO SELL THESE SECURITIES AND IT IS NOT A SOLICITATION OF AN OFFER TO BUY THESE SECURITIES IN ANY JURISDICTION WHERE THE OFFER OR SALE IS NOT PERMITTED.
| | 20 | |
| Structural and Collateral Term Sheet | BBCMS 2018-C2 | |
| Structural Overview | ||
certain voting rights and the determination of the controlling class. As a result of calculating one or more Appraisal Reduction Amounts (and, in the case of any Whole Loan, to the extent allocated in the relatedmortgage loan), the amount of any required P&I Advance will be reduced, which will have the effect of reducing the amount of interest available to the most subordinate Class of Certificates then-outstanding (i.e.,first, to Class J-RR Certificates;second, to the Class H-RR Certificates,thirdto the Class G Certificates;fourth, to the Class F Certificates;fifth, to the Class E Certificates;sixth, to the Class D Certificates,seventh, to the Class C Certificates,eighth, to the Class B Certificates,ninth, to the Class A-S Certificates and finally,pro rata based on their respective interest entitlements, to the Senior Certificates).
With respect to each servicedpari passu Whole Loan, the Appraisal Reduction Amount is notionally allocated,pro rata, between the related mortgage loan and the related servicedpari passu companion loan(s), based upon their respective principal balances.
| ||
| ■ Appraisal Reduced Interest: | Accrued and unpaid interest at the related interest rate for a mortgage loan that is not advanced by the Master Servicer or the Trustee as backup master servicer due to the application of Appraisal Reduction Amounts to such mortgage loan. | |
| ■ Master Servicer Advances: | The Master Servicer will be required to advance certain delinquent scheduled mortgage loan payments of principal and interest and certain property protection advances, in each case, to the extent the Master Servicer deems such advances to be recoverable. At any time that an Appraisal Reduction Amount exists, the amount that would otherwise be required to be advanced by the Master Servicer in respect of delinquent payments of interest on any mortgage loan will be reduced to equal the product of (x) the interest portion of the amount that would be advanced without regard to any Appraisal Reduction Amount and (y) a fraction, the numerator of which is the then-outstanding principal balance of the mortgage loan minus the Appraisal Reduction Amount and the denominator of which is the then-outstanding principal balance of the mortgage loan immediately prior to the related Distribution Date. The Master Servicer will not make any principal or interest advances with respect to any companion loan. | |
| ■ Whole Loans: | Fourteen mortgage loans are each evidenced by one mortgage loan and one or more companion loans (each a “Companion Loan” and collectively with the related mortgage loan, a “Whole Loan”), secured by the same mortgage(s) on the related mortgaged property(ies). Each such mortgage loan and its related Companion Loan(s) are subject to an intercreditor agreement. None of these Companion Loans will be part of the trust.
In the case of the Whole Loans, referred to as the “Christiana Mall Whole Loan”, the “GNL Portfolio Whole Loan”, the “Liberty Portfolio Whole Loan”, the “Fidelis Portfolio Whole Loan”, the “Home Depot Technology Center Whole Loan”, the “Virginia Beach Hotel Portfolio Whole Loan”, the “Moffett Towers – Buildings E,F,G Whole Loan”, the “Shelbourne Global Portfolio II Whole Loan”, “Zenith Ridge Whole Loan”, “Moffett Towers II – Building 1 Whole Loan”, “The Shops at Solaris Whole Loan”, the “One River Place Whole Loan”, the “Alex Park South Whole Loan” and the “Fair Oaks Mall Whole Loan”, one or more related Companion Loans arepari passu with the related mortgage loan (these Companion Loans are also referred to as the “Pari Passu Companion Loans”). In the case of the Christiana Mall Whole Loan and the Fair Oaks Mall Whole Loan, in addition to any related Pari Passu Companion Loans, one or more related Companion Loans are subordinate in right of payment to the related mortgage loan and the related Pari Passu Companion Loans (these Companion Loans are also referred to as the “Subordinate Companion Loans”).
The GNL Portfolio Pari Passu Companion Loans, the Fidelis Portfolio Pari Passu Companion Loans, the Home Depot Technology Center Pari Passu Companion Loans, the Shelbourne Global Portfolio II Pari Passu Companion Loans and the One River Place Pari Passu Companion Loans are referred to as “Serviced Companion Loans”.
The GNL Portfolio Whole Loan, the Fidelis Portfolio Whole Loan, the Home Depot Technology Center Whole Loan, the Shelbourne Global Portfolio II Whole Loan and the One River Place Whole Loan (each, a “Serviced Whole Loan”) will be serviced under the pooling and servicing agreement for the BBCMS 2018-C2 transaction (the “Pooling and Servicing Agreement”).
The Christiana Mall Whole Loan is being serviced and administered pursuant to the terms of the BBCMS 2018-CHRS trust and servicing agreement. |
THE INFORMATION IN THIS STRUCTURAL AND COLLATERAL TERM SHEET IS NOT COMPLETE AND MAY BE AMENDED PRIOR TO THE TIME OF SALE. THIS TERM SHEET IS NOT AN OFFER TO SELL THESE SECURITIES AND IT IS NOT A SOLICITATION OF AN OFFER TO BUY THESE SECURITIES IN ANY JURISDICTION WHERE THE OFFER OR SALE IS NOT PERMITTED.
| | 21 | |
| Structural and Collateral Term Sheet | BBCMS 2018-C2 | |
| Structural Overview | ||
The Liberty Portfolio Whole Loan and The Shops at Solaris Whole Loan are each expected to be serviced and administered pursuant to the terms of the BMARK 2018-B7 pooling and servicing agreement.
The Virginia Beach Hotel Portfolio Whole Loan is being serviced pursuant to the WFCM 2018-C47 pooling and servicing agreement.
The Moffett Towers – Buildings E,F,G Whole Loan is being serviced pursuant to the DBGS 2018-C1 pooling and servicing agreement.
The Zenith Ridge Whole Loan is being serviced pursuant to the CD 2018-CD7 pooling and servicing agreement.
The Moffett Towers II – Building I Whole Loan is being serviced pursuant to the BMARK 2018-B6 pooling and servicing agreement.
The Alex Park South Whole Loan is being serviced pursuant to the MSC 2018-L1 pooling and servicing agreement.
The Fair Oaks Mall Whole Loan is being serviced pursuant to the BANK 2018-BNK12 pooling and servicing agreement.
The Christiana Mall Whole Loan, the Liberty Portfolio Whole Loan, the Virginia Beach Hotel Portfolio Whole Loan, the Moffett Towers – Buildings, E,F,G Whole Loan, the Zenith Ridge Whole Loan, the Moffett Towers II – Building I Whole Loan, The Shops at Solaris Whole Loan, the Alex Park South Whole Loan and the Fair Oaks Mall Whole Loan are each a “Non-Serviced Whole Loan” and collectively the “Non-Serviced Whole Loans”. | ||
| ■ Liquidated Loan Waterfall: | On liquidation of any mortgage loan, all net liquidation proceeds related to the mortgage loan (but not any related Companion Loan) will be applied so that amounts allocated as a recovery of accrued and unpaid interest will not, in the first instance, include any delinquent interest that was not advanced as a result of Appraisal Reduction Amounts or interest that accrued on any junior note(s) if such mortgage loan is an AB Modified Loan. After the adjusted interest amount is so allocated, any remaining liquidation proceeds will be allocated to offset certain advances and to pay principal on the mortgage loan until the unpaid principal amount of the mortgage loan has been reduced to zero. Any remaining liquidation proceeds will then be allocated to pay delinquent interest that was not advanced as a result of Appraisal Reduction Amounts and any interest that accrued on any junior note(s) if such mortgage loan is an AB Modified Loan. Any liquidation proceeds in respect of each such mortgage loan in excess of the related outstanding balance will first be applied to offset any interest shortfalls allocated to the Certificates (other than the Class S and Class R Certificates), in sequential order, and then to offset any realized losses allocated to the Certificates (other than the Class S and Class R Certificates), in sequential order. Any liquidation proceeds remaining after such applications will be distributed to the Class R Certificates. | |
| ■ Sale of Defaulted Loans and REO Properties: | The Special Servicer is required to solicit offers for any defaulted loan or REO property (other than a non-serviced mortgage loan), if the Special Servicer determines that no satisfactory arrangements can be made for collection of delinquent payments and the sale would be in the best economic interests of the certificateholders (or, in the case of any Serviced Whole Loan, the certificateholders and any holders of the related Serviced Pari Passu Companion Loans, as a collective whole, taking into account thepari passu nature of such Serviced Companion Loans), on a net present value basis.
In the case of each non-serviced mortgage loan, under certain circumstances permitted under the related intercreditor agreement, to the extent that such non-serviced mortgage loan is not sold together with the related non-serviced companion loan by the special servicer for the related Non-Serviced Whole Loans, the Special Servicer will be entitled to sell (with respect to any mortgage loan other than an Excluded Loan, with the consent of the Directing Certificateholder if no Control Termination Event has occurred and is continuing) such non-serviced mortgage loan if it determines in accordance with the servicing standard that such action would be in the best interests of the certificateholders. |
THE INFORMATION IN THIS STRUCTURAL AND COLLATERAL TERM SHEET IS NOT COMPLETE AND MAY BE AMENDED PRIOR TO THE TIME OF SALE. THIS TERM SHEET IS NOT AN OFFER TO SELL THESE SECURITIES AND IT IS NOT A SOLICITATION OF AN OFFER TO BUY THESE SECURITIES IN ANY JURISDICTION WHERE THE OFFER OR SALE IS NOT PERMITTED.
| | 22 | |
| Structural and Collateral Term Sheet | BBCMS 2018-C2 | |
| Structural Overview | ||
The Special Servicer is generally required to accept the highest cash offer received from any person for any defaulted loan or REO property in an amount at least equal to par plus accrued interest plus all other outstanding amounts due under such mortgage loan and any outstanding expenses of the trust relating to such mortgage loan (the “Purchase Price”) except as described in the Preliminary Prospectus.
With respect to the Serviced Whole Loans, any such sale of the related defaulted loan is required to also include the related Pari Passu Companion Loans, if any, and the prices will be adjusted accordingly.
With respect to the mortgage loans that have mezzanine debt or permit mezzanine debt in the future, the mezzanine lenders may have theoption to purchase the related mortgage loan after certain events of default under such mortgage loan.
The Directing Certificateholder will not have a right of first refusal to purchase a defaulted loan.
If the Special Servicer does not receive a cash offer at least equal to the Purchase Price, the Special Servicer may accept the first cash offer received from any person that is determined to be a fair price and will be required to take into account (in addition to the results of any appraisal, updated appraisal or narrative appraisal that it may have obtained pursuant to the PSA within the prior 9 months), among other factors, the period and amount of the occupancy level and physical condition of the related Mortgaged Property and the state of the local economy) for such defaulted loan or REO property, if the highest offeror is a person other than a party to the Pooling and Servicing Agreement, the Directing Certificateholder, any sponsor, any borrower, any manager of a mortgaged property, any independent contractor engaged by the Special Servicer, with respect to a defaulted whole loan, the depositor, Master Servicer, Special Servicer (or independent contractor engaged by such Special Servicer) or the trustee for the securitization of a Companion Loan and each holder of any related Companion Loan or mezzanine loan (but only with respect to the related mortgage loan), or any known affiliate of any such person (each, an “Interested Person”). If the highest offer is made by an Interested Person, the Trustee will determine (based upon the most recent appraisal or updated appraisal conducted in accordance with the terms of the Pooling and Servicing Agreement) whether the offer constitutes a fair price for the defaulted loan or REO propertyprovided that no offer from an Interested Person will constitute a fair price unless (A) it is the highest offer received and (B) if the offer is less than the applicable Purchase Price, at least two other offers are received from independent third parties and the Trustee may conclusively rely on the opinion of an independent appraiser or other independent expert retained by the Trustee in connection with making such determination. Neither the Trustee nor any of its affiliates may make an offer for or purchase any specially serviced mortgage loan or REO property.
If the Special Servicer does not receive any offers that are at least equal to the Purchase Price, the Special Servicer is not required to accept the highest offer and may accept a lower offer for a defaulted loan or REO property if the Special Servicer determines, in accordance with the servicing standard (and subject to the requirements of any related intercreditor agreement), that a rejection of such offer would be in the best interests of the Certificateholders and, with respect to any Serviced Whole Loan, the holder of the related Companion Loans, as a collective whole, as if such Certificateholders and, if applicable, the related Companion Loan Holder(s) constituted a single lender), so long as such lower offer was not made by the Special Servicer or any of its affiliates.If title to any mortgaged property is acquired by the trust fund, the Special Servicer will be required to sell such mortgaged property prior to the close of the third calendar year beginning after the year of acquisition, unless (a) the IRS grants or has not denied an extension of time to sell such mortgaged property or (b) the Special Servicer, Trustee and the Certificate Administrator receive an opinion of independent counsel to the effect that the holding of the property by the trust longer than the above-referenced three-year period will not result in the imposition of a tax on any REMIC of the trust fund or Grantor Trust or cause any REMIC of the trust fund to fail to qualify as a REMIC or the Grantor Trust to fail to qualify as a grantor trust.
The foregoing applies to mortgage loans serviced under the Pooling and Servicing Agreement. With respect to each Non-Serviced Whole Loan, if the special servicer under the applicable trust and servicing agreement or pooling and servicing agreement, as applicable, determines to |
THE INFORMATION IN THIS STRUCTURAL AND COLLATERAL TERM SHEET IS NOT COMPLETE AND MAY BE AMENDED PRIOR TO THE TIME OF SALE. THIS TERM SHEET IS NOT AN OFFER TO SELL THESE SECURITIES AND IT IS NOT A SOLICITATION OF AN OFFER TO BUY THESE SECURITIES IN ANY JURISDICTION WHERE THE OFFER OR SALE IS NOT PERMITTED.
| | 23 | |
| Structural and Collateral Term Sheet | BBCMS 2018-C2 | |
| Structural Overview | ||
| sell the related Companion Loan(s) as described above, then the applicable special servicer will be required to sell the related non-serviced mortgage loan, included in the BBCMS 2018-C2 Trust, and the related Companion Loan(s), as a single loan. In connection with any such sale, the then-applicable special servicer will be required to follow procedures substantially similar to those set forth above. | ||
| ■ Control Eligible Certificates: | Classes F, G, H-RR and J-RR. | |
| ■ Control Rights: | The Control Eligible Certificates will have certain control rights attached to them. The “Directing Certificateholder” will be with respect to each mortgage loan, the Controlling Class Certificateholder (or its representative) selected by more than 50% of the Controlling Class Certificateholders;provided,however, that (1) absent that selection, (2) until a Directing Certificateholder is so selected or (3) upon receipt of a notice from a majority of the Controlling Class Certificateholders that a Directing Certificateholder is no longer designated, the Controlling Class Certificateholder that owns the largest aggregate Certificate Balance of the Controlling Class (or its representative) will be the Directing Certificateholder;provided,however, that in the case of this clause (3), in the event no one holder owns the largest aggregate Certificate Balance of the Controlling Class, then there will be no Directing Certificateholder until appointed in accordance with the terms of the Pooling and Servicing Agreement. With respect to any mortgage loan (other than any non-serviced mortgage loan or any Excluded Loan), unless a Control Termination Event has occurred and is continuing, the Directing Certificateholder will be entitled to direct the Special Servicer to take, or refrain from taking, certain actions with respect to such mortgage loan. Furthermore, the Directing Certificateholder will also have the right to receive notice and provide consent with respect to certain material actions that the Master Servicer and the Special Servicer plan on taking with respect to a mortgage loan (other than any non-serviced mortgage loan or any Excluded Loan). With respect to any mortgage loan that has or may in the future have mezzanine debt, pursuant to the related intercreditor agreement, the related mezzanine lender may have certain consent rights with respect to certain modifications related to such mortgage loan.
A “Borrower Party”means a borrower, a mortgagor, a manager of a mortgaged property, an Accelerated Mezzanine Loan Lender, any other person controlling or controlled by or under common control with such borrower, mortgagor, manager or Accelerated Mezzanine Loan Lender, as applicable, or any other person owning, directly or indirectly, 25% or more of the beneficial interests in such borrower, mortgagor, manager or Accelerated Mezzanine Loan Lender, as applicable. For purposes of this definition, “control” when used with respect to any specified person means the power to direct the management and policies of such person, directly or indirectly, whether through the ownership of voting securities, by contract or otherwise and the terms “controlling” and “controlled” have meanings correlative to the foregoing.
An “Accelerated Mezzanine Loan Lender” means a mezzanine lender under a mezzanine loan that has been accelerated or as to which foreclosure or enforcement proceedings have been commenced against the equity collateral pledged to secure such mezzanine loan.
An “Excluded Loan” is a mortgage loan or Whole Loan with respect to which the Directing Certificateholder or the holder of the majority of the controlling class is a Borrower Party. As of the Closing Date, it is expected that there will be no Excluded Loans in this securitization.
With respect to the Serviced Whole Loans, direction, consent and consultation rights with respect to the related Whole Loan are subject to certain consultation rights of the holder of the related Pari Passu Companion Loans pursuant to the related intercreditor agreement.
With respect to any Non-Serviced Whole Loan, direction, consent and consultation rights with respect to the related Whole Loan will be exercised by the directing certificateholder or controlling class representative under the applicable trust and servicing agreement or pooling and servicing agreement, as applicable.
| |
| ■ Directing Certificateholder: | LNR Securities Holdings, LLC (or its affiliate) is expected to be appointed as the initial directing certificateholder with respect to all serviced mortgage loans (other than the Excluded Loans). | |
| ■ Controlling Class: | The “Controlling Class” will at any date of determination be the most subordinate Class of Control Eligible Certificates then outstanding that has an aggregate Certificate Balance, as |
THE INFORMATION IN THIS STRUCTURAL AND COLLATERAL TERM SHEET IS NOT COMPLETE AND MAY BE AMENDED PRIOR TO THE TIME OF SALE. THIS TERM SHEET IS NOT AN OFFER TO SELL THESE SECURITIES AND IT IS NOT A SOLICITATION OF AN OFFER TO BUY THESE SECURITIES IN ANY JURISDICTION WHERE THE OFFER OR SALE IS NOT PERMITTED.
| | 24 | |
| Structural and Collateral Term Sheet | BBCMS 2018-C2 | |
| Structural Overview | ||
| notionally reduced by any Cumulative Appraisal Reduction Amounts allocable to such Class, equal to no less than 25% of the initial Certificate Balance for such Class. Each holder of a certificate of the Controlling Class is referred to herein as a “Controlling Class Certificateholder”.
The Controlling Class as of the Closing Date will be the Class J-RR Certificates;provided that if at any time the principal balances of the certificates other than the Control Eligible Certificates have been reduced to zero as a result of the allocation of principal payments on the mortgage loans, then the Controlling Class will be the most subordinate Class among the Control Eligible Certificates that has an aggregate principal balance greater than zero without regard to any Appraisal Reduction Amounts. | ||
| ■ Control Termination Event: | A “Control Termination Event” will occur when the Class F Certificates have a Certificate Balance (taking into account the application of any Cumulative Appraisal Reduction Amounts to notionally reduce the Certificate Balance of such class) of less than 25% of the initial Certificate Balance of that class;provided, that a Control Termination Event will not be deemed to be continuing in the event the Certificate Balances of all Classes of Principal Balance Certificates other than the Control Eligible Certificates have been reduced to zero.
The “Cumulative Appraisal Reduction Amount” as of any date of determination, is equal to the sum of (i) with respect to any mortgage loan, all Appraisal Reduction Amounts then in effect, and (ii) with respect to any AB Modified Loan, any Collateral Deficiency Amount then in effect.
An “AB Modified Loan” means any corrected loan (1) that became a corrected loan (which includes for purposes of this definition any non-serviced mortgage loan that became a “corrected loan” (or any term substantially similar thereto) pursuant to the trust and servicing agreement or pooling and servicing agreement, as applicable, governing such non-serviced mortgage loan) due to a modification thereto that resulted in the creation of an A/B note structure (or similar structure) and as to which the new junior note(s) did not previously exist or the principal amount of the new junior note(s) was previously part of either an A note held by the issuing entity or the original unmodified mortgage loan and (2) as to which an Appraisal Reduction Amount is not in effect.
The “Collateral Deficiency Amount” means, with respect to any AB Modified Loan as of any date of determination, the excess of (i) the principal balance of such AB Modified Loan (taking into account the related junior note(s) and any pari passu notes included therein), over (ii) the sum of (in the case of a Whole Loan, solely to the extent allocable to the subject mortgage loan) (x) the most recent Appraised Value for the related mortgaged property or mortgaged properties, plus (y) solely to the extent not reflected or taken into account in such Appraised Value and to the extent on deposit with, or otherwise under the control of, the lender as of the date of such determination, any capital or additional collateral contributed by the related borrower at the time the mortgage loan became (and as part of the modification related to) such AB Modified Loan for the benefit of the related mortgaged property or mortgaged properties (provided, that in the case of a non-serviced mortgage loan, the amounts set forth in this clause (y) will be taken into account solely to the extent relevant information is received by the Master Servicer), plus (z) any other escrows or reserves (in addition to any amounts set forth in the immediately preceding clause (y)) held by the lender in respect of such AB Modified Loan as of the date of such determination.
Upon the occurrence and during the continuance of a Control Termination Event, the Controlling Class will no longer have any control rights. After the occurrence and during the continuance of a Control Termination Event, the Directing Certificateholder will relinquish its right to direct certain actions of the Special Servicer and will no longer have consent rights with respect to certain actions that the Master Servicer or the Special Servicer plan on taking with respect to a mortgage loan. Following the occurrence and during the continuance of a Control Termination Event, the Directing Certificateholder will retain consultation rights with the Special Servicer with respect to certain material actions that the Special Servicer plans on taking with respect to any mortgage loan other than an Excluded Loan. Such consultation rights will continue until the occurrence of a Consultation Termination Event. |
THE INFORMATION IN THIS STRUCTURAL AND COLLATERAL TERM SHEET IS NOT COMPLETE AND MAY BE AMENDED PRIOR TO THE TIME OF SALE. THIS TERM SHEET IS NOT AN OFFER TO SELL THESE SECURITIES AND IT IS NOT A SOLICITATION OF AN OFFER TO BUY THESE SECURITIES IN ANY JURISDICTION WHERE THE OFFER OR SALE IS NOT PERMITTED.
| | 25 | |
| Structural and Collateral Term Sheet | BBCMS 2018-C2 | |
| Structural Overview | ||
| ■ Consultation Termination Event: | A “Consultation Termination Event” will occur when there is no class of Control Eligible Certificates that has a then-outstanding Certificate Balance at least equal to 25% of the initial Certificate Balance of that class, in each case, without regard to the application of any Cumulative Appraisal Reduction Amounts;provided, that a Consultation Termination Event will not be deemed to be continuing in the event the Certificate Balances of all Classes of Principal Balance Certificates other than the Control Eligible Certificates have been reduced to zero.
Upon the occurrence of a Consultation Termination Event, there will be no Class of Certificates that will act as the Controlling Class and the Directing Certificateholder will have no rights under the Pooling and Servicing Agreement, other than those rights generally available to all Certificateholders.
| |
| ■ Appraised-Out Class: | A Class of Control Eligible Certificates that has been determined, as a result of Appraisal Reduction Amounts or Collateral Deficiency Amounts allocable to such Class, to no longer be the Controlling Class. | |
| ■ Remedies Available to Holders of an Appraised-Out Class: | Holders of the majority of any Class of Control Eligible Certificates that are determined at any date of determination to no longer be the Controlling Class as a result of Appraisal Reduction Amounts or Collateral Deficiency Amounts allocable to such class will have the right, at their sole expense, to require the Special Servicer to order a supplemental appraisal report from an MAI appraiser (selected by the Special Servicer) for any mortgage loan (or Serviced Whole Loan) that results in the Class becoming an Appraised-Out Class.
Upon receipt of that supplemental appraisal, the Special Servicer will be required to determine, in accordance with the Servicing Standard, whether, based on its assessment of the supplemental appraisal, any recalculation of the Appraisal Reduction Amount or Collateral Deficiency Amount is warranted, and if so warranted, the Master Servicer will be required to recalculate the Appraisal Reduction Amount or Collateral Deficiency Amount, as applicable, based on the supplemental appraisal and if required by such recalculation, the Appraised-Out Class will be reinstated as the Controlling Class. The holders of an Appraised-Out Class requesting a supplemental appraisal are not permitted to exercise any control or consent rights of the Controlling Class until such time, if any, as the Class is reinstated as the Controlling Class.
| |
| ■ Operating Advisor: | The Operating Advisor will initially be Park Bridge Lender Services LLC. The Operating Advisor will have certain review and consultation rights relating to the performance of the Special Servicer and with respect to its actions taken in connection with the resolution and/or liquidation of specially serviced loans. The Operating Advisor will generally be responsible for reviewing the Special Servicer’s operational practices with respect to the resolution and liquidation of specially serviced loans. In addition, after the occurrence and during the continuance of a Control Termination Event, the Operating Advisor will have certain consultation rights with respect to the specially serviced loans. The Operating Advisor will generally have no obligations or consultation rights under the Pooling and Servicing Agreement with respect to the Non-Serviced Whole Loans or any related REO Property.
However, Park Bridge Lender Services LLC is currently the operating advisor under the Benchmark 2018-B7, WFCM 2018-C47, CD 2018-CD7, Benchmark 2018-B6 and BANK 2018-BNK12 pooling and servicing agreement and, in each such capacity, has certain obligations and consultation rights with respect to the Benchmark 2018-B7, WFCM 2018-C47, CD 2018-CD7, Benchmark 2018-B6 and BANK 2018-BNK12 pooling and servicing agreements, respectively, that are substantially similar to those of the Operating Advisor under the Pooling and Servicing Agreement.
With respect to each mortgage loan or Serviced Whole Loan (in each case, other than a non-serviced mortgage loan, the Operating Advisor will be responsible for:
■ after the occurrence and during the continuance of a Control Termination Event, consulting (on a non-binding basis) with the Special Servicer with respect to each asset status report prepared by the Special Servicer and recommending proposed alternative courses of action.
■ after the occurrence and during the continuance of a Control Termination Event, preparing an annual report addressing the Operating Advisor’s overall findings and |
THE INFORMATION IN THIS STRUCTURAL AND COLLATERAL TERM SHEET IS NOT COMPLETE AND MAY BE AMENDED PRIOR TO THE TIME OF SALE. THIS TERM SHEET IS NOT AN OFFER TO SELL THESE SECURITIES AND IT IS NOT A SOLICITATION OF AN OFFER TO BUY THESE SECURITIES IN ANY JURISDICTION WHERE THE OFFER OR SALE IS NOT PERMITTED.
| | 26 | |
| Structural and Collateral Term Sheet | BBCMS 2018-C2 | |
| Structural Overview | ||
determinations and setting forth its assessment of the Special Servicer’s performance of its duties under the Pooling and Servicing Agreement on a platform-level basis with respect to the resolution and/or liquidation of specially serviced loans that the Special Servicer is responsible for servicing under the Pooling and Servicing Agreement. As used above, “platform-level basis” refers to the Special Servicer’s performance of its duties as they relate to the resolution and liquidation of specially serviced loans, taking into account the Special Servicer’s specific duties under the Pooling and Servicing Agreement as well as the extent to which those duties were performed in accordance with the servicing standard, with reasonable consideration to (and as limited by) the Operating Advisor’s review of any assessment of compliance report, attestation report, asset status report and other information delivered to the Operating Advisor by the Special Servicer with respect to the specially serviced loans (other than any communications between the Directing Certificateholder and the Special Servicer that would be privileged information). The annual report will be based on the Operating Advisor’s knowledge of the Special Servicer’s actions taken during the applicable calendar year with respect to the resolution or liquidation of specially serviced loans that the Special Servicer is responsible for servicing under the Pooling and Servicing Agreement, including knowledge obtained in connection with the Operating Advisor’s review of each asset status report prepared by the Special Servicer.
■ prior to the occurrence and continuance of a Control Termination Event, the Special Servicer will forward any Appraisal Reduction Amount and net present value calculations used in the Special Servicer’s determination of what course of action to take in connection with the workout or liquidation of a specially serviced loan to the Operating Advisor after such calculations have been finalized. The Operating Advisor will be required to review such calculations (with respect to Appraisal Reduction Amounts, if the Special Servicer has calculated such amounts) but will not opine on or take any affirmative action with respect to such Appraisal Reduction Amount calculations and/or net present value calculations.
■ after the occurrence and during the continuance of a Control Termination Event, recalculating and verifying, on a limited basis, the accuracy of mathematical calculations and the corresponding application of the non-discretionary portion of the applicable formulas utilized in connection with any Appraisal Reduction Amount (with respect to Appraisal Reduction Amounts, if the Special Servicer has calculated such amounts) or net present value calculations performed by the Special Servicer. In the event the Operating Advisor does not agree with the mathematical calculations or the application of the non-discretionary portion of the applicable formulas required to be utilized for such calculation, the Operating Advisor and the Special Servicer will consult with each other in order to resolve any disagreement. If there is any disagreement with respect to such calculations that the Operating Advisor and the Special Servicer are unable to resolve, the Certificate Administrator will determine which calculation is to apply.
In addition, the Operating Advisor is required to promptly review all information available to Privileged Persons on the Certificate Administrator’s website related to specially serviced loans and certain information available to Privileged Persons on the Certificate Administrator’s website related to mortgage loans included on the monthly CREFC®servicer watch list report, each final asset status report delivered to the Operating Advisor by the Special Servicer and each assessment of compliance report and attestation report prepared by the Special Servicer in order to maintain its familiarity with the mortgage loans and the performance of the Special Servicer under the Pooling and Servicing Agreement.
After the occurrence and during the continuance of a Control Termination Event, the Operating Advisor will also consult with the Special Servicer in connection with certain major decisions and propose possible alternative courses of action.
In addition, after the occurrence of a Consultation Termination Event, if the Operating Advisor determines that the Special Servicer is not performing its duties as required under the Pooling and Servicing Agreement or is otherwise not acting in accordance with the Servicing Standard, the Operating Advisor will have the right to recommend the replacement of the Special Servicer |
THE INFORMATION IN THIS STRUCTURAL AND COLLATERAL TERM SHEET IS NOT COMPLETE AND MAY BE AMENDED PRIOR TO THE TIME OF SALE. THIS TERM SHEET IS NOT AN OFFER TO SELL THESE SECURITIES AND IT IS NOT A SOLICITATION OF AN OFFER TO BUY THESE SECURITIES IN ANY JURISDICTION WHERE THE OFFER OR SALE IS NOT PERMITTED.
| | 27 | |
| Structural and Collateral Term Sheet | BBCMS 2018-C2 | |
| Structural Overview | ||
| and will submit its formal recommendation to the Trustee and the Certificate Administrator (along with its rationale, its proposed replacement special servicer and other relevant information justifying its recommendation).
The Operating Advisor’s recommendation to replace the Special Servicer must be confirmed by an affirmative vote of holders of Certificates evidencing at least a majority of the aggregate voting rights (taking into account the application of any Appraisal Reduction Amounts to notionally reduce the Certificate Balances of the Classes to which such Appraisal Reduction Amounts are allocable). In the event the holders of such Certificates elect to remove and replace the Special Servicer, the Certificate Administrator will be required to obtain a rating agency confirmation from each of the rating agencies at that time. | ||
| ■ Replacement of Operating Advisor: | The Operating Advisor may be terminated or removed under certain circumstances and a replacement operating advisor appointed as described in the Preliminary Prospectus.
Any replacement operating advisor (or the personnel responsible for supervising the obligations of the replacement operating advisor) must be an institution (A) that is a special servicer or operating advisor on a commercial mortgage-backed securities transaction rated by S&P, Fitch and DBRS (including, in the case of the Operating Advisor, this transaction) but has not been special servicer or operating advisor on a transaction for which any of S&P, Fitch and DBRS has qualified, downgraded or withdrawn its rating or ratings of, one or more classes of certificates for such transaction publicly citing servicing concerns with the operating advisor in its capacity as special servicer or operating advisor on such commercial mortgage-backed securities transaction as the sole or a material factor in such rating action; (B) that can and will make the representations and warranties of the operating advisor set forth in the Pooling and Servicing Agreement; (C) that is not (and is not affiliated with) the Depositor, the Trustee, the Certificate Administrator, the Master Servicer, the Special Servicer, a Mortgage Loan Seller, the Directing Certificateholder, or a depositor, a trustee, a certificate administrator, a master servicer or special servicer with respect to the securitization of a Companion Loan, or any of their respective affiliates; (D) that has not been paid by any Special Servicer or successor special servicer any fees, compensation or other remuneration (x) in respect of its obligations under the Pooling and Servicing Agreement or (y) for the appointment or recommendation for replacement of a successor special servicer to become the Special Servicer; and (E) that (x) has been regularly engaged in the business of analyzing and advising clients in commercial mortgage-backed securities matters and that has at least five years of experience in collateral analysis and loss projections and (y) has at least five years of experience in commercial real estate asset management and experience in the workout and management of distressed commercial real estate assets. Any Operating Advisor is prohibited from making an investment in any Class of Certificates in the Trust as described in the Preliminary Prospectus.
| |
| ■ Asset Representations Reviewer: | The Asset Representations Reviewer will be required to review certain delinquent mortgage loans after a specified delinquency threshold has been exceeded and notification from the Certificate Administrator that the required percentage of Certificateholders have voted to direct a review of such delinquent mortgage loans. An “Asset Review Trigger” will occur when either (1)mortgage loans with an aggregate outstanding principal balance of 25.0% or more of the aggregate outstanding principal balance of all of themortgage loans (including any REO Loans (or a portion of any REO Loan in the case of a Whole Loan)) held by the issuing entity as of the end of the applicable Collection Period are Delinquent Loans (2)(A) prior to and including the second anniversary of the Closing Date at least 10 mortgage loans are Delinquent Loans and the outstanding principal balance of such Delinquent Loans in the aggregate constitutes at least 15.0% of the aggregate outstanding principal balance of all of the mortgage loans (including any REO Loans (or a portion of any REO Loan in the case of a Whole Loan)) held by the issuing entity as of the end of the applicable Collection Period or (B) after the second anniversary of the Closing Date,, at least 15mortgage loans are Delinquent Loans and the outstanding principal balance of such Delinquent Loans in the aggregate constitutes at least 20.0% of the aggregate outstanding principal balance of all of themortgage loans (including any REO Loans (or a portion of any REO Loan in the case of a Whole Loan)) held by the issuing entity as of the end of the applicable Collection Period.
Following the determination that an Asset Review Trigger has occurred, the Certificate Administrator will include in the Form 10-D relating to the distribution period in which the Asset Review Trigger occurred a description of the events that caused the Asset Review Trigger to |
THE INFORMATION IN THIS STRUCTURAL AND COLLATERAL TERM SHEET IS NOT COMPLETE AND MAY BE AMENDED PRIOR TO THE TIME OF SALE. THIS TERM SHEET IS NOT AN OFFER TO SELL THESE SECURITIES AND IT IS NOT A SOLICITATION OF AN OFFER TO BUY THESE SECURITIES IN ANY JURISDICTION WHERE THE OFFER OR SALE IS NOT PERMITTED.
| | 28 | |
| Structural and Collateral Term Sheet | BBCMS 2018-C2 | |
| Structural Overview | ||
| occur. Once an Asset Review Trigger has occurred, Certificateholders evidencing not less than 5% of the voting rights may deliver to the Certificate Administrator a written direction requesting a vote on whether to commence an Asset Review within 90 days after the filing of the Form 10-D reporting the occurrence of the Asset Review Trigger (an “Asset Review Vote Election”). If directed by such Certificateholders, a vote of all Certificateholders will commence and an Asset Review will occur if more than a majority of Certificateholders voting (assuming Certificateholders representing a minimum of 5% of the voting rights respond) vote affirmatively within 150 days of the Asset Review Vote Election. If the vote does not come to pass within such 150-day period, then no further votes will occur unless and until (A) an additionalmortgage loan becomes a Delinquent Loan after the expiration of such 150 day period, (B) an additional Asset Review Trigger occurs or an Asset Review Trigger is otherwise in effect, (C) Certificateholders representing 5% of the voting rights again elect to cause a vote of all the Certificateholders and (D) such vote has occurred within 150 after the election described in clause (C) above. | ||
| ■ Replacement of the Asset Representations Reviewer: | The Asset Representations Reviewer may be terminated and replaced without cause. Upon (i) the written direction of Certificateholders evidencing not less than 25% of the voting rights (without regard to the application of any Appraisal Reduction Amounts) requesting a vote to terminate and replace the Asset Representations Reviewer with a proposed successor asset representations reviewer that is an Eligible Asset Representations Reviewer, and (ii) payment by such holders to the Certificate Administrator of the reasonable fees and expenses to be incurred by the Certificate Administrator in connection with administering such vote, the Certificate Administrator will promptly provide notice to all Certificateholders and the Asset Representations Reviewer of such request by posting such notice on its internet website, and by mailing to all Certificateholders and the Asset Representations Reviewer. Upon the written direction of Certificateholders evidencing at least 75% of a Certificateholder Quorum (without regard to the application of any Appraisal Reduction Amounts), the Trustee will terminate all of the rights and obligations of the Asset Representations Reviewer under the Pooling and Servicing Agreement by written notice to the Asset Representations Reviewer, and the proposed successor asset representations reviewer will be appointed. | |
| ■ Appointment and Replacement of Special Servicer: | The Directing Certificateholder will appoint the initial Special Servicer as of the Closing Date. Prior to the occurrence and continuance of a Control Termination Event, the Special Servicer may generally be replaced for cause at any time and without cause if either (i) LNR Partners, LLC or its affiliate is no longer the Special Servicer or (ii) LNR Securities Holdings LLC or its affiliate owns less than 25% of the certificate balance of the controlling classby the Directing Certificateholder.
If the Special Servicer obtains knowledge that it has become a Borrower Party with respect to any mortgage loan or Serviced Whole Loan (any such mortgage loan or Serviced Whole Loan, an “Excluded Special Servicer Loan”), the Special Servicer will be required to resign as Special Servicer of that Excluded Special Servicer Loan. Prior to the occurrence and continuance of a Control Termination Event, if the applicable Excluded Special Servicer Loan is not also an Excluded Loan, the Directing Certificateholder or the controlling class certificateholder on its behalf will be required to appoint (and may remove and replace with or without cause) a successor special servicer that is not a Borrower Party in accordance with the terms of the Pooling and Servicing Agreement (an “Excluded Special Servicer”) for the related Excluded Special Servicer Loan. After the occurrence and during the continuance of a Control Termination Event or if at any time the applicable Excluded Special Servicer Loan is also an Excluded Loan, the resigning Special Servicer will be required to use reasonable efforts to select the related Excluded Special Servicer.
Upon the occurrence and during the continuance of a Control Termination Event, the Directing Certificateholder will no longer have the right to replace the Special Servicer and such replacement will occur based on a vote of holders of all voting eligible Classes of Certificates as described below.
After the occurrence of a Consultation Termination Event, the Operating Advisor may also recommend the replacement of the Special Servicer as described above. |
THE INFORMATION IN THIS STRUCTURAL AND COLLATERAL TERM SHEET IS NOT COMPLETE AND MAY BE AMENDED PRIOR TO THE TIME OF SALE. THIS TERM SHEET IS NOT AN OFFER TO SELL THESE SECURITIES AND IT IS NOT A SOLICITATION OF AN OFFER TO BUY THESE SECURITIES IN ANY JURISDICTION WHERE THE OFFER OR SALE IS NOT PERMITTED.
| | 29 | |
| Structural and Collateral Term Sheet | BBCMS 2018-C2 | |
| Structural Overview | ||
| ■ Replacement of Special Servicer by Vote of Certificateholders: | After the occurrence and during the continuance of a Control Termination Event and upon (a) the written direction of holders of Certificates evidencing not less than 25% of the Voting Rights of all Classes of Certificates entitled to principal (taking into account the application of Appraisal Reduction Amounts to notionally reduce the Certificate Balances of Classes to which such Appraisal Reduction Amounts are allocable) requesting a vote to replace the Special Servicer with a replacement special servicer, (b) payment by such requesting holders to the Certificate Administrator of all reasonable fees and expenses to be incurred by the Certificate Administrator in connection with administering such vote and (c) delivery by such holders to the Certificate Administrator and the Trustee of written confirmations from each Rating Agency that the appointment of such replacement special servicer will not result in a downgrade, withdrawal or qualification of the Certificates (which confirmations will be obtained at the expense of such holders), the Certificate Administrator will be required to post such notice on its Internet website, and by mail conduct the solicitation of votes of all Certificates in such regard, which such vote must occur within 180 days of the posting of such notice. Upon the written direction of holders of at least 66-2/3% of a Certificateholder Quorum, the Trustee will immediately replace the Special Servicer with a qualified replacement special servicer designated by such holders of Certificates.
A “Certificateholder Quorum” means, in connection with any solicitation of votes in connection with the replacement of the Special Servicer or the Asset Representations Reviewer described above, the holders of Certificates evidencing at least 50% of the aggregate Voting Rights (taking into account the application of realized losses and, other than with respect to the termination of the Asset Representations Reviewer, the application of any Appraisal Reduction Amounts to notionally reduce the Certificate Balance of the Certificates) of all Classes of Certificates entitled to principal on an aggregate basis.
With respect to each of the Serviced Whole Loan, the holders of the related Pari Passu Companion Loans, under certain circumstances following a servicer termination event with respect to the Special Servicer, will be entitled to direct the Trustee (and the Trustee will be required) to terminate the Special Servicer solely with respect to such Serviced Whole Loan. A replacement special servicer will be selected by the Trustee or, prior to a Control Termination Event, by the Directing Certificateholder;provided,however, that any successor special servicer appointed to replace the Special Servicer with respect to such Whole Loan can generally not be the person (or its affiliate) that was terminated at the direction of the holder of the related Pari Passu Companion Loan.
With respect to any Non-Serviced Whole Loan, the BBCMS 2018-C2 trust as holder of the related mortgage loan has similar termination rights in the event of a servicer termination event with respect to the special servicer under the applicable trust and servicing agreement or pooling and servicing agreement, as applicable, as described above, which may be exercised by the Directing Certificateholder prior to the Control Termination Event. However, the successor special servicer will be selected pursuant to the applicable trust and servicing agreement or pooling and servicing agreement, as applicable, by the related directing holder prior to a control event under such trust and servicing agreement or pooling and servicing agreement, as applicable. The Master Servicer and Special Servicer are entitled to certain fees in connection with the servicing and administration of the mortgage loans as more fully described in “Pooling and Servicing Agreement—Servicing and Other Compensation and Payment of Expenses” in the Preliminary Prospectus.
| |
| ■ Dispute Resolution Provisions: | Each Mortgage Loan Seller will be subject to the dispute resolution provisions set forth in the Pooling and Servicing Agreement to the extent those provisions are triggered with respect to any mortgage loan sold to the Depositor by a Mortgage Loan Seller and such Mortgage Loan Seller will be obligated under the related mortgage loan purchase agreement to comply with all applicable provisions and to take part in any mediation or arbitration proceedings that may result.
Generally, in the event that a request to repurchase a mortgage loan (a “Repurchase Request”) is not “Resolved” (as defined below) within 180 days after the related Mortgage Loan Seller receives such Repurchase Request (a “Resolution Failure”), then the Enforcing Servicer (as defined below) will be required to send a notice to the “Initial Requesting Certificateholder” (if any) indicating the Enforcing Servicer’s intended course of action with |
THE INFORMATION IN THIS STRUCTURAL AND COLLATERAL TERM SHEET IS NOT COMPLETE AND MAY BE AMENDED PRIOR TO THE TIME OF SALE. THIS TERM SHEET IS NOT AN OFFER TO SELL THESE SECURITIES AND IT IS NOT A SOLICITATION OF AN OFFER TO BUY THESE SECURITIES IN ANY JURISDICTION WHERE THE OFFER OR SALE IS NOT PERMITTED.
| | 30 | |
| Structural and Collateral Term Sheet | BBCMS 2018-C2 | |
| Structural Overview | ||
respect to the Repurchase Request. If (a) the Enforcing Servicer’s intended course of action with respect to the Repurchase Request does not involve pursuing further action to exercise rights against the related Mortgage Loan Seller with respect to the Repurchase Request and the Initial Requesting Certificateholder, if any, or any other Certificateholder or Certificate Owner wishes to exercise its right to refer the matter to mediation (including nonbinding arbitration) or arbitration, or (b) the Enforcing Servicer’s intended course of action is to pursue further action to exercise rights against the related Mortgage Loan Seller with respect to the Repurchase Request but the Initial Requesting Certificateholder, if any, or any other Certificateholder or Certificate Owner does not agree with the dispute resolution method selected by the Enforcing Servicer, then the Initial Requesting Certificateholder, if any, or such other Certificateholder or Certificate Owner may deliver a written notice to the Enforcing Servicer indicating its intent to exercise its right to refer the matter to either mediation or arbitration.
The Enforcing Servicer will be required to consult with any Certificateholder or Certificate Owner that delivers a notice of its intent to exercise its dispute resolution rights (a “Requesting Certificateholder”) so that a Requesting Certificateholder may consider the views of the Enforcing Servicer as to the claims underlying the Repurchase Request and possible dispute resolution methods. If a Requesting Certificateholder elects to exercise its right to refer the matter to either mediation or arbitration, then it will become the party responsible for enforcing the Repurchase Request and must promptly submit the matter to mediation (including nonbinding arbitration) or arbitration. Failure to make an election to exercise that right or failure to begin the elected form of proceedings within the certain timeframe set forth in the Pooling and Servicing Agreement will generally waive the Certificateholders’ or Certificate Owners’ rights with respect to the related Repurchase Request.
The “Enforcing Servicer” will be (a) with respect to a specially serviced loan, the Special Servicer, and (b) with respect to a non-specially serviced loan, (i) in the case of a Repurchase Request made by the Special Servicer, the Directing Certificateholder or a Controlling Class Certificateholder, the Master Servicer, and (ii) in the case of a Repurchase Request made by any person other than the Special Servicer, the Directing Certificateholder or a Controlling Class Certificateholder, (A) prior to a Resolution Failure relating to such non-specially serviced loan, the Master Servicer, and (B) from and after a Resolution Failure relating to such non-specially serviced Loan, the Special Servicer.
“Resolved” means, with respect to a Repurchase Request, (i) that the related Material Defect has been cured, (ii) the related mortgage loan has been repurchased in accordance with the related mortgage loan purchase agreement, (iii) a mortgage loan has been substituted for the related mortgage loan in accordance with the related mortgage loan purchase agreement, (iv) the applicable Mortgage Loan Seller has made a Loss of Value Payment, (v) a contractually binding agreement is entered into between the Enforcing Servicer, on behalf of the issuing entity, and the related Mortgage Loan Seller that settles the related Mortgage Loan Seller’s obligations under the related mortgage loan purchase agreement, or (vi) the related mortgage loan is no longer property of the issuing entity as a result of a sale or other disposition in accordance with the Pooling and Servicing Agreement. | ||
| ■ Investor Communications | The Certificate Administrator is required to include on any Form 10–D any request received from a Certificateholder to communicate with other Certificateholders related to Certificateholders exercising their rights under the terms of the Pooling and Servicing Agreement. Any Certificateholder wishing to communicate with other Certificateholders regarding the exercise of its rights under the terms of the Pooling and Servicing Agreement should deliver a written request signed by an authorized representative of the requesting investor to the Certificate Administrator at the address below:
9062 Old Annapolis Road Columbia, Maryland 21045 Attention: Corporate Trust Administration Group – BBCMS Mortgage Trust 2018-C2 With a copy to: trustadministrationgroup@wellsfargo.com
|
THE INFORMATION IN THIS STRUCTURAL AND COLLATERAL TERM SHEET IS NOT COMPLETE AND MAY BE AMENDED PRIOR TO THE TIME OF SALE. THIS TERM SHEET IS NOT AN OFFER TO SELL THESE SECURITIES AND IT IS NOT A SOLICITATION OF AN OFFER TO BUY THESE SECURITIES IN ANY JURISDICTION WHERE THE OFFER OR SALE IS NOT PERMITTED.
| | 31 | |
| Structural and Collateral Term Sheet | BBCMS 2018-C2 | |
| Structural Overview | ||
| ■ Master Servicer and Special Servicer Compensation: | The Master Servicer is entitled to a fee (the “Servicing Fee”) payable monthly from interest received in respect of each mortgage loan, any related REO loan and any related Serviced Companion Loan that will accrue at the related servicing fee rate described in the Preliminary Prospectus. The Special Servicer is also entitled to a fee (the “Special Servicing Fee”) with respect to each specially serviced loan and REO loan (other than a non-serviced mortgage loan) at the special servicing fee rate described in the Preliminary Prospectus.
In addition to the Servicing Fee, Special Servicing Fee and certain other fees described below, the Master Servicer and Special Servicer are entitled to retain and share certain additional servicing compensation, including assumption application fees, assumption fees, defeasance fees and certain Excess Modification Fees and consent fees with respect to the mortgage loans. The Special Servicer may also be entitled to either a Workout Fee or Liquidation Fee, but not both, from recoveries in respect of any particular mortgage loan.
An “Excess Modification Fee” with respect to any mortgage loan (other than the non-serviced mortgage loans) or Serviced Whole Loan is the sum of (A) the excess, if any, of (i) any and all Modification Fees with respect to a mortgage loan or Serviced Whole Loan, as applicable, over (ii) all unpaid or unreimbursed additional expenses described in the Preliminary Prospectus (excluding Special Servicing Fees, Workout Fees and Liquidation Fees) outstanding with respect to the related mortgage loan or Serviced Whole Loan, as applicable, and reimbursed from such Modification Fees and (B) expenses previously paid or reimbursed from Modification Fees as described in clause (A), which expenses have subsequently been recovered from the related borrower or otherwise.
With respect to the Master Servicer and Special Servicer, the Excess Modification Fees collected and earned by such servicer from the related borrower (taken in the aggregate with any other Excess Modification Fees collected and earned by such servicer from the related borrower within the prior 12 months of the collection of the current Excess Modification Fees) will be subject to a cap of 1.00% of the outstanding principal balance of the related mortgage loan or Serviced Whole Loan, as applicable, on the closing date of the related modification, extension, waiver or amendment. A “Modification Fee” with respect to any mortgage loan (other than the non-serviced mortgage loans) or Serviced Companion Loan is generally any fee with respect to a modification, extension, waiver or amendment of any mortgage loan and/or related Serviced Companion Loan.
A “Workout Fee” will generally be payable with respect to each corrected loan and will be calculated at a rate of 1.00% of payments of principal and interest on the respective mortgage loan for so long as it remains a corrected loan, subject to a maximum of $1,000,000 in the aggregate with respect to any particular corrected loan. After receipt by the Special Servicer of Workout Fees with respect to a corrected loan in an amount equal to $25,000, any Workout Fees in excess of such amount will be reduced by the Excess Modification Fee Amount;provided that in the event the Workout Fee, collected over the course of such workout calculated at the Workout Fee Rate is less than $25,000, then the Special Servicer will be entitled to an amount from the final payment on the related corrected loan (including any related Serviced Companion Loan) that would result in the total Workout Fees payable to the Special Servicer in respect of that corrected loan (including any related Serviced Companion Loan) to be $25,000.
The “Excess Modification Fee Amount” for any corrected loan is an amount equal to any Excess Modification Fees paid by or on behalf of the related borrower with respect to the related mortgage loan (including the related Serviced Companion Loan) and received and retained by the Master Servicer or the Special Servicer, as applicable, as additional servicing compensation within the prior 12 months of the related modification, waiver, extension or amendment resulting in the mortgage loan or REO loan being a corrected loan, but only to the extent those fees have not previously been deducted from a Workout Fee or Liquidation Fee.
A “Liquidation Fee” will generally be payable with respect to each specially serviced loan or REO property (except with respect to any non-serviced mortgage loan) as to which the Special Servicer obtains a full or partial recovery of the related asset). The Liquidation Fee for each specially serviced mortgage loan will be payable at a rate of 1.00% of the liquidation proceeds (exclusive of default interest) subject to a maximum of $1,000,000;provided,however, that no Liquidation Fee will be less than $25,000. |
THE INFORMATION IN THIS STRUCTURAL AND COLLATERAL TERM SHEET IS NOT COMPLETE AND MAY BE AMENDED PRIOR TO THE TIME OF SALE. THIS TERM SHEET IS NOT AN OFFER TO SELL THESE SECURITIES AND IT IS NOT A SOLICITATION OF AN OFFER TO BUY THESE SECURITIES IN ANY JURISDICTION WHERE THE OFFER OR SALE IS NOT PERMITTED.
| | 32 | |
| Structural and Collateral Term Sheet | BBCMS 2018-C2 | |
| Structural Overview | ||
The Liquidation Fees will be reduced by the amount of any Excess Modification Fees received by the Special Servicer with respect to the related mortgage loan (including a Serviced Companion Loan) or REO property as additional compensation within the prior 12 months, but only to the extent those fees have not previously been deducted from a Workout Fee or Liquidation Fee.
Similar fees to those described above will be payable to the applicable special servicer for the Non-Serviced Whole Loans under the related trust and servicing agreement or pooling and servicing agreement, as applicable.
Subject to certain limited exceptions, in connection with its duties under the Pooling and Servicing Agreement, the Special Servicer and its affiliates are prohibited from receiving or retaining any compensation (other than compensation specifically provided for under the Pooling and Servicing Agreement) from anyone in connection with the disposition, workout or foreclosure of any mortgage loan, the management or disposition of any REO property, or the performance of any other special servicing duties under the Pooling and Servicing Agreement. In the event the Special Servicer does receive any such compensation, it will be required to disclose those fees to the Certificate Administrator who will include it as part of the statement to Certificateholders.
In addition, no liquidation fee will be payable to the Special Servicer if a mortgage loan or Serviced Whole Loan becomes a specially serviced loan only because of a maturity default and the related liquidation proceeds are received within 90 days following the related maturity date as a result of the related mortgage loan or Serviced Whole Loan being refinanced or otherwise repaid in full.
| ||
| ■ Deal Website: | The Certificate Administrator will maintain a deal website to which certain persons will have access to certain information including, but not limited to the following, which will be posted: ■ special notices, ■ summaries of any final asset status reports, ■ appraisals in connection with Appraisal Reductions plus any second appraisals ordered, ■ an “Investor Q&A Forum,” ■ a voluntary investor registry, and ■ SEC EDGAR filings. |
THE INFORMATION IN THIS STRUCTURAL AND COLLATERAL TERM SHEET IS NOT COMPLETE AND MAY BE AMENDED PRIOR TO THE TIME OF SALE. THIS TERM SHEET IS NOT AN OFFER TO SELL THESE SECURITIES AND IT IS NOT A SOLICITATION OF AN OFFER TO BUY THESE SECURITIES IN ANY JURISDICTION WHERE THE OFFER OR SALE IS NOT PERMITTED.
| | 33 | |
| Structural and Collateral Term Sheet | BBCMS 2018-C2 |
| Dream Inn |
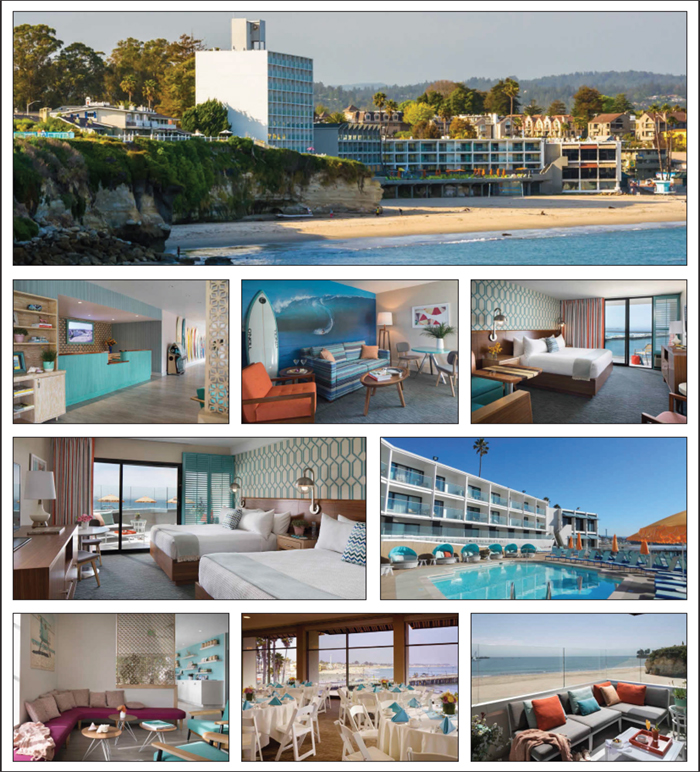
THE INFORMATION IN THIS STRUCTURAL AND COLLATERAL TERM SHEET IS NOT COMPLETE AND MAY BE AMENDED PRIOR TO THE TIME OF SALE. THIS TERM SHEET IS NOT AN OFFER TO SELL THESE SECURITIES AND IT IS NOT A SOLICITATION OF AN OFFER TO BUY THESE SECURITIES IN ANY JURISDICTION WHERE THE OFFER OR SALE IS NOT PERMITTED.
| | 34 | |
| Structural and Collateral Term Sheet | BBCMS 2018-C2 |
| Dream Inn |
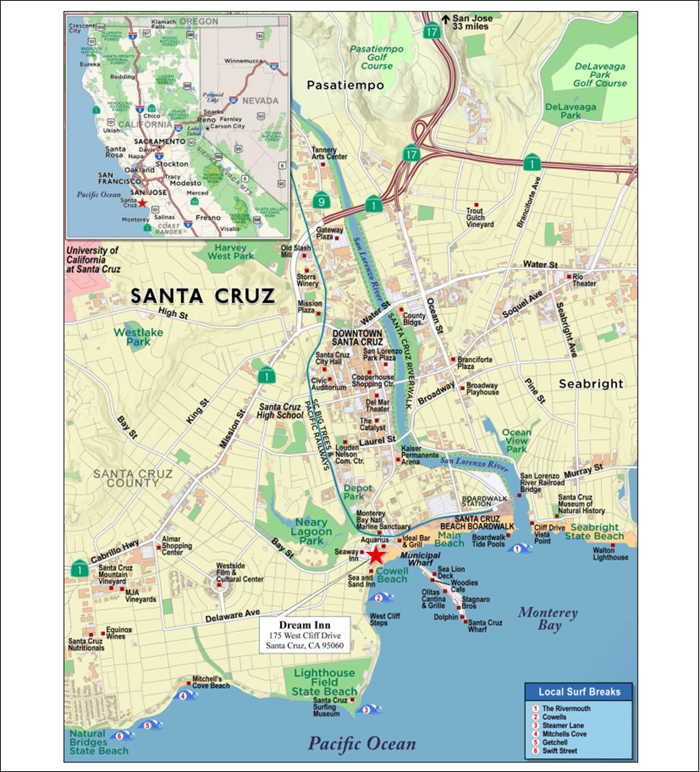
THE INFORMATION IN THIS STRUCTURAL AND COLLATERAL TERM SHEET IS NOT COMPLETE AND MAY BE AMENDED PRIOR TO THE TIME OF SALE. THIS TERM SHEET IS NOT AN OFFER TO SELL THESE SECURITIES AND IT IS NOT A SOLICITATION OF AN OFFER TO BUY THESE SECURITIES IN ANY JURISDICTION WHERE THE OFFER OR SALE IS NOT PERMITTED.
| | 35 | |
| Structural and Collateral Term Sheet | BBCMS 2018-C2 |
| Dream Inn |
| Mortgage Loan Information | Property Information | |||
| Mortgage Loan Seller: | KeyBank | Single Asset / Portfolio: | Single Asset | |
| Original Principal Balance: | $55,000,000 | Title: | Fee | |
| Cut-off Date Principal Balance: | $55,000,000 | Property Type–Subtype: | Hotel – Full Service | |
| % of IPB: | 6.2% | Net Rentable Area (Rooms): | 165 | |
| Loan Purpose: | Refinance | Location: | Santa Cruz, CA | |
| Borrower: | S.C. Beach Holdco, LLC | Year Built / Renovated: | 1962, 1972, 2009 / 2017 | |
| Sponsor: | Ensemble Investments, LLC | Occupancy / ADR / RevPAR: | 83.3% / $307.76 / $256.24 | |
| Interest Rate: | 5.05000% | Occupancy / ADR / RevPAR Date: | 9/30/2018 | |
| Note Date: | 11/13/2018 | 4th Most Recent NOI (As of): | $6,898,238 (12/31/2015) | |
| Maturity Date: | 12/1/2028 | 3rd Most Recent NOI (As of)(1): | $5,532,918 (12/31/2016) | |
| Interest-only Period: | 120 months | 2nd Most Recent NOI (As of)(1): | $5,685,619 (12/31/2017) | |
| Original Term: | 120 months | Most Recent NOI (As of): | $7,603,966 (TTM 9/30/2018) | |
| Original Amortization Term: | None | UW Occupancy / ADR / RevPAR: | 83.3% / $307.76 / $256.24 | |
| Amortization Type: | Interest Only | UW Revenues: | $22,826,143 | |
| Call Protection: | L(24),Def(93),O(3) | UW Expenses: | $15,514,540 | |
| Lockbox / Cash Management: | Hard / Springing | UW NOI: | $7,311,603 | |
| Additional Debt: | N/A | UW NCF: | $6,694,311 | |
| Additional Debt Balance: | N/A | Appraised Value / Per Room: | $100,000,000 / $606,061 | |
| Additional Debt Type: | N/A | Appraisal Date: | 10/2/2018 | |
| Escrows and Reserves(2) | Financial Information | ||||||||
| Initial | Monthly | Initial Cap | Cut-off Date Loan / Room: | $333,333 | |||||
| Taxes: | $149,302 | $47,453 | N/A | Maturity Date Loan / Room: | $333,333 | ||||
| Insurance: | $0 | Springing | N/A | Cut-off Date LTV: | 55.0% | ||||
| FF&E Reserves: | $710,000 | 4% of Gross Room Revenues | N/A | Maturity Date LTV: | 55.0% | ||||
| TI/LC: | $0 | $0 | N/A | UW NCF DSCR: | 2.38x | ||||
| Other: | $290,000 | Springing | $290,000 | UW NOI Debt Yield: | 13.3% | ||||
| Sources and Uses | |||||||||
| Sources | Proceeds | % of Total | Uses | Proceeds | % of Total | ||||
| Mortgage Loan | $55,000,000 | 100.0% | Payoff Existing Debt | $43,609,097 | 79.3% | ||||
| Return of Equity | 9,769,426 | 17.8 | |||||||
| Upfront Reserves | 1,149,302 | 2.1 | |||||||
| Closing Costs | 472,174 | 0.9 | |||||||
| Total Sources | $55,000,000 | 100.0% | Total Uses | $55,000,000 | 100.0% | ||||
| (1) | 3rdMost Recent NOI and 2nd Most Recent NOI were impacted by a full room and common area renovation conducted from November 1, 2016 through March 29, 2017 which resulted in a total reported loss of 9,798 room nights and during which room rate concessions were provided to guests. |
| (2) | For a full description of Escrows and Reserves, please refer to “Escrows and Reserves” below. |
THE INFORMATION IN THIS STRUCTURAL AND COLLATERAL TERM SHEET IS NOT COMPLETE AND MAY BE AMENDED PRIOR TO THE TIME OF SALE. THIS TERM SHEET IS NOT AN OFFER TO SELL THESE SECURITIES AND IT IS NOT A SOLICITATION OF AN OFFER TO BUY THESE SECURITIES IN ANY JURISDICTION WHERE THE OFFER OR SALE IS NOT PERMITTED.
| | 36 | |
| Structural and Collateral Term Sheet | BBCMS 2018-C2 |
| Dream Inn |
The Loan. The Dream Inn mortgage loan has an outstanding principal balance as of the Cut-off Date of $55.0 million and is secured by a first mortgage lien on the borrower’s fee interest in a full service, beach-front hotel located in Santa Cruz, California (the “Dream Inn Mortgage Loan”). The Dream Inn Mortgage Loan has a 10-year, interest-only term.
The Property. The Dream Inn property is a 165-room, four-star, full-service, beach-front hotel located in Santa Cruz, California (the “Dream Inn Property”). The Dream Inn Property is accessed off of West Cliff Drive and sits on Cowell Beach. It is the only beach-front hotel in Santa Cruz. First built in 1962 on the site of Jack O’Neill’s first surf shop, the Dream Inn Property originally consisted of a 65-room, three to four-story low-rise but was expanded in 1972 with a 10-story tower which added 100 rooms for a total of 165 rooms, all with ocean views. The Dream Inn Property is a short walk from the Santa Cruz Municipal Wharf and the Santa Cruz Beach Boardwalk. The Dream Inn Property has 77 king rooms, 72 double-queen rooms and 16 suites. Guest room amenities include floor-to-ceiling windows with sliding glass door access to private balconies or patios with views of Monterey Bay, 42-inch flat-screen TVs, complimentary WiFi, mini-refrigerators, Keurig coffee makers with premium coffee, iPod docking stations, safes, walk-in showers, and bedside best-selling books which may be kept as souvenirs. Suite rooms offer a separate living room with queen-sized sleeper sofas. Amenities at the Dream Inn Property include an ocean-front heated outdoor pool with jacuzzi/spa, firepits and direct access to Cowell Beach, Shorebreak Drink + Dine, a poolside bar serving cocktails and beach fare, Aquarius, a second-story restaurant with ocean views, the Jack O’Neill lounge, 3,247 square feet of meeting/event space, a lobby coffee cart, surfboard, bike and luggage storage, concierge services, room service, laundry/dry cleaning services and valet and self-parking. The Dream Inn Property offers 198 surface parking spaces, resulting in a parking ratio of approximately 1.2 spaces per room.
The Dream Inn Property was purchased by the loan sponsors in 2006 for a reported price of $40.0 million. From 2008 to 2009, the Dream Inn Property underwent a full-room renovation and the additional development of an attached building for meeting and amenity space for which the sponsors report a total investment for the period of approximately $16.6 million ($100,501 per room). The most recent renovations at the Dream Inn Property conducted during 2016 and 2017 include a second, full-room renovation, remodeling of common areas including the lobby, pool and deck space for which the sponsors report a total investment during the period of approximately $9.6 million ($58,280 per room). The most recent renovations include a new porte cochere, upgraded flooring for exterior corridors, new paint on doors and a complete re-landscaping. Common area improvements include an expansion of the lobby space with a larger sitting area and room for a café kiosk. The pool area was improved with renovated bathrooms, an expanded jacuzzi/spa, and a refresh of the pool-side bar. Interior corridors received new carpet, wall covering, doors, and locksets. Elevator walls were resurfaced with graphic prints of the beach and surf. Individual rooms received new flooring and a complete FF&E replacement and upgrade. Including the purchase price, capital improvements since acquisition, and loan closing costs, the sponsor’s total cost basis equals approximately $70.6 million ($428,143 per room).
According to data from a third-party research report, over the trailing 12-month period ending in August 2018 the Dream Inn Property generated 83.7% of its room revenue from transient demand, which includes both commercial and leisure transient business and 16.3% from meeting and group demand. Since 2014 the Dream Inn Property has outperformed its competitive set in occupancy, ADR and RevPAR posting average annual penetration figures of 114.2%, 122.2% and 139.6%, respectively.
Environmental.According to a Phase I environmental assessment dated October 5, 2018, there was no evidence of any recognized environmental conditions at the Dream Inn Property.
The Market. The Dream Inn Property is located in Santa Cruz, Santa Cruz County, California. Santa Cruz is on the California coast on the north end of Monterey Bay approximately 75 miles south of San Francisco and approximately 45 miles north of Monterey, California. The nearest airport served by commercial airlines is the San Jose International Airport which is 35 miles north of the Dream Inn Property. Other area commercial airports are the San Francisco International Airport, the Monterey Regional Airport and the Oakland International Airport. Access to the Dream Inn Property is provided by Highways 1, 9 and 17. Santa Cruz receives between 3 to 4 million visitors per year and offers an annual average of 262 days of sun. Santa Cruz offers visitors beaches, marine life, parks and open spaces, the nearby redwood forests in the Santa Cruz mountains, the University of California – Santa Cruz, a local art scene, wine tasting, microbreweries, outdoor recreation on the land and water and agri-tourism. Nearby attractions to the Dream Inn Property include of Cowell Beach which provides access to the popular surf spot, Steamer Lane, the Municipal Wharf, the Santa Cruz Boardwalk, one of only two remaining seaside amusement parks on the West Coast and West Cliff Park, a 2.5 mile multi-use pathway winding from the Dream Inn Property down the coast line to Natural Bridges State Park.
The appraisal noted only one planned hotel representing potential future competition to the Dream Inn Property, La Bahia Hotel. The La Bahia Hotel would be a result of the redevelopment of the existing La Bahia Apartment property at 215 Beach Street which is currently shuttered. The original plan approved in 2009 was abandoned after challenges from the Historical and Coastal Commissions. The latest plan was approved by the City of Santa Cruz in 2014 but no work has been completed on the project.
THE INFORMATION IN THIS STRUCTURAL AND COLLATERAL TERM SHEET IS NOT COMPLETE AND MAY BE AMENDED PRIOR TO THE TIME OF SALE. THIS TERM SHEET IS NOT AN OFFER TO SELL THESE SECURITIES AND IT IS NOT A SOLICITATION OF AN OFFER TO BUY THESE SECURITIES IN ANY JURISDICTION WHERE THE OFFER OR SALE IS NOT PERMITTED.
| | 37 | |
| Structural and Collateral Term Sheet | BBCMS 2018-C2 |
| Dream Inn |
| Historical Occupancy, ADR, RevPAR | |||||||||
| Competitive Set(1) | Dream Inn(2) | Penetration Factor(3) | |||||||
| Year | Occupancy | ADR | RevPAR | Occupancy | ADR | RevPAR | Occupancy | ADR | RevPAR |
| 2015 | 65.0% | $230.43 | $149.80 | 77.9% | $282.79 | $220.35 | 119.8% | 122.7% | 147.1% |
| 2016 | 66.7% | $236.50 | $157.82 | 71.5% | $285.30 | $204.11 | 107.1% | 120.6% | 129.3% |
| 2017 | 70.1% | $239.24 | $167.66 | 74.0% | $294.80 | $218.12 | 105.6% | 123.2% | 130.1% |
| TTM(4) | 70.2% | $244.80 | $171.78 | 83.1% | $306.67 | $254.95 | 118.5% | 125.3% | 148.4% |
| (1) | Data provided by a third-party research report. The competitive set contains the following properties: Joie De Vivre Monterey Tides, Autograph Collection Hotel Paradox, Chaminade Resort & Spa, Seascape Resort, Hilton Santa Cruz Scotts Valley and InterContinental The Clement Monterey. |
| (2) | Based on operating statements provided by the borrower, with the exception of TTM, which is based on data provided by a third-party research report. |
| (3) | Penetration Factor is calculated based on data provided by a third-party research report for the competitive set and the operating statements provided by the borrower for the Dream Inn Property, with the exception of TTM, which is based on data provided by a third-party research report. |
| (4) | TTM represents the trailing 12-month period ending on August 31, 2018. |
| Competitive Hotels(1) | ||||||
| Property | Rooms | Year Opened | Location | Distance from Subject (Miles) | Meeting Space (SF) | Beach Front (Y/N) |
| Dream Inn | 165 | 1963 | Santa Cruz, CA | NAP | 3,247 | Yes |
| Joie De Vivre Monterey Tides | 196 | 1969 | Monterey, CA | 40.6 | 9,092 | Yes |
| Autograph Collection Hotel Paradox | 170 | 1969 | Santa Cruz, CA | 1.3 | 5,100 | No |
| Chaminade Resort and Spa | 156 | 1929 | Santa Cruz, CA | 4.5 | 12,030 | No |
| Seascape Resort | 228 | 1993 | Aptos, CA | 12.9 | 14,296 | No |
| Hilton Santa Cruz Scotts Valley | 178 | 1999 | Santa Cruz, CA | 6.3 | 6,111 | No |
| InterContinental The Clement Monterey | 208 | 2008 | Monterey, CA | 44.1 | 8,728 | No |
| Total(2) | 1,136 | |||||
| (1) | Based on the appraisal. |
| (2) | Excludes the Dream Inn Property. |
THE INFORMATION IN THIS STRUCTURAL AND COLLATERAL TERM SHEET IS NOT COMPLETE AND MAY BE AMENDED PRIOR TO THE TIME OF SALE. THIS TERM SHEET IS NOT AN OFFER TO SELL THESE SECURITIES AND IT IS NOT A SOLICITATION OF AN OFFER TO BUY THESE SECURITIES IN ANY JURISDICTION WHERE THE OFFER OR SALE IS NOT PERMITTED.
| | 38 | |
| Structural and Collateral Term Sheet | BBCMS 2018-C2 |
| Dream Inn |
| Operating History and Underwritten Net Cash Flow | |||||||
| 2015 | 2016(1) | 2017(1) | TTM(2) | Underwritten | Per Room(3) | % of Total Revenue(4) | |
| Occupancy | 77.9% | 71.5% | 74.0% | 83.3% | 83.3% | ||
| ADR | $282.79 | $285.30 | $294.80 | $307.76 | $307.76 | ||
| RevPAR | $220.35 | $204.11 | $218.12 | $256.24 | $256.24 | ||
| Room Revenue | $13,270,368 | $12,325,943 | $13,136,309 | $15,432,287 | $15,432,287 | $93,529 | 67.6% |
| Food & Beverage Revenue | 4,734,067 | 4,689,568 | 5,138,793 | 6,206,144 | 6,206,144 | 37,613 | 27.2 |
| Other Departmental Revenue | 819,221 | 798,316 | 916,424 | 1,187,712 | 1,187,712 | 7,198 | 5.2 |
| Total Revenue | $18,823,656 | $17,813,827 | $19,191,526 | $22,826,143 | $22,826,143 | $138,340 | 100.0% |
| Room Expense | $3,438,756 | $3,565,262 | $3,810,295 | $4,007,643 | $4,007,643 | $24,289 | 17.6% |
| Food & Beverage Expense | 3,888,082 | 3,815,095 | 4,275,469 | 5,071,952 | 5,071,952 | 30,739 | 22.2 |
| Other Departmental Expenses | 392,172 | 453,606 | 494,510 | 653,743 | 653,743 | 3,962 | 2.9 |
| Departmental Expenses | $7,719,010 | $7,833,963 | $8,580,274 | $9,733,338 | $9,733,338 | $58,990 | 42.6% |
| Departmental Profit | $11,104,646 | $9,979,864 | $10,611,252 | $13,092,805 | $13,092,805 | $79,350 | 57.4% |
| Operating Expenses | $2,783,329 | $3,058,046 | $3,622,775 | $4,020,249 | $4,207,516 | $25,500 | 18.4% |
| Gross Operating Profit | $8,321,317 | $6,921,818 | $6,988,477 | $9,072,556 | $8,885,289 | $53,850 | 38.9% |
| Management Fees | $703,699 | $669,387 | $584,728 | $712,392 | $712,392 | $4,318 | 3.1% |
| Property Taxes | 491,882 | 500,690 | 509,517 | 532,687 | 615,603 | 3,731 | 2.7 |
| Property Insurance | 227,498 | 218,823 | 208,613 | 223,511 | 245,691 | 1,489 | 1.1 |
| Total Other Expenses | $1,423,079 | $1,388,900 | $1,302,858 | $1,468,590 | $1,573,686 | $9,537 | 6.9% |
| Net Operating Income | $6,898,238 | $5,532,918 | $5,685,619 | $7,603,966 | $7,311,603 | $44,313 | 32.0% |
| FF&E(5) | 744,281 | 712,554 | 383,831 | 825,927 | 617,291 | 3,741 | 2.7 |
| Net Cash Flow | $6,153,957 | $4,820,364 | $5,301,788 | $6,778,039 | $6,694,311 | $40,572 | 29.3% |
| (1) | Operating results for the 2016 and 2017 periods were impacted by a full room and common area renovation conducted from November 1, 2016 through March 29, 2017 which resulted in a total reported loss of 9,798 room nights and during which room rate concessions were provided to guests. |
| (2) | TTM reflects the trailing 12-month period ending September 30, 2018. |
| (3) | Per Room values are based on 165 guest rooms. |
| (4) | % of Total Revenue for Room Expense, Food & Beverage Expense and Other Departmental Expenses are based on their corresponding revenue line item. |
| (5) | Underwritten FF&E is calculated as 4% of Underwritten Room Revenue. |
The Borrower. The borrowing entity for the Dream Inn Mortgage Loan is S.C. Beach Holdco, LLC, a Delaware limited liability company and special purpose entity with two independent directors. Legal counsel to the borrower delivered a non-consolidation opinion in connection with the origination of the Dream Inn Mortgage Loan. Ensemble Investments, LLC is the guarantor of certain nonrecourse carve-outs under the Dream Inn Mortgage Loan.
The Loan Sponsor. The Dream Inn Mortgage Loan sponsor is Ensemble Investments, LLC, an entity 100% owned by the three founders of Ensemble Real Estate Solutions and Investments (“Ensemble”), Kambiz Babaoff, Michael Moskowitz and Randy McGrane. Ensemble is a full service real estate solutions and investments provider with real estate experience in the hospitality, healthcare, commercial, and multifamily/mixed-use sectors dating back to 1980. Headquartered in Phoenix, AZ, Ensemble maintains regional offices in Long Beach, California, and Las Vegas and Reno, Nevada.
Property Management. The Dream Inn Property is managed by Woodside Hotel Group Ltd. (“Woodside”), a California-based, family-owned hospitality developer, owner and third-party management provider for boutique hotels located in northern California. In addition to Woodside’s wine country, San Francisco, and Silicon Valley properties under management, Woodside also operates two seaside hotel properties in addition to the Dream Inn Property, The Bodega Bay Lodge and the Monterey Plaza Hotel and Spa.
Franchise Agreement. The Dream Inn Property does not operate under a franchise agreement.
Escrows and Reserves. At origination, the borrower deposited into escrow $149,302 for real estate taxes, $710,000 for FF&E and $290,000 for seasonality.
THE INFORMATION IN THIS STRUCTURAL AND COLLATERAL TERM SHEET IS NOT COMPLETE AND MAY BE AMENDED PRIOR TO THE TIME OF SALE. THIS TERM SHEET IS NOT AN OFFER TO SELL THESE SECURITIES AND IT IS NOT A SOLICITATION OF AN OFFER TO BUY THESE SECURITIES IN ANY JURISDICTION WHERE THE OFFER OR SALE IS NOT PERMITTED.
| | 39 | |
| Structural and Collateral Term Sheet | BBCMS 2018-C2 |
| Dream Inn |
Tax Escrows– On a monthly basis, the borrower is required to escrow 1/12 of the annual estimated tax payments, which currently equates to $47,453.
Insurance Escrows – On a monthly basis, the borrower is required to escrow 1/12 of the annual estimated insurance payments (unless the borrower maintains insurance under an acceptable blanket insurance policy, among other conditions as detailed in the Dream Inn mortgage loan documents).
FF&E Reserves– On a monthly basis, the borrower is required to deposit an amount equal to the greater of 1/12 of 4.0% of the greater of (i) total gross room revenues for operations at the property for the immediately preceding calendar year as determined by the lender and (ii) total projected gross room revenue set forth in the approved annual budget for the immediately following calendar year as determined by the lender. Monthly FF&E reserve payments currently equate to $51,161.
Seasonality Reserves– On a monthly basis from and including May through and including the month of September, the borrower is required to pay to the lender the sum of $58,000 (the “Seasonality Reserve Monthly Deposit”) for an aggregate amount of $290,000 (the “Fully Funded Seasonality Amount”). The Seasonality Reserve Monthly Deposit and the Fully Funded Seasonality Amount are subject to future adjustment as provided in the related mortgage loan documents; provided that the Fully Funded Seasonality Amount may not exceed $290,000. The lender is required to, in its reasonable discretion, determine the amount of the Seasonality Reserve Monthly Deposit and the Fully Funded Seasonality Amount for the next calendar year by taking into account the then existing balance of the seasonality reserve and the lender’s reasonable estimate of the total amount of the monthly cash shortfalls that will occur during the next calendar year (multiplied by a factor of 1.10) based on the greater of (i) the aggregate monthly cash shortfalls derived from the preceding calendar year multiplied by 1.10 and (ii) the aggregate projected monthly cash shortfalls derived from the borrower’s annual budget multiplied by 1.10. If the lender determines no month in the trailing 12-month period and no month in the projected 12-month period will result in a DSCR less than 1.10x, the Seasonality Reserve Monthly Deposit will be waived and any funds on deposit will be disbursed to the borrower. The Seasonality Reserve Monthly Deposit is currently suspended due to the initial deposit collected at origination which is equal to the Fully Funded Seasonality Amount.
Lockbox / Cash Management. The Dream Inn Mortgage Loan is structured with a hard lockbox and springing cash management. At origination, the borrower was required to deliver written instructions to credit card companies to deposit all revenues into the lockbox account controlled by the lender. In the absence of a Cash Sweep Period (as defined below), the funds in the lockbox account will be swept daily into an account controlled by the borrower. Upon the occurrence of a Cash Sweep Period, all funds on deposit in the lockbox account are swept on a daily basis into a cash management account controlled by the lender and applied on each payment date in accordance with the Dream Inn Mortgage Loan documents.
A “Cash Sweep Period” means the occurrence of (i) an event of default, (ii) any bankruptcy action of the borrower or property manager, or (iii) a debt service coverage ratio less than 1.35x based upon the preceding trailing 12-month period and an assumed 30-year amortization period (“DSCR Trigger”). A Cash Sweep Period will continue until the applicable Cash Sweep Cure (as defined below) is achieved.
A “Cash Sweep Cure” means (i) if a Cash Sweep Period is due to an event of default, the event of default is cured (as determined by the lender) or waived by the lender in writing, (ii) if a Cash Sweep Period is due to a bankruptcy action of the property manager, the replacement of the manager with a qualified manager under a replacement management agreement within 60 days, or (iii) if a Cash Sweep Period is due to a DSCR Trigger, the achievement for two consecutive quarters of a DSCR equal to or greater than 1.35x based upon the trailing 12-month period and an assumed 30-year amortization period, provided, however, no event of default is continuing and the Dream Inn Mortgage Loan borrower has paid the reasonable expenses of the lender incurred as a result of such Cash Sweep Cure. In no event may a bankruptcy action of the borrower be cured.
Future Mezzanine Debt.Future mezzanine debt is permitted provided (i) the lender consents in writing, (ii) no event of default is continuing, (iii) a combined loan-to-value ratio as determined under the Dream Inn Mortgage Loan documents is not greater than 55.0%, (iv) the combined debt service coverage ratio as determined under the Dream Inn Mortgage Loan documents is equal to or greater than 2.38x on a trailing 12-month basis, (v) delivery to the lender of all documents pertaining to the mezzanine loan and an executed intercreditor agreement satisfactory to the lender in its reasonable discretion, (vi) rating agency confirmation, (vii) the mezzanine loan is coterminous with the Dream Inn Mortgage Loan and other conditions as detailed in the Dream Inn Mortgage Loan documents.
Partial Release. Not Permitted.
Ground Lease. None.
THE INFORMATION IN THIS STRUCTURAL AND COLLATERAL TERM SHEET IS NOT COMPLETE AND MAY BE AMENDED PRIOR TO THE TIME OF SALE. THIS TERM SHEET IS NOT AN OFFER TO SELL THESE SECURITIES AND IT IS NOT A SOLICITATION OF AN OFFER TO BUY THESE SECURITIES IN ANY JURISDICTION WHERE THE OFFER OR SALE IS NOT PERMITTED.
| | 40 | |
| Structural and Collateral Term Sheet | BBCMS 2018-C2 |
[THIS PAGE INTENTIONALLY LEFT BLANK]
THE INFORMATION IN THIS STRUCTURAL AND COLLATERAL TERM SHEET IS NOT COMPLETE AND MAY BE AMENDED PRIOR TO THE TIME OF SALE. THIS TERM SHEET IS NOT AN OFFER TO SELL THESE SECURITIES AND IT IS NOT A SOLICITATION OF AN OFFER TO BUY THESE SECURITIES IN ANY JURISDICTION WHERE THE OFFER OR SALE IS NOT PERMITTED.
| | 41 | |
| Structural and Collateral Term Sheet | BBCMS 2018-C2 | |
| Christiana Mall | ||

THE INFORMATION IN THIS STRUCTURAL AND COLLATERAL TERM SHEET IS NOT COMPLETE AND MAY BE AMENDED PRIOR TO THE TIME OF SALE. THIS TERM SHEET IS NOT AN OFFER TO SELL THESE SECURITIES AND IT IS NOT A SOLICITATION OF AN OFFER TO BUY THESE SECURITIES IN ANY JURISDICTION WHERE THE OFFER OR SALE IS NOT PERMITTED.
| | 42 | |
| Structural and Collateral Term Sheet | BBCMS 2018-C2 | |
| Christiana Mall | ||
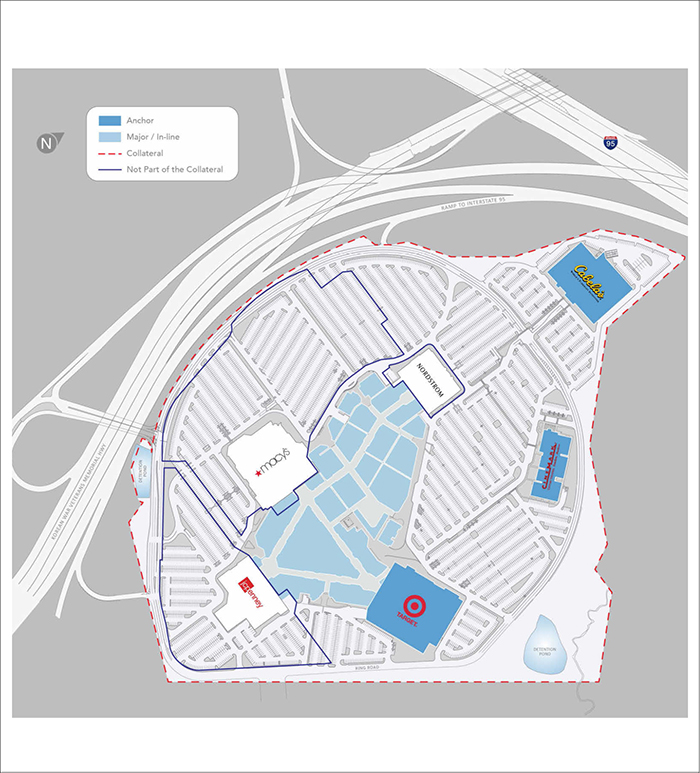
THE INFORMATION IN THIS STRUCTURAL AND COLLATERAL TERM SHEET IS NOT COMPLETE AND MAY BE AMENDED PRIOR TO THE TIME OF SALE. THIS TERM SHEET IS NOT AN OFFER TO SELL THESE SECURITIES AND IT IS NOT A SOLICITATION OF AN OFFER TO BUY THESE SECURITIES IN ANY JURISDICTION WHERE THE OFFER OR SALE IS NOT PERMITTED.
| | 43 | |
| Structural and Collateral Term Sheet | BBCMS 2018-C2 | |
| Christiana Mall | ||
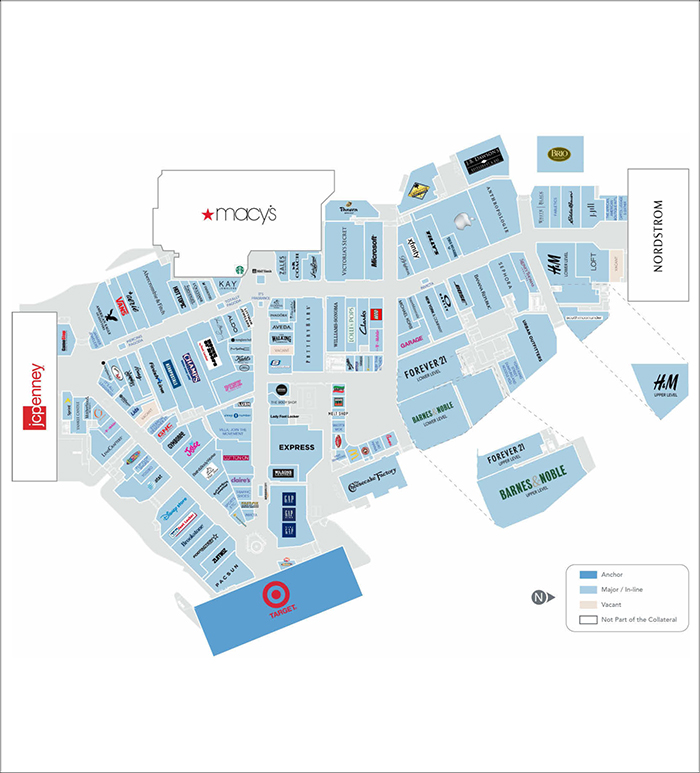
THE INFORMATION IN THIS STRUCTURAL AND COLLATERAL TERM SHEET IS NOT COMPLETE AND MAY BE AMENDED PRIOR TO THE TIME OF SALE. THIS TERM SHEET IS NOT AN OFFER TO SELL THESE SECURITIES AND IT IS NOT A SOLICITATION OF AN OFFER TO BUY THESE SECURITIES IN ANY JURISDICTION WHERE THE OFFER OR SALE IS NOT PERMITTED.
| | 44 | |
| Structural and Collateral Term Sheet | BBCMS 2018-C2 | |
| Christiana Mall | ||
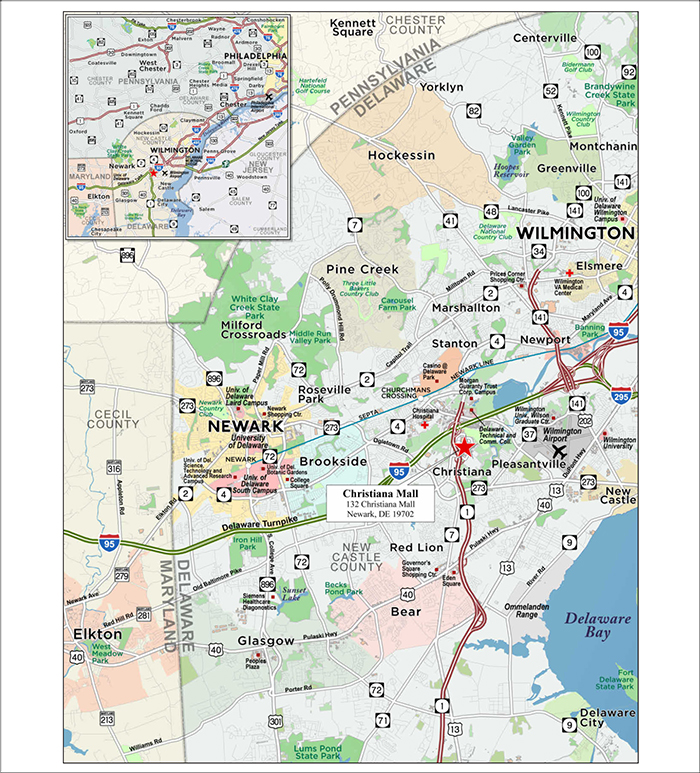
THE INFORMATION IN THIS STRUCTURAL AND COLLATERAL TERM SHEET IS NOT COMPLETE AND MAY BE AMENDED PRIOR TO THE TIME OF SALE. THIS TERM SHEET IS NOT AN OFFER TO SELL THESE SECURITIES AND IT IS NOT A SOLICITATION OF AN OFFER TO BUY THESE SECURITIES IN ANY JURISDICTION WHERE THE OFFER OR SALE IS NOT PERMITTED.
| | 45 | |
| Structural and Collateral Term Sheet | BBCMS 2018-C2 | |
| Christiana Mall | ||
| Mortgage Loan Information | Property Information | |||
| Mortgage Loan Seller(1): | Barclays | Single Asset / Portfolio: | Single Asset | |
| Credit Assessment (Fitch / DBRS): | AA- / A | Title(4): | Fee/Leasehold | |
| Original Principal Balance(2): | $54,840,000 | Property Type - Subtype: | Retail – Super Regional Mall | |
| Cut-off Date Principal Balance(2): | $54,840,000 | Net Rentable Area (SF)(5): | 779,084 | |
| % of IPB: | 6.1% | Location: | Newark, DE | |
| Loan Purpose: | Refinance | Year Built / Renovated: | 1978 / 2007-2015 | |
| Borrower: | Christiana Mall LLC | Occupancy(5): | 98.3% | |
| Sponsors: | GGP Inc., Brookfield Property | Occupancy Date: | 5/31/2018 | |
| Partners L.P. and Brookfield Asset | 4thMost Recent NOI (As of): | $41,918,054 (12/31/2015) | ||
| Management Inc. | 3rd Most Recent NOI (As of): | $43,957,559 (12/31/2016) | ||
| Interest Rate: | 4.27750% | 2nd Most Recent NOI (As of): | $43,514,169 (12/31/2017) | |
| Note Date: | 7/12/2018 | Most Recent NOI (As of): | $43,550,426 (TTM 5/31/2018) | |
| Maturity Date: | 8/1/2028 | UW Economic Occupancy: | 96.8% | |
| Interest-only Period: | 120 months | UW Revenues: | $56,260,022 | |
| Original Term: | 120 months | UW Expenses: | $9,514,932 | |
| Original Amortization Term: | None | UW NOI: | $46,745,090 | |
| Amortization Type: | Interest Only | UW NCF: | $46,104,564 | |
| Call Protection(3): | L(28),Def(85),O(7) | Appraised Value / Per SF: | $1,040,000,000 / $1,335 | |
| Lockbox / Cash Management: | Hard / Springing | Appraisal Date: | 6/5/2018 | |
| Additional Debt: | Yes | |||
| Additional Debt Balance: | $283,160,000 / $212,000,000 | |||
| Additional Debt Type: | Pari Passu / B-Note | |||
| Escrows and Reserves(6) | Financial Information(2) | |||||||||
| Initial | Monthly | Initial Cap | A-Notes | Whole Loan | ||||||
| Taxes: | $0 | Springing | N/A | Cut-off Date Loan / SF: | $434 | $706 | ||||
| Insurance: | $0 | Springing | N/A | Maturity Date Loan / SF: | $434 | $706 | ||||
| Replacement Reserves: | $0 | Springing | $241,565 | Cut-off Date LTV: | 32.5% | 52.9% | ||||
| TI/LC: | $0 | Springing | $1,449,387 | Maturity Date LTV: | 32.5% | 52.9% | ||||
| Other: | $1,804,093 | $0 | N/A | UW NCF DSCR: | 3.15x | 1.93x | ||||
| UW NOI Debt Yield: | 13.8% | 8.5% | ||||||||
| Sources and Uses | ||||||||||
| Sources | Proceeds | % of Total | Uses | Proceeds | % of Total | |||||
| Mortgage Loan(2) | $550,000,000 | 100.0% | Payoff Existing Debt | $235,182,023 | 42.8% | |||||
| Return of Equity | 309,760,172 | 56.3 | ||||||||
| Closing Costs | 3,253,713 | 0.6 | ||||||||
| Upfront Reserves | 1,804,093 | 0.3 | ||||||||
| Total Sources | $550,000,000 | 100.0% | Total Uses | $550,000,000 | 100.0% | |||||
| (1) | The Christiana Mall Whole Loan, as defined in “The Loan” below, was co-originated by Barclays Bank PLC, Société Générale, and Deutsche Bank AG, New York Branch. |
| (2) | The Christiana Mall mortgage loan is part of a whole loan evidenced by 13pari passu senior notes and three subordinate companion B-Notes with an aggregate original principal balance of $550.0 million. The financial information presented for the A-Notes in the chart above reflects the Cut-off Date balance of the $338.0 million Christiana Mall senior notes. |
| (3) | The lockout period will be at least 28 payments beginning with and including September 1, 2018. Defeasance of the full $550.0 million Christiana Mall Whole Loan is permitted after the date that is the earlier to occur of (i) two years from the closing date of the securitization that includes the last note to be securitized and (ii) July 12, 2021. |
| (4) | For a full description of the leasehold interest, please refer to“Ground Lease”below. |
| (5) | Net Rentable Area (SF) andOccupancy is based on the 779,084 square feet of collateral at the Christiana Mall Property. Occupancy of the entire 1,275,084 square feet of the Christiana Mall was 98.9%. |
| (6) | For a full description of Escrows and Reserves, please refer to “Escrows and Reserves” below. |
THE INFORMATION IN THIS STRUCTURAL AND COLLATERAL TERM SHEET IS NOT COMPLETE AND MAY BE AMENDED PRIOR TO THE TIME OF SALE. THIS TERM SHEET IS NOT AN OFFER TO SELL THESE SECURITIES AND IT IS NOT A SOLICITATION OF AN OFFER TO BUY THESE SECURITIES IN ANY JURISDICTION WHERE THE OFFER OR SALE IS NOT PERMITTED.
| | 46 | |
| Structural and Collateral Term Sheet | BBCMS 2018-C2 | |
| Christiana Mall | ||
The Loan.The Christiana Mall mortgage loan is secured by a first mortgage lien on the borrower’s fee and leasehold interest in a 779,084 square foot portion (the “Christiana Mall Property”) of an upscale super regional mall located in Newark, Delaware (“Christiana Mall”). The whole loan was originated by Barclays Bank PLC (“Barclays”), Société Générale and Deutsche Bank AG, New York Branch (“Deutsche Bank”) and has an outstanding principal balance as of the Cut-off Date of $550.0 million (the “Christiana Mall Whole Loan”), and is comprised of 13 seniorpari passu notes and three subordinate companion B-Notes. The Christiana Mall Whole Loan is serviced pursuant to the pooling and servicing agreement for the BBCMS 2018-CHRS Trust. The Christiana Mall Whole Loan has a 10-year term and is interest-only for the full term of the loan.
The Property. The Christiana Mall Property consists of a 779,084 square foot portion of the Christiana Mall. The Christiana Mall is a super regional mall comprised of a total of 1,275,084 square feet of retail space. The Christiana Mall Property’s collateral anchors include Target, Cabela’s, and Cinemark and non-collateral anchors include Macy’s, JCPenney, and Nordstrom. Target and Cabela’s each own their improvements and ground lease the land from the borrower. The collateral and non-collateral anchor tenants generate approximately $198.7 million in annual sales. The Christiana Mall Property features over 130 tenants including Apple, Anthropologie, Banana Republic, Barnes & Noble, Express, Finish Line, H&M, Microsoft, Pottery Barn, Sephora, Urban Outfitters, Victoria’s Secret, Williams-Sonoma, and XXI Forever. Additionally, the Christiana Mall Property includes dining options such as a 10-bay food court and five restaurants including Brio, California Pizza Kitchen, The Cheesecake Factory, J.B. Dawson’s Restaurant and Panera Bread. Included in the collateral are 6,628 parking spaces (approximately 5.2 spaces per 1,000 SF). Excluding the anchor tenants, no other tenant occupies more than 4.7% of NRA or represents more than 6.0% of underwritten base rent.
The Christiana Mall Property was built in 1978 and underwent an expansion phase from 2007 to 2015. Over $200.0 million was invested, adding several large-format tenants including Nordstrom, Target, Cabela’s, and Cinemark, as well as over 160,000 square feet of in-line, restaurant, and exterior facing in-line space.
As of May 31, 2018, the Christiana Mall Property was 98.3% occupied by 131 retail and restaurant tenants, and the entire 1,275,084 square feet of the Christiana Mall was 98.9% leased. Since 2014, Christiana Mall has maintained an average occupancy of approximately 99.5% including anchor tenants, with no year-end occupancy falling below 98.9%. As of TTM April 2018, sales for in-line tenants occupying less than 10,000 square feet of space were $885 per square foot with occupancy cost of 13.4% (including Apple and its 10,705 square feet of space, the Christiana Mall Property generated sales per square foot of $2,504 with an occupancy cost of 4.7%).
Environmental. According to a Phase I environmental assessment dated June 11, 2018, there is no evidence of any recognized environmental conditions at The Christiana Mall Property.
THE INFORMATION IN THIS STRUCTURAL AND COLLATERAL TERM SHEET IS NOT COMPLETE AND MAY BE AMENDED PRIOR TO THE TIME OF SALE. THIS TERM SHEET IS NOT AN OFFER TO SELL THESE SECURITIES AND IT IS NOT A SOLICITATION OF AN OFFER TO BUY THESE SECURITIES IN ANY JURISDICTION WHERE THE OFFER OR SALE IS NOT PERMITTED.
| | 47 | |
| Structural and Collateral Term Sheet | BBCMS 2018-C2 | |
| Christiana Mall | ||
| Historical and Current Occupancy(1)(2) | ||||
| 2014 | 2015 | 2016 | 2017 | Current(3) |
| 99.2% | 99.3% | 99.8% | 99.0% | 98.3% |
| (1) | Historical Occupancies are as of December 31 of each respective year. |
| (2) | Historical Occupancy includes the 779,084 square feet of collateral at the Christiana Mall Property. Historical occupancy of the entire 1,275,084 square feet of the Christiana Mall was 99.5%, 99.5%, 99.9%, 99.4%, and 98.9%, respectively. |
| (3) | Current Occupancy is as of May 31, 2018. |
| Historical Sales(1)(2) | |||||
| 2014 | 2015 | 2016 | 2017 | TTM(3) | |
| Sales PSF w/ Apple | $3,733 | $2,750 | $1,660 | $2,038 | $2,504 |
| Occupancy Cost w/ Apple | 2.8% | 3.9% | 6.8% | 5.8% | 4.7% |
| Sales PSF w/o Apple | $699 | $786 | $821 | $887 | $885 |
| Occupancy cost w/o Apple | 14.8% | 13.8% | 13.8% | 13.4% | 13.4% |
| (1) | Information as provided by the sponsors and only includes tenants reporting comparable sales for the Christiana Mall Property. |
| (2) | Historical sales figures are presented in millions. |
| (3) | TTM Historical Sales PSF are as of the trailing 12-month period ending April 30, 2018. |
| Historical Anchor Sales(1) |
| 2014 | 2015 | 2016 | 2017 | TTM | |
| Macy’s Sales $ mil / Sales PSF(2)(3) | $56.0/$260 | $57.0/$265 | $52.0/$242 | $48.0/$223 | $48.0/$223 |
| JCPenney’s Sales $ mil / Sales PSF(2)(3) | $22.0/$139 | $22.0/$139 | $20.0/$127 | $21.0/$133 | $21.0/$133 |
| Target Sales $ mil / Sales PSF(3) | $56.0/$385 | $60.0/$413 | $52.0/$358 | $52.0/$358 | $52.0/$358 |
| Nordstrom Sales $ mil / Sales PSF(2)(3) | $25.1/$204 | $25.0/$203 | $24.1/$196 | $19.7/$160 | $19.7/$160 |
| Cabela’s Sales $ mil / Sales PSF | NAV | $57.9/$579 | $50.6/$506 | $50.8/$508 | $50.8/$508 |
| Cinemark Sales $ mil / Sales PSF(4) | NAV | $8.0/$665,953 | $8.4/$697,866 | $7.3/$604,286 | $7.3/$604,286 |
| (1) | Information is estimated and is provided by the borrower sponsors. |
| (2) | These anchors are non-collateral tenants. |
| (3) | Sales figures for Macy’s, JCPenney, and Target represent borrower estimates. TTM April 2018 sales were not available for Macy’s, JCPenney, and Target, thus 2017 estimates were utilized. Additionally, Nordstrom reports sales on an annual basis, thus TTM April 2018 sales figures on this table reflect 2017 sales. |
| (4) | Cinemark Sales PSF represent sales per screen (12 screens). |
THE INFORMATION IN THIS STRUCTURAL AND COLLATERAL TERM SHEET IS NOT COMPLETE AND MAY BE AMENDED PRIOR TO THE TIME OF SALE. THIS TERM SHEET IS NOT AN OFFER TO SELL THESE SECURITIES AND IT IS NOT A SOLICITATION OF AN OFFER TO BUY THESE SECURITIES IN ANY JURISDICTION WHERE THE OFFER OR SALE IS NOT PERMITTED.
| | 48 | |
| Structural and Collateral Term Sheet | BBCMS 2018-C2 | |
| Christiana Mall | ||
| Major Tenant Summary(1) | |||||||||
| Tenant | Ratings(2) Moody’s/S&P/ Fitch | Net Rentable Area (SF) | % of Total NRA | Base Rent PSF | Base Rent(3) | % of Total Base Rent | Sales PSF(4) | Occ. Costs | Lease Expiration Date |
| Target(5) | A2 / A / A- | 145,312 | 18.7% | $0.00 | $0 | 0.0% | $358 | NAP | 12/31/2036 |
| Cabela’s(6) | NA / NA / NA | 100,000 | 12.8 | $10.21 | 1,021,250 | 2.8 | $508 | 2.0% | 1/31/2035 |
| Cinemark(7)(8) | NA / BB / NA | 50,643 | 6.5 | $22.30 | 1,129,339 | 3.1 | $604,286 | 15.6% | 11/30/2029 |
| Barnes & Noble(9) | NA / NA / NA | 36,803 | 4.7 | $20.38 | 750,000 | 2.1 | $215 | 9.5% | 1/31/2020 |
| XXI Forever | NA / NA / NA | 27,300 | 3.5 | $78.21 | 2,135,133 | 6.0 | $238 | 32.9% | 1/31/2020 |
| H&M(10) | NA / NA / NA | 20,160 | 2.6 | $45.60 | 919,371 | 2.6 | $317 | 14.4% | 2/28/2021 |
| Anthropologie(11) | NA / NA / NA | 10,967 | 1.4 | $68.43 | 750,455 | 2.1 | $149 | 45.8% | 1/31/2021 |
| Victoria’s Secret | NA / NA / NA | 10,830 | 1.4 | $60.00 | 649,800 | 1.8 | $599 | 10.0% | 1/31/2024 |
| Apple | Aa1 / AA+ / NA | 10,705 | 1.4 | $109.85 | 1,175,974 | 3.3 | $45,679 | 0.2% | 1/31/2023 |
| Gap/Gap Kids/Baby Gap | Baa2 / BB+ / NA | 10,583 | 1.4 | $59.12 | 625,698 | 1.7 | $298 | 19.8% | 5/31/2024 |
| Express | NA / NA / NA | 10,008 | 1.3 | $45.75 | 457,913 | 1.3 | $317 | 14.4% | 1/31/2024 |
| Urban Outfitters(12) | NA / NA / NA | 10,000 | 1.3 | $42.00 | 420,000 | 1.2 | $245 | 17.2% | 1/31/2021 |
| Major Tenants | 443,311 | 56.9% | $33.67(13) | $10,034,934 | 28.0% | ||||
| Non-major Tenants(14) | 322,372 | 41.4% | $82.30(14) | $25,834,705 | 72.0% | ||||
| Occupied Collateral Total | 765,683 | 98.3% | $58.62(15) | $35,869,639 | 100.0% | ||||
| Vacant Space | 13,401 | 1.7% | |||||||
| Collateral Total | 779,084 | 100.0% | |||||||
| Non-collateral Tenants | |||||||||
| Macy’s | Baa3 / BBB- / BBB | 215,000 | NAP | NAP | NAP | NAP | $223 | NAP | 12/31/2028 |
| JCPenney | B3 / B- / B | 158,000 | NAP | NAP | NAP | NAP | $133 | NAP | 12/31/2028 |
| Nordstrom | Baa1 / BBB+ / BBB+ | 123,000 | NAP | NAP | NAP | NAP | $160 | NAP | 12/31/2028 |
| (1) | Based on the underwritten rent roll. |
| (2) | Ratings provided are for the parent company of the entity listed in the “Tenant” field whether or not the parent company guarantees the lease. |
| (3) | Base Rent includes contractual rent steps of $1,226,247 taken through July 2019. |
| (4) | Sales PSF represents trailing 12-month period ending April 30, 2018. Sales figures for Macy’s, JCPenney, Target, Barnes & Noble and Nordstrom represent 2017 borrower estimates. |
| (5) | See “Target Purchase and Put Options” section. |
| (6) | Cabela’s has eight five-year renewal options with six months’ written notice. Additionally, Cabela’s has a right to raze its leased premises, so long as it restores the building pad back to the condition at which time the leased premises were delivered, caps utilities at their in-place levels and otherwise leaves its leased premises in good condition. Upon substantial completion of this razing, the Cabela’s lease will terminate. |
| (7) | Sales PSF for Cinemark reflects sales per screen (12 screens). |
| (8) | Cinemark has three five-year renewal options with six months’ written notice. |
| (9) | Barnes & Noble has two five-year renewal options with 180 days’ written notice. |
| (10) | H&M has one five-year renewal option with 180 days’ written notice. |
| (11) | Anthropologie has one five-year renewal option with 180 days’ written notice. |
| (12) | Urban Outfitters has one five-year renewal option with 180 days’ written notice. |
| (13) | Target’s square footage is excluded from the Base Rent PSF calculation as it has no attributable base rent. |
| (14) | Non-major Tenants include 1,553 square feet for one temporary tenant with an expiration date in May 2019 and 6,907 square feet of kiosk, antenna, and storage tenants with no attributable base rent, and are excluded in the Base Rent PSF calculation. |
| (15) | Base Rent PSF calculation excludes Target’s square footage (145,312 square feet), 1,553 square feet for one temporary tenant, and 6,907 square feet of kiosk, antenna, and storage space. |
THE INFORMATION IN THIS STRUCTURAL AND COLLATERAL TERM SHEET IS NOT COMPLETE AND MAY BE AMENDED PRIOR TO THE TIME OF SALE. THIS TERM SHEET IS NOT AN OFFER TO SELL THESE SECURITIES AND IT IS NOT A SOLICITATION OF AN OFFER TO BUY THESE SECURITIES IN ANY JURISDICTION WHERE THE OFFER OR SALE IS NOT PERMITTED.
| | 49 | |
| Structural and Collateral Term Sheet | BBCMS 2018-C2 | |
| Christiana Mall | ||
| Lease Rollover Schedule(1)(2)(3) | |||||||||
| Year | Number of Leases Expiring | Net Rentable Area Expiring | % of NRA Expiring | Base Rent Expiring(4) | % of Base Rent Expiring(4) | Cumulative Net Rentable Area Expiring | Cumulative % of NRA Expiring | Cumulative Base Rent Expiring | Cumulative % of Base Rent Expiring |
| Vacant | NAP | 13,401 | 1.7% | NAP | NAP | 13,401 | 1.7% | NAP | NAP |
| 2018 & MTM | 5 | 9,964 | 1.3 | $910,842 | 2.5% | 23,365 | 3.0% | $910,842 | 2.5% |
| 2019 | 14 | 21,935 | 2.8 | 2,084,627 | 5.8 | 45,300 | 5.8% | $2,995,469 | 8.4% |
| 2020 | 18 | 114,468 | 14.7 | 6,063,941 | 16.9 | 159,768 | 20.5% | $9,059,410 | 25.3% |
| 2021 | 21 | 105,128 | 13.5 | 6,432,376 | 17.9 | 264,896 | 34.0% | $15,491,786 | 43.2% |
| 2022 | 9 | 19,976 | 2.6 | 2,099,539 | 5.9 | 284,872 | 36.6% | $17,591,325 | 49.0% |
| 2023 | 13 | 33,728 | 4.3 | 3,132,006 | 8.7 | 318,600 | 40.9% | $20,723,331 | 57.8% |
| 2024 | 12 | 50,843 | 6.5 | 3,842,731 | 10.7 | 369,443 | 47.4% | $24,566,062 | 68.5% |
| 2025 | 13 | 37,189 | 4.8 | 3,715,274 | 10.4 | 406,632 | 52.2% | $28,281,336 | 78.8% |
| 2026 | 14 | 39,768 | 5.1 | 3,914,722 | 10.9 | 446,400 | 57.3% | $32,196,058 | 89.8% |
| 2027 | 3 | 9,078 | 1.2 | 480,791 | 1.3 | 455,478 | 58.5% | $32,676,849 | 91.1% |
| 2028 & Beyond | 9 | 316,699 | 40.7 | 3,192,790 | 8.9 | 772,177 | 99.1% | $35,869,639 | 100.0% |
| Other(5) | NAP | 6,907 | 0.9 | NAP | NAP | 779,084 | 100.0% | NAP | NAP |
| Total | 131 | 779,084 | 100.0% | $35,869,639 | 100.0% | ||||
| (1) | Based on the underwritten rent roll. |
| (2) | Certain tenants may have lease termination options that are exercisable prior to the originally stated expiration date of the subject lease that are not considered in the lease rollover schedule. |
| (3) | Includes executed leases that have not yet commenced as of May 31, 2018. |
| (4) | Base Rent Expiring includes contractual rent steps of $1,226,247 taken through July 2019. |
| (5) | 6,907 square feet included in “Other” are kiosk, antenna, and storage tenants. |
THE INFORMATION IN THIS STRUCTURAL AND COLLATERAL TERM SHEET IS NOT COMPLETE AND MAY BE AMENDED PRIOR TO THE TIME OF SALE. THIS TERM SHEET IS NOT AN OFFER TO SELL THESE SECURITIES AND IT IS NOT A SOLICITATION OF AN OFFER TO BUY THESE SECURITIES IN ANY JURISDICTION WHERE THE OFFER OR SALE IS NOT PERMITTED.
| | 50 | |
| Structural and Collateral Term Sheet | BBCMS 2018-C2 | |
| Christiana Mall | ||
Operating History and Underwritten Net Cash Flow | |||||||
| 2015 | 2016 | 2017 | TTM(1) | Underwritten | Per Square Foot | %(2) | |
| Base Rent(3)(4) | $32,684,203 | $34,240,787 | $34,477,828 | $34,558,591 | $35,869,639 | $46.04 | 69.4% |
| Vacant Income | 0 | 0 | 0 | 0 | 1,638,466 | 2.10 | 3.2 |
| Gross Potential Rent | $32,684,203 | $34,240,787 | $34,477,828 | $34,558,591 | $37,508,105 | $48.14 | 72.6% |
| Total Reimbursements | 13,257,802 | 13,807,251 | 13,491,109 | 13,425,783 | 14,157,327 | 18.17 | 27.4 |
| Percentage Rent | 0 | 0 | 6,575 | 7,770 | 0 | 0.0 | 0.0 |
| Net Rental Income | $45,942,005 | $48,048,039 | $47,975,513 | $47,992,144 | $51,665,432 | $66.32 | 100.0% |
| (Vacancy/Credit Loss) | 0 | 0 | 0 | 0 | (1,638,466) | (2.10) | (3.2) |
| Specialty Leasing | 2,714,827 | 2,749,431 | 2,713,432 | 2,759,788 | 2,876,610 | 3.69 | 5.6 |
| Other Income(5) | 3,469,234 | 3,343,004 | 3,369,589 | 3,277,797 | 3,356,447 | 4.31 | 6.5 |
| Effective Gross Income | $52,126,066 | $54,140,474 | $54,058,534 | $54,029,729 | $56,260,022 | $72.21 | 108.9% |
| Total Expenses | $10,208,012 | $10,182,915 | $10,544,365 | $10,479,303 | $9,514,932 | $12.21 | 16.9% |
| Net Operating Income | $41,918,054 | $43,957,559 | $43,514,169 | $43,550,426 | $46,745,090 | $60.00 | 83.1% |
| Total TI/LC, Capex/RR | 0 | 0 | 0 | 0 | 640,526 | 0.82 | 1.1 |
| Net Cash Flow | $41,918,054 | $43,957,559 | $43,514,169 | $43,550,426 | $46,104,564 | $59.18 | 81.9% |
| (1) | TTM reflects the trailing 12-month period ending May 31, 2018. |
| (2) | Percentage column represents percent of Net Rental Income for all revenue lines and represents percent of Effective Gross Income for the remainder of fields. |
| (3) | Underwritten Base Rent includes contractual rent steps of $1,226,247 taken through July 2019. |
| (4) | Underwritten Base Rent includes $643,284 for tenants who have signed leases but have not occupied their space as of May 31, 2018 including Tilly’s (4,999 square feet), Xfinity (4,014 square feet), Lolli and Pops (2,400 square feet), Jamba Juice (246 square feet), and Bath and Body Works (209 square feet). Underwritten Base Rent excludes bankrupt tenants as of May 31, 2018 including Icing by Claire’s (1,979 square feet), Claire’s (1,239 square feet), and the Walking Company (1,582 square feet) and also excludes Teavana (1,020 square feet) that is currently dark and not occupying its space. Walking Company has since emerged from bankruptcy. |
| (5) | Other Income consists of overage rent, storage, and other miscellaneous income. |
The Market.The Christiana Mall Property is located in the southeast quadrant of the intersection of Route 7 and Interstate 95 in Newark, Delaware. Delaware is one of only five U.S. states with no sales tax, and the Christiana Mall Property benefits from being the closest super regional shopping center to several surrounding states with sales tax. According to the appraisal, Interstate 95 is the most important limited access highway serving the region and offers direct access to Philadelphia and New York City to the north and Baltimore and Washington D.C. to the south. Christiana Mall is located directly off Interstate 95 with over 200,000 vehicles passing by daily. A $150.0 million upgrade to Interstate 95 has been completed, including the addition of an exit dedicated to Christiana Mall. The mall is popular for out-of-state shoppers since it is only approximately 10 miles from Maryland, Pennsylvania, and New Jersey. US Highway 1, DE Routes 2, 7, and 273, and Interstates 95, 295, and 495 all serve the area. Interstate 295, with access to the Delaware Memorial Bridge, leading to New Jersey, New York, and New England, lies approximately four miles northeast of the mall.
According to the appraisal, the Christiana Mall Property is located in a growing, suburban area, which benefits from access to the major traffic arteries connecting the surrounding metropolitan area. Christiana Mall caters to two large universities within a seven-mile radius, University of Delaware and Wilmington University, which are home to a combined 38,000 students and 5,000 employees. Another draw to the area is the Christiana Hospital, housing 907 licensed beds, 22 hospital-based operating rooms and 10 outpatient rooms, which is located a short distance south. It is home to Delaware’s only level 3 neonatal intensive care unit and the state’s largest maternity center. The Christiana Hospital Campus is also home to the Center for Heart & Vascular Health and the Helen F. Graham Cancer Center. The Christiana Mall Property is located in the Philadelphia metropolitan statistical area, which is home to 14 Fortune 500 companies of which two (DuPont and Chemours) are located in Wilmington, Delaware.
According to the appraisal, the estimated 2017 population within the Christiana Mall Property’s primary trade area was 680,683. The estimated 2017 average household income in the trade area was $90,061. The primary trade area has been established by zip codes based on a shopper intercept survey. From 2000 to 2017, the trade area experienced compound annual population growth rate of approximately 0.9% and an annual household income growth rate of approximately 2.0%.
The appraisal identified three primary competitive retail properties and four secondary competitive retail properties built between 1958 and 1982 and ranging in size from 610,582 square feet to 2,391,105 square feet. The comparable retail properties reported occupancies ranging from 84.0% to 97.0%. Available sales per square foot data for the competitive properties range from $316 to $805.
THE INFORMATION IN THIS STRUCTURAL AND COLLATERAL TERM SHEET IS NOT COMPLETE AND MAY BE AMENDED PRIOR TO THE TIME OF SALE. THIS TERM SHEET IS NOT AN OFFER TO SELL THESE SECURITIES AND IT IS NOT A SOLICITATION OF AN OFFER TO BUY THESE SECURITIES IN ANY JURISDICTION WHERE THE OFFER OR SALE IS NOT PERMITTED.
| | 51 | |
| Structural and Collateral Term Sheet | BBCMS 2018-C2 | |
| Christiana Mall | ||
| Competitive Set Summary(1) | ||||||
| Property/Location | Year Built / Renovated | Total GLA (square feet) | Est. Sales PSF | Est. Occ. | Proximity (miles) | Anchor Tenants |
Christiana Mall Newark, DE | 1978 / 2007-2015 | 1,275,084 | $885(2) | 98.9%(3) | NAP | Macy’s, JCPenney, Target, Nordstrom, Cabela’s, Cinemark |
| Primary Competition | ||||||
Concord Mall Wilmington, DE | 1969 / 1984 | 960,000 | $395 | 86.0% | 13.5 | Boscov’s, Macy’s, Sears |
Springfield Mall Springfield, PA | 1964 / 1997 | 610,582 | $424 | 97.0% | 26.6 | Macy’s, Target |
Exton Square Mall Exton, PA | 1973 / 2000 | 1,088,000 | $316 | 84.0% | 30.2 | Boscov’s, Macy’s, Main Line Health Center, Sears, Round 1 |
| Secondary Competition | ||||||
Dover Mall Dover, DE | 1982 / 1997 | 928,194 | $410 | 93.0% | 39.2 | AMC Cinema, Boscov’s, Dick’s Sporting Goods, JCPenney, Macy’s, Sears |
King of Prussia Mall King of Prussia, PA | 1962 / 1995 | 2,391,105 | $805 | 96.0% | 41.6 | Bloomingdales, JCPenney, Lord & Taylor, Macy’s, Neiman Marcus, Nordstrom, Sears |
Cherry Hill Mall Cherry Hill, NJ | 1961 / 2009 | 1,305,813 | $659 | 97.0% | 44.3 | JCPenney, Macy’s, Nordstrom |
Towson Town Center Towson, MD | 1958 / 2007 | 1,063,549 | $495 | 92.0% | 63.6 | Macy’s, Nordstrom, Crate & Barrel, Nordstrom Rack |
| (1) | Based on the appraisal and underwritten rent roll. |
| (2) | Based on TTM April 2018 sales for comparable in-line tenants occupying less than 10,000 square feet. |
| (3) | This occupancy reflects the entire Christiana Mall as of May 31, 2018. The 779,084 square feet of collateral was 98.3% occupied as of May 31, 2018. |
The Borrower. The borrowing entity for the Christiana Mall Whole Loan is Christiana Mall LLC, a Delaware limited liability company and special purpose entity with at least two independent directors. Legal counsel to the borrower delivered a non-consolidation opinion in connection with the origination of the Christiana Mall Whole Loan. GGP Nimbus, LP and PPF Retail, LLC are the guarantors of certain nonrecourse carve-outs under the Christiana Mall Whole Loan.The guarantees consist of (1) a loss recourse guaranty from GGP Nimbus, LP, which provides for loss recourse for various non-recourse carveouts, and (2) a guaranty from GGP Nimbus, LP and PPF Retail, LLC, which covers various voluntary bankruptcy-related actions, which is capped at an amount equal to 20.0% of the outstanding principal amount of the related Whole Loan at the time the applicable event first occurs.
The Loan Sponsors.The borrower sponsors are GGP Inc. (“GGP”), Brookfield Property Partners L.P. (“BPY”), and Brookfield Asset Management Inc.
GGP (NYSE: GGP) is a retail real estate company headquartered in Chicago, Illinois and is one of the largest owners and operators of real estate in the United States. According to the borrower, GGP owns, manages, leases and develops retail properties throughout the United States. As of March 31, 2018, GGP owned, either entirely or with joint venture partners, 125 retail properties located throughout the United States comprising approximately 122.5 million square feet of gross leasable area, which was 95.3% leased. GGP’s portfolio includes Ala Moana Center in Honolulu, Hawaii, Fashion Show in Las Vegas, Nevada, Tysons Galleria in McLean, Virginia, Glendale Galleria in Glendale, California, and Water Tower Place in Chicago, Illinois. On March 26, 2018, an affiliate of Brookfield announced that BPY and GGP have entered into an agreement for BPY to acquire all of the outstanding shares of common stock of GGP other than those shares that were already held by BPY and its affiliates, and the transaction was completed on August 28, 2018. BPY is one of the world’s largest commercial real estate companies, with approximately $68.0 billion in total assets. GGP is currently in the final stages of transferring a 24.995% indirect interest in the borrower to Institutional Mall Investors LLC. GGP had previously filed for bankruptcy on April 16, 2009.
The borrower is currently a joint venture that is indirectly owned and controlled by GGP and Morgan Stanley’s Prime Property Fund, PPF Retail, LLC. PPF Retail, LLC is a diversified core real estate fund managed by Morgan Stanley Real Estate. The fund’s assets include office, retail, multifamily, industrial self-storage and hotel properties located in major real estate markets throughout the United States. As of March 31, 2018, the Prime Property Fund had over $20.0 billion in net asset value.
Property Management. The Christiana Mall Property is managed by General Growth Services, Inc., an affiliate of the borrower.
Escrows and Reserves. At origination, the borrower was required to deposit into escrow $1,804,093 for outstanding tenant improvements and/or leasing commissions.
THE INFORMATION IN THIS STRUCTURAL AND COLLATERAL TERM SHEET IS NOT COMPLETE AND MAY BE AMENDED PRIOR TO THE TIME OF SALE. THIS TERM SHEET IS NOT AN OFFER TO SELL THESE SECURITIES AND IT IS NOT A SOLICITATION OF AN OFFER TO BUY THESE SECURITIES IN ANY JURISDICTION WHERE THE OFFER OR SALE IS NOT PERMITTED.
| | 52 | |
| Structural and Collateral Term Sheet | BBCMS 2018-C2 | |
| Christiana Mall | ||
Tax Escrows – The requirement for the borrower to make monthly deposits into the tax escrow is waived so long as no Cash Sweep Period (as defined below) exists.
Insurance Escrows – The requirement for the borrower to make monthly deposits to the insurance escrow is waived so long as the Christiana Mall Property is insured under a blanket insurance policy in accordance with the loan documents and no Cash Sweep Period exists.
Replacement Reserves – The requirement for the borrower to make monthly deposits into the replacement reserve is waived so long as no Cash Sweep Period exists. Upon the occurrence of a Cash Sweep Period, the borrower is required to escrow $10,065 (approximately $0.16 per square foot under the Christiana Mall Property annually) on a monthly basis for replacement reserves. The reserve is subject to a cap of $241,565 (approximately $0.31 per square foot under the Christiana Mall Property).
TI/LC Reserves – The requirement for the borrower to make monthly deposits into the tenant improvements and leasing commissions escrow is waived so long as no Cash Sweep Period exists. Upon the occurrence of a Cash Sweep Period, the borrower is required to escrow $60,391 (approximately $0.93 per square foot under the Christiana Mall Property annually) on a monthly basis for tenant improvement and leasing commission reserves. The reserve is subject to a cap of $1,449,387 (approximately $1.86 per square foot under the Christiana Mall Property).
Lockbox / Cash Management.The Christiana Mall Whole Loan is structured with a hard lockbox and springing cash management. Tenant direction letters were required to be sent to all tenants upon the origination of the loan instructing them to deposit all rents and payments into the lockbox account controlled by the lender. The funds are then returned to an account controlled by the borrower until the occurrence of a Cash Sweep Period (as defined below). During a Cash Sweep Period, all funds in the lockbox account are swept daily to a segregated cash management account under the control of the lender. To the extent there is a Cash Sweep Period continuing, all excess cash flow after payment of the mortgage debt service, required reserves and other amounts required by the loan documents will be held as additional collateral for the Christiana Mall Whole Loan. The lender has a first priority security interest in the cash management account.
A “Cash Sweep Period” means the occurrence of (i) an event of default under the Christiana Mall Whole Loan, (ii) bankruptcy action of the borrower, (iii) bankruptcy action of the guarantors, or any replacement guarantor or guarantors or (iv) the debt service coverage ratio falling below 1.35x for two consecutive quarters.
A Cash Sweep Event Period will end if (w) with respect to clause (i) above, such event of default has been cured and no other event of default has occurred and is continuing, (x) with respect to clause (ii) above, such bankruptcy action is discharged, (y) with respect to clause (iii) above, (A) the borrower replaces the guarantor subject to bankruptcy action with either (1) a replacement guarantor having an aggregate net worth of at least $500,000,000 and liquidity of at least $25,000,000, in each case exclusive of such person’s interest in the Christiana Mall Property or otherwise acceptable to lender or (2) PPF Retail, LLC or (so long as Institutional Mall Investors LLC and one such substitute guarantor has assumed all obligations of such guarantor under each guaranty and environmental indemnity or executed an acceptable replacement guaranty, the borrower has delivered an insolvency opinion, a rating agency confirmation if required by the lender, and a credit check acceptable to the lender as reasonably required by the lender) or (B) such bankruptcy action is discharged, stayed, or dismissed within 90 days of filing provided that such filing does not materially affect guarantor’s ability to pay and perform its obligations in the lender’s reasonable discretion, and (z) with respect to clause (iv) above, the Christiana Mall Property has achieved a debt service coverage ratio of at least 1.35x for two consecutive quarters.
Subordinate and Mezzanine Debt. The Christiana Mall Whole Loan includes a subordinate companion loan with an aggregate original principal balance of $212,000,000 that was contributed to the BBCMS 2018-CHRS securitization transaction. The subordinate companion loan is coterminous with the Christiana Mall Whole Loan and accrues interest at a fixedper annum rate equal to 4.27750%. The UW NCF DSCR and UW NOI debt yield on the Christiana Mall total debt is 1.93x and 8.5%, respectively. A co-lender agreement is in place with respect to the Christiana Mall Whole Loan.
Partial Release. If no event of default is continuing, the borrower is permitted to release from the lien of the mortgage the Cabela’s parcel and/or the Cinemark parcel (each, an “Outlot Parcel”) (or a portion thereof) in connection with the transfer of the fee simple interest in such Outlot Parcel (or portion thereof) to a transferee which is not an affiliate of the borrower that is either a national tenant or approved by the lender in its reasonable discretion, upon the borrower’s satisfaction of certain conditions, including, among other things:
| (i) | the borrower must make a partial prepayment of the Mortgage Loan by an amount equal to the greatest of (1) 125% of the allocated loan amount (i.e., $8,400,000 with respect to the Cabela’s parcel and $6,600,000 with respect to the Cinemark parcel) for such Outlot Parcel, (2) the net sales proceeds received by the borrower with respect to such transfer and (3) any |
THE INFORMATION IN THIS STRUCTURAL AND COLLATERAL TERM SHEET IS NOT COMPLETE AND MAY BE AMENDED PRIOR TO THE TIME OF SALE. THIS TERM SHEET IS NOT AN OFFER TO SELL THESE SECURITIES AND IT IS NOT A SOLICITATION OF AN OFFER TO BUY THESE SECURITIES IN ANY JURISDICTION WHERE THE OFFER OR SALE IS NOT PERMITTED.
| | 53 | |
| Structural and Collateral Term Sheet | BBCMS 2018-C2 | |
| Christiana Mall | ||
| “qualified amount” necessary to comply with any applicable REMIC requirement described in clause (iii) below, which partial prepayment, if made prior to the open period, shall be accompanied by a payment of the yield maintenance premium payment (calculated based upon the amount prepaid);provided, however, in lieu of making any such prepayment, at the borrower’s election prior to the release of the Outlot Parcel in question, the borrower may either (a) deposit cash with the lender in the amount of such prepayment (exclusive of the yield maintenance premium payment) as additional reserve funds, which the lender will hold in an additional reserve account, or (b) deliver to the lender a letter of credit in the amount of such prepayment (exclusive of the yield maintenance premium payment). The borrower will have the option of having such reserve funds or letter of credit, as applicable, returned to the borrower with the payment to the lender of the amounts required pursuant to this clause (i) with respect to the Outlot Parcel in question (inclusive of any yield maintenance premium payment that may be due and payable as of the date of such prepayment); |
| (ii) | upon request by lender, delivery of a REMIC opinion; |
| (iii) | the loan-to-value ratio immediately after the release of the applicable Outlot Parcel is less than or equal to 125%,provided that the borrower may prepay the “qualified amount” (with payment of the yield maintenance premium calculated based upon the amount prepaid), in order to meet the foregoing loan-to-value ratio; and |
| (iv) | delivery of rating agency confirmation. |
Real Estate Substitution. If no event of default is continuing, the borrower may substitute the fee simple or leasehold interest to a parcel of real property at or adjacent to the related mall (each an “Acquired Parcel”) in connection with the release of one or more parcels of the Christiana Mall Property (each, an “Exchange Parcel”),provided that, among other conditions, (i) the borrower provides at least 20 days’ prior written notice, (ii) the Acquired Parcel is reasonably equivalent in value to the Exchange Parcel, (iii) the Exchange Parcel is vacant, non-income producing and unimproved or improved only by landscaping, utility facilities that are readily relocatable or surface parking areas, (iv) the borrower pays the lender a fee in the amount of $10,000, along with any reasonable out-of-pocket expenses, (v) the borrower delivers a satisfactory environmental report covering the Acquired Parcel (unless the Acquired Parcel is covered by the environmental report received by the lender in connection with the origination of the mortgage loan) and (vi) after giving effect to such substitution, the loan-to-value ratio is less than or equal to 125%,provided that the borrower may prepay the “qualified amount” in order to meet such loan-to-value ratio.
Target Purchase and Put Options. Target constructed its own store on a 10.15-acre site which is ground leased from the borrower. The ground lease agreement with Target provides that Target has a fair market value purchase option to acquire the fee interest from the borrower in the Target property at any time during the ground lease term. The ground lease with Target has an initial term which runs through December 2036 and also includes five, 10-year and one final, 5-year renewal option. The Target lease does not have any minimum rent but does require Target to make a contribution (currently $139,557 per year) towards the common area maintenance (“CAM”). The Target lease states that, should Target exercise its purchase options, Target would still be obligated to pay its CAM contribution to the borrower through its lease term. The appraisal concluded that the exclusion of Target from the Christiana Mall Property in the appraisal would not affect the value of the Christiana Mall Property.
The lender agrees to release the Target parcel from the lien of the mortgage if and when Target exercises its purchase option pursuant to the terms of the Target lease upon satisfaction of certain conditions, which include, but are not limited to, the following:
| (i) | the borrower agrees that the purchase option will not be exercised in the event that (a) the borrower, or controlling affiliate of the borrower, acquires Target’s interest under its lease and (b) such option had not therefore been exercised in accordance with Target’s lease; |
| (ii) | the loan-to-value ratio immediately after the release of the Target parcel must be less than or equal to 125% and the borrower must repay the “qualified amount” (with payment of the yield maintenance premium amount calculated based upon the amount prepaid), in order to meet the foregoing loan-to-value ratio; |
| (iii) | the borrower causes all proceeds from the sale of the Target parcel to be deposited into the clearing account to be applied in the same manner as rents; and |
| (iv) | the borrower pays a fee in the amount of $10,000. |
Pursuant to the terms set forth in the Target lease, Target has the unilateral right to require the borrower to purchase the improvements located on the Target parcel owned by Target (the “Target Improvements”) and/or, if Target is then the fee owner of the Target parcel (pursuant to the exercise of its purchase option or otherwise), the fee interest in the Target parcel, for the lesser of fair market value or
THE INFORMATION IN THIS STRUCTURAL AND COLLATERAL TERM SHEET IS NOT COMPLETE AND MAY BE AMENDED PRIOR TO THE TIME OF SALE. THIS TERM SHEET IS NOT AN OFFER TO SELL THESE SECURITIES AND IT IS NOT A SOLICITATION OF AN OFFER TO BUY THESE SECURITIES IN ANY JURISDICTION WHERE THE OFFER OR SALE IS NOT PERMITTED.
| | 54 | |
| Structural and Collateral Term Sheet | BBCMS 2018-C2 | |
| Christiana Mall | ||
book value (the “Put Option”). On or prior to the anticipated date of the conveyance of the Target Improvements pursuant to the exercise by Target of the Put Option, the borrower must execute and deliver to the lender any amendment or modification to the mortgage or similar documents reasonably necessary in order to confirm that the lien of the mortgage attaches to the Target Improvements, in form and substance reasonably satisfactory to the lender.
Ground Lease. The Christiana Mall Property is subject to a ground lease with Macy’s Retail Holdings, Inc. (“Macy’s”) effective through December 31, 2028. The 4.154-acre portion of the parking lot is owned by Macy’s and ground leased to the borrower pursuant to a parking lease agreement dated as of July 30, 2010. Macy’s can terminate the parking lease agreement at any time with 12 months’ notice. The tenant is not obligated to pay a monthly or annual rent under the ground lease.
THE INFORMATION IN THIS STRUCTURAL AND COLLATERAL TERM SHEET IS NOT COMPLETE AND MAY BE AMENDED PRIOR TO THE TIME OF SALE. THIS TERM SHEET IS NOT AN OFFER TO SELL THESE SECURITIES AND IT IS NOT A SOLICITATION OF AN OFFER TO BUY THESE SECURITIES IN ANY JURISDICTION WHERE THE OFFER OR SALE IS NOT PERMITTED.
| | 55 | |
| Structural and Collateral Term Sheet | BBCMS 2018-C2 | |
| GNL Portfolio | ||
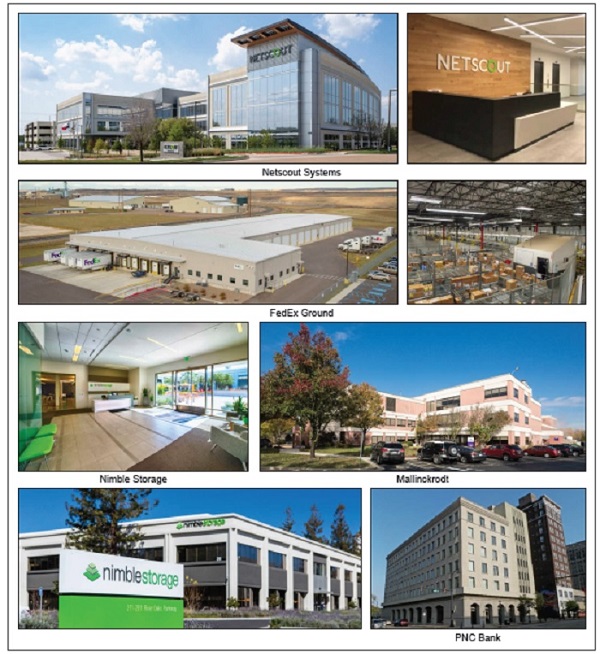
THE INFORMATION IN THIS STRUCTURAL AND COLLATERAL TERM SHEET IS NOT COMPLETE AND MAY BE AMENDED PRIOR TO THE TIME OF SALE. THIS TERM SHEET IS NOT AN OFFER TO SELL THESE SECURITIES AND IT IS NOT A SOLICITATION OF AN OFFER TO BUY THESE SECURITIES IN ANY JURISDICTION WHERE THE OFFER OR SALE IS NOT PERMITTED.
| | 56 | |
| Structural and Collateral Term Sheet | BBCMS 2018-C2 | |
| ||
| GNL Portfolio | ||

THE INFORMATION IN THIS STRUCTURAL AND COLLATERAL TERM SHEET IS NOT COMPLETE AND MAY BE AMENDED PRIOR TO THE TIME OF SALE. THIS TERM SHEET IS NOT AN OFFER TO SELL THESE SECURITIES AND IT IS NOT A SOLICITATION OF AN OFFER TO BUY THESE SECURITIES IN ANY JURISDICTION WHERE THE OFFER OR SALE IS NOT PERMITTED.
| | 57 | |
| Structural and Collateral Term Sheet | BBCMS 2018-C2 | |
| GNL Portfolio | ||
| Mortgage Loan Information | Property Information | |||
| Mortgage Loan Seller(1): | KeyBank | Single Asset / Portfolio: | Portfolio | |
| Original Principal Balance(2): | $54,175,000 | Title: | Fee | |
| Cut-off Date Principal Balance(2): | $54,175,000 | Property Type–Subtype: | Various – Various | |
| % of IPB: | 6.1% | Net Rentable Area (SF): | 647,713 | |
| Loan Purpose: | Refinance | Location: | Various | |
| Borrowers(3): | Various | Year Built / Renovated: | Various / Various | |
| Sponsor: | Global Net Lease Operating | Occupancy: | 100.0% | |
| Partnership, L.P. | Occupancy Date: | 11/9/2018 | ||
| Interest Rate: | 4.85300% | 4thMost Recent NOI (As of)(4): | $7,265,307 (12/31/2015) | |
| Note Date: | 11/9/2018 | 3rdMost Recent NOI (As of)(4): | $7,407,598 (12/31/2016) | |
| Maturity Date: | 12/1/2028 | 2nd Most Recent NOI (As of)(4): | $8,011,118 (12/31/2017) | |
| Interest-only Period: | 120 months | Most Recent NOI (As of)(4)(5): | $8,061,391 (TTM 7/31/2018) | |
| Original Term: | 120 months | UW Economic Occupancy: | 91.3% | |
| Original Amortization Term: | None | UW Revenues: | $13,867,956 | |
| Amortization Type: | Interest Only | UW Expenses: | $3,011,132 | |
| Call Protection: | L(25),Grtr1%orYM(91),O(4) | UW NOI(5): | $10,856,824 | |
| Lockbox / Cash Management: | Hard / Springing | UW NCF: | $10,069,241 | |
| Additional Debt: | Yes | Appraised Value / Per SF(6): | $172,290,000 / $266 | |
| Additional Debt Balance: | $44,325,000 | Appraisal Date(6): | 10/1/2018 | |
| Additional Debt Type: | Pari Passu | |||
| Escrows and Reserves(7) | Financial Information(2) | ||||||||||||
| Initial | Monthly | Initial Cap | Cut-off Date Loan / SF: | $152 | |||||||||
| Taxes: | $0 | Springing | N/A | Maturity Date Loan / SF: | $152 | ||||||||
| Insurance: | $0 | Springing | N/A | Cut-off Date LTV(6): | 57.2% | ||||||||
| Replacement Reserves: | $0 | Springing | N/A | Maturity Date LTV(6): | 57.2% | ||||||||
| TI/LC: | $0 | Springing | $5,000,000 | UW NCF DSCR: | 2.08x | ||||||||
| Other: | $233,500 | $0 | N/A | UW NOI Debt Yield: | 11.0% | ||||||||
| Sources and Uses | |||||||||||||
| Sources | Proceeds | % of Total | Uses | Proceeds | % of Total | ||||||||
| Whole Loan(2) | $98,500,000 | 100.0% | Payoff Existing Debt(8) | $90,167,460 | 91.5% | ||||||||
| Return of Equity | 6,925,611 | 7.0 | |||||||||||
| Closing Costs | 1,173,429 | 1.2 | |||||||||||
| Upfront Reserves | 233,500 | 0.2 | |||||||||||
| Total Sources | $98,500,000 | 100.0% | Total Uses | $98,500,000 | 100.0% | ||||||||
| (1) | The GNL Portfolio Whole Loan, as defined in “The Loan” below, was co-originated by KeyBank and Société Générale Financial Corporation (“Société Générale”). |
| (2) | The GNL Portfolio Mortgage Loan, as defined in “The Loan” below, is part of a whole loan evidenced by threepari passu notes with an aggregate original principal balance of $98.5 million. The financial information presented in the chart above is based on the $98.5 million GNL Portfolio Whole Loan. |
| (3) | The borrowers for the GNL Portfolio Whole Loan include ARG FEGRFMT001, LLC, ARC MPSTLMO001, LLC, ARG NSALNTX001, LLC, ARC NSSNJCA001, LLC, ARC PNEREPA001, LLC, ARC PPHHTKY001, LLC, and ARC WIODSTX001, LLC. |
| (4) | The FedEx Ground Property and NetScout Systems Property (as defined in “The Properties” below) were constructed in 2017 and 2018, respectively. Therefore, the FedEx Ground property is excluded from 4th Most Recent NOI and 3rd Most Recent NOI, while the NetScout Systems property is excluded from 4th Most Recent NOI, 3rdMost Recent NOI, 2nd Most Recent NOI, and Most Recent NOI. |
| (5) | The increase in UW NOI from Most Recent NOI is primarily due to NetScout Systems’ recent lease commencement date of August 6, 2018. NetScout Systems is the second largest tenant by net rentable area and annual underwritten base rent. |
| (6) | The Appraised Value / Per SF, Appraisal Date, Cut-off Date LTV and Maturity Date LTV are calculated based on the appraised value of $172,290,000, which reflects an approximately 1.2% premium attributed to the aggregate “as-is” value of the individual GNL Portfolio properties. The sum of the values of each of the properties on an individual basis is $170,205,000, which represents a Cut-off Date LTV and Maturity Date LTV of 57.9%. |
| (7) | For a full description of Escrows and Reserves, please refer to “Escrows and Reserves” below. |
| (8) | Proceeds from the GNL Portfolio Whole Loan were used primarily to pay down a portion of a KeyBank credit facility for all but one of the GNL Portfolio Properties. |
THE INFORMATION IN THIS STRUCTURAL AND COLLATERAL TERM SHEET IS NOT COMPLETE AND MAY BE AMENDED PRIOR TO THE TIME OF SALE. THIS TERM SHEET IS NOT AN OFFER TO SELL THESE SECURITIES AND IT IS NOT A SOLICITATION OF AN OFFER TO BUY THESE SECURITIES IN ANY JURISDICTION WHERE THE OFFER OR SALE IS NOT PERMITTED.
| | 58 | |
| Structural and Collateral Term Sheet | BBCMS 2018-C2 | |
| GNL Portfolio | ||
The Loan.The GNL Portfolio mortgage loan is secured by a first mortgage lien on the borrowers’ fee interest in seven office and industrial buildings located in six states. The whole loan was co-originated by KeyBank and Société Générale and has an outstanding principal balance as of the Cut-off Date of $98.5 million (the “GNL Portfolio Whole Loan”). The GNL Portfolio Whole Loan is comprised of threepari passu notes, Note A-1, Note A-2, and Note A-3. Note A-1, with an outstanding principal balance as of the Cut-off Date of approximately $54.2 million, is being contributed to the BBCMS 2018-C2 Trust (the “GNL Portfolio Mortgage Loan”). Note A-2 and Note A-3 are held by Société Générale, have an aggregate outstanding principal balance as of the Cut-off Date of approximately $44.3 million, and are expected to be contributed to the UBS 2018-C14 trust. Note A-1 is the controlling note under the related co-lender agreement, the rights of which will be exercised under this securitization (or, prior to the occurrence and continuance of a control termination event under the pooling and servicing agreement, the directing certificateholder);however, the holders of Note A-2 and Note A-3 will be entitled, under certain circumstances, to be consulted with respect to certain major decisions. The GNL Portfolio Whole Loan has a 10-year term and is interest-only for the full term of the loan.
| Whole Loan Summary | |||
| Note | Original Balance | Note Holder | Controlling Piece |
| A-1 | $54,175,000 | BBCMS 2018-C2 | Yes |
| A-2 | 34,325,000 | UBS 2018-C14 | No |
| A-3 | 10,000,000 | UBS 2018-C14 | No |
| Total | $98,500,000 | ||
The Properties. The GNL Portfolio is comprised of seven single-tenant office and industrial buildings with an aggregate of 647,713 square feet (the “GNL Portfolio Properties”). The loan sponsor acquired the GNL Portfolio Properties in separate transactions between August 2013 and August 2018 and subsequently completed capital repairs at the GNL Portfolio Properties, bringing the loan sponsor’s total cost basis to approximately $158.0 million and resulting in a loan-to-cost ratio of 62.3%.
The GNL Portfolio is geographically diverse with properties located in six different states and seven different markets. The three largest states by allocated loan amount are California (39.4%), Texas (35.2%), and Missouri (11.1%), which account for approximately 34.4%, 31.6%, and 16.7% of underwritten net cash flow, respectively. The remaining three properties, located in Kentucky, Pennsylvania and Montana, do not individually account for more than 6.1% of the allocated loan amount or 7.4% of underwritten net cash flow.
| Portfolio Summary | |||||||
| Property Name, Location | Property Type – Subtype | Net Rentable Area (SF) | Year Built / Renovated | Allocated Whole Loan Amount (“ALA”) | % of ALA | Appraised Value(1) | UW NCF |
Nimble Storage San Jose, CA | Office – Suburban | 164,608 | 1979-1982 / 2013 | $38,773,831 | 39.4% | $67,000,000 | $3,463,748 |
NetScout Systems Allen, TX | Office – Suburban | 144,779 | 2018 / N/A | 32,627,890 | 33.1 | 56,380,000 | 2,956,824 |
Mallinckrodt St. Louis, MO | Office – R&D Lab | 89,900 | 1980, 2008 / 2017 | 10,937,693 | 11.1 | 18,900,000 | 1,680,940 |
PPD Global Labs Highland Heights, KY | Office – R&D Lab | 73,220 | 1983 / 2015 | 6,018,625 | 6.1 | 10,400,000 | 748,870 |
PNC Bank Erie, PA | Office – CBD | 97,203 | 1909, 1968 / 2000 | 4,513,968 | 4.6 | 7,800,000 | 624,797 |
FedEx Ground Great Falls, MT | Industrial – Warehouse/Distribution | 58,148 | 2017 / N/A | 3,544,623 | 3.6 | 6,125,000 | 373,661 |
Weatherford International Odessa, TX | Industrial – Warehouse | 19,855 | 1950 / 2010 | 2,083,370 | 2.1 | 3,600,000 | 220,400 |
| Total | 647,713 | $98,500,000 | 100.0% | $172,290,000 | $10,069,241 | ||
| (1) | Portfolio Appraised Value of $172,290,000 reflects an approximately 1.2% premium attributed to the aggregate value of the GNL Portfolio Properties as a whole. The sum of the “as-is” appraised values of each of the GNL Portfolio Properties on an individual basis, which individual values are reflected in the table above, was $170,205,000 as of September and October 2018. |
THE INFORMATION IN THIS STRUCTURAL AND COLLATERAL TERM SHEET IS NOT COMPLETE AND MAY BE AMENDED PRIOR TO THE TIME OF SALE. THIS TERM SHEET IS NOT AN OFFER TO SELL THESE SECURITIES AND IT IS NOT A SOLICITATION OF AN OFFER TO BUY THESE SECURITIES IN ANY JURISDICTION WHERE THE OFFER OR SALE IS NOT PERMITTED.
| | 59 | |
| Structural and Collateral Term Sheet | BBCMS 2018-C2 | |
| GNL Portfolio | ||
| GNL Portfolio 2018 Demographic Summary(1) | ||||||||
| Property Name | City, State | 1-mile Population | 3-mile Population | 5-mile Population | 1-mile Average Household Income | 3-mile Average Household Income | 5-mile Average Household Income | |
| Nimble Storage | San Jose, CA | 27,222 | 114,591 | 404,756 | $175,817 | $149,191 | $129,620 | |
| NetScout Systems | Allen, TX | 6,089 | 111,007 | 277,810 | $151,162 | $126,210 | $124,827 | |
| Mallinckrodt | St. Louis, MO | 11,706 | 110,800 | 312,025 | $102,906 | $105,910 | $97,637 | |
| PPD Global Labs | Highland Heights, KY | 4,801 | 58,468 | 143,096 | $103,020 | $71,484 | $74,433 | |
| PNC Bank | Erie, PA | 22,338 | 95,511 | 151,312 | $35,633 | $52,541 | $59,167 | |
| FedEx Ground | Great Falls, MT | 1,752 | 16,486 | 46,807 | $50,582 | $60,635 | $58,185 | |
| Weatherford International | Odessa, TX | 1,008 | 13,261 | 30,644 | $137,953 | $117,747 | $99,889 | |
| (1) | Source: third party market research reports. |
Nimble Storage (164,608 SF, 25.4% NRA, 39.4% ALA). The Nimble Storage property consists of three, two-story office buildings constructed between 1979 and 1982 and renovated in 2013 (the “Nimble Storage Property”). The buildings feature open office areas, private offices, conference and meeting rooms, break rooms, and engineering labs. The Nimble Storage Property has additional amenities that include an outdoor courtyard with seating, a barbeque grill, and a bocce ball court, indoor bicycle storage, and a fitness room. Nimble Storage occupies 100.0% of the net rentable area through October 2021, with one, five-year renewal option at fair market rent. The lease does not provide any termination or contraction options.
Located on approximately 9.82 acres, the Nimble Storage Property is located in San Jose, California, approximately four miles northwest of the San Jose central business district and within the southern portion of the San Francisco Bay area. The immediately surrounding area predominantly consists of office and R&D facilities and is occupied by several notable high-technology firms, including AT&T, Canon, Cisco Systems, PayPal, and Samsung. This technology-concentrated area, referred to as the Golden Triangle of Silicon Valley, is bounded by State Highway 237 to the north, U.S. Highway 101 to the south, and Interstate 880 to the east, all three of which provide access to the Nimble Storage Property. According to a third-party market research report, the Nimble Storage Property is located in the San Jose North submarket of the Silicon Valley office market. The submarket contains approximately 11.6 million square feet of office inventory, has an overall vacancy of 13.8% and an average annual rental rate of $40.44 per square foot. The appraisal indicated that the higher submarket vacancy, relative to the market vacancy of 8.2%, reflects the significant repositioning of older developments, which are currently under renovation and are available for lease.
Founded in 2008, Nimble Storage is an information technology company focused on providing external networked data storage products and solutions to corporate customers. In 2017, Hewlett Packard Enterprise (NYSE: HPE) (rated Baa2/BBB/BBB+ by Moody’s/S&P/Fitch) (“HPE”) acquired Nimble Storage for approximately $1 billion and Nimble Storage is now fully integrated into HPE. HPE is a global technology company that offers enterprise technology solutions and services, including servers, storage, and networking, as well as financial services.
NetScout Systems (144,779 SF, 22.4% NRA, 33.1% ALA). The NetScout Systems property is a three-story, class A, single-tenant office building that was constructed as a build-to-suit in 2018 (the “NetScout Systems Property”). The office building includes a 482-space, four-story parking garage located on the west side of the office building. Amenities at the NetScout Systems Property include a cafeteria, a fitness center, and an outdoor courtyard with a turf putting green and a patio with a grilling area. NetScout Systems (“NetScout”) occupies 100.0% of the net rentable area through August 2030, with three, five-year renewal options at fair market rent. The lease does not provide any termination or contraction options.
The NetScout Systems Property is located in Allen, Texas, approximately 25.0 miles north of the Dallas central business district and part of the greater Dallas-Fort Worth-Arlington, TX metropolitan statistical area (“Dallas MSA”). The Dallas MSA had an estimated 2017 population of approximately 7.5 million, making it the fourth most populous metropolitan area in the United States. The NetScout Systems Property is situated within a commercial office and retail area, as well as a densely populated residential neighborhood. The NetScout Systems Property benefits from proximity to U.S. Highway 75, which is located east of the NetScout Systems Property and provides direct access to downtown Dallas. According to a third-party market research report, the NetScout Systems Property is located in the Dallas/Ft. Worth office market and the Allen/McKinney office submarket. The submarket consists of approximately 9.1 million square feet of office inventory, has an overall vacancy rate of 10.3%, and average asking rents of $27.69 per square foot.
NetScout (NASDAQ: NTCT) is a provider of business assurance, which encompasses service assurance, cybersecurity, and business intelligence solutions. NetScout oversees the designing, developing, manufacturing, marketing, selling, and supporting of products that assure the performance and availability of critical business applications and services in complex, high-speed networks. NetScout was
THE INFORMATION IN THIS STRUCTURAL AND COLLATERAL TERM SHEET IS NOT COMPLETE AND MAY BE AMENDED PRIOR TO THE TIME OF SALE. THIS TERM SHEET IS NOT AN OFFER TO SELL THESE SECURITIES AND IT IS NOT A SOLICITATION OF AN OFFER TO BUY THESE SECURITIES IN ANY JURISDICTION WHERE THE OFFER OR SALE IS NOT PERMITTED.
| | 60 | |
| Structural and Collateral Term Sheet | BBCMS 2018-C2 | |
| GNL Portfolio | ||
founded in 1984 and is headquartered in Westford, Massachusetts. NetScout reported total revenues for fiscal year 2018 of approximately $986.8 million, with net income of approximately $79.8 million.
Mallinckrodt(89,900 SF, 13.9% NRA, 11.1% ALA). The Mallinckrodt property consists of three interconnected three-story office and R&D buildings, two of which were primarily constructed in 1980 with renovations completed by 2004 and are utilized as office and laboratory space (the “Mallinckrodt Property”). The third building was constructed in 2008 and is a pharmaceutical pilot production plant. Mallinckrodt Pharmaceuticals (“Mallinckrodt”) has occupied 100.0% of the Mallinckrodt Property since 2004 subject to a current lease expiration in August 2024, with two, five-year renewal options at fair market rent. The lease does not provide any termination or contraction options. Mallinckrodt completed a $5 million renovation in 2017 that covered approximately 50% of the Mallinckrodt Property and included reconfiguration of offices and cafeteria space, the addition of third-floor office space in place of a two-story atrium, and resealing and reconfiguration of the parking lot.
The Mallinckrodt Property is located in St. Louis, Missouri within St. Louis County, which is approximately 13 miles west of the St. Louis central business district. The Mallinckrodt Property is a part of the Owen Ridge office park, a planned development which consists of various office, R&D, and industrial uses. The Mallinckrodt Property is situated within close proximity to multiple major thoroughfares, including Interstates 64 and 44, which both provide the area with access to the greater St. Louis metropolitan area. According to a third-party market research report, the Mallinckrodt Property is located in the St. Louis office market and the Brentwood/Maplewood office submarket. The submarket has approximately 2.4 million square feet of office inventory, an overall vacancy rate of 2.2%, and average asking rents of $18.97 per square foot. The St. Louis office market as a whole contains 32 R&D properties totaling 2.7 million square feet with a vacancy rate of 5.3%.
Mallinckrodt (NYSE: MNK) (rated NA/B+/NA by Moody’s/S&P/Fitch) is a specialty pharmaceutical company that develops, manufactures, markets, and distributes specialty pharmaceutical products and diagnostic imaging agents. Founded in 1867 in St. Louis, Mallinckrodt’s global headquarters is located in Staines-upon-Thames, United Kingdom, while its U.S. headquarters remains in St. Louis.
Environmental.According to Phase I environmental assessments dated October 2018, there was no evidence of any recognized environmental conditions at the GNL Portfolio Properties; however, there was a controlled recognized environmental condition at the Mallinckrodt Property. From the early 1920s until 1998, the Mallinckrodt Property and the surrounding area were previously part of a petrochemical plant campus, known as Baker Petrolite. Prior soil and groundwater contamination was present throughout the former Baker Petrolite campus and Baker Hughes was identified as the responsible party. The campus was enrolled in a voluntary cleanup program and the impacted soils have been remediated with the only residual impacted soils over 400 feet north of the Mallinckrodt Property. No further investigation was recommended in the Phase I environmental assessment except to continue the ongoing monitoring and cleanup as part of the voluntary cleanup program.
| Historical and Current Occupancy(1)(2) | |||
| 2015 | 2016 | 2017 | Current(3) |
| 100.0% | 100.0% | 100.0% | 100.0% |
| (1) | Historical Occupancies are as of December 31 of each respective year. |
| (2) | The FedEx Ground Property and NetScout Systems Property were constructed in 2017 and 2018, respectively. These tenants are excluded from occupancy figures for the years prior to the respective build dates. |
| (3) | Current Occupancy is as of November 9, 2018. |
THE INFORMATION IN THIS STRUCTURAL AND COLLATERAL TERM SHEET IS NOT COMPLETE AND MAY BE AMENDED PRIOR TO THE TIME OF SALE. THIS TERM SHEET IS NOT AN OFFER TO SELL THESE SECURITIES AND IT IS NOT A SOLICITATION OF AN OFFER TO BUY THESE SECURITIES IN ANY JURISDICTION WHERE THE OFFER OR SALE IS NOT PERMITTED.
| | 61 | |
| Structural and Collateral Term Sheet | BBCMS 2018-C2 | |
| GNL Portfolio | ||
| Top Seven Tenant Summary(1) | |||||||
| Tenant | Ratings(2) Moody’s/S&P/Fitch | Net Rentable Area (SF) | % of Total NRA | Base Rent PSF | Base Rent | % of Total Base Rent | Lease Expiration Date |
| Nimble Storage | Baa2 / BBB / BBB+ | 164,608 | 25.4% | $26.12 | $4,299,912 | 35.1% | 10/31/2021 |
| NetScout Systems | NA / NA / NA | 144,779 | 22.4 | $25.03 | 3,623,818 | 29.6 | 8/31/2030 |
| PNC Bank | A3 / A- / A+ | 97,203 | 15.0 | $7.65 | 744,017 | 6.1 | 7/31/2029 |
| Mallinckrodt Pharmaceuticals | NA / B+ / NA | 89,900 | 13.9 | $22.14 | 1,990,578 | 16.3 | 8/31/2024 |
| PPD Global Labs | NA / NA / NA | 73,220 | 11.3 | $12.24 | 895,910 | 7.3 | 12/31/2024 |
| FedEx Ground | Baa2 / BBB / NA | 58,148 | 9.0 | $7.58 | 440,863 | 3.6 | 6/30/2026 |
| Weatherford International | NA / B / NA | 19,855 | 3.1 | $12.29 | 244,055 | 2.0 | 11/1/2025 |
| Top Seven Tenants | 647,713 | 100.0% | $18.90 | $12,239,153 | 100.0% | ||
| Occupied Collateral Total | 647,713 | 100.0% | $18.90 | $12,239,153 | 100.0% | ||
| Vacant Space | 0 | 0.0% | |||||
| Collateral Total | 647,713 | 100.0% | |||||
| (1) | Based on the underwritten rent roll. |
| (2) | Ratings provided are for the parent company of the entity listed in the “Tenant” field whether or not the parent company guarantees the lease. |
| Lease Rollover Schedule(1) | |||||||||
| Year | Number of Leases Expiring | Net Rentable Area Expiring | % of NRA Expiring | Base Rent Expiring | % of Base Rent Expiring | Cumulative Net Rentable Area Expiring | Cumulative % of NRA Expiring | Cumulative Base Rent Expiring | Cumulative % of Base Rent Expiring |
| Vacant | NAP | 0 | 0.0% | NAP | NAP | 0 | 0.0% | NAP | NAP |
| 2018 & MTM | 0 | 0 | 0.0 | $0 | 0.0% | 0 | 0.0% | $0 | 0.0% |
| 2019 | 0 | 0 | 0.0 | 0 | 0.0 | 0 | 0.0% | $0 | 0.0% |
| 2020 | 0 | 0 | 0.0 | 0 | 0.0 | 0 | 0.0% | $0 | 0.0% |
| 2021 | 1 | 164,608 | 25.4 | 4,299,912 | 35.1 | 164,608 | 25.4% | $4,299,912 | 35.1% |
| 2022 | 0 | 0 | 0.0 | 0 | 0.0 | 164,608 | 25.4% | $4,299,912 | 35.1% |
| 2023 | 0 | 0 | 0.0 | 0 | 0.0 | 164,608 | 25.4% | $4,299,912 | 35.1% |
| 2024 | 2 | 163,120 | 25.2 | 2,886,488 | 23.6 | 327,728 | 50.6% | $7,186,400 | 58.7% |
| 2025 | 1 | 19,855 | 3.1 | 244,055 | 2.0 | 347,583 | 53.7% | $7,430,455 | 60.7% |
| 2026 | 1 | 58,148 | 9.0 | 440,863 | 3.6 | 405,731 | 62.6% | $7,871,318 | 64.3% |
| 2027 | 0 | 0 | 0.0 | 0 | 0.0 | 405,731 | 62.6% | $7,871,318 | 64.3% |
| 2028 & Beyond | 2 | 241,982 | 37.4 | 4,367,835 | 35.7 | 647,713 | 100.0% | $12,239,153 | 100.0% |
| Total | 7 | 647,713 | 100.0% | $12,239,153 | 100.0% | ||||
| (1) | Based on the underwritten rent roll. |
THE INFORMATION IN THIS STRUCTURAL AND COLLATERAL TERM SHEET IS NOT COMPLETE AND MAY BE AMENDED PRIOR TO THE TIME OF SALE. THIS TERM SHEET IS NOT AN OFFER TO SELL THESE SECURITIES AND IT IS NOT A SOLICITATION OF AN OFFER TO BUY THESE SECURITIES IN ANY JURISDICTION WHERE THE OFFER OR SALE IS NOT PERMITTED.
| | 62 | |
| Structural and Collateral Term Sheet | BBCMS 2018-C2 | |
| ||
| GNL Portfolio | ||
| Operating History and Underwritten Net Cash Flow(1) | |||||||
| 2015 | 2016 | 2017 | TTM(2) | Underwritten | Per Square Foot | %(3) | |
| Rents in Place(4)(5) | $7,276,078 | $7,448,113 | $7,976,062 | $8,283,594 | $12,174,621 | $18.80 | 80.1% |
| Straight-Line Rent(6) | 0 | 0 | 0 | 0 | 64,532 | 0.10 | 0.4 |
| Gross Potential Rent | $7,276,078 | $7,448,113 | $7,976,062 | $8,283,594 | $12,239,153 | $18.90 | 80.5% |
| Total Reimbursements | 1,526,397 | 1,145,781 | 1,575,833 | 1,481,292 | 2,958,184 | 4.57 | 19.5 |
| Net Rental Income | $8,802,475 | $8,593,894 | $9,551,894 | $9,764,886 | $15,197,337 | $23.46 | 100.0% |
| (Vacancy/Credit Loss) | 0 | 0 | 0 | 0 | (1,329,381) | (2.05) | (8.7) |
| Other Income | 15,061 | 13,310 | 13,310 | 0 | 0 | 0.00 | 0.0 |
| Effective Gross Income | $8,817,537 | $8,607,204 | $9,565,204 | $9,764,886 | $13,867,956 | $21.41 | 91.3% |
| Total Expenses | $1,552,230 | $1,199,606 | $1,554,087 | $1,703,495 | $3,011,132 | $4.65 | 21.7% |
| Net Operating Income | $7,265,307 | $7,407,598 | $8,011,118 | $8,061,391 | $10,856,824 | $16.76 | 78.3% |
| Total TI/LC, Capex/RR | 0 | 0 | 0 | 0 | 787,584 | 1.22 | 5.7 |
| Net Cash Flow | $7,265,307 | $7,407,598 | $8,011,118 | $8,061,391 | $10,069,241 | $15.55 | 72.6% |
| (1) | The FedEx Ground Property and NetScout Systems Property were constructed in 2017 and 2018, respectively. Therefore, the FedEx Ground property is excluded from 2015 and 2016 historical cash flows, while the NetScout Systems Property is excluded from 2015, 2016, 2017, and TTM cash flows. |
| (2) | TTM reflects the trailing 12-month period ending July 2018. |
| (3) | Percentage column represents percent of Net Rental Income for all revenue lines and represents percent of Effective Gross Income for the remainder of fields. |
| (4) | Underwritten Rents in Place are based on the underwritten rent roll dated August 31, 2018 and include contractual rent steps through November 2019 in the amount of $154,022. |
| (5) | The increase in Underwritten Rents in Place from TTM is primarily due to NetScout’s recent lease commencement date of August 6, 2018. NetScout is the second largest tenant by net rentable area and annual underwritten base rent. |
| (6) | Straight-Line Rent represents $64,532 in average contractual rent increases for the investment grade tenant PNC Bank through the term of its lease |
The Borrowers. The borrowing entities for the GNL Portfolio Whole Loan are ARG FEGRFMT001, LLC, ARC MPSTLMO001, LLC, ARG NSALNTX001, LLC, ARC NSSNJCA001, LLC, ARC PNEREPA001, LLC, ARC PPHHTKY001, LLC, and ARC WIODSTX001, LLC, each a Delaware limited liability company and special purpose entity with two independent directors. Legal counsel to the borrowers delivered a non-consolidation opinion in connection with the origination of the GNL Portfolio Whole Loan.
The Loan Sponsor.The loan sponsor and nonrecourse carve-out guarantor is Global Net Lease Operating Partnership, L.P., a Delaware limited partnership and the business operations entity of Global Net Lease, Inc. (NYSE: GNL) (“GNL”). Founded in 2011, GNL is a publicly traded real estate investment trust focused on acquiring a diversified global portfolio of commercial properties, with an emphasis on sale-leaseback transactions involving single tenant, mission critical, income producing net-lease assets across the United States and western and northern Europe. As of June 30, 2018, GNL owned a portfolio of 333 properties totaling approximately 25.0 million square feet. GNL is an affiliate of AR Global Investments, LLC, which has raised and invested over $30.0 billion in capital, served over 150,000 shareholders and grown to one of the largest external managers of direct investment programs in the United States. See “Description of the Mortgage Pool—Litigation and Other Considerations” in the Preliminary Prospectus.
Property Management. The GNL Portfolio Properties are managed by Global Net Lease Properties, LLC, an affiliate of the borrower.
Escrows and Reserves. At origination, the borrowers were required to deposit into escrow $233,500 for required repairs.
Tax Escrows – There is no requirement for the borrowers to make monthly deposits into the tax escrow for each respective property so long as (i) no event of default exists, (ii) each applicable lease is in full force and effect and requires the applicable tenant to pay taxes directly and such tenant pays all applicable taxes prior to the due date thereof, (iii) the borrowers have delivered to lender copies of all tax bills within 30 days of receipt and (iv) the lender has received reasonably satisfactory evidence that all applicable taxes have been paid as and when required pursuant to the mortgage loan documents with respect to the applicable property.
Insurance Escrows – There is no requirement for the borrowers to make deposits to the insurance escrow so long as the property is insured under a blanket insurance policy in accordance with the mortgage loan documents, until and unless the lender elects to apply such requirement as required in the mortgage loan documents.
THE INFORMATION IN THIS STRUCTURAL AND COLLATERAL TERM SHEET IS NOT COMPLETE AND MAY BE AMENDED PRIOR TO THE TIME OF SALE. THIS TERM SHEET IS NOT AN OFFER TO SELL THESE SECURITIES AND IT IS NOT A SOLICITATION OF AN OFFER TO BUY THESE SECURITIES IN ANY JURISDICTION WHERE THE OFFER OR SALE IS NOT PERMITTED.
| | 63 | |
| Structural and Collateral Term Sheet | BBCMS 2018-C2 | |
| ||
| GNL Portfolio | ||
Replacement Reserves – There is no requirement for the borrowers to make monthly deposits into the replacement reserve account so long as no Cash Sweep Period (as defined below) has occurred and is continuing. Following the occurrence and during the continuance of a Cash Sweep Period, the borrowers are required to make monthly deposits equal to $0.25 multiplied by the then existing aggregate net leasable area of the applicable property, divided by 12, for replacement reserves.
TI/LC Reserves – There is no requirement for the borrowers to make monthly deposits to the TI/LC reserve account so long as no Cash Sweep Period has occurred and is continuing. Following the occurrence and during the continuance of a Cash Sweep Period, the borrowers are required to make monthly deposits equal to $1.00 multiplied by the then existing aggregate net leasable area of the applicable property, divided by 12, for TI/LC reserves, up to a cap of $5,000,000. In lieu of monthly deposits, the borrowers will be allowed to deposit an unconditional irrevocable letter of credit in the amount set forth in the mortgage loan documents, and on every third payment date thereafter occurring during the existence of a Cash Sweep Period, the borrowers are required to cause the letter of credit to be increased by an amount equal to $1.00 multiplied by the then existing aggregate net leasable area of the applicable property, divided by four, up to a cap of $5,000,000.
Major Tenant Rollover Reserves – The borrower is required to deposit excess cash flow generated by the GNL Portfolio Properties following the occurrence of a Major Tenant Cash Flow Sweep (as defined below).
Minor Tenant Rollover Reserves – The borrower is required to deposit excess cash flow generated by the GNL Portfolio Properties following the occurrence of a Minor Tenant Cash Flow Sweep (as defined below).
Lockbox / Cash Management.The GNL Portfolio Whole Loan is structured with a hard lockbox and springing cash management. The borrowers were required to send direction letters to all tenants instructing them to deposit all rents directly into a clearing account controlled by the lender. Notwithstanding the foregoing, the borrowers and property manager are required to deposit all revenues otherwise received into the clearing account within two business days of receipt. Provided no Cash Sweep Period is in effect, all funds in the clearing account will be transferred to an account controlled by the borrowers. Upon the occurrence of a Cash Sweep Period, all sums on deposit in the clearing account are required to be transferred on a daily basis to a cash management account controlled by the lender and applied and disbursed in accordance with the mortgage loan documents, with any excess cash held by the lender as additional collateral for the GNL Portfolio Whole Loan during the continuance of such Cash Sweep Period.
A “Cash Sweep Period” means the occurrence of (i) an event of default and will continue until such event of default is cured, (ii) any bankruptcy action of the borrowers (in no event will a Cash Sweep Period due to a bankruptcy of the borrowers be cured), (iii) a Manager Sweep Event, (iv) any period that the interest-only debt service coverage ratio as calculated in the loan documents based on the trailing three-month period is less than 1.70x and will continue until such time as (x) the interest-only debt service coverage ratio for the immediately preceding three-month period is at least 1.70x for two consecutive calendar quarters (a “DSCR Cure”), (y) the borrower has delivered a letter of credit in an amount initially equal to the amount of excess cash flow for the immediately preceding three-month period, with such amount recalculated and increased every three-month period thereafter, up to any applicable capped amount (the “DSCR/Tenant Cure – Letter of Credit”), or (z) the borrower has completed a partial prepayment of the loan (including any prepayment consideration) to the extent required to achieve an interest-only debt service coverage ratio for the immediately preceding three-month period of 1.70x or greater, (v) a Major Tenant Cash Flow Sweep (as defined below) or (vi) a Minor Tenant Cash Flow Sweep (as defined below).
A “Manager Sweep Event” means (i) for a borrower affiliated manager, any bankruptcy action of the manager and (ii) for a manager that is not affiliated with the borrowers, (a) the date of the occurrence of an involuntary bankruptcy petition or (b) the date which is 60 days after the occurrence of any other bankruptcy action of such manager unless the manager is replaced with a qualified manager within such 60 day period. In any case, a Manager Sweep Event will continue until the property manager is replaced with a qualified manager under a replacement management agreement.
A “Major Tenant Cash Flow Sweep” will commence upon (i) any bankruptcy action of Nimble Storage or NetScout, any successor or assign thereof as tenant under the respective lease, or any subsequent tenant under a replacement lease (each a “Major Tenant”) or any person or entity that controls a Major Tenant, (ii) the earlier to occur of (a) the date a Major Tenant gives notice of its intention to vacate or abandon substantially all of its premises, or go dark at the premises or (b) the date that a Major Tenant vacates, abandons, surrenders, or goes dark at the applicable premises for five consecutive business days, (iii) the continuation of any default by a Major Tenant under its respective lease beyond any applicable notice and cure periods, or (iv) the earlier to occur of (a) the date of any early termination or cancellation of a Major Tenant lease or (b) the earlier to occur of the date (x) that is (1) 12 months prior to the then applicable expiration of the Nimble Storage lease or (2) nine months prior to the then applicable expiration of the NetScout lease or (y) on which notice for extension is due under the applicable lease and will continue until, in general, (A) with respect to clause (i), the applicable Major Tenant is no longer the subject of a bankruptcy or similar proceeding and has satisfied all other conditions under the mortgage loan documents, (B) with respect to clause (ii), the applicable Major Tenant has resumed operations at the premises and has
THE INFORMATION IN THIS STRUCTURAL AND COLLATERAL TERM SHEET IS NOT COMPLETE AND MAY BE AMENDED PRIOR TO THE TIME OF SALE. THIS TERM SHEET IS NOT AN OFFER TO SELL THESE SECURITIES AND IT IS NOT A SOLICITATION OF AN OFFER TO BUY THESE SECURITIES IN ANY JURISDICTION WHERE THE OFFER OR SALE IS NOT PERMITTED.
| | 64 | |
| Structural and Collateral Term Sheet | BBCMS 2018-C2 | |
| ||
| GNL Portfolio | ||
satisfied all other requirements under the mortgage loan documents, (C) with respect to clause (iii), the applicable Major Tenant has fully cured all applicable defaults under its lease, (D) the applicable Major Tenant has been replaced with an acceptable replacement tenant under the mortgage loan documents, (E) with respect to clause (ii), the applicable Major Tenant has subleased its premises to an acceptable subtenant under the mortgage loan documents and all other conditions under the mortgage loan documents have been satisfied, (F) with respect to clause (iv), the borrower has provided acceptable evidence to the lender that the applicable Major Tenant has renewed the term of its lease pursuant to the terms set forth therein, (G) funds swept as a result of a Major Tenant Cash Flow Sweep have reached (1) $7,400,000 if related to Nimble Storage, (2) $5,000,000 if related to NetScout, or (3) $12,400,000 if related to both Nimble Storage and NetScout, (H) the borrowers have delivered the DSCR/Tenant Cure – Letter of Credit, or (I) in the case of any Major Tenant Cash Flow Sweep except with respect to clause (iii), the occurrence of a DSCR Cure.
A “Minor Tenant Cash Flow Sweep” will commence upon the earlier to occur of (i) the date of any early termination or cancellation of the Mallinckrodt lease or the PPD Global Labs lease (each tenant, a “Minor Tenant”) or (ii) the earlier to occur of the date (a) that is 12 months prior to the then applicable expiration of the applicable lease (or any renewal or replacement thereof) or (b) on which notice for extension is due under the applicable lease. A Minor Tenant Cash Flow Sweep will continue until (i) the borrower has provided reasonably acceptable evidence to the lender that the applicable Minor Tenant has renewed the term of its lease pursuant to the terms set forth therein, (ii) the applicable Minor Tenant has been replaced with an acceptable replacement tenant under the mortgage loan documents, (iii) funds swept as a result of a Minor Tenant Cash Flow Sweep have reached (a) $2,700,000 if related to Mallinckrodt, (b) $2,300,000 if related to PPD Global Labs, or (c) $5,000,000 if related to both Mallinckrodt and PPD Global Labs, (iv) the borrowers have delivered a DSCR/Tenant Cure – Letter of Credit, or (v) the occurrence of a DSCR Cure.
Subordinate and Mezzanine Debt. None.
Partial Release.At any time after January 1, 2021, and prior to the GNL Portfolio Whole Loan maturity date, the GNL Portfolio borrowers may obtain the release of any of the GNL Portfolio Properties included in the GNL Portfolio Whole Loan,provided that, among other things, (i) no event of default has occurred and is continuing (other than an event of default which applies only to the property to be released), (ii) the borrowers prepay a portion of the GNL Portfolio Whole Loan equal to 115% (120% if released to a borrower affiliate) of the allocated loan amount of the property being released, (iii) the debt service coverage ratio for the remaining properties following the release based on the trailing 12 months is no less than the greater of (1) the interest-only debt service coverage ratio immediately preceding such release and (2) 2.08x and (iv) the debt yield for the remaining properties based on the trailing 12 months is no less than the greater of (1) the debt yield immediately preceding such release and (2) 10.22%.
Substitutions.The borrowers may obtain the release of any one or more of the GNL Portfolio Properties (individually or collectively, the “Release Property”) by providing one or more substitute properties (individually or collectively, the “Substitute Property”),provided that, among other things, (i) no event of default has occurred and is continuing (other than an event of default which applies only to the Release Property), (ii) such substitution is being requested in connection with (1) a sale of the Release Property to a third party that is not an affiliate of the borrowers or (2) a Major Tenant Cash Flow Sweep or a Minor Tenant Cash Flow Sweep with respect to the applicable tenant that occupies the Release Property, (iii) the borrowers will deliver to the lender rating agency confirmation as to the substitution, (iv) the lender has approved the Substitute Property in its reasonable discretion and has determined that the proposed substitution shall not materially adversely affect the GNL Portfolio Whole Loan, (v) after giving effect to the substitution, the debt yield for the trailing 12 months for all of the GNL Portfolio Properties will be equal to or greater than (1) 10.0% and (2) the debt yield for the trailing 12 months for all of the GNL Portfolio Properties immediately preceding such substitution, (vi) the borrowers will deliver to the lender an acceptable appraisal of each proposed Substitute Property and each proposed Release Property indicating an appraised value of the Substitute Property (as reflected in such acceptable appraisal) that is equal to or greater than the appraised value of the Release Property (as reflected in such acceptable appraisal) and (vii) the GNL Portfolio borrowers will deliver to the lender such other documents, instruments and agreements as the lender may reasonably require relating to such substitution (including any documents as may be reasonably required by a special servicer in a securitization). See “Description of the Mortgage Pool—Certain Terms of the Mortgage Loans—Partial Releases”.
THE INFORMATION IN THIS STRUCTURAL AND COLLATERAL TERM SHEET IS NOT COMPLETE AND MAY BE AMENDED PRIOR TO THE TIME OF SALE. THIS TERM SHEET IS NOT AN OFFER TO SELL THESE SECURITIES AND IT IS NOT A SOLICITATION OF AN OFFER TO BUY THESE SECURITIES IN ANY JURISDICTION WHERE THE OFFER OR SALE IS NOT PERMITTED.
| | 65 | |
| Structural and Collateral Term Sheet | BBCMS 2018-C2 | |
| Liberty Portfolio | ||
THE INFORMATION IN THIS STRUCTURAL AND COLLATERAL TERM SHEET IS NOT COMPLETE AND MAY BE AMENDED PRIOR TO THE TIME OF SALE. THIS TERM SHEET IS NOT AN OFFER TO SELL THESE SECURITIES AND IT IS NOT A SOLICITATION OF AN OFFER TO BUY THESE SECURITIES IN ANY JURISDICTION WHERE THE OFFER OR SALE IS NOT PERMITTED.
| | 66 | |
| Structural and Collateral Term Sheet | BBCMS 2018-C2 | |
| Liberty Portfolio | ||

THE INFORMATION IN THIS STRUCTURAL AND COLLATERAL TERM SHEET IS NOT COMPLETE AND MAY BE AMENDED PRIOR TO THE TIME OF SALE. THIS TERM SHEET IS NOT AN OFFER TO SELL THESE SECURITIES AND IT IS NOT A SOLICITATION OF AN OFFER TO BUY THESE SECURITIES IN ANY JURISDICTION WHERE THE OFFER OR SALE IS NOT PERMITTED.
| | 67 | |
| Structural and Collateral Term Sheet | BBCMS 2018-C2 | |
| Liberty Portfolio | ||
| Mortgage Loan Information | Property Information | |||
| Mortgage Loan Seller(1): | Barclays/CCRE | Single Asset / Portfolio: | Portfolio | |
| Original Principal Balance(2): | $50,000,000 | Title(4): | Fee/Leasehold | |
| Cut-off Date Principal Balance(2): | $50,000,000 | Property Type - Subtype: | Office – Suburban | |
| % of IPB: | 5.6% | Net Rentable Area (SF): | 805,746 | |
| Loan Purpose: | Acquisition | Location: | Various, AZ | |
| Borrower: | RS Phoenix Portfolio LLC | Year Built / Renovated: | Various / N/A | |
| Sponsor: | Bruce Karsh | Occupancy: | 100.0% | |
| Interest Rate: | 4.75500% | Occupancy Date: | 5/31/2018 | |
| Note Date: | 9/26/2018 | 4th Most Recent NOI (As of)(5): | $4,651,042 (12/31/2015) | |
| Maturity Date: | 10/6/2028 | 3rd Most Recent NOI (As of)(5): | $7,201,661 (12/31/2016) | |
| Interest-only Period: | 120 months | 2nd Most Recent NOI (As of)(5): | $8,748,230 (12/31/2017) | |
| Original Term: | 120 months | Most Recent NOI (As of)(5): | $14,502,825 (Annualized T-7 7/31/2018) | |
| Original Amortization Term: | None | UW Economic Occupancy: | 95.0% | |
| Amortization Type: | Interest Only | UW Revenues: | $19,169,391 | |
| Call Protection(3): | L(26),Def(91),O(3) | UW Expenses: | $4,059,580 | |
| Lockbox / Cash Management: | Hard / Springing | UW NOI(5): | $15,109,811 | |
| Additional Debt: | Yes | UW NCF: | $14,130,018 | |
| Additional Debt Balance: | $115,700,000 | Appraised Value / Per SF(6): | $256,700,000 / $319 | |
| Additional Debt Type: | Pari Passu | Appraisal Date(6): | Various | |
| Escrows and Reserves(7) | Financial Information(2) | ||||||
| Initial | Monthly | Initial Cap | Cut-off Date Loan / SF: | $206 | |||
| Taxes: | $89,189 | $44,594 | N/A | Maturity Date Loan / SF: | $206 | ||
| Insurance: | $18,366 | $9,183 | N/A | Cut-off Date LTV: | 64.6% | ||
| Replacement Reserves: | $0 | $13,429 | N/A | Maturity Date LTV: | 64.6% | ||
| TI/LC: | $0 | $0 | N/A | UW NCF DSCR: | 1.77x | ||
| Other: | $1,351,754 | $77,257 | N/A | UW NOI Debt Yield: | 9.1% | ||
| Sources and Uses | ||||||
| Sources | Proceeds | % of Total | Uses | Proceeds | % of Total | |
| Whole Loan(2) | $165,700,000 | 63.9% | Purchase Price | $255,000,000 | 98.3% | |
| Sponsor Equity | 92,058,681 | 35.5 | Closing Costs | 2,896,463 | 1.1 | |
| Other Sources(8) | 1,597,091 | 0.6 | Upfront Reserves | 1,459,309 | 0.6 | |
| Total Sources | $259,355,773 | 100.0% | Total Uses | $259,355,773 | 100.0% | |
| (1) | The Liberty Portfolio Whole Loan (as defined below) was co-originated by Barclays Bank PLC, Cantor Commercial Real Estate Lending, L.P. and Citi Real Estate Funding, Inc. Barclays Bank PLC will contribute the $25.0 million Note A-4 and Cantor Commercial Real Estate Lending, L.P. will contribute the $25.0 million Note A-6 to the BBCMS 2018-C2 Trust. |
| (2) | The Liberty Portfolio Whole Loan is part of a whole loan evidenced by eightpari passunotes with an aggregate original balance of $165.7 million. The Financial Information presented in the chart above reflects the Cut-off Date balance of the Liberty Portfolio Whole Loan. |
| (3) | The lockout period will be at least 26 payments beginning with and including November 6, 2018. Defeasance of the full $165.7 million Liberty Portfolio Whole Loan is permitted after the date that is the earlier of (i) two years from the closing date of the securitization that includes the last note to be securitized and (ii) September 26, 2021. |
| (4) | For a full description, please refer to “Tax Abatements”below. |
| (5) | The difference between 4th Most Recent NOI, 3rd Most Recent NOI, 2ndMost Recent NOI, Most Recent NOI, and UW NOI is primarily attributable to the construction and stabilization of the Liberty Center at Rio Salado property. The Liberty Center at Rio Salado property consists of four buildings: 1850 West Rio Salado Parkway (built in 2014 and represents approximately 18.0% of UW NOI), 1870 West Rio Salado Parkway (built in 2017 and represents approximately 29.9% of UW NOI), 1910 West Rio Salado Parkway (built in 2014 and represents approximately 20.0% of UW NOI), and 1930 West Rio Salado Parkway (built in 2016 and represents approximately 16.8% of UW NOI). The 8501 East Raintree Drive property was built in 2006 and represents approximately 15.4% of UW NOI. The Liberty Portfolio properties are both 100.0% leased and all outstanding landlord obligations and free rent were reserved at origination. |
| (6) | The Appraised Value of $256,700,000 represents the aggregate value of the Liberty Portfolio Properties (as defined below). The Liberty Center at Rio Salado property had an “As-Is” appraised value of $212,910,000 as of August 22, 2018, and the 8501 East Raintree Drive Property had an “As-Is” appraised value of $43,790,000 as of August 24, 2018. |
| (7) | For a full description of escrows and reserves, please refer to “Escrows and Reserves” below. |
| (8) | Other Sources primarily consists of purchase credits relating to outstanding tenant improvement allowances owed to Centene and The Vanguard Group. |
THE INFORMATION IN THIS STRUCTURAL AND COLLATERAL TERM SHEET IS NOT COMPLETE AND MAY BE AMENDED PRIOR TO THE TIME OF SALE. THIS TERM SHEET IS NOT AN OFFER TO SELL THESE SECURITIES AND IT IS NOT A SOLICITATION OF AN OFFER TO BUY THESE SECURITIES IN ANY JURISDICTION WHERE THE OFFER OR SALE IS NOT PERMITTED.
| | 68 | |
| Structural and Collateral Term Sheet | BBCMS 2018-C2 | |
| Liberty Portfolio | ||
The Loan.The Liberty Portfolio loan has an outstanding principal balance as of the Cut-off Date of $50.0 million and is secured by the borrower’s fee and leasehold interests in a two-property Class A office portfolio located in Arizona, totaling 805,746 square feet of fully occupied space. The Liberty Portfolio loan is part of a whole loan (the “Liberty Portfolio Whole Loan”) evidenced by eightpari passunotes with an aggregate original principal balance of $165.7 million and an outstanding principal balance as of the Cut-off Date of $165.7 million. Note A-1 will be entitled to exercise the rights of the controlling noteholder for the Liberty Portfolio Whole Loan. The Liberty Portfolio Whole Loan has a 10-year term and is interest-only for the full term of the loan.
| Whole Loan Summary | |||
| Note | Original Balance | Note Holder | Controlling Piece |
| A-1 | $30,000,000 | Benchmark 2018-B7 | Yes |
| A-2 | 30,000,000 | CGCMT 2018-C6 | No |
| A-3 | 20,000,000 | Benchmark 2018-B7 | No |
| A-4 | 25,000,000 | BBCMS 2018-C2 | No |
| A-5 | 12,850,000 | Barclays Bank PLC | No |
| A-6 | 25,000,000 | BBCMS 2018-C2 | No |
| A-7 | 12,850,000 | CGCMT 2018-C6 | No |
| A-8 | 10,000,000 | CGCMT 2018-C6 | No |
| Total | $165,700,000 | ||
The Portfolio.
| Portfolio Summary(1) | ||||||||
| Property Name | Largest Tenant | Property Type | Net Rentable Area (NRA) | Occupancy | Allocated Loan Amount ($) | % of Allocated Loan Amount | UW NCF | Appraised Value |
| Liberty Center at Rio Salado | Centene | Office | 682,406 | 100.0% | $42,467,603 | 84.9% | $11,962,700 | $212,910,000 |
| 8501 East Raintree Drive | The Vanguard Group | Office | 123,340 | 100.0% | 7,532,397 | 15.1 | 2,167,319 | 43,790,000 |
| Total / Wtd. Avg. | 805,746 | 100.0% | $50,000,000 | 100.0% | $14,130,019 | $256,700,000 | ||
| (1) | Based on the underwritten rent rolls dated May 31, 2018 and the Liberty Portfolio Whole Loan documents. |
The Liberty Portfolio consists of two Class A office properties (together, the “Liberty Portfolio Properties”). The Liberty Center at Rio Salado property (682,406 square feet) includes four office buildings built from 2014 to 2017 located at 1850, 1870, 1910 and 1930 West Rio Salado Parkway in Tempe, Arizona (the “Liberty Center at Rio Salado Property”). The Liberty Center at Rio Salado Property is situated on a site covering approximately 40.7 acres and is 100.0% occupied as of the underwritten rent rolls dated May 31, 2018 by national tenants such as Centene Management Company, LLC (“Centene”), DHL Express (USA), Inc. (“DHL Express”) and WageWorks, Inc. (“WageWorks”). The buildings at the Liberty Center at Rio Salado Property, which consist of three two-story Class A office buildings and one three-story Class A office building, offer 4,078 surface parking spaces (which equates to approximately 6.0 parking spaces per 1,000 square feet of NRA). The Liberty Center at Rio Salado Property also offers redundant power, balconies, cafeterias, mountain views and access to downtown Tempe and the Phoenix Sky Harbor International Airport. The 8501 East Raintree Drive Property (123,340 square feet) is a three-story, Class A, LEED Gold office building that was built-to-suit for The Vanguard Group, Inc. (“The Vanguard Group”) in 2006 and is located in Scottsdale, Arizona (the “8501 East Raintree Drive Property”). The 8501 East Raintree Drive Property is situated on a site covering approximately 13.8 acres and remains 100.0% occupied by The Vanguard Group as of the underwritten rent roll dated May 31, 2018. The Vanguard Group lease commenced in 2006, expires in July 2026 and offers two five-year renewal options. The 8501 East Raintree Drive Property amenities include approximately 28,000 square feet of landscaped outdoor patio area. The 8501 East Raintree Drive Property also contains a parking garage with 594 parking spaces (which equates to approximately 4.8 parking spaces per 1,000 square feet of net rentable area). Overall, the Liberty Portfolio Properties are 100.0% occupied by six national tenants with a weighted average remaining lease term from the Cut-off Date of 7.0 years.
Major Tenants.Centene (352,988 square feet; 43.8% of NRA; 44.1% of Base Rent):Centene, rated Ba1/BB+ by Moody’s/S&P, is a Fortune 500 multi-national healthcare company headquartered in St. Louis, Missouri. Centene utilizes its space at the Liberty Center at Rio Salado Property as one of the primary office locations for its Nursewise (a wholly-owned subsidiary of Centene in the business of providing multilingual telehealth services) and Cenpatico Integrated Care (a wholly-owned subsidiary of Centene that offers agencies, health plans, and states solutions to administer healthcare services more effectively) business lines. Centene first leased 77,867 square feet of space in October 2015 and has since expanded to its current footprint of 352,988 square feet across multiple buildings at the Liberty Center at Rio Salado Property. Centene occupies 236,131 square feet through January 31, 2028 in the 1870 West Rio Salado
THE INFORMATION IN THIS STRUCTURAL AND COLLATERAL TERM SHEET IS NOT COMPLETE AND MAY BE AMENDED PRIOR TO THE TIME OF SALE. THIS TERM SHEET IS NOT AN OFFER TO SELL THESE SECURITIES AND IT IS NOT A SOLICITATION OF AN OFFER TO BUY THESE SECURITIES IN ANY JURISDICTION WHERE THE OFFER OR SALE IS NOT PERMITTED.
| | 69 | |
| Structural and Collateral Term Sheet | BBCMS 2018-C2 | |
| Liberty Portfolio | ||
Parkway building, 77,867 square feet through January 22, 2028 in the 1850 West Rio Salado Parkway building and 38,990 square feet through December 31, 2028 in the 1910 West Rio Salado Parkway building, and has two five-year renewal options and no termination options. For the fiscal year ended December 31, 2017, Centene reported approximately $48.4 billion in total revenues and employees of approximately 33,700. As of October 16, 2018, Centene had a market capitalization of approximately $30.1 billion.
The Vanguard Group (123,340 square feet; 15.3% of NRA; 15.9% of Base Rent): The Vanguard Group is a privately-owned investment manager founded in 1975 and, as of January 31, 2018, employed approximately 16,600 people in the United States and had approximately $5.1 trillion in global assets under management. The Vanguard Group primarily provides its services to investment companies and caters to pooled investment vehicles, corporations, individuals, retirement plan sponsors, institutional investors, separate account institutional clients and financial advisors. The Vanguard Group utilizes the entire 123,340 square feet of office space at the 8501 Raintree Drive Property as a regional office and has been in occupancy since the property was constructed in 2006.
DHL Express (117,593 square feet; 14.6% of NRA; 15.0% of Base Rent): DHL Express, rated A3/BBB+ by Moody’s/Fitch, the United States branch of Deutsche Post DHL Group, the world’s largest international courier service company with express, global forwarding, freight and supply chain divisions, utilizes its space at the Liberty Center at Rio Salado Property as a corporate office. Deutsche Post DHL Group currently employs approximately 520,000 employees in over 220 countries worldwide. As of October 16, 2018, Deutsche Post DHL Group had a market capitalization of approximately $40.7 billion. According to the 2017 annual report, Deutsche Post DHL Group reported earnings before interest and taxes of approximately $4.65 billion for fiscal year 2017.
Tax Abatements.The four buildings located at the Liberty Center at Rio Salado Property receive a 50.0% real estate tax abatement for eight years commencing on the respective certificate of occupancy date for each building through a Government Property Lease Excise Tax (“GPLET”) abatement with the Arizona Department of Revenue and the City of Tempe. In lieu of paying real estate taxes, the borrower pays to the Arizona Department of Revenue and the City of Tempe, in the form of rent, 50.0% of what the respective buildings’ real estate taxes otherwise would have been (2018 rent due under the GPLET abatement for the four buildings located at the Liberty Center at Rio Salado Property was equal to $882,940). The borrower has a leasehold interest in each of the buildings comprising the Liberty Center at Rio Salado Property, which are subject to the GPLET abatement until expiration of the underlying lease, at which point title in the fee interest will automatically vest to the borrower. Real estate taxes were underwritten based on the 10-year average of each respective building’s current tax amount and full tax amount when the GPLET abatement expires. Assuming a 1.0% growth rate, 14.21% tax rate and 18.0% assessment ratio, the average annual real estate tax savings from the 2018/2019 tax year through the 2027/2028 tax year for the Liberty Center at Rio Salado Property is equal to $508,706 per year. The 8501 East Raintree Drive Property is not subject to an abatement and real estate taxes were underwritten to the budgeted amount equal to $509,650. Below is a table illustrating the GPLET abatements for each building at the Liberty Center at Rio Salado Property:
Liberty Center at Rio Salado Property Tax Abatement Summary | |||||
Liberty at Rio | Certificate of | GPLET Expiration Date | Remaining GPLET | Unabated Annual Real | U/W Annual Real Estate |
| 1850 West Rio Salado Parkway | 10/30/2014 | 10/29/2022 | 3.9 | $535,060 | $431,237 |
| 1870 West Rio Salado Parkway | 2/15/2018 | 2/14/2026 | 7.2 | 412,042 | 246,330 |
| 1910 West Rio Salado Parkway | 7/8/2015 | 7/7/2023 | 4.6 | 508,615 | 384,629 |
| 1930 West Rio Salado Parkway | 9/28/2016 | 9/27/2024 | 5.8 | 391,784 | 276,599 |
| Total/Wtd. | 5.1 | $1,847,501 | $1,338,795 | ||
| (1) | Remaining GPLET Term (years) is based on the Cut-off Date for the BBCMS 2018-C2 Trust in December 2018. |
THE INFORMATION IN THIS STRUCTURAL AND COLLATERAL TERM SHEET IS NOT COMPLETE AND MAY BE AMENDED PRIOR TO THE TIME OF SALE. THIS TERM SHEET IS NOT AN OFFER TO SELL THESE SECURITIES AND IT IS NOT A SOLICITATION OF AN OFFER TO BUY THESE SECURITIES IN ANY JURISDICTION WHERE THE OFFER OR SALE IS NOT PERMITTED.
| | 70 | |
| Structural and Collateral Term Sheet | BBCMS 2018-C2 | |
| Liberty Portfolio | ||
Environmental. According to a Phase I environmental assessment dated July 23, 2018, there was no evidence of any recognized environmental conditions at the Liberty Portfolio Properties.
| Historical and Current Occupancy(1) | |||
| 2015 | 2016 | 2017 | Current(2) |
| NAV | NAV | NAV | 100.0 % |
| (1) | Due to the various construction dates of the Liberty Portfolio properties, historical occupancy information is not available. The 8501 East Raintree Drive Property has maintained 100.0% occupancy since 2008 and the buildings at the Liberty Center at Rio Salado Drive Property have steadily increased occupancy each year since construction was complete to reach 100.0% occupancy levels represented in the underwritten rent rolls dated May 31, 2018. |
| (2) | Current occupancy is as of May 31, 2018. |
| Top Six Summary(1) | |||||||
| Tenant | Ratings(2) Moody’s/S&P/Fitch | Net Rentable Area (SF) | % of Total NRA | Base Rent PSF(3) | Base Rent(3) | % of Total Base Rent(3) | Lease Expiration Date |
| Centene(4)(5) | Ba1 / BB+ / NA | 352,988 | 43.8% | $19.54 | $6,897,298 | 44.1% | 1/31/2028 |
| The Vanguard Group(6) | NA / NA / NA | 123,340 | 15.3 | $20.15 | 2,485,301 | 15.9 | 7/31/2026 |
| DHL Express(7) | A3 / NA / BBB+ | 117,593 | 14.6 | $19.96 | 2,347,468 | 15.0 | 2/28/2023 |
| WageWorks(7) | NA / NA / NA | 76,162 | 9.5 | $17.47 | 1,330,550 | 8.5 | 12/31/2021 |
| Carvana, LLC(8)(9) | NA / NA / NA | 69,774 | 8.7 | $19.10 | 1,332,683 | 8.5 | 2/29/2024 |
| DriveTime Automotive Group, Inc.(8)(9) | NA / NA / NA | 65,889 | 8.2 | $19.10 | 1,258,480 | 8.0 | 2/29/2024 |
| Top Six Tenants | 805,746 | 100.0% | $19.43 | $15,651,781 | 100.0% | ||
| Vacant Space | 0 | 0.0% | |||||
| Collateral Total | 805,746 | 100.0% | |||||
| (1) | Based on the underwritten rent rolls dated May 31, 2018. |
| (2) | Ratings provided are for the parent company of the entity listed in the “Tenant” field whether or not the parent company guarantees the lease. |
| (3) | Includes approximately $261,743 in contractual rent steps through October 1, 2019 and $185,411 which represents the present value of rent steps for DHL Express. |
| (4) | Centene has two five-year renewal options. Upon exercised renewal option, Centene will receive a tenant improvement allowance equal to $7.00 per square foot for the space renewed. |
| (5) | Centene occupies 236,131 square feet though January 31, 2028 in the 1870 West Rio Salado Parkway building, 77,867 square feet through January 22, 2028 in the 1850 West Rio Salado Parkway building and 38,990 square feet through December 31, 2028 in the 1910 West Rio Salado Parkway building. |
| (6) | The Vanguard Group has two five-year renewal options. |
| (7) | DHL Express and WageWorks, Inc. each have two five-year renewal options. |
| (8) | Carvana, LLC and DriveTime Automotive Group, Inc. each have three five-year renewal options. |
| (9) | DriveTime Automotive Group, Inc. subleases 65,889 square feet of space to Carvana, LLC. The sublease is co-terminus with, and requires the same rent, as the original DriveTime Automotive Group, Inc. lease. |
THE INFORMATION IN THIS STRUCTURAL AND COLLATERAL TERM SHEET IS NOT COMPLETE AND MAY BE AMENDED PRIOR TO THE TIME OF SALE. THIS TERM SHEET IS NOT AN OFFER TO SELL THESE SECURITIES AND IT IS NOT A SOLICITATION OF AN OFFER TO BUY THESE SECURITIES IN ANY JURISDICTION WHERE THE OFFER OR SALE IS NOT PERMITTED.
| | 71 | |
| Structural and Collateral Term Sheet | BBCMS 2018-C2 | |
| Liberty Portfolio | ||
| Lease Rollover Schedule(1) | |||||||||
| Year | Number of Leases Expiring | Net Rentable Area Expiring | % of NRA Expiring | Base Rent Expiring(2) | % of Base Rent Expiring(2) | Cumulative Net Rentable Area Expiring | Cumulative % of NRA Expiring | Cumulative Base Rent Expiring | Cumulative % of Base Rent Expiring |
| Vacant | NAP | 0 | 0.0% | NAP | NAP | 0 | 0.0% | NAP | NAP |
| 2018 & MTM | 0 | 0 | 0.0 | $0 | 0.0% | 0 | 0.0% | $0 | 0.0% |
| 2019 | 0 | 0 | 0.0 | 0 | 0.0 | 0 | 0.0% | $0 | 0.0% |
| 2020 | 0 | 0 | 0.0 | 0 | 0.0 | 0 | 0.0% | $0 | 0.0% |
| 2021 | 1 | 76,162 | 9.5 | 1,330,550 | 8.5 | 76,162 | 9.5% | $1,330,550 | 8.5% |
| 2022 | 0 | 0 | 0.0 | 0 | 0.0 | 76,162 | 9.5% | $1,330,550 | 8.5% |
| 2023 | 1 | 117,593 | 14.6 | 2,347,468 | 15.0 | 193,755 | 24.0% | $3,678,018 | 23.5% |
| 2024 | 2 | 135,663 | 16.8 | 2,591,163 | 16.6 | 329,418 | 40.9% | $6,269,182 | 40.1% |
| 2025 | 0 | 0 | 0.0 | 0 | 0.0 | 329,418 | 40.9% | $6,269,182 | 40.1% |
| 2026 | 1 | 123,340 | 15.3 | 2,485,301 | 15.9 | 452,758 | 56.2% | $8,754,483 | 55.9% |
| 2027 | 0 | 0 | 0.0 | 0 | 0.0 | 452,758 | 56.2% | $8,754,483 | 55.9% |
| 2028 & Beyond(3) | 3 | 352,988 | 43.8 | 6,897,298 | 44.1 | 805,746 | 100.0% | $15,651,781 | 100.0% |
| Total | 8 | 805,746 | 100.0% | $15,651,781 | 100.0% | ||||
| (1) | Based on the underwritten rent rolls dated May 31, 2018. |
| (2) | Includes approximately $261,743 in contractual rent steps through October 1, 2019 and $185,411 which represents the present value of the rent steps for DHL Express. |
| (3) | Centene leases 236,131 square feet through January 31, 2028 at the 1870 West Rio Salado Parkway building, 77,867 square feet through January 22, 2028 at the 1850 West Rio Salado Parkway building and 38,990 square feet at the 1910 West Rio Salado building. |
| Operating History and Underwritten Net Cash Flow | |||||||
| 2015 | 2016 | 2017 | Annualized 7/31/2018 | Underwritten | Per Square Foot | %(1) | |
| Rents in Place(2) | $4,810,318 | $7,167,149 | $8,527,073 | $14,118,837 | $15,204,627 | $18.87 | 77.1% |
| Rent Steps(3) | 0 | 0 | 0 | 0 | 447,154 | 0.55 | 2.3 |
| Total Reimbursements | 820,838 | 1,636,533 | 1,973,158 | 2,845,390 | 4,078,245 | 5.06 | 20.7 |
| Gross Potential Rent | $5,631,156 | $8,803,682 | $10,500,231 | $16,964,227 | $19,730,026 | $24.49 | 100% |
| Other Income | 492 | 1,504 | 1,017 | 0 | 0 | 0.00 | 0 |
| Parking | 35,100 | 101,350 | 332,312 | 397,500 | 425,867 | 0.53 | 2.2 |
| (Vacancy/Credit Loss)(4) | 0 | 0 | 0 | (3) | (986,501) | (1.22) | (5.0) |
| Effective Gross Income | $5,666,748 | $8,906,536 | $10,833,560 | $17,361,723 | $19,169,391 | $23.79 | 97.2% |
| Total Variable Expenses | 335,407 | 761,670 | 985,096 | 1,472,184 | 2,106,185 | 2.61 | 11.0 |
| Total Fixed Expenses(5) | 680,299 | 943,205 | 1,100,234 | 1,386,715 | 1,953,395 | 2.42 | 10.2 |
| Net Operating Income(6) | $4,651,042 | $7,201,661 | $8,748,230 | $14,502,825 | $15,109,811 | $18.75 | 78.8% |
| Capital Expenditures | 0 | 0 | 0 | 0 | 161,149 | 0.20 | 0.8 |
| TI/LC | 0 | 0 | 0 | 0 | 818,643 | 1.02 | 4.3 |
| Net Cash Flow | $4,651,042 | $7,201,661 | $8,748,230 | $14,502,825 | $14,130,018 | $17.54 | 73.7% |
| (1) | Percentage column represents percent of Gross Potential Rent for all revenue lines and represents percent of Effective Gross Income for the remainder of fields. |
| (2) | Based on the underwritten rent rolls dated May 31, 2018. |
| (3) | Consists of approximately $261,743 in contractual rent steps through October 1, 2019 and $185,411 which represents the present value of rent steps for DHL Express. |
| (4) | Underwritten Vacancy represents the economic vacancy of 5.0%. |
| (5) | Underwritten Total Fixed Expenses include real estate taxes ($1,848,445) that were underwritten using the budgeted real estate tax amount for the 8501 East Raintree property ($509,650) and the 10-year average of the current abated real estate taxes and the fully unabated real estate taxes due when the GPLET’s expire at each of the respective buildings that make up the Liberty Center at Rio Salado Property ($1,338,795). See “Tax Abatements” section for further detail. |
| (6) | The difference between 2015 Net Operating Income, 2016 Net Operating Income, 2017 Net Operating Income, the annualized 7-month period ending July 31, 2018 Net Operating Income and Underwritten Net Operating Income is primarily attributable to the construction and stabilization of the Liberty Center at Rio Salado Property. The Liberty Center at Rio Salado Property consists of four buildings: 1850 West Rio Salado Parkway (built in 2014 and represents approximately 18.0% of Underwritten NOI), 1870 West Rio Salado Parkway (built in 2017 and represents approximately 29.9% of Underwritten NOI), 1910 West Rio Salado Parkway (built in 2014 and represents approximately 20.0% of Underwritten NOI), and 1930 West Rio Salado Parkway (built in 2016 and represents approximately 16.8% of Underwritten NOI). The 8501 East Raintree Drive Property was built in 2006 and represents approximately 15.4% of Underwritten NOI. The Liberty Portfolio Properties are all 100.0% leased and all outstanding landlord obligations and free rent were reserved for at origination. |
THE INFORMATION IN THIS STRUCTURAL AND COLLATERAL TERM SHEET IS NOT COMPLETE AND MAY BE AMENDED PRIOR TO THE TIME OF SALE. THIS TERM SHEET IS NOT AN OFFER TO SELL THESE SECURITIES AND IT IS NOT A SOLICITATION OF AN OFFER TO BUY THESE SECURITIES IN ANY JURISDICTION WHERE THE OFFER OR SALE IS NOT PERMITTED.
| | 72 | |
| Structural and Collateral Term Sheet | BBCMS 2018-C2 | |
| Liberty Portfolio | ||
The Market.The Liberty Portfolio Properties are located within the Phoenix office market which, according to the appraisal as of year end 2017, had an overall office supply of approximately 179.4 million square feet, a vacancy rate of 14.6% and average asking rent of $23.94 per square feet. According to the appraisal, from the period beginning in 2009 and ending June 30, 2018, the Phoenix office market has added approximately 12.4 million square feet of supply, reduced vacancy by approximately 6.2% while maintaining an average asking rent that ranged from $23.52 per square feet in 2009 to $25.14 per square feet as of the second quarter of 2018. According to a third party report, the technology industry continues to expand, many technology companies have relocated from Southern California or expanded in the Phoenix office market to utilize the cheaper rents for back-office space. The Phoenix office market is currently home to the back-office operations of prominent technology companies including PayPal, Yelp and San Francisco-based financial technology firm Upgrade. According to the appraisal, the Phoenix market has also become a significant market in the United States for advanced business services jobs in the financial sector. According to the United States Bureau of Labor Statistics, as of August 31, 2018, the financial services sector accounts for approximately 9.1% of total non-farm employment in the Phoenix market and supports approximately 191,500 jobs. Since the beginning of 2017, firms such as Bank of the West, Charles Schwab, and Northern Trust have relocated or expanded within the Phoenix office market.
The buildings that make up the Liberty Center at Rio Salado Property are located at 1850, 1870, 1910 and 1930 West Rio Salado Parkway in Tempe, Arizona, approximately 9.5 miles east of downtown Phoenix. Tempe, the eighth largest city in Arizona, is an urban community located in southeast Arizona that is bordered by Scottsdale to the north, Mesa to the east, Chandler to the south and Phoenix to the west. Tempe is served by Interstate 10, U.S. Route 60 and State Routes 101 and 143. The Salt River flows through the northern portion of Tempe and the Phoenix Sky Harbor International Airport is located approximately four miles west of Tempe. According to the appraisal, as of year-end 2017, the population within a one-, three- and five-mile radius was5,947, 91,845 and 328,873, respectively. Additionally, for the same period, theaverage household income within a one-, three- and five-mile radius was$50,990, $51,485 and $60,211, respectively. The Liberty Center at Rio Salado Property is part of the Phoenix Airport Area submarket, which, according to the appraisal, as of the second quarter of 2018, contained an office supply of approximately 12.4 million square feet with a vacancy rate of 21.8% and average gross asking rent equal to $23.83 per square feet (compared to the weighted average underwritten gross rent of $24.35 per square foot).
The 8501 East Raintree Drive Property is located in Scottsdale, Arizona, approximately 26.6 miles northeast of downtown Phoenix. Scottsdale, the seventh largest city in Arizona, is bordered by Tempe to the south, Fountain Hills and McDowell Mountain Regional Park to the east, Tonto National Forest to the north and Phoenix and Paradise Valley to the west. Scottsdale is served by Interstates 10 and 17, as well as U.S. Route 60, which are all located within 10 miles of the 8501 East Raintree Drive Property. Also, the Phoenix Sky Harbor International Airport is located approximately six miles west of Scottsdale. According to the appraisal, as of year-end 2017, the population within a one-, three- and five-mile radius was5,184, 70,146 and 168,757, respectively. Additionally, for the same period, theaverage household income within a one-, three- and five-mile radius was$114,175, $125,706 and $127,144, respectively. The8501 East Raintree Drive Propertyis part of the Scottsdale Airpark submarket, which, according to the appraisal as of the second quarter of 2018, contained an office supply of approximately 13.2 million square feet with a vacancy rate of 13.1% and average gross asking rent equal to $27.76 per square feet (compared to the underwritten gross rent for The Vanguard Group at the 8501 East Raintree Drive Property of $25.26 per square foot).
In determining market rent for the Liberty Portfolio Properties, the appraiser identified the six comparable office properties located in the Phoenix office market listed in the table below.
Office Comparables(1) | ||||||
Property Name | Office Area (NRA) | City | Occupancy | Tenant Name | Lease Type | Rent (PSF) |
| Liberty Portfolio Properties | 805,746(2) | Tempe/Scottsdale | 100.0% | Various | NNN | $19.75 - $20.00(3) |
| Price Road Office | 66,759 | Chandler | 100.0% | Walgreens (Call Center) | NNN | $15.75 |
| Chaparral Commerce Center | 271,085 | Scottsdale | 100.0% | McKesson Corp. | NNN | $16.31 |
| Norterra West One | 475,000 | Phoenix | 100.0% | USAA (IT Dept.) | NNN | $17.38 |
| Rio 2100 | 100,102 | Tempe | 100.0% | Varsity Tutors LLC | FSG | $28.37 |
| Rio Office | 63,500 | Tempe | 100.0% | Benchmark Elec., Inc. | FSG | $30.25 |
| The Alameda | 235,000 | Tempe | 93.2% | Lennar Homes | NNN | $19.00 |
| (1) | Source: Appraisal. |
| (2) | Based on the underwritten rent rolls dated May 31, 2018. |
| (3) | Represents the range of concluded market office rent from the appraisal (on a net basis) for the Liberty Portfolio Properties. |
THE INFORMATION IN THIS STRUCTURAL AND COLLATERAL TERM SHEET IS NOT COMPLETE AND MAY BE AMENDED PRIOR TO THE TIME OF SALE. THIS TERM SHEET IS NOT AN OFFER TO SELL THESE SECURITIES AND IT IS NOT A SOLICITATION OF AN OFFER TO BUY THESE SECURITIES IN ANY JURISDICTION WHERE THE OFFER OR SALE IS NOT PERMITTED.
| | 73 | |
| Structural and Collateral Term Sheet | BBCMS 2018-C2 | |
| Liberty Portfolio | ||
The Borrower. The borrowing entity for the Liberty Portfolio Whole Loan is RS Phoenix Portfolio LLC, a Delaware limited liability company and single purpose entity with one independent director. Legal counsel to the borrower delivered a non-consolidation opinion in connection with the origination of the Liberty Portfolio Whole Loan. H25A, LLC, a Delaware limited liability company, is the nonrecourse carve-out guarantor for the Liberty Portfolio Whole Loan.
The Loan Sponsor.The loan sponsor is Bruce Karsh. Bruce Karsh is a co-chairman and co-founder of Oaktree Capital which, as of September 30, 2018, currently manages approximately $124.0 billion in assets. He also serves as Chief Investment Officer and serves as portfolio manager for Oaktree Capital’s Distressed Opportunities, Value Opportunities and Multi-Strategy Credit strategies. Bruce Karsh serves on the boards of a number of privately held companies and is a member of the investment committee of the Broad Foundations. Bruce Karsh, a Duke University alumni, also served as Chairman of the Board of DUMAC, LLC, the entity that manages Duke University’s endowment, from 2005 to 2014.
Property Management. The Liberty Portfolio Properties are managed by Signature Real Estate Services, Inc., an independent third party property manager.
Escrows and Reserves. At origination, the borrower was required to deposit into escrow $89,189 for real estate taxes, $18,366 for insurance, $1,161,769 for unfunded obligations, $109,603 for free rent for Carvana, LLC, $77,257 for ground rent related to the GPLET leases with respect to the Liberty Center at Rio Salado Property, and $3,125 for immediate repairs.
Tax Escrows – On a monthly basis, the borrower is required to escrow 1/12th of the annual estimated tax payments, which currently equates to $44,594.
Insurance Escrows – On a monthly basis, the borrower is required to escrow 1/12th of the annual estimated insurance premiums that the lender estimates will be payable over the next-ensuing 12-month period (initially estimated to be $9,183).
Replacement Reserves –On a monthly basis, the borrower is required to escrow $13,429 into a replacement reserve for capital expenditures.
Specified Tenant Sweep Reserve– On each monthly payment date occurring on and after the occurrence and during the continuance of a Specified Tenant Trigger Period, the borrower will deposit an amount equal to the specified tenant sweep excess cash flow (as defined in the Liberty Portfolio Whole Loan documents) generated by the Liberty Portfolio Properties for the immediately preceding interest accrual period until the amount in the specified tenant sweep reserve meets a certain threshold and the DSCR is greater than 1.25x.
GPLET Ground Rent Reserve– On a monthly basis, the borrower is required to deposit reserves of 1/12th of the ground rent payable during the next-ensuing 12 months under the GPLET leases with respect to the Liberty Center at Rio Salado Property (initially estimated to be $77,257).
Lockbox / Cash Management.The Liberty Portfolio Whole Loan is structured with a hard lockbox and springing cash management. The borrower is required to deliver tenant direction letters to each existing tenant at the Liberty Portfolio Properties directing each of them to remit their rent checks directly to the lender-controlled lockbox. The borrower is also required to deliver a tenant direction letter to each and every future commercial tenant. The borrower is required to (and is required to cause the property manager to) deposit all revenue derived from the Liberty Portfolio Properties and deposit the same into the clearing account promptly upon receipt. All funds deposited into the clearing account are required to be transferred on each business day to or at the direction of the borrower unless a Trigger Period (as defined below) exists. Upon the occurrence and during the continuance of a Trigger Period, all funds in the lockbox account are required to be swept on each business day to a cash management account under the control of the lender to be applied and disbursed in accordance with the Liberty Portfolio Whole Loan documents and all excess cash flow funds remaining in the cash management account after the application of such funds in accordance with the Liberty Portfolio Whole Loan documents are (a) to the extent that a Specified Tenant Trigger Period (as defined below) is continuing, swept into a Specified Tenant leasing reserve, (b) to the extent that a Trigger Period other than a Specified Tenant Trigger Period is continuing, held by the lender in an excess cash flow reserve account as additional collateral for the Liberty Portfolio Whole Loan or (c) to the extent that no Trigger Period is continuing, disbursed to the borrower.
A “Trigger Period” means the occurrence of the following, as applicable: (i) a mortgage loan event of default has occurred and is continuing, (ii) the debt service coverage ratio is less than 1.20x and (iii) a Specified Tenant Trigger Period (defined below).
A Trigger Period caused by clause (ii) will be cured if the borrower deposits with the lender cash or an evergreen letter of credit in an amount that (if applied to pay the balance of the Liberty Portfolio Whole Loan) would cause the Liberty Portfolio Whole Loan to have a debt service coverage ratio at least equal to 1.25x. Such reserve or letter of credit will be released to the borrower upon the Liberty
THE INFORMATION IN THIS STRUCTURAL AND COLLATERAL TERM SHEET IS NOT COMPLETE AND MAY BE AMENDED PRIOR TO THE TIME OF SALE. THIS TERM SHEET IS NOT AN OFFER TO SELL THESE SECURITIES AND IT IS NOT A SOLICITATION OF AN OFFER TO BUY THESE SECURITIES IN ANY JURISDICTION WHERE THE OFFER OR SALE IS NOT PERMITTED.
| | 74 | |
| Structural and Collateral Term Sheet | BBCMS 2018-C2 | |
| Liberty Portfolio | ||
Portfolio Whole Loan having a debt service coverage ratio at or above 1.25x for two consecutive calendar quarters (not taking into account the foregoing reserve).
A “Specified Tenant Trigger Period” means a period commencing upon (i) any bankruptcy or similar insolvency of any Specified Tenant (defined below) or guarantor under any Specified Tenant lease (ii) any Specified Tenant failing to be in actual, physical possession of its space, failing to operate in its premises, and/or “going dark” (this Specified Tenant Trigger Period will not exist provided that the applicable Specified Tenant is an investment grade tenant under the Liberty Portfolio Whole Loan documents), (iii) any Specified Tenant giving written notice to the borrower that it is terminating its lease for all or any portion of its space (provided that (x) with respect to The Vanguard Group lease, if such termination notice is delivered more than 18 months prior to the applicable termination date set forth in such notice, no Specified Tenant Trigger Period will exist with respect to clause (iii) until the date that is 18 months prior to such termination date and (y) with respect to any Specified Tenant other than The Vanguard Group, if such termination notice is delivered more than 12 months prior to the applicable termination date, then no Specified Tenant Trigger Period will exist with respect to clause (iii) until the date that is 12 months prior to such termination date), (iv) any termination or cancellation of any Specified Tenant lease and/or any Specified Tenant lease failing to otherwise be in full force and effect, (v) any Specified Tenant or the guarantor under any Specified Tenant lease being in monetary default or material non-monetary default beyond applicable notice and cure periods, or (vi) Specified Tenant failing to extend or renew its lease on or prior to the applicable extension deadline in accordance with the Liberty Portfolio Whole Loan documents.
Solely with respect to a Specified Tenant Trigger Period with respect to Centene or The Vanguard Group, amongst other things, Specified Tenant Trigger period will be cured when (i) funds deposited in the specified tenant sweep reserve account equal the product of (x) $30.00 multiplied by (y) the number of square feet applicable for the respective tenant and (ii) the debt service coverage ratio is greater than 1.25x.
A “Specified Tenant” means (i) Centene, (ii) The Vanguard Group, and (iii) any tenant whose lease, individually or when aggregated with all other leases at the Liberty Portfolio Properties, either (a) accounts for 25.0% or more of total rental income for the Liberty Portfolio Properties or (b) demises 25.0% or more of the Liberty Portfolio Properties’ gross leasable area.
Subordinate and Mezzanine Debt. None.
Partial Release. Not Permitted.
Excluded Tax Parcel. As of the closing date of the Liberty Portfolio Whole Loan, the 8501 East Raintree Drive Property was legally subdivided from, but still part of, a larger tax parcel with certain adjacent property (the “Excluded Parcel”). The borrower has represented that all conditions precedent to the consummation of the severance of the 8501 East Raintree Drive Property from the Excluded Parcel for real estate tax purposes such that the 8501 East Raintree Drive Property is assessed for real estate tax purposes as one or more wholly independent tax lot or lots (the “Scottsdale Tax Parcelization“) have been satisfied, except the ministerial creation by the Maricopa County Assessor’s Office of separate tax lots for the 8501 East Raintree Drive Property and the Excluded Parcel. The entity that sold the 8501 East Raintree Drive Property to borrower (the “Liberty Seller”) is required pursuant to the applicable purchase-and-sale agreement (the “Liberty PSA”) to pay to borrower all real estate taxes with respect to the Excluded Parcel not later than ten (10) business days prior to the due date thereof to the extent that such real estate taxes relate to the period prior to the consummation of the Scottsdale Tax Parcelization. The borrower will be required to escrow for real estate taxes with respect to the Excluded Parcel if (a) the Scottsdale Tax Parcelization has not occurred and (b) any of the following conditions are not satisfied: (i) no event of default under the Liberty Portfolio Whole Loan documents has occurred and is continuing, (ii) the borrower is diligently pursuing in a commercially reasonable good faith manner the Scottsdale Tax Parcelization, (iii) Liberty Seller is not in default of its obligation to pay to borrower real estate taxes with respect to the Excluded Parcel pursuant to the Liberty PSA, or (iv) the borrower has delivered evidence of the payment of taxes with respect to the Excluded Parcel at least five days prior to the due date of such taxes.
THE INFORMATION IN THIS STRUCTURAL AND COLLATERAL TERM SHEET IS NOT COMPLETE AND MAY BE AMENDED PRIOR TO THE TIME OF SALE. THIS TERM SHEET IS NOT AN OFFER TO SELL THESE SECURITIES AND IT IS NOT A SOLICITATION OF AN OFFER TO BUY THESE SECURITIES IN ANY JURISDICTION WHERE THE OFFER OR SALE IS NOT PERMITTED.
| | 75 | |
| Structural and Collateral Term Sheet | BBCMS 2018-C2 | |
| Fidelis Portfolio | ||
THE INFORMATION IN THIS STRUCTURAL AND COLLATERAL TERM SHEET IS NOT COMPLETE AND MAY BE AMENDED PRIOR TO THE TIME OF SALE. THIS TERM SHEET IS NOT AN OFFER TO SELL THESE SECURITIES AND IT IS NOT A SOLICITATION OF AN OFFER TO BUY THESE SECURITIES IN ANY JURISDICTION WHERE THE OFFER OR SALE IS NOT PERMITTED.
| | 76 | |
| Structural and Collateral Term Sheet | BBCMS 2018-C2 | |
| Fidelis Portfolio | ||

THE INFORMATION IN THIS STRUCTURAL AND COLLATERAL TERM SHEET IS NOT COMPLETE AND MAY BE AMENDED PRIOR TO THE TIME OF SALE. THIS TERM SHEET IS NOT AN OFFER TO SELL THESE SECURITIES AND IT IS NOT A SOLICITATION OF AN OFFER TO BUY THESE SECURITIES IN ANY JURISDICTION WHERE THE OFFER OR SALE IS NOT PERMITTED.
| | 77 | |
| Structural and Collateral Term Sheet | BBCMS 2018-C2 | |
| Fidelis Portfolio | ||
| Mortgage Loan Information | Property Information | |||
| Mortgage Loan Seller: | SMC | Single Asset / Portfolio: | Portfolio | |
| Original Principal Balance(1): | $49,300,000 | Title: | Fee | |
| Cut-off Date Principal Balance(1): | $49,188,389 | Property Type - Subtype: | Retail – Anchored | |
| % of IPB: | 5.5% | Net Rentable Area (SF): | 885,707 | |
| Loan Purpose: | Acquisition | Location: | Various, TX | |
| Borrowers(2): | Various | Year Built / Renovated: | 2005, 2006 / N/A | |
| Sponsor: | Alan Hassenflu | Occupancy(3): | 96.5% | |
| Interest Rate: | 5.01000% | Occupancy Date: | 10/1/2018 | |
| Note Date: | 10/5/2018 | 4thMost Recent NOI (As of): | $9,847,602 (12/31/2015) | |
| Maturity Date: | 10/6/2028 | 3rd Most Recent NOI (As of): | $10,138,789 (12/31/2016) | |
| Interest-only Period: | None | 2nd Most Recent NOI (As of)(4): | $10,165,703 (12/31/2017) | |
| Original Term: | 120 months | Most Recent NOI (As of): | $10,512,329 (TTM 8/31/2018) | |
| Original Amortization Term: | 360 months | UW Economic Occupancy: | 91.5% | |
| Amortization Type: | Balloon | UW Revenues: | $15,940,840 | |
| Call Protection: | L(12),Grtr1%orYM(104),O(4) | UW Expenses: | $4,767,276 | |
| Lockbox / Cash Management: | Springing | UW NOI(4): | $11,173,564 | |
| Additional Debt: | Yes | UW NCF: | $10,597,854 | |
| Additional Debt Balance(1): | $44,898,124 | Appraised Value / Per SF: | $147,700,000 / $167 | |
| Additional Debt Type(1): | Pari Passu | Appraisal Date(5): | Various | |
| Escrows and Reserves(6) | Financial Information(1) | |||||||||
| Initial | Monthly | Initial Cap | Cut-off Date Loan / SF: | $106 | ||||||
| Taxes: | $2,477,325 | $225,211 | N/A | Maturity Date Loan / SF: | $88 | |||||
| Insurance: | $107,526 | $18,419 | N/A | Cut-off Date LTV: | 63.7% | |||||
| Replacement Reserves: | $0 | $11,071 | N/A | Maturity Date LTV: | 52.5% | |||||
| TI/LC: | $1,500,000 | Springing | $1,500,000 | UW NCF DSCR: | 1.74x | |||||
| Other: | $3,664,994 | $0 | N/A | UW NOI Debt Yield: | 11.9% | |||||
| Sources and Uses | ||||||||||
| Sources | Proceeds | % of Total | Uses | Proceeds | % of Total | |||||
| Whole Loan(1) | $94,300,000 | 67.2% | Purchase Price | $131,750,000 | 93.9% | |||||
| Sponsor Equity | 45,949,616 | 32.8 | Upfront Reserves | 7,749,845 | 5.5 | |||||
| Closing Costs | 749,772 | 0.5 | ||||||||
| Total Sources | $140,249,616 | 100.0% | Total Uses | $140,249,616 | 100.0% | |||||
| (1) | The Fidelis Portfolio mortgage loan is part of a loan evidenced by threepari passu notes with an aggregate original principal balance of $94.3 million (the “Fidelis Portfolio Whole Loan”). The financial information presented in the chart above reflects the Cut-off Date balance of the $94.3 million Fidelis Portfolio Whole. |
| (2) | The borrowers under the Fidelis Portfolio Whole Loan are MK Towne Crossing Associates, LLC, RS Shopping Center Associates, LLC and VL Town Center Associates, LLC. |
| (3) | Occupancy includes 55,613 square feet (6.3% of net rentable area) of space that is leased by five tenants, but is not yet occupied. According to the sponsor, 13,409 square feet (4.9% of net rentable area) is expected to be occupied in the fourth quarter of 2018, while the remaining 42,204 square feet (4.8% of net rentable area) is expected to be occupied in September 2019. Tenants are entitled to free rent related to the recently leased space for which the borrowers were required to escrow at origination an amount equal to approximately $107,714, along with outstanding tenant improvements and leasing commissions in an aggregate amount equal to $3,557,280. Additionally, Occupancy includes Staples (2.3% of net rentable area) and Mattress Firm (0.4% of net rentable area), however both tenants were underwritten as vacant. |
| (4) | UW NOI is higher than 2nd Most Recent NOI due in part to (i) UTMB expanding by 42,204 square feet at the Victory Lakes Town Center Property (as defined below) with rent commencement in late 2018 ($633,060 in underwritten base rent), (ii) Patel Brothers rent commencing in late 2018 ($300,000 in underwritten base rent) and (iii) $73,524 of contractual rent steps underwritten through April 2019. |
| (5) | The as-is appraised values for the Victory Lakes Town Center Property and McKinney Towne Crossing Property (as defined below) are as of August 17, 2018. The as-is appraised value of Riverstone Shopping Center Property (as defined below) is as of August 20, 2018. |
| (6) | For a full description of Escrows and Reserves, please refer to “Escrows and Reserves” below. |
THE INFORMATION IN THIS STRUCTURAL AND COLLATERAL TERM SHEET IS NOT COMPLETE AND MAY BE AMENDED PRIOR TO THE TIME OF SALE. THIS TERM SHEET IS NOT AN OFFER TO SELL THESE SECURITIES AND IT IS NOT A SOLICITATION OF AN OFFER TO BUY THESE SECURITIES IN ANY JURISDICTION WHERE THE OFFER OR SALE IS NOT PERMITTED.
| | 78 | |
| Structural and Collateral Term Sheet | BBCMS 2018-C2 | |
| Fidelis Portfolio | ||
The Loan.The Fidelis Portfolio Whole Loan is secured by a first mortgage lien on the borrowers’ fee interest in three anchored retail shopping centers located in Texas and totaling 885,707 square feet (the “Fidelis Portfolio Properties”). The Fidelis Portfolio Whole Loan was originated by Starwood Mortgage Capital LLC and has an outstanding principal balance as of the Cut-off Date of approximately $94.1 million, and is comprised of threepari passu notes, Note A-1, Note A-2 and Note A-3. The Fidelis Portfolio Whole Loan has a 10-year term and amortizes on a 30-year basis.
Whole Loan Summary | |||
| Note | Original Balance | Note Holder | Controlling Piece |
| A-1 | $49,300,000 | BBCMS 2018-C2 | Yes |
| A-2 | $22,500,000 | Starwood Mortgage Funding II, LLC | No |
| A-3 | $22,500,000 | Starwood Mortgage Funding II, LLC | No |
The Properties.The Fidelis Portfolio Properties are located in League City (the “Victory Lakes Town Center Property”), McKinney (the “McKinney Towne Crossing Property”) and Missouri City (the “Riverstone Shopping Center Property”), Texas and total 885,707 square feet. Overall, the Fidelis Portfolio Properties are 96.5% leased by 81 tenants.
The following tables present certain information relating to the Fidelis Portfolio Properties:
| Property Summary | ||||||||||
| Property Name, Location | Year Built / Renovated | Allocated Loan Amount (“ALA”) | % of ALA | Square Feet | Acquisition Price | Occ.(1) | UW NOI | UW NOI % | Appraised Value | % of Appraised Value |
Victory Lakes Town Center 2520 Gulf Freeway South League City, TX
| 2006 / NAP | $19,395,864 | 39.3% | 370,367 | $53,000,000 | 99.4% | $4,473,551 | 40.0% | $56,600,000 | 38.3% |
McKinney Towne Crossing(2) 8800 State Highway 121 McKinney, TX
| 2006 / NAP | 18,663,945 | 37.9 | 242,805 | 51,000,000 | 94.0 | 3,858,058 | 34.5 | 55,100,000 | 37.3 |
Riverstone Shopping Center 5730 Highway 6 Missouri City, TX
| 2005, 2006 / NAP | 11,240,191 | 22.8 | 272,535 | 27,750,000 | 94.7 | 2,841,955 | 25.4 | 36,000,000 | 24.4 |
| Total/Wtd. Avg. | $49,300,000 | 100.0% | 885,707 | $131,750,000 | 96.5% | $11,173,564 | 100.0% | $147,700,000 | 100.0% | |
| (1) | Information based on the underwritten rent rolls dated October 1, 2018. |
| (2) | Occupancy at the McKinney Towne Crossing Property includes Staples (2.3% of net rentable area) and Mattress Firm (0.4% of net rentable area), however both tenants were underwritten as vacant. |
The Victory Lakes Town Center Property was built in 2006, is situated on approximately 50.2 acres and has a net rentable area of 370,367 square feet. The Victory Lakes Town Center Property is currently 99.4% leased to 24 tenants and anchored by JC Penney and Hobby Lobby. Additionally, the Victory Lakes Town Center Property is shadow anchored by a Walmart and Lowe’s and located in immediate proximity to Target, Home Depot, H-E-B Grocery and Cabela’s. In addition, the Victory Lakes Town Center Property is home to the University of Texas Medical Branch (“UTMB”) which offers an array of medical services. The Victory Lakes Town Center Property contains 1,593 parking spaces which equates to a parking ratio of approximately 4.30 spaces per 1,000 square feet of NRA.
The McKinney Towne Crossing Property was built in 2006, is situated on approximately 32.6 acres and has a net rentable area of 242,805 square feet. The McKinney Towne Crossing Property is currently 94.0% leased to 45 tenants and anchored by Patel Brothers. Additionally, the McKinney Towne Crossing Property is shadow anchored by a Target and Lowe’s. In addition, the McKinney Towne Crossing Property is home to national tenants such as Ross Dress for Less, Petsmart, Chili’s Bar & Grill, Whataburger and Chick-fil-A. The McKinney Towne Crossing Property contains 1,501 parking spaces which equates to a parking ratio of approximately 6.18 spaces per 1,000 square feet of NRA.
The Riverstone Shopping Center Property was built in 2005 and 2006, is situated on approximately 27.9 acres and has a net rentable area of 272,535 square feet. The Riverstone Shopping Center Property is currently 94.7% leased to 14 tenants and anchored by Hobby Lobby, Ross Dress for Less and Palais Royal. Additionally, the Riverstone Shopping Center Property is shadow anchored by a Target and Home Depot and located in immediate proximity to a Walmart Supercenter and Kroger. In addition, the Riverstone Shopping Center Property is home to national tenants such as Bed Bath & Beyond, Petsmart and Office Depot. The Riverstone Shopping Center Property contains 1,594 parking spaces which equates to a parking ratio of approximately 5.85 spaces per 1,000 square feet of NRA.
THE INFORMATION IN THIS STRUCTURAL AND COLLATERAL TERM SHEET IS NOT COMPLETE AND MAY BE AMENDED PRIOR TO THE TIME OF SALE. THIS TERM SHEET IS NOT AN OFFER TO SELL THESE SECURITIES AND IT IS NOT A SOLICITATION OF AN OFFER TO BUY THESE SECURITIES IN ANY JURISDICTION WHERE THE OFFER OR SALE IS NOT PERMITTED.
| | 79 | |
| Structural and Collateral Term Sheet | BBCMS 2018-C2 | |
| Fidelis Portfolio | ||
Environmental.According to the Phase I environmental assessments dated August 29, 2018, there was no evidence of any recognized environmental conditions at the Fidelis Portfolio Properties.
| Historical and Current Occupancy(1) | ||||
| 2015 | 2016 | 2017 | Current(2) | |
| Victory Lakes Town Center Property | 98.3% | 99.1% | 99.4% | 99.4% |
| McKinney Towne Crossing Property(3) | 78.1% | 78.9% | 78.9% | 94.0% |
| Riverstone Shopping Center Property | 98.9% | 94.4% | 96.0% | 94.7% |
| Wtd. Avg. | 92.9% | 92.1% | 92.7% | 96.5% |
| (1) | Historical Occupancies are as of December 31 of each respective year. |
| (2) | Current Occupancy is as of October 1, 2018. |
| (3) | Current Occupancy at the McKinney Towne Crossing Property includes Staples (2.3% of net rentable area) and Mattress Firm (0.4% of net rentable area), however both tenants were underwritten as vacant. |
| Top Ten Tenant Summary(1) | |||||||||||
| Tenant | Ratings(2) Moody’s/S&P/ Fitch | Property | Net Rentable Area (SF) | % of Total NRA | Base Rent PSF | Base Rent | % of Total Base Rent | Sales PSF | Occ. Costs | Lease Exp. Date | |
| Hobby Lobby(3) | NR / NR / NR | Various(4) | 115,971 | 13.1% | $8.58 | $995,261 | 8.4% | $88 | 14.8% | Various | |
| JC Penney(5) | NR / B- / NR | Victory Lakes Town Center | 103,525 | 11.7 | $4.35 | 450,000 | 3.8 | NAP | NAP | 9/30/2033 | |
| UTMB(6) | NR / NR / NR | Victory Lakes Town Center | 87,615 | 9.9 | $15.00 | 1,314,225 | 11.1 | NAP | NAP | 8/30/2028 | |
| Ross Dress for Less | A3 / A- / NR | Various(7) | 57,863 | 6.5 | $9.98 | 577,388 | 4.9 | NAP | NAP | Various | |
| Petsmart | Caa3 / CCC / NR | Various(8) | 47,391 | 5.4 | $13.42 | 635,914 | 5.4 | NAP | NAP | Various | |
| LA Fitness | NR / B+ / NR | Riverstone Shopping Center | 45,000 | 5.1 | $15.57 | 700,800 | 5.9 | NAP | NAP | 12/31/2020 | |
| Best Buy | Baa1 / BBB / BBB | Victory Lakes Town Center | 30,038 | 3.4 | $15.25 | 458,079 | 3.9 | NAP | NAP | 1/31/2023 | |
| Patel Brothers | NR / NR / NR | McKinney Towne Crossing | 30,000 | 3.4 | $10.00 | 300,000 | 2.5 | NAP | NAP | 7/31/2028 | |
| Palais Royal | NR / NR / NR | Riverstone Shopping Center | 30,000 | 3.4 | $9.00 | 270,000 | 2.3 | NAP | NAP | 1/31/2021 | |
| Bed Bath & Beyond | Baa3 / BB+ / NR | Riverstone Shopping Center | 28,000 | 3.2 | $9.50 | 266,000 | 2.2 | NAP | NAP | 1/31/2021 | |
| Top Ten Tenants | 575,403 | 65.0% | $10.37 | $5,967,667 | 50.2% | ||||||
| Non Top Ten Tenants | 255,428 | 28.8% | $23.14 | $5,910,768 | 49.8% | ||||||
| Occupied Collateral Total | 830,831 | 93.8% | $14.30 | $11,878,434 | 100.0% | ||||||
| Vacant Space(9) | 54,876 | 6.2% | |||||||||
| Collateral Total | 885,707 | 100.0% | |||||||||
| (1) | Based on the underwritten rent rolls dated October 1, 2018. |
| (2) | Ratings provided are for the parent company of the entity listed in the “Tenant” field whether or not the parent company guarantees the lease. |
| (3) | Sales PSF and Occ. Costs for Hobby Lobby represent the trailing 12 months ending October 2017 sales at the Riverstone Shopping Center Property only. |
| (4) | Hobby Lobby occupies 60,971 square feet at the Riverstone Shopping Center Property under a lease with an expiration date on October 31, 2021. Additionally, Hobby Lobby occupies 55,000 square feet at the Victory Lakes Town Center Property under a lease with an expiration date on April 30, 2024. |
| (5) | JC Penney is on a ground lease. |
| (6) | UTMB occupies the entire 45,411 square feet at Victory Lakes Town Center and is currently building out an additional 42,204 square feet. The sponsor expects UTMB to take occupancy of the expansion space in September 2019. At origination of the loan, the borrowers were required to escrow outstanding tenant improvements and leasing commissions in an aggregate amount equal to $1,900,000 for UTMB’s expansion space. Additionally, UTMB has the one time right to terminate its lease August 31, 2023 with 12 months’ notice. |
| (7) | Ross Dress for Less occupies 30,174 square feet at the Riverstone Shopping Center Property under a lease with an expiration date on January 31, 2021. Additionally, Ross Dress for Less occupies 27,689 square feet at the McKinney Towne Crossing Property under a lease with an expiration date on January 31, 2024. |
| (8) | Petsmart occupies 27,404 square feet at the McKinney Towne Crossing Property under a lease with an expiration date on July 31, 2023. Additionally, Petsmart occupies 19,987 square feet at the Riverstone Shopping Center Property under a lease with an expiration date on January 31, 2022. |
| (9) | Vacant Space includes Staples (2.3% of net rentable area) and Mattress Firm (0.4% of net rentable area) which are in occupancy, however, were underwritten as vacant. |
THE INFORMATION IN THIS STRUCTURAL AND COLLATERAL TERM SHEET IS NOT COMPLETE AND MAY BE AMENDED PRIOR TO THE TIME OF SALE. THIS TERM SHEET IS NOT AN OFFER TO SELL THESE SECURITIES AND IT IS NOT A SOLICITATION OF AN OFFER TO BUY THESE SECURITIES IN ANY JURISDICTION WHERE THE OFFER OR SALE IS NOT PERMITTED.
| | 80 | |
| Structural and Collateral Term Sheet | BBCMS 2018-C2 | |
| Fidelis Portfolio | ||
| Lease Rollover Schedule(1)(2) | |||||||||
| Year | Number of Leases Expiring | Net Rentable Area Expiring | % of NRA Expiring | Base Rent Expiring | % of Base Rent Expiring | Cumulative Net Rentable Area Expiring | Cumulative % of NRA Expiring | Cumulative Base Rent Expiring | Cumulative % of Base Rent Expiring |
| Vacant(3) | NAP | 54,876 | 6.2% | NAP | NAP | 54,876 | 6.2% | NAP | NAP |
| 2018 & MTM | 0 | 0 | 0.0 | $0 | 0.0% | 54,876 | 6.2% | $0 | 0.0% |
| 2019 | 6 | 11,153 | 1.3 | 299,874 | 2.5 | 66,029 | 7.5% | $299,874 | 2.5% |
| 2020 | 14 | 114,527 | 12.9 | 1,983,814 | 16.7 | 180,556 | 20.4% | $2,283,688 | 19.2% |
| 2021 | 16 | 192,322 | 21.7 | 2,498,122 | 21.0 | 372,878 | 42.1% | $4,781,809 | 40.3% |
| 2022 | 10 | 48,988 | 5.5 | 965,509 | 8.1 | 421,866 | 47.6% | $5,747,318 | 48.4% |
| 2023 | 7 | 75,932 | 8.6 | 1,332,962 | 11.2 | 497,798 | 56.2% | $7,080,281 | 59.6% |
| 2024 | 5 | 101,506 | 11.5 | 1,096,380 | 9.2 | 599,304 | 67.7% | $8,176,660 | 68.8% |
| 2025 | 3 | 8,977 | 1.0 | 189,940 | 1.6 | 608,281 | 68.7% | $8,366,600 | 70.4% |
| 2026 | 5 | 11,245 | 1.3 | 315,162 | 2.7 | 619,526 | 69.9% | $8,681,762 | 73.1% |
| 2027 | 5 | 13,072 | 1.5 | 373,456 | 3.1 | 632,598 | 71.4% | $9,055,218 | 76.2% |
| 2028 | 5 | 135,154 | 15.3 | 1,974,776 | 16.6 | 767,752 | 86.7% | $11,029,994 | 92.9% |
| 2029 & Beyond | 5 | 117,955 | 13.3 | 848,440 | 7.1 | 885,707 | 100.0% | $11,878,434 | 100.0% |
| Total | 81 | 885,707 | 100.0% | $11,878,434 | 100.0% | ||||
| (1) | Based on the underwritten rent rolls dated October 1, 2018. |
| (2) | Certain tenants may have lease termination options that are exercisable prior to the originally stated expiration date of the subject lease that are not considered in the lease rollover schedule. |
| (3) | Staples (2.3% of net rentable area) and Mattress Firm (0.4% of net rentable area) are included in physical occupancy, however both tenants were underwritten as vacant in the Lease Rollover Schedule. |
Operating History and Underwritten Net Cash Flow | |||||||
| 2015 | 2016 | 2017 | TTM(1) | Underwritten | Per Square Foot | %(2) | |
| Rents in Place | $11,071,283 | $11,252,201 | $11,091,728 | $11,108,190 | $11,878,434 | $13.41 | 68.4% |
| Vacant Income | 0 | 0 | 0 | 0 | 1,208,572 | 1.36 | 7.0 |
| Gross Potential Rent | $11,071,283 | $11,252,201 | $11,091,728 | $11,108,190 | $13,087,006 | $14.78 | 75.3% |
| Total Reimbursements | 3,114,133 | 3,190,519 | 3,431,168 | 3,359,035 | 4,284,224 | 4.84 | 24.7 |
| Net Rental Income | $14,185,416 | $14,442,720 | $14,522,896 | $14,467,225 | $17,371,230 | $19.61 | 100.0% |
| (Vacancy/Credit Loss) | 0 | 0 | 0 | 0 | (1,471,627) | (1.66) | (8.5) |
| Other Income | 20,769 | 41,912 | 41,354 | 41,236 | 41,236 | 0.05 | 0.2 |
| Effective Gross Income | $14,206,185 | $14,484,632 | $14,564,250 | $14,508,461 | $15,940,840 | $18.00 | 91.8% |
| Total Expenses | $4,358,583 | $4,345,843 | $4,398,547 | $3,996,132 | $4,767,276 | $5.38 | 29.9% |
| Net Operating Income(3) | $9,847,602 | $10,138,789 | $10,165,703 | $10,512,329 | $11,173,564 | $12.62 | 70.1% |
| Total TI/LC, Capex/RR | 0 | 0 | 0 | 0 | 575,710 | 0.65 | 3.6 |
| Net Cash Flow | $9,847,602 | $10,138,789 | $10,165,703 | $10,512,329 | $10,597,854 | $11.97 | 66.5% |
| (1) | TTM represents the trailing 12 month period ending August 31, 2018. |
| (2) | Percentage column represents percent of Net Rental Income for all revenue lines and represents percent of Effective Gross Income for the remainder of fields. |
| (3) | Underwritten Net Operating Income is higher than TTM Net Operating Income due in part to (i) UTMB expanding by 42,204 square feet at the Victory Lakes Town Center Property with rent commencement in late 2018 ($633,060 in underwritten base rent), (ii) Patel Brothers rent commencing in late 2018 ($300,000 in underwritten base rent) and (iii) $73,524 of contractual rent steps underwritten through April 2019. |
THE INFORMATION IN THIS STRUCTURAL AND COLLATERAL TERM SHEET IS NOT COMPLETE AND MAY BE AMENDED PRIOR TO THE TIME OF SALE. THIS TERM SHEET IS NOT AN OFFER TO SELL THESE SECURITIES AND IT IS NOT A SOLICITATION OF AN OFFER TO BUY THESE SECURITIES IN ANY JURISDICTION WHERE THE OFFER OR SALE IS NOT PERMITTED.
| | 81 | |
| Structural and Collateral Term Sheet | BBCMS 2018-C2 | |
| Fidelis Portfolio | ||
The Markets.The Victory Lakes Town Center Property is located in League City, Galveston County, Texas. The Victory Lakes Town Center Property is situated approximately 27.1 miles southeast of Houston in the NASA/Clear Lake retail submarket. According to a market report, as of November 2018, the NASA/Clear Lake retail submarket contains approximately 27.9 million square feet, vacancy rate of 4.8% and asking rent of $17.92 per square foot. The appraisal determined market rent of $26.00 per square foot for inline space, $30.00 per square feet for front facing space, $35.00 per square foot for pad site space, $15.00 per square foot for junior anchor space, $10.00 per square foot for anchor space and $5.00 per square foot for the JC Penney space. The appraisal identified 25 comparable quoted and leased grocery, anchor and junior anchor spaces with rental rates ranging between $5.28 and $26.00 per square foot. The estimated 2018 population within a one-, three- and five-mile radius of the Victory Lakes Town Center Property was 4,069, 65,260 and 138,378, respectively. The estimated 2018 average household income within a one-, three- and five-mile radius of the Victory Lakes Town Center Property was $122,346, $118,165 and $121,085, respectively.
The following table presents in-line rental data with respect to comparable retail properties with respect to the Victory Lakes Town Center Property as identified in the appraisal:
| Comparable In-line Summary(1) | ||||||
| Property Name/Location | Year Built | Occ. | Size (SF) | Asking Rent Per Square Foot(2) | Lease Term | Lease Type |
Victory Lakes Town Center 2520 Gulf Freeway South League City, TX | 2006 | 99.4% | 370,367 | $12.79 | - | - |
League City Towne Center 3040 Gulf Freeway South League City, TX | 2008 | 97.0% | 553,158 | $14.00-$34.00 | 60-120 | NNN |
MarketPlace at Ninety-Six 1920 West League City Parkway League City, TX | 2016 | 90.0% | 163,545 | $16.00-$28.00 | 60 | NNN |
Bay Colony Town Center 2885 Gulf Freeway South League City, TX | 2008 | 94.0% | 513,906 | $15.00-$26.00 | 36-60 | NNN |
| (1) | Source: Appraisal |
| (2) | For the Victory Lakes Town Center Property, represents underwritten rent per square foot. |
The McKinney Towne Crossing Property is located in McKinney, Collin County, Texas. The McKinney Towne Crossing Property is situated approximately 26.3 miles north of Dallas in the McKinney retail submarket. According to a market report and as of November 2018, the McKinney retail submarket contains approximately 9.2 million square feet, a vacancy rate of 4.8% and asking rent of $21.64 per square foot. The appraisal determined market rent of $28.00 per square foot for inline space, $30.00 per square foot for front facing space, $35.00 per square foot for pad site space, $14.00 per square foot for junior anchor space and $10.00 per square foot for anchor space. The appraisal identified 15 comparable leased anchor and junior anchor spaces with rental rates ranging between $8.00 and $22.23 per square foot. The estimated 2018 population within a one-, three- and five-mile radius of the McKinney Towne Crossing Property was 9,370, 104,330 and 325,749, respectively. The estimated 2018 average household income within a one-, three- and five-mile radius of the McKinney Towne Crossing Property was $167,808, $157,877 and $137,429, respectively.
THE INFORMATION IN THIS STRUCTURAL AND COLLATERAL TERM SHEET IS NOT COMPLETE AND MAY BE AMENDED PRIOR TO THE TIME OF SALE. THIS TERM SHEET IS NOT AN OFFER TO SELL THESE SECURITIES AND IT IS NOT A SOLICITATION OF AN OFFER TO BUY THESE SECURITIES IN ANY JURISDICTION WHERE THE OFFER OR SALE IS NOT PERMITTED.
| | 82 | |
| Structural and Collateral Term Sheet | BBCMS 2018-C2 | |
| Fidelis Portfolio | ||
The following table presents in-line rental data with respect to comparable retail properties with respect to the McKinney Towne Crossing Property as identified in the appraisal:
| Comparable In-line Summary(1) | ||||||
| Property Name/Location | Year Built | Occ. | Size (SF) | Asking Rent Per Square Foot(2) | Lease Term | Lease Type |
McKinney Towne Crossing 8900 TX-121 McKinney, TX | 2006 | 94.0% | 242,805 | $20.04 | - | - |
Cameron Crossing 1739 North Central Expressway McKinney, TX | 1998 | 98.0% | 385,855 | $18.00-$26.00 | 60-120 | NNN |
Custer Plaza 500 North Custer Road League McKinney, TX | 2007 | 97.0% | 50,577 | $18.00-$26.00 | Negotiable | NNN |
Heritage Square 1705 West University Drive McKinney, TX | 1980 | 97.6% | 75,396 | $15.00-$27.50 | 36-60 | NNN |
380 Towne Crossing 2050 West University Drive McKinney, TX | 1984 | 97.0% | 482,742 | $22.00-$32.00 | 60-120 | NNN |
| (1) | Source: Appraisal |
| (2) | For the McKinney Towne Crossing Property, represents underwritten rent PSF. |
The Riverstone Shopping Center Property is located in Missouri City, Fort Bend County, Texas. The Riverstone Shopping Center Property is situated approximately 21.0 miles southwest of Houston in the Far New Territory retail submarket. According to a market report and as of November 2018, the Far New Territory retail submarket contains approximately 7.3 million square feet, vacancy rate of 3.6% and asking rent of $25.59 per square foot. The appraisal determined market rent of $24.00 per square foot for inline space, $28.00 per square foot for front facing space and between $9.00 and $15.00 per square foot for anchor space. The appraisal identified 25 comparable quoted and leased grocery, anchor and junior anchor spaces with rental rates ranging between $5.28 and $26.00 per square foot. The estimated 2018 population within a one-, three- and five-mile radius of the Riverstone Shopping Center Property was 11,050, 104,013 and 192,238, respectively. The estimated 2018 average household income within a one-, three- and five-mile radius of the Riverstone Shopping Center Property was $177,950, $143,751 and $141,488, respectively.
THE INFORMATION IN THIS STRUCTURAL AND COLLATERAL TERM SHEET IS NOT COMPLETE AND MAY BE AMENDED PRIOR TO THE TIME OF SALE. THIS TERM SHEET IS NOT AN OFFER TO SELL THESE SECURITIES AND IT IS NOT A SOLICITATION OF AN OFFER TO BUY THESE SECURITIES IN ANY JURISDICTION WHERE THE OFFER OR SALE IS NOT PERMITTED.
| | 83 | |
| Structural and Collateral Term Sheet | BBCMS 2018-C2 | |
| Fidelis Portfolio | ||
The following table presents in-line rental data with respect to comparable retail properties with respect to the Riverstone Shopping Center Property as identified in the appraisal:
| Comparable In-line Summary(1) | ||||||
| Property Name/Location | Year Built | Occ. | Size (SF) | Asking Rent Per Square Foot(2) | Lease Term | Lease Type |
Riverstone Shopping Center 5730 Highway 6 Missouri City, TX | 2005, 2006 | 94.7% | 272,535 | $11.90 | - | - |
Tang City Plaza 4899-B Highway 6 Missouri City, TX | 2017 | 90.0% | 89,500 | $24.00-$30.00 | 60-120 | NNN |
Siena Crossing 9130 Highway 6 Missouri City, TX | 2008 | 98.0% | 236,250 | $24.00-$32.00 | 60-120 | NNN |
First Colony Marketplace 4610 Highway 6 Sugar Land, TX | 1993 | 100.0% | 159,166 | $14.40-$24.00 | 36-60 | NNN |
Market at First Colony 3591 Highway 6 Sugar Land, TX | 1988 | 97.0% | 190,320 | $15.00-$26.00 | 36-60 | NNN |
| (1) | Source: Appraisal |
| (2) | For the Riverstone Shopping Center Property, represents underwritten rent per square foot. |
The Borrowers. The borrowing entities for the Fidelis Portfolio Whole Loan are MK Towne Crossing Associates, LLC, RS Shopping Center Associates, LLC and VL Town Center Associates, LLC, each a Delaware limited liability company and special purpose entity with two independent directors. Legal counsel to the borrowers delivered a non-consolidation opinion in connection with the origination of the Fidelis Portfolio Whole Loan. Alan Hassenflu is the guarantor of certain nonrecourse carve-outs under the Fidelis Portfolio Whole Loan, provided that his liability is limited to 20% of the Fidelis Portfolio Whole Loan balance for certain breaches.
The Loan Sponsor.The Fidelis Portfolio Whole Loan sponsor is Alan Hassenflu, President and Chief Executive Officer of Fidelis Realty Partners, Ltd. (“Fidelis Realty”). Fidelis Realty is a national retail commercial real estate developer, investor and operator headquartered in Houston, Texas with more than 60 employees. Fidelis Realty was founded in 2003 by Alan Hassenflu. Fidelis Realty’s current commercial real estate portfolio consists of more than 10 million square feet located across 60 retail assets throughout Texas, New Mexico, Louisiana and Tennessee. Additionally, Fidelis Realty is the property manager for the Fidelis Portfolio Properties.
Property Management. The Fidelis Portfolio Properties are managed by Fidelis Realty, an affiliate of the borrowers.
Escrows and Reserves. At origination, the borrowers were required to deposit into escrow approximately $3,557,280 for outstanding tenant improvements and leasing commissions, approximately $2,477,325 for real estate taxes, $1,500,000 for future tenant improvements and leasing commissions, approximately $107,526 for insurance premiums and approximately $107,714 for free rent.
Tax Escrows– On a monthly basis, the borrowers are required to escrow 1/12 of the annual estimated tax payments, which currently equates to approximately $225,211.
Insurance Escrows - On a monthly basis, the borrowers are required to escrow 1/12 of the annual estimated insurance payments, which currently equates to approximately $18,419.
Replacement Reserves - On a monthly basis, the borrowers are required to escrow $11,071 for replacement reserves (approximately $0.15 per square foot annually). In no event will the borrowers be required to escrow more than 105% of the amount paid by the borrowers during the immediately preceding calendar year for replacement reserves.
TI/LC Reserves – When the reserve falls below the cap, the borrowers are required to escrow $21,667 (approximately $0.29 per square foot annually) on a monthly basis for tenant improvement and leasing commission reserves. The reserve is subject to a cap of $1,500,000 (approximately $1.69 per square foot).
THE INFORMATION IN THIS STRUCTURAL AND COLLATERAL TERM SHEET IS NOT COMPLETE AND MAY BE AMENDED PRIOR TO THE TIME OF SALE. THIS TERM SHEET IS NOT AN OFFER TO SELL THESE SECURITIES AND IT IS NOT A SOLICITATION OF AN OFFER TO BUY THESE SECURITIES IN ANY JURISDICTION WHERE THE OFFER OR SALE IS NOT PERMITTED.
| | 84 | |
| Structural and Collateral Term Sheet | BBCMS 2018-C2 | |
| Fidelis Portfolio | ||
Lockbox / Cash Management.The Fidelis Portfolio Whole Loan is structured with a springing lockbox and springing cash management. The Fidelis Portfolio Whole Loan requires that after the occurrence of a Sweep Event Period (as defined below), the borrowers or property manager deliver tenant direction letters to the tenants directing such tenants to pay all rents into the lockbox account. Upon the occurrence and during the continuance of a Sweep Event Period, all funds in the lockbox account are required to be swept daily to a cash management account under the control of the lender to be applied and disbursed in accordance with the Fidelis Portfolio Whole Loan documents and all excess cash flow funds remaining in the cash management account after the application of such funds in accordance with the Fidelis Portfolio Whole Loan documents are required to be held by the lender in an excess cash flow reserve account as additional collateral for the Fidelis Portfolio Whole Loan. To the extent that no Sweep Event Period is continuing, all excess cash flow funds are required to be disbursed to the Fidelis Portfolio Whole Loan borrowers. Additionally, the Fidelis Portfolio Whole Loan borrowers have a two-time right to cure a Sweep Event Period and cease making deposits into the lockbox account. Upon the commencement of a third Sweep Event Period, the Fidelis Portfolio Whole Loan borrowers will be required to open, maintain and resume causing all rents and other revenue to be deposited into the lockbox for the remainder of the term of the Fidelis Portfolio Whole Loan.
A “Sweep Event Period” will commence upon the earliest of the following: (i) the occurrence of an event of default or (ii) the debt service coverage ratio based on the trailing 12-month period is less than 1.15x.
A Sweep Event Period will end: with regard to clause (i), upon the cure of such event of default and the lender’s acceptance of such a cure in its reasonable discretion, and with regard to clause (ii), upon the debt service coverage ratio based on the trailing 12-month period being at least 1.20x for two consecutive calendar quarters.
Subordinate and Mezzanine Debt. None
Partial Release. Commencing on the payment date in November 2019, the Fidelis Portfolio Whole Loan borrowers are permitted to obtain the release of any one individual property or more (each a “Release Property”) as collateral for the Fidelis Portfolio Whole Loan, provided that the following conditions, among others, are satisfied: (a) no event of default or other Sweep Event Period then exists; (b) the Fidelis Portfolio Whole Loan borrowers partially prepay the Fidelis Portfolio Whole Loan (together with payment of a prepayment fee equal to the greater of 1% of the unpaid principal balance or yield maintenance) in an amount equal to the greatest of (i) 125% of the allocated loan amount for such Release Property, (ii) an amount which would result in the debt service coverage ratio on the then-remaining balance of the Fidelis Portfolio Whole Loan for the properties remaining after giving effect to the release being not less than the greater of (x) the debt service coverage ratio immediately prior to the release and (y) 1.74x, (iii) an amount which would result in the loan-to-value ratio on the then-remaining balance of the Fidelis Portfolio Whole Loan for the properties remaining after giving effect to the release being not greater than 65.0%, and (iv) an amount which would result in the debt yield on the then-remaining balance of the Fidelis Portfolio Whole Loan for the properties remaining after giving effect to the Release being not less than the greater of (x) the debt yield immediately prior to the release and (y) 11.8%; and (c) title to the Release Property will be transferred to a person or entity other than the Fidelis Portfolio Whole Loan borrowers or an affiliate of the Fidelis Portfolio Whole Loan borrowers. The allocated loan amounts, based on the Fidelis Portfolio Whole Loan, for the Victory Lakes Town Center Property, McKinney Towne Crossing Property and the Riverstone Shopping Center Property are $37,100,000, $35,700,000 and $21,500,000, respectively.
Ground Lease. None.
THE INFORMATION IN THIS STRUCTURAL AND COLLATERAL TERM SHEET IS NOT COMPLETE AND MAY BE AMENDED PRIOR TO THE TIME OF SALE. THIS TERM SHEET IS NOT AN OFFER TO SELL THESE SECURITIES AND IT IS NOT A SOLICITATION OF AN OFFER TO BUY THESE SECURITIES IN ANY JURISDICTION WHERE THE OFFER OR SALE IS NOT PERMITTED.
| | 85 | |
| Structural and Collateral Term Sheet | BBCMS 2018-C2 | |
| Troy Place | ||
THE INFORMATION IN THIS STRUCTURAL AND COLLATERAL TERM SHEET IS NOT COMPLETE AND MAY BE AMENDED PRIOR TO THE TIME OF SALE. THIS TERM SHEET IS NOT AN OFFER TO SELL THESE SECURITIES AND IT IS NOT A SOLICITATION OF AN OFFER TO BUY THESE SECURITIES IN ANY JURISDICTION WHERE THE OFFER OR SALE IS NOT PERMITTED.
| | 86 | |
| Structural and Collateral Term Sheet | BBCMS 2018-C2 | |
| Troy Place | ||

THE INFORMATION IN THIS STRUCTURAL AND COLLATERAL TERM SHEET IS NOT COMPLETE AND MAY BE AMENDED PRIOR TO THE TIME OF SALE. THIS TERM SHEET IS NOT AN OFFER TO SELL THESE SECURITIES AND IT IS NOT A SOLICITATION OF AN OFFER TO BUY THESE SECURITIES IN ANY JURISDICTION WHERE THE OFFER OR SALE IS NOT PERMITTED.
| | 87 | |
| Structural and Collateral Term Sheet | BBCMS 2018-C2 | |
| Troy Place | ||
| Mortgage Loan Information | Property Information | |||
| Mortgage Loan Seller: | SMC | Single Asset / Portfolio: | Single Asset | |
| Original Principal Balance: | $40,000,000 | Title: | Fee | |
| Cut-off Date Principal Balance: | $40,000,000 | Property Type - Subtype: | Office – Suburban | |
| % of IPB: | 4.5% | Net Rentable Area (SF): | 756,845 | |
| Loan Purpose: | Refinance | Location: | Troy, MI | |
| Borrowers(1): | Various | Year Built / Renovated: | 1973-1978 / N/A | |
| Sponsor: | Larry M. Nemer | Occupancy: | 73.2% | |
| Interest Rate: | 5.09000% | Occupancy Date: | 11/1/2018 | |
| Note Date: | 11/8/2018 | 4th Most Recent NOI (As of)(3): | $3,362,155 (12/31/2015) | |
| Maturity Date: | 12/6/2028 | 3rd Most Recent NOI (As of)(3): | $3,422,608 (12/31/2016) | |
| Interest-only Period: | 120 months | 2nd Most Recent NOI (As of)(3): | $4,225,791 (12/31/2017) | |
| Original Term: | 120 months | Most Recent NOI (As of): | $4,533,077 (TTM 9/30/2018) | |
| Original Amortization Term: | None | UW Economic Occupancy: | 73.0% | |
| Amortization Type: | Interest Only | UW Revenues: | $10,550,799 | |
| Call Protection: | L(24),Def(91),O(5) | UW Expenses: | $4,466,390 | |
| Lockbox / Cash Management: | Springing | UW NOI(3): | $6,084,409 | |
| Additional Debt: | N/A | UW NCF: | $5,100,510 | |
| Additional Debt Balance: | N/A | Appraised Value / Per SF: | $75,500,000 / $100 | |
| Additional Debt Type: | N/A | Appraisal Date: | 9/26/2018 | |
| Escrows and Reserves(2) | Financial Information | |||||||||
| Initial | Monthly | Initial Cap | Cut-off Date Loan / SF: | $53 | ||||||
| Taxes: | $176,523 | $44,021 | N/A | Maturity Date Loan / SF: | $53 | |||||
| Insurance: | $59,904 | $8,558 | N/A | Cut-off Date LTV: | 53.0% | |||||
| Replacement Reserves: | $0 | $18,921 | N/A | Maturity Date LTV: | 53.0% | |||||
| TI/LC: | $1,000,000 | $63,071 | $2,500,000 | UW NCF DSCR: | 2.47x | |||||
| Other: | $1,464,996 | $0 | N/A | UW NOI Debt Yield: | 15.2% | |||||
| Sources and Uses | ||||||||||
| Sources | Proceeds | % of Total | Uses | Proceeds | % of Total | |||||
| Mortgage Loan | $40,000,000 | 100.0% | Payoff Existing Debt | $31,302,857 | 78.3% | |||||
| Return of Equity | 5,321,472 | 13.3 | ||||||||
| Upfront Reserves | 2,701,423 | 6.8 | ||||||||
| Closing Costs | 674,248 | 1.7 | ||||||||
| Total Sources | $40,000,000 | 100.0% | Total Uses | $40,000,000 | 100.0% | |||||
| (1) | The borrowers under the Troy Place Mortgage Loan (as defined below) are Troy Place Equities II, LLC, Nemer Troy Place Equities II, LLC and Nemer Limited II, L.L.C. |
| (2) | For a full description of Escrows and Reserves, please refer to “Escrows and Reserves” below. |
| (3) | UW NOI is higher than historical NOI due in part to (i) an increase in occupancy from 54.4% as of December 31, 2015 to 73.2% as of November 1, 2018, (ii) nine new leases being signed in 2018 reflecting approximately $1,644,029 in rental income, and (iii) $136,544 amount of underwritten rent steps taken through April 2019. |
The Loan.TheTroy Place mortgageloanhas an outstanding principal balance as of the Cut-off Date of $40.0 million (the “Troy Place Mortgage Loan”)and is secured by a first mortgage lien on the borrowers’ fee interest in a 756,845 square foot, suburban office complex located in Troy, Michigan (the “Troy Place Property”). The Troy Place Mortgage Loan has a 10-year term and is interest-only for the full term of the loan term.
THE INFORMATION IN THIS STRUCTURAL AND COLLATERAL TERM SHEET IS NOT COMPLETE AND MAY BE AMENDED PRIOR TO THE TIME OF SALE. THIS TERM SHEET IS NOT AN OFFER TO SELL THESE SECURITIES AND IT IS NOT A SOLICITATION OF AN OFFER TO BUY THESE SECURITIES IN ANY JURISDICTION WHERE THE OFFER OR SALE IS NOT PERMITTED.
| | 88 | |
| Structural and Collateral Term Sheet | BBCMS 2018-C2 | |
| Troy Place | ||
The Property.The Troy Place Property is comprised of five, three to seven story Class B office buildings totaling 756,845 square feet and is located in Troy, Michigan. Additionally, the Troy Place Property was developed between 1973 and 1978 by the sponsor. The Troy Place Property is 73.2% occupied by 131tenants. The Troy Place Property features a granular rent roll with no tenant comprising more than 5.5% of the net rentable area.The Troy Place Property is situated along Coolidge Highway and West Big Beaver Road, an intersection with approximately 49,570 vehicles per day in the aggregate. The Troy Place Property is adjacent to the Somerset Collection, a super-regional luxury mall with approximately 180 retailers with a total of over 1.4 million square feet. Anchored by Saks, Neiman Marcus, Nordstrom and Macy’s, the Somerset Collection also has many luxury boutiques including Louis Vuitton, Burberry, Gucci and an Apple, as well as dining options that include The Capital Grille, California Pizza Kitchen, McCormick & Schmick’s, PF Chang’s and Brio Tuscan Grille. Amenities at the Troy Place Property include two full-service cafeterias, a sundry shop, an onsite full-service bank branch with drive-through, fiber optics/cable and on-site management. Additionally, several tenants have emergency back-up generators.
The Troy Place Property also has an Ocean Prime, a steak and seafood restaurant with 14 locations in major cities, on a ground-leased outparcel. The Troy Place Property contains 2,740 parking spaces which equates to a parking ratio of approximately 3.6 spaces per 1,000 square feet of net rentable area.
Environmental.According to the Phase I environmental assessment dated October 8, 2018, there was no evidence of any recognized environmental conditions at the Troy Place Property.
| Historical and Current Occupancy(1) | ||||
| 2015 | 2016 | 2017 | Current(2) | |
| Troy Place | 54.4% | 58.1% | 61.3% | 73.2% |
| (1) | Historical Occupancies are as of December 31 of each respective year. |
| (2) | Current Occupancy is as of November 1, 2018. |
| Top Ten Tenant Summary(1) | ||||||||
| Tenant | Ratings(2) Moody’s/S&P/Fitch | Net Rentable Area (SF) | % of Total NRA | Base Rent PSF | Base Rent | % of Total Base Rent | Lease Exp. Date | |
| GP Strategies Corporation(3) | NR / NR / NR | 41,566 | 5.5% | $16.75 | $696,231 | 7.1% | 6/30/2027 | |
| Marsh & McLennan Agency LLC | Baa1 / A- / A | 23,483 | 3.1 | $18.22 | 427,860 | 4.3 | 10/31/2020 | |
| ThyssenKrupp Presta North America | Ba2 / BB / BB+ | 23,260 | 3.1 | $19.00 | 441,940 | 4.5 | 3/31/2020 | |
| Kelley Blue Book Co., Inc. | Baa2 / BBB / BBB+ | 22,742 | 3.0 | $18.16 | 412,974 | 4.2 | 3/31/2024 | |
| Dynamic Acquisition Co., LLC(4) | NR / NR / NR | 19,722 | 2.6 | $17.50 | 345,135 | 3.5 | Various | |
| Populus Group, LLC | NR / NR / NR | 19,047 | 2.5 | $17.00 | 323,799 | 3.3 | 12/31/2021 | |
| Bush Seyferth & Paige PLLC | NR / NR / NR | 13,938 | 1.8 | $18.00 | 250,884 | 2.5 | 4/30/2019 | |
| Young Basile Hanlon & Macfarlane, P.C. | NR / NR / NR | 13,157 | 1.7 | $19.00 | 249,983 | 2.5 | 1/31/2020 | |
| Integra Partners Holdings | NR / NR / NR | 12,985 | 1.7 | $17.75 | 230,484 | 2.3 | 8/31/2024 | |
| Derderian Kann Seyferth | NR / NR / NR | 12,819 | 1.7 | $18.50 | 237,152 | 2.4 | 2/29/2024 | |
| Top Ten Tenants | 202,719 | 26.8% | $17.84 | $3,616,441 | 36.6% | |||
| Non Top Ten Tenants | 351,185 | 46.4% | $17.81 | $6,255,219 | 63.4% | |||
| Occupied Collateral Total | 553,904 | 73.2% | $17.82 | $9,871,660 | 100.0% | |||
| Vacant Space | 202,941 | 26.8% | ||||||
| Collateral Total | 756,845 | 100.0% | ||||||
| (1) | Based on the underwritten rent roll dated November 1, 2018. |
| (2) | Ratings provided are for the parent company of the entity listed in the “Tenant” field whether or not the parent company guarantees the lease. |
| (3) | GP Strategies Corporation has a one-time option to contract by 6,700 square feet effective December 2023. |
| (4) | Dynamic Acquisition Co., LLC occupies 18,602 square feet under a lease with an expiration date on August 31, 2024 and occupies another 1,120 square feet under a lease with an expiration date on September 30, 2019. |
THE INFORMATION IN THIS STRUCTURAL AND COLLATERAL TERM SHEET IS NOT COMPLETE AND MAY BE AMENDED PRIOR TO THE TIME OF SALE. THIS TERM SHEET IS NOT AN OFFER TO SELL THESE SECURITIES AND IT IS NOT A SOLICITATION OF AN OFFER TO BUY THESE SECURITIES IN ANY JURISDICTION WHERE THE OFFER OR SALE IS NOT PERMITTED.
| | 89 | |
| Structural and Collateral Term Sheet | BBCMS 2018-C2 | |
| Troy Place | ||
| Lease Rollover Schedule(1)(2) | |||||||||
| Year | Number of Leases Expiring | Net Rentable Area Expiring | % of NRA Expiring | Base Rent Expiring | % of Base Rent Expiring | Cumulative Net Rentable Area Expiring | Cumulative % of NRA Expiring | Cumulative Base Rent Expiring | Cumulative % of Base Rent Expiring |
| Vacant | NAP | 202,941 | 26.8% | NAP | NAP | 202,941 | 26.8% | NAP | NAP |
| 2018 & MTM | 4 | 4,203 | 0.6 | $74,234 | 0.8% | 207,144 | 27.4% | $74,234 | 0.8% |
| 2019 | 45 | 118,188 | 15.6 | 2,130,194 | 21.6 | 325,332 | 43.0% | $2,204,427 | 22.3% |
| 2020(3) | 31 | 148,670 | 19.6 | 2,515,644 | 25.5 | 474,002 | 62.6% | $4,720,072 | 47.8% |
| 2021 | 17 | 62,331 | 8.2 | 1,104,648 | 11.2 | 536,333 | 70.9% | $5,824,720 | 59.0% |
| 2022 | 14 | 47,229 | 6.2 | 850,052 | 8.6 | 583,562 | 77.1% | $6,674,772 | 67.6% |
| 2023 | 8 | 37,230 | 4.9 | 792,921 | 8.0 | 620,792 | 82.0% | $7,467,693 | 75.6% |
| 2024 | 8 | 74,174 | 9.8 | 1,352,985 | 13.7 | 694,966 | 91.8% | $8,820,678 | 89.4% |
| 2025 | 2 | 14,689 | 1.9 | 261,955 | 2.7 | 709,655 | 93.8% | $9,082,634 | 92.0% |
| 2026 | 0 | 0 | 0.0 | 0 | 0.0 | 709,655 | 93.8% | $9,082,634 | 92.0% |
| 2027 | 1 | 41,566 | 5.5 | 696,231 | 7.1 | 751,221 | 99.3% | $9,778,864 | 99.1% |
| 2028 | 1 | 5,624 | 0.7 | 92,796 | 0.9 | 756,845 | 100.0% | $9,871,660 | 100.0% |
| 2029 & Beyond | 0 | 0 | 0.0 | 0 | 0.0 | 756,845 | 100.0% | $9,871,660 | 100.0% |
| Total | 131 | 756,845 | 100.0% | $9,871,660 | 100.0% | ||||
| (1) | Based on the underwritten rent roll dated November 1, 2018. |
| (2) | Certain tenants may have lease termination options that are exercisable prior to the originally stated expiration date of the subject lease that are not considered in the lease rollover schedule. |
| (3) | Includes 13,527 square feet of cafeteria space that is underwritten as physically occupied but economically vacant. |
| Operating History and Underwritten Net Cash Flow | |||||||
| 2015 | 2016 | 2017 | TTM(1) | Underwritten | Per Square Foot | %(2) | |
| Rents in Place | $6,890,706 | $7,060,635 | $7,911,485 | $8,454,699 | $9,871,660 | $13.04 | 69.6% |
| Vacant Income | 0 | 0 | 0 | 0 | 3,835,533 | 5.07 | 27.0 |
| Gross Potential Rent | $6,890,706 | $7,060,635 | $7,911,485 | $8,454,699 | $13,707,193 | $18.11 | 96.6% |
| Tenant Electric | 373,311 | 381,373 | 397,557 | 415,960 | 413,969 | 0.55 | 2.9 |
| Total Reimbursements | 21,473 | 62,985 | 72,990 | 74,610 | 69,722 | 0.09 | 0.5 |
| Net Rental Income | $7,285,490 | $7,504,993 | $8,382,032 | $8,945,269 | $14,190,884 | $18.75 | 100.0% |
| (Vacancy/Credit Loss) | 0 | 0 | 0 | 0 | (3,835,533) | (5.07) | (27.0) |
| Other Income | 1,901 | 1,828 | 1,800 | 1,800 | 195,448 | 0.26 | 1.4 |
| Effective Gross Income | $7,287,391 | $7,506,821 | $8,383,832 | $8,947,069 | $10,550,799 | $13.94 | 74.3% |
| Total Expenses | $3,925,236 | $4,084,213 | $4,158,041 | $4,413,992 | $4,466,390 | $5.90 | 42.3% |
| Net Operating Income(3) | $3,362,155 | $3,422,608 | $4,225,791 | $4,533,077 | $6,084,409 | $8.04 | 57.7% |
| Total TI/LC, Capex/RR | 0 | 0 | 0 | 0 | 983,899 | 1.30 | 9.3 |
| Net Cash Flow | $3,362,155 | $3,422,608 | $4,225,791 | $4,533,077 | $5,100,510 | $6.74 | 48.3% |
| (1) | TTM represents the trailing 12 month period ending September 30, 2018. |
| (2) | Percentage column represents percent of Net Rental Income for all revenue lines and represents percent of Effective Gross Income for the remainder of fields. |
| (3) | Underwritten Net Operating Income is higher than historical Net Operating Income due in part to (i) an increase in occupancy from 54.4% in 2015 to 72.3% as of November 1, 2018, (ii) nine new leases being signed in 2018 reflecting approximately $1,644,029 in rental income, and (iii) $136,544 amount of underwritten rent steps taken through April 2019. |
The Market.The Troy Place Property is located in Troy, Oakland County, Michigan. The Troy Place Property is situated approximately 19 miles north of downtown Detroit in the Detroit office market. The Detroit office market contains approximately 192.7 million square feet with a third quarter 2018 vacancy rate of 9.7% and asking rent of $19.21 per square foot. The Troy Place Property is located within the Troy office submarket. The Troy office submarket contains approximately 18.2 million square feet with a third quarter 2018 vacancy
THE INFORMATION IN THIS STRUCTURAL AND COLLATERAL TERM SHEET IS NOT COMPLETE AND MAY BE AMENDED PRIOR TO THE TIME OF SALE. THIS TERM SHEET IS NOT AN OFFER TO SELL THESE SECURITIES AND IT IS NOT A SOLICITATION OF AN OFFER TO BUY THESE SECURITIES IN ANY JURISDICTION WHERE THE OFFER OR SALE IS NOT PERMITTED.
| | 90 | |
| Structural and Collateral Term Sheet | BBCMS 2018-C2 | |
| Troy Place | ||
rate of 13.2% and asking rent of $19.56 per square foot. The appraisal determined market rent of $18.50 per square foot for standard office space and $18.00 per square foot for large office space (greater than 10,000 square feet). The estimated 2017 population within a one-, three- and five-mile radius of the Troy Place Property was 12,545, 83,151 and 227,242, respectively. The estimated 2017 average household income within a one-, three- and five-mile radius of the Troy Place Property was $114,728, $127,216 and $116,331, respectively.
The following table presents standard office rental data with respect to comparable office properties with respect to the Troy Place Property as identified in the appraisal:
| Comparable Standard Office Rental Summary(1) | |||||||||
| Property Name/Location | Year Built | Occ. | Size (SF) | Tenant | Suite Size (SF) | Rent PSF(2) | Adjusted Rent PSF(3) | Commencement | Lease Term (Years) |
Troy Place 3001, 3155, 3221 and 3331 West Big Beaver Road and 2855 Coolidge Highway Troy, MI | 1973-1978 | 73.2% | 756,845 | - | - | $18.23 | - | - | - |
North Troy Corporate Park 700 Tower Drive Troy, MI | 1984 | 88.3% | 240,548 | North American Interconnect L.L.C. | 6,013 | $17.25 | $18.29 | Jul-17 | 5.3 |
Columbia Center I 201 West Big Beaver Road Troy, MI | 1989 | 97.5% | 254,978 | Confidential | 2,658 | $22.50 | $16.07 | Feb-17 | 5.1 |
Sheffield Office Park I 3250 West Big Beaver Road Troy, MI | 1974 | 61.9% | 149,134 | Confidential | 1,127 | $15.50 | $15.81 | Jan-17 | 3.0 |
Wilshire Plaza 900 & 1050 Wilshire Drive Troy, MI | 1986 | 89.1% | 349,643 | First American Title Insurance | 4,316 | $20.20 | $20.60 | Dec-16 | 1.8 |
Liberty Center 50 West Big Beaver Troy, MI | 1988 | 90.6% | 149,976 | Corning | 5,544 | $21.00 | $20.35 | Aug-16 | 10.0 |
Troy Office Centre 300, 320 & 340 East Big Beaver Road Troy, MI | 1986 | 85.0% | 737,463 | Trion Solutions | 5,627 | $18.45 | $17.88 | Jun-16 | 3.3 |
| (1) | Source:Appraisal. |
| (2) | For the Troy Place Property, represents weighted average underwritten rent per square foot for office space under 10,000 square feet. |
| (3) | As adjusted by the appraiser after taking market conditions, quality, condition, exposure, and access into account. |
THE INFORMATION IN THIS STRUCTURAL AND COLLATERAL TERM SHEET IS NOT COMPLETE AND MAY BE AMENDED PRIOR TO THE TIME OF SALE. THIS TERM SHEET IS NOT AN OFFER TO SELL THESE SECURITIES AND IT IS NOT A SOLICITATION OF AN OFFER TO BUY THESE SECURITIES IN ANY JURISDICTION WHERE THE OFFER OR SALE IS NOT PERMITTED.
| | 91 | |
| Structural and Collateral Term Sheet | BBCMS 2018-C2 | |
| Troy Place | ||
The following table presents large office rental data with respect to comparable office properties with respect to the Troy Place Property as identified in the appraisal:
| Comparable Large Office Rental Summary(1) | |||||||||
| Property Name/Location | Year Built | Occ. | Size (SF) | Tenant | Suite Size (SF) | Rent PSF(2) | Adjusted Rent PSF(3) | Commencement | Lease Term (Years) |
Troy Place 3001, 3155, 3221 and 3331 West Big Beaver Road and 2855 Coolidge Highway Troy, MI | 1973-1978 | 73.2% | 756,845 | - | - | $17.86 | - | - | - |
5555 New King 5555 New King Street Troy, MI | 1985 | 64.9% | 113,300 | Confidential | 10,656 | $17.00 | $18.03 | Jan-18 | 6.0 |
PNC Center 755 West Big Beaver Road Troy, MI | 1975 | 86.5% | 535,868 | Confidential | 18,500 | $20.65 | $15.65 | Aug-17 | 7.5 |
1441 West Long Lake Road 1441 West Long Lake Road Troy, MI | 1999 | 99.0% | 183,826 | Confidential | 18,903 | $21.50 | $19.55 | Jun-17 | 5.3 |
800 Tower 800 Tower Drive Troy, MI | 1990 | 81.6% | 218,000 | Confidential | 15,013 | $17.50 | $15.91 | Apr-17 | 7.3 |
Wilshire Plaza 900 & 1050 Wilshire Drive Troy, MI | 1986 | 89.1% | 349,643 | Entrega Systems | 13,190 | $20.00 | $20.40 | Feb-17 | 6.8 |
Troy Office Centre 300, 320 & 340 East Big Beaver Road Troy, MI | 1986 | 85.0% | 737,463 | Midland Credit Management | 31,169 | $18.00 | $17.44 | Jul-16 | 7.5 |
| (1) | Source:Appraisal. |
| (2) | For the Troy Place Property, represents underwritten rent per square foot for office space over 10,000 square feet. |
| (3) | As adjusted by the appraiser after taking market conditions, quality, exposure, condition and access. |
The Borrowers. The borrowing entities, as tenants-in-common, for the Troy Place Mortgage Loan are Troy Place Equities II, LLC, Nemer Troy Place Equities II, LLC and Nemer Limited II, L.L.C., each a Delaware limited liability company and special purpose entity with one independent director. Legal counsel to the borrowers delivered a non-consolidation opinion in connection with the origination of the Troy Place Mortgage Loan. Larry M. Nemer is the guarantor of certain nonrecourse carve-outs under the Troy Place Mortgage Loan.
The Loan Sponsor.TheTroy Place Mortgage Loan sponsor is Larry M. Nemer. Larry M. Nemer, through his wholly owned Nemer Property Group, Inc. (“NPG”), manages and has ownership interests in over 1.0 million square feet of office properties and more than 600,000 square feet of industrial properties throughout the Detroit area. Mr. Nemer has been with NPG since 1986 and has been its president since 2000. NPG was founded in 1950 by Larry Nemer’s father and is a full-service real estate organization providing management, leasing and tenant improvement construction, and design services. The sponsor disclosed two prior maturity defaults, one of which was resolved via a discounted payoff. See “Description of the Mortgage Pool–Loan Purpose; Default History, Bankruptcy Issues and Other Proceedings” in the Preliminary Prospectus.
Property Management. The Troy Place Property is managed by NPG, an affiliate of the borrowers.
Escrows and Reserves. At origination, the borrowers were required to deposit into escrow $1,000,000 for future tenant improvements and leasing commissions, $976,875 for immediate repairs, approximately $378,121 for rent concessions, approximately $176,523 for real estate taxes, $110,000 for existing tenant improvements and leasing commissions and approximately $59,904 for insurance premiums.
Tax Escrows– On a monthly basis, the borrowers are required to escrow 1/12 of the annual estimated tax payments, which currently equates to approximately $44,021.
THE INFORMATION IN THIS STRUCTURAL AND COLLATERAL TERM SHEET IS NOT COMPLETE AND MAY BE AMENDED PRIOR TO THE TIME OF SALE. THIS TERM SHEET IS NOT AN OFFER TO SELL THESE SECURITIES AND IT IS NOT A SOLICITATION OF AN OFFER TO BUY THESE SECURITIES IN ANY JURISDICTION WHERE THE OFFER OR SALE IS NOT PERMITTED.
| | 92 | |
| Structural and Collateral Term Sheet | BBCMS 2018-C2 | |
| Troy Place | ||
Insurance Escrows - On a monthly basis, the borrowers are required to escrow 1/12 of the annual estimated insurance payments, which currently equates to approximately $8,558.
Replacement Reserves - On a monthly basis, the borrowers are required to escrow $18,921 for replacement reserves (approximately $0.30 per square foot annually).
TI/LC Reserves- The borrowers are required to escrow $63,071 (approximately $1.00 per square foot annually) on a monthly basis for tenant improvement and leasing commission reserves, which requirement does not apply if (i) no Sweep Event Period (as defined below) is continuing and (ii) the amount on deposit for such tenant improvement and leasing commission reserves equals or exceeds a $2,500,000 cap.
Lockbox / Cash Management.The Troy Place Mortgage Loan is structured with a springing lockbox and springing cash management. The Troy Place Mortgage Loan requires that after the occurrence of a Sweep Event Period, the borrowers or property manager deliver tenant direction letters to the tenants directing such tenants to pay all rents into the lockbox account. Upon the occurrence and during the continuance of a Sweep Event Period, all funds in the lockbox account are required to be swept daily to a cash management account under the control of the lender to be applied and disbursed in accordance with the Troy Place Mortgage Loan documents and all excess cash flow funds remaining in the cash management account after the application of such funds in accordance with the Troy Place Mortgage Loan documents are required to be held by the lender in an excess cash flow reserve account as additional collateral for the Troy Place Mortgage Loan. To the extent that no Sweep Event Period is continuing, all excess cash flow funds are required to be disbursed to the Troy Place Mortgage Loan borrowers.
A “Sweep Event Period” will commence upon the earliest of the following: (i) the occurrence of an event of default or (ii) the date on which the debt service coverage ratio based on the trailing 12-month period, as determined by the lender in its sole discretion is less than 1.50x.
A Sweep Event Period will end: with regard to clause (i) above, upon the cure of such event of default and with regard to clause (ii) above, upon the debt service coverage ratio based on the trailing 12-month period being at least 1.60x for two consecutive calendar quarters.
Subordinate and Mezzanine Debt. None.
Partial Release. Not Permitted.
Ground Lease. None.
THE INFORMATION IN THIS STRUCTURAL AND COLLATERAL TERM SHEET IS NOT COMPLETE AND MAY BE AMENDED PRIOR TO THE TIME OF SALE. THIS TERM SHEET IS NOT AN OFFER TO SELL THESE SECURITIES AND IT IS NOT A SOLICITATION OF AN OFFER TO BUY THESE SECURITIES IN ANY JURISDICTION WHERE THE OFFER OR SALE IS NOT PERMITTED.
| | 93 | |
| Structural and Collateral Term Sheet | BBCMS 2018-C2 | |
| West Covina Village | ||

THE INFORMATION IN THIS STRUCTURAL AND COLLATERAL TERM SHEET IS NOT COMPLETE AND MAY BE AMENDED PRIOR TO THE TIME OF SALE. THIS TERM SHEET IS NOT AN OFFER TO SELL THESE SECURITIES AND IT IS NOT A SOLICITATION OF AN OFFER TO BUY THESE SECURITIES IN ANY JURISDICTION WHERE THE OFFER OR SALE IS NOT PERMITTED.
| | 94 | |
| Structural and Collateral Term Sheet | BBCMS 2018-C2 | |
| West Covina Village | ||
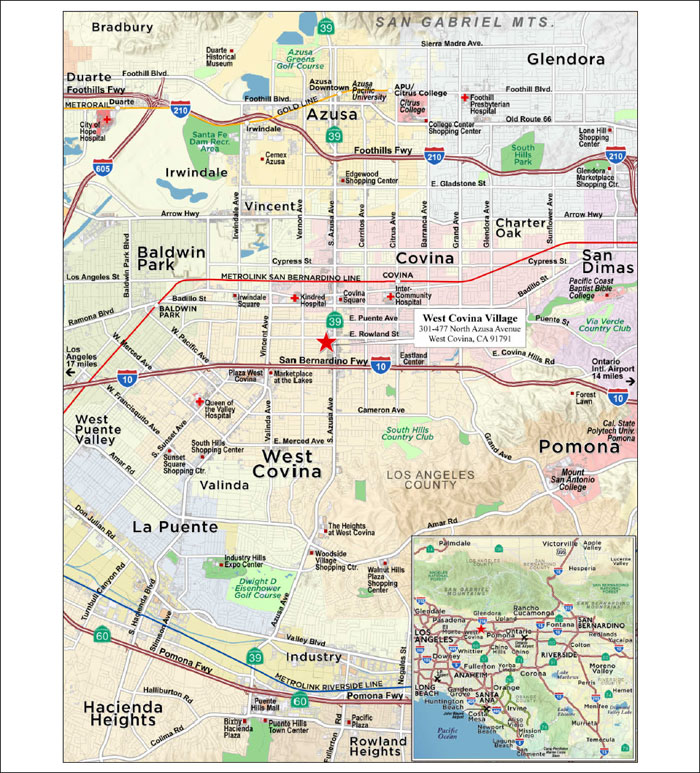
THE INFORMATION IN THIS STRUCTURAL AND COLLATERAL TERM SHEET IS NOT COMPLETE AND MAY BE AMENDED PRIOR TO THE TIME OF SALE. THIS TERM SHEET IS NOT AN OFFER TO SELL THESE SECURITIES AND IT IS NOT A SOLICITATION OF AN OFFER TO BUY THESE SECURITIES IN ANY JURISDICTION WHERE THE OFFER OR SALE IS NOT PERMITTED.
| | 95 | |
| Structural and Collateral Term Sheet | BBCMS 2018-C2 | |
| West Covina Village | ||
| Mortgage Loan Information | Property Information | |||
| Mortgage Loan Seller: | SMC | Single Asset / Portfolio: | Single Asset | |
| Original Principal Balance: | $36,000,000 | Title: | Fee | |
| Cut-off Date Principal Balance: | $36,000,000 | Property Type - Subtype: | Mixed Use – Retail/Office | |
| % of IPB: | 4.0% | Net Rentable Area (SF): | 220,000 | |
| Loan Purpose: | Refinance | Location: | West Covina, CA | |
| Borrower: | Azusa Rowland, LLC | Year Built / Renovated: | 1981 / 2017 | |
| Sponsors: | Tarek Alhassen and Dighton | Occupancy: | 89.3% | |
| America Inc. | Occupancy Date: | 11/5/2018 | ||
| Interest Rate: | 5.43600% | 4thMost Recent NOI (As of): | $2,577,306 (12/31/2015) | |
| Note Date: | 11/7/2018 | 3rd Most Recent NOI (As of): | $2,700,787 (12/31/2016) | |
| Maturity Date: | 12/6/2028 | 2nd Most Recent NOI (As of): | $2,791,622 (12/31/2017) | |
| Interest-only Period: | 48 months | Most Recent NOI (As of)(2): | $2,769,661 (TTM 8/31/2018) | |
| Original Term: | 120 months | UW Economic Occupancy: | 92.8% | |
| Original Amortization Term: | 360 months | UW Revenues: | $5,044,678 | |
| Amortization Type: | IO-Balloon | UW Expenses: | $1,435,151 | |
| Call Protection: | L(24),Def(92),O(4) | UW NOI(2): | $3,609,527 | |
| Lockbox / Cash Management: | Springing | UW NCF: | $3,345,527 | |
| Additional Debt: | N/A | Appraised Value / Per SF: | $61,600,000 / $280 | |
| Additional Debt Balance: | N/A | Appraisal Date: | 10/8/2018 | |
| Additional Debt Type: | N/A | |||
| Escrows and Reserves(1) | Financial Information | ||||||
| Initial | Monthly | Initial Cap | Cut-off Date Loan / SF: | $164 | |||
| Taxes: | $93,324 | $46,662 | N/A | Maturity Date Loan / SF: | $149 | ||
| Insurance: | $72,609 | $6,601 | N/A | Cut-off Date LTV: | 58.4% | ||
| Replacement Reserves: | $275,000 | $3,667 | N/A | Maturity Date LTV: | 53.3% | ||
| TI/LC: | $0 | $41,250 | $1,500,000 | UW NCF DSCR: | 1.37x | ||
| Other: | $0 | $0 | N/A | UW NOI Debt Yield: | 10.0% | ||
| Sources and Uses | ||||||
| Sources | Proceeds | % of Total | Uses | Proceeds | % of Total | |
| Mortgage Loan | $36,000,000 | 100.0% | Payoff Existing Debt | $34,705,976 | 96.4% | |
| Closing Costs | 632,267 | 1.8 | ||||
| Upfront Reserves | 440,934 | 1.2 | ||||
| Return of Equity | 220,824 | 0.6 | ||||
| Total Sources | $36,000,000 | 100.0% | Total Uses | $36,000,000 | 100.0% | |
| (1) | For a full description of Escrows and Reserves, please refer to “Escrows and Reserves” below. |
| (2) | UW NOI is higher than Most Recent NOI due in part to (i) UEI (as defined below) leasing a previously vacant suite totaling 34,603 square feet with total underwritten rent and reimbursements of approximately $754,691 that commenced in January 2018, (ii) Turner Outdoorsman expanding into 9,425 square feet (up from 4,780 square feet) and commencing payment of expense reimbursements, which resulted in approximately $64,467 of additional rental income, and (iii) Cafe Chimichurri taking 9,062 square feet of previously vacant space and paying a total of approximately $277,297 in underwritten rent and reimbursements |
THE INFORMATION IN THIS STRUCTURAL AND COLLATERAL TERM SHEET IS NOT COMPLETE AND MAY BE AMENDED PRIOR TO THE TIME OF SALE. THIS TERM SHEET IS NOT AN OFFER TO SELL THESE SECURITIES AND IT IS NOT A SOLICITATION OF AN OFFER TO BUY THESE SECURITIES IN ANY JURISDICTION WHERE THE OFFER OR SALE IS NOT PERMITTED.
| | 96 | |
| Structural and Collateral Term Sheet | BBCMS 2018-C2 | |
| West Covina Village | ||
The Loan.TheWest Covina Village mortgageloanhas an outstanding principal balance as of the Cut-off Date of $36.0 million (the “West Covina Village Mortgage Loan”)and is secured by a first mortgage lien on the borrower’s fee interest in a 220,000 square foot, grocery-anchored mixed use property located in West Covina, California (the “West Covina VillageProperty”). The West Covina Village Mortgage Loan has a 10-year term and, following a four-year interest-only period, amortizes on a 30-year schedule. The previously existing debt was securitized in 2006 as part of the CSMC 2006-C5 transaction.
The Property.The West Covina Village Property is a 220,000 square foot mixed use property anchored by Stater Bros. and is located in West Covina, California. The West Covina Village Property is 89.3% occupied by 31 tenants, of which 20 tenants representing approximately 52.5% of the net rentable area have been in occupancy for at least 10 years or exercised at least one lease renewal option. Additionally, approximately 35.0% of the net rentable area is occupied by tenants that have been in occupancy for more than 20 years.The West Covina Village Property was built in 1981 and most recently renovated in 2017, is situated on approximately 16.9 acres andat the intersection of North Azusa Avenue and Rowland Avenue. Stater Bros. is leasing the 35,232 square foot grocery store space and recently executed a lease renewal option that runs through December 10, 2021. Stater Bros. has been in occupancy at the West Covina Village Property since 1986, has renewed three times and has two, five-year lease renewal options remaining under its lease.
As of the trailing-12 months ending in September 2018, Stater Bros. reported sales of approximately $31,440,367 which is approximately $892 per square foot and an approximately 1.6% occupancy cost. Stater Bros. recently completed a renovation of its space at the West Covina Village Property. Renovations included new flooring, energy-efficient LED lighting, and new refrigeration display cases. Other additions included a handcrafted sushi bar, a display case with an assortment of fresh fruit cut in-store each day, a wider selection of premium wines and an expanded section for freshly prepared, grab-and-go food items.The West Covina Village Property also features a variety of national, regional and local in-line tenants such as LA Fitness, Dollar Tree, Wingstop and JP Morgan Chase Bank N.A. Additionally, the West Covina Village Property is home to the United Education Institute (“UEI”), which occupies 34,603 square feet of office space and is accredited by the Accrediting Council for Continuous Education and Training (“ACCET”). UEI was founded in 1974 for the purpose of improving continuing education and training, ACCET has been officially recognized as a “reliable authority” by the U.S. Department of Education since 1978. UEI’s West Covina campus has vocational and trade programs in industries such as business, computer technology, criminal justice, HVAC, and medical/dental. UEI has 13 campuses in California and 15 campuses nationwide. The West Covina Village Property contains 966 parking spaces which equates to a parking ratio of approximately 4.4 spaces per 1,000 square feet of net rentable area.
Environmental.According to the Phase I environmental assessment dated October 11, 2018, there was no evidence of any recognized environmental conditions at the West Covina Village Property.
| Historical and Current Occupancy(1) | ||||
| 12/22/2015 | 2/22/2017 | 1/31/2018 | Current(2) | |
| West Covina Village | 70.8% | 75.6% | 91.9% | 89.3% |
| (1) | Historical Occupancies are as of each specified date. |
| (2) | Current Occupancy is as of November 5, 2018. |
THE INFORMATION IN THIS STRUCTURAL AND COLLATERAL TERM SHEET IS NOT COMPLETE AND MAY BE AMENDED PRIOR TO THE TIME OF SALE. THIS TERM SHEET IS NOT AN OFFER TO SELL THESE SECURITIES AND IT IS NOT A SOLICITATION OF AN OFFER TO BUY THESE SECURITIES IN ANY JURISDICTION WHERE THE OFFER OR SALE IS NOT PERMITTED.
| | 97 | |
| Structural and Collateral Term Sheet | BBCMS 2018-C2 | |
| West Covina Village | ||
| Top Ten Tenant Summary(1) | |||||||||||
| Tenant | Ratings(2) Moody’s/S&P/Fitch | Lease Type | Net Rentable Area (SF) | % of Total NRA | Base Rent PSF | Base Rent | % of Total Base Rent | Sales PSF | Occ. Costs | Lease Exp. Date | |
| Stater Bros.(3) | NR / NR / NR | Retail | 35,232 | 16.0% | $9.92 | $349,492 | 8.9% | $892 | 1.6% | 12/10/2021 | |
| UEI | NR / NR / NR | Office | 34,603 | 15.7 | $15.45 | 534,616 | 13.7 | NAV | NAV | 1/31/2028 | |
| LA Fitness(4) | NR / NR / NR | Retail | 28,300 | 12.9 | $32.77 | 927,381 | 23.7 | NAV | NAV | 11/30/2026 | |
| Dollar Tree | Baa3 / BBB- / NR | Retail | 10,234 | 4.7 | $13.20 | 135,089 | 3.5 | NAV | NAV | 3/31/2022 | |
| Turner’s Outdoorsman | NR / NR / NR | Retail | 9,425 | 4.3 | $11.52 | 108,576 | 2.8 | NAV | NAV | 12/31/2028 | |
| Café Chimichurri | NR / NR / NR | Retail | 9,062 | 4.1 | $24.00 | 217,488 | 5.6 | NAV | NAV | 11/30/2028 | |
| CareMore Medical Enterprises | NR / NR / NR | Office | 8,663 | 3.9 | $29.94 | 259,371 | 6.6 | NAV | NAV | 8/31/2021 | |
| Automobile Club of Southern CA | NR / NR / NR | Retail | 6,380 | 2.9 | $19.80 | 126,324 | 3.2 | NAV | NAV | 12/31/2020 | |
| Tasty Goody Food Group | NR / NR / NR | Retail | 4,950 | 2.3 | $21.43 | 106,102 | 2.7 | NAV | NAV | 5/1/2028 | |
| JP Morgan Chase Bank N.A. | A2 / A- / AA- | Retail | 4,500 | 2.0 | $31.33 | 141,000 | 3.6 | NAV | NAV | 12/31/2031 | |
| Top Ten Tenants | 151,349 | 68.8% | $19.20 | $2,905,440 | 74.3% | ||||||
| Non Top Ten Tenants | 45,079 | 20.5% | $22.27 | $1,003,924 | 25.7% | ||||||
| Occupied Collateral Total | 196,428 | 89.3% | $19.90 | $3,909,364 | 100.0% | ||||||
| Vacant Space | 23,572 | 10.7% | |||||||||
| Collateral Total | 220,000 | 100.0% | |||||||||
| (1) | Based on the underwritten rent roll dated November 5, 2018. |
| (2) | Ratings provided are for the parent company of the entity listed in the “Tenant” field whether or not the parent company guarantees the lease. |
| (3) | Sales PSF and Occ. Costs for Stater Bros. represent the trailing 12-months ending September 30, 2018 sales. |
| (4) | LA Fitness has the one time right to terminate its lease effective November 30, 2021 with six months’ notice. |
| Lease Rollover Schedule(1)(2) | |||||||||
| Year | Number of Leases Expiring | Net Rentable Area Expiring | % of NRA Expiring | Base Rent Expiring | % of Base Rent Expiring | Cumulative Net Rentable Area Expiring | Cumulative % of NRA Expiring | Cumulative Base Rent Expiring | Cumulative % of Base Rent Expiring |
| Vacant | NAP | 23,572 | 10.7% | NAP | NAP | 23,572 | 10.7% | NAP | NAP |
| 2018 & MTM | 2 | 3,050 | 1.4 | $50,274 | 1.3% | 26,622 | 12.1% | $50,274 | 1.3% |
| 2019 | 6 | 16,050 | 7.3 | 395,027 | 10.1 | 42,672 | 19.4% | $445,301 | 11.4% |
| 2020 | 3 | 10,380 | 4.7 | 197,619 | 5.1 | 53,052 | 24.1% | $642,920 | 16.4% |
| 2021 | 4 | 46,795 | 21.3 | 668,983 | 17.1 | 99,847 | 45.4% | $1,311,903 | 33.6% |
| 2022 | 5 | 14,629 | 6.6 | 261,012 | 6.7 | 114,476 | 52.0% | $1,572,915 | 40.2% |
| 2023 | 2 | 6,700 | 3.0 | 158,820 | 4.1 | 121,176 | 55.1% | $1,731,735 | 44.3% |
| 2024 | 1 | 3,404 | 1.5 | 58,681 | 1.5 | 124,580 | 56.6% | $1,790,416 | 45.8% |
| 2025 | 1 | 3,080 | 1.4 | 57,684 | 1.5 | 127,660 | 58.0% | $1,848,100 | 47.3% |
| 2026 | 1 | 28,300 | 12.9 | 927,381 | 23.7 | 155,960 | 70.9% | $2,775,482 | 71.0% |
| 2027 | 0 | 0 | 0.0 | 0 | 0.0 | 155,960 | 70.9% | $2,775,482 | 71.0% |
| 2028 | 5 | 59,540 | 27.1 | 992,882 | 25.4 | 215,500 | 98.0% | $3,768,364 | 96.4% |
| 2029 & Beyond | 1 | 4,500 | 2.0 | 141,000 | 3.6 | 220,000 | 100.0% | $3,909,364 | 100.0% |
| Total | 31 | 220,000 | 100.0% | $3,909,364 | 100.0% | ||||
| (1) | Based on the underwritten rent roll dated November 5, 2018. |
| (2) | Certain tenants may have lease termination options that are exercisable prior to the originally stated expiration date of the subject lease that are not considered in the lease rollover schedule. |
THE INFORMATION IN THIS STRUCTURAL AND COLLATERAL TERM SHEET IS NOT COMPLETE AND MAY BE AMENDED PRIOR TO THE TIME OF SALE. THIS TERM SHEET IS NOT AN OFFER TO SELL THESE SECURITIES AND IT IS NOT A SOLICITATION OF AN OFFER TO BUY THESE SECURITIES IN ANY JURISDICTION WHERE THE OFFER OR SALE IS NOT PERMITTED.
| | 98 | |
| Structural and Collateral Term Sheet | BBCMS 2018-C2 | |
| West Covina Village | ||
| Operating History and Underwritten Net Cash Flow | |||||||
| 2015 | 2016 | 2017 | TTM(1) | Underwritten | Per Square Foot | %(2) | |
| Rents in Place | $3,435,049 | $3,226,444 | $3,263,850 | $3,302,087 | $3,909,364 | $17.77 | 71.9% |
| Vacant Income | 0 | 0 | 0 | 0 | 391,680 | 1.78 | 7.2 |
| Gross Potential Rent | $3,435,049 | $3,226,444 | $3,263,850 | $3,302,087 | $4,301,044 | $19.55 | 79.1% |
| Total Reimbursements | 442,391 | 835,121 | 867,483 | 867,484 | 1,135,314 | 5.16 | 20.9 |
| Net Rental Income | $3,877,440 | $4,061,565 | $4,131,333 | $4,169,571 | $5,436,358 | $24.71 | 100.0% |
| (Vacancy/Credit Loss) | 0 | 0 | 0 | 0 | (391,680) | (1.78) | (7.2) |
| Other Income | 0 | 3,513 | 0 | 0 | 0 | 0.00 | 0.0 |
| Effective Gross Income | $3,877,440 | $4,065,078 | $4,131,333 | $4,169,571 | $5,044,678 | $22.93 | 92.8% |
| Total Expenses | $1,300,134 | $1,364,291 | $1,339,711 | $1,399,910 | $1,435,151 | $6.52 | 28.4% |
| Net Operating Income(3) | $2,577,306 | $2,700,787 | $2,791,622 | $2,769,661 | $3,609,527 | $16.41 | 71.6% |
| Total TI/LC, Capex/RR | 0 | 0 | 0 | 0 | 264,000 | 1.20 | 5.2 |
| Net Cash Flow | $2,577,306 | $2,700,787 | $2,791,622 | $2,769,661 | $3,345,527 | $15.21 | 66.3% |
| (1) | TTM represents the trailing 12-month period ending August 31, 2018. |
| (2) | Percentage column represents percent of Net Rental Income for all revenue lines and represents percent of Effective Gross Income for the remainder of fields. |
| (3) | Underwritten Net Operating Income is higher than TTM Net Operating Income due in part to (i) UEI leasing a previously vacant suite totaling 34,603 square feet with total underwritten rent and reimbursements of approximately $754,691 that commenced January 2018, (ii) Turner Outdoorsman expanding into 9,425 square feet (up from 4,780 square feet) and commencing payment of expense reimbursements, which resulted in approximately $64,467 of additional rental income, and (iii) Cafe Chimichurri taking 9,062 square feet of previously vacant space and paying a total of approximately $277,297 in underwritten rent and reimbursements. |
The Market.The West Covina Village Property is located in West Covina, Los Angeles County, California. The West Covina Village Property is situated approximately 20 miles east of the Los Angeles central business district in the San Gabriel Valley retail market. As of the third quarter of 2018, the San Gabriel Valley retail market contains approximately 62.6 million square feet, vacancy rate of 3.5% and asking rent of $21.84 per square foot. The West Covina Village Property is located within the Covina/West Covina retail submarket. As of the third quarter of 2018, the Covina/West Covina retail submarket contains approximately 11.1 million square feet, vacancy rate of 2.3% and asking rent of $18.56 per square foot. The appraisal determined market rent of $18.00 per square foot for supermarket space, $12.00 per square foot for junior anchor space, $18.00 per square foot for office space, $21.00 per square foot for inline space, $27.00 per square foot for pad retail space, $21.00 per square foot for inline restaurant space, $24.00 per square foot for pad restaurant space, $27.00 per square foot for pad bank space and $21.00 per square foot for the health club space. The estimated 2017 population within a five-, ten- and 15-minute radius of the West Covina Village Property was 41,548, 297,882 and 719,540, respectively. The estimated 2017 average household income within a five-, ten- and 15-minute radius of the West Covina Village Property was $85,341, $79,651 and $77,607, respectively.
THE INFORMATION IN THIS STRUCTURAL AND COLLATERAL TERM SHEET IS NOT COMPLETE AND MAY BE AMENDED PRIOR TO THE TIME OF SALE. THIS TERM SHEET IS NOT AN OFFER TO SELL THESE SECURITIES AND IT IS NOT A SOLICITATION OF AN OFFER TO BUY THESE SECURITIES IN ANY JURISDICTION WHERE THE OFFER OR SALE IS NOT PERMITTED.
| | 99 | |
| Structural and Collateral Term Sheet | BBCMS 2018-C2 | |
| West Covina Village | ||
The following table presents junior anchor, office, inline and pad rental data with respect to comparable retail properties with respect to the West Covina Village Property as identified in the appraisal:
| Comparable Junior Anchor, Office, Inline and Pad Rental Summary(1) | |||||||||
| Property Name/Location | Year Built | Occ. | Size (SF) | Tenant | Suite Size (SF) | Rent PSF(2) | Adjusted Rent PSF(3) | Commencement | Lease Term (Years) |
West Covina Village 301-477 North Azusa Avenue West Covina, CA | 1981 | 89.3% | 220,000 | - | - | $22.08 | - | - | - |
Covina Marketplace 1405-1453 North Azusa Avenue Covina, CA | 1989 | 100.0% | 95,495 | Western Dental | 3,500 | $27.00 | $23.64 | Dec-17 | 5 |
Arrow Center 412 West Arrow Highway Covina, CA | 1960 | 77.0% | 80,750 | A-J Auto Paint | 1,745 | $13.56 | $20.16 | Nov-17 | 3 |
Covina Plaza 543-621 North Azusa Avenue Covina, CA | 1982 | 93.0% | 125,673 | Global Security | 1,224 | $22.20 | $26.40 | Dec-17 | 3 |
Covina Square 100-428 North Azusa Avenue Covina, CA | 1974 | 96.0% | 124,820 | Mathnasium | 1,350 | $20.40 | $22.68 | Jul-18 | 5 |
West Covina Parkway Plaza 1000 West West Covina Parkway West Covina, CA | 1990 | 95.0% | 87,379 | Petco | 13,880 | $24.00 | $24.36 | Jul-16 | 6 |
| (1) | Source:Appraisal. |
| (2) | For the West Covina Village Property, represents weighted average underwritten rent per square foot for junior anchor, office, inline and pad spaces. |
| (3) | As adjusted by the appraiser after taking location, quality, condition, exposure, parking ratio, age and anchor into account. |
The following table presents supermarket rental data with respect to comparable retail properties with respect to the West Covina Village Property as identified in the appraisal:
| Comparable Supermarket Summary(1) | |||||||||
| Property Name/Location | Year Built | Occ. | Size (SF) | Tenant | Suite Size (SF) | Rent PSF(2) | Adjusted Rent PSF(3) | Commencement | Lease Term (Years) |
West Covina Village 301-477 North Azusa Avenue West Covina, CA | 1981 | 89.3% | 220,000 | Stater Bros. | 35,232 | $9.92 | - | Jan-16 | 5 |
El Super 16420 Parthenia Street Panorama City, CA | 1960 | 100.0% | 48,264 | El Super | 48,264 | $16.92 | $21.96 | Oct-18 | 29 |
Winco 3400 East South Street Lakewood, CA | 1992 | 100.0% | 96,849 | Winco | 96,849 | $8.76 | $11.52 | Apr-18 | 10 |
Vons 600 East Broadway Long Beach, CA | 2010 | 100.0% | 47,570 | Vons | 47,570 | $30.12 | $24.84 | Nov-17 | 20 |
Stater Bros. 2314 River Road Corona, CA | 2017 | 100.0% | 53,772 | Stater Bros. | 53,772 | $31.80 | $23.16 | Jul-17 | 10 |
| (1) | Source:Appraisal. |
| (2) | For the West Covina Village Property, represents underwritten rent per square foot for the Stater Bros. space. |
| (3) | As adjusted by the appraiser after taking size, quality, condition, access, parking ratio and age into account. |
The Borrower. The borrowing entity for the West Covina Village Mortgage Loan is Azusa Rowland, LLC, a Delaware limited liability company and special purpose entity with one independent director. Legal counsel to the borrower delivered a non-consolidation opinion in connection with the origination of the West Covina Village Mortgage Loan. Tarek Alhassen and Dighton America Inc. are the guarantors of certain nonrecourse carve-outs under the West Covina Village Mortgage Loan.
THE INFORMATION IN THIS STRUCTURAL AND COLLATERAL TERM SHEET IS NOT COMPLETE AND MAY BE AMENDED PRIOR TO THE TIME OF SALE. THIS TERM SHEET IS NOT AN OFFER TO SELL THESE SECURITIES AND IT IS NOT A SOLICITATION OF AN OFFER TO BUY THESE SECURITIES IN ANY JURISDICTION WHERE THE OFFER OR SALE IS NOT PERMITTED.
| | 100 | |
| Structural and Collateral Term Sheet | BBCMS 2018-C2 | |
| West Covina Village | ||
The Loan Sponsors.The West Covina Village Mortgage Loansponsors are Tarek Alhassen and Dighton America Inc. Tarek Alhassen is a Los Angeles area commercial and residential real estate developer who has been operating in the area since the early 1980’s. Mr. Alhassen’s sole outside investor in the West Covina Village Property is Sheikh Khalifa Bin Hamdan Al-Nahyan. Sheikh Khalifa Bin Hamdan Al-Nahyan is a member of one of the six ruling families in the United Arab Emirates and is based in Abu Dhabi. His U.S. real estate investments are made through the Dighton America Inc. entity. A prior loan secured by the West Covina Village Property went through a workout which included the appointment of a receiver. The borrower under the prior loan was controlled by Tarek Alhassen’s brother. See “Description of the Mortgage Pool–Loan Purpose; Default History, Bankruptcy Issues and Other Proceedings” in the Preliminary Prospectus.
Property Management. The West Covina Village Property is managed by Brenton Development Corporation, an affiliate of the borrower.
Escrows and Reserves. At origination, the borrower was required to deposit into escrow approximately $275,000 for capital expenditures, approximately $93,324 for real estate taxes and approximately $72,609 for insurance premiums.
Tax Escrows – On a monthly basis, the borrower is required to escrow 1/12 of the annual estimated tax payments, which currently equates to approximately $46,662.
Insurance Escrows - On a monthly basis, the borrower is required to escrow 1/12 of the annual estimated insurance payments, which currently equates to approximately $6,601.
Replacement Reserves - On a monthly basis, the borrower is required to escrow approximately $3,667 for replacement reserves (approximately $0.20 per square foot annually).
TI/LC Reserves - The borrower is required to escrow $41,250 (approximately $2.25 per square foot annually) on a monthly basis for tenant improvement and leasing commission reserves occurring on the payment date in January 2019 and for each payment date occurring thereafter up to and including the payment date in December 2021. Beginning on the payment date in January 2022, the borrower is required to escrow $18,333 (approximately $1.00 per square foot annually) on a monthly basis for tenant improvement and leasing commission reserves. The reserve is subject to a cap of $1,500,000 (approximately $6.82 per square foot annually).
Lockbox / Cash Management.The West Covina Village Mortgage Loan is structured with a springing lockbox and springing cash management. The West Covina Village Mortgage Loan requires that during the continuance of a Sweep Event Period (as defined below), the borrower deliver tenant direction letters to the tenants directing such tenants to pay all rents into the lockbox account. Upon the occurrence and during the continuance of a Sweep Event Period, all funds in the lockbox account are required to be swept daily to a cash management account under the control of the lender to be applied and disbursed in accordance with the West Covina Village Mortgage Loan documents and all excess cash flow funds remaining in the cash management account after the application of such funds in accordance with the West Covina Village Mortgage Loan documents are required to be held by the lender in an excess cash flow reserve account as additional collateral for the West Covina Village Mortgage Loan. To the extent that no Sweep Event Period is continuing, all excess cash flow funds are required to be disbursed to the West Covina Village Mortgage Loan borrower.
A “Sweep Event Period” will commence upon the earliest of the following: (i) the occurrence of an event of default, (ii) the date on which the debt service coverage ratio (commencing on the payment date occurring six months from the closing date based on the trailing 12-month period) is less than 1.20x or (iii) a Key Tenant Trigger Event (as defined below).
A Sweep Event Period will end: with regard to clause (i), upon the cure of such event of default and the lender’s acceptance of such cure in its sole and absolute discretion, with regard to clause (ii), upon the debt service coverage ratio based on the trailing 12-month period being at least 1.30x for two consecutive calendar quarters and with regard to clause (iii), the Key Tenant Trigger Event is cured in accordance with the West Covina Village Loan documents.
A “Key Tenant Trigger Event” means that either UEI, LA Fitness or a replacement tenant (i) defaults under its lease, (ii) goes dark or gives notice of its intention to do the foregoing, (iii) gives notice to vacate or vacates its leased space at the West Covina Village Property, (iv) becomes a debtor in any bankruptcy or other insolvency proceeding, (v) terminates its lease, (vi) sublets 20% or more of its respective space or gives notice of its intention to do the foregoing or (vii) with regard to UEI, fails to renew or extend the term of its lease pursuant to the terms set forth in its lease on or before the date required under its lease by which UEI is required to give notice of its exercise of its renewal option thereunder; and with regard to LA Fitness, fails to renew or extend the term of its lease for a period of five years with a rental rate of at least $18.00 per square foot and on terms reasonably satisfactory to the lender at least nine months prior to its lease expiration.
THE INFORMATION IN THIS STRUCTURAL AND COLLATERAL TERM SHEET IS NOT COMPLETE AND MAY BE AMENDED PRIOR TO THE TIME OF SALE. THIS TERM SHEET IS NOT AN OFFER TO SELL THESE SECURITIES AND IT IS NOT A SOLICITATION OF AN OFFER TO BUY THESE SECURITIES IN ANY JURISDICTION WHERE THE OFFER OR SALE IS NOT PERMITTED.
| | 101 | |
| Structural and Collateral Term Sheet | BBCMS 2018-C2 | |
| West Covina Village | ||
Such Key Tenant Trigger Event will terminate: with regard to clause (i), upon the related tenant curing such default; with regard to clauses (ii), (iii) and (v), the related tenant has rescinded such notice and/or resumed its customary business operations at its leased space for at least two consecutive calendar quarters; with regard to clause (iv), the lease for the related tenant is assumed or affirmed in such proceeding and the related tenant, among other things, is discharged from bankruptcy such that no proceedings are ongoing; with regard to clause (vi), the related tenant is no longer subletting 20% or more of its respective space and such tenant is occupying no less than 80% of its space and has resumed normal business operations; with regard to clause (vii), the related tenant, exercises the applicable extension option or enters into a new lease on terms and conditions satisfactory to the lender and as described above; and with regard to clauses (i) through (vii) above, the lender has received a certain related estoppel certificate. In addition, a Key Tenant Trigger Event will terminate in the event that a Key Tenant Re-Tenanting Event (as defined below) has occurred.
A “Key Tenant Re-Tenanting Event” means that: (i) the UEI space or LA Fitness space, as applicable, is leased pursuant to a replacement lease having a term of at least five years for the related space, as applicable, (ii) such lease has commenced, (iii) UEI, LA Fitness or a replacement tenant has taken occupancy of the entire leased premises and is paying full unabated rent and all tenant improvements costs and leasing commissions have been paid by the borrower and (iv) such replacement tenant has delivered a signed estoppel certificate reasonably satisfactory to the lender.
Subordinate and Mezzanine Debt. None.
Partial Release. Not Permitted.
Ground Lease. None.
THE INFORMATION IN THIS STRUCTURAL AND COLLATERAL TERM SHEET IS NOT COMPLETE AND MAY BE AMENDED PRIOR TO THE TIME OF SALE. THIS TERM SHEET IS NOT AN OFFER TO SELL THESE SECURITIES AND IT IS NOT A SOLICITATION OF AN OFFER TO BUY THESE SECURITIES IN ANY JURISDICTION WHERE THE OFFER OR SALE IS NOT PERMITTED.
| | 102 | |
| Structural and Collateral Term Sheet | BBCMS 2018-C2 |
[THIS PAGE INTENTIONALLY LEFT BLANK]
THE INFORMATION IN THIS STRUCTURAL AND COLLATERAL TERM SHEET IS NOT COMPLETE AND MAY BE AMENDED PRIOR TO THE TIME OF SALE. THIS TERM SHEET IS NOT AN OFFER TO SELL THESE SECURITIES AND IT IS NOT A SOLICITATION OF AN OFFER TO BUY THESE SECURITIES IN ANY JURISDICTION WHERE THE OFFER OR SALE IS NOT PERMITTED.
| | 103 | |
| Structural and Collateral Term Sheet | BBCMS 2018-C2 | |
| AVR Embassy Suites Fort Worth | ||

THE INFORMATION IN THIS STRUCTURAL AND COLLATERAL TERM SHEET IS NOT COMPLETE AND MAY BE AMENDED PRIOR TO THE TIME OF SALE. THIS TERM SHEET IS NOT AN OFFER TO SELL THESE SECURITIES AND IT IS NOT A SOLICITATION OF AN OFFER TO BUY THESE SECURITIES IN ANY JURISDICTION WHERE THE OFFER OR SALE IS NOT PERMITTED.
| | 104 | |
| Structural and Collateral Term Sheet | BBCMS 2018-C2 | |
| AVR Embassy Suites Fort Worth | ||
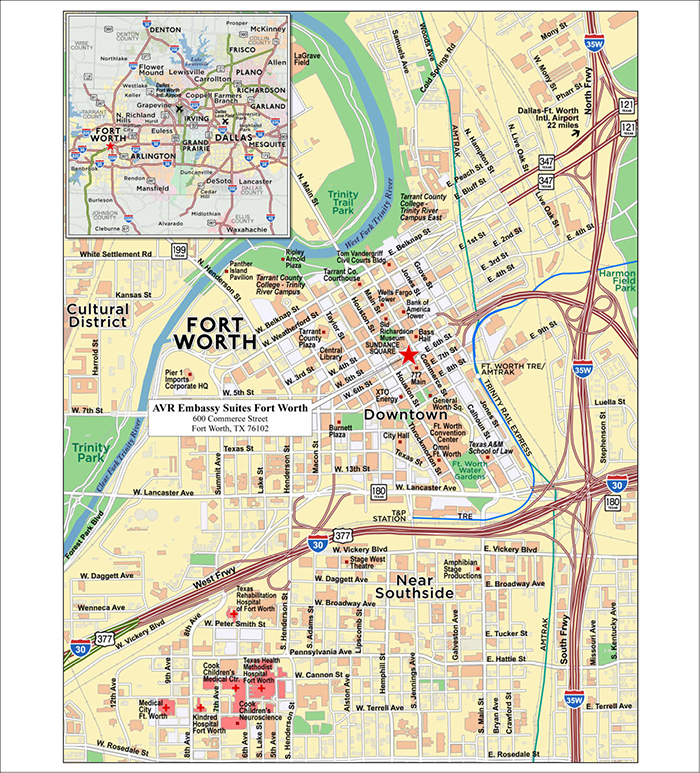
THE INFORMATION IN THIS STRUCTURAL AND COLLATERAL TERM SHEET IS NOT COMPLETE AND MAY BE AMENDED PRIOR TO THE TIME OF SALE. THIS TERM SHEET IS NOT AN OFFER TO SELL THESE SECURITIES AND IT IS NOT A SOLICITATION OF AN OFFER TO BUY THESE SECURITIES IN ANY JURISDICTION WHERE THE OFFER OR SALE IS NOT PERMITTED.
| | 105 | |
| Structural and Collateral Term Sheet | BBCMS 2018-C2 | |
| AVR Embassy Suites Fort Worth | ||
| Mortgage Loan Information | Property Information | |||
| Mortgage Loan Seller: | CCRE | Single Asset / Portfolio: | Single Asset | |
| Original Principal Balance: | $35,200,000 | Title: | Fee | |
| Cut-off Date Principal Balance: | $35,200,000 | Property Type - Subtype: | Hotel – Full Service | |
| % of IPB: | 3.9% | Net Rentable Area (Rooms): | 156 | |
| Loan Purpose: | Acquisition | Location: | Fort Worth, TX | |
| Borrower: | AVR Fort Worth Hotel LLC | Year Built / Renovated(1): | 2007 / 2018 | |
| Sponsor: | Allan V. Rose | Occupancy / ADR / RevPAR: | 82.4% / $178.50 / $147.12 | |
| Interest Rate: | 5.57800% | Occupancy / ADR / RevPAR Date: | 8/31/2018 | |
| Note Date: | 11/8/2018 | 4th Most Recent NOI (As of): | $4,658,642 (12/31/2015) | |
| Maturity Date: | 12/1/2028 | 3rd Most Recent NOI (As of)(2): | $4,681,929 (12/31/2016) | |
| Interest-only Period: | 60 months | 2nd Most Recent NOI (As of)(2): | $4,209,412 (12/31/2017) | |
| Original Term: | 120 months | Most Recent NOI (As of)(2): | $3,592,739 TTM 8/31/2018 | |
| Original Amortization Term: | 360 Months | UW Occupancy / ADR / RevPAR: | 84.0% / $194.25 / $163.17 | |
| Amortization Type: | IO-Balloon | UW Revenues: | $11,054,987 | |
| Call Protection: | L(24),Def(92),O(4) | UW Expenses: | $6,507,816 | |
| Lockbox / Cash Management: | Hard / Springing | UW NOI: | $4,547,171 | |
| Additional Debt: | N/A | UW NCF: | $4,104,972 | |
| Additional Debt Balance: | N/A | Appraised Value / Per Room(3): | $54,500,000 / $349,359 | |
| Additional Debt Type: | N/A | Appraisal Date(3): | 10/1/2018 | |
| Escrows and Reserves(4) | Financial Information | ||||||
| Initial | Monthly | Initial Cap | Cut-off Date Loan / Room: | $225,641 | |||
| Taxes: | $0 | Springing | N/A | Maturity Date Loan / Room: | $209,895 | ||
| Insurance: | $0 | Springing | N/A | Cut-off Date LTV(3): | 64.6% | ||
| FF&E Reserves: | $0 | 4.0% of Gross Revenues | N/A | Maturity Date LTV(3): | 60.1% | ||
| TI/LC: | $0 | $0 | N/A | UW NCF DSCR: | 1.70x | ||
| Other(5): | $743,070 | Springing | $320,000 | UW NOI Debt Yield: | 12.9% | ||
| Sources and Uses | ||||||
| Sources | Proceeds | % of Total | Uses | Proceeds | % of Total | |
| Mortgage Loan | $35,200,000 | 66.1% | Purchase Price | $52,000,000 | 97.7% | |
| Sponsor Equity | 18,045,055 | 33.9 | Upfront Reserves | 743,070 | 1.4 | |
| Closing Costs | 501,985 | 0.9 | ||||
| Total Sources | $53,245,055 | 100.0% | Total Uses | $53,245,055 | 100.0% | |
| (1) | The AVR Embassy Suites Fort Worth property was built in 1975 as a 300+ room Clarion Hotel and was converted to the 156-room Embassy Suites in 2005, with a renovation occurring between late 2017-2018. |
| (2) | The decrease in 2nd Most Recent NOI to Most Recent NOI is primarily a result of an approximately $5.6 million renovation occurring between late December 2017 and August 2018. |
| (3) | The appraisal also concluded to a “prospective value upon stabilization” appraised value of $59,500,000 with a valuation date of October 1, 2020, which results in a Cut-off Date LTV and Maturity Date LTV of 59.2% and 55.0%, respectively. The “prospective value upon stabilization” value assumes the hotel achieves a stabilized occupancy of 85.0%, ADR of $208.08 and RevPAR of $176.87. |
| (4) | For a full description of Escrows and Reserves, please refer to “Escrows and Reserves” below. |
| (5) | Other reserve is comprised of a $423,070 PIP reserve and a $320,000 seasonality reserve. |
The Loan.TheAVR Embassy Suites Fort Worthloanhas an outstanding principal balance as of the Cut-off Date of $35.2 million and is secured by a first mortgage lien on the borrower’s fee interest in a 156-room, full service hotel located in Fort Worth, Texas. The loan has a 10-year term, and subsequent to a five-year interest-only period, will amortize on a 30-year schedule. The previously existing debt was securitized in 2010 as part of the WFCM 2010-C1 transaction.
THE INFORMATION IN THIS STRUCTURAL AND COLLATERAL TERM SHEET IS NOT COMPLETE AND MAY BE AMENDED PRIOR TO THE TIME OF SALE. THIS TERM SHEET IS NOT AN OFFER TO SELL THESE SECURITIES AND IT IS NOT A SOLICITATION OF AN OFFER TO BUY THESE SECURITIES IN ANY JURISDICTION WHERE THE OFFER OR SALE IS NOT PERMITTED.
| | 106 | |
| Structural and Collateral Term Sheet | BBCMS 2018-C2 | |
| AVR Embassy Suites Fort Worth | ||
The Property.The AVR Embassy Suites Forth Worth propertyis a 13-story, 156-room full service hotel located in Fort Worth, Texas. The AVR Embassy Suites Fort Worth property was developed in 1975 as a Clarion Hotel and subsequently converted to a 156-room Embassy Suites from 2005-2007. The AVR Embassy Suites Fort Worth property includes 86 king, 62 queen/queen and eight ADA rooms. Guest room amenities include complimentary wireless internet, work desks and flat screen televisions. Amenities at the AVR Embassy Suites Fort Worth property include Market Bistro Coffee Shop, a full-service restaurant, an indoor pool, a fitness center, complimentary breakfast and an evening reception area, guest laundry facilities, a business center, a sundry shop and approximately 10,311 square feet of meeting space. The property also offers 161 parking spaces within a seven-level parking garage.
From 2015 to 2018, approximately $5.6 million was spent on capital expenditures, which included $5.1 million spent between December 2017 and August 2018 on architectural design upgrades, replacing the IT systems, relocating the business center, and renovating the exterior public bathrooms, kitchen/dining areas, meeting spaces and pool area, among other things. Since 2015, the AVR Embassy Suites Fort Worth property has had occupancy penetration rates over 109%, ADR penetration rates over 105% and RevPAR penetration rates over 115%.
Environmental. According to a Phase I environmental assessment dated October 3, 2018, there was no evidence of any recognized environmental conditions at the property.
The Market.The AVR Embassy Suites Fort Worth property is located in Downtown Fort Worth, approximately 25 miles southwest of DFW Airport, 35 miles southwest of Love Field and 32 miles west of Downtown Dallas. According to the 2017 Census Bureau, Fort Worth is the 15th largest city in the United States. Major employers in Fort Worth include American Airlines, Lockheed Martin and the NAS Fort Worth Joint Reserve Base. From December 2008 to December 2017, the labor force in Fort Worth grew by approximately 28.5%, which is 7.9 times faster than the national labor force.
The property is located in downtown Fort Worth, within Sundance Square, a 35-block commercial, residential, entertainment and retail district that attracts approximately 10.0 million visitors each year. The Fort Worth Convention Center is located within 0.5 miles of the property and offers more than 250,000 square feet of exhibit space. Texas Christian University is located within 5.0 miles of the property and has a total undergraduate enrollment of approximately 9,000 individuals in 2017. Additional lodging demand generators include the Arts District, Fort Worth Stockyards, Bass Performance Hall, Will Rodgers Memorial Center, Riverside Arts District, Billy Bob’s Texas and Texas Motor Speedway.
The primary competitive set for the hotel consists of five hotels, which range in size from 203 to 614 rooms and collectively contain an aggregate of 2,044 rooms. There are currently two hotels under construction totaling 327 rooms. These hotels include an Autograph Collection hotel that is expected to be completed in 2019 followed by a Hilton Garden Inn that is expected to be completed in 2020.
| Historical Occupancy, ADR, RevPAR | |||||||||
| Competitive Set(1) | AVR Embassy Suites – Fort Worth, TX(2) | Penetration Factor(3) | |||||||
| Year | Occupancy | ADR | RevPAR | Occupancy | ADR | RevPAR | Occupancy | ADR | RevPAR |
| 2015 | 68.7% | $173.60 | $119.27 | 86.1% | $183.07 | $157.68 | 125.3% | 105.5% | 132.2% |
| 2016 | 68.9% | $170.36 | $117.34 | 85.5% | $187.33 | $160.24 | 124.1% | 110.0% | 136.6% |
| 2017 | 74.0% | $168.63 | $124.83 | 84.2% | $184.05 | $154.95 | 113.7% | 109.1% | 124.1% |
| TTM(4) | 75.2% | $169.35 | $127.42 | 82.4% | $178.50 | $147.12 | 109.5% | 105.4% | 115.5% |
| (1) | Data provided by an industry travel research provider. The competitive set contains the following properties: Hilton Fort Worth, Renaissance The Worthington Fort Worth Hotel, Courtyard Fort Worth Downtown Blackstone, Omni Fort Worth Hotel and Sheraton Fort Worth Downtown Hotel. |
| (2) | Based on operating statements provided by the borrower. |
| (3) | Penetration Factor is calculated based on data provided by an industry travel research provider for the competitive set and the operating statements provided by the borrower for the mortgaged property. |
| (4) | TTM represents the trailing 12-month period ending on August 31, 2018. |
THE INFORMATION IN THIS STRUCTURAL AND COLLATERAL TERM SHEET IS NOT COMPLETE AND MAY BE AMENDED PRIOR TO THE TIME OF SALE. THIS TERM SHEET IS NOT AN OFFER TO SELL THESE SECURITIES AND IT IS NOT A SOLICITATION OF AN OFFER TO BUY THESE SECURITIES IN ANY JURISDICTION WHERE THE OFFER OR SALE IS NOT PERMITTED.
| | 107 | |
| Structural and Collateral Term Sheet | BBCMS 2018-C2 | |
| AVR Embassy Suites Fort Worth | ||
| Competitive Hotels Profile(1) | |||||||||
| 2017 Estimated Market Mix | 2017 Estimated Operating Statistics | ||||||||
| Property | Rooms | Year Opened | Meeting Space (SF) | Commercial | Leisure | Meeting & Group | Occ. | ADR | RevPAR |
| AVR Embassy Suites Fort Worth | 156 | 2007 | 10,311 | 52% | 20% | 28% | 84.2% | $184.05 | $154.95 |
| Hilton Fort Worth | 294 | 2007 | 25,000 | 50% | 11% | 39% | 75-80% | $165-$170 | $125-$130 |
| Renaissance The Worthington Fort Worth | 504 | 1981 | 53,172 | 40% | 15% | 45% | 75-80% | $195-$200 | $145-$150 |
| Courtyard Fort Worth Downtown Blackstone | 203 | 1999 | 1,442 | 65% | 15% | 20% | 85-90% | $155-$160 | $130-$135 |
| Omni Fort Worth Hotel | 614 | 2009 | 68,000 | 35% | 20% | 45% | 70-75% | $165-$170 | $115-$120 |
| Sheraton Fort Worth Downtown | 429 | 2008 | 22,000 | 35% | 20% | 45% | 75-80% | $155-$170 | $115-$120 |
| Total(2) | 2,044 | 41% | 17% | 42% | 75.3% | $170.95 | $128.75 | ||
| (1) | Based on the appraisal, except for the “2017 Estimated Operating Statistics” for AVR Embassy Suites Fort Worth, which are based on the operating statements provided by the borrower. |
| (2) | Excludes the AVR Embassy Suites Fort Worth property. |
| Operating History and Underwritten Net Cash Flow | |||||||
| 2015 | 2016 | 2017 | TTM(1) | Underwritten(2) | Per Room(3) | % of Total Revenue(4) | |
| Occupancy | 86.1% | 85.5% | 84.2% | 82.4% | 84.0% | ||
| ADR | $183.07 | $187.33 | $184.05 | $178.50 | $194.25 | ||
| RevPAR | $157.68 | $160.24 | $154.95 | $147.12 | $163.17 | ||
| Room Revenue | $8,978,306 | $9,149,103 | $8,822,915 | $8,399,953 | $9,290,900 | $59,557 | 84.0% |
| Food & Beverage Revenue | 1,030,434 | 982,075 | 988,916 | 993,513 | 992,808 | 6,364 | 9.0 |
| Other Departmental Revenue | 758,507 | 811,822 | 793,272 | 780,417 | 771,279 | 4,944 | 7.0 |
| Total Revenue | $10,767,247 | $10,943,000 | $10,605,103 | $10,173,883 | $11,054,987 | $70,865 | 100.0% |
| Room Expense | $1,635,482 | $1,650,914 | $1,683,905 | $1,772,535 | $1,731,150 | $11,097 | 18.6% |
| Food & Beverage Expense | 466,430 | 446,575 | 513,535 | 533,347 | 519,639 | 3,331 | 52.3 |
| Other Departmental Expenses | 253,664 | 253,649 | 250,723 | 247,257 | 240,598 | 1,542 | 31.2 |
| Departmental Expenses | $2,355,576 | $2,351,138 | $2,448,163 | $2,553,139 | $2,491,387 | $15,970 | 22.5% |
| Departmental Profit | $8,411,671 | $8,591,862 | $8,156,940 | $7,620,744 | $8,563,600 | $54,895 | 77.5% |
| Operating Expenses | $2,911,622 | $3,009,070 | $2,988,174 | $3,063,365 | $3,084,240 | $19,771 | 27.9% |
| Gross Operating Profit | $5,500,049 | $5,582,792 | $5,168,766 | $4,557,379 | $5,479,360 | $35,124 | 49.6% |
| Management Fees | $323,016 | $328,290 | $318,152 | $305,216 | $331,650 | $2,126 | 3.0% |
| Property Taxes | 427,364 | 461,170 | 532,457 | 513,653 | 545,495 | 3,497 | 4.9 |
| Property Insurance | 91,027 | 111,403 | 108,745 | 145,771 | 55,044 | 353 | 0.5 |
| Total Other Expenses | $841,407 | $900,863 | $959,354 | $964,640 | $932,189 | $5,976 | 8.4% |
| Net Operating Income | $4,658,642 | $4,681,929 | $4,209,412 | $3,592,739 | $4,547,171 | $29,149 | 41.1% |
| FF&E | 430,688 | 437,722 | 424,205 | 406,954 | 442,199 | 2,835 | 4.0% |
| Net Cash Flow(5) | $4,227,954 | $4,244,207 | $3,785,207 | $3,185,785 | $4,104,972 | $26,314 | 37.1% |
| (1) | TTMreflects TTM reflects the trailing 12 month period ending August 31, 2018. |
| (2) | Due to the renovation in 2017-2018, the Underwritten Net Cash Flow is primarily based on the appraiser’s conclusions. |
| (3) | Per Room values are based on 156 guest rooms. |
| (4) | % of Total Revenue for Room Expense, Food & Beverage Expense and Other Departmental Expenses is based on their corresponding revenue line item. |
| (5) | The decrease in Net Cash Flow from 2017 to TTM is primarily a result of a $5.6 million renovation occurring between late December 2017 and August 2018. |
THE INFORMATION IN THIS STRUCTURAL AND COLLATERAL TERM SHEET IS NOT COMPLETE AND MAY BE AMENDED PRIOR TO THE TIME OF SALE. THIS TERM SHEET IS NOT AN OFFER TO SELL THESE SECURITIES AND IT IS NOT A SOLICITATION OF AN OFFER TO BUY THESE SECURITIES IN ANY JURISDICTION WHERE THE OFFER OR SALE IS NOT PERMITTED.
| | 108 | |
| Structural and Collateral Term Sheet | BBCMS 2018-C2 | |
| AVR Embassy Suites Fort Worth | ||
The Borrower. The borrowing entity for the AVR Embassy Suites Fort Worth loan is AVR Fort Worth Hotel LLC, a Delaware limited liability company and special purpose entity with one independent director. Legal counsel to the borrower delivered a non-consolidation opinion in connection with the origination of the AVR Embassy Suites Fort Worth loan. Allan V. Rose is the guarantor of certain nonrecourse carve-outs under the AVR Embassy Suites Fort Worth loan.
The Loan Sponsor.The loan sponsor is Allan V. Rose. Allan V. Rose, is the owner and chief executive officer of AVR Realty (“AVR”), a privately held real estate development and management company. AVR was founded over 45 years ago and has built, acquired and developed more than 30 million square feet of commercial and residential space. AVR’s portfolio includes office complexes, shopping centers, corporate and industrial parks, apartment complexes, residential communities and hotels.
Property Management.The property is managed by Dimension Development Two, LLC (“Dimension”), a Louisiana limited liability company. The current management agreement is dated October 2, 2018 and has an expiration date three years from the opening of the hotel with automatic two-year extension options unless either party gives written notice 120 days prior to the expiration of the term.
Franchise Agreement. The borrower entered into a franchise agreement for this property with Hilton Franchise Holding LLC, a Delaware limited liability company. The current franchise agreement is effective as of November 8, 2018 for a term of approximately 19 years, with an expiration date of November 30, 2037. Among other fees, the franchise agreement requires payment of a program fee equal to 4.0% of gross rooms revenue and a royalty fee equal to 4.5% of gross rooms revenue for year 1, 5.0% for year 2 and 5.5% thereafter. As part of the new franchise agreement, the borrower is required to complete a PIP that is estimated to cost $423,070, which amount was escrowed at loan origination.
Escrows and Reserves.At origination, the borrower deposited into escrow $423,070 for a PIP reserve and $320,000 for a seasonality reserve.
Tax Escrows– The borrower is required to make monthly payments into the tax reserve,provided that this requirement is waived so long as (i) no event of default and/or Cash Trap Period (as defined below) has occurred and is continuing and (ii) the borrower has paid all taxes directly to the appropriate governmental taxing authority and the borrower provides evidence to the lender.
Insurance Escrows - The borrower is required to make monthly payments into the insurance reserve,provided that this requirement is waived so long as no event of default has occurred and is continuing and the property is insured under a blanket insurance policy in accordance with the mortgage loan documents.
FF&E Reserves- On a monthly basis, the borrower is required to deposit an amount equal to 1/12 of 4.0% of gross revenues for the hotel related operations at the property for the immediately preceding calendar year as determined by the lender.
Seasonality Reserves –The borrower is required to make seasonality reserve payments in the amount of approximately $35,556 in the months of January, February, April, May, June, August, September, October and November, subject to a cap of $320,000.
Lockbox / Cash Management. The loan is structured with a hard lockbox and springing cash management. At loan origination, the borrower sent direction letters to all tenants and credit card companies instructing them to deposit all rents and revenues received into a clearing account controlled by the lender. During a Cash Trap Period, all funds on deposit in the clearing account will be swept on a daily basis into a cash management account controlled by the lender and disbursed during each interest period of the term of the loan in accordance with the loan documents. Additionally, all excess cash flow after payment of the mortgage debt service, required reserves and customary expenses in accordance with the loan documents will be held as additional collateral for the AVR Embassy Suites Forth Worth loan.
A “Cash Trap Period” commences upon (i) the occurrence of an event of default, (ii) any bankruptcy action of borrower, guarantor or property manager, (iii) the debt service coverage ratio (as calculated in accordance with the loan documents) based on the trailing 12-month period immediately preceding the date of determination is less than 1.30x (1.20x during the continuance of a PIP Period) after the end of two consecutive calendar quarters or (iv) 12 months prior to the expiration of the franchise agreement or such time the borrower receives notice from the franchisor of termination of the franchise agreement, and terminates upon, (w) with regard to clause (i), a cure of the event of default, (x) in the case of a bankruptcy action only with respect to the property manager, the borrower replaces the manager with a qualified manager, (y) with regard to clause (iii), the debt service coverage ratio is greater than or equal to 1.35x (1.25x during the continuance of a PIP Period) after the end of two consecutive calendar quarters or (z) with regard to clause (iv), the franchise agreement is replaced or renewed with a term of not less than three years past the maturity date of the AVR Embassy Suites Fort Worth loan, among other things.
THE INFORMATION IN THIS STRUCTURAL AND COLLATERAL TERM SHEET IS NOT COMPLETE AND MAY BE AMENDED PRIOR TO THE TIME OF SALE. THIS TERM SHEET IS NOT AN OFFER TO SELL THESE SECURITIES AND IT IS NOT A SOLICITATION OF AN OFFER TO BUY THESE SECURITIES IN ANY JURISDICTION WHERE THE OFFER OR SALE IS NOT PERMITTED.
| | 109 | |
| Structural and Collateral Term Sheet | BBCMS 2018-C2 | |
| AVR Embassy Suites Fort Worth | ||
A “PIP Period” commenced upon the closing of the AVR Embassy Suites Fort Worth loan and will terminate upon the earlier to occur of (i) the date the borrower is required to complete the PIP work pursuant to the PIP or (ii) the date the borrower actually completes the PIP work.
Subordinate and Mezzanine Debt. None.
Partial Release. Not Permitted.
Ground Lease. None.
THE INFORMATION IN THIS STRUCTURAL AND COLLATERAL TERM SHEET IS NOT COMPLETE AND MAY BE AMENDED PRIOR TO THE TIME OF SALE. THIS TERM SHEET IS NOT AN OFFER TO SELL THESE SECURITIES AND IT IS NOT A SOLICITATION OF AN OFFER TO BUY THESE SECURITIES IN ANY JURISDICTION WHERE THE OFFER OR SALE IS NOT PERMITTED.
| | 110 | |
| Structural and Collateral Term Sheet | BBCMS 2018-C2 |
[THIS PAGE INTENTIONALLY LEFT BLANK]
THE INFORMATION IN THIS STRUCTURAL AND COLLATERAL TERM SHEET IS NOT COMPLETE AND MAY BE AMENDED PRIOR TO THE TIME OF SALE. THIS TERM SHEET IS NOT AN OFFER TO SELL THESE SECURITIES AND IT IS NOT A SOLICITATION OF AN OFFER TO BUY THESE SECURITIES IN ANY JURISDICTION WHERE THE OFFER OR SALE IS NOT PERMITTED.
| | 111 | |
| Structural and Collateral Term Sheet | BBCMS 2018-C2 | |
| Residence Inn by Marriott Phoenix Desert View at Mayo Clinic | ||

THE INFORMATION IN THIS STRUCTURAL AND COLLATERAL TERM SHEET IS NOT COMPLETE AND MAY BE AMENDED PRIOR TO THE TIME OF SALE. THIS TERM SHEET IS NOT AN OFFER TO SELL THESE SECURITIES AND IT IS NOT A SOLICITATION OF AN OFFER TO BUY THESE SECURITIES IN ANY JURISDICTION WHERE THE OFFER OR SALE IS NOT PERMITTED.
| | 112 | |
| Structural and Collateral Term Sheet | BBCMS 2018-C2 | |
| Residence Inn by Marriott Phoenix Desert View at Mayo Clinic | ||

THE INFORMATION IN THIS STRUCTURAL AND COLLATERAL TERM SHEET IS NOT COMPLETE AND MAY BE AMENDED PRIOR TO THE TIME OF SALE. THIS TERM SHEET IS NOT AN OFFER TO SELL THESE SECURITIES AND IT IS NOT A SOLICITATION OF AN OFFER TO BUY THESE SECURITIES IN ANY JURISDICTION WHERE THE OFFER OR SALE IS NOT PERMITTED.
| | 113 | |
| Structural and Collateral Term Sheet | BBCMS 2018-C2 | |
| Residence Inn by Marriott Phoenix Desert View at Mayo Clinic | ||
| Mortgage Loan Information | Property Information | |||
| Mortgage Loan Seller: | SMC | Single Asset / Portfolio: | Single Asset | |
| Original Principal Balance: | $31,000,000 | Title: | Leasehold | |
| Cut-off Date Principal Balance: | $31,000,000 | Property Type - Subtype: | Hotel – Extended Stay | |
| % of IPB: | 3.5% | Net Rentable Area (Rooms): | 208 | |
| Loan Purpose: | Refinance | Location: | Phoenix, AZ | |
| Borrower: | Phoenix RI Owner, LLC | Year Built / Renovated: | 2009 / 2017 | |
| Sponsor: | Robert I. Finvarb | Occupancy / ADR / RevPAR: | 73.0% / $160.73 / $117.26 | |
| Interest Rate: | 5.60000% | Occupancy / ADR / RevPAR Date: | 9/30/2018 | |
| Note Date: | 10/25/2018 | 4thMost Recent NOI (As of): | $3,633,194 (12/31/2015) | |
| Maturity Date: | 11/6/2028 | 3rd Most Recent NOI (As of): | $3,591,453 (12/31/2016) | |
| Interest-only Period: | 24 months | 2nd Most Recent NOI (As of): | $3,860,467 (12/31/2017) | |
| Original Term: | 120 months | Most Recent NOI (As of): | $3,824,715 (TTM 9/30/2018) | |
| Original Amortization Term: | 360 months | UW Occupancy / ADR / RevPAR: | 73.0% / $160.73 / $117.26 | |
| Amortization Type: | IO-Balloon | UW Revenues: | $9,330,088 | |
| Call Protection: | L(25),Def(90),O(5) | UW Expenses: | $5,528,865 | |
| Lockbox / Cash Management: | Soft / Springing | UW NOI: | $3,801,223 | |
| Additional Debt: | N/A | UW NCF: | $3,334,718 | |
| Additional Debt Balance: | N/A | Appraised Value / Per Room: | $52,100,000 / $250,481 | |
| Additional Debt Type: | N/A | Appraisal Date: | 9/18/2018 | |
| Escrows and Reserves(1) | Financial Information | |||||||||
| Initial | Monthly | Initial Cap | Cut-off Date Loan / Room: | $149,038 | ||||||
| Taxes: | $0 | Springing | N/A | Maturity Date Loan / Room: | $130,853 | |||||
| Insurance: | $0 | Springing | N/A | Cut-off Date LTV: | 59.5% | |||||
| FF&E Reserves: | $0 | Springing | N/A | Maturity Date LTV: | 52.2% | |||||
| TI/LC: | $0 | $0 | N/A | UW NCF DSCR: | 1.56x | |||||
| Other: | $301,764 | Springing | N/A | UW NOI Debt Yield: | 12.3% | |||||
| Sources and Uses | ||||||||||
| Sources | Proceeds | % of Total | Uses | Proceeds | % of Total | |||||
| Mortgage Loan | $31,000,000 | 100.0% | Payoff Existing Debt | $22,814,301 | 73.6% | |||||
| Return of Equity | 7,342,095 | 23.7 | ||||||||
| Closing Costs | 541,839 | 1.7 | ||||||||
| Upfront Reserves | 301,764 | 1.0 | ||||||||
| Total Sources | $31,000,000 | 100.0% | Total Uses | $31,000,000 | 100.0% | |||||
| (1) | For a full description of Escrows and Reserves, please refer to “Escrows and Reserves” below. |
The Loan.TheResidence Inn by Marriott Phoenix Desert View at Mayo Clinic mortgageloanhas an outstanding principal balance as of the Cut-off Date of $31.0 million and is secured by a first mortgage lien on the borrower’s leasehold interest in a 208-room, extended stay hotel located in Phoenix, Arizona (the “Residence Inn by Marriott Phoenix Desert View at Mayo ClinicLoan”). The Residence Inn by Marriott Phoenix Desert View at Mayo ClinicLoanhas a 10-year term and, following a two-year interest-only period, amortizes on a 30-year schedule. The previously existing debt was securitized in 2012 as part of the UBSBB 2012-C3 transaction.
The Property. The Residence Inn by Marriott Phoenix Desert View at Mayo Clinic property is a six-story, 208-room extended stay hotel located in Phoenix, Arizona (the “Residence Inn by Marriott Phoenix Desert View at Mayo Clinic Property”).TheResidence Inn by Marriott Phoenix Desert View at Mayo Clinic Propertyopened in 2009 and is located on the campus of the Mayo Clinic Hospital (“Mayo Clinic”) and directly across the street from an approximately 562,000 square foot corporately-owned American Express (“Amex”) campus. Of theResidence Inn by Marriott Phoenix Desert View at Mayo Clinic Property’s208 rooms, 104 are king suites, 52 are one-
THE INFORMATION IN THIS STRUCTURAL AND COLLATERAL TERM SHEET IS NOT COMPLETE AND MAY BE AMENDED PRIOR TO THE TIME OF SALE. THIS TERM SHEET IS NOT AN OFFER TO SELL THESE SECURITIES AND IT IS NOT A SOLICITATION OF AN OFFER TO BUY THESE SECURITIES IN ANY JURISDICTION WHERE THE OFFER OR SALE IS NOT PERMITTED.
| | 114 | |
| Structural and Collateral Term Sheet | BBCMS 2018-C2 | |
| Residence Inn by Marriott Phoenix Desert View at Mayo Clinic | ||
bedroom suites, 42 are double queen suites and 10 are two-bedroom suites.Amenities at theResidence Inn by Marriott Phoenix Desert View at Mayo Clinic Propertyinclude free hot breakfast, weekly happy hours, exercise room, outdoor swimming pool with cabanas, business center, market pantry (food, beverages, and sundries), outdoor barbeque and fire-pit area, guest laundry facilities, an outdoor putting green and three meeting rooms totaling approximately 2,400 square feet of meeting space, as well as 208 on-site surface parking spaces.Guest suites feature flat screen televisions, ergonomic workspaces, pullout sofa beds, free Wi-Fi, pillow-top mattresses and separate places to dine, relax and sleep. Suites also offer a full kitchen with microwave, full-sized refrigerator, coffeemaker, two or four burner stove, dishwasher and cooking and dining utensils.
The sponsor completed a soft-goods guestroom renovation in the second and third quarters of 2016 and public space renovation in the second and third quarters of 2017 at a total cost of approximately $2.6 million (approximately $12,500 per room). The management agreement with Residence Inn by Marriott, LLC runs through 2039, more than 10 years past theResidence Inn by Marriott Phoenix Desert View at Mayo Clinic Loan’smaturity. Based on information provided by theResidence Inn by Marriott Phoenix Desert View at Mayo Clinicborrower and a September 2018 travel research report, theResidence Inn by Marriott Phoenix Desert View at Mayo Clinic Propertyhad a 106.6% occupancy penetration rate, a 100.0% ADR penetration rate and a 106.5% RevPAR penetration rate, as compared to its competitive set. TheResidence Inn by Marriott Phoenix Desert View at Mayo Clinic Property’sRevPAR performance increased by approximately 11.4% based on the trailing 12-month period ending September 2016 through the trailing-12 month period ending September 2018 as compared to an approximate 5.1% increase for the comp set.
Environmental. According to a Phase I environmental assessment dated September 28, 2018, there was no evidence of any recognized environmental conditions at the Residence Inn by Marriott Phoenix Desert View at Mayo Clinic Property.
The Market.TheResidence Inn by Marriott Phoenix Desert View at Mayo Clinic Propertyis located in the Desert Ridge area of North Phoenix, in the southeast quadrant of the intersection formed by 56th Street and Mayo Boulevard. Primary regional access through the area is provided by Interstate 10 and Interstate 17. TheResidence Inn by Marriott Phoenix Desert View at Mayo Clinic Propertyis uniquely situated on the Mayo Clinic campus. Additionally, it is located across 56th street from a 562,000 square foot corporate campus for Amex. Both have recently announced and broken ground on significant expansion.In February 2016, the Mayo Clinic opened a proton beam cancer therapy center at a cost of approximately $180 million. The facility has been increasing productivity with just two rooms on line in 2016 and all six rooms now in operation with discussions to operate the facility seven days a week. Further, Arizona State University and the Mayo Clinic are developing a new 150,000 square foot Health Solutions Innovation Center that is expected to cost upwards of $200 million and open in the next two years to the east of the existing Mayo Clinic site. The Mayo Clinic recently announced another major expansion which would see the hospital’s footprint grow by approximately 1.4 million square feet (to a total of approximately 3.1 million square feet). The expansion is anticipated to be delivered in stages beginning in 2020 with the full expansion completed by 2023. Initial site work for the parking has already commenced. The $648 million expansion is expected to add 94 new inpatient beds and expand the emergency room as well as surgical, clinic and laboratory facilities, as well as creating approximately 2,000 jobs, including 200 physicians. Mayo Clinic was recently ranked No. 1 in Arizona and the Phoenix metro area, and No. 11 nationally in a magazine ranking. Additionally,Amex’s corporately-owned 90-acre campus totals 562,000 square feet and is home to approximately 3,000 employees. In 2017, Amex announced it will be closing another Phoenix area office and expanding this campus to accommodate an additional 3,000 employees, doubling its workforce on-site.
| Historical Occupancy, ADR, RevPAR | |||||||||
| Competitive Set(1) | Residence Inn by Marriott Phoenix Desert View at Mayo Clinic(2) | Penetration Factor(3) | |||||||
| Year | Occupancy | ADR | RevPAR | Occupancy | ADR | RevPAR | Occupancy | ADR | RevPAR |
| 2015 | 67.7% | $147.96 | $100.16 | 67.3% | $155.64 | $104.78 | 99.4% | 105.2% | 104.6% |
| 2016 | 70.6% | $151.54 | $106.93 | 68.9% | $156.50 | $107.78 | 97.7% | 103.3% | 100.8% |
| 2017 | 68.1% | $157.64 | $107.30 | 73.4% | $158.63 | $116.49 | 107.8% | 100.6% | 108.6% |
| TTM(4) | 68.5% | $160.74 | $110.10 | 73.0% | $160.73 | $117.26 | 106.6% | 100.0% | 106.5% |
| (1) | Data provided by a travel research report. The competitive set contains the following properties: Hampton Inn & Suites Phoenix Scottsdale, Homewood Suites Phoenix Scottsdale, Gainey Suites, Holiday Inn Scottsdale North Airpark and Hilton Garden Inn Scottsdale North Perimeter Center. |
| (2) | Based on operating statements provided by the borrower. |
| (3) | Penetration Factor is calculated based on data provided by a travel research report for the competitive set and the operating statements provided by the borrower for the Residence Inn by Marriott Phoenix Desert View at Mayo Clinic Property. |
| (4) | TTM represents the trailing 12-month period ending September 30, 2018. |
THE INFORMATION IN THIS STRUCTURAL AND COLLATERAL TERM SHEET IS NOT COMPLETE AND MAY BE AMENDED PRIOR TO THE TIME OF SALE. THIS TERM SHEET IS NOT AN OFFER TO SELL THESE SECURITIES AND IT IS NOT A SOLICITATION OF AN OFFER TO BUY THESE SECURITIES IN ANY JURISDICTION WHERE THE OFFER OR SALE IS NOT PERMITTED.
| | 115 | |
| Structural and Collateral Term Sheet | BBCMS 2018-C2 | |
| Residence Inn by Marriott Phoenix Desert View at Mayo Clinic | ||
| Competitive Hotels Profile(1) | |||||||||
| Estimated Market Mix | 2017 Estimated Operating Statistics | ||||||||
| Property | Rooms | Year Opened | Extended-Stay | Commercial | Leisure | Meeting & Group | Occ. | ADR | RevPAR |
| Residence Inn by Marriott Phoenix Desert View at Mayo Clinic | 208 | 2009 | 30% | 35% | 20% | 15% | 73.0% | $160.73 | $117.26 |
| Cambria Hotel North Scottsdale Desert Ridge | 130 | 2017 | 15% | 55% | 20% | 10% | 35%-40% | $160-$170 | $55-$60 |
| Holiday Inn Express & Suites Phoenix North Scottsdale | 104 | 2013 | 15% | 55% | 20% | 10% | 40%-45% | $150-$160 | $60-$65 |
| Residence Inn by Marriott Scottsdale North | 120 | 2002 | 25% | 45% | 25% | 5% | 65%-70% | $150-$160 | $105-$110 |
| Secondary Competitors | 519 | Various | 7% | 63% | 25% | 5% | 70.9% | $152.61 | $108.18 |
| Total(2) | 873 | ||||||||
| (1) | Based on the appraisal, except for the “2017 Estimated Operating Statistics” for Residence Inn by Marriott Phoenix Desert View at Mayo Clinic, which are based on the operating statements for the trailing 12-month period ending September 30, 2018 provided by the borrower. |
| (2) | Excludes the Residence Inn by Marriott Phoenix Desert View at Mayo Clinic Property. |
Operating History and Underwritten Net Cash Flow | |||||||
| 2015 | 2016 | 2017 | TTM | Underwritten | Per Room(1) | % of Total Revenue(2) | |
| Occupancy | 67.3% | 68.9% | 73.4% | 73.0% | 73.0% | ||
| ADR | $155.64 | $156.50 | $158.63 | $160.73 | $160.73 | ||
| RevPAR | $104.78 | $107.78 | $116.49 | $117.26 | $117.26 | ||
| Room Revenue | $7,955,148 | $8,205,023 | $8,843,595 | $8,902,215 | $8,902,215 | $42,799 | 95.4% |
| Food & Beverage Revenue | 241,831 | 204,235 | 178,133 | 212,872 | 212,872 | 1,023 | 2.3 |
| Other Revenue | 247,049 | 235,078 | 234,091 | 215,001 | 215,001 | 1,034 | 2.3 |
| Total Revenue | $8,444,028 | $8,644,336 | $9,255,820 | $9,330,088 | $9,330,088 | $44,856 | 100.0% |
| Room Expense | $1,551,241 | $1,643,326 | $1,813,776 | $1,876,637 | $1,876,637 | $9,022 | 21.1% |
| Food & Beverage Expense | 66,275 | 53,329 | 56,284 | 60,000 | 60,000 | 288 | 28.2 |
| Other Departmental Expenses | 82,901 | 50,397 | 50,230 | 51,538 | 51,538 | 248 | 24.0 |
| Departmental Expenses | $1,700,417 | $1,747,051 | $1,920,290 | $1,988,174 | $1,988,174 | $9,559 | 21.3% |
| Departmental Profit | $6,743,611 | $6,897,285 | $7,335,530 | $7,341,914 | $7,341,914 | $35,298 | 78.7% |
| Operating Expenses | $1,648,693 | $1,801,492 | $1,882,808 | $1,907,898 | $1,907,898 | $9,173 | 20.4% |
| Gross Operating Profit | $5,094,918 | $5,095,793 | $5,452,721 | $5,434,016 | $5,434,016 | $26,125 | 58.2% |
| Management Fees | $591,082 | $605,104 | $647,907 | $653,106 | $653,106 | $3,140 | 7.0% |
| Ground Rent | 421,638 | 434,849 | 467,515 | 470,953 | 471,989 | 2,269 | 5.1 |
| Property Taxes | 404,288 | 419,275 | 422,450 | 425,844 | 441,609 | 2,123 | 4.7 |
| Property Insurance | 44,716 | 45,113 | 54,382 | 59,398 | 66,090 | 318 | 0.7 |
| Total Other Expenses | $1,461,724 | $1,504,340 | $1,592,254 | $1,609,302 | $1,632,793 | $7,850 | 17.5% |
| Net Operating Income | $3,633,194 | $3,591,453 | $3,860,467 | $3,824,715 | $3,801,223 | $18,275 | 40.7% |
| FF&E | 337,761 | 379,192 | 462,791 | 466,504 | 466,504 | 2,243 | 5.0 |
| Net Cash Flow | $3,295,433 | $3,212,261 | $3,397,676 | $3,358,210 | $3,334,718 | $16,032 | 35.7% |
| (1) | Per Room values are based on 208 guest rooms. |
| (2) | % of Total Revenue for Room Expense, Food & Beverage Expense and Other Departmental Expenses is based on their corresponding revenue line item. |
THE INFORMATION IN THIS STRUCTURAL AND COLLATERAL TERM SHEET IS NOT COMPLETE AND MAY BE AMENDED PRIOR TO THE TIME OF SALE. THIS TERM SHEET IS NOT AN OFFER TO SELL THESE SECURITIES AND IT IS NOT A SOLICITATION OF AN OFFER TO BUY THESE SECURITIES IN ANY JURISDICTION WHERE THE OFFER OR SALE IS NOT PERMITTED.
| | 116 | |
| Structural and Collateral Term Sheet | BBCMS 2018-C2 | |
| Residence Inn by Marriott Phoenix Desert View at Mayo Clinic | ||
The Borrower. The borrowing entity for the Residence Inn by Marriott Phoenix Desert View at Mayo Clinic Loan is Phoenix RI Owner, LLC, a Delaware limited liability company and special purpose entity with one independent director.
The Loan Sponsor.The sponsor and nonrecourse carve-out guarantor is Robert I. Finvarb. TheResidence Inn by Marriott Phoenix Desert View at Mayo Clinic Loansponsor founded the Robert Finvarb Companies (“RFC”) in 2002 to develop Marriott branded hotels. Since its formation, RFC has developed projects containing over 3,000 guestrooms that are affiliated with Marriott, Hyatt and Choice International in seven states and the District of Columbia. Robert I. Finvarb has an ownership interest in 14 operating hotels totaling over 2,200 rooms, 12 of which are Marriott flagged.
Property Management.The Residence Inn by Marriott Phoenix Desert View at Mayo ClinicPropertyis managed by Residence Inn by Marriott, LLC, a Delaware limited liability company. The current management agreement commenced on January 31, 2007 and was most recently amended on October 5, 2015 and has an expiration date on December 30, 2039 with two 10-year extension options.
Escrows and Reserves.At origination, the borrower deposited into escrow approximately $177,964 for a debt service reserve and $123,800 for a ground rent reserve.
Tax Escrows - The lender will not require the borrower to make monthly deposits for taxes, provided that, among other conditions, no event of default has occurred and the Residence Inn by Marriott Phoenix Desert View at Mayo Clinic Property manager is paying such taxes.
Insurance Escrows –The lender will not require the borrower to make monthly deposits for insurance premiums, provided that, among other conditions, no event of default has occurred and the Residence Inn by Marriott Phoenix Desert View at Mayo Clinic Property manager is paying such insurance premiums.
FF&E Reserves - The lender will not require the borrower to make monthly deposits into the FF&E reserve, provided that, among other conditions, no event of default has occurred and the Residence Inn by Marriott Phoenix Desert View at Mayo Clinic Property borrower is paying the FF&E reserve as required under the Residence Inn by Marriott Phoenix Desert View at Mayo Clinic Loan documents.
Ground Rent Reserves - From and after (i) the commencement of a Sweep Event (as defined below) or (ii) the borrower’s failure to pay any ground rent pursuant to the terms of the ground lease, the borrower will be required to deposit with the lender on each monthly payment date, an amount equal to one-third of the ground rent payable under the ground lease for the next quarterly payment due thereunder, which amounts will be required to be transferred into an account established by or on behalf of the lender to hold such funds.
Debt Service Reserves– At origination, the borrower deposited with the lender an amount equal $177,964.48 for debt service. On each monthly payment date, the borrower is required to deposit with the lender an amount, if any, required to make the amount of debt service reserve equal to $177,964.48, which amounts will be transferred into an account established by or on behalf of the lender to hold such funds. The Residence Inn by Marriott Phoenix Desert View at Mayo Clinic Property is affected by seasonality in the months of June, July, August and September.
Lockbox / Cash Management. The Residence Inn by Marriott Phoenix Desert View at Mayo ClinicLoanis structured with a soft lockbox and springing cash management. The borrower or Residence Inn by Marriott Phoenix Desert View at Mayo ClinicPropertymanager must cause all rents to be deposited directly into a lockbox account. Upon the occurrence of a Sweep Event, all funds on deposit in the lockbox account are swept on a daily basis into a cash management account controlled by the lender and in accordance with the related loan documents.
A “Sweep Event” means (i) the occurrence of an event of default under the Residence Inn by Marriott Phoenix Desert View at Mayo ClinicLoan, (ii) the debt service coverage ratio (as calculated in accordance with the loan documents) based on the trailing 12-month period immediately preceding the date of determination is less than 1.15x or (iii) the termination of the Residence Inn by Marriott Phoenix Desert View at Mayo ClinicPropertymanagement agreement.
Subordinate and Mezzanine Debt. None.
Partial Release. Not Permitted.
THE INFORMATION IN THIS STRUCTURAL AND COLLATERAL TERM SHEET IS NOT COMPLETE AND MAY BE AMENDED PRIOR TO THE TIME OF SALE. THIS TERM SHEET IS NOT AN OFFER TO SELL THESE SECURITIES AND IT IS NOT A SOLICITATION OF AN OFFER TO BUY THESE SECURITIES IN ANY JURISDICTION WHERE THE OFFER OR SALE IS NOT PERMITTED.
| | 117 | |
| Structural and Collateral Term Sheet | BBCMS 2018-C2 | |
| Residence Inn by Marriott Phoenix Desert View at Mayo Clinic | ||
Ground Lease. The Residence Inn by Marriott Phoenix Desert View at Mayo Clinic Property is subject to a ground lease with Mayo Clinic Arizona. The lease commenced on April 18, 2007, was amended February 25, 2008 and expires April 17, 2077. The ground lease provides for one 15-year extension option and one 14-year extension option with a fully extended ground lease expiration date of April 17, 2106. The ground lease payments are structured with two parts: (1) a fixed use fee which increases by 3% annually (approximately $26,095 for 2018) and (2) the greater of (a) a fixed base rent (approximately $331,963 in 2018) which increases by 7.5% every five years or (b) percentage rent of 5% of gross room revenue (approximately $445,111 based on the trailing 12 months ending September 30, 2018 and as underwritten).
THE INFORMATION IN THIS STRUCTURAL AND COLLATERAL TERM SHEET IS NOT COMPLETE AND MAY BE AMENDED PRIOR TO THE TIME OF SALE. THIS TERM SHEET IS NOT AN OFFER TO SELL THESE SECURITIES AND IT IS NOT A SOLICITATION OF AN OFFER TO BUY THESE SECURITIES IN ANY JURISDICTION WHERE THE OFFER OR SALE IS NOT PERMITTED.
| | 118 | |
| Structural and Collateral Term Sheet | BBCMS 2018-C2 |
[THIS PAGE INTENTIONALLY LEFT BLANK]
THE INFORMATION IN THIS STRUCTURAL AND COLLATERAL TERM SHEET IS NOT COMPLETE AND MAY BE AMENDED PRIOR TO THE TIME OF SALE. THIS TERM SHEET IS NOT AN OFFER TO SELL THESE SECURITIES AND IT IS NOT A SOLICITATION OF AN OFFER TO BUY THESE SECURITIES IN ANY JURISDICTION WHERE THE OFFER OR SALE IS NOT PERMITTED.
| | 119 | |
| Structural and Collateral Term Sheet | BBCMS 2018-C2 | |
| Home Depot Technology Center | ||
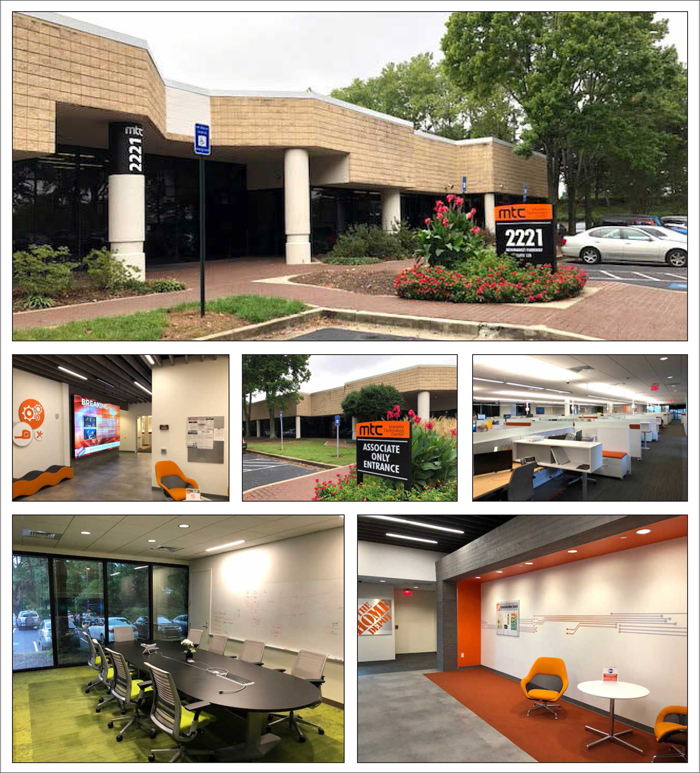
THE INFORMATION IN THIS STRUCTURAL AND COLLATERAL TERM SHEET IS NOT COMPLETE AND MAY BE AMENDED PRIOR TO THE TIME OF SALE. THIS TERM SHEET IS NOT AN OFFER TO SELL THESE SECURITIES AND IT IS NOT A SOLICITATION OF AN OFFER TO BUY THESE SECURITIES IN ANY JURISDICTION WHERE THE OFFER OR SALE IS NOT PERMITTED.
| | 120 | |
| Structural and Collateral Term Sheet | BBCMS 2018-C2 | |
| Home Depot Technology Center | ||
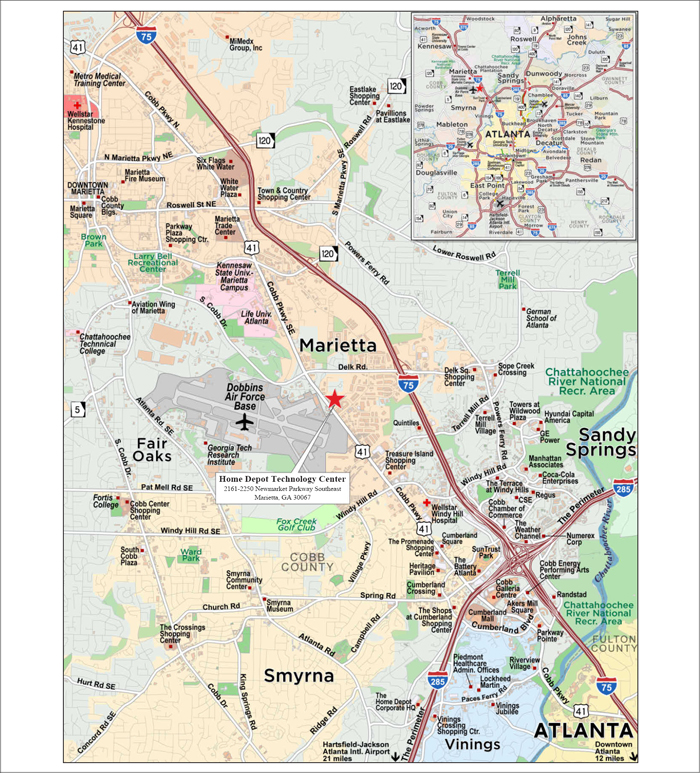
THE INFORMATION IN THIS STRUCTURAL AND COLLATERAL TERM SHEET IS NOT COMPLETE AND MAY BE AMENDED PRIOR TO THE TIME OF SALE. THIS TERM SHEET IS NOT AN OFFER TO SELL THESE SECURITIES AND IT IS NOT A SOLICITATION OF AN OFFER TO BUY THESE SECURITIES IN ANY JURISDICTION WHERE THE OFFER OR SALE IS NOT PERMITTED.
| | 121 | |
| Structural and Collateral Term Sheet | BBCMS 2018-C2 | |
| Home Depot Technology Center | ||
Mortgage Loan Information | Property Information | |||
| Mortgage Loan Seller: | Barclays | Single Asset / Portfolio: | Single Asset | |
| Original Principal Balance(1): | $30,000,000 | Title: | Fee | |
| Cut-off Date Principal Balance(1): | $30,000,000 | Property Type – Subtype: | Office – Suburban | |
| % of IPB: | 3.4% | Net Rentable Area (SF): | 347,498 | |
| Loan Purpose(2): | Acquisition | Location: | Marietta, GA | |
| Borrower: | MTC Atlanta Owner, LLC | Year Built / Renovated: | 1984-1986 / 2017 | |
| Sponsors: | SSP Newmarket, LLC, SM | Occupancy: | 100.0% | |
| Newmarket Manager, LLC and | Occupancy Date: | 10/14/2018 | ||
| Centerlane MTC Atlanta, LLC | 4th Most Recent NOI (As of)(5): | $17,108 (12/31/2015) | ||
| Interest Rate(3): | 5.00100% | 3rd Most Recent NOI (As of)(5): | $987,268 (12/31/2016) | |
| Note Date: | 10/11/2018 | 2nd Most Recent NOI (As of)(5): | $2,885,767 (12/31/2017) | |
| Anticipated Repayment Date(3): | 11/5/2025 | Most Recent NOI (As of)(5)(6): | $3,908,565 (TTM 8/31/2018) | |
| Interest-only Period(3): | 84 months | UW Economic Occupancy: | 96.1% | |
| Original Term(3): | 84 months | UW Revenues: | $5,857,123 | |
| Original Amortization Term(3): | None | UW Expenses: | $1,737,924 | |
| Amortization Type(3): | ARD-Interest Only | UW NOI(6): | $4,119,198 | |
| Call Protection(4): | L(25),Def(52),O(7) | UW NCF: | $3,983,373 | |
| Lockbox / Cash Management: | Hard / Springing | Appraised Value / Per SF(7): | $66,600,000 / $192 | |
| Additional Debt: | Yes | Appraisal Date: | 8/31/2018 | |
| Additional Debt Balance: | $14,300,000 | |||
| Additional Debt Type: | Pari Passu | |||
| Escrows and Reserves(8) | Financial Information(1) | |||||||||
| Initial | Monthly | Initial Cap | Cut-off Date Loan / SF: | $127 | ||||||
| Taxes: | $27,577 | $27,577 | N/A | Maturity Date Loan / SF(9): | $127 | |||||
| Insurance: | $0 | Springing | N/A | Cut-off Date LTV: | 66.5% | |||||
| Replacement Reserves: | $0 | Springing | N/A | Maturity Date LTV(9): | 66.5% | |||||
| TI/LC: | $0 | $0 | N/A | UW NCF DSCR: | 1.77x | |||||
| Other: | $1,415,196 | $0 | N/A | UW NOI Debt Yield: | 9.3% | |||||
| Sources and Uses | ||||||||||
| Sources | Proceeds | % of Total | Uses | Proceeds | % of Total | |||||
| Whole Loan(1) | $44,300,000 | 67.7% | Purchase Price | $63,000,000 | 96.3% | |||||
| Sponsor Equity | 19,685,686 | 30.1 | Upfront Reserves | 1,442,773 | 2.2 | |||||
| Other Sources(10) | 1,415,196 | 2.2 | Closing Costs | 958,109 | 1.5 | |||||
| Total Sources | $65,400,882 | 100.0% | Total Uses | $65,400,882 | 100.0% | |||||
| (1) | The Home Depot Technology Center loan is part of a whole loan evidenced by twopari passu notes with an aggregate original principal balance of $44.3 million. The financial information presented in the chart above reflects the Cut-off Date balance of the $44.3 million Home Depot Technology Center Whole Loan (as defined below). |
| (2) | One of the mortgage loan sponsors, Centerlane MTC Atlanta, LLC, contributed approximately $19.7 million of fresh equity and acquired an approximate 98.9% interest in the Home Depot Technology Center property. Prior to the acquisition, affiliates of the mortgage loan sponsors, SSP Newmarket, LLC and SM Newmarket Manager, LLC, had a combined interest in the Home Depot Technology Center property of 10.0%; and post-acquisition, their combined interest is approximately 1.1%. |
| (3) | The Home Depot Technology Center Whole Loan is structured with an anticipated repayment date of November 5, 2025 (the “ARD”). If the Home Depot Technology Center Whole Loan is not paid off on or before the ARD, then the Home Depot Technology Center Whole Loan will accrue interest at a rate of 8.00100%per annum (the “Adjusted Interest Rate”); however, interest accrued at the excess of the Adjusted Interest Rate over the initial interest rate will be deferred. In addition, from and after the ARD, all excess cash flow from the Home Depot Technology Center property after the payment of reserves, interest calculated at the initial interest rate and operating expenses will be applied (a) first, to repay the outstanding principal balance of the Home Depot Technology Center Whole Loan until the entire outstanding principal balance is paid in full and (b) second, to the payment of Accrued Interest. The final maturity date of the Home Depot Technology Center Whole Loan is November 5, 2028. |
THE INFORMATION IN THIS STRUCTURAL AND COLLATERAL TERM SHEET IS NOT COMPLETE AND MAY BE AMENDED PRIOR TO THE TIME OF SALE. THIS TERM SHEET IS NOT AN OFFER TO SELL THESE SECURITIES AND IT IS NOT A SOLICITATION OF AN OFFER TO BUY THESE SECURITIES IN ANY JURISDICTION WHERE THE OFFER OR SALE IS NOT PERMITTED.
| | 122 | |
| Structural and Collateral Term Sheet | BBCMS 2018-C2 | |
| Home Depot Technology Center | ||
| (4) | The lockout period will be at least 25 payments beginning with and including the first payment date of December 5, 2018. Defeasance of the full $44.3 million Home Depot Technology Center Whole Loan is permitted at any time after the earlier to occur of (i) two years after the closing date of the of the securitization that includes the last note to be securitized and (ii) October 11, 2021. |
| (5) | The increase in NOI from 2015 to 2016 resulted from Home Depot executing a lease for 226,260 square feet commencing in August 2015. The increase in NOI from 2016 to TTM resulted from Home Depot expansion into its current 310,669 square feet over that time period. |
| (6) | The increase in NOI from TTM to Underwritten is due to Home Depot’s underwritten rent being straight-line averaged through the 7-year ARD date resulting in a $369,572 increase over in place rent. Additionally, Underwritten Rents In Place includes a contractual rent step of $49,720 for Underwriters Laboratories effective January 2019. |
| (7) | The appraisal also concluded a “hypothetical go-dark” value of $41.0 million (approximately $118 per square foot) as of August 31, 2018. |
| (8) | For a full description of Escrows and Reserves, please refer to the “Escrow and Reserves” section below. |
| (9) | Maturity Date Loan / SF and Maturity Date LTV are calculated as of the ARD. |
| (10) | Other Sources reflects a buyer credit of $1,415,196 for an outstanding tenant improvement allowance and abated rent owed to Underwriters Laboratories. Such credit has been reserved by the lender. |
The Loan.The Home Depot Technology Center Whole Loan is secured by a first lien mortgage on the borrower’s fee simple interest in 347,498 square foot office and technology center located in Marietta, Georgia. The Home Depot Technology Center Whole Loan was originated by Barclays and has an outstanding principal balance as of the Cut-off Date of $44.3 million (the “Home Depot Technology Center Whole Loan”) and is comprised of twopari passunotes. Note A-1 has an outstanding principal balance as of the Cut-off Date of $30.0 million and is being contributed to the BBCMS 2018-C2 Trust. Note A-2 has an outstanding principal balance as of the Cut-off Date of $14.3 million and is expected to be contributed to a future securitization transaction. The Home Depot Technology Center Whole Loan requires interest-only payments through the anticipated repayment date on November 5, 2025 and accrues interest at a rate of 5.00100%per annum (the “Initial Interest Rate”) through the ARD. Following the ARD, to the extent that the loan is outstanding, the Home Depot Technology Center Whole Loan will accrue interest at a rate of 8.00100%per annum; however, interest accrued at the Adjusted Interest Rate in excess of the Initial Interest Rate (“Accrued Interest”) will be deferred. In addition, to the extent that there is excess cash flow after the payment of reserves, the excess cash flow will (i) first, be applied to the reduction of the principal balance of the Home Depot Technology Center Whole Loan until the entire outstanding principal balance is paid in full and (ii) second, be applied to the payment of Accrued Interest. The final maturity date is November 5, 2028.
| Whole Loan Summary | |||
| Note | Original Balance | Note Holder | Controlling Piece |
| Note A-1 | $30,000,000 | BBCMS 2018-C2 | Yes |
| Note A-2 | 14,300,000 | Barclays Bank PLC | No |
| Total | $44,300,000 | ||
The Property. Home Depot Technology Center is an office complex located on a 29.09-acre parcel in Marietta, Georgia comprising four, one-story buildings totaling 347,498 square feet (the “Home Depot Technology Center Property”). The Home Depot Technology Center Property contains 1,354 parking spaces, resulting in a ratio of 3.9 spaces per 1,000 square feet. The 2161 Newmarket Parkway building was built in 1984, the 2211 Newmarket Parkway and 2221 Newmarket Parkway buildings were built in 1985, and the 2250 Newmarket Parkway building was built in 1986. Between 2015 and 2018, approximately $37.2 million was invested in the Home Depot Technology Center Property to completely renovate the property interiors. New floor-to-ceiling glass meeting rooms were built out, a fitness center was developed, new flooring and wall coverings were installed, new fixtures were installed in the bathrooms, security doors and ballistic glass walls were installed, technology was improved, and building systems including the HVAC and other mechanical systems and the roof were completely replaced.
As of October 14, 2018, the property was 100.0% occupied by two tenants. The largest tenant, Home Depot U.S.A., Inc. (“Home Depot”), a wholly-owned subsidiary of Home Depot (Moody’s/S&P/Fitch: A2/A/A and NYSE: HD), leases 89.4% of net rentable area through July 2029, and has been located at the property since August 2015. Home Depot originally occupied 226,260 square feet, expanding by 4,940 square feet in 2015, 43,247 square feet in 2016, and 36,222 square feet in 2017. Home Depot Technology Center serves as the technology group’s headquarters and is located four miles away from the company’s main headquarters. The property houses Home Depot’s information technology group, which has been tasked with rolling out an internally developed e-commerce platform that generated more than $6.0 billion in revenue in 2017. According to the sponsors, since taking occupancy in 2015, Home Depot has invested nearly $84 per square foot on improvements into their space. Home Depot has also announced their intent to hire an additional 1,000 information technology employees, many of which will be housed at the Home Depot Technology Property. Founded in 1978, Home Depot is a home improvement retailer that sells various building materials, home improvement products, lawn and garden products, and décor and provides installation services and tool and equipment rental services. As of January 28, 2018, the company operated 2,284 stores, had over 413,000 employees, and was ranked #23 on the Fortune 500.
THE INFORMATION IN THIS STRUCTURAL AND COLLATERAL TERM SHEET IS NOT COMPLETE AND MAY BE AMENDED PRIOR TO THE TIME OF SALE. THIS TERM SHEET IS NOT AN OFFER TO SELL THESE SECURITIES AND IT IS NOT A SOLICITATION OF AN OFFER TO BUY THESE SECURITIES IN ANY JURISDICTION WHERE THE OFFER OR SALE IS NOT PERMITTED.
| | 123 | |
| Structural and Collateral Term Sheet | BBCMS 2018-C2 | |
| Home Depot Technology Center | ||
The second largest tenant, Underwriters Laboratories, LLC (“Underwriters Laboratories”), leases 10.6% of the net rentable area. Originally leasing 29,477 square feet in 2008, Underwriters Laboratories subsequently expanded by 7,352 square feet in 2010, and in 2018 Underwriters Laboratories exercised their two five-year renewal options extending their lease through August 2029. Underwriters Laboratories is a private, global safety consulting and certification company. As one of the companies certified by the U.S. Occupational Safety and Health Administration to perform safety testing and compliance, Underwriters Laboratories offers services such as inspection, advisory, education and training, testing, auditing and analytics, certification software solutions, and marketing claim verification. Since initially taking occupancy of their space in 2008, Underwriters Laboratories has invested into their space in order to perform air quality testing on common household goods.
Unrelated to the Home Depot Technology Center Whole Loan borrower and sponsors, and prior to Home Depot’s occupancy, a previous mortgage loan originated in 2006 and secured by the Home Depot Technology Center Property and two other properties, was foreclosed on by the special servicer in 2013. See “Description of the Mortgage Pool – Loan Purpose; Default History, Bankruptcy Issues and Other Proceedings”in the Preliminary Prospectus.
Environmental. According to a Phase I environmental assessment dated September 27, 2018, there was no evidence of any recognized environmental conditions at the Home Depot Technology Center Property.
| Historical and Current Occupancy(1) | |||
| 2015(2) | 2016(2) | 2017(2) | Current(3) |
| 77.1% | 89.6% | 100.0% | 100.0% |
| (1) | Historical Occupancies are the year-end occupancies of each respective year. |
| (2) | Home Depot’s original lease commenced in August 2015 for 226,260 square feet. Home Depot expanded to a total of 231,200 square feet in 2015. Home Depot expanded by an additional 43,247 square feet in 2016 and an additional 36,222 square feet in 2017 to occupy its current space of 310,669 square feet at the property. |
| (3) | Current Occupancy is as of October 14, 2018. |
| Top Tenant Summary(1) | ||||||||||||
| Tenant | Ratings(2) Moody’s/S&P/Fitch | Net Rentable Area (SF) | % of Total NRA | Base Rent PSF | Base Rent | % of Total Base Rent | Lease Expiration Date | |||||
| Home Depot | A2 / A / A | 310,669 | 89.4 | % | $16.82 | (3) | $5,225,328 | 90.6 | % | 7/31/2029 | ||
| Underwriters Laboratories | NA / NA / NA | 36,829 | 10.6 | $14.71 | 541,755 | 9.4 | 8/31/2029 | (4) | ||||
| Top Tenants | 347,498 | 100.0 | % | $16.60 | $5,767,083 | 100.0 | % | |||||
| Occupied Collateral Total | 347,498 | 100.0 | % | $16.60 | $5,767,083 | 100.0 | % | |||||
| Vacant Space | 0 | 0.0 | % | |||||||||
| Collateral Total | 347,498 | 100.0 | % | |||||||||
| (1) | Based on the underwritten rent roll. |
| (2) | Ratings provided are for the parent company of the entity listed in the “Tenant” field whether or not the parent company guarantees the lease. |
| (3) | Home Depot’s rent has been straight-line averaged through the 7-year ARD date. Home Depot is currently paying $15.63 per square foot with approximately 2.25% annual increases. |
| (4) | Underwriters Laboratories also has a one-time option to terminate its lease effective as of August 31, 2026 with notice at least 360 days, but not more than 450 days, prior to the termination date and the payment of a termination fee of $727,786. |
THE INFORMATION IN THIS STRUCTURAL AND COLLATERAL TERM SHEET IS NOT COMPLETE AND MAY BE AMENDED PRIOR TO THE TIME OF SALE. THIS TERM SHEET IS NOT AN OFFER TO SELL THESE SECURITIES AND IT IS NOT A SOLICITATION OF AN OFFER TO BUY THESE SECURITIES IN ANY JURISDICTION WHERE THE OFFER OR SALE IS NOT PERMITTED.
| | 124 | |
| Structural and Collateral Term Sheet | BBCMS 2018-C2 | |
| Home Depot Technology Center | ||
| Lease Rollover Schedule(1) | |||||||||||
| Year | Number of Leases Expiring | Net Rentable Area Expiring | % of NRA Expiring | Base Rent Expiring | % of Base Rent Expiring | Cumulative Net Rentable Area Expiring | Cumulative % of NRA Expiring | Cumulative Base Rent Expiring | Cumulative % of Base Rent Expiring | ||
| Vacant | NAP | 0 | 0.0% | NAP | NAP | 0 | 0.0% | NAP | NAP | ||
| 2018 & MTM | 0 | 0 | 0.0 | $0 | 0.0 | % | 0 | 0.0% | $0 | 0.0 | % |
| 2019 | 0 | 0 | 0.0 | 0 | 0.0 | 0 | 0.0% | $0 | 0.0 | % | |
| 2020 | 0 | 0 | 0.0 | 0 | 0.0 | 0 | 0.0% | $0 | 0.0 | % | |
| 2021 | 0 | 0 | 0.0 | 0 | 0.0 | 0 | 0.0% | $0 | 0.0 | % | |
| 2022 | 0 | 0 | 0.0 | 0 | 0.0 | 0 | 0.0% | $0 | 0.0 | % | |
| 2023 | 0 | 0 | 0.0 | 0 | 0.0 | 0 | 0.0% | $0 | 0.0 | % | |
| 2024 | 0 | 0 | 0.0 | 0 | 0.0 | 0 | 0.0% | $0 | 0.0 | % | |
| 2025 | 0 | 0 | 0.0 | 0 | 0.0 | 0 | 0.0% | $0 | 0.0 | % | |
| 2026(2) | 0 | 0 | 0.0 | 0 | 0.0 | 0 | 0.0% | $0 | 0.0 | % | |
| 2027 | 0 | 0 | 0.0 | 0 | 0.0 | 0 | 0.0% | $0 | 0.0 | % | |
| 2028 & Beyond(2) | 2 | 347,498 | 100.0 | 5,767,083 | 100.0 | 347,498 | 100.0% | $5,767,083 | 100.0 | % | |
| Total | 2 | 347,498 | 100.0% | $5,767,083 | 100.0 | % | |||||
| (1) | Based on the underwritten rent roll. |
| (2) | Underwriters Laboratories also has a one-time option to terminate its lease effective as of August 31, 2026 with notice 360 days, but not more than 450 days, prior to the termination date and the payment of a termination fee of $727,786 which shall be deposited directly into the rollover reserve account. |
| Operating History and Underwritten Net Cash Flow | ||||||||
| 2015 | 2016 | 2017 | TTM(1) | Underwritten | Per Square Foot | %(2) | ||
| Rents in Place(3)(4) | $1,023,410 | $2,379,447 | $4,359,685 | $5,249,985 | $5,767,098 | $16.60 | 95.0 | % |
| Vacant Income | 0 | 0 | 0 | 0 | 0 | 0.0 | 0.0 | |
| Gross Potential Rent | $1,023,410 | $2,379,447 | $4,359,685 | $5,249,985 | $5,767,098 | $16.60 | 95.0 | % |
| Total Reimbursements | 150,330 | 90,338 | 96,854 | 357,544 | 302,668 | 0.87 | 5.0 | |
| Net Rental Income | $1,173,740 | $2,469,785 | $4,456,539 | $5,607,529 | $6,069,766 | $17.47 | 100.0 | % |
| Other Income | 8,978 | 8,610 | 11,420 | 10,543 | 10,543 | 0.03 | 0.2 | |
| (Vacancy/Credit Loss) | 0 | 0 | 0 | 0 | (223,187) | (0.64) | (3.7 | ) |
| Effective Gross Income | $1,182,718 | $2,478,395 | $4,467,959 | $5,618,072 | $5,857,123 | $16.86 | 96.5 | % |
| Total Expenses | $1,165,609 | $1,491,128 | $1,582,192 | $1,709,507 | $1,737,924 | $5.00 | 29.7 | % |
| Net Operating Income | $17,108 | $987,268 | $2,885,767 | $3,908,565 | $4,119,198 | $11.85 | 70.3 | % |
| Total TI/LC, Capex/RR | 0 | 0 | 0 | 0 | 135,825 | 0.39 | 2.3 | |
| Net Cash Flow | $17,108 | $987,268 | $2,885,767 | $3,908,565 | $3,983,373 | $11.46 | 68.0 | % |
| (1) | TTM reflects the trailing 12-month period ending August 2018. |
| (2) | Percentage column represents percent of Net Rental Income for all revenue lines and represents percent of Effective Gross Income for the remainder of fields. |
| (3) | The increase in Rents in Place from 2015 to 2016 resulted from Home Depot executing a lease for 226,260 square feet commencing in August 2015. The increase in Rents in Place from 2016 to TTM resulted in Home Depot expansion into its current 310,669 square feet over that time period. |
| (4) | The increase in Rents in Place from TTM to Underwritten is due to Home Depot’s underwritten rent being straight-line averaged through the 7-year ARD date resulting in a $369,572 increase over in place rent. Additionally, Underwritten Rents In Place includes a contractual rent step of $49,720 for Underwriters Laboratories effective January 2019. |
The Market.The Home Depot Technology Center Property is located in Marietta, Georgia, approximately 15 miles northwest of the Atlanta central business district. According to the appraisal, the property is located in the Atlanta-Sandy Springs-Marietta core based statistical area (“CBSA”), the ninth largest CBSA in the United States. Atlanta is the state capital and most populous city in Georgia. Atlanta has the country’s third largest concentration of Fortune 500 companies with 75% of Fortune 1000 companies having a presence in the metropolitan area. As of June 2018, the region added 49,000 new jobs over the year, increasing 1.8% over the prior year. Due to
THE INFORMATION IN THIS STRUCTURAL AND COLLATERAL TERM SHEET IS NOT COMPLETE AND MAY BE AMENDED PRIOR TO THE TIME OF SALE. THIS TERM SHEET IS NOT AN OFFER TO SELL THESE SECURITIES AND IT IS NOT A SOLICITATION OF AN OFFER TO BUY THESE SECURITIES IN ANY JURISDICTION WHERE THE OFFER OR SALE IS NOT PERMITTED.
| | 125 | |
| Structural and Collateral Term Sheet | BBCMS 2018-C2 | |
| Home Depot Technology Center | ||
a relatively inexpensive tech workforce, companies such as Facebook, Amazon and Boeing are planning expansions in the Atlanta area. The property is located approximately one mile away from I-75, which provides access to the new Atlanta Braves stadium and entertainment district (3.2 miles from the property), the Cobb Energy Performing Arts Center (3.6 miles from the property), and the 1,040,000 square foot Cumberland Mall composed of approximately 150 stores and restaurants (3.6 miles from the property).
According to the appraisal, the Home Depot Technology Center Property is located in the Atlanta office market and Cumberland/I-75 submarket. The Atlanta office market contains 145,855,000 square feet of space, and the Cumberland/I-75 submarket contains 20,848,000 square feet of office space (14.3% of the region’s inventory). As of the second quarter of 2018, the submarket had a vacancy rate of 18.3%. The property is located within the Newmarket Business Park, which consists of 11 buildings totaling 705,856 square feet. According to a third party market research report, the Newmarket Business Park vacancy rate is currently 10.3% and has averaged 15.9% over the last five years. According to the appraisal, the concluded market rent was $17.00 per square foot. Besides Home Depot, other major employers in the submarket include The Weather Channel, General Electric, Lockheed Martin, Russell Athletics, and Coca Cola Enterprises.
The Borrower. The borrowing entity for the Home Depot Technology Center Whole Loan is MTC Atlanta Owner, LLC, a Delaware limited liability company and special purpose entity with one independent director in its organizational structure. Legal counsel to the borrower delivered a non-consolidation opinion in connection with the origination of the Home Depot Technology Center Whole Loan. Jordan Phillips, a Partner at South Street Partners, and Michael Meyer, a Principal of Praelium Commercial Real Estate, are the guarantors of certain nonrecourse carve-outs under the Home Depot Technology Center Whole Loan.
The Loan Sponsors.The Home Depot Technology Center Whole Loan sponsors are SSP Newmarket, LLC, SM Newmarket Manager, LLC and Centerlane MTC Atlanta, LLC. SSP Newmarket, LLC is controlled by South Street Partners. Founded in 2009, South Street Partners is a private equity real estate firm with over $850 million assets under management. South Street Partners is primarily focused on opportunistic and value add real estate investments in the southeastern United States as well as select continental US and international markets. SM Newmarket Manager, LLC is controlled by Michael Meyer. Michael Meyer is a principal of Praelium Commercial Real Estate is a Southern California-based commercial real estate investment and advisory firm primarily focused on acquiring office assets nationwide. Centerlane MTC Atlanta, LLC is controlled by Centerlane Capital. Centerlane Capital was founded in 2014 to identify select commercial real estate investments from its own capital and co-investors’ capital. Their investments are primarily focused on the middle market tier in the southeastern United States. Centerlane Capital has invested in transactions valued over $225 million through value-add acquisitions and opportunistic developments.
Property Management. The Home Depot Technology Center Property is managed by Colliers International Management – Atlanta, LLC, a Georgia limited liability company.
Escrows and Reserves. At origination, the borrower was required to escrow $1,054,027 for outstanding tenant improvements and leasing commissions for the Underwriters Laboratories space, $361,170 for free rent for Underwriters Laboratories and $27,577 for real estate taxes.
Tax Escrows – On a monthly basis, the borrower is required to escrow 1/12th of the annual estimated tax payments, which currently equates to $27,577.
Insurance Escrows – The requirement for the borrower to make monthly deposits to the insurance escrow is waived so long as no event of default has occurred and is continuing and the property is insured under a blanket insurance policy in accordance with the mortgage loan documents.
Replacement Reserves –On a monthly basis during the continuance of a Trigger Period (as defined below), the borrower is required to escrow $3,185 (approximately $0.11 per square foot annually) for ongoing replacement reserves.
A “Trigger Period” will commence upon the earliest to occur of (i) an event of default, (ii) the debt service coverage ratio is less than 1.40x for two consecutive calendar quarters, (iii) a Home Depot Trigger Event (as defined below), or (iv) the ARD, and will cease to exist when (i) the event of default is cured, (ii) the debt service coverage ratio is greater than or equal to 1.45x for two consecutive calendar quarters or (iii) a Home Depot Cure Event (as defined below).
A “Home Depot Trigger Event” means (i) the earliest to occur of (a) Home Depot terminating their lease, abandoned any material or substantial portion of their space, or has “gone dark” with respect to any material or substantial portion (at the lender’s reasonable discretion) of its space or (b) Home Depot delivering notice of its intention to take any of the foregoing actions, (ii) Home Depot defaulting under its lease or (iii) Home Depot, its parent company, or any guarantor under the lease filing for bankruptcy.
THE INFORMATION IN THIS STRUCTURAL AND COLLATERAL TERM SHEET IS NOT COMPLETE AND MAY BE AMENDED PRIOR TO THE TIME OF SALE. THIS TERM SHEET IS NOT AN OFFER TO SELL THESE SECURITIES AND IT IS NOT A SOLICITATION OF AN OFFER TO BUY THESE SECURITIES IN ANY JURISDICTION WHERE THE OFFER OR SALE IS NOT PERMITTED.
| | 126 | |
| Structural and Collateral Term Sheet | BBCMS 2018-C2 | |
| Home Depot Technology Center | ||
A “Home Depot Cure Event” shall occur when the borrower has delivered to the lender (i) evidence reasonably satisfactory to the Lender that either (a) the Home Depot space has been re-tenanted under one or more leases with a term of no less than five years with tenant(s) reasonably acceptable to the lender and which lease(s) are reasonably acceptable to the Lender, (b) Home Depot has cured all defaults under its lease or (c) the Home Depot lease is affirmed by Home Depot, its parent company, or any guarantor of the Home Depot lease in a bankruptcy proceeding and (ii) tenant estoppel(s) are reasonably satisfactory to the lender.
Lockbox / Cash Management.The mortgage loan is structured with a hard lockbox and springing cash management. The borrower was required to send direction letters to all tenants instructing them to deposit all rents into a clearing account controlled by the lender. In the absence of a Trigger Period, the funds in the clearing account will be swept on each business day into an account controlled by the borrower. During a Trigger Period, any transfers to the borrower’s operating account are required to cease and sums on deposit in the clearing account will be transferred on each business day to a cash management account controlled by the lender and applied to payment of all monthly amounts due under the mortgage loan documents. Upon the occurrence and continuance of a Trigger Period, all excess cash flow in the cash management account will be held as additional security for the mortgage loan in an excess cash reserve account.
Subordinate and Mezzanine Debt. None.
Partial Release. Not Permitted.
Ground Lease. None.
THE INFORMATION IN THIS STRUCTURAL AND COLLATERAL TERM SHEET IS NOT COMPLETE AND MAY BE AMENDED PRIOR TO THE TIME OF SALE. THIS TERM SHEET IS NOT AN OFFER TO SELL THESE SECURITIES AND IT IS NOT A SOLICITATION OF AN OFFER TO BUY THESE SECURITIES IN ANY JURISDICTION WHERE THE OFFER OR SALE IS NOT PERMITTED.
| | 127 | |
| Structural and Collateral Term Sheet | BBCMS 2018-C2 | |
| Virginia Beach Hotel Portfolio | ||
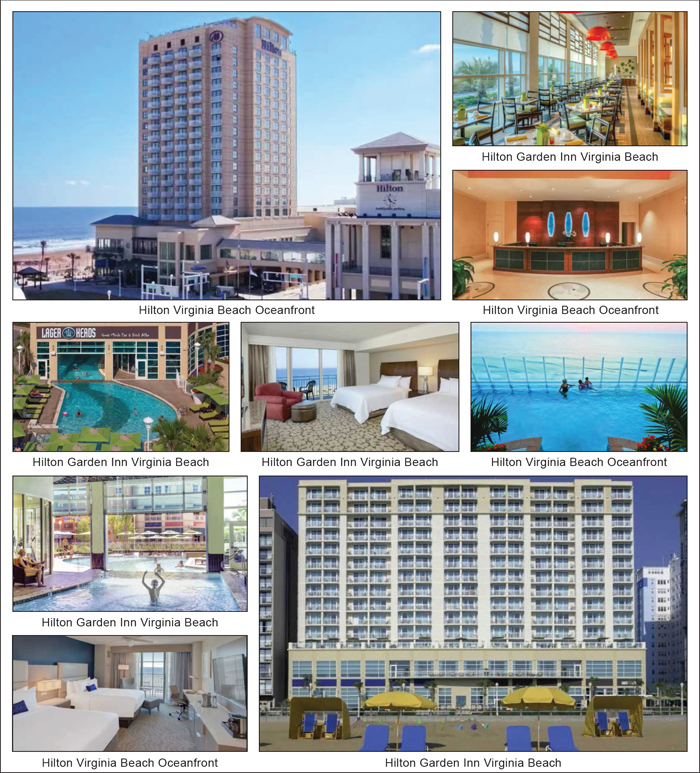
THE INFORMATION IN THIS STRUCTURAL AND COLLATERAL TERM SHEET IS NOT COMPLETE AND MAY BE AMENDED PRIOR TO THE TIME OF SALE. THIS TERM SHEET IS NOT AN OFFER TO SELL THESE SECURITIES AND IT IS NOT A SOLICITATION OF AN OFFER TO BUY THESE SECURITIES IN ANY JURISDICTION WHERE THE OFFER OR SALE IS NOT PERMITTED.
| | 128 | |
| Structural and Collateral Term Sheet | BBCMS 2018-C2 | |
| Virginia Beach Hotel Portfolio | ||

THE INFORMATION IN THIS STRUCTURAL AND COLLATERAL TERM SHEET IS NOT COMPLETE AND MAY BE AMENDED PRIOR TO THE TIME OF SALE. THIS TERM SHEET IS NOT AN OFFER TO SELL THESE SECURITIES AND IT IS NOT A SOLICITATION OF AN OFFER TO BUY THESE SECURITIES IN ANY JURISDICTION WHERE THE OFFER OR SALE IS NOT PERMITTED.
| | 129 | |
| Structural and Collateral Term Sheet | BBCMS 2018-C2 | |
| Virginia Beach Hotel Portfolio | ||
| Mortgage Loan Information | Property Information | |||
| Mortgage Loan Seller: | Barclays | Single Asset / Portfolio: | Portfolio | |
| Original Principal Balance(1): | $30,000,000 | Title: | Fee/Leasehold | |
| Cut-off Date Principal Balance(1): | $30,000,000 | Property Type–Subtype: | Hotel – Full Service | |
| % of IPB: | 3.4% | Net Rentable Area (Rooms): | 456 | |
| Loan Purpose: | Acquisition | Location: | Virginia Beach, VA | |
| Borrowers: | 3001 Atlantic, LLC and 3315 | Year Built / Renovated: | Various / Various | |
| Atlantic, LLC | Occupancy / ADR / RevPAR: | 76.0% / $206.21 / $156.51 | ||
| Sponsors: | Neil P. Amin and Jay B. Shah | Occupancy / ADR / RevPAR Date: | 5/31/2018 | |
| Interest Rate: | 4.91250% | 4thMost Recent NOI (As of): | $11,341,568 (12/31/2015) | |
| Note Date: | 8/31/2018 | 3rd Most Recent NOI (As of): | $12,284,627 (12/31/2016) | |
| Maturity Date: | 9/6/2028 | 2nd Most Recent NOI (As of): | $12,509,547 (12/31/2017) | |
| Interest-only Period: | 24 months | Most Recent NOI (As of): | $11,841,080 (TTM 5/31/2018) | |
| Original Term: | 120 months | UW Occupancy / ADR / RevPAR: | 73.1% / $206.21 / $150.44 | |
| Original Amortization Term: | 360 months | UW Revenues: | $30,113,592 | |
| Amortization Type: | IO-Balloon | UW Expenses: | $18,324,515 | |
| Call Protection(2): | L(27),Def(89),O(4) | UW NOI: | $11,789,077 | |
| Lockbox / Cash Management: | Springing | UW NCF: | $10,584,533 | |
| Additional Debt: | Yes | Appraised Value / Per Room(3): | $130,400,000 / $285,965 | |
| Additional Debt Balance: | $60,000,000 | Appraisal Date: | Various | |
| Additional Debt Type: | Pari Passu | |||
| Escrows and Reserves(4) | Financial Information(1) | |||||||||
| Initial | Monthly | Initial Cap | Cut-off Date Loan / Room: | $197,368 | ||||||
| Taxes: | $326,006 | $81,502 | N/A | Maturity Date Loan / Room: | $170,383 | |||||
| Insurance: | $0 | $28,642 | N/A | Cut-off Date LTV(3): | 69.0% | |||||
| FF&E Reserves: | $0 | 5% of Gross Revenues | $3,755,852 | Maturity Date LTV(3): | 59.6% | |||||
| TI/LC: | $0 | $0 | N/A | UW NCF DSCR: | 1.84x | |||||
| Other: | $741,954 | Springing | N/A | UW NOI Debt Yield: | 13.1% | |||||
| Sources and Uses | ||||||||||
| Sources | Proceeds | % of Total | Uses | Proceeds | % of Total | |||||
| Whole Loan(1) | $90,000,000 | 69.5% | Purchase Price(5) | $126,538,697 | 97.7% | |||||
| Borrower Equity | 39,510,713 | 30.5 | Closing Costs | 1,904,056 | 1.5 | |||||
| Upfront Reserves | 1,067,960 | 0.8 | ||||||||
| Total Sources | $129,510,713 | 100.0% | Total Uses | $129,510,713 | 100.0% | |||||
| (1) | The Virginia Beach Hotel Portfolio loan is part of a whole loan evidenced by threepari passu notes with an aggregate original principal balance of $90.0 million. The Financial Information presented in the chart above reflects the Cut-off Date balance of the $90.0 million Virginia Beach Hotel Portfolio Whole Loan (the “Virginia Beach Hotel Portfolio Whole Loan”). |
| (2) | The lockout period will be at least 27 payments beginning with and including the first payment date of October 6, 2018. Defeasance of the full $90.0 million Virginia Beach Hotel Portfolio Whole Loan is permitted any time after the earlier of (i) the date that is two years from the closing date of the final REMIC securitization that includes the lastpari passunote to be securitized and (ii) August 31, 2021. |
| (3) | The Appraised Value / Per Room, Cut-off Date LTV, and Maturity Date LTV are based on the appraiser’s prospective as-is value, which assumes that 50.0% of expected PIP work ($1,000,000) would be escrowed by the lender and would be available to a prospective buyer to fund the PIP work at the Hilton Garden Inn Virginia Beach Oceanfront property. The Virginia Beach Hotel Portfolio Borrowers (as defined below) deposited upfront PIP reserves totaling $741,954, which represents 50.0% of the engineer’s updated estimated costs of the remaining PIP work (see “Escrows and Reserves” section). The balance of the remaining PIP work will be funded by the monthly FF&E reserve amount of 1/12th of 5.0% of the gross income from operations (initially $104,329 for the portfolio). For the Hilton Garden Inn Virginia Beach Oceanfront property, the appraiser concluded an as-is appraised value without the PIP assumption of $44,600,000, which results in a total appraised value of $129,400,000, and a Cut-off Date LTV and Maturity Date LTV of 69.6% and 60.0%, respectively. |
| (4) | For a full description of Escrows and Reserves, please refer to “Escrows and Reserves” below. |
| (5) | The purchase price includes defeasance costs that the buyer paid on behalf of the seller in the amount of $3,538,697. |
THE INFORMATION IN THIS STRUCTURAL AND COLLATERAL TERM SHEET IS NOT COMPLETE AND MAY BE AMENDED PRIOR TO THE TIME OF SALE. THIS TERM SHEET IS NOT AN OFFER TO SELL THESE SECURITIES AND IT IS NOT A SOLICITATION OF AN OFFER TO BUY THESE SECURITIES IN ANY JURISDICTION WHERE THE OFFER OR SALE IS NOT PERMITTED.
| | 130 | |
| Structural and Collateral Term Sheet | BBCMS 2018-C2 | |
| Virginia Beach Hotel Portfolio | ||
The Loan.The Virginia Beach Hotel Portfolio Whole Loan is secured by a first mortgage lien on the borrowers’ fee and leasehold interest in the 289-room, full-service Hilton Virginia Beach Oceanfront property and the 167-room, full-service Hilton Garden Inn Virginia Beach Oceanfront property (together, the “Virginia Beach Hotel Portfolio Properties”). The Virginia Beach Portfolio Whole Loan has an outstanding principal balance as of the Cut-off Date of $90.0 million, and is comprised of threepari passu notes, Note A-1, Note A-2, and Note A-3. The Virginia Beach Hotel Portfolio Whole Loan is serviced pursuant to the pooling and servicing agreement of the WFCM 2018-C47 Trust. The Virginia Beach Hotel Portfolio Whole Loan has a 10-year term and, subsequent to a two-year interest-only period, will amortize on a 30-year schedule. The Hilton Virginia Beach Oceanfront property was previously securitized in 2014 in the JPMBB 2014-C21 Trust.
| Whole Loan Summary | |||
| Note | Original Balance | Note Holder | Controlling Piece |
| A-1 | $45,000,000 | WFCM 2018-C47 | Yes |
| A-2 | 30,000,000 | BBCMS 2018-C2 | No |
| A-3 | 15,000,000 | Barclays Bank PLC | No |
| Total | $90,000,000 | ||
The Properties. The Virginia Beach Hotel Portfolio Properties are comprised of two full-service hotels properties built in 2005 and 2014 totaling 456 rooms that, as of May 31, 2018, were 76.0% occupied with occupancies at the individual hotel properties of 75.7% at the Hilton Virginia Beach Oceanfront property and 76.6% at the Hilton Garden Inn Virginia Beach Oceanfront property.
The Hilton Virginia Beach Oceanfront property is a 289-room, full-service resort hotel. The property was built in 2005, and features two restaurants and a lounge, 10,050 square feet of meeting space, an indoor pool, a rooftop outdoor pool and whirlpool, oceanfront and boardwalk access, a fitness room, valet parking service and a business center. The hotel contains 186 double/double guestrooms, 90 king guestrooms, 11 studio suites and two one-bedroom suites. Catch 21, the hotel’s primary dining outlet, is located in the northern portion of the lobby and has a built-in buffet to facilitate breakfast and lunch service. According to Diamond Ratings, the second restaurant, Salacia, is the only four diamond steakhouse in Virginia. Additionally, the Skybar is located on the 21st floor and offers food and beverage service to the rooftop infinity pool. The hotel is expected to undergo renovations anticipated to cost approximately $832,184, which will be funded by the monthly FF&E reserve in an amount equal to one-twelfth of 5.0% of the projected annual gross income from room revenue operations (currently approximately $104,329 for the portfolio). Attached to the property by way of an overhead walkway is an approximately 1,000 car parking garage with ground floor retail. The borrower has a leasehold interest in 380 garage parking spaces and approximately 26,000 square feet of retail space, with 58 additional spaces for exclusive retail use (see “Leasehold Interest” section). There are currently 13 tenants leasing the retail space for a total underwritten base rent of $765,284 resulting in a net positive cash flow. Tenants include Starbucks and other small shops that cater to the hotel’s customer base. The hotel franchise agreement with Hilton Franchise Holding LLC expires on August 31, 2038.
The Hilton Garden Inn Virginia Beach Oceanfront property is a 167-room, full-service hotel. The property was built in 2014, featuring two restaurants, a lounge, 6,350 square feet of meeting space, an indoor/outdoor pool, oceanfront access, a fitness room, a 24-hour business center, a market pantry, and a guest laundry room. The hotel contains 51 king guestrooms, 20 king suites, 92 queen/queen guestrooms, and 4 queen/queen suites. All rooms at the hotel have a view of the ocean. The on-site Lager Heads Restaurant serves lunch and dinner, with indoor and outdoor seating, and the on-site Great American Grill serves breakfast. The Hilton Garden Inn Virginia Beach Oceanfront has a leasehold interest in a 168-space parking garage, located approximately one block away from the subject property (see “Leasehold Interest” section). The hotel offers valet service from the hotel to the garage. The Hilton Garden Inn Virginia Beach Oceanfront property is expected to undergo an approximately $1.5 million property improvement plan (“PIP”) of which $741,954 was reserved at closing and the remaining balance will be funded by the monthly FF&E reserve in an amount equal to one-twelfth of 5.0% of the projected annual gross income from room revenue operations (currently approximately $104,329 for the portfolio). The hotel franchise agreement with Hilton Franchise Holding LLC expires on August 31, 2038.
Environmental.According to a Phase I environmental assessment dated June 21, 2018, there was no evidence of any recognized environmental conditions at the Virginia Beach Hotel Portfolio Properties.
The Market.The Hilton Virginia Beach Oceanfront property and the Hilton Garden Inn Virginia Beach Oceanfront property are located in Virginia Beach, Virginia. The Virginia Beach Hotel Portfolio Properties are accessible regionally by Interstate 64, Interstate 264, and Atlantic Avenue and are located approximately 11 miles southeast of Norfolk International Airport. According to the appraisal, Virginia Beach is best known as a resort, with miles of beaches and hundreds of hotels, motels, and restaurants along its oceanfront. It is also home to several state parks, long protected beach areas, three military bases, three Fortune 500 companies and a number of other large corporations, two universities, and historic sites. The Virginia Beach Convention Center, which is located approximately two miles
THE INFORMATION IN THIS STRUCTURAL AND COLLATERAL TERM SHEET IS NOT COMPLETE AND MAY BE AMENDED PRIOR TO THE TIME OF SALE. THIS TERM SHEET IS NOT AN OFFER TO SELL THESE SECURITIES AND IT IS NOT A SOLICITATION OF AN OFFER TO BUY THESE SECURITIES IN ANY JURISDICTION WHERE THE OFFER OR SALE IS NOT PERMITTED.
| | 131 | |
| Structural and Collateral Term Sheet | BBCMS 2018-C2 | |
| Virginia Beach Hotel Portfolio | ||
from the Virginia Beach Hotel Portfolio Properties, offers over 516,000 square feet of convention space and hosts an array of conventions, consumer shows, theater events, banquets, local meetings and trade shows.
There is an approximately 305-room, full-service Marriott that recently broke ground and will likely open in January 2020 within the market approximately 0.6 miles away from the Virginia Beach Hotel Portfolio Properties. According to the appraisal, the Marriott will have more meeting space and is expected to operate at a higher price point. Furthermore, according to the appraisal, the proposed Marriott is not located within easy walking distance of many of the restaurants in the area and is expected to be part of a campus setting. The appraisal considers the property secondarily competitive. Additionally, an Embassy Suites by Hilton has been proposed for a site located within one mile from the Virginia Beach Hotel Portfolio Properties; however, this project is not expected to break ground until the Marriott is operational and absorbed in the market. There is potential additional demand as the city of Virginia Beach is constructing a 285,000 square foot Virginia Beach Sports Center, which is expected to be completed by November 2020. The sports center will feature 12 basketball courts, 24 volleyball courts, and 9 indoor field hockey courts. By its fifth year in operation, this facility is expected to increase hotel traffic by 100,000 guests and direct spending revenue by over $82.0 million according to a third party report.
The Virginia Beach Hotel Portfolio Properties are located within the greater Hampton Roads lodging market. For the year 2017, the market-wide occupancy level was 69.9%, average daily rate was $178.86, and RevPAR was $125.10. Market segmentation for the Hampton Roads lodging market is 46% leisure, 39% commercial, and 15% meeting and group, which is consistent with the subject properties (40%, 35% and 25%, respectively, for the Hilton Virginia Beach Oceanfront property and 45%, 40%, and 15%, respectively, for the Hilton Garden Inn Virginia Beach Oceanfront property). Leisure demand is driven largely by the beaches and cultural attractions, commercial demand is driven by the government and government-related contractors, and meeting and group demand comes from a variety of sources.
| Historical Occupancy, ADR, RevPAR | |||||||||
| Competitive Set(1) | Hilton Virginia Beach Oceanfront2) | Penetration Factor(3) | |||||||
| Year | Occupancy | ADR | RevPAR | Occupancy | ADR | RevPAR | Occupancy | ADR | RevPAR |
TTM 6/30/2016 TTM | 65.8% | $162.73 | $107.03 | 72.7% | $214.48 | $155.84 | 110.5% | 131.8% | 145.6% |
| TTM 6/30/2017 TTM | 67.3% | $164.08 | $110.49 | 76.0% | $213.70 | $162.45 | 112.9% | 130.2% | 147.0% |
| TTM 6/30/2018 TTM | 68.2% | $161.92 | $110.41 | 75.7%(4) | $214.32(4) | $162.27(4) | 111.0% | 132.4% | 147.0% |
(1) | Data provided by a third party research report.The competitive set contains the following properties:Holiday Inn Virginia Beach Oceanside 21st Street, Sheraton Virginia Beach Oceanfront Hotel, Hampton Inn Virginia Beach Oceanfront North, Ramada Virginia Beach Oceanfront, Holiday Inn Express & Suites Virginia Beach Surfside, Courtyard Virginia Beach Oceanfront South, and Courtyard Virginia Beach Oceanfront North 37th Street. |
| (2) | Based on information obtained from the borrower. |
| (3) | Penetration Factor is calculated based on data provided by a third party research report for the competitive set and information obtained from the borrower for the Hilton Virginia Beach Oceanfront property. |
| (4) | For the Hilton Virginia Beach Oceanfront property, TTM 5/31/2018 data is used. |
| Historical Occupancy, ADR, RevPAR | |||||||||
| Competitive Set(1) | Hilton Garden Inn Virginia Beach Oceanfront(2) | Penetration Factor(3) | |||||||
| Year | Occupancy | ADR | RevPAR | Occupancy | ADR | RevPAR | Occupancy | ADR | RevPAR |
| TTM 6/30/2016 | 61.6% | $172.54 | $106.30 | 74.1% | $191.52 | $141.91 | 120.3% | 111.0% | 133.5% |
| TTM 6/30/2017 | 63.4% | $171.84 | $108.93 | 79.9% | $192.10 | $153.56 | 126.1% | 111.8% | 141.0% |
TTM 6/30/2018
| 63.7% | $169.82 | $108.13 | 76.6%(4) | $192.19(4) | $147.16(4) | 120.3% | 113.2% | 136.1% |
| (1) | Data provided by a third party research report. The competitive set contains the following properties:Holiday Inn & Suites Virginia Beach North Beach, Holiday Inn Virginia Beach Oceanside 21st Street, Sheraton Virginia Beach Oceanfront Hotel, Hampton Inn Virginia Beach Oceanfront North, Wyndham Virginia Beach, Courtyard Virginia Beach Oceanfront North 37th Street, Springhill Suites Virginia Beach Oceanfront, and Hampton Inn Virginia Beach Oceanfront South. |
| (2) | Based on information obtained from the borrower. |
| (3) | Penetration Factor is calculated based on data provided by a third party research report for the competitive set and information obtained from the borrower for the Hilton Garden Inn Virginia Beach Oceanfront property. |
| (4) | For the Hilton Garden Inn Virginia Beach Oceanfront property, TTM 5/31/2018 data is used. |
THE INFORMATION IN THIS STRUCTURAL AND COLLATERAL TERM SHEET IS NOT COMPLETE AND MAY BE AMENDED PRIOR TO THE TIME OF SALE. THIS TERM SHEET IS NOT AN OFFER TO SELL THESE SECURITIES AND IT IS NOT A SOLICITATION OF AN OFFER TO BUY THESE SECURITIES IN ANY JURISDICTION WHERE THE OFFER OR SALE IS NOT PERMITTED.
| | 132 | |
| Structural and Collateral Term Sheet | BBCMS 2018-C2 | |
| Virginia Beach Hotel Portfolio | ||
| Operating History and Underwritten Net Cash Flow | |||||||
| 2015 | 2016 | 2017 | TTM 5/31/2018 | Underwritten | Per Room(1) | % of Total Revenue(2) | |
| Occupancy | 71.5% | 75.5% | 76.8% | 76.0% | 73.1% | ||
| ADR | $206.24 | $206.83 | $204.58 | $206.21 | $206.21 | ||
| RevPAR | $147.45 | $147.45 | $155.44 | $156.51 | $150.44 | ||
| Room Revenue | $24,541,676 | $26,010,775 | $25,870,802 | $25,039,015 | $25,039,015 | $54,910 | 83.1% |
| Food & Beverage Revenue(3) | 3,325,000 | 3,325,000 | 3,325,000 | 3,325,000 | 3,325,000 | 7,292 | 11.0 |
| Other Departmental Revenue(4) | 1,687,647 | 1,703,206 | 1,721,681 | 1,702,584 | 1,749,577 | 3,837 | 5.8 |
| Total Revenue | $29,554,323 | $31,038,981 | $30,917,483 | $30,066,599 | $30,113,592 | $66,039 | 100.0% |
| Room Expense | $5,864,411 | $5,893,190 | $5,860,377 | $5,774,234 | $5,774,234 | $12,663 | 23.1% |
| Food & Beverage Expense(5) | 278,916 | 273,685 | 266,633 | 257,105 | 257,105 | 564 | 7.7 |
| Other Departmental Expenses | 1,123,543 | 1,106,197 | 1,027,061 | 1,056,956 | 1,056,956 | 2,318 | 60.4 |
| Departmental Expenses | $7,266,870 | $7,273,072 | $7,154,071 | $7,088,295 | $7,088,295 | $15,555 | 23.5% |
| Departmental Profit | $22,287,453 | $23,765,909 | $23,763,412 | $22,978,304 | $23,025,297 | $50,494 | 76.5% |
| Operating Expenses(6) | $9,252,195 | $9,576,837 | $9,513,721 | $9,360,639 | $9,832,133 | $21,562 | 32.7% |
| Gross Operating Profit | $13,035,258 | $14,189,072 | $14,249,691 | $13,617,665 | $13,193,164 | $28,932 | 43.8% |
| Property Taxes | $914,747 | $945,997 | $979,040 | $1,004,374 | $1,060,382 | $2,325 | 3.5% |
| Property Insurance | 778,943 | 958,448 | 761,104 | 772,211 | 343,705 | 754 | 1.1 |
| Total Other Expenses | $1,693,690 | $1,904,445 | $1,740,144 | $1,776,585 | $1,404,087 | $3,079 | 4.7% |
| Net Operating Income | $11,341,568 | $12,284,627 | $12,509,547 | $11,841,080 | $11,789,077 | $25,853 | 39.1% |
| FF&E | 0 | 0 | 0 | 0 | 1,204,544 | 2,642 | 4.0 |
| Net Cash Flow | $11,341,568 | $12,284,627 | $12,509,547 | $11,841,080 | $10,584,533 | $23,212 | 35.1% |
| (1) | Per Room values are based on 456 guest rooms. |
| (2) | % of Total Revenue for Room Expense, Food & Beverage Expense and Other Departmental Expenses are based on their corresponding revenue line item. |
| (3) | The F&B revenues have been normalized to reflect the new borrower-affiliated F&B lease that commenced at loan closing. At loan origination, the borrower leased out all F&B operations of the restaurants in the portfolio to Shamin-TLV Inc., an affiliate of the borrower. The rent will be $3,325,000 for a 15-year term with 10.0% rent steps every five years. The lease has no termination options. |
| (4) | Other revenue includes telephone revenue, parking, and retail income. |
| (5) | The F&B expense represents the utilities and licenses that will remain in expense for each property with the new lease. |
| (6) | Operating Expenses include a management fee of 3.0% of total revenue. |
The Borrowers. The borrowing entities for the Virginia Beach Hotel Portfolio Whole Loan are 3001 Atlantic, LLC and 3315 Atlantic, LLC, Virginia limited liability companies and special purpose entities with two independent directors. Legal counsel to the borrower delivered a non-consolidation opinion in connection with the origination of the Virginia Beach Hotel Portfolio Whole Loan. Neil P. Amin and Jay B. Shah are the guarantors of certain nonrecourse carve-outs under the Virginia Beach Hotel Portfolio Whole Loan.
The Loan Sponsors.The loan sponsors areNeil P. Amin and Jay B. Shah.Neil P. Amin is the CEO of Shamin Hotels and Jay B. Shah serves as Vice President. Founded in 1979, Shamin Hotels is the largest hotel management company in Virginia. It owns and manages 56 properties with more than 7,000 rooms and over 100,000 square feet of meeting and banquet space. Managed brands include Hilton, Marriott, Intercontinental Hotels, and Hyatt. Shamin Hotels is headquartered in Virginia, but has expanded nationally, operating hotels in Virginia, Maryland, New York, Colorado, Florida, and North Carolina.Shamin Hotels has received numerous awards and recognitions including the Developer of the Year from Intercontinental Hotels Group and the Multi-Brand Developer of the Year, New Build/Adaptive Reuse of the Year, and the Lifetime Achievement Award from Hilton Hotels. The borrower sponsors disclosed three previous loan modifications.
Property Management.The property is managed by Shamin Hotels, Inc., an affiliate of the borrower.
Franchise Agreements. The properties have franchise agreements with Hilton Franchise Holding LLC, a Delaware limited liability company. Both of the current franchise agreements are effective as of August 31, 2018 for terms of 20 years, with expiration dates of August 31, 2038.
THE INFORMATION IN THIS STRUCTURAL AND COLLATERAL TERM SHEET IS NOT COMPLETE AND MAY BE AMENDED PRIOR TO THE TIME OF SALE. THIS TERM SHEET IS NOT AN OFFER TO SELL THESE SECURITIES AND IT IS NOT A SOLICITATION OF AN OFFER TO BUY THESE SECURITIES IN ANY JURISDICTION WHERE THE OFFER OR SALE IS NOT PERMITTED.
| | 133 | |
| Structural and Collateral Term Sheet | BBCMS 2018-C2 | |
| Virginia Beach Hotel Portfolio | ||
Escrows and Reserves.At origination, the borrower deposited into escrow approximately $326,006 for real estate taxes and approximately $741,954 for estimated expenses related to remaining planned PIP renovations for the Hilton Garden Inn Virginia Beach Oceanfront property. This amount represents 50.0% of the engineer’s updated estimated cost of the remaining PIP work. The balance of the remaining PIP will be funded by the monthly PIP reserve.
Tax Escrows –On a monthly basis, the borrower is required to escrow 1/12th of the annual estimated tax payments, which currently equates to approximately $81,502.
Insurance Escrows–On a monthly basis, the borrower is required to escrow 1/12th of the annual estimated insurance payments, which currently equates to approximately $28,642.
FF&E Reserves– On a monthly basis, the borrower is required to deposit an amount equal to the 1/12th of 5.0% of projected annual gross revenues from operations at the property from the commencement date until the PIP is completed and 1/12th of 4.0% of the projected annual gross revenues from operations thereafter up to a cap of 36 months’ worth of monthly deposits.
Retail and Parking Reserve– Upon the occurrence of a Low DSCR Cash Sweep Period (as defined below) or a Franchise Trigger Period (as defined below), the borrower will be required to make a monthly deposit of 1/12th of the applicable rent that the Lender estimates will be payable during the next ensuing twelve months in order to accumulate sufficient funds to pay the retail and parking lease rents at least 30 days prior to their respective due dates.
Lockbox / Cash Management.The loan is structured with a springing lockbox and springing cash management. During the continuance of a Trigger Period (as defined below), the borrower will be required to deposit, or cause to be deposited, into the lockbox account all gross income from operations, all forfeited security deposits, and all other revenue of any kind from the Virginia Beach Hotel Portfolio Properties received by the borrowers or manager. All funds on deposit in the lockbox account are then required to be disbursed immediately preceding each payment date in accordance with the loan documents, with all excess cash flow to be deposited to an excess cash reserve to be held as additional security for the Virginia Beach Hotel Portfolio Whole Loan.
A “Trigger Period” means (i) the occurrence of an event of default, (ii) the debt service coverage ratio based on the calendar quarter preceding the date of determination is less than 1.15x, or (iii) the earliest to occur of (a) lender’s reasonable determination that the borrowers have failed to complete all work under the PIP within the reasonable time required under such PIP (as may be extended by or with the consent of Hilton Franchise Holding LLC) or (b) the expiration or termination of the franchise agreement at any time while any portion of the debt remains outstanding (a “Franchise Trigger Period”).
A “Low DSCR Cash Sweep Period” means any period commencing on the last day of the second consecutive calendar quarter preceding the date of determination for which the debt service coverage ratio is less than 1.15x.
Subordinate and Mezzanine Debt. None.
Partial Release.Not Permitted.
Leasehold Interest.At the Hilton Virginia Beach Oceanfront property, the borrower has a leasehold interest in a portion of the garage consisting of 380 parking garage spaces. The leased fee holder of the garage is the City of Virginia Beach Development Authority. Rent under the parking lease currently consists of an approximately $222,000 annual payment plus special rent (fixed at $10,538 per year expiring in 2025), and additional rent. Additional rent is calculated as 2.0% applied to the difference between the current year room revenue less the room revenue in 2014, capped at $50,000. The lease expires on June 30, 2070. Additionally, the borrower has also entered into a lease for the ground floor retail portion of the parking garage, which provides approximately 26,000 square feet of commercial space to the borrower as well as an additional 58 parking spaces for exclusive retail use. The annual lease expense is $378,930 with the lease term expiring on June 30, 2030.
At the Hilton Garden Inn Virginia Beach Oceanfront, the borrower has a leasehold interest in an off-site parking garage where the borrower leases 168 spaces from 34th Street Garage, LLC. Annual rent under the lease equals $1.00 plus apro rata share of all expenses paid or incurred by the lessor and operation and preservation of the property and parking facilities. The lease expires in May 2105.
THE INFORMATION IN THIS STRUCTURAL AND COLLATERAL TERM SHEET IS NOT COMPLETE AND MAY BE AMENDED PRIOR TO THE TIME OF SALE. THIS TERM SHEET IS NOT AN OFFER TO SELL THESE SECURITIES AND IT IS NOT A SOLICITATION OF AN OFFER TO BUY THESE SECURITIES IN ANY JURISDICTION WHERE THE OFFER OR SALE IS NOT PERMITTED.
| | 134 | |
| Structural and Collateral Term Sheet | BBCMS 2018-C2 |
[THIS PAGE INTENTIONALLY LEFT BLANK]
THE INFORMATION IN THIS STRUCTURAL AND COLLATERAL TERM SHEET IS NOT COMPLETE AND MAY BE AMENDED PRIOR TO THE TIME OF SALE. THIS TERM SHEET IS NOT AN OFFER TO SELL THESE SECURITIES AND IT IS NOT A SOLICITATION OF AN OFFER TO BUY THESE SECURITIES IN ANY JURISDICTION WHERE THE OFFER OR SALE IS NOT PERMITTED.
| | 135 | |
| Structural and Collateral Term Sheet | BBCMS 2018-C2 | |
| Moffett Towers – Buildings E,F,G | ||
| Mortgage Loan Information | Property Information | |||
| Mortgage Loan Seller(1): | CCRE | Single Asset / Portfolio: | Single Asset | |
| Credit Assessment (Fitch/DBRS): | BBB- / BBB(low) | Title: | Fee | |
| Original Principal Balance(2): | $25,000,000 | Property Type – Subtype: | Office ‒ CBD | |
| Cut-off Date Principal Balance(2): | $25,000,000 | Net Rentable Area (SF): | 676,598 | |
| % of IPB: | 2.8% | Location: | Sunnyvale, CA | |
| Loan Purpose: | Refinance | Year Built / Renovated: | 2009 / 2011-2012 | |
| Borrower(3): | MT3 EFG Real Estate LLC | Occupancy: | 100.0% | |
| Sponsor(4): | Joseph K. Paul | Occupancy Date: | 9/7/2018 | |
| Interest Rate: | 4.13098592% | 4thMost Recent NOI (As of): | $24,367,752 (12/31/2015) | |
| Note Date: | 9/7/2018 | 3rdMost Recent NOI (As of): | $24,977,236 (12/31/2016) | |
| Maturity Date: | 10/6/2028 | 2ndMost Recent NOI (As of): | $24,953,252 (12/31/2017) | |
| Interest-only Period: | 120 months | Most Recent NOI (As of): | $25,168,813 (TTM 5/31/2018) | |
| Original Term: | 120 months | UW Economic Occupancy: | 95.0% | |
| Original Amortization Term: | None | UW Revenues: | $44,603,641 | |
| Amortization Type: | Interest Only | UW Expenses: | $8,747,532 | |
| Call Protection(5): | L(24),Grtr1%orYM(2),Defor | UW NOI: | $35,856,109 | |
| Grtr1%orYM(87),O(7) | UW NCF: | $35,309,093 | ||
| Lockbox / Cash Management: | Hard / In Place | Appraised Value / Per SF(7): | $705,800,000 / $1,043 | |
| Additional Debt(2)(6): | $259,000,000 / $216,000,000 | Appraisal Date: | 11/15/2019 | |
| Additional Debt Type: | Pari Passu / Mezzanine Loan | |||
| Escrows and Reserves | Financial Information(10) | |||||||
| Initial | Monthly | Initial Cap | A-Notes | Total Debt | ||||
| Taxes: | $1,772,695 | $253,242 | N/A | Cut-off Date Loan / SF: | $420 | $739 | ||
| Insurance(8): | $0 | Springing | N/A | Maturity Date Loan / SF: | $420 | $739 | ||
| Replacement Reserves: | $0 | $11,277 | N/A | Cut-off Date LTV(7): | 40.2% | 70.8% | ||
| TI/LC: | $23,914,655 | $0 | N/A | Maturity Date LTV(7): | 40.2% | 70.8% | ||
| Other(9): | $15,021,721 | Springing | $20,297,940 | UW NCF DSCR: | 2.97x | 1.41x | ||
| UW NOI Debt Yield: | 12.6% | 7.2% | ||||||
| Sources and Uses | ||||||
| Sources | Proceeds | % of Total | Uses | Proceeds | % of Total | |
| Whole Loan(2) | $284,000,000 | 56.8% | Existing Debt | $321,129,945 | 64.2% | |
| Mezzanine Loans(6) | 216,000,000 | 43.2 | Return of Equity | 130,975,725 | 26.2 | |
| Upfront Reserves | 40,709,070 | 8.1 | ||||
| Closing Costs | 7,185,260 | 1.4 | ||||
| Total Sources | $500,000,000 | 100.0% | Total Uses | $500,000,000 | 100.0% | |
| (1) | The Moffett Towers – Buildings E,F,G Whole Loan (as defined below) was co-originated by Deutsche Bank AG, New York Branch (“DBNY”), Goldman Sachs Mortgage Company (“GSMC”) and Wells Fargo Bank, National Association (“WFBNA”). CCRE purchased Note A-2-2 from DBNY (or an affiliate) prior to the date hereof. |
| (2) | The Cut-off Date Balance of $25.0 million represents the non-controlling Note A-2-2 (the “Moffett Towers – Buildings E,F,G Loan”), which together with the remainingpari passu notes, comprise a $284.0 million whole loan (the “Moffett Towers – Buildings E,F,G Whole Loan”). |
| (3) | The borrower is affiliated with the borrower of the Moffett Towers II – Building 1 Ioan, which has an original principal balance of $22,000,000 (representing 2.5% of the initial pool balance) and is part of a whole loan with an original principal balance of $168,000,000. |
| (4) | The non-recourse guarantor is Paul Guarantor LLC, a Delaware limited liability company |
| (5) | The lockout period will be at least 24 payments beginning with and including the first payment date of November 6, 2018. The borrower is also permitted to prepay the Moffett Towers – Building E,F,G Whole Loan on or after the payment date in November 2020 with a payment of a yield maintenance premium. Defeasance of the full $284.0 million Moffett Towers – Building E,F,G Whole Loan is permitted after the earlier to occur of (i) two years after the closing date of the securitization that includes the lastpari passu companion loan to be securitized and (ii) September 7, 2021. |
| (6) | Concurrent with the Moffett Towers – Buildings E,F,G Whole Loan, DBNY, WFBNA and GSMC funded a $150.0 million Mezzanine A loan (the “Moffett Towers – Buildings E,F,G Mezzanine A Loan”) to MT Lot 3 EFG LLC (the “Moffett Towers – Buildings E,F,G Mezzanine A Borrower”), and a $66.0 million Mezzanine B loan |
THE INFORMATION IN THIS STRUCTURAL AND COLLATERAL TERM SHEET IS NOT COMPLETE AND MAY BE AMENDED PRIOR TO THE TIME OF SALE. THIS TERM SHEET IS NOT AN OFFER TO SELL THESE SECURITIES AND IT IS NOT A SOLICITATION OF AN OFFER TO BUY THESE SECURITIES IN ANY JURISDICTION WHERE THE OFFER OR SALE IS NOT PERMITTED.
| | 136 | |
| Structural and Collateral Term Sheet | BBCMS 2018-C2 | |
| Moffett Towers – Buildings E,F,G | ||
| (“Moffett Towers – Buildings E,F,G Mezzanine B Loan”, and together with the Moffett Towers – Building E,F,G Mezzanine A Loan, the “Moffett Towers – Buildings E,F,G Mezzanine Loan”) to MT Lot 3 EFG Mezzanine LLC (the “Moffett Towers - Buildings E,F,G Mezzanine B Borrower”) both Delaware limited liability companies. The Moffett Towers – Buildings E,F,G Mezzanine A Loan accrues interest at a rate of 5.67000%per annum and requires interest-only payments through the maturity date of October 6, 2028. The Moffett Towers – Buildings E,F,G Mezzanine B Loan accrues interest at a rate of 6.80000%per annum and requires interest-only payments through the maturity date of October 6, 2028. The Mezzanine A Loan and the Mezzanine B Loan are expected to be sold to third parties. The rights of the lender of the Moffett Towers — Buildings E,F,G Mezzanine Loan are further described under “Description of the Mortgage Pool—Additional Indebtedness—Mezzanine Indebtedness” in the Preliminary Prospectus. |
| (7) | The Appraised Value reflects a “prospective market value upon stabilization” which assumes that HP vacates its space from September 2018 through March 2023, in phases. The Cut-off Date LTV and the Maturity LTV are calculated based upon the Appraised Value of $705,800,000. The “as-is” appraised value is $646,700,000 as of July 30, 2018 equating to a Cut-off Date LTV and Maturity LTV of 43.9% and 43.9%, respectively, for the Moffett Towers – Buildings E,F,G Whole Loan balance of $284.0 million, and a Cut-off Date LTV and Maturity LTV of 77.3% and 77.3%, respectively, for the total debt balance of $500.0 million. In addition, the appraiser concluded a “hypothetical go dark” appraised value of $504,200,000 as of July 30, 2018, equating to a Cut-off Date LTV and Maturity LTV of 56.3% and 56.3%, respectively, for the Moffett Towers – Buildings E,F,G Whole Loan and a Cut-off Date LTV and Maturity LTV of 99.2% and 99.2%, respectively, for the total debt. See “Description of the Mortgage Pool—Tenant Issues—Lease Expirations and Terminations—Other”. |
| (8) | Insurance escrows are waived so long as the Moffett Towers – Buildings E,F,G property is covered by an acceptable blanket insurance policy (which is currently maintained). If such condition is no longer satisfied, on each monthly payment date, the borrower will be required to fund an insurance reserve equal to 1/12th of the amount that the lender estimates will be necessary to pay the annual insurance premiums. |
| (9) | Other reserves consist of the following upfront and ongoing reserves. At loan origination, the borrower deposited $15,021,721 for outstanding rent concessions due under the Amazon lease. This reserve is inclusive of both free rent and gap rent. The rent concession reserve will be drawn down from October 2018 to September 2023. On each monthly payment date during the continuance of a lease sweep period, but only until the aggregate lease sweep funds transferred in the lease sweep account during the lease sweep in question (inclusive of the initial lease termination payment application made into the lease sweep account with respect to such lease sweep period) equals the applicable threshold, the borrower will pay to the lender, (i) a required minimum monthly lease sweep deposit amount and (ii) available cash. If, during a lease sweep period, the aggregate lease sweep funds transferred into the lease sweep account during the lease sweep period in question equals the applicable threshold, then on each monthly payment date during such ease sweep period, all required minimum monthly lease sweep deposit amounts and available cash (or such required minimum monthly lease sweep deposit amounts or other amounts required to be deposited) will be deposited into the debt service reserve account. |
| (10) | The financial information presented for the A-Notes in the chart above is calculated based on the aggregate outstanding principal balance as of the Cut-off Date of the Moffett Towers – Buildings E, F, G Whole Loan. The financial information presented for the Total Debt in the chart above is calculated based on the aggregate outstanding principal balance as of the Cut-off Date of the Moffett Towers – Buildings E, F, G Whole Loan and the Moffett Towers – Buildings E,F,G Mezzanine Loan. |
The Loan.The Moffett Towers – Buildings E,F,G Whole Loan is secured by the borrower’s fee interest in a Class A office building leased to a wholly-owned subsidiary of Amazon.com, Inc. (“Amazon”) located in Sunnyvale, California (the “Moffett Towers – Buildings E,F,G Property”). The loan has a 10-year term and is interest-only for the full term of the loan. The borrower, MT3 EFG Real Estate LLC, is a single purpose Delaware limited liability company and structured to be a bankruptcy-remote entity with two independent directors in its organization structure. The borrower sponsor is Joseph K. Paul, founder of The Jay Paul Company, a privately held real estate firm based in San Francisco, California.
The Moffett Towers – Buildings E,F,G Loan is evidenced by the non-controlling Note A-2-2, with an aggregate Original Balance and Cut-off Date Balance of $25.0 million. The Moffett Towers – Buildings E,F,G Loan is part of a whole loan with an Original Principal and Cut-off Date Balance of $284.0 million, which is evidenced by 11pari passu notes, each as described below. Only the Moffett Towers – Buildings E,F,G Loan will be contributed to the BBCMS 2018-C2 Trust. The remaining notes are currently held by the parties described in the “Total Debt Summary” chart below and have been or are expected to be contributed to one or more securitization trusts.
| Total Debt Summary | |||
| Note | Original Balance | Note Holder | Controlling Piece |
| A-1-1, A-5 | $80,000,000 | DBGS 2018-C1 | Yes |
| A-1-2, A-1-3, A-4 | 50,400,000 | Benchmark 2018-B7 | No |
| A-1-4, A-3 | 46,800,000 | DBNY | No |
| A-2-1 | 25,000,000 | CGCMT 2018-C6 | No |
| A-2-2 | 25,000,000 | BBCMS 2018-C2 | No |
| A-6, A-7 | 56,800,000 | Wells Fargo Bank, National Association | No |
| Whole Loan | $284,000,000 | ||
| Mezzanine Loans | $216,000,000 | (1) | No |
| Total | $500,000,000 | ||
| (1) | The Mezzanine Loans are expected to be sold to third parties. |
The Property. The Moffett Towers – Buildings E,F,G Property is comprised of three, eight-story, Class A office buildings totaling 676,598 square feet in Sunnyvale, California. As of September 7, 2018, the Moffett Towers – Buildings E,F,G Property was 100.0% leased to a wholly-owned subsidiary of Amazon on a triple-net basis through June 2030 with respect to 452,106 square feet at Buildings F and G, and February 2024 with respect to 224,492 square feet at Building E, with two, seven-year extension options. Amazon serves as guarantor of the lease and, as of the origination date, has taken possession of the Moffett Towers – Buildings E,F,G Property other than the space Hewlett-Packard (“HP”) currently occupies and commenced the build out of its space. Outstanding rent
THE INFORMATION IN THIS STRUCTURAL AND COLLATERAL TERM SHEET IS NOT COMPLETE AND MAY BE AMENDED PRIOR TO THE TIME OF SALE. THIS TERM SHEET IS NOT AN OFFER TO SELL THESE SECURITIES AND IT IS NOT A SOLICITATION OF AN OFFER TO BUY THESE SECURITIES IN ANY JURISDICTION WHERE THE OFFER OR SALE IS NOT PERMITTED.
| | 137 | |
| Structural and Collateral Term Sheet | BBCMS 2018-C2 | |
| Moffett Towers – Buildings E,F,G | ||
concessions and tenant improvement allowances related to the Amazon lease were deposited into escrows by the borrower on the origination date.
The Moffett Towers – Buildings E,F,G Property was built in 2009. The Moffett Towers – Buildings E,F,G Property is a portion of a development known as Moffett Towers. Moffett Towers comprises Buildings A through G, consisting of seven, eight-story, CBD, class “A” office buildings collectively containing 1,985,577 square feet of net rentable area. The entire Moffett Towers Phase 2 development includes an additional, eight-story building containing 357,481 square feet of net rentable area that was completed in 2014. This building is known as Building D (1100 Enterprise Way) and is not part of the collateral. Also part of Moffett Towers is a one-story amenities building improved as café and fitness center containing 48,207 square feet, which is shared between all seven buildings.
The Market.The Moffett Towers – Buildings E,F,G Property is located in Moffett Park, in the northern portion of the Sunnyvale submarket within Silicon Valley. Moffett Park is a 519-acre area comprised of recently developed office spaces and research and development buildings. Notable high technology firms currently in Moffett Park include Google Inc., Hewlett-Packard, Juniper Networks, Lab126 (an Amazon subsidiary), Lockheed-Martin, Microsoft, Motorola, NetApp and Rambus. The Moffett Towers – Buildings E,F,G Property is just north of State Highway 237, which forms the southern border of the Moffett Park area and provides access from Interstate 680 and Interstate 280 to the northeast and U.S. Highway 101 in Sunnyvale to the southwest. U.S. Highway 101 runs northward through San Francisco and southward through San Jose, terminating in the city of Los Angeles. The Santa Clara County Transit System provides bus service county-wide with stops near the Moffett Towers - Buildings E,F,G Property. In addition, a Santa Clara Light Rail System station is located directly across the street from the Moffett Towers - Buildings E,F,G Property and services the surrounding residential communities.
According to the appraisal, overall vacancy in the Silicon Valley market and the Sunnyvale submarket was 9.8% and 3.5%, respectively, as of the first quarter of 2018. According to the appraisal, as of the first quarter of 2018, new supply under construction in Silicon Valley stood at approximately 3.2 million square feet, which consisted of approximately 0.7 million square feet of build-to-suit construction and 2.6 million square feet of speculative space. As of first quarter of 2018, the total office annual average asking rent for the Sunnyvale submarket was $69.36 per square foot, which is above the Silicon Valley total office annual average asking rent of $55.20 per square foot. Within the Sunnyvale submarket, the annual average asking rent for Class A office properties is $81.36 per square foot (fully-serviced).
| Tenant Summary(1) | |||||||
| Tenant | Ratings(2) Moody’s/S&P/Fitch | Net Rentable Area (SF) | % of Total NRA | Base Rent PSF(3) | Base Rent | % of Total Base Rent | Lease Expiration Date |
| Amazon / Building E | A+/Baa1/AA- | 224,492 | 33.2% | $41.73 | $9,368,919 | 28.5% | 2/28/2024 |
| Amazon / Building F(4)(5)(6) | A+/Baa1/AA- | 224,492 | 33.2 | $53.77 | 12,070,037 | 36.7 | 6/30/2030 |
| Amazon / Building G(6)(7) | A+/Baa1/AA- | 227,614 | 33.6 | $50.19 | 11,423,087 | 34.8 | 6/30/2030 |
| Sole Tenant | 676,598 | 100.0% | $48.57 | $32,862,043 | 100.0% | ||
| Collateral Total | 676,598 | 100.0% | |||||
| (1) | Based on the underwritten rent roll. |
| (2) | Certain ratings are those of the parent company whether or not the parent guarantees the lease. |
| (3) | Excludes $4,389,651 ($6.49 per square foot) of straight-lined rent that was underwritten. See “Cash Flow Analysis” below. |
| (4) | HP occupies Building F until March 31, 2019. All of the TI/LC, free rent, and gap rent required under the executed Amazon lease for this space is held in a lender controlled reserve. Amazon is in a free rent period from May 2019 until October 2019 for Building F. |
| (5) | If the borrower fails to deliver Building F to Amazon in the required delivery condition on or before October 15, 2019 (as such date may be extended on a day-for day basis for tenant delays or up to four months and 15 days in the aggregate for force majeure delays), Amazon may terminate the lease for Building F, upon at least 30 days’ notice, only if the borrower does not deliver Building F to Amazon in the required delivery condition within such 30 days and then within 15 days of Amazon’s second written notice to terminate after the initial 30 days expires. In order to deliver Building F to Amazon in the required delivery condition, the borrower’s sole obligations are to ensure that Building F is free of tenants or occupants and any rights or claims of third parties under rights of first refusal, rights of first offer, or similar rights. |
| (6) | The free rent period for Building F (224,492 square feet) extends through October 2019 and through April 2019 for suite G100 (25,778 square feet). The free rent period for Building G extends through September 2023. |
| (7) | HP occupies the Building G lab (7,874 square feet) until March 31, 2023. All of the TI/LC, free rent, and gap rent required under the executed Amazon lease for this space is held in a lender controlled reserve. |
THE INFORMATION IN THIS STRUCTURAL AND COLLATERAL TERM SHEET IS NOT COMPLETE AND MAY BE AMENDED PRIOR TO THE TIME OF SALE. THIS TERM SHEET IS NOT AN OFFER TO SELL THESE SECURITIES AND IT IS NOT A SOLICITATION OF AN OFFER TO BUY THESE SECURITIES IN ANY JURISDICTION WHERE THE OFFER OR SALE IS NOT PERMITTED.
| | 138 | |
| Structural and Collateral Term Sheet | BBCMS 2018-C2 | |
| Moffett Towers – Buildings E,F,G | ||
| Lease Rollover Schedule(1)(2) | |||||||||
| Year | Number of Leases Expiring | Net Rentable Area Expiring | % of NRA Expiring | Base Rent Expiring | % of Base Rent Expiring | Cumulative Net Rentable Area Expiring | Cumulative % of NRA Expiring | Cumulative Base Rent Expiring | Cumulative % of Base Rent Expiring |
| Vacant | NAP | 0 | 0.0% | NAP | NAP | 0 | 0.0% | NAP | NAP |
| 2018 & MTM | 0 | 0 | 0.0 | $0 | 0.0% | 0 | 0.0% | $0 | 0.0% |
| 2019 | 0 | 0 | 0.0 | 0 | 0.0 | 0 | 0.0% | $0 | 0.0% |
| 2020 | 0 | 0 | 0.0 | 0 | 0.0 | 0 | 0.0% | $0 | 0.0% |
| 2021 | 0 | 0 | 0.0 | 0 | 0.0 | 0 | 0.0% | $0 | 0.0% |
| 2022 | 0 | 0 | 0.0 | 0 | 0.0 | 0 | 0.0% | $0 | 0.0% |
| 2023 | 0 | 0 | 0.0 | 0 | 0.0 | 0 | 0.0% | $0 | 0.0% |
| 2024 | 1 | 224,492 | 33.2 | 9,368,919 | 28.5 | 224,492 | 33.2% | $9,368,919 | 28.5% |
| 2025 | 0 | 0 | 0.0 | 0 | 0.0 | 224,492 | 33.2% | $9,368,919 | 28.5% |
| 2026 | 0 | 0 | 0.0 | 0 | 0.0 | 224,492 | 33.2% | $9,368,919 | 28.5% |
| 2027 | 0 | 0 | 0.0 | 0 | 0.0 | 224,492 | 33.2% | $9,368,919 | 28.5% |
| 2028 | 0 | 0 | 0.0 | 0 | 0.0 | 224,492 | 33.2% | $9,368,919 | 28.5% |
| 2029 & Beyond | 5 | 452,106 | 66.8 | 23,493,124 | 71.5 | 676,598 | 100.0% | $32,862,043 | 100.0% |
| Total | 6 | 676,598 | 100.0% | $32,862,043 | 100.0% | ||||
| (1) | Based on the underwritten rent roll. |
| (2) | If the borrower fails to deliver Building F to Amazon in the required delivery condition on or before October 15, 2019 (as such date may be extended on a day-for day basis for tenant delays or up to four months and 15 days in the aggregate for force majeure delays), Amazon may terminate the lease for Building F, upon at least 30 days’ notice, only if the borrower does not deliver Building F to Amazon in the required delivery condition within such 30 days and then within 15 days of Amazon’s second written notice to terminate after the initial 30 days expires. In order to deliver Building F to Amazon in the required delivery condition the borrower’s sole obligations are to ensure that Building F is free of tenants or occupants and any rights or claims of third parties under rights of first refusal, rights of first offer, or similar rights. |
THE INFORMATION IN THIS STRUCTURAL AND COLLATERAL TERM SHEET IS NOT COMPLETE AND MAY BE AMENDED PRIOR TO THE TIME OF SALE. THIS TERM SHEET IS NOT AN OFFER TO SELL THESE SECURITIES AND IT IS NOT A SOLICITATION OF AN OFFER TO BUY THESE SECURITIES IN ANY JURISDICTION WHERE THE OFFER OR SALE IS NOT PERMITTED.
| | 139 | |
| Structural and Collateral Term Sheet | BBCMS 2018-C2 | |
| Moffett Towers – Buildings E,F,G | ||
| Operating History and Underwritten Net Cash Flow(1) | |||||||
| 2015 | 2016 | 2017 | TTM(2) | Underwritten(2)(3) | Per Square Foot | %(4) | |
| Rents in Place | $24,343,756 | $24,880,050 | $24,897,611 | $24,995,672 | $32,862,043 | $48.57 | 70.1% |
| Credit Tenant Rent Step Credit(5) | 0 | 0 | 0 | 0 | 4,389,651 | 6.49 | 9.4 |
| Vacant Income | 0 | 0 | 0 | 0 | 0 | 0.00 | 0.0 |
| Gross Potential Rent | $24,343,756 | $24,880,050 | $24,897,611 | $24,995,672 | $37,251,694 | $55.06 | 79.4% |
| Total Reimbursements | 7,282,052 | 7,258,304 | 7,681,625 | 7,822,621 | 8,747,514 | 12.93 | 18.6 |
| Other Rental Income | 0 | 0 | 0 | 0 | 904,393 | 1.34 | 1.9 |
| Net Rental Income | $31,625,808 | $32,138,354 | $32,579,236 | $32,818,293 | $46,903,601 | $69.32 | 100.0% |
| (Vacancy/Credit Loss)(6) | 0 | 0 | 0 | 0 | (2,299,960) | (3.40) | (4.9) |
| Effective Gross Income | $31,625,808 | $32,138,354 | $32,579,236 | $32,818,293 | $44,603,641 | $65.92 | 95.1% |
| Total Expenses | $7,258,056 | $7,161,118 | $7,625,984 | $7,649,480 | $8,747,532 | $12.93 | 19.6% |
| Net Operating Income | $24,367,752 | $24,977,236 | $24,953,252 | $25,168,813 | $35,856,109 | $52.99 | 80.4% |
| Total TI/LC, Capex/RR(7) | 0 | 0 | 0 | 0 | 547,016 | 0.81 | 1.2 |
| Net Cash Flow | $24,367,752 | $24,977,236 | $24,953,252 | $25,168,813 | $35,309,093 | $52.19 | 79.2% |
| Occupancy(6) | 100.0% | 100.0% | 100.0% | 100.0% | 95.0% | ||
| (1) | Certain items such as interest expense, interest income, lease cancellation income, depreciation, amortization, debt service payments and any other non-recurring or non-operating items were excluded from the historical presentation and are not considered for the underwritten cash flow. |
| (2) | TTM reflects the trailing 12-month period ending May 31, 2018. |
| (3) | Underwritten Net Operating Income is higher than TTM Net Operating Income primarily because of new leases commencing in 2018 and beyond with the sole tenant, Amazon, to occupy the space currently occupied by HP. The new leases make up 63.8% of annual rent and 58.2% of net rental area. |
| (4) | Percentage column represents percent of Net Rental Income for all revenue lines and represents percent of Effective Gross Income for the remainder of fields. |
| (5) | Represents straight-lined rent through the maturity date of the Moffett Towers – Buildings E,F,G Whole Loan. |
| (6) | The Underwritten Vacancy is 5.0%. The Moffett Towers - Buildings E,F,G Property is 100.0% leased as of September 7, 2018. |
| (7) | Underwritten TI/LC is inclusive of a credit of $1,184,047, equal to 1/20th of the lease sweep and debt service reserve cap. This credit is netted out of the above TI/LC total. |
Partial Release.The borrower may obtain the release of a portion of the Moffett Towers – Buildings E,F,G Property in connection with a partial prepayment, subject to the satisfaction of conditions set forth in the related mortgage loan documents. See“Description of the Mortgage Pool—Certain Terms of the Mortgage Loans— Partial Releases”in the Preliminary Prospectus.
THE INFORMATION IN THIS STRUCTURAL AND COLLATERAL TERM SHEET IS NOT COMPLETE AND MAY BE AMENDED PRIOR TO THE TIME OF SALE. THIS TERM SHEET IS NOT AN OFFER TO SELL THESE SECURITIES AND IT IS NOT A SOLICITATION OF AN OFFER TO BUY THESE SECURITIES IN ANY JURISDICTION WHERE THE OFFER OR SALE IS NOT PERMITTED.
| | 140 | |
| Structural and Collateral Term Sheet | BBCMS 2018-C2 |
[THIS PAGE INTENTIONALLY LEFT BLANK]
THE INFORMATION IN THIS STRUCTURAL AND COLLATERAL TERM SHEET IS NOT COMPLETE AND MAY BE AMENDED PRIOR TO THE TIME OF SALE. THIS TERM SHEET IS NOT AN OFFER TO SELL THESE SECURITIES AND IT IS NOT A SOLICITATION OF AN OFFER TO BUY THESE SECURITIES IN ANY JURISDICTION WHERE THE OFFER OR SALE IS NOT PERMITTED.
| | 141 | |
| Structural and Collateral Term Sheet | BBCMS 2018-C2 | |
| Shelbourne Global Portfolio II | ||
| Mortgage Loan Information | Property Information | |||
| Mortgage Loan Seller: | CCRE | Single Asset / Portfolio: | Portfolio | |
| Original Principal Balance(1): | $25,000,000 | Title: | Fee | |
| Cut-off Date Principal Balance(1): | $25,000,000 | Property Type - Subtype: | Office/Industrial | |
| % of IPB: | 2.8% | Net Rentable Area (SF): | 676,538 | |
| Loan Purpose: | Refinance | Location: | Newark, DE | |
| Borrowers(2): | Various | Year Built / Renovated: | Various / N/A | |
| Sponsors: | Barry Friedman and Benjamin Schlossberg | Occupancy: | 93.2% | |
| Interest Rate: | 5.57800% | Occupancy Date: | 11/5/2018 | |
| Note Date: | 11/15/2018 | 4th Most Recent NOI (As of): | NAV | |
| Maturity Date: | 12/6/2028 | 3rd Most Recent NOI (As of): | NAV | |
| Interest-only Period: | 120 months | 2nd Most Recent NOI (As of): | $5,385,061 (12/31/2017) | |
| Original Term: | 120 months | Most Recent NOI (As of): | $5,740,659 (TTM 8/31/2018) | |
| Original Amortization Term: | None | UW Economic Occupancy: | 92.7% | |
| Amortization Type: | Interest Only | UW Revenues: | $10,439,667 | |
| Call Protection(3)(4): | L(24),Def(93),O(3) | UW Expenses: | $4,165,229 | |
| Lockbox / Cash Management: | Soft / Springing | UW NOI: | $6,274,437 | |
| Additional Debt(1): | Yes | UW NCF: | $5,889,451 | |
| Additional Debt Balance(1): | $30,000,000 | Appraised Value / Per SF: | $93,700,000 / $139 | |
| Additional Debt Type(1): | Pari Passu | Appraisal Date: | 10/12/2018 | |
| Escrows and Reserves | Financial Information(1) | |||||||||
| Initial | Monthly | Initial Cap | Cut-off Date Loan / SF: | $81 | ||||||
| Taxes: | $273,402 | $91,134 | N/A | Maturity Date Loan / SF: | $81 | |||||
| Insurance: | $41,067 | $9,676 | N/A | Cut-off Date LTV: | 58.7% | |||||
| Replacement Reserves: | $0 | $8,060 | N/A | Maturity Date LTV: | 58.7% | |||||
| TI/LC(5): | $3,000,000 | Springing | $2,500,000 | UW NCF DSCR: | 1.89x | |||||
| Other: | $244,300 | $0 | N/A | UW NOI Debt Yield: | 11.4% | |||||
| Sources and Uses | ||||||||||
| Sources | Proceeds | % of Total | Uses | Proceeds | % of Total | |||||
| Whole Loan | $55,000,000 | 100.0% | Payoff Existing Debt | $38,937,455 | 70.8% | |||||
| Return of Equity | 11,812,191 | 21.5 | ||||||||
| Upfront Reserves | 3,558,769 | 6.5 | ||||||||
| Closing Costs | 691,585 | 1.3 | ||||||||
| Total Sources | $55,000,000 | 100.0% | Total Uses | $55,000,000 | 100.0% | |||||
| (1) | The Shelbourne Global Portfolio II loan is part of a whole loan evidenced by sixpari passu senior notes with an aggregate original principal balance of $55.0 million. The Financial Information presented in the chart above reflects the Cut-off Date balance of the Shelbourne Global Portfolio II Whole Loan (as defined below). |
| (2) | The borrowers are SWC 100, LLC, SWC 200, LLC, SWC 300, LLC, SWC 400, LLC, SWC 500, LLC, SWC 600, LLC SWC 700, LLC and Shelbourne University LLC, each a single-purpose Delaware limited liability company structured to be bankruptcy remote with two independent directors. |
| (3) | The lockout period will be at least 24 payments beginning with and including the first payment date of January 6, 2019. Defeasance of the full $55.0 million Shelbourne Global Portfolio II Whole Loan is permitted after the date that is the earlier to occur of (i) two years from the closing date of the securitization that includes the last note to be securitized and (ii) January 6, 2023. |
| (4) | Following the lockout period, the borrowers are permitted to obtain the release of any property in connection with a partial defeasance, subject to certain conditions, including but not limited to delivery of the adjusted release amount in an amount equal to the greater of (i) 110.0% of the released property’s original allocated loan balance, (ii) an amount that results in a debt service coverage ratio equal to the greater of 1.60x and the debt service coverage ratio immediately prior to the release and (iii) an amount that results in a loan to value ratio equal to the lesser of 70.0% and the loan to value ratio immediately prior to the release. |
| (5) | The borrower deposited $3,000,000 for future tenant improvements and leasing commissions, with up to $1,142,952 of such funds being transferred to the Chase TI reserve. In the event that the balance of the TI/LC reserve account is less than $2,000,000, the borrower is required to make monthly deposits of $48,045, until such time the balance of the TI/LC is $2,500,000, which will only apply during any period in which (i) the mortgaged property is not less than 85.0% occupied by tenants that are in occupancy, open for business and paying rent under their applicable leases (after the expiration of any free rent or rent concession periods) and (ii) the debt service coverage ratio is not less than 1.50x. |
| (6) | Other reserve represents a free rent reserve of $17,050 and an immediate repairs reserve of $227,250. |
THE INFORMATION IN THIS STRUCTURAL AND COLLATERAL TERM SHEET IS NOT COMPLETE AND MAY BE AMENDED PRIOR TO THE TIME OF SALE. THIS TERM SHEET IS NOT AN OFFER TO SELL THESE SECURITIES AND IT IS NOT A SOLICITATION OF AN OFFER TO BUY THESE SECURITIES IN ANY JURISDICTION WHERE THE OFFER OR SALE IS NOT PERMITTED.
| | 142 | |
| Structural and Collateral Term Sheet | BBCMS 2018-C2 | |
| Shelbourne Global Portfolio II | ||
The Loan.The Shelbourne Global Portfolio II loan is part of a whole loan (the “Shelbourne Global Portfolio II Whole Loan”) evidenced by sixpari passu promissory notes with an aggregate original principal balance of $55,000,000. The Shelbourne Global Portfolio II Whole Loan is secured by a first lien mortgage encumbering the borrowers’ fee interest in two office and industrial properties totaling 676,538 square feet located in Newark, Delaware. Promissory Notes A-1 and A-3 with an aggregate original principal balance of $25,000,000 will be included in the BBCMS 2018-C2 Trust. The Shelbourne Global Portfolio II Whole Loan will be serviced pursuant to the pooling and servicing agreement for the BBCMS 2018-C2 Trust. The below table summarizes the remaining promissory notes, which are currently held by CCRE and are expected to be contributed to one or more future securitization transactions or may be otherwise transferred at any time.
| Whole Loan Summary | |||
| Note | Original Balance | Note Holder |
Controlling Piece |
| A-1 | $15,000,000 | BBCMS 2018-C2 | Yes |
| A-2 | 12,500,000 | CCRE | No |
| A-3 | 10,000,000 | BBCMS 2018-C2 | No |
| A-4 | 10,000,000 | CCRE | No |
| A-5 | 4,000,000 | CCRE | No |
| A-6 | 3,500,000 | CCRE | No |
| Total | $55,000,000 | ||
The non recourse carve-out guarantors and borrower sponsors of the Shelbourne Global Portfolio II Whole Loan are Barry Friedman and Benjamin Schlossberg, on a joint and several basis, each of which are principals of Shelbourne Global Solutions. A non-consolidation opinion was delivered in connection with the origination of the Shelbourne Global Portfolio II Whole Loan.
Shelbourne Global Solutions (“Shelbourne”) is a privately-held company, headquartered in New York City, which invests in and manages real estate related investments. Shelbourne has successfully partnered with institutional and privately held firms in a wide variety of transactions with a focus on single and multi-tenanted office and retail properties. Shelbourne has acquired more than 4.0 million square feet of office space & flex space across the country since early 2013 and has in excess of $500 million in assets.
The Properties. The Shelbourne Global Portfolio II properties are comprised of seven buildings, totaling 492,298 square feet, that make up the business park known as the White Clay Office Park and six office buildings, totaling 184,240 square feet that make up the business park known as University Office Plaza. Both of the Shelbourne Global Portfolio II properties are located in Newark, Delaware. Collectively, as of November 5, 2018, the Shelbourne Global Portfolio II properties are 93.2% occupied by more than 80 tenants including Chase, Citigroup, First Data, Sardo & Sons Warehousing and the State of Delaware.
The White Clay Office Park property consists of one, 125,000 square feet warehouse and six, one- to three-story office/industrial buildings that were constructed between 1983 and 1987. Investment grade rated tenants at the White Clay property include Chase (28.2% of NRA), Citigroup (13.1% of NRA), the State of Delaware (three tenants representing 8.8% of NRA) and Walgreens (2.1% of NRA), totaling approximately 52.1% of NRA at the Shelbourne Global Portfolio II properties. Tenants occupying approximately 468,633 SF (95.2% of NRA) have been tenants at the White Clay Center Property for ten years or more. As of November 5, 2018, the White Clay Center property was 95.2% occupied.
The University Office Plaza property consists of six office buildings, totaling 184,240 square feet, that were constructed between 1971 and 1983. Tenants occupying approximately 46,257 square feet (25.1% of NRA) have been tenants at the University Plaza Property for ten years or more. The State of Delaware (Department of Health and Human Services and Department of Health) together occupy approximately 19% of NRA (under two separate leases) with a remaining term of approximately ten and seven years, respectively. As of November 5, 2018, the University Plaza property was 87.8% occupied.
The top three tenants at the Shelbourne Global Portfolio II property are Chase Bank USA, Sardo & Sons Warehousing and Citigroup.
Chase Bank USA (“Chase”) (rated AA-/A2/A- by Fitch/Moody’s/S&P) provides financial services, which includes consumer and commercial banking. Chase uses their space at the White Clay property for the servicing of their Sapphire Card, as well as for loan processing groups, market risk reporting, accounting, trade support and other operations group. Chase has been a tenant at the White Clay Office Park Property since 1984. They have a current lease expiration of July 31, 2023 with two, three-year renewal options. Pursuant to the terms of its lease, Chase may terminate its lease on July 31, 2021 or July 31, 2022, so long as they provide one year’s notice along with a termination fee of unamortized TI/LCs, among other things.
THE INFORMATION IN THIS STRUCTURAL AND COLLATERAL TERM SHEET IS NOT COMPLETE AND MAY BE AMENDED PRIOR TO THE TIME OF SALE. THIS TERM SHEET IS NOT AN OFFER TO SELL THESE SECURITIES AND IT IS NOT A SOLICITATION OF AN OFFER TO BUY THESE SECURITIES IN ANY JURISDICTION WHERE THE OFFER OR SALE IS NOT PERMITTED.
| | 143 | |
| Structural and Collateral Term Sheet | BBCMS 2018-C2 | |
| Shelbourne Global Portfolio II | ||
Sardo & Sons Warehousing (“Sardo & Sons”) is a full-service warehousing company, founded in 1966, that specializes in warehousing, transportation, packaging and re-packaging and consolidation for export. Sardo & Sons primarily utilizes their space at the White Clay Property for warehouse space and has been a tenant at the property since 2008. Sardo & Sons has a current lease expiration of April 30, 2021 with no renewal or termination options.
Citigroup (rated A/Baa1/BBB+ by Fitch/Moody’s/S&P) occupies a portion of two buildings at the White Clay Office Park property. It uses approximately 31,210 square feet for cash and trade processing and compliance teams. The remaining space is used in conjunction with the U.S. State Department. Citigroup has been a tenant at the White Clay Office Park Property since 2008. They have a current lease expiration of March 31, 2022 with one, seven-year renewal options and no termination options.
The Market.The Shelbourne Global Portfolio II properties are located in Newark, Delaware, approximately 12 miles southwest of Wilmington, Delaware. Interstate 95, the main interstate highway on the east coast of the United States, passes through the southern portion of the city. The University of Delaware is less than 1.5 miles from the White Clay Office Park property and 5.0 miles from the University Office Plaza property. The University of Delaware has approximately 19,000 undergraduates and has a direct partnership with Chase, the largest tenant at the Shelbourne Global Portfolio II properties, whereas Chase has an Innovation Learning Center on campus and recruits new employees directly from the University of Delaware.
The state of Delaware provides tax incentives to companies that operate and are incorporated in Delaware. Approximately 63.0% of Fortune 500 companies are incorporated in Delaware. The state does not tax the following items: no personal property tax, no corporate tax on interest or other investment income earned, no sales tax, no corporate income tax on goods & services, no inheritance tax, no value-added taxes and no stock transfer taxes.
According to the appraisal, the 2017 population and median household income within 3 and 5 miles of the Shelbourne Global Portfolio II properties were 75,905 individuals and $57,940 and 175,269 individuals and $65,159, respectively. Based on the suburban Wilmington office and New Castle County industrial markets, the appraiser concluded a blended vacancy rate of 6.6% for the Shelbourne Global Portfolio II properties.
| Top Ten Tenant Summary(1) | |||||||
| Tenant | Ratings(2) Moody’s/S&P/Fitch | Net Rentable Area (SF) | % of Total NRA | Base Rent PSF | Base Rent | % of Total Base Rent | Lease Expiration Date |
| Chase Bank USA(3) | A2 / A- / AA- | 190,492 | 28.2% | $9.53 | $1,815,389 | 22.5% | 7/31/2023 |
| Sardo & Sons Warehousing | NA / NA / NA | 125,000 | 18.5 | $4.25 | 531,250 | 6.6 | 4/30/2021 |
| Citigroup | Baa1 / BBB+ / A | 88,471 | 13.1 | $18.19 | 1,608,879 | 19.9 | 3/31/2022 |
| First Data Corporation(4) | B2 / BB- / BB- | 46,458 | 6.9 | $11.00 | 510,816 | 6.3 | 8/31/2022 |
| The State of DE – DAS(5) | Aaa / AAA / AAA | 24,803 | 3.7 | $24.24 | 601,235 | 7.4 | 12/31/2019 |
| State of DE Department of H&SS(5) | Aaa / AAA / AAA | 24,285 | 3.6 | $22.49 | 546,170 | 6.8 | 8/31/2028 |
| Walgreens Eastern Co, Inc. | Baa2 / BBB / BBB | 14,000 | 2.1 | $15.48 | 216,670 | 2.7 | 7/31/2020 |
| Department of Health & SS(5) | Aaa / AAA / AAA | 10,557 | 1.6 | $20.17 | 212,935 | 2.6 | 6/30/2025 |
| DE Sleep Disorder Centers(6) | NA / NA / NA | 6,485 | 1.0 | $18.00 | 116,730 | 1.4 | 12/31/2024 |
| Substation Engineering Co | NA / NA / NA | 6,101 | 0.9 | $20.75 | 126,596 | 1.6 | 2/28/2019 |
| Top Ten Tenants | 536,652 | 79.3% | $11.71 | $6,286,669 | 77.8% | ||
| Non Top Ten Tenants | 93,661 | 13.8% | $19.12 | $1,790,550 | 22.2% | ||
| Occupied Collateral Total | 630,313 | 93.2% | $12.81 | $8,077,220 | 100.0% | ||
| Vacant Space | 46,225 | 6.8% | |||||
| Collateral Total | 676,538 | 100.0% | |||||
| (1) | Based on the underwritten rent roll. |
| (2) | Ratings provided are for the parent company or government entity of the entity listed in the “Tenant” field whether or not the parent company guarantees the lease. |
| (3) | Chase Bank USA may terminate its lease on July 31, 2021 or July 31, 2022, so long as they provide one year’s notice along with a termination fee of unamortized TI/LCs, among other things. |
| (4) | First Data Corporation has a one-time option to terminate up to 15,331 square feet of its space, effective on July 1, 2020, with prior written notice no later than March 3, 2020. |
| (5) | In the event that the State of Delaware fails to provide specific appropriations to the applicable tenants, the tenant may terminate its lease at the commencement of the applicable fiscal year. |
| (6) | DE Sleep Disorder Centers may terminate its lease effective December 31, 2021 by providing written notice no later than March 3, 2021. |
THE INFORMATION IN THIS STRUCTURAL AND COLLATERAL TERM SHEET IS NOT COMPLETE AND MAY BE AMENDED PRIOR TO THE TIME OF SALE. THIS TERM SHEET IS NOT AN OFFER TO SELL THESE SECURITIES AND IT IS NOT A SOLICITATION OF AN OFFER TO BUY THESE SECURITIES IN ANY JURISDICTION WHERE THE OFFER OR SALE IS NOT PERMITTED.
| | 144 | |
| Structural and Collateral Term Sheet | BBCMS 2018-C2 | |
| Shelbourne Global Portfolio II | ||
| Lease Rollover Schedule(1) | |||||||||
| Year | Number of Leases Expiring | Net Rentable Area Expiring | % of NRA Expiring | Base Rent Expiring | % of Base Rent Expiring | Cumulative Net Rentable Area Expiring | Cumulative % of NRA Expiring | Cumulative Base Rent Expiring | Cumulative % of Base Rent Expiring |
| Vacant | NAP | 46,225 | 6.8% | NAP | NAP | 46,225 | 6.8% | NAP | NAP |
| 2018 & MTM | 3 | 1,042 | 0.2 | $20,907 | 0.3% | 47,267 | 7.0% | $20,907 | 0.3% |
| 2019 | 45 | 56,113 | 8.3 | 1,214,076 | 15.0 | 103,380 | 15.3% | $1,234,983 | 15.3% |
| 2020 | 10 | 27,931 | 4.1 | 504,880 | 6.3 | 131,311 | 19.4% | $1,739,863 | 21.5% |
| 2021 | 6 | 135,711 | 20.1 | 740,676 | 9.2 | 267,022 | 39.5% | $2,480,539 | 30.7% |
| 2022 | 12 | 151,852 | 22.4 | 2,440,209 | 30.2 | 418,874 | 61.9% | $4,920,748 | 60.9% |
| 2023 | 7 | 201,267 | 29.7 | 2,031,243 | 25.1 | 620,141 | 91.7% | $6,951,991 | 86.1% |
| 2024 | 3 | 7,448 | 1.1 | 137,476 | 1.7 | 627,589 | 92.8% | $7,089,467 | 87.8% |
| 2025 | 4 | 19,147 | 2.8 | 378,243 | 4.7 | 646,736 | 95.6% | $7,467,710 | 92.5% |
| 2026 | 1 | 3,167 | 0.5 | 63,340 | 0.8 | 649,903 | 96.1% | $7,531,050 | 93.2% |
| 2027 | 0 | 0 | 0.0 | 0 | 0.0 | 649,903 | 96.1% | $7,531,050 | 93.2% |
| 2028 | 2 | 24,285 | 3.6 | 546,170 | 6.8 | 674,188 | 99.7% | $8,077,220 | 100.0% |
| 2029 & Beyond | 2 | 2,350 | 0.3 | 0 | 0.0 | 676,538 | 100.0% | $8,077,220 | 100.0% |
| Total | 95 | 676,538 | 100.0% | $8,077,220 | 100.0% | ||||
| (1) | Based on the underwritten rent roll. |
| Operating History and Underwritten Net Cash Flow | |||||
| 2017 | TTM(1) | Underwritten | Per Square Foot | %(2) | |
| Rents in Place | $7,292,579 | $7,454,416 | $8,077,220 | $11.94 | 71.7% |
| Vacant Income | 0 | 0 | 702,258 | 1.04 | 6.2 |
| Gross Potential Rent(3) | $7,292,579 | $7,454,416 | $8,779,477 | $12.98 | 77.9% |
| Total Reimbursements | 2,110,324 | 2,401,615 | 2,484,255 | 3.67 | 22.0 |
| Other Income | 2,975 | 3,244 | 3,018 | 0.00 | 0.0 |
| Net Rental Income | $9,405,878 | $9,859,275 | $11,266,750 | $16.65 | 100.0% |
| (Vacancy/Credit Loss)(4) | 0 | 0 | (827,084) | (1.22) | (7.3) |
| Effective Gross Income | $9,405,878 | $9,859,275 | $10,439,667 | $15.43 | 92.7% |
| Total Expenses | $4,020,817 | $4,118,616 | $4,165,229 | $6.16 | 39.9% |
| Net Operating Income | $5,385,061 | $5,740,659 | $6,274,437 | $9.27 | 60.1% |
| Total TI/LC, Capex/RR | 0 | 0 | 384,986 | 0.57 | 3.7 |
| Net Cash Flow | $5,385,061 | $5,740,659 | $5,889,451 | $8.71 | 56.4% |
| Occupancy | 90.4% | 93.2% | 92.7% | ||
| (1) | TTM reflects the trailing twelve month period ending August 2018. |
| (2) | Percentage column represents percent of Net Rental Income for all revenue lines and represents percent of Effective Gross Income for the remainder of fields. |
| (3) | Underwritten Gross Potential Rent is based on the underwritten rent roll and includes (i) vacancy gross up of $702,258, (ii) rent steps through November 2019 of $137,939, and (iii) straight line rent of $86,293 associated with Citigroup. |
| (4) | Underwritten (Vacancy/Credit Loss) is based on economic vacancy of 7.3%. As of November 5, 2018, the Shelbourne Global Portfolio II properties were 93.2% leased. The appraiser concluded a blended vacancy rate of 6.6% for the Shelbourne Global Portfolio II properties. |
THE INFORMATION IN THIS STRUCTURAL AND COLLATERAL TERM SHEET IS NOT COMPLETE AND MAY BE AMENDED PRIOR TO THE TIME OF SALE. THIS TERM SHEET IS NOT AN OFFER TO SELL THESE SECURITIES AND IT IS NOT A SOLICITATION OF AN OFFER TO BUY THESE SECURITIES IN ANY JURISDICTION WHERE THE OFFER OR SALE IS NOT PERMITTED.
| | 145 | |
| Structural and Collateral Term Sheet | BBCMS 2018-C2 | |
| Shelbourne Global Portfolio II | ||
Future Mezzanine Debt.The Shelbourne Global Portfolio II Whole Loan permits future mezzanine debt in an aggregate amount not to exceed $7.0 million, provided, among other things, (i) no event of default has occurred or is continuing, (ii) based on the combined Shelbourne Global Portfolio II Whole Loan and the mezzanine debt (A) the loan-to-value ratio as determined under the loan documents is not greater than 66.2%, (B) the debt yield as determined under the loan documents is equal to or greater than 9.5%, and (C) the debt service coverage ratio as determined under the loan documents is equal to or greater than 1.55x, (iii) the mezzanine lender enters into an intercreditor agreement satisfactory to the lender in its reasonable discretion, (iv) lender’s approval of the mezzanine loan documents and (v) rating agency confirmation.
THE INFORMATION IN THIS STRUCTURAL AND COLLATERAL TERM SHEET IS NOT COMPLETE AND MAY BE AMENDED PRIOR TO THE TIME OF SALE. THIS TERM SHEET IS NOT AN OFFER TO SELL THESE SECURITIES AND IT IS NOT A SOLICITATION OF AN OFFER TO BUY THESE SECURITIES IN ANY JURISDICTION WHERE THE OFFER OR SALE IS NOT PERMITTED.
| | 146 | |
| Structural and Collateral Term Sheet | BBCMS 2018-C2 |
[THIS PAGE INTENTIONALLY LEFT BLANK]
THE INFORMATION IN THIS STRUCTURAL AND COLLATERAL TERM SHEET IS NOT COMPLETE AND MAY BE AMENDED PRIOR TO THE TIME OF SALE. THIS TERM SHEET IS NOT AN OFFER TO SELL THESE SECURITIES AND IT IS NOT A SOLICITATION OF AN OFFER TO BUY THESE SECURITIES IN ANY JURISDICTION WHERE THE OFFER OR SALE IS NOT PERMITTED.
| | 147 | |
| Structural and Collateral Term Sheet | BBCMS 2018-C2 | |
| Zenith Ridge | ||
| Mortgage Loan Information | Property Information | |||
| Mortgage Loan Seller: | SMC | Single Asset / Portfolio: | Single Asset | |
| Original Principal Balance(1): | $25,000,000 | Title: | Fee | |
| Cut-off Date Principal Balance(1): | $25,000,000 | Property Type - Subtype: | Office – Suburban | |
| % of IPB: | 2.8% | Net Rentable Area (SF): | 486,000 | |
| Loan Purpose: | Refinance | Location: | Canonsburg, PA | |
| Borrowers(2): | Various | Year Built / Renovated: | 2014, 2015, 2016 / N/A | |
| Sponsors(3): | Various | Occupancy(4): | 100.0% | |
| Interest Rate: | 4.70000% | Occupancy Date: | 7/11/2018 | |
| Note Date: | 7/13/2018 | 4thMost Recent NOI (As of)(5): | N/A | |
| Maturity Date: | 8/6/2028 | 3rd Most Recent NOI (As of)(5): | $7,657,108 (12/31/2016) | |
| Interest-only Period: | 60 months | 2nd Most Recent NOI (As of)(5): | $9,233,988 (12/31/2017) | |
| Original Term: | 120 months | Most Recent NOI (As of): | $9,371,083 (TTM 5/31/2018) | |
| Original Amortization Term: | 360 months | UW Economic Occupancy: | 95.0% | |
| Amortization Type: | IO-Balloon | UW Revenues: | $12,152,422 | |
| Call Protection: | L(28),Def(88),O(4) | UW Expenses: | $2,723,379 | |
| Lockbox / Cash Management: | Hard / Springing | UW NOI(5): | $9,429,044 | |
| Additional Debt: | Yes | UW NCF: | $8,627,144 | |
| Additional Debt Balance(1): | $65,000,000 | Appraised Value / Per SF: | $133,100,000 / $274 | |
| Additional Debt Type(1): | Pari Passu | Appraisal Date: | 6/25/2018 | |
| Escrows and Reserves | Financial Information(1) | |||||||||
| Initial | Monthly | Initial Cap | Cut-off Date Loan / SF: | $185 | ||||||
| Taxes: | $30,949 | $54,461 | N/A | Maturity Date Loan / SF: | $170 | |||||
| Insurance(6): | $0 | Springing | N/A | Cut-off Date LTV: | 67.6% | |||||
| Replacement Reserves: | $0 | $6,075 | N/A | Maturity Date LTV: | 62.1% | |||||
| TI/LC: | $0 | $60,750 | N/A | UW NCF DSCR: | 1.54x | |||||
| Other(7): | $2,335,949 | $0 | N/A | UW NOI Debt Yield: | 10.5% | |||||
| Sources and Uses | ||||||||||
| Sources | Proceeds | % of Total | Uses | Proceeds | % of Total | |||||
| Whole Loan(1) | $90,000,000 | 100.0% | Payoff Existing Debt | $78,785,911 | 87.5% | |||||
| Return of Equity | 7,317,560 | 8.1 | ||||||||
| Upfront Reserves | 2,366,898 | 2.6 | ||||||||
| Closing Costs | 1,529,631 | 1.7 | ||||||||
| Total Sources | $90,000,000 | 100.0% | Total Uses | $90,000,000 | 100.0% | |||||
| (1) | The Zenith Ridge mortgage loan is part of a whole loan evidenced by fivepari passu notes with an aggregate original principal balance of $90.0 million (the “Zenith Ridge Whole Loan”). The financial information presented in the chart above reflects the Cut-off Date balance of the $90.0 million Zenith Ridge Whole. |
| (2) | The borrowers under the Zenith Ridge Whole Loan are Quattro Investment Group, L.P., Quattro 2a, L.P. and Quattro 2b, L.P. |
| (3) | The sponsors under the Zenith Ridge Whole Loan are James D. Scalo, John F. Scalo, Charles R. Zappala and John J. Verbanac. |
| (4) | Occupancy includes 30,971 square feet (6.4% of net rentable area) of additional space that is leased by the largest tenant, Ansys, Inc. (“Ansys”), but is not yet occupied. Ansys currently occupies 186,000 square feet at the Zenith Ridge Property (as defined below) and is in the process of building out its additional space in Zenith Ridge II (as defined below). According to the sponsors, Ansys is expected to take occupancy of its space in January 2019. Ansys is entitled to 15 months of free rent related to its Zenith Ridge II space for which the borrowers were required to escrow at origination of the Zenith Ridge Whole Loan an amount equal to $890,416, along with outstanding tenant improvements and leasing commissions in an aggregate amount equal to $1,445,533. |
| (5) | UW NOI is higher than historical NOI due in part to (i) the lease-up of the Zenith Ridge Property and (ii) the inclusion of contractual rent steps totaling $358,484 through April 2019. |
| (6) | Insurance escrows are waived so long as, among other things, the Zenith Ridge Property (as defined below) is covered by an acceptable blanket policy (which is currently maintained). If such condition is no longer satisfied, on each due date, the borrowers will be required to fund an insurance reserve in a monthly amount equal to 1/12 of the amount that the lender estimates will be necessary to pay the annual insurance premiums. |
| (7) | Other reserves consist of $1,445,533 into an account for outstanding tenant improvements and leasing commissions related to Ansys and $890,416 into an account for free rent related to Ansys at Zenith Ridge II. |
THE INFORMATION IN THIS STRUCTURAL AND COLLATERAL TERM SHEET IS NOT COMPLETE AND MAY BE AMENDED PRIOR TO THE TIME OF SALE. THIS TERM SHEET IS NOT AN OFFER TO SELL THESE SECURITIES AND IT IS NOT A SOLICITATION OF AN OFFER TO BUY THESE SECURITIES IN ANY JURISDICTION WHERE THE OFFER OR SALE IS NOT PERMITTED.
| | 148 | |
| Structural and Collateral Term Sheet | BBCMS 2018-C2 | |
| Zenith Ridge | ||
The Loan.The Zenith Ridge Whole Loan is secured by a first mortgage lien on the borrowers’ fee interest in a suburban office property totaling 486,000 square feet located in Canonsburg, Pennsylvania (the “Zenith Ridge Property”). The Zenith Ridge Whole Loan was originated by Starwood Mortgage Capital LLC, has an outstanding principal balance as of the Cut-off Date of approximately $90.0 million, and is comprised of fivepari passu notes, Note A-1, Note A-2, Note A-3, Note A-4 and Note A-5. The Zenith Ridge Whole Loan has a 10-year term and, subsequent to a five-year interest-only period, amortizes on a 30-year basis.
| Whole Loan Summary | |||
| Note | Original Balance | Note Holder | Controlling Piece |
| A-1 | $35,000,000 | CD 2018-CD7 | Yes |
| A-2 | $30,000,000 | MSC 2018-L1 | No |
| A-3 | $10,000,000 | BBCMS 2018-C2 | No |
| A-4 | $10,000,000 | BBCMS 2018-C2 | No |
| A-5 | $5,000,000 | BBCMS 2018-C2 | No |
The Property.The Zenith Ridge Property is comprised of three, five-story class A office buildings located in Canonsburg, Pennsylvania, encompassing 486,000 square feet. The Zenith Ridge I building (“Zenith Ridge I”) has approximately 186,000 square feet and is 100% occupied by Ansys. The Zenith Ridge II building (“Zenith Ridge II”) has approximately 150,000 square feet and is 100% leased to 12 tenants. The Zenith Ridge III building (“Zenith Ridge III”) has approximately 150,000 square feet and is 100% occupied by EQT Corp. The Zenith Ridge Property is located in a suburban office park in the Pittsburgh area (the “Southpointe Business Park”). The Southpointe Business Park is nearly fully developed and contains approximately 4.0 million square feet of office space and is currently 91.4% occupied.
The Southpointe Business Park was developed in two phases (“Southpointe I” and “Southpointe II”) with Southpointe I being developed in 1989 and Southpointe II being developed approximately 10 years ago. The Zenith Ridge Property is located in Southpointe II, which features developments such as a class A multi-family property known as 1400 Main Street built in 2015, a new Holiday Inn Express, a Homewood Suites by Hilton and the Southpointe Town Center, a mixed-use development with approximately 60,000 square feet of retail and restaurants. All of these developments are within walking distance of the Zenith Ridge Property.
The Zenith Ridge Property has received the LEED Core and Shell Certification and the Class G Certification and is one of three office properties in the Southpointe Business Park with that designation. The Zenith Ridge Property has the following attributes to qualify for the certification: low-flow water fixtures, energy monitoring equipment, preferred parking for “Low Emission Vehicles”, low volatile organic compound paints, which positively impact indoor air quality, high performance low emissivity coated glass and a green campus, including walking trails, fire pits and outdoor patios.
The Market.The Zenith Ridge Property is located in Canonsburg, Washington County, Pennsylvania. The Zenith Ridge Property is situated in the Pittsburgh office market and the Washington County office submarket. The Pittsburgh office market contains approximately 133.1 million square feet with a first quarter 2018 vacancy rate of 8.7% and asking rent of $21.56 per square foot. The Washington County office submarket contains approximately 8.5 million square feet with a first quarter 2018 vacancy rate of 8.3% and asking rent of $20.78 per square foot. The appraisal determined market rent of $24.25 per square foot for office space. The estimated 2017 population within a one-, three- and five-mile radius of the Zenith Ridge Property was 5,614, 32,117 and 63,326 people, respectively. The estimated 2017 average household income within a one-, three- and five-mile radius of the Zenith Ridge Property was $92,636, $99,010 and $104,935, respectively. The appraisal identified five competitive properties built between 1996 and 2014 and ranging in size from approximately 62,500 to 115,160 square feet. The comparable properties reported occupancy rates ranging from 96.0% to 100.0%. Asking rents for the comparable properties range from $20.00 to $24.50 per square foot.
THE INFORMATION IN THIS STRUCTURAL AND COLLATERAL TERM SHEET IS NOT COMPLETE AND MAY BE AMENDED PRIOR TO THE TIME OF SALE. THIS TERM SHEET IS NOT AN OFFER TO SELL THESE SECURITIES AND IT IS NOT A SOLICITATION OF AN OFFER TO BUY THESE SECURITIES IN ANY JURISDICTION WHERE THE OFFER OR SALE IS NOT PERMITTED.
| | 149 | |
| Structural and Collateral Term Sheet | BBCMS 2018-C2 | |
| Zenith Ridge | ||
| Top Ten Tenant Summary(1) | ||||||||
| Tenant | Ratings(2) Moody’s/S&P/Fitch | Net Rentable Area (SF) | % of Total NRA | Base Rent PSF | Base Rent | % of Total Base Rent | Lease Exp. Date | |
| Ansys(3) | NR / NR / NR | 216,971 | 44.6% | $23.14 | $5,021,304 | 42.1% | 12/31/2029 | |
| EQT Corp.(4) | Baa3 / BBB / BBB- | 180,908 | 37.2 | $25.82 | 4,671,664 | 39.1 | Various | |
| Nicholson Construction Company | NR / NR / NR | 17,342 | 3.6 | $27.06 | 469,275 | 3.9 | 1/31/2026 | |
| Regus | NR / NR / NR | 13,814 | 2.8 | $27.06 | 373,807 | 3.1 | 1/31/2025 | |
| Sentric Holdings Corp. | NR / NR / NR | 13,334 | 2.7 | $24.94 | 332,550 | 2.8 | 9/30/2021 | |
| Langan Engineering & Environmental Services | NR / NR / NR | 12,261 | 2.5 | $25.62 | 314,127 | 2.6 | 2/28/2021 | |
| Aladdin Food Management | NR / NR / NR | 7,654 | 1.6 | $16.13 | 123,459 | 1.0 | 8/31/2021 | |
| RBC Capital Markets, LLC | NR / NR / NR | 6,637 | 1.4 | $28.14 | 186,765 | 1.6 | 3/31/2022 | |
| Wells Fargo Advisors, LLC | A2 / A- / A+ | 6,296 | 1.3 | $28.01 | 176,335 | 1.5 | 8/31/2022 | |
| Colonial Life | NR / A / NR | 4,000 | 0.8 | $25.38 | 101,505 | 0.9 | 10/31/2022 | |
| Top Ten Tenants | 479,217 | 98.6% | $24.56 | $11,770,791 | 98.6% | |||
| Non Top Ten Tenants | 6,783 | 1.4% | $24.11 | $163,535 | 1.4% | |||
| Occupied Collateral Total | 486,000 | 100.0% | $24.56 | $11,934,326 | 100.0% | |||
| Vacant Space | 0 | 0.0% | ||||||
| Collateral Total | 486,000 | 100.0% | ||||||
| (1) | Based on the underwritten rent roll dated July 11, 2018. |
| (2) | Ratings provided are for the parent company of the entity listed in the “Tenant” field whether or not the parent company guarantees the lease. |
| (3) | Ansys occupies the entire 186,000 square feet of Zenith Ridge I and is currently building out its 30,971 square foot suite in Zenith Ridge II. The sponsors expect Ansys to take occupancy of its space in Zenith Ridge II in January 2019. Ansys is entitled to 15 months of free rent related to its Zenith Ridge II space which the borrowers were required to escrow at origination of the Zenith Ridge Whole Loan in an amount equal to $890,416, along with outstanding tenant improvements and leasing commissions in an aggregate amount equal to $1,445,533. Additionally, Ansys has the one-time right to terminate its lease effective December 2025 by providing 18 months’ notice and paying all unamortized tenant improvements allowance, brokerage fees and free rent, plus an additional $887,671, estimated to total approximately $5.75 million. |
| (4) | EQT Corp. occupies the entire 150,000 square feet in Zenith Ridge III under a lease that expires in January 2031 and occupies another 30,908 square feet in Zenith Ridge II under a lease that expires in December 2024. |
THE INFORMATION IN THIS STRUCTURAL AND COLLATERAL TERM SHEET IS NOT COMPLETE AND MAY BE AMENDED PRIOR TO THE TIME OF SALE. THIS TERM SHEET IS NOT AN OFFER TO SELL THESE SECURITIES AND IT IS NOT A SOLICITATION OF AN OFFER TO BUY THESE SECURITIES IN ANY JURISDICTION WHERE THE OFFER OR SALE IS NOT PERMITTED.
| | 150 | |
| Structural and Collateral Term Sheet | BBCMS 2018-C2 | |
| Zenith Ridge | ||
| Lease Rollover Schedule(1)(2) | |||||||||
| Year | Number of Leases Expiring | Net Rentable Area Expiring | % of NRA Expiring | Base Rent Expiring | % of Base Rent Expiring | Cumulative Net Rentable Area Expiring | Cumulative % of NRA Expiring | Cumulative Base Rent Expiring | Cumulative % of Base Rent Expiring |
| Vacant | NAP | 0 | 0.0% | NAP | NAP | 0 | 0.0% | NAP | NAP |
| 2018 & MTM | 0 | 0 | 0.0 | $0 | 0.0% | 0 | 0.0% | $0 | 0.0% |
| 2019 | 0 | 0 | 0.0 | 0 | 0.0 | 0 | 0.0% | $0 | 0.0% |
| 2020 | 0 | 0 | 0.0 | 0 | 0.0 | 0 | 0.0% | $0 | 0.0% |
| 2021 | 3 | 33,249 | 6.8 | 770,136 | 6.5 | 33,249 | 6.8% | $770,136 | 6.5% |
| 2022 | 5 | 23,716 | 4.9 | 628,140 | 5.3 | 56,965 | 11.7% | $1,398,276 | 11.7% |
| 2023 | 0 | 0 | 0.0 | 0 | 0.0 | 56,965 | 11.7% | $1,398,276 | 11.7% |
| 2024 | 1 | 30,908 | 6.4 | 762,790 | 6.4 | 87,873 | 18.1% | $2,161,066 | 18.1% |
| 2025 | 1 | 13,814 | 2.8 | 373,807 | 3.1 | 101,687 | 20.9% | $2,534,873 | 21.2% |
| 2026 | 1 | 17,342 | 3.6 | 469,275 | 3.9 | 119,029 | 24.5% | $3,004,148 | 25.2% |
| 2027 | 0 | 0 | 0.0 | 0 | 0.0 | 119,029 | 24.5% | $3,004,148 | 25.2% |
| 2028 | 0 | 0 | 0.0 | 0 | 0.0 | 119,029 | 24.5% | $3,004,148 | 25.2% |
| 2029 & Beyond | 3 | 366,971 | 75.5 | 8,930,178 | 74.8 | 486,000 | 100.0% | $11,934,326 | 100.0% |
| Total | 14 | 486,000 | 100.0% | $11,934,326 | 100.0% | ||||
| (1) | Based on the underwritten rent roll dated July 11, 2018. |
| (2) | Certain tenants may have lease termination options that are exercisable prior to the originally stated expiration date of the subject lease that are not considered in the lease rollover schedule. |
| Operating History and Underwritten Net Cash Flow | ||||||
| 2016 | 2017 | TTM(1) | Underwritten | Per Square Foot | %(2) | |
| Rents in Place | $9,082,608 | $10,827,320 | $11,012,814 | $11,934,326 | $24.56 | 93.3% |
| Vacant Income | 0 | 0 | 0 | 0 | 0.00 | 0.0 |
| Gross Potential Rent | $9,082,608 | $10,827,320 | $11,012,814 | $11,934,326 | $24.56 | 93.3% |
| Total Reimbursements | 159,691 | 353,016 | 398,350 | 857,697 | 1.76 | 6.7 |
| Net Rental Income | $9,242,299 | $11,180,336 | $11,411,164 | $12,792,023 | $26.32 | 100.0% |
| (Vacancy/Credit Loss) | 0 | 0 | 0 | (639,601) | (1.32) | (5.0) |
| Other Income | 33,000 | 13,482 | 0 | 0 | 0.00 | 0.0 |
| Effective Gross Income | $9,275,299 | $11,193,818 | $11,411,164 | $12,152,422 | $25.00 | 95.0% |
| Total Expenses | $1,618,191 | $1,959,830 | $2,040,081 | $2,723,379 | $5.60 | 22.4% |
| Net Operating Income(3) | $7,657,108 | $9,233,988 | $9,371,083 | $9,429,044 | $19.40 | 77.6% |
| Total TI/LC, Capex/RR | 0 | 0 | 0 | 801,900 | 1.65 | 6.6 |
| Net Cash Flow | $7,657,108 | $9,233,988 | $9,371,083 | $8,627,144 | $17.75 | 71.0% |
| Occupancy(4) | 91.1% | 93.6% | 100.0% | 95.0% | ||
| (1) | TTM represents the trailing 12 month period ending May 31, 2018. |
| (2) | Percentage column represents percent of Net Rental Income for all revenue lines and represents percent of Effective Gross Income for the remainder of fields. |
| (3) | Underwritten Net Operating Income is higher than historical Net Operating Income due in part to (i) the lease-up of the Zenith Ridge Property and (ii) the inclusion of contractual rent steps totaling $358,484 through April 2019. |
| (4) | Occupancy for 2016 and 2017 represents physical occupancy as of December 31 for each respective year. TTM Occupancy is as of July 11, 2018 and includes 30,971 square feet (6.4% of net rentable area) of additional space that is leased by the largest tenant, Ansys, but is not yet occupied. Ansys currently occupies 186,000 square feet at the Zenith Ridge Property and is in the process of building out its additional space in Zenith Ridge II. According to the sponsors, Ansys is expected to take occupancy of its space in January 2019. Ansys is entitled to 15 months of free rent related to its Zenith Ridge II space for which the borrowers were required to escrow at origination of the Zenith Ridge Whole Loan an amount equal to $890,416, along with outstanding tenant improvements and leasing commissions in an aggregate amount equal to $1,445,533. Underwritten Occupancy is based on underwritten economic occupancy. |
THE INFORMATION IN THIS STRUCTURAL AND COLLATERAL TERM SHEET IS NOT COMPLETE AND MAY BE AMENDED PRIOR TO THE TIME OF SALE. THIS TERM SHEET IS NOT AN OFFER TO SELL THESE SECURITIES AND IT IS NOT A SOLICITATION OF AN OFFER TO BUY THESE SECURITIES IN ANY JURISDICTION WHERE THE OFFER OR SALE IS NOT PERMITTED.
| | 151 | |
| Structural and Collateral Term Sheet | BBCMS 2018-C2 | |
| Dudley Farms Plaza | ||
| Mortgage Loan Information | Property Information | |||
| Mortgage Loan Seller: | Barclays | Single Asset / Portfolio: | Single Asset | |
| Original Principal Balance: | $24,700,000 | Title(1): | Leasehold | |
| Cut-off Date Principal Balance: | $24,700,000 | Property Type - Subtype: | Retail – Anchored | |
| % of IPB: | 2.8% | Net Rentable Area (SF)(2): | 230,776 | |
| Loan Purpose: | Refinance | Location: | Charleston, WV | |
| Borrower: | THF-D Charleston Development | Year Built / Renovated: | 1998 / N/A | |
| Limited Liability Company | Occupancy(3): | 96.5% | ||
| Sponsor: | E. Stanley Kroenke | Occupancy Date: | 10/9/2018 | |
| Interest Rate: | 5.02400% | 4thMost Recent NOI (As of): | $2,867,803 (12/31/2015) | |
| Note Date: | 10/5/2018 | 3rd Most Recent NOI (As of): | $2,812,008 (12/31/2016) | |
| Maturity Date: | 10/6/2028 | 2nd Most Recent NOI (As of): | $2,909,376 (12/31/2017) | |
| Interest-only Period: | 120 months | Most Recent NOI (As of): | $2,818,736 (TTM 8/31/2018) | |
| Original Term: | 120 months | UW Economic Occupancy: | 95.0% | |
| Original Amortization Term: | None | UW Revenues: | $3,762,144 | |
| Amortization Type: | Interest Only | UW Expenses: | $900,283 | |
| Call Protection: | L(23),Grtr1%orYM(93),O(4) | UW NOI: | $2,861,861 | |
| Lockbox / Cash Management: | Springing | UW NCF: | $2,651,427 | |
| Additional Debt: | N/A | Appraised Value / Per SF: | $40,960,000 / $177 | |
| Additional Debt Balance: | N/A | Appraisal Date: | 9/24/2018 | |
| Additional Debt Type: | N/A | |||
| Escrows and Reserves(4) | Financial Information | |||||||||
| Initial | Monthly | Initial Cap | Cut-off Date Loan / SF: | $107 | ||||||
| Taxes: | $0 | Springing | N/A | Maturity Date Loan / SF: | $107 | |||||
| Insurance: | $0 | Springing | N/A | Cut-off Date LTV: | 60.3% | |||||
| Replacement Reserves: | $0 | Springing | N/A | Maturity Date LTV: | 60.3% | |||||
| TI/LC: | $0 | Springing | $850,000 | UW NCF DSCR: | 2.11x | |||||
| Other: | $0 | $0 | N/A | UW NOI Debt Yield: | 11.6% | |||||
| Sources and Uses | ||||||||||
| Sources | Proceeds | % of Total | Uses | Proceeds | % of Total | |||||
| Mortgage Loan | $24,700,000 | 100.0% | Payoff Existing Debt | $15,008,638 | 60.8% | |||||
| Return of Equity | 9,476,486 | 38.4 | ||||||||
| Closing Costs | 214,876 | 0.9 | ||||||||
| Total Sources | $24,700,000 | 100.0% | Total Uses | $24,700,000 | 100.0% | |||||
| (1) | The property is subject to a ground lease with Dudley Family Limited Partnership II that expires on October 31, 2096. The fixed rent payable under the ground lease is $231,130 per year and was underwritten. |
| (2) | Six of the tenants own the improvements and ground lease their space from the borrower. Additionally, the borrower rents out surface parking at the property to an additional tenant. 1 square foot of space has been attributed to each of these tenants in the underwritten rent roll, and these tenants comprise $422,107 of the underwritten base rent (12.2% of underwritten base rent). |
| (3) | There are currently letters of intent for three of the vacant spaces at the property totaling 5,900 square feet. These spaces were underwritten as vacant. |
| (4) | As long as (i) no Cash Sweep Period (as defined below) is in effect and (ii) E. Stanley Kroenke remains the sponsor of the loan, the borrower shall not be required to make monthly deposits for taxes, insurance premiums, replacement reserves or TI/LC reserves. A “Cash Sweep Period” will commence upon the earliest of (i) an event of default, (ii) the debt service coverage ratio falling below 1.20x for six consecutive calendar months based on the trailing six months, and/or (iii) the date which is six months prior to the expiration of the Kohl’s lease unless Kohl’s has renewed or extended its lease under terms and conditions acceptable to the lender prior to such expiration date. So long as E. Stanley Kroenke remains the sponsor of the loan, the borrower may enter into a master lease to cure a Cash Sweep Period in regard to clause (ii) above. |
THE INFORMATION IN THIS STRUCTURAL AND COLLATERAL TERM SHEET IS NOT COMPLETE AND MAY BE AMENDED PRIOR TO THE TIME OF SALE. THIS TERM SHEET IS NOT AN OFFER TO SELL THESE SECURITIES AND IT IS NOT A SOLICITATION OF AN OFFER TO BUY THESE SECURITIES IN ANY JURISDICTION WHERE THE OFFER OR SALE IS NOT PERMITTED.
| | 152 | |
| Structural and Collateral Term Sheet | BBCMS 2018-C2 | |
| Dudley Farms Plaza | ||
The Loan.The Dudley Farms Plaza loan is secured by a first mortgage lien on the borrower’s leasehold interest in a 230,776 square foot anchored retail shopping center located in Charleston, West Virginia. The mortgage loan was originated by Barclays and has an outstanding principal balance as of the Cut-off Date of $24.7 million (the “Dudley Farms Plaza Mortgage Loan”). The Dudley Farms Plaza Mortgage Loan has a 10-year term and is interest-only for the full term of the loan.The borrowing entity for the loan is THF-D Charleston Development Limited Liability Company, a West Virginia limited liability company and special purpose entity. The nonrecourse carve-out guarantor and loan sponsor is E. Stanley Kroenke. E. Stanely Kroenke owns approximately 30.0 million square feet of real estate and is also an active participant in the sports industry, owning the Los Angeles Rams, Denver Nuggets, Colorado Avalanche, Colorado Rapids, and Arsenal soccer club.
The Property. Dudley Farms Plaza is a 230,776 square foot anchored retail shopping center located in Charleston, West Virginia (the “Dudley Farms Plaza Property”). The loan sponsor constructed the retail center in 1998. As of October 9, 2018, the property was 96.5% occupied by 27 retail tenants. The Dudley Farms Plaza Property is anchored by Kohl’s with other major tenants including OfficeMax, Michaels, Books-A-Million, and Shoe Carnival. The five largest tenants have been in occupancy at the property since it opened in 1998, and since 2017, four of the five tenants have exercised their lease renewal options (66.5% of the net rentable area and 49.0% of the underwritten base rent). The property contains 1,050 parking spaces with overall parking ratio of approximately 4.5 spaces per 1,000 square feet of net rentable area.
The Market.The Dudley Farms Plaza Property is located in the city of Charleston, the capital of West Virginia and its largest city. The Dudley Farms Plaza Property is located approximately five miles southwest of the Charleston central business district. The Dudley Farms Plaza Property is part of a nearly 1.8 million square foot retail corridor that includes prominent tenants such as Walmart, Sam’s Club, Cabela’s, Home Depot, Lowe’s and Target. The Dudley Farms Plaza Property is located along US Highway 119, with access to downtown Charleston to the northeast and Kentucky to the southwest. According to the appraisal, the Dudley Farms Plaza Property’s 2017 estimated population within a one-, three-, and five-mile radius was 2,163, 22,880, and 57,694 people, respectively, with average household income of $64,294, $67,840, and $66,682, respectively. The Dudley Farms Plaza Property is located in the Charleston retail market and the South Charleston retail submarket. As of second quarter of 2018, the Charleston retail market contained approximately 24.8 million square feet of retail space with a vacancy rate of 2.1%, 0.5% bps lower than year end 2017. As of second quarter of 2018, the South Charleston retail submarket contained approximately 1.5 million square feet of retail space with an average vacancy rate of 1.8%. The appraisal identified four directly competitive retail properties built between 1960 and 2000 and ranging in size from 45,011 square feet to 496,125 square feet. The comparable retail properties reported occupancies ranging from 98.0% to 100.0% with a weighted average occupancy of approximately 99.1%.
THE INFORMATION IN THIS STRUCTURAL AND COLLATERAL TERM SHEET IS NOT COMPLETE AND MAY BE AMENDED PRIOR TO THE TIME OF SALE. THIS TERM SHEET IS NOT AN OFFER TO SELL THESE SECURITIES AND IT IS NOT A SOLICITATION OF AN OFFER TO BUY THESE SECURITIES IN ANY JURISDICTION WHERE THE OFFER OR SALE IS NOT PERMITTED.
| | 153 | |
| Structural and Collateral Term Sheet | BBCMS 2018-C2 | |
| Dudley Farms Plaza | ||
| Top Ten Tenant Summary(1) | ||||||||||
| Tenant | Ratings(2) Moody’s/S&P/ Fitch | Net Rentable Area (SF) | % of Total NRA | Base Rent PSF | Base Rent | % of Total Base Rent | Sales PSF(3) | Occ. Costs | Lease Exp. Date | |
| Kohl’s(4) | Baa2 / BBB- / BBB | 86,584 | 37.5% | $8.50 | $735,964 | 22.5% | NAV | NAV | 1/31/2024 | |
| OfficeMax(5) | B1 / B / NA | 23,500 | 10.2 | $14.00 | 329,000 | 10.0 | NAV | NAV | 9/30/2023 | |
| Michaels(6) | NA / BB- / NA | 23,285 | 10.1 | $11.81 | 274,996 | 8.4 | $241(3) | 4.9% | 2/28/2027 | |
| Books-A-Million(7) | NA / NA / NA | 20,000 | 8.7 | $13.20 | 264,000 | 8.1 | $154 | 8.5% | 1/21/2024 | |
| Shoe Carnival(8) | NA / NA / NA | 20,000 | 8.7 | $11.00 | 220,000 | 6.7 | $267 | 4.1% | 1/31/2022 | |
| ULTA Salon(9) | NA / NA / NA | 12,000 | 5.2 | $21.87 | 262,440 | 8.0 | NAV | NAV | 6/30/2022 | |
| Hallmark | NA / NA / NA | 6,000 | 2.6 | $18.00 | 108,000 | 3.3 | $236 | 7.6% | 2/29/2020 | |
| Carter’s(10) | NA / BB+ / NA | 4,000 | 1.7 | $19.00 | 76,000 | 2.3 | $318 | 6.0% | 1/31/2022 | |
| Lane Bryant(11) | NA / NA / NA | 4,000 | 1.7 | $20.00 | 80,000 | 2.4 | $210 | 9.5% | 1/31/2026 | |
| Mattress Warehouse(12) | NA / NA / NA | 4,000 | 1.7 | $15.25 | 61,000 | 1.9 | NAV | NAV | 10/31/2023 | |
| Top Ten Tenants | 203,369 | 88.1% | $11.86 | $2,411,400 | 73.7% | |||||
| Non Top Ten Tenants | 19,307 | 8.4% | $44.66 | $862,257 | 26.3% | |||||
| Occupied Collateral Total | 222,676 | 96.5% | $14.70 | $3,273,657 | 100.0% | |||||
| Vacant Space(13) | 8,100 | 3.5% | ||||||||
| Collateral Total | 230,776 | 100.0% | ||||||||
| (1) | Based on the underwritten rent roll. |
| (2) | Ratings provided are for the parent company of the entity listed in the “Tenant” field whether or not the parent company guarantees the lease. |
| (3) | Sales are based on TTM August 2018 figures. Certain tenants at the Dudley Farms Plaza Property are not required to report sales and therefore do not have Sales PSF available. As Michaels did not report TTM August 2018 sales, 2017 sales figures were used for Sales PSF. |
| (4) | Kohl’s has five, five-year renewal options. |
| (5) | OfficeMax has three, five-year renewal options. |
| (6) | Michaels has two, five-year renewal options. |
| (7) | Books-A-Million has two, five-year renewal options. |
| (8) | Shoe Carnival has two, five-year renewal options. |
| (9) | ULTA Salon has two, five-year renewal options. |
| (10) | Carter’s has two, five-year renewal options. |
| (11) | Lane Bryant has two, five-year renewal options. Lane Bryant has the option to terminate its lease with 60 days’ notice, sent within 90 days after the fifth lease year, and the payment of a termination fee if it fails to achieve gross sales of at least $1,000,000 during 2020. |
| (12) | Mattress Warehouse executed a lease extension effective November 1, 2018 expiring on October 31, 2023. Under the new lease, Mattress Warehouse is contractually obligated to pay rent of $64,000 annually. The loan was underwritten to the rent under the previous lease of $61,000 annually. |
| (13) | There are currently letters of intent for three of the vacant spaces at the property totaling 5,900 square feet. These spaces were underwritten as vacant. |
THE INFORMATION IN THIS STRUCTURAL AND COLLATERAL TERM SHEET IS NOT COMPLETE AND MAY BE AMENDED PRIOR TO THE TIME OF SALE. THIS TERM SHEET IS NOT AN OFFER TO SELL THESE SECURITIES AND IT IS NOT A SOLICITATION OF AN OFFER TO BUY THESE SECURITIES IN ANY JURISDICTION WHERE THE OFFER OR SALE IS NOT PERMITTED.
| | 154 | |
| Structural and Collateral Term Sheet | BBCMS 2018-C2 | |
| Dudley Farms Plaza | ||
| Lease Rollover Schedule(1) | |||||||||
| Year | Number of Leases Expiring | Net Rentable Area Expiring | % of NRA Expiring | Base Rent Expiring | % of Base Rent Expiring | Cumulative Net Rentable Area Expiring | Cumulative % of NRA Expiring | Cumulative Base Rent Expiring | Cumulative % of Base Rent Expiring |
| Vacant(2) | NAP | 8,100 | 3.5% | NAP | NAP | 8,100 | 3.5% | NAP | NAP |
| 2018 & MTM | 0 | 0 | 0.0 | $0 | 0.0% | 8,100 | 3.5% | $0 | 0.0% |
| 2019(3) | 4 | 5,102 | 2.2 | 183,581 | 5.6 | 13,202 | 5.7% | $183,581 | 5.6% |
| 2020(3) | 4 | 7,202 | 3.1 | 188,222 | 5.7 | 20,404 | 8.8% | $371,803 | 11.4% |
| 2021(3) | 4 | 7,001 | 3.0 | 283,830 | 8.7 | 27,405 | 11.9% | $655,633 | 20.0% |
| 2022 | 4 | 37,300 | 16.2 | 590,940 | 18.1 | 64,705 | 28.0% | $1,246,573 | 38.1% |
| 2023 | 5 | 32,200 | 14.0 | 494,400 | 15.1 | 96,905 | 42.0% | $1,740,973 | 53.2% |
| 2024(3) | 4 | 106,586 | 46.2 | 1,177,688 | 36.0 | 203,491 | 88.2% | $2,918,661 | 89.2% |
| 2025 | 0 | 0 | 0.0 | 0 | 0.0 | 203,491 | 88.2% | $2,918,661 | 89.2% |
| 2026 | 1 | 4,000 | 1.7 | 80,000 | 2.4 | 207,491 | 89.9% | $2,998,661 | 91.6% |
| 2027 | 1 | 23,285 | 10.1 | 274,996 | 8.4 | 230,776 | 100.0% | $3,273,657 | 100.0% |
| 2028 | 0 | 0 | 0 | 0 | 0 | 230,776 | 100.0% | $3,273,657 | 100.0% |
| 2029 & Beyond | 0 | 0 | 0 | 0 | 0 | 230,776 | 100.0% | $3,273,657 | 100.0% |
| Total | 27 | 230,776 | 100.0% | $3,273,657 | 100.0% | ||||
| (1) | Based on the underwritten rent roll. |
| (2) | There are currently letters of intent for three of the vacant spaces at the property totaling 5,900 square feet. These spaces were underwritten as vacant. |
| (3) | Six of the tenants own the improvements and ground lease their space from the borrower. Additionally, the borrower rents out surface parking at the property to an additional tenant. 1 square foot of space has been attributed to each of these tenants in the underwritten rent roll, and these tenants comprise $422,107 of the underwritten base rent (12.2% of underwritten base rent). |
| Operating History and Underwritten Net Cash Flow | |||||||
| 2015 | 2016 | 2017 | TTM(1) | Underwritten | Per Square Foot | %(2) | |
| Rents in Place(3) | $3,223,374 | $3,198,913 | $3,276,568 | $3,261,910 | $3,273,657 | $14.19 | 82.7% |
| Vacant Income | 0 | 0 | 0 | 0 | 200,300 | $0.87 | 5.1% |
| Gross Potential Rent | $3,223,374 | $3,198,913 | $3,276,568 | $3,261,910 | $3,473,957 | $15.05 | 87.7% |
| Total Reimbursements | 468,149 | 506,961 | 450,369 | 460,847 | 486,105 | 2.11 | 12.3 |
| Percentage Rent | 0 | 3,991 | 3,511 | 0 | 0 | 0.0 | 0.0 |
| Net Rental Income | $3,691,523 | $3,709,865 | $3,730,449 | $3,722,758 | $3,960,062 | $17.16 | 100.0% |
| (Vacancy/Credit Loss) | 0 | 0 | 0 | 0 | (198,077) | (0.86) | (5.0) |
| Other Income | 3,382 | 353 | 284 | 160 | 160 | 0.00 | 0.0 |
| Effective Gross Income | $3,694,904 | $3,710,218 | $3,730,732 | $3,722,917 | $3,762,144 | $16.30 | 95.0% |
| Total Expenses | $827,101 | $898,210 | $821,356 | $904,182 | $900,283 | $3.90 | 23.9% |
| Net Operating Income | $2,867,803 | $2,812,008 | $2,909,376 | $2,818,736 | $2,861,861 | $12.40 | 76.1% |
| Total TI/LC, Capex/RR | 0 | 0 | 0 | 0 | 210,434 | 0.91 | 5.6 |
| Net Cash Flow | $2,867,803 | $2,812,008 | $2,909,376 | $2,818,736 | $2,651,427 | $11.49 | 70.5% |
| Occupancy(4) | 99.1% | 99.1% | 98.5% | 96.5% | 95.0% | ||
| (1) | TTM reflects the trailing twelve month period ending August 2018. |
| (2) | Percentage column represents percent of Net Rental Income for all revenue lines and represents percent of Effective Gross Income for the remainder of fields. |
| (3) | Underwritten Rents in Place are based on the underwritten rent roll dated October 9, 2018 and include contractual rent steps of $93,353 through October 31, 2019. |
| (4) | Historical occupancies are as of December 31 for each respective year. TTM Occupancy is as of October 9, 2018. Underwritten Occupancy represents economic occupancy. |
THE INFORMATION IN THIS STRUCTURAL AND COLLATERAL TERM SHEET IS NOT COMPLETE AND MAY BE AMENDED PRIOR TO THE TIME OF SALE. THIS TERM SHEET IS NOT AN OFFER TO SELL THESE SECURITIES AND IT IS NOT A SOLICITATION OF AN OFFER TO BUY THESE SECURITIES IN ANY JURISDICTION WHERE THE OFFER OR SALE IS NOT PERMITTED.
| | 155 | |
| Structural and Collateral Term Sheet | BBCMS 2018-C2 | |
| Contacts | ||
| Barclays CMBS Capital Markets & Banking | ||
| Contact | Phone Number | |
| Daniel Vinson | daniel.vinson@barclays.com | (212) 528-8224 |
| Managing Director | ||
| Daniel Schmidt | daniel.schmidt@barclays.com | (212) 528-7479 |
| Director | ||
| Philip Marx | philip.marx@barclays.com | (212) 526-5248 |
| Analyst | ||
| Barclays CMBS Trading | ||
| Contact | Phone Number | |
| David Kung | david.kung@barclays.com | (212) 528-7374 |
| Director | ||
| Peter Taylor | peter.w.taylor@barclays.com | (212) 526-1528 |
| Assistant Vice President | ||
| Barclays Securitized Products Syndicate | ||
| Contact | Phone Number | |
| Brian Wiele | brian.wiele@barclays.com | (212) 412-5780 |
| Managing Director | ||
| Kenneth Rosenberg | kenneth.rosenberg@barclays.com | (212) 412-5780 |
| Director | ||
| Sean Foley | sean.foley@barclays.com | (212) 412-5780 |
| Assistant Vice President | ||
| CCRE CMBS Capital Markets & Banking | ||
| Contact | Phone Number | |
| Baz Preston | bpreston@ccre.com | (212) 829-5294 |
| Senior Managing Director | ||
| Jared Noordyk | jnoordyk@ccre.com | (212) 915-1709 |
| Managing Director | ||
| Kiran Manda | kmanda@cantor.com | (212) 829-5290 |
| Director | ||
| CCRE CMBS Trading & Syndicate | ||
| Contact | Phone Number | |
| Steve Gargiulo | sgargiulo@cantor.com | (212) 829-5259 |
| Managing Director | ||
| Clark Andresen | candresen@cantor.com | (704) 374-0570 |
| Managing Director | ||
THE INFORMATION IN THIS STRUCTURAL AND COLLATERAL TERM SHEET IS NOT COMPLETE AND MAY BE AMENDED PRIOR TO THE TIME OF SALE. THIS TERM SHEET IS NOT AN OFFER TO SELL THESE SECURITIES AND IT IS NOT A SOLICITATION OF AN OFFER TO BUY THESE SECURITIES IN ANY JURISDICTION WHERE THE OFFER OR SALE IS NOT PERMITTED.
| | 156 | |