| FREE WRITING PROSPECTUS | ||
| FILED PURSUANT TO RULE 433 | ||
| REGISTRATION FILE NO.: 333-226850-02 | ||
| Dated May 13, 2019 | BBCMS 2019-C3 |
Free Writing Prospectus Structural and Collateral Term Sheet | |||
BBCMS Mortgage Trust 2019-C3
| |||
$936,649,542 (Approximate Mortgage Pool Balance) | |||
$823,080,000 (Approximate Offered Certificates) | |||
Barclays Commercial Mortgage Securities LLC Depositor
| |||
Commercial Mortgage Pass-Through Certificates, Series 2019-C3
| |||
Barclays Capital Real Estate Inc. Societe Generale Financial Corporation KeyBank National Association UBS AG Natixis Real Estate Capital LLC Rialto Mortgage Finance, LLC Mortgage Loan Sellers
| |||
| Barclays | Natixis | Société Générale | UBS Securities LLC |
| Co-Lead Managers and Joint Bookrunners | |||
KeyBanc Capital Markets Co-Manager
|
| Drexel Hamilton Co-Manager
| |
THE INFORMATION IN THIS STRUCTURAL AND COLLATERAL TERM SHEET IS NOT COMPLETE AND MAY BE AMENDED PRIOR TO THE TIME OF SALE. THIS TERM SHEET IS NOT AN OFFER TO SELL THESE SECURITIES AND IT IS NOT A SOLICITATION OF AN OFFER TO BUY THESE SECURITIES IN ANY JURISDICTION WHERE THE OFFER OR SALE IS NOT PERMITTED.
| Dated May 13, 2019 | BBCMS 2019-C3 |
This material is for your information, and none of Barclays Capital Inc., SG Americas Securities, LLC, UBS Securities LLC, Natixis Securities Americas LLC, KeyBanc Capital Markets Inc. and Drexel Hamilton, LLC (the “Underwriters”) are soliciting any action based upon it. This material is not to be construed as an offer to sell or the solicitation of any offer to buy any security in any jurisdiction where such an offer or solicitation would be illegal.
The depositor has filed a registration statement (including the prospectus) with the Securities and Exchange Commission (File No. 333-226850) for the offering to which this communication relates. Before you invest, you should read the prospectus in the registration statement and other documents the depositor has filed with the Securities and Exchange Commission for more complete information about the depositor, the issuing entity and this offering. You may get these documents for free by visiting EDGAR on the SEC website at www.sec.gov. Alternatively, the depositor or Barclays Capital Inc., any other underwriter, or any dealer participating in this offering will arrange to send you the prospectus if you request it by calling 1-888-603-5847. The Offered Certificates referred to in these materials, and the asset pool backing them, are subject to modification or revision (including the possibility that one or more Classes of Certificates may be split, combined or eliminated at any time prior to issuance or availability of a final prospectus) and are offered on a “when, as and if issued” basis. You understand that, when you are considering the purchase of these Certificates, a contract of sale will come into being no sooner than the date on which the relevant Class has been priced and we have verified the allocation of Certificates to be made to you; any “indications of interest” expressed by you, and any “soft circles” generated by us, will not create binding contractual obligations for you or us.
Neither this document nor anything contained in this document shall form the basis for any contract or commitment whatsoever. The information contained in this document is preliminary as of the date of this document, supersedes any previous such information delivered to you and will be superseded by any such information subsequently delivered prior to the time of sale. These materials are subject to change, completion or amendment from time to time. The information should be reviewed only in conjunction with the entire offering document relating to the Commercial Mortgage Pass-Through Certificates, Series 2019-C3 (the “Offering Document”). All of the information contained herein is subject to the same limitations and qualifications contained in the Offering Document. The information contained herein does not contain all relevant information relating to the underlying mortgage loans or mortgaged properties. Such information is described elsewhere in the Offering Document. The information contained herein will be more fully described elsewhere in the Offering Document. The information contained herein should not be viewed as projections, forecasts, predictions or opinions with respect to value. Prior to making any investment decision, prospective investors are strongly urged to read the Offering Document its entirety. Neither the Securities and Exchange Commission nor any state securities commission has approved or disapproved of these securities or determined if this free writing prospectus is truthful or complete. Any representation to the contrary is a criminal offense.
This document has been prepared by the Underwriters for information purposes only and does not constitute, in whole or in part, a prospectus for the purposes of Directive 2003/71/EC (as amended) and/or Part VI of the Financial Services and Markets Act 2000 (as amended) or other offering document.
The attached information contains certain tables and other statistical analyses (the “Computational Materials”) which have been prepared in reliance upon information furnished by the Mortgage Loan Sellers. Numerous assumptions were used in preparing the Computational Materials, which may or may not be reflected herein. As such, no assurance can be given as to the Computational Materials’ accuracy, appropriateness or completeness in any particular context; or as to whether the Computational Materials and/or the assumptions upon which they are based reflect present market conditions or future market performance. The Computational Materials should not be construed as either projections or predictions or as legal, tax, financial or accounting advice. You should consult your own counsel, accountant and other advisors as to the legal, tax, business, financial and related aspects of a purchase of these securities. Any weighted average lives, yields and principal payment periods shown in the Computational Materials are based on prepayment and/or loss assumptions, and changes in such prepayment and/or loss assumptions may dramatically affect such weighted average lives, yields and principal payment periods. In addition, it is possible that prepayments or losses on the underlying assets will occur at rates higher or lower than the rates shown in the attached Computational Materials. The specific characteristics of the securities may differ from those shown in the Computational Materials due to differences between the final underlying assets and the preliminary underlying assets used in preparing the Computational Materials. The principal amount and designation of any security described in the Computational Materials are subject to change prior to issuance. None of the Underwriters or any of their respective affiliates make any representation or warranty as to the actual rate or timing of payments or losses on any of the underlying assets or the payments or yield on the securities. The information in this presentation is based upon management forecasts and reflects prevailing conditions and management’s views as of this date, all of which are subject to change. In preparing this presentation, we have relied upon and assumed, without independent verification, the accuracy and completeness of all information available from public sources or which was provided to us by or on behalf of the Mortgage Loan Sellers or which was otherwise reviewed by us.
This document contains forward-looking statements. If and when included in this document, the words “expects”, “intends”, “anticipates”, “estimates” and analogous expressions and all statements that are not historical facts, including statements about our beliefs or expectations, are intended to identify forward-looking statements. Any forward-looking statements are made subject to risks and uncertainties which could cause actual results to differ materially from those stated. Those risks and uncertainties include, among other things, declines in general economic and business conditions, increased competition, changes in demographics, changes in political and social conditions, regulatory initiatives and changes in consumer preferences, many of which are beyond our control and the control of any other person or entity related to this offering. The forward-looking statements made in this document are made as of the date hereof. We have no obligation to update or revise any forward-looking statement.
IMPORTANT NOTICE RELATING TO AUTOMATICALLY-GENERATED EMAIL DISCLAIMERS
Any legends, disclaimers or other notices that may appear at the bottom of any email communication to which this document is attached relating to (1) these materials not constituting an offer (or a solicitation of an offer), (2) no representation that these materials are accurate or complete and may not be updated or (3) these materials possibly being confidential, are not applicable to these materials and should be disregarded. Such legends, disclaimers or other notices have been automatically generated as a result of these materials having been sent via Bloomberg or another system.
THE CERTIFICATES REFERRED TO IN THESE MATERIALS ARE SUBJECT TO MODIFICATION OR REVISION (INCLUDING THE POSSIBILITY THAT ONE OR MORE CLASSES OF CERTIFICATES MAY BE SPLIT, COMBINED OR ELIMINATED AT ANY TIME PRIOR TO ISSUANCE OR AVAILABILITY OF A FINAL PROSPECTUS) AND ARE OFFERED ON A “WHEN, AS AND IF ISSUED” BASIS.
THE UNDERWRITERS MAY FROM TIME TO TIME PERFORM INVESTMENT BANKING SERVICES FOR, OR SOLICIT INVESTMENT BANKING BUSINESS FROM, ANY COMPANY NAMED IN THESE MATERIALS. THE UNDERWRITERS AND/OR THEIR AFFILIATES OR RESPECTIVE EMPLOYEES MAY FROM TIME TO TIME HAVE A LONG OR SHORT POSITION IN ANY CERTIFICATE OR CONTRACT DISCUSSED IN THESE MATERIALS.
THE INFORMATION IN THIS STRUCTURAL AND COLLATERAL TERM SHEET IS NOT COMPLETE AND MAY BE AMENDED PRIOR TO THE TIME OF SALE. THIS TERM SHEET IS NOT AN OFFER TO SELL THESE SECURITIES AND IT IS NOT A SOLICITATION OF AN OFFER TO BUY THESE SECURITIES IN ANY JURISDICTION WHERE THE OFFER OR SALE IS NOT PERMITTED.
2
| Structural and Collateral Term Sheet | BBCMS 2019-C3 | |
| Indicative Capital Structure | ||
Publicly Offered Certificates
| Class | Expected Ratings (S&P / Fitch / KBRA) | Approximate Initial Certificate Balance or Notional Amount(1) | Approximate Initial Credit Support(2) | Expected Weighted Avg. Life (years)(3) | Expected Principal Window(3) | Certificate Principal to Value Ratio(4) | Underwritten NOI Debt Yield(5) |
| A-1 | AAA(sf) / AAAsf / AAA(sf) | $16,654,000 | 30.000% | 2.88 | 7/19-2/24 | 42.1% | 16.0% |
| A-2 | AAA(sf) / AAAsf / AAA(sf) | $30,000,000 | 30.000% | 4.68 | 2/24-2/24 | 42.1% | 16.0% |
| A-3 | AAA(sf) / AAAsf / AAA(sf) | (6) | 30.000% | (6) | (6) | 42.1% | 16.0% |
| A-4 | AAA(sf) / AAAsf / AAA(sf) | (6) | 30.000% | (6) | (6) | 42.1% | 16.0% |
| A-SB | AAA(sf) / AAAsf / AAA(sf) | $36,000,000 | 30.000% | 7.02 | 2/24-8/28 | 42.1% | 16.0% |
| X-A | AAA(sf) / AAAsf / AAA(sf) | $655,654,000(7) | N/A | N/A | N/A | N/A | N/A |
| X-B | NR / A-sf / AAA(sf) | $167,426,000(8) | N/A | N/A | N/A | N/A | N/A |
| A-S | AA(sf) / AAAsf / AAA(sf) | $87,811,000 | 20.625% | 9.90 | 4/29-5/29 | 47.8% | 14.1% |
| B | NR / AA-sf / AA(sf) | $39,808,000 | 16.375% | 9.93 | 5/29-5/29 | 50.3% | 13.4% |
| C | NR / A-sf / A-(sf) | $39,807,000 | 12.125% | 9.93 | 5/29-5/29 | 52.9% | 12.7% |
Privately Offered Certificates(9)
| Class | Expected Ratings (S&P / Fitch / KBRA) | Approximate Initial Certificate Balance or Notional Amount(1) | Approximate Initial Credit Support(2) | Expected Weighted Avg. Life (years)(3) | Expected Principal Window(3) | Certificate Principal to Value Ratio(4) | Underwritten NOI Debt Yield(5) |
| X-D | NR / BBBsf / BBB+(sf) | $18,349,000(10) | N/A | N/A | N/A | N/A | N/A |
| D | NR / BBBsf / BBB+(sf) | $18,349,000 | 10.166% | 9.93 | 5/29-5/29 | 54.1% | 12.5% |
| E-RR | NR / BBB-sf / BBB-(sf) | $27,313,000 | 7.250% | 9.93 | 5/29-5/29 | 55.8% | 12.1% |
| F-RR | NR / BB+sf / BB+(sf) | $11,708,000 | 6.000% | 9.93 | 5/29-5/29 | 56.6% | 11.9% |
| G-RR | NR / BB-sf / BB-(sf) | $10,537,000 | 4.875% | 9.93 | 5/29-5/29 | 57.3% | 11.8% |
| H-RR | NR / B-sf / B(sf) | $9,367,000 | 3.875% | 9.93 | 5/29-5/29 | 57.9% | 11.7% |
| J-RR | NR / NR / NR | $36,295,542 | 0.000% | 9.93 | 5/29-5/29 | 60.2% | 11.2% |
| (1) | In the case of each such Class, subject to a permitted variance of plus or minus 5%. In addition, the notional amounts of the Class X-A, Class X-B and Class X-D Certificates may vary depending upon the final pricing of the Classes of Principal Balance Certificates whose Certificate Balances comprise such notional amounts, and, if as a result of such pricing the pass-through rate of any Class of the Class X-A, Class X-B or Class X-D Certificates, as applicable, would be equal to zero at all times, such Class of Certificates will not be issued on the closing date of this securitization. |
| (2) | The credit support percentages set forth for Class A-1, Class A-2, Class A-3, Class A-4 and Class A-SB Certificates represent the approximate initial credit support for the Class A-1, Class A-2, Class A-3, Class A-4 and Class A-SB Certificates in the aggregate. |
| (3) | Assumes 0% CPR / 0% CDR and a June 11, 2019 closing date. Based on modeling assumptions as described in the Preliminary Prospectus dated May 13, 2019 (the “Preliminary Prospectus”). |
| (4) | The “Certificate Principal to Value Ratio” for any Class of Principal Balance Certificates (other than the Class A-1, Class A-2, Class A-3, Class A-4 and Class A-SB Certificates) is calculated as the product of (a) the weighted average Cut-off Date LTV Ratio for the mortgage loans, multiplied by (b) a fraction, the numerator of which is the total initial Certificate Balance of such Class of Certificates and all Classes of Principal Balance Certificates senior to such Class of Certificates and the denominator of which is the total initial Certificate Balance of all of the Principal Balance Certificates. The Class A-1, Class A-2, Class A-3, Class A-4 and Class A-SB Certificate Principal to Value Ratios are calculated in the aggregate for those Classes as if they were a single Class. Investors should note, however, that excess mortgaged property value associated with a mortgage loan will not be available to offset losses on any other mortgage loan. |
| (5) | The “Underwritten NOI Debt Yield” for any Class of Principal Balance Certificates (other than the Class A-1, Class A-2, Class A-3, Class A-4 and Class A-SB Certificates) is calculated as the product of (a) the weighted average UW NOI Debt Yield for the mortgage loans and (b) the total initial Certificate Balance of all of the Classes of Principal Balance Certificates divided by the total initial Certificate Balance for such Class and all Classes of Principal Balance Certificates senior to such Class of Certificates. The Underwritten NOI Debt Yield for each of the Class A-1, Class A-2, Class A-3, Class A-4 and Class A-SB Certificates is calculated in the aggregate for those Classes as if they were a single Class. Investors should note, however, that net operating income from any mortgaged property supports only the related mortgage loan and will not be available to support any other mortgage loan. |
| (6) | The exact initial certificate balances of the Class A-3 and Class A-4 certificates are unknown and will be determined based on the final pricing of those classes of certificates. However, the respective initial certificate balances, weighted average lives and expected principal windows of the Class A-3 and Class A-4 certificates are expected to be within the applicable ranges reflected in the following chart. The aggregate initial available certificate balance of the Class A-3 and Class A-4 certificates is expected to be approximately $573,000,000, subject to a variance of plus or minus 5%. |
| Class of Certificates | Expected Range of Approximate Initial Certificate Balance | Expected Range of Weighted Avg. Life (Yrs) | Expected Range of Principal Window | |
| Class A-3 | $100,000,000 – $325,000,000 | 9.40 – 9.61 | 8/28-11/28 – 8/28-4/29 | |
| Class A-4 | $248,000,000 – $473,000,000 | 9.77 – 9.84 | 4/29-4/29 – 11/28-4/29 |
| (7) | The Notional Amount of the Class X-A Certificates will be equal to the aggregate Certificate Balance of the Class A-1, Class A-2, Class A-3, Class A-4 and Class A-SB Certificates outstanding from time to time. |
| (8) | The Notional Amount of the Class X-B Certificates will be equal to the aggregate Certificate Balance of the Class A-S, Class B and Class C Certificates outstanding from time to time. |
| (9) | The Class X-D, Class D, Class E-RR, Class F-RR, Class G-RR, Class H-RR and Class J-RR Certificates are not being offered by the Preliminary Prospectus and this Term Sheet. The Class R Certificates are not shown above. |
| (10) | The Notional Amount of the Class X-D Certificates will be equal to the aggregate Certificate Balance of the Class D outstanding from time to time. |
THE INFORMATION IN THIS STRUCTURAL AND COLLATERAL TERM SHEET IS NOT COMPLETE AND MAY BE AMENDED PRIOR TO THE TIME OF SALE. THIS TERM SHEET IS NOT AN OFFER TO SELL THESE SECURITIES AND IT IS NOT A SOLICITATION OF AN OFFER TO BUY THESE SECURITIES IN ANY JURISDICTION WHERE THE OFFER OR SALE IS NOT PERMITTED.
3
| Structural and Collateral Term Sheet | BBCMS 2019-C3 | |
| Summary of Transaction Terms | ||
| Securities Offered: | $823,080,000 monthly pay, multi-class, commercial mortgage REMIC Pass-Through Certificates. |
| Co-Lead Managers and Joint Bookrunners: | Barclays Capital Inc., SG Americas Securities, LLC, UBS Securities LLC, and Natixis Securities Americas LLC. |
| Co-Managers: | KeyBanc Capital Markets Inc. and Drexel Hamilton, LLC. |
| Mortgage Loan Sellers: | Barclays Capital Real Estate Inc. (“Barclays”) (29.7%), Societe Generale Financial Corporation (“SGFC”) (28.5%), KeyBank National Association (“KeyBank”) (13.0%), UBS AG (“UBS”) (12.7%), Natixis Real Estate Capital LLC (“Natixis”) (9.9%) and Rialto Mortgage Finance, LLC (“Rialto”) (6.2%). |
| Master Servicer: | Midland Loan Services, a Division of PNC Bank, National Association. |
| Special Servicer: | Midland Loan Services, a Division of PNC Bank, National Association. |
| Directing Certificateholder: | KKR Real Estate Credit Opportunity Partners Aggregator I L.P. (or its affiliate). |
| Trustee: | Wells Fargo Bank, National Association. |
| Certificate Administrator: | Wells Fargo Bank, National Association. |
| Operating Advisor: | Pentalpha Surveillance LLC. |
| Asset Representations Reviewer: | Pentalpha Surveillance LLC. |
| Rating Agencies: | S&P Global Ratings, acting through Standard & Poor’s Financial Services LLC (“S&P”), Fitch Ratings, Inc. (“Fitch”) and Kroll Bond Rating Agency, Inc. (“KBRA”). |
| U.S. Credit Risk Retention: | Barclays Capital Real Estate Inc., is expected to act as the “retaining sponsor” for this securitization and intends to satisfy the U.S. credit risk retention requirements (i) through the purchase by KKR Real Estate Credit Opportunity Partners (AIV) Aggregator I L.P., a “majority-owned affiliate” of the “third party purchaser” (each as defined in the credit risk retention rules), which is expected to be KKR Real Estate Credit Opportunity Partners Aggregator I L.P. of the Class E-RR, Class F-RR, Class G-RR, Class H-RR and Class J-RR certificates (collectively, the “Horizontal Risk Retention Certificates”) with an estimated aggregate initial Certificate Balance of $95,220,542 and representing approximately 5.03% of the aggregate fair value of the certificates (other than the Class R Certificates) as of the Closing Date. The Horizontal Risk Retention Certificates will constitute an “eligible horizontal residual interest” (as such term is defined in the credit risk retention rules).
The third party purchaser will be required to comply with the hedging, transfer and financing restrictions applicable to a “retaining sponsor” under the credit risk retention rules, which generally prohibit the transfer of the applicable certificates except to a “majority-owned affiliate” of the “retaining sponsor”. The restrictions on hedging and transfer under the credit risk retention rules as in effect on the closing date of this transaction will expire on and after the date that is the latest of (i) the date on which the aggregate principal balance of the mortgage loans has been reduced to 33% of the aggregate principal balance of the mortgage loans as of the Cut-off Date; (ii) the date on which the total unpaid principal obligations under the certificates has been reduced to 33% of the aggregate total unpaid principal obligations under the certificates as of the Closing Date; or (iii) two years after the Closing Date.
For additional information, see “Credit Risk Retention” in the Preliminary Prospectus.
|
| EU Credit Risk Retention: | None of the sponsors, the depositor or any other party to the transaction intends to retain a material net economic interest in the securitization constituted by the issue of the certificates in a manner that would satisfy the requirements of the European Union Regulation (EU) 2017/2402. In addition, no such person undertakes to take any other action which may be required by any investor for the purposes of its compliance with any applicable requirement under such Regulation. Furthermore, the transaction is not structured to satisfy the EU risk retention and due diligence requirements. |
| Closing Date: | On or about June 11, 2019. |
| Cut-off Date: | With respect to each mortgage loan, the related due date in June 2019, or in the case of any mortgage loan that has its first due date after June 2019, the date that would have been its due date in June 2019 under the terms of that mortgage loan if a monthly debt service payment were scheduled to be due in that month. |
| Distribution Date: | The 4th business day after the Determination Date in each month, commencing in July 2019. |
| Determination Date: | 11th day of each month, or if the 11th day is not a business day, the next succeeding business day, commencing in July 2019. |
| Assumed Final Distribution Date: | The Distribution Date in May 2029 which is the latest anticipated repayment date of the Certificates. |
| Rated Final Distribution Date: | The Distribution Date in May 2052. |
| Tax Treatment: | The Publicly Offered Certificates are expected to be treated as REMIC “regular interests” for U.S. federal income tax purposes. |
| Form of Offering: | The Class A-1, Class A-2, Class A-3, Class A-4, Class A-SB, Class X-A, Class X-B, Class A-S, Class B and Class C Certificates (the “Publicly Offered Certificates”) will be offered publicly. The Class X-D, Class D, Class E-RR, Class F-RR, Class G-RR, Class H-RR, Class J-RR and Class R Certificates (the “Privately Offered Certificates”) will be offered domestically to Qualified Institutional Buyers and to Institutional Accredited Investors and to institutions that are not U.S. Persons pursuant to Regulation S. |
| SMMEA Status: | The Certificates will not constitute “mortgage related securities” for purposes of SMMEA. |
| ERISA: | The Publicly Offered Certificates are expected to be ERISA eligible. |
THE INFORMATION IN THIS STRUCTURAL AND COLLATERAL TERM SHEET IS NOT COMPLETE AND MAY BE AMENDED PRIOR TO THE TIME OF SALE. THIS TERM SHEET IS NOT AN OFFER TO SELL THESE SECURITIES AND IT IS NOT A SOLICITATION OF AN OFFER TO BUY THESE SECURITIES IN ANY JURISDICTION WHERE THE OFFER OR SALE IS NOT PERMITTED.
4
| Structural and Collateral Term Sheet | BBCMS 2019-C3 | |
| Summary of Transaction Terms | ||
| Optional Termination: | On any Distribution Date on which the aggregate principal balance of the pool of mortgage loans is less than 1% of the aggregate principal balance of the mortgage loans as of the cut-off date, certain entities specified in the Preliminary Prospectus will have the option to purchase all of the remaining mortgage loans (and all property acquired through exercise of remedies in respect of any mortgage loan) at the price specified in the Preliminary Prospectus. Refer to “Pooling and Servicing Agreement—Termination; Retirement of Certificates” in the Preliminary Prospectus. |
| Minimum Denominations: | The Publicly Offered Certificates (other than the Class X-A and Class X-B Certificates) will be issued in minimum denominations of $10,000 and integral multiples of $1 in excess of $10,000. The Class X-A and Class X-B Certificates will be issued in minimum denominations of $1,000,000 and in integral multiples of $1 in excess of $1,000,000. |
| Settlement Terms: | DTC, Euroclear and Clearstream Banking. |
| Analytics: | The transaction is expected to be modeled by Intex Solutions, Inc. and Trepp, LLC and is expected to be available on Bloomberg L.P., BlackRock Financial Management, Inc., Interactive Data Corp., CMBS.com, Inc., Markit Group Limited, Moody’s Analytics, MBS Data, LLC and Thomson Reuters Corporation. |
| Risk Factors: | THE CERTIFICATES INVOLVE CERTAIN RISKS AND MAY NOT BE SUITABLE FOR ALL INVESTORS. REFER TO THE “RISK FACTORS” SECTION OF THE PRELIMINARY PROSPECTUS. |
THE INFORMATION IN THIS STRUCTURAL AND COLLATERAL TERM SHEET IS NOT COMPLETE AND MAY BE AMENDED PRIOR TO THE TIME OF SALE. THIS TERM SHEET IS NOT AN OFFER TO SELL THESE SECURITIES AND IT IS NOT A SOLICITATION OF AN OFFER TO BUY THESE SECURITIES IN ANY JURISDICTION WHERE THE OFFER OR SALE IS NOT PERMITTED.
5
| Structural and Collateral Term Sheet | BBCMS 2019-C3 | |
| Collateral Characteristics | ||
Mortgage Loan Seller | Number of | Number of Mortgaged | Aggregate | % of IPB |
| Barclays | 13 | 35 | $278,095,779 | 29.7% |
| SGFC | 16 | 75 | $266,778,013 | 28.5% |
| KeyBank | 6 | 15 | $122,025,999 | 13.0% |
| UBS AG | 7 | 378 | $119,096,111 | 12.7% |
| Natixis | 3 | 6 | $92,626,787 | 9.9% |
| RMF | 5 | 8 | $58,026,853 | 6.2% |
| Total: | 50 | 517 | $936,649,542 | 100.0% |
| Loan Pool | ||
| Initial Pool Balance (“IPB”): | $936,649,542 | |
| Number of Mortgage Loans: | 50 | |
| Number of Mortgaged Properties: | 517 | |
| Average Cut-off Date Balance per Mortgage Loan: | $18,732,991 | |
| Weighted Average Current Mortgage Rate: | 4.80232% | |
| 10 Largest Mortgage Loans as % of IPB: | 45.4% | |
| Weighted Average Remaining Term to Maturity: | 115 months | |
| Weighted Average Seasoning: | 3 months | |
| Credit Statistics | ||
| Weighted Average UW NCF DSCR(1)(2): | 1.93x | |
| Weighted Average UW NOI Debt Yield(1)(3): | 11.2% | |
| Weighted Average Cut-off Date Loan-to-Value Ratio (“LTV”)(1)(4): | 60.2% | |
| Weighted Average Maturity Date LTV(1)(4): | 56.0% | |
| Other Statistics | ||
| % of Mortgage Loans with Additional Debt: | 18.8% | |
| % of Mortgaged Loans with Single Tenants(5): | 14.7% | |
| % of Mortgaged Loans secured by multiple Properties: | 42.2% | |
| Amortization | ||
| Weighted Average Original Amortization Term(6): | 358 months | |
| Weighted Average Remaining Amortization Term(6): | 357 months | |
| % of Mortgage Loans with Interest-Only: | 52.9% | |
| % of Mortgage Loans with Partial Interest-Only followed by Amortizing Balloon: | 34.0% | |
| % of Mortgage Loans with Amortizing Balloon: | 13.1% | |
| Lockboxes(7) | ||
| % of Mortgage Loans with Hard Lockboxes: | 58.0% | |
| % of Mortgage Loans with Springing Lockboxes: | 36.6% | |
| % of Mortgage Loans with Soft Lockboxes: | 5.3% | |
| % of Mortgage Loans with No Lockbox: | 0.0% | |
| Reserves | ||
| % of Mortgage Loans Requiring Monthly Tax Reserves: | 76.3% | |
| % of Mortgage Loans Requiring Monthly Insurance Reserves: | 36.5% | |
| % of Mortgage Loans Requiring Monthly CapEx Reserves(8): | 79.1% | |
| % of Mortgage Loans Requiring Monthly TI/LC Reserves(9): | 40.3% | |
| (1) | In the case of Loan Nos. 1, 2, 3, 4, 7, 8, 9, 10, 11, 13, 18, 19, 21, 22, 23, 26, 32, 33 and 36, the UW NCF DSCR, UW NOI Debt Yield, Cut-off Date LTV and Maturity Date LTV calculations include the related Pari Passu Companion Loan(s). In the case of Loan Nos. 2, 8, 9, 10, 22 and 36, the UW NCF DSCR, UW NOI Debt Yield, Cut-off Date LTV and Maturity Date LTV calculations exclude the related Subordinate Companion Loans. |
| (2) | For the mortgage loans that are interest-only for the entire term and accrue interest on an Actual/360 basis, the Monthly Debt Service Amount ($) was calculated as 1/12th of the product of (i) the Original Balance ($), (ii) the Interest Rate % and (iii) 365/360. In the case of Loan No. 22, the UW NCF DSCR was calculated using the sum of interest payments over the first 12 months following the Cut-off Date, as the Whole Loan amortizes on a 30-year amortization schedule with all amortization being applied to the Note B through April 1, 2029 as provided on Annex F in the Preliminary Prospectus. |
| (3) | In the case of Loan No. 21, the UW NOI Debt Yield calculation includes a deduction for a holdback reserve in the amount of $2,200,000, to be released to the borrower (at the borrower’s request) provided that the debt yield (as calculated in the loan documents) at the mortgaged property is not less than 9.0%. The U/W NOI Debt Yield and U/W NCF Debt Yield are calculated net of the $2,200,000 achievement reserve. The unadjusted U/W NOI Debt Yield and U/W NCF Debt Yield are 8.8% and 8.7%, respectively, based on the full Cut-Off Date Balance. All LTVs and DSCRs are calculated assuming the full loan amount of $84,000,000. |
| (4) | In the case of Loan Nos. 1, 4, 5, 33, 34 and 41, the Cut-off Date LTV and the Maturity Date LTV are calculated by using an appraised value based on certain hypothetical or as stabilized assumptions. Refer to “Description of the Mortgage Pool—Assessment of Property Value and Condition” and “—Appraised Value” in the Preliminary Prospectus for additional details. |
| (5) | Excludes mortgage loans that are secured by multiple properties with multiple tenants. |
| (6) | Excludes 18 mortgage loans that are interest-only for the entire term. |
| (7) | For a more detailed description of Lockboxes, refer to “Description of the Mortgage Pool—Certain Terms of the Mortgage Loans—Mortgaged Property Accounts” in the Preliminary Prospectus. In the case of Loan No. 8, the loan is structured with a soft lockbox for residential tenants and a hard lockbox for commercial tenants and is considered a Soft Lockbox for calculations shown. |
| (8) | CapEx Reserves include FF&E reserves for hotel properties. |
| (9) | Calculated only with respect to the Cut-off Date Balance of mortgage loans secured or partially secured by office, retail, mixed use and industrial properties. |
THE INFORMATION IN THIS STRUCTURAL AND COLLATERAL TERM SHEET IS NOT COMPLETE AND MAY BE AMENDED PRIOR TO THE TIME OF SALE. THIS TERM SHEET IS NOT AN OFFER TO SELL THESE SECURITIES AND IT IS NOT A SOLICITATION OF AN OFFER TO BUY THESE SECURITIES IN ANY JURISDICTION WHERE THE OFFER OR SALE IS NOT PERMITTED.
6
| Structural and Collateral Term Sheet | BBCMS 2019-C3 | |
| Collateral Characteristics | ||
| Ten Largest Mortgage Loans | |||||||||||||
| No. | Loan Name | City, State | Mortgage Loan Seller | No. of Prop. | Cut-off Date Balance | % of IPB | Square Feet / Rooms / Units | Property Type | UW NCF DSCR(1) | UW NOI Debt Yield(1)(2) | Cut-off Date LTV(1)(3) | Maturity Date LTV(1)(3) | |
| 1 | SSTII Self Storage Portfolio II | Various, Various | KeyBank | 10 | $57,200,000 | 6.1% | 6,903 | Self Storage | 1.74x | 8.9% | 59.4% | 59.4% | |
| 2 | Vanguard Portfolio | Malvern, PA | Natixis | 4 | $55,000,000 | 5.9% | 568,658 | Office | 2.03x | 10.1% | 61.8% | 61.8% | |
| 3 | GNL Industrial Portfolio | Various, Various | SGFC | 16 | $48,750,000 | 5.2% | 2,443,208 | Industrial | 1.98x | 9.8% | 65.0% | 65.0% | |
| 4 | SWVP Portfolio | Various, Various | SGFC | 4 | $45,000,000 | 4.8% | 1,192 | Hotel | 2.04x | 11.9% | 59.6% | 59.6% | |
| 5 | Renaissance Fort Lauderdale | Fort Lauderdale, FL | Barclays | 1 | $42,275,000 | 4.5% | 236 | Hotel | 2.29x | 13.2% | 60.9% | 60.9% | |
| 6 | ATRIA Corporate Center | Plymouth, MN | Barclays | 1 | $41,250,000 | 4.4% | 360,047 | Office | 1.65x | 12.1% | 71.6% | 61.8% | |
| 7 | Inland Devon Self Storage Portfolio | Various, Various | Barclays | 21 | $41,000,000 | 4.4% | 10,824 | Self Storage | 1.63x | 9.7% | 57.8% | 52.6% | |
| 8 | NEMA San Francisco | San Francisco, CA | Natixis | 1 | $35,000,000 | 3.7% | 754 | Multifamily | 2.27x | 10.3% | 37.7% | 37.7% | |
| 9 | 787 Eleventh Avenue | New York, NY | SGFC | 1 | $30,000,000 | 3.2% | 513,638 | Mixed Use | 3.01x | 14.4% | 26.9% | 26.9% | |
| 10 | The Colonnade Office Complex | Addison, TX | UBS AG | 1 | $30,000,000 | 3.2% | 1,080,180 | Office | 3.87x | 19.1% | 30.2% | 30.2% | |
| Top 3 Total/Weighted Average | 30 | $160,950,000 | 17.2% | 1.91x | 9.6% | 61.9% | 61.9% | ||||||
| Top 5 Total/Weighted Average | 35 | $248,225,000 | 26.5% | 2.00x | 10.6% | 61.3% | 61.3% | ||||||
| Top 10 Total/Weighted Average | 60 | $425,475,000 | 45.4% | 2.16x | 11.5% | 55.4% | 54.0% | ||||||
| Non-Top 10 Total/Weighted Average | 457 | $511,174,542 | 54.6% | 1.74x | 11.0% | 64.2% | 57.8% | ||||||
| (1) | In the case of Loan Nos. 1, 2, 3, 4, 7, 8, 9 and 10, the UW NCF DSCR, UW NOI Debt Yield, Cut-off Date LTV and Maturity Date LTV calculations include the related Pari Passu Companion Loan(s). In the case of Loan Nos. 2, 8, 9 and 10, the UW NCF DSCR, UW NOI Debt Yield, Cut-off Date LTV and Maturity Date LTV calculations exclude the related Subordinate Companion Loans. |
| (2) | In the case of Loan No. 21, the UW NOI Debt Yield calculation includes a deduction for a holdback reserve in the amount of $2,200,000, to be released to the borrower (at the borrower’s request) provided that the debt yield (as calculated in the loan documents) at the mortgaged property is not less than 9.0%. The U/W NOI Debt Yield and U/W NCF Debt Yield are calculated net of the $2,200,000 achievement reserve. The unadjusted U/W NOI Debt Yield and U/W NCF Debt Yield are 8.8% and 8.7%, respectively, based on the full Cut-Off Date Balance. All LTVs and DSCRs are calculated assuming the full loan amount of $84,000,000. |
| (3) | In the case of Loan Nos. 1, 4 and 5, the Cut-off Date LTV and the Maturity Date LTV are calculated by using an appraised value based on certain hypothetical assumptions. Refer to “Description of the Mortgage Pool—Assessment of Property Value and Condition” and “—Appraised Value” in the Preliminary Prospectus for additional details. |
THE INFORMATION IN THIS STRUCTURAL AND COLLATERAL TERM SHEET IS NOT COMPLETE AND MAY BE AMENDED PRIOR TO THE TIME OF SALE. THIS TERM SHEET IS NOT AN OFFER TO SELL THESE SECURITIES AND IT IS NOT A SOLICITATION OF AN OFFER TO BUY THESE SECURITIES IN ANY JURISDICTION WHERE THE OFFER OR SALE IS NOT PERMITTED.
7
| Structural and Collateral Term Sheet | BBCMS 2019-C3 | |
| Collateral Characteristics | ||
| Pari Passu Companion Loan Summary | |||||||||
No. | Loan Name | Mortgage Loan Seller | Trust Cut-off Date Balance | Total Mortgage Loan Cut-off Date Balance(1) | Controlling Pooling/Trust & Servicing Agreement | Master Servicer | Special Servicer | Related Pari Passu Loan(s) Securitizations | Related Pari Passu Loan(s) Original Balance |
| 1 | SSTII Self Storage Portfolio II | KeyBank | $57,200,000 | $104,000,000 | BBCMS 2019-C3 | Midland | Midland | CF 2019-CF1 | $46,800,000 |
| 2 | Vanguard Portfolio | Natixis | $55,000,000 | $116,842,500 | BBCMS 2019-C3(2) | Midland | Midland | Future Securitization(s) | $61,842,500 |
| 3 | GNL Industrial Portfolio | SGFC | $48,750,000 | $97,500,000 | (3) | (3) | (3) | Future Securitization(s) | $48,750,000 |
| 4 | SWVP Portfolio | SGFC | $45,000,000 | $200,000,000 | BBCMS 2019-C3 | Midland | Midland | Future Securitization(s) | $155,000,000 |
| 7 | Inland Devon Self Storage Portfolio | Barclays | $41,000,000 | $71,000,000 | BBCMS 2019-C3 | Midland | Midland | WFCM 2019-C50(4) | $30,000,000 |
| 8 | NEMA San Francisco | Natixis | $35,000,000 | $205,000,000 | NCMS 2019-NEMA(2) | KeyBank | Situs | NCMS 2019-NEMA Future Securitization(s) | $130,000,000 $40,000,000 |
| 9 | 787 Eleventh Avenue | SGFC | $30,000,000 | $175,000,000 | SGCMS 2019-787E(2) | Wells | AEGON | SGCMS 2019-787E, CSAIL 2019-C15, Future Securitization(s) | $70,000,000 $45,000,000 $30,000,000 |
| 10 | The Colonnade Office Complex | UBS AG | $30,000,000 | $105,000,000 | UBS 2019-C16(2) | Midland | Midland | UBS 2019-C16, WFCM 2019-C50(4) | $47,000,000 $28,000,000 |
| 11 | Wolverine Portfolio | UBS AG | $30,000,000 | $59,000,000 | BBCMS 2019-C3 | Midland | Midland | WFCM 2019-C50(4) | $29,000,000 |
| 13 | Kings Mountain Center | SGFC | $25,000,000 | $42,000,000 | BBCMS 2019-C3 | Midland | Midland | Future Securitization(s) | $17,000,000 |
| 18 | ExchangeRight Net Leased Portfolio 26 | SGFC | $20,000,000 | $55,000,000 | (3) | (3) | (3) | Future Securitization(s) | $35,000,000 |
| 19 | Patuxent Crossing | Barclays | $20,000,000 | $36,575,000 | BBCMS 2019-C3 | Midland | Midland | Future Securitization(s) | $16,575,000 |
| 21 | The Block Northway | UBS AG | $17,000,000 | $84,000,000 | BBCMS 2019-C3 | Midland | Midland | WFCM 2019-C50(4) UBS 2019-C16 Future Securitization(s) | $25,000,000 $23,000,000 $19,000,000 |
| 22 | Goodyear Portfolio | RMF | $16,000,000 | $50,500,000 | WFCM 2019-C50(2)(4) | Wells | Rialto | WFCM 2019-C50(4) | $34,500,000 |
| 23 | ExchangeRight Net Leased Portfolio 24 | SGFC | $15,000,000 | $54,165,000 | CSAIL 2019-C15 | Midland | Midland | CSAIL 2019-C15 UBS 2018-C15 | $35,000,000 $4,165,000 |
| 26 | Heartland Dental Medical Office Portfolio | UBS AG | $14,396,111 | $179,206,759 | WFCM 2019-C50(4) | Wells | Rialto | UBS 2018-C14 WFCM 2019-C50(4) UBS 2018-C15 UBS 2019-C16 Future Securitization(s) | $44,000,000 $22,000,000 $55,000,000 $25,000,000 $20,000,000 |
| 32 | ILPT Hawaii Portfolio | UBS AG | $10,000,000 | $650,000,000 | ILPT 2019-SURF | Midland | Rialto | ILPT Trust 2019-SURF BANK 2019-BNK17 UBS 2019-C16 Future Securitization(s) | $390,000,000 $50,000,000 $23,000,000 $177,000,000 |
| 33 | Southern Motion Industrial Portfolio | UBS AG | $10,000,000 | $41,690,000 | UBS 2019-C16 | Midland | Midland | UBS 2019-C16 | $31,690,000 |
THE INFORMATION IN THIS STRUCTURAL AND COLLATERAL TERM SHEET IS NOT COMPLETE AND MAY BE AMENDED PRIOR TO THE TIME OF SALE. THIS TERM SHEET IS NOT AN OFFER TO SELL THESE SECURITIES AND IT IS NOT A SOLICITATION OF AN OFFER TO BUY THESE SECURITIES IN ANY JURISDICTION WHERE THE OFFER OR SALE IS NOT PERMITTED.
8
| Structural and Collateral Term Sheet | BBCMS 2019-C3 | |
| Collateral Characteristics | ||
| Pari Passu Companion Loan Summary | |||||||||
No. | Loan Name | Mortgage Loan Seller | Trust Cut-off Date Balance | Total Mortgage Loan Cut-off Date Balance(1) | Controlling Pooling/Trust & Servicing Agreement | Master Servicer | Special Servicer | Related Pari Passu Loan(s) Securitizations | Related Pari Passu Loan(s) Original Balance |
| 36 | Christiana Mall | SGFC | $9,704,000 | $338,000,000 | BBCMS 2018-CHRS | Wells | Wells | BBCMS 2018-CHRS WFCM 2018-C47 BBCMS 2018-C2 WFCM 2018-C48 UBS 2018-C13 UBS 2018-C14 UBS 2018-C15 DBGS 2018-C1 | $284,320,000 $50,000,000 $54,840,000 $28,000,000 $30,000,000 $30,000,000 $10,000,000 $53,136,000 |
| (1) | In the case of Loan Nos. 2, 8, 9, 10, 22 and 36, the Total Mortgage Loan Cut-off Date Balance excludes the related Subordinate Companion Loans. |
| (2) | Control rights are currently exercised by the holder of the related Subordinate Companion Loan until the occurrence and during the continuance of a control appraisal period for the related Whole Loan, as described under “Description of the Mortgage Pool—The Whole Loans—The Non-Serviced AB Whole Loans”in the Preliminary Prospectus. |
| (3) | In the case of Loan Nos. 3 and 19, the related whole loan will be serviced under the BBCMS 2019-C3 pooling and servicing agreement until such time that the controllingpari passu companion loan is securitized, at which point the whole loan will be serviced under the related pooling and servicing agreement. The initial controlling noteholder is Column, or an affiliate, as holder of the related controllingpari passu companion loan. |
| (4) | The WFCM 2019-C50 securitization is expected to close on or about May 14, 2019. |
| Additional Debt Summary |
No. | Loan Name | Trust | Pari Passu Loan(s) Cut-off Date Balance | Subordinate Debt Cut-off Date Balance(1) | Total Debt Cut-off Date Balance | Mortgage Loan UW NCF DSCR(2) | Total Debt UW NCF DSCR | Mortgage Loan | Total Debt Cut-off Date LTV | Mortgage Loan UW NOI Debt Yield(2) | Total Debt UW NOI Debt Yield |
| 2 | Vanguard Portfolio | $55,000,000 | $61,842,500 | $12,982,500 | $129,825,000 | 2.03x | 1.68x | 61.8% | 68.6% | 10.1% | 9.0% |
| 8 | NEMA San Francisco | $35,000,000 | $170,000,000 | $179,000,000 | $384,000,000 | 2.27x | 1.15x | 37.7% | 70.6% | 10.3% | 5.5% |
| 9 | 787 Eleventh Avenue | $30,000,000 | $145,000,000 | $235,000,000 | $410,000,000 | 3.01x | 1.17x | 26.9% | 63.1% | 14.4% | 6.2% |
| 10 | The Colonnade Office Complex | $30,000,000 | $75,000,000 | $135,000,000 | $240,000,000 | 3.87x | 1.35x | 30.2% | 69.0% | 19.1% | 8.4% |
| 22 | Goodyear Portfolio | $16,000,000 | $34,500,000 | $9,861,676 | $60,361,676 | 2.22x | 1.38x | 57.2% | 68.4% | 11.1% | 9.3% |
| 36 | Christiana Mall | $9,704,000 | $328,296,000 | $212,000,000 | $550,000,000 | 3.15x | 1.93x | 32.5% | 52.9% | 13.8% | 8.5% |
| (1) | In the case of Loan Nos. 2, 8, 9, 22 and 36, subordinate debt represents one or more Subordinate Companion Loans. In the case of Loan No. 10, subordinate debt represents one or more Subordinate Companion Loans and a mezzanine loan. |
| (2) | In the case of Loan Nos. 2, 8, 9, 10, 22 and 36, Mortgage Loan UW NCF DSCR, Mortgage Loan Cut-off Date LTV and Mortgage Loan UW NOI Debt Yield calculations include any related Pari Passu Companion Loans, but exclude the related Subordinate Companion Loans. |
THE INFORMATION IN THIS STRUCTURAL AND COLLATERAL TERM SHEET IS NOT COMPLETE AND MAY BE AMENDED PRIOR TO THE TIME OF SALE. THIS TERM SHEET IS NOT AN OFFER TO SELL THESE SECURITIES AND IT IS NOT A SOLICITATION OF AN OFFER TO BUY THESE SECURITIES IN ANY JURISDICTION WHERE THE OFFER OR SALE IS NOT PERMITTED.
9
| Structural and Collateral Term Sheet | BBCMS 2019-C3 | |
| Collateral Characteristics | ||
| Mortgaged Properties by Type(1) |
Weighted Average
| ||||||||
| Property Type | Property Subtype | Number of Properties | Cut-off Date Principal Balance | % of IPB | UW NCF DSCR(2)(3) | UW NOI Debt Yield(2)(4) | Cut-off Date LTV(2)(5) | Maturity Date LTV(2)(5) |
| Office | Suburban | 13 | $187,720,000 | 20.0% | 2.08x | 12.3% | 62.4% | 56.9% |
| Data Center | 1 | 25,000,000 | 2.7% | 1.75x | 11.5% | 56.0% | 51.4% | |
| CBD | 1 | 21,000,000 | 2.2% | 1.76x | 9.2% | 64.8% | 64.8% | |
| Medical | 149 | 15,144,012 | 1.6% | 1.69x | 11.3% | 56.6% | 50.0% | |
| Subtotal: | 164 | $248,864,012 | 26.6% | 1.99x | 11.9% | 61.6% | 56.6% | |
| Hotel | Full Service | 6 | $114,245,629 | 12.2% | 2.16x | 13.3% | 61.0% | 58.3% |
| Limited Service | 7 | 37,439,732 | 4.0% | 1.87x | 14.5% | 64.9% | 51.7% | |
| Extended Stay | 2 | 21,142,954 | 2.3% | 1.70x | 12.6% | 63.1% | 52.4% | |
| Select Service | 1 | 13,570,000 | 1.4% | 1.96x | 14.2% | 64.0% | 56.6% | |
| Subtotal: | 16 | $186,398,314 | 19.9% | 2.04x | 13.6% | 62.2% | 56.2% | |
| Self Storage | Self Storage | 33 | $125,850,000 | 13.4% | 1.73x | 9.1% | 59.1% | 57.0% |
| Retail | Anchored | 5 | $57,568,975 | 6.1% | 1.58x | 10.8% | 68.7% | 60.3% |
| Freestanding | 41 | 37,185,406 | 4.0% | 1.94x | 9.3% | 61.2% | 61.2% | |
| Unanchored | 2 | 10,415,000 | 1.1% | 1.41x | 9.7% | 69.0% | 59.7% | |
| Super Regional Mall | 1 | 9,704,000 | 1.0% | 3.15x | 13.8% | 32.5% | 32.5% | |
| Subtotal: | 49 | $114,873,380 | 12.3% | 1.81x | 10.5% | 63.2% | 58.2% | |
| Industrial | Flex | 14 | $42,658,540 | 4.6% | 1.95x | 11.2% | 62.8% | 60.1% |
| Warehouse/Distribution | 14 | 37,615,374 | 4.0% | 1.80x | 9.7% | 64.4% | 62.5% | |
| Manufacturing | 9 | 20,700,000 | 2.2% | 1.86x | 10.8% | 65.3% | 60.9% | |
| Warehouse | 2 | 4,080,000 | 0.4% | 1.95x | 10.0% | 65.5% | 64.7% | |
| Subtotal: | 39 | $105,053,914 | 11.2% | 1.88x | 10.5% | 64.0% | 61.3% | |
| Multifamily | Garden | 2 | $38,727,856 | 4.1% | 1.51x | 8.8% | 69.3% | 64.0% |
| High Rise | 1 | 35,000,000 | 3.7% | 2.27x | 10.3% | 37.7% | 37.7% | |
| Subtotal: | 3 | $73,727,856 | 7.9% | 1.87x | 9.5% | 54.3% | 51.5% | |
| Manufactured Housing | Manufactured Housing | 11 | $39,840,000 | 4.3% | 1.34x | 8.3% | 67.1% | 62.0% |
| Mixed Use | Retail/Office | 1 | $30,000,000 | 3.2% | 3.01x | 14.4% | 26.9% | 26.9% |
| Medical/Retail | 23 | 2,566,693 | 0.3% | 1.59x | 11.8% | 55.1% | 46.6% | |
| Subtotal: | 24 | $32,566,693 | 3.5% | 2.90x | 14.2% | 29.1% | 28.5% | |
| Other | Leased Fee | 177 | $9,440,087 | 1.0% | 2.40x | 10.6% | 45.2% | 45.2% |
| Parking | 1 | 35,286 | 0.0% | 2.40x | 10.6% | 45.2% | 45.2% | |
| Subtotal: | 178 | $9,475,373 | 1.0% | 2.40x | 10.6% | 45.2% | 45.2% | |
| Total / Weighted Average: | 517 | $936,649,542 | 100.0% | 1.93x | 11.2% | 60.2% | 56.0% | |
| (1) | Because this table presents information relating to the mortgaged properties and not mortgage loans, the information for mortgage loans secured by more than one mortgaged property is based on allocated loan amounts. |
| (2) | In the case of Loan Nos. 1, 2, 3, 4, 7, 8, 9, 10, 11, 13, 18, 19, 21, 22, 23, 26, 32, 33 and 36, the UW NCF DSCR, UW NOI Debt Yield, Cut-off Date LTV and Maturity Date LTV calculations include the related Pari Passu Companion Loan(s). In the case of Loan Nos. 2, 8, 9, 10, 22 and 36, the UW NCF DSCR, UW NOI Debt Yield, Cut-off Date LTV and Maturity Date LTV calculations exclude the related Subordinate Companion Loans. |
| (3) | For the mortgage loans that are interest-only for the entire term and accrue interest on an Actual/360 basis, the Monthly Debt Service Amount ($) was calculated as 1/12th of the product of (i) the Original Balance ($), (ii) the Interest Rate % and (iii) 365/360. In the case of Loan No. 22, the UW NCF DSCR was calculated using the sum of interest payments over the first 12 months following the Cut-off Date, as the Whole Loan amortizes on a 30-year amortization schedule with all amortization being applied to the Note B through April 1, 2029 as provided on Annex F in the Preliminary Prospectus. |
| (4) | In the case of Loan No. 21, the UW NOI Debt Yield calculation includes a deduction for a holdback reserve in the amount of $2,200,000, to be released to the borrower (at the borrower’s request) provided that the debt yield (as calculated in the loan documents) at the mortgaged property is not less than 9.0%. The U/W NOI Debt Yield and U/W NCF Debt Yield are calculated net of the $2,200,000 achievement reserve. The unadjusted U/W NOI Debt Yield and U/W NCF Debt Yield are 8.8% and 8.7%, respectively, based on the full Cut-Off Date Balance. All LTVs and DSCRs are calculated assuming the full loan amount of $84,000,000. |
| (5) | In the case of Loan Nos. 1, 4, 5, 33, 34 and 41, the Cut-off Date LTV and the Maturity Date LTV are calculated by using an appraised value based on certain hypothetical or as stabilized assumptions. Refer to “Description of the Mortgage Pool—Assessment of Property Value and Condition” and “—Appraised Value” in the Preliminary Prospectus for additional details. |
THE INFORMATION IN THIS STRUCTURAL AND COLLATERAL TERM SHEET IS NOT COMPLETE AND MAY BE AMENDED PRIOR TO THE TIME OF SALE. THIS TERM SHEET IS NOT AN OFFER TO SELL THESE SECURITIES AND IT IS NOT A SOLICITATION OF AN OFFER TO BUY THESE SECURITIES IN ANY JURISDICTION WHERE THE OFFER OR SALE IS NOT PERMITTED.
10
[THIS PAGE INTENTIONALLY LEFT BLANK]
11
| Structural and Collateral Term Sheet | BBCMS 2019-C3 | |
| Collateral Characteristics | ||
| Mortgaged Properties by Location(1) |

THE INFORMATION IN THIS STRUCTURAL AND COLLATERAL TERM SHEET IS NOT COMPLETE AND MAY BE AMENDED PRIOR TO THE TIME OF SALE. THIS TERM SHEET IS NOT AN OFFER TO SELL THESE SECURITIES AND IT IS NOT A SOLICITATION OF AN OFFER TO BUY THESE SECURITIES IN ANY JURISDICTION WHERE THE OFFER OR SALE IS NOT PERMITTED.
12
| Structural and Collateral Term Sheet | BBCMS 2019-C3 | |
| Collateral Characteristics | ||
| Mortgaged Properties by Location(1) |
Weighted Average | ||||||||||
State | Number of Properties | Cut-off Date Principal Balance | % of IPB |
| UW NCF DSCR(2)(3) | UW NOI Debt Yield(2)(4) | Cut-off Date LTV(2)(5) | Maturity Date LTV(2)(5) | ||
| California | 12 | $120,943,153 | 12.9% | 1.85x | 9.9% | 54.8% | 51.9% | |||
| Florida | 54 | 93,243,789 | 10.0% | 1.98x | 11.9% | 61.7% | 59.0% | |||
| Pennsylvania | 8 | 72,824,148 | 7.8% | 1.88x | 9.8% | 63.4% | 62.1% | |||
| Texas | 27 | 72,611,531 | 7.8% | 2.71x | 14.9% | 49.2% | 46.1% | |||
| North Carolina | 6 | 61,421,391 | 6.6% | 1.75x | 11.2% | 59.9% | 55.4% | |||
| New York | 3 | 60,300,000 | 6.4% | 2.31x | 11.5% | 46.5% | 46.5% | |||
| Minnesota | 4 | 45,940,027 | 4.9% | 1.68x | 11.8% | 70.6% | 61.8% | |||
| Ohio | 17 | 31,898,594 | 3.4% | 2.06x | 10.3% | 61.0% | 60.5% | |||
| Michigan | 10 | 30,938,195 | 3.3% | 1.44x | 8.7% | 68.7% | 63.3% | |||
| Louisiana | 3 | 30,876,293 | 3.3% | 2.01x | 12.0% | 60.3% | 58.3% | |||
| Wisconsin | 12 | 30,800,483 | 3.3% | 1.76x | 12.2% | 68.6% | 59.5% | |||
| Massachusetts | 3 | 28,009,031 | 3.0% | 1.53x | 8.9% | 65.8% | 61.1% | |||
| Colorado | 2 | 27,091,928 | 2.9% | 2.15x | 16.0% | 63.5% | 52.1% | |||
| District of Columbia | 1 | 21,000,000 | 2.2% | 1.76x | 9.2% | 64.8% | 64.8% | |||
| Oregon | 2 | 20,227,856 | 2.2% | 1.57x | 9.3% | 70.1% | 59.9% | |||
| Maryland | 3 | 20,233,005 | 2.2% | 1.56x | 10.7% | 74.7% | 63.9% | |||
| Alabama | 4 | 19,101,128 | 2.0% | 1.62x | 11.2% | 69.1% | 60.8% | |||
| Tennessee | 24 | 18,983,953 | 2.0% | 1.67x | 9.8% | 58.1% | 53.3% | |||
| Illinois | 31 | 16,937,945 | 1.8% | 1.89x | 11.8% | 64.9% | 57.9% | |||
| Mississippi | 7 | 15,650,000 | 1.7% | 1.82x | 11.1% | 65.4% | 59.6% | |||
| Nevada | 3 | 14,974,953 | 1.6% | 1.74x | 8.9% | 59.4% | 59.4% | |||
| Indiana | 16 | 12,638,962 | 1.3% | 1.68x | 12.2% | 63.3% | 54.3% | |||
| Virginia | 5 | 11,021,611 | 1.2% | 1.43x | 9.7% | 68.5% | 59.6% | |||
| Hawaii | 186 | 10,000,000 | 1.1% | 2.40x | 10.6% | 45.2% | 45.2% | |||
| Delaware | 1 | 9,704,000 | 1.0% | 3.15x | 13.8% | 32.5% | 32.5% | |||
| South Carolina | 19 | 9,660,741 | 1.0% | 1.72x | 9.2% | 58.9% | 58.0% | |||
| Georgia | 19 | 9,428,882 | 1.0% | 1.88x | 12.3% | 62.4% | 53.5% | |||
| New Mexico | 3 | 5,394,670 | 0.6% | 2.13x | 16.0% | 61.6% | 49.2% | |||
| Washington | 1 | 4,481,373 | 0.5% | 1.73x | 13.6% | 66.9% | 56.7% | |||
| Connecticut | 1 | 2,626,787 | 0.3% | 1.41x | 13.0% | 73.6% | 62.5% | |||
| Idaho | 1 | 2,250,000 | 0.2% | 1.98x | 9.8% | 65.0% | 65.0% | |||
| Iowa | 1 | 1,504,016 | 0.2% | 2.04x | 9.5% | 62.0% | 62.0% | |||
| Missouri | 8 | 1,059,216 | 0.1% | 1.59x | 11.8% | 55.1% | 46.6% | |||
| Nebraska | 3 | 956,948 | 0.1% | 1.92x | 10.1% | 63.4% | 62.0% | |||
| Kansas | 2 | 864,945 | 0.1% | 1.95x | 10.0% | 64.3% | 63.6% | |||
| Oklahoma | 5 | 359,448 | 0.0% | 1.59x | 11.8% | 55.1% | 46.6% | |||
| Kentucky | 4 | 286,950 | 0.0% | 1.59x | 11.8% | 55.1% | 46.6% | |||
| Arizona | 3 | 205,667 | 0.0% | 1.59x | 11.8% | 55.1% | 46.6% | |||
| Arkansas | 2 | 170,566 | 0.0% | 1.59x | 11.8% | 55.1% | 46.6% | |||
| New Hampshire | 1 | 27,357 | 0.0% | 1.59x | 11.8% | 55.1% | 46.6% | |||
| Total / Weighted Average: | 517 | $936,649,542 | 100.0% | 1.93x | 11.2% | 60.2% | 56.0% | |||
| (1) | Because this table presents information relating to the mortgaged properties and not mortgage loans, the information for mortgage loans secured by more than one mortgaged property is based on allocated loan amounts. |
| (2) | In the case of Loan Nos. 1, 2, 3, 4, 7, 8, 9, 10, 11, 13, 18, 19, 21, 22, 23, 26, 32, 33 and 36, the UW NCF DSCR, UW NOI Debt Yield, Cut-off Date LTV and Maturity Date LTV calculations include the related Pari Passu Companion Loan(s). In the case of Loan Nos. 2, 8, 9, 10, 22 and 36, the UW NCF DSCR, UW NOI Debt Yield, Cut-off Date LTV and Maturity Date LTV calculations exclude the related Subordinate Companion Loans. |
| (3) | For the mortgage loans that are interest-only for the entire term and accrue interest on an Actual/360 basis, the Monthly Debt Service Amount ($) was calculated as 1/12th of the product of (i) the Original Balance ($), (ii) the Interest Rate % and (iii) 365/360. In the case of Loan No. 22, the UW NCF DSCR was calculated using the sum of interest payments over the first 12 months following the Cut-off Date, as the Whole Loan amortizes on a 30-year amortization schedule with all amortization being applied to the Note B through April 1, 2029 as provided on Annex F in the Preliminary Prospectus. |
| (4) | In the case of Loan No. 21, the UW NOI Debt Yield calculation includes a deduction for a holdback reserve in the amount of $2,200,000, to be released to the borrower (at the borrower’s request) provided that the debt yield (as calculated in the loan documents) at the mortgaged property is not less than 9.0%. The U/W NOI Debt Yield and U/W NCF Debt Yield are calculated net of the $2,200,000 achievement reserve. The unadjusted U/W NOI Debt Yield and U/W NCF Debt Yield are 8.8% and 8.7%, respectively, based on the full Cut-Off Date Balance. All LTVs and DSCRs are calculated assuming the full loan amount of $84,000,000. |
| (5) | In the case of Loan Nos. 1, 4, 5, 33, 34 and 41, the Cut-off Date LTV and the Maturity Date LTV are calculated by using an appraised value based on certain hypothetical or as stabilized assumptions. Refer to “Description of the Mortgage Pool—Assessment of Property Value and Condition” and “—Appraised Value” in the Preliminary Prospectus for additional details. |
THE INFORMATION IN THIS STRUCTURAL AND COLLATERAL TERM SHEET IS NOT COMPLETE AND MAY BE AMENDED PRIOR TO THE TIME OF SALE. THIS TERM SHEET IS NOT AN OFFER TO SELL THESE SECURITIES AND IT IS NOT A SOLICITATION OF AN OFFER TO BUY THESE SECURITIES IN ANY JURISDICTION WHERE THE OFFER OR SALE IS NOT PERMITTED.
13
| Structural and Collateral Term Sheet | BBCMS 2019-C3 | |
| Collateral Characteristics | ||
| Cut-off Date Principal Balance |
Weighted Average | |||||||||||
| Range of Cut-off Date Principal Balances | Number of Loans | Cut-off Date Principal Balance | % of IPB | Mortgage Rate | Remaining Loan Term | UW NCF DSCR(1)(2) | UW NOI DY(1)(3) | Cut-off Date LTV(1)(4) | Maturity Date LTV(1)(4) | ||
| $2,626,787 | - | $9,999,999 | 17 | $111,084,377 | 11.9% | 5.10236% | 117 | 1.83x | 12.3% | 62.9% | 54.0% |
| $10,000,000 | - | $19,999,999 | 14 | 191,619,537 | 20.5% | 4.85609% | 117 | 1.73x | 10.9% | 64.4% | 57.7% |
| $20,000,000 | - | $29,999,999 | 8 | 178,470,629 | 19.1% | 4.77948% | 118 | 1.77x | 10.7% | 64.0% | 59.3% |
| $30,000,000 | - | $39,999,999 | 4 | 125,000,000 | 13.3% | 4.60167% | 102 | 2.60x | 12.9% | 41.0% | 39.4% |
| $40,000,000 | - | $49,999,999 | 5 | 218,275,000 | 23.3% | 4.66968% | 118 | 1.92x | 11.3% | 63.0% | 60.2% |
| $50,000,000 | - | $57,200,000 | 2 | 112,200,000 | 12.0% | 4.93137% | 115 | 1.88x | 9.5% | 60.6% | 60.6% |
| Total / Weighted Average: | 50 | $936,649,542 | 100.0% | 4.80232% | 115 | 1.93x | 11.2% | 60.2% | 56.0% | ||
| Mortgage Interest Rates |
Weighted Average | |||||||||||
| Range of Mortgage Interest Rates | Number of Loans | Cut-off Date Principal Balance | % of IPB | Mortgage Rate | Remaining Loan Term(1) | UW NCF DSCR(1)(2) | UW NOI DY(1)(3) | Cut-off Date LTV(1)(4) | Maturity Date LTV(1)(4) | ||
| 4.14000 | - | 4.49999 | 6 | $165,454,000 | 17.7% | 4.35044% | 117 | 2.05x | 10.0% | 53.3% | 52.0% |
| 4.50000 | - | 4.99999 | 26 | 562,805,530 | 60.1% | 4.78936% | 114 | 2.00x | 11.9% | 61.1% | 56.6% |
| 5.00000 | - | 5.49999 | 14 | 181,210,752 | 19.3% | 5.11987% | 117 | 1.64x | 10.2% | 63.7% | 58.9% |
| 5.50000 | - | 5.94000 | 4 | 27,179,261 | 2.9% | 5.70452% | 115 | 1.66x | 13.0% | 60.7% | 50.3% |
| Total / Weighted Average: | 50 | $936,649,542 | 100.0% | 4.80232% | 115 | 1.93x | 11.2% | 60.2% | 56.0% | ||
| Original Term to Maturity in Months |
Weighted Average | |||||||||
| Original Term to Maturity in Months | Number of Loans | Cut-off Date Principal Balance | % of IPB | Mortgage Rate | Remaining Loan Term(1) | UW NCF DSCR(1)(2) | UW NOI DY(1)(3) | Cut-off Date LTV(1)(4) | Maturity Date LTV(1)(4) |
| 60 | 1 | $30,000,000 | 3.2% | 4.56800% | 56 | 3.87x | 19.1% | 30.2% | 30.2% |
| 120 | 49 | 906,649,542 | 96.8% | 4.81008% | 117 | 1.86x | 11.0% | 61.2% | 56.9% |
| Total / Weighted Average: | 50 | $936,649,542 | 100.0% | 4.80232% | 115 | 1.93x | 11.2% | 60.2% | 56.0% |
| Remaining Term to Maturity in Months |
| Weighted Average | |||||||||||||||
| Range of Remaining Term to Maturity in Months | Number of Loans | Cut-off Date Principal Balance | % of IPB | Mortgage Rate | Remaining Loan Term(1) | UW NCF DSCR(1)(2) | UW NOI DY(1)(3) | Cut-off Date LTV(1)(4) | Maturity Date LTV(1)(4) | ||||||
| 56 | - | 60 | 1 | $30,000,000 | 3.2% | 4.56800% | 56 | 3.87x | 19.1% | 30.2% | 30.2% | ||||
| 110 | - | 119 | 49 | 906,649,542 | 96.8% | 4.81008% | 117 | 1.86x | 11.0% | 61.2% | 56.9% | ||||
| Total / Weighted Average: | 50 | $936,649,542 | 100.0% | 4.80232% | 115 | 1.93x | 11.2% | 60.2% | 56.0% | ||||||
| (1) | In the case of Loan Nos. 1, 2, 3, 4, 7, 8, 9, 10, 11, 13, 18, 19, 21, 22, 23, 26, 32, 33 and 36, the UW NCF DSCR, UW NOI Debt Yield, Cut-off Date LTV and Maturity Date LTV calculations include the related Pari Passu Companion Loan(s). In the case of Loan Nos. 2, 8, 9, 10, 22 and 36, the UW NCF DSCR, UW NOI Debt Yield, Cut-off Date LTV and Maturity Date LTV calculations exclude the related Subordinate Companion Loans. |
| (2) | For the mortgage loans that are interest-only for the entire term and accrue interest on an Actual/360 basis, the Monthly Debt Service Amount ($) was calculated as 1/12th of the product of (i) the Original Balance ($), (ii) the Interest Rate % and (iii) 365/360. In the case of Loan No. 22, the UW NCF DSCR was calculated using the sum of interest payments over the first 12 months following the Cut-off Date, as the Whole Loan amortizes on a 30-year amortization schedule with all amortization being applied to the Note B through April 1, 2029 as provided on Annex F in the Preliminary Prospectus. |
| (3) | In the case of Loan No. 21, the UW NOI Debt Yield calculation includes a deduction for a holdback reserve in the amount of $2,200,000, to be released to the borrower (at the borrower’s request) provided that the debt yield (as calculated in the loan documents) at the mortgaged property is not less than 9.0%. The U/W NOI Debt Yield and U/W NCF Debt Yield are calculated net of the $2,200,000 achievement reserve. The unadjusted U/W NOI Debt Yield and U/W NCF Debt Yield are 8.8% and 8.7%, respectively, based on the full Cut-Off Date Balance. All LTVs and DSCRs are calculated assuming the full loan amount of $84,000,000. |
| (4) | In the case of Loan Nos. 1, 4, 5, 33, 34 and 41, the Cut-off Date LTV and the Maturity Date LTV are calculated by using an appraised value based on certain hypothetical or as stabilized assumptions. Refer to “Description of the Mortgage Pool—Assessment of Property Value and Condition” and “—Appraised Value” in the Preliminary Prospectus for additional details. |
THE INFORMATION IN THIS STRUCTURAL AND COLLATERAL TERM SHEET IS NOT COMPLETE AND MAY BE AMENDED PRIOR TO THE TIME OF SALE. THIS TERM SHEET IS NOT AN OFFER TO SELL THESE SECURITIES AND IT IS NOT A SOLICITATION OF AN OFFER TO BUY THESE SECURITIES IN ANY JURISDICTION WHERE THE OFFER OR SALE IS NOT PERMITTED.
14
| Structural and Collateral Term Sheet | BBCMS 2019-C3 | |
| Collateral Characteristics | ||
| Original Amortization Term in Months |
| Weighted Average | |||||||||
| Original Amortization Term in Months | Number of Loans | Cut-off Date Principal Balance | % of IPB | Mortgage Rate | Remaining Loan Term | UW NCF DSCR(1)(2) | UW NOI DY(1)(3) | Cut-off Date LTV(1)(4) | Maturity Date LTV(1)(4) |
| Interest Only | 18 | $495,269,000 | 52.9% | 4.74328% | 113 | 2.18x | 11.0% | 54.8% | 54.8% |
| 300 | 4 | 18,106,702 | 1.9% | 5.33608% | 118 | 1.95x | 15.7% | 63.7% | 48.3% |
| 360 | 28 | 423,273,841 | 45.2% | 4.84858% | 118 | 1.63x | 11.3% | 66.4% | 57.8% |
| Total / Weighted Average: | 50 | $936,649,542 | 100.0% | 4.80232% | 115 | 1.93x | 11.2% | 60.2% | 56.0% |
| Remaining Amortization Term in Months |
| Weighted Average | |||||||||||||||
| Range of Remaining Amortization Term in Months | Number of Loans | Cut-off Date Principal Balance | % of IPB | Mortgage Rate | Remaining Loan Term | UW NCF DSCR(1)(2) | UW NOI DY(1)(3) | Cut-off Date LTV(1)(4) | Maturity Date LTV(1)(4) | ||||||
| Interest Only | 18 | $495,269,000 | 52.9% | 4.74328% | 113 | 2.18x | 11.0% | 54.8% | 54.8% | ||||||
| 297 | - | 299 | 4 | 18,106,702 | 1.9% | 5.33608% | 118 | 1.95x | 15.7% | 63.7% | 48.3% | ||||
| 353 | - | 360 | 28 | 423,273,841 | 45.2% | 4.84858% | 118 | 1.63x | 11.3% | 66.4% | 57.8% | ||||
| Total / Weighted Average: | 50 | $936,649,542 | 100.0% | 4.80232% | 115 | 1.93x | 11.2% | 60.2% | 56.0% | ||||||
| Amortization Types |
Weighted Average | |||||||||
| Amortization Types | Number of Loans | Cut-off Date Principal Balance | % of IPB | Mortgage Rate | Remaining Loan Term | UW NCF DSCR(1)(2) | UW NOI DY(1)(3) | Cut-off Date LTV(1)(4) | Maturity Date LTV(1)(4) |
| Interest Only | 18 | $495,269,000 | 52.9% | 4.74328% | 113 | 2.18x | 11.0% | 54.8% | 54.8% |
| IO-Balloon | 18 | 318,607,500 | 34.0% | 4.76226% | 118 | 1.58x | 10.7% | 67.1% | 59.3% |
| Balloon | 14 | 122,773,042 | 13.1% | 5.14449% | 118 | 1.82x | 13.5% | 64.4% | 52.6% |
| Total / Weighted Average: | 50 | $936,649,542 | 100.0% | 4.80232% | 115 | 1.93x | 11.2% | 60.2% | 56.0% |
| Underwritten Net Cash Flow Debt Service Coverage Ratios(2)(4) |
| Weighted Average | ||||||||||||
| Range of Underwritten Net Cash Flow Debt Service Coverage Ratios | Number of Loans | Cut-off Date Principal Balance | % of IPB | Mortgage Rate | Remaining Loan Term | UW NCF DSCR(1)(2) | UW NOI DY(1)(3) | Cut-off Date LTV(1)(4) | Maturity Date LTV(1)(4) | |||
| 1.28x | - | 1.39x | 4 | $55,882,500 | 6.0% | 4.97829% | 117 | 1.32x | 8.8% | 69.1% | 61.8% | |
| 1.40x | - | 1.49x | 6 | 75,109,643 | 8.0% | 4.89395% | 118 | 1.44x | 9.6% | 69.0% | 60.7% | |
| 1.50x | - | 1.59x | 5 | 80,746,111 | 8.6% | 5.12356% | 117 | 1.56x | 10.5% | 68.1% | 61.2% | |
| 1.60x | - | 1.69x | 4 | 111,104,884 | 11.9% | 4.64539% | 118 | 1.64x | 11.1% | 65.4% | 57.5% | |
| 1.70x | 1.79x | 9 | 156,590,834 | 16.7% | 4.89827% | 117 | 1.75x | 10.4% | 61.1% | 57.7% | ||
| 1.80x | - | 1.99x | 10 | 137,772,444 | 14.7% | 4.67033% | 119 | 1.95x | 11.1% | 63.4% | 59.4% | |
| 2.00x | - | 2.99x | 9 | 249,739,128 | 26.7% | 4.79523% | 117 | 2.15x | 11.8% | 57.1% | 55.6% | |
| 3.00x | - | 3.87x | 3 | 69,704,000 | 7.4% | 4.51134% | 89 | 3.40x | 16.3% | 29.1% | 29.1% | |
| Total / Weighted Average: | 50 | $936,649,542 | 100.0% | 4.80232% | 115 | 1.93x | 11.2% | 60.2% | 56.0% | |||
| (1) | In the case of Loan Nos. 1, 2, 3, 4, 7, 8, 9, 10, 11, 13, 18, 19, 21, 22, 23, 26, 32, 33 and 36, the UW NCF DSCR, UW NOI Debt Yield, Cut-off Date LTV and Maturity Date LTV calculations include the related Pari Passu Companion Loan(s). In the case of Loan Nos. 2, 8, 9, 10, 22 and 36, the UW NCF DSCR, UW NOI Debt Yield, Cut-off Date LTV and Maturity Date LTV calculations exclude the related Subordinate Companion Loans. |
| (2) | For the mortgage loans that are interest-only for the entire term and accrue interest on an Actual/360 basis, the Monthly Debt Service Amount ($) was calculated as 1/12th of the product of (i) the Original Balance ($), (ii) the Interest Rate % and (iii) 365/360. In the case of Loan No. 22, the UW NCF DSCR was calculated using the sum of interest payments over the first 12 months following the Cut-off Date, as the Whole Loan amortizes on a 30-year amortization schedule with all amortization being applied to the Note B through April 1, 2029 as provided on Annex F in the Preliminary Prospectus. |
| (3) | In the case of Loan No. 21, the UW NOI Debt Yield calculation includes a deduction for a holdback reserve in the amount of $2,200,000, to be released to the borrower (at the borrower’s request) provided that the debt yield (as calculated in the loan documents) at the mortgaged property is not less than 9.0%. The U/W NOI Debt Yield and U/W NCF Debt Yield are calculated net of the $2,200,000 achievement reserve. The unadjusted U/W NOI Debt Yield and U/W NCF Debt Yield are 8.8% and 8.7%, respectively, based on the full Cut-Off Date Balance. All LTVs and DSCRs are calculated assuming the full loan amount of $84,000,000. |
| (4) | In the case of Loan Nos. 1, 4, 5, 33, 34 and 41, the Cut-off Date LTV and the Maturity Date LTV are calculated by using an appraised value based on certain hypothetical or as stabilized assumptions. Refer to “Description of the Mortgage Pool—Assessment of Property Value and Condition” and “—Appraised Value” in the Preliminary Prospectus for additional details. |
THE INFORMATION IN THIS STRUCTURAL AND COLLATERAL TERM SHEET IS NOT COMPLETE AND MAY BE AMENDED PRIOR TO THE TIME OF SALE. THIS TERM SHEET IS NOT AN OFFER TO SELL THESE SECURITIES AND IT IS NOT A SOLICITATION OF AN OFFER TO BUY THESE SECURITIES IN ANY JURISDICTION WHERE THE OFFER OR SALE IS NOT PERMITTED.
15
| Structural and Collateral Term Sheet | BBCMS 2019-C3 | |
| Collateral Characteristics | ||
| LTV Ratios as of the Cut-off Date(2)(4) |
| Weighted Average | |||||||||||
| Range of Cut-off Date LTVs | Number of Loans | Cut-off Date Principal Balance | % of IPB | Mortgage Rate | Remaining Loan Term | UW NCF DSCR(1)(2) | UW NOI DY(1)(3) | Cut-off Date LTV(1)(4) | Maturity Date LTV(1)(4) | ||
| 26.9% | - | 49.9% | 5 | $114,704,000 | 12.2% | 4.47079% | 100 | 2.97x | 14.0% | 33.1% | 33.1% |
| 50.0% | - | 59.9% | 9 | 234,936,111 | 25.1% | 4.79122% | 118 | 1.81x | 10.2% | 58.1% | 56.2% |
| 60.0% | - | 64.9% | 15 | 255,252,688 | 27.3% | 4.88006% | 117 | 1.98x | 11.9% | 62.6% | 58.3% |
| 65.0% | - | 69.9% | 13 | 216,652,102 | 23.1% | 4.86099% | 118 | 1.64x | 10.3% | 67.4% | 61.9% |
| 70.0% | - | 74.9% | 8 | 115,104,643 | 12.3% | 4.87254% | 118 | 1.56x | 11.0% | 72.8% | 62.4% |
| Total / Weighted Average: | 50 | $936,649,542 | 100.0% | 4.80232% | 115 | 1.93x | 11.2% | 60.2% | 56.0% | ||
| LTV Ratios as of the Maturity Date(1)(2)(4) |
Weighted Average | |||||||||||
| Range of Maturity Date LTVs | Number of Loans | Cut-off Date Principal Balance | % of IPB | Mortgage Rate | Remaining Loan Term | UW NCF DSCR(1)(2) | UW NOI DY(1)(3) | Cut-off Date LTV(1)(4) | Maturity Date LTV(1)(4) | ||
| 26.9% | - | 49.9% | 10 | $147,206,812 | 15.7% | 4.69744% | 103 | 2.71x | 14.0% | 39.0% | 36.3% |
| 50.0% | - | 59.9% | 20 | 347,873,088 | 37.1% | 4.82966% | 118 | 1.82x | 11.2% | 60.7% | 56.1% |
| 60.0% | - | 64.9% | 18 | 368,819,643 | 39.4% | 4.82418% | 117 | 1.74x | 10.6% | 67.2% | 62.0% |
| 65.0% | - | 66.1% | 2 | 72,750,000 | 7.8% | 4.77304% | 119 | 1.83x | 9.3% | 65.4% | 65.4% |
| Total / Weighted Average: | 50 | $936,649,542 | 100.0% | 4.80232% | 115 | 1.93x | 11.2% | 60.2% | 56.0% | ||
| Prepayment Protection |
Weighted Average | |||||||||
| Prepayment Protection | Number of Loans | Cut-off Date Principal Balance | % of IPB | Mortgage Rate | Remaining Loan Term | UW NCF DSCR(1)(2) | UW NOI DY(1)(3) | Cut-off Date LTV(1)(4) | Maturity Date LTV(1)(4) |
| Defeasance | 41 | $736,108,789 | 78.6% | 4.86519% | 115 | 1.92x | 11.3% | 61.4% | 57.1% |
| Defeasance or Yield Maintenance | 4 | $67,626,787 | 7.2% | 4.59674% | 117 | 2.39x | 12.7% | 42.2% | 40.0% |
| Yield Maintenance | 5 | 132,913,967 | 14.2% | 4.55877% | 118 | 1.75x | 10.1% | 62.8% | 58.2% |
| Total / Weighted Average: | 50 | $936,649,542 | 100.0% | 4.80232% | 115 | 1.93x | 11.2% | 60.2% | 56.0% |
| Loan Purpose |
Weighted Average | |||||||||
| Loan Purpose | Number of Loans | Cut-off Date Principal Balance | % of IPB | Mortgage Rate | Remaining Loan Term | UW NCF DSCR(1)(2) | UW NOI DY(1)(3) | Cut-off Date LTV(1)(4) | Maturity Date LTV(1)(4) |
| Refinance | 29 | $500,429,989 | 53.4% | 4.87455% | 114 | 2.01x | 11.6% | 57.2% | 52.9% |
| Acquisition | 18 | 367,469,553 | 39.2% | 4.75899% | 117 | 1.81x | 11.0% | 64.0% | 59.4% |
| Recapitalization | 3 | 68,750,000 | 7.3% | 4.50820% | 118 | 2.00x | 10.2% | 62.2% | 60.9% |
| Total / Weighted Average: | 50 | $936,649,542 | 100.0% | 4.80232% | 115 | 1.93x | 11.2% | 60.2% | 56.0% |
| (1) | In the case of Loan Nos. 1, 2, 3, 4, 7, 8, 9, 10, 11, 13, 18, 19, 21, 22, 23, 26, 32, 33 and 36, the UW NCF DSCR, UW NOI Debt Yield, Cut-off Date LTV and Maturity Date LTV calculations include the related Pari Passu Companion Loan(s). In the case of Loan Nos. 2, 8, 9, 10, 22 and 36, the UW NCF DSCR, UW NOI Debt Yield, Cut-off Date LTV and Maturity Date LTV calculations exclude the related Subordinate Companion Loans. |
| (2) | For the mortgage loans that are interest-only for the entire term and accrue interest on an Actual/360 basis, the Monthly Debt Service Amount ($) was calculated as 1/12th of the product of (i) the Original Balance ($), (ii) the Interest Rate % and (iii) 365/360. In the case of Loan No. 22, the UW NCF DSCR was calculated using the sum of interest payments over the first 12 months following the Cut-off Date, as the Whole Loan amortizes on a 30-year amortization schedule with all amortization being applied to the Note B through April 1, 2029 as provided on Annex F in the Preliminary Prospectus. |
| (3) | In the case of Loan No. 21, the UW NOI Debt Yield calculation includes a deduction for a holdback reserve in the amount of $2,200,000, to be released to the borrower (at the borrower’s request) provided that the debt yield (as calculated in the loan documents) at the mortgaged property is not less than 9.0%. The U/W NOI Debt Yield and U/W NCF Debt Yield are calculated net of the $2,200,000 achievement reserve. The unadjusted U/W NOI Debt Yield and U/W NCF Debt Yield are 8.8% and 8.7%, respectively, based on the full Cut-Off Date Balance. All LTVs and DSCRs are calculated assuming the full loan amount of $84,000,000. |
| (4) | In the case of Loan Nos. 1, 4, 5, 33, 34 and 41, the Cut-off Date LTV and the Maturity Date LTV are calculated by using an appraised value based on certain hypothetical or as stabilized assumptions. Refer to “Description of the Mortgage Pool—Assessment of Property Value and Condition” and “—Appraised Value” in the Preliminary Prospectus for additional details. |
THE INFORMATION IN THIS STRUCTURAL AND COLLATERAL TERM SHEET IS NOT COMPLETE AND MAY BE AMENDED PRIOR TO THE TIME OF SALE. THIS TERM SHEET IS NOT AN OFFER TO SELL THESE SECURITIES AND IT IS NOT A SOLICITATION OF AN OFFER TO BUY THESE SECURITIES IN ANY JURISDICTION WHERE THE OFFER OR SALE IS NOT PERMITTED.
16
| Structural and Collateral Term Sheet | BBCMS 2019-C3 | |
| Collateral Characteristics | ||
| Previous Securitization History(1) |
| No. | Mortgage Loan Seller | Loan Name | Location | Property Type | Cut-off Date Principal Balance | % of IPB | Previous Securitization |
| 11.01 | UBS AG | Apple Tree Estates | Walker, MI | Manufactured Housing | $5,490,000 | 0.6% | LBUBS 2006-C7 |
| 11.02 | UBS AG | South Lyon | South Lyon, MI | Manufactured Housing | $5,095,424 | 0.5% | LBUBS 2006-C7 |
| 11.03 | UBS AG | Metro Commons | Romulus, MI | Manufactured Housing | $4,402,881 | 0.5% | LBUBS 2006-C7 |
| 11.04 | UBS AG | Brighton Village | Brighton, MI | Manufactured Housing | $4,306,780 | 0.5% | LBUBS 2006-C7 |
| 11.05 | UBS AG | College Heights | Auburn Hills, MI | Manufactured Housing | $3,000,508 | 0.3% | LBUBS 2006-C7 |
| 11.06 | UBS AG | Hillcrest | Kalamazoo, MI | Manufactured Housing | $2,062,881 | 0.2% | LBUBS 2006-C7 |
| 11.07 | UBS AG | Royal Village | Toledo, OH | Manufactured Housing | $1,817,797 | 0.2% | LBUBS 2006-C7 |
| 11.08 | UBS AG | Fernwood | Deland, FL | Manufactured Housing | $1,462,881 | 0.2% | LBUBS 2006-C7 |
| 11.09 | UBS AG | Satellite Bay | Clearwater, FL | Manufactured Housing | $1,189,322 | 0.1% | LBUBS 2006-C7 |
| 11.10 | UBS AG | Chalet Village | Tampa, FL | Manufactured Housing | $1,171,525 | 0.1% | LBUBS 2006-C7 |
| 14 | RMF | The Falls In Hudson | Hudson, NY | Multifamily | $24,000,000 | 2.6% | SGCP 2018-FL1 |
| 22 | RMF | Goodyear Portfolio | Akron, OH | Industrial | $16,000,000 | 1.7% | COMM 2014-CCRE21 |
| 22.01 | RMF | Innovation Tech Center | Akron, OH | Industrial | $13,688,497 | 1.5% | COMM 2014-CCRE21 |
| 22.02 | RMF | Research Center | Akron, OH | Industrial | $985,989 | 0.1% | COMM 2014-CCRE21 |
| 22.03 | RMF | Tire Testing | Akron, OH | Industrial | $823,159 | 0.1% | COMM 2014-CCRE21 |
| 22.04 | RMF | North Archwood | Akron, OH | Industrial | $502,355 | 0.1% | COMM 2014-CCRE21 |
| 23.04 | SGFC | Walgreens - Lawrenceville, GA | Lawrenceville, GA | Retail | $944,337 | 0.1% | GSMS 2013-GCJ16 |
| 34 | Barclays | Candlewood Suites Indianapolis Downtown Medical District | Indianapolis, IN | Hotel | $9,954,884 | 1.1% | WFRBS 2014-C19 |
| 36 | SGFC | Christiana Mall | Newark, DE | Retail | $9,704,000 | 1.0% | MSC 2011-C1 |
| 45 | SGFC | Town Plaza Leesville | Leesville, LA | Retail | $5,468,975 | 0.6% | WFRBS 2011-C3 |
| (1) | The table above represents the properties for which the previously existing debt was most recently securitized, based on information provided by the related borrower or obtained through searches of a third-party database. |
THE INFORMATION IN THIS STRUCTURAL AND COLLATERAL TERM SHEET IS NOT COMPLETE AND MAY BE AMENDED PRIOR TO THE TIME OF SALE. THIS TERM SHEET IS NOT AN OFFER TO SELL THESE SECURITIES AND IT IS NOT A SOLICITATION OF AN OFFER TO BUY THESE SECURITIES IN ANY JURISDICTION WHERE THE OFFER OR SALE IS NOT PERMITTED.
17
| Structural and Collateral Term Sheet | BBCMS 2019-C3 | |
| Class A-2(1) | ||
No. | Loan Name | Location | Cut-off Date Balance | % of IPB | Maturity Date Balance | % of Certificate Class(2) | Original Loan Term | Remaining Loan Term | UW NCF DSCR(3) | UW NOI Debt Yield(3) | Cut-off Date LTV(3) | Maturity Date LTV(3) |
| 10 | The Colonnade Office Complex | Addison, TX | $30,000,000 | 3.2% | $30,000,000 | 100.0% | 60 | 56 | 3.87x | 19.1% | 30.2% | 30.2% |
| Total / Weighted Average: | $30,000,000 | 3.2% | $30,000,000 | 100.0% | 60 | 56 | 3.87x | 19.1% | 30.2% | 30.2% | ||
| (1) | The table above presents the mortgage loan whose balloon payment would be applied to pay down the certificate balance of the Class A-2 Certificates, assuming a 0% CPR and applying the “Modeling Assumptions” described in the Preliminary Prospectus, including the assumptions that (i) none of the mortgage loans in the pool experience prepayments, defaults or losses; (ii) there are no extensions of maturity dates of any mortgage loans in the pool; and (iii) each mortgage loan in the pool is paid in full on its stated maturity date. Each Class of Certificates, including the Class A-2 Certificates, evidences undivided ownership interests in the entire pool of mortgage loans. Debt service coverage ratio, debt yield and loan-to-value ratio information does not take into account subordinate debt (whether or not secured by the mortgaged property), if any, that is allowed under the terms of any mortgage loan. See Annex A-1 to the Preliminary Prospectus. |
| (2) | Reflects the percentage equal to the Maturity Date Balance divided by the initial Class A-2 Certificate Balance. |
| (3) | The UW NCF DSCR, UW NOI Debt Yield, Cut-off Date LTV and Maturity Date LTV calculations include the related Pari Passu Companion Loans. The UW NCF DSCR, UW NOI Debt Yield, Cut-off Date LTV and Maturity Date LTV calculations exclude the related Subordinate Companion Loans. |
THE INFORMATION IN THIS STRUCTURAL AND COLLATERAL TERM SHEET IS NOT COMPLETE AND MAY BE AMENDED PRIOR TO THE TIME OF SALE. THIS TERM SHEET IS NOT AN OFFER TO SELL THESE SECURITIES AND IT IS NOT A SOLICITATION OF AN OFFER TO BUY THESE SECURITIES IN ANY JURISDICTION WHERE THE OFFER OR SALE IS NOT PERMITTED.
18
| Structural and Collateral Term Sheet | BBCMS 2019-C3 | |
| Structural Overview | ||
| ■ Accrual: | Each Class of Certificates (other than the Class R Certificates) will accrue interest on a 30/360 basis. The Class R Certificates will not accrue interest. | |
| ■ Distribution of Interest: | On each Distribution Date, accrued interest for each Class of Certificates (other than the Class R Certificates) at the applicable pass-through rate will be distributed in the following order of priority to the extent of available funds: first, to the Class A-1, Class A-2, Class A-3, Class A-4, Class A-SB, Class X-A, Class X-B and Class X-D Certificates (the “Senior Certificates”), on apro rata basis, based on the interest entitlement for each such Class on such date, and then to the Class A-S, Class B, Class C, Class D, Class E-RR, Class F-RR, Class G-RR, Class H-RR and Class J-RR Certificates, in that order, in each case until the interest entitlement for such date payable to each such Class is paid in full.
The pass-through rate applicable to each of the Class A-1, Class A-2, Class A-3, Class A-4, Class A-SB, Class A-S, Class B, Class C, Class D, Class E-RR, Class F-RR, Class G-RR, Class H-RR and Class J-RR Certificates (collectively, the “Principal Balance Certificates”) on each Distribution Date, will be aper annum rate equal to one of (i) a fixed rate, (ii) the weighted average of the net mortgage rates on the mortgage loans (in each case adjusted, if necessary, to accrue on the basis of a 360-day year consisting of twelve 30-day months), (iii) the lesser of a specified fixed pass-through rate and the rate described in clause (ii) above or (iv) the rate described in clause (ii) above less a specified percentage.
The pass-through rate for the Class X-A Certificates for any Distribution Date will be aper annum rate equal to the excess, if any, of (a) the weighted average of the net mortgage rates on the mortgage loans (in each case adjusted, if necessary, to accrue on the basis of a 360-day year consisting of twelve 30-day months), over (b) the weighted average of the pass-through rates on the Class A-1, Class A-2, Class A-3, Class A-4 and Class A-SB Certificates for the related Distribution Date, weighted on the basis of their respective Certificate Balances outstanding immediately prior to that Distribution Date.
The pass-through rate for the Class X-B Certificates for any Distribution Date will be aper annum rate equal to the excess, if any, of (a) the weighted average of the net mortgage rates on the mortgage loans (in each case adjusted, if necessary, to accrue on the basis of a 360-day year consisting of twelve 30-day months), over (b) the weighted average of the pass-through rates on the Class A-S, Class B and Class C Certificates for the related Distribution Date, weighted on the basis of their respective Certificate Balances outstanding immediately prior to the Distribution Date.
The pass-through rate for the Class X-D Certificates for any Distribution Date will be aper annum rate equal to the excess, if any, of (a) the weighted average of the net mortgage rates on the mortgage loans (in each case adjusted, if necessary, to accrue on the basis of a 360-day year consisting of twelve 30-day months), over (b) the pass-through rate on the Class D Certificates for the related Distribution Date.
See “Description of the Certificates—Distributions” in the Preliminary Prospectus.
| |
■ Distribution of Principal:
| On any Distribution Date prior to the Cross-Over Date, payments in respect of principal of the Certificates will be distributed:
first, to the Class A-SB Certificates until the Certificate Balance of the Class A-SB Certificates is reduced to the Class A-SB planned principal balance for the related Distribution Date set forth in Annex E to the Preliminary Prospectus, second, to the Class A-1 Certificates, until the Certificate Balance of such Class is reduced to zero, third, to the Class A-2 Certificates, until the Certificate Balance of such Class is reduced to zero, fourth, to the Class A-3 Certificates, until the Certificate Balance of such Class is reduced to zero, fifth, to the Class A-4 Certificates, until the Certificate Balance of such Class is reduced to zero, and sixth, to the Class A-SB Certificates, until the Certificate Balance of such Class is reduced to zero and then to the Class A-S, Class B, Class C, Class D, Class E-RR, Class F-RR, Class G-RR, Class H-RR and Class J-RR Certificates, in that order, until the Certificate Balance of each such Class is reduced to zero.
On any Distribution Date on or after the Cross-Over Date, payments in respect of principal of the Certificates will be distributed to the Class A-1, Class A-2, Class A-3, Class A-4 and Class A-SB Certificates,pro rata based on the Certificate Balance of each such Class until the Certificate Balance of each such Class is reduced to zero. |
THE INFORMATION IN THIS STRUCTURAL AND COLLATERAL TERM SHEET IS NOT COMPLETE AND MAY BE AMENDED PRIOR TO THE TIME OF SALE. THIS TERM SHEET IS NOT AN OFFER TO SELL THESE SECURITIES AND IT IS NOT A SOLICITATION OF AN OFFER TO BUY THESE SECURITIES IN ANY JURISDICTION WHERE THE OFFER OR SALE IS NOT PERMITTED.
19
| Structural and Collateral Term Sheet | BBCMS 2019-C3 | |
| Structural Overview | ||
The “Cross-Over Date” means the Distribution Date on which the aggregate Certificate Balances of the Class A-S, Class B, Class C, Class D, Class E-RR, Class F-RR, Class G-RR, Class H-RR and Class J-RR Certificates have been reduced to zero as a result of the allocation of realized losses to such Classes.
The Class X-A, Class X-B and Class X-D Certificates (the “Class X Certificates”) will not be entitled to receive distributions of principal; however, the notional amount of the Class X-A Certificates will be reduced by the aggregate amount of principal distributions, realized losses and trust fund expenses, if any, allocated to the Class A-1, Class A-2, Class A-3, Class A-4 and Class A-SB Certificates, the notional amount of the Class X-B Certificates will be reduced by the aggregate amount of principal distributions, realized losses and trust fund expenses, if any, allocated to the Class A-S, Class B and Class C Certificates, and the notional amount of the Class X-D Certificates will be reduced by the aggregate amount of principal distributions, realized losses and trust fund expenses, if any, allocated to the Class D Certificates. | ||
| ■ Yield Maintenance / Fixed Penalty Allocation: | If any yield maintenance charge or prepayment premium is collected during any particular collection period with respect to any mortgage loan, then on the Distribution Date corresponding to that collection period, the certificate administrator will pay that yield maintenance charge or prepayment premium (net of liquidation fees or workout fees payable therefrom) in the following manner: (1) to each of the Class A-1, Class A-2, Class A-3, Class A-4, Class A-SB, Class A-S, Class B, Class C and Class D Certificates, the product of (a) the yield maintenance charge or prepayment premium, (b) the related Base Interest Fraction (as defined in the Preliminary Prospectus) for such Class, and (c) a fraction, the numerator of which is equal to the amount of principal distributed to such Class for that Distribution Date, and the denominator of which is the total amount of principal distributed to all Principal Balance Certificates for that Distribution Date, (2) to the Class X-A Certificates, the excess, if any, of (a) the product of (i) such yield maintenance charge or prepayment premium and (ii) a fraction, the numerator of which is equal to the amount of principal distributed to the Class A-1, Class A-2, Class A-3, Class A-4 and Class A-SB Certificates for that Distribution Date, and the denominator of which is the total amount of principal distributed to all Principal Balance Certificates for that Distribution Date, over (b) the amount of such yield maintenance charge or prepayment premium distributed to the Class A-1, Class A-2, Class A-3, Class A-4 and Class A-SB Certificates as described above, and (3) to the Class X-B Certificates, any remaining portion of such yield maintenance charge or prepayment premium not distributed as described above. No Yield Maintenance Charges will be distributed to the Class X-D, Class E-RR, Class F-RR Class G-RR, Class H-RR, Class J-RR or Class R Certificates. | |
| ■ Realized Losses: | Losses on the mortgage loans will be allocated first to the Class J-RR, Class H-RR, Class G-RR, Class F-RR, Class E-RR, Class D, Class C, Class B and Class A-S Certificates, in that order, in each case until the Certificate Balance of all such Classes have been reduced to zero, and then, to the Class A-1, Class A-2, Class A-3, Class A-4 and Class A-SB Certificates,pro rata, based on the Certificate Balance of each such Class, until the Certificate Balance of each such Class has been reduced to zero. The notional amounts of the Class X-A, Class X-B and Class X-D Certificates will be reduced by the aggregate amount of realized losses allocated to Certificates that are components of the notional amounts of the Class X-A, Class X-B and Class X-D Certificates, respectively.
Losses on eachpari passu Whole Loan will be allocated,pro rata, between the related mortgage loan and the relatedPari Passu Companion Loan(s), based upon their respective principal balances and with respect to any Whole Loan with one or more subordinate companion loans, first to the related Subordinate Companion Loan(s) and then to the related mortgage loan and any relatedPari Passu Companion loans (if any).
| |
| ■ Interest Shortfalls: | A shortfall with respect to the amount of available funds distributable in respect of interest can result from, among other sources: (a) delinquencies and defaults by borrowers; (b) shortfalls resulting from the application of appraisal reductions to reduce P&I Advances; (c) shortfalls resulting from interest on Advances made by the Master Servicer, the Special Servicer or the Trustee; (d) shortfalls resulting from the payment of Special Servicing Fees and other additional compensation that the Special Servicer is entitled to receive; (e) shortfalls resulting from extraordinary expenses of the trust, including indemnification payments payable to the Depositor, the Master Servicer, the Special Servicer, the Certificate Administrator, the Trustee, the Operating Advisor and the Asset Representations Reviewer; (f) shortfalls resulting from a modification of a mortgage loan’s interest rate or principal balance; and (g) shortfalls resulting from other unanticipated or default-related expenses of the trust. Any such shortfalls that decrease the amount of available funds distributable in respect of interest to the Certificateholders will reduce distributions to the classes of Certificates (other than the Class R Certificates) |
THE INFORMATION IN THIS STRUCTURAL AND COLLATERAL TERM SHEET IS NOT COMPLETE AND MAY BE AMENDED PRIOR TO THE TIME OF SALE. THIS TERM SHEET IS NOT AN OFFER TO SELL THESE SECURITIES AND IT IS NOT A SOLICITATION OF AN OFFER TO BUY THESE SECURITIES IN ANY JURISDICTION WHERE THE OFFER OR SALE IS NOT PERMITTED.
20
| Structural and Collateral Term Sheet | BBCMS 2019-C3 | |
| Structural Overview | ||
| beginning with those with the lowest payment priorities, in reverse sequential order. See “Description of the Certificates—Distributions—Priority of Distributions” in the Preliminary Prospectus. | ||
| ■ Appraisal Reduction Amounts: | With respect to mortgage loans serviced under the Pooling and Servicing Agreement, upon the occurrence of certain trigger events with respect to a mortgage loan, which are generally tied to certain events of default under the related mortgage loan documents, the Special Servicer will be obligated to obtain an appraisal of the related mortgaged property and the Master Servicer will calculate the Appraisal Reduction Amount. The “Appraisal Reduction Amount” is generally the amount by which the current principal balance of the related mortgage loan or Serviced Whole Loan, plus outstanding advances, real estate taxes, unpaid servicing fees and certain similar amounts exceeds the sum of (a) 90% of the appraised value of the related mortgaged property and (b) the amount of any escrows, letters of credit and reserves.
With respect to the Non-Serviced Whole Loans, any Appraisal Reduction Amount will be similarly determined pursuant to the related trust and servicing agreement or pooling and servicing agreement, as applicable, under which it is serviced.
In general, the Appraisal Reduction Amounts that are allocated to the mortgage loans are notionally allocated to reduce, in reverse sequential order, the Certificate Balance of each Class of Certificates (other than the Class A-1, Class A-2, Class A-3, Class A-4 and Class A-SB Certificates) beginning with the Class J-RR Certificates for certain purposes, including certain voting rights and the determination of the controlling class. As a result of calculating one or more Appraisal Reduction Amounts (and, in the case of any Whole Loan, to the extent allocated in the relatedmortgage loan), the amount of any required P&I Advance will be reduced, which will have the effect of reducing the amount of interest available to the most subordinate Class of Certificates then-outstanding (i.e.,first, to the Class J-RR Certificates;second, to the Class H-RR Certificates;third, to the Class G-RR Certificates,fourth to the Class F-RR Certificates,fifthto the Class E-RR Certificates;sixth, to the Class D Certificates;seventh, to the Class C Certificates;eighth, to the Class B Certificates,ninth, to the Class A-S Certificates and finally,pro rata based on their respective interest entitlements, to the Senior Certificates).
With respect to each serviced AB Whole Loan, the Appraisal Reduction Amount is notionally allocated,first, to any related Serviced Subordinate Companion Loan (until its principal balance is notionally reduced to zero by such related Appraisal Reduction Amounts) and,second,pro rata, between the related mortgage loan and the related servicedpari passu companion loan(s), based upon their respective principal balances.
| |
| ■ Master Servicer Advances: | The Master Servicer will be required to advance certain delinquent scheduled mortgage loan payments of principal and interest and certain property protection advances, in each case, to the extent the Master Servicer deems such advances to be recoverable. With respect to any Non-Serviced Whole Loan, the master servicer or trustee, as applicable, under the related lead securitization servicing agreement will have the primary obligation to make any required servicing advances with respect to such Non-Serviced Whole Loan. | |
| ■ Whole Loans: | 19 mortgage loans are each evidenced by one mortgage loan and one or more companion loans (each a “Companion Loan” and collectively with the related mortgage loan, a “Whole Loan”), secured by the same mortgage(s) on the related mortgaged property(ies). Each such mortgage loan and its related Companion Loan(s) are subject to an intercreditor agreement. None of these Companion Loans will be part of the trust.
In the case of the Whole Loans, referred to as the “SSTII Self Storage Portfolio II Whole Loan”, the “Vanguard Portfolio Whole Loan”, the “GNL Industrial Portfolio Whole Loan”, the “SWVP Portfolio Whole Loan”, the “Inland Devon Self Storage Portfolio Whole Loan”, the “NEMA San Francisco Whole Loan”, the “787 Eleventh Avenue Whole Loan”, the “The Colonnade Office Complex Whole Loan”, the “Wolverine Portfolio Whole Loan”, the “Kings Mountain Center Whole Loan”, the “ExchangeRight Net Leased Portfolio 26 Whole Loan”, the “Patuxent Crossing Whole Loan”, the “The Block Northway Whole Loan”, the “Goodyear Portfolio Whole Loan”, the “ExchangeRight Net Leased Portfolio 24 Whole Loan”, the “Heartland Dental Medical Office Portfolio Whole Loan”, the “ILPT Hawaii Portfolio Whole Loan”, the “Southern Motion Industrial Portfolio Whole Loan” and the “Christiana Mall Whole Loan”, one or more related Companion Loans arepari passu with the related mortgage loan (these Companion Loans are also referred to as the “Pari Passu Companion Loans”). In the case of the Vanguard Portfolio Whole Loan, the NEMA San Francisco Whole Loan, the 787 Eleventh Avenue Whole Loan, The Colonnade Office Complex Whole Loan, the Goodyear Portfolio Whole Loan and the Christiana Mall Whole Loan, in addition to any related Pari Passu Companion Loans, one |
THE INFORMATION IN THIS STRUCTURAL AND COLLATERAL TERM SHEET IS NOT COMPLETE AND MAY BE AMENDED PRIOR TO THE TIME OF SALE. THIS TERM SHEET IS NOT AN OFFER TO SELL THESE SECURITIES AND IT IS NOT A SOLICITATION OF AN OFFER TO BUY THESE SECURITIES IN ANY JURISDICTION WHERE THE OFFER OR SALE IS NOT PERMITTED.
21
| Structural and Collateral Term Sheet | BBCMS 2019-C3 | |
| Structural Overview | ||
or more related Companion Loans are subordinate in right of payment to the related mortgage loan and the related Pari Passu Companion Loans (these Companion Loans are also referred to as the “Subordinate Companion Loans”).
The SSTII Self Storage Portfolio II Pari Passu Companion Loans, the Vanguard Portfolio Pari Passu Companion Loans, the Vanguard Portfolio Subordinate Companion Loans, the SWVP Portfolio Pari Passu Companion Loans, the Inland Devon Self Storage Portfolio Pari Passu Companion Loans, the Kings Mountain Center Pari Passu Companion Loans, the Patuxent Crossing Pari Passu Companion Loans, the Wolverine Portfolio Pari Passu Companion Loans and The Block Northway Pari Passu Companion Loans are referred to as “Serviced Companion Loans”.
The SSTII Self Storage Portfolio II Whole Loan, the Vanguard Portfolio Whole Loan, the SWVP Portfolio Whole Loan, the Inland Devon Self Storage Portfolio Whole Loan, the Wolverine Portfolio Whole Loan, the Kings Mountain Center Whole Loan, the Patuxent Crossing Whole Loan and The Block Northway Whole Loan (each, a “Serviced Whole Loan”) will be serviced under the pooling and servicing agreement for the BBCMS 2019-C3 transaction (the “Pooling and Servicing Agreement”).
The 787 Eleventh Avenue Whole Loan is being serviced pursuant to the SGCMS 2019-787E trust and servicing agreement.
The Colonnade Office Complex Whole Loan and the Southern Motion Industrial Portfolio Whole Loan are being serviced and administered pursuant to the terms of the UBS 2019-C16 pooling and servicing agreement.
The ILPT Hawaii Portfolio Whole Loan is being serviced pursuant to the ILPT Trust 2019-SURF trust and servicing agreement.
The NEMA San Francisco Whole Loan is being serviced pursuant to the NCMS 2019-NEMA trust and servicing agreement.
The Goodyear Portfolio Whole Loan and the Heartland Dental Medical Office Portfolio Whole Loan are each expected to be serviced and administered pursuant to the terms of the WFCM 2019-C50 pooling and servicing agreement.
The ExchangeRight Net Leased Portfolio 24 Whole Loan is being serviced pursuant to the CSAIL 2019-C15 pooling and servicing agreement.
The Christiana Mall Whole Loan is being serviced and administered pursuant to the terms of the BBCMS 2018-CHRS trust and servicing agreement.
The NEMA San Francisco Whole Loan, the 787 Eleventh Avenue Whole Loan, The Colonnade Office Complex Whole Loan, the Goodyear Portfolio Whole Loan, the ExchangeRight Net Leased Portfolio 24 Whole Loan, the Heartland and Dental Medical Office Portfolio Whole Loan, the ILPT Hawaii Portfolio Whole Loan, the Southern Motion Industrial Portfolio Whole Loan and the Christiana Mall Whole Loan are each a “Non-Serviced Whole Loan” and collectively the “Non-Serviced Whole Loans”.
The GNL Industrial Portfolio Whole Loan and ExchangeRight Net Leased Portfolio 26 Whole Loan (each, a “Servicing Shift Whole Loan”) will initially be serviced under the Pooling and Servicing Agreement prior to the date of securitization of the related controlling Pari Passu Companion Loan (such date, a “Servicing Shift Date”). Following the related Servicing Shift Date, the Servicing Shift Whole Loans will be Non-Serviced Whole Loans. The holder of the controlling companion loan prior to the Servicing Shift Date will be the “Loan-Specific Directing Certificateholder”. | ||
| ■ Liquidated Loan Waterfall: | On liquidation of any mortgage loan, all net liquidation proceeds related to the mortgage loan will be applied (after reimbursement of advances and certain trust fund expenses) first, as a recovery of accrued interest, other than delinquent interest that was not advanced as a result of Appraisal Reduction Amounts, second, as a recovery of principal until all principal has been recovered, and then as a recovery of delinquent interest that was not advanced as a result of Appraisal Reduction Amounts. Please see “Description of the Certificates—Distributions—Application Priority of Mortgage Loan Collections or Whole Loan Collections” in the Preliminary Prospectus. | |
| ■ Sale of Defaulted Loans and REO Properties: | The Special Servicer is required to use reasonable efforts to solicit offers for any defaulted loan or REO property (other than a non-serviced mortgage loan), if the Special Servicer determines that no satisfactory arrangements can be made for collection of delinquent payments and the sale would be in the best economic interests of the certificateholders (or, in the case of any |
THE INFORMATION IN THIS STRUCTURAL AND COLLATERAL TERM SHEET IS NOT COMPLETE AND MAY BE AMENDED PRIOR TO THE TIME OF SALE. THIS TERM SHEET IS NOT AN OFFER TO SELL THESE SECURITIES AND IT IS NOT A SOLICITATION OF AN OFFER TO BUY THESE SECURITIES IN ANY JURISDICTION WHERE THE OFFER OR SALE IS NOT PERMITTED.
22
| Structural and Collateral Term Sheet | BBCMS 2019-C3 | |
| Structural Overview | ||
Serviced Whole Loan, the certificateholders and any holders of the related Serviced Pari Passu Companion Loans, as a collective whole, taking into account thepari passu or subordinate nature of such Serviced Companion Loans), on a net present value basis.
In the case of each non-serviced mortgage loan, under certain circumstances permitted under the related intercreditor agreement, to the extent that such non-serviced mortgage loan is not sold together with the related non-serviced companion loan by the special servicer for the related Non-Serviced Whole Loans, the Special Servicer will be entitled to sell (with respect to any mortgage loan other than an Excluded Loan, with the consent of the Directing Certificateholder if no Control Termination Event has occurred and is continuing) such non-serviced mortgage loan if it determines in accordance with the servicing standard that such action would be in the best interests of the certificateholders.
The Special Servicer is generally required to accept the highest cash offer received from any person for any defaulted loan or REO property in an amount at least equal to par plus accrued interest plus all other outstanding amounts due under such mortgage loan and any outstanding expenses of the trust relating to such mortgage loan (the “Purchase Price”) except as described in the Preliminary Prospectus.
With respect to the Serviced Whole Loans, any such sale of the related defaulted loan is required to also include the related Pari Passu Companion Loans, if any, and the prices will be adjusted accordingly.
With respect to the mortgage loans that have mezzanine debt or permit mezzanine debt in the future, the mezzanine lenders may have theoption to purchase the related mortgage loan after certain events of default under such mortgage loan.
The Directing Certificateholder will not have a right of first refusal to purchase a defaulted loan.
If the Special Servicer does not receive a cash offer at least equal to the Purchase Price, the Special Servicer may accept the first cash offer received from any person that is determined to be a fair price and will be required to take into account (in addition to the results of any appraisal, updated appraisal or narrative appraisal that it may have obtained pursuant to the PSA within the prior 9 months), among other factors, the period and amount of the occupancy level and physical condition of the related Mortgaged Property and the state of the local economy) for such defaulted loan or REO property, if the highest offeror is a person other than a party to the Pooling and Servicing Agreement, the Directing Certificateholder, any sponsor, any borrower, any manager of a mortgaged property, any independent contractor engaged by the Special Servicer, with respect to a defaulted whole loan, the depositor, Master Servicer, Special Servicer (or independent contractor engaged by such Special Servicer) or the trustee for the securitization of a Companion Loan and each holder of any related Companion Loan or mezzanine loan (but only with respect to the related mortgage loan), or any known affiliate of any such person (each, an “Interested Person”). If the highest offer is made by an Interested Person, the Trustee will determine (unless (i) the offer is equal to or greater than the outstanding principal balance of the mortgage loan, any unpaid interest and any outstanding costs and expenses relating to the mortgage loan and (ii) the offer is the highest offer received) (based upon the most recent appraisal or updated appraisal conducted in accordance with the terms of the Pooling and Servicing Agreement) whether the offer constitutes a fair price for the defaulted loan or REO propertyprovided that no offer from an Interested Person will constitute a fair price unless (A) it is the highest offer received and (B) at least two other offers are received from independent third parties and the Trustee may conclusively rely on the opinion of an independent appraiser or other independent expert retained by the Trustee in connection with making such determination. Neither the Trustee nor any of its affiliates may make an offer for or purchase any specially serviced mortgage loan or REO property.
If the Special Servicer does not receive any offers that are at least equal to the Purchase Price, the Special Servicer is not required to accept the highest offer and may accept a lower offer for a defaulted loan or REO property if the Special Servicer determines, in accordance with the servicing standard (and subject to the requirements of any related intercreditor agreement), that a rejection of such offer would be in the best interests of the certificateholders and, with respect to any Serviced Whole Loan, the holder of the related Companion Loans, as a collective whole, as if such certificateholders and, if applicable, the related Companion Loan Holder(s) constituted a single lender, and taking into account the subordinate orpari passu nature of any Companion Loan), so long as such lower offer was not made by the Special Servicer or any of its affiliates.If title to any mortgaged property is acquired by the trust fund, the Special Servicer will be required to sell such mortgaged property prior to the close of the third calendar year beginning after the year of acquisition, unless (a) the IRS grants or has not denied an extension of time to sell such |
THE INFORMATION IN THIS STRUCTURAL AND COLLATERAL TERM SHEET IS NOT COMPLETE AND MAY BE AMENDED PRIOR TO THE TIME OF SALE. THIS TERM SHEET IS NOT AN OFFER TO SELL THESE SECURITIES AND IT IS NOT A SOLICITATION OF AN OFFER TO BUY THESE SECURITIES IN ANY JURISDICTION WHERE THE OFFER OR SALE IS NOT PERMITTED.
23
| Structural and Collateral Term Sheet | BBCMS 2019-C3 | |
| Structural Overview | ||
mortgaged property or (b) the Special Servicer, Trustee and the Certificate Administrator receive an opinion of independent counsel to the effect that the holding of the property by the trust longer than the above-referenced three-year period will not result in the imposition of a tax on any REMIC of the trust fund or cause any REMIC of the trust fund to fail to qualify as a REMIC.
The foregoing applies to mortgage loans serviced under the Pooling and Servicing Agreement. With respect to each Non-Serviced Whole Loan, if the special servicer under the applicable trust and servicing agreement or pooling and servicing agreement, as applicable, determines to sell the related Companion Loan(s) as described above, then the applicable special servicer will be required to sell the related non-serviced mortgage loan, included in the BBCMS 2019-C3 Trust, and the related Companion Loan(s), as a single loan. In connection with any such sale, the then-applicable special servicer will be required to follow procedures substantially similar to those set forth above. | ||
| ■ Control Eligible Certificates: | Classes E-RR, F-RR, G-RR, H-RR and J-RR Certificates. | |
| ■ Control Rights: | The Control Eligible Certificates will have certain control rights attached to them. The “Directing Certificateholder” will be (i) with respect to a Servicing Shift Mortgage Loan, the related Loan-Specific Directing Certificateholder, and (ii) with respect to each Mortgage Loan (other than any Servicing Shift Mortgage Loan and any Excluded Loan), the Controlling Class Certificateholder (or its representative) selected by more than 50% of the Controlling Class Certificateholders;provided,however, that (1) absent that selection, (2) until a Directing Certificateholder is so selected or (3) upon receipt of a notice from a majority of the Controlling Class Certificateholders that a Directing Certificateholder is no longer designated, the Controlling Class Certificateholder that owns the largest aggregate Certificate Balance of the Controlling Class (or its representative) will be the Directing Certificateholder;provided,however, that in the case of this clause (3), in the event no one holder owns the largest aggregate Certificate Balance of the Controlling Class, then there will be no Directing Certificateholder until appointed in accordance with the terms of the Pooling and Servicing Agreement. With respect to any mortgage loan (other than any non-serviced mortgage loan, any Excluded Loan or any Servicing Shift Whole Loans), unless a Control Termination Event has occurred and is continuing, the Directing Certificateholder will be entitled to direct the Special Servicer to take, or refrain from taking, certain actions with respect to such mortgage loan. Furthermore, the Directing Certificateholder will also have the right to receive notice and provide consent with respect to certain material actions that the Master Servicer and the Special Servicer plan on taking with respect to a mortgage loan (other than any non-serviced mortgage loan or any Excluded Loan). With respect to any mortgage loan that has or may in the future have mezzanine debt, pursuant to the related intercreditor agreement, the related mezzanine lender may have certain consent rights with respect to certain modifications related to such mortgage loan.
A “Borrower Party”means a borrower, a mortgagor, a manager of a mortgaged property, an Accelerated Mezzanine Loan Lender, any other person controlling or controlled by or under common control with such borrower, mortgagor, manager or Accelerated Mezzanine Loan Lender, as applicable, or any other person owning, directly or indirectly, 25% or more of the beneficial interests in such borrower, mortgagor, manager or Accelerated Mezzanine Loan Lender, as applicable. For purposes of this definition, “control” when used with respect to any specified person means the power to direct the management and policies of such person, directly or indirectly, whether through the ownership of voting securities, by contract or otherwise and the terms “controlling” and “controlled” have meanings correlative to the foregoing.
An “Accelerated Mezzanine Loan Lender” means a mezzanine lender under a mezzanine loan that has been accelerated or as to which foreclosure or enforcement proceedings have been commenced against the equity collateral pledged to secure such mezzanine loan.
An “Excluded Loan” is a mortgage loan or Whole Loan with respect to which the Directing Certificateholder or the holder of the majority of the controlling class is a Borrower Party. As of the Closing Date, it is expected that there will be no Excluded Loans in this securitization.
With respect to the Serviced Whole Loans, direction, consent and consultation rights with respect to the related Whole Loan are subject to certain consultation rights of the holder of the related Pari Passu Companion Loans or Subordinate Companion Loans pursuant to the related intercreditor agreement.
With respect to any Non-Serviced Whole Loan, direction, consent and consultation rights with respect to the related Whole Loan will be exercised by the directing certificateholder or controlling class representative under the applicable trust and servicing agreement or pooling and servicing |
THE INFORMATION IN THIS STRUCTURAL AND COLLATERAL TERM SHEET IS NOT COMPLETE AND MAY BE AMENDED PRIOR TO THE TIME OF SALE. THIS TERM SHEET IS NOT AN OFFER TO SELL THESE SECURITIES AND IT IS NOT A SOLICITATION OF AN OFFER TO BUY THESE SECURITIES IN ANY JURISDICTION WHERE THE OFFER OR SALE IS NOT PERMITTED.
24
| Structural and Collateral Term Sheet | BBCMS 2019-C3 | |
| Structural Overview | ||
| agreement (or, in the case of Non-Serviced Whole Loans with Subordinate Companion Loans, the holder of the related Subordinate Companion Loan), as applicable. | ||
| ■ Directing Certificateholder: | KKR Real Estate Credit Opportunity Partners Aggregator I L.P. (or its affiliate) is expected to be appointed as the initial directing certificateholder with respect to all serviced mortgage loans (other than the Excluded Loans and any Servicing Shift Mortgage Loan). | |
| ■ Controlling Class: | The “Controlling Class” will at any time of determination be the most subordinate Class of Control Eligible Certificates then outstanding that has an aggregate Certificate Balance, as notionally reduced by any Cumulative Appraisal Reduction Amounts allocable to such Class, equal to no less than 25% of the initial Certificate Balance for such Class. Each holder of a certificate of the Controlling Class is referred to herein as a “Controlling Class Certificateholder”.
The Controlling Class as of the Closing Date will be the Class J-RR Certificates;provided that if at any time the principal balances of the certificates other than the Control Eligible Certificates have been reduced to zero as a result of principal payments on the mortgage loans, then the Controlling Class will be the most subordinate Class of Control Eligible Certificates that has a certificate balance greater than zero without regard to any Cumulative Appraisal Reduction Amounts.
| |
| ■ Control Termination Event: | A “Control Termination Event” will occur when the Class E-RR Certificates have a Certificate Balance (taking into account the application of any Cumulative Appraisal Reduction Amounts to notionally reduce the Certificate Balance of such class) of less than 25% of the initial Certificate Balance of that class;provided, that no Control Termination Event may occur with respect to the Loan-Specific Directing Certificateholder, and the term “Control Termination Event” will not be applicable to the Loan-Specific Directing Certificateholder;provided,however, that a Control Termination Event will not be deemed continuing in the event that the Certificate Balances of the certificates other than the Control Eligible Certificates have been reduced to zero as a result of principal payments on the Mortgage Loans.
The “Cumulative Appraisal Reduction Amount” as of any date of determination and for any mortgage loan, is equal to the sum of (i) all Appraisal Reduction Amounts then in effect, and (ii) with respect to any AB Modified Loan, any Collateral Deficiency Amount then in effect.
An “AB Modified Loan” means any corrected loan (1) that became a corrected loan (which includes for purposes of this definition any non-serviced mortgage loan that became a “corrected loan” (or any term substantially similar thereto) pursuant to the trust and servicing agreement or pooling and servicing agreement, as applicable, governing such non-serviced mortgage loan) due to a modification thereto that resulted in the creation of an A/B note structure (or similar structure) and as to which the new junior note(s) did not previously exist or the principal amount of the new junior note(s) was previously part of either an A note held by the issuing entity or the original unmodified mortgage loan and (2) as to which an Appraisal Reduction Amount is not in effect.
The “Collateral Deficiency Amount” means, with respect to any AB Modified Loan as of any date of determination, the excess of (i) the principal balance of such AB Modified Loan (taking into account the related junior note(s) and any pari passu notes included therein), over (ii) the sum of (in the case of a Whole Loan, solely to the extent allocable to the subject mortgage loan) (x) the most recent Appraised Value for the related mortgaged property or mortgaged properties, plus (y) solely to the extent not reflected or taken into account in such Appraised Value and to the extent on deposit with, or otherwise under the control of, the lender as of the date of such determination, any capital or additional collateral contributed by the related borrower at the time the mortgage loan became (and as part of the modification related to) such AB Modified Loan for the benefit of the related mortgaged property or mortgaged properties (provided, that in the case of a non-serviced mortgage loan, the amounts set forth in this clause (y) will be taken into account solely to the extent relevant information is received by the Master Servicer), plus (z) any other escrows or reserves (in addition to any amounts set forth in the immediately preceding clause (y)) held by the lender in respect of such AB Modified Loan as of the date of such determination.
Upon the occurrence and during the continuance of a Control Termination Event, the Controlling Class will no longer have any control rights. After the occurrence and during the continuance of a Control Termination Event, the Directing Certificateholder will relinquish its right to direct certain actions of the Special Servicer and will no longer have consent rights with respect to certain actions that the Master Servicer or the Special Servicer plan on taking with respect to a mortgage loan. Following the occurrence and during the continuance of a Control Termination Event, the Directing Certificateholder will retain consultation rights with the Special Servicer with respect to |
THE INFORMATION IN THIS STRUCTURAL AND COLLATERAL TERM SHEET IS NOT COMPLETE AND MAY BE AMENDED PRIOR TO THE TIME OF SALE. THIS TERM SHEET IS NOT AN OFFER TO SELL THESE SECURITIES AND IT IS NOT A SOLICITATION OF AN OFFER TO BUY THESE SECURITIES IN ANY JURISDICTION WHERE THE OFFER OR SALE IS NOT PERMITTED.
25
| Structural and Collateral Term Sheet | BBCMS 2019-C3 | |
| Structural Overview | ||
| certain material actions that the Special Servicer plans on taking with respect to any mortgage loan other than an Excluded Loan. Such consultation rights will continue until the occurrence of a Consultation Termination Event. | ||
| ■ Consultation Termination Event: | A “Consultation Termination Event” will occur when there is no class of Control Eligible Certificates that has a then-outstanding Certificate Balance at least equal to 25% of the initial Certificate Balance of that class, in each case, without regard to the application of any Cumulative Appraisal Reduction Amounts;provided, that no Consultation Termination Event may occur with respect to the Loan-Specific Directing Certificateholder and the term “Consultation Termination Event” will not be applicable to the Loan-Specific Directing Certificateholder;provided,however, that a Consultation Termination Event will not be deemed to be continuing in the event that the Certificate Balances of the certificates other than the Control Eligible Certificates have been reduced to zero as a result of principal payments on the Mortgage Loans.
Upon the occurrence of a Consultation Termination Event, there will be no Class of Certificates that will act as the Controlling Class and the Directing Certificateholder will have no rights under the Pooling and Servicing Agreement, other than those rights generally available to all certificateholders.
| |
| ■ Appraised-Out Class: | A Class of Control Eligible Certificates that has been determined, as a result of Appraisal Reduction Amounts or Collateral Deficiency Amounts allocable to such Class, to no longer be the Controlling Class. | |
| ■ Remedies Available to Holders of an Appraised-Out Class: | Holders of the majority of any Class of Control Eligible Certificates that are determined at any date of determination to no longer be the Controlling Class as a result of Appraisal Reduction Amounts or Collateral Deficiency Amounts allocable to such class will have the right, at their sole expense, to require the Special Servicer to order a supplemental appraisal report from an MAI appraiser (selected by the Special Servicer) for any mortgage loan (or Serviced Whole Loan) that results in the Class becoming an Appraised-Out Class.
Upon receipt of that supplemental appraisal, the Special Servicer will be required to determine, in accordance with the Servicing Standard, whether, based on its assessment of the supplemental appraisal, any recalculation of the Appraisal Reduction Amount or Collateral Deficiency Amount is warranted, and if so warranted, and will be required to recalculate the Appraisal Reduction Amount or Collateral Deficiency Amount, as applicable, based on the supplemental appraisal and if required by such recalculation, the Appraised-Out Class will be reinstated as the Controlling Class. The holders of an Appraised-Out Class requesting a supplemental appraisal are not permitted to exercise any control or consent rights of the Controlling Class until such time, if any, as the Class is reinstated as the Controlling Class. | |
| ■ Operating Advisor: | The Operating Advisor will initially be Pentalpha Surveillance LLC. The Operating Advisor will have certain review and consultation rights relating to the performance of the Special Servicer and with respect to its actions taken in connection with the resolution and/or liquidation of specially serviced loans. With respect to each mortgage loan or serviced whole loan, the Operating Advisor will generally be responsible for reviewing the Special Servicer’s operational practices with respect to the resolution and liquidation of specially serviced loans. In addition, after the occurrence and during the continuance of a Control Termination Event, the Operating Advisor will have certain consultation rights with respect to the specially serviced loans. The Operating Advisor will generally have no obligations or consultation rights under the Pooling and Servicing Agreement with respect to the Non-Serviced Whole Loans or any related REO Property.
With respect to each mortgage loan or Serviced Whole Loan (in each case, other than a non-serviced mortgage loan or Servicing Shift Mortgage Loan), the Operating Advisor will be responsible for:
▪ reviewing the actions of the Special Servicer with respect to any Specially Serviced Loan;
▪ reviewing (i) all reports by the Special Servicer made available to Privileged Persons on the Certificate Administrator’s website and (ii) each Asset Status Report (as defined in the Preliminary Prospectus) (after the occurrence and during the continuance of an Operating Advisor Consultation Event (as defined below)) and Final Asset Status Report (as defined in the Preliminary Prospectus);
▪ recalculating and reviewing for accuracy and consistency with the Pooling and Servicing Agreement the mathematical calculations by the special servicer and the corresponding application of the non-discretionary portion of the applicable formulas |
THE INFORMATION IN THIS STRUCTURAL AND COLLATERAL TERM SHEET IS NOT COMPLETE AND MAY BE AMENDED PRIOR TO THE TIME OF SALE. THIS TERM SHEET IS NOT AN OFFER TO SELL THESE SECURITIES AND IT IS NOT A SOLICITATION OF AN OFFER TO BUY THESE SECURITIES IN ANY JURISDICTION WHERE THE OFFER OR SALE IS NOT PERMITTED.
26
| Structural and Collateral Term Sheet | BBCMS 2019-C3 | |
| Structural Overview | ||
required to be utilized in connection with Appraisal Reduction Amounts, Collateral Deficiency Amounts and net present value calculations used in the Special Servicer’s determination of what course of action to take in connection with the workout or liquidation of a Specially Serviced Loan; and
▪ preparing an annual report (if any mortgage loan (other than any Non-Serviced Mortgage Loan) or serviced whole loan was a Specially Serviced Loan at any time during the prior calendar year or an Operating Advisor Consultation Event (as defined below) occurred during the prior calendar year) that sets forth whether the Operating Advisor believes, in its sole discretion exercised in good faith, that the Special Servicer is operating in compliance with the Servicing Standard with respect to its performance of its duties under the Pooling and Servicing Agreement with respect to Specially Serviced Loans (and, after the occurrence and continuance of an Operating Advisor Consultation Event (as defined below), with respect to major decisions on non-Specially Serviced Loans) during the prior calendar year on a “trust-level basis”. The Operating Advisor will identify (1) which, if any, standards the Operating Advisor believes, in its sole discretion exercised in good faith, the Special Servicer has failed to comply with and (2) any material deviations from the Special Servicer’s obligations under the Pooling and Servicing Agreement with respect to the resolution or liquidation of any Specially Serviced Loan or REO Property (other than with respect to any REO Property related to any Non-Serviced Mortgage Loan). In preparing any Operating Advisor Annual Report (as defined in the Preliminary Prospectus), the Operating Advisor will not be required to report on instances of non-compliance with, or deviations from, the Servicing Standard or the Special Servicer’s obligations under the Pooling and Servicing Agreement that the Operating Advisor determines, in its sole discretion exercised in good faith, to be immaterial.
With respect to each mortgage loan (other than any Non-Serviced Mortgage Loan) or Serviced Whole Loan, after the Operating Advisor has received notice that an Operating Advisor Consultation Event (as defined below) has occurred and is continuing, in addition to the duties described above, the Operating Advisor will be required to perform the following additional duties:
▪ to consult (on a non-binding basis) with the Special Servicer in respect of asset status reports and
▪ to consult (on a non-binding basis) with the Special Servicer with respect to “major decisions” processed by the Special Servicer.
An “Operating Advisor Consultation Event” will occur when the Certificate Balances of the Class E-RR, F-RR, G-RR, H-RR and J-RR Certificates in the aggregate (taking into account the application of any Cumulative Appraisal Reduction Amounts to notionally reduce the Certificate Balances of such classes) is 25% or less of the initial Certificate Balances of such classes in the aggregate.
In addition, if the Operating Advisor determines that the Special Servicer is not performing its duties as required under the Pooling and Servicing Agreement or is otherwise not acting in accordance with the Servicing Standard and that replacement of the Special Servicer would be in the best interest of the certificateholders as a collective whole, the Operating Advisor will have the right to recommend the replacement of the Special Servicer and will submit its formal recommendation to the Trustee and the Certificate Administrator (along with its rationale, its proposed replacement special servicer and other relevant information justifying its recommendation).
The Operating Advisor’s recommendation to replace the Special Servicer must, among other conditions, be confirmed by an affirmative vote of holders of Certificates evidencing at least a majority of a quorum of certificateholders (taking into account the application of any Appraisal Reduction Amounts to notionally reduce the Certificate Balances of the Classes to which such Appraisal Reduction Amounts are allocable). In the event the holders of such Certificates elect to remove and replace the Special Servicer, the Certificate Administrator will be required to obtain a rating agency confirmation from each of the rating agencies at that time.
| ||
| ■ Replacement of Operating Advisor: | The Operating Advisor may be terminated or removed under certain circumstances and a replacement operating advisor appointed as described in the Preliminary Prospectus.
Any replacement operating advisor (or the personnel responsible for supervising the obligations of the replacement operating advisor) must be an institution (A) that is a special servicer or operating advisor on a commercial mortgage-backed securities transaction rated by S&P, Fitch | |
THE INFORMATION IN THIS STRUCTURAL AND COLLATERAL TERM SHEET IS NOT COMPLETE AND MAY BE AMENDED PRIOR TO THE TIME OF SALE. THIS TERM SHEET IS NOT AN OFFER TO SELL THESE SECURITIES AND IT IS NOT A SOLICITATION OF AN OFFER TO BUY THESE SECURITIES IN ANY JURISDICTION WHERE THE OFFER OR SALE IS NOT PERMITTED.
27
| Structural and Collateral Term Sheet | BBCMS 2019-C3 | |
| Structural Overview | ||
| and KBRA (including, in the case of the Operating Advisor, this transaction) but has not been special servicer or operating advisor on a transaction for which any of S&P, Fitch and KBRA has qualified, downgraded or withdrawn its rating or ratings of, one or more classes of certificates for such transaction publicly citing servicing concerns with the operating advisor in its capacity as special servicer or operating advisor on such commercial mortgage-backed securities transaction as the sole or a material factor in such rating action; (B) that can and will make the representations and warranties of the operating advisor set forth in the Pooling and Servicing Agreement; (C) that is not (and is not affiliated with) the Depositor, the Trustee, the Certificate Administrator, the Master Servicer, the Special Servicer, a Mortgage Loan Seller, the Directing Certificateholder, or a depositor, a trustee, a certificate administrator, a master servicer or special servicer with respect to the securitization of a Companion Loan, or any of their respective affiliates; (D) that has not been paid by any Special Servicer or successor special servicer any fees, compensation or other remuneration (x) in respect of its obligations under the Pooling and Servicing Agreement or (y) for the appointment or recommendation for replacement of a successor special servicer to become the Special Servicer; (E) that (x) has been regularly engaged in the business of analyzing and advising clients in commercial mortgage-backed securities matters and that has at least five years of experience in collateral analysis and loss projections and (y) has at least five years of experience in commercial real estate asset management and experience in the workout and management of distressed commercial real estate assets, and (F) that does not directly or indirectly, through one or more affiliates or otherwise, own or have derivative exposure in any interest in any certificates, any mortgage loan, any companion loan or securities backed by a companion loan or otherwise have any financial interest in the securitization transaction to which the Pooling and Servicing Agreement relates, other than in fees from its role as operating advisor and asset representations reviewer (to the extent it also acts as the asset representations reviewer). Any Operating Advisor is prohibited from making an investment in any Class of Certificates in the Trust as described in the Preliminary Prospectus. | ||
| ■ Asset Representations Reviewer: | The Asset Representations Reviewer will be required to review certain delinquent mortgage loans after a specified delinquency threshold has been exceeded and notification from the Certificate Administrator that the required percentage of Certificateholders have voted to direct a review of such delinquent mortgage loans. An “Asset Review Trigger” will occur when either (1)mortgage loans with an aggregate outstanding principal balance of 25.0% or more of the aggregate outstanding principal balance of all of themortgage loans (including any REO Loans (or a portion of any REO Loan in the case of a Whole Loan)) held by the issuing entity as of the end of the applicable Collection Period are Delinquent Loans (2)(A) prior to and including the second anniversary of the Closing Date at least 10 mortgage loans are Delinquent Loans and the outstanding principal balance of such Delinquent Loans in the aggregate constitutes at least 15.0% of the aggregate outstanding principal balance of all of the mortgage loans (including any REO Loans (or a portion of any REO Loan in the case of a Whole Loan)) held by the issuing entity as of the end of the applicable Collection Period or (B) after the second anniversary of the Closing Date, at least 15mortgage loans are Delinquent Loans and the outstanding principal balance of such Delinquent Loans in the aggregate constitutes at least 20.0% of the aggregate outstanding principal balance of all of themortgage loans (including any REO Loans (or a portion of any REO Loan in the case of a Whole Loan)) held by the issuing entity as of the end of the applicable Collection Period.
Following the determination that an Asset Review Trigger has occurred, the Certificate Administrator will include in the Form 10-D relating to the distribution period in which the Asset Review Trigger occurred a description of the events that caused the Asset Review Trigger to occur. Once an Asset Review Trigger has occurred, Certificateholders evidencing not less than 5% of the voting rights may deliver to the Certificate Administrator a written direction requesting a vote on whether to commence an Asset Review within 90 days after the filing of the Form 10-D reporting the occurrence of the Asset Review Trigger (an “Asset Review Vote Election”). If directed by such Certificateholders, a vote of all Certificateholders will commence and an Asset Review will occur if more than a majority of Certificateholders voting (assuming Certificateholders representing a minimum of 5% of the voting rights respond) vote affirmatively within 150 days of the Asset Review Vote Election. If the vote does not come to pass within such 150-day period, then no further votes will occur unless and until (A) an additionalmortgage loan becomes a Delinquent Loan after the expiration of such 150 day period, (B) a new Asset Review Trigger occurs or an Asset Review Trigger is otherwise in effect, (C) Certificateholders representing 5% of the voting rights again elect to cause a vote of all the Certificateholders and (D) such vote has occurred within 150 after the election described in clause (C) above. |
THE INFORMATION IN THIS STRUCTURAL AND COLLATERAL TERM SHEET IS NOT COMPLETE AND MAY BE AMENDED PRIOR TO THE TIME OF SALE. THIS TERM SHEET IS NOT AN OFFER TO SELL THESE SECURITIES AND IT IS NOT A SOLICITATION OF AN OFFER TO BUY THESE SECURITIES IN ANY JURISDICTION WHERE THE OFFER OR SALE IS NOT PERMITTED.
28
| Structural and Collateral Term Sheet | BBCMS 2019-C3 | |
| Structural Overview | ||
| ■ Replacement of the Asset Representations Reviewer: | The Asset Representations Reviewer may be terminated and replaced without cause. Upon (i) the written direction of Certificateholders evidencing not less than 25% of the voting rights (without regard to the application of any Cumulative Appraisal Reduction Amounts) requesting a vote to terminate and replace the Asset Representations Reviewer with a proposed successor asset representations reviewer that is an Eligible Asset Representations Reviewer, and (ii) payment by such holders to the Certificate Administrator of the reasonable fees and expenses to be incurred by the Certificate Administrator in connection with administering such vote, the Certificate Administrator will promptly provide notice to all Certificateholders and the Asset Representations Reviewer of such request by posting such notice on its internet website, and by mailing to all Certificateholders and the Asset Representations Reviewer. Upon the written direction of Certificateholders evidencing at least 75% of a Certificateholder Quorum (without regard to the application of any Cumulative Appraisal Reduction Amounts), the Trustee will terminate all of the rights and obligations of the Asset Representations Reviewer under the Pooling and Servicing Agreement by written notice to the Asset Representations Reviewer, and the proposed successor asset representations reviewer will be appointed. | |
| ■ Appointment and Replacement of Special Servicer: | The Directing Certificateholder will appoint the initial Special Servicer as of the Closing Date. Prior to the occurrence and continuance of a Control Termination Event, the Special Servicer may generally be replaced at any time and without causeby the Directing Certificateholder.
If the Special Servicer obtains knowledge that it has become a Borrower Party with respect to any mortgage loan or Serviced Whole Loan (any such mortgage loan or Serviced Whole Loan, an “Excluded Special Servicer Loan”), the Special Servicer will be required to resign as Special Servicer of that Excluded Special Servicer Loan. Prior to the occurrence and continuance of a Control Termination Event, if the applicable Excluded Special Servicer Loan is not also an Excluded Loan as to the Directing Certificateholder, the Directing Certificateholder will be required to select a successor special servicer that is not a Borrower Party in accordance with the terms of the Pooling and Servicing Agreement (an “Excluded Special Servicer”) for the related Excluded Special Servicer Loan. After the occurrence and during the continuance of a Control Termination Event or if at any time the applicable Excluded Special Servicer Loan is also an Excluded Loan as to the Directing Certificateholder, the resigning Special Servicer will be required to use commercially reasonable efforts to appoint the Excluded Special Servicer.
Upon the occurrence and during the continuance of a Control Termination Event, the Directing Certificateholder will no longer have the right to replace the Special Servicer and such replacement will occur based on a vote of holders of all voting eligible Classes of Certificates as described below.
| |
| ■ Replacement of Special Servicer by Vote of Certificateholders: | After the occurrence and during the continuance of a Control Termination Event and upon (a) the written direction of holders of principal balance Certificates evidencing not less than 25% of the Voting Rights of all Classes of principal balance Certificates (taking into account the application of Cumulative Appraisal Reduction Amounts to notionally reduce the Certificate Balances of Classes to which such Cumulative Appraisal Reduction Amounts are allocable) requesting a vote to replace the Special Servicer with a replacement special servicer, (b) payment by such requesting holders to the Certificate Administrator of all reasonable fees and expenses to be incurred by the Certificate Administrator in connection with administering such vote and (c) delivery by such holders to the Certificate Administrator and the Trustee of written confirmations from each Rating Agency that the appointment of such replacement special servicer will not result in a downgrade, withdrawal or qualification of the Certificates (which confirmations will be obtained at the expense of such holders) and confirmation from the applicable rating agencies that the contemplated appointment or replacement will not result in the downgrade, withdrawal or qualification of the then-current ratings of any class of any related securities, the Certificate Administrator will be required to post such notice on its Internet website, and by mail conduct the solicitation of votes of all Certificates in such regard, which such vote must occur within 180 days of the posting of such notice. Upon the written direction of holders of at least 66-2/3% of a Certificateholder Quorum, the Trustee will immediately replace the Special Servicer with a qualified replacement special servicer designated by such holders of Certificates.
A “Certificateholder Quorum” means, in connection with any solicitation of votes in connection with the replacement of the Special Servicer or the Asset Representations Reviewer described above, the holders of Certificates evidencing at least 50% of the aggregate Voting Rights (taking into account the application of realized losses and, other than with respect to the termination of the Asset Representations Reviewer, the application of any Cumulative Appraisal Reduction |
THE INFORMATION IN THIS STRUCTURAL AND COLLATERAL TERM SHEET IS NOT COMPLETE AND MAY BE AMENDED PRIOR TO THE TIME OF SALE. THIS TERM SHEET IS NOT AN OFFER TO SELL THESE SECURITIES AND IT IS NOT A SOLICITATION OF AN OFFER TO BUY THESE SECURITIES IN ANY JURISDICTION WHERE THE OFFER OR SALE IS NOT PERMITTED.
29
| Structural and Collateral Term Sheet | BBCMS 2019-C3 | |
| Structural Overview | ||
Amounts to notionally reduce the Certificate Balance of the Certificates) of all principal balance Certificates on an aggregate basis.
With respect to each of the Serviced Whole Loan, the holders of the related Pari Passu Companion Loans, under certain circumstances following a servicer termination event with respect to the Special Servicer, will be entitled to direct the Trustee (and the Trustee will be required) to terminate the Special Servicer solely with respect to such Serviced Whole Loan. A replacement special servicer will be selected by the Trustee or, prior to a Control Termination Event, by the Directing Certificateholder;provided,however, that any successor special servicer appointed to replace the Special Servicer with respect to such Whole Loan can generally not be the person (or its affiliate) that was terminated at the direction of the holder of the related Pari Passu Companion Loan. | ||
| With respect to any Non-Serviced Whole Loan, the BBCMS 2019-C3 trust as holder of the related mortgage loan has similar termination rights in the event of a servicer termination event with respect to the special servicer under the applicable trust and servicing agreement or pooling and servicing agreement, as applicable, as described above, which may be exercised by the Directing Certificateholder prior to the Control Termination Event. However, the successor special servicer will be selected pursuant to the applicable trust and servicing agreement or pooling and servicing agreement, as applicable, by the related directing holder prior to a control event under such trust and servicing agreement or pooling and servicing agreement, as applicable. The Master Servicer and Special Servicer are entitled to certain fees in connection with the servicing and administration of the mortgage loans as more fully described in “Pooling and Servicing Agreement—Servicing and Other Compensation and Payment of Expenses” in the Preliminary Prospectus. | ||
| ■ Dispute Resolution Provisions: | Each Mortgage Loan Seller will be subject to the dispute resolution provisions set forth in the Pooling and Servicing Agreement to the extent those provisions are triggered with respect to any mortgage loan sold to the Depositor by a Mortgage Loan Seller and such Mortgage Loan Seller will be obligated under the related mortgage loan purchase agreement to comply with all applicable provisions and to take part in any mediation or arbitration proceedings that may result.
Generally, in the event that a request to repurchase a mortgage loan (a “Repurchase Request”) is not “Resolved” (as defined below) within 180 days after the related Mortgage Loan Seller receives such Repurchase Request (a “Resolution Failure”), then the Enforcing Servicer (as defined below) will be required to send a notice to the “Initial Requesting Certificateholder” (if any) indicating the Enforcing Servicer’s intended course of action with respect to the Repurchase Request. If (a) the Enforcing Servicer’s intended course of action with respect to the Repurchase Request does not involve pursuing further action to exercise rights against the related Mortgage Loan Seller with respect to the Repurchase Request and the Initial Requesting Certificateholder, if any, or any other Certificateholder or Certificate Owner wishes to exercise its right to refer the matter to mediation (including nonbinding arbitration) or arbitration, or (b) the Enforcing Servicer’s intended course of action is to pursue further action to exercise rights against the related Mortgage Loan Seller with respect to the Repurchase Request but the Initial Requesting Certificateholder, if any, or any other Certificateholder or Certificate Owner does not agree with the dispute resolution method selected by the Enforcing Servicer, then the Initial Requesting Certificateholder, if any, or such other Certificateholder or Certificate Owner may deliver a written notice to the Enforcing Servicer indicating its intent to exercise its right to refer the matter to either mediation or arbitration.
The Enforcing Servicer will be required to consult with any Certificateholder or Certificate Owner that delivers a notice of its intent to exercise its dispute resolution rights (a “Requesting Certificateholder”) so that a Requesting Certificateholder may consider the views of the Enforcing Servicer as to the claims underlying the Repurchase Request and possible dispute resolution methods. If a Requesting Certificateholder elects to exercise its right to refer the matter to either mediation or arbitration, then it will become the party responsible for enforcing the Repurchase Request and must promptly submit the matter to mediation (including nonbinding arbitration) or arbitration. Failure to make an election to exercise that right or failure to begin the elected form of proceedings within the certain timeframe set forth in the Pooling and Servicing Agreement will generally waive the Certificateholders’ or Certificate Owners’ rights with respect to the related Repurchase Request.
The “Enforcing Servicer” will be (a) with respect to a specially serviced loan, the Special Servicer, and (b) with respect to a non-specially serviced loan, (i) in the case of a Repurchase Request made by the Special Servicer, the Directing Certificateholder or a Controlling Class Certificateholder, the Master Servicer, and (ii) in the case of a Repurchase Request made by any person other than the Special Servicer, the Directing Certificateholder or a Controlling Class |
THE INFORMATION IN THIS STRUCTURAL AND COLLATERAL TERM SHEET IS NOT COMPLETE AND MAY BE AMENDED PRIOR TO THE TIME OF SALE. THIS TERM SHEET IS NOT AN OFFER TO SELL THESE SECURITIES AND IT IS NOT A SOLICITATION OF AN OFFER TO BUY THESE SECURITIES IN ANY JURISDICTION WHERE THE OFFER OR SALE IS NOT PERMITTED.
30
| Structural and Collateral Term Sheet | BBCMS 2019-C3 | |
| Structural Overview | ||
Certificateholder, (A) prior to a Resolution Failure relating to such non-specially serviced loan, the Master Servicer, and (B) from and after a Resolution Failure relating to such non-specially serviced Loan, the Special Servicer.
“Resolved” means, with respect to a Repurchase Request, (i) that the related Material Defect has been cured, (ii) the related mortgage loan has been repurchased in accordance with the related mortgage loan purchase agreement, (iii) a mortgage loan has been substituted for the related mortgage loan in accordance with the related mortgage loan purchase agreement, (iv) the applicable Mortgage Loan Seller makes a Loss of Value Payment (as defined in the Preliminary Prospectus), (v) a contractually binding agreement is entered into between the Enforcing Servicer, on behalf of the issuing entity, and the related Mortgage Loan Seller that settles the related Mortgage Loan Seller’s obligations under the related mortgage loan purchase agreement, or (vi) the related mortgage loan is no longer property of the issuing entity as a result of a sale or other disposition in accordance with the Pooling and Servicing Agreement. | ||
| ■ Investor Communications: | The Certificate Administrator is required to include on any Form 10–D any request received from a Certificateholder to communicate with other Certificateholders related to Certificateholders exercising their rights under the terms of the Pooling and Servicing Agreement. Any Certificateholder wishing to communicate with other Certificateholders regarding the exercise of its rights under the terms of the Pooling and Servicing Agreement should deliver a written request signed by an authorized representative of the requesting investor to the Certificate Administrator at the address below:
9062 Old Annapolis Road Columbia, Maryland 21045 Attention: Corporate Trust Administration Group – BBCMS Mortgage Trust 2019-C3 With a copy to: trustadministrationgroup@wellsfargo.com
| |
| ■ Master Servicer and Special Servicer Compensation: | The Master Servicer is entitled to a fee (the “Servicing Fee”) payable monthly from interest received in respect of each mortgage loan, any related REO loan and any related Serviced Companion Loan that are Specially Serviced Loans that will accrue at the related servicing fee rate described in the Preliminary Prospectus. The Special Servicer is also entitled to a fee (the “Special Servicing Fee”) with respect to each specially serviced loan and REO loan (other than a non-serviced mortgage loan) at the special servicing fee rate described in the Preliminary Prospectus.
In addition to the Servicing Fee, Special Servicing Fee and certain other fees described below, the Master Servicer and Special Servicer are entitled to retain and share certain additional servicing compensation, including assumption application fees, assumption fees, defeasance fees and certain Excess Modification Fees and consent fees with respect to the mortgage loans. The Special Servicer may also be entitled to either a Workout Fee or Liquidation Fee, but not both, from recoveries in respect of any particular mortgage loan.
An “Excess Modification Fee” with respect to any mortgage loan (other than a non-serviced mortgage loan) or Serviced Whole Loan is the sum of (A) the excess, if any, of (i) any and all Modification Fees with respect to a mortgage loan or Serviced Whole Loan, over (ii) all unpaid or unreimbursed additional expenses described in the Preliminary Prospectus (excluding Special Servicing Fees, Workout Fees and Liquidation Fees) outstanding with respect to the related mortgage loan or Serviced Whole Loan, and reimbursed from such Modification Fees and (B) expenses previously paid or reimbursed from Modification Fees as described in clause (A), which expenses have subsequently been recovered from the related borrower or otherwise.
With respect to the Master Servicer and Special Servicer, the Excess Modification Fees collected and earned by such servicer from the related borrower (taken in the aggregate with any other Excess Modification Fees collected and earned by such servicer from the related borrower within the prior 12 months of the collection of the current Excess Modification Fees) will be subject to a cap of 1.00% of the outstanding principal balance of the related mortgage loan or Serviced Whole Loan, as applicable, on the closing date of the related modification, extension, waiver or amendment. A “Modification Fee” with respect to any mortgage loan (other than a non-serviced mortgage loan) or Serviced Companion Loan is generally any fee with respect to a modification, extension, waiver or amendment of any mortgage loan and/or related Serviced Companion Loan (other than all assumption fees, assumption application fees, consent fees, defeasance fees, Special Servicing Fees, Liquidation Fees or Workout Fees).
A “Workout Fee” will generally be payable with respect to each corrected loan and will be calculated at a rate of 1.00% of payments of principal and interest on the respective mortgage loan for so long as it remains a corrected loan, subject to a maximum of $1,000,000 in the |
THE INFORMATION IN THIS STRUCTURAL AND COLLATERAL TERM SHEET IS NOT COMPLETE AND MAY BE AMENDED PRIOR TO THE TIME OF SALE. THIS TERM SHEET IS NOT AN OFFER TO SELL THESE SECURITIES AND IT IS NOT A SOLICITATION OF AN OFFER TO BUY THESE SECURITIES IN ANY JURISDICTION WHERE THE OFFER OR SALE IS NOT PERMITTED.
31
| Structural and Collateral Term Sheet | BBCMS 2019-C3 | |
| Structural Overview | ||
aggregate with respect to any particular corrected loan. After receipt by the Special Servicer of Workout Fees with respect to a corrected loan in an amount equal to $25,000, any Workout Fees in excess of such amount will be reduced by the Excess Modification Fee Amount;provided that in the event the Workout Fee, collected over the course of such workout calculated at the Workout Fee Rate is less than $25,000, then the Special Servicer will be entitled to an amount from the final payment on the related corrected loan (including any related Serviced Companion Loan) that would result in the total Workout Fees payable to the Special Servicer in respect of that corrected loan (including any related Serviced Companion Loan) equal to $25,000.
The “Excess Modification Fee Amount” for any corrected loan is an amount equal to the aggregate of any Excess Modification Fees paid by or on behalf of the related borrower with respect to the related mortgage loan (including the related Serviced Companion Loan) and received and retained by the Master Servicer or the Special Servicer, as applicable, as additional servicing compensation within the prior 12 months of the related modification, waiver, extension or amendment resulting in the mortgage loan or REO loan being a corrected loan, but only to the extent those fees have not previously been deducted from a Workout Fee or Liquidation Fee.
A “Liquidation Fee” will generally be payable with respect to each (i) non-specially serviced loan with respect to which the special servicer acts at the Enforcing Servicer, (ii) specially serviced loan or (iii) REO property (except with respect to any non-serviced mortgage loan) as to which the Special Servicer obtains a full or partial recovery of the related asset. The Liquidation Fee for each specially serviced mortgage loan will be payable at a rate of 1.00% of the liquidation proceeds (exclusive of default interest) subject to a maximum of $1,000,000;provided,however, that no Liquidation Fee will be less than $25,000.
The Liquidation Fees will be reduced by the amount of any Excess Modification Fees received by the Special Servicer with respect to the related mortgage loan (including a Serviced Companion Loan) or REO property as additional compensation within the prior 12 months, but only to the extent those fees have not previously been deducted from a Workout Fee or Liquidation Fee.
Similar fees to those described above will be payable to the applicable special servicer for the Non-Serviced Whole Loans under the related trust and servicing agreement or pooling and servicing agreement, as applicable.
Subject to certain limited exceptions, in connection with its duties under the Pooling and Servicing Agreement, the Special Servicer and its affiliates are prohibited from receiving or retaining any compensation (other than compensation specifically provided for under the Pooling and Servicing Agreement) from anyone in connection with the disposition, workout or foreclosure of any mortgage loan, the management or disposition of any REO property, or the performance of any other special servicing duties under the Pooling and Servicing Agreement. In the event the Special Servicer does receive any such compensation, it will be required to disclose those fees to the Certificate Administrator who will include it as part of the statement to Certificateholders.
In addition, no liquidation fee will be payable to the Special Servicer upon the purchase of (A) any Specially Serviced Loan that is part of a Serviced Whole Loan with a Subordinate Companion Loan or related REO property by the holder of the related Subordinate Companion Loan or (B) any Specially Serviced Loan or an REO property that is subject to mezzanine indebtedness by the holder of the related mezzanine loan, in each case, within 90 days of such holder’s purchase option first becoming exercisable during the period prior to such Mortgage Loan becoming a Corrected Loan (as defined in the Preliminary Prospectus).
| ||
| ■ Deal Website: | The Certificate Administrator will maintain a deal website to which certain persons will have access to certain information including, but not limited to the following, which will be posted: ▪ special notices, ▪ summaries of any final asset status reports, ▪ appraisals in connection with Appraisal Reductions plus any second appraisals ordered, ▪ an “Investor Q&A Forum,” ▪ a voluntary investor registry, and ▪ SEC EDGAR filings. |
THE INFORMATION IN THIS STRUCTURAL AND COLLATERAL TERM SHEET IS NOT COMPLETE AND MAY BE AMENDED PRIOR TO THE TIME OF SALE. THIS TERM SHEET IS NOT AN OFFER TO SELL THESE SECURITIES AND IT IS NOT A SOLICITATION OF AN OFFER TO BUY THESE SECURITIES IN ANY JURISDICTION WHERE THE OFFER OR SALE IS NOT PERMITTED.
32
[THIS PAGE INTENTIONALLY LEFT BLANK]
33
| Structural and Collateral Term Sheet | BBCMS 2019-C3 | |
| No. 1 – SSTII Self Storage Portfolio II | ||

THE INFORMATION IN THIS STRUCTURAL AND COLLATERAL TERM SHEET IS NOT COMPLETE AND MAY BE AMENDED PRIOR TO THE TIME OF SALE. THIS TERM SHEET IS NOT AN OFFER TO SELL THESE SECURITIES AND IT IS NOT A SOLICITATION OF AN OFFER TO BUY THESE SECURITIES IN ANY JURISDICTION WHERE THE OFFER OR SALE IS NOT PERMITTED.
34
| Structural and Collateral Term Sheet | BBCMS 2019-C3 | |
| No. 1 – SSTII Self Storage Portfolio II | ||

THE INFORMATION IN THIS STRUCTURAL AND COLLATERAL TERM SHEET IS NOT COMPLETE AND MAY BE AMENDED PRIOR TO THE TIME OF SALE. THIS TERM SHEET IS NOT AN OFFER TO SELL THESE SECURITIES AND IT IS NOT A SOLICITATION OF AN OFFER TO BUY THESE SECURITIES IN ANY JURISDICTION WHERE THE OFFER OR SALE IS NOT PERMITTED.
35
| Structural and Collateral Term Sheet | BBCMS 2019-C3 | |
| No. 1 – SSTII Self Storage Portfolio II | ||
| Mortgage Loan Information | Property Information | |||
| Mortgage Loan Seller: | KeyBank | Single Asset / Portfolio: | Portfolio | |
| Original Principal Balance(1): | $57,200,000 | Title: | Fee | |
| Cut-off Date Principal Balance(1): | $57,200,000 | Property Type–Subtype: | Self Storage – Self Storage | |
| % of IPB: | 6.1% | Net Rentable Area (Units): | 6,903 | |
| Loan Purpose: | Refinance | Location: | Various | |
| Borrowers(2): | Various | Year Built / Renovated: | Various / Various | |
| Borrower Sponsor: | SmartStop Asset Management, | Occupancy: | 88.9% | |
| LLC | Occupancy Date: | 3/26/2019 | ||
| Interest Rate: | 5.00000% | 4thMost Recent NOI (As of)(3): | NAV | |
| Note Date: | 1/24/2019 | 3rdMost Recent NOI (As of)(3): | $7,303,551 (12/31/2017) | |
| Maturity Date: | 2/1/2029 | 2ndMost Recent NOI (As of): | $9,441,849 (12/31/2018) | |
| Interest-only Period: | 120 months | Most Recent NOI (As of): | NAV | |
| Original Term: | 120 months | UW Economic Occupancy: | 88.1% | |
| Original Amortization Term: | None | UW Revenues: | $13,234,845 | |
| Amortization Type: | Interest Only | UW Expenses: | $3,986,726 | |
| Call Protection: | L(28),Def(88),O(4) | UW NOI: | $9,248,119 | |
| Lockbox / Cash Management: | Springing | UW NCF: | $9,152,004 | |
| Additional Debt: | Yes | Appraised Value / Per Unit(4): | $175,000,000 / $25,351 | |
| Additional Debt Balance: | $46,800,000 | Appraisal Date(4): | 1/9/2019 | |
| Additional Debt Type: | Pari Passu | |||
| Escrows and Reserves(5) | Financial Information(1) | ||||||
| Initial | Monthly | Initial Cap | Cut-off Date Loan / Unit: | $15,066 | |||
| Taxes: | $316,559 | $87,322 | N/A | Maturity Date Loan / Unit: | $15,066 | ||
| Insurance: | $0 | Springing | N/A | Cut-off Date LTV(4): | 59.4% | ||
| Replacement Reserves: | $8,009 | $8,009 | N/A | Maturity Date LTV(4): | 59.4% | ||
| TI/LC: | $0 | $0 | N/A | UW NCF DSCR: | 1.74x | ||
| Other: | $119,623 | $0 | N/A | UW NOI Debt Yield: | 8.9% | ||
| Sources | Proceeds | % of Total | Uses | Proceeds | % of Total | ||
| Whole Loan(1) | $104,000,000 | 100.0% | Payoff Existing Debt(6) | $52,627,072 | 50.6% | ||
| Return of Equity(6) | 49,818,148 | 47.9 | |||||
| Closing Costs | 1,110,590 | 1.1 | |||||
| Upfront Reserves | 444,191 | 0.4 | |||||
| Total Sources | $104,000,000 | 100.0% | Total Uses | $104,000,000 | 100.0% | ||
| (1) | The SSTII Self Storage Portfolio II mortgage loan is part of a whole loan evidenced by fourpari passu notes with an aggregate original principal balance of $104.0 million (the “SSTII Self Storage Portfolio II Whole Loan”). The Financial Information presented in the chart above is based on the $104.0 million SSTII Self Storage Portfolio II Whole Loan. |
| (2) | The borrowers under the SSTII Self Storage Portfolio II Whole Loan are SST II 19240 Hwy 12, LLC, SSGT 3252 N US Highway 1, LLC, SST II 501 NW Business Center Dr, LLC, SST II 10325 W Broward Blvd, LLC, SSGT 6 Sun Island Rd, LLC, SST II 9890 Pollock Dr, LLC, SST II 6318 W Sahara Ave, LLC, SST II 590 E Silverado Ranch Blvd, LLC, SST II 338 Jesse St, LLC, and SST II 4630 Dick Pond Rd, LLC. |
| (3) | The majority of the SSTII Self Storage Portfolio II Properties were acquired by the loan sponsor during 2016, and thus, 4th Most Recent NOI is not available. In addition, the Nantucket property was acquired by the loan sponsor on August 22, 2017. As such, the 3rd Most Recent NOI as of December 31, 2017 for the Nantucket property represents a partial year commencing from the time of acquisition. |
| (4) | The Appraised Value / Per Unit, Appraisal Date, Cut-off Date LTV and Maturity Date LTV are calculated based on the appraised value $175,000,000, which reflects a portfolio premium attributed to the aggregate “as-is” value of the individual SSTII Self Storage Portfolio II properties. The sum of the values of each of the properties on an individual basis is $158,900,000, which represents a Cut-off Date LTV and Maturity Date LTV of 65.4% |
| (5) | For a full description of Escrows and Reserves, please refer to “Escrows and Reserves” below. |
| (6) | Proceeds from the SSTII Self Storage Portfolio II Whole Loan, along with proceeds from additional balance sheet and floating rate debt secured by non-collateral self storage properties, were used primarily to pay down a portion of various KeyBank credit facilities as well as to finance Strategic Storage Trust II, Inc.’s acquisition of another sponsor-affiliated REIT. The existing debt payoff amount represents an estimatedpro rata portion allocated to the properties securing the SSTII Self Storage Portfolio II Whole Loan. |
THE INFORMATION IN THIS STRUCTURAL AND COLLATERAL TERM SHEET IS NOT COMPLETE AND MAY BE AMENDED PRIOR TO THE TIME OF SALE. THIS TERM SHEET IS NOT AN OFFER TO SELL THESE SECURITIES AND IT IS NOT A SOLICITATION OF AN OFFER TO BUY THESE SECURITIES IN ANY JURISDICTION WHERE THE OFFER OR SALE IS NOT PERMITTED.
36
| Structural and Collateral Term Sheet | BBCMS 2019-C3 | |
| No. 1 – SSTII Self Storage Portfolio II | ||
The Loan.The SSTII Self Storage Portfolio II mortgage loan is secured by a first mortgage lien on the borrowers’ fee interest in 10 self storage properties located in five states (collectively, the “SSTII Self Storage Portfolio II Properties”). The SSTII Self Storage Portfolio II Whole Loan has an outstanding principal balance as of the Cut-off Date of $104.0 million and is comprised of fourpari passu notes, Note A-1, Note A-2, Note A-3, and Note A-4. Note A-1, the control note, has an original principal balance of $57,200,000 and will be included in the BBCMS 2019-C3 Trust. The SSTII Self Storage Portfolio II Whole Loan will be serviced pursuant to the pooling and servicing agreement of the BBCMS 2019-C3 Trust. The SSTII Self Storage Portfolio II Whole Loan has a 10-year term and is interest-only for the full term of the loan.
| Whole Loan Summary | |||
| Note | Original Balance | Note Holder | Controlling Piece |
| A-1 | $57,200,000 | BBCMS 2019-C3 | Yes |
| A-2 | 26,000,000 | CF 2019-CF1 | No |
| A-3 | 13,000,000 | CF 2019-CF1 | No |
| A-4 | 7,800,000 | CF 2019-CF1 | No |
| Total | $104,000,000 | ||
The Properties.The SSTII Self Storage Portfolio II Properties are comprised of 10 cross-collateralized self storage facilities with a total of 6,903 units totaling approximately 800,961 square feet and 325 parking spaces for lease. All facilities contain an on-site leasing office. The SSTII Self Storage Portfolio II Properties were constructed between 1984 and 2011 and, as of March 26, 2019, were 88.9% occupied. The SSTII Self Storage Portfolio II Properties are located across five states with three each in Florida and Nevada, two in South Carolina, and one each in Massachusetts and California. The loan sponsor acquired the SSTII Self Storage Portfolio II Properties between July 2014 and August 2017 and has a cost basis of approximately $142.0 million, which results in a whole loan to cost basis ratio of 73.3%.
The following table presents certain information relating to the SSTII Self Storage Portfolio II Properties:
| Portfolio Summary | ||||||||
| Property Name | Location | Year Built | Net Rentable Area (SF)(1) | Units(1) | Allocated Loan Amount (“ALA”)(2) | % of ALA | Appraised Value(3) | UW NOI % |
| Nantucket | Nantucket, MA | 2011 | 93,177 | 842 | $25,198,238 | 24.2% | $38,500,000 | 23.2% |
| Plantation | Plantation, FL | 2001 | 88,849 | 903 | $15,969,792 | 15.4% | $24,400,000 | 15.0% |
| Pollock | Las Vegas, NV | 2000 | 88,840 | 767 | $10,471,995 | 10.1% | $16,000,000 | 9.7% |
| Silverado Ranch | Las Vegas, NV | 2002 | 89,988 | 726 | $10,210,195 | 9.8% | $15,600,000 | 9.7% |
| Myrtle Beach - Jesse | Myrtle Beach, SC | 1996 | 93,715 | 743 | $8,606,670 | 8.3% | $13,150,000 | 9.5% |
| Port St. Lucie | Port St. Lucie, FL | 1996 | 71,652 | 610 | $7,264,947 | 7.0% | $11,100,000 | 6.5% |
| Myrtle Beach - Dick Pond | Myrtle Beach, SC | 1999 | 75,320 | 598 | $6,970,422 | 6.7% | $10,650,000 | 7.3% |
| Sahara | Las Vegas, NV | 1989 | 76,425 | 617 | $6,544,997 | 6.3% | $10,000,000 | 6.7% |
| Fort Pierce | Fort Pierce, FL | 2008 | 85,245 | 758 | $6,479,547 | 6.2% | $9,900,000 | 6.7% |
| Sonoma | Sonoma, CA | 1984 | 37,750 | 339 | $6,283,197 | 6.0% | $9,600,000 | 5.8% |
| Total | 800,961 | 6,903 | $104,000,000 | 100.0% | $175,000,000 | 100.0% | ||
| (1) | Based on the underwritten rent rolls dated March 26, 2019. |
| (2) | Based on the SSTII Self Storage Portfolio II Whole Loan. |
| (3) | The Total Appraised Value of $175,000,000 reflects a portfolio premium attributed to the aggregate “as-is” value of the individual SSTII Self Storage Portfolio II Properties. The sum of the “as-is” appraised values of each of the properties on an individual basis, which are reflected in the table above, is $158,900,000. |
The five largest facilities by allocated loan amount are described below:
Nantucket.The Nantucket property is a two-story, 93,177 square foot, 842-unit self storage building located on the island of Nantucket, Massachusetts, approximately two miles southeast of the downtown area and less than one mile northeast of Nantucket Airport. Situated on a 1.70-acre site, the property was constructed in 2011 and contains an office and two apartments for on-site management, surveillance cameras, and keypad entry. The facility includes 790 climate controlled storage units, which includes 17 wine storage units in the basement level, and 52 traditional storage units. The property
THE INFORMATION IN THIS STRUCTURAL AND COLLATERAL TERM SHEET IS NOT COMPLETE AND MAY BE AMENDED PRIOR TO THE TIME OF SALE. THIS TERM SHEET IS NOT AN OFFER TO SELL THESE SECURITIES AND IT IS NOT A SOLICITATION OF AN OFFER TO BUY THESE SECURITIES IN ANY JURISDICTION WHERE THE OFFER OR SALE IS NOT PERMITTED.
37
| Structural and Collateral Term Sheet | BBCMS 2019-C3 | |
| No. 1 – SSTII Self Storage Portfolio II | ||
was 84.7% occupied as of March 26, 2019. The Nantucket property is situated on the resort island of Nantucket within an area primarily consisting of light industrial and other commercial uses, as well as residential uses and undeveloped land.
Plantation.The Plantation property is an 88,849 square foot, 903-unit self storage facility consisting of two, two-story buildings and two, single-story buildings located in Plantation, Florida, approximately six miles west of the Fort Lauderdale central business district. Situated on a 4.75-acre site, the property was originally constructed in 2001 and contains an office for on-site management, surveillance cameras, individual unit alarms, and keypad entry. The facility includes 851 climate controlled storage units, 52 traditional storage units, and eight RV parking spaces for lease. The property was 90.3% occupied as of March 26, 2019. The area surrounding the property consists of a mix of single and multi-family residential, retail, office, and vacant land, with the Plantation Midtown District and the Broward Mall less than two miles to the east.
Pollock.The Pollock property is an 88,840 square foot, 767-unit self storage facility consisting of 11, single-story buildings located in Las Vegas, Nevada, approximately eight miles south of the Las Vegas central business district and four miles south of the Las Vegas strip. Situated on a 5.52-acre site, the property was originally constructed in 2000 and contains an office and apartment for on-site management, surveillance cameras, and keypad entry. The facility includes 433 climate controlled storage units, 334 traditional storage units, and 39 parking spaces for lease. The property was 89.8% occupied as of March 26, 2019. The area surrounding the property primarily consists of single-family residential, while commercial uses are situated along the major thoroughfares.
Silverado Ranch.The Silverado Ranch property is an 89,988 square foot, 726-unit self storage facility consisting of four, two-story buildings located in Las Vegas, Nevada, approximately eight miles south of the Las Vegas central business district and four miles south of the Las Vegas strip. Situated on a 5.52-acre site, the property was originally constructed in 2002 and contains an office and apartment for on-site management, surveillance cameras, and keypad entry. The facility includes 308 climate controlled storage units, 418 traditional storage units, and 35 covered parking spaces for lease. The property was 87.3% occupied as of March 26, 2019. The area surrounding the property primarily consists of single and multi-family residential, with commercial uses along the main thoroughfares.
Myrtle Beach - Jesse.The Myrtle Beach - Jesse property is a 93,715 square foot, 743-unit self storage facility consisting of 11, single-story buildings located in Myrtle Beach, South Carolina, approximately three miles northwest of downtown Myrtle Beach. Situated on a 6.49-acre site, the property was originally constructed in 1996 with renovations most recently completed in 2007 and contains an office for on-site management, surveillance cameras, and keypad entry. The facility includes 242 climate controlled storage units, 501 traditional storage units, three office spaces, and 27 parking spaces for lease. The property was 87.5% occupied as of March 26, 2019. The property is located in a suburban neighborhood with residential uses in the immediately surrounding area and commercial uses along the primary thoroughfares, with a large concentration along US Route 17.
THE INFORMATION IN THIS STRUCTURAL AND COLLATERAL TERM SHEET IS NOT COMPLETE AND MAY BE AMENDED PRIOR TO THE TIME OF SALE. THIS TERM SHEET IS NOT AN OFFER TO SELL THESE SECURITIES AND IT IS NOT A SOLICITATION OF AN OFFER TO BUY THESE SECURITIES IN ANY JURISDICTION WHERE THE OFFER OR SALE IS NOT PERMITTED.
38
| Structural and Collateral Term Sheet | BBCMS 2019-C3 | |
| No. 1 – SSTII Self Storage Portfolio II | ||
The following table presents detailed information with respect to the unit mix of the SSTII Self Storage Portfolio II Properties:
| Unit Mix Summary(1) | ||||||||
| Property Name | Location | Net Rentable Area (SF)(2) | Storage Units(2) | Occupancy(3) | Average Asking Rent per SF(2) | % of Climate Controlled Units | Parking Units | Office Units |
| Nantucket | Nantucket, MA | 93,177 | 842 | 84.7% | $2.88 | 93.8% | 0 | 0 |
| Plantation | Plantation, FL | 88,849 | 903 | 90.3% | $2.03 | 94.2% | 8 | 0 |
| Pollock | Las Vegas, NV | 88,840 | 767 | 89.8% | $1.49 | 56.5% | 39 | 0 |
| Silverado Ranch | Las Vegas, NV | 89,988 | 726 | 87.3% | $1.35 | 42.4% | 35 | 0 |
| Myrtle Beach - Jesse | Myrtle Beach, SC | 93,715 | 743 | 87.5% | $1.14 | 32.6% | 27 | 3 |
| Port St. Lucie | Port St. Lucie, FL | 71,652 | 610 | 87.2% | $1.10 | 75.9% | 112 | 0 |
| Myrtle Beach - Dick Pond | Myrtle Beach, SC | 75,320 | 598 | 89.0% | $1.07 | 51.2% | 69 | 0 |
| Sahara | Las Vegas, NV | 76,425 | 617 | 93.5% | $1.10 | 85.9% | 22 | 0 |
| Fort Pierce | Fort Pierce, FL | 85,245 | 758 | 90.5% | $1.19 | 95.0% | 0 | 0 |
| Sonoma | Sonoma, CA | 37,750 | 339 | 91.2% | $2.25 | 0.0% | 13 | 1 |
| Total / Wtd. Avg. | 800,961 | 6,903 | 88.9% | $1.55 | 67.3% | 325 | 4 | |
| (1) | Information is based on the underwritten rent rolls dated March 26, 2019. |
| (2) | Excludes parking and office units. |
| (3) | Occupancy is based on Storage Units. Weighted average occupancy based on square footage is 88.4%. |
Environmental. According to Phase I environmental assessments dated December 2018, there was no evidence of any recognized environmental conditions at the SSTII Self Storage Portfolio II Properties.
| Historical and Current Occupancy(1) | ||||
| Property Name | 2016(2) | 2017 | 2018 | Current(3) |
| Nantucket | N/A | 85.4% | 86.4% | 84.7% |
| Plantation | 96.6% | 92.7% | 90.0% | 90.3% |
| Pollock | 87.3% | 94.0% | 86.2% | 89.8% |
| Silverado Ranch | 90.8% | 93.6% | 87.9% | 87.3% |
| Myrtle Beach - Jesse | 94.1% | 94.3% | 85.0% | 87.5% |
| Port St. Lucie | 93.9% | 93.6% | 83.4% | 87.2% |
| Myrtle Beach - Dick Pond | 94.8% | 90.3% | 86.7% | 89.0% |
| Sahara | 90.6% | 89.6% | 89.4% | 93.5% |
| Fort Pierce | 98.7% | 95.4% | 89.5% | 90.5% |
| Sonoma | 98.3% | 96.6% | 91.8% | 91.2% |
| Wtd. Avg. | 93.7% | 92.3% | 87.5% | 88.9% |
| (1) | Historical Occupancies are as of December 31 of each respective year. |
| (2) | The Nantucket property was acquired in 2017 and the seller did not provide 2016 occupancy. |
| (3) | Current Occupancy is as of March 26, 2019. |
The Market. As of 2018, per a third party self storage market research report, the U.S. self storage market contained approximately 45,547 facilities with nearly 1.7 billion square feet. It is estimated that SmartStop Asset Management, LLC, the borrower sponsor and an affiliate of the property managers of the SSTII Self Storage Portfolio II Properties, is the ninth largest market participant by square foot with a total of approximately 10.0 million square feet under operation. The self storage industry in the United States has experienced steadily increasing performance in recent years, with overall occupancy increasing each year since 2011 except for a slight dip in occupancy from 92.8% in second quarter 2017 to 91.7% in second quarter 2018. In general, self storage customers fall into one of four main categories of renters as follows: residential (77%), commercial (19%), military (2%), and student (2%).
THE INFORMATION IN THIS STRUCTURAL AND COLLATERAL TERM SHEET IS NOT COMPLETE AND MAY BE AMENDED PRIOR TO THE TIME OF SALE. THIS TERM SHEET IS NOT AN OFFER TO SELL THESE SECURITIES AND IT IS NOT A SOLICITATION OF AN OFFER TO BUY THESE SECURITIES IN ANY JURISDICTION WHERE THE OFFER OR SALE IS NOT PERMITTED.
39
| Structural and Collateral Term Sheet | BBCMS 2019-C3 | |
| No. 1 – SSTII Self Storage Portfolio II | ||
The following table presents certain information related to the demographic profile of the SSTII Self Storage Portfolio II Properties:
| Portfolio Demographic Profile(1) | |||||||||
2018 Population Demographics | 2018-2023 Projected Population Growth % | 2018 Median Household Income | |||||||
| Property Name | 1 Mile | 3 Miles | 5 Miles | 1 Mile | 3 Miles | 5 Miles | 1 Mile | 3 Miles | 5 Miles |
| Nantucket | 1,573 | 8,902 | 10,693 | 1.49% | 1.45% | 1.45% | $102,465 | $100,383 | $100,818 |
| Plantation | 13,054 | 126,114 | 318,017 | 0.50% | 1.12% | 1.14% | $84,898 | $64,719 | $59,217 |
| Pollock | 35,301 | 149,863 | 283,572 | 1.83% | 2.00% | 1.94% | $62,782 | $65,627 | $69,269 |
| Silverado Ranch | 30,457 | 144,387 | 283,573 | 1.57% | 2.04% | 1.99% | $62,577 | $66,048 | $69,115 |
| Myrtle Beach - Jesse | 3,591 | 43,173 | 95,082 | 2.74% | 2.96% | 2.73% | $44,056 | $47,485 | $49,703 |
| Port St. Lucie | 5,267 | 43,024 | 112,834 | 2.24% | 1.78% | 1.67% | $64,814 | $57,683 | $55,417 |
| Myrtle Beach - Dick Pond | 9,060 | 36,935 | 85,207 | 2.20% | 2.65% | 2.72% | $48,762 | $50,230 | $49,808 |
| Sahara | 8,393 | 206,984 | 459,207 | 0.73% | 1.17% | 1.33% | $49,398 | $44,160 | $48,015 |
| Fort Pierce | 2,459 | 22,180 | 57,852 | 1.56% | 1.24% | 1.28% | $38,628 | $30,907 | $36,135 |
| Sonoma | 12,587 | 34,200 | 38,883 | -0.23% | -0.14% | -0.12% | $65,006 | $73,665 | $75,041 |
| Wtd. Avg. | 11,644 | 76,316 | 164,132 | 1.44% | 1.61% | 1.60% | $71,213 | $67,833 | $68,410 |
| Median | 8,727 | 43,099 | 103,958 | 1.57% | 1.62% | 1.56% | $62,680 | $61,201 | $57,317 |
| (1) | Source: Third party market research reports |
The following table presents competitive set information with respect to the SSTII Self Storage Portfolio II Properties:
| Market Overview | |||||
| Property Name | Location | Occupancy(1) | Average Asking Rent Range(1) | Competitive Set Occupancy(2) | Competitive Set Average Asking Rent Range(2) |
| Nantucket | Nantucket, MA | 84.7% | $2.21 per SF - $7.56 per SF(3) | 69.9% | $1.32 per SF - $4.64 per SF |
| Plantation | Plantation, FL | 90.3% | $1.46 per SF - $4.76 per SF | 92.0% | $0.96 per SF - $2.76 per SF |
| Pollock | Las Vegas, NV | 89.8% | $1.01 per SF - $3.00 per SF | 92.0% | $1.18 per SF - $2.80 per SF |
| Silverado Ranch | Las Vegas, NV | 87.3% | $0.73 per SF - $3.04 per SF | 94.0% | $1.50 per SF - $3.04 per SF |
| Myrtle Beach - Jesse | Myrtle Beach, SC | 87.5% | $0.91 per SF - $3.28 per SF | 87.5% | $0.54 per SF - $2.52 per SF |
| Port St. Lucie | Port St. Lucie, FL | 87.2% | $0.87 per SF - $1.88 per SF | 92.1% | $1.12 per SF - $1.96 per SF |
| Myrtle Beach - Dick Pond | Myrtle Beach, SC | 89.0% | $0.77 per SF - $3.96 per SF | 88.4% | $0.73 per SF - $2.84 per SF |
| Sahara | Las Vegas, NV | 93.5% | $0.63 per SF - $2.12 per SF | 91.6% | $0.89 per SF - $2.76 per SF |
| Fort Pierce | Fort Pierce, FL | 90.5% | $0.99 per SF - $3.00 per SF | 92.1% | $0.88 per SF - $1.96 per SF |
| Sonoma | Sonoma, CA | 91.2% | $0.91 per SF - $4.48 per SF | 93.2% | $1.11 per SF - $3.04 per SF |
| Wtd. Avg. | 88.9% | ||||
| (1) | Information is based on the underwritten rent roll dated March 26, 2019. |
| (2) | Source: Appraisals. |
| (3) | For the purpose of comparison against the competitive set, the Average Asking Rent Range for the Nantucket property excludes the 17 wine storage units, which have average asking rents ranging from $5.35 per square foot to $18.50 per square foot. |
THE INFORMATION IN THIS STRUCTURAL AND COLLATERAL TERM SHEET IS NOT COMPLETE AND MAY BE AMENDED PRIOR TO THE TIME OF SALE. THIS TERM SHEET IS NOT AN OFFER TO SELL THESE SECURITIES AND IT IS NOT A SOLICITATION OF AN OFFER TO BUY THESE SECURITIES IN ANY JURISDICTION WHERE THE OFFER OR SALE IS NOT PERMITTED.
40
| Structural and Collateral Term Sheet | BBCMS 2019-C3 | |
| No. 1 – SSTII Self Storage Portfolio II | ||
| Operating History and Underwritten Net Cash Flow(1) | |||||
| 2017(2) | 2018 | Underwritten | Per Unit | %(3) | |
| Rents in Place(4) | $10,660,464 | $13,235,789 | $14,545,183 | $2,107 | 100.0% |
| Vacant Income | 0 | 0 | 0 | 0 | 0.0 |
| Gross Potential Rent | $10,660,464 | $13,235,789 | $14,545,183 | $2,107 | 100.0% |
| (Vacancy/Credit Loss) | (146,174) | (170,407) | (1,924,892) | (279) | (13.2) |
| (Concessions) | (263,168) | (533,207) | (533,207) | (77) | (3.7) |
| Other Income(5) | 364,156 | 724,929 | 1,147,761 | 166 | 7.9 |
| Effective Gross Income | $10,615,278 | $13,257,104 | $13,234,845 | $1,917 | 91.0% |
| Total Expenses | $3,311,727 | $3,815,255 | $3,986,726 | $578 | 30.1% |
| Net Operating Income | $7,303,551 | $9,441,849 | $9,248,119 | $1,340 | 69.9% |
| Total TI/LC, Capex/RR | 0 | 0 | 96,115 | 14 | 0.7 |
| Net Cash Flow | $7,303,551 | $9,441,849 | $9,152,004 | $1,326 | 69.2% |
| (1) | The majority of the SSTII Self Storage Portfolio II Properties were acquired by the borrower sponsor during 2016, and thus, historical financials prior to 2017 are not available. |
| (2) | The 2017 cash flow reflects a partial year for the Nantucket property commencing on the date of acquisition by the loan sponsor of August 22, 2017. |
| (3) | Percentage column represents percent of Gross Potential Rent for all revenue lines and represents percent of Effective Gross Income for the remainder of fields. |
| (4) | Underwritten Rents in Place are based on the underwritten rent roll dated March 26, 2019. |
| (5) | Other Income is comprised of administration fees, unit insurance, late fees, and merchandise sales. In addition, Underwritten Other Income includes parking income and income from office units, which were historically included in Rents in Place. |
The Borrowers. The borrowing entities for the SSTII Self Storage Portfolio II Whole Loan are SST II 19240 Hwy 12, LLC, SSGT 3252 N US Highway 1, LLC, SST II 501 NW Business Center Dr, LLC, SST II 10325 W Broward Blvd, LLC, SSGT 6 Sun Island Rd, LLC, SST II 9890 Pollock Dr, LLC, SST II 6318 W Sahara Ave, LLC, SST II 590 E Silverado Ranch Blvd, LLC, SST II 338 Jesse St, LLC, and SST II 4630 Dick Pond Rd, LLC, each a Delaware limited liability company and special purpose entity with two independent directors. Legal counsel to the borrowers delivered a non-consolidation opinion in connection with the origination of the SSTII Self Storage Portfolio II Whole Loan. The borrowers are 99.9% owned by Strategic Storage Trust II, Inc. (“SST II”), the nonrecourse carve-out guarantor.
The Loan Sponsor.The loan sponsor and sponsor of SST II is SmartStop Asset Management, LLC (“SAM”), a diversified real estate company with approximately $1.8 billion of real estate assets under management, including 127 self storage facilities throughout the United States and Toronto, Canada comprised of approximately 80,000 units and 9.4 million rentable square feet. Including SST II, SAM is the sponsor of three public non-traded REITs, two of which are focused on self storage assets while the third is focused on student and senior housing assets. Founded in January 2013, SST II is a public non-traded REIT focused on stabilized income-producing self storage facilities located in primary and secondary markets across the United States and Toronto, Canada. In January 2019, Strategic Storage Growth Trust, Inc. (“SSGT”), a fourth public non-traded REIT sponsored by SAM, was acquired by and consolidated under SST II, creating a company valued at approximately $1.4 billion. With the addition of SSGT’s assets, SST II’s expanded portfolio contains 111 self storage facilities located in 17 states and Toronto, Canada totaling approximately 8.1 million net rentable square feet in approximately 70,300 self storage units.
Property Management. The SSTII Self Storage Portfolio II Properties are managed by Strategic Storage Property Management II, LLC and SS Growth Property Management, LLC, affiliates of the borrowers and the sponsor.
Escrows and Reserves. At origination, the borrowers were required to deposit into escrow $316,559 for real estate taxes, $8,009 for replacements, and $119,623 for required repairs.
Tax Escrows – On a monthly basis, the borrowers are required to escrow 1/12 of the annual estimated tax payments, which currently equates to approximately $87,322.
Insurance Escrows – There is no requirement for the borrowers to make deposits to the insurance escrow so long as the property is insured under a blanket insurance policy in accordance with the mortgage loan documents, until and unless the lender elects to apply such requirement as required in the mortgage loan documents.
THE INFORMATION IN THIS STRUCTURAL AND COLLATERAL TERM SHEET IS NOT COMPLETE AND MAY BE AMENDED PRIOR TO THE TIME OF SALE. THIS TERM SHEET IS NOT AN OFFER TO SELL THESE SECURITIES AND IT IS NOT A SOLICITATION OF AN OFFER TO BUY THESE SECURITIES IN ANY JURISDICTION WHERE THE OFFER OR SALE IS NOT PERMITTED.
41
| Structural and Collateral Term Sheet | BBCMS 2019-C3 | |
| No. 1 – SSTII Self Storage Portfolio II | ||
Replacement Reserves – On a monthly basis, the borrowers are required to escrow $8,009 for replacement reserves (approximately $0.12 per square foot annually).
Lockbox / Cash Management.The SSTII Self Storage Portfolio II Whole Loan is structured with a springing lockbox and springing cash management. Upon the occurrence and during the continuance of a Cash Sweep Period (as defined below), the borrowers are required to cause all revenues (except tenant insurance revenue) to be deposited by the borrowers or property managers into a lockbox account controlled by the lender on a weekly basis. During the continuance of a Cash Sweep Period, all sums on deposit in the clearing account are required to be transferred on a daily basis to a cash management account controlled by the lender and applied and disbursed in accordance with the mortgage loan documents, and for so long as a DSCR Trigger (as defined below) exists, with excess cash held by the lender as additional collateral for the SSTII Self Storage Portfolio II Whole Loan.
A “Cash Sweep Period” means the occurrence of (i) an event of default and will continue until such event of default is cured, (ii) any bankruptcy action of the borrowers or property managers and will continue until the property manager is replaced with a qualified manager within 60 days of such bankruptcy action (in no event will a Cash Sweep Period due to a bankruptcy of the borrowers be cured), or (iii) any period that the debt service coverage ratio as calculated in the loan documents based on the trailing three-month period is less than 1.00x (“DSCR Trigger”) and will continue until such time as the debt service coverage ratio for the immediately preceding three-month period is at least 1.05x for two consecutive calendar quarters.
Subordinate and Mezzanine Debt. None.
Partial Release. At any time after the date that is two years after the closing date of the BBCMS 2019-C3 Trust, and prior to November 1, 2028, the borrowers may obtain the release of a property included in the SSTII Self Storage Portfolio II Properties,provided that, among other things, (i) no event of default has occurred and is continuing, (ii) the borrowers defease a portion of the SSTII Self Storage Portfolio II Whole Loan equal to the greater of (a) 125% of the allocated loan amount of the property being released or (b) 80% of the net proceeds from the sale of the property being released, (iii) the debt service coverage ratio for the remaining properties following the release based on the trailing 12 months is no less than the greater of the debt service coverage ratio immediately preceding such release and 1.70x, (iv) the debt yield for the remaining properties based on the trailing 12 months is no less than the greater of the debt yield immediately preceding such release and 8.62%, and (v) the loan-to-value ratio for the remaining properties is no greater than the lesser of the loan-to-value ratio immediately preceding such release and 65.45%.
THE INFORMATION IN THIS STRUCTURAL AND COLLATERAL TERM SHEET IS NOT COMPLETE AND MAY BE AMENDED PRIOR TO THE TIME OF SALE. THIS TERM SHEET IS NOT AN OFFER TO SELL THESE SECURITIES AND IT IS NOT A SOLICITATION OF AN OFFER TO BUY THESE SECURITIES IN ANY JURISDICTION WHERE THE OFFER OR SALE IS NOT PERMITTED.
42
[THIS PAGE INTENTIONALLY LEFT BLANK]
43
| Structural and Collateral Term Sheet | BBCMS 2019-C3 | |
| No. 2 – Vanguard Portfolio | ||
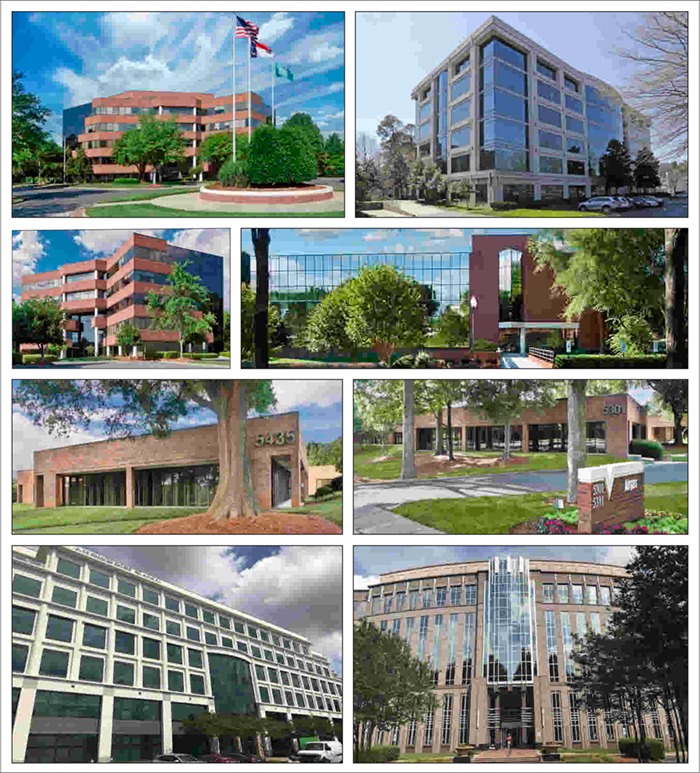
THE INFORMATION IN THIS STRUCTURAL AND COLLATERAL TERM SHEET IS NOT COMPLETE AND MAY BE AMENDED PRIOR TO THE TIME OF SALE. THIS TERM SHEET IS NOT AN OFFER TO SELL THESE SECURITIES AND IT IS NOT A SOLICITATION OF AN OFFER TO BUY THESE SECURITIES IN ANY JURISDICTION WHERE THE OFFER OR SALE IS NOT PERMITTED.
44
| Structural and Collateral Term Sheet | BBCMS 2019-C3 | |
| No. 2 – Vanguard Portfolio | ||

THE INFORMATION IN THIS STRUCTURAL AND COLLATERAL TERM SHEET IS NOT COMPLETE AND MAY BE AMENDED PRIOR TO THE TIME OF SALE. THIS TERM SHEET IS NOT AN OFFER TO SELL THESE SECURITIES AND IT IS NOT A SOLICITATION OF AN OFFER TO BUY THESE SECURITIES IN ANY JURISDICTION WHERE THE OFFER OR SALE IS NOT PERMITTED.
45
| Structural and Collateral Term Sheet | BBCMS 2019-C3 | |
| No. 2 – Vanguard Portfolio | ||
| Mortgage Loan Information | Property Information | |||
| Mortgage Loan Seller(1): | Natixis | Single Asset / Portfolio: | Portfolio | |
| Original Principal Balance(2): | $55,000,000 | Title: | Fee | |
| Cut-off Date Principal Balance(2): | $55,000,000 | Property Type–Subtype: | Office – Suburban | |
| % of IPB: | 5.9% | Net Rentable Area (SF): | 568,658 | |
| Loan Purpose: | Acquisition | Location: | Malvern, PA | |
| Borrowers(3): | Various | Year Built / Renovated: | Various / Various | |
| Borrower Sponsors(4): | Arch Street Capital Advisors, L.L.C. and Great Valley Properties Investor Company LLC | Occupancy: | 100.0% | |
| Occupancy Date: | 11/7/2018 | |||
| Interest Rate: | 4.86000% | 4th Most Recent NOI (As of)(6): | NAV | |
| Note Date: | 11/7/2018 | 3rd Most Recent NOI (As of)(6): | NAV | |
| Maturity Date: | 11/7/2028 | 2nd Most Recent NOI (As of)(6): | NAV | |
| Interest-only Period: | 120 months | Most Recent NOI (As of)(6): | NAV | |
| Original Term: | 120 months | UW Economic Occupancy: | 95.0% | |
| Original Amortization Term: | None | UW Revenues: | $13,837,018 | |
| Amortization Type: | Interest Only | UW Expenses: | $2,090,411 | |
| Call Protection(5): | L(31),Def(86),O(3) | UW NOI: | $11,746,607 | |
| Lockbox / Cash Management: | Hard / Springing | UW NCF: | $11,661,308 | |
| Additional Debt: | Yes | Appraised Value / Per SF: | $189,200,000 / $333 | |
| Additional Debt Balance(2): | $61,842,500; $12,982,500 | Appraisal Date: | 9/12/2018 | |
| Additional Debt Type(2): | Pari Passu;B-Note | |||
| Escrows and Reserves(7) | Financial Information(2) | ||||||
| Initial | Monthly | Initial Cap | A Notes | Whole Loan | |||
| Taxes: | $419,618 | $139,873 | N/A | Cut-off Date Loan / SF: | $205 | $228 | |
| Insurance: | $123,331 | $10,822 | N/A | Maturity Date Loan / SF: | $205 | $228 | |
| Replacement Reserves: | $0 | $7,108 | $255,896 | Cut-off Date LTV: | 61.8% | 68.6% | |
| TI/LC Reserves: | $0 | $0 | N/A | Maturity Date LTV: | 61.8% | 68.6% | |
| Other: | $247,551 | $0 | N/A | UW NCF DSCR: | 2.03x | 1.68x | |
| UW NOI Debt Yield: | 10.1% | 9.0% | |||||
| Sources and Uses | |||||||
| Sources | Proceeds | % of Total | Uses | Proceeds | % of Total | ||
| Mortgage Loan A Notes(2) | $116,842,500 | 64.2% | Purchase Price | $173,100,000 | 95.2% | ||
| Mortgage Loan B Note(2) | 12,982,500 | 7.1 | Closing Costs | 8,005,855 | 4.4 | ||
| Sponsor Equity | 52,071,355 | 28.6 | Upfront Reserves | 790,500 | 0.4 | ||
| Total Sources | $181,896,355 | 100.0% | Total Uses | $181,896,355 | 100.0% | ||
| (1) | The Vanguard Portfolio Whole Loan, as defined in “The Loan” below, was originated by Natixis Real Estate Capital LLC (“Natixis”). |
| (2) | The Vanguard Portfolio Mortgage Loan, as defined in “The Loan” below, is part of a larger split whole loan, which is comprised of six seniorpari passupromissory notes with an aggregate original principal balance of $116,842,500 (the “A Notes”) and one subordinate companion note with a principal balance of $12,982,500 (the “B Note”). |
| (3) | For a more detailed description of the borrowers, please refer to “The Borrowers”below. |
| (4) | For a more detailed description, please refer to “The Loan Sponsor” below. |
| (5) | Prior to the open prepayment date of September 7, 2028, the Borrowers (as defined below) have the right to defease the Vanguard Portfolio Whole Loan after the earlier to occur of (a) November 7, 2022 and (b) two years from the closing date of the securitization of the last Vanguard Portfolio Whole Loan promissory note to be securitized. The assumed lockout period of 31 payments is based on the closing date of this transaction in June 2019. Partial Release is permitted. See “Partial Release” below for further discussion. |
| (6) | Historical financial information is not available as the borrower sponsors acquired the Vanguard Portfolio Properties in 2018 and the Borrowers were not provided with historical financials. |
| (7) | For a full description of Escrows and Reserves, please refer to “Escrows and Reserves” below. |
THE INFORMATION IN THIS STRUCTURAL AND COLLATERAL TERM SHEET IS NOT COMPLETE AND MAY BE AMENDED PRIOR TO THE TIME OF SALE. THIS TERM SHEET IS NOT AN OFFER TO SELL THESE SECURITIES AND IT IS NOT A SOLICITATION OF AN OFFER TO BUY THESE SECURITIES IN ANY JURISDICTION WHERE THE OFFER OR SALE IS NOT PERMITTED.
46
| Structural and Collateral Term Sheet | BBCMS 2019-C3 | |
| No. 2 – Vanguard Portfolio | ||
The Loan.The Vanguard Portfolio mortgage loan is secured by a first mortgage lien on the borrowers’ fee interest in four single-tenant suburban office buildings located in Malvern, Pennsylvania, collectively comprising 568,658 square feet (the “Vanguard Portfolio Properties”). The Vanguard Portfolio Whole Loan was originated by Natixis and has an outstanding principal balance as of the Cut-off Date of $129.825 million (the “Vanguard Portfolio Whole Loan”), and is comprised of six seniorpari passu notes and one subordinate companion B-Note. The A Notes are comprised of sixpari passu notes, Note A-1, Note A-2, Note A-3, Note A-4, Note A-5, and Note A-6. Note A-1 and Note A-2, with an aggregate outstanding principal balance as of the Cut-off Date of approximately $55.0 million, are being contributed to the BBCMS 2019-C3 Trust (the “Vanguard Portfolio Mortgage Loan”). Note A-3, Note A-4, Note A-5, and Note A-6 are held by Natixis, have an aggregate outstanding principal balance as of the Cut-off Date of approximately $61.8 million, and are expected to be contributed to one or more future securitizations. B Note is the controlling note under the related co-lender agreement;however, after the occurrence of a control appraisal period, the holder of the Note A-1 will be the controlling noteholder. At any time that the Note A-1 holder is the controlling noteholder, the holders of Note A-2, Note A-3, Note A-4, Note A-5, and Note A-6 will be entitled, under certain circumstances, to be consulted with respect to certain major decisions. The Vanguard Portfolio Whole Loan has a 10-year term and is interest-only for the full term of the loan.
| Whole Loan Summary | ||||
| Note | Original Balance | Note Holder | Lead Servicer for Whole Loan | Controlling Piece |
| A-1 | $30,000,000 | BBCMS 2019-C3 | Yes | No |
| A-2 | 25,000,000 | BBCMS 2019-C3 | No | No |
| A-3 | 20,000,000 | Natixis | No | No |
| A-4 | 20,000,000 | Natixis | No | No |
| A-5 | 17,017,500 | Natixis | No | No |
| A-6 | 4,825,000 | Natixis | No | No |
| B | 12,982,500 | Third Party Investor | No | Yes |
| Total | $129,825,000 | |||
The Properties. The Vanguard Portfolio is comprised of four Class A suburban office buildings, totaling 568,658 square feet and built between 1989 and 2014. The Vanguard Portfolio Properties are occupied by a single tenant, The Vanguard Group (“Vanguard”), pursuant to four separate leases. The 425 Old Morehall Road and the 50 Morehall Road properties were built to suit for Vanguard in 2014 and 1997, respectively. Vanguard’s initial occupancy at the 1001 Cedar Hollow Road property and the 60 Morehall Road property started in 1998 and 1996, respectively. Vanguard’s IT Programming Department occupies 425 Old Morehall Road, 50 Morehall Road and 60 Morehall Road. The IT Programming Department serves a critical function within the company, according to Vanguard’s website. These employees include developers responsible for the programming and monitoring of existing and new investment products across the Vanguard platform. Members of Vanguard’s Investment Management division are located at 1001 Cedar Hollow Road. According to the borrower sponsors, the Vanguard Portfolio Properties meet Vanguard’s top three criteria when choosing buildings to lease, the properties: (i) are adjacent to its corporate-owned headquarters campus, (ii) are self-managed by Vanguard, and (iii) have controlled access to all points of entry in each building with a security desk in lobby. Other amenities at the Vanguard Portfolio Properties include uninterrupted power supply on all properties, on-site full-service cafeterias at the 425 Old Morehall Road, 1001 Cedar Hollow Road, and 50 Morehall Road properties and an on-site gym with locker rooms and showers at the 425 Old Morehall Road property. In addition, the Vanguard Portfolio Properties contain approximately 4.6 parking spaces per 1,000 square feet including a three-level parking deck at the 425 Old Morehall Road property. According to the borrower sponsors, Vanguard has invested in each of the Vanguard Portfolio Properties, keeping the standards in line with all its corporate owned properties. The 425 Old Morehall Road property, the largest of the four Vanguard Portfolio Properties (representing 35.5% of NRA) features LEED Gold certification and has a multitude of modern finishes and operating systems. The following table presents certain information with respect to each property comprising the Vanguard Portfolio Properties.
THE INFORMATION IN THIS STRUCTURAL AND COLLATERAL TERM SHEET IS NOT COMPLETE AND MAY BE AMENDED PRIOR TO THE TIME OF SALE. THIS TERM SHEET IS NOT AN OFFER TO SELL THESE SECURITIES AND IT IS NOT A SOLICITATION OF AN OFFER TO BUY THESE SECURITIES IN ANY JURISDICTION WHERE THE OFFER OR SALE IS NOT PERMITTED.
47
| Structural and Collateral Term Sheet | BBCMS 2019-C3 | |
| No. 2 – Vanguard Portfolio | ||
| Portfolio Summary | |||||||
| Property Name, Location | Property Type – Subtype | Net Rentable Area (SF) | Year Built / Renovated | Allocated Whole Loan Amount (“ALA”) | % of ALA | Appraised Value | UW NCF |
425 Old Morehall Road Malvern, PA | Office – Suburban | 201,658 | 2014 / N/A | $51,875,106 | 40.0% | $75,600,000 | $4,398,295 |
1001 Cedar Hollow Road Malvern, PA | Office – Suburban | 133,000 | 1998 / 2017 | 29,917,389 | 23.0 | 43,600,000 | 2,752,520 |
50 Morehall Road Malvern, PA | Office – Suburban | 117,000 | 1997 / 2014 | 24,016,253 | 18.5 | 35,000,000 | 2,246,587 |
60 Morehall Road Malvern, PA | Office – Suburban | 117,000 | 1989 / 2015 | 24,016,253 | 18.5 | 35,000,000 | 2,263,906 |
| Total | 568,658 | $129,825,000 | 100.0% | $189,200,000 | $11,661,308 | ||
Environmental. According to the Phase I environmental assessments dated November 2, 2018, there is no evidence of any recognized or historical recognized environmental conditions at the 425 Old Morehall Road and 1001 Cedar Hollow Road properties. The Phase I environmental assessment identified a recognized environmental condition at the 50 Morehall Road property related to the presence of trichloroethylene (TCE) and tetrachloroethylene (PCE) in groundwater; however, according to the third-party environmental engineers, vapor intrusion is not expected to represent a significant environmental concern. A spill of unleaded gasoline occurred at the 50 Morehall Road property and 60 Morehall Road property, which have impacted soils at the site; however, according to the third-party environmental engineers, clean-up has been completed to statewide health standards and site-specific standards as of April 23, 2009. The historic gasoline spill and clean-up are considered a historical recognized environmental condition. An environmental insurance policy is in place with a policy aggregate limit of liability of $25 million that covers commercial lender collateral protection, clean-up costs, pollution legal liability, diminution in value, and business interruption due to potential pollution. See “Description of the Mortgage Pool—Mortgage Pool Characteristics—Environmental Considerations” in the Preliminary Prospectus.
| Historical and Current Occupancy(1) | |||
| 2015 | 2016 | 2017 | Current(2) |
| 100.0% | 100.0% | 100.0% | 100.0% |
| (1) | Historical Occupancy is provided by the sponsor, Occupancies are as of December 31 of each respective year. |
| (2) | Current Occupancy is as of November 7, 2018. |
THE INFORMATION IN THIS STRUCTURAL AND COLLATERAL TERM SHEET IS NOT COMPLETE AND MAY BE AMENDED PRIOR TO THE TIME OF SALE. THIS TERM SHEET IS NOT AN OFFER TO SELL THESE SECURITIES AND IT IS NOT A SOLICITATION OF AN OFFER TO BUY THESE SECURITIES IN ANY JURISDICTION WHERE THE OFFER OR SALE IS NOT PERMITTED.
48
| Structural and Collateral Term Sheet | BBCMS 2019-C3 | |
| No. 2 – Vanguard Portfolio | ||
| Top Tenant Summary(1) | |||||||
| Tenant | Ratings Moody’s/S&P/Fitch | Net Rentable Area (SF) | % of Total NRA | Base Rent PSF | Base Rent | % of Total Base Rent | Lease Expiration Date |
| Vanguard (425 Old Morehall Road) | NA / NA / NA | 201,658 | 35.5% | $23.87 | $4,812,568 | 37.7% | 10/31/2030 |
| Vanguard (1001 Cedar Hollow Road) | NA / NA / NA | 133,000 | 23.4 | $22.64 | 3,011,120 | 23.6 | 10/31/2029 |
| Vanguard (50 Morehall Road) | NA / NA / NA | 117,000 | 20.6 | $20.98 | 2,454,660 | 19.2 | 10/31/2027 |
| Vanguard (60 Morehall Road) | NA / NA / NA | 117,000 | 20.6 | $21.14 | 2,473,263 | 19.4 | 10/31/2028 |
| Occupied Collateral Total / Wtd. Avg. | 568,658 | 100.0% | $22.42 | $12,751,611 | 100.0% | ||
| Vacant Space | 0 | 0.0% | |||||
| Collateral Total | 568,658 | 100.0% | |||||
| (1) | Based on the underwritten rent roll. |
| Lease Rollover Schedule(1) | |||||||||
| Year | Number of Leases Expiring | Net Rentable Area Expiring | % of NRA Expiring | Base Rent Expiring | % of Base Rent Expiring | Cumulative Net Rentable Area Expiring | Cumulative % of NRA Expiring | Cumulative Base Rent Expiring | Cumulative % of Base Rent Expiring |
| Vacant | NAP | 0 | 0.0% | NAP | NAP | 0 | 0.0% | NAP | NAP |
| 2019 & MTM | 0 | 0 | 0.0 | $0 | 0.0% | 0 | 0.0% | $0 | 0.0% |
| 2020 | 0 | 0 | 0.0 | 0 | 0.0 | 0 | 0.0% | $0 | 0.0% |
| 2021 | 0 | 0 | 0.0 | 0 | 0.0 | 0 | 0.0% | $0 | 0.0% |
| 2022 | 0 | 0 | 0.0 | 0 | 0.0 | 0 | 0.0% | $0 | 0.0% |
| 2023 | 0 | 0 | 0.0 | 0 | 0.0 | 0 | 0.0% | $0 | 0.0% |
| 2024 | 0 | 0 | 0.0 | 0 | 0.0 | 0 | 0.0% | $0 | 0.0% |
| 2025 | 0 | 0 | 0.0 | 0 | 0.0 | 0 | 0.0% | $0 | 0.0% |
| 2026 | 0 | 0 | 0.0 | 0 | 0.0 | 0 | 0.0% | $0 | 0.0% |
| 2027 | 1 | 117,000 | 20.6 | 2,454,660 | 19.2 | 117,000 | 20.6% | $2,454,660 | 19.2% |
| 2028 | 1 | 117,000 | 20.6 | 2,473,263 | 19.4 | 234,000 | 41.1% | $4,927,923 | 38.6% |
| 2029 | 1 | 133,000 | 23.4 | 3,011,120 | 23.6 | 367,000 | 64.5% | $7,939,043 | 62.3% |
| 2030 & Beyond | 1 | 201,658 | 35.5 | 4,812,568 | 37.7 | 568,658 | 100.0% | $12,751,611 | 100.0% |
| Total | 4 | 568,658 | 100.0% | $12,751,611 | 100.0% | ||||
| (1) | Based on the underwritten rent roll. |
THE INFORMATION IN THIS STRUCTURAL AND COLLATERAL TERM SHEET IS NOT COMPLETE AND MAY BE AMENDED PRIOR TO THE TIME OF SALE. THIS TERM SHEET IS NOT AN OFFER TO SELL THESE SECURITIES AND IT IS NOT A SOLICITATION OF AN OFFER TO BUY THESE SECURITIES IN ANY JURISDICTION WHERE THE OFFER OR SALE IS NOT PERMITTED.
49
| Structural and Collateral Term Sheet | BBCMS 2019-C3 | |
| No. 2 – Vanguard Portfolio | ||
| Operating History and Underwritten Net Cash Flow(1) | |||
| Underwritten(2) | Per Square Foot | %(3) | |
| Rents in Place | $12,751,611 | $22.42 | 87.5% |
| Vacant Income | 0 | 0.00 | 0.0 |
| Gross Potential Rent | $12,751,611 | $22.42 | 87.5% |
| Total Reimbursements | 1,813,671 | 3.19 | 12.5 |
| Net Rental Income | $14,565,282 | $25.61 | 100.0% |
| (Vacancy/Credit Loss) | (728,264) | (1.28) | (5.0) |
| Other Income | 0 | 0.00 | 0.0 |
| Effective Gross Income | $13,837,018 | $24.33 | 95.0% |
| Total Expenses | $2,090,411 | $3.68 | 15.1% |
| Net Operating Income | $11,746,607 | $20.66 | 84.9% |
| Total TI/LC, Capex/RR | 85,299 | 0.15 | 0.6 |
| Net Cash Flow | $11,661,308 | $20.51 | 84.3% |
| (1) | There is no historical operating history as this is an acquisition and the borrower sponsors were not provided with operating history. |
| (2) | The underwritten Gross Potential Rent includes rent averaging through the term of the Vanguard Portfolio Whole Loan. |
| (3) | % column represents percent of Net Rental Income for all revenue lines and represents percent of Effective Gross Income for the remainder of fields. |
The Markets.The Vanguard Portfolio Properties are located in Malvern, Chester County, Pennsylvania, part of the Philadelphia-Camden-Wilmington, PA-NJ-DE-MD Metropolitan Statistical Area, which is the seventh most populous metropolitan area in the country and generates a higher level of GDP per capita than the nation overall, according to the appraiser.
The Vanguard Portfolio Properties are part of the Great Valley Corporate Center located in Malvern, Pennsylvania, approximately 20 miles west of the Philadelphia central business district. The Vanguard Portfolio Properties are primarily serviced by two major regional transportation highways, U.S. Route 202 and Pennsylvania Turnpike (I-76), the latter of which provides access to western suburban core markets nearby, including King of Prussia, Plymouth Meeting, Fort Washington, Willow Grove, and Conshohocken. The Vanguard Portfolio Properties’ secondary highway access is provided by Route 29, Swedesford Road, and Route 30. Public transportation is immediately adjacent to GVCC via the SEPTA bus system and a nearby commuter rail station in downtown Malvern.
According to a third party research report, the Malvern market is considered part of the Philadelphia main line, an upper-class area with historical roots stretching along Route 30 which leads directly into downtown Philadelphia. The properties benefit from proximity to some of the most affluent neighborhoods and school districts in the Philadelphia suburbs. The estimated 2018 population and average household income within a one-, three-, and five-mile radius of the Vanguard Portfolio Properties are 1,107, 25,000, and 84,499, respectively, and $170,350, $165,601, and $153,975, respectively. The properties are also located approximately eight miles from King of Prussia Mall, the largest super-regional mall in the Eastern United States. The Malvern market offers a mix of office and research facilities, retail centers, and a diverse base of residential housing options. The Malvern market has had significant development in the past five years and is in the middle of ongoing residential and commercial projects like Atwater and Uptown Worthington.
According to the appraisals, the Vanguard Portfolio Properties are located in the Exton/Whitelands office submarket containing approximately 14.8 million SF of office inventory. The appraisals concluded a current market rental rate of $29.93 PSF on gross basis, submarket rental rate of $24.68 PSF on gross basis, submarket vacancy rate of 5.8% and net absorption of -6,732 SF.
THE INFORMATION IN THIS STRUCTURAL AND COLLATERAL TERM SHEET IS NOT COMPLETE AND MAY BE AMENDED PRIOR TO THE TIME OF SALE. THIS TERM SHEET IS NOT AN OFFER TO SELL THESE SECURITIES AND IT IS NOT A SOLICITATION OF AN OFFER TO BUY THESE SECURITIES IN ANY JURISDICTION WHERE THE OFFER OR SALE IS NOT PERMITTED.
50
| Structural and Collateral Term Sheet | BBCMS 2019-C3 | |
| No. 2 – Vanguard Portfolio | ||
The following table presents office rental data with respect to comparable office properties of the 425 Old Morehall Road property as identified in the appraisal:
| Comparable Office Rental Summary for 425 Old Morehall Road(1) | ||||||||
| Property Name/Location | Year Built | NRA (SF) | Tenant | Lease Size (SF) | Rent PSF | Commencement | Lease Term (Years) | Lease Type |
425 Old Morehall Road 425 Old Morehall Road | 2014 | 201,658(2) | Vanguard(2) | 201,658(2) | $23.87(2) | November 2018 | 12(3) | NNN |
One Tower Bridge 100 Front Street | 1989 | 270,127 | Morgan Stanley | 99,700 | $36.00 | March 2018 | 11(3) | Gross |
Chesterbrook Corporate Center 1200 Morris Drive | 1984 | 111,184 | JG Wentworth | 83,000 | $26.00 | June 2017 | 11(3) | Gross |
Renaissance Business Park 2301 Renaissance Boulevard King of Prussia, PA | 2002 | 189,502 | Vertex | 170,000 | $20.00 | January 2017 | 11(3) | Net |
151 South Warner Road 151 South Warner Road King of Prussia, PA | 1980 | 89,914 | The Judge Group | 89,914 | $30.42 | September 2016 | 15(3) | Gross |
Great Valley Corporate Center 2 West Liberty Boulevard Malvern, PA | 2005 | 100,975 | Teva Pharmaceuticals | 60,000 | $30.50 | May 2016 | 4(3) | Gross |
| (1) | Source:Appraisal. |
| (2) | Based on underwritten rent roll. |
| (3) | 425 Old Morehall Road’s lease term reflects remaining lease term based on the underwritten rent roll. The comparable office properties’ lease terms reflect the original lease terms. |
The following table presents office rental data with respect to comparable office properties of the 1001 Cedar Hollow Road, 50 Morehall Road, and 60 Morehall Road properties as identified in the appraisals:
| Comparable Office Rental Summary for 1001 Cedar Hollow Road, 60 Morehall Road, and 50 Morehall Road(1) | ||||||||
| Property Name/Location | Year Built | NRA (SF) | Tenant | Lease Size (SF) | Rent PSF | Commencement | Lease Term (Years) | Lease Type |
1001 Cedar Hollow Road 1001 Cedar Hollow Road Malvern, PA | 1998 | 133,000(2) | Vanguard(2) | 133,000(2) | $22.64(2) | November 2018 | 11(3) | NNN |
50 Morehall Road 50 Morehall Road Malvern, PA | 1997 | 117,000(2) | Vanguard(2) | 117,000(2) | $20.98(2) | November 2018 | 9(3) | NNN |
60 Morehall Road 60 Morehall Road Malvern, PA | 1989 | 117,000(2) | Vanguard(2) | 117,000(2) | $21.14(2) | November 2018 | 10(3) | NNN |
Chesterbrook Corporate Center 1000 Chesterbrook Boulevard Berwyn, PA | 1999 | 173,036 | Envestnet | 24,000 | $30.75 | July 2018 | 10(3) | Gross |
Chesterbrook Corporate Center 1200 Morris Drive Wayne, PA | 1984 | 111,184 | JG Wentworth | 83,000 | $26.00 | June 2017 | 11(3) | Gross |
Renaissance Business Park 2301 Renaissance Boulevard King of Prussia, PA | 2002 | 189,502 | Vertex | 170,000 | $20.00 | January 2017 | 11(3) | NNN |
First Avenue Corporate Center 935 First Avenue King of Prussia, PA | 2001
| 103,334 | Radial, Inc. | 103,334 | $18.00 | January 2017 | 15(3) | NNN |
151 South Warner Road 151 South Warner Road King of Prussia, PA | 1980 | 89,914 | The Judge Group | 89,914 | $30.42 | September 2016 | 15(3) | Gross |
Great Valley Corporate Center 2 West Liberty Boulevard Malvern, PA | 2005 | 100,975 | Teva Pharmaceuticals | 60,000 | $30.50 | May 2016 | 4(3) | Gross |
| (1) | Source:Appraisal. |
| (2) | Based on underwritten rent roll. |
| (3) | 1001 Cedar Hollow Road, 50 Morehall Road, and 60 Morehall Road’s lease terms reflect remaining lease terms based on the underwritten rent roll. The comparable office properties’ lease terms reflect the original lease terms. |
THE INFORMATION IN THIS STRUCTURAL AND COLLATERAL TERM SHEET IS NOT COMPLETE AND MAY BE AMENDED PRIOR TO THE TIME OF SALE. THIS TERM SHEET IS NOT AN OFFER TO SELL THESE SECURITIES AND IT IS NOT A SOLICITATION OF AN OFFER TO BUY THESE SECURITIES IN ANY JURISDICTION WHERE THE OFFER OR SALE IS NOT PERMITTED.
51
| Structural and Collateral Term Sheet | BBCMS 2019-C3 | |
| No. 2 – Vanguard Portfolio | ||
The Borrowers. The borrowing entities for the Vanguard Portfolio Whole Loan are 425 GVP Property Company LLC, 1001 GVP Property Company LLC and 50 GVP Property Company LLC (collectively, the “Borrowers”). Each borrower is a Delaware limited liability company and special purpose entity. The loan is structured as Shari’ah compliant and therefore, the Borrowers have master leased the properties to three operating companies which are the master lessees under the master lease. The three master lessees of the Vanguard Portfolio Properties are 425 GVP Operating Company LLC, 1001 GVP Operating Company LLC and 50 GVP Operating Company LLC, all Delaware limited liability companies and special purpose entities (collectively, the “Master Lessees”). See “Description of the Mortgage Pool—Mortgage Pool Characteristics—Shari’ah Compliant Loan” in the Preliminary Prospectus.
The Loan Sponsors.The borrower sponsors for the Vanguard Portfolio Whole Loan are Arch Street Capital Advisors, L.L.C. and Great Valley Properties Investor Company LLC. The Vanguard Portfolio Whole Loan is structured with a master lease structure to create a Shari’ah compliant structure, so there is no guarantor for the Vanguard Portfolio Whole Loan. The Borrowers and the Loan Sponsors are the parties liable for any breach or violation of the non-recourse carveouts. The Master Lessees are owned 100.0% by Great Valley Properties Investor Company LLC, which is owned 100.0% by Great Valley Properties Investor Corp. Great Valley Properties Investor Corp. is owned 2.1% by Great Valley Properties Investment Company Ltd. and 97.9% by Great Valley Properties Property Company Ltd. Great Valley Properties Investment Company Ltd. is owned by 12 investors, none of which holds, directly or indirectly, a 10.0% or more ownership interest in Great Valley Properties Investment Company Ltd. Individuals affiliated with Soor Capital Holding, W.L.L. comprise the board of directors of Great Valley Properties Investor Corp.
Property Management. The Vanguard Portfolio Properties are self-managed by Vanguard. Jones Lang LaSalle Americas, Inc. has been retained by the Borrowers for “limited scope” third party management services.
Escrows and Reserves. At origination, the Borrowers deposited in escrow (i) $419,618 for real estate taxes, (ii) $123,331 for insurance premiums, and (iii) $247,551 for required repairs.
Tax Escrows – On a monthly basis, the Borrowers are required to escrow 1/12th of the annual estimated tax payments, which currently equals $139,873.
Insurance Escrows – On a monthly basis, the Borrowers are required to escrow 1/12th of the annual estimated insurance payments, which currently equals $10,822.
Replacement Reserves – On a monthly basis, the Borrowers are required to escrow $7,108 for replacement reserves subject to a cap of $255,896. At any time after the cap is met, if the amount on deposit in the replacement reserve falls below $128,000, monthly deposits will commence until the cap is met.
Lockbox / Cash Management.The Vanguard Portfolio Whole Loan is structured with a hard lockbox and springing cash management. Pursuant to the Vanguard Portfolio Whole Loan documents, all excess funds on deposit will be applied as follows: (a) during the continuation of a Primary Tenant Sweep Period (as defined below), to the primary tenant reserve subaccount, (b) during the continuation of a Cash Management Period (as defined below), to a cash collateral reserve subaccount as additional collateral, and (c) if neither a Primary Tenant Sweep Period nor a Cash Management Period is continuing, to the Borrowers. Provided no Cash Management Period exists, all excess cash flow in the lockbox account after payment of all sums due and payable under the Vanguard Portfolio Whole Loan documents will be remitted to the Borrowers.
The “Primary Tenant” is Vanguard, and any acceptable replacement tenant.
A “Cash Management Period” means the occurrence of (i) an event of default under the Vanguard Portfolio Whole Loan, or (ii) the failure by the Borrowers, after the end of a calendar quarter, to maintain a debt service coverage ratio of at least 1.20x; or (iii) a Primary Tenant Sweep Period. A Cash Management Period will end, provided that (1) the Vanguard Portfolio Whole Loan and all other obligations under the Vanguard Portfolio Whole Loan documents have been repaid in full; (2) with respect to subclause (i) above, the event of default has been cured and such cure is accepted by the lender and no event that would trigger another Cash Management Period exists; (3) with respect to subclause (ii) above, for six consecutive months since the commencement of the existing Cash Management Period (A) no default or event of default has occurred, (B) no event that would trigger a Cash Management Period exists, and (C) the debt service coverage ratio is at least equal
THE INFORMATION IN THIS STRUCTURAL AND COLLATERAL TERM SHEET IS NOT COMPLETE AND MAY BE AMENDED PRIOR TO THE TIME OF SALE. THIS TERM SHEET IS NOT AN OFFER TO SELL THESE SECURITIES AND IT IS NOT A SOLICITATION OF AN OFFER TO BUY THESE SECURITIES IN ANY JURISDICTION WHERE THE OFFER OR SALE IS NOT PERMITTED.
52
| Structural and Collateral Term Sheet | BBCMS 2019-C3 | |
| No. 2 – Vanguard Portfolio | ||
to 1.25x, or (4) with respect to subclause (iii) above, a Primary Tenant Sweep Period Cure (as defined below) has occurred and no event that would trigger another Cash Management Period exists.
A “Primary Tenant Sweep Period” will commence upon (i) the earlier of (a) 18 months prior to the expiration or termination date of any Primary Tenant lease, whether such lease is in its initial term or any renewal term and (b) the date by which any Primary Tenant is required to exercise its renewal option under any Primary Tenant lease; (ii) any termination, cancellation or surrender of a Primary Tenant lease or any Borrower’s receipt of notice by a Primary Tenant of its intent to terminate, cancel or surrender its Primary Tenant lease; (iii) the date upon which any Primary Tenant “goes dark” in all or substantially all of the its premises; (iv) the date that any Primary Tenant commits a monetary or material nonmonetary default under the applicable Primary Tenant lease; or (v) the date upon which any Primary Tenant becomes a debtor in any bankruptcy action and end at such time, if ever, upon the occurrence of a Primary Tenant Sweep Period Cure.
A "Primary Tenant Sweep Period Cure” will commence, provided that (1) with respect to clauses (i) and (ii) above, a Primary Tenant Replacement Event (as defined below) has occurred; (2) with respect to clause (iii) above, either the Primary Tenant or an acceptable replacement tenant under a lease meeting the requirements under the Vanguard Portfolio Whole Loan documents re-opens for business for a continuous period of not less than three months; (3) with respect to clause (iv) above, either the default is cured and no other default or a Primary Tenant Replacement Event has occurred; (4) with respect to clause (v) above, either the bankruptcy action is dismissed or the Primary Tenant lease is affirmed, or a Primary Tenant Replacement Event has occurred.
A “Primary Tenant Replacement Event” means, (1) (i) Primary Tenant lease that is the subject of a Primary Tenant Sweep Period has been terminated and the Borrower has entered into one or more new leases for all of the Primary Tenant premises under the Primary Tenant lease that has been terminated with acceptable replacement tenant(s) and upon such terms and conditions as are reasonably acceptable to lender in all respects, or (ii) the renewal of the applicable Primary Tenant lease for the entire Primary Tenant premises in accordance with its terms and (2) sufficient funds have been accumulated and remain available on deposit in the Primary Tenant reserve subaccount to pay all Primary Tenant re-leasing costs.
Subordinate Debt.The Vanguard Portfolio Whole Loan includes a subordinate companion loan with an original principal balance of $12,982,500 that was sold to a third party investor. The subordinate companion loan is coterminous with the Vanguard Portfolio Mortgage Loan and accrues interest at a fixedper annum rate equal to 9.05000%. The UW NCF DSCR and UW NOI Debt Yield on the Vanguard Portfolio Whole Loan (including the B Note) are 1.68x and 9.0%, respectively. A co-lender agreement is in place with respect to the Vanguard Portfolio Whole Loan.
PartialRelease. The Borrowers have the option to release any Vanguard Portfolio Property upon a bona fide sale of such Vanguard Portfolio Property to a third party, provided, among other conditions, (i) the sale of such Vanguard Portfolio Property is pursuant to an arms' length agreement with a third party which is not an affiliate of any Borrowers or Master Lessees; (ii) the Borrowers (a) pay 125.0% of the allocated loan amount for such Vanguard Portfolio Property to be released, together with all accrued and unpaid interest on the principal being prepaid and any applicable yield maintenance premium or (b) cause a partial defeasance in accordance with the Vanguard Portfolio Whole Loan documents in the amount of 125.0% of the allocated loan amount for such Vanguard Portfolio Property to be released; (iii) no event of default has occurred and is continuing; (iv) the debt yield after giving effect to such release is not less than the greater of (a) the debt yield immediately prior to such release and (b) the debt yield at the origination of the Vanguard Portfolio Whole Loan; (v) the loan-to-value ratio after giving effect to such release is not more than the lesser of (a) the loan-to-value ratio immediately prior to such release and (b) the loan-to-value ratio at the origination of the Vanguard Portfolio Whole Loan; (vi) the debt service coverage ratio after giving effect to such release is not less than the greater of (a) the debt service coverage ratio immediately prior to such release and (b) the debt service coverage ratio at the origination of the Vanguard Portfolio Whole Loan; and (vii) the Borrowers have given the lender not less than 30 days’ prior written notice of such sale. No release will be permitted if such release would result in a "prohibited transaction" or the disqualification of the loan as a "qualified mortgage" for REMIC tax purposes. All prepayments in connection with the release of any Vanguard Portfolio Property or Vanguard Portfolio Properties will be applied pro rata among A Notes and the B Note.
Ground Lease.None.
THE INFORMATION IN THIS STRUCTURAL AND COLLATERAL TERM SHEET IS NOT COMPLETE AND MAY BE AMENDED PRIOR TO THE TIME OF SALE. THIS TERM SHEET IS NOT AN OFFER TO SELL THESE SECURITIES AND IT IS NOT A SOLICITATION OF AN OFFER TO BUY THESE SECURITIES IN ANY JURISDICTION WHERE THE OFFER OR SALE IS NOT PERMITTED.
53
| Structural and Collateral Term Sheet | BBCMS 2019-C3 | |
| No. 3 – GNL Industrial Portfolio | ||
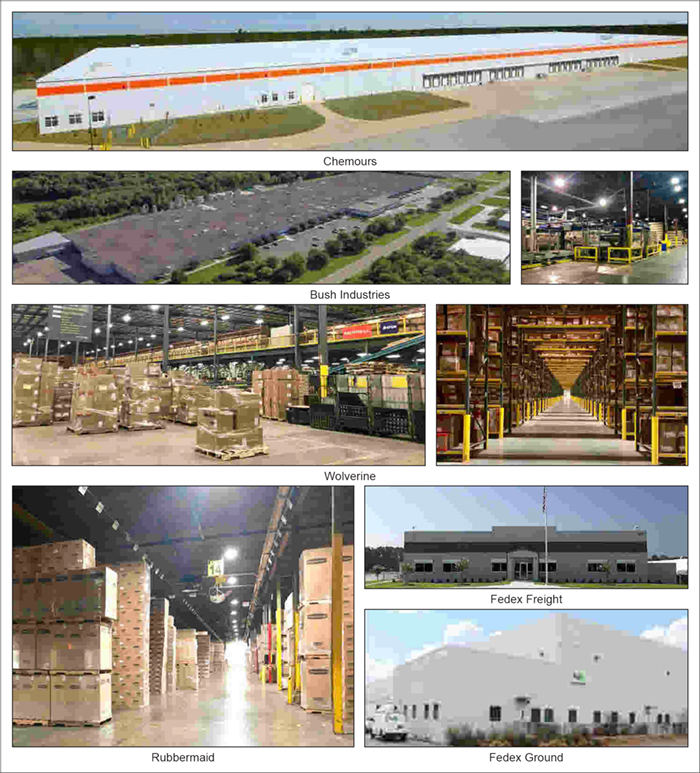
THE INFORMATION IN THIS STRUCTURAL AND COLLATERAL TERM SHEET IS NOT COMPLETE AND MAY BE AMENDED PRIOR TO THE TIME OF SALE. THIS TERM SHEET IS NOT AN OFFER TO SELL THESE SECURITIES AND IT IS NOT A SOLICITATION OF AN OFFER TO BUY THESE SECURITIES IN ANY JURISDICTION WHERE THE OFFER OR SALE IS NOT PERMITTED.
54
| Structural and Collateral Term Sheet | BBCMS 2019-C3 | |
| No. 3 – GNL Industrial Portfolio | ||
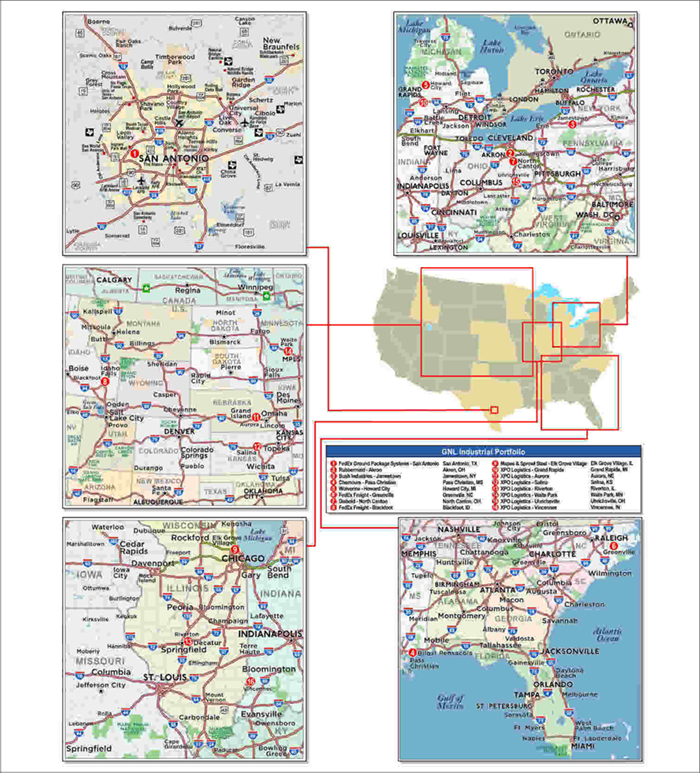
THE INFORMATION IN THIS STRUCTURAL AND COLLATERAL TERM SHEET IS NOT COMPLETE AND MAY BE AMENDED PRIOR TO THE TIME OF SALE. THIS TERM SHEET IS NOT AN OFFER TO SELL THESE SECURITIES AND IT IS NOT A SOLICITATION OF AN OFFER TO BUY THESE SECURITIES IN ANY JURISDICTION WHERE THE OFFER OR SALE IS NOT PERMITTED.
55
| Structural and Collateral Term Sheet | BBCMS 2019-C3 | |
| No. 3 – GNL Industrial Portfolio | ||
| Mortgage Loan Information | Property Information | |||
| Mortgage Loan Seller(1): | SGFC | Single Asset / Portfolio: | Portfolio | |
| Original Principal Balance(2): | $48,750,000 | Title: | Various | |
| Cut-off Date Principal Balance(2): | $48,750,000 | Property Type–Subtype: | Industrial – Various | |
| % of IPB: | 5.2% | Net Rentable Area (SF): | 2,443,208 | |
| Loan Purpose: | Recapitalization | Location: | Various | |
| Borrowers(3): | Various | Year Built / Renovated: | Various / Various | |
| Borrower Sponsor: | Global Net Lease Operating | Occupancy: | 100.0% | |
| Partnership, L.P. | Occupancy Date: | 4/12//2019 | ||
| Interest Rate: | 4.48900% | 4th Most Recent NOI (As of)(4): | $5,140,849 (12/31/2016) | |
| Note Date: | 4/12/2019 | 3rd Most Recent NOI (As of)(4): | $5,080,862 (12/31/2017) | |
| Maturity Date: | 5/6/2029 | 2nd Most Recent NOI (As of)(4)(5): | $7,699,119 (12/31/2018) | |
| Interest-only Period: | 120 months | Most Recent NOI (As of): | NAV | |
| Original Term: | 120 months | UW Economic Occupancy: | 95.0% | |
| Original Amortization Term: | None | UW Revenues: | $13,786,508 | |
| Amortization Type: | Interest Only | UW Expenses: | $4,190,341 | |
| Call Protection: | Grtr1%orYM(116),O(4) | UW NOI(5): | $9,596,167 | |
| Lockbox / Cash Management: | Hard / In Place | UW NCF: | $8,808,266 | |
| Additional Debt(2): | Yes | Appraised Value / Per SF: | $150,090,000 / $61 | |
| Additional Debt Balance(2): | $48,750,000 | Appraisal Date(6): | Various | |
| Additional Debt Type(2): | Pari Passu | |||
| Escrows and Reserves(7) | Financial Information(2) | ||||||
| Initial | Monthly | Initial Cap | Cut-off Date Loan / SF: | $40 | |||
| Taxes: | $0 | Springing | N/A | Maturity Date Loan / SF: | $40 | ||
| Insurance: | $0 | Springing | N/A | Cut-off Date LTV: | 65.0% | ||
| Replacement Reserves: | $0 | Springing | $2,443,208 | Maturity Date LTV: | 65.0% | ||
| TI/LC: | $0 | Springing | $6,108,020 | UW NCF DSCR: | 1.98x | ||
| Other: | $0 | Springing | N/A | UW NOI Debt Yield: | 9.8% | ||
| Sources and Uses | |||||||
| Sources | Proceeds | % of Total | Uses | Proceeds | % of Total | ||
| Whole Loan(2) | $97,500,000 | 100.0% | Corporate Debt Repayment | $90,197,578 | 92.5% | ||
| Return of Equity(8) | 4,961,235 | 5.1 | |||||
| Closing Costs | 2,341,187 | 2.4 | |||||
| Total Sources | $97,500,000 | 100.0% | Total Uses | $97,500,000 | 100.0% | ||
| (1) | The GNL Industrial Portfolio Whole Loan, as defined in “The Loan” below, was co-originated by Column Financial, Inc. (“Column”) and Societe Generale Financial Corporation (“SGFC”). |
| (2) | The GNL Industrial Portfolio mortgage loan is part of a whole loan evidenced by twopari passusenior notes with an aggregate original principal balance of $97.5 million. The financial information presented in the chart above reflects the Cut-off Date balance of the GNL Industrial Portfolio Whole Loan (as defined below). |
| (3) | The borrowers for the GNL Industrial Portfolio Whole Loan include ARC CWARANE001, LLC, ARC CWGRDMI001, LLC, ARC CWRVTIL001, LLC, ARC CWSALKS001, LLC, ARC CWUVLOH001, LLC, ARC CWVININ001, LLC, ARC CWWPKMN001, LLC, ARC DINCNOH001, LLC, ARC FESANTX001, LLC, ARC MSELGIL001, LLC, ARC WWHWCMI001, LLC, ARG BIJTNNY001, LLC, ARG CMPCRMS001, LLC, ARG FEBLCID001, LLC, ARG FEGRNNC001, LLC and ARG RMAKROH001, LLC. |
| (4) | The Chemours - Pass Christian property, FedEx Freight - Blackfoot property, Rubbermaid - Akron Property (as defined below), FedEx Freight - Greenville property and Bush Industries - Jamestown Property (as defined below) were acquired in 2018. As such, these properties were excluded from 3rd Most Recent NOI and 4th Most Recent NOI and partial year operating financials were provided for 2nd Most Recent NOI. |
| (5) | The increase in UW NOI from 2nd Most Recent NOI is primarily attributed to (i) the Chemours - Pass Christian property, FedEx Freight - Blackfoot property, Rubbermaid - Akron Property, FedEx Freight - Greenville property and Bush Industries - Jamestown Property being acquired in 2018, (ii) contractual rent steps through March 2020 in the amount of $64,016 and (iii) straight-line rent for investment grade tenants Rubbermaid Industrial (“Rubbermaid”) and FedEx Corporation in the amount of $60,450. |
| (6) | Appraisal Dates for the GNL Industrial Portfolio Properties (as defined below) range from January 16, 2019 to January 23, 2019. |
| (7) | For a full description of Escrows and Reserves, please refer to “Escrows and Reserves” below. |
| (8) | The borrower sponsor has a total cost basis of approximately $150.8 million and will have approximately $55.3 million of remaining cash equity following the recapitalization of the GNL Industrial Portfolio Properties. |
THE INFORMATION IN THIS STRUCTURAL AND COLLATERAL TERM SHEET IS NOT COMPLETE AND MAY BE AMENDED PRIOR TO THE TIME OF SALE. THIS TERM SHEET IS NOT AN OFFER TO SELL THESE SECURITIES AND IT IS NOT A SOLICITATION OF AN OFFER TO BUY THESE SECURITIES IN ANY JURISDICTION WHERE THE OFFER OR SALE IS NOT PERMITTED.
56
| Structural and Collateral Term Sheet | BBCMS 2019-C3 | |
| No. 3 – GNL Industrial Portfolio | ||
The Loan.The GNL Industrial Portfolio mortgage loan is part of a whole loan (the “GNL Industrial Portfolio Whole Loan”) evidenced by twopari passusenior promissory notes with an aggregate original principal balance of $97,500,000. The GNL Industrial Portfolio Whole Loan is secured by the fee (15 properties) and leasehold (one property) interests in 16 industrial properties located in 12 states (collectively, the “GNL Industrial Portfolio Properties”). The GNL Industrial Portfolio Whole Loan was co-originated by Column and SGFC. Note A-2 has an original principal balance of $48,750,000 and will be included in the BBCMS 2019-C3 Trust. The below table summarizes the remainingpari passupromissory note, which is currently held by Column and is expected to be contributed to one or more future securitization transactions or may otherwise be transferred at any time. The GNL Industrial Portfolio Whole Loan will be serviced pursuant to the pooling and servicing agreement for the BBCMS 2019-C3 Trust until the controllingpari passuPromissory Note A-1 is securitized, whereupon the GNL Industrial Portfolio Whole Loan will be serviced pursuant to the pooling and servicing agreement for such future securitization. See “Description of the Mortgage Pool—The Whole Loans—The Serviced Pari Passu Whole Loans”, “—The Non-Serviced Pari Passu Whole Loans” and “Pooling and Servicing Agreement” in the Preliminary Prospectus. The GNL Industrial Portfolio Whole Loan has a 10-year term and is interest only for the full term of the loan.
| Whole Loan Summary | |||
| Note | Original Balance | Note Holder | Controlling Piece |
| A-1 | $48,750,000 | Column | Yes |
| A-2 | 48,750,000 | BBCMS 2019-C3 | No |
| Total | $97,500,000 | ||
The Properties. The GNL Industrial Portfolio Properties are comprised of 16 single-tenant industrial buildings with an aggregate of 2,443,208 square feet. The borrower sponsor acquired the GNL Industrial Portfolio Properties in separate transactions between November 2013 and September 2018.
The GNL Industrial Portfolio Properties are geographically diverse with properties located in 12 different states and 14 different markets. The five largest states by allocated loan amount are Ohio (22.8%), Texas (17.6%), Michigan (13.2%), New York (12.9%) and Mississippi (11.6%), which account for approximately 22.9%, 16.6%, 14.7%, 12.1% and 11.9% of underwritten net cash flow, respectively. The remaining properties are located in North Carolina, Illinois, Idaho, Kansas, Nebraska, Minnesota and Indiana and do not individually account for more than 7.7% of the allocated loan amount or 7.3% of the underwritten net cash flow. Three tenants, or their parent entities, are investment grade representing 36.3% of NRA at the GNL Industrial Portfolio Properties and seven tenants are publicly traded representing 78.8% of NRA at the GNL Industrial Portfolio Properties.
THE INFORMATION IN THIS STRUCTURAL AND COLLATERAL TERM SHEET IS NOT COMPLETE AND MAY BE AMENDED PRIOR TO THE TIME OF SALE. THIS TERM SHEET IS NOT AN OFFER TO SELL THESE SECURITIES AND IT IS NOT A SOLICITATION OF AN OFFER TO BUY THESE SECURITIES IN ANY JURISDICTION WHERE THE OFFER OR SALE IS NOT PERMITTED.
57
| Structural and Collateral Term Sheet | BBCMS 2019-C3 | |
| No. 3 – GNL Industrial Portfolio | ||
| Portfolio Summary | |||||||
| Property Name, Location | Property Type – Subtype | Net Rentable Area (SF) | Year Built / Renovated | Allocated Whole Loan Amount (“ALA”) | % of ALA | Appraised Value | UW NCF |
FedEx Ground Package Systems - San Antonio San Antonio, TX | Industrial – Warehouse/Distribution | 168,576 | 2008, 2012 / N/A | $17,200,000 | 17.6% | $26,400,000 | $1,461,850 |
Rubbermaid - Akron Akron, OH | Industrial – Warehouse/Distribution | 668,592 | 1953, 1969, 2005 / 2018 | 16,000,000 | 16.4 | 21,900,000 | 1,276,531 |
Bush Industries - Jamestown Jamestown, NY | Industrial – Manufacturing | 456,094 | 1985, 1986, 1989 / 2007 | 12,600,000 | 12.9 | 18,300,000 | 1,062,035 |
Chemours - Pass Christian Pass Christian, MS | Industrial – Flex | 300,000 | 2018 / N/A | 11,300,000 | 11.6 | 18,700,000 | 1,047,948 |
Wolverine - Howard City Howard City, MI | Industrial – Warehouse/Distribution | 468,635 | 1998 / 2003 | 10,800,000 | 11.1 | 15,000,000 | 1,127,117 |
FedEx Freight - Greenville Greenville, NC | Industrial – Warehouse | 29,051 | 2018 / N/A | 7,500,000 | 7.7 | 11,100,000 | 643,507 |
Diebold - North Canton North Canton, OH | Industrial – Manufacturing | 158,330 | 2005 / N/A | 5,300,000 | 5.4 | 10,500,000 | 653,393 |
FedEx Freight - Blackfoot Blackfoot, ID | Industrial – Warehouse/Distribution | 21,574 | 2017 / N/A | 4,500,000 | 4.6 | 6,550,000 | 376,999 |
Mapes & Sprowl Steel - Elk Grove Village Elk Grove Village, IL | Industrial – Manufacturing | 60,798 | 1980 / N/A | 3,500,000 | 3.6 | 8,200,000 | 388,566 |
XPO Logistics - Grand Rapids Grand Rapids, MI | Industrial – Flex | 28,070 | 2003 / N/A | 2,100,000 | 2.2 | 3,200,000 | 167,330 |
XPO Logistics - Aurora Aurora, NE | Industrial – Flex | 15,700 | 2004 / 2013 | 1,600,000 | 1.6 | 2,470,000 | 143,110 |
XPO Logistics - Salina Salina, KS | Industrial – Flex | 15,029 | 2002 / N/A | 1,600,000 | 1.6 | 2,300,000 | 164,986 |
XPO Logistics - Riverton Riverton, IL | Industrial – Flex | 14,881 | 1989 / 2009 | 1,000,000 | 1.0 | 1,600,000 | 80,736 |
XPO Logistics - Waite Park Waite Park, MN | Industrial – Warehouse/Distribution | 14,160 | 2001 / N/A | 1,000,000 | 1.0 | 1,530,000 | 68,836 |
XPO Logistics - Uhrichsville Uhrichsville, OH | Industrial – Warehouse/Distribution | 15,068 | 1991 / 2001 | 900,000 | 0.9 | 1,400,000 | 83,386 |
XPO Logistics - Vincennes Vincennes, IN | Industrial – Warehouse/Distribution | 8,650 | 2001 / N/A | 600,000 | 0.6 | 940,000 | 61,938 |
| Total | 2,443,208 | $97,500,000 | 100.0% | $150,090,000 | $8,808,266 | ||
THE INFORMATION IN THIS STRUCTURAL AND COLLATERAL TERM SHEET IS NOT COMPLETE AND MAY BE AMENDED PRIOR TO THE TIME OF SALE. THIS TERM SHEET IS NOT AN OFFER TO SELL THESE SECURITIES AND IT IS NOT A SOLICITATION OF AN OFFER TO BUY THESE SECURITIES IN ANY JURISDICTION WHERE THE OFFER OR SALE IS NOT PERMITTED.
58
| Structural and Collateral Term Sheet | BBCMS 2019-C3 | |
| No. 3 – GNL Industrial Portfolio | ||
| GNL Industrial Portfolio 2018 Demographic Summary(1) | |||||||
| Property Name | City, State | 1-mile Population | 3-mile Population | 5-mile Population | 1-mile Median Household Income | 3-mile Median Household Income | 5-mile Median Household Income |
| FedEx Ground Package Systems - San Antonio | San Antonio, TX | 8,970 | 114,191 | 353,153 | $32,338 | $41,054 | $45,309 |
| Rubbermaid - Akron | Akron, OH | 6,300 | 54,458 | 129,056 | $47,133 | $50,155 | $42,781 |
| Bush Industries - Jamestown | Jamestown, NY | 800 | 19,955 | 40,381 | $47,869 | $33,898 | $39,735 |
| Chemours - Pass Christian | Pass Christian, MS | 9 | 6,074 | 15,976 | $50,000 | $67,314 | $63,817 |
| Wolverine - Howard City | Howard City, MI | 1,810 | 4,743 | 9,282 | $42,179 | $46,292 | $49,672 |
| FedEx Freight - Greenville(2) | Greenville, NC | 506 | 19,741 | 65,696 | $28,475 | $25,366 | $34,573 |
| Diebold - North Canton(2) | North Canton, OH | 260 | 23,889 | 83,328 | $69,086 | $71,542 | $71,255 |
| FedEx Freight - Blackfoot | Blackfoot, ID | 357 | 8,720 | 19,539 | $68,343 | $53,058 | $50,664 |
| Mapes & Sprowl Steel - Elk Grove Village | Elk Grove Village, IL | 2,222 | 60,309 | 204,722 | $78,160 | $63,682 | $68,618 |
| XPO Logistics - Grand Rapids | Grand Rapids, MI | 31 | 13,797 | 74,596 | $85,566 | $69,302 | $63,346 |
| XPO Logistics - Aurora | Aurora, NE | 20 | 2,810 | 5,046 | $50,000 | $56,879 | $57,438 |
| XPO Logistics - Salina | Salina, KS | 863 | 18,293 | 44,907 | $44,421 | $47,403 | $45,452 |
| XPO Logistics - Riverton | Riverton, IL | 269 | 7,183 | 14,723 | $52,289 | $60,513 | $58,155 |
| XPO Logistics - Waite Park | Waite Park, MN | 105 | 24,266 | 68,358 | $43,722 | $51,831 | $52,645 |
| XPO Logistics - Uhrichsville(2) | Uhrichsville, OH | 605 | 12,287 | 18,450 | $43,958 | $41,492 | $44,089 |
| XPO Logistics - Vincennes | Vincennes, IN | 445 | 6,914 | 21,162 | $53,843 | $41,887 | $39,974 |
| (1) | Source: third party market research reports. |
| (2) | Demographic Information is as of 2017. |
The Markets.
FedEx Ground Package System, Inc. (168,576 square feet, 6.9% of NRA, 17.6% of ALA). The FedEx Ground Package System - San Antonio property consists of one single-story industrial building constructed in 2008 and expanded in 2012 (the “FedEx Ground Package System - San Antonio Property”). The building was built-to-suit and is used by FedEx Ground for package sorting and delivery. The facility has 42 dock-height loading doors, 16 drive-in doors and 30-foot clear-heights with approximately 7% of the property NRA utilized as office space. FedEx Ground Package System, Inc. occupies 6.9% of NRA through August 2022, with two, five-year renewal options and pays annual rent of $11.48 per square foot and $12.05 per square foot, respectively.
Located on approximately 22.8 acres, the FedEx Ground Package Systems - San Antonio Property is located in the northwestern portion of San Antonio, Texas. The immediately surrounding area predominantly consists of industrial, office and residential uses. Primary access to the area is provided by Loop 410, a two-way, eight-lane major arterial that provides access to all of the San Antonio MSA. Access to the FedEx Ground Package Systems - San Antonio Property from Loop 410 is provided by Culebra Road, a two-way, four-lane primary roadway that runs in an east/west direction. According to a third-party market research report, the FedEx Ground Package Systems - San Antonio Property is located in the San Antonio Industrial market and Northwest submarket. The submarket contains approximately 15.9 million square feet of industrial inventory, has an overall vacancy of 5.7% and an average annual rental rate of $9.62 per square foot.
FedEx Ground Package System (“FedEx Ground”) is a subsidiary of FedEx Corporation (NYSE: FDX, M/S&P/F: Baa2/BBB/NR), which provides transportation, e-commerce and business services worldwide. The parent was founded in 1971, is headquartered in Memphis, Tennessee, and employed more than 425,000 in 2018. The tenant is a leading North American provider of small package ground delivery services. FedEx Ground provides low-cost, day-certain service to any business address in the U.S. and Canada, as well as residential delivery to 100% of U.S. residences through its FedEx Home Delivery service. FedEx SmartPost is a FedEx Ground service that specializes in the consolidation and delivery of high volumes of low-weight, less time-sensitive business-to-consumer packages primarily using the U.S. Postal Service for final delivery to residences. As of May 31, 2018, FedEx Ground employed approximately 26,000 permanent full-time employees and approximately 71,000 permanent part time employees.
Rubbermaid Incorporated (668,592 square feet, 27.4% of NRA, 16.4% of ALA). The Rubbermaid - Akron Property is a one-story single-tenant industrial building constructed between 1953 and 1969, expanded in 2005 and renovated in 2018 (the
THE INFORMATION IN THIS STRUCTURAL AND COLLATERAL TERM SHEET IS NOT COMPLETE AND MAY BE AMENDED PRIOR TO THE TIME OF SALE. THIS TERM SHEET IS NOT AN OFFER TO SELL THESE SECURITIES AND IT IS NOT A SOLICITATION OF AN OFFER TO BUY THESE SECURITIES IN ANY JURISDICTION WHERE THE OFFER OR SALE IS NOT PERMITTED.
59
| Structural and Collateral Term Sheet | BBCMS 2019-C3 | |
| No. 3 – GNL Industrial Portfolio | ||
“Rubbermaid - Akron Property”). The Rubbermaid - Akron Property functions as a distribution facility for Newell Brands’ products, in addition to serving as a storage and distribution center for the Rubbermaid manufacturing facility located just across Gilchrist Road. The facility has 50 dock-height loading doors, 24-foot clear-heights with approximately 1% of the property NRA utilized as office space. Rubbermaid occupies 27.4% of NRA through January 2029, with two, five-year renewal options with annual rent escalations.
Located on two non-contiguous parcels totaling 26.5 acres, the Rubbermaid - Akron Property is located in Akron, Ohio east of the central business district within the Cleveland metropolitan statistical area. Primary highway access to Rubbermaid - Akron Property is provided by Interstate 76, a major arterial, that runs east/west through Akron with access approximately one-mile northwest from the Rubbermaid - Akron Property. According to a third-party market research report, the Rubbermaid - Akron Property is located in the Cleveland market and Akron Industrial submarket. The submarket contains approximately 98.5 million square feet of industrial inventory, has an overall vacancy of 2.8% and an average annual rental rate of $4.83 per square foot.
Rubbermaid is a subsidiary company of Newell Brands Inc. (NYSE: NWL, M/S&P/F: Baa3/BBB-/BB+). Newell Brands Inc. designs, manufactures, sources and distributes consumer and commercial products worldwide. Newell Brands Inc. sells its products in approximately 200 countries around the world and has operations in approximately 100 countries as of December 31, 2018. Rubbermaid designs and markets a full range of home organization, storage and cleaning products.
Bush Industries, Inc. (456,094 square feet, 18.7% of NRA, 12.9% of ALA). The Bush Industries - Jamestown Property consists of one, two-story industrial building constructed in 1985, 1986 and 1989 and expanded in 2007 (the “Bush Industries - Jamestown Property”). The building was built-to-suit and serves as the global headquarters of Bush Industries. The facility has 21 dock-height doors, 13 drive-in doors, 28-foot clear-heights and rail access with approximately 6% of the property NRA utilized as office space. Bush Industries, Inc. occupies 18.7% of NRA through September 2038, with four, five-year renewal options with annual rent escalations.
Located on approximately 78.6 acres, the Bush Industries - Jamestown Property is located in Jamestown, New York approximately 2.5 miles northeast of the Jamestown central business district. The immediately surrounding area land uses include a mix of industrial uses and vacant land. Primary access to the area is provided by Interstate 86, a major arterial that crosses the southern tier of New York state in an east/west direction, with the nearest onramp to I-86 located 1.6 miles north of the Bush Industries - Jamestown Property. According to a third-party market research report, the Bush Industries - Jamestown Property is located in the Jamestown Industrial market and 10-Mile Radius submarket. The submarket contains approximately 5.7 million square feet of industrial inventory, has an overall vacancy of 7.5% and an average annual rental rate of $3.15 per square foot.
Bush Industries, Inc. is a designer and manufacturer of ready-to-assemble furniture for the home office and home entertainment living spaces. Bush Industries, Inc. distributes products nationally through furniture retailers, department stores, mass merchandisers, wholesale clubs, catalog showrooms, office furniture dealers, electronics stores and e-commerce. Bush Industries, Inc. was founded in 1959 and is headquartered in Jamestown, New York, with manufacturing facilities in Jamestown and China.
Environmental. According to Phase I environmental assessments dated January 2019, there was no evidence of any recognized environmental conditions at the GNL Industrial Portfolio Properties with the exception of the following: (1) an asbestos-containing material operations and maintenance program (“ACM O&M Program”) was recommended at the Rubbermaid - Akron Property; (2) fueling activities associated with the diesel aboveground storage tank was recommended to be performed on a impervious surface in order to prevent accidental spillage to the ground surface at the Chemours - Pass Christian property; (3) water quality testing at the FedEx - Blackfoot property was recommended; (4) testing the water per EPA recommendations to include coliform and lead as best management practices at the XPO Logistics - Riverton property was recommended; and (5) placing the 55-gallon motor oil drum in a secondary containment pallet as best management practices at the XPO Logistics - Vincennes property was recommended. See “Description of the Mortgage Pool—Mortgage Pool Characteristics—Environmental Considerations”.
THE INFORMATION IN THIS STRUCTURAL AND COLLATERAL TERM SHEET IS NOT COMPLETE AND MAY BE AMENDED PRIOR TO THE TIME OF SALE. THIS TERM SHEET IS NOT AN OFFER TO SELL THESE SECURITIES AND IT IS NOT A SOLICITATION OF AN OFFER TO BUY THESE SECURITIES IN ANY JURISDICTION WHERE THE OFFER OR SALE IS NOT PERMITTED.
60
| Structural and Collateral Term Sheet | BBCMS 2019-C3 | |
| No. 3 – GNL Industrial Portfolio | ||
| Historical and Current Occupancy(1)(2) | |||
| 2016 | 2017 | 2018 | Current(3) |
| 100.0% | 100.0% | 100.0% | 100.0% |
| (1) | Historical Occupancies are as of December 31 of each respective year. |
| (2) | The Chemours - Pass Christian property, FedEx Freight - Blackfoot property, Rubbermaid - Akron Property, FedEx Freight - Greenville property and Bush Industries - Jamestown Property were acquired in 2018. As such, these tenants are excluded from occupancy figures for the years prior to the respective acquisition dates. |
| (3) | Current Occupancy is as of April 12, 2019. |
| Top Seven Tenant Summary(1) | |||||||
| Tenant | Ratings(2) Moody’s/S&P/Fitch | Net Rentable Area (SF) | % of Total NRA | Base Rent PSF | Base Rent | % of Total Base Rent | Lease Expiration Date |
| Rubbermaid Incorporated | Baa3 / BBB- / BB+ | 668,592 | 27.4% | $2.38 | $1,589,846 | 14.7% | 1/31/2029 |
| Wolverine World Wide, Inc. | Ba1 / BB+ / NA | 468,635 | 19.2 | $2.89 | 1,355,458 | 12.5 | 1/31/2023 |
| Bush Industries, Inc. | NA / NA / NA | 456,094 | 18.7 | $3.14 | 1,430,665 | 13.2 | 9/27/2038 |
| The Chemours Company | Ba2 / BB / NA | 300,000 | 12.3 | $4.21 | 1,263,000 | 11.7 | 1/31/2028 |
| FedEx Ground Package System, Inc. | Baa2 / BBB / NA | 168,576 | 6.9 | $10.43 | 1,758,552 | 16.2 | 8/31/2022 |
| Diebold Nixdorf Incorporated | Caa2 / B- / NA | 158,330 | 6.5 | $5.41 | 856,565 | 7.9 | 6/30/2025 |
| Mapes & Sprowl Steel, Ltd. | NA / NA / NA | 60,798 | 2.5 | $7.57 | 460,241 | 4.2 | 1/9/2030 |
| Top Seven Tenants | 2,281,025 | 93.4% | $3.82 | $8,714,328 | 80.5% | ||
| Occupied Collateral Total | 2,443,208 | 100.0% | $4.43 | $10,829,625 | 100.0% | ||
| Vacant Space | 0 | 0.0% | |||||
| Collateral Total | 2,443,208 | 100.0% | |||||
| (1) | Based on the underwritten rent roll. |
| (2) | Ratings provided are for the parent company of the entity listed in the “Tenant” field whether or not the parent company guarantees the lease. |
THE INFORMATION IN THIS STRUCTURAL AND COLLATERAL TERM SHEET IS NOT COMPLETE AND MAY BE AMENDED PRIOR TO THE TIME OF SALE. THIS TERM SHEET IS NOT AN OFFER TO SELL THESE SECURITIES AND IT IS NOT A SOLICITATION OF AN OFFER TO BUY THESE SECURITIES IN ANY JURISDICTION WHERE THE OFFER OR SALE IS NOT PERMITTED.
61
| Structural and Collateral Term Sheet | BBCMS 2019-C3 | |
| No. 3 – GNL Industrial Portfolio | ||
| Lease Rollover Schedule(1) | |||||||||
| Year | Number of Leases Expiring | Net Rentable Area Expiring | % of NRA Expiring | Base Rent Expiring | % of Base Rent Expiring | Cumulative Net Rentable Area Expiring | Cumulative % of NRA Expiring | Cumulative Base Rent Expiring | Cumulative % of Base Rent Expiring |
| Vacant | NAP | 0 | 0.0% | NAP | NAP | 0 | 0.0% | NAP | NAP |
| 2019 | 0 | 0 | 0.0 | $0 | 0.0% | 0 | 0.0% | $0 | 0.0% |
| 2020 | 0 | 0 | 0.0 | 0 | 0.0 | 0 | 0.0% | $0 | 0.0% |
| 2021 | 0 | 0 | 0.0 | 0 | 0.0 | 0 | 0.0% | $0 | 0.0% |
| 2022 | 1 | 168,576 | 6.9 | 1,758,552 | 16.2 | 168,576 | 6.9% | $1,758,552 | 16.2% |
| 2023 | 8 | 580,193 | 23.7 | 2,293,774 | 21.2 | 748,769 | 30.6% | $4,052,326 | 37.4% |
| 2024 | 0 | 0 | 0.0 | 0 | 0.0 | 748,769 | 30.6% | $4,052,326 | 37.4% |
| 2025 | 1 | 158,330 | 6.5 | 856,565 | 7.9 | 907,099 | 37.1% | $4908,891 | 45.3% |
| 2026 | 0 | 0 | 0.0 | 0 | 0.0 | 907,099 | 37.1% | $4,908,891 | 45.3% |
| 2027 | 0 | 0 | 0.0 | 0 | 0.0 | 907,099 | 37.1% | $4,908,891 | 45.3% |
| 2028 | 1 | 300,000 | 12.3 | 1,263,000 | 11.7 | 1,207,099 | 49.4% | $6,171,891 | 57.0% |
| 2029 | 1 | 668,592 | 27.4 | 1,589,846 | 14.7 | 1,875,691 | 76.8% | $7,761,738 | 71.7% |
| 2030 & Beyond | 4 | 567,517 | 23.2 | 3,067,888 | 28.3 | 2,443,208 | 100.0% | $10,829,625 | 100.0% |
| Total | 16 | 2,443,208 | 100.0% | $10,829,625 | 100.0% | ||||
| (1) | Based on the underwritten rent roll. |
| Operating History and Underwritten Net Cash Flow(1) | ||||||
| 2016 | 2017 | 2018 | Underwritten | Per Square Foot | %(2) | |
| Rents in Place(3) | $5,285,718 | $5,308,224 | $7,954,718 | $10,769,175 | $4.41 | 74.2% |
| Straight-Line Rent(4) | 0 | 0 | 0 | 60,450 | 0.02 | 0.4 |
| Gross Potential Rent | $5,285,718 | $5,308,224 | $7,954,718 | $10,829,625 | $4.43 | 74.6% |
| Total Reimbursements | 232,678 | 874,667 | 425,809 | 3,682,488 | 1.51 | 25.4 |
| Net Rental Income | $5,518,396 | $6,182,891 | $8,380,527 | $14,512,113 | $5.94 | 100.0% |
| (Vacancy/Credit Loss) | 0 | 0 | 0 | (725,606) | (0.30) | (5.0) |
| Other Income | 0 | 0 | 0 | 0 | 0.00 | 0.0 |
| Effective Gross Income | $5,518,396 | $6,182,891 | $8,380,527 | $13,786,508 | $5.64 | 95.0% |
| Total Expenses | $377,547 | $1,102,029 | $681,408 | $4,190,341 | $1.72 | 30.4% |
| Net Operating Income(5) | $5,140,849 | $5,080,862 | $7,699,119 | $9,596,167 | $3.93 | 69.6% |
| Total TI/LC, Capex/RR | 0 | 0 | 0 | 787,901 | 0.32 | 5.7 |
| Net Cash Flow | $5,140,849 | $5,080,862 | $7,699,119 | $8,808,266 | $3.61 | 63.9% |
| (1) | The Chemours - Pass Christian property, FedEx Freight - Blackfoot property, Rubbermaid - Akron Property, FedEx Freight - Greenville property, and Bush Industries - Jamestown Property were acquired in 2018. As such, these properties were excluded from 2017 and 2016 historical cash flows and partial year operating financials were provided for 2018 cash flows. |
| (2) | Percentage column represents percent of Gross Potential Income for all revenue lines and represents percent of Effective Gross Income for the remainder of fields. |
| (3) | Underwritten Rents in Place are based on the underwritten rent roll dated March 31, 2019 and include contractual rent steps through March 2020 in the amount of $64,016. |
| (4) | Underwritten Straight-Line Rent represents $60,450 in average contractual rent increases for investment grade tenants Rubbermaid and FedEx Corporation. |
| (5) | The increase in Net Operating Income between 2018 and Underwritten is primarily attributed to (i) the Chemours - Pass Christian property, FedEx Freight - Blackfoot property, Rubbermaid - Akron Property, FedEx Freight - Greenville property, and Bush Industries - Jamestown Property being acquired in 2018, (ii) contractual rent steps through March 2020 in the amount of $64,016 and (iii) straight-line rent for investment grade tenants Rubbermaid and FedEx Corporation in the amount of $60,450. |
THE INFORMATION IN THIS STRUCTURAL AND COLLATERAL TERM SHEET IS NOT COMPLETE AND MAY BE AMENDED PRIOR TO THE TIME OF SALE. THIS TERM SHEET IS NOT AN OFFER TO SELL THESE SECURITIES AND IT IS NOT A SOLICITATION OF AN OFFER TO BUY THESE SECURITIES IN ANY JURISDICTION WHERE THE OFFER OR SALE IS NOT PERMITTED.
62
| Structural and Collateral Term Sheet | BBCMS 2019-C3 | |
| No. 3 – GNL Industrial Portfolio | ||
The Borrowers. The borrowing entities for the GNL Industrial Portfolio Whole Loan are ARC CWARANE001, LLC, ARC CWGRDMI001, LLC, ARC CWRVTIL001, LLC, ARC CWSALKS001, LLC, ARC CWUVLOH001, LLC, ARC CWVININ001, LLC, ARC CWWPKMN001, LLC, ARC DINCNOH001, LLC, ARC FESANTX001, LLC, ARC MSELGIL001, LLC, ARC WWHWCMI001, LLC, ARG BIJTNNY001, LLC, ARG CMPCRMS001, LLC, ARG FEBLCID001, LLC, ARG FEGRNNC001, LLC and ARG RMAKROH001, LLC, each a Delaware limited liability company and special purpose entity with two independent directors. Legal counsel to the borrowers delivered a non-consolidation opinion in connection with the origination of the GNL Industrial Portfolio Whole Loan.
The Loan Sponsor.The loan sponsor and nonrecourse carve-out guarantor is Global Net Lease Operating Partnership, L.P., a Delaware limited partnership and the business operations entity of Global Net Lease, Inc. (NYSE: GNL) (“GNL”). Founded in 2011, GNL is a publicly traded real estate investment trust focused on acquiring a diversified global portfolio of commercial properties, with an emphasis on sale-leaseback transactions involving single tenant, mission critical, income producing net-lease assets across the United States and western and northern Europe. As of December 31, 2018, GNL owned a portfolio of 342 properties totaling approximately 27.5 million square feet, which were 99.2% leased, with a weighted-average remaining lease term of 8.3 years. GNL is an affiliate of AR Global Investments, LLC, which has raised and invested over $30.0 billion in capital, served over 150,000 shareholders and grown to one of the largest external managers of direct investment programs in the United States. See “Description of the Mortgage Pool—Litigation and Other Considerations” in the Preliminary Prospectus.
Property Management. The GNL Industrial Portfolio Properties are managed by Global Net Lease Properties, LLC, an affiliate of the borrowers.
Escrows and Reserves. No escrow deposits were required at origination.
Tax Escrows – There is no requirement for the borrowers to make deposits to the tax escrow so long as no Cash Sweep Period (as defined below) has occurred and is continuing. Following the occurrence and during the continuance of a Cash Sweep Period, the borrowers are required to make monthly deposits equal to an amount sufficient to pay all taxes and other charges at least 30 days prior to the due date.
Insurance Escrows – There is no requirement for the borrowers to make deposits to the insurance escrow so long as the property is insured under a blanket insurance policy in accordance with the GNL Industrial Portfolio Whole Loan documents and no event of default exists; otherwise, following the occurrence and during the continuance of a Cash Sweep Period, the borrowers are required to make monthly deposits equal to an amount sufficient to renew the insurance coverage at least 30 days prior to the expiration of the insurance policies.
Replacement Reserves – There is no requirement for the borrowers to make monthly deposits into the replacement reserve account so long as no Cash Sweep Period has occurred and is continuing. Following the occurrence and during the continuance of a Cash Sweep Period, the borrowers are required to make monthly deposits equal to $0.20 multiplied by the then existing aggregate rentable square feet comprising all of the GNL Industrial Portfolio Properties, divided by 12, for replacement reserves, up to a cap of $1.00 multiplied by the then existing aggregate rentable square feet comprising all of the GNL Industrial Portfolio Properties.
TI/LC Reserves – There is no requirement for the borrowers to make monthly deposits to the TI/LC reserve account so long as no Cash Sweep Period has occurred and is continuing. Following the occurrence and during the continuance of a Cash Sweep Period, the borrowers are required to make monthly deposits equal to $0.50 multiplied by the then existing aggregate rentable square feet comprising all of the GNL Industrial Portfolio Properties, divided by 12, for TI/LC reserves, up to a cap of $2.50 multiplied by the then existing aggregate rentable square feet comprising all of the GNL Industrial Portfolio Properties. During the continuance of a Lease Sweep Period (as defined below), provided no Cash Sweep Period or event of default is continuing, on each payment date during the continuance of such Lease Sweep Period, (1) first an amount equal to all cash flow attributable to any lease which caused the Lease Sweep Period or would have caused a Lease Sweep Period to commence if a Lease Sweep Period did not already exist, up to a cap amount for each individual property as detailed in the GNL Industrial Portfolio Whole Loan documents (an aggregate amount of $10,720,000 for all GNL Industrial Portfolio Properties), will be deposited into the TI/LC reserve account for the affected property and (2) second, to the borrowers. In addition, the borrowers will deposit into the TI/LC reserve account all funds received by the borrowers in connection with any cancellation, termination or surrender of any lease or any default under any lease, including, but not
THE INFORMATION IN THIS STRUCTURAL AND COLLATERAL TERM SHEET IS NOT COMPLETE AND MAY BE AMENDED PRIOR TO THE TIME OF SALE. THIS TERM SHEET IS NOT AN OFFER TO SELL THESE SECURITIES AND IT IS NOT A SOLICITATION OF AN OFFER TO BUY THESE SECURITIES IN ANY JURISDICTION WHERE THE OFFER OR SALE IS NOT PERMITTED.
63
| Structural and Collateral Term Sheet | BBCMS 2019-C3 | |
| No. 3 – GNL Industrial Portfolio | ||
limited to, any surrender or cancellation fees, buy-out fees, default fees or reimbursements for tenant improvements and leasing commissions.
Ground Sublease Reserves – During the continuance of a Cash Sweep Period, the borrowers will be required to deposit the amount of rents (including both base and additional rents) and other charges due under the ground sublease that will be payable by the Diebold Nixdorf - North Canton property borrower as sub-lessee under the ground sublease (the “Ground Rent”) to accumulate sufficient funds to pay all Ground Rent at least 30 days prior to the respective due date.
Lockbox / Cash Management.The GNL Industrial Portfolio Whole Loan is structured with a hard lockbox and in place cash management. The borrowers were required to send direction letters to all tenants instructing them to deposit all rents directly into a clearing account controlled by the lender. Notwithstanding the foregoing, the borrowers and property manager are required to deposit all revenues otherwise received into the clearing account within two business days of receipt. In the event that a Cash Sweep Period (as defined below) exists and no Lease Sweep Period (as defined below) exists, excess cash flow will be deposited into the excess cash flow account. If a Cash Sweep Period does not exist, but a Lease Sweep Period is continuing, (i) first an amount equal to all cash flow attributable to the lease up to the amount defined within the GNL Industrial Portfolio Whole Loan documents that caused the Lease Sweep Period will be deposited into the TI/LC reserve account and (ii) second any excess will be disbursed to the borrowers. Provided no Cash Sweep Period or Lease Sweep Period exists, excess cash will be disbursed to the borrowers.
A “Cash Sweep Period” means the occurrence of (i) an event of default and will continue until such event of default is cured, (ii) any bankruptcy action of any affiliate property manager and will continue until the dismissal or discharge of the same or the borrowers replace the property manager with a qualified property manager under a replacement management agreement, (iii) any bankruptcy action of any property manager that is not an affiliated property manager, only with the respect to the filing of any involuntary petition against such property manager not being dismissed or discharged for 60 days after the filing of such involuntary petition, (iv) a Debt Yield Trigger Event (as defined below), which will continue until (1) an achievement of a debt yield equal to or greater than 9.0% for one fiscal quarter, (2) the delivery of a letter of credit in an amount that if applied to the GNL Industrial Portfolio Whole Loan would result in the debt yield of at least 9.0%, or (3) the borrowers prepay a portion of the GNL Industrial Portfolio Whole Loan in connection with release(s) of individual properties the effect of which is that had the reduced aggregate principal balance of the GNL Industrial Portfolio Whole Loan been in effect, the debt yield based solely on the remaining GNL Industrial Portfolio Properties would have been in excess of 9.0%, or (v) a Portfolio Tenant Event (as defined below).
A “Lease Sweep Period” means the occurrence of (i) two or more tenants “going dark” in or ceasing to occupy their respective demised premises and will continue until one or more of such tenants are no longer “dark” and in occupancy, or a replacement tenant has occupied the applicable demised premises, (ii) any tenant gives written notice of its election to either terminate or not renew its lease or any tenant failing to renew its lease during its renewal notice period and will continue until such tenant renews its respective lease or a replacement tenant has executed a new lease, (iii) any bankruptcy action of any tenant and will continue until such bankruptcy action is dismissed or discharged or a replacement tenant has executed a new lease, and (iv) any monetary default or any material non-monetary default exists under any lease until such default has been cured. Notwithstanding the foregoing, in the event any tenant “goes dark”, such event will not be counted as a lease sweep event so long as (i) such tenant or the guarantor of such tenant’s lease is rated “BBB+” (or the equivalent) or higher by any rating agency, (ii) such tenant has not given written notice of its election to vacate, terminate or not renew its lease, and (iii) such tenant has not failed to renew its lease prior to the expiration of its renewal notice period.
A “Debt Yield Trigger Event” means a debt yield of less than 9.0% as of the last day of any fiscal quarter.
A “Portfolio Tenant Event” means that tenants have “gone dark” or ceased to operate in more than 40% of the gross leasable area of the GNL Industrial Portfolio Properties.
The borrowers may delivery a letter of credit (i) in lieu of making all or any cash deposits to any of the reserve accounts, (ii) to replace cash deposits previously made to the reserve accounts, (iii) every three months in lieu of making the deposits of excess cash flow to the excess cash flow reserve, the borrowers may deliver a letter of credit in an amount equal to three months of funds that borrowers reasonably anticipate would otherwise be deposited into the excess cash flow reserve during the impending three-month period, and (iv) as a substitute for cash on deposit in the excess cash flow reserve.
Subordinate and Mezzanine Debt. None.
THE INFORMATION IN THIS STRUCTURAL AND COLLATERAL TERM SHEET IS NOT COMPLETE AND MAY BE AMENDED PRIOR TO THE TIME OF SALE. THIS TERM SHEET IS NOT AN OFFER TO SELL THESE SECURITIES AND IT IS NOT A SOLICITATION OF AN OFFER TO BUY THESE SECURITIES IN ANY JURISDICTION WHERE THE OFFER OR SALE IS NOT PERMITTED.
64
| Structural and Collateral Term Sheet | BBCMS 2019-C3 | |
| No. 3 – GNL Industrial Portfolio | ||
Partial Release. The borrowers may obtain the release of any of the GNL Industrial Portfolio Properties included in the GNL Industrial Portfolio Whole Loan,provided that, among other things, (i) no event of default has occurred and is continuing (other than an event of default which applies only to the property to be released), (ii) the borrowers prepay a portion of the GNL Industrial Portfolio Whole Loan (together with the payment of the applicable yield maintenance premium if such payment occurs prior to February 6, 2029) equal to (a) 110% (120% if released to a borrower affiliate) of the allocated loan amount of the property being released until such time the outstanding principal balance of the GNL Industrial Portfolio Whole Loan is reduced to $87,750,000 and (b) after the outstanding principal balance of the GNL Industrial Portfolio Whole Loan is reduced below $87,750,000, 115% (125% if released to a borrower affiliate) of the allocated loan amount of the property being released (notwithstanding the foregoing, in the event the property being released is vacant, the release amount for such property will be 100% of the allocated loan amount of such property), (iii) the debt yield for the remaining properties based on the trailing 12 months is no less than the greater of (1) the debt yield immediately preceding such release and (2) 10.45% and (iv) the satisfaction of customary REMIC requirements following such release.
Substitutions.If a Lease Sweep Period or default has occurred (but not beyond any applicable notice or grace periods), the borrowers may replace one or more of the GNL Industrial Portfolio Properties (individually or collectively, the “Replaced Property” or “Replaced Properties”) by providing one or more substitute properties (individually or collectively, the “Property Substitution”) solely to the extent necessary to cure such Lease Sweep Period or default,provided that, among other things, (i) no event of default is continuing (beyond any applicable noticed or cure periods) or would result from the substitution of one or more of the GNL Industrial Portfolio Properties, (ii) if the Property Substitution occurs after a securitization, the borrowers will obtained a rating agency confirmation, (iii) the borrowers will deliver current appraisals of the substitute property and Replaced Property, (iv) after giving effect to the substitution, the debt yield based on the trailing 12 months for the GNL Industrial Portfolio Properties will be equal to or greater than (1) 10.45% and (2) the debt yield for the GNL Industrial Portfolio Properties immediately prior to such release, (v) the aggregate Allocated Loan Amounts of all Replaced Properties during the term of the GNL Industrial Portfolio Whole Loan may not exceed $39,000,000 and (vi) the lender will, in its sole discretion, have approved the Property Substitution. See “Description of the Mortgage Pool—Certain Terms of the Mortgage Loans—Releases; Partial Releases” in the Preliminary Prospectus.
Ground Lease. The Diebold - North Canton property is subject to a ground sublease with CAK Land Holdings, LLC. The sublease commenced on July 1, 2004 and expires December 31, 2035. The ground sublease provides for two, 20-year extension options and one 19-year extension option with a fully extended ground lease expiration date of December 31, 2094. The ground sublease payments are structured at a current annual rent of $4,806, which increases to $13,960 on July 1, 2024, and to $14,922 on January 1, 2026 continuing through the ground sublease expiration date. The ground lease is between Akron-Canton Regional Airport Authority and CAK Land Holdings, LLC dated June 15, 1995 with a 40-year lease term expiring December 31, 2035. The ground lease provides for the same extension options as the ground sublease.
THE INFORMATION IN THIS STRUCTURAL AND COLLATERAL TERM SHEET IS NOT COMPLETE AND MAY BE AMENDED PRIOR TO THE TIME OF SALE. THIS TERM SHEET IS NOT AN OFFER TO SELL THESE SECURITIES AND IT IS NOT A SOLICITATION OF AN OFFER TO BUY THESE SECURITIES IN ANY JURISDICTION WHERE THE OFFER OR SALE IS NOT PERMITTED.
65
| Structural and Collateral Term Sheet | BBCMS 2019-C3 | |
| No. 4 – SWVP Portfolio | ||

THE INFORMATION IN THIS STRUCTURAL AND COLLATERAL TERM SHEET IS NOT COMPLETE AND MAY BE AMENDED PRIOR TO THE TIME OF SALE. THIS TERM SHEET IS NOT AN OFFER TO SELL THESE SECURITIES AND IT IS NOT A SOLICITATION OF AN OFFER TO BUY THESE SECURITIES IN ANY JURISDICTION WHERE THE OFFER OR SALE IS NOT PERMITTED.
66
| Structural and Collateral Term Sheet | BBCMS 2019-C3 | |
| No. 4 – SWVP Portfolio | ||

THE INFORMATION IN THIS STRUCTURAL AND COLLATERAL TERM SHEET IS NOT COMPLETE AND MAY BE AMENDED PRIOR TO THE TIME OF SALE. THIS TERM SHEET IS NOT AN OFFER TO SELL THESE SECURITIES AND IT IS NOT A SOLICITATION OF AN OFFER TO BUY THESE SECURITIES IN ANY JURISDICTION WHERE THE OFFER OR SALE IS NOT PERMITTED.
67
| Structural and Collateral Term Sheet | BBCMS 2019-C3 | |
| No. 4 – SWVP Portfolio | ||
| Mortgage Loan Information | Property Information | |||
| Mortgage Loan Seller(1): | SGFC | Single Asset / Portfolio: | Portfolio | |
| Original Principal Balance(2): | $45,000,000 | Title: | Fee | |
| Cut-off Date Principal Balance(2): | $45,000,000 | Property Type - Subtype: | Hotel – Full Service | |
| % of IPB: | 4.8% | Net Rentable Area (Rooms): | 1,192 | |
| Loan Purpose: | Refinance | Location: | Various | |
| Borrowers(3): | Various | Year Built / Renovated: | Various / Various | |
| Borrower Sponsor: | Southwest Value Partners Fund XVI, LP | Occupancy / ADR / RevPAR: | 80.3% / $150.49 / $120.88 | |
| Occupancy / ADR / RevPAR Date: | 1/31/2019 | |||
| Interest Rate: | 4.95800% | 4thMost Recent NOI (As of): | $21,390,216 (12/31/2016) | |
| Note Date: | 4/18/2019 | 3rdMost Recent NOI (As of): | $23,153,479 (12/31/2017) | |
| Maturity Date: | 5/1/2029 | 2nd Most Recent NOI (As of): | $23,248,958 (12/31/2018) | |
| Interest-only Period: | 120 months | Most Recent NOI (As of): | $23,723,247 (TTM 1/31/2019) | |
| Original Term: | 120 months | UW Occupancy / ADR / RevPAR: | 80.3% / $150.49 / $120.88 | |
| Original Amortization Term: | None | UW Revenues: | $67,719,285 | |
| Amortization Type: | Interest Only | UW Expenses: | $43,853,764 | |
| Call Protection(4): | L(25),Def(91),O(4) | UW NOI: | $23,865,520 | |
| Lockbox / Cash Management: | Hard / Springing | UW NCF: | $20,479,556 | |
| Additional Debt(2): | Yes | Appraised Value / Per Room(5): | $335,600,000 / $281,544 | |
| Additional Debt Balance(2): | $155,000,000 | Appraisal Date(5): | 10/16/2018 | |
| Additional Debt Type(2): | Pari Passu | |||
| Escrows and Reserves(6) | Financial Information(2) | ||||||
| Initial | Monthly | Initial Cap | Cut-off Date Loan / Room: | $167,785 | |||
| Taxes: | $822,222 | $205,555 | N/A | Maturity Date Loan / Room: | $167,785 | ||
| Insurance: | $990,844 | $82,570 | N/A | Cut-off Date LTV(5): | 59.6% | ||
| FF&E Reserves: | $0 | 5% of Gross Revenues | N/A | Maturity Date LTV(5): | 59.6% | ||
| TI/LC: | $0 | $0 | N/A | UW NCF DSCR: | 2.04x | ||
| Other: | $5,097,938 | Springing | N/A | UW NOI Debt Yield: | 11.9% | ||
| Sources and Uses | |||||||
| Sources | Proceeds | % of Total | Uses | Proceeds | % of Total | ||
| Whole Loan(2) | $200,000,000 | 100.0% | Payoff Existing Debt | $134,273,134 | 67.1% | ||
| Return of Equity(7) | 55,704,926 | 27.9 | |||||
| Reserves | 6,911,003 | 3.5 | |||||
| Closing Costs | 3,110,937 | 1.6 | |||||
| Total Sources | $200,000,000 | 100.0% | Total Uses | $200,000,000 | 100.0% | ||
| (1) | The SWVP Portfolio Whole Loan, as defined in “The Loan” below, was co-originated by Societe Generale Financial Corporation (“SGFC”) and JPMorgan Chase Bank, National Association (“JPMCB”). |
| (2) | The SWVP Portfolio mortgage loan is part of a whole loan evidenced by 10pari passu senior notes with an aggregate original principal balance of $200.0 million. The financial information presented in the chart above reflects the Cut-off Date balance of SWVP Portfolio Whole Loan (as defined below). |
| (3) | The borrowers for the SWVP Portfolio Whole Loan include SWVP New Orleans LLC, SWVP Sawgrass Mills LLC, SWVP Raleigh LLC, and SWVP Charlotte LLC. |
| (4) | The lockout period will be at least 25 payments beginning with and including June 1, 2019. Defeasance of the full $200.0 million SWVP Portfolio Whole Loan is permitted following the date after the earlier to occur of (i) two years from the closing date of the securitization that includes the last note to be securitized and (ii) May 1, 2022 (the “Lockout Period”). |
| (5) | The Appraised Value / Per Room, Appraisal Date, Cut-off Date LTV and Maturity Date LTV are calculated based on the appraised value of $335,600,000, which reflects the bulk value of the SWVP Portfolio Properties (as defined below). The appraisal concluded an “As Is” Appraised Value of $45,400,000 and an “As Is (Capital Deduction Assumed)” Appraised Value of $50,000,000 for the DoubleTree Charlotte property. The borrower escrowed $5,000,000 for the property improvement plan (“PIP”) reserve at origination of the SWVP Portfolio Whole Loan. The sum of the “As Is” and “As Is (Capital Deduction Assumed)” Appraised Values of each of the SWVP Portfolio Properties on an individual basis is $321,200,000, which represents a Cut-off Date LTV and Maturity Date LTV of 62.3% and 62.3%, respectively. |
| (6) | For a full description of Escrows and Reserves, please refer to “Escrows and Reserves” below. |
| (7) | The borrower sponsor has a total cost basis of approximately $209.4 million and will have approximately $9.4 million of remaining cash equity following the refinancing of the SWVP Portfolio Properties. |
THE INFORMATION IN THIS STRUCTURAL AND COLLATERAL TERM SHEET IS NOT COMPLETE AND MAY BE AMENDED PRIOR TO THE TIME OF SALE. THIS TERM SHEET IS NOT AN OFFER TO SELL THESE SECURITIES AND IT IS NOT A SOLICITATION OF AN OFFER TO BUY THESE SECURITIES IN ANY JURISDICTION WHERE THE OFFER OR SALE IS NOT PERMITTED.
68
| Structural and Collateral Term Sheet | BBCMS 2019-C3 | |
| No. 4 – SWVP Portfolio | ||
The Loan.The SWVP Portfolio mortgage loan is part of a whole loan (the “SWVP Portfolio Whole Loan”) evidenced by 10pari passu senior promissory notes with an aggregate original principal balance of $200,000,000.The SWVP Portfolio Whole Loan is secured by the borrowers’ fee interest in four full service hotels located in Louisiana, Florida, and North Carolina (collectively, the “SWVP Portfolio Properties”). The SWVP Portfolio Whole Loan was co-originated by SGFC and JPMCB. Notes A-1 and A-3 have an aggregate original balance of $45,000,000 and will be included in the BBCMS 2019-C3 Trust. The below table summarizes the remainingpari passu promissory notes, which are currently held by SGFC and JPMCB and are expected to be contributed to one or more future securitization transactions or may otherwise be transferred at any time. The SWVP Portfolio Whole Loan will be serviced pursuant to the pooling and servicing agreement for the BBCMS 2019-C3 Trust.See “Description of the Mortgage Pool—The Whole Loans—The Serviced Whole Loans” and “Pooling and Servicing Agreement” in the Preliminary Prospectus.The SWVP Portfolio Whole Loan has a 10-year term and is interest-only for the full term of the loan.
| Whole Loan Summary | |||
| Note | Original Balance | Note Holder | Controlling Piece |
| A-1 | $35,000,000 | BBCMS 2019-C3 | Yes |
| A-2 | 30,000,000 | SGFC | No |
| A-3 | 10,000,000 | BBCMS 2019-C3 | No |
| A-4 | 10,000,000 | SGFC | No |
| A-5 | 10,000,000 | SGFC | No |
| A-6 | 5,000,000 | SGFC | No |
| A-7 | 25,000,000 | JPMCB | No |
| A-8 | 25,000,000 | JPMCB | No |
| A-9 | 35,000,000 | JPMCB | No |
| A-10 | 15,000,000 | JPMCB | No |
| Total | $200,000,000 | ||
The Properties. The SWVP Portfolio Properties are comprised of four full service hotel properties built between 1983 and 2001 totaling 1,192 rooms. As of January 31, 2019, the SWVP Portfolio Properties were 80.3% occupied. The borrower sponsor acquired the SWVP Portfolio Properties between 2013 and 2015 for approximately $164.4 million. Since acquisition, the borrower sponsor has stated that they have invested approximately $40.0 million in capital improvements at the SWVP Portfolio Properties.
| SWVP Portfolio Summary | |||||||
| Property Name, Location | Property Type – Subtype | No. of Rooms | Year Built / Renovated | Allocated Whole Loan Amount (“ALA”) | % of ALA | Appraised Value(1) | UW NCF |
InterContinental New Orleans, LA | Hotel – Full Service | 484 | 1983 / 2015 | $106,300,000 | 53.2% | $170,000,000 | $10,344,521 |
DoubleTree Sunrise Sunrise, FL | Hotel – Full Service | 252 | 2001 / 2016 | 37,000,000 | 18.5 | 61,000,000 | 3,980,206 |
DoubleTree Charlotte Charlotte, NC | Hotel – Full Service | 207 | 1985 / 2019 | 30,000,000 | 15.0 | 50,000,000 | 3,256,464 |
DoubleTree RTP Durham, NC | Hotel – Full Service | 249 | 1988 / 2016 | 26,700,000 | 13.4 | 40,200,000 | 2,898,365 |
| Total | 1,192 | $200,000,000 | 100.0% | $335,600,000 | $20,479,556 | ||
| (1) | Total Appraised Value reflects the portfolio bulk value of $335,600,000, which is based on the assumption the entire SWVP Portfolio Properties are marketed to a single purchaser equating to a Cut-off Date LTV and Maturity Date LTV of 59.6% of 59.6%, respectively. The appraisal concluded an “As Is” Appraised Value of $45,400,000 and an “As Is (Capital Deduction Assumed)” Appraised Value of $50,000,000 for the DoubleTree Charlotte property. The borrower escrowed $5,000,000 for the PIP reserve at origination of the SWVP Portfolio Whole Loan. The sum of the “As Is” and “As Is (Capital Deduction Assumed)” Appraised Values of each of the SWVP Portfolio Properties on an individual basis, of which individual values are reflected on the table above, was $321,200,000, equating to a Cut-off Date LTV and Maturity Date LTV of 62.3% and 62.3%, respectively. |
THE INFORMATION IN THIS STRUCTURAL AND COLLATERAL TERM SHEET IS NOT COMPLETE AND MAY BE AMENDED PRIOR TO THE TIME OF SALE. THIS TERM SHEET IS NOT AN OFFER TO SELL THESE SECURITIES AND IT IS NOT A SOLICITATION OF AN OFFER TO BUY THESE SECURITIES IN ANY JURISDICTION WHERE THE OFFER OR SALE IS NOT PERMITTED.
69
| Structural and Collateral Term Sheet | BBCMS 2019-C3 | |
| No. 4 – SWVP Portfolio | ||
InterContinental
The InterContinental property is a 484-room, 15-story, full service hotel located in downtown New Orleans, Louisiana. The InterContinental property is situated on a 1.10-acre lot and has a long term lease for 120 parking spaces with the adjacent property owner, resulting in a parking ratio of approximately 0.25 spaces per room. The InterContinental property was built in 1983 and renovated in 2015. The hotel has standard and suite-style guestrooms on levels four through 14 of the InterContinental property. Guestrooms feature a dresser with a 42-inch flat-panel television, a desk, an armchair, bedside tables, and a coffeemaker. Guestroom amenities includes high-speed Internet access, a telephone with voicemail and data port and a private deck or patio in select rooms. Hotel amenities include two restaurants, 24-hour room service, a rooftop pool with changing rooms and shower facilities, poolside dining, a fitness facility, on-site laundry facility, nanny/babysitting services, business center and over 30,000 square feet of flexible meeting/banquet space, which can accommodate over 1,000 people. According to the borrower sponsor, since acquisition in 2013, the borrower sponsor has invested approximately $28.5 million ($58,942/key) in capital improvements consisting of a redesigned lobby, removal of an escalator, and elimination of leased outlets to create more meeting space that was completed in 2015.
DoubleTree Sunrise
The DoubleTree Sunrise property is a 252-room, 10-story, full service hotel located in Sunrise, Florida. The DoubleTree Sunrise property is situated on a 4.22-acre site and has 293 parking spaces either onsite or available to it by way of a title insured easement and license, resulting in a parking ratio of approximately 1.16 spaces per room. The DoubleTree Sunrise property was built in 2001 and renovated in 2016. Guestrooms are configured as either standard or suites-style. Guestrooms feature an entertainment dresser with 37-inch television, a work desk, an armchair and ottoman and a coffeemaker. Guestroom amenities include wireless, high-speed internet access and a telephone with voicemail and data port. Suites feature a separate living room with a 42-inch television, a large desk with high-speed wireless internet access, an armchair, an ottoman, and a double sleeper sofa. Suites also feature a small refrigerator and microwave. Hotel amenities include a restaurant, an outdoor pool, outdoor whirlpool, fitness facility, laundry/valet service, airport/local shuttle, business center and over 10,000 square feet of flexible meeting space. According to the borrower sponsor, since acquisition in 2014, the borrower sponsor has invested approximately $4.3 million ($16,984/key) in capital improvements consisting of a general refresh of all areas of the DoubleTree Sunrise property, including the reconstruction of the retail shop, refinished and reupholstered bar/lounge, new soft goods package in meeting rooms and a refresh of corridors, elevators and elevator lobbies. Guestrooms received new headboards, nightstands and desk chairs, while guestroom bathrooms were refinished and received new tile shower surrounds that was completed in 2016.
DoubleTree Charlotte
The DoubleTree Charlotte property is a 207-room, six-story, full service hotel located in Charlotte, North Carolina. The DoubleTree Charlotte property is situated on a 6.53-acre site and has 259 parking spaces, resulting in a parking ratio of approximately 1.25 spaces per room. The DoubleTree Charlotte property was built in 1985 and renovated in 2019. The hotel comprises two connected towers; the original tower is three stories and features the public spaces and guestrooms, while the six-story tower only contains guestrooms. All guestrooms are configured in a suite style. In-room amenities include a wet-bar or kitchenette, separate living areas, sofa beds, complimentary coffee and Wi-Fi access for a fee. Additionally, some suites feature balconies with views of the Garden Courtyard and Symphony Park. Hotel amenities include two full service restaurants, a Grab and Go Market, an outdoor pool, a business center, a fitness center, a gift shop and over 12,000 square feet of meeting space. According to the borrower sponsor, since acquisition in 2014, the borrower sponsor has invested approximately $5.3 million ($25,792/key) in capital improvements including over $4.0 million in DoubleTree Charlotte property improvement plan items. Improvements included upgrading 14 suites, renovating the fitness room, and replacing the phone system. In 2019, the DoubleTree Charlotte property started an approximately $5.0 million ($24,155/key) capital improvement project that was reserved at origination and includes improvements to the guestrooms, guest suite bathrooms, corridors, lobby and dining area. The renovation of the lobby and restaurant are expected to commence in the fourth quarter of 2019.
DoubleTree RTP
The DoubleTree RTP property is a 249-room, five-story, full service hotel located in Durham, North Carolina. The DoubleTree RTP property is situated on a 12.50-acre site and has 366 parking spaces, resulting in a parking ratio of approximately 1.47 spaces per room. The DoubleTree RTP property was built in 1988 and renovated in 2016. The hotel
THE INFORMATION IN THIS STRUCTURAL AND COLLATERAL TERM SHEET IS NOT COMPLETE AND MAY BE AMENDED PRIOR TO THE TIME OF SALE. THIS TERM SHEET IS NOT AN OFFER TO SELL THESE SECURITIES AND IT IS NOT A SOLICITATION OF AN OFFER TO BUY THESE SECURITIES IN ANY JURISDICTION WHERE THE OFFER OR SALE IS NOT PERMITTED.
70
| Structural and Collateral Term Sheet | BBCMS 2019-C3 | |
| No. 4 – SWVP Portfolio | ||
offers a mix of guestrooms and suites, which are located on all levels of the DoubleTree RTP property's single building. Guestrooms feature one king or two double beds, two telephones with voicemail and data ports, a large work desk, high speed internet access available for a fee, a coffee maker, a hairdryer and an iron/board. Hotel amenities include a restaurant and lounge adjacent to the lobby, and seven meeting rooms on the first floor, which includes a large ballroom. Additional amenities consist of an outdoor pool, a fitness room, a lobby workstation, a market pantry, and a vending area. According to the borrower sponsor, since acquisition in 2015, the borrower sponsor has invested approximately $1.8 million ($7,291/key) in capital improvements including upgrades to the exterior lighting, parking lot, public spaces and restaurant that was completed in 2016.
Environmental. According to a Phase I environmental assessments dated February 1, 2019, there was no evidence of any recognized environmental conditions at the SWVP Portfolio Properties.
The Markets.The SWVP Portfolio Properties are located in four diverse markets:
InterContinental
The InterContinental property is located in New Orleans, within the parish of Orleans, Louisiana. Known for its multicultural heritage and world-famous music and cuisine, New Orleans is predominantly recognized as a tourist destination. In addition to tourism, the greater New Orleans area is a significant logistics center, owing to its access to the Mississippi River, the Gulf of Mexico, and numerous railways. Major employers within the market include Ochsner Health System, University Medical Center, Tulane University and University of New Orleans. The InterContinental’s top corporate accounts represent many of the primary employers in the local marketplace, as well as high-volume demand drivers in the immediate vicinity of the hotel. According to the borrower sponsor, Shell, Pan America, Iberia Bank, Bank of America, the United States Fifth Circuit Court of Appeals, Louisiana State Bar Association and Jones Walker are some of the top corporate accounts at the InterContinental property and are located blocks from the hotel. Access to the InterContinental property is provided by St. Charles Avenue. The neighborhood surrounding the InterContinental property is comprised of high-rise office and residential buildings, hotels, world-renowned restaurants, upscale retail establishments, entertainment venues, and tourism attractions. Some specific facilities in the area include the Ernest N. Morial Convention Center, the Mercedes-Benz Superdome, the Smoothie King Center, and Harrah's New Orleans Hotel & Casino. New Orleans has hosted two NBA All-Star games, the NCAA Final Four, WWE's WrestleMania XXX, and Super Bowl XLVII. The InterContinental property is served by the Louis Armstrong New Orleans International Airport, which is located approximately 12.0 miles to the northwest of the hotel. The appraisal identified a 234-room hotel that is expected to directly compete with the InterContinental property. The competing property is estimated to open in September 2019. According to the appraisal, demand segmentation for the InterContinental property is 55% meeting and group, 25% commercial, and 20% leisure.
| Historical Occupancy, ADR, RevPAR(1) | |||||||||
| Competitive Set | InterContinental(2) | Penetration Factor | |||||||
| Year | Occupancy | ADR | RevPAR | Occupancy | ADR | RevPAR | Occupancy | ADR | RevPAR |
| 2016 | 75.4% | $174.34 | $131.42 | 73.1% | $164.61 | $120.38 | 97.0% | 94.4% | 91.6% |
| 2017 | 78.7% | $174.63 | $137.52 | 75.8% | $169.07 | $128.16 | 96.3% | 96.8% | 93.2% |
| 2018 | 78.0% | $179.15 | $139.72 | 78.9% | $167.35 | $132.12 | 101.2% | 93.4% | 94.6% |
| TTM(3) | 78.0% | $179.41 | $139.98 | 79.6% | $169.13 | $134.65 | 102.0% | 94.3% | 96.2% |
| (1) | Data provided by a third party market research report. The competitive set contains the following properties: Le Meridien New Orleans, Westin New Orleans Canal Place, DoubleTree by Hilton Hotel New Orleans, JW Marriott New Orleans, Hyatt French Quarter, Crowne Plaza New Orleans French Quarter, and Lowes New Orleans. |
| (2) | The variances between the underwriting, the appraisal and the third party market research provider date with respect to Occupancy, ADR and RevPAR at the InterContinental property are attributable to differing reporting methodologies, and/or timing differences. |
| (3) | TTM represents the trailing 12-month period ending January 31, 2019. |
DoubleTree Sunrise
The DoubleTree Sunrise property is located in Sunrise, Florida. Sunrise is a suburb of Fort Lauderdale, which is the county seat of Broward County. Fort Lauderdale is a popular tourism and yachting destination in the South Florida region. Sunrise has a diverse economic base, with strong employers in finance, health care, manufacturing, marine, aviation, technology, life sciences, and tourism. Major employers within the market include Nova Southeastern University, American Express, Spirit Airlines and Citrix. American Express is the #1 corporate account for the DoubleTree Sunrise property and had an ADR of approximately $155.73 for 2018. The American Express Company corporate offices is a regional headquarters office
THE INFORMATION IN THIS STRUCTURAL AND COLLATERAL TERM SHEET IS NOT COMPLETE AND MAY BE AMENDED PRIOR TO THE TIME OF SALE. THIS TERM SHEET IS NOT AN OFFER TO SELL THESE SECURITIES AND IT IS NOT A SOLICITATION OF AN OFFER TO BUY THESE SECURITIES IN ANY JURISDICTION WHERE THE OFFER OR SALE IS NOT PERMITTED.
71
| Structural and Collateral Term Sheet | BBCMS 2019-C3 | |
| No. 4 – SWVP Portfolio | ||
designed for 3,000 employees that opened in early 2017 on the southeast corner of Northwest 136th Street and Sunrise Boulevard. Sawgrass Mills is a 2.1 million square foot outlet mall located 1.0 mile north of the DoubleTree Sunrise property and draws approximately 23.0 million visitors annually from more than 110 countries. Other major demand generators located within six miles of the DoubleTree Sunrise property include BB&T Center, MDLIVE, Sawgrass Technology Park, and Cigna Healthcare. BB&T is home to the NHL’s Florida Panthers and host of numerous events throughout the year. Access to the DoubleTree Sunrise property is provided by Yellow Toucan Road. The DoubleTree Sunrise property’s neighborhood will also feature Metropica, a 65-acre, $1.5 billion mixed-use development. Metropica will feature 785,000 square feet of office space and a major residential condominium component. The DoubleTree Sunrise property is served primarily by the Fort Lauderdale Hollywood International Airport, which is located approximately 10 miles southeast of the hotel. The appraisal identified a 174-room hotel that is expected to directly compete with the DoubleTree Sunrise property. The competing property is estimated to open in August 2020. According to the appraisal, demand segmentation for the DoubleTree Sunrise property is 60% commercial, 20% meeting and group, and 20% leisure.
| Historical Occupancy, ADR, RevPAR(1) | |||||||||
| Competitive Set | DoubleTree Sunrise(2) | Penetration Factor | |||||||
| Year | Occupancy | ADR | RevPAR | Occupancy | ADR | RevPAR | Occupancy | ADR | RevPAR |
| 2016 | 75.4% | $118.92 | $89.72 | 85.7% | $140.03 | $119.94 | 113.5% | 117.7% | 133.7% |
| 2017 | 77.2% | $124.41 | $95.99 | 89.0% | $144.43 | $128.49 | 115.3% | 116.1% | 133.9% |
| 2018 | 76.8% | $127.14 | $97.67 | 86.7% | $148.39 | $128.61 | 112.8% | 116.7% | 131.7% |
| TTM(3) | 76.8% | $123.16 | $94.54 | 87.0% | $148.91 | $129.53 | 113.3% | 120.9% | 137.0% |
| (1) | Data provided by a third party market research report. The competitive set contains the following properties for 2016-2018: Sawgrass Grand Hotel & Suites, Sheraton Suites Fort Lauderdale Plantation, Renaissance Fort Lauderdale Plantation Hotel and Courtyard Fort Lauderdale Weston. The competitive set contains the following properties for TTM: Holiday Inn Express & Suites Fort Lauderdale, Sawgrass Grand Hotel & Suites, Sheraton Suites Fort Lauderdale Plantation, Hyatt Place Fort Lauderdale Plantation, and Renaissance Fort Lauderdale Plantation Hotel. |
| (2) | The variances between the underwriting, the appraisal and the third party market research provider date with respect to Occupancy, ADR and RevPAR at the DoubleTree Sunrise property are attributable to differing reporting methodologies, and/or timing differences. |
| (3) | TTM represents the trailing 12-month period ending January 31, 2019. |
DoubleTree Charlotte
The DoubleTree Charlotte property is located in Charlotte, North Carolina. The Charlotte market is the third largest financial center in the nation according to the appraisal. The area is also home to manufacturing, retail and wholesale trade, information, and an increasing number of international companies. Charlotte is home to eight Fortune 500 company headquarters that represent the finance, energy, and manufacturing industries, as well as the retail sector. Major employers within the market include Carolinas Healthcare System, Wells Fargo, Charlotte-Mecklenburg Schools, Wal-Mart Store Inc., and Bank of America. The neighborhood surrounding the DoubleTree Charlotte property is comprised of restaurants, office buildings, and retail shopping centers along the primary thoroughfares, with residential areas located along the secondary roadways. Other businesses in the area include the SouthPark shopping mall, Coca-Cola Bottling Company, and Nucor Corporation. Other demand generators include Bank of America Stadium, BB&T Ballpark, EpiCentre, Spectrum Center, NASCAR Hall of Fame, Blumenthal Performing Arts Center, and AvidXchange Music Factory, as well as the Carowinds amusement park located in southwestern Charlotte. Access to the DoubleTree Charlotte property is provided by Morrison Boulevard, South Park Drive, Interstate 77 and Interstate 485, allowing easy access to the airport and Uptown Charlotte. The DoubleTree Charlotte property is served primarily by the Charlotte Douglas International Airport, which is located approximately seven miles northwest of the hotel. The appraisal identified two new hotels with a combined 320-rooms which are expected to directly compete with the DoubleTree Charlotte property. The competing properties are estimated to open in 2020. According to the appraisal, demand segmentation for the DoubleTree Charlotte property is 43% commercial, 32% meeting and group, and 25% leisure.
THE INFORMATION IN THIS STRUCTURAL AND COLLATERAL TERM SHEET IS NOT COMPLETE AND MAY BE AMENDED PRIOR TO THE TIME OF SALE. THIS TERM SHEET IS NOT AN OFFER TO SELL THESE SECURITIES AND IT IS NOT A SOLICITATION OF AN OFFER TO BUY THESE SECURITIES IN ANY JURISDICTION WHERE THE OFFER OR SALE IS NOT PERMITTED.
72
| Structural and Collateral Term Sheet | BBCMS 2019-C3 | |
| No. 4 – SWVP Portfolio | ||
| Historical Occupancy, ADR, RevPAR(1) | |||||||||
| Competitive Set | DoubleTree Charlotte(2) | Penetration Factor | |||||||
| Year | Occupancy | ADR | RevPAR | Occupancy | ADR | RevPAR | Occupancy | ADR | RevPAR |
| 2016 | 76.1% | $143.31 | $109.08 | 82.8% | $146.36 | $121.12 | 108.7% | 102.1% | 111.0% |
| 2017 | 73.3% | $145.86 | $106.85 | 80.6% | $150.23 | $121.01 | 110.0% | 103.0% | 113.2% |
| 2018 | 68.4% | $145.23 | $99.29 | 79.6% | $144.54 | $115.01 | 116.4% | 99.5% | 115.8% |
| TTM(3) | 68.0% | $144.92 | $98.55 | 78.9% | $144.77 | $114.29 | 116.1% | 99.9% | 116.0% |
| (1) | Data provided by a third party market research report. The competitive set contains the following properties: Marriott Charlotte Southpark, Hilton Charlotte Executive Park, Renaissance Charlotte South Park Hotel, Hyatt House Charlotte Airport, Hampton Inn Charlotte South Park @ Phillips Place, La Quinta Inn & Suites Charlotte Airport South, and Residence Inn Charlotte Southpark. |
| (2) | The variances between the underwriting, the appraisal and the third party market research provider date with respect to Occupancy, ADR and RevPAR at the DoubleTree Charlotte property are attributable to differing reporting methodologies, and/or timing differences. |
| (3) | TTM represents the trailing 12-month period ending January 31, 2019. |
DoubleTree RTP
The DoubleTree RTP property is located in Durham, North Carolina. Durham is part of the greater Raleigh/Durham economic base and is part of the Research Triangle Park, which includes the neighboring cities of Chapel Hill and Raleigh. The Durham economy has a diverse economic base within the healthcare, bioscience, technology, and education sectors, including healthy employment levels at companies in the Research Triangle Park. Major employers in the market include Duke University, Duke University Health System, IBM, North Carolina State University, WakeMed Health & Hospitals, and UNC Rex Healthcare. Access to the DoubleTree RTP property is provided by Page Creek Lane, Old Page Road and Interstate 40, which is the nearest major highway. The neighborhood surrounding the DoubleTree RTP property is comprised of restaurants, office buildings, and retail shopping centers along the primary thoroughfares, with residential areas located along some secondary roadways. Other specific businesses and entities in the area include Duke Medical Plaza Page Road, Alcami, Cenduit, and Merrill Lynch Wealth Management. The DoubleTree RTP property is served by the Raleigh-Durham International Airport, which is located approximately two miles to the east of the hotel. The appraisal identified a proposed new hotel that has been approved by the Research Triangle Foundation and is currently in the planning stages. According to the appraisal, demand segmentation for the DoubleTree RTP property is 50% commercial, 30% leisure, and 20% meeting and group.
| Historical Occupancy, ADR, RevPAR(1) | |||||||||
| Competitive Set | DoubleTree RTP(2) | Penetration Factor | |||||||
| Year | Occupancy | ADR | RevPAR | Occupancy | ADR | RevPAR | Occupancy | ADR | RevPAR |
| 2016 | 73.6% | $119.30 | $87.85 | 72.5% | $119.29 | $86.51 | 98.5% | 100.0% | 98.5% |
| 2017 | 73.6% | $118.04 | $86.83 | 73.8% | $119.69 | $88.31 | 100.3% | 101.4% | 101.7% |
| 2018 | 75.8% | $119.48 | $90.58 | 76.0% | $120.60 | $91.67 | 100.3% | 100.9% | 101.2% |
| TTM(3) | 76.3% | $114.19 | $87.11 | 76.2% | $120.56 | $91.85 | 99.9% | 105.6% | 105.4% |
| (1) | Data provided by a third party market research report. The competitive set contains the following property for 2016-2018: DoubleTree by Hilton Hotel Guest Suites Raleigh Durham, Marriott @ Research Triangle Park, Sheraton Imperial Hotel Raleigh Durham Airport Research Triangle Park, Hilton Garden Inn Durham Raleigh Research Triangle Park, Homewood Suites by Hilton Raleigh Durham Airport Research Triangle, Springhill Suites Raleigh Durham Airport Research Triangle Park, Hotel Indigo Raleigh Durham Airport @ RTP, and Hyatt Place Durham Southpoint. The competitive set contains the following properties for TTM: DoubleTree by Hilton Hotel Guest Suites Raleigh Durham, Marriott @ Research Triangle Park, Hilton Garden Inn Durham Raleigh Research Triangle Park, La Quinta Inns & Suites Durham Research Triangle Park, and Hotel Indigo Raleigh Durham Airport @ RTP. |
| (2) | The variances between the underwriting, the appraisal and the third party market research provider date with respect to Occupancy, ADR and RevPAR at the DoubleTree RTP property are attributable to differing reporting methodologies, and/or timing differences. |
| (3) | TTM represents the trailing 12-month period ending January 31, 2019. |
THE INFORMATION IN THIS STRUCTURAL AND COLLATERAL TERM SHEET IS NOT COMPLETE AND MAY BE AMENDED PRIOR TO THE TIME OF SALE. THIS TERM SHEET IS NOT AN OFFER TO SELL THESE SECURITIES AND IT IS NOT A SOLICITATION OF AN OFFER TO BUY THESE SECURITIES IN ANY JURISDICTION WHERE THE OFFER OR SALE IS NOT PERMITTED.
73
| Structural and Collateral Term Sheet | BBCMS 2019-C3 | |
| No. 4 – SWVP Portfolio | ||
| Operating History and Underwritten Net Cash Flow | |||||||
| 2016 | 2017 | 2018 | TTM(1) | Underwritten | Per Room(2) | % of Total Revenue(3) | |
| Occupancy | 77.8% | 79.1% | 79.8% | 80.3% | 80.3% | ||
| ADR | $146.17 | $149.79 | $150.15 | $150.49 | $150.49 | ||
| RevPAR | $113.60 | $118.36 | $119.90 | $120.89 | $120.88 | ||
| Room Revenue | $49,492,887 | $51,496,118 | $52,165,543 | $52,476,386 | $52,593,360 | $44,122 | 77.7% |
| Food & Beverage Revenue | 11,453,086 | 13,034,557 | 12,432,826 | 12,931,530 | 12,931,530 | 10,849 | 19.1 |
| Other Departmental Revenue | 1,767,360 | 1,834,540 | 2,130,803 | 2,194,395 | 2,194,395 | 1,841 | 3.2 |
| Total Revenue | $62,713,333 | $66,365,215 | $66,729,172 | $67,602,311 | $67,719,285 | $56,811 | 100.0% |
| Room Expense | $10,639,861 | $11,122,787 | $11,210,546 | $11,329,879 | $11,352,438 | $9,524 | 21.6% |
| Food & Beverage Expense | 6,962,035 | 7,516,095 | 7,378,949 | 7,493,877 | 7,493,876 | 6,287 | 58.0 |
| Other Departmental Expenses | 443,506 | 427,338 | 434,921 | 436,195 | 436,432 | 366 | 19.9 |
| Departmental Expenses | $18,045,402 | $19,066,220 | $19,024,416 | $19,259,951 | $19,282,745 | $16,177 | 28.5% |
| Departmental Profit | $44,667,931 | $47,298,995 | $47,704,756 | $48,342,360 | $48,436,539 | $40,635 | 71.5% |
| Operating Expenses | $18,175,172 | $18,877,536 | $19,063,691 | $19,189,533 | $19,182,636 | $16,093 | 28.3% |
| Gross Operating Profit | $26,492,759 | $28,421,459 | $28,641,065 | $29,152,827 | $29,253,903 | $24,542 | 43.2% |
| Management Fees | $1,880,640 | $1,990,218 | $2,001,183 | $2,027,379 | $2,031,579 | $1,704 | 3.0% |
| Property Taxes | 2,301,211 | 2,396,596 | 2,394,820 | 2,395,025 | 2,394,820 | 2,009 | 3.5 |
| Property Insurance | 920,692 | 881,166 | 996,104 | 1,007,176 | 961,984 | 807 | 1.4 |
| Total Other Expenses | $5,102,543 | $5,267,980 | $5,392,107 | $5,429,580 | $5,388,383 | $4,520 | 8.0% |
| Net Operating Income | $21,390,216 | $23,153,479 | $23,248,958 | $23,723,247 | $23,865,520 | $20,021 | 35.2% |
| FF&E | 0 | 0 | 0 | 0 | 3,385,964 | 2,841 | 5.0 |
| Net Cash Flow(4) | $21,390,216 | $23,153,479 | $23,248,958 | $23,723,247 | $20,479,556 | $17,181 | 30.2% |
| (1) | TTM reflects the trailing 12 month period ending January 31, 2019. |
| (2) | Per Room values are based on 1,192 guest rooms. |
| (3) | % of Total Revenue for Room Expense, Food & Beverage Expense and Other Departmental Expenses is based on their corresponding revenue line item. |
| (4) | The increase in Net Cash Flow from 2016 to 2017 is primarily the result of an approximately $23.6 million renovation occurring between 2014 to February 2015 at the InterContinental property. |
The Borrowers. The borrowing entities for the SWVP Portfolio Whole Loan are SWVP New Orleans LLC, SWVP Sawgrass Mills LLC, SWVP Raleigh LLC, and SWVP Charlotte LLC, each a Delaware limited liability company and special purpose entity with two independent directors. Legal counsel delivered a non-consolidation opinion in connection with the origination of the SWVP Portfolio Whole Loan. Southwest Value Partners Fund XVI, LP is the guarantor of certain nonrecourse carveouts under the SWVP Portfolio Whole Loan.
The Loan Sponsor.The loan sponsor is Southwest Value Partners Fund XVI, LP.Southwest Value Partners (“SWVP”), is a private real estate investment firm based in San Diego. SWVP currently owns and manages in excess of 30 assets with an aggregate value over $3.0 billion, including 13 hotels representing 3,867 rooms. SWVP’s consolidated hospitality portfolio consists of 13 operating properties and one hotel under construction for a total of 4,458 rooms, all of which are flagged by Hilton (five), Marriott (four), Hyatt (three) and IHG (one), along with one independent boutique. Since inception, SWVP has invested more than $1.5 billion of equity in over 100 transactions with a total capitalization of approximately $3.9 billion. The borrower sponsor has a total cost basis of approximately $209.4 million and will have approximately $9.4 million of remaining cash equity following the refinancing of the SWVP Portfolio Properties.
Property Management.The SWVP Portfolio Properties are managed by Dimension Development Two, LLC.
Franchise Agreements. The Intercontinental property has a license agreement with Holiday Hospitality Franchising, LLC, a Delaware limited liability company, an affiliate of InterContinental Hotels Group. The current franchise agreement is effective as of January 23, 2013 for a term of approximately 20 years, with an expiration date of January 23, 2033. The franchise agreement provides for a royalty fee of 5.0% and a services contribution of 3.0%.
THE INFORMATION IN THIS STRUCTURAL AND COLLATERAL TERM SHEET IS NOT COMPLETE AND MAY BE AMENDED PRIOR TO THE TIME OF SALE. THIS TERM SHEET IS NOT AN OFFER TO SELL THESE SECURITIES AND IT IS NOT A SOLICITATION OF AN OFFER TO BUY THESE SECURITIES IN ANY JURISDICTION WHERE THE OFFER OR SALE IS NOT PERMITTED.
74
| Structural and Collateral Term Sheet | BBCMS 2019-C3 | |
| No. 4 – SWVP Portfolio | ||
The DoubleTree Sunrise property has a franchise agreement with Doubletree Franchise LLC, a Delaware limited liability company. The current franchise agreement is effective as of May 28, 2014 for a term of approximately 15 years, with an expiration date of May 31, 2029. The franchise agreement provides for a royalty fee of 5.0% and a program fee of 4.0%.
The DoubleTree Charlotte property has a franchise agreement with Doubletree Franchise LLC, a Delaware limited liability company. The current franchise agreement is effective as of October 30, 2014 for a term of approximately 15 years, with an expiration date of October 31, 2029. The franchise agreement provides for a royalty fee of 5.0% and a program fee of 4.0%.
The DoubleTree RTP property has a franchise agreement with Hilton Franchise Holding LLC, a Delaware limited liability company. The current franchise agreement is effective as of May 28, 2015 for a term of approximately 15 years, with an expiration date of May 31, 2030. The franchise agreement provides for a royalty fee of 5.0% and a program fee of 4.0%.
Escrows and Reserves.At origination, the borrowers deposited into escrow (i) $5,000,000 ($24,155/key) for an elective (non-franchise mandated) property improvement reserves at the Double Tree Charlotte property, (ii) $990,844 for insurance reserves, (iii) $822,222 for real estate taxes, and (iv) $97,938 for deferred maintenance.
Tax Escrows– On a monthly basis, the borrowers are required to escrow 1/12 of the annual estimated tax payments, which currently equates to $205,555.
Insurance Escrows – On a monthly basis, the borrowers are required to escrow 1/12 of the annual estimated insurance payments, which currently equates to $82,570.
FF&E Reserves– On a monthly basis, the borrowers are required to deposit an amount equal to the greater of (i) 1/12 of the amount required to be reserved annually for FF&E expenses with respect to its property under the applicable franchise agreement, and (ii) 1/12 of 5.0% of aggregate annual rents (excluding hotel taxes) of its property based on the prior year.
PIP Reserves– In the event the borrowers are required to complete a property improvement plan, the borrowers are required to deposit an amount by which (A) the estimated cost approved by the lender for such property improvement plan over the immediately succeeding 12 month period exceeds (B) the sum of (i) the amount on deposit in reserves applicable to the property to which such property improvement plan applies for capital and FF&E expenses and (ii) the amount of required deposits to the FF&E reserves for such property over the immediately succeeding 12 month period less the greater of (x) the base FF&E amounts (as defined in the SWVP Portfolio Whole Loan documents) for each property not subject to such property improvement plan and (y) the aggregate amount of budgeted approved capital/FF&E expenses for such period for all properties, provided such deposit amount will never be less than $0 and the borrowers will be entitled to certain credits set forth in the SWVP Portfolio Whole Loan documents.
Hotel Tax Reserves– During the continuance of any Cash Management Period (as defined below) the borrowers are required to deposit an amount equal to the hotel taxes for the preceding the monthly hotel tax reporting period.
Lockbox / Cash Management. The SWVP Portfolio Whole Loan documents require a hard lockbox and springing cash management. The borrowers were required to send direction letters to all tenants, credit card companies and other payees instructing them to deposit all rents directly into a lender controlled lockbox account per property. The SWVP Portfolio Whole Loan documents require that all rents received by the borrowers or property manager be deposited into the lockbox account within one business day of receipt. During the continuance of a Cash Management Period, all sums on deposit in the lockbox account are required to be transferred on a daily basis to a cash management account controlled by the lenders and applied and disbursed in accordance with the SWVP Portfolio Whole loan documents. Excess cash on deposit will be applied as follows: (a) to the extent a Cash Management Period is in effect solely due to a Franchise Trigger Event (as defined below) to the property improvement plan reserve subaccount, and (b) to the extent a Cash Management Period is not in effect (other than solely as a result of a Franchise Trigger Event (as defined below)), to the cash collateral subaccount.
A “Cash Management Period” will commence upon (i) the occurrence of the maturity date, (ii) the occurrence of an event of default, (iii) the debt service coverage ratio (as calculated in accordance with the SWVP Portfolio Whole Loan documents) as of the last day of each calendar quarter during the term is less than 1.40x, (iv) the date that is 12 months prior to the maturity date, if both (a) the franchise agreement with respect to any property is scheduled to terminate earlier than 24
THE INFORMATION IN THIS STRUCTURAL AND COLLATERAL TERM SHEET IS NOT COMPLETE AND MAY BE AMENDED PRIOR TO THE TIME OF SALE. THIS TERM SHEET IS NOT AN OFFER TO SELL THESE SECURITIES AND IT IS NOT A SOLICITATION OF AN OFFER TO BUY THESE SECURITIES IN ANY JURISDICTION WHERE THE OFFER OR SALE IS NOT PERMITTED.
75
| Structural and Collateral Term Sheet | BBCMS 2019-C3 | |
| No. 4 – SWVP Portfolio | ||
months after the maturity date, and (b) the Capital/FF&E subaccount does not then have a balance that is equal to or greater than the product of the number of units at each property that has a franchise agreement expiring less than 24 months after the maturity date, multiplied by $20,000, (v) the date that is 12 months prior to the expiration or early termination, the date upon which the expiration or early termination date becomes known to the borrowers and the borrowers have not provided evidence of the satisfaction of the New License Conditions (as defined below), (vi) a property improvement plan for the property is required by the franchisor or replacement franchisor and the borrowers have not deposited the required property improvement deposit, (clauses (iv), (v) or (vi) are referred to as a “Franchise Trigger Event”), or (vii) any involuntary or voluntary petition or bankruptcy action of the borrowers or property manager (“Insolvency Cash Management Trigger Event”).
A Cash Management Period will end upon satisfaction of certain terms and conditions including, without limitation: (i) the repayment in full of the SWVP Portfolio Whole Loan or (ii) if the maturity date has not yet occurred, (a) with respect to the matters described in clause (ii) above, such event of default has been cured and no other event of default has occurred and is continuing, (b) with respect to the matter described in clause (iii) above, the debt service coverage ratio (as calculated in accordance with the SWVP Portfolio Whole Loan documents) has been at least 1.40x for two consecutive calendar quarters, (c) with respect to the matter described in clause (iv) above, the repayment in full of the SWVP Portfolio Whole Loan, (d) with respect to the matter described in clause (v) above, the date upon which the borrowers satisfy the New License Conditions (subject to satisfaction of the requirements in clause (e) below with respect to property improvement plan required in connection with the satisfaction of the New License Conditions), (e) with respect to the matter described in clause (vi) above, the funds on deposit in the PIP reserve are at least equal to the full amount of the estimated cost, as approved by the lender, to satisfy any repairs, replacements, remediation, renovation or improvement required by the franchisor or any successor franchisor or licensor pursuant to any and all then existing PIPs, or (f) with respect to any matter described in clause (vii) above, the completion of an Insolvency Cash Management Trigger Cure (as defined below).
An “Insolvency Cash Management Trigger Cure” means (i) with respect to an Insolvency Cash Management Trigger Event, any such petition or proceeding against the borrowers or property manager that caused an Insolvency Cash Management Trigger Event is subject to a final non-appealable dismissal or (ii) with respect to an Insolvency Cash Management Trigger Event pertaining to the property manager, a replacement property manager has been appointed for all of the SWVP Portfolio Properties.
A “New License Conditions” means (i) a replacement franchise agreement with an approved replacement flag or the extension or renewal of an existing franchise agreement, in each case for a term that does not expire until a date which is as least two years beyond the maturity date and contains market terms consistent with other license agreements issued by the approved replacement flag and (ii) a tri-party agreement or comfort letter issued by the approved replacement flag for the benefit of the lenders.
Subordinate and Mezzanine Debt. None.
Partial Release. At any time on or after the first payment date after the Lockout Period, any of the borrowers, with the exception of the SWVP New Orleans LLC borrower, may obtain the release of any of the SWVP Portfolio Properties, with the exception of the InterContinental property included in the SWVP Portfolio Whole Loan, provided that, among other things, (i) no event of default has occurred and is continuing (other than an event of default which applies only to the property to be released), (ii) the borrowers prepay a portion of the SWVP Portfolio Whole Loan equal to the greater of (a) 120% of the allocated loan amount of the property being released and (b) an amount by which the principal balance of the SWVP Portfolio Whole Loan would need to be reduced to satisfy the following clauses, (iii) the (debt service coverage ratio for the remaining properties following the release is not less than the greater of (1) the debt service coverage ratio immediately preceding such release and (2) 2.03x, (iv) the loan-to-value for the remaining properties is not greater than the lesser of (1) the loan-to-value immediately preceding such release and (2) 59.6%, and (v) all defeasance conditions set forth in the SWVP Portfolio Whole Loan documents are satisfied.
Ground Lease. None.
THE INFORMATION IN THIS STRUCTURAL AND COLLATERAL TERM SHEET IS NOT COMPLETE AND MAY BE AMENDED PRIOR TO THE TIME OF SALE. THIS TERM SHEET IS NOT AN OFFER TO SELL THESE SECURITIES AND IT IS NOT A SOLICITATION OF AN OFFER TO BUY THESE SECURITIES IN ANY JURISDICTION WHERE THE OFFER OR SALE IS NOT PERMITTED.
76
[THIS PAGE INTENTIONALLY LEFT BLANK]
77
| Structural and Collateral Term Sheet | BBCMS 2019-C3 | |
| No. 5 – Renaissance Fort Lauderdale | ||

THE INFORMATION IN THIS STRUCTURAL AND COLLATERAL TERM SHEET IS NOT COMPLETE AND MAY BE AMENDED PRIOR TO THE TIME OF SALE. THIS TERM SHEET IS NOT AN OFFER TO SELL THESE SECURITIES AND IT IS NOT A SOLICITATION OF AN OFFER TO BUY THESE SECURITIES IN ANY JURISDICTION WHERE THE OFFER OR SALE IS NOT PERMITTED.
78
| Structural and Collateral Term Sheet | BBCMS 2019-C3 | |
| No. 5 – Renaissance Fort Lauderdale | ||
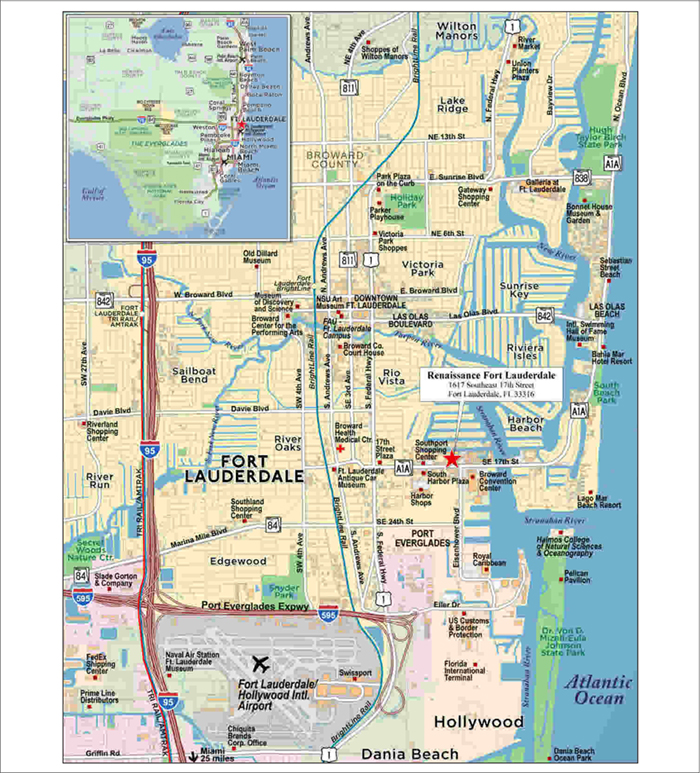
THE INFORMATION IN THIS STRUCTURAL AND COLLATERAL TERM SHEET IS NOT COMPLETE AND MAY BE AMENDED PRIOR TO THE TIME OF SALE. THIS TERM SHEET IS NOT AN OFFER TO SELL THESE SECURITIES AND IT IS NOT A SOLICITATION OF AN OFFER TO BUY THESE SECURITIES IN ANY JURISDICTION WHERE THE OFFER OR SALE IS NOT PERMITTED.
79
| Structural and Collateral Term Sheet | BBCMS 2019-C3 | |
| No. 5 – Renaissance Fort Lauderdale | ||
| Mortgage Loan Information | Property Information | |||
| Mortgage Loan Seller: | Barclays | Single Asset / Portfolio: | Single Asset | |
| Original Principal Balance: | $42,275,000 | Title: | Fee | |
| Cut-off Date Principal Balance: | $42,275,000 | Property Type - Subtype: | Hotel – Full Service | |
| % of IPB: | 4.5% | Net Rentable Area (Rooms): | 236 | |
| Loan Purpose: | Acquisition | Location: | Fort Lauderdale, FL | |
| Borrowers: | 17th Street Hotel, LLC and 17th Street Hotel Operations, LLC | Year Built / Renovated: | 2001 / 2016 | |
| Borrower Sponsor: | Howard J. Wurzak | Occupancy / ADR / RevPAR: | 82.4% / $177.08 / $145.90 | |
| Interest Rate: | 4.86500% | Occupancy / ADR / RevPAR Date: | 1/31/2019 | |
| Note Date: | 3/13/2019 | 4th Most Recent NOI (As of): | $4,557,421 (12/31/2016) | |
| Maturity Date: | 4/6/2029 | 3rd Most Recent NOI (As of): | $5,327,316 (12/31/2017) | |
| Interest-only Period: | 120 months | 2nd Most Recent NOI (As of): | $5,589,131 (12/31/2018) | |
| Original Term: | 120 months | Most Recent NOI (As of): | $5,555,741 (TTM 1/31/2019) | |
| Original Amortization Term: | None | UW Occupancy / ADR / RevPAR: | 82.4% / $177.08 / $145.90 | |
| Amortization Type: | Interest Only | UW Revenues: | $16,182,736 | |
| Call Protection: | L(26),Def(90),O(4) | UW Expenses: | $10,601,013 | |
| Lockbox / Cash Management: | Springing | UW NOI: | $5,581,723 | |
| Additional Debt: | N/A | UW NCF: | $4,772,586 | |
| Additional Debt Balance: | N/A | Appraised Value / Per Room(4): | $69,400,000 / $294,068 | |
| Additional Debt Type: | N/A | Appraisal Date(4): | 1/15/2019 | |
| Escrows and Reserves(1) | Financial Information | ||||||
| Initial | Monthly | Initial Cap | Cut-off Date Loan / Room: | $179,131 | |||
| Taxes: | $394,304 | $78,861 | N/A | Maturity Date Loan / Room: | $179,131 | ||
| Insurance: | $0 | Springing | N/A | Cut-off Date LTV(4): | 60.9% | ||
| FF&E(2): | $2,346,912 | 5% of Gross Revenues | N/A | Maturity Date LTV(4): | 60.9% | ||
| Other(3): | $1,497,688 | Springing | $200,000 | UW NCF DSCR: | 2.29x | ||
| UW NOI Debt Yield: | 13.2% | ||||||
| Sources and Uses | |||||||
| Sources | Proceeds | % of Total | Uses | Proceeds | % of Total | ||
| Mortgage Loan | $42,275,000 | 58.7% | Purchase Price | $66,365,000 | 92.2% | ||
| Sponsor Equity | 29,743,140 | 41.3 | Upfront Reserves | 4,238,904 | 5.9 | ||
| Closing Costs | 1,414,237 | 2.0 | |||||
| Total Sources | $72,018,140 | 100.0% | Total Uses | $72,018,140 | 100.0% | ||
| (1) | For a full description of Escrows and Reserves, please refer to “Escrows and Reserves” below. |
| (2) | FF&E reserve is comprised of a $1,202,312 capital expenditure reserve and a $1,144,600 FF&E reserve. |
| (3) | Other reserve is comprised of a $1,000,000 East Entrance Contingency Reserve, a $200,000 seasonality reserve and $297,688 of immediate repairs. The springing $22,222 monthly amount represents the monthly ongoing amount for the seasonality reserve. The borrowers are required to deposit $22,222 on each payment date during the months of January through June and October through December into the seasonality reserve subject to a cap of $200,000. |
| (4) | The appraised value is based on an “As-Is” value with an extraordinary assumption that $2,644,600 is reserved to fund capital improvements for the hotel. At origination, the borrowers reserved $1,202,312 for capital expenditures, $1,144,600 for FF&E, and $297,688 for immediate repairs, collectively totaling $2,644,600. The “As-Is” value of the Renaissance Fort Lauderdale Property (as defined below) without the extraordinary assumption regarding the reserves was $66,700,000. The Cut-off Date LTV and the Maturity Date LTV based on the “As-Is” value without the extraordinary assumption are 63.4% and 63.4%, respectively. |
THE INFORMATION IN THIS STRUCTURAL AND COLLATERAL TERM SHEET IS NOT COMPLETE AND MAY BE AMENDED PRIOR TO THE TIME OF SALE. THIS TERM SHEET IS NOT AN OFFER TO SELL THESE SECURITIES AND IT IS NOT A SOLICITATION OF AN OFFER TO BUY THESE SECURITIES IN ANY JURISDICTION WHERE THE OFFER OR SALE IS NOT PERMITTED.
80
| Structural and Collateral Term Sheet | BBCMS 2019-C3 | |
| No. 5 – Renaissance Fort Lauderdale | ||
The Loan.TheRenaissance Fort Lauderdaleloanhas an outstanding principal balance as of the Cut-off Date of $42.275 million and is secured by a first mortgage lien on the borrowers’ fee interest in a 236-room, full service hotel located in Fort Lauderdale, Florida. The loan has a 10-year term and is interest-only for the entire loan term (the “Renaissance Fort Lauderdale Mortgage Loan”).
The Property.The Renaissance Fort Lauderdale propertyis a 12-story, 236-room full service hotel located in Fort Lauderdale, Florida (the “Renaissance Fort Lauderdale Property”). The Renaissance Fort Lauderdale Property was built in 2001 and most recently renovated in 2016. The Renaissance Fort Lauderdale Property includes 130 king rooms, 94 queen/queen rooms, 11 junior suites, and one presidential suite. Guestroom amenities include an entertainment console with a 49-inch flat panel television, a work desk and chair, and high speed internet. Suites feature living spaces with a sleeper sofa. Amenities at the Renaissance Fort Lauderdale Property include a restaurant, a lounge, a coffee bar, an outdoor swimming pool and whirlpool, a fitness center, a concierge lounge, an Avis rental car counter, a business center, and 12,838 square feet of meeting space. The Renaissance Fort Lauderdale Property offers 313 parking spaces with valet parking options available. The Renaissance Fort Lauderdale Property also includes three retail spaces leased to Re/Max, BBI, and Fresh First.
In 2014, $7.8 million was spent on guestroom renovations at the Renaissance Fort Lauderdale Property, which represents approximately $33,051 per room. The guestroom renovations included refurbished case goods, new carpet, window treatments, lighting fixtures and artwork. In 2016, approximately $5.0 million was spent on capital expenditures for common areas, the lobby, meeting spaces and food and beverage outlets. According to the borrower sponsor, there has been $850,000 spent on general upkeep, HVAC systems and a newly painted exterior over the past few years. In total, approximately $13.3 million was invested in the Renaissance Fort Lauderdale Property since 2014, which represents approximately $56,252 per room. Although there will not be a change-in-ownership property improvement plan in connection with the new franchise agreement, the borrowers anticipate a property improvement plan required by Marriott International, Inc. at the end of 2021. See the PIP reserve description in “Escrows and Reserves” for further details. The borrowers are expecting to invest approximately $2.64 million in the near term on guest room updates, common area upgrades, and exterior enhancements. Such amounts were reserved as part of the upfront capital expenditures reserve, the FF&E reserve and the immediate repair reserve.
Environmental. According to a Phase I environmental assessment dated January 11, 2019, there was no evidence of any recognized environmental conditions at the Renaissance Fort Lauderdale Property.
The Market.The Renaissance Fort Lauderdale Property is located in Fort Lauderdale, Florida, within a commercial area including numerous restaurants, office buildings, hotels, a major port, a convention center and retail shopping centers. The Renaissance Fort Lauderdale Property is located within walking distance from Port Everglades cruise terminal, the second largest cruise port in the world, which services 15 cruise lines and over 50 ships that accommodate more than 4.0 million passengers annually. In addition to its cruise industry, Port Everglades is a petroleum storage and distribution hub and bulk cargo depot. According to the appraisal, Port Everglades is amid a $1.6 billion capital improvement program to improve productivity for cargo, cruise and petroleum businesses. According to the appraisal, economic activity at Port Everglades is estimated to be nearly $30 billion annually and is associated with over 230,000 jobs. Additionally, the 600,000 square-foot Broward County Convention Center is located less than a half mile away from the Renaissance Fort Lauderdale Property, which hosts numerous conventions, trade shows, meetings, consumer shows, sporting competitions and other large events. According to the appraisal, the Broward Convention Center is currently expanding by approximately 500,000 square feet, which is expected to generate an additional annual economic impact of $100 million. The Renaissance Fort Lauderdale Property is also located in close proximity to Fort Lauderdale’s public beaches, including the Fort Lauderdale Beach Park which is approximately two miles from the Renaissance Fort Lauderdale Property.
The Fort Lauderdale Hollywood International Airport is located approximately three miles from the Renaissance Fort Lauderdale Property. According to the appraisal, the airport is currently undergoing a $3.2 billion capital improvement program, which is scheduled to be completed in 2022. The largest aspects of the capital improvement include $826 million of runway expansions, $500 million of terminal renovations and $390 million of terminal expansion. According to the appraisal, 28 new routes were added to the Fort Lauderdale Hollywood International Airport in 2017, 10 were added in 2018 and additional routes are expected to be added due to airport renovations. The Renaissance Fort Lauderdale Property is also located approximately three miles northwest of the Fort Lauderdale stop on the Brightline, a high-speed rail system
THE INFORMATION IN THIS STRUCTURAL AND COLLATERAL TERM SHEET IS NOT COMPLETE AND MAY BE AMENDED PRIOR TO THE TIME OF SALE. THIS TERM SHEET IS NOT AN OFFER TO SELL THESE SECURITIES AND IT IS NOT A SOLICITATION OF AN OFFER TO BUY THESE SECURITIES IN ANY JURISDICTION WHERE THE OFFER OR SALE IS NOT PERMITTED.
81
| Structural and Collateral Term Sheet | BBCMS 2019-C3 | |
| No. 5 – Renaissance Fort Lauderdale | ||
with service between Miami and West Palm Beach that became operational in January 2018. The Brightline is currently in its second phase of construction, which will extend service from West Palm Beach to Orlando.
The primary competitive set for the Renaissance Fort Lauderdale Property consists of four hotels, which range in size from 252 to 589 rooms and collectively contain an aggregate of 1,683 rooms.
| Historical Occupancy, ADR, RevPAR | |||||||||
| Competitive Set(1) | Renaissance Fort Lauderdale(2) | Penetration Factor(3) | |||||||
| Year | Occupancy | ADR | RevPAR | Occupancy | ADR | RevPAR | Occupancy | ADR | RevPAR |
| 2016 | 72.4% | $161.96 | $117.30 | 80.1% | $166.99 | $133.76 | 110.6% | 103.1% | 114.0% |
| 2017 | 76.0% | $164.68 | $125.18 | 84.5% | $170.54 | $144.07 | 111.2% | 103.6% | 115.1% |
| 2018 | 80.8% | $167.96 | $135.70 | 82.6% | $178.02 | $147.11 | 102.2% | 106.0% | 108.4% |
| TTM(4) | 81.4% | $167.82 | $136.63 | 82.4% | $177.08 | $145.90 | 101.2% | 105.5% | 106.8% |
| (1) | Data provided by an industry travel research provider. The competitive set contains the following properties: B Ocean Fort Lauderdale, Pier Sixty Six Hotel & Marina, Hilton FortLauderdale Marina, and Embassy Suites by Hilton Fort Lauderdale 17th Street. |
| (2) | Information is obtained from the borrowers. |
| (3) | Penetration Factor is calculated based on data provided by an industry travel research provider for the competitive set and information obtained from the borrowers for the Renaissance Fort Lauderdale Property. |
| (4) | TTM representsthe trailing 12-month period ending on January 31, 2019. |
| Competitive Hotels Profile(1) | |||||||
| 2018 Estimated Market Mix | 2018 Estimated Operating Statistics | ||||||
| Property | Rooms | Leisure | Meeting & Group | Commercial | Occ. | ADR | RevPAR |
| Renaissance Fort Lauderdale(2) | 236 | 55% | 30% | 15% | 82.4% | $177.08 | $145.90 |
| B Ocean Resort Fort Lauderdale | 481 | 60% | 30% | 10% | 70 - 75% | $160 - $170 | $115 - $120 |
| Embassy Suites by Hilton Fort Lauderdale 17th Street | 361 | 50% | 30% | 20% | 85 - 90% | $180 - $190 | $160 - $170 |
| Hilton Fort Lauderdale Marina | 589 | 55% | 30% | 15% | 80 - 85% | $160 - $170 | $130 - $140 |
| Pier Sixty-Six Hotel & Marina | 252 | 55% | 30% | 15% | 80 - 85% | $170 - $180 | $130 - $140 |
| Total(3) | 1,683 | ||||||
| (1) | Based on the appraisal, except for the 2018 Estimated Operating Statistics for Renaissance Fort Lauderdale, which are based on the actual operating statements provided by the borrowers. |
| (2) | Occupancy, ADR and RevPAR for the Renaissance Fort Lauderdale Property are based on the actual TTM January 2019 figures. |
| (3) | Excludes the Renaissance Fort Lauderdale Property. |
THE INFORMATION IN THIS STRUCTURAL AND COLLATERAL TERM SHEET IS NOT COMPLETE AND MAY BE AMENDED PRIOR TO THE TIME OF SALE. THIS TERM SHEET IS NOT AN OFFER TO SELL THESE SECURITIES AND IT IS NOT A SOLICITATION OF AN OFFER TO BUY THESE SECURITIES IN ANY JURISDICTION WHERE THE OFFER OR SALE IS NOT PERMITTED.
82
| Structural and Collateral Term Sheet | BBCMS 2019-C3 | |
| No. 5 – Renaissance Fort Lauderdale | ||
| Operating History and Underwritten Net Cash Flow | |||||||
| 2016 | 2017 | 2018 | TTM(1) | Underwritten | Per Room(2) | % of Total Revenue(3) | |
| Occupancy | 80.1% | 84.5% | 82.6% | 82.4% | 82.4% | ||
| ADR | $166.99 | $170.54 | $178.02 | $177.08 | $177.08 | ||
| RevPAR | $133.76 | $144.07 | $147.11 | $145.90 | $145.90 | ||
| Room Revenue | $11,553,634 | $12,410,062 | $12,672,440 | $12,567,481 | $12,567,481 | $53,252 | 77.7% |
| Food & Beverage Revenue | 2,376,504 | 2,928,970 | 2,835,201 | 2,856,085 | 2,856,085 | 12,102 | 17.6 |
| Other Departmental Revenue | 916,823 | 810,047 | 777,506 | 759,170 | 759,170 | 3,217 | 4.7 |
| Total Revenue | $14,846,961 | $16,149,079 | $16,285,147 | $16,182,736 | $16,182,736 | $68,571 | 100.0% |
| Room Expense | $2,734,195 | $2,822,894 | $2,881,908 | $2,865,432 | $2,865,432 | $12,142 | 22.8% |
| Food & Beverage Expense | 1,620,653 | 1,821,497 | 1,847,560 | 1,849,182 | 1,849,182 | 7,836 | 64.7 |
| Other Departmental Expenses | 124,839 | 117,933 | 116,643 | 115,930 | 115,930 | 491 | 15.3 |
| Departmental Expenses | $4,479,687 | $4,762,324 | $4,846,111 | $4,830,544 | $4,830,544 | $20,468 | 29.8% |
| Departmental Profit | $10,367,274 | $11,386,755 | $11,439,036 | $11,352,192 | $11,352,192 | $48,103 | 70.2% |
| Operating Expenses | $4,225,170 | $4,389,253 | $4,269,581 | $4,220,834 | $4,050,603 | $17,164 | 25.0% |
| Gross Operating Profit | $6,142,104 | $6,997,502 | $7,169,455 | $7,131,358 | $7,301,589 | $30,939 | 45.1% |
| Management Fees | $441,703 | $481,888 | $484,437 | $481,091 | $485,482 | $2,057 | 3.0% |
| Property Taxes | 925,747 | 976,435 | 950,294 | 943,416 | 1,061,193 | 4,497 | 6.6 |
| Property Insurance | 217,233 | 211,863 | 145,593 | 151,110 | 173,191 | 734 | 1.1 |
| Total Other Expenses | $1,584,683 | $1,670,186 | $1,580,324 | $1,575,617 | $1,719,866 | $7,288 | 10.6% |
| Net Operating Income | $4,557,421 | $5,327,316 | $5,589,131 | $5,555,741 | $5,581,723 | $23,651 | 34.5% |
| FF&E | 740,866 | 799,098 | 816,196 | 815,221 | 809,137 | 3,429 | 5.0 |
| Net Cash Flow | $3,816,555 | $4,528,218 | $4,772,935 | $4,740,520 | $4,772,586 | $20,223 | 29.5% |
| (1) | TTMreflects the trailing 12 month period ending January 31, 2019. |
| (2) | Per Room values are based on 236 guest rooms. |
| (3) | % of Total Revenuefor Room Expense, Food & Beverage Expense and Other Departmental Expenses is based on their corresponding revenue line item. |
The Borrowers. The borrowing entities for the Renaissance Fort Lauderdale Mortgage Loan are 17th Street Hotel, LLC and 17th Street Hotel Operations, LLC, both Delaware limited liability companies and special purpose entities with one independent director. Legal counsel to the borrowers delivered a non-consolidation opinion in connection with the origination of the Renaissance Fort Lauderdale Mortgage Loan. Howard J. Wurzak is the guarantor of certain nonrecourse carve-outs under the Renaissance Fort Lauderdale Mortgage Loan.
The Loan Sponsor.The loan sponsor is Howard J. Wurzak. Howard J. Wurzak serves as chairman and chief executive officer at Wurzak Hotel Management Corporation, an affiliate of DoveHill. DoveHill is a real estate investment company that has developed and acquired over $1 billion of institutional quality hospitality assets and is contributing 57.4% of the equity. Wurzak Hotel Management Corporation is a vertically integrated owner, developer and operator of premium-branded full service, extended stay and focus serviced hotels. Wurzak Hotel Management Corporation is a full service hospitality company with experience in many facets of the hospitality industry including site selection, construction management, franchise affiliation, capital markets, and management of hotels. The group is also a participant in the food and beverage and catering service industries. Wurzak Hotel Management Corporation’s current projects include ten hotels in Florida, Pennsylvania, New Jersey and Virginia. Though not a nonrecourse guarantor, Starwood Capital will be contributing 42.6% of the total equity through an affiliate.
Property Management.The Renaissance Fort Lauderdale Property is managed by JCB Management Company, LLC, an affiliate of the borrower sponsor.
Franchise Agreement. The borrowers entered into a franchise agreement for the Renaissance Fort Lauderdale Property with Marriott International, Inc. The current franchise agreement is effective as of March 13, 2019 for a term of 20 years, with an expiration date of March 13, 2039. Among other fees, the franchise agreement requires payment of a program fee equal to 5.0% of gross room sales and a marketing fund contribution of 1.5% of gross room sales.
THE INFORMATION IN THIS STRUCTURAL AND COLLATERAL TERM SHEET IS NOT COMPLETE AND MAY BE AMENDED PRIOR TO THE TIME OF SALE. THIS TERM SHEET IS NOT AN OFFER TO SELL THESE SECURITIES AND IT IS NOT A SOLICITATION OF AN OFFER TO BUY THESE SECURITIES IN ANY JURISDICTION WHERE THE OFFER OR SALE IS NOT PERMITTED.
83
| Structural and Collateral Term Sheet | BBCMS 2019-C3 | |
| No. 5 – Renaissance Fort Lauderdale | ||
Escrows and Reserves.At origination, the borrowers deposited into escrow $297,688 for immediate repairs, $394,304 for real estate taxes, $1,202,312 for capital expenditures, $1,144,600 for FF&E, $1,000,000 into an East Entrance Contingency Reserve and $200,000 for a seasonality reserve.
Tax Escrows– On a monthly basis, the borrowers are required to escrow 1/12th of the annual estimated tax payments, which is currently $78,861.
Insurance Escrows – The requirement for the borrowers to make monthly deposits to the insurance escrow is waived so long as no event of default has occurred and is continuing and the Renaissance Fort Lauderdale Property is insured under a blanket insurance policy in accordance with the Renaissance Fort Lauderdale Mortgage Loan documents.
FF&E Reserves – On a monthly basis, the borrowers are required to deposit an amount equal to 1/12 of 5.0% of gross revenues for the hotel related operations at the Renaissance Fort Lauderdale Property for the immediately preceding calendar year as determined by the lender, which is currently approximately $67,428 or such amount as required by the franchise agreement.
Seasonality Reserves –The borrower is required to make seasonality reserve payments in the amount of approximately $22,222 in the months of January, February, March, April, May, June, October, November and December up to an amount capped at $200,000.
East Entrance Contingency Reserve –The borrowers were required to deposit $1,000,000 into an East Entrance Contingency Reserve at origination. The Renaissance Fort Lauderdale Property benefits from pedestrian and vehicular access of a private road on its western border pursuant to easements granted under a certain declaration with neighboring parcel owners affecting the Renaissance Fort Lauderdale Property. Such primary entrance easements will expire by their terms of the declaration in June 2022. The balance of the East Entrance Contingency Reserve will be released to the borrowers upon the earlier to occur of: (i) extension of the term of the 2022 access easements on the west side of the Renaissance Fort Lauderdale Property to an expiration date no earlier than June 1, 2042 or (ii) construction and completion of the following conditions to the approved east entrance improvements: (a) lender’s receipt of evidence of a third party inspection acceptable to the lender including certificates from appropriate building authorities, payment of contractors, compliance with legal requirements and a title insurance endorsement, (b) amounts due for all labor and materials have been paid in full, (c) the debt yield, debt service coverage ratio, and RevPAR being greater than the values of such metrics on the closing date or the date immediately prior to the commencement of the approved east entrance improvements, (d) no event of default will have occurred or be continuing under any of the Renaissance Fort Lauderdale Mortgage Loan documents, and (e) the borrowers’ reimbursement of all lender’s costs and expenses incurred due to the approved east entrance improvements and the East Entrance Contingency Reserve Fund. If the borrowers fail to either extend the term of the easements to June 2042 or build the approved alternative access on or prior to March 1, 2022, the Renaissance Fort Lauderdale Mortgage Loan will become recourse to the borrowers capped at an amount equal to $8,455,000 less any amounts remaining in the East Entrance Contingency Reserve fund.
PIP Reserve Fund – Under the Renaissance Fort Lauderdale Mortgage Loan documents, the borrowers and lender acknowledged that certain repairs and property improvements will be required in the future (expected at the end of 2021) under the franchise agreement (“Scope Work”). The borrowers are required to submit a property improvement plan budget for lender approval within 90 days of receiving the final property improvement plan from the franchisor. Upon lender approval, the borrowers will be required to deposit in a PIP Reserve Fund either cash or a letter of credit equal to the Scope Work Shortfall (as defined below) prior to the Scope Work Funding Due Date (as defined below). The “Scope Work Funding Due Date” is the date that is the later of (i) 24 months prior to the date that the Scope Work is required to be completed under the property improvement plan or (ii) 30 days after the date that the lender approves the property improvement plan budget. The “Scope Work Shortfall” is the amount equal to the difference between (i) the completion cost of the Scope Work as estimated by the borrowers in the budget approved by the lender and (ii) the sum of (x) all amounts then held by the lender in the FF&E Reserve and (y) the lesser of (A) 5% of the projected gross income from operations of the Renaissance Fort Lauderdale Property for the next 12 payment dates and (B) the actual amount of funds collected in the FF&E Reserve for the prior 12 month period. Additionally, any Scope Work Shortfall will become a recourse liability of the borrowers.
THE INFORMATION IN THIS STRUCTURAL AND COLLATERAL TERM SHEET IS NOT COMPLETE AND MAY BE AMENDED PRIOR TO THE TIME OF SALE. THIS TERM SHEET IS NOT AN OFFER TO SELL THESE SECURITIES AND IT IS NOT A SOLICITATION OF AN OFFER TO BUY THESE SECURITIES IN ANY JURISDICTION WHERE THE OFFER OR SALE IS NOT PERMITTED.
84
| Structural and Collateral Term Sheet | BBCMS 2019-C3 | |
| No. 5 – Renaissance Fort Lauderdale | ||
Lockbox / Cash Management. The Renaissance Fort Lauderdale Mortgage Loan is structured with a springing lockbox and springing cash management. The Renaissance Fort Lauderdale Mortgage Loan documents require that, upon the first occurrence of a Trigger Period (as defined below), all gross income from operations, all forfeited security deposits and all other revenue of any kind from the Renaissance Fort Lauderdale Property will be deposited into a lockbox account under control of the lender. Upon the occurrence and continuance of a Trigger Period, all funds in the lockbox account are required to be swept daily into a cash management account under the control of the lender to be applied and disbursed in accordance with the Renaissance Fort Lauderdale Mortgage Loan documents and all excess cash flow funds remaining after such disbursement are required to be held by the lender in an excess cash flow reserve account. To the extent that no Cash Sweep Period (as defined below) has occurred and is continuing, all excess cash flow funds will be disbursed to the borrowers.
A “Trigger Period” will commence upon the earliest of (i) an event of default, (ii) the debt service coverage ratio being less than 1.20x based on a 30-year amortization schedule (approximately 1.54x based on the interest only debt service), and (iii) the occurrence of a Cash Sweep Trigger Event (as defined below). A Trigger Period will end upon, with regard to clause (i), the lender’s acceptance of the cure of such event of default; with regard to clause (ii), the debt service coverage ratio being greater than or equal to 1.20x based on a 30-year amortization schedule; and with respect to clause (iii) above, the occurrence of the corresponding Cash Sweep Cure (as defined below).
A “Cash Sweep Period” will commence upon the earliest of (i) an event of default, (ii) the insolvency of the borrowers, (iii) the insolvency of the manager, (iv) the debt service coverage ratio being less than 1.20x based on a 30-year amortization schedule for two consecutive quarters, and (v) the commencement of a PIP Delinquency Period (as defined below) (each a “Cash Sweep Trigger Event”). A Cash Sweep Period will end, with respect to clause (i) above, the cure of such event of default; with respect to clause (ii) above, the cash sweep period cannot be cured; with respect to clause (iii) above, a qualified manager assuming management under a replacement management agreement; with respect to clause (iv) above, the debt service coverage ratio being greater than or equal to 1.20x based on a 30-year amortization schedule for two consecutive calendar quarters; and with respect to clause (v) above, the end of such PIP Delinquency Period (each a “Cash Sweep Cure”).
A “PIP Delinquency Period” will commence upon the borrowers not completing or paying in full for all requirements pursuant to any property improvement plan under the franchise agreement prior to the deadline for such property improvement plan. The PIP Delinquency Period will end upon the borrowers’ compliance with the property improvement plan.
Subordinate and Mezzanine Debt. None.
Partial Release and Partial Defeasance. The borrowers have the right to partially release the parking garage outparcel from the Renaissance Fort Lauderdale Mortgage Loan if certain conditions are met, including but not limited to (i) no event of default has occurred or is continuing, (ii) (a) in the case of a partial release, a payment equal to 115% of the then-current appraised value of the parking garage outparcel, or (b) in the case of a partial defeasance, the payment of the partial defeasance deposit, in an amount sufficient to purchase the related partial defeasance collateral, (iii) (a) before and on the payment date in June 2021, payment of the yield maintenance garage release premium and (b) after the payment date in June 2021, replacement defeasance collateral, (iv) the debt yield and debt service coverage ratio being greater than or equal to the debt yield and debt service coverage ratio both on the origination date and immediately prior to such release, (v) the loan-to-value ratio being less than or equal to the loan-to-value ratio at origination and immediately prior to such release, (vi) the borrowers entering into a reciprocal access agreement that grants access to at least 314 parking spaces in the parking garage outparcel, (vii) during any construction of a new garage on the parking garage outparcel, the borrowers escrowing any parking, leasing or valet costs and entering into a temporary parking agreement for 314 spaces within a half mile of the Renaissance Fort Lauderdale Property, (viii) the guarantor entering into a completion guaranty for the construction of the new garage on the parking garage outparcel, (ix) delivery of a REMIC opinion, (x) delivery of rating agency confirmation, (xi) delivery of a deed conveying a restrictive covenant that prohibits a hotel from being constructed on the parking garage outparcel, (xii) either (a) extension of the term of the 2022 access easements on the west side of the Renaissance Fort Lauderdale Property to an expiration date no earlier than June 1, 2042 or (b) completion of the approved east entrance improvements in conformance with the terms of the Renaissance Fort Lauderdale Mortgage Loan documents, and (xiii) confirmation that the ratio of the unpaid principal balance of the Renaissance Fort Lauderdale Mortgage Loan to the value of the remaining Renaissance Fort Lauderdale Property is equal to or less than 125%.
Ground Lease. None.
THE INFORMATION IN THIS STRUCTURAL AND COLLATERAL TERM SHEET IS NOT COMPLETE AND MAY BE AMENDED PRIOR TO THE TIME OF SALE. THIS TERM SHEET IS NOT AN OFFER TO SELL THESE SECURITIES AND IT IS NOT A SOLICITATION OF AN OFFER TO BUY THESE SECURITIES IN ANY JURISDICTION WHERE THE OFFER OR SALE IS NOT PERMITTED.
85
| Structural and Collateral Term Sheet | BBCMS 2019-C3 | |
| No. 6 – ATRIA Corporate Center | ||

THE INFORMATION IN THIS STRUCTURAL AND COLLATERAL TERM SHEET IS NOT COMPLETE AND MAY BE AMENDED PRIOR TO THE TIME OF SALE. THIS TERM SHEET IS NOT AN OFFER TO SELL THESE SECURITIES AND IT IS NOT A SOLICITATION OF AN OFFER TO BUY THESE SECURITIES IN ANY JURISDICTION WHERE THE OFFER OR SALE IS NOT PERMITTED.
86
| Structural and Collateral Term Sheet | BBCMS 2019-C3 | |
| No. 6 – ATRIA Corporate Center | ||

THE INFORMATION IN THIS STRUCTURAL AND COLLATERAL TERM SHEET IS NOT COMPLETE AND MAY BE AMENDED PRIOR TO THE TIME OF SALE. THIS TERM SHEET IS NOT AN OFFER TO SELL THESE SECURITIES AND IT IS NOT A SOLICITATION OF AN OFFER TO BUY THESE SECURITIES IN ANY JURISDICTION WHERE THE OFFER OR SALE IS NOT PERMITTED.
87
| Structural and Collateral Term Sheet | BBCMS 2019-C3 | |
| No. 6 – ATRIA Corporate Center | ||

THE INFORMATION IN THIS STRUCTURAL AND COLLATERAL TERM SHEET IS NOT COMPLETE AND MAY BE AMENDED PRIOR TO THE TIME OF SALE. THIS TERM SHEET IS NOT AN OFFER TO SELL THESE SECURITIES AND IT IS NOT A SOLICITATION OF AN OFFER TO BUY THESE SECURITIES IN ANY JURISDICTION WHERE THE OFFER OR SALE IS NOT PERMITTED.
88
| Structural and Collateral Term Sheet | BBCMS 2019-C3 | |
| No.6 – ATRIA Corporate Center | ||
| Mortgage Loan Information | Property Information | |||
| Mortgage Loan Seller: | Barclays | Single Asset / Portfolio: | Single Asset | |
| Original Principal Balance: | $41,250,000 | Title: | Fee | |
| Cut-off Date Principal Balance: | $41,250,000 | Property Type – Subtype: | Office – Suburban | |
| % of IPB: | 4.4% | Net Rentable Area (SF): | 360,047 | |
| Loan Purpose: | Acquisition | Location: | Plymouth, MN | |
| Borrower: | Pembroke TCM Atria LLC | Year Built / Renovated: | 1985 / 2017 | |
| Borrower Sponsors: | Ten Capital Management, Pembroke IV LLC | Occupancy(3): | 99.7% | |
| Interest Rate: | 4.89500% | Occupancy Date: | 10/1/2018 | |
| Note Date: | 3/14/2019 | 4th Most Recent NOI (As of): | $3,556,442 (12/31/2016) | |
| Maturity Date: | 4/6/2029 | 3rd Most Recent NOI (As of): | $3,961,750 (12/31/2017) | |
| Interest-only Period: | 24 months | 2nd Most Recent NOI (As of)(4): | $4,518,508 (12/31/2018) | |
| Original Term: | 120 months | Most Recent NOI (As of)(5): | NAV | |
| Original Amortization Term: | 360 months | UW Economic Occupancy: | 89.5% | |
| Amortization Type: | IO-Balloon | UW Revenues: | $9,023,275 | |
| Call Protection: | L(26),Def(89),O(5) | UW Expenses: | $4,022,076 | |
| Lockbox / Cash Management: | Hard / Springing | UW NOI(4): | $5,001,200 | |
| Additional Debt: | No | UW NCF: | $4,323,248 | |
| Additional Debt Balance: | N/A | Appraised Value / Per SF: | $57,600,000 / $160 | |
| Additional Debt Type: | N/A | Appraisal Date: | 11/15/2018 | |
| Escrows and Reserves(1) | Financial Information | ||||||||
| Initial | Monthly | Initial Cap | Cut-off Date Loan / SF: | $115 | |||||
| Taxes: | $140,006 | $140,006 | N/A | Maturity Date Loan / SF: | $99 | ||||
| Insurance: | $0 | Springing | N/A | Cut-off Date LTV: | 71.6% | ||||
| Replacement Reserves: | $0 | $6,001 | N/A | Maturity Date LTV: | 61.8% | ||||
| TI/LC: | $1,900,000 | $45,006 | $3,000,000 | UW NCF DSCR: | 1.65x | ||||
| Other: | $4,711,321 | Springing | Various | UW NOI Debt Yield: | 12.1% | ||||
| Sources and Uses | |||||||||
| Sources | Proceeds | % of Total | Uses | Proceeds | % of Total | ||||
| Mortgage Loan | $41,250,000 | 64.1% | Purchase Price | $55,500,000 | 86.3% | ||||
| Sponsor Equity | 18,546,959 | 28.8 | Upfront Reserves | 6,751,327 | 10.5 | ||||
| Other Sources(2) | 4,545,658 | 7.1 | Closing Costs | 2,091,290 | 3.3 | ||||
| Total Sources | $64,342,617 | 100.0% | Total Uses | $64,342,617 | 100.0% | ||||
| (1) | For a full description of Escrows and Reserves, please refer to the “Escrow and Reserves” section below. |
| (2) | Other Sources reflects purchaser credits of $2,590,065 for outstanding leasing costs related to Daikin, $1,791,411 for outstanding tenant improvement costs, and $164,182 for a rent abatement credit related to Travel Leaders. |
| (3) | Current Occupancy includes Daikin, who has an executed lease for 49,563 square feet and will be occupying their space in two phases beginning in August 2019. |
| (4) | The increase in NOI from 2018 to UW is driven by the new lease executed with Daikin accounting for $892,134 in base rent and $568,926 of reimbursement income. Additionally, Covidien Medtronic’s rent is being straight-line averaged through its lease term resulting in a $18,697 increase over in-place rent. |
| (5) | TTM financials were not available for the ATRIA Corporate Center Property. |
The Loan.The ATRIA Corporate Center mortgage loan is secured by a first lien mortgage on the borrower’s fee interest in a 360,047 square foot office property located in Plymouth, Minnesota. The ATRIA Corporate Center mortgage loan was originated by Barclays and has an outstanding principal balance as of the Cut-off Date of $41.25 million (the “ATRIA Corporate Center Mortgage Loan”). The ATRIA Corporate Center Mortgage Loan has a 10-year term and is interest-only for the first 24 months of the term followed by a 30-year amortization schedule.
THE INFORMATION IN THIS STRUCTURAL AND COLLATERAL TERM SHEET IS NOT COMPLETE AND MAY BE AMENDED PRIOR TO THE TIME OF SALE. THIS TERM SHEET IS NOT AN OFFER TO SELL THESE SECURITIES AND IT IS NOT A SOLICITATION OF AN OFFER TO BUY THESE SECURITIES IN ANY JURISDICTION WHERE THE OFFER OR SALE IS NOT PERMITTED.
89
| Structural and Collateral Term Sheet | BBCMS 2019-C3 | |
| No.6 – ATRIA Corporate Center | ||
The Property. ATRIA Corporate Center is a five-story, Class A suburban office building located on a 19.00-acre parcel in Plymouth, Minnesota totaling 360,047 square feet (the “ATRIA Corporate Center Property”). The ATRIA Corporate Center Property contains 1,327 parking spaces, including 347 surface spaces, 85 underground garage spaces, and 895 parking deck spaces, resulting in a ratio of 3.7 spaces per 1,000 square feet. The ATRIA Corporate Center Property was built in 1985 and renovated in 2017. According to the borrower sponsors, since late 2016, approximately $1.6 million was invested in the ATRIA Corporate Center Property to renovate the lobby, provide parking lot updates, and to fund other minor building upgrades. Amenities at the ATRIA Corporate Center Property include a full cafeteria, complementary coffee bar, fitness center with locker rooms and showers, and a training center. According to the borrower, and in addition to the most recent upgrades, approximately $3.5 million has been invested in overall base building upgrades since 2010. The ATRIA Corporate Center Property contains 75,000 square foot floor plates, which are the largest for any Class A office building in the overall Twin Cities markets. The ATRIA Corporate Center Property is LEED Gold Certified and has received Energy Star designation annually since 2007. The building was also awarded a Building Owners and Managers Association 360 designation.
As of October 1, 2018, the ATRIA Corporate Center Property was 99.7% leased to 21 tenants. The largest tenant, The Mosaic Company (Moody’s/S&P/Fitch: Baa3/BBB-/BBB- and NYSE: MOS), leases 21.4% of the net rentable area through March 2022 and has been located at the ATRIA Corporate Center Property since 2005. The Mosaic Company renewed their lease in 2014 and expanded to an additional 1,697 square feet in November 2016. The ATRIA Corporate Center Property serves as the company’s main headquarters. The Mosaic Company produces and distributes crop nutrients to the agricultural communities located in North America and globally. The company offers products including concentrated phosphates and potash, both are used as crop nutrition and as input to animal feed. The company accounts for approximately 75% of the annual phosphate production and nearly 40% of potash production in North America. The company mines phosphate rock from almost 200,000 acres of company-owned land in Central Florida and mines potash from four mines in New Mexico and Canada. The company employs nearly 9,000 people in six countries. Through the third quarter of 2018, The Mosaic Company had year-to-date net earnings of $358 million and an adjusted EBITDA of $1.4 billion, up 71% compared to the same period in 2017. The Mosaic Company has indicated its intentions to downsize its staff from approximately 136 staffers to 85 through year-end 2019 and will be retaining commercial, finance, tax and legal functions at the ATRIA Corporate Center Property. The potential downsize was underwritten into the economic occupancy of 89.5% compared to the physical occupancy of 99.7%.
The second largest tenant, Covidien Medtronic (S&P: A), leases 20.8% of the net rentable area through November 2021. Covidien Medtronic has been a tenant at the ATRIA Corporate Center Property since 2009 and renewed their lease in April 2016. Medtronic acquired Covidien in 2015, and Covidien is now called Medtronic Minimally Invasive Therapies Division. This group focuses on minimally invasive therapies and products including advanced energy products, gastrointestinal products, patient care products, patient monitoring products, respiratory products, and surgical products. The company houses members of its Minimally Invasive Therapies division, as well as a diabetes-focused unit, a small lab area, and some training and human resources functions, at the ATRIA Corporate Center Property. For the fiscal year 2018, Covidien Medtronic had $30 billion in total revenue, with $8.7 billion coming from their Minimally Invasive Therapies Division.
The third largest tenant, Daikin, leases 13.8% of the net rentable area through May 2027. Daikin recently executed their lease and is expected to take occupancy at the ATRIA Corporate Center Property in two phases. Phase I includes 29,735 square feet of the space, which is expected to commence in August 2019, and Phase II includes the remaining 19,828 square feet of the space, which is expected to commence in February 2020. Headquartered in Japan, Daikin manufactures, distributes, and sells air-conditioning and refrigeration equipment and chemical products. It sells its products in over 150 countries with over 90 worldwide production bases. All outstanding tenant improvements and leasing commissions, free rent and gap rent has been reserved upfront for the Daikin space. See the “Escrows and Reserves” section for further details.
Environmental. According to a Phase I environmental assessment dated November 20, 2018, there was no evidence of any recognized environmental conditions at the ATRIA Corporate Center Property.
THE INFORMATION IN THIS STRUCTURAL AND COLLATERAL TERM SHEET IS NOT COMPLETE AND MAY BE AMENDED PRIOR TO THE TIME OF SALE. THIS TERM SHEET IS NOT AN OFFER TO SELL THESE SECURITIES AND IT IS NOT A SOLICITATION OF AN OFFER TO BUY THESE SECURITIES IN ANY JURISDICTION WHERE THE OFFER OR SALE IS NOT PERMITTED.
90
| Structural and Collateral Term Sheet | BBCMS 2019-C3 | |
| No.6 – ATRIA Corporate Center | ||
| Historical and Current Occupancy | |||
| 2015(1) | 2016(1) | 2017(1) | Current(2)(3) |
| 79.3% | 88.4% | 94.6% | 99.7% |
| (1) | Historical Occupancies are as of December 31 for each respective year. |
| (2) | Current Occupancy reflects in-place leases as of October 1, 2018 based on the underwritten rent roll. |
| (3) | The increase in occupancy is driven by the third largest tenant, executing a new lease commencing in August 2019 for 49,563 square feet. |
| Top Tenant Summary(1) | |||||||
| Tenant | Ratings(2) Moody’s/S&P/Fitch | Net Rentable Area (SF) | % of Total NRA | Base Rent PSF | Base Rent | % of Total Base Rent | Lease Expiration Date |
| The Mosaic Company(3) | Baa3/BBB-/BBB- | 77,013 | 21.4% | $16.50 | $1,270,715 | 21.5% | 3/31/2022 |
| Covidien Medtronic(4) | NR/A/NR | 74,788 | 20.8 | $16.25 | 1,215,305 | 20.5 | 11/30/2021 |
| Daikin(5) | NR/NR/NR | 49,563 | 13.8 | $18.00 | 892,134 | 15.1 | 5/31/2027(6) |
| Messerli & Kramer(7) | NR/NR/NR | 25,094 | 7.0 | $18.00 | 451,692 | 7.6 | 3/31/2027 |
| Cannon Technologies(8) | NR/NR/NR | 24,404 | 6.8 | $16.50 | 402,666 | 6.8 | 10/31/2024 |
| Travel Leaders(9) | NR/NR/NR | 23,895 | 6.6 | $18.00 | 430,110 | 7.3 | 9/30/2025 |
| Major Tenants / Wtd. Avg. | 274,757 | 76.3% | $16.97 | $4,662,622 | 78.7% | ||
| Other Tenants / Wtd. Avg/ | 84,289 | 23.4% | $14.95 | $1,260,357 | 21.3% | ||
| Occupied Collateral Total / Wtd. Avg. | 359,046 | 99.7% | $16.50 | $5,922,979 | 100.0% | ||
| Vacant Space | 1,001 | 0.3% | |||||
| Collateral Total | 360,047 | 100.0% | |||||
| (1) | Based on the underwritten rent roll. |
| (2) | Ratings provided are for the parent company of the entity listed in the “Tenant” field whether or not the parent company guarantees the lease. |
| (3) | The Mosaic Company has two five-year renewal options with respect to its 75,316 square-foot space. |
| (4) | Covidien Medtronic has two five-year renewal options with respect to its entire space. |
| (5) | Daikin recently executed their lease and is expected to take occupancy at the ATRIA Corporate Center Property in two phases. Phase I includes 29,735 square feet of the space, which is expected to commence in August 2019, and Phase II includes the remaining 19,828 square feet of the space, which is expected to commence in February 2020. |
| (6) | Daikin has a termination option to change the expiration date of its lease to the last day of the 64th month following the first space commencement (expected to be August 2019), upon 12 months’ notice and a termination fee equal to the sum of the unamoritzed balances of the tenant improvement work and brokerage commission amortized at an interest rate of 8%per annum from the fifth calendar month of each respective space commencement date through the lease expiration date. |
| (7) | Messerli & Kramer has two five-year renewal options with respect to its 24,205 square foot space. |
| (8) | Cannon Technologies has one five-year renewal option with respect to its entire space. |
| (9) | Travel Leaders has one five-year renewal option with respect to its entire space. |
THE INFORMATION IN THIS STRUCTURAL AND COLLATERAL TERM SHEET IS NOT COMPLETE AND MAY BE AMENDED PRIOR TO THE TIME OF SALE. THIS TERM SHEET IS NOT AN OFFER TO SELL THESE SECURITIES AND IT IS NOT A SOLICITATION OF AN OFFER TO BUY THESE SECURITIES IN ANY JURISDICTION WHERE THE OFFER OR SALE IS NOT PERMITTED.
91
| Structural and Collateral Term Sheet | BBCMS 2019-C3 | |
| No.6 – ATRIA Corporate Center | ||
| Lease Rollover Schedule(1) | |||||||||
| Year | Number of Leases Expiring | Net Rentable Area Expiring | % of NRA Expiring | Base Rent Expiring | % of Base Rent Expiring | Cumulative Net Rentable Area Expiring | Cumulative % of NRA Expiring | Cumulative Base Rent Expiring | Cumulative % of Base Rent Expiring |
| Vacant | NAP | 1,001 | 0.3% | NAP | NAP | 1,001 | 0.3% | NAP | NAP |
| 2019 & MTM(2)(3) | 0 | 6,995 | 1.9 | $34,260 | 0.6% | 7,996 | 2.2% | $34,260 | 0.6% |
| 2020(3) | 1 | 3,706 | 1.0 | 66,708 | 1.1 | 11,702 | 3.3% | $100,968 | 1.7% |
| 2021 | 2 | 87,030 | 24.2 | 1,412,401 | 23.8 | 98,732 | 27.4% | $1,513,369 | 25.6% |
| 2022 | 6 | 93,779 | 26.0 | 1,554,999 | 26.3 | 192,511 | 53.5% | $3,068,368 | 51.8% |
| 2023 | 1 | 12,278 | 3.4 | 217,321 | 3.7 | 204,789 | 56.9% | $3,285,689 | 55.5% |
| 2024 | 3 | 31,770 | 8.8 | 535,254 | 9.0 | 236,559 | 65.7% | $3,820,943 | 64.5% |
| 2025(4) | 5 | 46,342 | 12.9 | 712,164 | 12.0 | 282,901 | 78.6% | $4,533,106 | 76.5% |
| 2026 | 1 | 2,489 | 0.7 | 46,047 | 0.8 | 285,390 | 79.3% | $4,579,153 | 77.3% |
| 2027 | 2 | 74,657 | 20.7 | 1,343,826 | 22.7 | 360,047 | 100.0% | $5,922,979 | 100.0% |
| 2028 | 0 | 0 | 0.0 | 0 | 0.0 | 360,047 | 100.0% | $5,922,979 | 100.0% |
| 2029 | 0 | 0 | 0.0 | 0 | 0.0 | 360,047 | 100.0% | $5,922,979 | 100.0% |
| 2030 & Beyond | 0 | 0 | 0.0 | 0 | 0.0 | 360,047 | 100.0% | $5,922,979 | 100.0% |
| Total | 21 | 360,047 | 100.0% | $5,922,979 | 100.0% | ||||
| (1) | Based on the underwritten rent roll. |
| (2) | 2019 & MTM Net Rentable Area Expiring includes 1,413 square feet of temporary space leased to MOBE, LLC, a 1,111 square foot management office, a 2,218 square foot fitness center, and 2,253 square feet of conference rooms with no attributable underwritten base rent |
| (3) | Daikin recently executed their lease and is expected to take occupancy at the ATRIA Corporate Center Property in two phases. Phase I includes 29,735 square feet of the space, which is expected to commence in August 2019, and Phase II includes the remaining 19,828 square feet of the space, which is expected to commence in February 2020. |
| (4) | 2025 Net Rentable Area Expiring includes a 6,804 square foot cafeteria with no attributable underwritten base rent. |
| Operating History and Underwritten Net Cash Flow | ||||||
| 2016 | 2017 | 2018 | Underwritten | Per Square Foot | %(1) | |
| Rents in Place(2) | $4,166,881 | $4,360,667 | $4,777,843 | $5,922,979 | $16.45 | 59.7% |
| Vacant Income | 0 | 0 | 0 | 18,018 | 0.05 | 0.2 |
| Gross Potential Rent | $4,166,881 | $4,360,667 | $4,777,843 | $5,940,997 | $16.50 | 59.9% |
| Total Reimbursements(2) | 2,998,712 | 3,250,240 | 3,413,472 | 3,983,529 | 11.06 | 40.1 |
| Net Rental Income | $7,165,593 | $7,610,907 | $8,191,315 | $9,924,526 | $27.56 | 100.0% |
| Other Income(3) | 126,921 | 129,680 | 140,393 | 140,393 | 0.39 | 1.4 |
| (Vacancy/Credit Loss) | 0 | 0 | 0 | (1,041,643) | (2.89) | (10.5) |
| Effective Gross Income | $7,292,514 | $7,740,587 | $8,331,708 | $9,023,275 | $25.06 | 90.9% |
| Total Expenses | $3,736,072 | $3,778,837 | $3,813,200 | $4,022,076 | $11.17 | 44.6% |
| Net Operating Income(2) | $3,556,442 | $3,961,750 | $4,518,508 | $5,001,200 | $13.89 | 55.4% |
| Total TI/LC, Capex/RR | 0 | 0 | 0 | 677,951 | 1.88 | 7.5 |
| Net Cash Flow | $3,556,442 | $3,961,750 | $4,518,508 | $4,323,248 | $12.01 | 47.9% |
| (1) | % column represents percent of Net Rental Income for all revenue lines and represents percent of Effective Gross Income for the remainder of fields. |
| (2) | The increase in Rents in Place, Total Reimbursements and Net Operating Income from 2018 to Underwritten is driven by the new lease executed with Daikin accounting for $892,134 in base rent and $568,926 of reimbursement income. Additionally, Covidien Medtronic’s rent is being straight-line averaged through its lease term resulting in a $18,697 increase over in-place rent. Lastly, Underwritten Rents in Place includes contractual rent steps of $221,658 through March 2020. |
| (3) | Other Income consists of parking and storage income. |
The Market.The ATRIA Corporate Center Property is located in Plymouth, Minnesota approximately 12 miles west of the Minneapolis/St. Paul central business district. According to the appraisal, the ATRIA Corporate Center Property is located in the Minneapolis-St. Paul-Bloomington, MN-WI metropolitan area. The metropolitan area is home to 16 Fortune 500 companies, including UnitedHealth Group, Target, and Best Buy. According to the Minnesota Department of Employment and Economic Development, in 2017 total employment passed three million jobs for the first time and has maintained at
THE INFORMATION IN THIS STRUCTURAL AND COLLATERAL TERM SHEET IS NOT COMPLETE AND MAY BE AMENDED PRIOR TO THE TIME OF SALE. THIS TERM SHEET IS NOT AN OFFER TO SELL THESE SECURITIES AND IT IS NOT A SOLICITATION OF AN OFFER TO BUY THESE SECURITIES IN ANY JURISDICTION WHERE THE OFFER OR SALE IS NOT PERMITTED.
92
| Structural and Collateral Term Sheet | BBCMS 2019-C3 | |
| No.6 – ATRIA Corporate Center | ||
this level ever since. Located in suburban Hennepin County, Plymouth is a fully developed suburban community with numerous restaurants, convenience stores, and support services. The WestHealth Specialty Medical Center, a health complex that includes Abbott Northwestern Hospital, is located directly south of the ATRIA Corporate Center Property. The ATRIA Corporate Center Property is adjacent to Interstate 494, a major highway that serves the southern and western portions of the Twin Cities metro area. A Crowne Plaza and a Residence Inn by Marriott are located on the east side of Interstate 494 with accessibility to the ATRIA Corporate Center Property. Additionally, the ATRIA Corporate Center Property is located 3.7 miles from Ridgedale Regional Shopping Center, an 889,268 square foot shopping mall with over 100 tenants, including Macy’s and Nordstrom. The ATRIA Corporate Center Property is also located 7.7 miles from the Shoppes at West End, a premier shopping outlet that also includes multiple Class A apartments, a movie theater, and a Hilton hotel, as well as numerous stores and restaurants.
According to a third party report, the ATRIA Corporate Center Property is located in the Minneapolis office market and I-394 Corridor submarket. The Minneapolis office market contains 56,722,389 square feet of Class A office space, and the I-394 Corridor submarket contains 6,831,922 square feet of office space (12.0% of the region’s inventory). As of year-end 2018, the submarket had a Class A office vacancy rate of 12.7%. The Class A office quoted rental rates for the submarket are $32.48 per square foot.
The following table presents office rental data with respect to comparable office properties of the ATRIA Corporate Center Property as identified in the appraisal:
| Comparable Office Rental Summary(1) | ||||||||
| Property Name/Location | Year Built | NRA (SF) | Tenant | Lease Size (SF) | Rent PSF | Commencement | Lease Term (Years) | Lease Type |
ATRIA Corporate Center 3033 Campus Drive Plymouth, MN | 1985 | 360,047(2) | Daikin(2) | 49,563(2) | $18.00(2) | Various(3) | 6.8 - 7.3(3) | Net |
Excelsior Crossings 9350 Excelsior Blvd. Hopkins, MN | 2007 | 259,994 | Digi | 55,000 | $18.00 | February 2019 | 11.0 | Net |
The Colonnade 5500 Wayzata Blvd. Golden Valley, MN | 1988 | 357,193 | HNTB | 12,900 | $20.95 | August 2018 | 5.2 | Net |
West End Center 5100 Gamble Dr. St. Louis Park, MN | 1968/2017 | 196,708 | CoBank | 29,727 | $19.00 | August 2018 | 10.8 | Net |
West End Center 5100 Gamble Dr. St. Louis Park, MN | 1968/2017 | 196,708 | nVent | 60,000 | $19.50 | May 2018 | 10.8 | Net |
505 Waterford 505 N. Highway 169 Plymouth, MN | 1987 | 287,587 | Wealth Enhancement | 27,662 | $17.25 | May 2018 | 5.3 | Net |
Park Place West 6465 Wayzata Blvd. St. Louis Park, MN | 1983 | 198,999 | Verisque | 8,500 | $16.00 | January 2018 | 7.4 | Net |
| (1) | Source: Appraisal. |
| (2) | Based on the underwritten rent roll. |
| (3) | Daikin recently executed their lease and is expected to take occupancy at the ATRIA Corporate Center Property in two phases. Phase I includes 29,735 square feet of the space, which is expected to commence in August 2019, and Phase II includes the remaining 19,828 square feet of the space, which is expected to commence in February 2020. |
The Borrower. The borrowing entity for the ATRIA Corporate Center Mortgage Loan is Pembroke TCM Atria LLC, a Delaware limited liability company and special purpose entity with one independent director in its organizational structure. Legal counsel to the borrower delivered a non-consolidation opinion in connection with the origination of the ATRIA Corporate Center Mortgage Loan. John B. Vander Zwaag, Richard C. Hamlin, Jeffrey J. Irmer, Benjamin Adams, Pembroke IV LLC, TCM Atria GP LLC, and TCM Atria LLC are the guarantors of certain nonrecourse carve-outs under the ATRIA Corporate Center Mortgage Loan.
THE INFORMATION IN THIS STRUCTURAL AND COLLATERAL TERM SHEET IS NOT COMPLETE AND MAY BE AMENDED PRIOR TO THE TIME OF SALE. THIS TERM SHEET IS NOT AN OFFER TO SELL THESE SECURITIES AND IT IS NOT A SOLICITATION OF AN OFFER TO BUY THESE SECURITIES IN ANY JURISDICTION WHERE THE OFFER OR SALE IS NOT PERMITTED.
93
| Structural and Collateral Term Sheet | BBCMS 2019-C3 | |
| No.6 – ATRIA Corporate Center | ||
The Loan Sponsors.The ATRIA Corporate Center Mortgage Loan borrower sponsors are Ten Capital Management and Pembroke IV LLC. Pembroke IV LLC was founded in 2007 and invests in commercial real estate. John B. Vander Zwaag, the founder and chief executive officer of Pembroke IV LLC, has reports that he has completed over $3.0 billion of transactions in the United States and Canada over his 30-year career in real estate finance and investment. John B. Vander Zwaag has assembled and managed nationally focused acquisitions, asset management and investment banking teams for four separate organizations. Jeffrey J. Irmer joined Pembroke IV LLC as a principal and chief operating officer in 2016. Richard C. Hamlin is a principal of Pembroke IV LLC and has been a practicing real estate attorney for over 35 years. Ten Capital Management is a privately held real estate investment company with Benjamin Adams as its founder and chief executive officer.
Property Management. The ATRIA Corporate Center Property is managed by Cushman & Wakefield U.S., Inc., a Missouri corporation.
Escrows and Reserves. At origination, the borrower was required to escrow $1,900,000 for future tenant improvements and leasing commissions, approximately $1,063,630 for outstanding TI/LCs to The Mosaic Company, approximately $1,982,520 for outstanding TI/LCs to Daikin, approximately $727,781 in outstanding TI/LCs to five other tenants, approximately $297,378 for free rent for Daikin, approximately $475,830 for gap rent for Daikin, approximately $164,182 for Travel Leaders rent abatement, and approximately $140,006 for real estate taxes.
Tax Escrows – On a monthly basis, the borrower is required to escrow 1/12th of the annual estimated tax payments, which currently equates to approximately $140,006.
Insurance Escrows – The requirement for the borrower to make monthly deposits to the insurance escrow is waived so long as no event of default has occurred and is continuing and the ATRIA Corporate Center Property is insured under a blanket insurance policy in accordance with the ATRIA Corporate Center Mortgage Loan documents.
Replacement Reserves –On a monthly basis, the borrower is required to escrow $6,001 (approximately $0.20 per square foot annually) for ongoing replacement reserves.
TI/LC Reserve – On a monthly basis, the borrower is required to escrow $45,006 (approximately $1.50 per square foot annually) for the TI/LC reserve, subject to a cap of $3,000,000.
Lockbox / Cash Management.The ATRIA Corporate Center Mortgage Loan is structured with a hard lockbox and springing cash management. The borrower was required to send direction letters to all tenants instructing them to deposit all rents into a clearing account controlled by the lender. In the absence of a Triggering Event (as defined below), the funds in the clearing account will be swept on each business day into an account controlled by the borrower. During a Triggering Event, any transfers to the borrower’s operating account are required to cease and sums on deposit in the clearing account will be transferred on each business day to a cash management account controlled by the lender and applied to payment of all monthly amounts due under the ATRIA Corporate Center Mortgage Loan documents.
Excess Cash Flow Sweeps.
Mosaic Rollover Reserve– Upon the occurrence and continuance of a Mosaic Trigger Event (as defined below), all excess cash flow in the cash management account will be disbursed to the Mosaic rollover reserve account subject to a cap of $1,925,325 ($25 per square foot of The Mosaic Company space), provided that for so long as a Daikin Leasing Condition (as defined below) exists, then amounts on deposit in the general rollover reserve account will be credited towards the $1,925,325 cap (if only a Mosaic Trigger Event exists).
Covidien Rollover Reserve – Upon the occurrence and continuance of a Covidien Trigger Event (as defined below), all excess cash flow in the cash management account will be disbursed to the Covidien rollover reserve account subject to a cap of $1,869,700 ($25 per square foot of the Covidien Medtronic space), provided that for so long as (a) a Daikin Leasing Condition exists and (b) a Mosaic Re-Tenanting Event (as defined below) has occurred, then amounts on deposit in the general rollover reserve account will be credited towards the $1,869,700 cap (if only a Covidien Trigger Event exists). If
THE INFORMATION IN THIS STRUCTURAL AND COLLATERAL TERM SHEET IS NOT COMPLETE AND MAY BE AMENDED PRIOR TO THE TIME OF SALE. THIS TERM SHEET IS NOT AN OFFER TO SELL THESE SECURITIES AND IT IS NOT A SOLICITATION OF AN OFFER TO BUY THESE SECURITIES IN ANY JURISDICTION WHERE THE OFFER OR SALE IS NOT PERMITTED.
94
| Structural and Collateral Term Sheet | BBCMS 2019-C3 | |
| No.6 – ATRIA Corporate Center | ||
both a Mosaic Trigger Event and a Covidien Trigger Event simultaneously exist, excess cash flow disbursements into the Covidien rollover reserve account and the Mosaic rollover reserve account, will be made on a pro-rata basis.
Additionally, during a Low DSCR Period (as defined below), all excess cash flow in the cash management account (after required deposits made into the Covidien rollover reserve and the Mosaic rollover reserve account as noted above) will be held as additional security for the ATRIA Corporate Center Mortgage Loan in an excess cash reserve account.
A “Triggering Event” will commence upon the earliest to occur of (i) an event of default, (ii) the debt service coverage ratio being less than 1.25x based on a 30-year amortization schedule, (iii) a Mosaic Trigger Event, or (iv) a Covidien Trigger Event. A Triggering Event will cease when: in respect to clause (i), the cure and acceptance by the lender of such event of default; in respect to clause (ii), the debt service coverage ratio being greater than or equal to 1.30x for two consecutive calendar quarters; with respect to clause (iii), the occurrence of a Mosaic Re-Tenanting Event (as defined below); and in respect to clause (iv), the occurrence of a Covidien Re-Tenanting Event (as defined below).
A “Low DSCR Period” is any period commencing on the last day of the calendar quarter for which the debt service coverage ratio is less than 1.25x based on a 30-year amortization schedule for two consecutive quarters and will end upon the debt service coverage ratio being greater than or equal to 1.30x based on a 30-year amortization schedule for two consecutive quarters.
A “Mosaic Trigger Event” will commence upon (i) the earliest to occur of (A) June 30, 2021 (nine months prior to The Mosaic Company’s lease expiration date), (B) Mosaic giving notice that it intends to terminate its lease, or (C) Mosaic giving notice to the borrower of its intent not to renew its lease in accordance with the terms in the lease, provided that, in each case of (A), (B), and (C), a Mosaic Re-Tenanting Event has not occurred, (ii) The Mosaic Company has abandoned its space, (iii) The Mosaic Company files for bankruptcy, (iv) The Mosaic Company lease has been terminated, or (v) The Mosaic Company has become delinquent under its lease payment obligations, which delinquency remains uncured past the applicable notice and grace periods as set forth in The Mosaic Company’s lease.
A “Mosaic Re-Tenanting Event” will occur when the borrower has delivered to the lender (i) reasonable evidence that (a) The Mosaic Company has given notice of renewal of its lease in accordance with the terms in the lease, (b) The Mosaic Company has agreed to remain in possession of at least one-half of its leased space (38,507 square feet) at a rental rate not less than $16.50 per square foot, (c) at least one-half of The Mosaic Company space has been re-tenanted for a term of at least five years at a rental rate of not less than $16.50 per square foot under one or more qualified replacement leases or (d) The Mosaic Company’s lease is affirmed by The Mosaic Company in a bankruptcy proceeding and (ii) tenant estoppel(s) reasonably satisfactory to the lender.
A “Covidien Trigger Event” will commence upon (i) the earliest to occur of (A) February 28, 2021 (nine months prior to Covidien Medtronic’s lease expiration date), or (B) Covidien Medtronic giving notice to the borrower of its intent not to renew its lease in accordance with the terms in the lease, provided that, in each case of (A) and (B), a Covidien Re-Tenanting Event has not occurred, (ii) Covidien Medtronic has abandoned its space, (iii) Covidien Medtronic files for bankruptcy, (iv) Covidien Medtronic’s lease has been terminated, or (v) Covidien Medtronic has become delinquent under its lease payment obligations, which delinquency remains uncured past the applicable notice and grace periods as set forth in Covidien Medtronic’s lease.
A “Covidien Re-Tenanting Event” will occur when the borrower delivers to the lender (i) reasonable evidence that (a) Covidien Medtronic has given notice of renewal under its lease in accordance with the terms of the lease, (b) Covidien Medtronic has agreed to remain in possession of at least one-half of its leased space (37,394 square feet) at a rental rate of not less than $16.25 per square foot, (c) at least one-half of the Covidien Medtronic space has been re-tenanted for a term of at least five years at a rental rate of not less $16.50 per square foot under one or more qualified replacement leases, or (d) the Covidien Medtronic lease is affirmed by Covidien Medtronic in a bankruptcy proceeding and (ii) tenant estoppel(s) reasonably satisfactory to the lender.
A “Daikin Leasing Condition” will mean Daikin (i) (A) is not subject to bankruptcy or (B) if subject to bankruptcy has affirmed its lease, (ii) is paying full unabated rent and (iii) is in physical occupancy of, and operating in all of the Daikin space.
THE INFORMATION IN THIS STRUCTURAL AND COLLATERAL TERM SHEET IS NOT COMPLETE AND MAY BE AMENDED PRIOR TO THE TIME OF SALE. THIS TERM SHEET IS NOT AN OFFER TO SELL THESE SECURITIES AND IT IS NOT A SOLICITATION OF AN OFFER TO BUY THESE SECURITIES IN ANY JURISDICTION WHERE THE OFFER OR SALE IS NOT PERMITTED.
95
| Structural and Collateral Term Sheet | BBCMS 2019-C3 | |
| No.6 – ATRIA Corporate Center | ||
Subordinate and Mezzanine Debt. None.
Partial Release. Not permitted.
Ground Lease. None.
THE INFORMATION IN THIS STRUCTURAL AND COLLATERAL TERM SHEET IS NOT COMPLETE AND MAY BE AMENDED PRIOR TO THE TIME OF SALE. THIS TERM SHEET IS NOT AN OFFER TO SELL THESE SECURITIES AND IT IS NOT A SOLICITATION OF AN OFFER TO BUY THESE SECURITIES IN ANY JURISDICTION WHERE THE OFFER OR SALE IS NOT PERMITTED.
96
[THIS PAGE INTENTIONALLY LEFT BLANK]
97
| Structural and Collateral Term Sheet | BBCMS 2019-C3 | |
| No. 7 – Inland Devon Self Storage Portfolio | ||
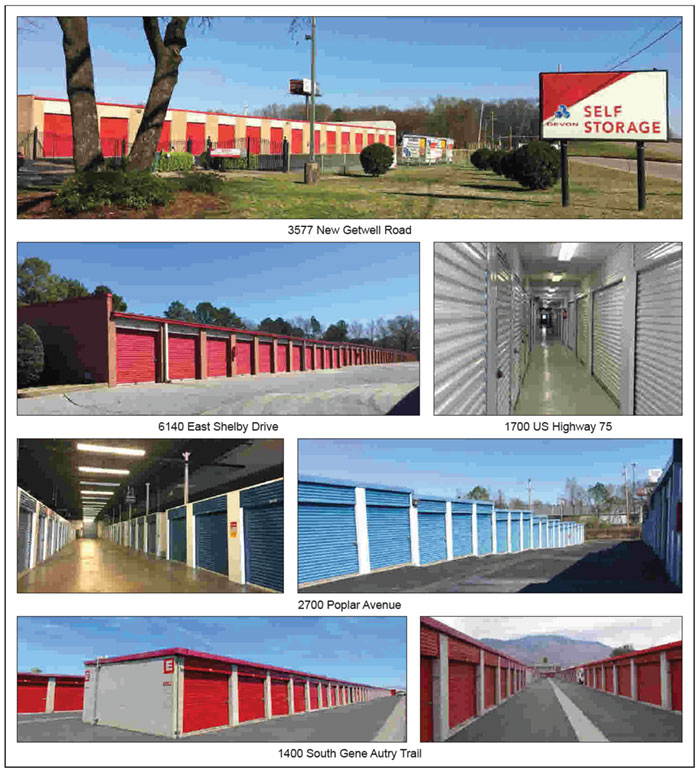
THE INFORMATION IN THIS STRUCTURAL AND COLLATERAL TERM SHEET IS NOT COMPLETE AND MAY BE AMENDED PRIOR TO THE TIME OF SALE. THIS TERM SHEET IS NOT AN OFFER TO SELL THESE SECURITIES AND IT IS NOT A SOLICITATION OF AN OFFER TO BUY THESE SECURITIES IN ANY JURISDICTION WHERE THE OFFER OR SALE IS NOT PERMITTED.
98
| Structural and Collateral Term Sheet | BBCMS 2019-C3 | |
| No. 7 – Inland Devon Self Storage Portfolio | ||
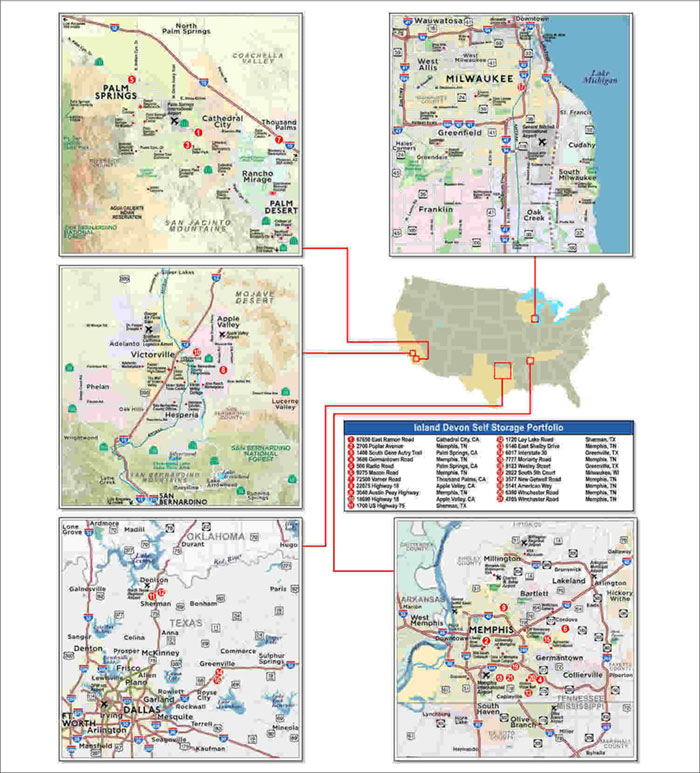
THE INFORMATION IN THIS STRUCTURAL AND COLLATERAL TERM SHEET IS NOT COMPLETE AND MAY BE AMENDED PRIOR TO THE TIME OF SALE. THIS TERM SHEET IS NOT AN OFFER TO SELL THESE SECURITIES AND IT IS NOT A SOLICITATION OF AN OFFER TO BUY THESE SECURITIES IN ANY JURISDICTION WHERE THE OFFER OR SALE IS NOT PERMITTED.
99
| Structural and Collateral Term Sheet | BBCMS 2019-C3 | |
| No. 7 – Inland Devon Self Storage Portfolio | ||
| Mortgage Loan Information | Property Information | |||
| Mortgage Loan Seller: | Barclays | Single Asset / Portfolio: | Portfolio | |
| Original Principal Balance(1): | $41,000,000 | Title: | Fee | |
| Cut-off Date Principal Balance(1): | $41,000,000 | Property Type–Subtype: | Self Storage – Self Storage | |
| % of IPB: | 4.4% | Net Rentable Area (Units): | 10,824 | |
| Loan Purpose: | Acquisition | Location: | Various | |
| Borrower: | Four State Storage DST | Year Built / Renovated: | Various / Various | |
| Borrower Sponsor: | Inland Private Capital Corporation | Occupancy: | 79.9% | |
| Interest Rate: | 4.14000% | Occupancy Date: | 3/6/2019 | |
| Note Date: | 3/29/2019 | 4th Most Recent NOI (As of): | $6,699,524 (12/31/2016) | |
| Maturity Date: | 4/6/2029 | 3rd Most Recent NOI (As of): | $7,135,768 (12/31/2017) | |
| Interest-only Period: | 60 months | 2nd Most Recent NOI (As of): | $7,407,429 (12/31/2018) | |
| Original Term: | 120 months | Most Recent NOI (As of): | $7,526,287 (TTM 2/28/2019) | |
| Original Amortization Term: | 360 months | UW Economic Occupancy: | 81.7% | |
| Amortization Type: | IO-Balloon | UW Revenues: | $13,394,162 | |
| Call Protection: | L(23),Grtr1%orYM(93),O(4) | UW Expenses: | $6,494,187 | |
| Lockbox / Cash Management: | Springing | UW NOI: | $6,899,975 | |
| Additional Debt: | Yes | UW NCF: | $6,752,457 | |
| Additional Debt Balance: | $30,000,000 | Appraised Value / Per Unit: | $122,770,000 / $11,342 | |
| Additional Debt Type: | Pari Passu | Appraisal Date: | Various | |
| Escrows and Reserves(2) | Financial Information(1) | |||||||||
| Initial | Monthly | Initial Cap | Cut-off Date Loan / Unit: | $6,559 | ||||||
| Taxes: | $0 | Springing | N/A | Maturity Date Loan / Unit: | $5,967 | |||||
| Insurance: | $0 | Springing | N/A | Cut-off Date LTV: | 57.8% | |||||
| Replacement Reserves: | $142,892 | Springing | $714,460 | Maturity Date LTV: | 52.6% | |||||
| TI/LC | $0 | $0 | N/A | UW NCF DSCR: | 1.63x | |||||
| Other: | $1,232,581 | $0 | N/A | UW NOI Debt Yield: | 9.7% | |||||
| Sources and Uses | ||||||||||
| Sources | Proceeds | % of Total | Uses | Proceeds | % of Total | |||||
| Whole Loan(1) | $71,000,000 | 58.7% | Purchase Price | $118,300,000 | 97.8% | |||||
| Sponsor Equity | 49,911,054 | 41.3 | Upfront Reserves | 1,375,473 | 1.1 | |||||
| Closing Costs | 1,235,581 | 1.0 | ||||||||
| Total Sources | $120,911,054 | 100.0% | Total Uses | $120,911,054 | 100.0% | |||||
| (1) | The Inland Devon Self Storage Portfolio Mortgage Loan, as defined below, is part of a whole loan evidenced by twopari passu notes with an aggregate original principal balance of $71.0 million. The financial information presented in the chart above is based on the $71.0 million Inland Devon Self Storage Portfolio Whole Loan (as defined below). |
| (2) | For a full description of Escrows and Reserves, please refer to “Escrows and Reserves” below. Additionally, the borrower informed the lender that it funded $6,630,840 into a trust reserve account separate from the Escrows and Reserves. Collectively, the initial Escrows and Reserves and trust reserve account will be used to pay for (i) repairs and replacements of the structure, foundation, roof, exterior walls, and parking lot improvements at the Inland Devon Self Storage Portfolio Properties (as defined below), (ii) leasing commissions, (iii) any environmental costs, (iv) any repairs identified in the property condition reports, (v) insurance deductibles and (vi) any other necessary property improvements. |
THE INFORMATION IN THIS STRUCTURAL AND COLLATERAL TERM SHEET IS NOT COMPLETE AND MAY BE AMENDED PRIOR TO THE TIME OF SALE. THIS TERM SHEET IS NOT AN OFFER TO SELL THESE SECURITIES AND IT IS NOT A SOLICITATION OF AN OFFER TO BUY THESE SECURITIES IN ANY JURISDICTION WHERE THE OFFER OR SALE IS NOT PERMITTED.
100
| Structural and Collateral Term Sheet | BBCMS 2019-C3 | |
| No. 7 – Inland Devon Self Storage Portfolio | ||
The Loan.The Inland Devon Self Storage Portfolio mortgage loan is secured by a first mortgage lien on the borrower’s fee interest in 21 self-storage properties located in Tennessee, California, Texas, and Wisconsin. The whole loan was originated by Barclays and has an outstanding principal balance as of the Cut-off Date of $71.0 million (the “Inland Devon Self Storage Portfolio Whole Loan”). The Inland Devon Self Storage Portfolio Whole Loan is comprised of twopari passu notes, Note A-1 and Note A-2. Note A-1, with an outstanding principal balance as of the Cut-off Date of approximately $41.0 million, is being contributed to the BBCMS 2019-C3 Trust (the “Inland Devon Self Storage Portfolio Mortgage Loan”). Note A-2 has an outstanding principal balance as of the Cut-off Date of approximately $30.0 million and is expected to be contributed to the WFCM 2019-C50 trust. Note A-1 is the controlling note under the related co-lender agreement, the rights of which will be exercised under this securitization (or, prior to the occurrence and continuance of a control termination event under the pooling and servicing agreement, the directing certificate holder);however, the holders of Note A-2 will be entitled, under certain circumstances, to be consulted with respect to certain major decisions. The Inland Devon Self Storage Portfolio Whole Loan has a 10-year term and is interest-only for the first five years.
| Whole Loan Summary | |||
| Note | Original Balance | Note Holder | Controlling Piece |
| A-1 | $41,000,000 | BBCMS 2019-C3 | Yes |
| A-2 | $30,000,000 | WFCM 2019-C50 | No |
| Total | $71,000,000 | ||
The Properties. The Inland Devon Self Storage Portfolio is a 21-property, 1,428,720 square-foot self-storage portfolio located in Tennessee (10 properties, 49.3% of NRA), California (six properties, 32.0% of NRA), Texas (four properties, 14.6% of NRA), and Wisconsin (one property, 4.1% of NRA) (the “Inland Devon Self Storage Portfolio Properties” or the “Inland Devon Self Storage Portfolio”). The Inland Devon Self Storage Portfolio Properties were constructed from 1966 to 2000 and range in size from 38,892 square feet to 109,255 square feet, with no Inland Devon Self Storage Portfolio Property comprising of more than 7.6% of the total net rentable area. The Inland Devon Self Storage Portfolio Properties have a total of 10,824 units, 1,735 of which are climate controlled. The Inland Devon Self Storage Portfolio Properties also include 486 RV/parking spaces, two billboard spaces, 38 office/flex units and five cell towers. The portfolio was 79.9% occupied as of March 6, 2019.
THE INFORMATION IN THIS STRUCTURAL AND COLLATERAL TERM SHEET IS NOT COMPLETE AND MAY BE AMENDED PRIOR TO THE TIME OF SALE. THIS TERM SHEET IS NOT AN OFFER TO SELL THESE SECURITIES AND IT IS NOT A SOLICITATION OF AN OFFER TO BUY THESE SECURITIES IN ANY JURISDICTION WHERE THE OFFER OR SALE IS NOT PERMITTED.
101
| Structural and Collateral Term Sheet | BBCMS 2019-C3 | |
| No. 7 – Inland Devon Self Storage Portfolio | ||
| Portfolio Summary | |||||||||
| Property Name, Location | Allocated Cut-off Date Whole Loan Balance | % of Portfolio Cut-off Date Balance | Occupancy(1) | Year Built/ Renovated | Net Rentable Area | Appraised Value | UW NOI | % of UW NOI | Storage Units |
67650 East Ramon Road Cathedral City, CA | $8,075,000 | 11.4% | 86.0% | 1987/NAP | 109,255 | $14,000,000 | $769,008 | 11.1% | 767 |
2700 Poplar Avenue Memphis, TN | 6,625,000 | 9.3 | 78.2 | 1966/NAV | 92,845 | 11,400,000 | 652,715 | 9.5 | 651 |
1400 South Gene Autry Trail Palm Springs, CA | 4,950,000 | 7.0 | 90.5 | 1987/NAP | 72,875 | 9,100,000 | 456,430 | 6.6 | 547 |
3686 Old Germantown Road Memphis, TN | 4,550,000 | 6.4 | 81.1 | 1986/NAP | 108,906 | 6,900,000 | 475,147 | 6.9 | 841 |
500 Radio Road Palm Springs, CA | 4,500,000 | 6.3 | 91.8 | 1989/NAP | 64,770 | 8,200,000 | 417,653 | 6.1 | 549 |
9275 Macon Road Memphis, TN | 4,450,000 | 6.3 | 75.4 | 1994/NAP | 67,900 | 7,900,000 | 413,771 | 6.0 | 549 |
72500 Varner Road Thousand Palms, CA | 4,225,000 | 6.0 | 78.5 | 1990/NAP | 74,855 | 7,400,000 | 402,153 | 5.8 | 693 |
22075 Highway 18 Apple Valley, CA | 4,050,000 | 5.7 | 86.7 | 1988/NAP | 73,565 | 6,600,000 | 410,341 | 5.9 | 573 |
3040 Austin Peay Highway Memphis, TN | 4,000,000 | 5.6 | 91.8 | 1973/NAP | 71,885 | 6,900,000 | 393,506 | 5.7 | 539 |
18690 Highway 18 Apple Valley, CA | 3,825,000 | 5.4 | 88.6 | 1988/NAP | 61,755 | 6,300,000 | 388,866 | 5.6 | 455 |
1700 US Highway 75 Sherman, TX | 3,450,000 | 4.9 | 86.5 | 1996/NAP | 48,625 | 5,200,000 | 350,318 | 5.1 | 393 |
1720 Loy Lake Road Sherman, TX | 3,200,000 | 4.5 | 73.7 | 1997/NAP | 55,100 | 5,350,000 | 323,594 | 4.7 | 502 |
6140 East Shelby Drive Memphis, TN | 2,900,000 | 4.1 | 84.7 | 1990/NAP | 72,700 | 4,450,000 | 285,489 | 4.1 | 577 |
6017 Interstate 30 Greenville, TX | 2,775,000 | 3.9 | 78.7 | 1990/NAP | 59,585 | 4,890,000 | 257,823 | 3.7 | 445 |
7777 Moriarty Road Memphis, TN | 2,550,000 | 3.6 | 70.9 | 1989/NAP | 54,325 | 4,700,000 | 251,132 | 3.6 | 368 |
8123 Wesley Street Greenville, TX | 1,950,000 | 2.7 | 79.2 | 2000/NAP | 45,100 | 3,480,000 | 182,701 | 2.6 | 307 |
2922 South 5thCourt Milwaukee, WI | 1,950,000 | 2.7 | 62.3 | 1983/NAP | 58,700 | 3,400,000 | 183,202 | 2.7 | 488 |
3577 New Getwell Road Memphis, TN | 1,100,000 | 1.5 | 70.7 | 1984/NAP | 96,363 | 2,250,000 | 110,584 | 1.6 | 478 |
5141 American Way Memphis, TN | 875,000 | 1.2 | 85.1 | 1984/NAP | 40,399 | 1,600,000 | 85,611 | 1.2 | 329 |
6390 Winchester Road Memphis, TN | 550,000 | 0.8 | 73.7 | 1985/NAP | 38,892 | 1,200,000 | 53,961 | 0.8 | 316 |
4705 Winchester Road Memphis, TN | 450,000 | 0.6 | 53.0 | 1981/NAP | 60,320 | 1,550,000 | 35,969 | 0.5 | 457 |
| Total | $71,000,000 | 100.0% | 79.9% | 1,428,720 | $122,770,000 | $6,899,975 | 100.0% | 10,824 | |
| (1) | Occupancy is based on Storage Units. The total occupancy based on square footage is 81.3%. |
THE INFORMATION IN THIS STRUCTURAL AND COLLATERAL TERM SHEET IS NOT COMPLETE AND MAY BE AMENDED PRIOR TO THE TIME OF SALE. THIS TERM SHEET IS NOT AN OFFER TO SELL THESE SECURITIES AND IT IS NOT A SOLICITATION OF AN OFFER TO BUY THESE SECURITIES IN ANY JURISDICTION WHERE THE OFFER OR SALE IS NOT PERMITTED.
102
| Structural and Collateral Term Sheet | BBCMS 2019-C3 | |
| No. 7 – Inland Devon Self Storage Portfolio | ||
Environmental. According to the Phase I environmental site assessments dated from January 18, 2019 to January 25, 2019, there was no evidence of any recognized environmental conditions at the Inland Devon Self Storage Portfolio Properties.
| Historical and Current Occupancy(1) | |||
| 2016 | 2017 | 2018 | Current(2) |
| 80.2% | 81.1% | 81.7% | 79.9% |
| (1) | Historical Occupancies are as of December 31 of each respective year. |
| (2) | Current Occupancy is as of March 6, 2019. |
| Operating History and Underwritten Net Cash Flow | |||||||
| 2016 | 2017 | 2018 | TTM(1) | Underwritten | Per Unit | %(2) | |
| Rents in Place | $13,847,868 | $14,492,789 | $12,069,652 | $12,138,016 | $12,138,016 | $1,121 | 80.2% |
| Grossed Up Vacant Space | 0 | 0 | 0 | 0 | 2,999,319 | 277 | 19.8 |
| Gross Potential Rent | $13,847,868 | $14,492,789 | $12,069,652 | $12,138,016 | $15,137,335 | $1,398 | 100.0% |
| Total Reimbursements | 0 | 0 | 0 | 0 | 0 | 0 | 0.0 |
| Net Rental Income | $13,847,868 | $14,492,789 | $12,069,652 | $12,138,016 | $15,137,335 | $1,398 | 100.0% |
| (Vacancy/Credit Loss) | (3,115,402) | (3,077,179) | (77,556) | 0 | (2,999,319) | (277) | (19.8) |
| Other Income | 1,075,102 | 1,227,424 | 1,238,151 | 1,256,146 | 1,256,146 | 116 | 8.3 |
| Effective Gross Income | $11,807,568 | $12,643,034 | $13,230,247 | $13,394,162 | $13,394,162 | $1,237 | 88.5% |
| Total Expenses | $5,108,044 | $5,507,266 | $5,822,818 | $5,867,875 | $6,494,187 | $600 | 48.5% |
| Net Operating Income | $6,699,524 | $7,135,768 | $7,407,429 | $7,526,287 | $6,899,975 | $637 | 51.5% |
| Total TI/LC, Capex/RR | 142,864 | 142,864 | 142,864 | 142,864 | 147,518 | 14 | 1.1 |
| Net Cash Flow | $6,556,660 | $6,992,905 | $7,264,565 | $7,383,424 | $6,752,457 | $624 | 50.4% |
| (1) | TTM reflects the trailing 12-month period ending February 2019. |
| (2) | % column represents percent of Net Rental Income for all revenue lines and represents percent of Effective Gross Income for the remainder of fields. |
The Borrower. The borrowing entity for the Inland Devon Self Storage Portfolio Whole Loan is Four State Storage DST, a Delaware statutory trust and special purpose entity. Legal counsel to the borrower delivered a non-consolidation opinion in connection with the origination of the Inland Devon Self Storage Portfolio Whole Loan. Upon the occurrence of a Conversion Event (as defined below), the borrower must convert from a DST to a Delaware limited liability company. The borrower has master leased the Inland Devon Self Storage Portfolio Properties to a master lessee affiliated with the borrower sponsor. The master lessee is structured to be a single purpose entity. The master lessee’s interest in the master lease and all rents are assigned to the lender. The borrower sponsor has a 100% ownership interest in the master lessee. The master lease is subordinate to the Inland Devon Self Storage Portfolio Mortgage Loan. There is no income underwritten from the master lease as the Inland Devon Self Storage Portfolio was underwritten to the underlying property income. There is one independent director for the borrowing entity, one independent director for the master lessee and one independent director for the signatory trustee. Legal counsel to the borrower delivered a non-consolidation opinion in connection with the origination of the Inland Devon Self Storage Portfolio Whole Loan. See“Description of the Mortgage Pool—Mortgage Pool Characteristics—Delaware Statutory Trusts” in the Preliminary Prospectus.
A “Conversion Event” will commence upon the earliest of (i) the occurrence of any event of default with respect to which the borrower does not deliver within 10 business days a reasoned opinion of tax counsel acceptable to the lender that either (a) the borrower is able to remedy such event of default without effectuating a conversion or (b) effectuating a conversion would not reasonably be expected to improve the ability of the borrower to remedy the event of default; (ii) 30 days prior to the maturity date if the lender does not have reasonable evidence that the loan will be repaid; or (iii) the borrower deeming it prudent to effectuate such conversion.
THE INFORMATION IN THIS STRUCTURAL AND COLLATERAL TERM SHEET IS NOT COMPLETE AND MAY BE AMENDED PRIOR TO THE TIME OF SALE. THIS TERM SHEET IS NOT AN OFFER TO SELL THESE SECURITIES AND IT IS NOT A SOLICITATION OF AN OFFER TO BUY THESE SECURITIES IN ANY JURISDICTION WHERE THE OFFER OR SALE IS NOT PERMITTED.
103
| Structural and Collateral Term Sheet | BBCMS 2019-C3 | |
| No. 7 – Inland Devon Self Storage Portfolio | ||
The Loan Sponsor.The loan sponsor and nonrecourse carve-out guarantor is Inland Private Capital Corporation (“IPCC”). IPCC has sponsored over 231 1031 exchange private placement programs since its inception that have offered more than $4.5 billion in equity and have served over 12,500 investors. Through December 31, 2018, IPCC-sponsored private placements have been made up of 621 properties comprised of more than 44 million square feet of gross leasable area, including more than 16,500 residential units. As of December 31, 2018, IPCC has $7.3 billion in assets under management. IPCC has had previous and is involved in ongoing foreclosures unrelated to the Inland Devon Self Storage Portfolio. See “Description of the Mortgage Pool—Loan Purpose; Default History, Bankruptcy Issues and Other Proceedings” in the Preliminary Prospectus.
Property Management. The Inland Devon Self Storage Portfolio Properties are managed by Devon Self Storage Holdings (US) LLC, a Delaware limited liability company. Founded in 1988, Devon Self Storage Holdings (US) LLC has owned or managed 183 facilities in 24 states and three European countries and is ranked as one of the top 15 self-storage operators in the United States.
Escrows and Reserves. At origination, the borrower was required to deposit into escrow $1,232,581 for major repairs at the 1720 Loy Lake Road property and the 4705 Winchester Road property. The major repairs at the 1720 Loy Lake Road property are to repair damage caused by a fire in May 2018 affecting approximately 78 units. The required repairs are expected to be completed in 2019 (but must be completed within two years of the origination date) using insurance funds, however, $123,119 was reserved at closing, reflecting 120% of the expected cost. The major repairs at the 4705 Winchester Road property include repairs to certain roofs, eaves and gutters due to water damage to approximately 150 units. The building repairs must be completed within four years of the origination date for an amount of $924,552. $1,109,462 of the major repair fund is dedicated to the 4705 Winchester Road repairs, reflecting 120% of the expected cost.
Tax Escrows – The borrower is required to make monthly payments of 1/12th of the estimated taxes payable during the next 12 months upon (i) the occurrence and continuance of an event of default and (ii) the debt service coverage ratio being less than 1.15x based on a 30-year amortization schedule.
Insurance Escrows – The borrower will be required to make monthly payments of 1/12th of the estimated insurance premiums payable for the renewal of the insurance policies upon (i) the occurrence and continuance of an event of default and (ii) the debt service coverage ratio being less than 1.15x based on a 30-year amortization schedule.
Replacement Reserves – At origination, the borrower deposited $142,892 upfront to cover a year’s worth of monthly replacement reserves. The borrower is required to make monthly payments of approximately $11,908 for replacement reserves which may be re-assessed as necessary on an annual basis, capped at $714,460. The borrower’s obligation to make replacement reserves will be waived if each of the following conditions is satisfied: (i) the borrower has deposited in the replacement reserve account an amount equal to $142,892 (the annual replacement reserve deposit, which is subject to annual increases if the lender determines in its reasonable discretion that an increase is necessary to maintain the proper maintenance and operation of the Inland Devon Self Storage Portfolio Properties) in either cash or by posting a letter of credit, (ii) no event of default exists, and (iii) the lender has been provided satisfactory evidence of payment of replacements and repairs required to be made during the calendar year in an amount greater than or equal to $0.10 per square foot per annum.
Lockbox / Cash Management.The Inland Devon Self Storage Portfolio Whole Loan is structured with a springing lockbox and springing cash management. The springing lockbox will be established within five business days of the first occurrence of a Triggering Event (as defined below). During the continuance of a Triggering Event, the borrower is required to deposit, or cause to be deposited, all rents into the lockbox account within three business days of receipt. Additionally, upon the occurrence of a Triggering Event, all funds deposited in the lockbox account will be transferred to a cash management account and those funds will be disbursed in accordance with the Inland Devon Self Storage Portfolio Whole Loan documents. During the occurrence of an Excess Cash Flow Trigger Event (as defined below), all excess cash flow will be deposited into an excess cash flow reserve to be held as additional security for the Inland Devon Self Storage Portfolio Whole Loan.
A “Triggering Event” means the occurrence of the earliest of (i) the occurrence and continuance of an event of default and (ii) the debt service coverage ratio being less than 1.20x for any calendar quarter. A Triggering Event will expire upon, with
THE INFORMATION IN THIS STRUCTURAL AND COLLATERAL TERM SHEET IS NOT COMPLETE AND MAY BE AMENDED PRIOR TO THE TIME OF SALE. THIS TERM SHEET IS NOT AN OFFER TO SELL THESE SECURITIES AND IT IS NOT A SOLICITATION OF AN OFFER TO BUY THESE SECURITIES IN ANY JURISDICTION WHERE THE OFFER OR SALE IS NOT PERMITTED.
104
| Structural and Collateral Term Sheet | BBCMS 2019-C3 | |
| No. 7 – Inland Devon Self Storage Portfolio | ||
regard to clause (i), the cure of such event of default and with respect to clause (ii), the debt service coverage ratio being greater than or equal to 1.25x for two consecutive calendar quarters.
An “Excess Cash Flow Trigger Event” will commence upon the earliest of (i) the occurrence and continuance of an event of default and (ii) the debt service coverage ratio being less than 1.20x for two or more consecutive calendar quarters. An Excess Cash Flow Trigger Event will end upon, with respect to clause (i) above, the cure of such event of default and with respect to clause (ii) above, the debt service coverage ratio being greater than or equal to 1.25x for two consecutive calendar quarters.
Subordinate and Mezzanine Debt. None.
Permitted Additional Unsecured Subordinate Indebtedness. Provided no event of default has occurred and is continuing, the borrower may obtain unsecured loans from the guarantor provided that the proceeds of such loans are required to be used solely to pay the monthly debt service payment amount, capital expenditures (as approved by the lender), extraordinary expenses (as approved by the lender), and actual operating expenses necessary for the operation, maintenance and/or re-tenanting of the properties as a result of insufficient reserves held by the borrower and/or as a result of insufficient rents being paid. The subordinate debt must at all times be, (i) unsecured, (ii) subordinate in all respects to the Inland Devon Self Storage Portfolio Whole Loan pursuant to a subordination and standstill agreement, which is required to be executed and delivered by the guarantor prior to providing the subordinate loans, (iii) without a maturity date, and (iv) evidenced by a promissory note with terms and conditions otherwise acceptable to the lender. Under no circumstances may any portion of the subordinate loans be used to make distributions to any beneficial owners of the borrower.
Partial Release. After the lockout period, the borrower may release an individual property provided that, among other conditions stated in the Inland Devon Self Storage Portfolio Whole Loan documents, (i) no event of default has occurred and is continuing; (ii) the loan is prepaid in the amount of at least 120% of the allocated loan amount for such individual property; (iii) the debt service coverage ratio for the remaining properties after such release is at least equal to the greater of (a) 1.63x and (b) the debt service coverage ratio for the remaining properties and the released property for the preceding 12 months capped at 1.75x; (iv) the loan-to-value ratio after such release is less than or equal to the lesser of (a) 57.8% and (b) the loan-to-value ratio for the remaining properties and the released property immediately preceding the release of the property; however, this condition does not apply to the release of any individual property given that, after such release, the aggregate allocated loan amounts of all the properties that have been released are less than 20% of the total original principal balance of the loan (v) the debt yield for the remaining properties after such release is greater than or equal to the greater of (a) 9.73% and (b) the debt yield of the remaining properties and the released property for the 12 months prior to such release capped at 10.25%; (vi) if required by the lender, rating agency confirmation, and (vii) the payment of any applicable yield maintenance premium, if such partial release occurs prior to January 6, 2029.
Ground Lease.None.
THE INFORMATION IN THIS STRUCTURAL AND COLLATERAL TERM SHEET IS NOT COMPLETE AND MAY BE AMENDED PRIOR TO THE TIME OF SALE. THIS TERM SHEET IS NOT AN OFFER TO SELL THESE SECURITIES AND IT IS NOT A SOLICITATION OF AN OFFER TO BUY THESE SECURITIES IN ANY JURISDICTION WHERE THE OFFER OR SALE IS NOT PERMITTED.
105
| Structural and Collateral Term Sheet | BBCMS 2019-C3 | |
| No. 8 – NEMA San Francisco | ||

THE INFORMATION IN THIS STRUCTURAL AND COLLATERAL TERM SHEET IS NOT COMPLETE AND MAY BE AMENDED PRIOR TO THE TIME OF SALE. THIS TERM SHEET IS NOT AN OFFER TO SELL THESE SECURITIES AND IT IS NOT A SOLICITATION OF AN OFFER TO BUY THESE SECURITIES IN ANY JURISDICTION WHERE THE OFFER OR SALE IS NOT PERMITTED.
106
| Structural and Collateral Term Sheet | BBCMS 2019-C3 | |
| No. 8 – NEMA San Francisco | ||

THE INFORMATION IN THIS STRUCTURAL AND COLLATERAL TERM SHEET IS NOT COMPLETE AND MAY BE AMENDED PRIOR TO THE TIME OF SALE. THIS TERM SHEET IS NOT AN OFFER TO SELL THESE SECURITIES AND IT IS NOT A SOLICITATION OF AN OFFER TO BUY THESE SECURITIES IN ANY JURISDICTION WHERE THE OFFER OR SALE IS NOT PERMITTED.
107
| Structural and Collateral Term Sheet | BBCMS 2019-C3 | |
| No. 8 – NEMA San Francisco | ||
| Mortgage Loan Information | Property Information | |||
| Mortgage Loan Seller(1): | Natixis | Single Asset / Portfolio: | Single Asset | |
| Credit Assessment (Fitch/KBRA): | BBB- / A- | Title: | Fee | |
| Original Principal Balance(2): | $35,000,000 | Property Type–Subtype: | Multifamily – High Rise | |
| Cut-off Date Principal Balance(2): | $35,000,000 | Net Rentable Area (Units): | 754 | |
| % of IPB: | 3.7% | Location: | San Francisco, CA | |
| Loan Purpose: | Refinance | Year Built / Renovated: | 2013 / N/A | |
| Borrower: | Tenth and Market, LLC | Occupancy: | 94.0% | |
| Borrower Sponsor(3): | Crescent Heights | Occupancy Date: | 1/14/2019 | |
| Interest Rate: | 4.43598540291971% | 4thMost Recent NOI: | 21,100,810 (12/31/2015) | |
| Note Date: | 2/8/2019 | 3rdMost Recent NOI: | 20,612,978 (12/31/2016) | |
| Maturity Date: | 2/10/2029 | 2ndMost Recent NOI: | 20,741,478 (12/31/2017) | |
| Interest-only Period: | 120 months | Most Recent NOI: | 20,480,399 (TTM 11/30/2018) | |
| Original Term: | 120 months | UW Economic Occupancy: | 94.0% | |
| Original Amortization Term: | None | UW Revenues: | $35,118,992 | |
| Amortization Type: | Interest Only | UW Expenses: | $13,967,383 | |
| Call Protection(4): | L(28),Def(88),O(4) | UW NOI: | $21,151,609 | |
| Lockbox / Cash Management: | Soft (Residential); Hard (Commercial) / In Place | UW NCF: | $20,972,925 | |
| Additional Debt: | Yes | Appraised Value / Per Unit: | $543,600,000 / $720,955 | |
| Additional Debt Balance(2): | $170,000,000; $179,000,000 | Appraisal Date: | 12/13/2018 | |
| Additional Debt Type(2): | Pari Passu;Subordinate Notes | |||
| Escrows and Reserves(5) | Financial Information(2) | ||||||
| Initial | Monthly | Initial Cap | A Notes | Whole Loan | |||
| Cut-off Date Loan / Unit: | $271,883 | $509,284 | |||||
| Taxes: | $2,063,608 | $421,010 | N/A | Maturity Date Loan / Unit: | $271,883 | $509,284 | |
| Insurance: | $402,392 | $57,485 | N/A | Cut-off Date LTV: | 37.7% | 70.6% | |
| Replacement Reserve: | $0 | $14,890 | $250,000 | Maturity Date LTV: | 37.7% | 70.6% | |
| Rent Abatement Reserve: | $14,238 | $0 | N/A | UW NCF DSCR: | 2.27x | 1.15x | |
| UW NOI Debt Yield: | 10.3% | 5.5% | |||||
| Sources and Uses | |||||||
| Sources | Proceeds | % of Total | Uses | Proceeds | % of Total | ||
| Mortgage Loan A Notes | $205,000,000 | 53.4% | Payoff Existing Debt | $377,725,496 | 98.4% | ||
| Mortgage Loan A-B Note | 69,000,000 | 18.0 | Return of Equity | 2,773,584 | 0.7 | ||
| Mortgage Loan B-1 Note | 60,000,000 | 15.6 | Upfront Reserves | 2,480,238 | 0.6 | ||
| Mortgage Loan B-2 Note | 50,000,000 | 13.0 | Closing Costs | 1,020,682 | 0.3 | ||
| Total Sources | $384,000,000 | 100.0% | Total Uses | $384,000,000 | 100.0% | ||
| (1) | The NEMA San Francisco Whole Loan, as defined in “The Loan” below, was originated by Natixis Real Estate Capital LLC (“Natixis”). |
| (2) | The NEMA San Francisco Mortgage Loan, as defined in “The Loan” below, is part of a larger split whole loan, which is comprised of five seniorpari passupromissory notes with an aggregate original principal balance of $205,000,000 (the “A Notes”), one senior subordinate note with a principal balance of $69,000,000 (the “A-B Note”), and two junior subordinate companion notes with outstanding principal balances of $60.0 million (the “B-1 Note”, which is subordinate to the A-B Note and the A Notes) and $50.0 million (the “B-2 Note”, which is subordinate to the B-1 Note, the A-B Note and the A Notes; B-1 Note and B-2 Note are referred to herein as the “B Notes”; the B Notes together with the A Notes and A-B Note are referred to herein as the “Whole Loan”). |
| (3) | For a full description of the Borrower Sponsor, please refer to “The Loan Sponsor” below. |
| (4) | Prior to the open prepayment date of November 10, 2028, the Borrowers (as defined below) have the right to defease the NEMA San Francisco Whole Loan in whole or in part on any payment date after the earlier to occur of (a) February 8, 2022 and (b) the date that is two years from the closing date of the securitization trust established in connection with the securitization of the final notes to be securitized, assuming no event of default is continuing (unless the default will be cured by the defeasance). The assumed lockout period of 28 payments is based on the closing date of this transaction in June 2019. |
| (5) | For a full description of Escrows and Reserves, please refer to “Escrows and Reserves” below. |
THE INFORMATION IN THIS STRUCTURAL AND COLLATERAL TERM SHEET IS NOT COMPLETE AND MAY BE AMENDED PRIOR TO THE TIME OF SALE. THIS TERM SHEET IS NOT AN OFFER TO SELL THESE SECURITIES AND IT IS NOT A SOLICITATION OF AN OFFER TO BUY THESE SECURITIES IN ANY JURISDICTION WHERE THE OFFER OR SALE IS NOT PERMITTED.
108
| Structural and Collateral Term Sheet | BBCMS 2019-C3 | |
| No. 8 – NEMA San Francisco | ||
The Loan.The NEMA San Francisco mortgage loan is secured by a first mortgage lien on the borrower’s fee interest in the NEMA San Francisco high-rise multifamily building located in San Francisco, California, comprising four connected towers that range from 10 to 35 stories and contain 754 Class A apartment units (the “NEMA San Francisco Property”). The whole loan was originated by Natixis Real Estate Capital LLC and has an outstanding principal balance as of the Cut-off Date of $384.0 million (the “NEMA San Francisco Whole Loan”). The NEMA San Francisco Whole Loan is comprised of 5 seniorpari passu notes, one senior subordinate companion A-B Note, and two junior subordinate companion B-Notes. Note A-B is subordinate to the A Notes; Note B-1 is subordinate to the A-B Note and the A Notes; and Note B-2 is subordinate to the B-1 Note, the A-B Note and the A Notes. The NEMA San Francisco Whole Loan has a 10-year term and is interest-only for the full term of the loan. Note A-2 and Note A-4, with an aggregate outstanding principal balance as of the Cut-off Date of $35.0 million, are being contributed to the BBCMS 2019-C3 Trust (the “NEMA San Francisco Mortgage Loan”). Note A-1 and Note A-B, with an aggregate outstanding principal balance as of the Cut-off Date of $199.0 million, have been contributed to the NCMS 2019-NEMA securitization trust. Note A-3 and Note A-5 are held by Natixis, have an aggregate outstanding principal balance as of the Cut-off Date of $40.0 million, and are expected to be contributed to one or more future securitizations. Note B-1, with an outstanding principal balance of $60.0 million, has been sold to an unaffiliated third party investor. Note B-2, with an outstanding principal balance of $50.0 million, is currently held by Natixis, New York Branch. Note B-2 is the controlling note under the related co-lender agreement. After the occurrence of a Note B-2 control appraisal period, the holder of the Note B-1 will be the controlling noteholder. If a Note B-1 control appraisal period is continuing, but a Note A-B control appraisal period is not continuing, the holder of Note A-B will be the controlling noteholder. If a Note A-B control appraisal period is continuing, the holder of the Note A-1 will be the controlling noteholder; however, the holders of Note A-2, Note A-3, Note A-4, and Note A-5 will be entitled, under certain circumstances, to be consulted with respect to certain major decisions.
| Whole Loan Summary | ||||
| Note | Original Balance | Note Holder | Lead Servicer for Whole Loan | Controlling Piece |
| A-1 | $130,000,000 | NCMS 2019-NEMA | Yes | No |
| A-2 | 25,000,000 | BBCMS 2019-C3 | No | No |
| A-3 | 25,000,000 | Natixis | No | No |
| A-4 | 10,000,000 | BBCMS 2019-C3 | No | No |
| A-5 | 15,000,000 | Natixis | No | No |
| A-B | 69,000,000 | NCMS 2019-NEMA | No | No |
| B-1 | 60,000,000 | Third Party Investor | No | No |
| B-2 | 50,000,000 | Natixis | No | Yes |
| Total | $384,000,000 | |||
The Property. The NEMA San Francisco Property comprises four linked towers that range from 10 to 35 stories and combined contain 754 Class A apartment units (90 of which are affordable units under San Francisco's Inclusionary Housing Program) located at 8 10th Street in San Francisco, California. For additional information concerning the affordable units see “Description of the Mortgage Pool—Mortgage Pool Characteristics—Property Types—Multifamily Properties” in the Preliminary Prospectus.
The construction of the NEMA San Francisco Property was completed in 2013. The NEMA San Francisco Property, designed by Handel Architects, LLP’s partner Glenn Rescalvo, has received numerous awards including the best-amenities award by the San Francisco Apartment Association, the 2014 IBcon “Digie” Award for most intelligent multi-family residential project and the 2015 Alliant Build America Merit Award, and was recognized by the San Francisco Business Times as the Market Rate Rental Project of the Year in 2014.
The NEMA San Francisco Property features approximately 30,000 SF of indoor and outdoor amenities, including two lobbies, three landscaped terraces, Club Solarium (a lounge equipped with a 65-inch TV, fireplace, pool table, and communal table), Energy Solarium (an open space that opens up to an outdoor terrace and can be used as a group fitness area or for social events), a 7,000 SF fitness center and 1,885 SF leasing office. All terraces feature designs inspired by the natural landscapes of Northern California’s Napa Valley, Big Sur, and Muir Woods, offer Wi-Fi and sound systems and are equipped with outdoor heaters. In addition, the 3rd floor Urban Terrace features a 60-foot lap pool with an environmentally friendly saline water treatment system, and a large fire pit surrounded by seating and grilling stations with dining tables. The
THE INFORMATION IN THIS STRUCTURAL AND COLLATERAL TERM SHEET IS NOT COMPLETE AND MAY BE AMENDED PRIOR TO THE TIME OF SALE. THIS TERM SHEET IS NOT AN OFFER TO SELL THESE SECURITIES AND IT IS NOT A SOLICITATION OF AN OFFER TO BUY THESE SECURITIES IN ANY JURISDICTION WHERE THE OFFER OR SALE IS NOT PERMITTED.
109
| Structural and Collateral Term Sheet | BBCMS 2019-C3 | |
| No. 8 – NEMA San Francisco | ||
Skyline Terrace on the 24th floor includes views of the city and San Francisco Bay. The solariums can serve as a communal workplace or can be reserved for private gatherings.
The NEMA San Francisco Property offers a variety of resident services, including 24/7 concierge, housekeeping, pet wash/dog walk and food deliveries. The business lounge provides Apple computers, a laptop station area, printers, fax machines, scanners and executive conference rooms, available for rent on a half-day basis. The NEMA San Francisco Property also provides residents use of the building’s proprietary application for various functionalities including guest access, package notifications, community updates, rent payment, maintenance requests, amenity reservations and service bookings. In addition, interactive touchscreens, located throughout the NEMA San Francisco Property’s amenity areas, display local transit schedules, weather, and headline news. Residents can request their cars from the valet or RSVP to an event using these touchscreens. The NEMA San Francisco Property also features keyless access, private Wi-Fi networks with gigabit internet and smart elevators with destination control.
The NEMA San Francisco Property received a LEED Silver certification from the U.S. Green Building Council for the efforts made in its development to minimize its environmental footprint. The NEMA San Francisco Property provides bicycle storage, electric car charging stations, and low-emitting vehicle sharing options, which complements the NEMA San Francisco Property’s location within walking distance of four metro stations and shuttle and bus stops. Additionally, the NEMA San Francisco Property features low-emitting interior design elements and uses recycled materials to landscape rooftops.
The NEMA San Francisco Property’s unit amenities include oversized windows, modern finishes, polished concrete or wood floors, washer and dryer, spacious closets, solid core doors, roller shades, quartz countertops, slow close drawers, stainless steel appliances, large bathrooms with soaking tubs and Hansgrohe faucets. Each unit also offers programmable thermostats with zoned heating and pre-wiring for TV, internet and telephones. Premium residences feature private balconies, gas stoves and wine refrigerators. Additional services include move-in coordination, interior design consultations, and installation of furnishings. One-bedroom and two-bedroom units are above-average size relative to competitive projects, according to the appraisal.
The NEMA San Francisco Property also features a 550-space parking garage (0.73 spaces per unit) with valet service, car share availability, a car wash and car charging stations. The parking garage currently generates daily and monthly rental income from transient and monthly parking users. Approximately 350 storage units are available for rent as well at $75 per month in the lower level of the NEMA San Francisco Property.
Environmental. According to a Phase I environmental assessment dated December 21, 2018, there is no evidence of any recognized environmental conditions, historical recognized environmental conditions, controlled recognized environmental conditions, de minimis conditions, or considerations of other environmental conditions at the NEMA San Francisco Property.
| Historical and Current Occupancy(1) | ||||
| 2015 | 2016 | 2017 | 2018 | Current(2) |
| 94.0% | 95.4% | 93.4% | 95.5% | 94.0% |
| (1) | Historical Occupancy is provided by the Borrower. Occupancies are as of December 31 of each respective year. |
| (2) | Current Occupancy is as of January 14, 2019. |
THE INFORMATION IN THIS STRUCTURAL AND COLLATERAL TERM SHEET IS NOT COMPLETE AND MAY BE AMENDED PRIOR TO THE TIME OF SALE. THIS TERM SHEET IS NOT AN OFFER TO SELL THESE SECURITIES AND IT IS NOT A SOLICITATION OF AN OFFER TO BUY THESE SECURITIES IN ANY JURISDICTION WHERE THE OFFER OR SALE IS NOT PERMITTED.
110
| Structural and Collateral Term Sheet | BBCMS 2019-C3 | |
| No. 8 – NEMA San Francisco | ||
| Multifamily Unit Mix(1) | ||||||
| Unit Type | # of Units | % of Units | Occupied Units | % Occupied | Average SF | Avg. Monthly Rent |
| Studio(2) | 274 | 36.3% | 258 | 94.2% | 533 | $3,370 |
| Studio - Affordable | 38 | 5.0 | 37 | 97.4% | 595 | $1,111 |
| 1 Bed/1 Bath(2) | 285 | 37.8 | 265 | 93.0% | 851 | $4,343 |
| 1 Bed/1 Bath - Affordable | 38 | 5.0 | 38 | 100.0% | 813 | $1,563 |
| 2 Bed/2 Bath(2) | 103 | 13.7 | 95 | 92.2% | 1,392 | $6,437 |
| 2 Bed/2 Bath - Affordable | 14 | 1.9 | 14 | 100.0% | 1,162 | $1,673 |
| 3 Bed/2 Bath | 2 | 0.3 | 2 | 100.0% | 1,843 | $9,150 |
| Collateral Total | 754 | 100.0% | 709 | 94.0% | 803 | $3,913 |
| (1) | Based on the underwritten rent roll. |
| (2) | Seven of the 664 market rate units are non-revenue units, including three model units, two guest suites, and two Crescent Heights’ corporate units. All non-revenue units are underwritten as vacant. |
| Retail Tenant Summary(1) | |||||||||
| Tenant | Ratings Moody’s/S&P/ Fitch | Net Rentable Area (SF) | % of Total NRA | Market Rent PSF | Base Rent PSF | Annual Base Rent | % of Occupied Total Base Rent | Expected Lease Expiration Date | |
| Steel & Lacquer LLC | NA / NA / NA | 2,000 | 17.9% | $50.00 | $47.70 | $95,400 | 62.6% | May 2025 | |
| The Tea Box(2) | NA / NA / NA | 904 | 8.1 | $65.00 | $63.00 | 56,952 | 37.4 | June 2022 | |
| Occupied Tenants | 2,904 | 26.0% | $54.67 | $52.46 | $152,352 | 100.0% | |||
| Orange Theory(3) | NA / NA / NA | 3,206 | 28.7 | $55.00 | $53.50 | 171,521 | July 2029 | ||
| Philz Coffee, Inc.(4) | NA / NA / NA | 1,749 | 15.6 | $60.00 | $58.00 | 101,442 | November 2029 | ||
| Leased Tenants | 4,955 | 44.3 | 272,963 | ||||||
| Occupied and Leased Tenants | 7,859 | 70.3% | $55.99 | $54.12 | $425,315 | ||||
| Vacant Space | 3,325 | 29.7% | $55.00 | ||||||
| Collateral Total | 11,184 | 100.0% | $55.70 | ||||||
| (1) | Based on the tenant leases. |
| (2) | The Tea Box accepted its space January 11, 2019, and is currently building it out, with rent commencing no later than June 10, 2019. At loan origination, $14,238 upfront rent abatement reserve was escrowed to cover The Tea Box free rent assuming rent commences on June 10, 2019, at the latest. |
| (3) | Orange Theory’s rent commences the earlier of (1) 120 days after the tenant receives a building permit from the City of San Francisco, which is in process, according to the Borrower (as defined below), or (2) when Orange Theory opens for business. |
| (4) | Philz Coffee, Inc. has signed a lease conditioned upon obtaining a conditional use permit. Philz Coffee, Inc. is underwritten as vacant as the timeline is unknown as to when the tenant will take possession of its space. The appraiser concluded a reasonable rent commencement date of November 2019 for the tenant. Upon Philz Coffee, Inc. lease commencement, the commercial component of the NEMA San Francisco Property will be 70.3% occupied. |
THE INFORMATION IN THIS STRUCTURAL AND COLLATERAL TERM SHEET IS NOT COMPLETE AND MAY BE AMENDED PRIOR TO THE TIME OF SALE. THIS TERM SHEET IS NOT AN OFFER TO SELL THESE SECURITIES AND IT IS NOT A SOLICITATION OF AN OFFER TO BUY THESE SECURITIES IN ANY JURISDICTION WHERE THE OFFER OR SALE IS NOT PERMITTED.
111
| Structural and Collateral Term Sheet | BBCMS 2019-C3 | |
| No. 8 – NEMA San Francisco | ||
Operating History and Underwritten Net Cash Flow | ||||||
| 2016 | 2017 | 2018(1) | Underwritten | Per Unit | %(2) | |
| Rents in Place | $34,449,831 | $34,555,478 | $35,107,999 | $35,609,712 | $47,227.73 | 100.0% |
| Vacant Income | 0 | 0 | 0 | 0 | 0 | 0.0 |
| Gross Potential Rent | $34,449,831 | $34,555,478 | $35,107,999 | $35,609,712 | $47,227.73 | 100.0% |
| Total Reimbursements | 0 | 0 | 0 | 0 | 0 | 0.0 |
| Net Rental Income | $34,449,831 | $34,555,478 | $35,107,999 | $35,609,712 | $47,227.73 | 100.0% |
| (Vacancy/Credit Loss) | (2,741,650) | (3,306,859) | (4,025,711) | (3,836,495) | (5,088.19) | (10.8) |
| Other Income | 2,901,620 | 3,167,610 | 3,262,697 | 3,345,775 | 4,437.37 | 9.4 |
| Effective Gross Income | $34,609,801 | $34,416,229 | $34,344,985 | $35,118,992 | $46,576.91 | 98.6% |
| Total Expenses | $13,996,824 | $13,674,751 | $13,864,586 | $13,967,383 | $18,524.38 | 39.8% |
| Net Operating Income | $20,612,978 | $20,741,478 | $20,480,399 | $21,151,609 | $28,052.53 | 60.2% |
| Total TI/LC, Capex/RR | 0 | 0 | 0 | 178,684 | 236.98 | 0.51 |
| Net Cash Flow | $20,612,978 | $20,741,478 | $20,480,399 | $20,972,925 | $27,815.55 | 59.7% |
| (1) | Based on November 2018 trailing twelve months cash flow. |
| (2) | % column represents percent of Net Rental Income for all revenue lines and represents percent of Effective Gross Income for the remainder of fields. |
The Market.The NEMA San Francisco Property is located in San Francisco’s Mid-Market neighborhood at the intersection of the South of Market (“SoMa”), Civic Center, Hayes Valley, and The Mission neighborhoods, providing the tenant base with proximity to employment centers, cultural destinations, and transportation access, in addition to restaurants and nightlife. The NEMA San Francisco Property is located in proximity to numerous high-tech companies, including Twitter’s headquarters (located within a block), which has more than 1,000 employees and recently signed an early lease extension. Uber’s headquarters (268,080 SF) is located within a block from the NEMA San Francisco Property and the company is expanding to multiple offices at nearby sites. The headquarters of Square and Dolby Labs are also located within a few blocks. Nearby local cultural and government facilities include the San Francisco Museum of Modern Art, the Asian Art Museum of San Francisco, Bill Graham Civic Auditorium, and San Francisco City Hall. Additional leisure spots include Yerba Buena Gardens and Oracle Park, home of Major League Baseball’s San Francisco Giants. The NEMA San Francisco Property’s location on Market Street provides access to Bay Area Rapid Transit, Muni Metro and U.S. Highway 101.
According to a third-party market research report, the NEMA San Francisco Property is located within the SoMa multifamily submarket, which has a reported vacancy rate as of December 2018 of 4.4%, with market rent of $4,045 and effective rents of $3,995 per unit per month. The current effective rent of $3,995 has increased by 7.3% from year-end 2017. According to a third-party market research report, as of year-end 2018, the population within a one-, three- and five-mile radius was 132,008, 520,027 and 846,055, respectively. Additionally, for the same period, theaverage household income within a one-, three- and five-mile radius was$91,666, $137,671 and $132,216, respectively.According to a third-party market research report, the SoMa submarket caters predominantly to apartment dwellers. Of the more than 261,000 housing units located within a three-mile radius of the NEMA San Francisco Property, almost 75% are renters, and 25% of residents are between the ages of 25-34 as of 2018. Additionally, approximately half of the 25-34 year-old age group are earning more than $100,000 annually.
THE INFORMATION IN THIS STRUCTURAL AND COLLATERAL TERM SHEET IS NOT COMPLETE AND MAY BE AMENDED PRIOR TO THE TIME OF SALE. THIS TERM SHEET IS NOT AN OFFER TO SELL THESE SECURITIES AND IT IS NOT A SOLICITATION OF AN OFFER TO BUY THESE SECURITIES IN ANY JURISDICTION WHERE THE OFFER OR SALE IS NOT PERMITTED.
112
| Structural and Collateral Term Sheet | BBCMS 2019-C3 | |
| No. 8 – NEMA San Francisco | ||
| Submarket Statistics(1) | |||||
| Time | Effective Rents | Vacancy | Inventory (Units) | Net Absorption | Net Deliveries |
| 2013 | $3,502 | 4.9% | 5,774 | 1,370 | 1,497 |
| 2014 | $3,697 | 5.4% | 6,578 | 730 | 804 |
| 2015 | $3,801 | 8.1% | 7,034 | 247 | 456 |
| 2016 | $3,717 | 11.7% | 8,663 | 1,185 | 1,629 |
| 2017 | $3,724 | 6.6% | 9,366 | 1,095 | 703 |
| 2018 | $3,995 | 4.4% | 9,859 | 679 | 493 |
| 2019 Projection | $4,171 | 6.0% | 10,885 | 818 | 1,036 |
| (1) | Source: third-party market research report. |
The Borrower. The borrowing entity for the loan is Tenth and Market, LLC (the “Borrower”). The Borrower is one of a number of companies operating under the trade name of “Crescent Heights”, whose senior principals are Sonny Kahn, Russell W. Galbut and Bruce A. Menin (such companies, the “Crescent Heights Companies”). Crescent Heights is a real estate development brand based in Miami, Florida, whose senior principals have over 30 years of industry experience. The Crescent Heights Companies specialize in the development, ownership and operation of residential high-rises in major cities across the United States. The Crescent Heights Companies have offices in five major U.S. markets: New York, Miami, Chicago, San Francisco and Los Angeles. Since its founding, the Crescent Heights brand has been associated with over 150 projects, including more than 38,000 completed residences, with a total development value in excess of $12.0 billion.
Crescent Heights’ notable multifamily projects include: Ten Thousand, Los Angeles (a 40-story building with views of both Pacific Ocean and downtown Los Angeles), the Hanley, New York (a 20-story building situated in the Upper East Side submarket of Manhattan), NEMA Chicago (a 76-story building located directly across the street from historic Grant Park) and NEMA Boston (a 21-story building located within Boston’s Seaport neighborhood). Crescent Heights’ other San Francisco projects include: Jasper, a 320-unit Class A rental in Rincon Hill (1.8 miles northeast; received "Best New Development Award" by the San Francisco Apartment Association in 2015), 524 Howard (currently under construction; 1.7 miles northeast; 350 units), 325 Fremont (1.8 miles northeast; 118 units), Metropolitan (1.8 miles northeast; 342 condo residences), and 10 South Van Ness (proposed; 0.2 miles southwest; 984 rental units).
Crescent Heights has been recognized with numerous industry awards, including National Association of Home Builder’s Freddie Mac Multi-Family Firm of the Year award (2006), Best Multifamily Project of the Year (2017) from the Los Angeles Business Journal, Best of the City (2017) from Angeleno Magazine, Build America Award (2015) from AGC of America, and Best Real Estate Deal of the Year (2014) from the San Francisco Business Times, among others.
The Loan Sponsor. The Loan Sponsor is Crescent Heights. The individual trustees of the business trusts (collective, the “Guarantors”) are three founders and managing principals of Crescent Heights, Bruce A. Menin, Russell W. Galbut, and Sonny Kahn (in their individual capacities, collectively, the “Individual Trustees”), who collectively have over 90 years of industry experience. As of September 30, 2018, the Guarantors reported a collective net worth and liquidity of approximately $803.5 million and $94.7 million, respectively. Generally, any liability of the Guarantors will be satisfied solely out of the assets of the business trusts and the lender will have no recourse to any assets personally owned by the Individual Trustees. However, as the Guarantors are revocable trusts, upon the revocation of any trust, the related Individual Trustee, under certain circumstances, will have personal liability for the Guaranty, and the Guaranty will be enforceable against the Individual Trustee. The Guarantors have approximately $73.2 million of contingent liabilities in various investments, including the bad boy carve-outs on the current debt outstanding on the NEMA San Francisco Property.
Property Management. The NEMA San Francisco Property is managed by CH Management Services, LLC, a borrower sponsor-affiliated management company (the “Manager”). The Development and Management Agreement between the Borrower and Manager dated October 31, 2011 specifies a management fee of 3.0% of gross revenues. The parking garage is also managed by a borrower sponsor affiliate, CH Parking, LLC, which, per the parking management agreement dated July 27, 2016, receives a management fee of $2,500 per month.
Escrows and Reserves. At origination, the Borrower deposited in escrow (i) $2,063,608 for real estate taxes, (ii) $402,392 for insurance premiums, and (iii) $14,238 for rent abatement.
Tax Escrows – On a monthly basis, the Borrower is required to escrow 1/12th of the annual estimated tax payments, which currently equals $421,010.
THE INFORMATION IN THIS STRUCTURAL AND COLLATERAL TERM SHEET IS NOT COMPLETE AND MAY BE AMENDED PRIOR TO THE TIME OF SALE. THIS TERM SHEET IS NOT AN OFFER TO SELL THESE SECURITIES AND IT IS NOT A SOLICITATION OF AN OFFER TO BUY THESE SECURITIES IN ANY JURISDICTION WHERE THE OFFER OR SALE IS NOT PERMITTED.
113
| Structural and Collateral Term Sheet | BBCMS 2019-C3 | |
| No. 8 – NEMA San Francisco | ||
Insurance Escrows – On a monthly basis, the Borrower is required to escrow 1/12th of the annual estimated insurance payments, which currently equals $57,485.
Replacement Reserves – On a monthly basis, the Borrower is required to escrow $14,890 for replacement reserves subject to a cap of $250,000. At any time after the cap is met, if the amount on deposit in the replacement reserve falls below $178,684, monthly deposits will commence until the cap is met.
Lockbox / Cash Management.The NEMA San Francisco Whole Loan is structured with a soft lockbox for residential tenants and a hard lockbox for commercial tenants, with in-place cash management. At origination, the Borrower established an account (the “Clearing Account”) into which income from the NEMA San Francisco Property is required to be deposited. At origination, the Borrower delivered a tenant direction letter to each existing commercial tenant at the property directing them to remit their rent checks directly into the Clearing Account. The Borrower is also required to deliver tenant direction letters to each commercial tenant entering into a lease after the origination date. All rents received by the Borrower or the Manager are required to be deposited into the Clearing Account within two business days of receipt.
Funds deposited into the Clearing Account are required to be swept by the clearing bank on a daily basis into an eligible account established by lender (the “Deposit Account”) and applied and disbursed in accordance with the loan documents. Funds in the Deposit Account will be invested at lender’s discretion only in permitted investments. Lender will also establish subaccounts of the Deposit Account, which are required at all times to be eligible accounts (and may be ledger or book entry accounts and not actual accounts) (such subaccounts are referred to herein as “Subaccounts”). The Deposit Account and any Subaccounts will be under the sole control and dominion of lender, and the Borrower will have no right of withdrawal from such accounts. The Borrower is required to pay for all expenses of opening and maintaining the above accounts. During a Cash Sweep Period (as defined below), all excess cash flow from the NEMA San Francisco Property (after debt service, required escrows and reserves and approved operating expenses) will be swept into an account controlled by the lender and held as cash collateral for the NEMA San Francisco Whole Loan.
At all times other than during the continuance of a Cash Sweep Period, funds on deposit in the Clearing Account may be released to the Borrower in accordance with the NEMA San Francisco Whole Loan documents.
A “Cash Sweep Period” will commence upon: (i) an event of default or (ii) the failure by the Borrower, after the end of a calendar quarter, to maintain the whole loan debt service coverage ratio of at least 1.10x, and will end upon lender giving notice to the Borrower and the clearing bank that the Cash Sweep Period has ended, which notice lender will only be required to give if (1) the NEMA San Francisco Whole Loan and all other obligations under the NEMA San Francisco Whole Loan documents have been repaid in full or (2) in the case of a Cash Sweep Period triggered by an event described in subclause (ii) above only, as of the end of six consecutive months since the commencement of the existing Cash Sweep Period (A) no event of default has occurred and is continuing, (B) no event that would trigger another Cash Sweep Period has occurred, and (C) the whole loan debt service coverage ratio is at least equal to 1.15x.
Subordinate and Mezzanine Debt.The NEMA San Francisco Whole Loan includes a senior subordinate companion A-B Note with an original principal balance of $69,000,000 (the “A-B Note”) and two junior subordinate companion loans with outstanding principal balance of $60.0 million (B-1 Note) and $50.0 million (B-2 Note), respectively. The subordinate companion loans are coterminous with the NEMA San Francisco Mortgage Loan. The A-B Note accrues interest at 4.43598540291971%, the B-1 Note accrues interest at 4.80000%, and the B-2 Note accrues interest at 5.95000%. The UW NCF DSCR and UW NOI debt yield on the NEMA San Francisco Whole Loan (including the related subordinate companion loans) are 1.15x and 5.5%, respectively. The relative rights and obligations of the holders of the A Notes, A-B Note and B Notes are governed by the terms of a co-lender agreement.
Partial Release.Notpermitted.
Ground Lease.None.
THE INFORMATION IN THIS STRUCTURAL AND COLLATERAL TERM SHEET IS NOT COMPLETE AND MAY BE AMENDED PRIOR TO THE TIME OF SALE. THIS TERM SHEET IS NOT AN OFFER TO SELL THESE SECURITIES AND IT IS NOT A SOLICITATION OF AN OFFER TO BUY THESE SECURITIES IN ANY JURISDICTION WHERE THE OFFER OR SALE IS NOT PERMITTED.
114
[THIS PAGE INTENTIONALLY LEFT BLANK]
115
| Structural and Collateral Term Sheet | BBCMS 2019-C3 | |
| No. 9 – 787 Eleventh Avenue | ||

THE INFORMATION IN THIS STRUCTURAL AND COLLATERAL TERM SHEET IS NOT COMPLETE AND MAY BE AMENDED PRIOR TO THE TIME OF SALE. THIS TERM SHEET IS NOT AN OFFER TO SELL THESE SECURITIES AND IT IS NOT A SOLICITATION OF AN OFFER TO BUY THESE SECURITIES IN ANY JURISDICTION WHERE THE OFFER OR SALE IS NOT PERMITTED.
116
| Structural and Collateral Term Sheet | BBCMS 2019-C3 | |
| No. 9 – 787 Eleventh Avenue | ||
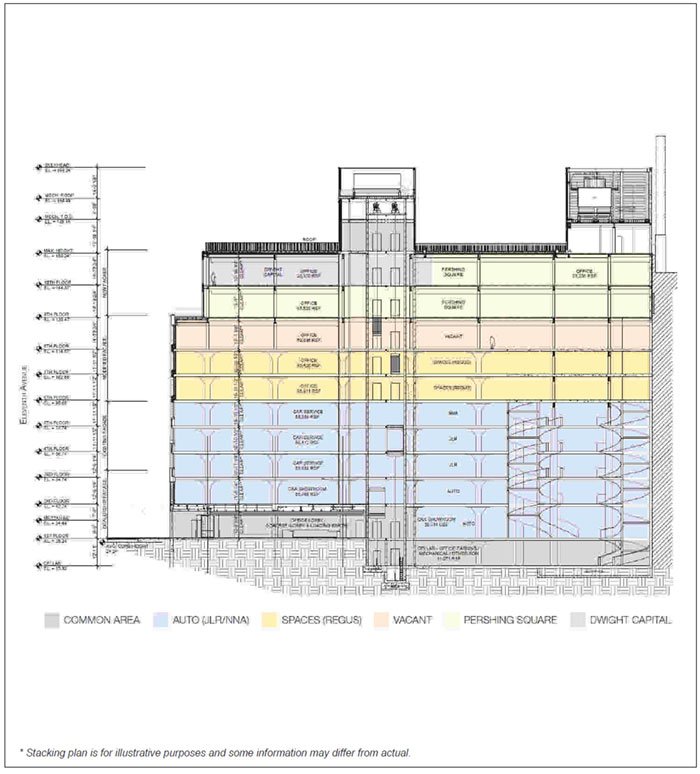
THE INFORMATION IN THIS STRUCTURAL AND COLLATERAL TERM SHEET IS NOT COMPLETE AND MAY BE AMENDED PRIOR TO THE TIME OF SALE. THIS TERM SHEET IS NOT AN OFFER TO SELL THESE SECURITIES AND IT IS NOT A SOLICITATION OF AN OFFER TO BUY THESE SECURITIES IN ANY JURISDICTION WHERE THE OFFER OR SALE IS NOT PERMITTED.
117
| Structural and Collateral Term Sheet | BBCMS 2019-C3 | |
| No. 9 – 787 Eleventh Avenue | ||
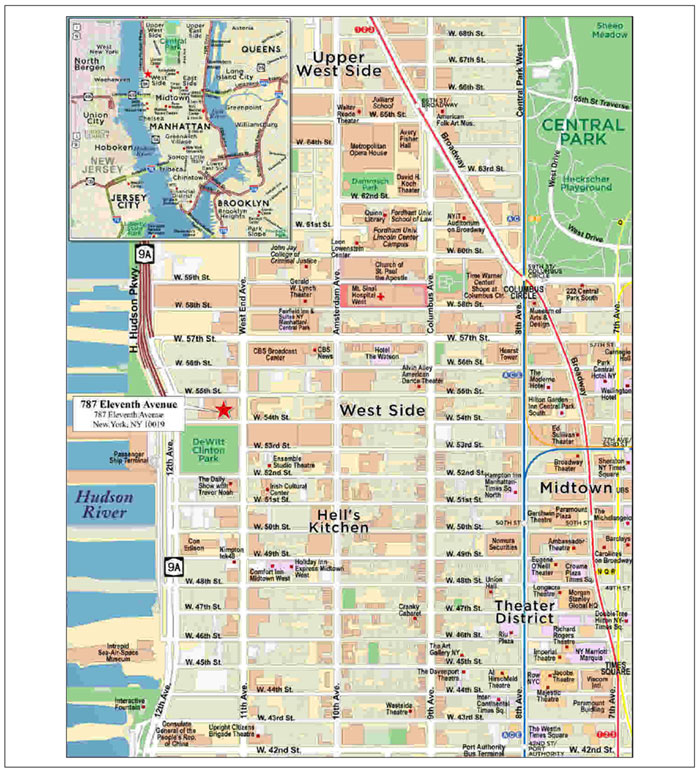
THE INFORMATION IN THIS STRUCTURAL AND COLLATERAL TERM SHEET IS NOT COMPLETE AND MAY BE AMENDED PRIOR TO THE TIME OF SALE. THIS TERM SHEET IS NOT AN OFFER TO SELL THESE SECURITIES AND IT IS NOT A SOLICITATION OF AN OFFER TO BUY THESE SECURITIES IN ANY JURISDICTION WHERE THE OFFER OR SALE IS NOT PERMITTED.
118
| Structural and Collateral Term Sheet | BBCMS 2019-C3 | |
| No. 9 – 787 Eleventh Avenue | ||
| Mortgage Loan Information | Property Information | ||||
| Mortgage Loan Seller: | SGFC | Single Asset / Portfolio: | Single Asset | ||
| Credit Assessment (Fitch / KBRA): | BBB- / BBB- | Title: | Fee | ||
| Original Principal Balance(1): | $30,000,000 | Property Type - Subtype: | Mixed Use – Retail / Office | ||
| Cut-off Date Principal Balance(1): | $30,000,000 | Net Rentable Area (SF): | 513,638 | ||
| % of IPB: | 3.2% | Location: | New York, NY | ||
| Loan Purpose: | Refinance | Year Built / Renovated: | 1929 / 2019 | ||
| Borrower: | Georgetown Eleventh Avenue Owners, LLC | Occupancy(3): | 88.4% | ||
| Borrower Sponsors: | TABLE Holdings, L.P., Georgetown Company, William A. Ackman and Adam R. Flatto | Occupancy Date: | 11/1/2018 | ||
| 4th Most Recent NOI (As of)(4): | NAV | ||||
| Interest Rate: | 4.53031685470085% | 3rd Most Recent NOI (As of)(4): | NAV | ||
| Note Date: | 1/9/2019 | 2nd Most Recent NOI (As of)(4): | NAV | ||
| Maturity Date: | 2/8/2029 | Most Recent NOI (As of)(4): | NAV | ||
| Interest-only Period: | 120 months | UW Economic Occupancy: | 88.2% | ||
| Original Term: | 120 months | UW Revenues: | $33,408,153 | ||
| Original Amortization Term: | None | UW Expenses: | $8,150,648 | ||
| Amortization Type: | Interest Only | UW NOI: | $25,257,505 | ||
| Call Protection(2): | L(28),DeforGrtr1%orYM(85),O(7) | UW NCF: | $24,178,865 | ||
| Lockbox / Cash Management: | Hard / Springing | Appraised Value / Per SF: | $650,000,000 / $1,265 | ||
| Additional Debt(1): | Yes | Appraisal Date: | 12/2/2018 | ||
| Additional Debt Balance(1): | $145,000,000 / $117,500,000 / $117,500,000 | ||||
| Additional Debt Type(1): | Pari Passu/ A-2 Note / B-Note | ||||
| Escrows and Reserves(5) | Financial Information(1) | ||||||||||
| Initial | Monthly | Initial Cap | A-Notes | Whole Loan | |||||||
| Taxes: | $0 | Springing | N/A | Cut-off Date Loan / SF: | $341 | $798 | |||||
| Insurance: | $0 | Springing | N/A | Maturity Date Loan / SF: | $341 | $798 | |||||
| Replacement Reserves: | $0 | $0 | N/A | Cut-off Date LTV: | 26.9% | 63.1% | |||||
| TI/LC: | $24,775,711 | Springing | N/A | Maturity Date LTV: | 26.9% | 63.1% | |||||
| Other: | $21,796,088 | $0 | N/A | UW NCF DSCR: | 3.01x | 1.17x | |||||
| UW NOI Debt Yield: | 14.4% | 6.2% | |||||||||
| Sources and Uses | |||||||||||
| Sources | Proceeds | % of Total | Uses | Proceeds | % of Total | ||||||
| Whole Loan(1) | $410,000,000 | 100.0% | Payoff Existing Debt | $320,367,552 | 78.1% | ||||||
| Upfront Reserves | 46,571,799 | 11.4 | |||||||||
| Return of Equity | 36,281,750 | 8.8 | |||||||||
| Closing Costs | 6,778,899 | 1.7 | |||||||||
| Total Sources | $410,000,000 | 100.0% | Total Uses | $410,000,000 | 100.0% | ||||||
| (1) | The 787 Eleventh Avenue mortgage loan is part of a larger split whole loan evidenced by (i) fourpari passu notes with an aggregate original principal balance of $175.0 million, (ii) one senior subordinate note with an original principal balance of $117.5 million and (iii) one junior subordinate note with an original principal balance of $117.5 million. The financial information presented in the chart above and herein reflects the Cut-off Date balance of the A Notes (as defined below). |
| (2) | At any time after the earlier to occur of (i) January 9, 2022 and (ii) two years from the closing date of the securitization that includes the last note of the 787 Eleventh Avenue Whole Loan to be securitized, the borrower has the right to either (a) defease the 787 Eight Avenue Whole Loan or (b) prepay the 787 Eighth Avenue Whole Loan, provided that the borrower pays the greater of a yield maintenance premium or a prepayment premium equal to 1.0% of the principal balance being prepaid. |
| (3) | Spaces (Regus Plc) (“Regus”) and Pershing Square Capital Management (“Pershing Square”) are currently building out their respective spaces and are expected to take occupancy in 2019. Nissan North America (“Nissan”) is currently building out its respective space and its expected occupancy date is yet to be determined. |
| (4) | Historical cash flows are unavailable as the 787 Eleventh Avenue Property (as defined below) was acquired by the borrower sponsors in 2015 and subsequently redeveloped through 2019. |
| (5) | For a full description of Escrows and Reserves, please refer to “Escrows and Reserves” below. |
THE INFORMATION IN THIS STRUCTURAL AND COLLATERAL TERM SHEET IS NOT COMPLETE AND MAY BE AMENDED PRIOR TO THE TIME OF SALE. THIS TERM SHEET IS NOT AN OFFER TO SELL THESE SECURITIES AND IT IS NOT A SOLICITATION OF AN OFFER TO BUY THESE SECURITIES IN ANY JURISDICTION WHERE THE OFFER OR SALE IS NOT PERMITTED.
119
| Structural and Collateral Term Sheet | BBCMS 2019-C3 | |
| No. 9 – 787 Eleventh Avenue | ||
The Loan.The 787 Eleventh Avenue mortgage loan is part of a whole loan evidenced by (i) fourpari passupromissory notes with an aggregate original principal balance of $175,000,000 (the “A-Notes”), (ii) one senior subordinate note with an original principal balance of $117,500,000 (“Note A-2”), which is subordinate to the A-Notes, and (iii) one junior subordinate note with an original principal balance of $117,500,000 (“Note B”), which is subordinate to both the A-Notes andNote A-2 (collectively, the “787 Eleventh Avenue Whole Loan”). The 787 Eleventh Avenue Whole Loan is secured by the fee interest in a 513,638 square foot, 10-story, mixed use, Class A office building, automotive retail showroom and service center space located on 11th Avenue between West 54th and 55th Streets in the Midtown West neighborhood of Manhattan (the “787 Eleventh Avenue Property”). The 787 Eleventh Avenue loan is represented by the non-controlling Note A-1C. The below table summarizes the 787 Eleventh Avenue Whole Loan, including the remaining unsecuritizedpari passuA-Note. The 787 Eleventh Avenue Whole Loan is serviced pursuant to the pooling and servicing agreement for the SGCMS 2019-787E Trust. See “Description of the Mortgage Pool—The Whole Loans—The Non-Serviced AB Whole Loans” and “Pooling and Servicing Agreement” in the Preliminary Prospectus. The holder of Note B (the “Controlling Noteholder”) is entitled to exercise all of the rights of the Controlling Noteholder with respect to the 787 Eleventh Avenue Whole Loan; however, the holders of the remaining notes are entitled, under certain circumstances, to consult with respect to certain major decisions. Note B was sold to a third-party investor. The 787 Eleventh Avenue Whole Loan has a 10-year term and is interest-only for the full term of the loan.
| Whole Loan Summary | |||
| Note | Original Balance | Note Holder | Controlling Piece |
| Note A-1A | $70,000,000 | SGCMS 2019-787E | No |
| Note A-1B | 45,000,000 | CSAIL 2019-C15 | No |
| Note A-1C | 30,000,000 | BBCMS 2019-C3 | No |
| Note A-1D | 30,000,000 | SGFC | No |
| Note A-2 | 117,500,000 | SGCMS 2019-787E | No |
| Note B | 117,500,000 | Third-Party Investor | Yes |
| Total | $410,000,000 | ||
The Property. The 787 Eleventh Avenue Property is a 513,638 square foot, 10-story, mixed use, Class A office, automotive retail showroom and service center building occupying the entire block on the west side of 11th Avenue between West 54th and 55th Streets in the Midtown West neighborhood of Manhattan. Originally built in 1929, the 787 Eleventh Avenue Property formerly housed Ford’s automotive flagship showroom facility.
The 787 Eleventh Avenue Property was acquired by the borrower sponsors in 2015 for approximately $255.5 million ($497 per square foot). Following the acquisition, the borrower sponsors commenced a $275.2 million ($536 per square foot) redevelopment and expansion of the existing improvements that created a mixed use building with Class A office space while retaining a portion of the original automotive retail showroom and service center. The redevelopment included converting three floors of the existing building from automotive retail showroom and service center use to office use, the addition of two new office floors, renovation of the lobby, entrance and façade (including the installation of oversized windows), executive parking in the basement, a wrap-around terrace on the 9th floor and a roof deck with a private tennis court and views of Manhattan, the Hudson River and New Jersey. Additional office tenant amenities include shuttle service to public transportation and access to the Mercedes Club across the street that offers a fitness center.
Located in the Midtown West neighborhood of Manhattan known as “Automobile Row”, the 787 Eleventh Avenue Property benefits from zoning that allows automotive tenants to perform both sales and service operations, a designation which is limited to properties west of 11th Avenue (unless otherwise grandfathered). The 787 Eleventh Avenue Property’s close proximity to the West Side Highway, Lincoln Tunnel and 57th Street east / west corridor provides access for automobile customers. According to the appraisal, the 787 Eleventh Avenue Property is the only building in the surrounding marketplace that features a double-helix ramp allowing for two-way, floor-by-floor vehicular access without reliance on an elevator like neighboring properties. This access feature provides valuable time and cost savings to tenants. As of November 1, 2018, the 787 Eleventh Avenue Property was 88.4% leased by five tenants.
THE INFORMATION IN THIS STRUCTURAL AND COLLATERAL TERM SHEET IS NOT COMPLETE AND MAY BE AMENDED PRIOR TO THE TIME OF SALE. THIS TERM SHEET IS NOT AN OFFER TO SELL THESE SECURITIES AND IT IS NOT A SOLICITATION OF AN OFFER TO BUY THESE SECURITIES IN ANY JURISDICTION WHERE THE OFFER OR SALE IS NOT PERMITTED.
120
| Structural and Collateral Term Sheet | BBCMS 2019-C3 | |
| No. 9 – 787 Eleventh Avenue | ||
Major Tenants.
GJM OPCO LLC – Jaguar Land Rover (161,195 square feet; 31.4% of NRA; 29.8% of Base Rent): GJM OPCO LLC – Jaguar Land Rover (“GJM OPCO”) is the franchise dealership operator. GJM OPCO is owned by Jonathan Sobel, a former partner at Goldman Sachs and owner of car dealerships throughout the New York region, including BMW, Mini, Porsche, Audi, Chrysler, Jeep, Dodge and Ram. GJM OPCO operates a Jaguar Land Rover dealership (“Jaguar Land Rover”) under a lease expiring in 2032 with two, five-year renewal options. Jaguar Land Rover is a British multinational automotive company and a subsidiary of Tata Motors, a publicly traded Indian automotive company rated AA by Crisil, an India based ratings firm owned by Standard & Poor’s. As of March 2018, the company reported total revenue of £25.8 billion and profit before taxes of £1.5 billion with reported retail sales of 614,309 cars. North America accounted for approximately 129,319 cars or 21.1% of those sales.
Nissan (106,391 square feet; 20.7% of NRA; 22.7% of Base Rent): Nissan is engaged in the manufacturing, sales and related business of automotive products and marine equipment. Nissan’s business segments include automobile sales and financing. The company offers products and services in over 160 countries across the world selling approximately 60 models under the Nissan, Infiniti and Datsun brands. As of March 2018, Nissan reported total net revenue of approximately $112.4 billion, net income from operations of approximately $7.0 billion and total assets of approximately $176.4 billion. According to the borrower sponsors, Nissan has not yet taken occupancy but is expected to have a flagship store at the 787 Eleventh Avenue Property, which would be its only dealership location in Manhattan. See “Description of the Mortgage Pool—Mortgage Pool Characteristics—Litigation and Other Considerations” in the Preliminary Prospectus. Nissan leases 106,391 square feet through July 2032 with two, ten-year renewal options. Nissan leases its space directly and is expected to have a third-party franchisee manage the day to day operations.
Regus (99,337 square feet; 19.3% of NRA; 23.0% of Base Rent): Regus is listed on the London Stock Exchange under the name IWG Plc. Regus’ network includes a global community of 2.5 million members, over 3,000 business centers, spanning more than 1,000 cities across more than 110 countries. As of December 2017, Regus reported total revenue of approximately £2.4 billion, operating profit of £163.2 million and total assets of approximately £2.9 billion. Regus’ Americas operations accounted for approximately £984.8 million, representing approximately 41.9% of its total revenues for 2017. Regus has not yet taken occupancy at the 787 Eleventh Avenue Property, but is expected to operate as a Spaces International Workplace Group (“Spaces”) location, Regus’ brand that provides creative workspaces. The Spaces lease is guaranteed by Regus and its United States subsidiary on a joint and several basis for an amount up to approximately $14.4 million. Regus, leases 99,337 square feet through October 2031 with one, five-year renewal option. The 787 Eleventh Avenue Property will house one of only two locations in Manhattan at which Regus signed leases in 2018, with the other location being the Chrysler Building. Regus has an option to terminate its lease in October 2028 with 12 months’ notice and the payment of a termination fee equal to $7,325,110 ($73.74 per square foot) to be used for re-tenanting the space.
Environmental. According to a revised Phase I environmental assessment dated December 11, 2018, there was no evidence of any recognized environmental conditions at the 787 Eleventh Avenue Property.
| Historical and Current Occupancy | |||
| 2015(1) | 2016(1) | 2017(1) | Current(2) |
| NAP | NAP | NAP | 88.4% |
| (1) | Historical Occupancies are unavailable as the 787 Eleventh Avenue Property was acquired by the borrower sponsors in 2015 and subsequently redeveloped through 2019. |
| (2) | Current Occupancy is as of November 1, 2018 and includes three tenants that have executed leases but not yet taken occupancy. Regus and Pershing Square are currently building out their respective spaces and are expected to take occupancy in 2019. Nissan is currently building out its respective space and its expected occupancy date is yet to be determined. |
THE INFORMATION IN THIS STRUCTURAL AND COLLATERAL TERM SHEET IS NOT COMPLETE AND MAY BE AMENDED PRIOR TO THE TIME OF SALE. THIS TERM SHEET IS NOT AN OFFER TO SELL THESE SECURITIES AND IT IS NOT A SOLICITATION OF AN OFFER TO BUY THESE SECURITIES IN ANY JURISDICTION WHERE THE OFFER OR SALE IS NOT PERMITTED.
121
| Structural and Collateral Term Sheet | BBCMS 2019-C3 | |
| No. 9 – 787 Eleventh Avenue | ||
| Tenant Summary(1) | |||||||
| Tenant | Ratings(2) Moody’s/S&P/Fitch | Net Rentable Area (SF) | % of Total NRA | Base Rent PSF | Base Rent | % of Total Base Rent | Lease Expiration Date |
| Jaguar Land Rover | NA / NA / NA | 161,195 | 31.4% | $57.88 | $9,330,000 | 29.8% | 11/30/2032 |
| Nissan(3) | NA / NA / NA | 106,391 | 20.7 | $66.83 | 7,109,660 | 22.7 | 7/31/2032 |
| Regus(3)(4) | NA / NA / NA | 99,337 | 19.3 | $72.50 | 7,201,933 | 23.0 | 10/31/2031 |
| Pershing Square(3)(5) | NA / NA / NA | 66,757 | 13.0 | $89.73 | 5,990,293 | 19.1 | 1/30/2034 |
| Dwight Capital | NA / NA / NA | 20,322 | 4.0 | $82.55 | 1,677,645 | 5.4 | 5/30/2029 |
| Occupied Collateral Total / Wtd. Avg. | 454,002 | 88.4% | $68.96 | $31,309,531 | 100.0% | ||
| Vacant Space | 59,636 | 11.6% | |||||
| Collateral Total | 513,638 | 100.0% | |||||
| (1) | Based on the underwritten rent roll. |
| (2) | Ratings provided are for the parent company of the entity listed in the “Tenant” field whether or not the parent company guarantees the lease. |
| (3) | Nissan is currently building out its respective space and its expected occupancy date is yet to be determined. Regus and Pershing Square are currently building out their respective spaces and are expected to take occupancy in 2019. |
| (4) | Regus and its U.S. subsidiary, on a joint and several basis, provided a limited guarantee of the tenant's obligation under its lease in an amount up to $14.4 million. Regus has an option to terminate the lease in October 2028, with 12 months' notice, and payment of a termination fee equal to $7,325,110 ($73.74 per square foot). |
| (5) | Pershing Square is an affiliate of Table, one of the borrower sponsors; the appraisal indicates that the lease is within current market levels. Mr. Ackman provided a limited personal guarantee of the tenant's obligations under its lease in an amount up to approximately $6.04 million. See “Description of the Mortgage Pool—Mortgage Pool Characteristics—Tenant Issues—Affiliated Leases” in the Preliminary Prospectus. |
| Lease Rollover Schedule(1) (2) | |||||||||
| Year | Number of Leases Expiring | Net Rentable Area Expiring | % of NRA Expiring | Base Rent Expiring(3) | % of Base Rent Expiring | Cumulative Net Rentable Area Expiring | Cumulative % of NRA Expiring | Cumulative Base Rent Expiring | Cumulative % of Base Rent Expiring |
| Vacant | NAP | 59,636 | 11.6% | NAP | NAP | 59,636 | 11.6% | NAP | NAP |
| 2019 & MTM | 0 | 0 | 0.0 | $0 | 0.0% | 59,636 | 11.6% | $0 | 0.0% |
| 2020 | 0 | 0 | 0.0 | 0 | 0.0 | 59,636 | 11.6% | $0 | 0.0% |
| 2021 | 0 | 0 | 0.0 | 0 | 0.0 | 59,636 | 11.6% | $0 | 0.0% |
| 2022 | 0 | 0 | 0.0 | 0 | 0.0 | 59,636 | 11.6% | $0 | 0.0% |
| 2023 | 0 | 0 | 0.0 | 0 | 0.0 | 59,636 | 11.6% | $0 | 0.0% |
| 2024 | 0 | 0 | 0.0 | 0 | 0.0 | 59,636 | 11.6% | $0 | 0.0% |
| 2025 | 0 | 0 | 0.0 | 0 | 0.0 | 59,636 | 11.6% | $0 | 0.0% |
| 2026 | 0 | 0 | 0.0 | 0 | 0.0 | 59,636 | 11.6% | $0 | 0.0% |
| 2027 | 0 | 0 | 0.0 | 0 | 0.0 | 59,636 | 11.6% | $0 | 0.0% |
| 2028 | 0 | 0 | 0.0 | 0 | 0.0 | 59,636 | 11.6% | $0 | 0.0% |
| 2029 | 1 | 20,322 | 4.0 | 1,677,645 | 5.4 | 79,958 | 15.6% | $1,677,645 | 5.4% |
| 2030 & Beyond | 4 | 433,680 | 84.4 | 29,631,886 | 94.6 | 513,638 | 100.0% | $31,309,531 | 100.0% |
| Total | 5 | 513,638 | 100.0% | $31,309,531 | 100.0% | ||||
| (1) | Based on the underwritten rent roll. |
| (2) | Certain tenants have more than one lease. Certain tenants may have lease termination options that are exercisable prior to the originally stated expiration date of the subject lease and that are not considered in the Lease Rollover Schedule. |
| (3) | Base Rent Expiring includes rent steps based on straight line rent of $889,660 associated with the investment grade tenant, Nissan, through the term of its lease. |
THE INFORMATION IN THIS STRUCTURAL AND COLLATERAL TERM SHEET IS NOT COMPLETE AND MAY BE AMENDED PRIOR TO THE TIME OF SALE. THIS TERM SHEET IS NOT AN OFFER TO SELL THESE SECURITIES AND IT IS NOT A SOLICITATION OF AN OFFER TO BUY THESE SECURITIES IN ANY JURISDICTION WHERE THE OFFER OR SALE IS NOT PERMITTED.
122
| Structural and Collateral Term Sheet | BBCMS 2019-C3 | |
| No. 9 – 787 Eleventh Avenue | ||
| Operating History and Underwritten Net Cash Flow(1) | |||
| Underwritten | Per Square Foot | %(2) | |
| Rents in Place | $30,419,871 | $59.22 | 80.5% |
| Vacant Income | 4,472,700 | 8.71 | 11.8 |
| Rent Steps(3) | 889,660 | 1.73 | 2.4 |
| Percentage Rent(4) | 114,081 | 0.22 | 0.3 |
| Gross Potential Rent | $35,896,311 | $69.89 | 95.0% |
| Total Reimbursements(5) | 1,886,554 | 3.67 | 5.0 |
| Net Rental Income | $37,782,865 | $73.56 | 100.0% |
| (Vacancy/Credit Loss) | (4,472,700) | (8.71) | (11.8) |
| Amenity Income | 51,088 | 0.10 | 0.2 |
| Mailroom Income(6) | 46,900 | 0.09 | 0.1 |
| Effective Gross Income | $33,408,153 | $65.04 | 100.0% |
| Total Expenses | $8,150,648 | $15.87 | 24.4% |
| Net Operating Income | $25,257,505 | $49.17 | 75.6% |
| Total TI/LC, Capex/RR | 1,078,640 | 2.10 | 3.2 |
| Net Cash Flow | $24,178,865 | $47.07 | 72.4% |
| (1) | Historical cash flows are unavailable as the 787 Eleventh Avenue Property was acquired by the borrower sponsors in 2015 and subsequently redeveloped through 2019. |
| (2) | % column represents percent of Net Rental Income for all revenue lines and represents percent of Effective Gross Income for the remainder of fields. |
| (3) | Underwritten Rent Steps are based on straight line rent of $889,660 associated with the investment grade tenant, Nissan, through the term of its lease. |
| (4) | Underwritten Percentage Rent is based on Jaguar Land Rover’s contractual agreement of 2.0% over $145,000,000 in new car salesper annum. The car sales figure of $150,704,039 was utilized for the concluded percentage rent based on new car dealership sales. |
| (5) | Underwritten Total Reimbursements are based on each tenant's recoveries per the contractual lease. All tenants are currently in a base year assessment period for operating expenses. For real estate tax recoveries, tenants generally pay a fixed amount in addition to their pro-rated shares over a tax base year. Tax base years and the applied real estate tax expense are calculated on the basis of the full real estate tax expense without any adjustments for the Industrial & Commercial Abatement Program. Tax base years are based on the appraiser's estimates. See “Tax Abatement” below. |
| (6) | Underwritten Mailroom Income is attributed to the Pershing Square lease, under which the tenant is contractually responsible for $46,900 in mailroom income. |
The Market. The 787 Eleventh Avenue Property is located on the Westside of Manhattan in New York, New York in the Westside office submarket of Midtown. The 787 Eleventh Avenue Property is also located one block east of the Westside Highway and two blocks south of the 57th Street east/west corridor. This provides tenants with multiple means of access via public and private transportation. The 59th Street - Columbus Circle Transit Stop is located approximately 0.8 miles from the 787 Eleventh Avenue Property, which provides commuters with access to the 1, 2, A, B, C and D subway trains. MTA bus lines with stops at or near the 787 Eleventh Avenue Property include the M12, M31, M57 (which stops at West 54th Street and 11th Avenue) and the M11. The New York Waterway ferry terminal, with service to New Jersey and lower Manhattan, is available at 39th Street and the West Side Highway.
According to a third-party report, the 2018 estimated population within a 0.5-mile radius of the 787 Eleventh Avenue Property is 50,379 people. Population in the area has grown approximately 1.9% since 2010 and this trend is projected to continue with compound annual growth of 1.6% through 2023. The 2018 median household income within a 0.25-mile and 0.5-mile radius is $61,398 and $90,297, respectively.
According to the appraisal, the 787 Eleventh Avenue Property is located in the Westside office submarket, which contained approximately 25.7 million square feet and had an overall vacancy rate of 5.0% and an average rental rate of $66.92 per square foot as of the third quarter 2018. The appraiser analyzed 32 competitive properties offering newly redeveloped Class A office space, which exhibited an average occupancy rate of 96.2% and a direct asking rent of $76.75 per square foot.
THE INFORMATION IN THIS STRUCTURAL AND COLLATERAL TERM SHEET IS NOT COMPLETE AND MAY BE AMENDED PRIOR TO THE TIME OF SALE. THIS TERM SHEET IS NOT AN OFFER TO SELL THESE SECURITIES AND IT IS NOT A SOLICITATION OF AN OFFER TO BUY THESE SECURITIES IN ANY JURISDICTION WHERE THE OFFER OR SALE IS NOT PERMITTED.
123
| Structural and Collateral Term Sheet | BBCMS 2019-C3 | |
| No. 9 – 787 Eleventh Avenue | ||
According to the appraisal, the Manhattan market comprises the largest market in the five boroughs of rentable automobile retail space (43.6% of NRA). Within the Manhattan market, approximately 89.0% of the total automotive space is located along the stretch of 11th Avenue known as “Automotive Row”, which evolved after the passing of the Special Clinton District rezoning of 2011. According to the appraisal, several brands including Mercedes-Benz, BMW, VW, Audi and Porsche have collectively spent more than $1.0 billion on showrooms and service centers. The appraisal noted that the only vacant space available in the entire corridor is at 748 11th Avenue, which previously housed the Nissan Infiniti dealership.
Underwritten rents for the occupied spaces at the 787 Eleventh Avenue Property are approximately 15.7% below the appraisal’s concluded market rents, driven primarily by the automotive retail spaces which have a weighted average rent that is approximately 25.1% below market rents. The automotive retail leases were initially signed in 2015.
The Borrower. The borrowing entity for the 787 Eleventh Avenue Whole Loan is Georgetown Eleventh Avenue Owners, LLC, a Delaware limited liability company and special purpose entity. The borrower is 50.0% owned by TABLE Holdings, L.P. (“Table”) and 50.0% owned by the Georgetown Company (“Georgetown”).
The Loan Sponsors. The loan sponsors are Adam R. Flatto, Georgetown, William A. Ackman and Table. The nonrecourse carve-out guarantors are Adam R. Flatto and William A. Ackman.
Founded in 1978, Georgetown is a privately-held diversified real estate company headquartered in New York. Georgetown and its principals have developed, owned and overseen in excess of 20.0 million square feet of office, residential, retail and recreational properties and currently have assets under management of over $3.0 billion. Examples of their work include the renovation of the IAC building in Chelsea; the master development of the Easton project in Columbus, OH; a venture with CNA Insurance to reposition the 1.1 million square foot Continental Center in Manhattan; and, in partnership with Sony Pictures Entertainment, the master planned redevelopment of Sony’s Culver City Studio Lot in Los Angeles.
Table is the investment office of William A. Ackman and his family. Table has invested more than $300.0 million of equity at cost in various real estate investments and has ownership interests in more than 2,200 multifamily apartments and hotels in New York City, Florida, California and other markets, as well as other 787 Eleventh Avenue Property interests. William A. Ackman is the CEO and Portfolio Manager of Pershing Square, a SEC-registered investment adviser founded in 2003 with assets under management of $6.8 billion as of December 31, 2018.
Property Management. The 787 Eleventh Avenue Property is managed by Cushman & Wakefield U.S., Inc.
Escrows and Reserves. At origination, the borrower deposited into escrow: (i) $24,254,223 for outstanding tenant improvements with respect to Nissan ($3,960,268), Regus ($12,528,382) and Pershing Square ($7,765,573) and $521,488 for outstanding leasing commissions with respect to Regus, (ii) $15,664,540 for free rent with respect to Regus ($6,980,561), Jaguar Land Rover ($7,217,153) and Dwight Capital ($1,466,826) and (iii) $6,131,548 for renovations.
Tax Escrows – The requirement for the borrower to make monthly deposits into the tax escrow is waived so long as (i) no event of default has occurred and is continuing and (ii) the borrower timely pays the tax and common charge costs when incurred and promptly provides evidence to the lender of the payment of same.
Insurance Escrows – The requirement for the borrower to make monthly deposits to the insurance escrow is waived so long as (i) no event of default has occurred and is continuing and (ii) the borrower timely pays the insurance and common charge costs when incurred and promptly provides evidence to the lender of the payment of same.
TI/LC Reserve – So long as no event of default is continuing, from and after July 1, 2020 the borrower is required to deposit any amounts required in connection with a permitted lease modification or permitted surrender in connection with various lease modifications and/or terminations.
Lockbox / Cash Management.The 787 Eleventh Avenue Whole Loan is structured with a hard lockbox and springing cash management. The borrower is required to deliver to all existing and new tenants at the 787 Eleventh Avenue Property a written notice instructing that all rents under leases at the 787 Eleventh Avenue Property are to be delivered by such tenants directly to the deposit account. All funds in the lockbox account are required to be remitted to the borrower on a daily basis
THE INFORMATION IN THIS STRUCTURAL AND COLLATERAL TERM SHEET IS NOT COMPLETE AND MAY BE AMENDED PRIOR TO THE TIME OF SALE. THIS TERM SHEET IS NOT AN OFFER TO SELL THESE SECURITIES AND IT IS NOT A SOLICITATION OF AN OFFER TO BUY THESE SECURITIES IN ANY JURISDICTION WHERE THE OFFER OR SALE IS NOT PERMITTED.
124
| Structural and Collateral Term Sheet | BBCMS 2019-C3 | |
| No. 9 – 787 Eleventh Avenue | ||
in the absence of a Cash Management Period (as defined below). Upon the commencement of a Cash Management Period, the lender will give notice thereof to the cash management bank, after which the borrower and cash management bank must establish a cash management account into which all funds on deposit in the deposit account (less any minimum peg balance required under the loan documents) will be swept on a daily basis. The cash management account is required to be in the name of the borrower but for the sole and exclusive benefit of the lender.
A “Cash Management Period” will commence upon (i) February 8, 2029 or (ii) an event of default.
Subordinate and Mezzanine Debt.The 787 Eleventh Avenue Whole Loan includes one senior subordinate Note A-2 with an original principal balance of $117.5 million and one junior subordinate Note B with an original principal balance of $117.5 million. The subordinate notes are coterminous with the 787 Eleventh Avenue mortgage loan. Note A-2 accrues interest at 4.53031685470085%per annumand Note B accrues interest at 6.099424%per annum. The UW NCF DSCR and UW NOI debt yield on the 787 Eleventh Avenue Whole Loan (including Note A-2 and Note B) are 1.17x and 6.2%, respectively. The relative rights and obligations of the holders of Note A-2 and Note B are governed by the terms of a co-lender agreement.
Partial Release. Following a permitted condominium conversion of all or a portion of the 787 Eleventh Avenue Property in accordance with the 787 Eleventh Avenue Whole Loan documents, the borrower may obtain a one-time release of the retail condominium unit from the lien of the 787 Eleventh Avenue Whole Loan, upon conveyance of the retail condominium unit to another entity;provided that each of the following conditions, among others, are satisfied: (a) the borrower either (i) pays a prepayment of the principal in an amount equal to 105.0% of the appraised value of the retail condominium unit (together with any applicable yield maintenance premium), or (ii) elects a partial defeasance event, in which case the defeased note will be in an amount equal to 105.0% of the appraised value of the retail condominium unit; (b) after giving effect to such prepayment or defeasance, the debt yield on the 787 Eleventh Avenue Whole Loan is greater than or equal to the greater of (i) 6.2% or (ii) the debt yield on the 787 Eleventh Avenue Whole Loan immediately preceding the retail condominium release (provided that the borrower may make an additional prepayment or partially defease the 787 Eleventh Avenue Whole Loan in an amount sufficient to pass such debt yield test); (c) the LTV ratio on the 787 Eleventh Avenue Whole Loan is required to be equal to or less than the lesser of (i) 63.1% and (ii) the LTV ratio on the 787 Eleventh Avenue Whole Loan of the 787 Eleventh Avenue Property immediately prior to the retail condominium release (provided that the borrower may make an additional prepayment or partially defease the 787 Eleventh Avenue Whole Loan in an amount sufficient to pass such test); (d) no event of default under the 787 Eleventh Avenue Whole Loan documents is continuing; and (e) the lender has either received a rating agency confirmation from each rating agency or each rating agency has waived such condition. See “Description of the Mortgage Pool—Certain Terms of the Mortgage Loans—Releases; Partial Releases” in the Preliminary Prospectus.
Tax Abatement. The borrower sponsors have applied for a tax abatement for the 787 Eleventh Avenue Property under the Industrial & Commercial Abatement Program (“ICAP”) program. The borrower projects that the ICAP application will be fully approved by the end of 2019 and that the abatement benefits will take effect in the 2020/2021 tax year. As projected by the borrower sponsors, the ICAP abatement would phase out over a 10-year period with full savings being realized in years one through five of the program, which subsequently burns off at a rate of 20.0% per year over the next five years decreasing to 20.0% in years nine and ten of the abatement period. The borrower is required under the 787 Eleventh Avenue Whole Loan documents to submit a timely ICAP notice of completion reflecting completion of construction on or before December 29, 2020 and satisfy all conditions and obtain all licenses and permits required under the loan documents, in order to fully vest in the 787 Eleventh Avenue Property all rights for benefits under the ICAP. The borrower is also required to comply with all legal requirements necessary to maintain, and is required to maintain, the abatement of taxes under the ICAP on or before July 1, 2020, subject to extension to July 1, 2021, including, without limitation, the filing of all certificates of continuing use and filing real property income and expense statements. The borrower is required to provide to the lender all material notices it receives from the applicable governmental authorities with respect to the ICAP within ten business days after receipt. See “Description of the Mortgage Pool—Real Estate and Other Tax Considerations” in the Preliminary Prospectus.
Ground Lease. None.
THE INFORMATION IN THIS STRUCTURAL AND COLLATERAL TERM SHEET IS NOT COMPLETE AND MAY BE AMENDED PRIOR TO THE TIME OF SALE. THIS TERM SHEET IS NOT AN OFFER TO SELL THESE SECURITIES AND IT IS NOT A SOLICITATION OF AN OFFER TO BUY THESE SECURITIES IN ANY JURISDICTION WHERE THE OFFER OR SALE IS NOT PERMITTED.
125
| Structural and Collateral Term Sheet | BBCMS 2019-C3 | |
| No. 10 – The Colonnade Office Complex | ||

THE INFORMATION IN THIS STRUCTURAL AND COLLATERAL TERM SHEET IS NOT COMPLETE AND MAY BE AMENDED PRIOR TO THE TIME OF SALE. THIS TERM SHEET IS NOT AN OFFER TO SELL THESE SECURITIES AND IT IS NOT A SOLICITATION OF AN OFFER TO BUY THESE SECURITIES IN ANY JURISDICTION WHERE THE OFFER OR SALE IS NOT PERMITTED.
126
| Structural and Collateral Term Sheet | BBCMS 2019-C3 | |
| No. 10 – The Colonnade Office Complex | ||
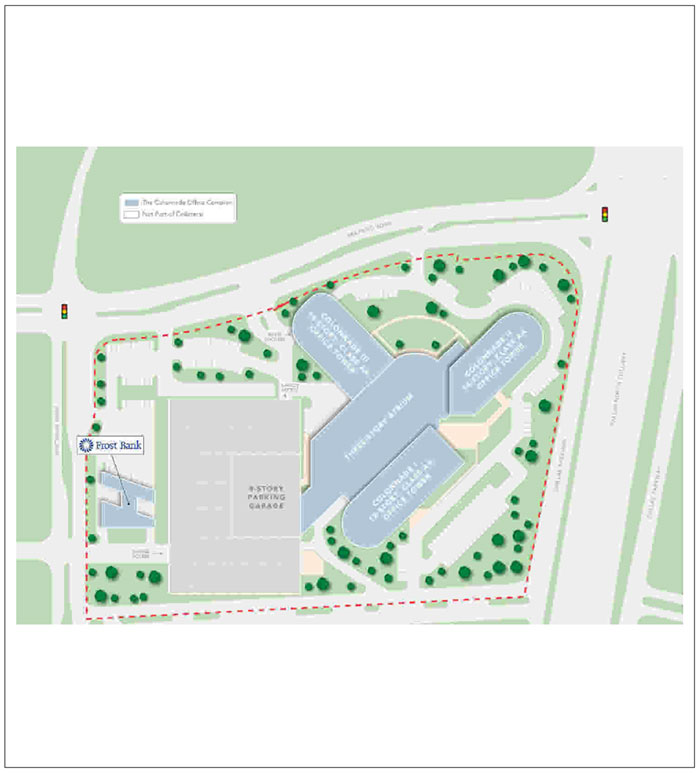
THE INFORMATION IN THIS STRUCTURAL AND COLLATERAL TERM SHEET IS NOT COMPLETE AND MAY BE AMENDED PRIOR TO THE TIME OF SALE. THIS TERM SHEET IS NOT AN OFFER TO SELL THESE SECURITIES AND IT IS NOT A SOLICITATION OF AN OFFER TO BUY THESE SECURITIES IN ANY JURISDICTION WHERE THE OFFER OR SALE IS NOT PERMITTED.
127
| Structural and Collateral Term Sheet | BBCMS 2019-C3 | |
| No. 10 – The Colonnade Office Complex | ||

THE INFORMATION IN THIS STRUCTURAL AND COLLATERAL TERM SHEET IS NOT COMPLETE AND MAY BE AMENDED PRIOR TO THE TIME OF SALE. THIS TERM SHEET IS NOT AN OFFER TO SELL THESE SECURITIES AND IT IS NOT A SOLICITATION OF AN OFFER TO BUY THESE SECURITIES IN ANY JURISDICTION WHERE THE OFFER OR SALE IS NOT PERMITTED.
128
| Structural and Collateral Term Sheet | BBCMS 2019-C3 | |
| No. 10 – The Colonnade Office Complex | ||
| Mortgage Loan Information | Property Information | ||||
| Mortgage Loan Seller: | UBS AG | Single Asset / Portfolio: | Single Asset | ||
| Credit Assessment (KBRA): | BBB | Title: | Fee | ||
| Original Principal Balance(1): | $30,000,000 | Property Type - Subtype: | Office – Suburban | ||
| Cut-off Date Principal Balance(1): | $30,000,000 | Net Rentable Area (SF): | 1,080,180 | ||
| % of IPB: | 3.2% | Location: | Addison, TX | ||
| Loan Purpose: | Refinance | Year Built / Renovated: | 1983 / 2015-2017 | ||
| Borrower: | FPG Colonnade, LP | Occupancy: | 91.2% | ||
| Borrower Sponsor: | Fortis Property Group, LLC | Occupancy Date: | 9/30/2018 | ||
| Interest Rate: | 4.56800% | 4th Most Recent NOI (As of): | $16,949,065 (12/31/2015) | ||
| Note Date: | 1/18/2019 | 3rd Most Recent NOI (As of): | $18,017,169 (12/31/2016) | ||
| Maturity Date: | 2/6/2024 | 2nd Most Recent NOI (As of): | $19,976,818 (12/31/2017) | ||
| Interest-only Period: | 60 months | Most Recent NOI (As of): | $20,063,363 (TTM 9/30/2018) | ||
| Original Term: | 60 months | UW Economic Occupancy: | 91.0% | ||
| Original Amortization Term: | None | UW Revenues: | $33,260,523 | ||
| Amortization Type: | Interest Only | UW Expenses: | $13,191,074 | ||
| Call Protection: | L(28),Def(27),O(5) | UW NOI: | $20,069,449 | ||
| Lockbox / Cash Management: | Hard / Springing | UW NCF: | $18,841,320 | ||
| Additional Debt(1): | Yes | Appraised Value / Per SF: | $347,590,000 / $322 | ||
| Additional Debt Balance(1): | $75,000,000 / $55,000,000 / $63,000,000 / $17,000,000 | Appraisal Date: | 10/31/2018 | ||
| Additional Debt Type(1): | Pari Passu/ B-Note / C-Note / Mezzanine Loan | ||||
| Escrows and Reserves(2) | Financial Information(1) | ||||||||||
| Initial | Monthly | Initial Cap | A-Notes | Total Debt | |||||||
| Taxes: | $502,948 | $502,948 | N/A | Cut-off Date Loan / SF: | $97 | $222 | |||||
| Insurance: | $0 | Springing | N/A | Maturity Date Loan / SF: | $97 | $222 | |||||
| Replacement Reserves: | $0 | $17,987 | N/A | Cut-off Date LTV: | 30.2% | 69.0% | |||||
| TI/LC: | $4,000,000 | $89,933 | $6,000,000 | Maturity Date LTV: | 30.2% | 69.0% | |||||
| Other: | $1,828,120 | $0 | N/A | UW NCF DSCR: | 3.87x | 1.35x | |||||
| UW NOI Debt Yield: | 19.1% | 8.4% | |||||||||
| Sources and Uses | |||||||||||
| Sources | Proceeds | % of Total | Uses | Proceeds | % of Total | ||||||
| Whole Loan(1) | $223,000,000 | 92.9% | Payoff Existing Debt(3) | $213,024,497 | 88.8% | ||||||
| Mezzanine Loan | 17,000,000 | 7.1 | Return of Equity | 11,917,495 | 5.0 | ||||||
| Closing Costs | 8,726,941 | 3.6 | |||||||||
| Reserves | 6,331,067 | 2.6 | |||||||||
| Total Sources | $240,000,000 | 100.0% | Total Uses | $240,000,000 | 100.0% | ||||||
| (1) | The Colonnade Office Complex mortgage loan is part of a whole loan evidenced by (i) 10pari passusenior notes with an aggregate original principal balance of $105.0 million, (ii) six B-notes with an aggregate original principal balance of $55.0 million and (iii) one C-note with an original principal balance of $63.0 million. The financial information presented in the chart above reflects the Cut-off Date balance of The Colonnade Office Complex Senior Loan (as defined below). |
| (2) | For a full description of Escrows and Reserves, please refer to “Escrows and Reserves” below. |
| (3) | Payoff Existing Debt includes (i) costs to defease in the amount of $163,162,316 and (ii) the payoff of 10 member loans totaling $49,862,182. |
THE INFORMATION IN THIS STRUCTURAL AND COLLATERAL TERM SHEET IS NOT COMPLETE AND MAY BE AMENDED PRIOR TO THE TIME OF SALE. THIS TERM SHEET IS NOT AN OFFER TO SELL THESE SECURITIES AND IT IS NOT A SOLICITATION OF AN OFFER TO BUY THESE SECURITIES IN ANY JURISDICTION WHERE THE OFFER OR SALE IS NOT PERMITTED.
129
| Structural and Collateral Term Sheet | BBCMS 2019-C3 | |
| No. 10 – The Colonnade Office Complex | ||
The Loan.The Colonnade Office Complex mortgage loan is part of a whole loan evidenced by (i) 10pari passusenior promissory notes with an aggregate original principal balance of $105,000,000 (“The Colonnade Office Complex Senior Loan”), (ii) six B-notes with an aggregate original principal balance of $55,000,000 (“The Colonnade Office Complex B-Note”), which are subordinate to The Colonnade Office Complex Senior Loan, and (iii) a C-note with an original principal balance of $63,000,000 (“The Colonnade Office Complex C-Note”), which is subordinate to both The Colonnade Office Complex Senior Loan and The Colonnade Office Complex B-Note (The Colonnade Office Complex B-Note and The Colonnade Office Complex C-Note, collectively, “The Colonnade Office Complex Subordinate Notes”, and together with The Colonnade Office Complex Senior Loan, “The Colonnade Office Complex Whole Loan”). The Colonnade Office Complex Whole Loan is secured by a first mortgage lien on a 1,080,180 square foot office complex located in Addison, Texas (“The Colonnade Office Complex Property”). The Colonnade Office Complex mortgage loan represents the non-controlling Notes A-3, A-6 and A-8. The below table summarizes The Colonnade Office Complex Whole Loan, including the remainingpari passu promissory notes comprising The Colonnade Office Complex Senior Loan. The Colonnade Office Complex Whole Loan is serviced under the UBS 2019-C16 pooling and servicing agreement. See “Description of the Mortgage Pool—The Whole Loans—The Non-Serviced AB Whole Loans” and “Pooling and Servicing Agreement” in the Preliminary Prospectus. The Colonnade Office Complex Whole Loan has a five-year term and is interest-only for the full term of the loan.
| Whole Loan Summary | |||
| Note | Original Balance | Note Holder | Controlling Piece |
| A-1 | $5,000,000 | UBS 2019-C16 | No |
| A-2-1 | 15,000,000 | WFCM 2019-C50 | No |
| A-2-2 | 3,000,000 | WFCM 2019-C50 | No |
| A-2-3 | 2,000,000 | UBS 2019-C16 | No |
| A-3 | 15,000,000 | BBCMS 2019-C3 | No |
| A-4 | 10,000,000 | UBS 2019-C16 | No |
| A-5 | 10,000,000 | WFCM 2019-C50 | No |
| A-6 | 10,000,000 | BBCMS 2019-C3 | No |
| A-7 | 30,000,000 | UBS 2019-C16 | No |
| A-8 | 5,000,000 | BBCMS 2019-C3 | No |
| B-1 | 30,000,000 | The Lincoln National Life Insurance Company | No |
| B-2 | 5,000,000 | Athene Annuity & Life Assurance Company | No |
| B-3 | 5,000,000 | Athene Annuity and Life Company | No |
| B-4 | 5,000,000 | American Equity Investment Life Insurance Company | No |
| B-5 | 5,000,000 | Athene Annuity & Life Assurance Company | No |
| B-6 | 5,000,000 | Athene Annuity & Life Assurance Company | No |
| C | 63,000,000 | Nonghyup Bank as Trustee for Up Global Private Real Estate Fund V | Yes(1) |
| Total | $223,000,000 | ||
| (1) | The initial controlling note is Note C. If a control appraisal period with respect to Note C has occurred and is continuing, but a control appraisal period with respect to Note B-1 has not occurred and is not continuing, then the control note will be Note B-1. If a control appraisal period with respect to Note B-1 has occurred and is continuing with respect to Note B-1, then the control note will be Note A-1. See “Description of the Mortgage Pool—The Whole Loans—The Non-Serviced AB Whole Loans— The Colonnade Office Complex Whole Loan” in the Preliminary Prospectus. |
THE INFORMATION IN THIS STRUCTURAL AND COLLATERAL TERM SHEET IS NOT COMPLETE AND MAY BE AMENDED PRIOR TO THE TIME OF SALE. THIS TERM SHEET IS NOT AN OFFER TO SELL THESE SECURITIES AND IT IS NOT A SOLICITATION OF AN OFFER TO BUY THESE SECURITIES IN ANY JURISDICTION WHERE THE OFFER OR SALE IS NOT PERMITTED.
130
| Structural and Collateral Term Sheet | BBCMS 2019-C3 | |
| No. 10 – The Colonnade Office Complex | ||

| (1) | Cumulative Loan Per SF is calculated based on 1,080,180 SF. |
| (2) | Based on the “as-is” appraised value of $347.59 million ($322 per SF), as of October 31, 2018. |
| (3) | Based on UW NOI of $20,069,449. |
| (4) | Based on UW NCF of $18,841,320 and the coupon of 4.56800% on The Colonnade Office Complex Senior Loan, 5.25000% on The Colonnade Office Complex B-Note, 6.47000% on The Colonnade Office Complex C-Note, and 12.00000% on The Colonnade Office Complex Mezzanine Loan (as defined below). See “Subordinate and Mezzanine Debt” below for further discussion of The Colonnade Office Complex Mezzanine Loan. |
| (5) | Implied Equity is based on the “as-is” appraised value of $347.59 million, less total debt of $240.0 million. |
The Property. The Colonnade Office Complex Property is comprised of three 14-story Class A office buildings totaling 1,080,180 square feet located in Addison, Texas. Situated on an approximately 12.4 acre site, The Colonnade Office Complex Property was constructed in 1983 and renovated between 2015 and 2017. The three buildings are connected by a three-story 70-foot high barrel vaulted glass atrium and an eight-level parking garage with 2,563 parking spaces and 137 surface parking spaces, resulting in a parking ratio of 2.5 spaces per 1,000 square feet. Amenities at The Colonnade Office Complex Property include a fitness facility, a business center, a full service bank, a 6,897 square foot food court, a coffee kiosk, a sundries shop, a conference center, storage spaces, and 24/7 security. The Colonnade Office Complex Property is LEED® Certified Gold for Existing Buildings Operations and Maintenance (LEED-EB O+M), and in 2004 and 2013, The Colonnade Office Complex Property was recognized as Building Owners and Managers Association’s "Building of the Year." Since the borrower sponsor’s acquisition of The Colonnade Office Complex Property in 2013, the borrower sponsor has spent approximately $32.5 million in capital improvements, tenant improvements, leasing commissions, and soft costs at The Colonnade Office Complex Property.
The Colonnade Office Complex Property was 91.2% leased as of September 30, 2018 to 59 office and telecommunications tenants, with approximately 19.6% of NRA and 21.4% of underwritten base rent leased to investment grade tenants. The borrower sponsor acquired The Colonnade Office Complex Property in April 2013 with occupancy of 88.8% and subsequent to the capital improvements that the borrower sponsor has implemented, The Colonnade Office Complex Property has averaged occupancy of 95.1% over the past five years. The top three tenants at The Colonnade Office Complex Property are Hilton Domestic Operating Company (14.4% of NRA), USP Texas, L.P. (11.8% of NRA) and HQ Global Workplaces, LLC (5.0% of NRA). No other tenant at The Colonnade Office Complex Property represents more than 4.7% of NRA or 4.9% of underwritten base rent.
THE INFORMATION IN THIS STRUCTURAL AND COLLATERAL TERM SHEET IS NOT COMPLETE AND MAY BE AMENDED PRIOR TO THE TIME OF SALE. THIS TERM SHEET IS NOT AN OFFER TO SELL THESE SECURITIES AND IT IS NOT A SOLICITATION OF AN OFFER TO BUY THESE SECURITIES IN ANY JURISDICTION WHERE THE OFFER OR SALE IS NOT PERMITTED.
131
| Structural and Collateral Term Sheet | BBCMS 2019-C3 | |
| No. 10 – The Colonnade Office Complex | ||
Major Tenants.
Hilton Domestic Operating Company (155,572 square feet; 14.4% of NRA; 16.7% of Base Rent): Hilton Domestic Operating Company, rated Ba2 by Moody’s, is a subsidiary of Hilton Worldwide Holdings Inc. (“Hilton”) (NYSE: HIL). Founded in 1919, Hilton is a leading global hospitality company with a portfolio of 5,685 properties comprising 912,960 rooms, in 113 countries and territories as of year-end 2018. Hilton’s portfolio of 16 brands include Waldorf Astoria Hotels & Resorts, Conrad Hotel & Resorts, Hilton Hotels & Resorts, Curio Collection, DoubleTree, Hilton Garden Inn, Hampton, and Hilton Grand Vacations. Hilton manages a customer loyalty program, Hilton Honors, which has over 85 million members as of year-end 2018. Hilton Domestic Operating Company currently occupies 155,572 square feet across nine suites at The Colonnade Office Complex Property. The leases related to seven suites totaling 106,860 square feet (9.9% of NRA, 10.8% of underwritten base rent) have a current expiration date of January 31, 2021 and provide for one, five-year renewal option. The leases related to two suites totaling 48,712 square feet (4.5% of NRA, 6.0% of underwritten base rent) have a current expiration date of November 30, 2023 and provide for one, two-year renewal option. Underwritten base rents for Hilton Domestic Operating Company’s nine suites range from $26.00 to $33.00 per square foot with a weighted average underwritten base rent of $28.96 per square foot. Hilton Domestic Operating Company does not have any termination options.
USP Texas, L.P. (127,613 square feet; 11.8% of NRA; 12.7% of Base Rent): United Surgical Partners Texas, L.P. (“USP”), rated B/Caa1/B by Fitch/Moody’s/S&P, is an ambulatory services provider and a subsidiary of Tenet Healthcare (NYSE: THC), a diversified healthcare services company. USP currently owns and operates over 400 ambulatory facilities, serving more than 9,000 physicians and over 2.5 million patients each year. With a team of approximately 17,000 employees, USP also maintains strategic joint-venture partnerships with more than 4,000 physicians and over 50 health systems nationwide. A tenant at The Colonnade Office Complex Property since January 2003, USP currently occupies six office suites totaling 123,249 square feet and two storage units totaling 4,364 square feet at The Colonnade Office Complex Property. USP pays current underwritten base rent of $27.37 per square foot for its office spaces and $12.00 per square foot for its storage spaces. USP’s lease has a current expiration date of October 31, 2025 and provides for one, five-year renewal option and no termination options.
HQ Global Workplaces, LLC (54,482 square feet; 5.0% of NRA; 5.2% of Base Rent): HQ Global Workplaces, LLC (“HQ Global”) is a subsidiary of International Workplace Group (LSE: IWG) (“IWG”), one of the world’s largest providers of flexible workspace solutions for companies of any size. As of year-end 2017, IWG had approximately 3,125 business centers in more than 1,000 cities across over 110 countries. IWG owns and operates internationally renowned brands including HQ, Regus, Spaces, Signature, No 18, Basepoint, and Open Office with office outsourcing services in the Americas, Europe, Middle East, Africa, Asia Pacific, and the United Kingdom. HQ Global currently occupies 52,831 square feet of office space and 1,651 square feet of storage space at The Colonnade Office Complex Property with a lease that commenced on July 1, 2001 and expires on April 30, 2020. HQ Global currently pays underwritten base rent of $23.50 per square foot for 26,356 square feet of office space, $29.00 per square foot for 26,475 square feet of office space, and $12.00 per square foot for its storage space. HQ Global’s lease provides for one, five-year renewal option for its office spaces and no termination option.
Environmental. According to a Phase I environmental assessment dated November 8, 2018, there was no evidence of any recognized environmental conditions at The Colonnade Office Complex Property.
| Historical and Current Occupancy(1) | ||||
| 2014 | 2015 | 2016 | 2017 | Current(2) |
| 94.2% | 94.6% | 94.2% | 97.1% | 91.2% |
| (1) | Historical Occupancies are the average occupancies of each respective year. |
| (2) | Current Occupancy is as of September 30, 2018. |
THE INFORMATION IN THIS STRUCTURAL AND COLLATERAL TERM SHEET IS NOT COMPLETE AND MAY BE AMENDED PRIOR TO THE TIME OF SALE. THIS TERM SHEET IS NOT AN OFFER TO SELL THESE SECURITIES AND IT IS NOT A SOLICITATION OF AN OFFER TO BUY THESE SECURITIES IN ANY JURISDICTION WHERE THE OFFER OR SALE IS NOT PERMITTED.
132
| Structural and Collateral Term Sheet | BBCMS 2019-C3 | |
| No. 10 – The Colonnade Office Complex | ||
| Top Ten Tenant Summary(1) | |||||||
| Tenant | Ratings(2) Moody’s/S&P/Fitch | Net Rentable Area (SF) | % of Total NRA | Base Rent PSF | Base Rent | % of Total Base Rent | Lease Expiration Date |
| Hilton Domestic Operating Company(3) | Ba2 / NA / NA | 155,572 | 14.4% | $28.96 | $4,505,134 | 16.7% | 1/31/2021 |
| USP Texas, L.P. | Caa1 / B / B | 127,613 | 11.8 | $26.84 | 3,425,416 | 12.7 | 10/31/2025 |
| HQ Global Workplaces, LLC | NA / NA / NA | 54,482 | 5.0 | $25.82 | 1,406,953 | 5.2 | 4/30/2020 |
| Google, Inc.(4) | Aa2 / AA+ / NA | 51,260 | 4.7 | $25.30 | 1,296,846 | 4.8 | 2/28/2026 |
| Systemware(5) | NA / NA / NA | 48,125 | 4.5 | $27.50 | 1,323,438 | 4.9 | 5/31/2022 |
| Willis Towers Watson | Baa3 / BBB / BBB | 46,266 | 4.3 | $27.38 | 1,266,534 | 4.7 | 12/31/2019 |
| Zurich American Insurance Company(6) | A1 / AA- / A+ | 43,711 | 4.0 | $25.12 | 1,097,946 | 4.1 | 4/30/2027 |
| GenCorp Technologies, Inc. | NA / NA / NA | 41,082 | 3.8 | $26.58 | 1,091,892 | 4.1 | 2/28/2029 |
| RMG Enterprise Solutions, Inc.(7) | NA / NA / NA | 31,255 | 2.9 | $29.00 | 906,395 | 3.4 | 3/31/2025 |
| Dillon Gage Incorporated of Dallas | NA / NA / NA | 28,874 | 2.7 | $27.07 | 781,509 | 2.9 | 5/31/2025 |
| Top Ten Tenants | 628,240 | 58.2% | $27.22 | $17,102,061 | 63.6% | ||
| Non Top Ten Tenants | 356,626 | 33.0% | $27.50 | $9,807,281 | 36.4% | ||
| Occupied Collateral Total | 984,866 | 91.2% | $27.32 | $26,909,342 | 100.0% | ||
| Vacant Space | 95,314 | 8.8% | |||||
| Collateral Total | 1,080,180 | 100.0% | |||||
| (1) | Based on the underwritten rent roll. |
| (2) | Ratings provided are for the parent company of the entity listed in the “Tenant” field whether or not the parent company guarantees the lease. |
| (3) | Seven suites totaling 106,860 square feet have a current expiration date of January 31, 2021 and two suites totaling 48,712 square feet have a current expiration date of November 30, 2023. |
| (4) | Three suites totaling 38,180 square feet have a current expiration date of February 28, 2026 and one suite totaling 13,080 square feet has a current expiration date of May 31, 2020. |
| (5) | Systemware has a one-time option to terminate its lease effective May 31, 2020 with at least 12 months’ written notice of such cancellation and payment of a termination fee equal to two months of then applicable base rent and the outstanding balance of leasing costs amortized over a 60-month term at 8%; provided, however, that such termination option will terminate if Systemware leases more than 5,000 square feet of additional space at The Colonnade Office Complex Property. |
| (6) | Two suites totaling 38,540 square feet have a current expiration date of April 30, 2027 and one suite totaling 5,171 square feet has a current expiration date of September 30, 2022. |
| (7) | RMG Enterprise Solutions, Inc. has a one-time option to terminate its lease effective December 31, 2021 with written notice, no earlier than 12 months prior and no later than nine months prior, of such cancellation and payment of a termination fee equal to five months of then applicable base rent and the outstanding balance of leasing costs amortized over its lease term at 8%; provided, however, that such termination option will terminate if RMG Enterprise Solutions, Inc. leases additional space at The Colonnade Office Complex Property. |
THE INFORMATION IN THIS STRUCTURAL AND COLLATERAL TERM SHEET IS NOT COMPLETE AND MAY BE AMENDED PRIOR TO THE TIME OF SALE. THIS TERM SHEET IS NOT AN OFFER TO SELL THESE SECURITIES AND IT IS NOT A SOLICITATION OF AN OFFER TO BUY THESE SECURITIES IN ANY JURISDICTION WHERE THE OFFER OR SALE IS NOT PERMITTED.
133
| Structural and Collateral Term Sheet | BBCMS 2019-C3 | |
| No. 10 – The Colonnade Office Complex | ||
| Lease Rollover Schedule(1) | |||||||||
| Year | Number of Leases Expiring | Net Rentable Area Expiring | % of NRA Expiring | Base Rent Expiring | % of Base Rent Expiring | Cumulative Net Rentable Area Expiring | Cumulative % of NRA Expiring | Cumulative Base Rent Expiring | Cumulative % of Base Rent Expiring |
| Vacant | NAP | 95,314 | 8.8% | NAP | NAP | 95,314 | 8.8% | NAP | NAP |
| 2019 & MTM | 15 | 75,734 | 7.0 | $1,917,150 | 7.1% | 171,048 | 15.8% | $1,917,150 | 7.1% |
| 2020 | 16 | 117,650 | 10.9 | 3,079,500 | 11.4 | 288,698 | 26.7% | $4,996,650 | 18.6% |
| 2021 | 19 | 192,308 | 17.8 | 5,429,641 | 20.2 | 481,006 | 44.5% | $10,426,291 | 38.7% |
| 2022 | 22 | 134,351 | 12.4 | 3,936,641 | 14.6 | 615,357 | 57.0% | $14,362,932 | 53.4% |
| 2023 | 9 | 109,232 | 10.1 | 3,081,821 | 11.5 | 724,589 | 67.1% | $17,444,753 | 64.8% |
| 2024 | 2 | 8,558 | 0.8 | 196,811 | 0.7 | 733,147 | 67.9% | $17,641,564 | 65.6% |
| 2025 | 18 | 229,231 | 21.2 | 6,232,731 | 23.2 | 962,378 | 89.1% | $23,874,294 | 88.7% |
| 2026 | 3 | 38,180 | 3.5 | 979,656 | 3.6 | 1,000,558 | 92.6% | $24,853,950 | 92.4% |
| 2027 | 2 | 38,540 | 3.6 | 963,500 | 3.6 | 1,039,098 | 96.2% | $25,817,450 | 95.9% |
| 2028 | 0 | 0 | 0.0 | 0 | 0.0 | 1,039,098 | 96.2% | $25,817,450 | 95.9% |
| 2029 | 8 | 41,082 | 3.8 | 1,091,892 | 4.1 | 1,080,180 | 100.0% | $26,909,342 | 100.0% |
| 2030 & Beyond | 0 | 0 | 0.0 | 0 | 0.0 | 1,080,180 | 100.0% | $26,909,342 | 100.0% |
| Total | 114 | 1,080,180 | 100.0% | $26,909,342 | 100.0% | ||||
| (1) | Based on the underwritten rent roll. |
| Operating History and Underwritten Net Cash Flow | |||||||
| 2015 | 2016 | 2017 | TTM(1) | Underwritten | Per Square Foot | %(2) | |
| Rents in Place(3) | $25,083,835 | $25,712,275 | $27,530,368 | $27,615,394 | $27,000,733 | $25.00 | 76.4% |
| Vacant Income | 0 | 0 | 0 | 0 | 2,230,380 | 2.06 | 6.3 |
| Gross Potential Rent | $25,083,835 | $25,712,275 | $27,530,368 | $27,615,394 | $29,231,113 | $27.06 | 82.7% |
| Total Reimbursements | 2,897,988 | 3,417,382 | 3,850,829 | 3,521,436 | 6,118,569 | 5.66 | 17.3 |
| Net Rental Income | $27,981,824 | $29,129,656 | $31,381,197 | $31,136,830 | $35,349,683 | $32.73 | 100.0% |
| (Vacancy/Credit Loss) | 0 | 0 | 0 | 0 | (3,164,483) | (2.93) | (9.0) |
| Other Income(4) | 1,257,497 | 906,483 | 1,087,285 | 1,050,028 | 1,075,323 | 1.00 | 3.0 |
| Effective Gross Income | $29,239,321 | $30,036,140 | $32,468,482 | $32,186,858 | $33,260,523 | $30.79 | 94.1% |
| Total Expenses | $12,290,256 | $12,018,971 | $12,491,663 | $12,123,495 | $13,191,074 | $12.21 | 39.7% |
| Net Operating Income | $16,949,065 | $18,017,169 | $19,976,818 | $20,063,363 | $20,069,449 | $18.58 | 60.3% |
| Total TI/LC, Capex/RR | 0 | 0 | 0 | 0 | 1,228,129 | 1.14 | 3.7 |
| Net Cash Flow | $16,949,065 | $18,017,169 | $19,976,818 | $20,063,363 | $18,841,320 | $17.44 | 56.6% |
| (1) | TTM reflects the trailing 12-month period ending September 30, 2018. |
| (2) | % column represents percent of Net Rental Income for all revenue lines and represents percent of Effective Gross Income for the remainder of fields. |
| (3) | Underwritten Rents in Place consist of in-place rents as of September 30, 2018, including (i) contractual rent steps through March 2020 totaling $318,819 and (ii) straight line rent for investment grade tenants totaling $91,392. |
| (4) | Other Income includes parking income, telecom income, tenant improvement amortization, late fees, tenant bill backs, signage income, and termination fees. |
The Market.The Colonnade Office Complex Property is located along Dallas North Tollway in Addison, Texas. The Colonnade Office Complex Property is approximately 15.0 miles north of downtown Dallas, approximately 14.0 miles southwest of Plano, and approximately 29.9 miles northeast of Arlington. The neighborhood surrounding The Colonnade Office Complex Property consists primarily of retail and office development. Immediate access to The Colonnade Office Complex Property is provided by the Dallas North Tollway and Arapaho Road. Regional access to The Colonnade Office Complex Property is provided by Interstate 635 (2.9 miles south) and the President George Bush Turnpike (SH 190) (4.9 miles south). Public transportation in the area is provided by Dallas Area Rapid Transit, which services Dallas and 12 surrounding cities. The Colonnade Office Complex Property is located two blocks east of the Addison Transit Center, which is expected to become a station along the planned Cotton Belt Rail Line, according to the appraisal.
THE INFORMATION IN THIS STRUCTURAL AND COLLATERAL TERM SHEET IS NOT COMPLETE AND MAY BE AMENDED PRIOR TO THE TIME OF SALE. THIS TERM SHEET IS NOT AN OFFER TO SELL THESE SECURITIES AND IT IS NOT A SOLICITATION OF AN OFFER TO BUY THESE SECURITIES IN ANY JURISDICTION WHERE THE OFFER OR SALE IS NOT PERMITTED.
134
| Structural and Collateral Term Sheet | BBCMS 2019-C3 | |
| No. 10 – The Colonnade Office Complex | ||
The Colonnade Office Complex Property is located in the Dallas-Fort Worth-Arlington metropolitan statistical area (the “Dallas MSA”). The Dallas MSA has a population of approximately 7.4 million, making it the fourth largest metropolitan statistical area in the United States. Major industries in the Dallas MSA economy include banking, commerce, telecommunications, technology, energy, healthcare and medical research, and transportation and logistics. In 2018, the Dallas MSA was home to 22 Fortune 500 companies, the third largest concentration of Fortune 500 companies in the nation, behind New York City and Chicago. Major employers in the Dallas MSA include Bank of America Corp., Texas Health Resources, Inc., Baylor Health Care System, AT&T, and JP Morgan & Chase Co. According to the appraisal, corporate relocations to the Dallas MSA in recent years include Toyota, Liberty Mutual, and State Farm.
Additional national retailers and restaurants within close proximity of The Colonnade Office Complex Property include Whole Foods Market, Walgreens, In-N-Out Burger, Whataburger, Outback Steakhouse, BJ’s Restaurants and Brewhouse, Chipotle, and McDonald’s. Nearby retail centers include Prestonwood Town Center (0.5 miles east), which is anchored by Walmart Supercenter, Michael’s, Best Buy, and DSW, as well as Addison Town Center (2.2 miles west), which is anchored by Target, Kroger, and PetSmart. The Galleria Mall, located approximately 2.4 miles south of The Colonnade Office Complex Property off North Dallas Parkway, is a regional mall anchored by Nordstrom, Macy’s, and Saks Fifth Avenue. Other retailers at the Galleria Mall include Tiffany, Gucci, Rolex, Bachendorf’s, Versace, and Louis Vuitton. The Galleria Mall has over 200 stores and restaurants and features an indoor ice skating rink. Nationally flagged hospitality properties are concentrated southwest of The Colonnade Office Complex Property, including Marriott, Renaissance, Courtyard by Marriott, Radisson Hotel, Hyatt House, and Residence Inn.
According to a third party market research report, The Colonnade Office Complex Property is located in the Dallas/Fort Worth office market and the Far North Dallas office submarket cluster. The Dallas/Fort Worth office market contains approximately 381.7 million square feet of office space with a vacancy rate of 14.9% and average asking rental rate of $25.51 per square foot NNN as of the third quarter of 2018. The Dallas/Fort Worth office market experienced positive year to date net absorption of 4.2 million square feet at the end of the third quarter of 2018. The Far North Dallas office submarket cluster contains approximately 64.7 million square feet of office space with a vacancy rate of 15.1% and an average asking rental rate of $28.66 per square foot NNN as of the third quarter of 2018. The Far North Dallas office submarket cluster experienced positive year to date net absorption of 666,235 square feet at the end of the third quarter of 2018. According to a third party market research report, the estimated 2018 population within a one-, three- and five-mile radius of The Colonnade Office Complex Property was 10,587, 143,954 and 373,092, respectively, and the 2018 estimated average household income within the same one-, three- and five-mile radius was $95,316, $97,719 and $101,781, respectively.
The appraisal identified five competitive properties built between 1982 and 2018 ranging in size from approximately 240,000 square feet to 549,170 square feet. The appraisal’s competitive set reported rent from $23.00 per square foot to $32.00 per square foot, with a weighted average rent of $25.93 per square foot. The appraisal concluded a market rent of $24.00 per square foot for office space.
THE INFORMATION IN THIS STRUCTURAL AND COLLATERAL TERM SHEET IS NOT COMPLETE AND MAY BE AMENDED PRIOR TO THE TIME OF SALE. THIS TERM SHEET IS NOT AN OFFER TO SELL THESE SECURITIES AND IT IS NOT A SOLICITATION OF AN OFFER TO BUY THESE SECURITIES IN ANY JURISDICTION WHERE THE OFFER OR SALE IS NOT PERMITTED.
135
| Structural and Collateral Term Sheet | BBCMS 2019-C3 | |
| No. 10 – The Colonnade Office Complex | ||
The following table presents recent leasing data at competitive office buildings with respect to The Colonnade Office Complex Property:
| Comparable Office Leases(1) | |||||||||
| Property Name/Location | Year Built | Occ. | Size (SF) | Tenant | Suite Size (SF) | Rent PSF | Lease Date | Lease Term (Months) | Lease Type |
| The Colonnade Office Complex 15301-15305 North Dallas Parkway Addison, Texas | 1983 | 91.2%(2) | 1,080,180(2) | Aliera Healthcare, Inc.(2) | 3,297(2) | $23.00(2) | May-17(2) | 65(2) | NNN(2) |
| North Park Central 8750 North Central Expressway Dallas, Texas | 1984 | 92.0% | 508,102 | Undisclosed | 6,938 | $24.25 | Sept-17 | 60 | NNN |
| One Galleria Tower 13355 Noel Road Dallas, Texas | 1982 | 88.0% | 477,790 | Undisclosed | 9,936 | $28.50 | Nov-18 | 60 | NNN |
| Pinnacle Tower 5005 LBJ Freeway Dallas, Texas | 1986 | 91.0% | 549,170 | Crown Labs | 8,509 | $24.50 | Dec-18 | 120 | NNN |
| Millennium Tower 15455 Dallas Parkway Addison, Texas | 1999 | 80.0% | 357,102 | Undisclosed | 9,633 | $23.00 | Aug-18 | 60 | NNN |
| Fourteen 555 North Building 14555 North Dallas Parkway Dallas, Texas | 2018 | 85.0% | 240,000 | Occidental Petroleum | 120,000 | $32.00 | Oct-18 | 60 | NNN |
| (1) | Source:Appraisal. |
| (2) | Based on the underwritten rent roll. |
The Borrower. The borrowing entity for The Colonnade Office Complex Whole Loan is FPG Colonnade, LP, a Delaware limited partnership and special purpose entity. Legal counsel to the borrower delivered a non-consolidation opinion in connection with the origination of The Colonnade Office Complex Whole Loan. Fortis Property Group, LLC (“Fortis”) is the guarantor of certain nonrecourse carve-outs under The Colonnade Office Complex Whole Loan.
The Loan Sponsor.The loan sponsor is Fortis, a private U.S. real estate investment, operating and development company based in Brooklyn, New York. Founded in 2005, Fortis has acquired and/or developed approximately 8.0 million square feet throughout the United States, with an emphasis on the Northeast and Dallas, Texas markets. Fortis’ portfolio of developments and properties under management are primarily Class A office and multi family rental and condominium properties, along with other assets such as retail and industrial. The borrower sponsor has had past loan defaults. See “Description of the Mortgage Pool—Loan Purpose; Default History, Bankruptcy Issues and Other Proceedings” in the Preliminary Prospectus.
Property Management. The Colonnade Office Complex Property is managed by FPG Texas Management, LP, an affiliate of the borrower.
Escrows and Reserves. At origination, the borrower was required to deposit into escrow (i) $69,163 for immediate repairs, (ii) $502,948 for real estate taxes, (iii) $631,755 for free rent with respect to Mente Group, LLC ($14,848), Mitsui Sumitomo Marine Management (U.S.A.), Inc. ($16,757), Accounting Principals, Inc. ($18,899), Roth Staffing Companies, L.P. ($19,273), Google, Inc. ($89,271), Hiersche, Hayward, Drakeley & Urbach, P.C. ($103,842), Dillon Gage Incorporated of Dallas ($148,292), and Systemware ($220,573), (iv) $1,127,202 for outstanding landlord obligations with respect to Mitsui Sumitomo Marine Management (U.S.A.), Inc. ($94,736), HQ Global Workplaces, LLC ($158,136), Google, Inc. ($378,835), and USP Texas, L.P. ($495,495), and (v) $4,000,000 for tenant improvements and leasing commissions.
Tax Escrows - On a monthly basis, the borrower is required to escrow 1/12 of the annual estimated tax payments, which currently equates to $502,948.
Insurance Escrows - The requirement for the borrower to make deposits to the insurance escrow is waived so long as no event of default has occurred and is continuing and The Colonnade Office Property is insured under a blanket insurance policy in accordance with the loan documents.
THE INFORMATION IN THIS STRUCTURAL AND COLLATERAL TERM SHEET IS NOT COMPLETE AND MAY BE AMENDED PRIOR TO THE TIME OF SALE. THIS TERM SHEET IS NOT AN OFFER TO SELL THESE SECURITIES AND IT IS NOT A SOLICITATION OF AN OFFER TO BUY THESE SECURITIES IN ANY JURISDICTION WHERE THE OFFER OR SALE IS NOT PERMITTED.
136
| Structural and Collateral Term Sheet | BBCMS 2019-C3 | |
| No. 10 – The Colonnade Office Complex | ||
Replacement Reserves- On a monthly basis, the borrower is required to escrow $17,987 for replacement reserves.
TI/LC Reserves - On a monthly basis, the borrower is required to escrow $89,933 for tenant improvements and leasing commissions (subject to a cap of $6,000,000).
Lockbox / Cash Management.The Colonnade Office Complex Whole Loan documents require a hard lockbox with springing cash management. The borrower was required at origination of The Colonnade Office Complex Whole Loan to deliver written instructions to tenants directing them to deposit all rents payable under such leases directly into a lender-controlled lockbox account. The Colonnade Office Complex Whole Loan documents require that all rents received by the borrower or the property manager be deposited into the lockbox account within one business day of receipt. Funds in the lockbox account, absent the occurrence and continuance of a Triggering Event (as defined below), are required to be transferred on each business day to a borrower operating account. Upon the first occurrence of a Triggering Event, the borrower is required to establish a cash management account under sole control of the lender, to which, during a Triggering Event, all amounts in the lockbox account are required to be automatically transferred on each business day for the payment, among other things, of the debt service, monthly escrows, default interest and late payment charges. Absent the continuance of a Cash Sweep Period (as defined below), any remaining funds after such disbursements are required to be distributed to the borrower. Upon a Cash Sweep Period, all remaining excess cash flow will be escrowed in an excess cash flow reserve account (provided, however, that if a Cash Sweep Period has occurred solely as a result of a Material Tenant Trigger Event (as defined below), then such amount will be applied to a Material Tenant (as defined below) reserve account).
A “Triggering Event” will commence upon the earliest to occur of (i) an event of default under The Colonnade Office Complex Whole Loan documents or The Colonnade Office Complex Mezzanine Loan documents, (ii) the debt service coverage ratio for the immediately preceding 12-month period of The Colonnade Office Complex debt, including The Colonnade Office Complex Mezzanine Loan (the “Cumulative DSCR”), falling below 1.15x for two consecutive calendar quarters, (iii) the date on which the borrower, the guarantor, or the property manager becomes insolvent or a debtor in a bankruptcy action, (iv) an indictment for fraud or misappropriation of funds by the borrower, the guarantor, Louis Kestenbaum, Joel Kestenbaum or the property manager (provided, that in the case of a third party manager, such indictment is related to The Colonnade Office Complex Property), or (v) a Material Tenant Trigger Event. A Triggering Event will end upon the occurrence of: with regard to clause (i) above, the cure of such event of default; with regard to clause (ii) above, the Cumulative DSCR being at least 1.20x for two consecutive calendar quarters; with regard to clause (iii) above, such bankruptcy action petition having been discharged, stayed, or dismissed within 120 days of such filing among other conditions, or with respect to the property manager, the borrower having replaced the property manager with a qualified property manager acceptable to the lender; with regard to clause (iv) above, (a) the dismissal of the applicable indictment, (b) the acquittal of each applicable person with respect to the related charge(s) or (c) the replacement of the property manager with a qualified manager under a replacement property management agreement; or with regard to clause (v) above, the cure of such Material Tenant Trigger Event.
A “Cash Sweep Period” will commence upon the earliest to occur of (i) an event of default under The Colonnade Office Complex Whole Loan documents or The Colonnade Office Complex Mezzanine Loan documents, (ii) the Cumulative DSCR falling below 1.10x for two consecutive calendar quarters, (iii) the date on which the borrower, the guarantor, or the property manager becomes insolvent or a debtor in a bankruptcy action, or (iv) a Material Tenant Trigger Event. A Cash Sweep Period will end upon the occurrence of: with regard to clause (i) above, the cure of such event of default; with regard to clause (ii) above, the Cumulative DSCR being at least 1.15x for two consecutive calendar quarters; with regard to clause (iii) above, such bankruptcy action petition having been discharged, stayed, or dismissed within 120 days of such filing among other conditions, or with respect to the property manager, the borrower having replaced the property manager with a qualified property manager acceptable to the lender; or with regard to clause (iv) above, the cure of such Material Tenant Trigger Event.
A “Material Tenant Trigger Event” will commence upon the occurrence of (i) a Material Tenant giving notice of its intent to terminate or not to extend or renew its lease, (ii) on or prior to 12 months prior to the expiration date of a Material Tenant’s lease, the related Material Tenant failing to extend or renew its lease, (iii) on or prior to the date on which a Material Tenant is required under its lease to provide notification of its election to renew its lease, such Material Tenant failing to give such notice, (iv) a monetary or a material non-monetary event of default under a Material Tenant lease that continues beyond any applicable notice and cure period, (v) any Material Tenant or any guarantor of the applicable Material Tenant lease becoming insolvent or a debtor in any bankruptcy action, (vi) a Material Tenant lease being terminated, in whole or in part,
THE INFORMATION IN THIS STRUCTURAL AND COLLATERAL TERM SHEET IS NOT COMPLETE AND MAY BE AMENDED PRIOR TO THE TIME OF SALE. THIS TERM SHEET IS NOT AN OFFER TO SELL THESE SECURITIES AND IT IS NOT A SOLICITATION OF AN OFFER TO BUY THESE SECURITIES IN ANY JURISDICTION WHERE THE OFFER OR SALE IS NOT PERMITTED.
137
| Structural and Collateral Term Sheet | BBCMS 2019-C3 | |
| No. 10 – The Colonnade Office Complex | ||
or being no longer in full force and effect; provided that with respect to a partial termination, such partial termination relates to a portion of a Material Tenant’s space that (a) makes up 10% or more of the total net rentable square footage or (b) is responsible for 10% or more of the total base rent of The Colonnade Office Complex Property, or (vii) any Material Tenant “going dark”, vacating or ceasing to occupy or conduct business at its space or a portion thereof constituting 10% or more of the total net rentable area at The Colonnade Office Complex Property. Notwithstanding the above, if the Cumulative DSCR excluding the rent paid or payable by such Material Tenant is at least 1.30x, no event relating to clause (i), (ii), or (iii) of this definition constitutes as a Material Tenant Trigger Event. A Material Tenant Trigger Event will end upon the occurrence of: with regard to clause (i) above, (a) the revocation or rescission by the applicable Material Tenant of all termination or cancellation notices with respect to such Material Tenant lease, (b) an acceptable Material Tenant lease extension with respect to the applicable Material Tenant space, or (c) all of the applicable Material Tenant space being leased to a replacement tenant; with regard to clauses (ii) and (iii) above, (x) an acceptable Material Tenant lease extension with respect to such Material Tenant space or (y) all of the applicable Material Tenant space being leased to a replacement tenant; with regard to clause (iv) above, a cure of the applicable event of default under the applicable Material Tenant lease; with regard to clause (v) above, an affirmation of the Material Tenant lease in the applicable bankruptcy proceeding and confirmation that the Material Tenant is actually paying all rents and other amounts due under its lease; with regard to clause (vi) above, all of the applicable Material Tenant space being leased to a replacement tenant; or with regard to clause (vii) above, the applicable Material Tenant having re-opened for business or the applicable Material Tenant space being leased to an acceptable replacement tenant.
A “Material Tenant” shall mean (i) Hilton Domestic Operating Company, (ii) USP, or (iii) any tenant whose leases, either individually or when taken together with any other lease with the same tenant or affiliate tenant, (x) cover no less than 10% of the net rentable area at The Colonnade Office Complex Property or (y) require the payment of base rent that is no less than 10% of the total in-place base rent at The Colonnade Office Complex Property.
Subordinate and Mezzanine Debt. The Colonnade Office Complex B-Note, which has an original principal value of $55.0 million, is subordinate to The Colonnade Office Complex Senior Loan and accrues interest at a rate of 5.25000%per annum. The Colonnade Office Complex C-Note, which has an original principal value of $63.0 million, is subordinate to The Colonnade Office Complex B-Note and accrues interest at a rate of 6.47000%per annum. The Colonnade Office Complex Subordinate Notes are coterminous with The Colonnade Office Complex Senior Loan. The holders of The Colonnade Office Complex Senior Loan and The Colonnade Office Complex Subordinate Notes have entered into a co-lender agreement that sets forth the allocation of collections on The Colonnade Office Complex Whole Loan. Based on The Colonnade Office Complex Whole Loan, the cumulative Cut-off Date LTV Ratio, cumulative U/W NCF DSCR and cumulative U/W NOI Debt Yield are 64.2%, 1.58x and 9.0%, respectively.
Additionally, a $17.0 million mezzanine loan was funded concurrently with the origination of The Colonnade Office Complex Whole Loan (“The Colonnade Office Complex Mezzanine Loan”), which is secured by the direct equity ownership in the borrower. The Colonnade Office Complex Mezzanine Loan accrues interest at a rate of 12.0000%per annum and is coterminous with The Colonnade Office Complex Whole Loan. Including The Colonnade Office Complex Whole Loan and The Colonnade Office Complex Mezzanine Loan, the total Cut-off Date LTV Ratio, total U/W NCF DSCR and total U/W NOI Debt Yield are 69.0%, 1.35x and 8.4%, respectively. The lenders of The Colonnade Office Complex Whole Loan and The Colonnade Office Complex Mezzanine Loan have entered into an intercreditor agreement that governs their relationship.
Partial Release. Not permitted.
Ground Lease. None.
THE INFORMATION IN THIS STRUCTURAL AND COLLATERAL TERM SHEET IS NOT COMPLETE AND MAY BE AMENDED PRIOR TO THE TIME OF SALE. THIS TERM SHEET IS NOT AN OFFER TO SELL THESE SECURITIES AND IT IS NOT A SOLICITATION OF AN OFFER TO BUY THESE SECURITIES IN ANY JURISDICTION WHERE THE OFFER OR SALE IS NOT PERMITTED.
138
[THIS PAGE INTENTIONALLY LEFT BLANK]
139
| Structural and Collateral Term Sheet | BBCMS 2019-C3 | |
| No. 11 – Wolverine Portfolio | ||
| Mortgage Loan Information | Property Information | |||
| Mortgage Loan Seller: | UBS AG | Single Asset / Portfolio: | Portfolio | |
| Original Principal Balance(1): | $30,000,000 | Title: | Fee | |
| Cut-off Date Principal Balance(1): | $30,000,000 | Property Type - Subtype: | Manufactured Housing | |
| % of IPB: | 3.2% | Net Rentable Area (Pads): | 1,649 | |
| Loan Purpose: | Refinance | Location: | Various | |
| Borrowers(2): | Various | Year Built / Renovated: | Various / Various | |
| Borrower Sponsor(3): | Ross H. Partrich | Occupancy: | 79.9% | |
| Interest Rate: | 4.90000% | Occupancy Date: | 3/4/2019 | |
| Note Date: | 3/28/2019 | 4thMost Recent NOI (As of)(4): | $3,303,283 (12/31/2015) | |
| Maturity Date: | 4/6/2029 | 3rd Most Recent NOI (As of)(4): | $3,484,663 (12/31/2016) | |
| Interest-only Period: | 48 months | 2nd Most Recent NOI (As of)(4): | $4,464,818 (12/31/2017) | |
| Original Term: | 120 months | Most Recent NOI (As of)(4): | $4,749,188 (TTM 2/28/2019) | |
| Original Amortization Term: | 360 months | UW Economic Occupancy: | 78.0% | |
| Amortization Type: | IO-Balloon | UW Revenues: | $8,308,685 | |
| Call Protection(5): | L(26),Def(90),O(4) | UW Expenses: | $3,371,488 | |
| Lockbox / Cash Management: | Springing / Springing | UW NOI: | $4,937,197 | |
| Additional Debt(1): | Yes | UW NCF: | $4,854,747 | |
| Additional Debt Balance(1): | $29,000,000 | Appraised Value / Per Pad: | $84,490,000 / $51,237 | |
| Additional Debt Type(1): | Pari Passu | Appraisal Date: | Various | |
| Escrows and Reserves | Financial Information(1) | ||||||
| Initial | Monthly | Initial Cap | Cut-off Date Loan / Pad: | $35,779 | |||
| Taxes: | $137,321 | $45,774 | N/A | Maturity Date Loan / Pad: | $32,296 | ||
| Insurance: | $0 | Springing(6) | N/A | Cut-off Date LTV: | 69.8% | ||
| Replacement Reserves: | $0 | $6,871 | N/A | Maturity Date LTV: | 63.0% | ||
| Immediate Repairs: | $284,203 | $0 | N/A | UW NCF DSCR: | 1.29x | ||
| UW NOI Debt Yield: | 8.4% | ||||||
| Sources and Uses | |||||||
| Sources | Proceeds | % of Total | Uses | Proceeds | % of Total | ||
| Whole Loan | $59,000,000 | 100.0% | Payoff Existing Debt(7) | $56,375,942 | 95.6% | ||
| Closing Costs | 972,894 | 1.6 | |||||
| Upfront Reserves | 421,523 | 0.7 | |||||
| Return of Equity | 1,229,640 | 2.1 | |||||
| Total Sources | $59,000,000 | 100.0% | Total Uses | $59,000,000 | 100.0% | ||
| (1) | The Wolverine Portfolio mortgage loan is part of a whole loan evidenced by tenpari passunotes with an aggregate original principal balance of $59.0 million. The financial information presented in the chart above reflects the Cut-off Date balance of the Wolverine Portfolio Whole Loan (as defined below). |
| (2) | The borrowing entities for the Wolverine Portfolio Whole Loan are Appletree Estates Associates, LLC, Brighton Village Associates, LLC, Chalet Village Associates, LLC, College Heights Associates, LLC, Fernwood Associates MHC, LLC, Hillcrest Acres Associates, LLC, Metro Commons Associates, LLC, Royal Village Associates, LLC, Satellite Bay Associates, LLC, and South Lyon Woods Associates, LLC, each a Delaware limited liability company and special purpose entity with one independent director. |
| (3) | The borrower sponsor and guarantor reported multiple deed-in-lieu foreclosures that occurred between 2003 and 2006. At loan origination, the guarantor provided a payment guaranty not to exceed the amount of $3.0 million to the lender (the "Payment Guaranty"). The Payment Guaranty will be released in the event the Wolverine Portfolio (as defined below) achieves a debt yield of not less than 9.0% for two consecutive quarters; provided that (i) no default of any material term then exists under the recourse carve-out guaranty and the environmental indemnity and (ii) no event of default then exists. |
| (4) | See “Operating History and Underwritten Net Cash Flow” section below for explanations on historical fluctuations in NOI. |
| (5) | Defeasance of the Wolverine Portfolio Whole Loan is permitted at any time after the end of the two-year period commencing on the closing date of the securitization of the last note comprising the Wolverine Portfolio Whole Loan to be securitized. The assumed lockout period of 26 payments is based on the closing date of this transaction in June 2019. Following the lockout period and prior to January 6, 2029, the borrowers are permitted to obtain the release of any individual property in connection with the sale of such individual property to a third party purchaser, provided that, among other conditions, (i) the debt service coverage ratio for the remaining properties is not less than the debt service coverage ratio immediately preceding such release, (ii) the debt yield for the remaining properties is not less than the debt yield immediately preceding such release, (iii) the loan-to-value for the remaining properties is not greater than the loan-to-value immediately preceding such release, (iv) partial defeasance with payment of a release price equal to 110% of the allocated loan amount for the release property, (v) no event of default has occurred and is continuing, (vi) after giving effect to such release, the affiliate borrower does not own any homes or personal property on such release property, and (vii) satisfaction of REMIC conditions. The borrowers are permitted to obtain the release of the Royal Village property and/or Chalet Village property in the event of a casualty or condemnation resulting in such property’s |
THE INFORMATION IN THIS STRUCTURAL AND COLLATERAL TERM SHEET IS NOT COMPLETE AND MAY BE AMENDED PRIOR TO THE TIME OF SALE. THIS TERM SHEET IS NOT AN OFFER TO SELL THESE SECURITIES AND IT IS NOT A SOLICITATION OF AN OFFER TO BUY THESE SECURITIES IN ANY JURISDICTION WHERE THE OFFER OR SALE IS NOT PERMITTED.
140
| Structural and Collateral Term Sheet | BBCMS 2019-C3 | |
| No. 11 – Wolverine Portfolio | ||
| inability to continue operating as a mobile or manufactured housing community pursuant to applicable zoning laws. See “Description of the Mortgage Pool—Certain Terms of the Mortgage Loan—Releases; Partial Releases” in the Preliminary Prospectus for more information. |
| (6) | The Wolverine Portfolio Whole Loan documents do not require ongoing monthly escrows for insurance premiums as long as the borrower provides the lender with evidence that the insurance coverage for the Wolverine Portfolio Properties (as defined below) are included in a blanket policy and such policy is in full force and effect and the borrower pays all applicable insurance premiums and provides the lender with evidence of renewals. |
| (7) | Loan payoff represents payoff of (i) existing debt encumbering the Wolverine Portfolio Properties of approximately $45.2 million and (ii) an existing note for the purchase of 397 homes at the Wolverine Portfolio Properties of approximately $11.2 million. See “The Loan” and “The Properties” sections below for more information. |
The Loan.The Wolverine Portfolio mortgage loan is part of a whole loan (the “Wolverine Portfolio Whole Loan”) evidenced by tenpari passu promissory notes with an aggregate original principal balance of $59,000,000. The Wolverine Portfolio Whole Loan is secured by a first lien mortgage encumbering (i) the borrowers’ fee interest in ten manufactured housing community ("MHC") properties located in ten cities throughout Michigan, Ohio, and Florida (the “Wolverine Portfolio” or “Wolverine Portfolio Properties”) and (ii) the borrower’s equity interest in an affiliate entity (“MH Owner”) that owns 516 homes at the Wolverine Portfolio Properties. See “The Properties” section below for more information. Promissory Notes A-3, A-4, A-6, A-7 and A-8 with an aggregate original principal balance of $30,000,000 will be included in the BBCMS 2019-C3 Trust. The Wolverine Portfolio Whole Loan will be serviced pursuant to the pooling and servicing agreement for the BBCMS 2019-C3 Trust. See “Description of the Mortgage Pool—The Whole Loans—The Serviced Pari Passu Whole Loans” and “Pooling and Servicing Agreement” in the Preliminary Prospectus. The Wolverine Portfolio Whole Loan has a 10-year term and is interest-only for the first 48 months of the term followed by a 30-year amortization schedule.
| Whole Loan Summary | |||
| Note | Original Balance | Note Holder | Controlling Piece |
| A-1 | $10,000,000 | WFCM 2019-C50 | No |
| A-2 | 10,000,000 | WFCM 2019-C50 | No |
| A-3 | 10,000,000 | BBCMS 2019-C3 | Yes |
| A-4 | 5,000,000 | BBCMS 2019-C3 | No |
| A-5 | 5,000,000 | WFCM 2019-C50 | No |
| A-6 | 5,000,000 | BBCMS 2019-C3 | No |
| A-7 | 5,000,000 | BBCMS 2019-C3 | No |
| A-8 | 5,000,000 | BBCMS 2019-C3 | No |
| A-9 | 2,000,000 | UBA AG, or an affiliate | No |
| A-10 | 2,000,000 | UBA AG, or an affiliate | No |
| Total | $59,000,000 | ||
The Properties. The Wolverine Portfolio is a ten-property MHC portfolio located in 10 different cities throughout Michigan, Ohio, and Florida, totaling approximately 1,649 pad sites. The borrower sponsor acquired the 10 properties in the Wolverine Portfolio as part of a larger 18-property portfolio. The borrower sponsor has invested approximately $8.5 million ($5,157 per pad site) in capital improvements at the Wolverine Portfolio Properties since 2003, including electrical system replacements, plumbing, and road and sideway paving. Since 2016, the borrower sponsor has rehabilitated existing park-owned homes and replaced abandoned resident-owned homes with 397 brand new park-owned homes, spending approximately $19.85 million ($50,000 per home). As of loan origination, MH Owner owns 516 homes at the Wolverine Portfolio Properties, or 31.3% of the total pad sites, and the borrower sponsor pledged 100% of its equity interest in MH Owner as additional collateral for the Wolverine Portfolio Whole Loan. No income from the affiliate-owned home rentals was included in the lender’s underwritten revenues, and only the income derived from the pad sites was underwritten. Under the Wolverine Portfolio Whole Loan documents, such affiliate-owned homes may generally not exceed 40.0% of the aggregate homes at the Wolverine Portfolio Properties. No affiliate-owned homes existing as of the date of origination may be subject to or serve as collateral for any financing (other than the Wolverine Portfolio Whole Loan). See “Description of the Mortgage Pool—Mortgage Pool Characteristics—Manufactured Housing Community Properties” in the Preliminary Prospectus for limitations on the purchase, sale, and release of homes owned by MH Owner.
Six of the properties totaling 1,180 pad sites (71.6% of total Wolverine Portfolio pad sites) are located in Michigan, three properties totaling 236 pad sites (14.3% of Wolverine Portfolio pad sites) are located in Florida, and one property with 233 pad sites (14.1% of Wolverine Portfolio pad sites) is located in Ohio. Common amenities at the Wolverine Portfolio Properties vary, but most include a clubhouse, pool, playground, and basketball court, among others.
THE INFORMATION IN THIS STRUCTURAL AND COLLATERAL TERM SHEET IS NOT COMPLETE AND MAY BE AMENDED PRIOR TO THE TIME OF SALE. THIS TERM SHEET IS NOT AN OFFER TO SELL THESE SECURITIES AND IT IS NOT A SOLICITATION OF AN OFFER TO BUY THESE SECURITIES IN ANY JURISDICTION WHERE THE OFFER OR SALE IS NOT PERMITTED.
141
| Structural and Collateral Term Sheet | BBCMS 2019-C3 | |
| No. 11 – Wolverine Portfolio | ||
As of the March 4, 2019 rent rolls, occupancies range from 48.9% at the Royal Village property in Toledo, Ohio to 98.4% at the Chalet Village property in Tampa, Florida and the Wolverine Portfolio has a weighted average physical occupancy of 79.9%. Weighted average historical occupancy at the Wolverine Portfolio between 2009 and 2018 ranges from 75.8% to 88.7%. Weighted average annual rental rate increases at the Wolverine Portfolio were 2.7%, 2.8%, 3.3%, and 4.1% for the years between 2015 and 2018, respectively.
The following table presents certain information relating to the Wolverine Portfolio Properties:
| Portfolio Summary | ||||||||||
| Property Name | Location | Allocated Loan Amount ($) | % of ALA | Net Rentable Area (Pads) | Occupancy | Year Built/ Renovated | Appraised Value ($) | Allocated Cut-off Date LTV | % of UW NOI | Parking Ratio (Per Pad) |
| Apple Tree Estates | Walker, MI | $10,797,000 | 18.3% | 238 | 88.7% | 1971/2005 | $15,460,000 | 69.8% | 18.1% | 2.14 |
| South Lyon | South Lyon, MI | 10,021,000 | 17.0 | 211 | 88.2% | 1972/NAP | 14,350,000 | 69.8% | 17.9 | 2.00 |
| Metro Commons | Romulus, MI | 8,659,000 | 14.7 | 227 | 82.4% | 1978/NAP | 12,400,000 | 69.8% | 14.6 | 2.21 |
| Brighton Village | Brighton, MI | 8,470,000 | 14.4 | 193 | 86.5% | 1960/NAP | 12,130,000 | 69.8% | 13.6 | 2.00 |
| College Heights | Auburn Hills, MI | 5,901,000 | 10.0 | 161 | 85.7% | 1964/NAP | 8,450,000 | 69.8% | 10.5 | 1.61 |
| Hillcrest | Kalamazoo, MI | 4,057,000 | 6.9 | 150 | 70.7% | 1962/NAP | 5,810,000 | 69.8% | 6.8 | 2.03 |
| Royal Village | Toledo, OH | 3,575,000 | 6.1 | 233 | 48.9% | 1979/NAP | 5,120,000 | 69.8% | 5.9 | 2.07 |
| Fernwood | Deland, FL | 2,877,000 | 4.9 | 92 | 77.2% | 1971/NAP | 4,120,000 | 69.8% | 4.4 | 2.04 |
| Satellite Bay | Clearwater, FL | 2,339,000 | 4.0 | 83 | 94.0% | 1973/NAP | 3,350,000 | 69.8% | 4.4 | 2.10 |
| Chalet Village | Tampa, FL | 2,304,000 | 3.9 | 61 | 98.4% | 1965/2005 | 3,300,000 | 69.8% | 3.7 | 2.11 |
| Total/Weighted Average | $59,000,000 | 100.0% | 1,649 | 79.9% | $84,490,000 | 69.8% | 100.0% | 2.04 | ||
| Historical and Current Occupancy | |||||
| 2014(1) | 2015(1) | 2016(1) | 2017(1) | 2018(1) | Current(2) |
| 77.4% | 75.8% | 83.3% | 85.6% | 88.7% | 79.9% |
| (1) | Information provided by the borrower sponsor. Historical occupancy is based on the total number of pad sites occupied by resident-owned homes and both rented and non-rented park-owned homes. |
| (2) | Information obtained from the underwritten rent roll. Current occupancy is based on the total number of pad sites occupied by resident-owned homes and rented park-owned homes. Pad site revenue from the 150 non-rented park-owned homes was excluded from the underwriting. |
The Market.The Wolverine Portfolio Properties are located across six statistical metropolitan areas (“SMAs”) within residential suburban areas. Four properties, accounting for 56.0% of the allocated loan amount, are located in the Detroit-Warren-Dearborn SMA. The Apple Tree Estates property, accounting for 18.3% of the allocated loan amount, is located in the Grand Rapids-Wyoming SMA. Two properties, accounting for 7.9% of the allocated loan amount, are located in the Tampa-St. Petersburg-Clearwater SMA. The Hillcrest property, accounting for 6.9% of the allocated loan amount, is located in the Kalamazoo-Portage SMA. The Royal Village property, accounting for 6.1% of the allocated loan amount, is located in the Toledo SMA. The Fernwood property, accounting for 4.9% of the allocated loan amount, is located in the Deltona-Daytona Beach-Ormond Beach SMA.
THE INFORMATION IN THIS STRUCTURAL AND COLLATERAL TERM SHEET IS NOT COMPLETE AND MAY BE AMENDED PRIOR TO THE TIME OF SALE. THIS TERM SHEET IS NOT AN OFFER TO SELL THESE SECURITIES AND IT IS NOT A SOLICITATION OF AN OFFER TO BUY THESE SECURITIES IN ANY JURISDICTION WHERE THE OFFER OR SALE IS NOT PERMITTED.
142
| Structural and Collateral Term Sheet | BBCMS 2019-C3 | |
| No. 11 – Wolverine Portfolio | ||
The following table presents certain information relating to the demographics for the Wolverine Portfolio Properties:
| Demographics(1) | ||||
| Property Name | Projected 2019 Population (3-mile radius) | Projected 2019 Population | Projected 2019 Avg Household Income (3-mile radius) | Projected 2019 Avg Household Income (5-mile radius) |
| Apple Tree Estates | 31,307 | 81,970 | $83,716 | $76,951 |
| South Lyon | 29,493 | 47,909 | $118,873 | $119,966 |
| Metro Commons | 66,941 | 177,798 | $67,434 | $70,790 |
| Brighton Village | 29,197 | 51,684 | $124,603 | $129,314 |
| College Heights | 52,654 | 167,160 | $113,627 | $109,827 |
| Hillcrest | 51,830 | 123,870 | $59,069 | $64,723 |
| Royal Village | 46,620 | 122,461 | $93,974 | $91,255 |
| Fernwood | 26,117 | 58,941 | $69,787 | $65,758 |
| Satellite Bay | 81,585 | 229,204 | $64,472 | $65,849 |
| Chalet Village | 105,062 | 251,935 | $61,578 | $69,508 |
| (1) | Information obtained from third party research reports. |
Seven Wolverine Portfolio Properties, accounting for 87.3% of the allocated loan amount, are located in the Midwest Region MHC market. In 2017, the Midwest Region MHC market exhibited monthly market rent of $370 per pad, which is a 2.8% increase over $360 per pad in 2016, and vacancy of 16.5%, which is a 12.2% decrease from 18.8% in 2016. Three Wolverine Portfolio Properties, accounting for 12.7% of the allocated loan amount, are located in the South Region MHC market. In 2017, the South Region MHC market exhibited monthly market rent of $394 per pad, which is a 0.5% decrease over $396 per pad in 2016, and vacancy of 8.1%, which is a 12.9% decrease from 9.3% in 2016.
The following table presents certain information relating to comparable rental information for the Wolverine Portfolio Properties:
| Submarket Summary(1) | ||||||
| Property Name | Pads(2) | In-Place U/W Base Rent(2) | Competitive Set Average Rent | In-Place Vacancy(2) | Competitive Set Vacancy | Appraisal Concluded Vacancy(3) |
| Apple Tree Estates | 238 | $452 | $463 | 11.3% | 3.6% | 10.0% |
| South Lyon | 211 | $554 | $537 | 11.8% | 6.6% | 14.0% |
| Metro Commons | 227 | $508 | $474 | 17.6% | 5.5% | 16.0% |
| Brighton Village | 193 | $496 | $432 | 13.5% | 9.5% | 15.0% |
| College Heights | 161 | $526 | $537 | 14.3% | 6.6% | 17.0% |
| Hillcrest | 150 | $442 | $456 | 29.3% | 7.0% | 25.0% |
| Royal Village | 233 | $453 | $498 | 51.1% | 9.7% | 48.0% |
| Fernwood | 92 | $470 | $436 | 22.8% | 4.2% | 23.0% |
| Satellite Bay | 83 | $481 | $495 | 6.0% | 7.1% | 8.5% |
| Chalet Village | 61 | $560 | $488 | 1.6% | 16.0% | 3.0% |
| Total/Weighted Average | 1,649 | $491 | $483 | 20.1% | 7.1% | 19.7% |
| (1) | Information obtained from appraisals. |
| (2) | Information obtained from the underwritten rent roll as of March 4, 2019. |
| (3) | Appraisal Concluded Vacancy is based on property rent rolls as of November 20, 2018. |
THE INFORMATION IN THIS STRUCTURAL AND COLLATERAL TERM SHEET IS NOT COMPLETE AND MAY BE AMENDED PRIOR TO THE TIME OF SALE. THIS TERM SHEET IS NOT AN OFFER TO SELL THESE SECURITIES AND IT IS NOT A SOLICITATION OF AN OFFER TO BUY THESE SECURITIES IN ANY JURISDICTION WHERE THE OFFER OR SALE IS NOT PERMITTED.
143
| Structural and Collateral Term Sheet | BBCMS 2019-C3 | |
| No. 11 – Wolverine Portfolio | ||
| Operating History and Underwritten Net Cash Flow | |||||||
| 2015(1) | 2016(1) | 2017(1) | TTM(2) | Underwritten | Per Pad | %(4) | |
| Rents in Place | $5,908,332 | $6,283,605 | $7,176,059 | $7,614,006 | $7,820,388 | $4,743 | 75.1% |
| Vacant Income | 2,684,591 | 2,563,570 | 1,940,941 | 1,891,486 | 1,899,648 | 1,152 | 18.2 |
| Credit Loss | (122,389) | (100,204) | (150,344) | (145,523) | (145,523) | (88) | (1.4) |
| Gross Potential Rent | $8,470,534 | $8,746,971 | $8,966,656 | $9,359,969 | $9,574,513 | $5,806 | 91.9% |
| Other Income | 654,543 | 637,339 | 816,904 | 845,812 | 839,534 | 509 | 8.1 |
| Net Rental Income | $9,125,077 | $9,384,310 | $9,783,560 | $10,205,781 | $10,414,047 | $6,315 | 100.0% |
| (Vacancy/Concessions) | (2,986,765) | (2,958,280) | (2,308,348) | (2,078,321) | (2,105,362)(3) | (1,277) | (20.2) |
| Effective Gross Income | $6,138,312 | $6,426,030 | $7,475,212 | $8,127,460 | $8,308,685 | $5,039 | 79.8% |
| Total Expenses | $2,835,029 | $2,941,367 | $3,010,394 | $3,378,272 | $3,371,488 | $2,045 | 40.6% |
| Net Operating Income | $3,303,283 | $3,484,663 | $4,464,818 | $4,749,188 | $4,937,197 | $2,994 | 59.4% |
| Total TI/LC, Capex/RR | 0 | 0 | 0 | 0 | 82,450 | 50 | 1.0 |
| Net Cash Flow | $3,303,283 | $3,484,663 | $4,464,818 | $4,749,188 | $4,854,747 | $2,944 | 58.4% |
| (1) | The borrower sponsor added 176, 121, and 100 new park-owned homes at the Wolverine Portfolio Properties in 2016, 2017, and 2018, respectively. The increase in Net Operating Income year over year is attributed to the lease up of the additional units. |
| (2) | TTM reflects the trailing 12-month period ending February 2019. |
| (3) | Underwritten economic vacancy is 22.0%. As of March 4, 2019, the Wolverine Portfolio Properties were 79.9% leased. The appraisal concluded a blended vacancy rate of 19.7% for the Wolverine Portfolio Properties. |
| (4) | Percentage column represents percent of Net Rental Income for all revenue lines and represents percent of Effective Gross Income for the remainder of fields. |
Future Mezzanine Debt.Future mezzanine debt is permitted provided, among other conditions, (i) the lender receives not less than 30 days’ prior written notice, (ii) no event of default is continuing, (iii) an aggregate loan-to-value ratio as determined under the Wolverine Portfolio Whole Loan documents is not greater than 69.8%, (iv) the aggregate debt service coverage ratio as determined under the Wolverine Portfolio Whole Loan documents is not less than 1.29x on a trailing 12-month basis, (v) the aggregate debt yield is not less than 8.2%, (vi) delivery to the lender of all documents pertaining to the mezzanine loan and an executed intercreditor agreement satisfactory to the lender in its reasonable discretion, (vii) rating agency confirmation and (viii) the mezzanine loan is coterminous with the Wolverine Portfolio Whole Loan.
THE INFORMATION IN THIS STRUCTURAL AND COLLATERAL TERM SHEET IS NOT COMPLETE AND MAY BE AMENDED PRIOR TO THE TIME OF SALE. THIS TERM SHEET IS NOT AN OFFER TO SELL THESE SECURITIES AND IT IS NOT A SOLICITATION OF AN OFFER TO BUY THESE SECURITIES IN ANY JURISDICTION WHERE THE OFFER OR SALE IS NOT PERMITTED.
144
[THIS PAGE INTENTIONALLY LEFT BLANK]
145
| Structural and Collateral Term Sheet | BBCMS 2019-C3 | |
| No. 12 – DoubleTree Colorado Springs | ||
| Mortgage Loan Information | Property Information | |||
| Mortgage Loan Seller: | Barclays | Single Asset / Portfolio: | Single Asset | |
| Original Principal Balance: | $27,000,000 | Title: | Fee | |
| Cut-off Date Principal Balance: | $26,970,629 | Property Type–Subtype: | Hotel – Full Service | |
| % of IPB: | 2.9% | Net Rentable Area (Rooms): | 299 | |
| Loan Purpose: | Refinance | Location: | Colorado Springs, CO | |
| Borrower: | DHCS Associates LLC | Year Built / Renovated: | 1986 / 2016-2018 | |
| Borrower Sponsor: | Kenneth K. Kochenour | Occupancy / ADR / RevPAR: | 77.2% / $135.72 / $104.82 | |
| Interest Rate: | 4.90000% | Occupancy / ADR / RevPAR Date: | 3/31/2019 | |
| Note Date: | 4/18/2019 | 4th Most Recent NOI (As of)(2)(3): | $2,555,845 (12/31/2016) | |
| Maturity Date: | 5/6/2029 | 3rd Most Recent NOI (As of)(2): | $2,578,983 (12/31/2017) | |
| Interest-only Period: | None | 2nd Most Recent NOI (As of)(2): | $3,787,698 (12/31/2018) | |
| Original Term: | 120 months | Most Recent NOI (As of)(2): | $4,367,874 (TTM 3/31/2019) | |
| Original Amortization Term: | 360 months | UW Occupancy / ADR / RevPAR: | 75.0% / $135.72 / $101.79 | |
| Amortization Type: | Balloon | UW Revenues: | $15,050,794 | |
| Call Protection: | L(25),Def(91),O(4) | UW Expenses: | $10,745,142 | |
| Lockbox / Cash Management: | Hard / Springing | UW NOI: | $4,305,652 | |
| Additional Debt: | N/A | UW NCF: | $3,703,620 | |
| Additional Debt Balance: | N/A | Appraised Value / Per Room: | $42,500,000 / $142,140 | |
| Additional Debt Type: | N/A | Appraisal Date: | 3/28/2019 | |
| Escrows and Reserves(1) | Financial Information | |||||||||
| Initial | Monthly | Initial Cap | Cut-off Date Loan / Room: | $90,203 | ||||||
| Taxes: | $40,734 | $20,367 | N/A | Maturity Date Loan / Room: | $74,016 | |||||
| Insurance: | $0 | Springing | N/A | Cut-off Date LTV: | 63.5% | |||||
| FF&E Reserves: | $0 | 4% of Gross Revenues | N/A | Maturity Date LTV: | 52.1% | |||||
| Other: | $0 | $0 | N/A | UW NCF DSCR: | 2.15x | |||||
| UW NOI Debt Yield: | 16.0% | |||||||||
| Sources and Uses | ||||||||||
| Sources | Proceeds | % of Total | Uses | Proceeds | % of Total | |||||
| Mortgage Loan | $27,000,000 | 100.0% | Payoff Existing Debt | $19,794,745 | 73.3% | |||||
| Return of Equity | 6,720,410 | 24.9 | ||||||||
| Closing Costs | 444,111 | 1.6 | ||||||||
| Upfront Reserves | 40,734 | 0.2 | ||||||||
| Total Sources | $27,000,000 | 100.0% | Total Uses | $27,000,000 | 100.0% | |||||
| (1) | The requirement for the borrower to make monthly deposits to the insurance escrow is waived so long as no event of default has occurred and is continuing and the DoubleTree Colorado Springs Property (as defined below) is insured under a blanket insurance policy in accordance with the DoubleTree Colorado Springs Mortgage Loan documents (as defined below). Additionally, in the event that the lender determines no later than August 15 of any calendar year that the DoubleTree Colorado Springs Property has a debt service coverage ratio less than 1.15x for any calendar month in any of the previous 12 months, the borrower is required to provide evidence to the lender during the succeeding month of September that the borrower has sufficient funds to cover the shortfall capped at $350,000. If the borrower is not able to provide such evidence, all excess cash will be deposited into a seasonality reserve up to a cap of $350,000. |
| (2) | The borrower sponsor originally acquired the DoubleTree Colorado Springs Property in January 2016 and from 2016 to 2018, subsequently invested $9.3 million into the DoubleTree Colorado Springs Property for a comprehensive renovation. 2015 financials were obtained from prior to the borrower sponsor’s acquisition, and ADR and RevPAR from 2015 to TTM 3/31/2019 have increased by 42.8% and 59.6%, respectively. |
| (3) | The 4thMost Recent NOI represents a partial year from the borrower sponsor’s acquisition in January 2016. |
The Loan.TheDoubleTree Colorado Springsloanhas an outstanding principal balance as of the Cut-off Date of $26.97 million, a 10-year term with no interest only period and amortizes on a 30-year schedule (the “DoubleTree Colorado Springs Mortgage Loan”). The DoubleTree Colorado Springs Mortgage Loan is secured by a first mortgage lien on the borrower’s fee interest in a 299-room, full service hotel located in Colorado Springs, Colorado (the “DoubleTree Colorado Springs Property”).
THE INFORMATION IN THIS STRUCTURAL AND COLLATERAL TERM SHEET IS NOT COMPLETE AND MAY BE AMENDED PRIOR TO THE TIME OF SALE. THIS TERM SHEET IS NOT AN OFFER TO SELL THESE SECURITIES AND IT IS NOT A SOLICITATION OF AN OFFER TO BUY THESE SECURITIES IN ANY JURISDICTION WHERE THE OFFER OR SALE IS NOT PERMITTED.
146
| Structural and Collateral Term Sheet | BBCMS 2019-C3 | |
| No. 12 – DoubleTree Colorado Springs | ||
The Loan Sponsor.The borrowing entity for the DoubleTree Colorado Springs Mortgage Loan is DHCS Associates LLC, a Delaware limited liability company and special purpose entity with one independent director. Legal counsel to the borrower delivered a non-consolidation opinion in connection with the origination of the DoubleTree Colorado Springs Mortgage Loan. Kenneth K. Kochenour is the guarantor of certain nonrecourse carve-outs under the DoubleTree Colorado Springs Mortgage Loan documents. Additionally, Ira Lubert, who is not a guarantor under the DoubleTree Colorado Springs Mortgage Loan documents, co-founded GF Management, Inc. with Kenneth K. Kochenour and owns a 40.0% interest in the borrower.
The borrower sponsor is Kenneth K. Kochenour, the founder and Chief Executive Officer of GF Management, Inc. Kochenour has more than 25 years of experience owning and operating hotel and resort facilities, turnaround deals, property evaluations, market analyses and cost controls. GF Management, Inc. is a hospitality ownership and management company that specializes in hotels, resorts, golf courses and other related hospitality assets. Since its founding in 1988, GF Management, Inc. reports that it has operated more than 500 hotels in 45 states. They currently partner closely with Starwood, Hilton, Marriott, IHG, Wyndham, and Carlson and Choice. Kenneth K. Kochenour has had one prior short sale and one previous foreclosure on unrelated properties. See “Description of the Mortgage Pool – Loan Purpose; Default History, Bankruptcy Issues and Other Proceedings” in the Preliminary Prospectus.
The Property. The DoubleTree Colorado Springs Property is a 299-room full-service hotel located in Colorado Springs, Colorado. The DoubleTree Colorado Springs Property was built in 1986 and has most recently undergone renovations from 2016 to 2018. The hotel contains 131 king guestrooms, 152 queen/queen guestrooms, ten ADA-compliant rooms and six one-bedroom suites. Amenities at the DoubleTree Colorado Springs Property include a central open-air courtyard, fitness room, guest laundry room, indoor pool and whirlpool, market pantry and 27,683 square feet of meeting and banquet space. The DoubleTree Colorado Springs Property also contains a 106-seat full-service restaurant and a 59-seat bar and lounge area. The DoubleTree Colorado Springs Property contains 425 parking spaces, resulting in a parking ratio of 1.4 spaces per room. The borrower has a franchise agreement with Hilton Franchise Holding LLC effective as of January 20, 2016 for a term of 15 years, with an expiration date of January 31, 2031. Among other fees, the franchise agreement requires payment of a program fee equal to 4.0% of gross room revenue and a monthly royalty fee of 5.0% of gross room revenue.
According to the borrower sponsor, from 2016 to 2018, approximately $9.3 million has been invested in hotel renovations, $4.7 million of which was above and beyond the property improvement plan requirements. The renovations consisted of four phases. The first phase was completed from December 2016 to February 2017 and included meeting space updates and updated landscaping to the courtyard. The second phase ran from August 2017 to May 2018 and included a comprehensive renovation of the guestrooms. The third phase in September 2017 included a reconfiguration of the lobby, restaurant, bar and main level public areas. Lastly, the fourth phase, which was completed in 2018, included the addition of a private dining room.
The Market. The DoubleTree Colorado Springs Property is located in Colorado Springs, Colorado, the second largest city in the state by population and located approximately 70 miles south of Denver. The DoubleTree Colorado Springs Property is accessible regionally by Interstate 25, located adjacent to the DoubleTree Colorado Springs Property and providing access to Denver to the north and Pueblo to the south. The DoubleTree Colorado Springs Property is also approximately six miles from the Colorado Springs Airport. Attractions in Colorado Springs include Pikes Peak (located approximately 3.3 miles from the DoubleTree Colorado Springs Property), the most visited mountain in North America and second most visited in the world. The Pikes Peak Cog Railway offers access to the mountain’s 14,110 foot peak with panoramic views of the Continental Divide and Colorado Springs. Colorado Springs contains a high concentration of military institutions, including Fort Carson, the Peterson Air Force Base, the North American Aerospace Defense Command and the United States Air Force Academy. Additionally, the DoubleTree Colorado Springs Property is located approximately 0.8 miles away from the Broadmoor World Arena, an 8,000-seat arena for conventions and special events that also includes two large ice rinks. The DoubleTree Colorado Springs Property is also located approximately four miles from the U.S. Olympic Complex, the headquarters of the U.S. Olympic Committee, USA Swimming, USA Shooting, fifteen additional member organizations and two international sports federations. The complex offers a state-of-the-art sports medicine and sports science center, as well as facility tours that are offered to tourists daily.
According to the appraisal, Colorado Springs was awarded $120.5 million in Regional Tourism Act funding to boost the “City for Champions” project. The “City for Champions” project consists of five subprojects – a 60,000 square foot US Olympic Museum and Hall of Fame, a 104,000 square foot sports medicine and performance center at the University of Colorado
THE INFORMATION IN THIS STRUCTURAL AND COLLATERAL TERM SHEET IS NOT COMPLETE AND MAY BE AMENDED PRIOR TO THE TIME OF SALE. THIS TERM SHEET IS NOT AN OFFER TO SELL THESE SECURITIES AND IT IS NOT A SOLICITATION OF AN OFFER TO BUY THESE SECURITIES IN ANY JURISDICTION WHERE THE OFFER OR SALE IS NOT PERMITTED.
147
| Structural and Collateral Term Sheet | BBCMS 2019-C3 | |
| No. 12 – DoubleTree Colorado Springs | ||
campus, an Air Force Academy visitor center, a 10,000 seat outdoor stadium located downtown and a 3,000 seat indoor arena on the Colorado College Campus. This “City of Champions” project is expected to attract approximately 1.2 million visitors annually with an economic impact of an estimated $6.5 billion over the next 30 years.
The appraiser identified two hotels under construction that will compete with the DoubleTree Colorado Springs Property. A Home2 Suites by Hilton (located approximately 1.3 miles from the DoubleTree Colorado Springs Property) is expected to open in June 2019 and according to the appraisal, is not a direct competitor with the DoubleTree Colorado Springs Property given its extended stay product type and lack of facilities and amenities. Additionally, the Hilton Garden Inn Downtown is expected to open in October 2019 and is expected to directly compete with the DoubleTree Colorado Springs Property due to its similarities in terms of product, brand affiliation and service level; however, the Hilton Garden Inn Downtown is located 4.1 miles away from the DoubleTree Colorado Springs Property.
The DoubleTree Colorado Springs Property is located within the Colorado Springs lodging market. Market segmentation for the Colorado Springs lodging market is 40% commercial/government, 30% leisure, and 30% meeting and group, which is similar to the DoubleTree Colorado Springs Property (45% commercial/government, 30% leisure, and 25% meeting and group).
| Historical Occupancy, ADR, RevPAR | |||||||||
| Competitive Set(1) | DoubleTree Colorado Springs(2) | Penetration Factor(3) | |||||||
| Year | Occupancy | ADR | RevPAR | Occupancy | ADR | RevPAR | Occupancy | ADR | RevPAR |
| 2016(4) | 68.1% | $123.64 | $84.24 | 74.9% | $113.20 | $84.82 | 109.9% | 91.6% | 100.7% |
| 2017 | 70.4% | $130.46 | $91.87 | 69.1% | $122.08 | $84.35 | 98.1% | 93.6% | 91.8% |
| 2018 | 72.4% | $134.71 | $97.47 | 74.0% | $133.35 | $98.68 | 102.3% | 99.0% | 101.2% |
| 2/28/2019 TTM(5) | 75.3% | $133.69 | $100.73 | 77.2% | $135.72 | $104.82 | 102.5% | 101.5% | 104.1% |
| (1) | Data provided by a third party research report.The competitive set contains the following properties:Embassy Suites by Hilton Colorado Springs, The Antlers, Wyndham Hotel, Marriott Colorado Springs, Courtyard Colorado Springs South and Hampton Inn Colorado Springs I-25 South. |
| (2) | Based on information obtained from the borrower. |
| (3) | Penetration Factor is calculated based on data provided by a third party research report for the competitive set and information obtained from the borrower for the DoubleTree Colorado Springs Property. |
| (4) | For the DoubleTree Colorado Springs Property, 2016 data represents a partial year due to the borrower sponsor acquiring the DoubleTree Colorado Springs Property in January 2016. |
| (5) | For the DoubleTree Colorado Springs Property, 3/31/2019 TTM data is used. |
| Competitive Hotels Profile(1) | |||||||
| 2018 Estimated Market Mix | 2018 Estimated Operating Statistics | ||||||
| Property | Rooms | Commercial | Leisure | Meeting & Group | Occ. | ADR | RevPAR |
| DoubleTree Colorado Springs(2) | 299 | 45% | 30% | 25% | 77.2% | $135.72 | $104.82 |
| Wyndham The Antlers Hotel | 273 | 35% | 25% | 40% | 70-75% | $140-$150 | $100-$105 |
| Embassy Suites Colorado Springs | 205 | 40% | 30% | 30% | 70-75% | $125-$130 | $95-$100 |
| Marriott Colorado Springs | 309 | 35% | 30% | 35% | 60-65% | $130-$140 | $85-$90 |
| Total(3) | 787 | ||||||
| (1) | Based on the appraisal, except for the 2018 Estimated Operating Statistics for DoubleTree Colorado Springs, which are based on the operating statements provided by the borrower. |
| (2) | Occupancy, ADR and RevPAR for the DoubleTree Colorado Springs Property are based on TTM March 2019 figures. |
| (3) | Excludes the DoubleTree Colorado Springs Property. |
THE INFORMATION IN THIS STRUCTURAL AND COLLATERAL TERM SHEET IS NOT COMPLETE AND MAY BE AMENDED PRIOR TO THE TIME OF SALE. THIS TERM SHEET IS NOT AN OFFER TO SELL THESE SECURITIES AND IT IS NOT A SOLICITATION OF AN OFFER TO BUY THESE SECURITIES IN ANY JURISDICTION WHERE THE OFFER OR SALE IS NOT PERMITTED.
148
| Structural and Collateral Term Sheet | BBCMS 2019-C3 | |
| No. 12 – DoubleTree Colorado Springs | ||
| Operating History and Underwritten Net Cash Flow(1) | |||||||
| 2016(2) | 2017 | 2018 | TTM 3/31/2019 | Underwritten | Per Room(3) | % of Total Revenue(4) | |
| Occupancy | 74.9% | 69.1% | 74.0% | 77.2% | 75.0% | ||
| ADR | $113.20 | $122.08 | $133.35 | $135.72 | $135.72 | ||
| RevPAR | $84.82 | $84.35 | $98.68 | $104.82 | $101.79 | ||
| Room Revenue | $8,647,857 | $9,357,163 | $10,769,352 | $11,439,342 | $11,108,688 | $37,153 | 73.8% |
| Food & Beverage Revenue | 2,604,163 | 2,557,723 | 3,534,023 | 3,791,733 | 3,791,733 | 12,681 | 25.2 |
| Other Departmental Revenue(5) | 150,690 | 151,269 | 151,489 | 150,373 | 150,373 | 503 | 1.0 |
| Total Revenue | $11,402,710 | $12,066,155 | $14,454,864 | $15,381,448 | $15,050,794 | $50,337 | 100.0% |
| Room Expense | $2,067,789 | $2,174,973 | $2,431,703 | $2,502,632 | $2,430,293 | $8,128 | 21.9% |
| Food & Beverage Expense | 1,823,490 | 1,835,529 | 2,286,223 | 2,390,931 | 2,390,931 | 7,996 | 63.1 |
| Other Departmental Expenses | 148,868 | 138,426 | 137,023 | 136,271 | 136,271 | 456 | 90.6 |
| Departmental Expenses | $4,040,147 | $4,148,928 | $4,854,949 | $5,029,834 | $4,957,495 | $16,580 | 32.9% |
| Departmental Profit | $7,362,563 | $7,917,227 | $9,599,915 | $10,351,614 | $10,093,298 | $33,757 | 67.1% |
| Operating Expenses(6) | $4,450,851 | $4,946,558 | $5,349,459 | $5,502,680 | $5,375,895 | $17,980 | 35.7% |
| Gross Operating Profit | $2,911,712 | $2,970,669 | $4,250,456 | $4,848,934 | $4,717,404 | $15,777 | 31.3% |
| Property Taxes | $164,976 | $179,260 | $237,285 | $250,357 | $243,000 | $813 | 1.6% |
| Property Insurance | 134,254 | 156,606 | 173,802 | 180,610 | 118,659 | 397 | 0.8 |
| Leases & Rents | 56,637 | 55,820 | 51,671 | 50,093 | 50,093 | 168 | 0.3 |
| Total Other Expenses | $355,867 | $391,686 | $462,758 | $481,060 | $411,752 | $1,377 | 2.7% |
| Net Operating Income | $2,555,845 | $2,578,983 | $3,787,698 | $4,367,874 | $4,305,652 | $14,400 | 28.6% |
| FF&E | 0 | 0 | 0 | 0 | 602,032 | 2,013 | 4.0 |
| Net Cash Flow | $2,555,845 | $2,578,983 | $3,787,698 | $4,367,874 | $3,703,620 | $12,387 | 24.6% |
| (1) | Theborrower sponsor originally acquired the DoubleTree Colorado Springs Property in January 2016 and from 2016 to 2018, subsequently invested $9.3 million into the DoubleTree Colorado Springs Property for a comprehensive renovation. 2015 financials were obtained from prior to the borrower sponsor’s acquisition, and ADR and RevPAR from 2015 to TTM 3/31/2019 have increased by 42.8% and 59.6%, respectively. |
| (2) | 2016 represents a partial year because the sponsor acquired the DoubleTree Colorado Springs Property in January 2016. |
| (3) | Per Room values are based on 299 guest rooms. |
| (4) | % of Total Revenue for Room Expense, Food & Beverage Expense and Other Departmental Expenses are based on their corresponding revenue line item. |
| (5) | Other Departmental Revenue includes information and telecommunications revenue, vending commissions, gift shops sales, guest laundry, pet fees and other miscellaneous revenue. |
| (6) | Operating Expenses include a management fee of 3.0% of total revenue. |
THE INFORMATION IN THIS STRUCTURAL AND COLLATERAL TERM SHEET IS NOT COMPLETE AND MAY BE AMENDED PRIOR TO THE TIME OF SALE. THIS TERM SHEET IS NOT AN OFFER TO SELL THESE SECURITIES AND IT IS NOT A SOLICITATION OF AN OFFER TO BUY THESE SECURITIES IN ANY JURISDICTION WHERE THE OFFER OR SALE IS NOT PERMITTED.
149
| Structural and Collateral Term Sheet | BBCMS 2019-C3 | |
| No. 13 – Kings Mountain Center | ||
| Mortgage Loan Information | Property Information | |||
| Mortgage Loan Seller: | SGFC | Single Asset / Portfolio: | Single Asset | |
| Original Principal Balance(1): | $25,000,000 | Title: | Fee | |
| Cut-off Date Principal Balance(1): | $25,000,000 | Property Type - Subtype: | Office – Data Center | |
| % of IPB: | 2.7% | Net Rentable Area (SF): | 215,000 | |
| Loan Purpose: | Acquisition | Location: | Kings Mountain, NC | |
| Borrower: | CHADC2 Investment, LLC | Year Built / Renovated: | 2007 / 2011 | |
| Borrower Sponsor: | AGC Equity Partners Investments Ltd. | Occupancy: | 100.0% | |
| Occupancy Date: | 3/28/2019 | |||
| Interest Rate: | 4.65000% | 4th Most Recent NOI (As of)(3): | NAV | |
| Note Date: | 3/28/2019 | 3rd Most Recent NOI (As of)(3): | NAV | |
| Maturity Date: | 4/1/2029 | 2nd Most Recent NOI (As of)(3): | NAV | |
| Interest-only Period: | 60 months | Most Recent NOI (As of)(3): | NAV | |
| Original Term: | 120 months | UW Economic Occupancy: | 95.0% | |
| Original Amortization Term: | 360 months | UW Revenues: | $5,559,153 | |
| Amortization Type: | IO-Balloon | UW Expenses: | $713,240 | |
| Call Protection(2): | L(25),Grtr1%orYM(1), DeforGrtr1%orYM(89),O(5) | UW NOI: | $4,845,913 | |
| UW NCF: | $4,555,663 | |||
| Lockbox / Cash Management: | Hard / Springing | Appraised Value / Per SF: | $75,000,000 / $349 | |
| Additional Debt(1): | Yes | Appraisal Date: | 2/7/2019 | |
| Additional Debt Balance(1): | $17,000,000 | |||
| Additional Debt Type(1): | Pari Passu | |||
| Escrows and Reserves(4) | Financial Information(1) | ||||||||
| Initial | Monthly | Initial Cap | Cut-off Date Loan / SF: | $195 | |||||
| Taxes: | $0 | Springing | N/A | Maturity Date Loan / SF: | $179 | ||||
| Insurance: | $0 | Springing | N/A | Cut-off Date LTV: | 56.0% | ||||
| Replacement Reserves: | $0 | Springing | N/A | Maturity Date LTV: | 51.4% | ||||
| TI/LC: | $0 | Springing | N/A | UW NCF DSCR: | 1.75x | ||||
| Other: | $0 | $0 | N/A | UW NOI Debt Yield: | 11.5% | ||||
| Sources and Uses | |||||||||
| Sources | Proceeds | % of Total | Uses | Proceeds | % of Total | ||||
| Whole Loan(1) | $42,000,000 | 58.8% | Purchase Price | $70,000,000 | 98.0% | ||||
| Sponsor Equity | 29,436,249 | 41.2 | Closing Costs | 1,436,249 | 2.0 | ||||
| Total Sources | $71,436,249 | 100.0% | Total Uses | $71,436,249 | 100.0% | ||||
| (1) | The Kings Mountain Center mortgage loan is part of a whole loan evidenced by fourpari passunotes with an aggregate original balance of $42.0 million. The financial information presented in the chart above reflects the Cut-off Date balance of the Kings Mountain Center Whole Loan (as defined below). |
| (2) | At any time after the earlier to occur of (i) May 1, 2022 and (ii) two years from the closing date of the securitization that includes the last note to be securitized, the borrower has the right to either (a) defease the Kings Mountain Center Whole Loan or (b) prepay the Kings Mountain Center Whole Loan, provided that the borrower pays the greater of a yield maintenance premium or a prepayment premium equal to 1.0% of the principal balance being prepaid. |
| (3) | Historical financial information is not available as the Kings Mountain Center Property (as defined below) was owner-occupied and operated by the co-tenants, Ensono, Inc. and Ensono, LP (collectively, “Ensono”), prior to the execution of a new 15-year lease as part of a sale-leaseback. |
| (4) | As long as certain conditions relating to the Ensono lease remain satisfied, the borrower will not be required to make monthly deposits for taxes, insurance premiums, replacement reserves or TI/LC reserves. |
The Loan.The Kings Mountain Center mortgage loan is part of a whole loan (the “Kings Mountain Center Whole Loan”) evidenced by fourpari passusenior promissory notes with an aggregate original principal balance of $42.0 million. The Kings Mountain Center Whole Loan is secured by the borrower’s fee interest in a 215,000 square foot LEED Gold-certified data center facility located in Kings Mountain, North Carolina (the “Kings Mountain Center Property”). Notes A-1, A-3 and A-4 have an aggregate original principal balance of $25,000,000 and will be included in the BBCMS 2019-C3 Trust.The below table summarizes the remainingpari passu promissory note, which is currently held by Societe Generale Financial Corporation (“SGFC”) and is expected to be contributed to one or more future securitization transactions or may otherwise be transferred at any time. The Kings Mountain Center Whole Loan will be serviced pursuant to the pooling and servicing agreement for the BBCMS 2019-C3 Trust.See “Description of the Mortgage Pool—The Whole Loans—The Serviced Whole
THE INFORMATION IN THIS STRUCTURAL AND COLLATERAL TERM SHEET IS NOT COMPLETE AND MAY BE AMENDED PRIOR TO THE TIME OF SALE. THIS TERM SHEET IS NOT AN OFFER TO SELL THESE SECURITIES AND IT IS NOT A SOLICITATION OF AN OFFER TO BUY THESE SECURITIES IN ANY JURISDICTION WHERE THE OFFER OR SALE IS NOT PERMITTED.
150
| Structural and Collateral Term Sheet | BBCMS 2019-C3 | |
| No. 13 – Kings Mountain Center | ||
Loans” and “Pooling and Servicing Agreement” in the Preliminary Prospectus. The Kings Mountain Center Whole Loan has a 10-year term and, following a five-year interest only period, amortizes on a 30-year schedule.
| Whole Loan Summary | |||
| Note | Original Balance | Note Holder | Controlling Piece |
| A-1 | $15,000,000 | BBCMS 2019-C3 | Yes |
| A-2 | 17,000,000 | SGFC | No |
| A-3 | 5,000,000 | BBCMS 2019-C3 | No |
| A-4 | 5,000,000 | BBCMS 2019-C3 | No |
| Total | $42,000,000 | ||
The Property. The Kings Mountain Center Property is a 215,000 square foot LEED Gold-certified data center located at 140 Riverside Court in Kings Mountain, North Carolina. Ensono purchased the data center as part of its acquisition of Wirpo’s Hosted Data Center Services Business in June 2018 for $405.0 million. Prior to the acquisition, according to the borrower sponsor, since 2012 Wirpo’s Hosted Data Center Services Business invested approximately $50.0 million into the Kings Mountain Center Property. The Kings Mountain Center Property is 100.0% leased to Ensono as part of a sale-leaseback between the borrower sponsor and Ensono under a 15-year triple net lease executed at the origination of the Kings Mountain Center Whole Loan.According to the borrower sponsor, approximately 10.0% of the firm’s global revenue is derived from the Kings Mountain Center Property. Ensono is in the process of consolidating its data center footprint across the United States to three locations with the Kings Mountain Center Property being the newest vintage and offering the most space for expansion.Situated on a 30.06-acre site, the improvements were originally constructed in 2007 and renovated in 2011. The Kings Mountain Center Property is currently improved with 25,000 square feet of raised data center space, 8,000 square feet of office space (3.7% of NRA) and 102,000 square feet of electrical / cooling / fire suppression / security and infrastructure systems. The remaining space is currently considered “shell space” with the potential for an additional approximately 80,000 square feet of additional raised floor data center space to be developed. The Kings Mountain Center Property contains three generators, each capable of providing 2.5 megawatts, in order to maintain constant operations. Fiber providers include AT&T, Time Warner, Charter, Palmetto and DukeNet.
The Kings Mountain Center Property is a Tier III infrastructure with N+1 redundancy and is situated within the T5 Kings Mountain data center campus. The campus hosts purpose-built data centers for Boeing, Disney and AT&T among others. The campus is a 300-acre business park intended for Class A manufacturing and technology developments with redundant electrical power delivery and fiber optic carriers. Established utility lines and fiber connectivity are necessary for data center use, and the Kings Mountain Center Property benefits from access to utilities and fiber.
Major Tenant.
Ensono (215,000 square feet, 100.0% of NRA, 100.0% of Base Rent): Ensono is an IT service management company founded in 1947. Ensono provides IT services in Europe and the U.S. including hybrid cloud services, managed infrastructure, mainframe and midrange services, application services, and consulting and advisory services. Ensono is backed by two private equity firms: Charlesbank Capital Partners and M/C Partners. In June 2018, Ensono acquired Wirpo’s Hosted Data Center Services Business for $405.0 million, doubling Ensono’s size and scale. Ensono currently has revenue in excess of $550.0 million, data center footprints in the U.S., United Kingdom and Germany, nearly 2,000 associates and clients in excess of 200. In April 2018, Moody’s Investors Service assigned a first-time B3 corporate family rating to Ensono. Ensono leases the Kings Mountain Center Property through March 31, 2034 with a current base rent of $24.00 per square feet under a triple net lease. Ensono has four, five-year renewal options and no termination options.
The Market.The Kings Mountain Center Property is located in Kings Mountain, North Carolina, approximately 35.0 miles west of Charlotte within the Charlotte-Concord Metropolitan Statistical Area (the “Charlotte MSA”). The Charlotte MSA’s major industries include finance, healthcare, manufacturing, energy and food. According to the appraisal, the city is the second largest banking center in the United States. Charlotte is home to Bank of America’s headquarters and Wells Fargo’s east coast headquarters. Five Fortune 500 companies are based in Charlotte, which include, Bank of America, Nucor, Sonic Automotive, Duke Energy and Sealed Air. Primary regional access to the Kings Mountain Center Property is provided by U.S. Route 74 and Interstate 85.
THE INFORMATION IN THIS STRUCTURAL AND COLLATERAL TERM SHEET IS NOT COMPLETE AND MAY BE AMENDED PRIOR TO THE TIME OF SALE. THIS TERM SHEET IS NOT AN OFFER TO SELL THESE SECURITIES AND IT IS NOT A SOLICITATION OF AN OFFER TO BUY THESE SECURITIES IN ANY JURISDICTION WHERE THE OFFER OR SALE IS NOT PERMITTED.
151
| Structural and Collateral Term Sheet | BBCMS 2019-C3 | |
| No. 13 – Kings Mountain Center | ||
The North Carolina data center market is primarily concentrated in Charlotte and Raleigh-Durham. According to a third party market research report, there are 25 operators supplying the market with 52 multi-tenant data centers, a combined 678,000 square feet of operational space and 100 megawatts. Charlotte accounts for approximately 50% of North Carolina’s multitenant data center footprint, followed by Raleigh-Durham with approximately 30%, and Winston-Salem with approximately 10%. In the state of North Carolina, Digital Realty is the largest wholesale provider with a 30% market share, followed by T5 Data Centers with a 25% market share.
In 2015, North Carolina made tax breaks much more accessible to smaller data center users by passing legislation to lower the minimum qualifying investment from $150 to $75 million. At the time of the new incentive package being implemented, 23 states offered data center-specific tax breaks, worth an estimated $1.5 billion from 2005 to 2015. In addition, North Carolina offers tax incentives for multi-tenant and large enterprise data centers for software and internet companies. Incentives for multi-tenant facilities provide tax exemptions to both owners and tenants with investments of $75 million or more over a five-year period on the buildings, electricity, equipment and software.
According to the appraisal, as of year-end 2017, the population within a one-, three- and five-mile radius was636, 12,504 and 26,956, respectively. Additionally, for the same period, theaverage household income within a one-, three- and five-mile radius was$55,611, $46,286 and $42,394, respectively.
| Top Tenant Summary(1) | |||||||
| Tenant | Ratings(2) Moody’s/S&P/Fitch | Net Rentable Area (SF) | % of Total NRA | Base Rent PSF | Base Rent | % of Total Base Rent | Lease Expiration Date |
| Ensono | B3 / NA / NA | 215,000 | 100.0% | $24.00 | $5,160,000 | 100.0% | 3/31/2034 |
| Top Tenant | 215,000 | 100.0% | $24.00 | $5,160,000 | 100.0% | ||
| Vacant Space | 0 | 0.0% | |||||
| Collateral Total | 215,000 | 100.0% | |||||
| (1) | Based on the underwritten rent roll. |
| (2) | Ratings provided are for the parent company of the entity listed in the “Tenant” field whether or not the parent company guarantees the lease. |
| Lease Rollover Schedule(1) | |||||||||
| Year | Number of Leases Expiring | Net Rentable Area Expiring | % of NRA Expiring | Base Rent Expiring | % of Base Rent Expiring | Cumulative Net Rentable Area Expiring | Cumulative % of NRA Expiring | Cumulative Base Rent Expiring | Cumulative % of Base Rent Expiring |
| Vacant | NAP | 0 | 0.0% | NAP | NAP | 0 | 0.0% | NAP | NAP |
| 2019 & MTM | 0 | 0 | 0.0 | $0 | 0.0% | 0 | 0.0% | $0 | 0.0% |
| 2020 | 0 | 0 | 0.0 | 0 | 0.0 | 0 | 0.0% | $0 | 0.0% |
| 2021 | 0 | 0 | 0.0 | 0 | 0.0 | 0 | 0.0% | $0 | 0.0% |
| 2022 | 0 | 0 | 0.0 | 0 | 0.0 | 0 | 0.0% | $0 | 0.0% |
| 2023 | 0 | 0 | 0.0 | 0 | 0.0 | 0 | 0.0% | $0 | 0.0% |
| 2024 | 0 | 0 | 0.0 | 0 | 0.0 | 0 | 0.0% | $0 | 0.0% |
| 2025 | 0 | 0 | 0.0 | 0 | 0.0 | 0 | 0.0% | $0 | 0.0% |
| 2026 | 0 | 0 | 0.0 | 0 | 0.0 | 0 | 0.0% | $0 | 0.0% |
| 2027 | 0 | 0 | 0.0 | 0 | 0.0 | 0 | 0.0% | $0 | 0.0% |
| 2028 | 0 | 0 | 0.0 | 0 | 0.0 | 0 | 0.0% | $0 | 0.0% |
| 2029 | 0 | 0 | 0.0 | 0 | 0.0 | 0 | 0.0% | $0 | 0.0% |
| 2030 & Beyond | 1 | 215,000 | 100.0 | 5,160,000 | 100.0 | 215,000 | 100.0% | $5,160,000 | 100.0% |
| Total | 1 | 215,000 | 100.0% | $5,160,000 | 100.0% | ||||
| (1) | Based on the underwritten rent roll. |
THE INFORMATION IN THIS STRUCTURAL AND COLLATERAL TERM SHEET IS NOT COMPLETE AND MAY BE AMENDED PRIOR TO THE TIME OF SALE. THIS TERM SHEET IS NOT AN OFFER TO SELL THESE SECURITIES AND IT IS NOT A SOLICITATION OF AN OFFER TO BUY THESE SECURITIES IN ANY JURISDICTION WHERE THE OFFER OR SALE IS NOT PERMITTED.
152
| Structural and Collateral Term Sheet | BBCMS 2019-C3 | |
| No. 13 – Kings Mountain Center | ||
| Underwritten Net Cash Flow(1) | |||
| Underwritten | Per Square Foot | %(2) | |
| Rents in Place(3) | $5,160,000 | $24.00 | 88.2% |
| Rent Steps | 0 | 0.00 | 0.0 |
| Total Reimbursements | 691,740 | 3.22 | 11.8 |
| Gross Potential Rent | $5,851,740 | $27.22 | 100.0% |
| Other Income | 0 | 0.00 | 0.0 |
| (Vacancy/Credit Loss)(4) | (292,587) | (1.36) | (5.0) |
| Effective Gross Income | $5,559,153 | $25.86 | 95.0% |
| Total Variable Expenses | 429,229 | 2.00 | 7.7 |
| Total Fixed Expenses | 284,011 | 1.32 | 5.1 |
| Net Operating Income | $4,845,913 | $22.54 | 87.2% |
| Capital Expenditures | 21,500 | 0.10 | 0.4 |
| TI/LC | 268,750 | 1.25 | 4.8 |
| Net Cash Flow | $4,555,663 | $21.19 | 81.9% |
| (1) | Historical financial information is not available as the Kings Mountain Center Property was owner-occupied and operated by the tenant, Ensono, prior to the execution of a new 15-year lease as part of a sale-leaseback. |
| (2) | Percentage column represents percent of Gross Potential Rent for all revenue lines and represents percent of Effective Gross Income for the remainder of fields. |
| (3) | Based on the underwritten rent roll. |
| (4) | Underwritten Vacancy represents the economic vacancy of 5.0%. |
THE INFORMATION IN THIS STRUCTURAL AND COLLATERAL TERM SHEET IS NOT COMPLETE AND MAY BE AMENDED PRIOR TO THE TIME OF SALE. THIS TERM SHEET IS NOT AN OFFER TO SELL THESE SECURITIES AND IT IS NOT A SOLICITATION OF AN OFFER TO BUY THESE SECURITIES IN ANY JURISDICTION WHERE THE OFFER OR SALE IS NOT PERMITTED.
153
| Structural and Collateral Term Sheet | BBCMS 2019-C3 | |
| No. 14 – The Falls In Hudson | ||
| Mortgage Loan Information | Property Information | |||
| Mortgage Loan Seller: | RMF | Single Asset / Portfolio: | Single Asset | |
| Original Principal Balance: | $24,000,000 | Title: | Fee | |
| Cut-off Date Principal Balance: | $24,000,000 | Property Type - Subtype: | Multifamily – Garden/Low Rise | |
| % of Pool by IPB: | 2.6% | Net Rentable Area (Units): | 116 | |
| Loan Purpose: | Refinance | Location: | Hudson, NY | |
| Borrowers: | The Falls In Hudson, Inc. | Year Built / Renovated: | 2016-2019 /N/A | |
| Borrower Sponsor: | Mark M. Salomon | Occupancy: | 99.1% | |
| Interest Rate: | 5.35000% | Occupancy Date: | 4/1/2019 | |
| Note Date: | 4/9/2019 | 4thMost Recent NOI (As of)(1): | NAP | |
| Maturity Date: | 4/6/2029 | 3rdMost Recent NOI (As of): | $569,982 (12/31/2017) | |
| Interest-only Period: | 120 months | 2ndMost Recent NOI (As of): | $712,950 (12/31/2018) | |
| Original Term: | 120 months | Most Recent NOI (As of)(2): | $925,001 (TTM 2/28/2019) | |
| Original Amortization: | None | UW Economic Occupancy: | 95.0% | |
| Amortization Type: | Interest Only | UW Revenues(3): | $2,939,944 | |
| Call Protection: | L(26),Def(90),O(4) | UW Expenses: | $919,141 | |
| Lockbox / Cash Management: | Springing | UW NOI(2): | $2,020,803 | |
| Additional Debt: | N/A | UW NCF: | $1,997,603 | |
| Additional Debt Balance: | N/A | Appraised Value / Per Unit: | $36,300,000 / $312,931 | |
| Additional Debt Type: | N/A | Appraisal Date: | 3/12/2019 | |
| Escrows and Reserves | Financial Information | ||||||
| Initial | Monthly | Initial Cap | Cut-off Date Loan / Unit: | $206,897 | |||
| Taxes: | $217,875 | $34,583 | N/A | Maturity Date Loan / Unit: | $206,897 | ||
| Insurance: | $54,000 | $6,429 | N/A | Cut-off Date LTV: | 66.1% | ||
| Replacement Reserves: | $0 | $1,933 | N/A | Maturity Date LTV: | 66.1% | ||
| TI/LC: | $0 | $0 | N/A | UW NCF DSCR: | 1.53x | ||
| Other: | $0 | $0 | N/A | UW NOI Debt Yield: | 8.4% | ||
| Sources and Uses | ||||||
| Sources | Proceeds | % of Total | Uses | Proceeds | % of Total | |
| Mortgage Loan | $24,000,000 | 100.0% | Payoff Existing Debt | $22,702,345 | 94.6% | |
| Return of Equity | 618,614 | 2.6 | ||||
| Closing Costs | 407,166 | 1.7 | ||||
| Upfront Reserves | 271,875 | 1.1 | ||||
| Total Sources | $24,000,000 | 100.0% | Total Uses | $24,000,000 | 100.0% | |
| (1) | The Falls In Hudson Property (defined below) was built in phases from 2016 to 2019; as such, historical information is limited. |
| (2) | UW NOI is higher than the Most Recent NOI due to lease-up of The Falls In Hudson Property. |
| (3) | UW Revenues include income producing commercial space leased to affiliates of the borrower for use as a banquet hall and office space. |
THE INFORMATION IN THIS STRUCTURAL AND COLLATERAL TERM SHEET IS NOT COMPLETE AND MAY BE AMENDED PRIOR TO THE TIME OF SALE. THIS TERM SHEET IS NOT AN OFFER TO SELL THESE SECURITIES AND IT IS NOT A SOLICITATION OF AN OFFER TO BUY THESE SECURITIES IN ANY JURISDICTION WHERE THE OFFER OR SALE IS NOT PERMITTED.
154
| Structural and Collateral Term Sheet | BBCMS 2019-C3 | |
| No. 14 – The Falls In Hudson | ||
The Loan.The Falls In Hudson mortgage loan has an outstanding principal balance as of the Cut-off Date of $24.0 million (“The Falls In Hudson Mortgage Loan”) and is secured by a first mortgage lien on the borrower’s fee interest in a multifamily garden apartment property totaling 116 units located in Hudson, New York (“The Falls In Hudson Property”). The Falls In Hudson Mortgage Loan has a 10-year term and is interest-only for the full term of the loan. The borrowing entity for The Falls In Hudson Mortgage Loan is The Falls In Hudson, Inc., a New York corporation and special purpose entity. The Falls In Hudson, Inc. is wholly owned by 158 Union In Hudson, Inc., a New York corporation, which is wholly owned by Mark M. Salomon. The borrower sponsor and nonrecourse carve-out guarantor is Mark M. Salomon, a local real estate developer and owner. Mr. Salomon is the CEO of JMS Construction Services, Inc., which company, under the umbrella of 21st Century Development, has built homes and managed apartments for over thirty years. In addition to multifamily assets, Mr. Salomon owns 15 retail properties across Pennsylvania, Ohio, Georgia, North Carolina, South Carolina, and Florida.
The Property.The Falls In Hudson Property is a 116-unit, garden style multifamily property located in Hudson, New York, approximately 1.8 miles east of Downtown Hudson and approximately 2.2 miles east of the Hudson River. Developed in phases from 2016 through 2019, The Falls In Hudson Property consists of one, four-story residential building situated on approximately 20.38 acres. The unit mix consists of 16 one-bedroom/one-bathroom units (13.8% of units), 80 two-bedroom/two-bathroom units (69.0% of units), and 20 three-bedroom/two-bathroom units (17.2% of units). The Falls In Hudson Property’s amenities include an outdoor swimming pool, a spa with an indoor heated pool, sauna, steam, and salt room, a fully-equipped fitness center, spin/yoga room, youth activity room/lounge, an adult game room/card room, common area/lounge, 30-person movie theater/presentation room, waterfall feature, playground, outdoor multi-purpose sports court, wooded walking paths, and a dog run. Unit amenities include gas fireplace, Wi-Fi 2G & 5G for each unit, dedicated off-street parking, 9′ x 9′ storage in full basement setting, trash and recycling services on each floor, elevator access to each floor, smoke-free community, pre-wired for high speed internet/TV technology, 9’ ceilings, walk-in closets, fully-equipped kitchens, stackable washer/dryer, bamboo floors, balcony (on every unit), Rinnai instant hot water heater, app based phone/wall thermostat control for central air conditioning and heat (gas), high end cabinetry, quartz countertops and tile backsplash, and keyless door apartment entry. As of April 1, 2019, The Falls In Hudson Property was 99.1% occupied. The Falls In Hudson Property has 130 surface spaces resulting in a parking ratio of approximately 1.1 spaces per unit.
The Falls In Hudson Property includes income producing commercial space including a 7,200 square foot banquet hall (“The Falls Venue”) and 3,500 square feet of office space (“The Falls Office Space”). The Falls Venue is an event space equipped with a stage and a commercial kitchen to facilitate catering, with a seating capacity of 200 people. The Falls Venue is leased to P&M Events Consultants, LLC (“P&M”), an entity affiliated with the borrower, pursuant to a 12-year lease that expires in March 2031 and provides for annual gross rent of $180,000 (or $25.00 per square foot). A portion of The Falls Office Space (1,500 square feet on the 2nd floor of the banquet hall building) is leased to 21st Century Development (“21st Century”), an affiliate of the borrower, pursuant to a 12-year lease that expires March 2031 and provides for annual gross rent of $21,600 (or $14.40 per square foot). Additionally, 2,000 square feet on the 2nd floor of the banquet hall building is leased to ProVest Management (“ProVest”), an affiliate of the borrower, pursuant to a 12-year lease that expires March 2031 and provides for annual gross rent of $24,000 (or $12.00 per square foot). Each of the leases with P&M, 21st Century and ProVest are guaranteed by the borrower sponsor.
The Market.The Falls In Hudson Property is located in Hudson, New York. Hudson is located approximately 38 miles south of the Albany Central Business District and approximately 122 miles north of New York City. The City of Hudson is located along the west boarder of Columbia County, which is part of the upper Hudson Valley Region. Hudson is a regional hub for Columbia County. The city’s economy is based on the healthcare/social assistance, manufacturing, retail trade and professional/scientific/technical services industries. As the county seat, Hudson is influenced by the public administration industry, with numerous government offices in the city.
The Falls In Hudson Property’s neighborhood consists of a mix of office, industrial, retail, and residential uses. Commercial and residential developments are mainly situated along Union Turnpike. The Falls In Hudson Property is immediately adjacent to Columbia Children Center and undeveloped land to the west, Saturn Industries across Union Turnpike to the south, various commercial uses to the east along Union Turnpike, and undeveloped land immediately north. Additional retail uses located along Fairview Avenue consist of grocery stores, restaurants, and shops. Approximately 0.7 miles north of The Falls In Hudson Property is a shopping center, which includes regional retailers such as CVS Pharmacy, Joann Fabrics, and Planet Fitness. Further north are additional national retailers, which include Shop Rite, Big Lots, Advance Auto Parts, Aldi, and Rent-A-Center. According to third party market research report, the estimated 2019 population in a one-, three-,
THE INFORMATION IN THIS STRUCTURAL AND COLLATERAL TERM SHEET IS NOT COMPLETE AND MAY BE AMENDED PRIOR TO THE TIME OF SALE. THIS TERM SHEET IS NOT AN OFFER TO SELL THESE SECURITIES AND IT IS NOT A SOLICITATION OF AN OFFER TO BUY THESE SECURITIES IN ANY JURISDICTION WHERE THE OFFER OR SALE IS NOT PERMITTED.
155
| Structural and Collateral Term Sheet | BBCMS 2019-C3 | |
| No. 14 – The Falls In Hudson | ||
and five-mile radius of The Falls In Hudson Property is 3,760, 13,061, and 19,327, respectively. The 2019 estimated average household income within a one-, three-, and five-mile radius of The Falls In Hudson Property is $69,060, $67,201, and $71,635, respectively.
According to the appraisal, The Falls In Hudson Property is located within the Albany apartment market. As of fourth quarter 2018, the Albany apartment market reported an overall vacancy rate of 4.5%, representing an improvement of 0.1% over fourth quarter 2017. Monthly asking rent within the local apartment market ranges from $1,049 for properties constructed between 1980 and 1989, to $1,683 per month for properties built post-2009. The market reported an average asking rent of $1,188 per unit. The appraisal identified six competitive multifamily properties totaling 969 units. The comparables range in size from 78 to 300 units. The comparable occupancy levels range from 91.0% to 100%, with a weighted average of approximately 96.2%. The competitive set exhibits monthly rents ranging from $1,200 to $3,063 per unit. The concluded market rents are $1,800 for one-bedroom units, $2,000 for two-bedroom units, and $2,600 for three-bedroom units.
The appraisal identified a competitive set of four office leases for properties located within 1.7 miles of The Falls In Hudson Property. The comparable leases total 4,500 square feet and range in size from 500 square feet to 2,500 square feet. The competitive set exhibits gross rents ranging from $12.00 per square foot to $23.88 per square foot with an average of $16.15 per square foot. The concluded market rents are $13.03 per square foot for the office spaces and $25.00 per square foot for the banquet hall.
| Multifamily Unit Mix(1) | |||||||
| Unit Type | # of Units | % of Total | Occupied Units | Occupancy(2) | Average Unit Size (SF)(2) | Average Monthly Rental Rate(2) | Average Monthly Rental Rate PSF(2) |
| 1 Bedroom, 1 Bath | 16 | 13.8% | 16 | 100.0% | 905 | $1,688 | $1.87 |
| 2 Bedroom, 2 Bath | 80 | 69.0% | 79 | 98.8% | 1,420 | $2,021 | $1.42 |
| 3 Bedroom, 2 Bath | 20 | 17.2% | 20 | 100.0% | 1,594 | $2,478 | $1.55 |
| Total/Wtd. Avg. | 116 | 100.0% | 115 | 99.1% | 1,379 | $2,054 | $1.51 |
| (1) | Based on the underwritten rent roll dated April 1, 2019. |
| (2) | Wtd. Avg. based on number of units of each unit type. |
THE INFORMATION IN THIS STRUCTURAL AND COLLATERAL TERM SHEET IS NOT COMPLETE AND MAY BE AMENDED PRIOR TO THE TIME OF SALE. THIS TERM SHEET IS NOT AN OFFER TO SELL THESE SECURITIES AND IT IS NOT A SOLICITATION OF AN OFFER TO BUY THESE SECURITIES IN ANY JURISDICTION WHERE THE OFFER OR SALE IS NOT PERMITTED.
156
| Structural and Collateral Term Sheet | BBCMS 2019-C3 | |
| No. 14 – The Falls In Hudson | ||
| Operating History and Underwritten Net Cash Flow | |||||||
| 2016(1) | 2017 | 2018 | TTM(2) | Underwritten | Per Unit | %(3) | |
| Rents in Place | N/A | $845,743 | $1,639,764 | $1,794,401 | $2,834,400 | $24,434 | 91.9% |
| Office & Banquet Income | N/A | 0 | 0 | 0 | 225,600 | 1,945 | 7.3 |
| Vacant Gross Up | N/A | 0 | 0 | 0 | 24,000 | 207 | 0.8 |
| Gross Potential Rent | N/A | $845,743 | $1,639,764 | $1,794,401 | $3,084,000 | $26,586 | 100.0% |
| Total Reimbursements | N/A | 0 | 0 | 0 | 0 | 0 | 0.0 |
| Net Rental Income | N/A | $845,743 | $1,639,764 | $1,794,401 | $3,084,000 | $26,586 | 100.0% |
| (Vacancy/Credit Loss) | N/A | 0 | 0 | 0 | (153,528) | (1,324) | (5.0) |
| Other Income(4) | N/A | 345 | 10,869 | 9,472 | 9,472 | 82 | 0.3 |
| Effective Gross Income | N/A | $846,088 | $1,650,633 | $1,803,873 | $2,939,944 | $25,344 | 95.3% |
| Total Expenses | N/A | $276,106 | $937,683 | $878,872 | $919,141 | $7,924 | 31.3% |
| Net Operating Income(5) | N/A | $569,982 | $712,950 | $925,001 | $2,020,803 | $17,421 | 68.7% |
| Replacement Reserves | N/A | 0 | 0 | 0 | 23,200 | 200 | 0.8 |
| Net Cash Flow | N/A | $569,982 | $712,950 | $925,001 | $1,997,603 | $17,221 | 67.9% |
| Occupancy(6) | N/A | 14.6% | 47.0% | 99.1% | 95.0% | ||
| (1) | The Falls In Hudson Property was built in phases from 2016 to 2019; as such, historical information is limited. |
| (2) | TTM column represents the trailing 12 months ending February 2019. |
| (3) | Percentage column represents percentage of Net Rental Income for all revenue lines and represents percentage of Effective Gross Income for the remaining fields. |
| (4) | Other Income is comprised of application fees and other miscellaneous income. |
| (5) | Net Operating Income has increased from 2017 to TTM February 1, 2019 due to The Falls In Hudson Property being in lease up. Underwritten Net Operating Income has increased compared to TTM Net Operating Income due to the fact that (i) commercial income from banquet and office space was underwritten; (ii) Rents in Place was underwritten based on the rent roll dated 4/1/2019 with occupancy of 99.1%; and (iii) some underwritten expenses such as repairs and maintenance and payroll were underwritten to appraisal values since repairs and maintenance expenses were higher when The Falls In Hudson Property were being completed, and management salary was included in payroll instead of management fee. |
| (6) | Historical occupancies are as of December 31 for each respective year. TTM occupancy is as of April 1, 2019. Underwritten Occupancy represents economic occupancy. |
THE INFORMATION IN THIS STRUCTURAL AND COLLATERAL TERM SHEET IS NOT COMPLETE AND MAY BE AMENDED PRIOR TO THE TIME OF SALE. THIS TERM SHEET IS NOT AN OFFER TO SELL THESE SECURITIES AND IT IS NOT A SOLICITATION OF AN OFFER TO BUY THESE SECURITIES IN ANY JURISDICTION WHERE THE OFFER OR SALE IS NOT PERMITTED.
157
| Structural and Collateral Term Sheet | BBCMS 2019-C3 | |
| No. 15 – Alton Self Storage | ||
| Mortgage Loan Information | Property Information | |||
| Mortgage Loan Seller: | KeyBank | Single Asset / Portfolio: | Single Asset | |
| Original Principal Balance: | $21,000,000 | Title: | Fee | |
| Cut-off Date Principal Balance: | $21,000,000 | Property Type–Subtype: | Self Storage – Self Storage | |
| % of IPB: | 2.2% | Net Rentable Area (Units): | 1,554 | |
| Loan Purpose: | Refinance | Location: | Irvine, CA | |
| Borrower: | Alton Self Storage, LP | Year Built / Renovated: | 1991 / 2016 | |
| Borrower Sponsors: | Mark Conzelman, M. Paul | Occupancy: | 96.1% | |
| Conzelman, John C. Thomson, | Occupancy Date: | 4/19/2019 | ||
| Thomson Family Trust dated | 4th Most Recent NOI (As of)(1): | NAV | ||
| June 18, 1997 | 3rd Most Recent NOI (As of)(1): | $1,382,172 (12/31/2017) | ||
| Interest Rate: | 4.35000% | 2nd Most Recent NOI (As of)(1): | $1,726,362 (12/31/2018) | |
| Note Date: | 4/30/2019 | Most Recent NOI (As of)(1): | $1,851,164 (TTM 3/31/2019) | |
| Maturity Date: | 5/1/2029 | UW Economic Occupancy: | 93.5% | |
| Interest-only Period: | 120 months | UW Revenues: | $2,715,443 | |
| Original Term: | 120 months | UW Expenses: | $862,013 | |
| Original Amortization Term: | None | UW NOI: | $1,853,430 | |
| Amortization Type: | Interest Only | UW NCF: | $1,837,911 | |
| Call Protection: | L(25),Def(92),O(3) | Appraised Value / Per Unit: | $37,000,000 / $23,810 | |
| Lockbox / Cash Management: | Springing | Appraisal Date: | 3/21/2019 | |
| Additional Debt: | N/A | |||
| Additional Debt Balance: | N/A | |||
| Additional Debt Type: | N/A | |||
| Escrows and Reserves | Financial Information | |||||||||
| Initial | Monthly | Initial Cap | Cut-off Date Loan / Unit: | $13,514 | ||||||
| Taxes: | $64,350 | $16,088 | N/A | Maturity Date Loan / Unit: | $13,514 | |||||
| Insurance: | $951 | $951 | N/A | Cut-off Date LTV: | 56.8% | |||||
| Replacement Reserves: | $1,293 | $1,293 | $46,559 | Maturity Date LTV: | 56.8% | |||||
| TI/LC: | $0 | $0 | N/A | UW NCF DSCR: | 1.98x | |||||
| Other: | $0 | $0 | N/A | UW NOI Debt Yield: | 8.8% | |||||
| Sources and Uses | ||||||||||
| Sources | Proceeds | % of Total | Uses | Proceeds | % of Total | |||||
| Mortgage Loan | $21,000,000 | 100.0% | Payoff Existing Debt | $13,735,221 | 65.4% | |||||
| Return of Equity | 6,950,316 | 33.1 | ||||||||
| Closing Costs | 247,869 | 1.2 | ||||||||
| Upfront Reserves | 66,594 | 0.3 | ||||||||
| Total Sources | $21,000,000 | 100.0% | Total Uses | $21,000,000 | 100.0% | |||||
| (1) | The Alton Self Storage Property (as defined below) was redeveloped into a self-storage facility in 2016 and as such, 4th Most Recent NOI is not available and increasing NOI through the most recent periods reflects increases in occupancy and increases in rent for occupied units over time. |
THE INFORMATION IN THIS STRUCTURAL AND COLLATERAL TERM SHEET IS NOT COMPLETE AND MAY BE AMENDED PRIOR TO THE TIME OF SALE. THIS TERM SHEET IS NOT AN OFFER TO SELL THESE SECURITIES AND IT IS NOT A SOLICITATION OF AN OFFER TO BUY THESE SECURITIES IN ANY JURISDICTION WHERE THE OFFER OR SALE IS NOT PERMITTED.
158
| Structural and Collateral Term Sheet | BBCMS 2019-C3 | |
| No. 15 – Alton Self Storage | ||
The Loan.The Alton Self Storage mortgage loan is secured by a first mortgage lien on the borrower’s fee interest in a 1,554-unit self-storage facility located in Irvine, California (the “Alton Self Storage Property”). The mortgage loan was originated by KeyBank and has an outstanding principal balance as of the Cut-off Date of $21.0 million (the “Alton Self Storage Mortgage Loan”). The Alton Self Storage Mortgage Loan has a 10-year term and is interest-only for the entirety of the loan term. The borrowing entity for the Alton Self Storage Mortgage Loan is Alton Self Storage, LP, a California limited partnership and special purpose entity. The nonrecourse carve-out guarantors and borrower sponsors are Mark Conzelman, M. Paul Conzelman, John C. Thomson and the Thomson Family Trust dated June 18, 1997. John Thomson founded Irvine-based Stadium Properties Self Storage Partners in 1995 and owns interests in 23 self-storage properties totaling over 2.0 million square feet. Mark and Paul Conzelman are principals of Ivine-based SC Development. In addition to other real estate holdings, Mark Conzelman owns eight self-storage properties totaling over 790,000 square feet, four of which are jointly owned with Paul Conzelman.
The Property.The Alton Self Storage Property is a Class A, three-story, 1,554-unit self-storage facility with a total of 155,196 rentable square feet and is currently 96.1% occupied as of April 19, 2019. The Alton Self Storage Property was originally constructed in 1991 as a single-story industrial warehouse and subsequently purchased by the borrower sponsors and redeveloped in 2016 into a self-storage facility for a reported cost of approximately $20.1 million. The facility opened in May 2016 and features 343 traditional storage units, 1,210 climate control units, one RV/Boat parking space, an on-site leasing office, three elevators, surveillance cameras, individual locks, and an electronic gated entry.
The Alton Self Storage Property is located on Alton Parkway approximately 400 feet from the intersection of Karman Avenue and Alton Parkway. Traffic counts on Alton Parkway and Karman Avenue are 15,000 and 21,000, respectively. The Alton Self Storage Property is located within in the Irvine Business Complex, an urban planning initiative adopted by the Irvine City Council in 2010 to manage the transition of the area from a commercial area to a residential mixed-use community. The latest development status report from the City of Irvine dated August 1, 2018 indicated 9,427 residential units have been completed with 3,633 under construction, 3,535 approved, and another 326 in the approval process. The Alton Self Storage Property is also located approximately 0.5 miles southwest of the Tustin Legacy, a master-planned community consisting of 1,606 acres of which 867 acres remain to be developed. Since development of the Tustin Legacy began, 3,270 residential units have been completed or approved for development and 3,543 planned residential units remain to be developed.
The following table presents detailed information with respect to the unit mix of the Alton Self Storage Property:
| Alton Self Storage Unit Mix(1) | |||||||
| Unit Type | Unit Size Range (SF) | # of Units | Occupied Units | Occupancy | Average Unit Size (SF)(2) | Average Monthly Rental Rate(2) | Average Monthly Rental Rate PSF(2) |
| Climate Controlled | 0-50 | 566 | 551 | 97.3% | 40 | $66 | $1.74 |
| 51-100 | 360 | 339 | 94.2% | 97 | $135 | $1.40 | |
| 101-150 | 185 | 178 | 96.2% | 134 | $177 | $1.31 | |
| 151-200 | 88 | 88 | 100.0% | 198 | $230 | $1.17 | |
| >200 | 11 | 11 | 100.0% | 255 | $277 | $1.09 | |
| Subtotal | 1,210 | 1,167 | 96.4% | 85 | $117 | $1.53 | |
| Traditional | 0-50 | 74 | 68 | 91.9% | 32 | $83 | $2.91 |
| 51-100 | 64 | 58 | 90.6% | 87 | $160 | $1.86 | |
| 101-150 | 61 | 57 | 93.4% | 138 | $206 | $1.49 | |
| 151-200 | 48 | 48 | 100.0% | 196 | $302 | $1.55 | |
| >200 | 96 | 95 | 99.0% | 278 | $403 | $1.45 | |
| Subtotal | 343 | 326 | 95.0% | 153 | $244 | $1.85 | |
| Other | Parking | 1 | 0 | 0.0% | 160 | $0 | $0.00 |
| Total/Wtd. Avg. | 1,554 | 1,493 | 96.1%
| 100
| $145
| $1.60
| |
| (1) | Based on the underwritten rent roll. |
| (2) | Wtd. Avg. based on occupied number of units of each unit type and category. |
THE INFORMATION IN THIS STRUCTURAL AND COLLATERAL TERM SHEET IS NOT COMPLETE AND MAY BE AMENDED PRIOR TO THE TIME OF SALE. THIS TERM SHEET IS NOT AN OFFER TO SELL THESE SECURITIES AND IT IS NOT A SOLICITATION OF AN OFFER TO BUY THESE SECURITIES IN ANY JURISDICTION WHERE THE OFFER OR SALE IS NOT PERMITTED.
159
| Structural and Collateral Term Sheet | BBCMS 2019-C3 | |
| No. 15 – Alton Self Storage | ||
The Market. According to a third-party demographics report, the estimated 2018 population within a one- and three-mile radius of the Alton Self Storage Property is 9,324 and 182,482, respectively. Estimated 2018 average household income within a one- and three-mile radius of the Alton Self Storage Property is $110,790 and $115,038, respectively. Average annual population growth from 2018-2023 within a one- and three-mile radius of the property is projected to be approximately 5.5% and 1.5%, respectively.
According to the appraisal, self-storage occupancy in a 1-mile, 2-mile, and 3-mile radius from the subject property is 94.8%, 95.1% and 92.9%, respectively, and concluded an approximately 4% vacancy for the Alton Self Storage Property.
The following table presents occupancy and rental data at comparable self-storage properties with respect to the Alton Self Storage Property:
| Comparable Self Storage Property Summary(1) | ||||||||||||
| Property Name/Address | Year Built | Units | Square Feet | Occ. % | Miles from Subject | Unit Type | 5x5 | 5x10 | 10x10 | 10x15 | 10x20 | 10x25 |
| Alton Self Storage 2215 Alton Parkway Irvine, CA(2) | 1991(3) | 1,554 | 155,196 | 96.1% | NAP | Inside Down | $75 | $112 | $175 | $214 | $306 | $361 |
| Inside Down CC | ||||||||||||
| Inside Up | ||||||||||||
| Inside Up CC | $53 | $74 | $137 | $196 | $229 | $290 | ||||||
Life Storage 17392 Murphy Ave Irvine, CA | 1998 | 700 | 65,867 | 96.0% | 0.72 | Inside Down | $95 | $251 | ||||
| Inside Down CC | ||||||||||||
| Inside Up | $75 | $63 | $145 | $209 | ||||||||
| Inside Up CC | $65 | $172 | $245 | |||||||||
Public Storage 16452 Construction Circle S, Irvine, CA | 2017 | 1,056 | 145,622 | 99.0% | 0.89 | Inside Down | ||||||
| Inside Down CC | $48 | $58 | $219 | |||||||||
| Inside Up | ||||||||||||
| Inside Up CC | $48 | $49 | $96 | $157 | $184 | |||||||
Public Storage 16700 Red Hill Ave Irvine, CA | 2016 | 3,000 | 255,978 | 97.0% | 0.83 | Inside Down | ||||||
| Inside Down CC | $50 | $60 | $139 | $180 | $225 | $354 | ||||||
| Inside Up | ||||||||||||
| Inside Up CC | $21 | $51 | $112 | $182 | ||||||||
Life Storage 3190 Pullman St Costa Mesa, CA | 2005 | 1,079 | 133,652 | 95.0% | 1.95 | Inside Down | $115 | $150 | $396 | |||
| Inside Down CC | ||||||||||||
| Inside Up | $90 | $135 | $253 | |||||||||
| Inside Up CC | ||||||||||||
A-1 Self Storage 2555 South Main St Santa Ana, CA | 2001 | 507 | 5,200 | 98.0% | 2.19 | Inside Down | $79 | $125 | $159 | |||
| Inside Down CC | ||||||||||||
| Inside Up | $64 | $96 | $139 | $225 | ||||||||
| Inside Up CC | ||||||||||||
| (1) | Source: Appraisal. |
| (2) | Based on the underwritten rent roll. Rent amounts presented are the weighted average in-place rents for each unit category. |
| (3) | The Alton Self Storage Property was originally constructed as a single-story industrial warehouse and subsequently redeveloped into a self-storage facility in 2016. |
THE INFORMATION IN THIS STRUCTURAL AND COLLATERAL TERM SHEET IS NOT COMPLETE AND MAY BE AMENDED PRIOR TO THE TIME OF SALE. THIS TERM SHEET IS NOT AN OFFER TO SELL THESE SECURITIES AND IT IS NOT A SOLICITATION OF AN OFFER TO BUY THESE SECURITIES IN ANY JURISDICTION WHERE THE OFFER OR SALE IS NOT PERMITTED.
160
| Structural and Collateral Term Sheet | BBCMS 2019-C3 | |
| No. 15 – Alton Self Storage | ||
| Operating History and Underwritten Net Cash Flow(1) | ||||||
| 2017 | 2018 | TTM | Underwritten | Per Unit | %(2) | |
| Rents in Place(3) | $2,012,226 | $2,332,040 | $2,383,406 | $2,692,035 | $1,732.33 | 100.0% |
| Vacant Income | 0 | 0 | 0 | 0 | 0.00 | 0.0 |
| Gross Potential Rent | $2,012,226 | $2,332,040 | $2,383,406 | $2,692,035 | $1,732.33 | 100.0% |
| (Vacancy/Credit Loss) | 0 | 0 | 0 | (174,982) | (112.60) | (6.5) |
| (Concessions) | 0 | 0 | 0 | 0 | 0 | 0.0 |
| Other Income(4) | 185,698 | 194,313 | 198,390 | 198,390 | 127.66 | 7.4 |
| Effective Gross Income | $2,197,924 | $2,526,353 | $2,581,796 | $2,715,443 | $1,747.39 | 100.9% |
| Total Expenses | $815,752 | $799,991 | $730,632 | $862,013 | $554.71 | 31.7% |
| Net Operating Income | $1,382,172 | $1,726,362 | $1,851,164 | $1,853,430 | $1,192.68 | 68.3% |
| Total TI/LC, Capex/RR | 0 | 0 | 0 | 15,520 | 9.99 | 0.6 |
| Net Cash Flow | $1,382,172 | $1,726,362 | $1,851,164 | $1,837,911 | $1,182.70 | 67.7% |
| (1) | The Alton Self Storage Property was redeveloped into a self-storage facility in 2016 and as such, historical financials prior to 2017 are not available. |
| (2) | Percentage column represents percent of Gross Potential Rent for all revenue lines and represents percent of Effective Gross Income for the remainder of fields. |
| (3) | Underwritten Rents in Place are based on the underwritten rent roll dated April 19, 2019. |
| (4) | Other Income is comprised of insurance protection plans, late charges, and miscellaneous charges. |
THE INFORMATION IN THIS STRUCTURAL AND COLLATERAL TERM SHEET IS NOT COMPLETE AND MAY BE AMENDED PRIOR TO THE TIME OF SALE. THIS TERM SHEET IS NOT AN OFFER TO SELL THESE SECURITIES AND IT IS NOT A SOLICITATION OF AN OFFER TO BUY THESE SECURITIES IN ANY JURISDICTION WHERE THE OFFER OR SALE IS NOT PERMITTED.
161
| Structural and Collateral Term Sheet | BBCMS 2019-C3 | |
| Contacts | ||
| Barclays CMBS Capital Markets & Banking | ||
| Contact | Phone Number | |
| Daniel Vinson | daniel.vinson@barclays.com | (212) 528-8224 |
| Managing Director | ||
| Daniel Schmidt | daniel.schmidt@barclays.com | (212) 528-7479 |
| Director | ||
| Philip Marx | philip.marx@barclays.com | (212) 526-5248 |
| Assistant Vice President | ||
| Barclays CMBS Trading | ||
| Contact | Phone Number | |
| David Kung | david.kung@barclays.com | (212) 528-7374 |
| Director | ||
| Peter Taylor | peter.w.taylor@barclays.com | (212) 526-1528 |
| Vice President | ||
| Barclays Securitized Products Syndicate | ||
| Contact | Phone Number | |
| Brian Wiele | brian.wiele@barclays.com | (212) 412-5780 |
| Managing Director | ||
| Sean Foley | sean.foley@barclays.com | (212) 412-5780 |
| Assistant Vice President | ||
| Societe Generale CMBS Capital Markets & Banking | ||
| Contact | Phone Number | |
| Adam Ansaldi | adam.ansaldi@sgcib.com | (212) 278-6126 |
| Managing Director | ||
| Jim Barnard | jim.barnard@sgcib.com | (212) 278-6263 |
| Director | ||
| Justin Cappuccino | Justin.cappuccino@sgcib.com | (212) 278-6393 |
| Vice President | ||
| Natixis CMBS Capital Markets and Banking | ||
| Contact | Phone Number | |
| Andrew Taylor | andrew.taylor@natixis.com | (212) 891-5702 |
| Managing Director | ||
| Sophia Ouyang | sophia.ouyang@natixis.com | (212) 891-5772 |
| Vice President | ||
| Donald MacMaster | donald.macmaster@natixis.com | (212) 891-5730 |
| Vice President | ||
| UBS CMBS Capital Markets & Banking | ||
| Contact | Phone Number | |
| David Schell | david.schell@ubs.com | (212) 713-3375 |
| Managing Director | ||
| Nicholas Galeone | nicholas.galeone@ubs.com | (212) 713-8832 |
| Executive Director | ||
| Siho Ham | siho.ham@ubs.com | (212) 713-1278 |
| Executive Director | ||
THE INFORMATION IN THIS STRUCTURAL AND COLLATERAL TERM SHEET IS NOT COMPLETE AND MAY BE AMENDED PRIOR TO THE TIME OF SALE. THIS TERM SHEET IS NOT AN OFFER TO SELL THESE SECURITIES AND IT IS NOT A SOLICITATION OF AN OFFER TO BUY THESE SECURITIES IN ANY JURISDICTION WHERE THE OFFER OR SALE IS NOT PERMITTED.
162