| FREE WRITING PROSPECTUS | ||
| FILED PURSUANT TO RULE 433 | ||
| REGISTRATION FILE NO.: 333-226850-10 | ||
| Dated September 9, 2021 | BBCMS 2021-C11 |
Free Writing Prospectus Structural and Collateral Term Sheet | ||
BBCMS Mortgage Trust 2021-C11 | ||
$988,043,799 (Approximate Mortgage Pool Balance) | ||
$865,773,000 (Approximate Offered Certificates) | ||
Barclays Commercial Mortgage Securities LLC Depositor
| ||
Commercial Mortgage Pass-Through Certificates, Series 2021-C11 | ||
Barclays Capital Real Estate Inc. Societe Generale Financial Corporation SSOF SCRE AIV, L.P. UBS AG LMF Commercial, LLC BSPRT CMBS Finance, LLC Natixis Real Estate Capital LLC Mortgage Loan Sellers
| ||
| Barclays | UBS Securities LLC Co-Lead Managers and Joint Bookrunners | Société Générale |
| Academy Securities Co-Manager | Mischler Financial Group, Inc. Co-Manager | Natixis Co-Manager |
THE INFORMATION IN THIS STRUCTURAL AND COLLATERAL TERM SHEET IS NOT COMPLETE AND MAY BE AMENDED PRIOR TO THE TIME OF SALE. THIS TERM SHEET IS NOT AN OFFER TO SELL THESE SECURITIES AND IT IS NOT A SOLICITATION OF AN OFFER TO BUY THESE SECURITIES IN ANY JURISDICTION WHERE THE OFFER OR SALE IS NOT PERMITTED.
| Dated September 9, 2021 | BBCMS 2021-C11 |
This material is for your information, and none of Barclays Capital Inc., SG Americas Securities, LLC, UBS Securities LLC, Natixis Securities Americas LLC, Academy Securities, Inc. or Mischler Financial Group, Inc. (the “Underwriters”) are soliciting any action based upon it. This material is not to be construed as an offer to sell or the solicitation of any offer to buy any security in any jurisdiction where such an offer or solicitation would be illegal.
The depositor has filed a registration statement (including the prospectus) with the Securities and Exchange Commission (File No. 333-226850) for the offering to which this communication relates. Before you invest, you should read the prospectus in the registration statement and other documents the depositor has filed with the Securities and Exchange Commission for more complete information about the depositor, the issuing entity and this offering. You may get these documents for free by visiting EDGAR on the SEC website at www.sec.gov. Alternatively, the depositor or Barclays Capital Inc., any other underwriter, or any dealer participating in this offering will arrange to send you the prospectus if you request it by calling 1-888-603-5847. The Offered Certificates referred to in these materials, and the asset pool backing them, are subject to modification or revision (including the possibility that one or more Classes of Certificates may be split, combined or eliminated at any time prior to issuance or availability of a final prospectus) and are offered on a “when, as and if issued” basis. You understand that, when you are considering the purchase of these Certificates, a contract of sale will come into being no sooner than the date on which the relevant Class has been priced and we have verified the allocation of Certificates to be made to you; any “indications of interest” expressed by you, and any “soft circles” generated by us, will not create binding contractual obligations for you or us.
Neither this document nor anything contained in this document shall form the basis for any contract or commitment whatsoever. The information contained in this document is preliminary as of the date of this document, supersedes any previous such information delivered to you and will be superseded by any such information subsequently delivered prior to the time of sale. These materials are subject to change, completion or amendment from time to time. The information should be reviewed only in conjunction with the entire offering document relating to the Commercial Mortgage Pass-Through Certificates, Series 2021-C11 (the “Offering Document”). All of the information contained herein is subject to the same limitations and qualifications contained in the Offering Document. The information contained herein does not contain all relevant information relating to the underlying mortgage loans or mortgaged properties. Such information is described elsewhere in the Offering Document. The information contained herein will be more fully described elsewhere in the Offering Document. The information contained herein should not be viewed as projections, forecasts, predictions or opinions with respect to value. Prior to making any investment decision, prospective investors are strongly urged to read the Offering Document its entirety. Neither the Securities and Exchange Commission nor any state securities commission has approved or disapproved of these securities or determined if this free writing prospectus is truthful or complete. Any representation to the contrary is a criminal offense.
This document has been prepared by the Underwriters for information purposes only and does not constitute, in whole or in part, a prospectus for the purposes of Regulation (EU) 2017/1129 (as amended or superseded) and/or Part VI of the Financial Services and Markets Act 2000 (as amended) or other offering document.
The attached information contains certain tables and other statistical analyses (the “Computational Materials”) which have been prepared in reliance upon information furnished by the Mortgage Loan Sellers. Numerous assumptions were used in preparing the Computational Materials, which may or may not be reflected herein. As such, no assurance can be given as to the Computational Materials’ accuracy, appropriateness or completeness in any particular context; or as to whether the Computational Materials and/or the assumptions upon which they are based reflect present market conditions or future market performance. The Computational Materials should not be construed as either projections or predictions or as legal, tax, financial or accounting advice. You should consult your own counsel, accountant and other advisors as to the legal, tax, business, financial and related aspects of a purchase of these securities. Any weighted average lives, yields and principal payment periods shown in the Computational Materials are based on prepayment and/or loss assumptions, and changes in such prepayment and/or loss assumptions may dramatically affect such weighted average lives, yields and principal payment periods. In addition, it is possible that prepayments or losses on the underlying assets will occur at rates higher or lower than the rates shown in the attached Computational Materials. The specific characteristics of the securities may differ from those shown in the Computational Materials due to differences between the final underlying assets and the preliminary underlying assets used in preparing the Computational Materials. The principal amount and designation of any security described in the Computational Materials are subject to change prior to issuance. None of the Underwriters or any of their respective affiliates make any representation or warranty as to the actual rate or timing of payments or losses on any of the underlying assets or the payments or yield on the securities. The information in this presentation is based upon management forecasts and reflects prevailing conditions and management’s views as of this date, all of which are subject to change. In preparing this presentation, we have relied upon and assumed, without independent verification, the accuracy and completeness of all information available from public sources or which was provided to us by or on behalf of the Mortgage Loan Sellers or which was otherwise reviewed by us.
This document contains forward-looking statements. If and when included in this document, the words “expects”, “intends”, “anticipates”, “estimates” and analogous expressions and all statements that are not historical facts, including statements about our beliefs or expectations, are intended to identify forward-looking statements. Any forward-looking statements are made subject to risks and uncertainties which could cause actual results to differ materially from those stated. Those risks and uncertainties include, among other things, declines in general economic and business conditions, increased competition, changes in demographics, changes in political and social conditions, regulatory initiatives and changes in consumer preferences, many of which are beyond our control and the control of any other person or entity related to this offering. The forward-looking statements made in this document are made as of the date hereof. We have no obligation to update or revise any forward-looking statement.
IMPORTANT NOTICE RELATING TO AUTOMATICALLY-GENERATED EMAIL DISCLAIMERS
Any legends, disclaimers or other notices that may appear at the bottom of any email communication to which this document is attached relating to (1) these materials not constituting an offer (or a solicitation of an offer), (2) no representation that these materials are accurate or complete and may not be updated or (3) these materials possibly being confidential, are not applicable to these materials and should be disregarded. Such legends, disclaimers or other notices have been automatically generated as a result of these materials having been sent via Bloomberg or another system.
THE CERTIFICATES REFERRED TO IN THESE MATERIALS ARE SUBJECT TO MODIFICATION OR REVISION (INCLUDING THE POSSIBILITY THAT ONE OR MORE CLASSES OF CERTIFICATES MAY BE SPLIT, COMBINED OR ELIMINATED AT ANY TIME PRIOR TO ISSUANCE OR AVAILABILITY OF A FINAL PROSPECTUS) AND ARE OFFERED ON A “WHEN, AS AND IF ISSUED” BASIS.
THE UNDERWRITERS MAY FROM TIME TO TIME PERFORM INVESTMENT BANKING SERVICES FOR, OR SOLICIT INVESTMENT BANKING BUSINESS FROM, ANY COMPANY NAMED IN THESE MATERIALS. THE UNDERWRITERS AND/OR THEIR AFFILIATES OR RESPECTIVE EMPLOYEES MAY FROM TIME TO TIME HAVE A LONG OR SHORT POSITION IN ANY CERTIFICATE OR CONTRACT DISCUSSED IN THESE MATERIALS.
THE INFORMATION IN THIS STRUCTURAL AND COLLATERAL TERM SHEET IS NOT COMPLETE AND MAY BE AMENDED PRIOR TO THE TIME OF SALE. THIS TERM SHEET IS NOT AN OFFER TO SELL THESE SECURITIES AND IT IS NOT A SOLICITATION OF AN OFFER TO BUY THESE SECURITIES IN ANY JURISDICTION WHERE THE OFFER OR SALE IS NOT PERMITTED.
2
| Structural and Collateral Term Sheet | BBCMS 2021-C11 |
| Indicative Capital Structure | |
Publicly Offered Certificates
| Class | Expected Ratings (S&P / Fitch / KBRA) | Approximate Initial Certificate Balance or Notional Amount(1) | Approximate Initial Available Certificate Balance or Notional Amount(1) | Approximate Initial Retained Certificate Balance or Notional Amount(1)(2) | Approximate Initial Credit Support(3) | Expected Weighted Avg. Life (years)(4) | Expected Principal Window(4) | Certificate Principal to Value Ratio(5) | Underwritten NOI Debt Yield(6) |
| A-1 | AAA(sf)/AAAsf/AAA(sf) | $23,677,000 | $22,828,000 | $849,000 | 30.000% | 2.77 | 10/21-5/26 | 41.2% | 15.3% |
| A-2 | AAA(sf)/AAAsf/AAA(sf) | $33,000,000 | $31,817,000 | $1,183,000 | 30.000% | 4.63 | 5/26-5/26 | 41.2% | 15.3% |
| A-SB | AAA(sf)/AAAsf/AAA(sf) | $41,720,000 | $40,224,000 | $1,496,000 | 30.000% | 7.00 | 5/26-1/31 | 41.2% | 15.3% |
| A-3 | AAA(sf)/AAAsf/AAA(sf) | $98,671,000 | $95,134,000 | $3,537,000 | 30.000% | 6.89 | 6/28-9/28 | 41.2% | 15.3% |
| A-4 | AAA(sf)/AAAsf/AAA(sf) | (7) | (7) | (7) | 30.000% | (7) | (7) | 41.2% | 15.3% |
| A-5 | AAA(sf)/AAAsf/AAA(sf) | (7) | (7) | (7) | 30.000% | (7) | (7) | 41.2% | 15.3% |
| X-A | AAA(sf)/AAAsf/AAA(sf) | $691,630,000(8) | $666,839,000(8) | $24,791,000(8) | N/A | N/A | N/A | N/A | N/A |
| X-B | NR/A-sf/AAA(sf) | $174,143,000(9) | $167,900,000(9) | $6,243,000(9) | N/A | N/A | N/A | N/A | N/A |
| A-S | AA+(sf)/AAAsf/AAA(sf) | $86,454,000 | $83,355,000 | $3,099,000 | 21.250% | 9.91 | 8/31-9/31 | 46.3% | 13.6% |
| B | AA-(sf)/AA-sf/AA(sf) | $44,462,000 | $42,868,000 | $1,594,000 | 16.750% | 9.96 | 9/31-9/31 | 49.0% | 12.9% |
| C | NR/A-sf/A(sf) | $43,227,000 | $41,677,000 | $1,550,000 | 12.375% | 9.96 | 9/31-9/31 | 51.5% | 12.2% |
Privately Offered Certificates(10)
| Class | Expected Ratings (S&P / Fitch / KBRA) | Approximate Initial Certificate Balance or Notional Amount(1) | Approximate Initial Available Certificate Balance or Notional Amount(1) | Approximate Initial Retained Certificate Balance or Notional Amount(1)(2) | Approximate Initial Credit Support(3) | Expected Weighted Avg. Life (years)(4) | Expected Principal Window(4) | Certificate Principal to Value Ratio(5) | Underwritten NOI Debt Yield(6) |
| X-D | NR/BBB-sf/BBB-(sf) | $50,637,000(11) | $48,821,000(11) | $1,816,000(11) | N/A | N/A | N/A | N/A | N/A |
| X-F | NR/BB+sf/BB+(sf) | $12,351,000(12) | $11,908,000(12) | $443,000(12) | N/A | N/A | N/A | N/A | N/A |
| X-G | NR/BB-sf/BB(sf) | $9,880,000(13) | $9,525,000(13) | $355,000(13) | N/A | N/A | N/A | N/A | N/A |
| D | NR/BBBsf/BBB+(sf) | $27,171,000 | $26,197,000 | $974,000 | 9.625% | 9.96 | 9/31-9/31 | 53.1% | 11.8% |
| E | NR/BBB-sf/BBB-(sf) | $23,466,000 | $22,624,000 | $842,000 | 7.250% | 9.96 | 9/31-9/31 | 54.5% | 11.5% |
| F | NR/BB+sf/BB+(sf) | $12,351,000 | $11,908,000 | $443,000 | 6.000% | 9.96 | 9/31-9/31 | 55.3% | 11.4% |
| G | NR/BB-sf/BB(sf) | $9,880,000 | $9,525,000 | $355,000 | 5.000% | 9.96 | 9/31-9/31 | 55.9% | 11.3% |
| H-RR | NR/B-sf/B(sf) | $9,881,000 | $9,526,000 | $355,000 | 4.000% | 9.96 | 9/31-9/31 | 56.4% | 11.1% |
| J-RR | NR/NR/NR | $39,521,799 | $38,105,000 | $1,416,799 | 0.000% | 9.96 | 9/31-9/31 | 58.8% | 10.7% |
| (1) | In the case of each such Class, subject to a permitted variance of plus or minus 5%, including in connection with any variation in the certificate balances and notional amounts of the classes comprising the VRR Interest following the calculation of the actual fair value of the ABS interests (as such term is defined in Regulation RR) issued by the issuing entity. |
| (2) | On the Closing Date, Sabal (a sponsor and an affiliate of the special servicer) will cause a majority-owned affiliate to purchase from the underwriters the certificates (other than the Class R certificates) with the initial certificate balances or notional amounts, as applicable, as set forth in the table above under “Approximate Initial Retained Certificate Balance or Notional Amount”, as further described in “Credit Risk Retention” in the Preliminary Prospectus. |
| (3) | The credit support percentages set forth for Class A-1, Class A-2, Class A-SB, Class A-3, Class A-4 and Class A-5 Certificates represent the approximate initial credit support for the Class A-1, Class A-2, Class A-SB, Class A-3, Class A-4 and Class A-5 Certificates in the aggregate. |
| (4) | Assumes 0% CPR / 0% CDR and a September 29, 2021 closing date. Based on modeling assumptions as described in the Preliminary Prospectus dated September 10, 2021 (the “Preliminary Prospectus”). |
| (5) | The “Certificate Principal to Value Ratio” for any Class of Principal Balance Certificates (other than the Class A-1, Class A-2, Class A-SB, Class A-3, Class A-4 and Class A-5 Certificates) is calculated as the product of (a) the weighted average Cut-off Date LTV Ratio for the mortgage loans, and (b) a fraction, the numerator of which is the total initial Certificate Balance of such Class of Certificates and all Classes of Principal Balance Certificates senior to such Class of Certificates and the denominator of which is the total initial Certificate Balance of all of the Principal Balance Certificates. The Class A-1, Class A-2, Class A-SB, Class A-3, Class A-4 and Class A-5 Certificate Principal to Value Ratios are calculated in the aggregate for those Classes as if they were a single Class. Investors should note, however, that excess mortgaged property value associated with a mortgage loan will not be available to offset losses on any other mortgage loan. |
| (6) | The “Underwritten NOI Debt Yield” for any Class of Principal Balance Certificates (other than the Class A-1, Class A-2, Class A-SB, Class A-3, Class A-4 and Class A-5 Certificates) is calculated as the product of (a) the weighted average UW NOI Debt Yield for the mortgage loans and (b) a fraction, the numerator of which is the total initial Certificate Balance of all of the Classes of Principal Balance Certificates and the denominator of which is the total initial Certificate Balance for such Class and all Classes of Principal Balance Certificates senior to such Class of Certificates. The Underwritten NOI Debt Yield for each of the Class A-1, Class A-2, Class A-SB, Class A-3, Class A-4 and Class A-5 Certificates is calculated in the aggregate for those Classes as if they were a single Class. Investors should note, however, that net operating income from any mortgaged property supports only the related mortgage loan and will not be available to support any other mortgage loan. |
| (7) | The exact initial certificate balances of the Class A-4 and Class A-5 certificates are unknown and will be determined based on the final pricing of those classes of certificates. However, the respective initial certificate balances, expected weighted average lives and expected principal windows of the Class A-4 and Class A-5 certificates are expected to be within the applicable ranges reflected in the following chart. The aggregate initial certificate balance of the Class A-4 and Class A-5 certificates is expected to be approximately $494,562,000, subject to a variance of plus or minus 5%. The initial certificate balance of the certificates to be retained by SSOF VRR, LLC related to the Class A-4 and Class A-5 certificates will be an amount equal to approximately 3.584% of the approximate initial certificate balance of such class, as further described in “Credit Risk Retention.” In the event that the Class A-5 certificates are issued with an initial certificate balance of $494,562,000, the Class A-4 certificates will not be issued and the Class A-5 will be renamed the Class A-4. |
THE INFORMATION IN THIS STRUCTURAL AND COLLATERAL TERM SHEET IS NOT COMPLETE AND MAY BE AMENDED PRIOR TO THE TIME OF SALE. THIS TERM SHEET IS NOT AN OFFER TO SELL THESE SECURITIES AND IT IS NOT A SOLICITATION OF AN OFFER TO BUY THESE SECURITIES IN ANY JURISDICTION WHERE THE OFFER OR SALE IS NOT PERMITTED.
3
| Structural and Collateral Term Sheet | BBCMS 2021-C11 | |
| Indicative Capital Structure | ||
| Class of Certificates | Expected Range of Approximate Initial Certificate Balance | Expected Range of Approximate Initial Available Certificate Balance | Expected Range of Approximate Initial Retained Certificate Balance | Expected Range of Weighted Avg. Life (Yrs) | Expected Range of Principal Window | ||
| Class A-4 | $0 - $233,364,000 | $0 - $225,000,000 | $0 - $8,364,000 | N/A – 9.14 | N/A – 12/29-7/31 | ||
| Class A-5 | $261,198,000 – $494,562,000 | $251,836,000 - $476,836,000 | $9,362,000 – $17,726,000 | 9.84 – 9.51 | 7/31-8/31 – 12/29-8/31 |
| (8) | The Notional Amount of the Class X-A Certificates will be equal to the aggregate Certificate Balance of the Class A-1, Class A-2, Class A-SB, Class A-3, Class A-4 and Class A-5 Certificates outstanding from time to time. |
| (9) | The Notional Amount of the Class X-B Certificates will be equal to the aggregate Certificate Balance of the Class A-S, Class B and Class C Certificates outstanding from time to time. |
| (10) | The Class X-D, Class X-F, Class X-G, Class D, Class E, Class F, Class G, Class H-RR and Class J-RR Certificates are not being offered by the Preliminary Prospectus and this Term Sheet. The Class R Certificates are not shown above. |
| (11) | The Notional Amount of the Class X-D Certificates will be equal to the aggregate Certificate Balance of the Class D and Class E Certificates outstanding from time to time. |
| (12) | The Notional Amount of the Class X-F Certificates will be equal to the Certificate Balance of the Class F Certificates outstanding from time to time. |
| (13) | The Notional Amount of the Class X-G Certificates will be equal to the Certificate Balance of the Class G Certificates outstanding from time to time. |
THE INFORMATION IN THIS STRUCTURAL AND COLLATERAL TERM SHEET IS NOT COMPLETE AND MAY BE AMENDED PRIOR TO THE TIME OF SALE. THIS TERM SHEET IS NOT AN OFFER TO SELL THESE SECURITIES AND IT IS NOT A SOLICITATION OF AN OFFER TO BUY THESE SECURITIES IN ANY JURISDICTION WHERE THE OFFER OR SALE IS NOT PERMITTED.
4
| Structural and Collateral Term Sheet | BBCMS 2021-C11 | |
| Summary of Transaction Terms | ||
| Securities Offered: | $865,773,000 monthly pay, multi-class, commercial mortgage REMIC Pass-Through Certificates. |
| Co-Lead Managers and Joint Bookrunners: | Barclays Capital Inc., SG Americas Securities, LLC and UBS Securities LLC. |
| Co-Managers: | Natixis Securities Americas LLC, Academy Securities, Inc. and Mischler Financial Group, Inc. |
| Mortgage Loan Sellers: | Barclays Capital Real Estate Inc. (“Barclays”) (26.3%), Societe Generale Financial Corporation (“SGFC”) (20.0%), SSOF SCRE AIV, L.P. (“Sabal”) (17.8%), UBS AG (“UBS AG”) (16.7%), LMF Commercial, LLC (“LMF”) (7.8%), BSPRT CMBS Finance, LLC (“BSPRT”) (7.0%) and Natixis Real Estate Capital LLC (“Natixis”) (4.5%). |
| Master Servicer: | Wells Fargo Bank, National Association. |
| Special Servicer: | SCP Servicing, LLC. |
| Trustee: | Wilmington Trust, National Association. |
| Certificate Administrator: | Wells Fargo Bank, National Association. |
| Operating Advisor: | Park Bridge Lender Services LLC. |
| Asset Representations Reviewer: | Park Bridge Lender Services LLC. |
| Rating Agencies: | S&P Global Ratings, acting through Standard & Poor’s Financial Services LLC (“S&P”), Fitch Ratings, Inc. (“Fitch”) and Kroll Bond Rating Agency, LLC (“KBRA”). |
| Initial Majority Controlling Class Certificateholder: | Sabal Strategic Opportunities Fund, L.P. or an affiliate |
| U.S. Credit Risk Retention: | Sabal is expected to act as the “retaining sponsor,” for this securitization and intends to satisfy the U.S. credit risk retention requirements (i) through the purchase by SSOF VRR LLC, a “majority-owned affiliate,” of an “eligible vertical interest” (each as defined in Regulation RR), which will consist of approximately 3.584% of the certificate balance, notional amount or percentage interest of each class of certificates (other than the Class R Certificates) (the “VRR Interest”) issued by the issuing entity and (ii) through the purchase by Sabal Strategic Opportunities Fund, L.P., a “majority-owned affiliate,” of an “eligible horizontal residual interest” (each as defined in Regulation RR), which will consist of the portion of the Class H-RR and Class J-RR Certificates not included in the VRR Interest. Sabal, in its capacity as the “retaining sponsor” for this transaction, will be required to comply with the hedging, transfer and financing restrictions applicable to a “retaining sponsor” under the credit risk retention rules, which generally prohibit the transfer of the applicable certificates except to a “majority-owned affiliate” of the “retaining sponsor”. The restrictions on hedging and transfer under the credit risk retention rules as in effect on the closing date of this transaction will expire on and after the date that is the latest of (i) the date on which the aggregate principal balance of the mortgage loans has been reduced to 33% of the aggregate principal balance of the mortgage loans as of the Cut-off Date; (ii) the date on which the total unpaid principal obligations under the certificates has been reduced to 33% of the aggregate total unpaid principal obligations under the certificates as of the Closing Date; or (iii) two years after the Closing Date. For additional information, see “Credit Risk Retention” in the Preliminary Prospectus. |
| EU Credit Risk Retention: | The transaction is not structured to satisfy the EU risk retention and due diligence requirements. |
| Closing Date: | On or about September 29, 2021. |
| Cut-off Date: | With respect to each mortgage loan, the related due date in September 2021, or in the case of any mortgage loan that has its first due date after September 2021, the date that would have been its due date in September 2021 under the terms of that mortgage loan if a monthly debt service payment were scheduled to be due in that month. |
| Distribution Date: | The 4th business day after the Determination Date in each month, commencing in October 2021. |
| Determination Date: | 11th day of each month, or if the 11th day is not a business day, the next succeeding business day, commencing in October 2021. |
| Assumed Final Distribution Date: | The Distribution Date in September 2031, which is the latest anticipated repayment date of the Certificates. |
| Rated Final Distribution Date: | The Distribution Date in September 2054. |
| Tax Treatment: | The Publicly Offered Certificates are expected to be treated as REMIC “regular interests” for U.S. federal income tax purposes. |
| Form of Offering: | The Class A-1, Class A-2, Class A-SB, Class A-3, Class A-4, Class A-5, Class X-A, Class X-B, Class A-S, Class B and Class C Certificates (the “Publicly Offered Certificates”) will be offered publicly. The Class X-D, Class X-F, Class X-G, Class D, Class E, Class F, Class G, Class H-RR, Class J-RR and Class R Certificates (the “Privately Offered Certificates”) will be offered domestically to Qualified Institutional Buyers and to Institutional Accredited Investors (other than the Class R Certificates) and to institutions that are not U.S. Persons pursuant to Regulation S. |
| SMMEA Status: | The Certificates will not constitute “mortgage related securities” for purposes of SMMEA. |
| ERISA: | The Publicly Offered Certificates are expected to be ERISA eligible. |
THE INFORMATION IN THIS STRUCTURAL AND COLLATERAL TERM SHEET IS NOT COMPLETE AND MAY BE AMENDED PRIOR TO THE TIME OF SALE. THIS TERM SHEET IS NOT AN OFFER TO SELL THESE SECURITIES AND IT IS NOT A SOLICITATION OF AN OFFER TO BUY THESE SECURITIES IN ANY JURISDICTION WHERE THE OFFER OR SALE IS NOT PERMITTED.
5
| Structural and Collateral Term Sheet | BBCMS 2021-C11 | |
| Summary of Transaction Terms | ||
| Optional Termination: | On any Distribution Date on which the aggregate principal balance of the pool of mortgage loans is less than 1% of the aggregate principal balance of the mortgage loans as of the Cut-off Date, certain entities specified in the Preliminary Prospectus will have the option to purchase all of the remaining mortgage loans (and all property acquired through exercise of remedies in respect of any mortgage loan) at the price specified in the Preliminary Prospectus. Refer to “Pooling and Servicing Agreement—Termination; Retirement of Certificates” in the Preliminary Prospectus. |
| Minimum Denominations: | The Publicly Offered Certificates (other than the Class X-A and Class X-B Certificates) will be issued in minimum denominations of $10,000 and integral multiples of $1 in excess of $10,000. The Class X-A and Class X-B Certificates will be issued in minimum denominations of $1,000,000 and in integral multiples of $1 in excess of $1,000,000. |
| Settlement Terms: | DTC, Euroclear and Clearstream Banking. |
| Analytics: | The transaction is expected to be modeled by Intex Solutions, Inc. and Trepp, LLC and is expected to be available on Bloomberg, L.P., Trepp, LLC, Intex Solutions, Inc., Interactive Data Corp., Markit Group Limited, BlackRock Financial Management, Inc., CMBS.com, Moody’s Analytics, MBS Data, LLC, RealInsight, KBRA Analytics, LLC, Thomson Reuters Corporation, DealView Technologies Ltd. and CRED iQ. |
| Risk Factors: | THE CERTIFICATES INVOLVE CERTAIN RISKS AND MAY NOT BE SUITABLE FOR ALL INVESTORS. REFER TO THE “SUMMARY OF RISK FACTORS” AND “RISK FACTORS” SECTIONS OF THE PRELIMINARY PROSPECTUS. |
THE INFORMATION IN THIS STRUCTURAL AND COLLATERAL TERM SHEET IS NOT COMPLETE AND MAY BE AMENDED PRIOR TO THE TIME OF SALE. THIS TERM SHEET IS NOT AN OFFER TO SELL THESE SECURITIES AND IT IS NOT A SOLICITATION OF AN OFFER TO BUY THESE SECURITIES IN ANY JURISDICTION WHERE THE OFFER OR SALE IS NOT PERMITTED.
6
| Structural and Collateral Term Sheet | BBCMS 2021-C11 | |
| Collateral Characteristics | ||
Mortgage Loan Seller | Number of | Number of Mortgaged | Aggregate | % of IPB |
| Barclays | 16 | 25 | $259,707,000 | 26.3% |
| SGFC | 12 | 12 | $197,393,695 | 20.0% |
| Sabal | 34 | 34 | $176,215,002 | 17.8% |
| UBS AG | 10 | 70 | $164,811,384 | 16.7% |
| LMF | 12 | 22 | $76,751,795 | 7.8% |
| BSPRT | 8 | 8 | $69,114,924 | 7.0% |
| Natixis | 2 | 2 | $44,050,000 | 4.5% |
| Total: | 94 | 173 | $988,043,799 | 100.0% |
| Loan Pool | ||
| Initial Pool Balance (“IPB”): | $988,043,799 | |
| Number of Mortgage Loans: | 94 | |
| Number of Mortgaged Properties: | 173 | |
| Average Cut-off Date Balance per Mortgage Loan: | $10,511,104 | |
| Weighted Average Current Mortgage Rate: | 3.55269% | |
| 10 Largest Mortgage Loans as % of IPB: | 37.4% | |
| Weighted Average Remaining Term to Maturity: | 111 months | |
| Weighted Average Seasoning: | 3 months | |
| Credit Statistics | ||
| Weighted Average UW NCF DSCR(1)(2): | 2.49x | |
| Weighted Average UW NOI Debt Yield(1): | 10.7% | |
| Weighted Average Cut-off Date Loan-to-Value Ratio (“LTV”)(1)(3): | 58.8% | |
| Weighted Average Maturity Date LTV(1)(3): | 54.3% | |
| Other Statistics | ||
| % of Mortgage Loans with Additional Debt: | 15.3% | |
| % of Mortgaged Loans with Single Tenants(4): | 17.3% | |
| % of Mortgaged Loans secured by Multiple Properties: | 12.4% | |
| Amortization | ||
| Weighted Average Original Amortization Term(5): | 353 months | |
| Weighted Average Remaining Amortization Term(5): | 351 months | |
| % of Mortgage Loans with Interest-Only: | 57.3% | |
| % of Mortgage Loans with Partial Interest-Only followed by Amortizing Balloon: | 27.6% | |
| % of Mortgage Loans with Amortizing Balloon: | 15.1% | |
| Lockboxes(6) | ||
| % of Mortgage Loans with Hard Lockboxes: | 49.1% | |
| % of Mortgage Loans with Springing Lockboxes: | 46.7% | |
| % of Mortgage Loans with Soft Lockboxes: | 4.2% | |
| % of Mortgage Loans with No Lockbox: | 0.0% | |
| Reserves | ||
| % of Mortgage Loans Requiring Monthly Tax Reserves: | 72.9% | |
| % of Mortgage Loans Requiring Monthly Insurance Reserves: | 62.6% | |
| % of Mortgage Loans Requiring Monthly CapEx Reserves: | 62.4% | |
| % of Mortgage Loans Requiring Monthly TI/LC Reserves(7): | 50.5% | |
| (1) | In the case of Loan Nos. 1, 2, 6, 11, 15 and 21, the UW NCF DSCR, UW NOI Debt Yield, Cut-off Date LTV and Maturity Date LTV calculations include the related Pari Passu Companion Loan(s). In the case of Loan Nos. 1, 2 and 4, the UW NCF DSCR, UW NOI Debt Yield, Cut-off Date LTV and Maturity Date LTV calculations exclude the related Subordinate Companion Loans and/or mezzanine loans. |
| (2) | For the mortgage loans that are interest-only for the entire term and accrue interest on an Actual/360 basis, the Monthly Debt Service Amount ($) was calculated as 1/12th of the product of (i) the Original Balance ($), (ii) the Interest Rate % and (iii) 365/360. |
| (3) | In the case of Loan Nos. 14 and 15, the Cut-off Date LTV and the Maturity Date LTV are calculated by using an appraised value based on an as portfolio assumption or an as-complete assumption, respectively. Refer to “Description of the Mortgage Pool—Assessment of Property Value and Condition” and “—Appraised Value” in the Preliminary Prospectus for additional details. |
| (4) | Excludes mortgage loans that are secured by multiple properties with multiple tenants. |
| (5) | Excludes 42 mortgage loans that are interest-only for the entire term. |
| (6) | For a more detailed description of Lockboxes, refer to “Description of the Mortgage Pool—Certain Terms of the Mortgage Loans—Mortgaged Property Accounts” in the Preliminary Prospectus. In the case of Loan No. 25, the mortgage loan is structured with a soft lockbox for residential tenants and a hard lockbox for commercial tenants and is considered a Soft Lockbox in the calculations shown. |
| (7) | Calculated only with respect to the Cut-off Date Balance of mortgage loans secured or partially secured by office, retail, mixed use and industrial properties. |
THE INFORMATION IN THIS STRUCTURAL AND COLLATERAL TERM SHEET IS NOT COMPLETE AND MAY BE AMENDED PRIOR TO THE TIME OF SALE. THIS TERM SHEET IS NOT AN OFFER TO SELL THESE SECURITIES AND IT IS NOT A SOLICITATION OF AN OFFER TO BUY THESE SECURITIES IN ANY JURISDICTION WHERE THE OFFER OR SALE IS NOT PERMITTED.
7
| Structural and Collateral Term Sheet | BBCMS 2021-C11 | |
| Collateral Characteristics | ||
| Ten Largest Mortgage Loans |
| No. | Loan Name | City, State | Mortgage Loan Seller | No. of Prop. | Cut-off Date Balance | % of IPB | Square Feet / Rooms / Units | Property Type | UW NCF DSCR(1) | UW NOI Debt Yield(1) | Cut-off Date LTV(1) | Maturity Date LTV(1) |
| 1 | One SoHo Square | New York, NY | Barclays | 1 | $70,000,000 | 7.1% | 786,891 | Office | 4.88x | 13.6% | 34.8% | 34.8% |
| 2 | Kings Plaza | Brooklyn, NY | SGFC | 1 | $47,945,946 | 4.9% | 811,797 | Retail | 3.07x | 10.7% | 54.1% | 54.1% |
| 3 | Parkway Irvine | Irvine, CA | SGFC | 1 | $37,000,000 | 3.7% | 209,831 | Industrial | 2.91x | 9.6% | 59.3% | 59.3% |
| 4 | Broadacres Office Park | Bloomfield, NJ | Natixis | 1 | $33,000,000 | 3.3% | 396,226 | Office | 3.73x | 14.8% | 58.7% | 58.7% |
| 5 | Fleet Farm Mixed Use | Appleton, WI | SGFC | 1 | $33,000,000 | 3.3% | 431,440 | Mixed Use | 1.88x | 10.9% | 60.0% | 54.0% |
| 6 | Morris Corporate Center | Parsippany, NJ | UBS AG | 1 | $32,500,000 | 3.3% | 541,195 | Office | 1.90x | 11.1% | 68.2% | 58.1% |
| 7 | 15-17 Park Avenue | New York, NY | SGFC | 1 | $31,000,000 | 3.1% | 97 | Multifamily | 2.04x | 7.0% | 61.9% | 61.9% |
| 8 | Gainey Ranch Corporate Center II | Scottsdale, AZ | BSPRT | 1 | $29,175,000 | 3.0% | 203,642 | Office | 3.68x | 13.0% | 47.1% | 47.1% |
| 9 | Pleasant Valley Apartments | Groton, CT | Barclays | 1 | $28,930,000 | 2.9% | 132 | Multifamily | 2.21x | 7.5% | 69.4% | 69.4% |
| 10 | Cooper Standard HQ | Northville, MI | UBS AG | 1 | $27,300,000 | 2.8% | 110,165 | Office | 1.93x | 11.0% | 63.8% | 53.3% |
| Top 3 Total/Weighted Average | 3 | $154,945,946 | 15.7% | 3.85x | 11.7% | 46.6% | 46.6% | ||||
| Top 5 Total/Weighted Average | 5 | $220,945,946 | 22.4% | 3.54x | 12.1% | 50.4% | 49.5% | ||||
| Top 10 Total/Weighted Average | 10 | $369,850,946 | 37.4% | 3.06x | 11.2% | 55.2% | 53.0% | ||||
| Non-Top 10 Total/Weighted Average(1)(2) | 163 | $618,192,853 | 62.6% | 2.14x | 10.3% | 60.9% | 55.1% | ||||
| (1) | In the case of Loan Nos. 1, 2, 6, 11, 15 and 21, the UW NCF DSCR, UW NOI Debt Yield, Cut-off Date LTV and Maturity Date LTV calculations include the related Pari Passu Companion Loan(s). In the case of Loan Nos. 1, 2 and 4, the UW NCF DSCR, UW NOI Debt Yield, Cut-off Date LTV and Maturity Date LTV calculations exclude the related Subordinate Companion Loans and/or mezzanine loans. |
| (2) | In the case of Loan Nos. 14 and 15, the Cut-off Date LTV and the Maturity Date LTV are calculated by using an appraised value based on an as portfolio assumption or an as-complete assumption, respectively. Refer to “Description of the Mortgage Pool—Assessment of Property Value and Condition” and “—Appraised Value” in the Preliminary Prospectus for additional details. |
THE INFORMATION IN THIS STRUCTURAL AND COLLATERAL TERM SHEET IS NOT COMPLETE AND MAY BE AMENDED PRIOR TO THE TIME OF SALE. THIS TERM SHEET IS NOT AN OFFER TO SELL THESE SECURITIES AND IT IS NOT A SOLICITATION OF AN OFFER TO BUY THESE SECURITIES IN ANY JURISDICTION WHERE THE OFFER OR SALE IS NOT PERMITTED.
8
| Structural and Collateral Term Sheet | BBCMS 2021-C11 | |
| Collateral Characteristics | ||
| Pari Passu Companion Loan Summary | |||||||||
No. | Loan Name | Mortgage Loan Seller | Trust Cut-off Date Balance | Total | Controlling | Master Servicer | Special | Related Pari Passu | Related Pari Passu Loan(s) Original Balance |
| 1 | One SoHo Square | Barclays | $70,000,000 | $470,000,000 | SOHO 2021-SOHO(2) | KeyBank | Midland | SOHO 2021-SOHO BMARK 2021-B28 Future Securitization(s) | $1,000,000 $135,000,000 $264,000,000 |
| 2 | Kings Plaza | SGFC | $47,945,946 | $487,000,000 | BMARK 2020-B17 | Midland | Midland | BMARK 2020-B17 DBJPM 2020-C9 BMARK 2020-B18 BMARK 2020-B16 BMARK 2020-IG1 BBCMS 2020-C6 BMARK 2020-B21 WFCM 2020-C55 BANK 2020-BNK25 BBCMS 2021-C10 | $32,000,000 $20,000,000 $14,108,108 $50,000,000 $55,000,000 $60,000,000 $30,000,000 $82,945,946 $75,000,000 $20,000,000 |
| 6 | Morris Corporate Center | UBS AG | $32,500,000 | $82,000,000 | BBCMS 2021-C10 | KeyBank | Rialto | BBCMS 2021-C10 | $49,500,000 |
| 11 | 356-362 E 148th Street | Barclays | $24,000,000 | $38,000,000 | BBCMS 2021-C11 | Wells | Sabal | Future Securitization(s) | $14,000,000 |
| 15 | Wyndham National Hotel Portfolio | UBS AG | $19,130,750 | $138,697,940 | UBS 2019-C18 | Wells | Rialto | UBS 2019-C18 BBCMS 2021-C10 Future Securitization(s) | $35,000,000 $10,000,000 $80,000,000 |
| 21 | Rollins Portfolio | UBS AG | $15,000,000 | $39,400,000 | WFCM 2021-C60 | Wells | Midland | WFCM 2021-C60 | $24,400,000 |
| (1) | In the case of Loan Nos. 1 and 2, the Total Mortgage Loan Cut-off Date Balance excludes the related Subordinate Companion Loan(s) and/or mezzanine loan(s). |
| (2) | In the case of Loan No. 1, control rights are currently exercised by the holder of the related Subordinate Companion Loan(s) until the occurrence and during the continuance of a control appraisal period for the related Whole Loan, as described under “Description of the Mortgage Pool—The Whole Loans—The Non-Serviced AB Whole Loan” in the Preliminary Prospectus. |
THE INFORMATION IN THIS STRUCTURAL AND COLLATERAL TERM SHEET IS NOT COMPLETE AND MAY BE AMENDED PRIOR TO THE TIME OF SALE. THIS TERM SHEET IS NOT AN OFFER TO SELL THESE SECURITIES AND IT IS NOT A SOLICITATION OF AN OFFER TO BUY THESE SECURITIES IN ANY JURISDICTION WHERE THE OFFER OR SALE IS NOT PERMITTED.
9
| Structural and Collateral Term Sheet | BBCMS 2021-C11 | |
| Collateral Characteristics | ||
| Additional Debt Summary |
No. | Loan Name | Trust | Pari Passu | Subordinate | Total Debt Cut- | Mortgage Loan UW NCF DSCR(2) | Total | Mortgage Loan | Total Debt | Mortgage Loan UW NOI Debt Yield(2) | Total |
| 1 | One SoHo Square | $70,000,000 | $400,000,000 | $435,000,000 | $905,000,000 | 4.88x | 2.28x | 34.8% | 67.0% | 13.6% | 7.1% |
| 2 | Kings Plaza | $47,945,946 | $439,054,054 | $53,000,000 | $540,000,000 | 3.07x | 1.73x | 54.1% | 60.0% | 10.7% | 9.6% |
| 4 | Broadacres Office Park | $33,000,000 | $0 | $7,000,000 | $40,000,000 | 3.73x | 2.43x | 58.7% | 71.2% | 14.8% | 12.2% |
| (1) | In the case of Loan No. 1, subordinate debt represents one or more Subordinate Companion Loans ($315,000,000) and a mezzanine loan ($120,000,000). In the case of Loan Nos. 2 and 4, subordinate debt represents a mezzanine loan. |
| (2) | Mortgage Loan UW NCF DSCR, Mortgage Loan Cut-off Date LTV and Mortgage Loan UW NOI Debt Yield calculations include any related Pari Passu Companion Loans (if applicable), but exclude the related Subordinate Companion Loans and mezzanine loan(s). |
THE INFORMATION IN THIS STRUCTURAL AND COLLATERAL TERM SHEET IS NOT COMPLETE AND MAY BE AMENDED PRIOR TO THE TIME OF SALE. THIS TERM SHEET IS NOT AN OFFER TO SELL THESE SECURITIES AND IT IS NOT A SOLICITATION OF AN OFFER TO BUY THESE SECURITIES IN ANY JURISDICTION WHERE THE OFFER OR SALE IS NOT PERMITTED.
10
| Structural and Collateral Term Sheet | BBCMS 2021-C11 | |
| Collateral Characteristics | ||
COVID-19 Update(1) |
Mortgage Loan | Information as of Date | Origination Date | Property Name | Property | July Debt Service Payment Received | August | Forbearance or Other Debt Service | Other Loan Modification Requested | Lease Modification or Rent | PPP Loan Received | Occupied SF/Unit | UW June | Occupied SF/Unit | UW July |
| SGFC | 8/31/202 | 12/3/2019 | Kings Plaza | Retail | Y | Y | N | N | Y(4) | N | NAP | 93.5% | NAP | 99.1% |
| UBS AG | 8/23/2021 | 11/27/2019 | Wyndham National Hotel Portfolio | Hospitality | Y | Y | N | N | N | N | NAP | NAP | NAP | NAP |
| SGFC | 8/31/2021 | 3/2/2020 | Homewood Suites Katy | Hospitality | Y | Y | Y(5) | N | N | Y(5) | NAP | NAP | NAP | NAP |
| Sabal | 8/26/2021 | 3/6/2020 | College Metcalf | Mixed Use | Y | Y | N | N | Y(6) | N | 100.0% | 100.0% | 100.0% | 100.0% |
| SGFC | 8/31/2021 | 3/2/2020 | Holiday Inn Express Alamogordo | Hospitality | Y | Y | N | N | N | N | NAP | NAP | NAP | NAP |
| LMF | 8/31/2021 | 2/27/2020 | Best Western Hampton Coliseum Inn | Hospitality | Y | Y | Y(7) | Y(7) | NAP | N | NAP | NAP | NAP | NAP |
| (1) | The table contains information regarding the status of the Mortgage Loans originated in or prior to March 2020 and of the related Mortgaged Properties, in each case as of the date found in the “Information as-of Date” column below. The information provided in the columns labeled “Lease Modification or Rent Relief Requested (Y/N)”, “PPP Loan Received by Borrower (Y/N)”, “Occupied SF/Unit Making Full June Payment (%)” and “Occupied SF/Unit Making Full July Payment (%)” as well as the information found in the footnotes to the table (such information collectively, the “Borrower Information”) was provided by the related borrower sponsors via phone conversations and email communications. The Borrower Information has not been independently verified by the Mortgage Loan Sellers, the Underwriters or any other party, and there can be no assurances that the Borrower Information was comprehensive and accurate when received, or as of the date of this term sheet. |
The cumulative effects of the COVID-19 pandemic on the global economy may cause tenants to be unable to pay their rent and borrowers to be unable to pay debt service under the Mortgage Loans. As a result, we cannot assure you that the information in the following table is indicative of future performance or that tenants or borrowers will not seek rent or debt service relief (including forbearance arrangements) or other lease or loan modifications in the future. Such actions may lead to shortfalls and losses on the Certificates. See “Risk Factors—Risks Related to Market Conditions and Other External Factors—Current Coronavirus Pandemic Has Adversely Affected the Global Economy and Will Likely Adversely Affect the Performance of the Mortgage Loans” in the Preliminary Prospectus.
| (2) | Forbearance or Other Debt Service Relief Requested (Y/N) and Other Loan Modification Requested (Y/N) reflect situations where a request was made and not withdrawn. |
| (3) | Lease Modification or Rent Relief Requested (Y/N) excludes residential tenants and self-storage tenants and includes any commercial tenant that has requested a lease modification or rent relief. |
| (4) | Although June and July 2021 collections were reported by the borrower, an accurate estimate of the percentage of Total Occupied SF/Unit Making Full Rent Payment (%) for June and July 2021 cannot be determined for the Kings Plaza Mortgage Loan based on the source documentation of the aged receivable reports received from the borrower sponsor, which only reported the balances for gross amounts due over 30 day increments for each tenant. According to the borrower sponsor, 31 tenants (collectively approximately 11.3% of total NRA and approximately 20.6% of UW Base Rent) have executed deferment agreements. However, these tenants are currently not in deferment and are paying current rent. JCPenney closed its store at the Kings Plaza Mortgaged Property on October 31, 2020. On May 10, 2021, the borrower sponsor’s CEO, Thomas O’Hern, reported on a Q1 2021 earnings call, it would be announcing a new store commitment for the Kings Plaza Mortgaged Property. As of the date of this term sheet no further announcement has been made. In addition: |
| ● | The following tenants have not reopened: Master Wok, Nathan’s Famous, Haagen Dazs (kiosk) and Starbucks (collectively, 0.8% of NRA and 1.0% of UW Base Rent). |
| ● | The following tenants have vacated the Kings Plaza Mortgaged Property: JCPenney, Clique (kiosk), Fashion to Figure, GNC, Landing Gear, New York & Company, NYX, Parfois and Pounds Lifestyle Boutique (collectively, 13.8% of NRA and 4.6% of UW Base Rent). |
| ● | GNC and JCPenney (collectively 11.9% of NRA and 2.3% of UW Base Rent) have declared bankruptcy and vacated the premises. The Forever 21 lease was assumed with the term extended to January 31, 2023, and such space was underwritten as vacant. The Charlotte Russe (1.0% of NRA and 0.7% of UW Base Rent) lease was assumed with a term through July 31, 2021, and currently negotiating a 2-year lease renewal. With respect to ALDO/ALDO Accessories (0.4% of NRA and 1.5% of UW Base Rent), the leases were assumed with terms through January 1, 2026 and January 31, 2022, respectively. |
| (5) | On May 1, 2020, the loan agreement was modified to (i) defer the May 2020, June 2020 and July 2020 principal payments, (ii) pay the June 2020 and July 2020 interest out of the hotel’s upfront PIP reserve and (iii) waive the ongoing FF&E reserve for May, June and July 2020. As a result of the Mortgaged Property’s rebound in Q3 2020 and Q4 2020, the borrower sponsor repaid all of the deferred payments/escrows (approximately $125K) in December 2020 and the loan has remained current. The related borrower sponsor obtained an unsecured loan in the amount of $158,800 under the Coronavirus Aid, Relief and Economic Security Act’s Payment Protection Program (a “PPP Loan”). Pursuant to a modification of the loan agreement, dated May 1, 2020, the lender consented to the PPP Loan and the PPP Loan was included as permitted debt under the related Mortgage Loan documents. |
| (6) | Seven tenants (collectively, approximately 19.0% of NRA and approximately 30.7% of UW Base Rent) received various COVID-19 related rent and recovery deferments in 2020 which deferments have since all ended. Such deferred amounts are scheduled to be repaid over periods ranging from 2 months to 12 months. The deferments totaled approximately $104,400, with the single largest deferment of $30,923 related to The Shack tenant. These deferred amounts are all scheduled to be fully repaid by the end of 2021. Additionally, 100.0% of Occupied SF/Unit Making Full August Payment (%) and 100.0% UW August Base Rent Paid (%) were collected for August 2021. |
| (7) | From April through September 2020, the borrower paid debt service; however, collections of tax and insurance reserves were deferred (and the borrower paid taxes and shortfalls in insurance premiums when due) and collections for capital expenditures were waived. Additionally, the lender entered into a forbearance agreement with the borrower, which deferred interest payments for four months from December 2020 through March 2021 (the total amount deferred was $41,892). The borrower is required to pay $41,892 in monthly installments of $3,491, starting in April 2021. The borrower is current on its repayments. |
THE INFORMATION IN THIS STRUCTURAL AND COLLATERAL TERM SHEET IS NOT COMPLETE AND MAY BE AMENDED PRIOR TO THE TIME OF SALE. THIS TERM SHEET IS NOT AN OFFER TO SELL THESE SECURITIES AND IT IS NOT A SOLICITATION OF AN OFFER TO BUY THESE SECURITIES IN ANY JURISDICTION WHERE THE OFFER OR SALE IS NOT PERMITTED.
11
| Structural and Collateral Term Sheet | BBCMS 2021-C11 |
| Collateral Characteristics | |
| Mortgaged Properties by Type(1) |
Weighted Average | ||||||||
| Property Type | Property Subtype | Number of Properties | Cut-off Date Principal Balance | % of IPB | UW NCF DSCR(2)(3) | UW NOI Debt Yield(2) | Cut-off Date LTV(2)(4) | Maturity Date LTV(2)(4) |
| Office | Suburban | 12 | $172,072,958 | 17.4% | 2.62x | 12.2% | 60.2% | 54.3% |
| CBD | 4 | 105,632,676 | 10.7 | 4.05x | 12.3% | 43.2% | 42.7% | |
| Medical | 3 | 11,987,500 | 1.2 | 1.77x | 9.8% | 57.9% | 52.7% | |
| Subtotal: | 19 | $289,693,133 | 29.3% | 3.10x | 12.1% | 53.9% | 50.0% | |
| Multifamily | Garden | 27 | $160,624,472 | 16.3% | 1.90x | 8.9% | 66.4% | 60.8% |
| High Rise | 1 | 31,000,000 | 3.1 | 2.04x | 7.0% | 61.9% | 61.9% | |
| Low Rise | 3 | 16,500,000 | 1.7 | 1.95x | 7.8% | 61.9% | 61.9% | |
| Age Restricted | 1 | 15,080,000 | 1.5 | 2.19x | 8.1% | 60.3% | 60.3% | |
| Mid Rise | 2 | 11,500,000 | 1.2 | 1.85x | 8.7% | 67.5% | 62.3% | |
| Subtotal: | 34 | $234,704,472 | 23.8% | 1.94x | 8.5% | 65.1% | 61.1% | |
| Retail | Anchored | 6 | $53,294,067 | 5.4% | 2.38x | 12.0% | 57.6% | 50.6% |
| Super Regional Mall | 1 | 47,945,946 | 4.9 | 3.07x | 10.7% | 54.1% | 54.1% | |
| Single Tenant | 4 | 19,810,000 | 2.0 | 2.47x | 9.8% | 61.0% | 59.0% | |
| Unanchored | 5 | 17,498,763 | 1.8 | 1.81x | 9.7% | 63.6% | 54.5% | |
| Subtotal: | 16 | $138,548,776 | 14.0% | 2.56x | 11.0% | 57.6% | 53.5% | |
| Industrial | Flex | 18 | $85,435,000 | 8.6% | 2.62x | 9.9% | 60.3% | 58.2% |
| Manufacturing | 2 | 30,251,500 | 3.1 | 2.51x | 9.9% | 53.6% | 49.7% | |
| Warehouse | 2 | 3,344,212 | 0.3 | 1.54x | 11.2% | 53.1% | 38.8% | |
| Subtotal: | 22 | $119,030,712 | 12.0% | 2.56x | 9.9% | 58.4% | 55.5% | |
| Mixed Use | Retail / Industrial | 1 | $33,000,000 | 3.3% | 1.88x | 10.9% | 60.0% | 54.0% |
| Retail / Office | 2 | 30,380,000 | 3.1 | 2.45x | 12.4% | 52.4% | 44.1% | |
| Multifamily / Retail | 6 | 30,330,000 | 3.1 | 1.80x | 8.5% | 64.7% | 58.6% | |
| Multifamily / Retail / Office | 2 | 11,950,000 | 1.2 | 1.59x | 6.3% | 62.0% | 62.0% | |
| Retail / Multifamily | 4 | 10,725,000 | 1.1 | 1.84x | 7.6% | 59.5% | 59.5% | |
| Subtotal: | 15 | $116,385,000 | 11.8% | 1.98x | 9.9% | 59.4% | 53.9% | |
| Hospitality | Limited Service | 46 | $27,107,707 | 2.7% | 1.96x | 15.9% | 63.0% | 46.6% |
| Extended Stay | 1 | 9,274,780 | 0.9 | 2.46x | 16.2% | 66.7% | 54.5% | |
| Subtotal: | 47 | $36,382,487 | 3.7% | 2.09x | 16.0% | 64.0% | 48.6% | |
| Self Storage | 11 | $33,725,219 | 3.4% | 2.50x | 11.6% | 54.2% | 49.8% | |
| Manufactured Housing | 9 | $19,574,000 | 2.0% | 2.66x | 10.1% | 58.6% | 56.3% | |
| Total / Weighted Average: | 173 | $988,043,799 | 100.0% | 2.49x | 10.7% | 58.8% | 54.3% | |
| (1) | Because this table presents information relating to the mortgaged properties and not mortgage loans, the information for mortgage loans secured by more than one mortgaged property is based on allocated loan amounts. |
| (2) | In the case of Loan Nos. 1, 2, 6, 11, 15 and 21, the UW NCF DSCR, UW NOI Debt Yield, Cut-off Date LTV and Maturity Date LTV calculations include the related Pari Passu Companion Loan(s). In the case of Loan Nos. 1, 2 and 4, the UW NCF DSCR, UW NOI Debt Yield, Cut-off Date LTV and Maturity Date LTV calculations exclude the related Subordinate Companion Loans and/or mezzanine loans. |
| (3) | For the mortgage loans that are interest-only for the entire term and accrue interest on an Actual/360 basis, the Monthly Debt Service Amount ($) was calculated as 1/12th of the product of (i) the Original Balance ($), (ii) the Interest Rate % and (iii) 365/360. |
| (4) | In the case of Loan Nos. 14 and 15, the Cut-off Date LTV and the Maturity Date LTV are calculated by using an appraised value based on an as portfolio assumption or an as-complete assumption, respectively. Refer to “Description of the Mortgage Pool—Assessment of Property Value and Condition” and “—Appraised Value” in the Preliminary Prospectus for additional details. |
THE INFORMATION IN THIS STRUCTURAL AND COLLATERAL TERM SHEET IS NOT COMPLETE AND MAY BE AMENDED PRIOR TO THE TIME OF SALE. THIS TERM SHEET IS NOT AN OFFER TO SELL THESE SECURITIES AND IT IS NOT A SOLICITATION OF AN OFFER TO BUY THESE SECURITIES IN ANY JURISDICTION WHERE THE OFFER OR SALE IS NOT PERMITTED.
12
| Structural and Collateral Term Sheet | BBCMS 2021-C11 | |
| Collateral Characteristics | ||

| Mortgaged Properties by Location(1) |
Weighted Average | |||||||
State | Number of | Cut-off Date | % of IPB | UW NCF DSCR(2)(3) | UW NOI Debt Yield(2) | Cut-off Date LTV(2)(4) | Maturity Date LTV(2)(4) |
| New York | 25 | $257,243,153 | 26.0% | 3.01x | 10.3% | 53.6% | 52.6% |
| California | 20 | 85,963,633 | 8.7 | 2.56x | 10.5 | 56.8 | 52.2 |
| Georgia | 14 | 72,306,415 | 7.3 | 2.44x | 10.1 | 58.7 | 55.6 |
| Texas | 11 | 67,058,864 | 6.8 | 2.27x | 10.3 | 60.5 | 54.5 |
| New Jersey | 2 | 65,500,000 | 6.6 | 2.82x | 13.0 | 63.4 | 58.4 |
| Florida | 11 | 57,377,202 | 5.8 | 1.90x | 9.7 | 60.5 | 54.8 |
| Arizona | 7 | 51,120,973 | 5.2 | 3.09x | 11.8 | 51.0 | 49.5 |
| Michigan | 5 | 46,030,000 | 4.7 | 2.07x | 10.7 | 61.5 | 53.3 |
| Illinois | 11 | 45,035,000 | 4.6 | 1.98x | 10.1 | 67.7 | 60.5 |
| Pennsylvania | 7 | 43,170,248 | 4.4 | 1.76x | 10.0 | 64.5 | 55.5 |
| Connecticut | 2 | 34,930,000 | 3.5 | 2.18x | 7.6 | 67.7 | 67.7 |
| Wisconsin | 1 | 33,000,000 | 3.3 | 1.88x | 10.9 | 60.0 | 54.0 |
| Ohio | 5 | 27,264,154 | 2.8 | 1.92x | 10.2 | 61.1 | 51.2 |
| Maryland | 3 | 17,535,549 | 1.8 | 2.07x | 11.0 | 60.9 | 54.1 |
| Utah | 2 | 16,303,982 | 1.7 | 2.49x | 10.6 | 65.0 | 64.6 |
| New Mexico | 5 | 13,370,885 | 1.4 | 2.25x | 14.9 | 55.0 | 41.4 |
| Kansas | 6 | 9,108,118 | 0.9 | 3.30x | 13.8 | 58.4 | 55.0 |
| Puerto Rico | 1 | 6,870,000 | 0.7 | 2.24x | 8.9 | 68.7 | 68.7 |
| Missouri | 3 | 5,959,343 | 0.6 | 1.33x | 8.8 | 71.3 | 58.8 |
| Oklahoma | 2 | 5,882,431 | 0.6 | 1.48x | 9.5 | 67.5 | 61.0 |
| Alabama | 1 | 4,632,676 | 0.5 | 2.35x | 13.7 | 50.6 | 40.5 |
| Virginia | 3 | 4,386,366 | 0.4 | 2.47x | 16.9 | 57.9 | 47.1 |
| Wyoming | 6 | 3,896,378 | 0.4 | 1.69x | 14.7 | 64.5 | 46.7 |
| Tennessee | 2 | 2,662,224 | 0.3 | 1.57x | 12.0 | 55.7 | 40.6 |
| South Carolina | 1 | 2,626,723 | 0.3 | 1.43x | 9.0 | 55.9 | 44.9 |
| Washington | 1 | 2,346,268 | 0.2 | 5.56x | 29.1 | 18.9 | 14.5 |
| Nebraska | 4 | 2,208,113 | 0.2 | 1.69x | 14.7 | 64.5 | 46.7 |
| Montana | 2 | 795,087 | 0.1 | 1.69x | 14.7 | 64.5 | 46.7 |
| Iowa | 2 | 718,512 | 0.1 | 1.69x | 14.7 | 64.5 | 46.7 |
| Colorado | 2 | 686,059 | 0.1 | 2.31x | 13.8 | 51.5 | 40.9 |
| Nevada | 1 | 553,895 | 0.1 | 1.69x | 14.7 | 64.5 | 46.7 |
| Oregon | 1 | 537,087 | 0.1 | 1.69x | 14.7 | 64.5 | 46.7 |
| Louisiana | 1 | 389,634 | 0.0 | 1.69x | 14.7 | 64.5 | 46.7 |
| South Dakota | 1 | 292,189 | 0.0 | 1.69x | 14.7 | 64.5 | 46.7 |
| North Dakota | 1 | 203,197 | 0.0 | 1.69x | 14.7 | 64.5 | 46.7 |
| Minnesota | 1 | 79,441 | 0.0 | 1.69x | 14.7 | 64.5 | 46.7 |
| Total / Weighted Average: | 173 | $988,043,799 | 100.0% | 2.49x | 10.7% | 58.8% | 54.3% |
| (1) | Because this table presents information relating to the mortgaged properties and not mortgage loans, the information for mortgage loans secured by more than one mortgaged property is based on allocated loan amounts. |
| (2) | In the case of Loan Nos. 1, 2, 6, 11, 15 and 21, the UW NCF DSCR, UW NOI Debt Yield, Cut-off Date LTV and Maturity Date LTV calculations include the related Pari Passu Companion Loan(s). In the case of Loan Nos. 1, 2 and 4, the UW NCF DSCR, UW NOI Debt Yield, Cut-off Date LTV and Maturity Date LTV calculations exclude the related Subordinate Companion Loans and/or mezzanine loans. |
| (3) | For the mortgage loans that are interest-only for the entire term and accrue interest on an Actual/360 basis, the Monthly Debt Service Amount ($) was calculated as 1/12th of the product of (i) the Original Balance ($), (ii) the Interest Rate % and (iii) 365/360. |
| (4) | In the case of Loan Nos. 14 and 15, the Cut-off Date LTV and the Maturity Date LTV are calculated by using an appraised value based on an as portfolio assumption or an as-complete assumption, respectively. Refer to “Description of the Mortgage Pool—Assessment of Property Value and Condition” and “—Appraised Value” in the Preliminary Prospectus for additional details. |
THE INFORMATION IN THIS STRUCTURAL AND COLLATERAL TERM SHEET IS NOT COMPLETE AND MAY BE AMENDED PRIOR TO THE TIME OF SALE. THIS TERM SHEET IS NOT AN OFFER TO SELL THESE SECURITIES AND IT IS NOT A SOLICITATION OF AN OFFER TO BUY THESE SECURITIES IN ANY JURISDICTION WHERE THE OFFER OR SALE IS NOT PERMITTED.
13
| Structural and Collateral Term Sheet | BBCMS 2021-C11 | |
| Collateral Characteristics | ||
| Cut-off Date Principal Balance |
Weighted Average | |||||||||||
| Range of Cut-off Date Principal Balances | Number of Loans | Cut-off Date Principal Balance | % of IPB | Mortgage Rate | Remaining Loan Term | UW NCF DSCR(1)(2) | UW NOI DY(1) | Cut-off Date LTV(1)(3) | Maturity Date LTV(1)(3) | ||
| $2,070,000 | - | $4,999,999 | 35 | $119,727,563 | 12.1% | 3.86624% | 115 | 2.07x | 10.4% | 59.5% | 52.9% |
| $5,000,000 | - | $9,999,999 | 31 | 214,256,273 | 21.7% | 3.74707% | 117 | 2.22x | 10.6% | 61.2% | 54.8% |
| $10,000,000 | - | $19,999,999 | 15 | 216,427,518 | 21.9% | 3.67439% | 116 | 2.10x | 10.3% | 62.6% | 57.2% |
| $20,000,000 | - | $29,999,999 | 6 | 153,186,500 | 15.5% | 3.47826% | 115 | 2.42x | 10.0% | 58.8% | 55.3% |
| $30,000,000 | - | $39,999,999 | 5 | 166,500,000 | 16.9% | 3.39134% | 106 | 2.51x | 10.7% | 61.5% | 58.4% |
| $40,000,000 | - | $70,000,000 | 2 | 117,945,946 | 11.9% | 2.98245% | 90 | 4.14x | 12.4% | 42.6% | 42.6% |
| Total / Weighted Average: | 94 | $988,043,799 | 100.0% | 3.55269% | 111 | 2.49x | 10.7% | 58.8% | 54.3% | ||
| Mortgage Interest Rates |
Weighted Average | |||||||||||
| Range of Mortgage Interest Rates | Number of Loans | Cut-off Date Principal Balance | % of IPB | Mortgage Rate | Remaining Loan Term | UW NCF DSCR(1)(2) | UW NOI DY(1) | Cut-off Date LTV(1)(3) | Maturity Date LTV(1)(3) | ||
| 2.72467 | - | 3.24999 | 14 | $221,755,225 | 22.4% | 3.00369% | 104 | 3.80x | 12.3% | 45.8% | 44.9% |
| 3.25000 | - | 3.74999 | 34 | 487,749,167 | 49.4% | 3.50396% | 112 | 2.29x | 10.4% | 61.6% | 57.2% |
| 3.75000 | - | 3.99999 | 20 | 143,999,862 | 14.6% | 3.86054% | 117 | 1.83x | 8.5% | 64.5% | 60.1% |
| 4.00000 | - | 4.24999 | 15 | 78,760,108 | 8.0% | 4.12579% | 115 | 1.76x | 10.6% | 64.8% | 54.9% |
| 4.25000 | - | 4.49999 | 7 | 27,385,638 | 2.8% | 4.30913% | 119 | 1.50x | 9.6% | 63.5% | 55.0% |
| 4.50000 | - | 4.74999 | 2 | 6,903,988 | 0.7% | 4.57688% | 91 | 2.20x | 14.6% | 51.8% | 45.6% |
| 4.75000 | - | 5.01000 | 2 | 21,489,811 | 2.2% | 4.86756% | 101 | 1.65x | 14.0% | 63.7% | 46.8% |
| Total / Weighted Average: | 94 | $988,043,799 | 100.0% | 3.55269% | 111 | 2.49x | 10.7% | 58.8% | 54.3% | ||
| Original Term to Maturity in Months |
Weighted Average | |||||||||
| Original Term to Maturity in Months | Number of Loans | Cut-off Date Principal Balance | % of IPB | Mortgage Rate | Remaining Loan Term | UW NCF DSCR(1)(2) | UW NOI DY(1) | Cut-off Date LTV(1)(3) | Maturity Date LTV(1)(3) |
| 60 | 1 | $33,000,000 | 3.3% | 3.54540% | 56 | 3.73x | 14.8% | 58.7% | 58.7% |
| 84 | 4 | 99,031,500 | 10.0% | 2.91598% | 83 | 4.21x | 12.4% | 39.6% | 39.5% |
| 120 | 89 | 856,012,299 | 86.6% | 3.62663% | 117 | 2.24x | 10.3% | 61.0% | 55.9% |
| Total / Weighted Average: | 94 | $988,043,799 | 100.0% | 3.55269% | 111 | 2.49x | 10.7% | 58.8% | 54.3% |
| Remaining Term to Maturity in Months |
| Weighted Average | |||||||||||
| Range of Remaining Term to Maturity in Months | Number of Loans | Cut-off Date Principal Balance | % of IPB | Mortgage Rate | Remaining Loan Term | UW NCF DSCR(1)(2) | UW NOI DY(1) | Cut-off Date LTV(1)(3) | Maturity Date LTV(1)(3) | ||
| 56 | 1 | $33,000,000 | 3.3% | 3.54540% | 56 | 3.73x | 14.8% | 58.7% | 58.7% | ||
| 81 | - | 103 | 10 | 190,709,933 | 19.3% | 3.35072% | 91 | 3.50x | 12.7% | 48.6% | 45.6% |
| 112 | - | 115 | 7 | 50,357,828 | 5.1% | 3.96834% | 113 | 2.00x | 10.0% | 60.0% | 54.8% |
| 116 | - | 120 | 76 | 713,976,038 | 72.3% | 3.57766% | 119 | 2.19x | 10.0% | 61.4% | 56.4% |
| Total / Weighted Average: | 94 | $988,043,799 | 100.0% | 3.55269% | 111 | 2.49x | 10.7% | 58.8% | 54.3% | ||
| (1) | In the case of Loan Nos. 1, 2, 6, 11, 15 and 21, the UW NCF DSCR, UW NOI Debt Yield, Cut-off Date LTV and Maturity Date LTV calculations include the related Pari Passu Companion Loan(s). In the case of Loan Nos. 1, 2 and 4, the UW NCF DSCR, UW NOI Debt Yield, Cut-off Date LTV and Maturity Date LTV calculations exclude the related Subordinate Companion Loans and/or mezzanine loans. |
| (2) | For the mortgage loans that are interest-only for the entire term and accrue interest on an Actual/360 basis, the Monthly Debt Service Amount ($) was calculated as 1/12th of the product of (i) the Original Balance ($), (ii) the Interest Rate % and (iii) 365/360. |
| (3) | In the case of Loan Nos. 14 and 15, the Cut-off Date LTV and the Maturity Date LTV are calculated by using an appraised value based on an as portfolio assumption or an as-complete assumption, respectively. Refer to “Description of the Mortgage Pool—Assessment of Property Value and Condition” and “—Appraised Value” in the Preliminary Prospectus for additional details. |
THE INFORMATION IN THIS STRUCTURAL AND COLLATERAL TERM SHEET IS NOT COMPLETE AND MAY BE AMENDED PRIOR TO THE TIME OF SALE. THIS TERM SHEET IS NOT AN OFFER TO SELL THESE SECURITIES AND IT IS NOT A SOLICITATION OF AN OFFER TO BUY THESE SECURITIES IN ANY JURISDICTION WHERE THE OFFER OR SALE IS NOT PERMITTED.
14
| Structural and Collateral Term Sheet | BBCMS 2021-C11 | |
| Collateral Characteristics | ||
| Original Amortization Term in Months |
| Weighted Average | |||||||||
| Original Amortization Term in Months | Number of Loans | Cut-off Date Principal Balance | % of IPB | Mortgage Rate | Remaining Loan Term | UW NCF DSCR(1)(2) | UW NOI DY(1) | Cut-off Date LTV(1)(3) | Maturity Date LTV(1)(3) |
| Interest Only | 42 | $565,809,946 | 57.3% | 3.37018% | 107 | 2.96x | 10.2% | 56.0% | 56.0% |
| 270 | 1 | 19,130,750 | 1.9% | 4.85000% | 99 | 1.69x | 14.7% | 64.5% | 46.7% |
| 300 | 4 | 20,392,641 | 2.1% | 3.65237% | 115 | 2.03x | 13.6% | 52.8% | 38.0% |
| 360 | 47 | 382,710,462 | 38.7% | 3.75237% | 117 | 1.84x | 10.9% | 62.9% | 53.1% |
| Total / Weighted Average: | 94 | $988,043,799 | 100.0% | 3.55269% | 111 | 2.49x | 10.7% | 58.8% | 54.3% |
| Remaining Amortization Term in Months |
| Weighted Average | |||||||||||
| Range of Remaining Amortization Term in Months | Number of Loans | Cut-off Date Principal Balance | % of IPB | Mortgage Rate | Remaining Loan Term | UW NCF DSCR(1)(2) | UW NOI DY(1) | Cut-off Date LTV(1)(3) | Maturity Date LTV(1)(3) | ||
| Interest Only | 42 | $565,809,946 | 57.3% | 3.37018% | 107 | 2.96x | 10.2% | 56.0% | 56.0% | ||
| 249 | - | 299 | 5 | 39,523,392 | 4.0% | 4.23206% | 107 | 1.86x | 14.1% | 58.5% | 42.2% |
| 342 | - | 354 | 4 | 25,176,596 | 2.5% | 4.17179% | 108 | 2.33x | 14.7% | 58.2% | 47.4% |
| 356 | - | 360 | 43 | 357,533,865 | 36.2% | 3.72283% | 118 | 1.81x | 10.7% | 63.2% | 53.5% |
| Total / Weighted Average: | 94 | $988,043,799 | 100.0% | 3.55269% | 111 | 2.49x | 10.7% | 58.8% | 54.3% | ||
| Amortization Types |
Weighted Average | |||||||||
| Amortization Types | Number of Loans | Cut-off Date Principal Balance | % of IPB | Mortgage Rate | Remaining Loan Term | UW NCF DSCR(1)(2) | UW NOI DY(1) | Cut-off Date LTV(1)(3) | Maturity Date LTV(1)(3) |
| Interest Only | 42 | $565,809,946 | 57.3% | 3.37018% | 107 | 2.96x | 10.2% | 56.0% | 56.0% |
| Interest Only, Amortizing Balloon | 30 | 272,662,000 | 27.6% | 3.68404% | 118 | 1.78x | 10.5% | 64.4% | 55.5% |
| Amortizing Balloon | 22 | 149,571,853 | 15.1% | 4.00367% | 114 | 1.96x | 12.6% | 59.0% | 45.9% |
| Total / Weighted Average: | 94 | $988,043,799 | 100.0% | 3.55269% | 111 | 2.49x | 10.7% | 58.8% | 54.3% |
| Underwritten Net Cash Flow Debt Service Coverage Ratios(1)(2) |
| Weighted Average | |||||||||||
| Range of Underwritten Net Cash Flow Debt Service Coverage Ratios | Number of Loans | Cut-off Date Principal Balance | % of IPB | Mortgage Rate | Remaining Loan Term | UW NCF DSCR(1)(2) | UW NOI DY(1) | Cut-off Date LTV(1)(3) | Maturity Date LTV(1)(3) | ||
| 1.25x | - | 1.59x | 20 | $98,517,590 | 10.0% | 4.07090% | 118 | 1.45x | 8.5% | 66.4% | 56.5% |
| 1.60x | - | 1.69x | 6 | 58,263,264 | 5.9% | 4.17436% | 112 | 1.67x | 10.2% | 67.1% | 58.7% |
| 1.70x | - | 1.79x | 10 | 76,577,702 | 7.8% | 3.82530% | 118 | 1.73x | 10.2% | 64.6% | 55.3% |
| 1.80x | - | 1.89x | 5 | 64,305,000 | 6.5% | 3.58117% | 118 | 1.86x | 10.6% | 60.2% | 53.6% |
| 1.90x | - | 1.99x | 5 | 82,350,000 | 8.3% | 3.63210% | 116 | 1.92x | 11.0% | 64.1% | 55.0% |
| 2.00x | - | 2.49x | 26 | 264,509,572 | 26.8% | 3.58186% | 117 | 2.16x | 9.6% | 60.7% | 57.3% |
| 2.50x | - | 2.99x | 10 | 122,743,457 | 12.4% | 3.31309% | 112 | 2.79x | 10.3% | 59.5% | 58.6% |
| 3.00x | - | 3.99x | 8 | 134,930,946 | 13.7% | 3.33733% | 96 | 3.47x | 12.5% | 53.6% | 53.6% |
| 4.00x | - | 5.56x | 4 | 85,846,268 | 8.7% | 2.78660% | 90 | 4.92x | 14.4% | 33.9% | 33.7% |
| Total / Weighted Average: | 94 | $988,043,799 | 100.0% | 3.55269% | 111 | 2.49x | 10.7% | 58.8% | 54.3% | ||
| (1) | In the case of Loan Nos. 1, 2, 6, 11, 15 and 21, the UW NCF DSCR, UW NOI Debt Yield, Cut-off Date LTV and Maturity Date LTV calculations include the related Pari Passu Companion Loan(s). In the case of Loan Nos. 1, 2 and 4, the UW NCF DSCR, UW NOI Debt Yield, Cut-off Date LTV and Maturity Date LTV calculations exclude the related Subordinate Companion Loans and/or mezzanine loans. |
| (2) | For the mortgage loans that are interest-only for the entire term and accrue interest on an Actual/360 basis, the Monthly Debt Service Amount ($) was calculated as 1/12th of the product of (i) the Original Balance ($), (ii) the Interest Rate % and (iii) 365/360. |
| (3) | In the case of Loan Nos. 14 and 15, the Cut-off Date LTV and the Maturity Date LTV are calculated by using an appraised value based on an as portfolio assumption or an as-complete assumption, respectively. Refer to “Description of the Mortgage Pool—Assessment of Property Value and Condition” and “—Appraised Value” in the Preliminary Prospectus for additional details. |
THE INFORMATION IN THIS STRUCTURAL AND COLLATERAL TERM SHEET IS NOT COMPLETE AND MAY BE AMENDED PRIOR TO THE TIME OF SALE. THIS TERM SHEET IS NOT AN OFFER TO SELL THESE SECURITIES AND IT IS NOT A SOLICITATION OF AN OFFER TO BUY THESE SECURITIES IN ANY JURISDICTION WHERE THE OFFER OR SALE IS NOT PERMITTED.
15
| Structural and Collateral Term Sheet | BBCMS 2021-C11 | |
| Collateral Characteristics | ||
| LTV Ratios as of the Cut-off Date(1)(3) |
| Weighted Average | |||||||||||
| Range of Cut-off Date LTVs | Number of Loans | Cut-off Date Principal Balance | % of IPB | Mortgage Rate | Remaining Loan Term | UW NCF DSCR(1)(2) | UW NOI DY(1) | Cut-off Date LTV(1)(3) | Maturity Date LTV(1)(3) | ||
| 18.9% | - | 49.9% | 12 | $166,655,225 | 16.9% | 2.98575% | 99 | 4.03x | 13.1% | 40.5% | 39.3% |
| 50.0% | - | 59.9% | 27 | 274,642,926 | 27.8% | 3.56134% | 107 | 2.60x | 11.3% | 56.2% | 52.5% |
| 60.0% | - | 64.9% | 22 | 255,487,165 | 25.9% | 3.79949% | 116 | 1.92x | 9.6% | 62.4% | 56.9% |
| 65.0% | - | 69.9% | 28 | 263,438,482 | 26.7% | 3.62042% | 117 | 2.04x | 9.7% | 67.9% | 62.7% |
| 70.0% | - | 73.4% | 5 | 27,820,000 | 2.8% | 3.95580% | 119 | 1.44x | 8.5% | 73.0% | 59.6% |
| Total / Weighted Average: | 94 | $988,043,799 | 100.0% | 3.55269% | 111 | 2.49x | 10.7% | 58.8% | 54.3% | ||
| LTV Ratios as of the Maturity Date/ARD(1)(3) |
Weighted Average | |||||||||||
| Range of Maturity Date/ARD LTVs | Number of Loans | Cut-off Date Principal Balance | % of IPB | Mortgage Rate | Remaining Loan Term | UW NCF DSCR(1)(2) | UW NOI DY(1) | Cut-off Date LTV(1)(3) | Maturity Date LTV(1)(3) | ||
| 14.5% | - | 49.9% | 29 | $295,064,883 | 29.9% | 3.41817% | 106 | 3.11x | 12.8% | 47.8% | 41.8% |
| 50.0% | - | 59.9% | 36 | 398,838,917 | 40.4% | 3.60127% | 110 | 2.30x | 10.7% | 62.0% | 56.2% |
| 60.0% | - | 64.9% | 18 | 169,920,000 | 17.2% | 3.67356% | 118 | 1.95x | 8.3% | 64.0% | 61.9% |
| 65.0% | - | 69.9% | 11 | 124,220,000 | 12.6% | 3.55092% | 118 | 2.32x | 8.5% | 67.4% | 67.4% |
| Total / Weighted Average: | 94 | $988,043,799 | 100.0% | 3.55269% | 111 | 2.49x | 10.7% | 58.8% | 54.3% | ||
| Prepayment Protection |
Weighted Average | |||||||||
| Prepayment Protection | Number of Loans | Cut-off Date Principal Balance | % of IPB | Mortgage Rate | Remaining Loan Term | UW NCF DSCR(1)(2) | UW NOI DY(1) | Cut-off Date LTV(1)(3) | Maturity Date LTV(1)(3) |
| Defeasance | 75 | $649,166,470 | 65.7% | 3.61499% | 117 | 2.18x | 10.1% | 61.6% | 56.6% |
| Yield Maintenance | 17 | 253,877,330 | 25.7% | 3.64199% | 104 | 2.58x | 11.3% | 57.7% | 53.2% |
| Defeasance or Yield Maintenance | 2 | 85,000,000 | 8.6% | 2.81023% | 89 | 4.54x | 12.9% | 40.2% | 40.2% |
| Total / Weighted Average: | 94 | $988,043,799 | 100.0% | 3.55269% | 111 | 2.49x | 10.7% | 58.8% | 54.3% |
| Loan Purpose |
Weighted Average | |||||||||
| Loan Purpose | Number of Loans | Cut-off Date Principal Balance | % of IPB | Mortgage Rate | Remaining Loan Term | UW NCF DSCR(1)(2) | UW NOI DY(1) | Cut-off Date LTV(1)(3) | Maturity Date LTV(1)(3) |
| Refinance | 57 | $599,501,214 | 60.7% | 3.49088% | 112 | 2.51x | 10.2% | 57.9% | 54.0% |
| Acquisition | 34 | 349,354,779 | 35.4% | 3.66345% | 108 | 2.52x | 11.5% | 59.4% | 54.8% |
| Recapitalization | 3 | 39,187,807 | 4.0% | 3.51093% | 117 | 1.84x | 11.0% | 66.1% | 55.1% |
| Total / Weighted Average: | 94 | $988,043,799 | 100.0% | 3.55269% | 111 | 2.49x | 10.7% | 58.8% | 54.3% |
| (1) | In the case of Loan Nos. 1, 2, 6, 11, 15 and 21, the UW NCF DSCR, UW NOI Debt Yield, Cut-off Date LTV and Maturity Date LTV calculations include the related Pari Passu Companion Loan(s). In the case of Loan Nos. 1, 2 and 4, the UW NCF DSCR, UW NOI Debt Yield, Cut-off Date LTV and Maturity Date LTV calculations exclude the related Subordinate Companion Loans and/or mezzanine loans. |
| (2) | For the mortgage loans that are interest-only for the entire term and accrue interest on an Actual/360 basis, the Monthly Debt Service Amount ($) was calculated as 1/12th of the product of (i) the Original Balance ($), (ii) the Interest Rate % and (iii) 365/360. |
| (3) | In the case of Loan Nos. 14 and 15, the Cut-off Date LTV and the Maturity Date LTV are calculated by using an appraised value based on an as portfolio assumption or an as-complete assumption, respectively. Refer to “Description of the Mortgage Pool—Assessment of Property Value and Condition” and “—Appraised Value” in the Preliminary Prospectus for additional details. |
THE INFORMATION IN THIS STRUCTURAL AND COLLATERAL TERM SHEET IS NOT COMPLETE AND MAY BE AMENDED PRIOR TO THE TIME OF SALE. THIS TERM SHEET IS NOT AN OFFER TO SELL THESE SECURITIES AND IT IS NOT A SOLICITATION OF AN OFFER TO BUY THESE SECURITIES IN ANY JURISDICTION WHERE THE OFFER OR SALE IS NOT PERMITTED.
16
| Structural and Collateral Term Sheet | BBCMS 2021-C11 | |
| Collateral Characteristics | ||
Previous Securitization History(1) | |||||||
| No. | Mortgage Loan Seller | Loan Name | Location | Property Type | Cut-off Date Principal Balance | % of IPB | Previous Securitization |
| 3 | SGFC | Parkway Irvine | Irvine, CA | Industrial | $37,000,000 | 3.7% | WFRBS 2012-C7 |
| 5 | SGFC | Fleet Farm Mixed Use | Appleton, WI | Mixed Use | $33,000,000 | 3.3% | CSMC 2016-MFF |
| 12 | UBS AG | Murrieta Spectrum | Murrieta, CA | Mixed Use | $23,030,000 | 2.3% | COMM 2015-LC23 |
| 14.01 | LMF | Jefferson Heights | Watertown, NY | Multifamily | $6,500,000 | 0.7% | FREMF 2016-K53 |
| 14.04 | LMF | Solar Building | Watertown, NY | Mixed Use | $2,300,000 | 0.2% | FREMF 2016-K53 |
| 18 | Barclays | Cumberland Marketplace | Mechanicsburg, PA | Retail | $16,263,000 | 1.6% | UBSCM 2012-C1 |
| 20 | Barclays | Attiva - Park Fort Worth, TX | Fort Worth, TX | Multifamily | $15,080,000 | 1.5% | FREMF 2018-KF55 |
| 23 | UBS AG | Chandler Business Center | Chandler, AZ | Industrial | $12,580,000 | 1.3% | A10 2015-1 |
| 94 | Sabal | Houston Self Storage | Houston, TX | Self Storage | $2,070,000 | 0.2% | BBCMS 2017-C1 |
| (1) | The table above represents the properties for which the previously existing debt was most recently securitized, based on information provided by the related borrower or obtained through searches of a third-party database. |
THE INFORMATION IN THIS STRUCTURAL AND COLLATERAL TERM SHEET IS NOT COMPLETE AND MAY BE AMENDED PRIOR TO THE TIME OF SALE. THIS TERM SHEET IS NOT AN OFFER TO SELL THESE SECURITIES AND IT IS NOT A SOLICITATION OF AN OFFER TO BUY THESE SECURITIES IN ANY JURISDICTION WHERE THE OFFER OR SALE IS NOT PERMITTED.
17
| Structural and Collateral Term Sheet | BBCMS 2021-C11 | |
| Class A-2(1) | ||
No. | Loan Name | Location | Cut-off Date | % of | Maturity | % of | Original | Remaining | UW | UW NOI | Cut-off | Maturity |
| 4 | Broadacres Office Park | Bloomfield, NJ | $33,000,000 | 3.3% | $33,000,000 | 100.0% | 60 | 56 | 3.73x | 14.8% | 58.7% | 58.7% |
| Total / Weighted Average: | $33,000,000 | 3.3% | $33,000,000 | 100.0% | 60 | 56 | 3.73x | 14.8% | 58.7% | 58.7% | ||
| (1) | The table above presents the mortgage loans whose balloon payment would be applied to pay down the certificate balance of the Class A-2 Certificates, assuming a 0% CPR and applying the “Modeling Assumptions” described in the Preliminary Prospectus, including the assumptions that (i) none of the mortgage loans in the pool experience prepayments, defaults or losses; (ii) there are no extensions of maturity dates of any mortgage loans in the pool; and (iii) each mortgage loan in the pool is paid in full on its stated maturity date or the anticipated repayment date. Each Class of Certificates, including the Class A-2 Certificates, evidences undivided ownership interests in the entire pool of mortgage loans. Debt service coverage ratio, debt yield and loan-to-value ratio information does not take into account subordinate debt (whether or not secured by the mortgaged property), if any, that is allowed under the terms of any mortgage loan. See Annex A-1 to the Preliminary Prospectus. |
| (2) | Reflects the percentage equal to the Maturity Date Balance divided by the initial Class A-2 Certificate Balance. |
THE INFORMATION IN THIS STRUCTURAL AND COLLATERAL TERM SHEET IS NOT COMPLETE AND MAY BE AMENDED PRIOR TO THE TIME OF SALE. THIS TERM SHEET IS NOT AN OFFER TO SELL THESE SECURITIES AND IT IS NOT A SOLICITATION OF AN OFFER TO BUY THESE SECURITIES IN ANY JURISDICTION WHERE THE OFFER OR SALE IS NOT PERMITTED.
18
| Structural and Collateral Term Sheet | BBCMS 2021-C11 | |
| Class A-3(1) | ||
No. | Loan Name | Location | Cut-off Date | % of | Maturity | % of | Original | Remaining | UW | UW NOI | Cut-off | Maturity Date |
| 1 | One SoHo Square | New York, NY | $70,000,000 | 7.1% | $70,000,000 | 70.9% | 84 | 83 | 4.88x | 13.6% | 34.8% | 34.8% |
| 13 | Merit Medical Systems | Houston, TX | 20,751,500 | 2.1% | 20,751,500 | 21.0% | 84 | 84 | 2.86x | 9.5% | 49.6% | 49.6% |
| 68 | Anytime Self-Storage Arizona Portfolio | Various, AZ | 4,250,000 | 0.4% | 3,889,568 | 3.9% | 84 | 84 | 1.91x | 11.9% | 46.5% | 42.6% |
| 72 | 376 Larkfield Road | East Northport, NY | 4,030,000 | 0.4% | 4,030,000 | 4.1% | 84 | 81 | 2.03x | 8.2% | 65.0% | 65.0% |
| Total / Weighted Average: | $99,031,500 | 10.0% | $98,671,068 | 100.0% | 84 | 83 | 4.21x | 12.4% | 39.6% | 39.5% | ||
| (1) | The table above presents the mortgage loans whose balloon payment would be applied to pay down the certificate balance of the Class A-3 Certificates, assuming a 0% CPR and applying the “Modeling Assumptions” described in the Preliminary Prospectus, including the assumptions that (i) none of the mortgage loans in the pool experience prepayments, defaults or losses; (ii) there are no extensions of maturity dates of any mortgage loans in the pool; and (iii) each mortgage loan in the pool is paid in full on its stated maturity date or the anticipated repayment date. Each Class of Certificates, including the Class A-3 Certificates, evidences undivided ownership interests in the entire pool of mortgage loans. Debt service coverage ratio, debt yield and loan-to-value ratio information does not take into account subordinate debt (whether or not secured by the mortgaged property), if any, that is allowed under the terms of any mortgage loan. See Annex A-1 to the Preliminary Prospectus. |
| (2) | Reflects the percentage equal to the Maturity Date Balance divided by the initial Class A-3 Certificate Balance. |
THE INFORMATION IN THIS STRUCTURAL AND COLLATERAL TERM SHEET IS NOT COMPLETE AND MAY BE AMENDED PRIOR TO THE TIME OF SALE. THIS TERM SHEET IS NOT AN OFFER TO SELL THESE SECURITIES AND IT IS NOT A SOLICITATION OF AN OFFER TO BUY THESE SECURITIES IN ANY JURISDICTION WHERE THE OFFER OR SALE IS NOT PERMITTED.
19
| Structural and Collateral Term Sheet | BBCMS 2021-C11 | |
| Structural Overview | ||
| ■ Assets: | The Class A-1, Class A-2, Class A-SB, Class A-3, Class A-4, Class A-5, Class X-A, Class X-B, Class X-D, Class X-F, Class X-G, Class A-S, Class B, Class C, Class D, Class E, Class F, Class G, Class H-RR, Class J-RR and Class R Certificates (collectively, the “Certificates”), will be entitled to distributions solely with respect to the mortgage loans. | |
| ■ Accrual: | Each Class of Certificates (other than Class R Certificates) will accrue interest on a 30/360 basis. The Class R Certificates will not accrue interest. | |
| ■ Distribution of Interest: | On each Distribution Date, accrued interest for each Class of Certificates (other than the Class R Certificates) at the applicable pass-through rate will be distributed in the following order of priority to the extent of available funds: first, to the Class A-1, Class A-2, Class A-SB, Class A-3, Class A-4, Class A-5, Class X-A, Class X-B, Class X-D, Class X-F and Class X-G Certificates (the “Senior Certificates”), on a pro rata basis, based on the interest entitlement for each such Class on such date, and then to the Class A-S, Class B, Class C, Class D, Class E, Class F, Class G, Class H-RR and Class J-RR Certificates, in that order, in each case until the interest entitlement for such date payable to each such Class is paid in full.
The pass-through rate applicable to each of the Class A-1, Class A-2, Class A-SB, Class A-3, Class A-4, Class A-5, Class A-S, Class B, Class C, Class D, Class E, Class F, Class G, Class H-RR and Class J-RR Certificates (collectively, the “Principal Balance Certificates”) on each Distribution Date, will be a per annum rate equal to one of (i) a fixed rate, (ii) the weighted average of the net mortgage rates on the mortgage loans (in each case adjusted, if necessary, to accrue on the basis of a 360-day year consisting of twelve 30-day months), (iii) the lesser of a specified fixed pass-through rate and the rate described in clause (ii) above or (iv) the rate described in clause (ii) above less a specified percentage.
The pass-through rate for the Class X-A Certificates for any Distribution Date will be a per annum rate equal to the excess, if any, of (a) the weighted average of the net mortgage rates on the mortgage loans (in each case adjusted, if necessary, to accrue on the basis of a 360-day year consisting of twelve 30-day months), over (b) the weighted average of the pass-through rates on the Class A-1, Class A-2, Class A-SB, Class A-3, Class A-4 and Class A-5 Certificates for the related Distribution Date, weighted on the basis of their respective Certificate Balances outstanding immediately prior to that Distribution Date.
The pass-through rate for the Class X-B Certificates for any Distribution Date will be a per annum rate equal to the excess, if any, of (a) the weighted average of the net mortgage rates on the mortgage loans (in each case adjusted, if necessary, to accrue on the basis of a 360-day year consisting of twelve 30-day months), over (b) the weighted average of the pass-through rates on the Class A-S, Class B and Class C Certificates for the related Distribution Date, weighted on the basis of their respective Certificate Balances outstanding immediately prior to that Distribution Date.
The pass-through rate for the Class X-D Certificates for any Distribution Date will be a per annum rate equal to the excess, if any, of (a) the weighted average of the net mortgage rates on the mortgage loans (in each case adjusted, if necessary, to accrue on the basis of a 360-day year consisting of twelve 30-day months), over (b) the weighted average of the pass-through rates on the Class D and Class E Certificates for the related Distribution Date, weighted on the basis of their respective Certificate Balances outstanding immediately prior to that Distribution Date.
The pass-through rate for the Class X-F Certificates for any Distribution Date will be a per annum rate equal to the excess, if any, of (a) the weighted average of the net mortgage rates on the mortgage loans (in each case adjusted, if necessary, to accrue on the basis of a 360-day year consisting of twelve 30-day months), over (b) the pass-through rate on the Class F Certificates for the related Distribution Date.
The pass-through rate for the Class X-G Certificates for any Distribution Date will be a per annum rate equal to the excess, if any, of (a) the weighted average of the net mortgage rates on the mortgage loans (in each case adjusted, if necessary, to accrue on the basis of a 360-day year consisting of twelve 30-day months), over (b) the pass-through rate on the Class G Certificates for the related Distribution Date.
See “Description of the Certificates—Distributions” in the Preliminary Prospectus.
| |
■ Distribution of Principal:
| On any Distribution Date prior to the Cross-Over Date, the payments in respect of principal of the Certificates will be distributed:
|
THE INFORMATION IN THIS STRUCTURAL AND COLLATERAL TERM SHEET IS NOT COMPLETE AND MAY BE AMENDED PRIOR TO THE TIME OF SALE. THIS TERM SHEET IS NOT AN OFFER TO SELL THESE SECURITIES AND IT IS NOT A SOLICITATION OF AN OFFER TO BUY THESE SECURITIES IN ANY JURISDICTION WHERE THE OFFER OR SALE IS NOT PERMITTED.
20
| Structural and Collateral Term Sheet | BBCMS 2021-C11 | |
| Structural Overview | ||
first, to the Class A-SB Certificates until the Certificate Balance of the Class A-SB Certificates is reduced to the Class A-SB planned principal balance for the related Distribution Date set forth in Annex E to the Preliminary Prospectus, second, to the Class A-1 Certificates, until the Certificate Balance of such Class is reduced to zero, third, to the Class A-2 Certificates, until the Certificate Balance of such Class is reduced to zero, fourth, to the Class A-3 Certificates, until the Certificate Balance of such Class is reduced to zero, fifth, to the Class A-4 Certificates, until the Certificate Balance of such Class is reduced to zero, sixth, to the Class A-5 Certificates, until the Certificate Balance of such Class is reduced to zero and seventh to the Class A-SB Certificates, until the Certificate Balance of such Class is reduced to zero and then to the Class A-S, Class B, Class C, Class D, Class E, Class F, Class G, Class H-RR and Class J-RR Certificates, in that order, until the Certificate Balance of each such Class is reduced to zero.
On any Distribution Date on or after the Cross-Over Date, the payments in respect of principal of the Certificates will be distributed to the Class A-1, Class A-2, Class A-SB, Class A-3, Class A-4 and Class A-5 Certificates, pro rata based on the Certificate Balance of each such Class until the Certificate Balance of each such Class is reduced to zero.
The “Cross-Over Date” means the Distribution Date on which the aggregate Certificate Balances of the Class A-S, Class B, Class C, Class D, Class E, Class F, Class G, Class H-RR and Class J-RR Certificates have been reduced to zero as a result of the allocation of realized losses to such Classes.
The Class X-A, Class X-B, Class X-D, Class X-F and Class X-G Certificates (the “Class X Certificates”) will not be entitled to receive distributions of principal; however, the notional amount of the Class X-A Certificates will be reduced by the aggregate amount of principal distributions, realized losses and trust fund expenses, if any, allocated to the Class A-1, Class A-2, Class A-SB, Class A-3, Class A-4 and Class A-5 Certificates, the notional amount of the Class X-B Certificates will be reduced by the aggregate amount of principal distributions, realized losses and trust fund expenses, if any, allocated to the Class A-S, Class B and Class C Certificates, the notional amount of the Class X-D Certificates will be reduced by the aggregate amount of principal distributions, realized losses and trust fund expenses, if any, allocated to the Class D and the Class E Certificates, the notional amount of the Class X-F Certificates will be reduced by the amount of principal distributions, realized losses and trust fund expenses, if any, allocated to the Class F Certificates and the notional amount of the Class X-G Certificates will be reduced by the amount of principal distributions, realized losses and trust fund expenses, if any, allocated to the Class G Certificates.
| ||
| ■ Yield Maintenance / Fixed Penalty Allocation: | If any yield maintenance charge or prepayment premium is collected during any particular collection period with respect to any mortgage loan, then on the Distribution Date corresponding to that collection period, the Certificate Administrator will pay that yield maintenance charge or prepayment premium (net of liquidation fees or workout fees payable therefrom) in the following manner: (1) to each of the Class A-1, Class A-2, Class A-SB, Class A-3, Class A-4, Class A-5, Class A-S, Class B, Class C, Class D and Class E Certificates, the product of (a) the yield maintenance charge or prepayment premium, (b) the related Base Interest Fraction (as defined in the Preliminary Prospectus) for such Class, and (c) a fraction, the numerator of which is equal to the amount of principal distributed to such Class for that Distribution Date, and the denominator of which is the total amount of principal distributed to all Principal Balance Certificates for that Distribution Date, (2) to the Class X-A Certificates, the excess, if any, of (a) the product of (i) the yield maintenance charge or prepayment premium and (ii) a fraction, the numerator of which is equal to the amount of principal distributed to the Class A-1, Class A-2, Class A-SB, Class A-3, Class A-4 and Class A-5 Certificates for that Distribution Date, and the denominator of which is the total amount of principal distributed to all Principal Balance Certificates for that Distribution Date, over (b) the amount of such yield maintenance charge or prepayment premium distributed to the Class A-1, Class A-2, Class A-SB, Class A-3, Class A-4 and Class A-5 Certificates as described above, (3) to the Class X-B Certificates, the excess, if any, of (a) the product of (i) the yield maintenance charge or prepayment premium and (ii) a fraction, the numerator of which is equal to the amount of principal distributed to the Class A-S, Class B and Class C Certificates for that Distribution Date, and the denominator of which is the total amount of principal distributed to all Principal Balance Certificates for that Distribution Date, over (b) the amount of such yield maintenance charge or prepayment premium distributed to the Class A-S, Class B and Class C Certificates as described above and (4) to the Class X-D Certificates, any remaining portion of such yield maintenance charge or prepayment premium not distributed as described above. |
THE INFORMATION IN THIS STRUCTURAL AND COLLATERAL TERM SHEET IS NOT COMPLETE AND MAY BE AMENDED PRIOR TO THE TIME OF SALE. THIS TERM SHEET IS NOT AN OFFER TO SELL THESE SECURITIES AND IT IS NOT A SOLICITATION OF AN OFFER TO BUY THESE SECURITIES IN ANY JURISDICTION WHERE THE OFFER OR SALE IS NOT PERMITTED.
21
| Structural and Collateral Term Sheet | BBCMS 2021-C11 | |
| Structural Overview | ||
No yield maintenance charges will be distributed to the Class X-F, Class X-G, Class F, Class G, Class H-RR, Class J-RR or Class R Certificates.
| ||
| ■ Realized Losses: | On each Distribution Date, the losses on the mortgage loans will be allocated first to the Class J-RR, Class H-RR, Class G, Class F, Class E, Class D, Class C, Class B and Class A-S Certificates, in that order, in each case until the Certificate Balance of all such Classes have been reduced to zero, and then, to the Class A-1, Class A-2, Class A-SB, Class A-3, Class A-4 and Class A-5 Certificates, pro rata, based on the Certificate Balance of each such Class, until the Certificate Balance of each such Class has been reduced to zero. The notional amounts of the Class X-A, Class X-B, Class X-D, Class X-F and Class X-G Certificates will be reduced by the aggregate amount of realized losses allocated to Certificates that are components of the notional amounts of the Class X-A, Class X-B, Class X-D, Class X-F and Class X-G Certificates, respectively.
Losses on each pari passu Whole Loan will be allocated, pro rata, between the related mortgage loan and the related Pari Passu Companion Loan(s), based upon their respective principal balances and with respect to any Whole Loan with one or more subordinate companion loans, first to the related Subordinate Companion Loan(s) until their principal balances have been reduced to zero and then to the related mortgage loan and any related Pari Passu Companion loans (if any), pro rata, based on their respective principal balances.
| |
| ■ Interest Shortfalls: | A shortfall with respect to the amount of available funds distributable in respect of interest can result from, among other sources: (a) delinquencies and defaults by borrowers; (b) shortfalls resulting from the application of appraisal reductions to reduce P&I Advances; (c) shortfalls resulting from the payment of interest on Advances made by the Master Servicer, the Special Servicer or the Trustee; (d) shortfalls resulting from the payment of Special Servicing Fees and other additional compensation that the Special Servicer is entitled to receive; (e) shortfalls resulting from extraordinary expenses of the trust, including indemnification payments payable to the Depositor, the Master Servicer, the Special Servicer, the Certificate Administrator, the Trustee, the Operating Advisor and the Asset Representations Reviewer; (f) shortfalls resulting from a modification of a mortgage loan’s interest rate or principal balance; and (g) shortfalls resulting from other unanticipated or default-related expenses of the trust. Any such shortfalls that decrease the amount of available funds distributable in respect of interest to the Certificateholders will reduce distributions to the classes of Certificates (other than the Class R Certificates) beginning with those with the lowest payment priorities, in reverse sequential order. See “Description of the Certificates—Distributions—Priority of Distributions” in the Preliminary Prospectus. | |
| ■ Appraisal Reduction Amounts: | With respect to mortgage loans serviced under the Pooling and Servicing Agreement, upon the occurrence of certain trigger events with respect to a mortgage loan, which are generally tied to certain events of default under the related mortgage loan documents, the Special Servicer will be obligated to obtain an appraisal of the related mortgaged property and the Special Servicer will calculate the Appraisal Reduction Amount. The “Appraisal Reduction Amount” is generally the amount by which the current principal balance of the related mortgage loan or Serviced Whole Loan, plus outstanding advances, real estate taxes, unpaid servicing fees and certain similar amounts exceeds the sum of (a) 90% of the appraised value of the related mortgaged property and (b) the amount of any escrows, letters of credit and reserves and (c) all insurance and casualty proceeds and condemnation awards that are collateral for the related mortgage loan.
With respect to the Non-Serviced Whole Loans, any Appraisal Reduction Amount will be similarly determined pursuant to the related lead securitization trust and servicing agreement or pooling and servicing agreement, as applicable, under which the non-serviced whole loan is serviced.
In general, the Appraisal Reduction Amounts that are allocated to the mortgage loans are notionally allocated to reduce, in reverse sequential order, the Certificate Balance of each Class of Principal Balance Certificates (other than the Class A-1, Class A-2, Class A-SB, Class A-3, Class A-4 and Class A-5 Certificates) beginning with the Class J-RR Certificates for certain purposes, including certain voting rights and the determination of the controlling class. As a result of calculating one or more Appraisal Reduction Amounts (and, in the case of any Whole Loan, to the extent allocated in the related mortgage loan), the amount of any required P&I Advance will be reduced, which will have the effect of reducing the amount of interest available to the most subordinate Class of Certificates then-outstanding (i.e., first, to the Class J-RR Certificates; second, to the Class H-RR Certificates; third, to the Class G Certificates; fourth, to the Class F Certificates; fifth to the Class E Certificates; sixth to the Class D Certificates; seventh, to the Class
|
THE INFORMATION IN THIS STRUCTURAL AND COLLATERAL TERM SHEET IS NOT COMPLETE AND MAY BE AMENDED PRIOR TO THE TIME OF SALE. THIS TERM SHEET IS NOT AN OFFER TO SELL THESE SECURITIES AND IT IS NOT A SOLICITATION OF AN OFFER TO BUY THESE SECURITIES IN ANY JURISDICTION WHERE THE OFFER OR SALE IS NOT PERMITTED.
22
| Structural and Collateral Term Sheet | BBCMS 2021-C11 | |
| Structural Overview | ||
C Certificates; eighth, to the Class B Certificates; ninth, to the Class A-S Certificates; and finally, pro rata based on their respective interest entitlements, to the Senior Certificates).
With respect to each Serviced Whole Loan, the Appraisal Reduction Amount will be notionally allocated, pro rata, between the related mortgage loan and any related serviced pari passu companion loan(s), based upon their respective principal balances.
| ||
| ■ Master Servicer Advances: | The Master Servicer will be required to advance certain delinquent scheduled mortgage loan payments of principal and interest and certain property protection advances, in each case, to the extent the Master Servicer deems such advances to be recoverable. With respect to any Non-Serviced Whole Loan, the master servicer or trustee, as applicable, under the related lead securitization servicing agreement will have the primary obligation to make any required servicing advances with respect to such Non-Serviced Whole Loan. | |
| ■ Whole Loans: | Six mortgage loans are each evidenced by one mortgage loan and one or more companion loans (each a “Companion Loan” and collectively with the related mortgage loan, a “Whole Loan”), secured by the same mortgage(s) on the related mortgaged property(ies). Each such mortgage loan and its related Companion Loan(s) are subject to an intercreditor agreement. None of these Companion Loans will be part of the trust.
In the case of the Whole Loans, referred to as the “One SoHo Square Whole Loan”, the “Kings Plaza Whole Loan”, the “Morris Corporate Center Whole Loan”, the “356-362 E 148th Street Whole Loan”, the “Wyndham National Hotel Portfolio Whole Loan” and the “Rollins Portfolio Whole Loan”, one or more related Companion Loans are pari passu with the related mortgage loan (these Companion Loans are also referred to as the “Pari Passu Companion Loans”). In the case of the One SoHo Square Whole Loan, in addition to any related Pari Passu Companion Loans, one or more related Companion Loans are subordinate in right of payment to the related mortgage loan and the related Pari Passu Companion Loans (these Companion Loans are also referred to as the “Subordinate Companion Loans”).
The 356-362 E 148th Street Pari Passu Companion Loans are referred to as “Serviced Companion Loans”.
The 356-362 E 148th Street Whole Loan (the “Serviced Whole Loan”) will be serviced under the pooling and servicing agreement for the BBCMS 2021-C11 transaction (the “Pooling and Servicing Agreement”).
The One SoHo Square Whole Loan, the Kings Plaza Whole Loan, the Morris Corporate Center Whole Loan, the Wyndham National Hotel Portfolio Whole Loan and the Rollins Portfolio Whole Loan are each a “Non-Serviced Whole Loan” and collectively, the “Non-Serviced Whole Loans” and will be serviced under the related pooling and servicing agreement identified in the table titled “Non-Serviced Whole Loans” under “Summary of Terms—The Mortgage Pool” in the Preliminary Prospectus.
| |
| ■ Liquidated Loan Waterfall: | On liquidation of any mortgage loan, all net liquidation proceeds related to the mortgage loan will be applied (after reimbursement of advances and certain trust fund expenses) first, as a recovery of accrued interest, other than delinquent interest that was not advanced as a result of Appraisal Reduction Amounts, second, as a recovery of principal until all principal has been recovered, and then as a recovery of delinquent interest that was not advanced as a result of Appraisal Reduction Amounts. Please see “Description of the Certificates—Distributions—Application Priority of Mortgage Loan Collections or Whole Loan Collections” in the Preliminary Prospectus. | |
| ■ Sale of Defaulted Loans and REO Properties: | The Special Servicer is required to use reasonable efforts to solicit offers for any defaulted loan or REO property (other than the non-serviced mortgage loans) if the Special Servicer determines that no satisfactory arrangements can be made for collection of delinquent payments and a sale would be in the best economic interests of the certificateholders (or, in the case of any Serviced Whole Loan, the certificateholders and any holders of the related Serviced Companion Loans, as a collective whole, taking into account the pari passu nature of any related Serviced Companion Loan), on a net present value basis.
In the case of each non-serviced mortgage loan, under certain circumstances permitted under the related intercreditor agreement, to the extent that such non-serviced mortgage loan is not sold together with the related non-serviced companion loan by the special servicer for the related Non-Serviced Whole Loans, the Special Servicer will be entitled to sell ((i) with the consent of the Directing Certificateholder if no Control Termination Event has occurred and is continuing and (ii) after consulting on a non-binding basis with the Risk Retention Consultation Party, in each case, with respect to any mortgage loan other than an Excluded Loan) such non-serviced mortgage
|
THE INFORMATION IN THIS STRUCTURAL AND COLLATERAL TERM SHEET IS NOT COMPLETE AND MAY BE AMENDED PRIOR TO THE TIME OF SALE. THIS TERM SHEET IS NOT AN OFFER TO SELL THESE SECURITIES AND IT IS NOT A SOLICITATION OF AN OFFER TO BUY THESE SECURITIES IN ANY JURISDICTION WHERE THE OFFER OR SALE IS NOT PERMITTED.
23
| Structural and Collateral Term Sheet | BBCMS 2021-C11 | |
| Structural Overview | ||
loan if it determines in accordance with the servicing standard that such action would be in the best interests of the certificateholders.
The Special Servicer is generally required to accept the highest cash offer received from any person for any defaulted loan or REO property in an amount at least equal to par plus accrued interest plus all other outstanding amounts due under such mortgage loan and any outstanding expenses of the trust relating to such mortgage loan (the “Purchase Price”) except as described in the Preliminary Prospectus.
With respect to the Serviced Whole Loan, any such sale of the related defaulted loan is required to also include the related Pari Passu Companion Loans, if any, and the prices will be adjusted accordingly.
With respect to the mortgage loans that have mezzanine debt or permit mezzanine debt in the future, the mezzanine lenders may have the option to purchase the related mortgage loan after certain events of default under such mortgage loan.
The Directing Certificateholder will not have a right of first refusal to purchase a defaulted loan.
If the Special Servicer does not receive a cash offer at least equal to the Purchase Price, the Special Servicer may accept the first cash offer received from any person that is determined to be a fair price and will be required to take into account (in addition to the results of any appraisal, updated appraisal or narrative appraisal that it may have obtained pursuant to the Pooling and Servicing Agreement within the prior 9 months), among other factors, the period and amount of the occupancy level and physical condition of the related mortgaged property and the state of the local economy) for such defaulted loan or REO property, if the highest offeror is a person other than a party to the Pooling and Servicing Agreement, the Directing Certificateholder, the Risk Retention Consultation Party, any sponsor, any borrower, any manager of a mortgaged property, any independent contractor engaged by the Special Servicer, with respect to a defaulted whole loan, the depositor, Master Servicer, Special Servicer (or independent contractor engaged by the Special Servicer) or the trustee for the securitization of a Companion Loan and each holder of any related Companion Loan or mezzanine loan (but only with respect to the related mortgage loan), or any known affiliate of any such person (each, an “Interested Person”). If the highest offer is made by an Interested Person, the Trustee will determine (based upon the most recent appraisal or updated appraisal conducted in accordance with the terms of the Pooling and Servicing Agreement) whether the offer constitutes a fair price for the defaulted loan or REO property provided that no offer from an Interested Person will constitute a fair price unless (A) it is the highest offer received and (B) if the offer is less than the applicable Purchase Price, at least two other offers are received from independent third parties and the Trustee may conclusively rely on the opinion of an independent appraiser or other independent expert retained by the Trustee in connection with making such determination. Neither the Trustee nor any of its affiliates may make an offer for or purchase any specially serviced mortgage loan or REO property.
If the Special Servicer does not receive any offers that are at least equal to the Purchase Price, the Special Servicer is not required to accept the highest offer and may accept a lower offer for a defaulted loan or REO property if the Special Servicer determines in consultation with (i) the Directing Certificateholder (unless a Consultation Termination Event has occurred and is continuing) and (ii) each risk retention consultation party, in each case, other than with respect to any Excluded Loan, in accordance with the servicing standard (and subject to the requirements of any related intercreditor agreement), that a rejection of such offer would be in the best interests of the certificateholders and, with respect to any Serviced Whole Loan, the holder of the related Companion Loans, as a collective whole, as if such certificateholders and, if applicable, the related Companion Loan Holder(s) constituted a single lender), so long as such lower offer was not made by the Special Servicer or any of its affiliates. If title to any mortgaged property is acquired by the trust fund, the Special Servicer will be required to sell such mortgaged property prior to the close of the third calendar year beginning after the year of acquisition, unless (a) the IRS grants or has not denied an extension of time to sell such mortgaged property or (b) the Special Servicer, Trustee and the Certificate Administrator receive an opinion of independent counsel to the effect that the holding of the property by the trust longer than the above-referenced three-year period will not result in the imposition of a tax on any REMIC of the trust fund or cause any REMIC of the trust fund to fail to qualify as a REMIC.
The foregoing applies to mortgage loans serviced under the Pooling and Servicing Agreement. With respect to each Non-Serviced Whole Loan, if the special servicer under the applicable trust and servicing agreement or pooling and servicing agreement, as applicable, determines to sell the related Companion Loan(s) as described above, then the applicable special servicer will be required to sell the related non-serviced mortgage loan included in the BBCMS 2021-C11 Trust
|
THE INFORMATION IN THIS STRUCTURAL AND COLLATERAL TERM SHEET IS NOT COMPLETE AND MAY BE AMENDED PRIOR TO THE TIME OF SALE. THIS TERM SHEET IS NOT AN OFFER TO SELL THESE SECURITIES AND IT IS NOT A SOLICITATION OF AN OFFER TO BUY THESE SECURITIES IN ANY JURISDICTION WHERE THE OFFER OR SALE IS NOT PERMITTED.
24
| Structural and Collateral Term Sheet | BBCMS 2021-C11 | |
| Structural Overview | ||
| and the related Companion Loan(s), as a single loan. In connection with any such sale, the then-applicable special servicer will be required to follow procedures substantially similar to those set forth above. | ||
| ■ Control Eligible Certificates: | Class F, Class G, Class H-RR and Class J-RR Certificates. | |
| ■ Control Rights: | The Control Eligible Certificates will have certain control rights attached to them. The “Directing Certificateholder” will be with respect to each mortgage loan (other than any Excluded Loan), the Controlling Class Certificateholder (or its representative) selected by more than 50% of the Controlling Class Certificateholders by Certificate Balance, as determined by the certificate registrar from time to time; provided, however, that (1) absent that selection, (2) until a Directing Certificateholder is so selected or (3) upon receipt of a notice from a majority of the Controlling Class Certificateholders that a Directing Certificateholder is no longer designated, the Controlling Class Certificateholder that owns the largest aggregate Certificate Balance of the Controlling Class (or its representative) will be the Directing Certificateholder; provided, however, that in the case of this clause (3), in the event no one holder owns the largest aggregate Certificate Balance of the Controlling Class, then there will be no Directing Certificateholder until appointed in accordance with the terms of the Pooling and Servicing Agreement. With respect to any mortgage loan (other than any non-serviced mortgage loan or any Excluded Loan), unless a Control Termination Event has occurred and is continuing, the Directing Certificateholder will be entitled to direct the Special Servicer to take, or refrain from taking, certain actions with respect to such mortgage loan. Furthermore, the Directing Certificateholder will also have the right to receive notice and provide consent with respect to certain material actions that the Master Servicer and the Special Servicer plan on taking with respect to a mortgage loan (other than any non-serviced mortgage loan or any Excluded Loan). With respect to any mortgage loan that has or may in the future have mezzanine debt, pursuant to the related intercreditor agreement, the related mezzanine lender may have certain consent rights with respect to certain modifications related to such mortgage loan.
A “Borrower Party” means a borrower, a mortgagor, a manager of a mortgaged property, an Accelerated Mezzanine Loan Lender, any other person controlling or controlled by or under common control with such borrower, mortgagor, manager or Accelerated Mezzanine Loan Lender, as applicable, or any other person owning, directly or indirectly, 25% or more of the beneficial interests in such borrower, mortgagor, manager or Accelerated Mezzanine Loan Lender, as applicable. For purposes of this definition, “control” when used with respect to any specified person means the power to direct the management and policies of such person, directly or indirectly, whether through the ownership of voting securities, by contract or otherwise and the terms “controlling” and “controlled” have meanings correlative to the foregoing.
An “Accelerated Mezzanine Loan Lender” means a mezzanine lender under a mezzanine loan that has been accelerated or as to which foreclosure or enforcement proceedings have been commenced against the equity collateral pledged to secure such mezzanine loan.
An “Excluded Loan” means a mortgage loan or Whole Loan with respect to which, as of any date of determination, (a) with respect to the Directing Certificateholder or the holder of the majority of the controlling class is a Borrower Party or (b) with respect to the Risk Retention Consultation Party or the holder of the majority of the VRR Interest is a Borrower Party. As of the Closing Date, it is expected that there will be no Excluded Loans in this securitization.
With respect to the Serviced Whole Loan, direction, consent and consultation rights with respect to the related Whole Loan are subject to certain consultation rights of the holder of the related Pari Passu Companion Loans pursuant to the related intercreditor agreement.
With respect to any Non-Serviced Whole Loan, direction, consent and consultation rights with respect to the related Whole Loan will be exercised by the directing certificateholder or controlling class representative under the applicable trust and servicing agreement or pooling and servicing agreement (or, in the case of Non-Serviced Whole Loans with Subordinate Companion Loans, the holder of the related Subordinate Companion Loan), as applicable.
| |
| ■ Directing Certificateholder: | Sabal Strategic Opportunities Fund, L.P. or an affiliate is expected to be appointed as the initial directing certificateholder with respect to all serviced mortgage loans (other than any Excluded Loans). | |
| ■ Controlling Class: | The “Controlling Class” will be, as of any date of determination, the most subordinate Class of Control Eligible Certificates then outstanding that has an aggregate Certificate Balance, as notionally reduced by any Cumulative Appraisal Reduction Amounts allocable to such Class, equal to no less than 25% of the initial Certificate Balance for such Class. Each holder of a |
THE INFORMATION IN THIS STRUCTURAL AND COLLATERAL TERM SHEET IS NOT COMPLETE AND MAY BE AMENDED PRIOR TO THE TIME OF SALE. THIS TERM SHEET IS NOT AN OFFER TO SELL THESE SECURITIES AND IT IS NOT A SOLICITATION OF AN OFFER TO BUY THESE SECURITIES IN ANY JURISDICTION WHERE THE OFFER OR SALE IS NOT PERMITTED.
25
| Structural and Collateral Term Sheet | BBCMS 2021-C11 | |
| Structural Overview | ||
certificate of the Controlling Class is referred to herein as a “Controlling Class Certificateholder”.
The Controlling Class as of the Closing Date will be the Class J-RR Certificates; provided that if at any time the principal balances of the certificates other than the Control Eligible Certificates have been reduced to zero as a result of principal payments on the mortgage loans, then the Controlling Class will be the most subordinate Class of Control Eligible Certificates that has a certificate balance greater than zero without regard to any Appraisal Reduction Amounts.
| ||
| ■ Control Termination Event: | A “Control Termination Event” will occur when the Class F Certificates have a Certificate Balance (taking into account the application of any Cumulative Appraisal Reduction Amounts to notionally reduce the Certificate Balance of such class) of less than 25% of the initial Certificate Balance of that class; provided, that a Control Termination Event will not be deemed to be continuing in the event the Certificate Balances of all Classes of Principal Balance Certificates other than the Control Eligible Certificates have been reduced to zero.
The “Cumulative Appraisal Reduction Amount” as of any date of determination, is equal to the sum of (i) all Appraisal Reduction Amounts then in effect, and (ii) with respect to any AB Modified Loan, any Collateral Deficiency Amount then in effect.
An “AB Modified Loan” means any corrected loan (1) that became a corrected loan (which includes for purposes of this definition any non-serviced mortgage loan that became a “corrected loan” (or any term substantially similar thereto) pursuant to the trust and servicing agreement or pooling and servicing agreement, as applicable, governing such non-serviced mortgage loan) due to a modification thereto that resulted in the creation of an AB note structure (or similar structure) and as to which the new junior note(s) did not previously exist or the principal amount of the new junior note(s) was previously part of either an A note held by the issuing entity or the original unmodified mortgage loan and (2) as to which an Appraisal Reduction Amount is not in effect.
The “Collateral Deficiency Amount” means, with respect to any AB Modified Loan as of any date of determination, the excess of (i) the principal balance of such AB Modified Loan (taking into account the related junior note(s) and any pari passu notes included therein), over (ii) the sum of (in the case of a Whole Loan, solely to the extent allocable to the subject mortgage loan) (x) the most recent appraised value for the related mortgaged property or mortgaged properties, plus (y) solely to the extent not reflected or taken into account in such appraised value and to the extent on deposit with, or otherwise under the control of, the lender as of the date of such determination, any capital or additional collateral contributed by the related borrower at the time the mortgage loan became (and as part of the modification related to) such AB Modified Loan for the benefit of the related mortgaged property or mortgaged properties (provided, that in the case of a non-serviced mortgage loan, the amounts set forth in this clause (y) will be taken into account solely to the extent relevant information is received by the Special Servicer), plus (z) any other escrows or reserves (in addition to any amounts set forth in the immediately preceding clause (y)) held by the lender in respect of such AB Modified Loan as of the date of such determination.
Upon the occurrence and during the continuance of a Control Termination Event, the Controlling Class will no longer have any control rights. After the occurrence and during the continuance of a Control Termination Event, the Directing Certificateholder will relinquish its right to direct certain actions of the Special Servicer and will no longer have consent rights with respect to certain actions that the Master Servicer or the Special Servicer plan on taking with respect to a mortgage loan. Following the occurrence and during the continuance of a Control Termination Event, the Directing Certificateholder will retain consultation rights with the Special Servicer with respect to certain material actions that the Special Servicer plans on taking with respect to any mortgage loan other than an Excluded Loan. Such consultation rights will continue until the occurrence of a Consultation Termination Event.
Notwithstanding anything to the contrary in the definition of Appraisal Reduction Event, no event, circumstance or action that has occurred or will occur with respect to a COVID Modified Loan (other than an event described in clause (3), (4), (5) or (7) of the definition of “Appraisal Reduction Event” in the Preliminary Prospectus) or the entry into of a COVID Modification Agreement will constitute an Appraisal Reduction Event, but only if, and for so long as, the related borrower and each related obligor is in compliance with the terms of the related COVID Modification Agreement.
“COVID Emergency” means the national emergency concerning the novel coronavirus disease (COVID-19) outbreak declared by the President on March 13, 2020 under the National Emergencies Act (50 U.S.C. 1601 et seq.).
|
THE INFORMATION IN THIS STRUCTURAL AND COLLATERAL TERM SHEET IS NOT COMPLETE AND MAY BE AMENDED PRIOR TO THE TIME OF SALE. THIS TERM SHEET IS NOT AN OFFER TO SELL THESE SECURITIES AND IT IS NOT A SOLICITATION OF AN OFFER TO BUY THESE SECURITIES IN ANY JURISDICTION WHERE THE OFFER OR SALE IS NOT PERMITTED.
26
| Structural and Collateral Term Sheet | BBCMS 2021-C11 | |
| Structural Overview | ||
“COVID Modification” means a modification of, or forbearance or waiver in respect of, a Mortgage Loan that satisfies each of the following conditions: (i) prior to the modification or forbearance or waiver, the related borrower certified to the Special Servicer that it is seeking limited relief from the terms of the related Mortgage Loan documents because it is experiencing a financial hardship due, directly or indirectly, to the COVID Emergency; (ii) the related modification or forbearance or waiver provides for (a) the temporary forbearance, waiver or deferral with respect to payment obligations or operating covenants, (b) the temporary alternative use of funds on deposit in any reserve account or escrow account for any purpose other than the explicit purpose provided for in the related Mortgage Loan documents, or (c) such other modifications, forbearance or waiver that is related or incidental to clause (a) or clause (b) as may be reasonably determined by the special servicer in accordance with the servicing standard to address a financial hardship due, directly or indirectly, to the COVID Emergency; (iii) if a default or event of default existed under the Mortgage Loan prior to the modification or forbearance or waiver, the related COVID Modification Agreement provides that such default or event of default is cured or deemed no longer outstanding; provided the borrower complies with the terms of the COVID Modification Agreement; (iv) any COVID Modification Agreement (a) defers up to nine monthly debt service payments but no greater than nine monthly debt service payments in the aggregate with any other COVID Modification or COVID Modification Agreement with respect to such Mortgage Loan) under the Mortgage Loan, and (b) requires that any payments deferred in accordance with clause (ii)(a) above or reserve or escrow amounts used for alternate purposes in accordance with clause (ii)(b) above are repaid or restored in full within 21 months of the date of the first COVID Modification Agreement with respect to such Mortgage Loan; and (v) the related COVID Modification Agreement may (but will not be required to) provide that (a) the Mortgage Loan will be full recourse to the borrower (and that such recourse obligation is a guaranteed obligation under the related borrower sponsor guaranty) if the certification described in clause (i) is false or misleading, and/or (b) that a cash trap or sweep event will be deemed to have occurred under the terms of the Mortgage Loan documents.
“COVID Modification Agreement” means the agreement or agreements pursuant to which a COVID Modification is effected.
“COVID Modified Loan” means a serviced mortgage loan and, if applicable, any related Serviced Companion Loan, that is subject to a COVID Modification.
| ||
| ■ Consultation Termination Event: | A “Consultation Termination Event” will occur when there is no class of Control Eligible Certificates that has a then-outstanding Certificate Balance at least equal to 25% of the initial Certificate Balance of that class, in each case, without regard to the application of any Cumulative Appraisal Reduction Amounts; provided, that a Consultation Termination Event will not be deemed to be continuing in the event the Certificate Balances of all Classes of Principal Balance Certificates other than the Control Eligible Certificates have been reduced to zero.
Upon the occurrence of a Consultation Termination Event, there will be no Class of Certificates that will act as the Controlling Class and the Directing Certificateholder will have no rights under the Pooling and Servicing Agreement, other than those rights generally available to all Certificateholders.
| |
| ■ Risk Retention Consultation Party: | The Risk Retention Consultation Party will be the party selected by SSOF SCRE AIV, L.P. as the Retaining Sponsor. It is expected that there will be no initial Risk Retention Consultation Party appointed as of the Closing Date. | |
| ■ Appraised-Out Class: | A Class of Control Eligible Certificates that has been determined, as a result of Appraisal Reduction Amounts or Collateral Deficiency Amounts allocable to such Class, to no longer be the Controlling Class. | |
| ■ Remedies Available to Holders of an Appraised-Out Class: | Holders of the majority of any Class of Control Eligible Certificates that are determined at any date of determination to no longer be the Controlling Class as a result of Appraisal Reduction Amounts or Collateral Deficiency Amounts allocable to such class will have the right, at their sole expense, to require the Special Servicer to order a supplemental appraisal report from an MAI appraiser (selected by the Special Servicer) for any mortgage loan (or Serviced Whole Loan) that results in the Class becoming an Appraised-Out Class.
Upon receipt of that supplemental appraisal, the Special Servicer will be required to determine, in accordance with the Servicing Standard, whether, based on its assessment of the supplemental appraisal, any recalculation of the Appraisal Reduction Amount or Collateral Deficiency Amount is warranted, and if so warranted, and will be required to recalculate the Appraisal Reduction Amount or Collateral Deficiency Amount, as applicable, based on the supplemental appraisal and if required by such recalculation, the Appraised-Out Class will be
|
THE INFORMATION IN THIS STRUCTURAL AND COLLATERAL TERM SHEET IS NOT COMPLETE AND MAY BE AMENDED PRIOR TO THE TIME OF SALE. THIS TERM SHEET IS NOT AN OFFER TO SELL THESE SECURITIES AND IT IS NOT A SOLICITATION OF AN OFFER TO BUY THESE SECURITIES IN ANY JURISDICTION WHERE THE OFFER OR SALE IS NOT PERMITTED.
27
| Structural and Collateral Term Sheet | BBCMS 2021-C11 | |
| Structural Overview | ||
reinstated as the Controlling Class. The holders of an Appraised-Out Class requesting a supplemental appraisal are not permitted to exercise any control or consent rights of the Controlling Class until such time, if any, as the Class is reinstated as the Controlling Class.
| ||
| ■ Operating Advisor: | The Operating Advisor will initially be Park Bridge Lender Services LLC. The Operating Advisor will have certain review and consultation rights relating to the performance of the Special Servicer and with respect to its actions taken in connection with the resolution and/or liquidation of specially serviced loans. The Operating Advisor will generally be responsible for reviewing the Special Servicer’s operational practices with respect to the resolution and liquidation of specially serviced loans. In addition, after the occurrence and during the continuance of a Control Termination Event, the Operating Advisor will have certain consultation rights with respect to the specially serviced loans. The Operating Advisor will generally have no obligations or consultation rights under the Pooling and Servicing Agreement with respect to the Non-Serviced Whole Loans or any related REO Property.
However, Park Bridge Lender Services LLC is currently the operating advisor under the UBS 2019-C18 pooling and servicing agreement, and in such capacity, has certain obligations and consultation rights with respect to the UBS 2019-C18 pooling and servicing agreement, respectively, that are substantially similar to those of the Operating Advisor under the Pooling and Servicing Agreement.
With respect to each mortgage loan or Serviced Whole Loan (in each case, other than a non-serviced mortgage loan), the Operating Advisor will be responsible for:
• after the occurrence and during the continuance of a Control Termination Event, consulting (on a non-binding basis) with the Special Servicer with respect to each asset status report prepared by the Special Servicer and recommending proposed alternative courses of action.
• after the occurrence and during the continuance of a Control Termination Event, preparing an annual report addressing the Operating Advisor’s overall findings and determinations and setting forth its assessment of the Special Servicer’s performance of its duties under the Pooling and Servicing Agreement on an asset-level basis with respect to the resolution and/or liquidation of specially serviced loans that the Special Servicer is responsible for servicing under the Pooling and Servicing Agreement. The Operating Advisor’s annual report will be prepared on the basis of the Special Servicer’s performance of its duties as they relate to the resolution and liquidation of specially serviced loans, taking into account the Special Servicer’s specific duties under the Pooling and Servicing Agreement as well as the extent to which those duties were performed in accordance with the servicing standard, with reasonable consideration to (and as limited by) the Operating Advisor’s review of any of the items required to be reviewed by it pursuant to the Pooling and Servicing Agreement. Notwithstanding the foregoing, no annual report will be required from the operating advisor with respect to a Special Servicer if, during the prior calendar year, no final asset status report was prepared by the Special Servicer in connection with a specially serviced loan or REO Property. The annual report will be based on the Operating Advisor’s knowledge of the Special Servicer’s actions taken during the applicable calendar year with respect to the resolution or liquidation of specially serviced loans that the Special Servicer is responsible for servicing under the Pooling and Servicing Agreement, including knowledge obtained in connection with the Operating Advisor’s review of each asset status report prepared by the Special Servicer.
• prior to the occurrence and continuance of a Control Termination Event, the Special Servicer will forward any Appraisal Reduction Amount and net present value calculations used in the Special Servicer’s determination of what course of action to take in connection with the workout or liquidation of a specially serviced loan to the Operating Advisor after such calculations have been finalized. The Operating Advisor will be required to review such calculations (with respect to Appraisal Reduction Amounts, if the Special Servicer has calculated such amounts) but will not opine on or take any affirmative action with respect to such Appraisal Reduction Amount calculations and/or net present value calculations.
• after the occurrence and during the continuance of a Control Termination Event, recalculating and verifying, on a limited basis, the accuracy of mathematical calculations and the corresponding application of the non-discretionary portion of the applicable formulas utilized in connection with any Appraisal Reduction Amount (with
|
THE INFORMATION IN THIS STRUCTURAL AND COLLATERAL TERM SHEET IS NOT COMPLETE AND MAY BE AMENDED PRIOR TO THE TIME OF SALE. THIS TERM SHEET IS NOT AN OFFER TO SELL THESE SECURITIES AND IT IS NOT A SOLICITATION OF AN OFFER TO BUY THESE SECURITIES IN ANY JURISDICTION WHERE THE OFFER OR SALE IS NOT PERMITTED.
28
| Structural and Collateral Term Sheet | BBCMS 2021-C11 | |
| Structural Overview | ||
respect to Appraisal Reduction Amounts, if the Special Servicer has calculated such amounts) or net present value calculations performed by the Special Servicer. In the event the Operating Advisor does not agree with the mathematical calculations or the application of the non-discretionary portion of the applicable formulas required to be utilized for such calculation, the Operating Advisor and the Special Servicer will consult with each other in order to resolve any disagreement. If there is any disagreement with respect to such calculations that the Operating Advisor and the Special Servicer are unable to resolve, the Certificate Administrator will determine which calculation is to apply.
In addition, the Operating Advisor is required to promptly review all information available to Privileged Persons on the Certificate Administrator’s website related to specially serviced loans and certain information available to Privileged Persons on the Certificate Administrator’s website related to mortgage loans included on the monthly CREFC® servicer watch list report, each final asset status report delivered to the Operating Advisor by the Special Servicer and each assessment of compliance report and attestation report prepared by the Special Servicer in order to maintain its familiarity with the mortgage loans and the performance of the Special Servicer under the Pooling and Servicing Agreement.
After the occurrence and during the continuance of a Control Termination Event, the Operating Advisor will also consult with the Special Servicer in connection with certain major decisions and propose possible alternative courses of action.
In addition, after the occurrence of a Consultation Termination Event, if the Operating Advisor determines that the Special Servicer is not performing its duties as required under the Pooling and Servicing Agreement or is otherwise not acting in accordance with the servicing standard, the Operating Advisor will have the right to recommend the replacement of the Special Servicer and will submit its formal recommendation to the Trustee and the Certificate Administrator (along with its rationale, its proposed replacement special servicer and other relevant information justifying its recommendation).
The Operating Advisor’s recommendation to replace the Special Servicer must be confirmed by an affirmative vote of holders of Certificates evidencing at least a majority of the aggregate voting rights (taking into account the application of any Appraisal Reduction Amounts to notionally reduce the Certificate Balances of the Classes to which such Appraisal Reduction Amounts are allocable). In the event the holders of such Certificates elect to remove and replace the Special Servicer, the Certificate Administrator will be required to obtain a rating agency confirmation from each of the rating agencies at that time.
| ||
| ■ Replacement of Operating Advisor: | The Operating Advisor may be terminated or removed under certain circumstances and a replacement operating advisor appointed as described in the Preliminary Prospectus.
If a Consultation Termination Event has occurred and is continuing, the Operating Advisor may be removed and replaced without cause upon the affirmative direction of certificate owners holding at least 75% of the voting rights of all Certificates (taking into account the application of Cumulative Appraisal Reduction Amounts), following a proposal from certificate owners holding not less than 25% of the voting rights of all Certificates (taking into account the application of Cumulative Appraisal Reduction Amounts). The certificateholders who initiate a vote on a termination and replacement of the Operating Advisor without cause must cause S&P, Fitch and KBRA to confirm the then-current ratings of the certificates (or decline to review the matter) and cause the payment of the fees and expenses incurred in the replacement.
Any replacement operating advisor (or the personnel responsible for supervising the obligations of the replacement operating advisor) must be an entity (A) that is a special servicer or operating advisor on a commercial mortgage-backed securities transaction rated by S&P, Fitch and KBRA (including, in the case of the Operating Advisor, this transaction) but has not been special servicer or operating advisor on a transaction for which any of S&P, Fitch and KBRA has qualified, downgraded or withdrawn its rating or ratings of, one or more classes of certificates for such transaction publicly citing servicing concerns with the operating advisor in its capacity as special servicer or operating advisor on such commercial mortgage-backed securities transaction as the sole or a material factor in such rating action; (B) that can and will make the representations and warranties of the operating advisor set forth in the Pooling and Servicing Agreement; (C) that is not (and is not affiliated with) the Depositor, the Trustee, the Certificate Administrator, the Master Servicer, the Special Servicer, a Mortgage Loan Seller, the Directing Certificateholder, the Risk Retention Consultation Party, or a depositor, a trustee, a certificate administrator, a master
|
THE INFORMATION IN THIS STRUCTURAL AND COLLATERAL TERM SHEET IS NOT COMPLETE AND MAY BE AMENDED PRIOR TO THE TIME OF SALE. THIS TERM SHEET IS NOT AN OFFER TO SELL THESE SECURITIES AND IT IS NOT A SOLICITATION OF AN OFFER TO BUY THESE SECURITIES IN ANY JURISDICTION WHERE THE OFFER OR SALE IS NOT PERMITTED.
29
| Structural and Collateral Term Sheet | BBCMS 2021-C11 | |
| Structural Overview | ||
servicer or special servicer with respect to the securitization of a Companion Loan, or any of their respective affiliates (including Risk Retention Affiliates); (D) that has not been paid by any Special Servicer or successor special servicer any fees, compensation or other remuneration (x) in respect of its obligations under the Pooling and Servicing Agreement or (y) for the appointment or recommendation for replacement of a successor special servicer to become the Special Servicer and (E) that (x) has been regularly engaged in the business of analyzing and advising clients in commercial mortgage-backed securities matters and that has at least five years of experience in collateral analysis and loss projections and (y) has at least five years of experience in commercial real estate asset management and experience in the workout and management of distressed commercial real estate assets. Any Operating Advisor is prohibited from making an investment in any Class of Certificates in the Trust as described in the Preliminary Prospectus.
| ||
| ■ Asset Representations Reviewer: | The Asset Representations Reviewer will be required to review certain delinquent mortgage loans after a specified delinquency threshold has been exceeded and notification from the Certificate Administrator that the required percentage of Certificateholders have voted to direct a review of such delinquent mortgage loans. An “Asset Review Trigger” will occur when either (1) mortgage loans with an aggregate outstanding principal balance of 25.0% or more of the aggregate outstanding principal balance of all of the mortgage loans (including any REO Loans (or a portion of any REO Loan in the case of a Whole Loan)) held by the issuing entity as of the end of the applicable Collection Period are Delinquent Loans (2)(A) prior to and including the second anniversary of the Closing Date at least 10 mortgage loans are Delinquent Loans and the outstanding principal balance of such Delinquent Loans in the aggregate constitutes at least 15.0% of the aggregate outstanding principal balance of all of the mortgage loans (including any REO Loans (or a portion of any REO Loan in the case of a Whole Loan)) held by the issuing entity as of the end of the applicable Collection Period or (B) after the second anniversary of the Closing Date, at least 15 mortgage loans are Delinquent Loans and the outstanding principal balance of such Delinquent Loans in the aggregate constitutes at least 20.0% of the aggregate outstanding principal balance of all of the mortgage loans (including any REO Loans (or a portion of any REO Loan in the case of a Whole Loan)) held by the issuing entity as of the end of the applicable Collection Period.
Following the determination that an Asset Review Trigger has occurred, the Certificate Administrator will include in the Form 10-D relating to the distribution period in which the Asset Review Trigger occurred a description of the events that caused the Asset Review Trigger to occur. Once an Asset Review Trigger has occurred, Certificateholders evidencing not less than 5% of the Voting Rights may deliver to the Certificate Administrator a written direction requesting a vote on whether to commence an Asset Review within 90 days after the filing of the Form 10-D reporting the occurrence of the Asset Review Trigger (an “Asset Review Vote Election”). If directed by such Certificateholders, a vote of all Certificateholders will commence and an Asset Review will occur if more than a majority of Certificateholders voting (assuming Certificateholders representing a minimum of 5% of the Voting Rights respond) vote affirmatively within 150 days of the Asset Review Vote Election. If the vote does not come to pass within such 150-day period, then no further votes will occur unless and until (A) an additional mortgage loan becomes a Delinquent Loan after the expiration of such 150 day period, (B) an additional Asset Review Trigger occurs or an Asset Review Trigger is otherwise in effect, (C) Certificateholders representing 5% of the Voting Rights again elect to cause a vote of all the Certificateholders and (D) such vote has occurred within 150 after the election described in clause (C) above.
| |
| ■ Replacement of the Asset Representations Reviewer: | The Asset Representations Reviewer may be terminated and replaced without cause. Upon (i) the written direction of Certificateholders evidencing not less than 25% of the Voting Rights (without regard to the application of any Cumulative Appraisal Reduction Amounts) requesting a vote to terminate and replace the Asset Representations Reviewer with a proposed successor asset representations reviewer that is an Eligible Asset Representations Reviewer, and (ii) payment by such holders to the Certificate Administrator of the reasonable fees and expenses to be incurred by the Certificate Administrator in connection with administering such vote, the Certificate Administrator will promptly provide notice to all Certificateholders and the Asset Representations Reviewer of such request by posting such notice on its internet website, and by mailing to all Certificateholders and the Asset Representations Reviewer. Upon the written direction of Certificateholders evidencing at least 75% of a Certificateholder Quorum (without regard to the application of any Cumulative Appraisal Reduction Amounts), the Trustee will terminate all of the rights and obligations of the Asset Representations Reviewer under the Pooling and Servicing Agreement by written notice to the Asset Representations Reviewer, and the proposed successor asset representations reviewer will be appointed. |
THE INFORMATION IN THIS STRUCTURAL AND COLLATERAL TERM SHEET IS NOT COMPLETE AND MAY BE AMENDED PRIOR TO THE TIME OF SALE. THIS TERM SHEET IS NOT AN OFFER TO SELL THESE SECURITIES AND IT IS NOT A SOLICITATION OF AN OFFER TO BUY THESE SECURITIES IN ANY JURISDICTION WHERE THE OFFER OR SALE IS NOT PERMITTED.
30
| Structural and Collateral Term Sheet | BBCMS 2021-C11 | |
| Structural Overview | ||
| ■ Appointment and Replacement of Special Servicer: | The Directing Certificateholder will appoint the initial Special Servicer as of the Closing Date. Prior to the occurrence and continuance of a Control Termination Event, the Special Servicer may generally be replaced for cause at any time and without cause by the Directing Certificateholder.
If the Special Servicer obtains knowledge that it has become a Borrower Party with respect to any mortgage loan or Serviced Whole Loan (any such mortgage loan or Serviced Whole Loan, an “Excluded Special Servicer Loan”), the Special Servicer will be required to resign as Special Servicer of that Excluded Special Servicer Loan. Prior to the occurrence and continuance of a Control Termination Event, if the applicable Excluded Special Servicer Loan is not also an Excluded Loan as to the Directing Certificateholder or the holder of the majority of the Controlling Class, the Directing Certificateholder or the controlling class certificateholder on its behalf will be required to appoint (and may remove and replace with or without cause) a successor special servicer that is not a Borrower Party in accordance with the terms of the Pooling and Servicing Agreement (an “Excluded Special Servicer”) for the related Excluded Special Servicer Loan. After the occurrence and during the continuance of a Control Termination Event or if at any time the applicable Excluded Special Servicer Loan is also an Excluded Loan as to the Directing Certificateholder or the holder of the majority of the Controlling Class, the resigning Special Servicer will be required to use reasonable efforts to select the related Excluded Special Servicer.
Upon the occurrence and during the continuance of a Control Termination Event, the Directing Certificateholder will no longer have the right to replace the Special Servicer and such replacement will occur based on a vote of holders of all voting eligible Classes of Certificates as described below.
After the occurrence of a Consultation Termination Event, the Operating Advisor may also recommend the replacement of the Special Servicer as described in “Operating Advisor” above.
| |
| ■ Replacement of Special Servicer by Vote of Certificateholders: | After the occurrence and during the continuance of a Control Termination Event upon (a) the written direction of holders of Principal Balance Certificates evidencing not less than 25% of the Voting Rights of all Classes of Principal Balance Certificates (taking into account the application of any Cumulative Appraisal Reduction Amounts to notionally reduce the Certificate Balances of Classes to which such Cumulative Appraisal Reduction Amounts are allocable) of the Principal Balance Certificates requesting a vote to replace the Special Servicer with a replacement special servicer, (b) payment by such requesting holders to the Certificate Administrator of all reasonable fees and expenses to be incurred by the Certificate Administrator in connection with administering such vote and (c) delivery by such holders to the Certificate Administrator and the Trustee of written confirmations from each Rating Agency that the appointment of such replacement special servicer will not result in a downgrade, withdrawal or qualification of the Certificates (which confirmations will be obtained at the expense of such holders), the Certificate Administrator will be required to post such notice on its Internet website, and by mail conduct the solicitation of votes of all Certificates in such regard, which such vote must occur within 180 days of the posting of such notice. Upon the written direction of holders of Principal Balance Certificates evidencing at least 66-2/3% of a Certificateholder Quorum, the Trustee will immediately replace the Special Servicer with a qualified replacement special servicer designated by such holders of Certificates.
A “Certificateholder Quorum” means, in connection with any solicitation of votes in connection with the replacement of the Special Servicer or the Asset Representations Reviewer described above, the holders of Certificates evidencing at least 50% of the aggregate Voting Rights (taking into account the application of realized losses and, other than with respect to the termination of the Asset Representations Reviewer, the application of any Cumulative Appraisal Reduction Amounts to notionally reduce the Certificate Balance of the Certificates) of all Principal Balance Certificates on an aggregate basis.
With respect to the Serviced Whole Loan, the holders of the related Pari Passu Companion Loans, under certain circumstances following a servicer termination event with respect to the Special Servicer, will be entitled to direct the Trustee (and the Trustee will be required) to terminate the Special Servicer solely with respect to such Serviced Whole Loan. A replacement special servicer will be selected by the Trustee or, prior to a Control Termination Event, by the Directing Certificateholder; provided, however, that any successor special servicer appointed to replace the Special Servicer with respect to such Whole Loan can generally not be the person (or its affiliate) that was terminated at the direction of the holder of the related Pari Passu Companion Loan.
| |
| With respect to any Non-Serviced Whole Loan, the BBCMS 2021-C11 trust as holder of the related mortgage loan has similar termination rights in the event of a servicer termination event with respect to the special servicer under the applicable trust and servicing agreement or pooling |
THE INFORMATION IN THIS STRUCTURAL AND COLLATERAL TERM SHEET IS NOT COMPLETE AND MAY BE AMENDED PRIOR TO THE TIME OF SALE. THIS TERM SHEET IS NOT AN OFFER TO SELL THESE SECURITIES AND IT IS NOT A SOLICITATION OF AN OFFER TO BUY THESE SECURITIES IN ANY JURISDICTION WHERE THE OFFER OR SALE IS NOT PERMITTED.
31
| Structural and Collateral Term Sheet | BBCMS 2021-C11 | |
| Structural Overview | ||
| and servicing agreement, as applicable, as described above, which may be exercised by the Directing Certificateholder prior to the Control Termination Event. However, the successor special servicer will be selected pursuant to the applicable trust and servicing agreement or pooling and servicing agreement, as applicable, by the related directing holder prior to a control event under such trust and servicing agreement or pooling and servicing agreement, as applicable. The Master Servicer and Special Servicer are entitled to certain fees in connection with the servicing and administration of the mortgage loans as more fully described in “Pooling and Servicing Agreement—Servicing and Other Compensation and Payment of Expenses” in the Preliminary Prospectus. | ||
| ■ Dispute Resolution Provisions: | Each Mortgage Loan Seller will be subject to the dispute resolution provisions set forth in the Pooling and Servicing Agreement to the extent those provisions are triggered with respect to any mortgage loan sold to the Depositor by a Mortgage Loan Seller and such Mortgage Loan Seller will be obligated under the related mortgage loan purchase agreement to comply with all applicable provisions and to take part in any mediation or arbitration proceedings that may result.
Generally, in the event that a request to repurchase a mortgage loan (a “Repurchase Request”) is not “Resolved” (as defined below) within 180 days after the related Mortgage Loan Seller receives such Repurchase Request (a “Resolution Failure”), then the Enforcing Servicer (as defined below) will be required to send a notice to the “Initial Requesting Certificateholder” (if any) indicating the Enforcing Servicer’s intended course of action with respect to the Repurchase Request. If (a) the Enforcing Servicer’s intended course of action with respect to the Repurchase Request does not involve pursuing further action to exercise rights against the related Mortgage Loan Seller with respect to the Repurchase Request and the Initial Requesting Certificateholder, if any, or any other Certificateholder or Certificate Owner wishes to exercise its right to refer the matter to mediation (including nonbinding arbitration) or arbitration, or (b) the Enforcing Servicer’s intended course of action is to pursue further action to exercise rights against the related Mortgage Loan Seller with respect to the Repurchase Request but the Initial Requesting Certificateholder, if any, or any other Certificateholder or Certificate Owner does not agree with the dispute resolution method selected by the Enforcing Servicer, then the Initial Requesting Certificateholder, if any, or such other Certificateholder or Certificate Owner may deliver a written notice to the Enforcing Servicer indicating its intent to exercise its right to refer the matter to either mediation or arbitration.
The Enforcing Servicer will be required to consult with any Certificateholder or Certificate Owner that delivers a notice of its intent to exercise its dispute resolution rights (a “Requesting Certificateholder”) so that a Requesting Certificateholder may consider the views of the Enforcing Servicer as to the claims underlying the Repurchase Request and possible dispute resolution methods. If a Requesting Certificateholder elects to exercise its right to refer the matter to either mediation or arbitration, then it will become the party responsible for enforcing the Repurchase Request and must promptly submit the matter to mediation (including nonbinding arbitration) or arbitration. Failure to make an election to exercise that right or failure to begin the elected form of proceedings within the certain timeframe set forth in the Pooling and Servicing Agreement will generally waive the Certificateholders’ or Certificate Owners’ rights with respect to the related Repurchase Request.
The “Enforcing Servicer” will be the Special Servicer.
“Resolved” means, with respect to a Repurchase Request, (i) that the related Material Defect has been cured, (ii) the related mortgage loan has been repurchased in accordance with the related mortgage loan purchase agreement, (iii) a mortgage loan has been substituted for the related mortgage loan in accordance with the related mortgage loan purchase agreement, (iv) the applicable Mortgage Loan Seller makes a Loss of Value Payment (as defined in the Preliminary Prospectus), (v) a contractually binding agreement is entered into between the Enforcing Servicer, on behalf of the issuing entity, and the related Mortgage Loan Seller that settles the related Mortgage Loan Seller’s obligations under the related mortgage loan purchase agreement, or (vi) the related mortgage loan is no longer property of the issuing entity as a result of a sale or other disposition in accordance with the Pooling and Servicing Agreement.
|
THE INFORMATION IN THIS STRUCTURAL AND COLLATERAL TERM SHEET IS NOT COMPLETE AND MAY BE AMENDED PRIOR TO THE TIME OF SALE. THIS TERM SHEET IS NOT AN OFFER TO SELL THESE SECURITIES AND IT IS NOT A SOLICITATION OF AN OFFER TO BUY THESE SECURITIES IN ANY JURISDICTION WHERE THE OFFER OR SALE IS NOT PERMITTED.
32
| Structural and Collateral Term Sheet | BBCMS 2021-C11 | |
| Structural Overview | ||
| ■ Investor Communications: | The Certificate Administrator is required to include on any Form 10–D any request received from a Certificateholder to communicate with other Certificateholders related to Certificateholders exercising their rights under the terms of the Pooling and Servicing Agreement. Any Certificateholder wishing to communicate with other Certificateholders regarding the exercise of its rights under the terms of the Pooling and Servicing Agreement should deliver a written request signed by an authorized representative of the requesting investor to the Certificate Administrator at the address below:
9062 Old Annapolis Road Columbia, Maryland 21045 Attention: Corporate Trust Administration Group – BBCMS Mortgage Trust 2021-C11 With a copy to: trustadministrationgroup@wellsfargo.com
| |
| ■ Master Servicer and Special Servicer Compensation: | The Master Servicer is entitled to a fee (the “Servicing Fee”) payable monthly from interest received in respect of each mortgage loan, any related REO loan and any related Serviced Companion Loan that will accrue at the related servicing fee rate described in the Preliminary Prospectus. The Special Servicer is also entitled to a fee (the “Special Servicing Fee”) with respect to each specially serviced loan and REO loan (other than a non-serviced mortgage loan) at the special servicing fee rate described in the Preliminary Prospectus.
In addition to the Servicing Fee, Special Servicing Fee and certain other fees described below, the Master Servicer and Special Servicer are entitled to retain and share certain additional servicing compensation, including assumption application fees, assumption fees, defeasance fees and certain Excess Modification Fees and consent fees with respect to the mortgage loans. The Special Servicer may also be entitled to either a Workout Fee or Liquidation Fee, but not both, from recoveries in respect of any particular mortgage loan.
An “Excess Modification Fee” with respect to any mortgage loan (other than the non-serviced mortgage loans) or Serviced Whole Loan is the sum of (A) the excess, if any, of (i) any and all Modification Fees (other than fees collected with respect to a COVID Modification) with respect to a mortgage loan or Serviced Whole Loan, over (ii) all unpaid or unreimbursed additional expenses described in the Preliminary Prospectus (excluding Special Servicing Fees, Workout Fees and Liquidation Fees) outstanding with respect to the related mortgage loan or Serviced Whole Loan, and reimbursed from such Modification Fees and (B) expenses previously paid or reimbursed from Modification Fees as described in clause (A), which expenses have subsequently been recovered from the related borrower or otherwise.
With respect to the Master Servicer and Special Servicer, the Excess Modification Fees collected and earned by such servicer from the related borrower (taken in the aggregate with any other Excess Modification Fees collected and earned by such servicer from the related borrower within the prior 12 months of the collection of the current Excess Modification Fees) will be subject to a cap of 1.00% of the outstanding principal balance of the related mortgage loan or Serviced Whole Loan, as applicable, on the closing date of the related modification, extension, waiver or amendment. A “Modification Fee” with respect to any mortgage loan (other than the non-serviced mortgage loans) or Serviced Companion Loan is generally any fee with respect to a modification, extension, waiver or amendment of any mortgage loan and/or related Serviced Companion Loan (other than all assumption fees, assumption application fees, consent fees, defeasance fees, Special Servicing Fees, Liquidation Fees or Workout Fees).
A “Workout Fee” will generally be payable with respect to each corrected loan and will be calculated at a rate of 1.00% of payments of principal and interest on the respective mortgage loan for so long as it remains a corrected loan, subject to a maximum of $1,000,000 in the aggregate with respect to any particular corrected loan. After receipt by the Special Servicer of Workout Fees with respect to a corrected loan in an amount equal to $25,000, any Workout Fees in excess of such amount will be reduced by the Excess Modification Fee Amount; provided that in the event the Workout Fee, collected over the course of such workout calculated at the Workout Fee Rate is less than $25,000, then the Special Servicer will be entitled to an amount from the final payment on the related corrected loan (including any related Serviced Companion Loan) that would result in the total Workout Fees payable to the Special Servicer in respect of that corrected loan (including any related Serviced Companion Loan) equal to $25,000.
The “Excess Modification Fee Amount” for any corrected loan is an amount equal to the aggregate of any Excess Modification Fees paid by or on behalf of the related borrower with respect to the related mortgage loan (including the related Serviced Companion Loan) and received and retained by the Master Servicer or the Special Servicer, as applicable, as additional servicing compensation within the prior 12 months of the related modification, waiver, extension
|
THE INFORMATION IN THIS STRUCTURAL AND COLLATERAL TERM SHEET IS NOT COMPLETE AND MAY BE AMENDED PRIOR TO THE TIME OF SALE. THIS TERM SHEET IS NOT AN OFFER TO SELL THESE SECURITIES AND IT IS NOT A SOLICITATION OF AN OFFER TO BUY THESE SECURITIES IN ANY JURISDICTION WHERE THE OFFER OR SALE IS NOT PERMITTED.
33
| Structural and Collateral Term Sheet | BBCMS 2021-C11 | |
| Structural Overview | ||
or amendment resulting in the mortgage loan or REO loan being a corrected loan, but only to the extent those fees have not previously been deducted from a Workout Fee or Liquidation Fee.
A “Liquidation Fee” will generally be payable with respect to each specially serviced loan or REO property (except with respect to any non-serviced mortgage loan) as to which the Special Servicer obtains a full or partial recovery of the related asset). The Liquidation Fee for each specially serviced mortgage loan will be payable at a rate of 1.0% of the liquidation proceeds (exclusive of default interest) subject to a maximum of $1,000,000; provided, however, that no Liquidation Fee will be less than $25,000.
The Liquidation Fees will be reduced by the amount of any Excess Modification Fees received by the Special Servicer with respect to the related mortgage loan (including a Serviced Companion Loan) or REO property as additional compensation within the prior 12 months, but only to the extent those fees have not previously been deducted from a Workout Fee or Liquidation Fee.
Similar fees to those described above will be payable to the applicable special servicer for the Non-Serviced Whole Loans under the related trust and servicing agreement or pooling and servicing agreement, as applicable.
Subject to certain limited exceptions, in connection with its duties under the Pooling and Servicing Agreement, the Special Servicer and its affiliates are prohibited from receiving or retaining any compensation (other than compensation specifically provided for under the Pooling and Servicing Agreement) from anyone in connection with the disposition, workout or foreclosure of any mortgage loan, the management or disposition of any REO property, or the performance of any other special servicing duties under the Pooling and Servicing Agreement. In the event the Special Servicer does receive any such compensation, it will be required to disclose those fees to the Certificate Administrator who will include it as part of the statement to Certificateholders.
In addition, no Liquidation Fee will be payable to the Special Servicer if a mortgage loan or Serviced Whole Loan becomes a specially serviced loan only because of a maturity default and the related liquidation proceeds are received within 90 days following the related maturity date as a result of the related mortgage loan or Serviced Whole Loan being refinanced or otherwise repaid in full.
| ||
| ■ Deal Website: | The Certificate Administrator will maintain a deal website to which certain persons will have access to certain information including, but not limited to the following, which will be posted:
▪ special notices, ▪ summaries of any final asset status reports, ▪ appraisals in connection with Appraisal Reductions plus any second appraisals ordered, ▪ an “Investor Q&A Forum,” ▪ a voluntary investor registry, and ▪ SEC EDGAR filings. |
THE INFORMATION IN THIS STRUCTURAL AND COLLATERAL TERM SHEET IS NOT COMPLETE AND MAY BE AMENDED PRIOR TO THE TIME OF SALE. THIS TERM SHEET IS NOT AN OFFER TO SELL THESE SECURITIES AND IT IS NOT A SOLICITATION OF AN OFFER TO BUY THESE SECURITIES IN ANY JURISDICTION WHERE THE OFFER OR SALE IS NOT PERMITTED.
34
(THIS PAGE INTENTIONALLY LEFT BLANK)
THE INFORMATION IN THIS STRUCTURAL AND COLLATERAL TERM SHEET IS NOT COMPLETE AND MAY BE AMENDED PRIOR TO THE TIME OF SALE. THIS TERM SHEET IS NOT AN OFFER TO SELL THESE SECURITIES AND IT IS NOT A SOLICITATION OF AN OFFER TO BUY THESE SECURITIES IN ANY JURISDICTION WHERE THE OFFER OR SALE IS NOT PERMITTED.
35
| Structural and Collateral Term Sheet | BBCMS 2021-C11 | |
| No. 1 – One SoHo Square | ||

THE INFORMATION IN THIS STRUCTURAL AND COLLATERAL TERM SHEET IS NOT COMPLETE AND MAY BE AMENDED PRIOR TO THE TIME OF SALE. THIS TERM SHEET IS NOT AN OFFER TO SELL THESE SECURITIES AND IT IS NOT A SOLICITATION OF AN OFFER TO BUY THESE SECURITIES IN ANY JURISDICTION WHERE THE OFFER OR SALE IS NOT PERMITTED.
36
| Structural and Collateral Term Sheet | BBCMS 2021-C11 | |
| No. 1 – One SoHo Square | ||

THE INFORMATION IN THIS STRUCTURAL AND COLLATERAL TERM SHEET IS NOT COMPLETE AND MAY BE AMENDED PRIOR TO THE TIME OF SALE. THIS TERM SHEET IS NOT AN OFFER TO SELL THESE SECURITIES AND IT IS NOT A SOLICITATION OF AN OFFER TO BUY THESE SECURITIES IN ANY JURISDICTION WHERE THE OFFER OR SALE IS NOT PERMITTED.
37
| Structural and Collateral Term Sheet | BBCMS 2021-C11 | |
| No. 1 – One SoHo Square | ||
| Mortgage Loan Information | Property Information | |||
| Mortgage Loan Seller(1): | Barclays | Single Asset / Portfolio: | Single Asset | |
| Original Principal Balance(2): | $70,000,000 | Title: | Fee | |
| Credit Assessment (Fitch/KBRA): | BBB-sf/A | Property Type – Subtype: | Office – CBD | |
| Cut-off Date Principal Balance(2): | $70,000,000 | Net Rentable Area (SF): | 786,891 | |
| % of IPB: | 7.1% | Location: | New York, NY | |
| Loan Purpose: | Refinance | Year Built / Renovated: | 1904-1926 / 2016 | |
| Borrowers: | SOHO AOA Owner, LLC, OSS 2016 LLC and 2016 SOHO LLC | Occupancy: | 92.5% | |
| Borrower Sponsor: | The Gluck Family Trust | Occupancy Date: | 6/1/2021 | |
| Interest Rate: | 2.72466879% | 4th Most Recent NOI (As of): | NAV | |
| Note Date: | 7/9/2021 | 3rd Most Recent NOI (As of)(4): | $24,995,700 (12/31/2019) | |
| Maturity Date: | 8/6/2028 | 2nd Most Recent NOI (As of): | $46,957,475 (12/31/2020) | |
| Interest-only Period: | 84 months | Most Recent NOI (As of): | $51,408,293 (TTM 4/30/2021) | |
| Original Term: | 84 months | UW Economic Occupancy: | 95.9% | |
| Original Amortization Term: | None | UW Revenues: | $83,142,799 | |
| Amortization Type: | Interest Only | UW Expenses: | $19,231,486 | |
| Call Protection(3): | YM(25),DorYM(53),O(6) | UW NOI(4): | $63,911,313 | |
| Lockbox / Cash Management: | Hard / Springing | UW NCF(4): | $63,328,788 | |
| Additional Debt(2): | Yes | Appraised Value / Per SF: | $1,350,000,000 / $1,716 | |
| Additional Debt Balance(2): | $400,000,000 / $315,000,000 / $120,000,000 | Appraisal Date: | 6/10/2021 | |
| Additional Debt Type(2): | Pari Passu / Subordinate / Mezzanine | |||
| Escrows and Reserves(5) | Financial Information(2) | ||||||||
| Initial | Monthly | Initial Cap | Senior Notes | Whole Loan | Total Debt | ||||
| Taxes: | $0 | Springing | N/A | Cut-off Date Loan / SF: | $597 | $998 | $1,150 | ||
| Insurance: | $0 | Springing | N/A | Maturity Date Loan / SF: | $597 | $998 | $1,150 | ||
| Replacement Reserves: | $0 | Springing | $150,000 | Cut-off Date LTV: | 34.8% | 58.1% | 67.0% | ||
| TI/LC Reserve: | $0 | Springing | $1,500,000 | Maturity Date LTV: | 34.8% | 58.1% | 67.0% | ||
| Other: | $0 | $0 | N/A | UW NCF DSCR: | 4.88x | 2.92x | 2.28x | ||
| UW NOI Debt Yield: | 13.6% | 8.1% | 7.1% | ||||||
| Sources and Uses | ||||||
| Sources | Proceeds | % of Total | Uses | Proceeds | % of Total | |
| Senior Notes | $470,000,000 | 51.8% | Loan Payoff | $900,036,150 | 99.2% | |
| Subordinate Notes | 315,000,000 | 34.7 | Closing Costs | 7,272,952 | 0.8 | |
| Mezzanine Loan | 120,000,000 | 13.2 | ||||
| Borrower Sponsor Equity | 2,309,102 | 0.3 | ||||
| Total Sources | $907,309,102 | 100.0% | Total Uses | $907,309,102 | 100.0% | |
| (1) | The One SoHo Square Whole Loan (as defined below) was co-originated by Goldman Sachs Bank USA, DBR Investments Co. Limited and Bank of Montreal. Barclays acquired Notes A-1-C-5 and A-1-C-6 from Goldman Sachs Bank USA. Barclays will be contributing $70.0 million (Notes A-1-C-5 and A-1-C-6) to the BBCMS 2021-C11 transaction. |
| (2) | The One SoHo Square Mortgage Loan (as defined below) is part of a whole loan evidenced by 20 senior pari passu notes, with an aggregate outstanding principal balance as of the Cut-off Date of $470.0 million (the “One SoHo Square Senior Notes”) and three pari passu subordinate notes with an aggregate outstanding principal balance as of the Cut-off Date of $315.0 million. The Financial Information in the chart above reflects the Cut-off Date Balances of the One SoHo Square Senior Notes, the One SoHo Square Whole Loan (as defined below), and the total debt inclusive of the related $120.0 million mezzanine loan on the One SoHo Square Property (as defined below). |
| (3) | The defeasance lockout period, with respect to a defeasance of the One SoHo Square Whole Loan, will be at least 25 payment dates beginning with and including the first payment date on September 6, 2021. Defeasance of the full $785.0 million One SoHo Square Whole Loan is permitted after the date that is earlier of (i) two years from the closing date of the securitization that includes the last note to be securitized and (ii) July 9, 2024. Prepayment in whole or in part is permitted at any time, subject to yield maintenance for any payment prior to March 6, 2028. |
| (4) | The increase from Third Most Recent NOI to UW NOI and UW NCF is primarily attributable to the One SoHo Square Property undergoing lease up. |
| (5) | For a full description of Escrows and Reserves, please refer to “Escrows and Reserves” below. |
THE INFORMATION IN THIS STRUCTURAL AND COLLATERAL TERM SHEET IS NOT COMPLETE AND MAY BE AMENDED PRIOR TO THE TIME OF SALE. THIS TERM SHEET IS NOT AN OFFER TO SELL THESE SECURITIES AND IT IS NOT A SOLICITATION OF AN OFFER TO BUY THESE SECURITIES IN ANY JURISDICTION WHERE THE OFFER OR SALE IS NOT PERMITTED.
38
| Structural and Collateral Term Sheet | BBCMS 2021-C11 | |
| No. 1 – One SoHo Square | ||
The Loan. The One SoHo Square mortgage loan (the “One SoHo Square Mortgage Loan”) is part of a fixed rate whole loan secured by the borrowers’ fee interests in a 786,891 square foot office property located in New York, New York (the “One SoHo Square Property”). The One SoHo Square Whole Loan was co-originated by Goldman Sachs Bank USA (“GSBI”), DBR Investments Co. Limited (“DBRI”) and Bank of Montreal (“BMO”). The One SoHo Square Mortgage Loan is part of a whole loan with an aggregate outstanding principal balance as of the Cut-off Date of $785.0 million (the “One SoHo Square Whole Loan”) consisting of 20 senior pari passu notes with an aggregate outstanding principal balance as of the Cut-off Date of $470.0 million and three pari passu subordinate notes with an aggregate outstanding principal balance as of the Cut-off Date of $315.0 million. The One SoHo Square Whole Loan has a seven-year term, is interest-only for the full term of the loan and accrues interest on an Actual/360 basis. The One SoHo Square Mortgage Loan is evidenced by the non-controlling Notes A-1-C-5 and A-1-C-6, with an aggregate outstanding principal balance as of the Cut-off Date of $70.0 million. The One SoHo Square Whole Loan is serviced pursuant to the trust and servicing agreement for the SOHO 2021-SOHO transaction. See “Description of the Mortgage Pool—The Whole Loans—The A/B Whole Loans—One SoHo Square Whole Loan” and “Pooling and Servicing Agreement—Servicing of the Non-Serviced Mortgage Loans” in the Preliminary Prospectus.
| Whole Loan Summary | ||||||
| Note | Original Balance | Cut-off Date Balance | Note Holder | Controlling Piece | ||
| A-1-S | $685,083 | $685,083 | SOHO 2021-SOHO | Yes(1) | ||
| A-1-C-1 | $53,950,000 | $53,950,000 | Benchmark 2021-B28 | No | ||
| A-1-C-2(2) | $75,000,000 | $75,000,000 | GSBI | No | ||
| A-1-C-3 | $50,000,000 | $50,000,000 | Benchmark 2021-B28 | No | ||
| A-1-C-4(2) | $50,000,000 | $50,000,000 | GSBI | No | ||
| A-1-C-5 | $50,000,000 | $50,000,000 | BBCMS 2021-C11 | No | ||
| A-1-C-6 | $20,000,000 | $20,000,000 | BBCMS 2021-C11 | No | ||
| A-1-C-7(2) | $20,000,000 | $20,000,000 | GSBI | No | ||
| A-1-C-8(2) | $2,353,868 | $2,353,868 | GSBI | No | ||
| A-2-S | $204,420 | $204,420 | SOHO 2021-SOHO | No | ||
| A-2-C-1 | $21,050,000 | $21,050,000 | Benchmark 2021-B28 | No | ||
| A-2-C-2(2) | $20,000,000 | $20,000,000 | DBRI | No | ||
| A-2-C-3(2) | $20,000,000 | $20,000,000 | DBRI | No | ||
| A-2-C-4(2) | $16,000,000 | $16,000,000 | DBRI | No | ||
| A-2-C-5 | $10,000,000 | $10,000,000 | Benchmark 2021-B28 | No | ||
| A-2-C-6(2) | $8,822,928 | $8,822,928 | DBRI | No | ||
| A-3-S | $110,497 | $110,497 | SOHO 2021-SOHO | No | ||
| A-3-C-1(2) | $24,000,000 | $24,000,000 | BMO | No | ||
| A-3-C-2(2) | $16,000,000 | $16,000,000 | BMO | No | ||
| A-3-C-3(2) | $11,823,204 | $11,823,204 | BMO | No | ||
| Total Senior Notes | $470,000,000 | $470,000,000 | ||||
| B-1 | $215,801,105 | $215,801,105 | SOHO 2021-SOHO | No | ||
| B-2 | $64,392,265 | $64,392,265 | SOHO 2021-SOHO | No | ||
| B-3 | $34,806,630 | $34,806,630 | SOHO 2021-SOHO | No | ||
| Whole Loan | $785,000,000 | $785,000,000 | ||||
| (1) | According to the co-lender agreement for SOHO 2021-SOHO, the controlling holder is the SOHO 2021-SOHO Mortgage Trust. See “Description of the Mortgage Pool—The Whole Loans—The A/B Whole Loans—One SoHo Square Whole Loan” in the Preliminary Prospectus. |
| (2) | Expected to be split and/or contributed to one or more future securitizations. |
The Property. The One SoHo Square Property is a 786,891 square foot, Class A, office property located in New York, New York that was designed by the architecture firm Gensler. The One SoHo Square Property is situated in the Hudson Square / Meatpacking District submarket on the northwest corner of 6th Avenue and Spring Street. The One SoHo Square Property features multiple amenities, including roof decks with panoramic views, building management systems, destination dispatch elevators, 24/7 attended lobby with exclusive key card access, a bike room, a message center, and an online tenant service request system. The One SoHo Square Property serves as the corporate headquarters for Flatiron Health, MAC, Warby Parker, Glossier and Double Verify (through November 2023, at which time Flatiron Health is expected take this space through February 2031 as further described below), which together occupy 59.2% of the NRA. As of June 1, 2021, the One SoHo Square Property was 92.5% leased to 14 tenants.
COVID-19 Update. Torch & Crown (Retail, 0.8% of underwritten base rent) is the only tenant to receive temporary rent relief (in the form of a deferral and a contractual repayment agreement) due to the COVID-19 pandemic. All other tenants are current on rent. The first due date of the One SoHo Square Whole Loan is September 6, 2021.
THE INFORMATION IN THIS STRUCTURAL AND COLLATERAL TERM SHEET IS NOT COMPLETE AND MAY BE AMENDED PRIOR TO THE TIME OF SALE. THIS TERM SHEET IS NOT AN OFFER TO SELL THESE SECURITIES AND IT IS NOT A SOLICITATION OF AN OFFER TO BUY THESE SECURITIES IN ANY JURISDICTION WHERE THE OFFER OR SALE IS NOT PERMITTED.
39
| Structural and Collateral Term Sheet | BBCMS 2021-C11 | |
| No. 1 – One SoHo Square | ||
Major Tenants.
Flatiron Health (“Flatiron”) (223,402 square feet; 28.4% of the NRA; 29.0% of underwritten base rent; Moody’s/S&P/Fitch: Aa3/AA/AA): Flatiron is an oncology-focused electronic health records company that seeks to accelerate cancer research and improve the quality of care for cancer patients. Founded in 2012, Flatiron partners with hundreds of cancer centers and developers of oncology therapeutics to facilitate the collection of patient data for research and development purposes to accelerate and impact treatment worldwide. Flatiron’s lease at the One SoHo Square Property commenced in June 2018 and expires in February 2031. Flatiron’s lease has two, five-year extension options.
Aetna (106,350 square feet; 13.5% of the NRA; 14.9% of underwritten base rent; Moody’s/S&P/Fitch: Baa2/BBB/NR): Aetna provides health insurance, as well as dental, vision and other plans to individuals, families and employers. Founded in 1853 in Hartford, Connecticut, Aetna offers: (i) a range of insurance and employee benefits products, (ii) programs and services that help control rising costs while striving to improve the quality of healthcare and (iii) tools and information to help people make better-informed decisions about their healthcare and financial well-being. Aetna’s lease at the One SoHo Square Property commenced in August 2018 and expires in July 2029. Aetna’s lease has two, one-year or five-year extension options.
MAC (88,699 square feet; 11.3% of the NRA; 13.1% of underwritten base rent; Moody’s/S&P/Fitch: A1/A+/NR): MAC, which stands for Make-Up Art Cosmetics (“MAC”), is a makeup and cosmetic supplier. Founded in 1984 in Toronto, Canada by photographer Frank Toskan and salon owner Frank Angelo, MAC is now sold in more than 120 countries around the globe and offers more than 50 collections each year. MAC’s lease at the One SoHo Square Property commenced in November 2017 and expires in March 2034. MAC’s lease has two, five-year extension options.
Environmental. According to a Phase I environmental assessment dated June 18, 2021, there was no evidence of any recognized environmental conditions at the One SoHo Square Property.
| Historical and Current Occupancy(1) | |
| TTM (Apr 2021) | Current(2) |
| 91.1% | 92.5% |
| (1) | Historical occupancies are not presented as the One SoHo Square Property was undergoing lease up. |
| (2) | Current Occupancy is as of June 1, 2021. |
THE INFORMATION IN THIS STRUCTURAL AND COLLATERAL TERM SHEET IS NOT COMPLETE AND MAY BE AMENDED PRIOR TO THE TIME OF SALE. THIS TERM SHEET IS NOT AN OFFER TO SELL THESE SECURITIES AND IT IS NOT A SOLICITATION OF AN OFFER TO BUY THESE SECURITIES IN ANY JURISDICTION WHERE THE OFFER OR SALE IS NOT PERMITTED.
40
| Structural and Collateral Term Sheet | BBCMS 2021-C11 | |
| No. 1 – One SoHo Square | ||
| Top Tenant Summary(1) | ||||||
Tenant | Ratings | Net Rentable Area (SF)(3) | % of | Base Rent | % of Total | Lease |
| Flatiron Health(5)(6) | Aa3/AA/AA | 223,402 | 28.4% | $87.17 | 29.0% | 2/28/2031 |
| Aetna | Baa2/BBB/NR | 106,350 | 13.5 | $93.77 | 14.9% | 7/31/2029 |
| MAC | A1/A+/NR | 88,699 | 11.3 | $99.03 | 13.1% | 3/31/2034 |
| Juul Labs(7) | NR/NR/NR | 54,068 | 6.9 | $128.13 | 10.3% | 5/31/2032 |
| Warby Parker | NR/NR/NR | 83,286 | 10.6 | $75.68 | 9.4% | 1/31/2025 |
| Glossier | NR/NR/NR | 39,637 | 5.0 | $88.13 | 5.2% | 4/30/2028 |
| Double Verify(8) | NR/NR/NR | 30,668 | 3.9 | $87.40 | 4.0% | 2/28/2031 |
| Trader Joe's | NR/NR/NR | 26,126 | 3.3 | $95.69 | 3.7% | 5/31/2033 |
| Managed By Q(9) | NR/NR/NR | 27,334 | 3.5 | $86.53 | 3.5% | 6/30/2028 |
| Aveda | A1/A+/NR | 20,194 | 2.6 | $90.52 | 2.7% | 5/31/2025 |
| Major Tenants | 699,764 | 88.9% | $91.93 | 95.8% | ||
| Other Tenants | 28,208 | 3.6 | ||||
| Total Occupied | 727,972 | 92.5% | ||||
| Vacant | 58,919 | 7.5 | ||||
| Total | 786,891 | 100.0% | ||||
| (1) | Based on the underwritten rent roll dated June 1, 2021. |
| (2) | In certain instances, ratings provided are those of the parent company of the entity shown, whether or not the parent company guarantees the lease. |
| (3) | Net Rentable Area (SF) represents borrower owned space. Does not include non-owned anchors or outparcels. |
| (4) | Base Rent PSF is inclusive of contractual rent steps through August 31, 2022. |
| (5) | Flatiron Health receives an abatement of 87.71% for the months of March 2027 through March 2028. Does not include space that has been pre-leased to Flatiron Health (35,523 square feet), which is currently occupied by Double Verify (see footnote (8) below) and another tenant. |
| (6) | Flatiron Health originally put up approximately 111,000 square feet (approximately 49.0%) of its leased space for sublease during the COVID-19 pandemic. They currently have approximately 40,890 square feet (approximately 17.9%) of its leased space up for sublease, of which 30,668 square feet has been subleased to Petal for three years at approximately 35.0% of Flatiron Health’s contractual rent. We cannot assure you that Flatiron Health will be able to sublease its remaining space or continue paying rent. |
| (7) | Juul Labs has not taken occupancy of its space but continues to pay its current rent. This space is presently on the market for sublease. We cannot assure you that this space will be subleased or that Juul Labs will continue to pay rent. |
| (8) | Suite 4 is presently leased to Double Verify through November 30, 2023. Flatiron Health has executed a lease for this space commencing on March 1, 2024. UW Base Rent depicts Double Verify’s base rent through November 2023 and Flatiron Health’s rent thereafter. Flatiron Health receives an abatement of 91.28% for the months of March 2027 through September 2027 and 58.1% for the month of October 2027. |
| (9) | Additional credit enhancement in the form of a parent company guaranty from WeWork, a letter of credit in the amount of one year of rent and a prohibition on using the space for co-working. |
THE INFORMATION IN THIS STRUCTURAL AND COLLATERAL TERM SHEET IS NOT COMPLETE AND MAY BE AMENDED PRIOR TO THE TIME OF SALE. THIS TERM SHEET IS NOT AN OFFER TO SELL THESE SECURITIES AND IT IS NOT A SOLICITATION OF AN OFFER TO BUY THESE SECURITIES IN ANY JURISDICTION WHERE THE OFFER OR SALE IS NOT PERMITTED.
41
| Structural and Collateral Term Sheet | BBCMS 2021-C11 | |
| No. 1 – One SoHo Square | ||
| Lease Rollover Schedule(1) | |||||||||
| Year | Number of Leases Expiring | Net Rentable Area Expiring | % of NRA Expiring | UW Base Rent Expiring(2) | % of UW Base Rent Expiring | Cumulative Net Rentable Area Expiring | Cumulative % of NRA Expiring | Cumulative UW Base Rent Expiring(2) | Cumulative % of UW Base Rent Expiring |
| Vacant | 0 | 58,919 | 7.5% | NAP | NAP | 58,919 | 7.5% | NAP | NAP |
| 2021 & MTM | 0 | 0 | 0.0 | $0 | 0.0% | 58,919 | 7.5% | $0 | 0.0% |
| 2022 | 0 | 0 | 0.0 | 0 | 0.0 | 58,919 | 7.5% | $0 | 0.0% |
| 2023(3) | 0 | 0 | 0.0 | 0 | 0.0 | 58,919 | 7.5% | $0 | 0.0% |
| 2024 | 0 | 0 | 0.0 | 0 | 0.0 | 58,919 | 7.5% | $0 | 0.0% |
| 2025 | 2 | 103,480 | 13.2 | 8,130,858 | 12.1 | 162,399 | 20.6% | $8,130,858 | 12.1% |
| 2026 | 1 | 4,855 | 0.6 | 89,652 | 0.1 | 167,254 | 21.3% | $8,220,510 | 12.2% |
| 2027 | 0 | 0 | 0.0 | 0 | 0.0 | 167,254 | 21.3% | $8,220,510 | 12.2% |
| 2028 | 2 | 66,971 | 8.5 | 5,858,247 | 8.7 | 234,225 | 29.8% | $14,078,757 | 21.0% |
| 2029 | 1 | 106,350 | 13.5 | 9,972,297 | 14.9 | 340,575 | 43.3% | $24,051,054 | 35.8% |
| 2030 | 0 | 0 | 0.0 | 0 | 0.0 | 340,575 | 43.3% | $24,051,054 | 35.8% |
| 2031 | 3 | 254,862 | 32.4 | 22,332,354 | 33.3 | 595,437 | 75.7% | $46,383,408 | 69.1% |
| 2032 & Beyond | 5 | 191,454 | 24.3 | 20,756,829 | 30.9 | 786,891 | 100.0% | $67,140,237 | 100.0% |
| Total | 14 | 786,891 | 100.0% | $67,140,237 | 100.0% | ||||
| (1) | Based on the underwritten rent roll dated June 1, 2021. |
| (2) | UW Base Rent Expiring and Cumulative UW Base Rent Expiring include rent steps through August 31, 2022. |
| (3) | Double Verify’s lease expires in November 2023. Flatiron Health has pre-leased the space subsequent to Double Verify’s lease expiration. Flatiron Health is anticipated to take occupancy of the space in March 2024 until its lease expiration in February 2031 coterminous with the other Flatiron Health spaces. Base Rent represents the term of the Double Verify Lease. The Lease Expiration represents the lease expiration of Flatiron Health. |
| Operating History and Underwritten Net Cash Flow | ||||||
| 2019(1) | 2020 | TTM (2) | Underwritten(1) | Per Square Foot | %(3) | |
| Base Rent(4) | $53,253,724 | $63,763,493 | $65,746,242 | $67,140,237 | $85.32 | 77.4% |
| Rent Steps(5) | 0 | 0 | 0 | 5,035,662 | 6.40 | 5.8 |
| Vacant Income | 0 | 0 | 0 | 3,588,186 | 4.56 | 4.1 |
| Gross Potential Rent | $53,253,724 | $63,763,493 | $65,746,242 | $75,764,085 | $96.28 | 87.4% |
| Total Reimbursements | 2,129,581 | 2,664,812 | 2,973,859 | 10,451,209 | 13.28 | 12.1 |
| Total Other Income(6) | 665,493 | 545,417 | 410,353 | 515,692 | 0.66 | 0.6 |
| Net Rental Income | $56,048,799 | $66,973,722 | $69,130,454 | $86,730,986 | $110.22 | 100.0% |
| (Vacancy/Credit Loss) | (16,604,337) | (5,059,796) | (2,158,794) | (3,588,186) | (4.56) | (4.1) |
| Effective Gross Income | $39,444,461 | $61,913,927 | $66,971,660 | $83,142,799 | $105.66 | 95.9% |
| Total Expenses | 14,448,761 | 14,956,452 | 15,563,367 | 19,231,486 | 24.44 | 23.1 |
| Net Operating Income | $24,995,700 | $46,957,475 | $51,408,293 | $63,911,313 | $81.22 | 76.9% |
| Total TI/LC, Capex/RR | 0 | 0 | 0 | 582,525 | 0.74 | 0.7 |
| Net Cash Flow | $24,995,700 | $46,957,475 | $51,408,293 | $63,328,788 | $80.48 | 76.2% |
| (1) | The increase from 2019 Net Cash Flow to Underwritten Net Cash Flow is primarily attributable to the One SoHo Square Property undergoing lease up. |
| (2) | TTM represents the trailing 12 months ending April 30, 2021. |
| (3) | % column represents percent of Net Rental Income for all revenue lines and represents percent of Effective Gross Income for the remainder of the fields. |
| (4) | Underwritten Base Rent is based on the in-place rent roll as of June 1, 2021. |
| (5) | Rent Steps are based on present value of rent steps from credit tenants and are taken through August 31, 2022. |
| (6) | Underwritten Total Other Income includes a Vertical Decommission Revenue Adjustment of $115,232. |
The Market. The One SoHo Square Property is located within the New York City-Jersey City-White Plains metropolitan area and is part of the Hudson Square/Meatpacking Office submarket. The One SoHo Square Property benefits from the area’s mass transit infrastructure that connects Manhattan to the outer boroughs and the surrounding suburbs in the tri-state area. Air transportation is available via JFK International Airport, Newark Liberty International Airport, and LaGuardia Airport, all of which are in close proximity to the One SoHo Square Property. Further, Penn Station and Grand Central are located in New York City, offering railroad access to Long Island, New York state, Connecticut, and New Jersey. The New York City metropolitan area has a diverse economy, with major employers including
THE INFORMATION IN THIS STRUCTURAL AND COLLATERAL TERM SHEET IS NOT COMPLETE AND MAY BE AMENDED PRIOR TO THE TIME OF SALE. THIS TERM SHEET IS NOT AN OFFER TO SELL THESE SECURITIES AND IT IS NOT A SOLICITATION OF AN OFFER TO BUY THESE SECURITIES IN ANY JURISDICTION WHERE THE OFFER OR SALE IS NOT PERMITTED.
42
| Structural and Collateral Term Sheet | BBCMS 2021-C11 | |
| No. 1 – One SoHo Square | ||
JP Morgan Chase & Co., Bank of America, New York-Presbyterian Healthcare System, Macy’s, Verizon Communications, PwC, Delta Air Lines Inc., and Time Warner Inc.
As of the first quarter of 2021, the Midtown South Office Market had approximately 3.4 million square feet under construction with an overall vacancy rate of 17.5% and average asking rents of $76.60 per square foot. As of the first quarter of 2021, the Hudson Square/Meatpacking Office submarket had approximately 988,866 square feet under construction with an overall vacancy rate of 6.4% and average asking rents of $79.55 per square foot.
The appraisal identified seven directly competitive office comparables. Comparable buildings were built between 1910 and 1987 and range in size from 236,512 square feet to 2,921,914 square feet. Average asking rents ranged from $85.00 to $90.00 per square foot.
The following table presents certain information relating to comparable office sales for the One SoHo Square Property:
| Comparable Office Sales(1) | |||||||||
Address | RSF | Year Built / Renovated | Occupancy | Sale Date | Price | Price PSF | Cap Rate | Adjusted Price PSF | |
| 1 | One SoHo Square(2) | 786,891 | 1904-1926 / 2016 | 92.5% | $1,350,000,000 | $ 1,716 | 4.25% | $ 1,716 | |
| 2 | 635-641 Avenue of the Americas | 267,000 | 1902 / 2015 | 84.0% | Jun-2021 | $ 325,000,000 | $ 1,217 | 5.36% | $ 1,339 |
| 2 | 546 Broadway | 93,600 | 1900 | 100.0% | Jun-2021 | 160,000,000 | 1,709 | 6.17% | 1,197 |
| 3 | 125 West End Avenue | 399,309 | 1929 | 0.0% | Mar-2021 | 597,015,923 | 1,495 | 4.58% | 1,719 |
| 4 | 410 Tenth Avenue | 634,359 | 1927 / 2021 | 98.0% | Dec-2020 | 952,840,000 | 1,502 | 4.30% | 1,577 |
| 5 | One Madison Avenue | 1,392,565 | 1932 / 2023 | 0.0% | May-2020 | 2,300,000,000 | 1,652 | 4.30% | 1,817 |
| 6 | 424 Fifth Avenue | 680,493 | 1929 / 2020 | 100.0% | Mar-2020 | 1,289,501,065 | 1,895 | 5.21% | 1,710 |
| 7 | 450 West 15th Street | 320,789 | 1928 / 2012 | 94.0% | May-2019 | 600,000,000 | 1,870 | 3.30% | 1,688 |
| 8 | 330 Hudson Street | 467,905 | 1910 / 2013 | 100.0% | Feb-2018 | 385,000,000 | 823 | 4.54% | 1,214 |
| Weighted Average / Total | 532,003 | 56.1% | $1,268,227,178 | $ 1,553 | 4.53% | $ 1,635 | |||
| (1) | Source: Appraisal. |
| (2) | The One SoHo Square Property’s Price and Price PSF are based on the “as-is” appraised value. The One SoHo Square Property’s Occupancy and RSF is based on in- place rent roll as of June 2021 with rent steps through August 31, 2022. |
The Borrowers. The borrowers are SOHO AOA Owner, LLC, OSS 2016 LLC and 2016 SOHO LLC, each a Delaware limited liability company. The borrowers are structured to be single purpose bankruptcy-remote entities, having at least two independent directors in their organizational structure. Legal counsel to the borrowers delivered a non-consolidation opinion in connection with the origination of the One SoHo Square Whole Loan.
The Borrower Sponsor. The borrower sponsor is comprised of entities controlled by Laurence Gluck or trustees of the Amended and Restated 2013 LG Revocable Trust (d/b/a Stellar Management) and the non-recourse carveout guarantor is The Gluck Family Trust. At origination, in lieu of funding an unfunded obligations reserve, the guarantor also provided a guaranty of certain unfunded obligations including tenant improvements and leasing commissions in an amount equal to $3,142,373.13. Stellar Management (“Stellar”) was founded in 1985 by Laurence Gluck, formerly a partner at New York real estate law firm Dreyer & Traub and a former member of the executive committee of the Real Estate Board of New York. Stellar owns and manages over 12,000 apartments, over two million square feet of office space and 1.3 million square feet of retail space. Notable New York City projects, past and present, include 14 Wall Street, The Milk Building, 522 Fifth Avenue, 220 Fifth Avenue, Otto Greenpoint, The Windermere, Embassy House, Columbus Square and Independence Plaza. Since its inception, Stellar has partnered with a number of institutions and has been a fiduciary to investors on over 150 transactions. Stellar employs over 700 people.
Property Management. The One SoHo Square Property is self-managed by MEL Management Corp. (d/b/a Stellar Management), a New York corporation that is an affiliate of the borrowers.
Escrows and Reserves.
Tax Escrows – The borrowers are required to deposit into a real estate tax reserve, on a monthly basis during the continuance of a One SoHo Square Cash Sweep Period (as defined below), 1/12th of the reasonably estimated annual real estate taxes.
Insurance Escrows – The borrowers are required to deposit into an insurance reserve, on a monthly basis during the continuance of a One SoHo Square Cash Sweep Period, 1/12th of reasonably estimated insurance premiums unless the borrowers maintain a blanket policy in accordance with the One SoHo Square Whole Loan documents.
THE INFORMATION IN THIS STRUCTURAL AND COLLATERAL TERM SHEET IS NOT COMPLETE AND MAY BE AMENDED PRIOR TO THE TIME OF SALE. THIS TERM SHEET IS NOT AN OFFER TO SELL THESE SECURITIES AND IT IS NOT A SOLICITATION OF AN OFFER TO BUY THESE SECURITIES IN ANY JURISDICTION WHERE THE OFFER OR SALE IS NOT PERMITTED.
43
| Structural and Collateral Term Sheet | BBCMS 2021-C11 | |
| No. 1 – One SoHo Square | ||
Replacement Reserve – The borrowers are required to deposit into a replacement reserve during the continuance of a One SoHo Square Cash Sweep Period, an amount equal to the lesser of (i) $13,197 and (ii) the amount that would cause the replacement reserve account to contain $150,000.
Rollover Reserve – The borrowers are required to deposit into a rollover reserve during the continuance of a One SoHo Square Cash Sweep Period, an amount equal to the lesser of (i) $65,984 and (ii) the amount that would cause the replacement reserve account to contain $1.5 million.
Lockbox / Cash Management. The One SoHo Square Whole Loan is structured with a hard lockbox and springing cash management. The borrowers were required to direct each tenant to remit all rents directly to a lender-controlled lockbox account. In addition, the borrowers are required to cause all cash revenues relating to the One SoHo Square Property and all other money received by the borrowers or the property manager with respect to the One SoHo Square Property (other than tenant security deposits) to be deposited into the lockbox account or a lender-controlled cash management account within one business day of receipt. On each business day during the continuance of a One SoHo Square Cash Sweep Period or event of default under the One SoHo Square Whole Loan, all amounts in the lockbox account are required to be remitted to the cash management account. On each business day that no One SoHo Square Cash Sweep Period or event of default under the One SoHo Square Whole Loan is continuing, all amounts in the lockbox account are required to be remitted to a borrower-controlled operating account.
On each due date during the continuance of a One SoHo Square Cash Sweep Period or an event of default under the One SoHo Square Whole Loan, all funds on deposit in the cash management account after payment of debt service on the One SoHo Square Whole Loan (and the One SoHo Square Mezzanine Loan provided that an event of default is not continuing), required reserves and budgeted operating expenses are required to be deposited into an excess cash flow reserve account as additional collateral for the One SoHo Square Whole Loan.
A “One SoHo Square Cash Sweep Period” means each period commencing upon (1) an event of default under the One SoHo Square Whole Loan documents and concluding upon a cure of such event of default, (2) an event of default under the One SoHo Square Mezzanine Loan (as defined below) and concluding upon a cure or waiver of such event of default, (3) the debt yield (as calculated under the related loan documents), as determined as of the last day of any two consecutive fiscal quarters, is less than 5.0% (a “One SoHo Square Debt Yield Trigger”), and concluding when the One SoHo Square Total Debt (as defined below) debt yield, determined as of the last day of each of two consecutive fiscal quarters thereafter, exceeds 5.0%, and (4) a failure to deliver annual, quarterly or monthly financial reports as and when required under the related loan documents and concluding when such reports are delivered and indicate that no other One SoHo Square Cash Sweep Period is continuing. Notwithstanding the foregoing, if a One SoHo Square Cash Sweep Period is in effect or would be in effect solely as a result of a One SoHo Square Debt Yield Trigger, the borrowers may avoid the commencement of or terminate the continuance of a One SoHo Square Cash Sweep Period by either (x) prepaying (or partially defeasing) a portion of the One SoHo Square Whole Loan and/or One SoHo Square Mezzanine Loan, such that the resulting debt yield exceeds 5.0%, or (y) delivering to the lender, as additional collateral (the “One SoHo Square Debt Yield Collateral”), a letter of credit or cash equivalents satisfactory to the lender in an amount (the “One SoHo Square Debt Yield Cure Amount”) that, when subtracted from the sum of the then outstanding principal balance of the One SoHo Square Whole Loan and the One SoHo Square Mezzanine Loan would result in a debt yield that exceeds 5.0%. Thereafter, if the One SoHo Square Debt Yield Cure Amount as of the last day of any fiscal quarter exceeds the aggregate amount of the One SoHo Square Debt Yield Collateral held by the lender, then a One SoHo Square Cash Sweep Period will commence unless the borrowers prepay (or partially defease) a portion of the One SoHo Square Whole Loan and/or One SoHo Square Mezzanine Loan, such that the resulting debt yield exceeds 5.0% or increases the amount of the One SoHo Square Debt Yield Collateral to the then-current One SoHo Square Debt Yield Cure Amount.
Subordinate and Mezzanine Debt. Concurrently with the funding of the One SoHo Square Whole Loan, the lender (in such capacity, the “Mezzanine Lender”) also funded a mezzanine loan in the amount of $120.0 million (the “One SoHo Square Mezzanine Loan”, and together with the One SoHo Square Whole Loan, the “One SoHo Square Total Debt”). The One SoHo Square Mezzanine Loan is secured by the pledge of the direct equity interest in the borrowers and is coterminous with the One SoHo Square Whole Loan. The One SoHo Square Mezzanine Loan accrues interest at a rate of 5.05000% per annum. The rights of the Mezzanine Lender under the One SoHo Square Mezzanine Loan are further described under “Description of the Mortgage Pool—Additional Indebtedness—Mezzanine Indebtedness” in the Preliminary Prospectus. The Cut-off Date LTV Ratio, Maturity Date LTV Ratio, DSCR Based on Underwritten NCF and Debt Yield Based on Underwritten NOI for the One SoHo Square Total Debt are set forth below:
| Mezzanine Loan | |||||
| Loan Amount | Interest Rate | Total Debt Cut-off Date LTV Ratio | Total Debt Maturity Date LTV Ratio | Total Debt Underwritten NCF DSCR | Total Debt Underwritten NOI Debt Yield |
| $120,000,000 | 5.05000% | 67.0% | 67.0% | 2.28x | 7.1% |
THE INFORMATION IN THIS STRUCTURAL AND COLLATERAL TERM SHEET IS NOT COMPLETE AND MAY BE AMENDED PRIOR TO THE TIME OF SALE. THIS TERM SHEET IS NOT AN OFFER TO SELL THESE SECURITIES AND IT IS NOT A SOLICITATION OF AN OFFER TO BUY THESE SECURITIES IN ANY JURISDICTION WHERE THE OFFER OR SALE IS NOT PERMITTED.
44
| Structural and Collateral Term Sheet | BBCMS 2021-C11 | |
| No. 1 – One SoHo Square | ||
Additionally, the related loan documents permit future mezzanine financing, subject to satisfaction of certain conditions, including among others, (i) such mezzanine debt is not in excess of $90.5 million, (ii) such mezzanine debt is subordinate to the One SoHo Square Mezzanine Loan, (iii) such mezzanine debt is obtained any time after July 9, 2023, (iv) such mezzanine debt is provided by a qualified lender (as defined in the loan documents), (v) such mezzanine debt is subject to an intercreditor agreement reasonably acceptable to the lender, (vi) such mezzanine debt is either coterminous with the One SoHo Square Whole Loan or freely prepayable without premium or penalty from and after the related One SoHo Square Whole Loan maturity date, (vii) as of the date of its incurrence, such mezzanine debt does not cause the DSCR to be less than 2.22x or the debt yield to be less than 6.82%, (viii) as of the date of its incurrence, such mezzanine debt does not cause the aggregate loan-to-value ratio of the One SoHo Square Whole Loan and the One SoHo Square Mezzanine Loan, based on an updated appraisal of the One SoHo Square Property, to be greater than 67.0%, (ix) delivery of a rating agency confirmation and (x) if such mezzanine debt bears a floating rate of interest, execution of an interest rate cap agreement from a counterparty reasonably acceptable to the lender. See “Description of the Mortgage Pool—Additional Indebtedness— Mezzanine Indebtedness” in the Preliminary Prospectus.
Partial Release. Not permitted.
Ground Lease. None.
THE INFORMATION IN THIS STRUCTURAL AND COLLATERAL TERM SHEET IS NOT COMPLETE AND MAY BE AMENDED PRIOR TO THE TIME OF SALE. THIS TERM SHEET IS NOT AN OFFER TO SELL THESE SECURITIES AND IT IS NOT A SOLICITATION OF AN OFFER TO BUY THESE SECURITIES IN ANY JURISDICTION WHERE THE OFFER OR SALE IS NOT PERMITTED.
45
| Structural and Collateral Term Sheet | BBCMS 2021-C11 |
| No. 2 – Kings Plaza |

THE INFORMATION IN THIS STRUCTURAL AND COLLATERAL TERM SHEET IS NOT COMPLETE AND MAY BE AMENDED PRIOR TO THE TIME OF SALE. THIS TERM SHEET IS NOT AN OFFER TO SELL THESE SECURITIES AND IT IS NOT A SOLICITATION OF AN OFFER TO BUY THESE SECURITIES IN ANY JURISDICTION WHERE THE OFFER OR SALE IS NOT PERMITTED.
46
| Structural and Collateral Term Sheet | BBCMS 2021-C11 |
| No. 2 – Kings Plaza |
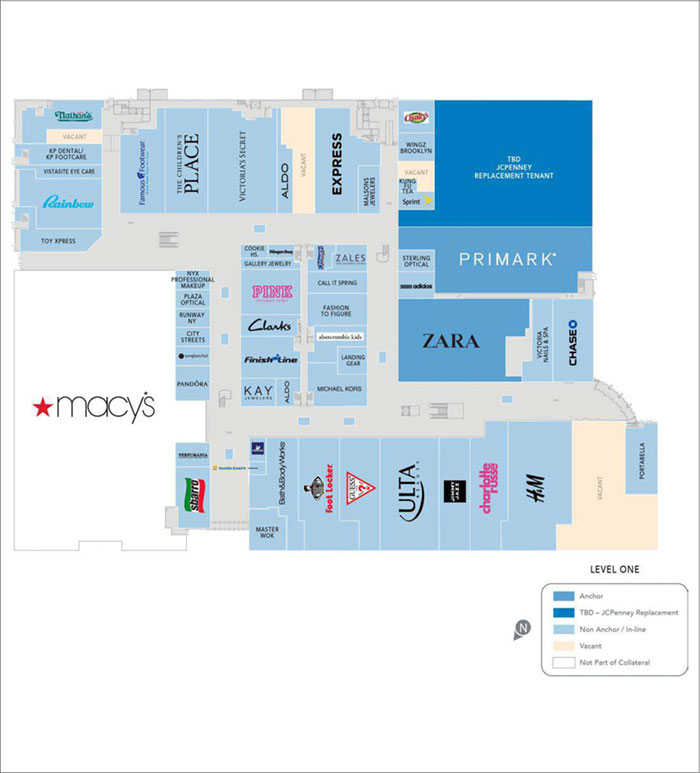
THE INFORMATION IN THIS STRUCTURAL AND COLLATERAL TERM SHEET IS NOT COMPLETE AND MAY BE AMENDED PRIOR TO THE TIME OF SALE. THIS TERM SHEET IS NOT AN OFFER TO SELL THESE SECURITIES AND IT IS NOT A SOLICITATION OF AN OFFER TO BUY THESE SECURITIES IN ANY JURISDICTION WHERE THE OFFER OR SALE IS NOT PERMITTED.
47
| Structural and Collateral Term Sheet | BBCMS 2021-C11 |
| No. 2 – Kings Plaza |
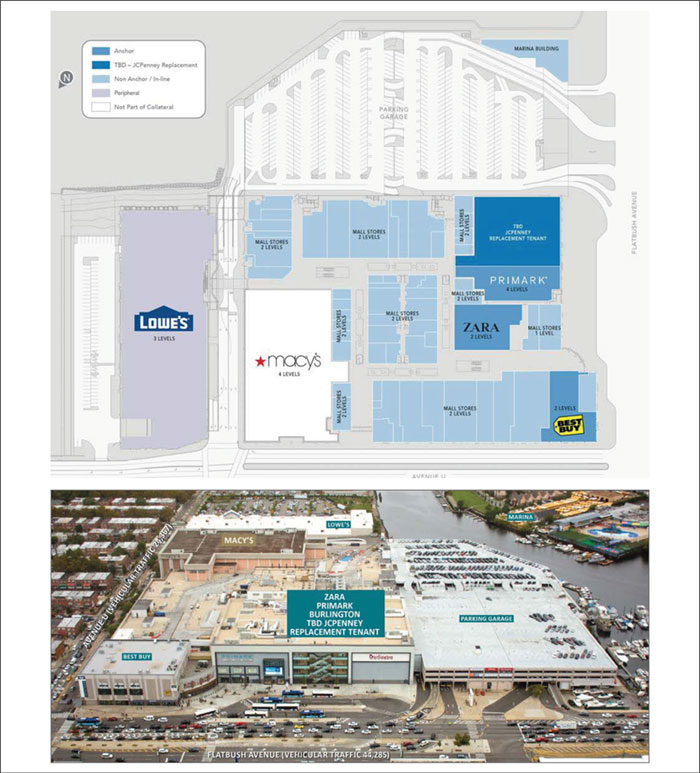
THE INFORMATION IN THIS STRUCTURAL AND COLLATERAL TERM SHEET IS NOT COMPLETE AND MAY BE AMENDED PRIOR TO THE TIME OF SALE. THIS TERM SHEET IS NOT AN OFFER TO SELL THESE SECURITIES AND IT IS NOT A SOLICITATION OF AN OFFER TO BUY THESE SECURITIES IN ANY JURISDICTION WHERE THE OFFER OR SALE IS NOT PERMITTED.
48
| Structural and Collateral Term Sheet | BBCMS 2021-C11 |
| No. 2 – Kings Plaza |

THE INFORMATION IN THIS STRUCTURAL AND COLLATERAL TERM SHEET IS NOT COMPLETE AND MAY BE AMENDED PRIOR TO THE TIME OF SALE. THIS TERM SHEET IS NOT AN OFFER TO SELL THESE SECURITIES AND IT IS NOT A SOLICITATION OF AN OFFER TO BUY THESE SECURITIES IN ANY JURISDICTION WHERE THE OFFER OR SALE IS NOT PERMITTED.
49
| Structural and Collateral Term Sheet | BBCMS 2021-C11 |
| No. 2 – Kings Plaza |

THE INFORMATION IN THIS STRUCTURAL AND COLLATERAL TERM SHEET IS NOT COMPLETE AND MAY BE AMENDED PRIOR TO THE TIME OF SALE. THIS TERM SHEET IS NOT AN OFFER TO SELL THESE SECURITIES AND IT IS NOT A SOLICITATION OF AN OFFER TO BUY THESE SECURITIES IN ANY JURISDICTION WHERE THE OFFER OR SALE IS NOT PERMITTED.
50
| Structural and Collateral Term Sheet | BBCMS 2021-C11 |
| No. 2 – Kings Plaza |
| Mortgage Loan Information | Property Information | |||
| Mortgage Loan Seller(1): | SGFC | Single Asset / Portfolio: | Single Asset | |
| Credit Assessment (Fitch/KBRA): | BBB-sf/BBB- | Title: | Fee / Leasehold | |
| Original Principal Balance(2): | $47,945,946 | Property Type - Subtype: | Retail – Super Regional Mall | |
| Cut-off Date Principal Balance(2): | $47,945,946 | Net Rentable Area (SF): | 811,797 | |
| % of IPB: | 4.9% | Location: | Brooklyn, NY | |
| Loan Purpose: | Refinance | Year Built / Renovated: | 1969 / 2018 | |
| Borrowers: | Brooklyn Kings Plaza LLC and Kings Plaza Ground Lease LLC | Occupancy(5): | 97.8% | |
| Borrower Sponsor: | The Macerich Partnership, L.P. | Occupancy Date: | 8/15/2021 | |
| Interest Rate: | 3.35880% | 4th Most Recent NOI (As of): | $42,088,187 (12/31/2018) | |
| Note Date: | 12/3/2019 | 3rd Most Recent NOI (As of): | $49,565,143 (12/31/2019) | |
| Maturity Date: | 1/1/2030 | 2nd Most Recent NOI (As of): | $47,043,686 (12/31/2020) | |
| Interest-only Period: | 120 months | Most Recent NOI (As of): | $46,450,944 (TTM 6/30/2021) | |
| Original Term: | 120 months | UW Economic Occupancy: | 95.0% | |
| Original Amortization Term: | None | UW Revenues: | $81,045,187 | |
| Amortization Type: | Interest Only | UW Expenses: | $29,004,262 | |
| Call Protection: | L(36),YM1(79),O(5) | UW NOI: | $52,040,925 | |
| Lockbox / Cash Management: | Hard / Springing | UW NCF: | $50,905,970 | |
| Additional Debt(2)(3): | Yes | Appraised Value / Per SF(6): | $900,000,000 / $1,109 | |
| Additional Debt Balance(2)(3): | $439,054,054 / $53,000,000 | Appraisal Date(6): | 10/17/2019 | |
| Additional Debt Type(2)(3): | Pari Passu / Mezzanine | |||
| Escrows and Reserves(4) | Financial Information(2) | ||||||
| Initial | Monthly | Initial Cap | Whole Loan | Total Debt | |||
| Taxes: | $0 | Springing | N/A | Cut-off Date Loan / SF: | $600 | $665 | |
| Insurance: | $0 | Springing | N/A | Maturity Date Loan / SF(7): | $600 | $600 | |
| Replacement Reserves: | $0 | Springing | $348,899 | Cut-off Date LTV: | 54.1% | 60.0% | |
| TI/LC: | $0 | Springing | $2,435,391 | Maturity Date LTV(7): | 54.1% | 54.1% | |
| Other: | $0 | Springing | N/A | UW NCF DSCR(7): | 3.07x | 1.73x | |
| UW NOI Debt Yield: | 10.7% | 9.6% | |||||
| Sources and Uses | |||||||
| Sources | Proceeds | % of Total | Uses | Proceeds | % of Total | ||
| Whole Loan(2) | $487,000,000 | 90.2% | Loan Payoff | $428,649,060 | 79.4% | ||
| Mezzanine Loan(7) | 53,000,000 | 9.8 | Return of Equity | 105,237,541 | 19.5 | ||
| Closing Costs | 6,113,399 | 1.1 | |||||
| Total Sources | $540,000,000 | 100.0% | Total Uses | $540,000,000 | 100.0% | ||
| (1) | The Kings Plaza Whole Loan (as defined below) was co-originated by JPMorgan Chase Bank, National Association (“JPMCB”), Wells Fargo Bank, N.A. (“WFB”) and SGFC. |
| (2) | The Kings Plaza Mortgage Loan (as defined below) is part of a whole loan evidenced by 15 senior pari passu notes with an aggregate original principal balance as of the Cut-off Date of $487.0 million. The financial information presented in the chart above reflects the Cut-off Date balance of the Kings Plaza Whole Loan. For additional information, see “The Loan” below. |
| (3) | For a full description see “Subordinate and Mezzanine Debt” below. |
| (4) | For a full description of Escrows and Reserves, please refer to “Escrows and Reserves” below. |
| (5) | Forever 21 Retail Inc. (“Forever 21”) occupies 22,828 square feet of space at the Kings Plaza Property (as defined below) and currently pays rent but was underwritten as vacant. Forever 21 has been in occupancy at the Kings Plaza Property since 2010. Following bankruptcy court proceedings, negotiations for a three-year lease renewal have been approved and Forever 21’s lease has been extended through January 31, 2023. As part of the bankruptcy negotiations, Forever 21 is required to pay 12% of sales. In addition, Occupancy is inclusive of a prospective replacement tenant for the JCPenney space (11.7% of total net rentable area) and Forever 21. JCPenney filed for Chapter 11 bankruptcy on May 15, 2020. JCPenney closed its store at the Kings Plaza Property on October 31, 2020. On May 10, 2021, Thomas O’Hern, the CEO of The Macerich Company (the parent organization of the borrower sponsor) (“Macerich”), reported on a Q1 2021 earnings call it would be announcing a new store commitment for the Kings Plaza Property. As of the date of this term sheet, no further announcement has been made. Based on the borrower rent roll, excluding JCPenney, the occupancy is approximately 86.6%. |
| (6) | The Appraised Value was determined prior to the emergence of the novel coronavirus pandemic and the economic disruption resulting from measures to combat the pandemic, and all LTV metrics were calculated based on such prior information. See “Risk Factors—Risks Related to Market Conditions and Other External Factors—Current Coronavirus Pandemic Has Adversely Affected the Global Economy and Will Likely Adversely Affect the Performance of the Mortgage Loans” in the Preliminary Prospectus. |
| (7) | The Kings Plaza Mezzanine Loan (as defined below) is interest only for the first five years of the loan term and then is fully amortizing based on a five-year schedule. Total Debt UW NCF DSCR is based on the first 12 amortizing payments on the amortization schedule for the Kings Plaza Mezzanine Loan. |
THE INFORMATION IN THIS STRUCTURAL AND COLLATERAL TERM SHEET IS NOT COMPLETE AND MAY BE AMENDED PRIOR TO THE TIME OF SALE. THIS TERM SHEET IS NOT AN OFFER TO SELL THESE SECURITIES AND IT IS NOT A SOLICITATION OF AN OFFER TO BUY THESE SECURITIES IN ANY JURISDICTION WHERE THE OFFER OR SALE IS NOT PERMITTED.
51
| Structural and Collateral Term Sheet | BBCMS 2021-C11 |
| No. 2 – Kings Plaza |
The Loan. The Kings Plaza loan (the “Kings Plaza Mortgage Loan”) is part of a whole loan that has an outstanding principal balance as of the Cut-off Date of $487.0 million (the “Kings Plaza Whole Loan”), which is secured by a first mortgage lien on the borrowers’ fee and leasehold interests in an 811,797 square foot super regional mall located in Brooklyn, New York (the “Kings Plaza Property”). The Kings Plaza Whole Loan is comprised of 15 pari passu notes with an aggregate original principal balance as of the Cut-off Date of $487.0 million, of which Note A-2-3 and Note A-2-4, with an aggregate outstanding principal balance as of the Cut-off Date of $47,945,946, are being contributed to the BBCMS 2021-C11 securitization trust and collectively constitute the Kings Plaza Mortgage Loan. The remaining notes have been contributed to other securitization trusts. The relationship between the holders of the Kings Plaza Whole Loan will be governed by a co-lender agreement as described under the “Description of the Mortgage Pool—The Whole Loans—The Non-Serviced Pari Passu Whole Loans” in the Preliminary Prospectus.
| Whole Loan Summary | |||
| Note | Original Balance | Note Holder | Controlling Piece |
| A-1-1-A | $32,000,000 | Benchmark 2020-B17 | Yes |
| A-1-1-B-1 | $20,000,000 | DBJPM 2020-C9 | No |
| A-1-1-B-2 | $14,108,108 | Benchmark 2020-B18 | No |
| A-1-2 | $50,000,000 | Benchmark 2020-B16 | No |
| A-1-3, A-1-4 | $55,000,000 | Benchmark 2020-IG1 | No |
| A-2-1 | $60,000,000 | BBCMS 2020-C6 | No |
| A-2-2-A | $30,000,000 | Benchmark 2020-B21 | No |
| A-2-2-B | $20,000,000 | BBCMS 2021-C10 | No |
| A-2-3 | $35,000,000 | BBCMS 2021-C11 | No |
| A-2-4 | $12,945,946 | BBCMS 2021-C11 | No |
| A-3-1, A-3-4 | $75,000,000 | BANK 2020-BNK25 | No |
| A-3-2, A-3-3 | $82,945,946 | WFCM 2020-C55 | No |
| Whole Loan | $487,000,000 | ||
The Property. The Kings Plaza Property is an 811,797 square foot enclosed, four-story super regional shopping center located in Brooklyn, New York. Built in 1969 and renovated in 2018, the collateral consists of the retail center, a power plant and a 3,739-space parking garage (3.26 spaces per 1,000 square feet). A portion of the collateral including the parking garage ingress/egress, the Marina Building (as defined below) and a portion of the ground under the parking garage is subject to a ground lease as further described in “Ground Lease” below.
The Kings Plaza Property is situated across approximately 21.6 acres of land with frontage along Flatbush Avenue and located at the intersection of Flatbush Avenue and Avenue U. The Kings Plaza Property is the only enclosed super-regional mall in Brooklyn, New York. The collateral is anchored by Macy’s, Lowe’s Home Centers, Primark, Burlington and Best Buy. Additional anchors include Zara, H&M, Old Navy, Victoria’s Secret, ULTA Beauty and Forever 21. According to the appraisal, Primark expects its Kings Plaza Property location to generate the highest revenue in the United States, exceeding its Boston flagship store location. Primark does not report sales at the Kings Plaza Property, however, the appraisal estimated Primark’s Kings Plaza Property location sales to be approximately $45 to $50 million annually. Macy’s, which is not part of the collateral, occupies approximately 339,000 square feet attached to the Kings Plaza Property (the “Macy’s Parcel”). The Kings Plaza Property Macy’s location was selected as one of the Macy’s “Growth 100” locations for 2020. According to Macerich, the retailer is experimenting with new concepts directed at improving store fixtures and facilities. As part of the program, Macy’s will receive an estimated $4 to $5 million to remodel the store adjacent to the Kings Plaza Property in the upcoming years, with anticipated renovations including technology upgrades, dressing room upgrades, new flooring, lighting, painting and improvements to the exterior of the space. Forever 21 currently occupies 22,802 square feet at the Kings Plaza Property and has been in occupancy since 2010. Forever 21 filed for Chapter 11 bankruptcy in September 2019. Following bankruptcy court proceedings, negotiations for a three-year lease renewal were approved and the Forever 21 lease is extended through January 31, 2023. As part of the bankruptcy negotiations, Forever 21 is required to pay 12% of sales. Forever 21 reported annualized T-6 June 2021 sales of approximately $261 per square foot. Forever 21 currently pays rent but was underwritten as vacant.
The Kings Plaza Property was 97.8% occupied as of August 15, 2021, inclusive of a prospective replacement tenant for the JCPenney space. JCPenney closed its store at the Kings Plaza Property on October 31, 2020. Based on the borrower rent roll, excluding JCPenney, the occupancy is approximately 86.6%. For the tenants reporting sales, the Kings Plaza Property generated approximately $180.2 million in gross sales as of the annualized T-6 ending June 2021. The Kings Plaza Property generates approximately 70.8% of its top line revenue from in-line tenants under 10,000 square feet. Total in-line sales excluding temporary tenants, account for approximately 96.9% of total revenue generated at the Kings Plaza Property.
THE INFORMATION IN THIS STRUCTURAL AND COLLATERAL TERM SHEET IS NOT COMPLETE AND MAY BE AMENDED PRIOR TO THE TIME OF SALE. THIS TERM SHEET IS NOT AN OFFER TO SELL THESE SECURITIES AND IT IS NOT A SOLICITATION OF AN OFFER TO BUY THESE SECURITIES IN ANY JURISDICTION WHERE THE OFFER OR SALE IS NOT PERMITTED.
52
| Structural and Collateral Term Sheet | BBCMS 2021-C11 |
| No. 2 – Kings Plaza |
Since acquiring the Kings Plaza Property in 2012, the borrower sponsor has invested approximately $290.3 million ($358 per square foot) in capital improvements including renovations of the mall and parking garage, leasing capital and power plant upgrades. Most notable capital projects at the Kings Plaza Property include the $144.7 million redevelopment of the 290,000 square foot, former four-level Sears box. The borrower sponsor negotiated an early termination with Sears to recapture the space in 2016. The redevelopment included a four-story glass atrium, a new façade, exterior improvements and a new entry with visual and vertical connections to all four levels. In 2018, the space previously occupied by Sears re-opened with Brooklyn’s first Primark and Zara, a new JCPenney and a new Burlington Coat Factory. Combined, these retailers generate a total gross rent that is approximately 31.2% higher than that of the former Sears. Prior to the Sears re-development, the borrower sponsor expended approximately $22.0 million to renovate the Kings Plaza Property throughout 2014 and 2015. These renovations included a refreshed interior, energy efficient LED lighting, new flooring (including both carpet and tile), a new ceiling, wall paint, new signage, the addition of six soft seating areas, free Wi-Fi for guests and security system upgrades.
The Kings Plaza Property operates a stand-alone power plant located on the roof which provides electricity for the shopping center as well as the surrounding area. In 2019, the borrower sponsor completed a $17.5 million project allowing the power plant to interconnect with the local Consolidated Edison (“ConEd”) grid. This connection allowed the Kings Plaza Property to export its surplus electric capacity during peak load demands, which is an additional profit center for the Kings Plaza Property. Tenants at the Kings Plaza Property purchase their utilities directly from the plant at ConEd rates but due to operating cost efficiencies, expenses are kept below the billed rates allowing the power plant to generate a profit. The power plant system went live in July 2019.
COVID-19 Update: As of August 31, 2021, the Kings Plaza Property is currently open for business with over 99% of stores open for operations. The Kings Plaza Property was forced to close down during March 2020 due to the COVID-19 pandemic and subsequently re-opened on September 9, 2020 with COVID-19 safety measures and comprehensive protocols in place as recommended by the CDC. According to the borrower sponsor, foot traffic at the Kings Plaza Property has increased, quickly reaching shopper capacity. In addition, many retailers are exceeding daily sales plans. On May 10, 2021, Macerich's CEO, Thomas O’Hern, reported on a Q1 2021 earnings call it would be announcing a new store commitment for the Kings Plaza Property. As of the date of this term sheet, no further announcement has been made. According to the borrower sponsor, 31 tenants, representing approximately 11.3% of total net rentable area and approximately 20.6% of UW Base Rent, have executed deferment agreements. However, these tenants are currently not in deferment and are paying current rent. Please see below for additional tenant updates:
| Tenant Updates (as of 8/31/2021) | |||
| Renewed leases from October 2020 to September 2021 | - | Vistasite Eye Care, McDonald's, Yong Kang Street, Cookie House, Spencer's, Cinnabon/21 Toppings, Auntie Anne's, M.A.C Cosmetics, Express, PERFUMANIA, GUESS, A|X Armani Exchange, Malsons Jewelers, Cohen's Fashion Optical, City Streets, New Look Salon, Threading Place, Sbarro, Popeye's, Piercing Pagoda, Everything Yogurt & Gretel's Pretzels, All Seasons Marine Corp. and Rainbow (collectively, 7.4% of NRA and 10.1% of UW Base Rent) | |
| New leases from October 2020 to September 2021 | - | Ardene, EPL Diamond, China Wok, Smoothie Bar, Cotton On, Cotton On Kids and Gateway Newsstand (collectively, 2.0% of NRA and 1.7% of UW Base Rent) | |
| Not reopened | - | Master Wok, Nathan's Famous, Haagen Dazs (kiosk) and Starbucks (collectively, 0.8% of NRA and 1.0% of UW Base Rent) | |
| Tenants who have vacated | - | JCPenney, Clique (kiosk), Fashion to Figure, GNC, Landing Gear, New York & Company, NYX, Parfois and Pounds Lifestyle Boutique (collectively, 13.8% of NRA and 4.6% of UW Base Rent) | |
| Bankrupt tenants | - | GNC and JCPenney (collectively, 11.9% of NRA and 2.3% of UW Base Rent) have vacated the premises | |
| - | Forever 21 - the lease was assumed with a term extended to 1/31/2023 (underwritten as vacant) | ||
| - | Charlotte Russe (1.0% of NRA and 0.7% of UW Base Rent) the lease was assumed with a term through 7/31/2021 and the borrower is currently negotiating a 2-year lease renewal | ||
| - | ALDO/ALDO Accessories (0.4% of NRA and 1.5% of UW Base Rent) - the lease was assumed with a term through 1/31/2026 and 1/31/2022, respectively | ||
THE INFORMATION IN THIS STRUCTURAL AND COLLATERAL TERM SHEET IS NOT COMPLETE AND MAY BE AMENDED PRIOR TO THE TIME OF SALE. THIS TERM SHEET IS NOT AN OFFER TO SELL THESE SECURITIES AND IT IS NOT A SOLICITATION OF AN OFFER TO BUY THESE SECURITIES IN ANY JURISDICTION WHERE THE OFFER OR SALE IS NOT PERMITTED.
53
| Structural and Collateral Term Sheet | BBCMS 2021-C11 |
| No. 2 – Kings Plaza |
| Sales Comparison(1) | |||
| YTD June 2019 | YTD June 2021 | % Change | |
| Comparable Inline Tenant Sales <10,000 SF (excluding Fast Food and Restaurants)(2) | $55,040,469 | $57,739,733 | 4.9% |
| Comparable Inline Tenant Sales <10,000 SF | $63,759,494 | $63,807,362 | 0.1% |
| (1) | Due to COVID-19, YTD June 2021 Comparable Inline Tenant Sales are understated because zero dollars were used as estimates for those non-reporting tenants (totaling 49,437 square feet) that were open in any given month. Tenants that did not report YTD June 2021 Sales were removed from YTD June 2019. |
| (2) | Fast Food and Restaurants Gross Inline Sales were excluded due to the indoor dining restriction mandates by the New York State Department of Health that were completely lifted on June 15, 2021. |
Rent collections for May 2020 through July 2021 are detailed in the table below:
| Recent Rent Collections | |||||||||||||||
| May 2020 | Jun. 2020 | Jul. 2020 | Aug. 2020 | Sept. 2020 | Oct. 2020 | Nov. 2020 | Dec. 2020 | Jan. 2021 | Feb. 2021 | Mar. 2021 | Apr. 2021 | May 2021 | Jun. 2021 | Jul. 2021 | |
| Rent Billed (million) | $6.5 | $6.5 | $6.5 | $6.1 | $6.0 | $6.0 | $6.0 | $5.9 | $5.7 | $5.9 | $5.9 | $5.9 | $5.8 | $5.9 | $5.9 |
| Rent Collected (million) | $3.3 | $3.9 | $4.0 | $3.8 | $4.2 | $4.8 | $4.9 | $5.0 | $4.9 | $5.1 | $5.2 | $5.3 | $5.1 | $5.5 | $5.8 |
| Rent Collected (%) | 49.9% | 60.3% | 62.3% | 62.8% | 69.6% | 80.8% | 82.0% | 84.9% | 85.0% | 86.3% | 88.1% | 89.6% | 87.7% | 93.5% | 99.1% |
Since February 1, 2020, new and renewal leases accounting for 80,080 square feet have been executed at the Kings Plaza Property, including 22,802 square feet for Forever 21’s lease assumption and 3-year extension. The Kings Plaza Whole Loan is current through the September 1, 2021 payment date. As of September 1, 2021, the Kings Plaza Whole Loan is not subject to any modification or forbearance request.
Environmental. According to a Phase I environmental assessment dated November 22, 2019, there was no evidence of any recognized environmental conditions at the Kings Plaza Property. The environmental consultant recommended providing secondary containment for drums containing petroleum products or hazardous substances at the Kings Plaza Property and continued compliance with an existing operations and maintenance plan for asbestos-containing materials. See “Description of the Mortgage Pool—Mortgage Pool Characteristics—Environmental Considerations” in the Preliminary Prospectus for additional information.
| Competitive Set Summary(1) | ||||||
| Property | Year Built / Renovated | Total GLA (square feet) | Est. Sales PSF | Est. Occ. | Proximity (miles) | Anchor Tenants |
| Primary Competition | ||||||
| Gateway Center I & II | 2001 / NAP | 1,200,000 | $450 | 97.0% | 6.4 | BJ’s Wholesale Club, Burlington, Home Depot, JCPenney, Shoprite, Target |
| Queens Center | 1973 / 2004 | 1,172,180 | $1,430 | 99.0% | 16.4 | JCPenney, Macy’s |
| Green Acres Mall | 1956 / 2016 | 2,075,000 | $615 | 96.0% | 14.3 | JCPenney, Macy’s, Sears, Kohl’s (Vacant) |
| Secondary Competition | ||||||
| Staten Island Mall | 1972 / 2018 | 1,700,000 | NAV | 92.0% | 19.0 | JCPenney, Macy’s, Primark, Sears (Vacant) |
| Roosevelt Field | 1956 / 2014 | 2,330,000 | $1,200 | 97.0% | 28.7 | Bloomingdale’s, Dick’s Sporting Goods, JCPenney, Macy’s, Neiman Marcus, Nordstrom |
| (1) | Source: Appraisal. |
THE INFORMATION IN THIS STRUCTURAL AND COLLATERAL TERM SHEET IS NOT COMPLETE AND MAY BE AMENDED PRIOR TO THE TIME OF SALE. THIS TERM SHEET IS NOT AN OFFER TO SELL THESE SECURITIES AND IT IS NOT A SOLICITATION OF AN OFFER TO BUY THESE SECURITIES IN ANY JURISDICTION WHERE THE OFFER OR SALE IS NOT PERMITTED.
54
| Structural and Collateral Term Sheet | BBCMS 2021-C11 |
| No. 2 – Kings Plaza |
| Historical and Current Occupancy(1) | |||
| 2018 | 2019 | 2020(2) | Current(2) |
| 97.9% | 99.4% | 96.3% | 97.8% |
| (1) | Historical Occupancies are as of December 31 of each respective year. |
| (2) | Current Occupancy is as of the August 15, 2021 borrower rent roll. 2020 Occupancy and Current Occupancy are inclusive of a prospective replacement tenant for the JCPenney space (11.7% of total net rentable area). JCPenney filed for Chapter 11 bankruptcy on May 15, 2020 and closed its store at the Kings Plaza Property on October 31, 2020. Based on the borrower rent roll as of August 15, 2021, excluding JCPenney, the occupancy is approximately 86.6%. |
The following table presents certain information relating to the historical sales at the Kings Plaza Property.
| Sales and Occupancy Costs(1) | |||||||||
| 2015 Sales PSF | 2016 Sales PSF | 2017 Sales PSF | 2018 Sales PSF | 2019 Sales | 2019 Sales PSF | 2019 Occupancy Cost(2) | Ann. T-6 June 2021 Sales (3) | Ann. T-6 June 2021 Sales PSF (3) | |
| Lowe’s Home Centers | $406 | $398 | $396 | $390 | $45,603,285 | $400 | 6.2% | NAP | NAP |
| H&M | $587 | $601 | $544 | $459 | $11,057,060 | $440 | 19.2% | $8,284,302 | $329 |
| Victoria’s Secret | $839 | $771 | $677 | $704 | $8,588,141 | $714 | 20.3% | $8,426,812 | $700 |
| Old Navy | $454 | $435 | $445 | $412 | $7,321,687 | $401 | 19.7% | $6,285,190 | $344 |
| Ulta Beauty(4) | NAP | NAP | NAP | $593 | $4,083,880 | $374 | 32.8% | NAP | NAP |
| Zara(5) | NAP | NAP | NAP | NAP | $17,502,063 | $518 | 7.2% | $17,970,307 | $532 |
| Total Comparable In-Line Tenant Sales (<10,000 SF) | $695 | $718 | $685 | $734 | $138,380,278 | $736 | 18.6% | $127,614,724 | $669 |
| (1) | Information as provided by the borrower sponsor and only includes tenants reporting sales. |
| (2) | 2019 Occupancy Cost is based on the TTM September 2019 occupancy costs and year end 2019 sales. |
| (3) | The YE 2020 Sales are not shown in the chart above because they do not reflect normalized sales figures at the Kings Plaza Property, as the Kings Plaza Property was forced to close during March 2020 due to the COVID-19 pandemic and subsequently re-opened on September 9, 2020. |
| (4) | Ulta Beauty’s lease commenced in October 2017. |
| (5) | Zara’s lease commenced in August 2018. |
THE INFORMATION IN THIS STRUCTURAL AND COLLATERAL TERM SHEET IS NOT COMPLETE AND MAY BE AMENDED PRIOR TO THE TIME OF SALE. THIS TERM SHEET IS NOT AN OFFER TO SELL THESE SECURITIES AND IT IS NOT A SOLICITATION OF AN OFFER TO BUY THESE SECURITIES IN ANY JURISDICTION WHERE THE OFFER OR SALE IS NOT PERMITTED.
55
| Structural and Collateral Term Sheet | BBCMS 2021-C11 |
| No. 2 – Kings Plaza |
| Top Ten Tenant Summary(1) | ||||||||||
| Tenant | Ratings Moody’s/S&P/ Fitch(2) | Net Rentable Area (SF) | % of Total NRA | UW Base Rent PSF(3) | UW Base Rent(3) | % of Total UW Base Rent(3) | Sales PSF(4) | Occ. Costs(5) | Lease Exp. Date | |
| Lowe’s Home Centers(6) | Baa1/BBB+/NR | 114,000 | 14.0% | $19.30 | $2,200,000 | 5.6% | $400 | 6.2% | 5/31/2028 | |
| Primark(7) | NR/NR/NR | 102,805 | 12.7% | $35.17 | $3,615,390 | 9.2% | NAP | NAP | 7/31/2038 | |
| Burlington | NR/BB+/BB+ | 55,078 | 6.8% | $22.25 | $1,225,485 | 3.1% | $302 | NAP | 7/31/2028 | |
| Best Buy(8) | Baa1/BBB/NR | 53,371 | 6.6% | $52.80 | $2,817,989 | 7.2% | NAP | NAP | 12/31/2022 | |
| Zara | NR/NR/NR | 33,771 | 4.2% | $34.22 | $1,155,688 | 2.9% | $518 | 7.2% | 7/31/2028 | |
| H&M | NR/NR/NR | 25,151 | 3.1% | $88.44 | $2,224,409 | 5.7% | $440 | 19.2% | 1/31/2024 | |
| Old Navy | Baa2/BB/NR | 18,256 | 2.2% | $68.94 | $1,258,638 | 3.2% | $401 | 19.7% | 1/31/2025 | |
| Victoria’s Secret | NR/NR/NR | 12,034 | 1.5% | $69.60 | $837,566 | 2.1% | $714 | 20.3% | 1/31/2023 | |
| Ulta Beauty | NR/NR/NR | 10,924 | 1.3% | $82.50 | $901,230 | 2.3% | $374 | 32.8% | 10/31/2027 | |
| Five Below | NR/NR/NR | 8,874 | 1.1% | $58.00 | $514,692 | 1.3% | $491 | 11.8% | 1/31/2029 | |
| Major Tenants | 434,264 | 53.5% | $38.57 | $16,751,087 | 42.7% | |||||
| Other Tenants | 341,787 | 42.1% | $65.66 | $22,443,027 | 57.3% | |||||
| Occupied Collateral Total / Wtd. Avg.(9) | 776,051 | 95.6% | $50.50 | $39,194,113 | 100.0% | |||||
| Vacant Space(10)(11) | 35,746 | 4.4% | ||||||||
| Collateral Total | 811,797 | 100.0% | ||||||||
| (1) | Based on the underwritten rent roll as of June 2, 2020. |
| (2) | Ratings provided are for the parent company of the entity listed in the “Tenant” field whether or not the parent company guarantees the lease. |
| (3) | UW Base Rent PSF, UW Base Rent and % of Total UW Base Rent reflect the following: (a) in-place leases based on the June 2020 rent roll, where Forever 21 is underwritten as vacant and (b) contractual rent steps of $1,139,421 through February 1, 2021. |
| (4) | Sales PSF are provided by the borrower sponsor and are as of year-end 2019. |
| (5) | Occ. Costs are based on TTM September 2019 occupancy costs and year end 2019 sales. |
| (6) | Lowe’s Home Centers has five automatic five-year renewal options unless Lowe’s Home Centers sends the landlord a nullification notice no later than the last day of the year immediately preceding the last year of the applicable term or renewal. In addition, Lowe’s Home Centers has one automatic renewal option for three years and 11 months unless the tenant sends the landlord a nullification notice no later than the last day of the year immediately preceding the last year of the fifth renewal term. |
| (7) | Primark has the right to terminate its lease on July 7, 2028 with 12 months’ notice provided that, as of the termination date, (i) the tenant is Primark US Corp., or a Primark successor, and (ii) the tenant is not in default of its lease beyond any applicable notice and cure period; provided, however, such termination option will be automatically terminated and of no force or effect if either (a) another Primark store opens for business within a certain radius of the Kings Plaza Property, or (b) the tenant or any of its affiliates owns, operates, otherwise becomes financially interested in any other Primark store or any other store branded under the Primark name within an approximately 10 mile radius of the Kings Plaza Property. |
| (8) | Lease Expiration Date for the Best Buy tenant is reflective of an amendment from the original expiration date. Under the terms of the lease amendment, Best Buy converted to a gross lease structure which will accelerate rental payments in return for a reduced term. The current annual gross rent is $14.0 million through December 31, 2021, after which annual gross rent will step down to $8.0 million thereafter through the lease expiration of December 31, 2022. |
| (9) | Occupied Collateral Total includes All Seasons Marine Corp., which is the ground lease tenant at the Kings Plaza Property and has no underwritten base rent. |
| (10) | Vacant Space is inclusive of Forever 21, which has been underwritten as vacant since it filed for bankruptcy in September 2019. Forever 21 has been in occupancy at the Kings Plaza Property since 2010. Following bankruptcy court proceedings, negotiations for a three-year lease renewal have been approved and Forever 21’s lease has been extended through January 31, 2023. As part of the bankruptcy negotiations, Forever 21 is required to pay 12% of sales. Vacant Space is exclusive of JCPenney (11.7% of total net rentable area), which filed for Chapter 11 bankruptcy on May 15, 2020. JCPenney closed its store at the Kings Plaza Property on October 31, 2020. On May 10, 2021, Macerich's CEO, Thomas O’Hern, reported on a Q1 2021 earnings call it would be announcing a new store commitment for the Kings Plaza Property. As of the date of this term sheet, no further announcement has been made. Based on the August 15, 2021 borrower rent roll, excluding JCPenney, the occupancy is approximately 86.6%. |
| (11) | Vacant space includes 9,065 square feet of space that is occupied by temporary or kiosk tenants with no underwritten base rent. |
THE INFORMATION IN THIS STRUCTURAL AND COLLATERAL TERM SHEET IS NOT COMPLETE AND MAY BE AMENDED PRIOR TO THE TIME OF SALE. THIS TERM SHEET IS NOT AN OFFER TO SELL THESE SECURITIES AND IT IS NOT A SOLICITATION OF AN OFFER TO BUY THESE SECURITIES IN ANY JURISDICTION WHERE THE OFFER OR SALE IS NOT PERMITTED.
56
| Structural and Collateral Term Sheet | BBCMS 2021-C11 |
| No. 2 – Kings Plaza |
| Lease Rollover Schedule(1)(2) | ||||||||||
| Year | Number of Leases Expiring(3) | Net Rentable Area Expiring | % of NRA Expiring | UW Base Rent Expiring(4) | % of UW Base Rent Expiring(4) | Cumulative Net Rentable Area Expiring | Cumulative % of NRA Expiring | Cumulative UW Base Rent Expiring | Cumulative % of UW Base Rent Expiring | |
| Vacant(5)(6) | NAP | 35,746 | 4.4% | NAP | NAP | 35,746 | 4.4% | NAP | NAP | |
| 2020 & MTM(7) | 12 | 42,601 | 5.2 | $3,051,598 | 7.8% | 78,347 | 9.7% | $3,051,598 | 7.8% | |
| 2021 | 7 | 21,346 | 2.6 | 1,511,585 | 3.9 | 99,693 | 12.3% | $4,563,184 | 11.6% | |
| 2022 | 14 | 26,624 | 3.3 | 2,485,936 | 6.3 | 126,317 | 15.6% | $7,049,120 | 18.0% | |
| 2023 | 9 | 24,161 | 3.0 | 2,299,178 | 5.9 | 150,478 | 18.5% | $9,348,298 | 23.9% | |
| 2024 | 10 | 43,309 | 5.3 | 3,868,632 | 9.9 | 193,787 | 23.9% | $13,216,930 | 33.7% | |
| 2025 | 9 | 40,150 | 4.9 | 3,153,268 | 8.0 | 233,937 | 28.8% | $16,370,198 | 41.8% | |
| 2026 | 13 | 41,603 | 5.1 | 3,894,646 | 9.9 | 275,540 | 33.9% | $20,264,843 | 51.7% | |
| 2027 | 8 | 29,981 | 3.7 | 2,567,137 | 6.5 | 305,521 | 37.6% | $22,831,981 | 58.3% | |
| 2028 | 10 | 219,491 | 27.0 | 6,129,071 | 15.6 | 525,012 | 64.7% | $28,961,052 | 73.9% | |
| 2029 | 13 | 35,714 | 4.4 | 3,081,629 | 7.9 | 560,726 | 69.1% | $32,042,681 | 81.8% | |
| 2030 | 0 | 0 | 0.0 | 0 | 0.0 | 560,726 | 69.1% | $32,042,681 | 81.8% | |
| 2031 & Beyond(8) | 3 | 251,071 | 30.9 | 7,151,433 | 18.2 | 811,797 | 100.0% | $39,194,113 | 100.0% | |
| Total | 108 | 811,797 | 100.0% | $39,194,113 | 100.0% | |||||
| (1) | Based on the underwritten rent roll as of June 2, 2020. |
| (2) | Certain tenants may have lease termination options that are exercisable prior to the originally stated expiration date of the subject lease and that are not considered in the lease rollover schedule. |
| (3) | Number of Leases Expiring excludes temporary kiosks and storage units located across the Kings Plaza Property. |
| (4) | UW Base Rent Expiring and % of UW Base Rent Expiring reflect the following: (a) in-place leases based on June 2020 rent roll and (b) contractual rent steps of $1,139,421 through February 1, 2021. |
| (5) | Vacant space includes 9,065 square feet associated with temporary tenants currently in occupancy across the Kings Plaza Property. |
| (6) | Vacant space is inclusive of Forever 21, however the tenant has been underwritten as vacant since it filed for bankruptcy in September 2019. Forever 21 has been in occupancy at the Kings Plaza Property since 2010. Following bankruptcy court proceedings, negotiations for a three-year lease renewal have been approved and Forever 21’s lease has been extended through January 31, 2023. As part of the bankruptcy negotiations, Forever 21 is required to pay 12% of sales. Vacant space is exclusive of JCPenney (11.7% of total net rentable area), which filed for Chapter 11 bankruptcy on May 15, 2020. JCPenney closed its store at the Kings Plaza Property on October 31, 2020. On May 10, 2021, Macerich's CEO, Thomas O’Hern, reported on a Q1 2021 earnings call it would be announcing a new store commitment for the Kings Plaza Property. As of the date of this term sheet, no further announcement has been made. Based on the August 15, 2021 borrower rent roll, excluding JCPenney, the occupancy is approximately 86.6%. |
| (7) | 2020 & MTM includes All Seasons Marine Corp., which is the ground lease tenant at the Kings Plaza Property and has no underwritten base rent. |
| (8) | 2031 & Beyond includes the lease expiration for Best Buy’s initial lease term of January 31, 2032. However, on January 28, 2020, an amendment was executed to reduce the term of the Best Buy lease, which will now expire on December 31, 2022. Under the terms of the lease amendment, Best Buy converted to a gross lease structure, which will accelerate rental payments in return for a reduced term. The current annual gross rent is $14.0 million through December 31, 2021, after which annual gross rent will step down to $8.0 million thereafter through the lease expiration of December 31, 2022. |
THE INFORMATION IN THIS STRUCTURAL AND COLLATERAL TERM SHEET IS NOT COMPLETE AND MAY BE AMENDED PRIOR TO THE TIME OF SALE. THIS TERM SHEET IS NOT AN OFFER TO SELL THESE SECURITIES AND IT IS NOT A SOLICITATION OF AN OFFER TO BUY THESE SECURITIES IN ANY JURISDICTION WHERE THE OFFER OR SALE IS NOT PERMITTED.
57
| Structural and Collateral Term Sheet | BBCMS 2021-C11 |
| No. 2 – Kings Plaza |
| Operating History and Underwritten Net Cash Flow | |||||||
| 2018 | 2019 | 2020 | TTM(1) | Underwritten | Per Square Foot | %(2) | |
| Rents in Place(3) | $33,095,904 | $39,279,984 | $48,653,578 | $43,623,860 | $38,005,038 | $46.82 | 48.5% |
| Straight-Line Rent(4) | 0 | 0 | 0 | 0 | 735,253 | 0.91 | 0.9 |
| Vacant Income | 0 | 0 | 0 | 0 | 2,227,628 | 2.74 | 2.8 |
| Gross Potential Rent | $33,095,904 | $39,279,984 | $48,653,578 | $43,623,860 | $40,967,919 | $50.47 | 52.3% |
| Total Reimbursements | 28,424,111 | 29,231,082 | 26,176,765 | 25,408,230 | 30,961,099 | 38.14 | 39.5 |
| % in Lieu/Percentage Rent(5) | 735,279 | 1,887,225 | 948,473 | 1,701,407 | 2,195,355 | 2.70 | 2.8 |
| Temporary Specialty Leasing | 2,254,340 | 2,286,375 | 1,174,825 | 816,841 | 2,411,429 | 2.97 | 3.1 |
| Power Plant Income | 0 | 1,087,538 | 1,359,011 | 1,467,542 | 1,804,680 | 2.22 | 2.3 |
| Net Rental Income | $64,509,633 | $73,772,205 | $78,312,652 | $73,017881 | $78,340,482 | $96.50 | 100.0% |
| (Vacancy/Credit Loss) | (612,614) | (401,183) | (3,244,080) | 83,262 | (3,678,863) | (4.53) | (4.7) |
| Other Income(6) | 5,787,129 | 5,691,895 | 3,392,919 | 4,574,850 | 6,383,568 | 7.86 | 8.1 |
| Effective Gross Income | $69,684,148 | $79,062,917 | $78,461,491 | $77,675,993 | $81,045,187 | $99.83 | 103.5% |
| Total Expenses | $27,595,961 | $29,497,775 | $31,417,805 | $31,225,049 | $29,004,262 | $35.73 | 35.8% |
| Net Operating Income | $42,088,187 | $49,565,143 | $47,043,686 | $46,450,944 | $52,040,925 | $64.11 | 64.2% |
| Total TI/LC, Capex/RR | 0 | 0 | 0 | 0 | 1,134,955 | 1.40 | 1.4 |
| Net Cash Flow | $42,088,187 | $49,565,143 | $47,043,686 | $46,450,944 | $50,905,970 | $62.71 | 62.8% |
| (1) | TTM represent the trailing 12 month ending June 30, 2021. |
| (2) | Percentage column represents percent of Net Rental Income for all revenue lines and represents percent of Effective Gross Income for the remainder of fields |
| (3) | Underwritten Rents In Place reflects the following: (a) in-place leases based on the June 2020 rent roll where Forever 21 is underwritten as vacant and (b) contractual rent steps of $1,139,421 through February 1, 2021. On January 28, 2020, the Best Buy lease was modified, and a master lease was executed with the borrower sponsor. The second amendment of agreement of lease established a new Best Buy gross rent schedule to pay rent at 105% of the amount of contractual total rent and reimbursements to which the borrower sponsor would be entitled to pursuant to the original Best Buy lease over its entire term, through January 31, 2032. For avoidance of doubt, no COVID-19 specific adjustments have been incorporated in the lender underwriting. |
| (4) | Underwritten Straight-Line Rent of $735,253 for investment grade rated tenants including Best Buy, Old Navy, Michael Kors, Chase, Vans, Verizon Wireless, Haagen-Dazs, Starbucks Coffee and Aeropostale. |
| (5) | % in Lieu/Percentage Rents includes % in lieu for JCPenney, Charlotte Russe and Parfois and reimbursements from the Macy’s Parcel which is not part of the collateral for the Kings Plaza Whole Loan. |
| (6) | Other Income includes storage income, business development income, ground rent income and parking income. |
The Market. The Kings Plaza Property is located in Brooklyn, New York at the intersection of Flatbush Avenue and Avenue U. The Kings Plaza Property has frontage on Flatbush Avenue, which is a major thoroughfare in Brooklyn. Primary access to the Kings Plaza Property is provided via the Belt Parkway, the region’s primary north-south route, situated approximately 3.9 miles northeast of the Kings Plaza Property. The Kings Plaza Property is located approximately 1.4 miles southeast of Kings Highway and is approximately 10.6 miles southwest of the John F. Kennedy International Airport. According to a third-party report, over 69,000 vehicles pass through the area daily and more than 1,000 buses delivering up to 40,000 passengers to the Kings Plaza Property operate each weekday. Per the appraisal, the estimated 2019 population within a one-, three- and five-mile radius of the Kings Plaza Property was 51,596, 601,221 and 1,737,025, respectively and with estimated 2019 average household income of $117,474, $89,529, and $78,194, respectively.
The Kings Plaza Property is located in the South Brooklyn submarket of the New York retail market. According to a third-party report, as of the fourth quarter of 2019, the New York retail market had an inventory of approximately 593.4 million square feet, an overall vacancy rate of 4.0% and average asking rents of $42.34 per square foot. As of August 2019, the South Brooklyn submarket had an inventory of approximately 42.9 million square feet, an overall vacancy rate of 3.1% and average asking rents of approximately $42.31 per square feet. The concluded market rent for the South Brooklyn retail submarket was $42.90 per square foot. As of October 2019, the Kings Plaza Property has a weighted average underwritten base rent of $50.50 per square feet, which is slightly above the market rent for the South Brooklyn retail submarket and the New York retail market.
The Borrowers. The borrowing entities for the Kings Plaza Whole Loan are Brooklyn Kings Plaza LLC and Kings Plaza Ground Lease LLC (collectively, the “Kings Plaza Borrowers”), each organized as a Delaware limited liability company and structured to be bankruptcy remote with two independent directors. Legal counsel to the Kings Plaza Borrowers delivered a non-consolidation opinion in connection with the origination of the Kings Plaza Whole Loan.
The Borrower Sponsor. The borrower sponsor is The Macerich Partnership, L.P. (the “Kings Plaza Guarantor”). The Macerich Partnership, L.P. is part of the parent organization The Macerich Company (“Macerich”) (NYSE:MAC), an S&P 500 company that ranks among the largest owners, operators and developers of retail real estate. Founded in 1964, Macerich has 47 properties in 15 different states with a large concentration in California, Arizona and New York. Additionally, Macerich, reported total revenues of $786 million as of December 31, 2020. Macerich also reported $9.03 billion in total assets under management as of December 31, 2020.
THE INFORMATION IN THIS STRUCTURAL AND COLLATERAL TERM SHEET IS NOT COMPLETE AND MAY BE AMENDED PRIOR TO THE TIME OF SALE. THIS TERM SHEET IS NOT AN OFFER TO SELL THESE SECURITIES AND IT IS NOT A SOLICITATION OF AN OFFER TO BUY THESE SECURITIES IN ANY JURISDICTION WHERE THE OFFER OR SALE IS NOT PERMITTED.
58
| Structural and Collateral Term Sheet | BBCMS 2021-C11 |
| No. 2 – Kings Plaza |
Property Management. The Kings Plaza Property is managed by Macerich Property Management Company, LLC, a Delaware limited liability company and an affiliate of the Kings Plaza Borrowers.
Escrows and Reserves. At origination, the Kings Plaza Borrowers were not required to fund any initial reserves.
Tax Escrows – On a monthly basis, during the continuance of a Trigger Period (as defined below), the Kings Plaza Borrowers are required to reserve 1/12th of the estimated annual property taxes. The monthly tax reserve requirement is waived if (i) no Trigger Period is continuing and (ii) the Kings Plaza Borrowers continue to deliver evidence reasonably satisfactory to the lender that all taxes have been timely paid.
Insurance Escrows – On a monthly basis, during the continuance of a Trigger Period, the Kings Plaza Borrowers are required to reserve 1/12th of the estimated annual insurance premiums. The monthly insurance reserve requirement is waived if (i) no Trigger Period is continuing, (ii) the Kings Plaza Borrowers continue to deliver evidence reasonably satisfactory to the lender that all insurance premiums have been timely paid, and (iii) the Kings Plaza Borrowers provide the lender with evidence that the insurance policies required to be maintained by the Kings Plaza Borrowers are maintained pursuant to blanket policies that comply with the requirements of the Kings Plaza Whole Loan documents.
Replacement Reserves – On a monthly basis, during the continuance of a Trigger Period, the Kings Plaza Borrowers are required to reserve a monthly amount equal to the gross leasable area of the Kings Plaza Property (excluding the Macy’s Parcel and the portion that is occupied by Lowe’s Home Centers and any other tenant that is required to pay for all repairs and maintenance costs for its entire leased premises) multiplied by $0.25 and divided by 12. At such time when the balance of the replacement reserve account reaches an amount equal to 24 times the required monthly deposit, the Kings Plaza Borrowers’ obligation to make monthly deposits into the replacement reserve account will be waived.
TI/LC Reserves – On a monthly basis, during the continuance of a Trigger Period, the Kings Plaza Borrowers are required to reserve an amount equal to the gross leasable area of the Kings Plaza Property (excluding the Macy’s Parcel) multiplied by $1.50 and divided by 12. At such time when the balance of the TI/LC reserve account reaches an amount equal to at least 24 times the required monthly deposit, the Kings Plaza Borrowers’ obligation to make monthly deposits into the TI/LC reserve account will be waived.
Ground Rent Reserve – On a monthly basis, during the continuance of a Trigger Period, the Kings Plaza Borrowers are required to reserve the monthly ground rent payable under the ground lease as described under “Ground Lease” below. However, as long as no Trigger Period has occurred or is continuing, the Kings Plaza Borrowers’ obligations with respect to monthly deposits into the ground rent reserve account will be waived.
Lockbox / Cash Management. The Kings Plaza Whole Loan is structured with a hard lockbox and springing cash management. The Kings Plaza Borrowers were required at loan origination to deliver tenant direction letters to the tenants at the Kings Plaza Property instructing the tenants to deposit all rents and payments directly into a Lender-controlled lockbox account at a deposit bank reasonably acceptable to the Lender (the “Deposit Bank”). In addition, in accordance with the Power Plant Owner Agreement between Kings Plaza Energy LLC (“KPE”), a Delaware limited liability company and an affiliate of the Kings Plaza Borrowers, and the lender, KPE is required to deposit amounts received by KPE directly into a lockbox account established and maintained by KPE at the Deposit Bank. Each of the Kings Plaza Borrowers, the related managers, and KPE is required to deposit any funds it receives into the applicable lockbox account within three business days of receipt. So long as no Trigger Period is continuing, all funds deposited into each lockbox account are required to be transferred to or at the direction of the Kings Plaza Borrowers. Upon the commencement of a Trigger Period, neither the Kings Plaza Borrowers nor KPE will have access to the funds in its lockbox account, and such funds are required to be swept on a weekly basis and on the second business day preceding each payment date into a lender-controlled cash management account.
A “Trigger Period” commences upon (i) an event of default under the Kings Plaza Whole Loan documents; (ii) the commencement of a Low Debt Service Period (as defined below); and (iii) the occurrence of an event of default under the Kings Plaza Mezzanine Loan (as defined below) documents; and ends if (A) with respect to clause (i), the event of default under the Kings Plaza Whole Loan documents has been cured, (B) with respect to clause (ii), the Low Debt Service Period has ended, or (C) with respect to clause (iii), the lender has received notice from the applicable mezzanine lenders that no event of default under the Kings Plaza Mezzanine Loan documents is continuing.
A “Low Debt Service Period” commences if either (i) the debt service coverage ratio under the Kings Plaza Whole Loan is less than 1.43x or (ii) the aggregate debt service coverage ratio under the Kings Plaza Whole Loan and the Kings Plaza Mezzanine Loan is less than 1.25x, and ends (a) with respect to clause (i), if the Kings Plaza Property has achieved a debt service coverage ratio with respect to the Kings Plaza Whole Loan of at least 1.48x, or (b) with respect to clause (ii), if the Kings Plaza Property has achieved an aggregate debt service coverage ratio with respect to the Kings Plaza Whole Loan and the Kings Plaza Mezzanine Loan of at least 1.30x, in each case, for two consecutive calendar quarter.
THE INFORMATION IN THIS STRUCTURAL AND COLLATERAL TERM SHEET IS NOT COMPLETE AND MAY BE AMENDED PRIOR TO THE TIME OF SALE. THIS TERM SHEET IS NOT AN OFFER TO SELL THESE SECURITIES AND IT IS NOT A SOLICITATION OF AN OFFER TO BUY THESE SECURITIES IN ANY JURISDICTION WHERE THE OFFER OR SALE IS NOT PERMITTED.
59
| Structural and Collateral Term Sheet | BBCMS 2021-C11 |
| No. 2 – Kings Plaza |
Subordinate and Mezzanine Debt. Concurrently with the funding of the Kings Plaza Whole Loan, JPMCB, SGFC and WFB funded a mezzanine loan in the amount of $53.0 million (the “Kings Plaza Mezzanine Loan”). The Kings Plaza Mezzanine Loan is secured by the pledge of the direct equity interest in the Kings Plaza Borrowers and is coterminous with the Kings Plaza Whole Loan. The Kings Plaza Mezzanine Loan accrues interest at a rate of 6.00000% per annum and following a five-year interest only period, is fully amortized by the maturity date of January 1, 2030 pursuant to a fixed amortization schedule as set forth in the Kings Plaza Mezzanine Loan documents. Based on the Kings Plaza Whole Loan and the Kings Plaza Mezzanine Loan, the cumulative Cut-off Date LTV is 60.0%, the cumulative UW NCF DSCR is 1.73x and the cumulative UW NOI debt yield is 9.6%. The rights of the related mezzanine lenders under the Kings Plaza Mezzanine Loan are further described under “Description of the Mortgage Pool—Additional Indebtedness—Mezzanine Indebtedness” in the Preliminary Prospectus.
Future Mezzanine or Subordinate Indebtedness Permitted. None, other than a corporate financing agreement with a pledge by the borrower sponsor or its affiliates of their indirect ownership of the Kings Plaza Borrowers, with respect to which, among other requirements, the value of the Kings Plaza Property constitutes no more than 15% of the value of all assets securing such credit facility.
Partial Release. The Kings Plaza Borrowers will have the right to transfer and obtain a release of all or a portion of the parking garage at the Kings Plaza Property for redevelopment, provided, that the redevelopment will not materially impair the use of the garage by customers at the Kings Plaza Property. In addition, the Kings Plaza Borrowers have the right to transfer and obtain the release of all or a portion of the parking garage (such portion of the parking garage, the “Release Parcel”) at the Kings Plaza Property, provided that, among other things: (i) no event of default has occurred and is continuing under the Kings Plaza Whole Loan documents; (ii) the Kings Plaza Borrowers have delivered not less than 30 days’ prior written notice to the lender; (iii) the Kings Plaza Borrowers pay the lender a processing fee in the amount of $15,000 and any additional reasonable costs and expenses incurred by the proposed transfer or release of the Release Parcel; (iv) the net revenue generated by parking operations at the Kings Plaza Property is not diminished by more than a de minimis amount as a result of the release of the Release Parcel; (v) the remaining Kings Plaza Property constitutes a separate tax lot, (vi) the number of parking spaces at the Kings Plaza Property is not reduced to a number below the number of parking spaces required to satisfy zoning requirements; (vii) the satisfaction of REMIC requirements; and (viii) the development of the Release Parcel is restricted for a non-retail use; provided, however, that up to 10% of the gross leasable area may be used for retail purposes; provided, further, that none of the Kings Plaza Borrowers or the Kings Plaza Guarantor may cause or solicit any existing retail tenant at the Kings Plaza Property to lease space at the Release Parcel.
Ground Lease. A portion of the Kings Plaza Property, comprised of the parking garage ingress/egress, the marina building (the “Marina Building”) and a portion of the ground under the parking garage covering a total of 10,278 square feet (1.3% of the net rentable area), is subject to a ground lease with the City of New York. The original lease term expired on May 28, 2018 and the Kings Plaza Borrowers exercised a 10-year extension option, which was their first of five extension options. Three 10-year extension options and one nine-year extension option remain for a fully extended expiration date of May 28, 2067. All Seasons Marine Corp. (the “Subtenant”) currently subleases from the Kings Plaza Borrowers the Marina Building, which is part of the ground leased land that is owned by the City of New York. The initial lease term expired in 2005, subsequent to which the Subtenant extended its sublease on a one- and two-year basis. A one-year extension through November 30, 2021 was executed by the Subtenant. Annual base rent equals $122,957 through the payment date occurring in May 2028. The annual ground lease payment will increase by 20% effective each time an extension term is exercised.
THE INFORMATION IN THIS STRUCTURAL AND COLLATERAL TERM SHEET IS NOT COMPLETE AND MAY BE AMENDED PRIOR TO THE TIME OF SALE. THIS TERM SHEET IS NOT AN OFFER TO SELL THESE SECURITIES AND IT IS NOT A SOLICITATION OF AN OFFER TO BUY THESE SECURITIES IN ANY JURISDICTION WHERE THE OFFER OR SALE IS NOT PERMITTED.
60
(THIS PAGE INTENTIONALLY LEFT BLANK)
THE INFORMATION IN THIS STRUCTURAL AND COLLATERAL TERM SHEET IS NOT COMPLETE AND MAY BE AMENDED PRIOR TO THE TIME OF SALE. THIS TERM SHEET IS NOT AN OFFER TO SELL THESE SECURITIES AND IT IS NOT A SOLICITATION OF AN OFFER TO BUY THESE SECURITIES IN ANY JURISDICTION WHERE THE OFFER OR SALE IS NOT PERMITTED.
61
| Structural and Collateral Term Sheet | BBCMS 2021-C11 | |
| No. 3 – Parkway Irvine | ||

THE INFORMATION IN THIS STRUCTURAL AND COLLATERAL TERM SHEET IS NOT COMPLETE AND MAY BE AMENDED PRIOR TO THE TIME OF SALE. THIS TERM SHEET IS NOT AN OFFER TO SELL THESE SECURITIES AND IT IS NOT A SOLICITATION OF AN OFFER TO BUY THESE SECURITIES IN ANY JURISDICTION WHERE THE OFFER OR SALE IS NOT PERMITTED.
62
| Structural and Collateral Term Sheet | BBCMS 2021-C11 | |
| No. 3 – Parkway Irvine | ||

THE INFORMATION IN THIS STRUCTURAL AND COLLATERAL TERM SHEET IS NOT COMPLETE AND MAY BE AMENDED PRIOR TO THE TIME OF SALE. THIS TERM SHEET IS NOT AN OFFER TO SELL THESE SECURITIES AND IT IS NOT A SOLICITATION OF AN OFFER TO BUY THESE SECURITIES IN ANY JURISDICTION WHERE THE OFFER OR SALE IS NOT PERMITTED.
63
| Structural and Collateral Term Sheet | BBCMS 2021-C11 | |
| No. 3 – Parkway Irvine | ||
| Mortgage Loan Information | Property Information | |||
| Mortgage Loan Seller: | SGFC | Single Asset / Portfolio: | Single Asset | |
| Original Principal Balance: | $37,000,000 | Title: | Fee | |
| Cut-off Date Principal Balance: | $37,000,000 | Property Type - Subtype: | Industrial – Flex | |
| % of IPB: | 3.7% | Net Rentable Area (SF): | 209,831 | |
| Loan Purpose: | Refinance | Location: | Irvine, CA | |
| Borrower: | PFG 2, LLC | Year Built / Renovated: | 1989 / NAP | |
| Borrower Sponsor: | Paul Queyrel | Occupancy: | 88.1% | |
| Interest Rate: | 3.13000% | Occupancy Date: | 8/16/2021 | |
| Note Date: | 8/30/2021 | 4th Most Recent NOI (As of): | NAV | |
| Maturity Date: | 9/1/2031 | 3rd Most Recent NOI (As of): | $3,577,837 (12/31/2019) | |
| Interest-only Period: | 120 months | 2nd Most Recent NOI (As of): | $3,525,552 (12/31/2020) | |
| Original Term: | 120 months | Most Recent NOI (As of): | $3,235,320 (TTM 6/30/2021) | |
| Original Amortization Term: | None | UW Economic Occupancy: | 91.0% | |
| Amortization Type: | Interest Only | UW Revenues: | $4,592,580 | |
| Call Protection: | L(24),YM1(92),O(4) | UW Expenses: | $1,035,456 | |
| Lockbox / Cash Management: | Springing / Springing | UW NOI: | $3,557,125 | |
| Additional Debt: | No | UW NCF: | $3,414,440 | |
| Additional Debt Balance: | N/A | Appraised Value / Per SF: | $62,400,000 / $279 | |
| Additional Debt Type: | N/A | Appraisal Date: | 7/23/2021 | |
| Escrows and Reserves(1) | Financial Information | |||||||||||
| Initial | Monthly | Initial Cap | Cut-off Date Loan / SF: | $176 | ||||||||
| Taxes: | $183,074 | $20,342 | N/A | Maturity Date Loan / SF: | $176 | |||||||
| Insurance: | $20,435 | $4,088 | N/A | Cut-off Date LTV: | 59.3% | |||||||
| Replacement Reserves: | $0 | $3,148 | N/A | Maturity Date LTV: | 59.3% | |||||||
| TI/LC: | $0 | $8,743 | N/A | UW NCF DSCR: | 2.91x | |||||||
| UW NOI Debt Yield: | 9.6% | |||||||||||
| Sources and Uses | ||||||||||||
| Sources | Proceeds | % of Total | Uses | Proceeds | % of Total | |||||||
| Mortgage Loan | $37,000,000 | 100.0% | Loan Payoff | $16,710,009 | 45.2% | |||||||
| Return of Equity | 19,581,101 | 52.9 | ||||||||||
| Closing Costs | 505,381 | 1.4 | ||||||||||
| Reserves | 203,509 | 0.6 | ||||||||||
| Total Sources | $37,000,000 | 100.0% | Total Uses | $37,000,000 | 100.0% | |||||||
| (1) | For a full description of Escrows and Reserves, please refer to “Escrows and Reserves” below. |
The Loan. The Parkway Irvine mortgage loan is secured by a first lien mortgage on the borrower’s fee interest in a 209,831 square foot industrial property located in Irvine, California (the “Parkway Irvine Property”). The Parkway Irvine mortgage loan was originated by SGFC and has an outstanding principal balance as of the Cut-off Date of $37.0 million (the “Parkway Irvine Mortgage Loan”). The Parkway Irvine Mortgage Loan has a 10-year term and is interest-only for the entire term.
The Property. The Parkway Irvine Property is a 209,831 square foot multi-tenant industrial flex property consisting of 12 buildings that were developed in 1989. The Parkway Irvine Property building mix includes: ten, single-story flex buildings and two, two-story office/flex buildings situated on a 13.71-acre site. The Parkway Irvine Property is comprised of 138,615 square feet of flex space and 71,215 square feet of office space. The Parkway Irvine Property features clear ceiling heights of 16 feet. Parking is provided via 686 surface parking spaces, resulting in a parking ratio of approximately 3.27 spaces per 1,000 square feet. As of August 16, 2021, the Parkway Irvine Property was 88.1% leased to 78 tenants, with no tenant occupying over 3.4% of the net rentable area.
THE INFORMATION IN THIS STRUCTURAL AND COLLATERAL TERM SHEET IS NOT COMPLETE AND MAY BE AMENDED PRIOR TO THE TIME OF SALE. THIS TERM SHEET IS NOT AN OFFER TO SELL THESE SECURITIES AND IT IS NOT A SOLICITATION OF AN OFFER TO BUY THESE SECURITIES IN ANY JURISDICTION WHERE THE OFFER OR SALE IS NOT PERMITTED.
64
| Structural and Collateral Term Sheet | BBCMS 2021-C11 | |
| No. 3 – Parkway Irvine | ||
COVID-19 Update. As of August 31, 2021, the Parkway Irvine Property is open and operating. Tenants representing approximately 100% of the occupied square footage at the Parkway Irvine Property and approximately 100% of the underwritten base rent made their July 2021 rental payments. According to the borrower sponsor, the Parkway Irvine Property’s performance was relatively unaffected by the COVID-19 pandemic in 2020. Reportedly, there were only approximately four tenants that requested rent relief. Relief was provided in the form of deferment or partial rent payments from mid-2020 to late 2020 or free rent or abatement periods for tenants facing lease maturity or renewal. According to the borrower sponsor, no lease was modified as a result of the COVID-19 pandemic except TriQuest Café (0.8% NRA; 1.0% of underwritten base rent). Pursuant to TriQuest Café’s June 2020 renewal, the tenant was provided 3 months of half rent for COVID-19 relief. As of the date of this term sheet, the Parkway Irvine Mortgage Loan is not subject to any modification or forbearance requests.
Major Tenants.
RJE International, Inc. (7,169 square feet; 3.4% NRA; 4.0% of underwritten base rent): RJE International, Inc. (“RJE International”) was founded in 1991 in Irvine, California. RJE International is a leading manufacturer of mission critical products for military divers, offshore and marine scientific communities, search and rescue teams. RJE International’s customers include the US Navy, Army, Air Force and all major branches of the U.S. Government, as well as most major foreign governments and commercial customers in over 50 countries worldwide. RJE International has been a tenant at the Park Irvine Property since 2020 under a lease with an expiration date of August 2023, with no renewal or termination options.
Jacob & Hefner (7,004 square feet; 3.3% NRA; 3.6% of underwritten base rent): Jacob & Hefner was founded in 1996 and is headquartered in Downers Grove, Illinois. Jacob & Hefner is a civil engineering, land surveying and environmental services firm with locations in Illinois, California, Georgia, Texas and Washington. Jacob & Hefner has been a tenant at the Park Irvine Property since 2016 with an expiration date of March 2026 with one, five-year renewal option remaining and no termination options.
Genterra Consultants (6,572 square feet; 3.1% NRA; 3.3% of underwritten base rent): Genterra Consultants (“Genterra”) was founded in 1995 and is headquartered in Irvine, California. Genterra offers a full range of engineering and geotechnical consulting services for all types of projects, with an emphasis on those involving proposed, new, and existing dams and reservoirs, levees, pumped storage, and other water storage, water conveyance, flood control, and infrastructure facilities. Genterra has been a tenant at the Park Irvine Property since 2010 under a lease with an expiration date of October 2022, which includes no renewal or termination options.
Environmental. According to a Phase I environmental assessment dated August 18, 2021, there was no evidence of any recognized environmental conditions at the Parkway Irvine Property.
| Historical and Current Occupancy | |||
| 2018(1) | 2019(1) | 2020(1) | Current(2) |
| 98.0% | 97.0% | 96.0% | 88.1% |
| (1) | Historical Occupancies are as of December 31 of each respective year. |
| (2) | Current Occupancy is as of August 16, 2021. |
THE INFORMATION IN THIS STRUCTURAL AND COLLATERAL TERM SHEET IS NOT COMPLETE AND MAY BE AMENDED PRIOR TO THE TIME OF SALE. THIS TERM SHEET IS NOT AN OFFER TO SELL THESE SECURITIES AND IT IS NOT A SOLICITATION OF AN OFFER TO BUY THESE SECURITIES IN ANY JURISDICTION WHERE THE OFFER OR SALE IS NOT PERMITTED.
65
| Structural and Collateral Term Sheet | BBCMS 2021-C11 | |
| No. 3 – Parkway Irvine | ||
| Top Tenant Summary(1) | |||||||
| Tenant | Ratings Moody’s/S&P/Fitch(2) | Net Rentable Area (SF) | % of Total NRA | UW Base Rent PSF(3) | UW Base Rent(3) | % of Total UW Base Rent | Lease Exp. Date |
| RJE International | NR / NR / NR | 7,169 | 3.4% | $20.52 | $147,108 | 4.0% | 8/31/2023 |
| Jacob & Hefner(4) | NR / NR / NR | 7,004 | 3.3 | $19.20 | $134,477 | 3.6% | 3/31/2026 |
| Genterra Consultants | NR / NR / NR | 6,572 | 3.1 | $18.72 | $123,028 | 3.3% | 10/31/2022 |
| Stepping Forward Counseling Center | NR / NR / NR | 6,410 | 3.1 | $21.08 | $135,136 | 3.7% | Various(5) |
| Earthlabs, Inc. | NR / NR / NR | 5,713 | 2.7 | $20.32 | $116,069 | 3.1% | 6/30/2023 |
| Major Tenants | 32,868 | 15.7% | $19.95 | $655,817 | 17.7% | ||
| Other Tenants | 152,031 | 72.5% | $20.03 | $3,045,023 | 82.3% | ||
| Occupied Collateral Total / Wtd. Avg. | 184,899 | 88.1% | $20.02 | $3,700,841 | 100.0% | ||
| Vacant Space | 24,932 | 11.9% | |||||
| Collateral Total | 209,831 | 100.0% | |||||
| (1) | Based on the underwritten rent roll dated August 16, 2021. |
| (2) | Ratings provided are for the parent company of the entity, whether or not the parent company guarantees the lease. |
| (3) | UW Base Rent PSF and UW Base Rent includes (i) forward starting leases and adjustments for prorated rents totaling approximately $273,176 and (ii) underwritten contractual rent steps totaling approximately $29,775 through February 2022. |
| (4) | Jacob & Hefner has one, five-year renewal option remaining. |
| (5) | Stepping Forward Counseling Center occupies two suites within the Parkway Irvine Property under two separate leases. One lease for 5,714 square feet has an expiration date of December 31, 2025 and one lease for 696 square feet has an expiration date of February 28, 2022. |
| Lease Rollover Schedule(1)(2) | |||||||||
| Year | Number of Leases Expiring | Net Rentable Area Expiring | % of NRA Expiring | UW Base Rent Expiring(3) | % of UW Base Rent Expiring(3) | Cumulative Net Rentable Area Expiring | Cumulative % of NRA Expiring | Cumulative UW Base Rent Expiring | Cumulative % of UW Base Rent Expiring |
| Vacant | NAP | 24,932 | 11.9% | NAP | NAP | 24,932 | 11.9% | NAP | NAP |
| 2021 & MTM | 5 | 9,634 | 4.6 | $189,057 | 5.1% | 34,566 | 16.5% | $189,057 | 5.1% |
| 2022 | 27 | 53,791 | 25.6 | $1,078,674 | 29.1 | 88,357 | 42.1% | $1,267,731 | 34.3% |
| 2023 | 21 | 55,742 | 26.6 | $1,133,595 | 30.6 | 144,099 | 68.7% | $2,401,326 | 64.9% |
| 2024 | 16 | 35,451 | 16.9 | $691,308 | 18.7 | 179,550 | 85.6% | $3,092,634 | 83.6% |
| 2025 | 4 | 11,029 | 5.3 | $234,187 | 6.3 | 190,579 | 90.8% | $3,326,821 | 89.9% |
| 2026 | 3 | 12,980 | 6.2 | $249,216 | 6.7 | 203,559 | 97.0% | $3,576,037 | 96.6% |
| 2027 | 0 | 0 | 0.0 | $0 | 0.0 | 203,559 | 97.0% | $3,576,037 | 96.6% |
| 2028 | 0 | 0 | 0.0 | $0 | 0.0 | 203,559 | 97.0% | $3,576,037 | 96.6% |
| 2029 | 0 | 0 | 0.0 | $0 | 0.0 | 203,559 | 97.0% | $3,576,037 | 96.6% |
| 2030 | 1 | 2,608 | 1.2 | $54,455 | 1.5 | 206,167 | 98.3% | $3,630,492 | 98.1% |
| 2031 | 0 | 0 | 0.0 | $0 | 0.0 | 206,167 | 98.3% | $3,630,492 | 98.1% |
| 2032 & Beyond | 1 | 3,664 | 1.7 | $70,349 | 1.9 | 209,831 | 100.0% | $3,700,841 | 100.0% |
| Total | 78 | 209,831 | 100.0% | $3,700,841 | 100.0% | ||||
| (1) | Based on the underwritten rent roll dated August 16, 2021. |
| (2) | Certain tenants have more than one lease. Certain tenants may have lease termination options that are exercisable prior to the originally stated expiration date of the subject lease and that are not considered in the lease rollover schedule. |
| (3) | UW Base Rent Expiring and Cumulative UW Base Rent Expiring include (i) forward starting leases and adjustments for prorated rents totaling approximately $273,176 and (ii) underwritten contractual rent steps totaling approximately $29,775 through February 2022. |
THE INFORMATION IN THIS STRUCTURAL AND COLLATERAL TERM SHEET IS NOT COMPLETE AND MAY BE AMENDED PRIOR TO THE TIME OF SALE. THIS TERM SHEET IS NOT AN OFFER TO SELL THESE SECURITIES AND IT IS NOT A SOLICITATION OF AN OFFER TO BUY THESE SECURITIES IN ANY JURISDICTION WHERE THE OFFER OR SALE IS NOT PERMITTED.
66
| Structural and Collateral Term Sheet | BBCMS 2021-C11 | |
| No. 3 – Parkway Irvine | ||
| Operating History and Net Cash Flow | |||||||
| 2019 | 2020 | TTM(1) | Underwritten | Per Square Foot | %(2) | ||
| Rents in Place(3) | $3,644,894 | $3,674,783 | $3,452,211 | $4,156,998 | $19.81 | 82.3% | |
| Vacant Income | 0 | 0 | 0 | 0 | 0.00 | 0.0 | |
| Gross Potential Rent | $3,644,894 | $3,674,783 | $3,452,211 | $4,156,998 | $19.81 | 82.3% | |
| Total Reimbursements | 980,164 | 939,627 | 879,670 | 891,740 | 4.25 | 17.7 | |
| Net Rental Income | $4,625,058 | $4,614,411 | $4,331,881 | $5,048,738 | $24.06 | 100.0% | |
| (Vacancy/Credit Loss) | (3,635) | (28,054) | (28,054) | (456,157) | (2.17) | (9.0) | |
| Other Income 1 | 9,614 | (398) | (398) | 0 | 0.00 | 0.0 | |
| Other Income 2 | 36,952 | 9,794 | 3,846 | 0 | 0.00 | 0.0 | |
| Effective Gross Income | $4,667,989 | $4,595,752 | $4,307,275 | $4,592,580 | $21.89 | 91.0% | |
| Total Expenses | $1,090,153 | $1,070,201 | $1,071,955 | $1,035,456 | $ 4.93 | 22.5% | |
| Net Operating Income | $3,577,837 | $3,525,552 | $3,235,320 | $3,557,125 | $16.95 | 77.5% | |
| Capital Expenditures | 0 | 0 | 0 | 37,770 | 0.18 | 0.8 | |
| TI/LC | 0 | 0 | 0 | 104,916 | 0.50 | 2.3 | |
| Net Cash Flow | $3,577,837 | $3,525,552 | $3,235,320 | $3,414,440 | $16.27 | 74.3% | |
| (1) | TTM reflects the trailing 12 month period ending June 30, 2021. |
| (2) | % column represents percent of Net Rental Income for all revenue lines and represents percent of Effective Gross Income for the remainder of fields. |
| (3) | Underwritten Rents in Place is based on the August 16, 2021 rent roll and includes (i) forward starting leases and adjustments for prorated rents totaling approximately $273,176, (ii) underwritten contractual rent steps totaling approximately $29,775 through February 2022 and (iii) underwritten vacant income totaling $456,157. |
The Market. The Parkway Irvine Property is located in the city of Irvine in Orange County, California within the Los-Angeles-Long Beach-Anaheim, CA metropolitan statistical area (the “Los Angeles MSA”). The Parkway Irvine Property is located approximately 46 miles southeast of the Los Angeles central business district, in the Irvine Spectrum community of Orange County. Irvine Spectrum is one of the nation’s growing business centers and is known for industry clusters that include large companies within software, computer hardware, biotech, medical devices, broadband communications and automotive design industries.
Access to the Parkway Irvine Property neighborhood is provided via Interstate 5, Interstate 405 and the Costa Mesa Freeway. The area immediately surrounding the Parkway Irvine Property consists of office, commercial, industrial and residential uses. Development in proximity to the Parkway Irvine Property includes Irvine Spectrum Center, Irvine Station and Orange County Great Park. The Irvine Spectrum Center is an outdoor shopping center located less than one mile west of the Parkway Irvine Property. Irvine Spectrum is approximately 1.2 million square feet and includes various restaurants, a movie theatre and a wide range of shopping opportunities including smaller boutique shops, and regional stores such as Target and Nordstrom. The Irvine Station is a growing transportation hub in South Orange County serving over a million commuters annually. The Irvine Transportation Center and Rail Station is currently served by Amtrak and Metrolink passenger rail services, as well as being a hub for express, local and rail-feeder bus services operated by the Orange County transportation authority. The Orange County Great Park features 1,300 acres of parks, amenities, attractions, and open space. According to the appraisal, the 2021 population within a one-, three- and five-mile radius of the Parkway Irvine Property is 5,963, 97,508 and 335,188, respectively. The 2021 average household income within the same radii is $127,943, $147,766 and $142,365, respectively.
According to the appraisal, the Parkway Irvine Property is located in the Orange County industrial market and the South Orange County industrial submarket. As of the second quarter of 2021, the Orange County industrial market contained approximately 257.5 million square feet of inventory with a vacancy rate of 2.0% and an average asking rental rate of $13.56 per square foot. As of the second quarter of 2021, the Orange County industrial market reported year to date positive absorption of 332,087 square feet and approximately 2.1 million square feet under construction. As of the second quarter of 2021, the South Orange County industrial submarket reported inventory of approximately 33.6 million square feet with a vacancy rate of 2.3% and an average annual asking rental rate of $16.08 per square foot. As of the second quarter of 2021, the South Orange County industrial submarket reported negative absorption of 187,851 square feet and no new construction. The appraiser provided seven comparable industrial leases to analyze the Parkway Irvine Property’s attainable flex rent. The comparable leases ranged in size from 1,508 to 5,307 square feet and the appraiser concluded to a market flex rent of $19.20 per square foot.
THE INFORMATION IN THIS STRUCTURAL AND COLLATERAL TERM SHEET IS NOT COMPLETE AND MAY BE AMENDED PRIOR TO THE TIME OF SALE. THIS TERM SHEET IS NOT AN OFFER TO SELL THESE SECURITIES AND IT IS NOT A SOLICITATION OF AN OFFER TO BUY THESE SECURITIES IN ANY JURISDICTION WHERE THE OFFER OR SALE IS NOT PERMITTED.
67
| Structural and Collateral Term Sheet | BBCMS 2021-C11 | |
| No. 3 – Parkway Irvine | ||
| Comparable Industrial Rental Summary(1) | ||||||||
| Property Name/Location | Year Built | Occ. | Size (SF) | Tenant | Suite Size (SF) | Rent PSF | Commencement | Lease Term (Months) |
Parkway Irvine 15375 Barranca Parkway Irvine, CA | 1989 | 88.1%(2) | 209,831(2) | Various(2) | Various(2) | $20.02(2) | Various(2) | Various(2) |
One Technology 1 Technology Drive Irvine, CA | 1990 | 100.0% | 23,252 | Tumble N’ Dots | 1,508 | $21.60 | Aug-20 | 24 |
Irvine Center Tech Park 8889-8909 Irvine Center Drive Irvine, CA | 2005 | 100.0% | 9,920 | iConn Technologies | 4,500 | $21.60 | Mar-20 | 36 |
Irvine Spectrum 5 26 Edelman Irvine, CA | 2004 | 100.0% | 15,000 | PCB Piezotronics | 5,140 | $15.00 | Jan-20 | 37 |
Crescent Bay Business Center 20505 Crescent Bay Drive Lake Forest, CA | 2001 | 100.0% | 7,192 | Invitrx Therapeutics | 3,183 | $15.00 | Oct-20 | 60 |
Jamboree Plaza 3065 Edinger Avenue Tustin, CA | 1999 | 100.0% | 5,307 | NAV | 5,307 | $17.52 | Jun-20 | NAP |
Dow Business Center 3002 Dow Avenue Tustin, CA | 1987 | 90.0% | 192,125 | NAV | 2,030 | $17.40 | Apr-20 | NAP |
Technology Plaza I & II 16-18 Technology Drive Irvine, CA 92618 | 1989 | 88.0% | 317,387 | Silverpoint Advisors | 3,051 | $19.32 | May-21 | 36 |
| (1) | Source: Appraisal. |
| (2) | Based on the underwritten rent roll dated August 16, 2021. |
| Comparable Office Rental Summary(1) | ||||||||
| Property Name/Location | Year Built | Occ. | Size (SF) | Tenant | Suite Size (SF) | Rent PSF | Commencement | Lease Term (Months) |
Parkway Irvine 15375 Barranca Parkway Irvine, CA | 1989 | 88.1%(2) | 209,831(2) | Various(2) | Various(2) | $20.02(2) | Various(2) | Various(2) |
16 Technology 16 Technology Irvine, CA | 1987 | 88.0% | 120,123 | Campus Crusade for Christ | 2,309 | $17.52 | Nov-20 | 6 |
Oak Creek Business Center 6400 Oak Canyon Irvine, CA | 2002 | 100.0% | 49,422 | Sega | 12,517 | $19.56 | Feb-21 | 12 |
Discovery Park 15420 Laguna Canyon Road Irvine, CA | 2000 | 83.0% | 54,720 | NAV | 7,036 | $20.40 | Nov-20 | 22 |
Irvine Business Center 7535 Irvine Center Drive Irvine, CA | 1999 | 100.0% | NAV | Lantronix | 26,897 | $20.40 | Sep-20 | 24 |
Lakeview Business Center 15370 Barranca Parkway Irvine, CA | 1991 | 100.0% | 47,039 | Sensormatic Electronics | 47,039 | $21.00 | Oct-19 | 60 |
| (1) | Source: Appraisal. |
| (2) | Based on the underwritten rent roll dated August 16, 2021. |
THE INFORMATION IN THIS STRUCTURAL AND COLLATERAL TERM SHEET IS NOT COMPLETE AND MAY BE AMENDED PRIOR TO THE TIME OF SALE. THIS TERM SHEET IS NOT AN OFFER TO SELL THESE SECURITIES AND IT IS NOT A SOLICITATION OF AN OFFER TO BUY THESE SECURITIES IN ANY JURISDICTION WHERE THE OFFER OR SALE IS NOT PERMITTED.
68
| Structural and Collateral Term Sheet | BBCMS 2021-C11 | |
| No. 3 – Parkway Irvine | ||
The following table presents certain information relating to comparable sales for the Parkway Irvine Property:
| Comparable Sales(1) | ||||||
| Property Location | Sale Date | Total NRA (SF) | Total Occupancy | Sale Price | Sale Price PSF | Adjusted Sales Price PSF |
Parkway Irvine Irvine, CA | NAP | 209,831(2) | 88.1%(2) | NAP | NAP | NAP |
Paramount Business Center (Portion of) Paramount, CA | Dec-2020 | 61,691 | 100.0% | $15,900,000 | $257.74 | $281.30 |
Sacher Industrial Portfolio Santa Ana, CA | Dec-2020 | 40,000 | 100.0% | $9,001,522 | $225.04 | $309.88 |
Raymer Business Park Fullerton, CA | Jan-2021 | 79,764 | 98.0% | $17,675,000 | $221.59 | $279.76 |
Vector Carlsbad, CA | Jun-2020 | 169,825 | 100.0% | $44,000,000 | $259.09 | $245.51 |
Flex Building Tustin, CA | Apr-2019 | 44,123 | 100.0% | $15,550,000 | $352.42 | $309.21 |
Kilroy Brea Industrial Complex Brea, CA | Dec-2020 | 169,269 | 100.0% | $39,750,000 | $234.83 | $268.27 |
Allred Corporate Center Lake Forest, CA | Apr-2020 | 155,665 | 100.0% | $38,816,227 | $249.36 | $249.36 |
(1) Source: Appraisal.
(2) Based on the underwritten rent roll dated August 16, 2021.
The Borrower. The borrower for the Parkway Irvine Mortgage Loan is PFG 2, LLC, a Delaware limited liability company and special purpose entity with one independent director. Legal counsel to the borrower delivered a non-consolidation opinion in connection with the origination of the Parkway Irvine Mortgage Loan.
The Borrower Sponsor. Paul Queyrel is the borrower sponsor and guarantor of certain nonrecourse carveouts under the Parkway Irvine Mortgage Loan. Paul Queyrel is the president of TriQuest Development Company. Mr. Queyrel has been involved in real estate for over 50 years and throughout his career has developed industrial and research and development space in the Irvine Business complex and Irvine Spectrum.
Property Management. The Parkway Irvine Property is managed by TriQuest Development Company, an affiliate of the borrower sponsor.
Escrows and Reserves. At origination, the borrower was required to deposit into escrow $183,074 for a real estate tax reserve and $20,435 for an insurance reserve.
Tax Escrows – On a monthly basis, the borrower is required to escrow 1/12th of the annual estimated tax payments, which currently equates to $20,342.
Insurance Escrows – On a monthly basis, the borrower is required to escrow 1/12th of the annual estimated insurance premiums, which currently equates to $4,088.
Replacement Reserve – On a monthly basis, the borrower is required to escrow 1/12th of the product obtained by multiplying $0.18 by the aggregate number of rentable square feet of space in the Parkway Irvine Property, which equates to $3,148.
TI/LC Reserve – On a monthly basis, the borrower is required to escrow 1/12th of the product obtained by multiplying $0.50 by the aggregate number of rentable square feet of space in the Parkway Irvine Property, which equates to $8,743.
Lockbox / Cash Management. The Parkway Irvine Mortgage Loan documents require a springing lockbox with springing cash management. During a Cash Management Period (as defined below) the borrower is required to cause all rents relating to the Parkway Irvine Property to be transmitted directly by tenants into a lender-controlled lockbox account and all rents received by the borrower or the property manager are required to be deposited into the lockbox account within one business day of receipt. As long as no Cash Management Period is in effect, funds deposited into the lockbox account are required to be transferred to the borrower’s operating account on a daily basis. Upon the occurrence of a Cash Management Period, all sums on deposit in the lockbox account are required to be transferred on a daily basis to a cash management account controlled by the lender and applied and disbursed in accordance with the Parkway Irvine Mortgage Loan documents. Available cash on deposit will be applied as follows: (a) during a Cash Management Period, to the borrower or (b) to the extent that a Cash Management Period is in effect, to the cash collateral subaccount.
THE INFORMATION IN THIS STRUCTURAL AND COLLATERAL TERM SHEET IS NOT COMPLETE AND MAY BE AMENDED PRIOR TO THE TIME OF SALE. THIS TERM SHEET IS NOT AN OFFER TO SELL THESE SECURITIES AND IT IS NOT A SOLICITATION OF AN OFFER TO BUY THESE SECURITIES IN ANY JURISDICTION WHERE THE OFFER OR SALE IS NOT PERMITTED.
69
| Structural and Collateral Term Sheet | BBCMS 2021-C11 | |
| No. 3 – Parkway Irvine | ||
A “Cash Management Period” means the occurrence of (i) the stated maturity date of September 1, 2031, (ii) an event of default, or (iii) a debt service coverage ratio less than 1.70x as of any calculation date, and will end, as applicable, if (1) the Parkway Irvine Mortgage Loan and all other obligations under the Parkway Irvine Mortgage Loan documents have been repaid in full or (2) the stated maturity date has not occurred and, (a) with respect to clause (ii) above, once the event of default has been cured and no other event of default has occurred and is continuing, or (b) with respect to clause (iii) above, the debt service coverage ratio is at least equal to 1.70x for two consecutive calendar quarters.
Subordinate and Mezzanine Debt. None.
Partial Release. Not permitted.
Ground Lease. None.
THE INFORMATION IN THIS STRUCTURAL AND COLLATERAL TERM SHEET IS NOT COMPLETE AND MAY BE AMENDED PRIOR TO THE TIME OF SALE. THIS TERM SHEET IS NOT AN OFFER TO SELL THESE SECURITIES AND IT IS NOT A SOLICITATION OF AN OFFER TO BUY THESE SECURITIES IN ANY JURISDICTION WHERE THE OFFER OR SALE IS NOT PERMITTED.
70
(THIS PAGE INTENTIONALLY LEFT BLANK)
THE INFORMATION IN THIS STRUCTURAL AND COLLATERAL TERM SHEET IS NOT COMPLETE AND MAY BE AMENDED PRIOR TO THE TIME OF SALE. THIS TERM SHEET IS NOT AN OFFER TO SELL THESE SECURITIES AND IT IS NOT A SOLICITATION OF AN OFFER TO BUY THESE SECURITIES IN ANY JURISDICTION WHERE THE OFFER OR SALE IS NOT PERMITTED.
71
| Structural and Collateral Term Sheet | BBCMS 2021-C11 | |
| No. 4 – Broadacres Office Park | ||

THE INFORMATION IN THIS STRUCTURAL AND COLLATERAL TERM SHEET IS NOT COMPLETE AND MAY BE AMENDED PRIOR TO THE TIME OF SALE. THIS TERM SHEET IS NOT AN OFFER TO SELL THESE SECURITIES AND IT IS NOT A SOLICITATION OF AN OFFER TO BUY THESE SECURITIES IN ANY JURISDICTION WHERE THE OFFER OR SALE IS NOT PERMITTED.
72
| Structural and Collateral Term Sheet | BBCMS 2021-C11 | |
| No. 4 – Broadacres Office Park | ||

THE INFORMATION IN THIS STRUCTURAL AND COLLATERAL TERM SHEET IS NOT COMPLETE AND MAY BE AMENDED PRIOR TO THE TIME OF SALE. THIS TERM SHEET IS NOT AN OFFER TO SELL THESE SECURITIES AND IT IS NOT A SOLICITATION OF AN OFFER TO BUY THESE SECURITIES IN ANY JURISDICTION WHERE THE OFFER OR SALE IS NOT PERMITTED.
73
| Structural and Collateral Term Sheet | BBCMS 2021-C11 | |
| No. 4 – Broadacres Office Park | ||
| Mortgage Loan Information | Property Information | |||
| Mortgage Loan Seller: | Natixis | Single Asset / Portfolio: | Single Asset | |
| Original Principal Balance: | $33,000,000 | Title: | Fee | |
| Cut-off Date Principal Balance: | $33,000,000 | Property Type – Subtype: | Office – Suburban | |
| % of IPB: | 3.3% | Net Rentable Area (SF): | 396,226 | |
| Loan Purpose: | Acquisition | Location: | Bloomfield, NJ | |
| Borrowers(1): | Various | Year Built / Renovated: | 1975-1976 / 2000-2001 | |
| Borrower Sponsor: | Ercument Tokat | Occupancy: | 90.1% | |
| Interest Rate: | 3.54540% | Occupancy Date: | 4/1/2021 | |
| Note Date: | 4/21/2021 | 4th Most Recent NOI (As of)(4): | NAV | |
| Maturity Date: | 5/5/2026 | 3rd Most Recent NOI (As of)(4): | $2,857,549 (12/31/2018) | |
| Interest-only Period: | 60 months | 2nd Most Recent NOI (As of)(4): | $3,564,754 (12/31/2019) | |
| Original Term: | 60 months | Most Recent NOI (As of)(5): | $3,385,473 (12/31/2020) | |
| Original Amortization Term: | None | UW Economic Occupancy: | 89.4% | |
| Amortization Type: | Interest Only | UW Revenues: | $9,055,911 | |
| Call Protection: | L(28),YM1(29),O(3) | UW Expenses: | $4,169,328 | |
| Lockbox / Cash Management: | Hard / In Place | UW NOI(5): | $4,886,583 | |
| Additional Debt(2): | Yes | UW NCF: | $4,429,207 | |
| Additional Debt Balance(2): | $7,000,000 | Appraised Value / Per SF: | $56,200,000 / $142 | |
| Additional Debt Type(2): | Mezzanine | Appraisal Date: | 4/1/2021 | |
| Escrows and Reserves(3) | Financial Information(2) | |||||||||
| Initial | Monthly | Initial Cap | Senior Loan | Total Debt | ||||||
| Taxes: | $115,089 | $115,066 | N/A | Cut-off Date Loan / SF: | $83 | $101 | ||||
| Insurance: | $27,928 | $9,104 | N/A | Maturity Date Loan / SF: | $83 | $101 | ||||
| Replacement Reserves: | $0 | $4,941 | N/A | Cut-off Date LTV: | 58.7% | 71.2% | ||||
| TI/LC Reserve: | $1,400,000 | $33,162 | N/A | Maturity Date LTV: | 58.7% | 71.2% | ||||
| Upfront TI/LC Reserve: | $1,120,410 | $0 | N/A | UW NCF DSCR: | 3.73x | 2.43x | ||||
| Rent Abatement Reserve: | $406,844 | $0 | N/A | UW NOI Debt Yield: | 14.8% | 12.2% | ||||
| Immediate Repairs Reserve: | $21,563 | $0 | N/A | |||||||
| Sources and Uses | ||||||||||
| Sources | Proceeds | % of Total | Uses | Proceeds | % of Total | |||||
| Mortgage Loan | $33,000,000 | 55.7% | Purchase Price | $52,000,000 | 87.7% | |||||
| Borrower Sponsor Equity | 19,261,556 | 32.5 | Closing Cost | 4,169,722 | 7.0 | |||||
| Mezzanine Loan | 7,000,000 | 11.8 | Reserves | 3,091,834 | 5.2 | |||||
| Total Sources | $59,261,556 | 100.0% | Total Uses | $59,261,556 | 100.0% | |||||
| (1) | For a more detailed description of the Borrowers, see “The Borrowers” below. |
| (2) | Concurrently with the origination of the Broadacres Office Park Mortgage Loan (as defined below), a $7.0 million Broadacres Office Park Mezzanine Loan (as defined below) was originated. For a full description of the mezzanine loan, please refer to the “Subordinate and Mezzanine Debt” section below. |
| (3) | For a full description of Escrows and Reserves, see “Escrows and Reserves” below. |
| (4) | Historical NOI prior to 2018 is unavailable due to the acquisition nature of the transaction. The increase in NOI from 2018 to 2019 was driven by (i) the increase in total base rent, (ii) the end of tenants’ free rent period and (iii) saving on the repair and maintenance. |
| (5) | The increase in UW NOI from Most Recent NOI is primarily driven by (i) the newly signed MAVeCap lease and (ii) excluding free rent in the UW NOI, given the abated rents are reserved at loan origination. |
The Loan. The Broadacres Office Park mortgage loan has an outstanding principal balance as of the Cut-off Date of $33,000,000 (the “Broadacres Office Park Mortgage Loan”) and is secured by a first mortgage lien on the borrowers’ fee interest in a 396,226 square foot office park located in Bloomfield, New Jersey (the “Broadacres Office Park Property”). The Broadacres Office Park Mortgage Loan has a five-year term and is interest-only for the entire term.
The Property. The Broadacres Office Park Property consists of four, four-story office buildings totaling 396,226 square feet, located in Bloomfield, New Jersey. The Broadacres Office Park Property was originally built between 1975 and 1976 and was renovated between 2000 and 2001. The Broadacres Office Park Property is situated approximately 14 miles northwest of New York, New York. The buildings have a “campus-like” feel and are connected via landscaped walkways with common signage/décor among the buildings. The previous
THE INFORMATION IN THIS STRUCTURAL AND COLLATERAL TERM SHEET IS NOT COMPLETE AND MAY BE AMENDED PRIOR TO THE TIME OF SALE. THIS TERM SHEET IS NOT AN OFFER TO SELL THESE SECURITIES AND IT IS NOT A SOLICITATION OF AN OFFER TO BUY THESE SECURITIES IN ANY JURISDICTION WHERE THE OFFER OR SALE IS NOT PERMITTED.
74
| Structural and Collateral Term Sheet | BBCMS 2021-C11 | |
| No. 4 – Broadacres Office Park | ||
owner spent approximately $2.3 million in renovations since 2016 which included parking lot resurfacing, upgrading to energy-efficient LED exterior lighting, renovating the café and adding a fitness center and a tenant lounge (Nautilus Lounge). The Broadacres Office Park Property has 1,147 surface parking spaces (2.90 spaces per 1,000 square feet).
The Broadacres Office Park Property is currently 90.1% occupied, as of April 1, 2021, by 47 tenants. The rent roll is granular with the largest tenant representing 6.6% of the NRA. The tenant roster is diverse and includes, among others, the financial services, cosmetics, insurance, legal services, healthcare, and technology industries. A total of 12 tenants, representing 29.2% of NRA, have been at the Broadacres Office Park Property for 10 years or longer. Since March 2020, the Broadacres Office Park Property has secured eight new leases totaling 57,398 square feet (14.5% NRA), expanded one existing tenant of 1,710 square feet (0.4% NRA), and signed six tenant renewals totaling 36,833 square feet (9.3% NRA).
In addition, Shoprite grocery store ground leases a portion (26,841 square feet) of the 400 Broadacres property on a 39-year ground lease at a flat ground rent for the first ten years of $288,000 per year, commencing 2017. The ground lessee has three, 20-year renewal options exercisable upon 180 days’ notice. The Shoprite grocery store building is not part of the collateral.
COVID-19 Update. As of August 31, 2021, the Broadacres Office Park Property was open and operating and all tenants are current on their rental obligations. The borrowers made their first debt service payment for the Broadacres Office Park Mortgage Loan in June 2021. As of August 31, 2021, the Broadacres Office Park Mortgage Loan is not subject to any forbearance, modification or debt service relief requests.
Major Tenants.
Partnership for Children of Essex (26,025 square feet; 6.6% of the NRA; 7.2% of the underwritten base rent): Partnership for Children of Essex is a private non-profit care management organization dedicated to assisting youth with complex needs that include: emotional/behavioral, intellectual/developmental and substance use. Partnership for Children of Essex is a part of New Jersey's Children's System of Care. Partnership for Children of Essex utilizes a wraparound model of care while working in partnership with youth and families to design and implement a plan of care that is specific to the youth's individual strengths and needs. Partnership for Children of Essex is committed to keeping youth safe in their home, school, and community. Partnership for Children of Essex has the right to terminate its lease exercisable upon eight months’ notice in the event that the State of New Jersey fails to allocate sufficient funds for its rental obligations.
MAVeCap (24,520 square feet; 6.2% of the NRA; 7.6% of the underwritten base rent): MAVeCap is a venture capital firm whose portfolio of companies includes Comodo (cybersecurity), Itarian (IT management), NuSEC (global cloud platform), and Ezlo Innovation (home automation), among others. The company occupying the space at the Broadacres Office Park Property is NuRD, an engineering organization that builds the technology that propels all MAVeCap portfolio companies. NuRD is an R&D/solutions provider that translates an idea into a viable product. Its services include analyzing target markets, determining key deliverables, creating interface prototypes, and providing product support and training.
Dewberry - Engineers, Inc. (24,422 square feet; 6.2% of the NRA; 6.7% of the underwritten base rent): Dewberry-Engineers, Inc. is a nationwide firm that provides professional engineering services. The company offers environmental, mechanical, electrical, plumbing, surveying, transportation, architecture, resilience, sustainability, and civil engineering services. The company employs more than 2,000 people at more than 50 locations.
Environmental. According to a Phase I environmental site assessment dated January 22, 2021, there was no evidence of any recognized environmental conditions at the Broadacres Office Park Property.
| Historical and Current Occupancy | |||
| 2018(1) | 2019(1) | 2020(1) | Current(2) |
| 86.6% | 82.5% | 82.0% | 90.1% |
| (1) | Historical Occupancies are as of December 31 of each respective year. |
| (2) | Current Occupancy is as of April 1, 2021. |
THE INFORMATION IN THIS STRUCTURAL AND COLLATERAL TERM SHEET IS NOT COMPLETE AND MAY BE AMENDED PRIOR TO THE TIME OF SALE. THIS TERM SHEET IS NOT AN OFFER TO SELL THESE SECURITIES AND IT IS NOT A SOLICITATION OF AN OFFER TO BUY THESE SECURITIES IN ANY JURISDICTION WHERE THE OFFER OR SALE IS NOT PERMITTED.
75
| Structural and Collateral Term Sheet | BBCMS 2021-C11 | |
| No. 4 – Broadacres Office Park | ||
| Top Tenant Summary(1) | |||||||
| Tenant | Ratings Moody’s/S&P/Fitch(2) | Net Rentable Area (SF) | % of Total NRA | UW Base Rent PSF(3) | UW Base Rent(3) | % of Total UW Base Rent | Lease Exp. Date |
| Partnership for Children of Essex(4) | NR/NR/NR | 26,025 | 6.6% | $22.29 | $580,097 | 7.2% | 10/31/2028 |
| MAVeCap(5) | NR/NR/NR | 24,520 | 6.2 | 25.00 | 613,000 | 7.6 | 4/30/2031 |
| Dewberry - Engineers, Inc.(6) | NR/NR/NR | 24,422 | 6.2 | 22.25 | 543,390 | 6.7 | 2/29/2024 |
| Munzing(7) | NR/NR/NR | 20,000 | 5.0 | 24.50 | 490,000 | 6.1 | 12/31/2028 |
| Reverse Mortgage Funding(8) | NR/NR/NR | 16,606 | 4.2 | 26.28 | 436,406 | 5.4 | MTM |
| Major Tenants | 111,573 | 28.2% | $23.87 | $2,662,892 | 32.9% | ||
| Other Tenants | 245,435 | 61.9% | $22.09 | $5,420,445 | 67.1% | ||
| Occupied Collateral Total / Wtd. Avg. | 357,008 | 90.1% | $22.64 | $8,083,338 | 100.0% | ||
| Vacant Space | 39,218 | 9.9% | |||||
| Collateral Total | 396,226 | 100.0% | |||||
| (1) | Based on underwritten rent roll dated April 1, 2021. |
| (2) | Ratings provided are for the parent company of the entity listed in the “Tenant” field whether or not the parent company guarantees the lease. |
| (3) | UW Base Rent PSF and UW Base Rent include rent steps totaling $82,072 through April 2022. |
| (4) | Partnership for Children of Essex has the right to terminate its lease exercisable upon eight months’ notice in the event that the State of New Jersey fails to allocate sufficient funds for its rental obligations. Partnership for Children of Essex also has two, five-year renewal options at 90% of market rent with a 12 months’ notice period. |
| (5) | MAVeCap has two, five-year renewal options with nine months’ notice. |
| (6) | Dewberry - Engineers, Inc. has two, five-year renewal options with at least nine months’ notice. |
| (7) | Munzing has the right to terminate as of December 31, 2024 and as of December 31, 2026 with minimum 270 days’ and maximum 360 days' notice and payment of unamortized transaction costs. Munzing also has one, ten-year renewal option with notice between January 1, 2027 and December 31, 2027. |
| (8) | Reverse Mortgage Funding’s current lease expired on July 31, 2021. The tenant is currently negotiating a seven-year renewal with the borrower sponsor. The tenant has continued paying the existing rent. |
| Lease Rollover Schedule(1)(2) | |||||||||
| Year | Number of Leases Expiring | Net Rentable Area Expiring | % of NRA Expiring | UW Base Rent Expiring(3) | % of UW Base Rent Expiring | Cumulative Net Rentable Area Expiring | Cumulative % of NRA Expiring | Cumulative UW Base Rent Expiring(3) | Cumulative % of UW Base Rent Expiring |
| Vacant | NAP | 39,218 | 9.9% | NAP | NAP | 39,218 | 9.9% | NAP | NAP |
| 2021 & MTM | 13 | 68,410 | 17.3 | $1,203,510 | 14.9% | 107,628 | 27.2% | 1,203,510 | 14.9% |
| 2022 | 3 | 14,657 | 3.7 | 360,072 | 4.5 | 122,285 | 30.9% | 1,563,582 | 19.3% |
| 2023 | 6 | 28,927 | 7.3 | 619,965 | 7.7 | 151,212 | 38.2% | 2,183,547 | 27.0% |
| 2024 | 7 | 52,546 | 13.3 | 1,251,312 | 15.5 | 203,758 | 51.4% | 3,434,859 | 42.5% |
| 2025 | 7 | 54,921 | 13.9 | 1,324,596 | 16.4 | 258,679 | 65.3% | 4,759,455 | 58.9% |
| 2026 | 4 | 17,432 | 4.4 | 432,986 | 5.4 | 276,111 | 69.7% | 5,192,441 | 64.2% |
| 2027 | 1 | 10,500 | 2.7 | 262,500 | 3.2 | 286,611 | 72.3% | 5,454,941 | 67.5% |
| 2028 | 2 | 46,025 | 11.6 | 1,070,097 | 13.2 | 332,636 | 84.0% | 6,525,039 | 80.7% |
| 2029 | 0 | 0 | 0.0 | 0 | 0.0 | 332,636 | 84.0% | 6,525,039 | 80.7% |
| 2030 | 1 | 16,304 | 4.1 | 383,144 | 4.7 | 348,940 | 88.1% | 6,908,183 | 85.5% |
| 2031 | 4 | 47,286 | 11.9 | 1,175,155 | 14.5 | 396,226 | 100.0% | 8,083,338 | 100.0% |
| 2032 & Beyond | 0 | 0 | 0.0 | 0 | 0.0 | 396,226 | 100.0% | 8,083,338 | 100.0% |
| Total | 48 | 396,226 | 100.0% | $8,083,338 | 100.0% | ||||
| (1) | Based on the underwritten rent roll dated April 1, 2021. |
| (2) | Certain leases may have termination options that are exercisable prior to the originally stated expiration date of the lease and that are not considered in this Lease Rollover Schedule. |
| (3) | UW Base Rent Expiring and Cumulative UW Base Rent Expiring include rent steps totaling $82,072 through April 2022. |
THE INFORMATION IN THIS STRUCTURAL AND COLLATERAL TERM SHEET IS NOT COMPLETE AND MAY BE AMENDED PRIOR TO THE TIME OF SALE. THIS TERM SHEET IS NOT AN OFFER TO SELL THESE SECURITIES AND IT IS NOT A SOLICITATION OF AN OFFER TO BUY THESE SECURITIES IN ANY JURISDICTION WHERE THE OFFER OR SALE IS NOT PERMITTED.
76
| Structural and Collateral Term Sheet | BBCMS 2021-C11 | |
| No. 4 – Broadacres Office Park | ||
| Operating History and Underwritten Net Cash Flow | ||||||
| 2018 | 2019 | 2020 | Underwritten | Per Square Foot | %(1) | |
| Rents in Place(2) | $6,782,328 | $7,309,987 | $6,687,339 | $8,083,338 | $20.40 | 83.4% |
| Vacant Income | 0 | 0 | 0 | 955,485 | 2.41 | 9.9 |
| Gross Potential Rent | $6,782,328 | $7,309,987 | $6,687,339 | $9,038,823 | $22.81 | 93.2% |
| Total Reimbursements | 1,021,541 | 1,098,673 | 778,267 | 657,095 | 1.66 | 6.8 |
| Net Rental Income | $7,803,869 | $8,408,660 | $7,465,606 | $9,695,918 | $24.47 | 100.0% |
| Other Income(3) | 96,886 | 88,834 | 46,850 | 430,441 | 1.09 | 4.4 |
| (Vacancy/Credit Loss) | 0 | 0 | 0 | (1,070,447) | (2.70) | (11.0) |
| Effective Gross Income | $7,900,755 | $8,497,494 | $7,512,455 | $9,055,911 | $22.86 | 93.4% |
| Total Expenses | $5,043,205 | $4,932,741 | $4,126,983 | $4,169,328 | $10.52 | 46.0% |
| Net Operating Income(4) | $2,857,549 | $3,564,754 | $3,385,473 | $4,886,583 | $12.33 | 54.0% |
| Capital Expenditures | 0 | 0 | 0 | 59,434 | 0.15 | 0.7 |
| TI/LC | 0 | 0 | 0 | 397,942 | 1.00 | 4.4 |
| Net Cash Flow | $2,857,549 | $3,564,754 | $3,385,473 | $4,429,207 | $11.18 | 48.9% |
| (1) | % column represents percent of Net Rental Income for all revenue lines and represents percent of Effective Gross Income for the remainder of fields. |
| (2) | Underwritten Rents in Place is based on the April 1, 2021 underwritten rent roll and includes rent steps totaling $82,072 through April 2022. |
| (3) | Other Income includes cell tower income, storage rent and Shoprite ground rent income. |
| (4) | The increase in NOI from 2018 to 2019 was driven by (i) the increase of total base rent, (ii) the end of tenants’ free rent periods and (iii) saving on the repair and maintenance. The increase in UW NOI from Most Recent NOI is primarily driven by (i) newly signed MAVeCap lease and (ii) excluding free rent in the UW NOI, given the abated rents are reserved at loan origination. |
The Market. The Broadacres Office Park Property is located in Bloomfield, New Jersey. The Bloomfield neighborhood is located approximately 10 miles north of Newark, NJ via Garden State Parkway. Access to the Broadacres Office Park Property from the east and west is provided by NJ-3E. The Broadacres Office Park Property is located next to Brookdale Park, where residents can enjoy a walk through the Brookdale Park Rose Garden or utilize the sports facilities which include a football/soccer field, tennis center, and multiple baseball fields. The surrounding areas to the north and south are primarily residential, with Brookfield Park located to the west and Upper Montclair Country Club located to the east on the other side of the Garden State Parkway. The Upper Montclair Station is located 1.6 miles east of the Broadacres Office Park Property. Newark Penn Station is located approximately 11 miles south of the Broadacres Office Park Property. Newark Penn Station is the hub for New Jersey Transit, and serving the Newark Light Rail, three New Jersey Transit commuter rail lines, the PATH rapid transit system, and Amtrak’s Northeast Corridor services. The Newark Penn Station is approximately 10 miles southwest of the New York Penn station, providing commuters with easy access to travel to and from Manhattan and other parts of New York. The Grove Street station, which is approximately 5 miles south of the Broadacres Office Park Property, brings the Newark Light Rail into Bloomfield, affording access to Newark, Jersey City, and Manhattan.
According to a third-party market report, as of August 2021, the Northern New Jersey office market had an inventory of approximately 153.2 million square feet, overall vacancy in the market of approximately 14.0% and average asking rents of $26.30 per square foot. The Broadacres Office Park Property is located in the Bloomfield/Garden State Park office submarket. According to a third-party market report, as of August 2021, the Bloomfield/Garden State Park office submarket had an inventory of approximately 3.0 million square feet, overall vacancy of approximately 7.9% and average asking rents of $25.74 per square foot. According to a third-party market report, the estimated 2021 population within a one-, three- and five-mile radius of the Broadacres Office Park Property is 15,779, 188,277 and 620,755, respectively. The estimated 2021 average household income within the same radii is $199,316, $144,281 and $117,594, respectively.
THE INFORMATION IN THIS STRUCTURAL AND COLLATERAL TERM SHEET IS NOT COMPLETE AND MAY BE AMENDED PRIOR TO THE TIME OF SALE. THIS TERM SHEET IS NOT AN OFFER TO SELL THESE SECURITIES AND IT IS NOT A SOLICITATION OF AN OFFER TO BUY THESE SECURITIES IN ANY JURISDICTION WHERE THE OFFER OR SALE IS NOT PERMITTED.
77
| Structural and Collateral Term Sheet | BBCMS 2021-C11 | |
| No. 4 – Broadacres Office Park | ||
The following table presents certain information relating to comparable office leases for the Broadacres Office Park Property:
| Comparable Office Leases(1) | ||||||||
| Property Location | Year Built | NRA (SF) | Tenant | Lease Size (SF) | Rent PSF | Commencement | Lease Term (Years) | Lease Type |
| Broadacres Office Park Bloomfield, NJ | 1975-1976 | 396,226(2) | Various | Various | $22.64(2) | Various | Various | Various |
300 Executive Drive West Orange, NJ | 1984 | 129,296 | PEF Services | 12,944 | $21.50 | Mar-2019 | 6.0 Yrs. | Modified Gross |
100 Metro Boulevard Nutley, NJ | 1996/2019 | 255,018 | Polo Ralph Lauren | 255,017 | $30.50 | Jul-2018 | 16 Yrs. | Full Service |
777 Passaic Clifton, NJ | 1985 | 75,000 | DCT Management | 1,577 | $24.00 | Mar-2018 | 5.0 Yrs. | NNN |
6 Brighton Road Clifton, NJ | 1985 | 51,242 | Metropolitan Orthopedics LLC | 1,837 | $21.50 | Nov-2016 | 1.0 Yrs. | Modified Gross |
1515 Broad Street Bloomfield, NJ | 1969/2010 | 40,164 | McDermott | 40,164 | $25.66 | Sep-2016 | 6.0 Yrs. | Full Service |
| (1) | Source: Appraisal. |
| (2) | Based on the underwritten rent roll dated April 1, 2021 with rent steps totaling $82,072 through April 2022. |
The following table presents certain information relating to comparable office sales for the Broadacres Office Park Property:
| Comparable Office Sales(1) | ||||||
| Property Location | Sale Date | Total NRA (SF) | Total Occupancy | Sale Price | Sale Price PSF | Adjusted Sales Price PSF |
| Broadacres Office Park Bloomfield, NJ | NAP | 396,226(2) | 90.1%(2) | NAP | NAP | NAP |
95 North State Route 17 Paramus, NJ | Dec-2020 | 119,846 | 76.8% | $16,250,000 | $135.59 | $135.59 |
| 325 Columbia Turnpike Florham Park, NJ | Sep-2020 | 168,144 | 85.0% | $25,800,000 | $153.44 | $138.10 |
| 55 Challenger Road Ridgefield Park, NJ | Sep-2020 | 269,720 | 94.1% | $36,500,000 | $135.33 | $121.79 |
155 Prospect Avenue West Orange, NJ | Mar-2019 | 34,765 | 100.0% | $5,750,000 | $165.40 | $133.56 |
700 Route 46 East Fairfield, NJ | Sep-2018 | 48,064 | 100.0% | $5,500,000 | $114.43 | $119.58 |
| (1) | Source: Appraisal. |
| (2) | Based on the underwritten rent roll dated April 1, 2021. |
The Borrowers. The borrowing entities for the Broadacres Office Park Mortgage Loan are 20 Delaware limited liability companies (each individually, a “Broadacres Office Park Borrower” and collectively, the “Broadacres Office Park Borrowers”), each a single purpose entity with one independent director. Legal counsel to the Broadacres Office Park Borrowers delivered a non-consolidation opinion in connection with the origination of the Broadacres Office Park Mortgage Loan. The Broadacres Office Park Borrowers collectively own the Broadacres Office Park Property as tenants-in-common.
The Borrower Sponsor. The borrower sponsor and guarantor is Ercument Tokat. Mr. Tokat is a high-net-worth investor with over 10 years of real estate experience, operating his portfolio of residential, retail, office and mixed-use real estate properties throughout New Jersey. Mr. Tokat’s current real estate portfolio consists of over 520 units and a total of over 500,000 square feet. Mr. Tokat’s commercial real estate experience has been focused within the immediate area of the Broadacres Office Park Property. Mr. Tokat is a partner and founding member of the Healthcare/Life Sciences practice at Centerview Partners, a global boutique investment banking firm that has advised on $3 trillion of transactions worldwide.
Property Management. The Broadacres Office Park Property is managed by Erct Property Management LLC, an affiliate of the borrower sponsor.
Escrows and Reserves. At origination, the Broadacres Office Park Borrowers were required to deposit into escrow approximately (i) $115,089 for real estate taxes, (ii) $27,928 for insurance premiums, (iii) $1,400,000 for general TI/LC reserve, (iv) $1,120,410 for upfront outstanding TI/LC reserve, (v) $406,844 for rent abatement reserve and (vi) $21,563 for the immediate repairs reserve.
Tax Escrows – On a monthly basis, the Broadacres Office Park Borrowers are required to escrow 1/12th of the annual estimated real estate taxes, which currently equates to approximately $115,066.
Insurance Escrows – On a monthly basis, the Broadacres Office Park Borrowers are required to escrow 1/12th of the annual estimated insurance premiums, which currently equates to approximately $9,104.
THE INFORMATION IN THIS STRUCTURAL AND COLLATERAL TERM SHEET IS NOT COMPLETE AND MAY BE AMENDED PRIOR TO THE TIME OF SALE. THIS TERM SHEET IS NOT AN OFFER TO SELL THESE SECURITIES AND IT IS NOT A SOLICITATION OF AN OFFER TO BUY THESE SECURITIES IN ANY JURISDICTION WHERE THE OFFER OR SALE IS NOT PERMITTED.
78
| Structural and Collateral Term Sheet | BBCMS 2021-C11 | |
| No. 4 – Broadacres Office Park | ||
Replacement Reserve – On a monthly basis, the Broadacres Office Park Borrowers are required to escrow approximately $4,941 for replacement reserves.
TI/LC Reserve – On a monthly basis, the Broadacres Office Park Borrowers are required to escrow approximately $33,162 for tenant improvements and leasing commissions.
Lockbox / Cash Management. The Broadacres Office Park Mortgage Loan is structured with a hard lockbox and in place cash management. The Broadacres Office Park Mortgage Loan requires all rents to be transmitted directly into a lockbox account controlled by the lender (including, without limitation, by sending tenant direction letters to all tenants at origination/new lease execution). All funds in the lockbox account are required to be swept on each business day to a cash management account controlled by the lender and applied and disbursed in accordance with the Broadacres Office Park Mortgage Loan documents. If a Cash Trap Period (as defined below) is occurring, excess cash is required to be held as additional security for the Broadacres Office Park Mortgage Loan. Upon the termination of any Cash Trap Period, excess cash will no longer be required to be held by the lender and, provided that no event of default exists, all amounts then on deposit in the cash collateral reserve account will be disbursed to the Broadacres Office Park Borrowers.
A “Cash Trap Period” will commence upon: (i) an event of default under the Broadacres Office Park Mortgage Loan documents or (ii) as of any date of determination by the lender, the debt service coverage ratio on the Broadacres Office Park Mortgage Loan and the Broadacres Office Park Mezzanine Loan is less than 2.00x; and will end (x) if the loan and all other obligations under the Broadacres Office Park Mortgage Loan documents have been repaid in full; (y) with respect to clause (i) above, if the lender has accepted a cure of such event of default; and (z) with respect to clause (ii) above, if for six consecutive calendar months since the commencement of the existing Cash Trap Period (A) no event of default under the Broadacres Office Park Mortgage Loan documents has occurred, (B) no event that constitutes another Cash Trap Period has occurred, and (C) the debt service coverage ratio on the Broadacres Office Park Mortgage Loan and the Broadacres Office Park Mezzanine Loan is at least equal to 2.20x.
Subordinate and Mezzanine Debt. A $7,000,000 mezzanine loan was funded concurrently with the origination of the Broadacres Office Park Mortgage Loan secured by the direct equity ownership in the Broadacres Office Park Borrowers (the “Broadacres Office Park Mezzanine Loan”). The Broadacres Office Park Mezzanine Loan accrues interest at a rate of 9.00000% per annum and is coterminous with the Broadacres Office Park Mortgage Loan. Including the Broadacres Office Park Mortgage Loan and the Broadacres Office Park Mezzanine Loan, the total debt Cut-off Date LTV, total debt UW NCF DSCR and total debt UW NOI Debt Yield are 71.2%, 2.43x and 12.2%, respectively. The lenders of the Broadacres Office Park Mortgage Loan and the Broadacres Office Park Mezzanine Loan have entered into an intercreditor agreement that governs their relationship.
Partial Release. At any time after September 5, 2023, the Broadacres Office Park Borrowers may release any of four individual buildings comprising the Broadacres Office Park Property in connection with the sale of such individual property to a bona-fide third party purchaser, provided that, among other conditions: (i) no event of default has occurred and is continuing; and (ii) the Broadacres Office Park Borrowers are required to prepay the outstanding principal balance of the Broadacres Office Park Mortgage Loan in an amount equal to the Release Amount (as defined below) together with (a) all accrued and unpaid interest on the portion of the outstanding principal balance being prepaid, (b) the yield maintenance premium with respect to the portion of the outstanding principal balance being prepaid, and (c) all other amounts due under the Broadacres Office Park Mortgage Loan documents; and (iii) the borrowers deliver a REMIC opinion to the lender.
“Release Amount” means, with respect to any individual building to be released in connection with a partial release, the amount that is the greatest of (i) the fraction of the Broadacres Office Park Mortgage Loan’s outstanding principal balance over the aggregate outstanding principal balance of the Broadacres Office Park Mortgage Loan and the Broadacres Office Park Mezzanine Loan multiplied by the net sale price for such individual building, (ii) 125% of the allocated loan amount of such individual building, and (iii) an amount such that, after giving effect to the partial release (a) total debt LTV does not exceed the lesser of 71.2% and the total debt LTV that existed immediately prior to such partial release and (b) the total debt yield is not less than the greater of 11.0% and the total debt yield that existed immediately prior to such partial release.
Ground Lease. None.
THE INFORMATION IN THIS STRUCTURAL AND COLLATERAL TERM SHEET IS NOT COMPLETE AND MAY BE AMENDED PRIOR TO THE TIME OF SALE. THIS TERM SHEET IS NOT AN OFFER TO SELL THESE SECURITIES AND IT IS NOT A SOLICITATION OF AN OFFER TO BUY THESE SECURITIES IN ANY JURISDICTION WHERE THE OFFER OR SALE IS NOT PERMITTED.
79
| Structural and Collateral Term Sheet | BBCMS 2021-C11 | |
| No. 5 – Fleet Farm Mixed Use | ||

THE INFORMATION IN THIS STRUCTURAL AND COLLATERAL TERM SHEET IS NOT COMPLETE AND MAY BE AMENDED PRIOR TO THE TIME OF SALE. THIS TERM SHEET IS NOT AN OFFER TO SELL THESE SECURITIES AND IT IS NOT A SOLICITATION OF AN OFFER TO BUY THESE SECURITIES IN ANY JURISDICTION WHERE THE OFFER OR SALE IS NOT PERMITTED.
80
| Structural and Collateral Term Sheet | BBCMS 2021-C11 | |
| No. 5 – Fleet Farm Mixed Use | ||

THE INFORMATION IN THIS STRUCTURAL AND COLLATERAL TERM SHEET IS NOT COMPLETE AND MAY BE AMENDED PRIOR TO THE TIME OF SALE. THIS TERM SHEET IS NOT AN OFFER TO SELL THESE SECURITIES AND IT IS NOT A SOLICITATION OF AN OFFER TO BUY THESE SECURITIES IN ANY JURISDICTION WHERE THE OFFER OR SALE IS NOT PERMITTED.
81
| Structural and Collateral Term Sheet | BBCMS 2021-C11 | |
| No. 5 – Fleet Farm Mixed Use | ||
| Mortgage Loan Information | Property Information | |||
| Mortgage Loan Seller: | SGFC | Single Asset / Portfolio: | Single Asset | |
| Original Principal Balance: | $33,000,000 | Title: | Fee | |
| Cut-off Date Principal Balance: | $33,000,000 | Property Type – Subtype: | Mixed Use – Retail/Industrial | |
| % of IPB: | 3.3% | Net Rentable Area (SF): | 431,440 | |
| Loan Purpose: | Acquisition | Location: | Appleton, WI | |
| Borrower: | KB Fleet Farm, DST | Year Built / Renovated: | 1984, 2005, 2006 and 2007 / 2006 | |
| Borrower Sponsor: | Jeff Pori | Occupancy: | 100.0% | |
| Interest Rate: | 3.57000% | Occupancy Date: | 6/21/2021 | |
| Note Date: | 6/21/2021 | 4th Most Recent NOI (As of)(2): | NAV | |
| Maturity Date: | 7/1/2031 | 3rd Most Recent NOI (As of)(2): | NAV | |
| Interest-only Period: | 60 months | 2nd Most Recent NOI (As of)(2): | NAV | |
| Original Term: | 120 months | Most Recent NOI (As of)(2): | NAV | |
| Original Amortization Term: | 360 months | UW Economic Occupancy: | 92.5% | |
| Amortization Type: | Interest Only, Amortizing Balloon | UW Revenues: | $4,219,518 | |
| Call Protection: | L(26),D(90),O(4) | UW Expenses: | $631,797 | |
| Lockbox / Cash Management: | Hard / Springing | UW NOI: | $3,587,721 | |
| Additional Debt: | No | UW NCF: | $3,372,001 | |
| Additional Debt Balance: | N/A | Appraised Value / Per SF: | $55,000,000 / $127 | |
| Additional Debt Type: | N/A | Appraisal Date: | 5/14/2021 | |
| Escrows and Reserves(1) | Financial Information | |||||||||
| Initial | Monthly | Initial Cap | Cut-off Date Loan / SF: | $76 | ||||||
| Taxes: | $0 | Springing | N/A | Maturity Date Loan / SF: | $69 | |||||
| Insurance: | $0 | Springing | N/A | Cut-off Date LTV: | 60.0% | |||||
| Replacement Reserves: | $500,000 | Springing | $500,000 | Maturity Date LTV: | 54.0% | |||||
| TI/LC Reserve: | $1,000,000 | Springing | N/A | UW NCF DSCR: | 1.88x | |||||
| Restoration Reserve: | $150,000 | Springing | N/A | UW NOI Debt Yield: | 10.9% | |||||
| Sources and Uses | ||||||||||
| Sources | Proceeds | % of Total | Uses | Proceeds | % of Total | |||||
| Mortgage Loan | $33,000,000 | 58.0% | Purchase Price | $55,150,000 | 96.9% | |||||
| Borrower Sponsor Equity | 23,901,135 | 42.0 | Reserves | 1,650,000 | 2.9 | |||||
| Closing Costs | 101,135 | 0.2 | ||||||||
| Total Sources | $56,901,135 | 100.0% | Total Uses | $56,901,135 | 100.0% | |||||
| (1) | For a full description of Escrows and Reserves, please refer to the “Escrows and Reserves” section below. |
| (2) | Historical NOI is unavailable as the Fleet Farm Mixed Use Property (as defined below) was acquired by the borrower sponsor at the origination of the Fleet Farm Mixed Use Mortgage Loan (as defined below), and the prior owner did not provide such information. |
The Loan. The Fleet Farm Mixed Use mortgage loan is secured by a first lien mortgage on the borrower’s fee interest in a 431,440 square foot mixed use property located in Appleton, Wisconsin (the “Fleet Farm Mixed Use Property”). The Fleet Farm Mixed Use mortgage loan was originated by SGFC and has an outstanding principal balance as of the Cut-off Date of $33.0 million (the “Fleet Farm Mixed Use Mortgage Loan”). The Fleet Farm Mixed Use Mortgage Loan has a 10-year term and is interest-only for the first 60 months of the term, followed by a 30-year amortization period.
The Property. The Fleet Farm Mixed Use Property is a 431,440 square foot mixed use retail and industrial complex located in Appleton, Wisconsin. The Fleet Farm Mixed Use Property is solely occupied by Fleet Farm Group, LLC (“Fleet Farm”). The Fleet Farm Mixed Use Property consists of five, one-story buildings situated on an approximately 32.3-acre parcel. The Fleet Farm Mixed Use Property consists of a 273,175 square foot retail building built in 2005, a 143,883 square foot industrial building built in 1984, a 7,086 square foot car wash building built in 2006, a 4,180 square foot gasoline service station built in 2007 and another 3,116 square foot gasoline service station built in 2006. There is surface parking available for 939 cars, resulting in a parking ratio of approximately 2.2 spaces per 1,000 square feet.
Fleet Farm has been the sole tenant at the Fleet Farm Mixed Use Property since 2005, and the property serves as a flagship location for Fleet Farm. Founded in 1955, Fleet Farm’s new corporate headquarters located in Appleton, Wisconsin consolidated six locations into one facility. Fleet Farm sells merchandise designed for life, work, home and recreation and targets active outdoor families, suburban and
THE INFORMATION IN THIS STRUCTURAL AND COLLATERAL TERM SHEET IS NOT COMPLETE AND MAY BE AMENDED PRIOR TO THE TIME OF SALE. THIS TERM SHEET IS NOT AN OFFER TO SELL THESE SECURITIES AND IT IS NOT A SOLICITATION OF AN OFFER TO BUY THESE SECURITIES IN ANY JURISDICTION WHERE THE OFFER OR SALE IS NOT PERMITTED.
82
| Structural and Collateral Term Sheet | BBCMS 2021-C11 | |
| No. 5 – Fleet Farm Mixed Use | ||
farm consumers through a range of products. Fleet Farm’s product mix ranges from hunting supplies, fishing and boating supplies, planting supplies, sporting goods, farming, pet care, toys, home goods, apparel and accessories for the entire family, pantry items and snacks. The Fleet Farm Mixed Use Property reported 2020 sales of approximately $67.02 million, an increase of approximately 0.04% over 2019 sales. Fleet Farm operates 47 locations across Minnesota, Wisconsin, Iowa and North Dakota and has approximately 6,600 employees. In 2016, Fleet Farm was purchased by KKR for approximately $1.6 billion. Fleet Farm executed a new, approximately 20-year lease for the Fleet Farm Mixed Use Property in connection with the origination of the Fleet Farm Mixed Use Mortgage Loan with an expiration date of October 2041. The lease has four, five-year renewal options remaining.
COVID-19 Update. As of August 31, 2021, the Fleet Farm Mixed Use Property is open and operating. Fleet Farm represents approximately 100% of the occupied square footage at the Fleet Farm Mixed Use Property and approximately 100% of the underwritten base rent and made its August 2021 rental payments. As of the date of this term sheet, the Fleet Farm Mixed Use Mortgage Loan is not subject to any modification or forbearance requests.
Environmental. According to a Phase I environmental assessment dated May 25, 2021, there was no evidence of any recognized environmental conditions at the Fleet Farm Mixed Use Property.
| Historical and Current Occupancy(1) | |||
| 2018 | 2019 | 2020 | Current(2) |
| 100.0% | 100.0% | 100.0% | 100.0% |
| (1) | Historical Occupancies are based on the sole tenant being in occupancy at the Fleet Farm Mixed Use Property since 2005 and are as of December 31 of each respective year. |
| (2) | Current Occupancy is as of June 21, 2021. |
| Tenant Summary(1) | |||||||
| Tenant | Ratings Moody’s/S&P/Fitch | Net Rentable Area (SF) | % of Total NRA | UW Base Rent PSF(2) | UW Base Rent(2) | % of Total UW Base Rent | Lease Exp. Date |
| Fleet Farm Group, LLC(3) | NR / NR / NR | 431,440(4) | 100.0% | $9.11 | $3,929,844 | 100.0% | 10/31/2041 |
| Occupied Collateral Total / Wtd. Avg. | 431,440 | 100.0% | $9.11 | $3,929,844 | 100.0% | ||
| Vacant Space | 0 | 0.0% | |||||
| Collateral Total | 431,440 | 100.0% | |||||
| (1) | Based on the underwritten rent roll dated May 1, 2021. |
| (2) | UW Base Rent PSF and UW Base Rent includes one rent step totaling $77,052 through October 2022. |
| (3) | Fleet Farm has four, five-year renewal options remaining. |
| (4) | Excluding the gasoline service stations and carwash building, the retail (273,175 square feet) and industrial (143,883 square feet) buildings account for 63.3% and 33.3% of the net rentable area, respectively. |
THE INFORMATION IN THIS STRUCTURAL AND COLLATERAL TERM SHEET IS NOT COMPLETE AND MAY BE AMENDED PRIOR TO THE TIME OF SALE. THIS TERM SHEET IS NOT AN OFFER TO SELL THESE SECURITIES AND IT IS NOT A SOLICITATION OF AN OFFER TO BUY THESE SECURITIES IN ANY JURISDICTION WHERE THE OFFER OR SALE IS NOT PERMITTED.
83
| Structural and Collateral Term Sheet | BBCMS 2021-C11 | |
| No. 5 – Fleet Farm Mixed Use | ||
| Lease Rollover Schedule(1) | |||||||||
| Year | Number of Leases Expiring | Net Rentable Area Expiring | % of NRA Expiring | UW Base Rent Expiring(2) | % of UW Base Rent Expiring | Cumulative Net Rentable Area Expiring | Cumulative % of NRA Expiring | Cumulative UW Base Rent Expiring(2) | Cumulative % of UW Base Rent Expiring |
| Vacant | NAP | 0 | 0.0% | NAP | NAP | 0 | 0.0% | NAP | NAP |
| 2021 & MTM | 0 | 0 | 0.0 | $0 | 0.0% | 0 | 0.0% | $0 | 0.0% |
| 2022 | 0 | 0 | 0.0 | $0 | 0.0 | 0 | 0.0% | $0 | 0.0% |
| 2023 | 0 | 0 | 0.0 | $0 | 0.0 | 0 | 0.0% | $0 | 0.0% |
| 2024 | 0 | 0 | 0.0 | $0 | 0.0 | 0 | 0.0% | $0 | 0.0% |
| 2025 | 0 | 0 | 0.0 | $0 | 0.0 | 0 | 0.0% | $0 | 0.0% |
| 2026 | 0 | 0 | 0.0 | $0 | 0.0 | 0 | 0.0% | $0 | 0.0% |
| 2027 | 0 | 0 | 0.0 | $0 | 0.0 | 0 | 0.0% | $0 | 0.0% |
| 2028 | 0 | 0 | 0.0 | $0 | 0.0 | 0 | 0.0% | $0 | 0.0% |
| 2029 | 0 | 0 | 0.0 | $0 | 0.0 | 0 | 0.0% | $0 | 0.0% |
| 2030 | 0 | 0 | 0.0 | $0 | 0.0 | 0 | 0.0% | $0 | 0.0% |
| 2031 | 0 | 0 | 0.0 | $0 | 0.0 | 0 | 0.0% | $0 | 0.0% |
| 2032 & Beyond | 1 | 431,440 | 100.0 | $3,929,844 | 100.0 | 431,440 | 100.0% | $3,929,844 | 100.0% |
| Total | 1 | 431,440 | 100.0% | $3,929,844 | 100.0% | ||||
| (1) | Based on the underwritten rent roll dated May 1, 2021. |
| (2) | UW Base Rent Expiring and Cumulative UW Base Rent Expiring include one rent step totaling $77,052 through October 2022. |
| Underwritten Net Cash Flow | |||
| Underwritten | Per Square Foot | %(1) | |
| Rents in Place(2) | $3,929,844 | $9.11 | 86.1% |
| Vacant Income | 0 | $0.00 | 0.0 |
| Gross Potential Rent | $3,929,844 | $9.11 | 86.1% |
| Total Reimbursements | 631,797 | $1.46 | 13.9 |
| Net Rental Income | $4,561,641 | $10.57 | 100.0% |
| (Vacancy/Credit Loss) | (342,123) | ($0.79) | (7.5) |
| Other Income | 0 | $0.00 | 0.0 |
| Effective Gross Income | $4,219,518 | $9.78 | 92.5% |
| Total Expenses | 631,797 | $1.46 | 15.0 |
| Net Operating Income | $3,587,721 | $8.32 | 85.0% |
| Capital Expenditures | 86,288 | $0.20 | 2.0 |
| TI/LC | 129,432 | $0.30 | 3.1 |
| Net Cash Flow | $3,372,001 | $7.82 | 79.9% |
| (1) | % column represents percent of Net Rental Income for all revenue lines and represents percent of Effective Gross Income for the remainder of fields. |
| (2) | Underwritten Rents in Place is based on in-place rent as of May 1, 2021 and includes underwritten contractual rent steps taken through October 2022 totaling $77,052. |
The Market. The Fleet Farm Mixed Use Property is located in Appleton, Wisconsin approximately 32 miles southwest of Green Bay and 105 miles north of Milwaukee. The Fleet Farm Mixed Use Property is located in the community of Grand Chute in the northeastern portion of Wisconsin within Outagamie county. Primary regional access to the area is provided via Interstate 41 which is located less than one mile west of the Fleet Farm Mixed Use Property. The immediate area surrounding the Fleet Farm Mixed Use Property is bound by Northland Avenue to the north, Richmond Street to the east, College Avenue to the south and Casaloma Drive to the west. The Fleet Farm Mixed Use Property’s location is positioned along Wisconsin Avenue, which is an east-west arterial with an average daily traffic count of approximately 27,700 vehicles. Fox River Mall is located approximately 1.7 miles southeast of the Fleet Farm Mixed Use Property and serves central and northern Wisconsin. Fox River Mall is approximately 1.2 million square feet and is anchored by Macy’s, Target, JCPenney and Scheels. Other retailers in the area include: Sam’s Club, Pick ‘n Save, Walmart Supercenter, Costco, The Home Depot, and Dick’s Sporting Goods, as well as several national restaurant chains. Appleton is also home to Fox Valley Technical College, Lawrence University, The Hearthstone House, and Fox Cities Exhibition Center.
THE INFORMATION IN THIS STRUCTURAL AND COLLATERAL TERM SHEET IS NOT COMPLETE AND MAY BE AMENDED PRIOR TO THE TIME OF SALE. THIS TERM SHEET IS NOT AN OFFER TO SELL THESE SECURITIES AND IT IS NOT A SOLICITATION OF AN OFFER TO BUY THESE SECURITIES IN ANY JURISDICTION WHERE THE OFFER OR SALE IS NOT PERMITTED.
84
| Structural and Collateral Term Sheet | BBCMS 2021-C11 | |
| No. 5 – Fleet Farm Mixed Use | ||
According to the appraisal, the 2020 population within a one-, three- and five-mile radius of the Fleet Farm Mixed Use Property was 6,478, 59,395 and 135,747, respectively. The 2020 average household income within the same radii was $65,848, $77,321 and $82,456, respectively.
According to the appraisal, the Fleet Farm Mixed Use Property is located within the Appleton retail market. As of the first quarter of 2021, the Appleton retail market reported retail inventory of approximately 19.3 million square feet with a vacancy rate of 6.0% and an average annual asking rent of $11.35 per square foot. As of the first quarter of 2021, the Appleton retail market reported positive absorption of 99,800 square feet and 30,000 square feet of new construction.
According to the appraisal, the Fleet Farm Mixed Use Property is located within the Appleton industrial market. As of the first quarter of 2021, the Appleton industrial market reported industrial inventory of approximately 23.5 million square feet with a vacancy rate of 4.7% and an average annual asking rent of $4.80 per square foot. As of the first quarter of 2021, the Appleton industrial market reported negative absorption of 405,000 square feet and 594,000 square feet of new construction.
| Comparable Industrial Rental Summary(1) | ||||||||
| Property Name/Location | Year Built / Renovated | Occ. | Size (SF) | Tenant | Suite Size (SF) | Rent PSF | Commencement | Lease Term (Months) |
Fleet Farm 3035 West Wisconsin Avenue Appleton, WI | 1984, 2005, 2006 and 2007 / 2006 | 100.0%(2) | 431,440(2) | Fleet Farm Group, LLC(2) | 431,440(2) | $9.11(2) | Jun-21(2) | 245(2) |
21905 Gateway Road 21905 Gateway Road Brookfield, WI | 1999 / NAP | NAV | 103,087 | Ajax TOCCO Magnethermic Corp. | 87,000 | $4.75 | Mar-21 | 120 |
375 Rivertown Drive 375 Rivertown Drive Woodbury, MN | 1996 / NAP | NAV | 251,968 | CenterPoint Marketing | 195,757 | $4.46 | May-20 | 120 |
724 Kasota 700 24th Avenue SE Minneapolis, MN | 1961 / NAP | 100.0% | 133,778 | Canteen-Compass | 133,778 | $4.07 | Mar-19 | 84 |
310 O’Connor Drive 310 O’Connor Drive Elkhorn, WI | 1994 / NAP | 100.0% | 90,000 | Younker Industries | 90,000 | $4.00 | Jan-19 | 84 |
Lafayette Park 355 East 8th Street Saint Paul, MN | 1965 / NAP | NAV | 240,000 | Murphy Warehouse | 166,000 | $3.08 | Nov-18 | 36 |
Former Walgreens Distribution Center 13201 Wilfred Lane North Rogers, MN | 1999 / 2018 | 100.0% | 335,400 | Veritiv | 335,400 | $3.70 | Jun-16 | 120 |
| (1) | Source: Appraisal |
| (2) | Based on the underwritten rent roll dated May 1, 2021. |
THE INFORMATION IN THIS STRUCTURAL AND COLLATERAL TERM SHEET IS NOT COMPLETE AND MAY BE AMENDED PRIOR TO THE TIME OF SALE. THIS TERM SHEET IS NOT AN OFFER TO SELL THESE SECURITIES AND IT IS NOT A SOLICITATION OF AN OFFER TO BUY THESE SECURITIES IN ANY JURISDICTION WHERE THE OFFER OR SALE IS NOT PERMITTED.
85
| Structural and Collateral Term Sheet | BBCMS 2021-C11 | |
| No. 5 – Fleet Farm Mixed Use | ||
| Comparable Retail Rental Summary(1) | ||||||||
| Property Name/Location | Year Built / Renovated | Occ. | Size (SF) | Tenant | Suite Size (SF) | Rent PSF | Commencement | Lease Term (Months) |
Fleet Farm 3035 West Wisconsin Avenue Appleton, WI | 1984, 2005, 2006 and 2007 / 2006 | 100.0%(2) | 431,440(2) | Fleet Farm Group, LLC(2) | 431,440(2) | $9.11(2) | Jun-21(2) | 245(2) |
Cabela’s 1 Cabela Way Richfield, WI | 2006 / NAP | 100.0% | 165,000 | Cabela’s Sporting Goods | 165,000 | $14.21 | Jun-21 | 276 |
Former Sam’s Club 340 East Edgewood Boulevard Lansing, MI | 1989 / NAP | 100.0% | 137,454 | Stock+Field | 137,454 | $5.82 | Mar-21 | 180 |
Fleet Farm 1300 Southeast Kettlestone Blvd Waukee, IA | 2020 / NAP | 100.0% | 192,000 | Fleet Farm | 192,000 | $13.01 | Apr-20 | NAP |
Walmart Supercenter 3850 E Grand River Howell, MI | 1999 / NAP | 100.0% | 214,172 | Walmart | 214,172 | $6.39 | Jan-20 | 84 |
Hy-Vee 1451 Adams Street South Shakopee, MN | 2017 / NAP | 100.0% | 109,078 | Hy-vee | 109,078 | $12.98 | Jan-19 | 240 |
Fleet Farm 5858 Sunnybrook Drive Sioux City, IA | 2018 / NAP | 100.0% | 224,083 | Mills Fleet Farm | 224,083 | $12.31 | Aug-18 | 240 |
Wal-mart 4542 Kenawa Avenue SW Grandville, MI | 1997 / NAP | 100.0% | 167,656 | Walmart | 167,656 | $5.08 | Jan-18 | 180 |
| (1) | Source: Appraisal |
| (2) | Based on the underwritten rent roll dated May 1, 2021. |
The following table presents certain information relating to comparable sales for the Fleet Farm Mixed Use Property:
| Comparable Sales(1) | ||||||
| Property Location | Sale Date | Total NRA (SF) | Total Occupancy | Sale Price | Sale Price PSF | Adjusted Sales Price PSF |
| Fleet Farm Mixed Use Appleton, WI | NAP | 431,440(2) | 100.0%(2) | NAP | NAP | NAP |
Fleet Farm Waukee, IA | Jan-2021 | 192,000 | 100.0% | $38,100,000 | $198.44 | $139.88 |
Fleet Farm Monticello, MN | Nov-2020 | 188,913 | 100.0% | $20,830,000 | $110.26 | $128.20 |
Mills Fleet Farm Oconomowoc, WI | Jan-2020 | 218,628 | 100.0% | $36,415,000 | $166.56 | $128.29 |
Fleet Farm Lakeville, MN | Nov-2019 | 202,669 | 100.0% | $32,108,830 | $158.43 | $122.51 |
| (1) | Source: Appraisal |
| (2) | Based on the underwritten rent roll dated May 1, 2021. |
The Borrower. The borrower for the Fleet Farm Mixed Use Mortgage Loan is KB Fleet Farm, DST, a Delaware statutory trust with one independent director.
The Borrower Sponsor. Jeff Pori is the borrower sponsor and guarantor of certain nonrecourse carve-outs under the Fleet Farm Mixed Use Mortgage Loan. Mr. Pori is a real estate entrepreneur, investor and CEO of Kingsbarn Realty Capital (“Kingsbarn”). Kingsbarn primarily focuses on structured investment programs. Mr. Pori directs all aspects of Kingsbarn, from initiating its strategic direction and initiatives to managing the day-to-day operations and overseeing all property financing and acquisitions. Mr. Pori’s 27-year career in commercial real estate has been as a principal involved in construction, development, syndications, finance and property operations. See “Description of the Mortgage Pool—Loan Purpose; Default History, Bankruptcy Issues and Other Proceedings” in the Preliminary Prospectus.
Property Management. The Fleet Farm Mixed Use Property is managed by KB Property Advisors, LLC, which is an affiliate of the borrower sponsor.
Escrows and Reserves. At origination, the borrower deposited into escrow $1,000,000 for tenant improvement and leasing commissions reserves, $500,000 for capital expenditure reserves and $150,000 for a restoration reserve.
THE INFORMATION IN THIS STRUCTURAL AND COLLATERAL TERM SHEET IS NOT COMPLETE AND MAY BE AMENDED PRIOR TO THE TIME OF SALE. THIS TERM SHEET IS NOT AN OFFER TO SELL THESE SECURITIES AND IT IS NOT A SOLICITATION OF AN OFFER TO BUY THESE SECURITIES IN ANY JURISDICTION WHERE THE OFFER OR SALE IS NOT PERMITTED.
86
| Structural and Collateral Term Sheet | BBCMS 2021-C11 | |
| No. 5 – Fleet Farm Mixed Use | ||
Tax Escrows – Ongoing monthly real estate tax reserves will not be required for so long as (i) no Cash Management Period (as defined below) has occurred and is continuing, (ii) the Major Lease (as defined below) provides that the Major Tenant (as defined below) is obligated to pay all taxes directly to the applicable governmental authority, (iii) the borrower has provided evidence satisfactory to the lender of the Major Tenant’s full compliance with such obligation and (iv) the Major Lease remains in full force and effect (collectively, the “Tax Reserve Waiver Conditions”). If the Tax Reserve Waiver Conditions are not satisfied, the borrower will be required to pay to the lender 1/12th of the real estate taxes the lender estimates will be payable during the next 12 months.
Insurance Escrows – Ongoing monthly insurance reserves will not be required for so long as (i) no Cash Management Period has occurred and is continuing, (ii) the Major Lease provides that the Major Tenant is obligated to provide, maintain and pay all premiums for all insurance coverages required under the Fleet Farm Mixed Use Mortgage Loan documents, (iii) the borrower has provided evidence satisfactory to the lender of the Major Tenant’s full compliance with such obligation and (iv) the Major Lease remains in full force and effect (collectively, the “Insurance Reserve Waiver Conditions”). If the Insurance Reserve Waiver Conditions are not satisfied, the borrower will be required to pay to the lender 1/12th of the insurance premiums the lender estimates will be payable during the next 12 months.
Replacement Reserve – On the first payment date when the balance of the replacement reserve subaccount falls below $100,000 and on each payment date thereafter until the balance of the replacement reserve subaccount is at least $500,000, the borrower will be required to escrow 1/12th of the product obtained by multiplying $0.20 by the aggregate number of rentable square feet of space at the Fleet Farm Mixed Use Property, which currently equates to $86,288.
Rollover Reserve – The borrower will be required to pay to the lender all lease termination payments received by the borrower, other than (i) all fees, penalties, commissions or other payments made to the borrower in connection with or relating to the rejection, buy-out, termination, surrender or cancellation of any Major Lease (included in connection with any Major Tenant insolvency proceeding), (ii) any security deposits or proceeds of letters of credit held by the borrower in lieu of cash security deposits, which the borrower is permitted to retain pursuant to the applicable provisions of any Major Lease and (iii) any payments made to the borrower relating to unamortized tenant improvements and leasing commissions under any Major Lease, which will be deposited into the special rollover reserve subaccount. If the lender determines in its reasonable judgment that the funds in the rollover reserve subaccount will be insufficient to pay (or are in excess of) the amounts due or to become due for approved leasing expenses, the lender may require monthly contributions to be made by the borrower to the rollover reserve subaccount.
Special Rollover Reserve – During the continuance of a Lease Sweep Period (as defined below) (provided no other Cash Management Period is then continuing) the borrower is required to deposit with the lender all available cash (or such portion of available cash allocated by the lender for deposit into the special rollover reserve subaccount). The borrower will also be required to deposit with the lender for transfer into the special rollover reserve subaccount (i) all fees, penalties, commissions or other payments made to the borrower in connection with or relating to the rejection, buy-out, termination, surrender or cancellation of any Major Lease (included in connection with any Major Tenant insolvency proceeding), (ii) any security deposits or proceeds of letters of credit held by the borrower in lieu of cash security deposits, which the borrower is permitted to retain pursuant to the applicable provisions of any Major Lease and (iii) any payments made to the borrower relating to unamortized tenant improvements and leasing commissions under any Major Lease.
Restoration Reserve – If at any point in time the balance of the restoration reserve subaccount falls below $150,000, the borrower will be required to pay the lender within 30 days the difference between (x) $150,000 and (y) the current balance of the restoration reserve subaccount. In the event of a casualty in which the proceeds are insufficient to cover the cost of restoration, repair, replacement or rebuilding of the Fleet Farm Mixed Use Property in accordance with the legal requirements to be of at least equal value and of substantially the same character as prior to such damage or destruction (the “Proceeds Shortfall”), the lender will disburse the restoration reserve funds to the borrower in the amount of such Proceeds Shortfall; provided that: (i) no default of event of default has occurred and is continuing, (ii) the borrower is otherwise entitled to reimbursement out of the proceeds pursuant to the Fleet Farm Mixed Use Mortgage Loan documents and (iii) Fleet Farm has failed to complete the restoration, repair, replacement or rebuilding of the Fleet Farm Mixed Use Property (as applicable) pursuant to Fleet Farm’s obligations under the Fleet Farm lease beyond any applicable notice and cure period provided for in the Fleet Farm lease. Notwithstanding the above, in the event and for so long as the borrower (or Fleet Farm if Fleet Farm’s insurance is being relied upon pursuant to the Fleet Farm Mixed Use Mortgage Loan documents) maintains the insurance required under the Fleet Farm Mixed Use Mortgage Loan documents and the policy with respect to the Fleet Farm Mixed Use Property and liability coverages has a deductible no greater than $100,000 (the “Deductible Condition”), all amounts in the restoration reserve subaccount will be (i) during a Cash Management Period, which is not the result of an event of default, transferred to the cash management account, (ii) in the absence of an existing Cash Management Period, disbursed to the borrower, or (iii) if an event of default has occurred and remains outstanding, disbursed to the lender and the lender may apply the restoration reserve funds to the payment of the Fleet Farm Mixed Use Mortgage Loan in any order, proportion and priority as the lender may determine in its sole and absolute discretion. If the borrower’s (or Fleet Farm’s, as applicable) insurance coverage does not satisfy the Deductible Condition after disbursement of the restoration reserve funds pursuant to the Fleet Farm Mixed Use Mortgage Loan, the borrower will be required to deposit $150,000 with the lender to be transferred into the restoration reserve subaccount within 30 days of the failure to satisfy the Deductible Condition.
Lockbox / Cash Management. The Fleet Farm Mixed Use Mortgage Loan documents require a hard lockbox with springing cash management. The borrower, the Master Tenant (as defined below) and the property manager are required to cause all rents relating to
THE INFORMATION IN THIS STRUCTURAL AND COLLATERAL TERM SHEET IS NOT COMPLETE AND MAY BE AMENDED PRIOR TO THE TIME OF SALE. THIS TERM SHEET IS NOT AN OFFER TO SELL THESE SECURITIES AND IT IS NOT A SOLICITATION OF AN OFFER TO BUY THESE SECURITIES IN ANY JURISDICTION WHERE THE OFFER OR SALE IS NOT PERMITTED.
87
| Structural and Collateral Term Sheet | BBCMS 2021-C11 | |
| No. 5 – Fleet Farm Mixed Use | ||
the Fleet Farm Mixed Use Property to be transmitted directly by the tenants into a lender-controlled lockbox account and all rents received by the borrower, the Master Tenant or the property manager are required to be deposited into the lockbox account within one business day of receipt. As long as no Cash Management Period is in effect, funds deposited into the lockbox account are required to be transferred to the borrower’s operating account on a daily basis. Upon the occurrence of a Cash Management Period, all sums on deposit in the lockbox account are required to be transferred on a daily basis to a cash management account controlled by the lender and applied and disbursed in accordance with the Fleet Farm Mixed Use Mortgage Loan documents. Available cash on deposit will be applied as follows: (a) during the continuance of a Lease Sweep Period, to the special rollover reserve subaccount, or (b) to the extent that a Cash Management Period is in effect (other than solely as a result of a Lease Sweep Period), to the cash collateral subaccount.
A “Cash Management Period” means the occurrence of (i) the stated maturity date of July 1, 2031, (ii) a default or an event of default, (iii) a debt service coverage ratio less than 1.25x as of any calculation date, (iv) a default of the borrower’s financial reporting obligations or the guarantor financial covenants, or (v) the commencement of a Lease Sweep Period, and will end, as applicable, if (1) the Fleet Farm Mixed Use Mortgage Loan and all other obligations under the Fleet Farm Mixed Use Mortgage Loan documents have been repaid in full or (2) the stated maturity date has not occurred and, (a) with respect to clause (ii) above, once the event of default has been cured and no other event of default has occurred and is continuing, (b) with respect to clause (iii) above, the debt service coverage ratio is at least equal to 1.30x for two consecutive calendar quarters, (c) with respect to clause (iv) above, once the reporting or financial covenant default has been cured and no other financial default has occurred and is continuing, or (d) with respect to clause (v) above, once the Lease Sweep Period has ended.
A “Lease Sweep Period” will commence on the first payment date following the occurrence of any of the following (i) the Master Lease or any Major Lease (or any material portion thereof) is surrendered, cancelled or terminated prior to its then current expiration date or the receipt by the borrower or the manager of notice from the Master Tenant or any Major Tenant of its intent to surrender, cancel or terminate any Major Lease (or any portion thereof prior to its then current expiration date); (ii) any Major Tenant discontinues its business at its premises (i.e., “goes dark”) or gives notice that it intends to discontinue its business; (iii) the occurrence and continuance (beyond any applicable notice and cure periods) of a default under the Master Lease or under any Major Lease by the applicable Major Tenant thereunder; and (iv) the occurrence of a Major Tenant insolvency proceeding. A Lease Sweep Period will end upon the earlier to occur of (a) the reasonable determination by the lender that sufficient funds have been accumulated in the special rollover reserve subaccount to pay for all anticipated expenses in connection with the re-leasing of the space under the applicable Major Lease that gave rise to the subject Lease Sweep Period, including brokerage commissions and tenant improvements and any anticipated shortfalls of payments required under the Fleet Farm Mixed Use Mortgage Loan documents during any period of time that rents are insufficient as a result of down-time or free rent periods, or (b) the occurrence of any of the following (provided that no other Lease Sweep Period is continuing); (1) with respect to clauses (i) or (ii) above, upon the earlier to occur of (A) the date on which the subject Major Tenant irrevocably exercises its renewal or extension option (or otherwise enters into an extension agreement for a term of at least five years with the borrower and acceptable to the lender) with respect to all of the space demised under its Major Lease, and in the lender’s judgement, sufficient funds have been accumulated in the special rollover reserve subaccount (during the continuance of the subject Lease Sweep Period) to pay for all anticipated approved Major Lease leasing expenses, free rent periods and/or rent abatement periods for such Major Lease and any other anticipated expenses in connection with such renewal or extension; (B) the date on which all of the space demised under the subject Major Lease (or portion thereof) that gave rise to the subject Lease Sweep Period has been fully leased pursuant to a replacement lease or replacement leases approved by the lender, and entered into in accordance with the Fleet Farm Mixed Use Mortgage Loan documents, and all approved Major Lease leasing expenses (and any other expenses in connection with the re-tenanting of such space) have been paid in full; (2) with respect to clause (iii) above, if the Master Tenant or Major Tenant default has been cured, and no other Master Tenant or Major Tenant default has occurred for a period of three consecutive months; or (3) with respect to clause (iv) above, if the applicable Major Tenant insolvency proceeding has terminated and the applicable Major Lease has been affirmed, assumed or assigned in a manner satisfactory to the lender.
A “Major Lease” means the Fleet Farm lease or any other lender approved replacement lease.
A “Major Tenant” means Fleet Farm or any tenant under a replacement Major Lease.
A “Master Lease” means the lease between the borrower and KB Fleet Farm MT, LLC (the “Master Tenant”) for a 10-year term with an expiration date of June 17, 2031 related to the Fleet Farm Mixed Use Property; provided, however, if any obligations remain outstanding under the Fleet Farm Mixed Use Mortgage Loan, the Master Lease may not expire without the prior written consent of the lender. The Master Lease has three, five-year renewal options remaining.
Subordinate and Mezzanine Debt. None.
Partial Release. Not permitted.
Ground Lease. None.
THE INFORMATION IN THIS STRUCTURAL AND COLLATERAL TERM SHEET IS NOT COMPLETE AND MAY BE AMENDED PRIOR TO THE TIME OF SALE. THIS TERM SHEET IS NOT AN OFFER TO SELL THESE SECURITIES AND IT IS NOT A SOLICITATION OF AN OFFER TO BUY THESE SECURITIES IN ANY JURISDICTION WHERE THE OFFER OR SALE IS NOT PERMITTED.
88
THIS PAGE INTENTIONALLY LEFT BLANK)
THE INFORMATION IN THIS STRUCTURAL AND COLLATERAL TERM SHEET IS NOT COMPLETE AND MAY BE AMENDED PRIOR TO THE TIME OF SALE. THIS TERM SHEET IS NOT AN OFFER TO SELL THESE SECURITIES AND IT IS NOT A SOLICITATION OF AN OFFER TO BUY THESE SECURITIES IN ANY JURISDICTION WHERE THE OFFER OR SALE IS NOT PERMITTED.
89
| Structural and Collateral Term Sheet | BBCMS 2021-C11 | |
| No. 6 – Morris Corporate Center | ||

THE INFORMATION IN THIS STRUCTURAL AND COLLATERAL TERM SHEET IS NOT COMPLETE AND MAY BE AMENDED PRIOR TO THE TIME OF SALE. THIS TERM SHEET IS NOT AN OFFER TO SELL THESE SECURITIES AND IT IS NOT A SOLICITATION OF AN OFFER TO BUY THESE SECURITIES IN ANY JURISDICTION WHERE THE OFFER OR SALE IS NOT PERMITTED.
90
| Structural and Collateral Term Sheet | BBCMS 2021-C11 | |
| No. 6 – Morris Corporate Center | ||

THE INFORMATION IN THIS STRUCTURAL AND COLLATERAL TERM SHEET IS NOT COMPLETE AND MAY BE AMENDED PRIOR TO THE TIME OF SALE. THIS TERM SHEET IS NOT AN OFFER TO SELL THESE SECURITIES AND IT IS NOT A SOLICITATION OF AN OFFER TO BUY THESE SECURITIES IN ANY JURISDICTION WHERE THE OFFER OR SALE IS NOT PERMITTED.
91
| Structural and Collateral Term Sheet | BBCMS 2021-C11 | |
| No. 6 – Morris Corporate Center | ||
| Mortgage Loan Information | Property Information | |||
| Mortgage Loan Seller: | UBS AG | Single Asset / Portfolio: | Single Asset | |
| Original Principal Balance(1): | $32,500,000 | Title: | Fee | |
| Cut-off Date Principal Balance(1): | $32,500,000 | Property Type – Subtype: | Office – Suburban | |
| % of IPB: | 3.3% | Net Rentable Area (SF): | 541,195 | |
| Loan Purpose: | Recapitalization | Location: | Parsippany, NJ | |
| Borrower: | MCC Owner LLC | Year Built / Renovated: | 1989 / 2017 | |
| Borrower Sponsors: | Harvey Rosenblatt and Asher Koenig | Occupancy: | 91.9% | |
| Interest Rate: | 3.40000% | Occupancy Date: | 4/1/2021 | |
| Note Date: | 5/7/2021 | 4th Most Recent NOI (As of)(3): | $5,451,447 (12/31/2018) | |
| Maturity Date: | 5/6/2031 | 3rd Most Recent NOI (As of)(3): | $7,144,386 (12/31/2019) | |
| Interest-only Period: | 36 months | 2nd Most Recent NOI (As of)(3): | $7,357,655 (12/31/2020) | |
| Original Term: | 120 months | Most Recent NOI (As of)(3): | $7,513,568 (TTM 2/28/2021) | |
| Original Amortization Term: | 360 months | UW Economic Occupancy: | 92.0% | |
| Amortization Type: | Interest Only, Amortizing Balloon | UW Revenues: | $15,139,045 | |
| Call Protection: | L(28),D(88),O(4) | UW Expenses: | $6,060,159 | |
| Lockbox / Cash Management: | Hard / Springing | UW NOI(3): | $9,078,886 | |
| Additional Debt(1): | Yes | UW NCF: | $8,279,089 | |
| Additional Debt Balance(1): | $49,500,000 | Appraised Value / Per SF: | $120,200,000 / $222 | |
| Additional Debt Type(1): | Pari Passu | Appraisal Date: | 4/16/2021 | |
| Escrows and Reserves(2) | Financial Information(1) | |||||||||
| Initial | Monthly | Initial Cap | Cut-off Date Loan / SF: | $152 | ||||||
| Taxes: | $248,296 | $155,185 | N/A | Maturity Date Loan / SF: | $129 | |||||
| Insurance: | $59,972 | $9,087 | N/A | Cut-off Date LTV: | 68.2% | |||||
| Replacement Reserves: | $0 | $6,765 | N/A | Maturity Date LTV: | 58.1% | |||||
| TI/LC Reserve: | $0 | $78,924 | N/A | UW NCF DSCR: | 1.90x | |||||
| Rent Concession Reserve(3): | $2,897,674 | $0 | N/A | UW NOI Debt Yield: | 11.1% | |||||
| Material Tenant Rollover Reserve: | $0 | Springing | Various | |||||||
| Sources and Uses | ||||||||||
| Sources | Proceeds | % of Total | Uses | Proceeds | % of Total | |||||
| Whole Loan(1) | $82,000,000 | 80.8% | Payoff Existing Debt | $61,345,393 | 60.4% | |||||
| Borrower Sponsor Equity | 19,500,000 | 19.2 | Partnership Buyout | 33,744,001 | 33.2 | |||||
| Upfront Reserves | 3,205,942 | 3.2 | ||||||||
| Closing Costs | 2,524,237 | 2.5 | ||||||||
| Return of Equity | 680,426 | 0.7 | ||||||||
| Total Sources | $101,500,000 | 100.0% | Total Uses | $101,500,000 | 100.0% | |||||
| (1) | The Morris Corporate Center Mortgage Loan (as defined below) is part of a whole loan evidenced by six pari passu promissory notes with an aggregate original principal balance of $82,000,000. The financial information presented in the chart above is based on the Morris Corporate Center Whole Loan (as defined below). |
| (2) | For a full description of Escrows and Reserves, see “Escrows and Reserves” below. |
| (3) | The increase in UW NOI from Most Recent NOI is primarily driven by underwriting the full rent for Teva Pharmaceuticals USA, Inc. (“Teva”) and $112,206 of straight-line rent for Ogilvy CommonHealth Worldwide, LLC (“Ogilvy”). The historical NOI figures reflect the net effective rent for Teva after partial abatements, while the UW NOI reflects the full escalated rent. At origination, $2,897,674 was reserved for outstanding rent concessions owed to Teva. |
The Loan. The Morris Corporate Center mortgage loan is part of a whole loan evidenced by six pari passu notes with an aggregate original principal balance of $82,000,000 (the “Morris Corporate Center Whole Loan”). The Morris Corporate Center Whole Loan is secured by a first lien mortgage on the borrower’s fee interest in a 541,195 square foot office property located in Parsippany, New Jersey (the “Morris Corporate Center Property”). The non-controlling Note A-3-2, Note A-4 and Note A-5 (collectively, the “Morris Corporate Center Mortgage Loan”), with an aggregate original principal balance of $32,500,000, will be included in the BBCMS 2021-C11 securitization trust. The Morris Corporate Center Whole Loan is serviced pursuant to the pooling and servicing agreement for the BBCMS 2021-C10 securitization trust. See “Description of the Mortgage Pool—The Whole Loans—The Non-Serviced Pari Passu Whole Loans” in the Preliminary Prospectus.
THE INFORMATION IN THIS STRUCTURAL AND COLLATERAL TERM SHEET IS NOT COMPLETE AND MAY BE AMENDED PRIOR TO THE TIME OF SALE. THIS TERM SHEET IS NOT AN OFFER TO SELL THESE SECURITIES AND IT IS NOT A SOLICITATION OF AN OFFER TO BUY THESE SECURITIES IN ANY JURISDICTION WHERE THE OFFER OR SALE IS NOT PERMITTED.
92
| Structural and Collateral Term Sheet | BBCMS 2021-C11 | |
| No. 6 – Morris Corporate Center | ||
| Whole Loan Summary | |||
| Note | Original Balance | Note Holder | Controlling Piece |
| A-1 | $20,000,000 | BBCMS 2021-C10 | Yes |
| A-2 | $20,000,000 | BBCMS 2021-C10 | No |
| A-3-1 | $9,500,000 | BBCMS 2021-C10 | No |
| A-3-2 | $10,500,000 | BBCMS 2021-C11 | No |
| A-4 | $10,000,000 | BBCMS 2021-C11 | No |
| A-5 | $12,000,000 | BBCMS 2021-C11 | No |
| Total | $82,000,000 | ||
The Property. The Morris Corporate Center Property consists of three, four-story, Class A office buildings totaling 541,195 square feet, located in Parsippany, New Jersey. The Morris Corporate Center Property was originally built in 1989 and was renovated in 2017. The Morris Corporate Center Property includes 1,638 parking spaces (approximately 3.0 parking spaces per 1,000 square feet of NRA). The Morris Corporate Center Property was 91.9% leased as of April 1, 2021 to seven tenants. The two largest tenants, Teva and Ogilvy, together comprise 81.7% of the NRA and 93.0% of the underwritten base rent. The borrower sponsors acquired the Morris Corporate Center Property in December 2017 for $60.0 million and have invested approximately $23.0 million in capital improvements, tenant improvements and leasing costs and approximately $3.5 million in soft costs.
COVID-19 Update. As of August 13, 2021, the Morris Corporate Center Property was open and operating and all tenants are current on their rental obligations. The Morris Corporate Center Whole Loan is current through the August 2021 payment date. As of August 13, 2021, the Morris Corporate Center Whole Loan is not subject to any forbearance, modification or debt service relief requests.
Major Tenants.
Teva (354,055 square feet; 65.4% of the NRA; 74.5% of the underwritten base rent; Ba2/BB-/BB- by Moody’s/S&P/ Fitch): Teva (NYSE: TEVA) started as a small business in Jerusalem in 1901 distributing imported medicine. Teva now produces 1,800 unique molecules and a portfolio of 3,500 products, spanning generics, specialty and over the counter medicines and provides medicines to approximately 200 million people worldwide every day. The Morris Corporate Center Property serves as Teva’s United States headquarters. Teva has been a tenant at the Morris Corporate Center Property since 2011, initially leasing 147,181 square feet through December 31, 2022. Since then, Teva has extended its lease through July 31, 2030 and expanded to 354,055 square feet. Teva provided a letter of credit in the amount of $4,664,008 as security for its lease obligations. Teva’s lease is guaranteed by Teva Pharmaceutical Industries, Ltd. Teva has two, five-year renewal options remaining. Teva has a one-time right to surrender less than 34,548 square feet (the “Surrender Space”) as of July 31, 2026 by providing at least 12 months’ prior written notice and payment of a fee equal to the sum of six months of the Surrender Space’s base rent, the unamortized amount of the Surrender Space’s tenant improvement allowance costs, leasing brokerage commissions and abated rent and any cost associated with separating out the Surrender Space into a self-contained rental unit. Teva is required to pay a monthly amount of approximately $1,667 for the right to use 21 parking spaces at the Morris Corporate Center Property.
Ogilvy (88,066 square feet; 16.3% of the NRA; 18.5% of the underwritten base rent; Baa2/BBB by Moody’s/S&P): Ogilvy provides advertising, marketing, market research, medical education, strategic planning and media services for customers in the healthcare industry. Ogilvy operates in more than 30 international markets across more than 50 offices. Ogilvy leases 83,497 square feet as office space through December 31, 2027, 3,060 square feet as a server room through December 31, 2021 and 1,509 square feet as storage space through December 31, 2021. Ogilvy is a subsidiary of WPP plc (NYSE: WPP), the world's largest advertising company by revenue, and its lease is guaranteed by WPP Group USA, Inc. WPP Group USA, Inc.’s obligations are guaranteed by WPP Jubilee Limited, a wholly-owned subsidiary of WPP plc. Ogilvy has two, five-year renewal options remaining on the 83,497 square foot office space. Ogilvy also pays $180 per space per month for the right to use 160 additional non-exclusive parking spaces at the Morris Corporate Center Property.
Environmental. According to a Phase I environmental site assessment dated April 19, 2021, there was no evidence of any recognized environmental conditions at the Morris Corporate Center Property.
THE INFORMATION IN THIS STRUCTURAL AND COLLATERAL TERM SHEET IS NOT COMPLETE AND MAY BE AMENDED PRIOR TO THE TIME OF SALE. THIS TERM SHEET IS NOT AN OFFER TO SELL THESE SECURITIES AND IT IS NOT A SOLICITATION OF AN OFFER TO BUY THESE SECURITIES IN ANY JURISDICTION WHERE THE OFFER OR SALE IS NOT PERMITTED.
93
| Structural and Collateral Term Sheet | BBCMS 2021-C11 | |
| No. 6 – Morris Corporate Center | ||
| Historical and Current Occupancy | |||
| 2018(1) | 2019(2) | 2020(2) | Current(3) |
| 76.7% | 93.0% | 93.0% | 91.9% |
| (1) | 2018 Occupancy is provided by CoStar and is based on the quarterly average. The borrower sponsors acquired the Morris Corporate Center Property in December 2017 and invested approximately $7.9 million in capital improvements, tenant improvements and leasing costs in 2018. |
| (2) | 2019 and 2020 Occupancies were provided by the borrower and are as of December 31 of each respective year. The borrower sponsors invested approximately $15.1 million in capital improvements, tenant improvements and leasing costs in 2019 and 2020. |
| (3) | Current Occupancy is as of April 1, 2021. |
| Top Tenant Summary(1) | |||||||
| Tenant | Ratings(2) Moody’s/S&P/Fitch | Net Rentable Area (SF) | % of Total NRA | UW Base Rent PSF(3) | UW Base Rent(3) | % of Total UW Base Rent | Lease Exp. Date |
| Teva Pharmaceuticals USA, Inc.(4) | Ba2/BB-/BB- | 354,055 | 65.4% | $28.50 | $10,090,568 | 74.5% | 7/31/2030 |
| Ogilvy CommonHealth Worldwide, LLC | Baa2/BBB/NR | 88,066 | 16.3 | 28.46 | 2,506,122 | 18.5 | Various(5) |
| Curtiss-Wright(6) | NR/NR/NR | 15,602 | 2.9 | 22.89 | 357,086 | 2.6 | 10/31/2029 |
| Homebridge Financial Services, Inc. | NR/NR/NR | 11,774 | 2.2 | 20.38 | 240,000 | 1.8 | 3/31/2023 |
| Lee Hecht Harrison(7) | NR/NR/NR | 5,149 | 1.0 | 28.50 | 146,747 | 1.1 | 11/30/2023 |
| Major Tenants | 474,646 | 87.7% | $28.11 | $13,340,522 | 98.4% | ||
| Other Tenants(8) | 22,775 | 4.2% | $9.27 | $211,031 | 1.6% | ||
| Occupied Collateral Total / Wtd. Avg. | 497,421 | 91.9% | $27.24 | $13,551,553 | 100.0% | ||
| Vacant Space | 43,774 | 8.1% | |||||
| Collateral Total | 541,195 | 100.0% | |||||
| (1) | Based on underwritten rent roll dated April 1, 2021. |
| (2) | Ratings provided are for the parent company of the entity listed in the “Tenant” field whether or not the parent company guarantees the lease. |
| (3) | UW Base Rent PSF and UW Base Rent include rent steps totaling $233,192 through June 2022. |
| (4) | Teva has a one-time right to decrease its leased space by the Surrender Space as of July 31, 2026 by providing at least 12 months’ prior written notice and payment of a fee equal to the sum of six months of the Surrender Space’s base rent, the unamortized amount of the Surrender Space’s tenant improvement allowance costs, leasing brokerage commissions and abated rent and any cost associated with separating out the Surrender Space into a self-contained rental unit. Teva has two, five-year renewal options remaining. |
| (5) | Ogilvy leases 83,497 square feet as office space through December 2027, 3,060 square feet as a server room through December 2021 and 1,509 square feet as storage space through December 2021. The 83,497 square foot office space has two, five-year renewal options remaining. |
| (6) | Curtiss-Wright leases 15,442 square feet as office space under one lease through October 2029 and 160 square feet as storage space under another lease through October 2029. Curtiss-Wright has an early termination option for the 15,442 square foot office space as of October 31, 2026, by providing at least 12 months’ written notice and payment of a termination fee equal to the sum of the unamortized balances of the tenant improvement allowance, leasing commissions, legal fees, rent abatement and moving allowance. The 15,442 square foot office space has two, five-year renewal options remaining. |
| (7) | Lee Hecht Harrison has one, three-year renewal option remaining. |
| (8) | Includes a café (7,886 square feet) with no associated rent and a management office (8,000 square feet) with rent that is included in other income and recorded as a reimbursable expense, resulting in a net impact of $0 to the net operating income. |
THE INFORMATION IN THIS STRUCTURAL AND COLLATERAL TERM SHEET IS NOT COMPLETE AND MAY BE AMENDED PRIOR TO THE TIME OF SALE. THIS TERM SHEET IS NOT AN OFFER TO SELL THESE SECURITIES AND IT IS NOT A SOLICITATION OF AN OFFER TO BUY THESE SECURITIES IN ANY JURISDICTION WHERE THE OFFER OR SALE IS NOT PERMITTED.
94
| Structural and Collateral Term Sheet | BBCMS 2021-C11 | |
| No. 6 – Morris Corporate Center | ||
| Lease Rollover Schedule(1)(2) | |||||||||
| Year | Number of Leases Expiring | Net Rentable Area Expiring | % of NRA Expiring | UW Base Rent Expiring(3) | % of UW Base Rent Expiring | Cumulative Net Rentable Area Expiring | Cumulative % of NRA Expiring | Cumulative UW Base Rent Expiring(3) | Cumulative % of UW Base Rent Expiring |
| Vacant | NAP | 43,774 | 8.1% | NAP | NAP | 43,774 | 8.1% | NAP | NAP |
| 2021 & MTM(4) | 2(5) | 20,455 | 3.8 | $74,565 | 0.6% | 64,229 | 11.9% | $74,565 | 0.6% |
| 2022 | 0 | 0 | 0.0 | 0 | 0.0 | 64,229 | 11.9% | $74,565 | 0.6% |
| 2023 | 4 | 23,812 | 4.4 | 597,778 | 4.4 | 88,041 | 16.3% | $672,343 | 5.0% |
| 2024 | 0 | 0 | 0.0 | 0 | 0.0 | 88,041 | 16.3% | $672,343 | 5.0% |
| 2025 | 0 | 0 | 0.0 | 0 | 0.0 | 88,041 | 16.3% | $672,343 | 5.0% |
| 2026 | 0 | 0 | 0.0 | 0 | 0.0 | 88,041 | 16.3% | $672,343 | 5.0% |
| 2027 | 1(5) | 83,497 | 15.4 | 2,431,557 | 17.9 | 171,538 | 31.7% | $3,103,899 | 22.9% |
| 2028 | 0 | 0 | 0.0 | 0 | 0.0 | 171,538 | 31.7% | $3,103,899 | 22.9% |
| 2029 | 2 | 15,602 | 2.9 | 357,086 | 2.6 | 187,140 | 34.6% | $3,460,985 | 25.5% |
| 2030 | 1 | 354,055 | 65.4 | 10,090,568 | 74.5 | 541,195 | 100.0% | $13,551,553 | 100.0% |
| 2031 | 0 | 0 | 0.0 | 0 | 0.0 | 541,195 | 100.0% | $13,551,553 | 100.0% |
| 2032 & Beyond | 0 | 0 | 0.0 | 0 | 0.0 | 541,195 | 100.0% | $13,551,553 | 100.0% |
| Total | 9 | 541,195 | 100.0% | $13,551,553 | 100.0% | ||||
| (1) | Based on the underwritten rent roll dated April 1, 2021. |
| (2) | Certain leases may have termination options that are exercisable prior to the originally stated expiration date of the lease and that are not considered in this Lease Rollover Schedule. |
| (3) | UW Base Rent Expiring and Cumulative UW Base Rent Expiring include rent steps totaling $233,192 through June 2022. |
| (4) | 2021 & MTM includes a café (7,886 square feet) with no associated rent and a management office (8,000 square feet) with rent that is included in other income and recorded as a reimbursable expense, resulting in a net impact of $0 to the net operating income. |
| (5) | Ogilvy leases 83,497 square feet through December 2027 and 3,060 square feet through December 2021 under one lease. |
| Operating History and Underwritten Net Cash Flow | |||||||
| 2018 | 2019 | 2020 | TTM(1) | Underwritten | Per Square Foot | %(2) | |
| Rents in Place(3) | $10,367,967 | $11,695,450 | $11,711,717 | $11,837,654 | $13,663,758 | $25.25 | 85.9% |
| Vacant Income | 0 | 0 | 0 | 0 | 1,269,446 | 2.35 | 8.0 |
| Gross Potential Rent | $10,367,967 | $11,695,450 | $11,711,717 | $11,837,654 | $14,933,204 | $27.59 | 93.9% |
| Total Reimbursements | 821,887 | 1,067,652 | 1,219,213 | 1,218,027 | 968,152 | 1.79 | 6.1 |
| Net Rental Income | $11,189,853 | $12,763,102 | $12,930,930 | $13,055,681 | $15,901,356 | $29.38 | 100.0% |
| Other Income(4) | 463,539 | 564,489 | 493,023 | 487,135 | 507,135 | 0.94 | 3.2 |
| (Vacancy/Credit Loss) | 0 | 0 | 0 | 0 | (1,269,446) | (2.35) | (8.0) |
| Effective Gross Income | $11,653,392 | $13,327,591 | $13,423,952 | $13,542,816 | $15,139,045 | $27.97 | 95.2% |
| Total Expenses | $ 6,201,945 | $ 6,183,205 | $ 6,066,297 | $ 6,029,248 | $ 6,060,159 | $11.20 | 40.0% |
| Net Operating Income(5) | $ 5,451,447 | $ 7,144,386 | $ 7,357,655 | $ 7,513,568 | $ 9,078,886 | $16.78 | 60.0% |
| Capital Expenditures | 0 | 0 | 0 | 0 | 81,179 | 0.15 | 0.5 |
| TI/LC | 0 | 0 | 0 | 0 | 718,618 | 1.33 | 4.7 |
| Net Cash Flow | $ 5,451,447 | $ 7,144,386 | $ 7,357,655 | $ 7,513,568 | $ 8,279,089 | $15.30 | 54.7% |
| (1) | TTM represents the trailing 12 months ending February 28, 2021. |
| (2) | % column represents percent of Net Rental Income for all revenue lines and represents percent of Effective Gross Income for the remainder of fields. |
| (3) | Underwritten Rents in Place is based on the April 1, 2021 rent roll and includes (i) straight line rent totaling $112,206 for Ogilvy and (ii) rent steps totaling $233,192 through June 2022. |
| (4) | Other Income includes contractual parking revenue, cable revenue, ATM revenue, tenant direct billings and management office rent. The management office rent is also recorded as a reimbursable expense, resulting in a net impact of $0 to the Net Operating Income. |
| (5) | The increase in Underwritten Net Operating Income from TTM Net Operating Income is primarily driven by underwriting the full rent for Teva and $112,206 of straight-line rent for Ogilvy. The historical Net Operating Income figures reflect the net effective rent for Teva after partial abatements, while the Underwritten Net Operating Income reflects the full escalated rent. At origination, $2,897,674 was reserved for outstanding rent concessions owed to Teva. |
THE INFORMATION IN THIS STRUCTURAL AND COLLATERAL TERM SHEET IS NOT COMPLETE AND MAY BE AMENDED PRIOR TO THE TIME OF SALE. THIS TERM SHEET IS NOT AN OFFER TO SELL THESE SECURITIES AND IT IS NOT A SOLICITATION OF AN OFFER TO BUY THESE SECURITIES IN ANY JURISDICTION WHERE THE OFFER OR SALE IS NOT PERMITTED.
95
| Structural and Collateral Term Sheet | BBCMS 2021-C11 | |
| No. 6 – Morris Corporate Center | ||
The Market. The Morris Corporate Center Property is located in Parsippany, New Jersey. According to a third-party market report, Northern New Jersey has a population of approximately 3.6 million people and spans approximately 1,583 square miles. Northern New Jersey’s transportation options include major interstate highways, 1,000 miles of freight lines, Newark Liberty International Airport, NJ Transit and the Port of New York and New Jersey. Two major interstate highways, I-80 and I-287, are located approximately 1.0 mile and 2.4 miles, respectively, from the Morris Corporate Center Property. The Deville and Mount Tabor train stations, which are served by NJ Transit Rail, are located approximately 3.0 miles and 3.1 miles, respectively, from the Morris Corporate Center Property. Newark Liberty International Airport is located approximately 25.9 miles southeast of the Morris Corporate Center Property. The immediate area surrounding the Morris Corporate Center Property consists of residential, office and retail uses. Intervale Gardens, a 248-unit garden apartment complex, is located approximately 1.3 miles east of the Morris Corporate Center Property. The Morris Hills Shopping Center, a 120,000 square foot shopping center that is anchored by Marshalls and HomeGoods and includes Blink Fitness and Harmon Face Values, is located approximately 1.6 miles east of the Morris Corporate Center Property. Downtown Parsippany is located approximately 3.0 miles east of the Morris Corporate Center Property. Manhattan is located approximately 29.6 miles east of the Morris Corporate Center Property.
According to a third-party market report, as of April 6, 2021, the Northern New Jersey office market had an inventory of approximately 153.8 million square feet, overall vacancy in the market of approximately 14.1% and average asking rents of $26.20 per square foot. The Morris Corporate Center Property is located in the Parsippany office submarket. According to a third-party market report, as of April 6, 2021, the Parsippany office submarket had an inventory of approximately 20.7 million square feet, overall vacancy of approximately 20.8% and average asking rents of $26.32 per square foot. According to a third-party market report, the estimated 2021 population within a one-, three- and five-mile radius of the Morris Corporate Center Property is 4,760, 54,982 and 138,652, respectively. The estimated 2021 average household income within the same radii is $176,423, $166,040 and $167,709, respectively.
The following table presents certain information relating to comparable office leases for the Morris Corporate Center Property:
| Comparable Office Leases(1) | ||||||||
| Property Location | Year Built | NRA (SF) | Tenant | Lease Size (SF) | Rent PSF | Commencement | Lease Term (Years) | Lease Type |
| 400 Interpace Parkway Parsippany, NJ | 1989 | 541,195(2) | Various | Various | $27.24(2) | Various | Various | Modified Gross |
115 Tabor Road Morris Plains, NJ | 2007 | 446,798 | Global Aerospace | 26,988 | $28.00 | Sep-2020 | 12.0 Yrs. | Modified Gross |
325 Columbia Turnpike Florham Park, NJ | 1987 | 168,144 | Bressler Amery & Ross | 59,000 | $27.50 | Sep-2020 | 10.8 Yrs. | Modified Gross |
| 119 Cherry Hill Road Parsippany, NJ | 1981 | 191,249 | Old Republic National Title Insurance | 4,995 | $22.25 | April-2020 | 5.3 Yrs. | Modified Gross |
6 Century Drive Parsippany, NJ | 1981 | 100,461 | Zoetis | 10,574 | $21.00 | Feb-2020 | 5.3 Yrs. | Modified Gross |
100 Campus Drive Florham Park, NJ | 1989 | 397,170 | Wiss & Company | 41,513 | $33.75 | Jan-2020 | 12.6 Yrs. | Modified Gross |
| (1) | Source: Appraisal. |
| (2) | Based on the underwritten rent roll dated April 1, 2021 with rent steps totaling $233,192 through June 2022. |
The following table presents certain information relating to comparable office sales for the Morris Corporate Center Property:
| Comparable Office Sales(1) | ||||||
| Property Location | Sale Date | Total NRA (SF) | Total Occupancy | Sale Price | Sale Price PSF | Adjusted Sales Price PSF |
| 400 Interpace Parkway Parsippany, NJ | NAP | 541,195(2) | 91.9%(2) | NAP | NAP | NAP |
| 433 Hackensack Avenue Hackensack, NJ | Jan-2020 | 649,338 | 91.0% | $123,000,000 | $189.42 | $215.95 |
| 44 Whippany Road Morristown, NJ | Nov-2020 | 220,160 | 87.0% | $50,000,000 | $227.11 | $233.03 |
| 60 Columbia Turnpike Morristown, NJ | Mar-2021 | 411,737 | 79.0% | $77,000,000 | $187.01 | $204.70 |
| 99 Wood Avenue South Iselin, NJ | Mar-2021 | 945,906 | 91.0% | $254,000,000 | $268.53 | $227.54 |
101 JFK Parkway Short Hills, NJ | Apr-2021 | 828,422 | 81.0% | $255,000,000 | $307.81 | $277.03 |
| (1) | Source: Appraisal. |
| (2) | Based on the underwritten rent roll dated April 1, 2021. |
THE INFORMATION IN THIS STRUCTURAL AND COLLATERAL TERM SHEET IS NOT COMPLETE AND MAY BE AMENDED PRIOR TO THE TIME OF SALE. THIS TERM SHEET IS NOT AN OFFER TO SELL THESE SECURITIES AND IT IS NOT A SOLICITATION OF AN OFFER TO BUY THESE SECURITIES IN ANY JURISDICTION WHERE THE OFFER OR SALE IS NOT PERMITTED.
96
| Structural and Collateral Term Sheet | BBCMS 2021-C11 | |
| No. 6 – Morris Corporate Center | ||
The Borrower. The borrower is MCC Owner LLC, a special purpose, bankruptcy-remote Delaware limited liability company with one independent director. A non-consolidation opinion was provided in connection with the origination of the Morris Corporate Center Whole Loan.
The Borrower Sponsors. The borrower sponsors and guarantors are Harvey Rosenblatt (the “Key Principal”) and Asher Koenig. Harvey Rosenblatt is the founder and CEO of P3 Properties and Blue Property Management. Founded in 2015, P3 Properties is a privately held commercial real estate acquisition and management firm headquartered in Bloomfield, New Jersey. P3 Properties is involved in acquisitions, asset management, lease-ups, construction and day to day property management. In 2010, Asher Koeing founded Image Capital LLC, which provides real estate investment opportunities to its institutional clients.
Property Management. The Morris Corporate Center Property is managed by Blue Property Management LLC, Blue Leasing LLC and Blue Construction Management LLC, each an affiliate of the borrower sponsors.
Escrows and Reserves. At origination, the borrower was required to deposit into escrow approximately (i) $248,296 for real estate taxes, (ii) $59,972 for insurance premiums and (iii) $2,897,674 for rent concessions related to Teva.
Tax Escrows – On a monthly basis, the borrower is required to escrow 1/12th of the annual estimated real estate taxes, which currently equates to approximately $155,185.
Insurance Escrows – On a monthly basis, the borrower is required to escrow 1/12th of the annual estimated insurance premiums, which currently equates to approximately $9,087.
Replacement Reserve – On a monthly basis, the borrower is required to escrow approximately $6,765 for replacement reserves.
TI/LC Reserve – On a monthly basis, the borrower is required to escrow approximately $78,924 for tenant improvements and leasing commissions.
Material Tenant Rollover Reserve – On a monthly basis during a Material Tenant Trigger Event (as defined below), the borrower is required to escrow excess funds as detailed in the section below.
Lockbox / Cash Management. The Morris Corporate Center Whole Loan is structured with a hard lockbox and springing cash management upon the occurrence and continuance of a Cash Management Trigger Event (as defined below). The borrower was required to deliver written instructions to tenants directing them to deposit all rents payable under leases directly into a lender-controlled lockbox account. The Morris Corporate Center Whole Loan documents require that all rents received by the borrower or the property managers be deposited into the lockbox account within one business day of receipt. During the continuance of a Cash Management Trigger Event, all funds in the lockbox account are required to be swept each business day to a lender-controlled cash management account and disbursed in accordance with the Morris Corporate Center Whole Loan documents, and excess funds on deposit in the cash management account (after payments of required monthly reserve deposits, debt service payment on the Morris Corporate Center Whole Loan, operating expenses and cash management bank fees) will be applied as follows: (a) if a Material Tenant Trigger Event has occurred and is continuing, to a Material Tenant (as defined below) rollover reserve, (b) if a Cash Sweep Period (as defined below) has occurred and is continuing (but not a Material Tenant Trigger Event), to an excess cash flow account or (c) if no Material Tenant Trigger Event or Cash Sweep Period has occurred and is continuing, to the borrower.
If a Material Tenant Trigger Event is caused solely by (1) the long term unsecured debt rating of Teva or any Teva lease guarantor falling below “BB-” or the equivalent but not lower than “B+” or the equivalent by Moody’s, S&P or Fitch (the “Teva Initial Downgrade Material Tenant Trigger Event”) and remains the sole Material Tenant Trigger Event, then $134,594 is required to be deposited each month during the interest-only period and $96,763 each month thereafter into the sub-account relating to Teva and (2) the long term unsecured debt rating of Teva or any Teva lease guarantor falling below “B+” or the equivalent by Moody’s, S&P or Fitch (the “Teva Additional Downgrade Material Tenant Trigger Event”), then all excess funds are required to be deposited into the sub-account relating to Teva; provided that, so long as no other Material Tenant Trigger Event occurs, the aggregate amount deposited into such sub-account may not exceed $40.00 per square foot of Teva's rentable square footage (a "Teva Downgrade Cap"). If a Material Tenant Trigger Event is caused solely by the long term unsecured debt rating of WPP, plc or any guarantor of the Ogilvy lease not being at least “BBB-” or the equivalent by Moody’s, S&P and Fitch (the “Ogilvy Downgrade Material Tenant Trigger Event”), and no other Material Tenant Trigger Event occurs, all excess funds are required to be deposited into a sub-account for Ogilvy; provided that, so long as the Ogilvy Downgrade Material Tenant Trigger Event is and remains the sole Material Tenant Trigger Event relating to Ogilvy (or its lease or lease guarantor), the aggregate amount deposited into such sub-account (combined with the $1.75 per square foot per annum TI/LC reserve) may not exceed $40.00 per square foot of Ogilvy's rentable square footage (an "Ogilvy Downgrade Cap"). In the event that the lender approves the extension or the renewal of the Ogilvy lease in accordance with the terms of the Morris Corporate Center Whole Loan documents (an “Ogilvy Renewal”) except that the space demised under the renewal is less than all or substantially all but more than 70.0% of the Ogilvy space (as of the origination of the Morris Corporate Center Whole Loan), then, such event will constitute a Material Tenant Trigger Event and a Material Tenant Trigger Event period will exist until such time that the aggregate amount of funds deposited into the sub-account for Ogilvy is at least equal to $40.00 per rentable square foot of the Ogilvy space that was surrendered in connection with the Ogilvy Renewal. If more than one Material Tenant Trigger Event has occurred and is continuing, then excess funds are required to be applied
THE INFORMATION IN THIS STRUCTURAL AND COLLATERAL TERM SHEET IS NOT COMPLETE AND MAY BE AMENDED PRIOR TO THE TIME OF SALE. THIS TERM SHEET IS NOT AN OFFER TO SELL THESE SECURITIES AND IT IS NOT A SOLICITATION OF AN OFFER TO BUY THESE SECURITIES IN ANY JURISDICTION WHERE THE OFFER OR SALE IS NOT PERMITTED.
97
| Structural and Collateral Term Sheet | BBCMS 2021-C11 | |
| No. 6 – Morris Corporate Center | ||
without regard to the Teva Downgrade Cap, and if more than one Material Tenant Trigger Event related to Ogilvy exists, excess funds are required to be applied without regard to the Ogilvy Downgrade Cap and pro-rated according to the Morris Corporate Center Whole Loan documents.
In addition, rollover funds are required to be made available to pay for tenant allowances, tenant improvements or leasing commissions in connection with an extension or renewal of the Ogilvy lease that (i) occurs earlier than 12 months prior to the Ogilvy lease expiration date, (ii) provides for an initial extension or renewal term that expires no earlier than five years after the maturity date of the Morris Corporate Center Whole Loan and (iii) is approved by the lender (an “Ogilvy Qualifying Renewal”), provided that in no event will the lender be obligated to disburse rollover funds on account of tenant allowances, tenant improvements or leasing commissions in connection with an Ogilvy Qualifying Renewal in excess of $5.00 per square foot per annum of the space demised to Ogilvy under the Ogilvy lease after the Ogilvy Qualifying Renewal.
A “Cash Management Trigger Event” will commence upon the earliest to occur of (i) an event of default under the Morris Corporate Center Whole Loan documents, (ii) a bankruptcy action of the borrower, a guarantor, the Key Principal or a property manager, (iii) as of any date, the debt service coverage ratio being less than 1.35x, (iv) an indictment for fraud or misappropriation of funds by the borrower, a guarantor, the Key Principal or a property manager (provided, that in the case of a third party property manager, such indictment is related to the Morris Corporate Center Property), or (v) a Material Tenant Trigger Event. A Cash Management Trigger Event will end upon the occurrence of: with regard to clause (i) above, the end of such event of default; with regard to clause (ii) above, the filing being discharged, stayed or dismissed within 45 days for the borrower, the applicable guarantor or the Key Principal, or within 120 days for the property managers, and the lender’s determination that such filing does not materially affect the borrower’s, the guarantors’, the Key Principal’s or any property manager’s monetary obligations, or a property manager is replaced with a manager acceptable to the lender; with regard to clause (iii) above, the debt service coverage ratio being equal to or greater than 1.35x for two consecutive calendar quarters; with regard to clause (iv) above, the dismissal of the applicable indictment, the acquittal of each applicable person with respect to the related charge(s) or the replacement of an affiliated property manager with a qualified property manager under a replacement property management agreement; or with regard to clause (v) above, the cure of such Material Tenant Trigger Event.
A “Cash Sweep Period” will commence upon the earliest to occur of (i) an event of default under the Morris Corporate Center Whole Loan documents, (ii) a bankruptcy action of the borrower, a guarantor, the Key Principal or an affiliated property manager, or (iii) as of any date, the debt service coverage ratio being less than 1.25x. A Cash Sweep Period will end upon the occurrence of: with regard to clause (i) above, the end of such event of default; with regard to clause (ii) above, the filing being discharged, stayed or dismissed within 45 days for the borrower, the guarantors or the Key Principal, or within 120 days for an affiliated property manager, and the lender’s determination that such filing does not materially affect the borrower’s, the guarantors’, the Key Principal’s or an affiliated property manager’s monetary obligations, or an affiliated property manager is replaced with a manager acceptable to the lender; or with regard to clause (iii) above, the debt service coverage ratio being equal to or greater than 1.25x for two consecutive calendar quarters.
A “Material Tenant Trigger Event” will commence upon the earliest to occur of (i) a Material Tenant giving notice of its intention to terminate or not to extend or renew its lease, (ii) on or prior to the date that is (a) in the case of Teva, 24 months, (b) in the case of Ogilvy, 12 months and (c) in the case of any other Material Tenant, 12 months prior to the expiration date of a Material Tenant’s lease, the related Material Tenant failing to extend or renew its lease, (iii) on or prior to the date on which a Material Tenant is required under its lease to provide notification of its election to renew its lease, such Material Tenant failing to give such notice, (iv) an event of default under a Material Tenant lease that continues beyond any applicable notice and cure period, (v) any Material Tenant or any guarantor of the applicable Material Tenant lease becoming insolvent or a debtor in any bankruptcy action, (vi) a Material Tenant lease being terminated, (in whole or in part, including in connection with the exercise of any contraction option, except in the event that Teva exercises its Surrender Space option), (vii) any Material Tenant “going dark”, vacating or ceasing to occupy or conduct business at its space or a portion thereof, provided that (a) all or substantially all of the affected space has been sublet by a subtenant pursuant to a sublease (1) with a remaining term of no less than the term of the applicable Material Tenant lease, (2) scheduled to generate annual rents that are not less than 95% of the greater of (x) the scheduled monthly rents (excluding any free rent, rent abatement or other rent concessions, if applicable) that were payable under the applicable Material Tenant’s lease during the 12 months preceding the occurrence of the sublet and (y) an amount equal to 12 times the scheduled monthly rent (excluding any free rent, rent abatement or other rent concessions, if applicable) that was payable under such Material Tenant lease during the month immediately preceding the occurrence of the sublet, (3) containing terms and provisions reasonably acceptable to the lender creating a direct lease between the subtenant and the borrower in the event the applicable Material Tenant lease were to terminate, (4) with a creditworthy subtenant and (5) otherwise on commercially reasonable terms (including, without limitation, acceptable subordination provisions) and (b) with respect to which subtenant (and such sublease or, if applicable, any sublease guarantor), none of the events or circumstances that would constitute a Material Tenant Trigger Event have occurred if such subtenant were a Material Tenant) or (viii) if (x) a Teva Initial Downgrade Material Tenant Trigger Event, Teva Additional Downgrade Material Tenant Trigger Event or Ogilvy Downgrade Material Tenant Trigger Event occurs, or (y) the long term unsecured debt rating of any other Material Tenant or any other lease guarantor of such Material Tenant lease is not at least “BBB-” by S&P, “Baa3” by Moody’s and “BBB-” by Fitch (or their equivalents by the other nationally recognized statistical rating agencies) in each case, to the extent that the long term unsecured debt obligations of the applicable entity are rated by such nationally recognized statistical rating agency. A Material Tenant Trigger Event will end upon the occurrence of: with regard to clause (i) above, (a) the revocation or rescission by the applicable Material Tenant of all termination or cancellation notices with respect to such Material Tenant lease, (b) an acceptable Material Tenant lease extension with respect to the applicable Material Tenant space, or (c) all of the applicable
THE INFORMATION IN THIS STRUCTURAL AND COLLATERAL TERM SHEET IS NOT COMPLETE AND MAY BE AMENDED PRIOR TO THE TIME OF SALE. THIS TERM SHEET IS NOT AN OFFER TO SELL THESE SECURITIES AND IT IS NOT A SOLICITATION OF AN OFFER TO BUY THESE SECURITIES IN ANY JURISDICTION WHERE THE OFFER OR SALE IS NOT PERMITTED.
98
| Structural and Collateral Term Sheet | BBCMS 2021-C11 | |
| No. 6 – Morris Corporate Center | ||
Material Tenant space being leased to a replacement tenant; with regard to clauses (ii) and (iii) above, (x) an acceptable Material Tenant lease extension with respect to such Material Tenant space or (y) all of the applicable Material Tenant space being leased to a replacement tenant; with regard to clause (iv) above, a cure of the applicable event of default under the applicable Material Tenant lease; with regard to clause (v) above, an affirmation of the Material Tenant lease in the applicable bankruptcy proceeding and confirmation that the Material Tenant is actually paying all rents and other amounts due under its lease; with regard to clause (vi) above, all of the applicable Material Tenant space being leased to a replacement tenant; with regard to clause (vii) above, the applicable Material Tenant having re-commenced its operations and no longer being dark, and having not vacated or ceased to conduct business; or with regard to clause (viii) above, the long term unsecured debt rating of the applicable Material Tenant or the applicable lease guarantor is subsequently raised or otherwise modified such that, with respect to Teva, it is at least “BB-” or the equivalent by Moody’s, S&P and Fitch, with respect to WPP, plc or any guarantor of the Ogilvy lease, it is at least “BBB-” or the equivalent by Moody’s, S&P and Fitch or, with respect to any other Material Tenant or any other lease guarantor of such Material Tenant lease, it is at least “BBB-” or the equivalent by a nationally recognized statistical rating agency if such entity is rated.
A “Material Tenant” means (i) Teva, (ii) Ogilvy or (iii) any other tenant whose lease, either individually or when taken together with any other lease with the same tenant or affiliate tenant, (x) covers no less than 20% of the total rentable square footage of the Morris Corporate Center Property or (y) requires the payment of base rent that is no less than 20% of the total in-place base rent at the Morris Corporate Center Property.
Subordinate and Mezzanine Debt. None.
Partial Release. Not permitted.
Ground Lease. None.
THE INFORMATION IN THIS STRUCTURAL AND COLLATERAL TERM SHEET IS NOT COMPLETE AND MAY BE AMENDED PRIOR TO THE TIME OF SALE. THIS TERM SHEET IS NOT AN OFFER TO SELL THESE SECURITIES AND IT IS NOT A SOLICITATION OF AN OFFER TO BUY THESE SECURITIES IN ANY JURISDICTION WHERE THE OFFER OR SALE IS NOT PERMITTED.
99
| Structural and Collateral Term Sheet | BBCMS 2021-C11 | |
| No. 7 – 15-17 Park Avenue | ||

THE INFORMATION IN THIS STRUCTURAL AND COLLATERAL TERM SHEET IS NOT COMPLETE AND MAY BE AMENDED PRIOR TO THE TIME OF SALE. THIS TERM SHEET IS NOT AN OFFER TO SELL THESE SECURITIES AND IT IS NOT A SOLICITATION OF AN OFFER TO BUY THESE SECURITIES IN ANY JURISDICTION WHERE THE OFFER OR SALE IS NOT PERMITTED.
100
| Structural and Collateral Term Sheet | BBCMS 2021-C11 | |
| No. 7 – 15-17 Park Avenue | ||

THE INFORMATION IN THIS STRUCTURAL AND COLLATERAL TERM SHEET IS NOT COMPLETE AND MAY BE AMENDED PRIOR TO THE TIME OF SALE. THIS TERM SHEET IS NOT AN OFFER TO SELL THESE SECURITIES AND IT IS NOT A SOLICITATION OF AN OFFER TO BUY THESE SECURITIES IN ANY JURISDICTION WHERE THE OFFER OR SALE IS NOT PERMITTED.
101
| Structural and Collateral Term Sheet | BBCMS 2021-C11 | |
| No. 7 – 15-17 Park Avenue | ||
| Mortgage Loan Information | Property Information | |||
| Mortgage Loan Seller: | SGFC | Single Asset / Portfolio: | Single Asset | |
| Original Principal Balance: | $31,000,000 | Title: | Fee | |
| Cut-off Date Principal Balance: | $31,000,000 | Property Type - Subtype: | Multifamily – High Rise | |
| % of Pool by IPB: | 3.1% | Net Rentable Area (Units)(2): | 97 | |
| Loan Purpose: | Refinance | Location: | New York, NY | |
| Borrower: | 15-17 Park Avenue Delaware LLC | Year Built / Renovated: | 1924 / NAP | |
| Borrower Sponsor: | Scott Goldstein | Occupancy: | 100.0% | |
| Interest Rate: | 3.34000% | Occupancy Date: | 7/20/2021 | |
| Note Date: | 8/16/2021 | 4th Most Recent NOI (As of): | $2,103,918 (12/31/2018) | |
| Maturity Date: | 9/1/2031 | 3rd Most Recent NOI (As of): | $2,092,489 (12/31/2019) | |
| Interest-only Period: | 120 months | 2nd Most Recent NOI (As of): | $1,707,774 (12/31/2020) | |
| Original Term: | 120 months | Most Recent NOI (As of)(3): | $1,715,668 (TTM 6/30/2021) | |
| Original Amortization: | None | UW Economic Occupancy: | 97.0% | |
| Amortization Type: | Interest Only | UW Revenues: | $4,803,894 | |
| Call Protection: | L(24),D(89),O(7) | UW Expenses: | $2,638,090 | |
| Lockbox / Cash Management: | Springing | UW NOI(3): | $2,165,804 | |
| Additional Debt: | No | UW NCF: | $2,141,054 | |
| Additional Debt Balance: | N/A | Appraised Value / Per Unit: | $50,100,000 / $516,495 | |
| Additional Debt Type: | N/A | Appraisal Date: | 7/8/2021 | |
| Escrows and Reserves(1) | Financial Information | |||||
| Initial | Monthly | Initial Cap | Cut-off Date Loan / Unit: | $319,588 | ||
| Taxes: | $332,588 | $110,863 | N/A | Maturity Date Loan / Unit: | $319,588 | |
| Insurance: | $0 | Springing | N/A | Cut-off Date LTV: | 61.9% | |
| Replacement Reserves: | $0 | $2,021 | $75,000 | Maturity Date LTV: | 61.9% | |
| Deferred Maintenance: | $26,400 | $0 | N/A | UW NCF DSCR: | 2.04x | |
| UW NOI Debt Yield: | 7.0% | |||||
| Sources and Uses | ||||||
| Sources | Proceeds | % of Total | Uses | Proceeds | % of Total | |
| Mortgage Loan | $31,000,000 | 100.0% | Loan Payoff(4) | $29,624,386 | 95.6% | |
| Return of Equity | 560,959 | 1.8 | ||||
| Closing Costs | 455,666 | 1.5 | ||||
| Upfront Reserves | 358,988 | 1.2 | ||||
| Total Sources | $31,000,000 | 100.0% | Total Uses | $31,000,000 | 100.0% | |
| (1) | For a full description of Escrows and Reserves, please refer to “Escrows and Reserves” below. |
| (2) | The 15-17 Park Avenue Property (as defined below) is a 97-unit multifamily property with two commercial units. The two commercial units are excluded from the unit count above. |
| (3) | The increase in Most Recent NOI to UW NOI is primarily attributed to one-time credits for new leases that were given throughout 2020. |
| (4) | The borrower received a credit totaling approximately $423,830 from the prior lender for the net escrow balance. |
The Loan. The 15-17 Park Avenue mortgage loan is secured by the borrower’s fee interest in a 97-unit multifamily property with two commercial units located in New York, New York (the “15-17 Park Avenue Property”). The 15-17 Park Avenue mortgage loan was originated by SGFC and has an outstanding principal balance as of the Cut-off Date of $31.0 million (the “15-17 Park Avenue Mortgage Loan”). The 15-17 Park Avenue Mortgage Loan has a 10-year term and is interest-only for the entire term.
The Property. The 15-17 Park Avenue Property is a high rise multifamily property located within the Murray Hill neighborhood of New York. The 15-17 Park Avenue Property was built in 1924 and consists of 85 market rate units, 11 rent stabilized units, a superintendent unit and 2,810 square feet of commercial space occupied by two medical tenants. Unit amenities include stone countertops, stainless steel appliances for some of the units and hardwood flooring. The 15-17 Park Avenue Property has a 24-hour doorman and features a laundry room. Since 2019, the borrower sponsor has invested approximately $2.1 million for capital expenditure items, including updates to the elevators, updates to the common area and unit renovations. As of the July 20, 2021 underwritten rent roll, the 15-17 Park Avenue Property was 100% occupied.
THE INFORMATION IN THIS STRUCTURAL AND COLLATERAL TERM SHEET IS NOT COMPLETE AND MAY BE AMENDED PRIOR TO THE TIME OF SALE. THIS TERM SHEET IS NOT AN OFFER TO SELL THESE SECURITIES AND IT IS NOT A SOLICITATION OF AN OFFER TO BUY THESE SECURITIES IN ANY JURISDICTION WHERE THE OFFER OR SALE IS NOT PERMITTED.
102
| Structural and Collateral Term Sheet | BBCMS 2021-C11 | |
| No. 7 – 15-17 Park Avenue | ||
COVID-19 Update. Tenants representing 98.6% of the underwritten annual residential base rent made their July 2021 rental payments. As of the date of this term sheet, the 15-17 Park Avenue Mortgage Loan is not subject to any modification or forbearance requests.
| Historical and Current Occupancy | |||
| 2018(1) | 2019(1) | 2020(1) | Current(2)(3) |
| 92.1% | 91.6% | 87.0% | 100.0% |
| (1) | Historical Occupancies are as of December 31 of each respective year. |
| (2) | Current Occupancy is as of July 20, 2021. |
| (3) | From April 2021 to July 2021, the 15-17 Park Avenue Property averaged an approximately 95.8% occupancy and achieved a 100.0% occupancy for both the residential and commercial units as of the July 20, 2021 underwritten rent roll. |
The following table presents detailed information with respect to the unit mix of the 15-17 Park Avenue Property:
| Multifamily Unit Mix(1) | ||||||
| Unit Type | # of Units(2) | % of Units | Occupied Units | Occupancy | Average Unit Size (SF) | Avg. Monthly Rent Per Unit |
| Studio - Market | 5 | 5.2% | 5 | 100.0% | 349 | $2,700 |
| One Bedroom - Market | 31 | 32.0 | 31 | 100.0% | 524 | $3,561 |
| One Bedroom - Stabilized | 3 | 3.1 | 3 | 100.0% | 524 | $1,647 |
| Two Bedroom - Market(3) | 38 | 39.2 | 38 | 100.0% | 698 | $4,572 |
| Two Bedroom - Stabilized | 8 | 8.2 | 8 | 100.0% | 698 | $1,631 |
| Three Bedroom - Market | 11 | 11.3 | 11 | 100.0% | 873 | $6,167 |
| Four Bedroom - Market | 1 | 1.0 | 1 | 100.0% | 1,047 | $6,300 |
| Collateral Total/Wtd. Avg. | 97 | 100.0% | 97 | 100.0% | 642 | $4,018 |
| (1) | Based on the underwritten rent roll dated July 20, 2021. |
| (2) | The 15-17 Park Avenue Property includes two commercial units, which are excluded from the Multifamily Unit Mix. |
| (3) | The superintendent’s unit is included in the Two Bedroom - Market statistics. |
Environmental. According to the Phase I environmental assessment dated July 20, 2021, there is no evidence of any recognized or controlled recognized environmental conditions at the 15-17 Park Avenue Property. A historical recognized environmental condition relating to past uses of the 15-17 Park Avenue Property was noted in the Phase I environmental assessment.
The Market. The 15-17 Park Avenue Property is located within the Murray Hill neighborhood on the east side of Manhattan, New York. The Murray Hill neighborhood is primarily residential with supporting retail uses and office buildings on the northern end of the neighborhood as the area approaches Midtown East. Murray Hill is known for its dense residential population, with many large rental, cooperative and condominium buildings along the avenues with small to medium-sized residential buildings on the side streets. Retail uses mostly include local retailers such as restaurants, local clothing boutiques, and convenience stores. Fairway Market is a retail attraction in the neighborhood located along Second Avenue. Other retail uses are located along Third Avenue and East 34th Street. The 15-17 Park Avenue Property is located within a few blocks of many of the New York’s tourist attractions including: the Empire State Building and Bryant Park. The Murray Hill neighborhood has experienced growth patterns in the way of multifamily properties, with some of the ongoing developments including: Madison Houses, a 62-story residential tower that features an indoor pool, spa and fitness center; and 360-368 3rd Avenue, a 35-story mixed-use residential tower that features a fitness room, residential lounge and children’s playroom and has estimated completion date in October 2021.
The 15-17 Park Avenue Property benefits from its proximity to the Grand Central Terminal and Pennsylvania Station (“Penn Station”). Grand Central Terminal is situated at Park Avenue and 42nd Street and Penn Station is situated at Seventh Avenue and West 32nd Street. Grand Central Terminal serves Westchester and Putnam counties in New York as well as the southeasterly coastline of Connecticut. Penn Station serves New Jersey and Long Island and is a major stop on Amtrak’s northeast corridor between Boston and Washington. The 4, 5 and 6 trains all stop at Grand Central Terminal, with additional service provided by the S train, which provides a shuttle between Port Authority and Grand Central Terminal, and the number 7 train which connects between Port Authority and Queens.
According to the appraisal, the 15-17 Park Avenue Property is located within the New York Metro apartment market. As of the first quarter of 2021, the New York Metro apartment market contained approximately 1.9 million residential units with a vacancy rate of 4.7%, representing a 0.7% decrease over the previous quarter. As of the first quarter of 2021, the New York Metro apartment market reported an effective rent of $3,116 per unit. As of the first quarter of 2021, there were 1,347 units completed and a negative net absorption of 12,599 units within the New York Metro apartment market. According to the appraisal, the 15-17 Park Avenue Property is located within the Midtown East submarket. As of the first quarter of 2021, the Midtown East apartment submarket contained 62,447 units with a vacancy
THE INFORMATION IN THIS STRUCTURAL AND COLLATERAL TERM SHEET IS NOT COMPLETE AND MAY BE AMENDED PRIOR TO THE TIME OF SALE. THIS TERM SHEET IS NOT AN OFFER TO SELL THESE SECURITIES AND IT IS NOT A SOLICITATION OF AN OFFER TO BUY THESE SECURITIES IN ANY JURISDICTION WHERE THE OFFER OR SALE IS NOT PERMITTED.
103
| Structural and Collateral Term Sheet | BBCMS 2021-C11 | |
| No. 7 – 15-17 Park Avenue | ||
rate of 6.6%, representing a decrease of 0.4% over the previous quarter. As of the first of quarter 2021, the Midtown East apartment submarket reported an effective rent of $3,802 per unit. As of the first quarter of 2021, there were no completions and negative net absorption of 262 units within the Midtown East apartment submarket.
The following table presents submarket statistics for the 15-17 Park Avenue Property:
| Submarket Statistics(1) | ||||
| Time | Asking Rent Per Unit | Occupancy | Inventory | Net Absorption |
| 2017 | $4,520 | 97.2% | 61,610 | 1,512 |
| 2018 | $4,670 | 97.9% | 61,610 | 468 |
| 2019 | $4,824 | 98.1% | 62,447 | 922 |
| 2020 | $3,989 | 93.8% | 62,447 | (2,682) |
| 1st Qtr. 2021 | $3,802 | 93.4% | 62,447 | (262) |
| (1) | Source: Appraisal. |
Comparable properties to the 15-17 Park Avenue Property are shown in the table below:
| Comparable Rental Properties(1) | |||||||
| Property Name/Location | Year Built/Renov. | Occupancy | Distance to Subject | Number of Units | Unit Type | Avg. Unit Size (SF) | Avg. Monthly Rent per Unit |
15-17 Park Avenue New York, NY(2) | 1924/NAP | 100.0% | - | 97(3) | Studio One Bedroom (Market) One Bedroom (Stabilized) Two Bedroom (Market)(4) Two Bedroom (Stabilized) Three Bedroom (Market) Four Bedroom (Market) | 349 524 524 698 698 873 1,047 | $2,700 $3,561 $1,647 $4,572 $1,631 $6,167 $6,300 |
20 Park Avenue New York, NY | 1939/NAP | 98.4% | 0.2 | 123 | Studio One Bedroom Two Bedroom Three Bedroom | 591 926 1,263 1,544 | $3,202 $4,823 $6,416 $12,643 |
39 Park Avenue New York, NY | 1950/NAP | 99.5% | 0.2 | 107 | Studio One Bedroom Two Bedroom | 505 906 1,322 | $3,148 $4,420 $6,227 |
36 East 36th Street New York, NY | 1949/NAP | 98.3% | 0.2 | 108 | Studio One Bedroom Two Bedroom Three Bedroom | 535 657 1,010 1,600 | $2,895 $3,129 $4,758 $9,588 |
106 East 38th Street New York, NY | 1930/NAP | 93.9% | 0.2 | 143 | Studio One Bedroom Two Bedroom | 328 606 998 | $1,925 $3,781 $4,844 |
151 Lexington Avenue New York, NY | 1910/NAP | 89.2% | 0.5 | 53 | Studio One Bedroom Two Bedroom | 439 496 600 | $2,273 $2,996 $3,275 |
150 East 39th Street New York, NY | 1928/NAP | 93.8% | 0.4 | 140 | Studio One Bedroom Two Bedroom Three Bedroom | 427 592 1,000 1,012 | $2,234 $3,347 $4,253 $4,530 |
| (1) | Source: Appraisal. |
| (2) | The 15-17 Park Avenue Occupancy, Unit Type, Avg. Unit Size and Avg. Monthly Rent Per Unit are based on the underwritten rent roll dated July 20, 2021. |
| (3) | The 15-17 Park Avenue Property includes two commercial units that are excluded from the Number of Units. |
| (4) | The superintendent’s unit is included in the Two Bedroom (Market) statistics. |
THE INFORMATION IN THIS STRUCTURAL AND COLLATERAL TERM SHEET IS NOT COMPLETE AND MAY BE AMENDED PRIOR TO THE TIME OF SALE. THIS TERM SHEET IS NOT AN OFFER TO SELL THESE SECURITIES AND IT IS NOT A SOLICITATION OF AN OFFER TO BUY THESE SECURITIES IN ANY JURISDICTION WHERE THE OFFER OR SALE IS NOT PERMITTED.
104
| Structural and Collateral Term Sheet | BBCMS 2021-C11 | |
| No. 7 – 15-17 Park Avenue | ||
The following table presents certain information relating to comparable sales for the 15-17 Park Avenue Property:
| Comparable Sales(1) | ||||||
| Property Location | Sale Date | No. of Units | Total Occupancy | Sale Price | Sale Price Per Unit | Adjusted Sales Price Per Unit |
15-17 Park Avenue New York, NY | NAP | 97(2) | 100.0%(2) | NAP | NAP | NAP |
400 East 58th Street New York, NY | Sept-2020 | 132 | NAV | $62,000,000 | $470,403 | $517,443 |
StoneHenge 51 New York, NY | Feb-2020 | 114 | NAV | $66,248,000 | $581,123 | $524,463 |
Upper West Side Portfolio New York, NY | May-2020 | 80 | NAV | $37,000,000 | $462,500 | $485,625 |
Eagle Court New York, NY | Jun-2021 | 128 | NAV | $71,000,000 | $554,688 | $526,953 |
| (1) | Source: Appraisal. | |
| (2) | Based on the underwritten rent roll dated July 20, 2021. |
| Operating History and Underwritten Net Cash Flow | |||||||
| 2018 | 2019 | 2020 | TTM(1) | Underwritten | Per Unit | %(2) | |
| Rents in Place | $4,832,541 | $4,901,293 | $4,815,186 | $4,879,645 | $4,676,916 | $47,242 | 94.4% |
| Laundry Income | 21,821 | 20,757 | 24,779 | 22,432 | 24,000 | 242 | 0.5 |
| Other Income 1(3) | 221,107 | 209,097 | 222,007 | 252,561 | 217,494 | 2,197 | 4.4 |
| Other Income 2(4) | 12,333 | 6,117 | 4,058 | 34,058 | 34,058 | 344 | 0.7 |
| Gross Potential Rent | $5,087,802 | $5,137,264 | $5,066,030 | $5,188,696 | $4,952,468 | $50,025 | 100.0% |
| Total Reimbursements | 0 | 0 | 0 | 0 | 0 | 0 | 0.0 |
| Net Rental Income | $5,087,802 | $5,137,264 | $5,066,030 | $5,188,696 | $4,952,468 | $50,025 | 100.0% |
| (Vacancy/Credit Loss)(5) | (383,035) | (409,089) | (642,925) | (664,393) | (148,574) | (1,501) | (3.0) |
| (Concessions) | 0 | 0 | 0 | (95,425) | 0 | 0 | 0.0 |
| Effective Gross Income | $4,704,767 | $4,728,175 | $4,423,105 | $4,428,878 | $4,803,894 | $48,524 | 97.0% |
| Total Expenses | $2,600,849 | $2,635,686 | $2,715,331 | $2,713,210 | $2,638,090 | $26,647 | 54.9% |
| Net Operating Income(6) | $2,103,918 | $2,092,489 | $1,707,774 | $1,715,668 | $2,165,804 | $21,877 | 45.1% |
| Total TI/LC, Capex/RR | 0 | 0 | 0 | 0 | 24,750 | 250 | 0.5 |
| Net Cash Flow | $2,103,918 | $2,092,489 | $1,707,774 | $1,715,668 | $2,141,054 | $21,627 | 44.6% |
| (1) | TTM column represents the trailing 12 months ending June 2021. |
| (2) | % column represents percent of Net Rental Income for all revenue lines and represents percent of Effective Gross Income for the remainder of fields. |
| (3) | Other Income 1 represents rent related to the two commercial tenants totaling $201,936 and commercial utility reimbursements totaling $9,500. Other Income 1 also includes rent steps of $6,058 for the two commercial tenants through July 2022. |
| (4) | Other Income 2 represents damage reimbursements, late fee income, pet fees, termination fees, cable income, air conditioning fees and miscellaneous income. |
| (5) | Underwritten Vacancy/Credit Loss represents the economic vacancy of 3.0%. |
| (6) | The increase in Underwritten Net Operating Income from TTM Net Operating Income is primarily attributed to one-time credits for new leases that were given throughout 2020. |
The Borrower. The borrower is 15-17 Park Avenue Delaware LLC, a single purpose, Delaware limited liability company with one independent director in its organizational structure. Legal counsel to the borrower delivered a non-consolidation opinion in connection with the origination of the 15-17 Park Avenue Mortgage Loan.
The Borrower Sponsor. The borrower sponsor and nonrecourse carve-out guarantor of the 15-17 Park Avenue Mortgage Loan is Scott Goldstein. Mr. Goldstein has over 25 years of experience in real estate, and his expertise includes property management, real estate development and repositioning of assets. Mr. Goldstein’s family founded Samson Management LLC (“Samson”) in 1964, which has been located in Rego Park, Queens for almost 50 years. Samson owns and manages over 5,000 residential apartment units in all five boroughs of New York City, Westchester county, Nassau county and West Palm Beach, Florida as well as over 1.5 million square feet of office and retail properties in New York City, Northern New Jersey, Westchester county, Long Island, Florida and Pennsylvania.
Property Management. The 15-17 Park Avenue Property is managed by Samson, an affiliate of the borrower sponsor.
Escrows and Reserves. At origination, the borrower deposited in escrow $332,588 for real estate taxes and $26,400 for deferred maintenance.
Tax Escrows – On a monthly basis, the borrower is required to escrow 1/12th of the annual estimated tax payments (currently $110,863).
THE INFORMATION IN THIS STRUCTURAL AND COLLATERAL TERM SHEET IS NOT COMPLETE AND MAY BE AMENDED PRIOR TO THE TIME OF SALE. THIS TERM SHEET IS NOT AN OFFER TO SELL THESE SECURITIES AND IT IS NOT A SOLICITATION OF AN OFFER TO BUY THESE SECURITIES IN ANY JURISDICTION WHERE THE OFFER OR SALE IS NOT PERMITTED.
105
| Structural and Collateral Term Sheet | BBCMS 2021-C11 | |
| No. 7 – 15-17 Park Avenue | ||
Insurance Escrows – The requirement for the borrower to make deposits to the insurance escrow is waived so long as (i) no event of default has occurred and is continuing; (ii) the 15-17 Park Avenue Property is insured under a blanket insurance policy in accordance with the 15-17 Park Avenue Mortgage Loan documents; and (iii) the borrower provides the lender with written evidence satisfactory to the lender of the payment of the applicable insurance premiums at least ten days prior to the expiration of any acceptable blanket policy.
Replacement Reserves – On a monthly basis, the borrower is required to escrow $2,021 for replacement reserves, subject to a cap of $75,000. Additionally, upon 30 days’ prior notice to the borrower, in the event the debt service coverage ratio ever falls below 1.40x, the lender may reassess the amount of the monthly payment required into the replacement reserve subaccount from time to time in its reasonable discretion.
Lockbox / Cash Management. The 15-17 Park Avenue Mortgage Loan documents require a springing lockbox with springing cash management. Upon the occurrence of a Cash Management Period (as defined below) the borrower will be required to (i) deposit all rents received from non-residential tenants at the 15-17 Park Avenue Property into the lender-controlled lockbox account and (ii) deposit all rents received from residential tenants at the 15-17 Park Avenue Property into a lender-controlled lockbox account within three business days of receipt. The borrower will be required to (i) deliver a tenant direction notice to each tenant occupying commercial space at the 15-17 Park Avenue Property within ten days following the occurrence of a Cash Management Period; (ii) from and after the first occurrence of a Cash Management Period, to deliver a new tenant direction notice upon the execution of any new commercial lease and (iii) continue to send any new tenant direction letters until the addressee complies with the terms, provided, however, the borrower will only be required to send to any non-complying tenant three new tenant direction notices in any calendar year during the term of the 15-17 Park Avenue Mortgage Loan unless an event of default has occurred and is continuing, in which case the borrower is required to continue to send the new tenant direction notices until each addressee complies with the terms of the notice. As long as no Cash Management Period is in effect, funds deposited into the lockbox account are required to be transferred to the borrower’s operating account on a daily basis. Upon the occurrence of a Cash Management Period, all sums on deposit in the lockbox account are required to be transferred on a daily basis to a cash management account controlled by the lender and applied and disbursed in accordance with the 15-17 Park Avenue Mortgage Loan documents. Available cash on deposit will be applied as follows: (a) if a Cash Management Period is not in effect, to the borrower, or (b) to the extent that a Cash Management Period is in effect, to the cash collateral subaccount.
A “Cash Management Period” will commence upon: (i) the stated maturity date of September 1, 2031; (ii) the occurrence of an event of default; (iii) a debt service coverage ratio less than 1.35x for two consecutive calculation dates; or (iv) if from and after the payment date occurring in September 2030, the debt yield is less than 6.50%; and will end upon, as applicable, (a) with respect to clause (i) above, (1) the 15-17 Park Avenue Mortgage Loan and all other obligations under the 15-17 Park Avenue Mortgage Loan documents have been repaid in full or (2) the stated maturity date has not occurred (b) with respect to clause (ii) once the event of default has been cured and no other event of default has occurred and is continuing, and (c) with respect to clause (iii) above, the debt service coverage ratio is at least equal to 1.40x for two consecutive quarters. A Cash Management Period that commences pursuant to clause (iv) above will only end upon the 15-17 Park Avenue Mortgage Loan and all other obligation under the 15-17 Park Avenue Mortgage Loan documents having been repaid in full.
Subordinate and Mezzanine Debt. None.
Partial Release. Not permitted.
Ground Lease. None.
THE INFORMATION IN THIS STRUCTURAL AND COLLATERAL TERM SHEET IS NOT COMPLETE AND MAY BE AMENDED PRIOR TO THE TIME OF SALE. THIS TERM SHEET IS NOT AN OFFER TO SELL THESE SECURITIES AND IT IS NOT A SOLICITATION OF AN OFFER TO BUY THESE SECURITIES IN ANY JURISDICTION WHERE THE OFFER OR SALE IS NOT PERMITTED.
106
(THIS PAGE INTENTIONALLY LEFT BLANK)
THE INFORMATION IN THIS STRUCTURAL AND COLLATERAL TERM SHEET IS NOT COMPLETE AND MAY BE AMENDED PRIOR TO THE TIME OF SALE. THIS TERM SHEET IS NOT AN OFFER TO SELL THESE SECURITIES AND IT IS NOT A SOLICITATION OF AN OFFER TO BUY THESE SECURITIES IN ANY JURISDICTION WHERE THE OFFER OR SALE IS NOT PERMITTED.
107
| Structural and Collateral Term Sheet | BBCMS 2021-C11 | |
| No. 8 – Gainey Ranch Corporate Center II | ||

THE INFORMATION IN THIS STRUCTURAL AND COLLATERAL TERM SHEET IS NOT COMPLETE AND MAY BE AMENDED PRIOR TO THE TIME OF SALE. THIS TERM SHEET IS NOT AN OFFER TO SELL THESE SECURITIES AND IT IS NOT A SOLICITATION OF AN OFFER TO BUY THESE SECURITIES IN ANY JURISDICTION WHERE THE OFFER OR SALE IS NOT PERMITTED.
108
| Structural and Collateral Term Sheet | BBCMS 2021-C11 | |
| No. 8 – Gainey Ranch Corporate Center II | ||

THE INFORMATION IN THIS STRUCTURAL AND COLLATERAL TERM SHEET IS NOT COMPLETE AND MAY BE AMENDED PRIOR TO THE TIME OF SALE. THIS TERM SHEET IS NOT AN OFFER TO SELL THESE SECURITIES AND IT IS NOT A SOLICITATION OF AN OFFER TO BUY THESE SECURITIES IN ANY JURISDICTION WHERE THE OFFER OR SALE IS NOT PERMITTED.
109
| Structural and Collateral Term Sheet | BBCMS 2021-C11 | |
| No. 8 – Gainey Ranch Corporate Center II | ||
| Mortgage Loan Information | Property Information | |||
| Mortgage Loan Seller: | BSPRT | Single Asset / Portfolio: | Single Asset | |
| Original Principal Balance: | $29,175,000 | Title: | Fee | |
| Cut-off Date Principal Balance: | $29,175,000 | Property Type - Subtype: | Office – Suburban | |
| % of IPB: | 3.0% | Net Rentable Area (SF): | 203,642 | |
| Loan Purpose: | Acquisition | Location: | Scottsdale, AZ | |
| Borrower: | Dansons Gainey, LLC | Year Built / Renovated: | 1991 / NAP | |
| Borrower Sponsors: | Jeffrey Thiessen and Jordan Thiessen | Occupancy: | 100.0% | |
| Interest Rate: | 3.20000% | Occupancy Date: | 8/6/2021 | |
| Note Date: | 8/6/2021 | 4th Most Recent NOI (As of)(2): | NAV | |
| Maturity Date: | 8/6/2031 | 3rd Most Recent NOI (As of)(2): | NAV | |
| Interest-only Period: | 120 months | 2nd Most Recent NOI (As of)(2): | NAV | |
| Original Term: | 120 months | Most Recent NOI (As of)(2): | NAV | |
| Original Amortization Term: | None | UW Economic Occupancy: | 95.0% | |
| Amortization Type: | Interest Only | UW Revenues: | $5,452,743 | |
| Call Protection: | L(25),D(91),O(4) | UW Expenses: | $1,666,890 | |
| Lockbox / Cash Management: | Hard / In Place | UW NOI: | $3,785,854 | |
| Additional Debt: | No | UW NCF: | $3,480,391 | |
| Additional Debt Balance: | N/A | Appraised Value / Per SF(3): | $62,000,000 / $304 | |
| Additional Debt Type: | N/A | Appraisal Date: | 6/22/2021 | |
| Escrows and Reserves(1) | Financial Information | |||||
| Initial | Monthly | Initial Cap | Cut-off Date Loan / SF: | $143 | ||
| Taxes: | $238,776 | $47,755 | N/A | Maturity Date Loan / SF: | $143 | |
| Insurance: | $126,903 | $21,151 | N/A | Cut-off Date LTV: | 47.1% | |
| Replacement Reserves: | $700,000 | $21,213 | N/A | Maturity Date LTV: | 47.1% | |
| TI/LC: | $0 | $16,970 | $610,926 | UW NCF DSCR: | 3.68x | |
| Deferred Maintenance: | $57,600 | $0 | N/A | UW NOI Debt Yield: | 13.0% | |
| Sources and Uses | ||||||
| Sources | Proceeds | % of Total | Uses | Proceeds | % of Total | |
| Mortgage Loan | $29,175,000 | 72.0% | Purchase Price(3) | $39,000,000 | 96.3% | |
| Borrower Sponsor Equity | 11,342,818 | 28.0 | Upfront Reserves | 1,123,279 | 2.8 | |
| Closing Costs | 394,539 | 0.9 | ||||
| Total Sources | $40,517,818 | 100.0% | Total Uses | $40,517,818 | 100.0% | |
| (1) | For a full description of Escrows and Reserves, see “Escrows and Reserves” below. |
| (2) | Historical financial information is not available because the borrower sponsors acquired the Gainey Ranch Corporate Ranch II Property in May 2021 and the prior owner did not provide such information. |
| (3) | The Gainey Ranch Corporate Ranch II Property was purchased vacant by the borrower sponsors at a contract price of $39,000,000 from Nationwide Mutual Insurance Company on May 3, 2021. The Appraised value of $62,000,000 assumes Dansons’ signed 15-year lease. The appraiser also concluded to a “Hypothetical- Go Dark” value of $40,000,000 as of June 22, 2021. The Cut-off Date LTV and Maturity Date LTV based on the $40,000,000 “Hypothetical- Go Dark” appraised value are 72.9% and 72.9%, respectively. |
The Loan. The Gainey Ranch Corporate Center II mortgage loan has an outstanding principal balance as of the Cut-off Date of $29,175,000 (the “Gainey Ranch Corporate Center II Mortgage Loan”) and is secured by a first mortgage lien on the borrower’s fee interest in a 203,642 square foot, office property located in Scottsdale, Arizona (the “Gainey Ranch Corporate Center II Property”). The Gainey Ranch Corporate Center II Mortgage Loan has a 10-year term and is interest-only for the entire term.
The Property. The Gainey Ranch Corporate Center II Property is a two-story Class A, single-tenant suburban office building located in Scottsdale, Arizona. The Gainey Ranch Corporate Center II Property was built in 1991 and is situated on approximately 7.65 acres. The Gainey Ranch Corporate Center II Property is part of the Gainey Ranch Corporate Center which features significant frontage and views along the Gainey Ranch Golf Club. The Gainey Ranch Corporate Center II Property was the former headquarters for Nationwide Insurance Company until the tenant vacated in the fourth quarter of 2020. Dansons US, LLC (“Dansons”) executed a 15-year, lease at the Gainey Ranch Corporate Center II Property on August 6, 2021. Dansons occupies 100% of the space and the Gainey Ranch Corporate Center II Property serves as the company’s corporate headquarters. Dansons has fully moved into the Gainey Ranch Corporate
THE INFORMATION IN THIS STRUCTURAL AND COLLATERAL TERM SHEET IS NOT COMPLETE AND MAY BE AMENDED PRIOR TO THE TIME OF SALE. THIS TERM SHEET IS NOT AN OFFER TO SELL THESE SECURITIES AND IT IS NOT A SOLICITATION OF AN OFFER TO BUY THESE SECURITIES IN ANY JURISDICTION WHERE THE OFFER OR SALE IS NOT PERMITTED.
110
| Structural and Collateral Term Sheet | BBCMS 2021-C11 | |
| No. 8 – Gainey Ranch Corporate Center II | ||
Center II Property as of August 26, 2021. The Gainey Ranch Corporate Center II Property also features a two-story subterranean parking garage with direct building access containing 847 spaces which equates to a parking ratio of approximately 4.2 spaces per 1,000 square feet of net rentable area.
COVID-19 Update. As of September 7, 2021, the Gainey Ranch Corporate Center II Property is open and operating. The sole tenant at the Gainey Ranch Corporate Center II Property made its August 2021 rental payment. As of the date of this term sheet, the Gainey Ranch Corporate Center II Property Mortgage Loan is not subject to any forbearance, modification, or debt service relief requests.
Major Tenant. Dansons (203,642 square feet; 100.0% of the NRA; 100.0% of underwritten base rent) is the sole tenant at the Gainey Ranch Corporate Center II Property. Dansons was founded in 1999 by Daniel Thiessen and his two sons, Jeffrey Thiessen and Jordan Thiessen, who serve as borrower sponsors and non-recourse carveout guarantors under the Gainey Ranch Corporate Center II Mortgage Loan documents. Dansons is a global consumer goods corporation and owns multiple brands including Country Smokers, Thiessens, Pit Boss Grills, Louisiana Grills and Surelock Security. Dansons currently operates across 25 factories and an additional 13 locations comprised of offices, distribution centers, pellet mills, and call centers. The Gainey Ranch Corporate Center II houses multiple departments for Dansons including a call center element, digital media marketing, sales, research and development, and executive offices. Dansons plans on utilizing the majority of its first floor space at the Gainey Ranch Corporate Center II Property to build out a retail showroom space for its large customers. Dansons is currently relocating all employees from its 30,000 square foot space in downtown Phoenix to the Gainey Ranch Corporate Center II Property. Dansons is planning to migrate its call center from its current location in Salem, Oregon to the Gainey Ranch Corporate Center II Property. Dansons has experienced tremendous growth over the past seven years increasing from a reported $6.4 million in net sales in 2013 to more than $365 million in reported net sales in 2020. For the period of 2019 to 2020, net sales increased by approximately 74.0%. In 2020, Dansons reported its best year in sales, units sold, profits, and market share in company history as well as a $43.0 million EBITDA, which has grown to $52.7 million for the trailing twelve months.
Environmental. According to the Phase I environmental assessment dated May 21, 2021, there was no evidence of any recognized environmental conditions at the Gainey Ranch Corporate Center II Property.
| Historical and Current Occupancy(1) | ||||
| 2018 | 2019 | 2020(2) | Current(3) | |
| Gainey Ranch Corporate Center II | 100.0% | 100.0% | 0.0% | 100.0% |
| (1) | Historical Occupancies are as of December 31 of each respective year. |
| (2) | The Gainey Ranch Corporate Center II Property was previously occupied by Nationwide Insurance Company which vacated in the fourth quarter of 2020. |
| (3) | Current Occupancy is as of August 6, 2021. |
| Top Tenant Summary(1) | |||||||
| Tenant | Ratings Moody’s/S&P/Fitch | Net Rentable Area (SF) | % of Total NRA | UW Base Rent PSF | UW Base Rent | % of Total UW Base Rent | Lease Exp. Date |
| Dansons US, LLC | NR/NR/NR | 203,642 | 100.0% | $20.00 | $4,072,840 | 100.0% | 8/5/2036(2) |
| Occupied Collateral Total | 203,642 | 100.0% | $20.00 | $4,072,840 | 100.0% | ||
| Vacant Space | 0 | 0.0% | |||||
| Collateral Total | 203,642 | 100.0% | |||||
| (1) | Based on the underwritten rent roll dated August 6, 2021. |
| (2) | After the expiration of the initial fifteen-year lease term, the lease with Dansons has one-year automatic renewals unless either the tenant or landlord terminates the lease by providing at least 90 days prior written notice to the other party. |
THE INFORMATION IN THIS STRUCTURAL AND COLLATERAL TERM SHEET IS NOT COMPLETE AND MAY BE AMENDED PRIOR TO THE TIME OF SALE. THIS TERM SHEET IS NOT AN OFFER TO SELL THESE SECURITIES AND IT IS NOT A SOLICITATION OF AN OFFER TO BUY THESE SECURITIES IN ANY JURISDICTION WHERE THE OFFER OR SALE IS NOT PERMITTED.
111
| Structural and Collateral Term Sheet | BBCMS 2021-C11 | |
| No. 8 – Gainey Ranch Corporate Center II | ||
| Lease Rollover Schedule(1) | |||||||||
Year | Number | Net | % of Expiring | UW Base | % of UW | Cumulative Net Rentable Area Expiring | Cumulative % of NRA | Cumulative | Cumulative % of UW Base Rent Expiring |
| Vacant | NAP | 0 | 0.0% | NAP | NAP | 0 | 0.0% | NAP | NAP |
| 2021 & MTM | 0 | 0 | 0.0 | $0 | 0.0% | 0 | 0.0% | $0 | 0.0% |
| 2022 | 0 | 0 | 0.0 | $0 | 0.0% | 0 | 0.0% | $0 | 0.0% |
| 2023 | 0 | 0 | 0.0 | $0 | 0.0% | 0 | 0.0% | $0 | 0.0% |
| 2024 | 0 | 0 | 0.0 | $0 | 0.0% | 0 | 0.0% | $0 | 0.0% |
| 2025 | 0 | 0 | 0.0 | $0 | 0.0% | 0 | 0.0% | $0 | 0.0% |
| 2026 | 0 | 0 | 0.0 | $0 | 0.0% | 0 | 0.0% | $0 | 0.0% |
| 2027 | 0 | 0 | 0.0 | $0 | 0.0% | 0 | 0.0% | $0 | 0.0% |
| 2028 | 0 | 0 | 0.0 | $0 | 0.0% | 0 | 0.0% | $0 | 0.0% |
| 2029 | 0 | 0 | 0.0 | $0 | 0.0% | 0 | 0.0% | $0 | 0.0% |
| 2030 | 0 | 0 | 0.0 | $0 | 0.0% | 0 | 0.0% | $0 | 0.0% |
| 2031 | 0 | 0 | 0.0 | $0 | 0.0% | 0 | 0.0% | $0 | 0.0% |
| 2032 & Beyond(2) | 1 | 203,642 | 100.0 | $4,072,840 | 100.0% | 203,642 | 100.0% | $4,072,840 | 100.0% |
| Total | 1 | 203,642 | 100.0% | $4,072,840 | 100.0% | ||||
| (1) | Based on underwritten rent roll dated August 6, 2021. |
| (2) | Dansons’ lease expires in 2036. |
| Operating History and Underwritten Net Cash Flow | |||
Underwritten | Per Square Foot | %(1) | |
| Gross Potential Rent | $4,072,840 | $20.00 | 71.0% |
| Total Recoveries | 1,666,890 | 8.19 | 29.0 |
| Other Income | 0 | 0.00 | 0.0 |
| Net Rental Income | $5,739,730 | $28.19 | 100.0% |
| (Vacancy/Credit Loss) | (286,986) | (1.41) | (5.0) |
| Effective Gross Income | $5,452,743 | $26.78 | 100.0% |
| Total Expenses | $1,666,890 | $8.19 | 30.6% |
| Net Operating Income | $3,785,854 | $18.59 | 69.4% |
| Total TI/LC, Capex/RR | 305,463 | 1.50 | 5.6 |
| Net Cash Flow | $3,480,391 | $17.09 | 63.8% |
| (1) | % column represents (i) percent of Net Rental Income for all revenue lines and Vacancy/Credit Loss and (ii) percent of Effective Gross Income for the remainder of fields |
The Market. The Gainey Ranch Corporate Center II Property is located in the Phoenix-Mesa-Scottsdale, AZ metropolitan statistical area (the “Phoenix MSA”). The Gainey Ranch Corporate Center II Property is located 5.8 miles north of downtown Scottsdale, which is widely regarded as one of the most desirable urban locations in the Phoenix MSA. According to the appraisal, The Phoenix MSA is one of the fastest growing metropolitan statistical areas in the nation. In recent years, a significant number of financial, technology and manufacturing companies have located and expanded operations in the area. The unemployment rate has gradually recovered for the past months. The unemployment rate in the Phoenix MSA was at a peak rate of 13.5% in April 2020 and has decreased to 6.2% as of May 2021.
The Gainey Ranch Corporate Center II Property is accessible to Scottsdale Road and Arizona Loop 101. Arizona Loop 101 is a highway that loops around the northern end of the Phoenix area connecting several suburbs including Tolleson, Glendale, Peoria, Scottsdale, Mesa, Tempe and Chandler. State Route 51 is located approximately 8.2 miles from the Gainey Ranch Corporate Center II Property and provides access between central and northeast Phoenix.
The Gainey Ranch Corporate Center II Property is located in the Central Scottsdale submarket of the Phoenix office market. According to a third-party report, as of the second quarter of 2021, the Phoenix office market had an inventory of approximately 193.8 million square feet, an overall vacancy rate of 14.1% and average asking rents of $26.30 per square foot. According to a third-party report, as of the second quarter of 2021, the Central Scottsdale submarket had an inventory of approximately 9.0 million square feet, an overall vacancy rate of 17.4% and average asking rents of $26.64 per square foot. According to the appraisal, the 2020 total population within a one-,
THE INFORMATION IN THIS STRUCTURAL AND COLLATERAL TERM SHEET IS NOT COMPLETE AND MAY BE AMENDED PRIOR TO THE TIME OF SALE. THIS TERM SHEET IS NOT AN OFFER TO SELL THESE SECURITIES AND IT IS NOT A SOLICITATION OF AN OFFER TO BUY THESE SECURITIES IN ANY JURISDICTION WHERE THE OFFER OR SALE IS NOT PERMITTED.
112
| Structural and Collateral Term Sheet | BBCMS 2021-C11 | |
| No. 8 – Gainey Ranch Corporate Center II | ||
three- and five-miles radius of the Gainey Ranch Corporate Center II Property is 7,828, 56,245 and 166,704, respectively. The 2020 average household income within the same radii is $165,011, $151,872 and $142,246, respectively.
The following table presents office rental data with respect to comparable office property leases with respect to the Gainey Ranch Corporate Center II Property as identified in the appraisal:
| Comparable Office Rental Summary(1) | ||||||||
| Property Name/Location | Year Built | Occ. | Size (SF) | Tenant | Suite Size (SF) | Rent PSF | Commencement | Lease Term (Yrs.) |
Gainey Ranch Corporate Center II 8877 North Gainey Center Drive Scottsdale, AZ | 1991 | 100.0% | 203,642 | Dansons US, LLC | 203,642 | $20.00 | Aug-21 | 15.0 |
Papago Park Center 1150 West Washington Street Tempe, AZ | 2004 | 100% | 215,827 | Wells Fargo | 214,303 | $28.00 | Jan-19 | 6.4 |
Republic Services Northsight 14400 North 87th Street Scottsdale, AZ | 1999 | 100% | 136,000 | Republic Services | 133,634 | $22.00 | Jul-19 | 12.8 |
Park Place- Building 16 1700 South Price Road Chandler, AZ | 2019 | 100% | 150,000 | Vaya Financial | 151,359 | $21.00 | Apr-20 | 10.7 |
Benchmark Electronics 2100 E Rio Salado Parkway Tempe, AZ | 2019 | 100% | 63,500 | Benchmark Electronics | 63,500 | $30.25 | Feb-19 | 10.7 |
Northrop Grumman 1715 West Elliot Road Gilbert, AZ | 2020 | 100% | 120,512 | Northrop Grumman | 119,222 | $19.75 | Nov-20 | 10.2 |
| (1) | Source: Appraisal, except for Gainey Ranch Corporate Center II, which information is based on the underwritten rent roll dated August 6, 2021. |
The following table presents certain information relating to comparable office sales for the Gainey Ranch Corporate Center II Property:
| Comparable Sales(1) | ||||||
| Property Name/Location | Sale Date | Total NRA (SF) | Distance from Subject | Sale Price | Sale Price PSF | Adjusted Sales Price PSF(2) |
Gainey Ranch Corporate Center II 8877 North Gainey Center Drive Scottsdale, AZ | May-2021 | 203,642(3) | -- | $39,000,000 | $191.51 | $191.51 |
Crown Castle Headquarters 2055 Southwest Stearman Drive Chandler, AZ | Sep-2015 | 70,000 | 21.0 miles | $16,038,341 | $229.12 | $229.12 |
Discount Tire Headquarters 20225 North Scottsdale Road Scottsdale, AZ | May-2017 | 157,566 | 7.2 miles | $40,180,000 | $255.00 | $255.00 |
Kierland I 16430 North Scottsdale Road Scottsdale, AZ | Aug-2013 | 175,441 | 4.8 miles | $29,300,000 | $167.01 | $168.15 |
Riverpoint, Bldg. 1 3125 East Wood Street Phoenix, AZ | Jul-2019 | 52,640 | 12.0 miles | $7,526,800 | $142.99 | $142.99 |
| (1) | Information obtained from the appraisal. |
| (2) | Adjusted Sales Price PSF reflects the appraiser’s stabilized price and accounts for certain transaction and property level adjustments. |
| (3) | Based on the underwritten rent roll dated August 6, 2021. |
The Borrower. The borrower is Dansons Gainey, LLC, a Delaware limited liability company and special purpose entity with one independent director. Legal counsel for the borrower delivered a non-consolidation opinion in connection with the Gainey Ranch Corporate Center II Mortgage Loan.
The Borrower Sponsors. The borrower sponsors and non-recourse carveout guarantors are Jeffrey Thiessen and Jordan Thiessen. Jeffrey Thiessen is the co-founder and president of Dansons. Jeffrey Thiessen has over 20 years of experience in the hearth and barbecue industry. Jeffrey Thiessen had led Dansons’ customer and business development and has provided strategic direction and vision for all of Dansons’ global sales and marketing activities. Jordan Thiessen serves as the Chief Operating Officer of Dansons.
Property Management. The Gainey Ranch Corporate Center II Property is self-managed.
Escrows and Reserves. At origination, the borrower deposited into escrow (i) $700,000 for replacement reserves, (ii) $238,776 for real estate taxes, (iii) $126,903 for insurance premiums and (iv) $57,600 for deferred maintenance.
THE INFORMATION IN THIS STRUCTURAL AND COLLATERAL TERM SHEET IS NOT COMPLETE AND MAY BE AMENDED PRIOR TO THE TIME OF SALE. THIS TERM SHEET IS NOT AN OFFER TO SELL THESE SECURITIES AND IT IS NOT A SOLICITATION OF AN OFFER TO BUY THESE SECURITIES IN ANY JURISDICTION WHERE THE OFFER OR SALE IS NOT PERMITTED.
113
| Structural and Collateral Term Sheet | BBCMS 2021-C11 | |
| No. 8 – Gainey Ranch Corporate Center II | ||
Tax Escrows – On each monthly payment date, the borrower is required to escrow 1/12th of the annual estimated tax payments, which currently equates to approximately $47,755.
Insurance Escrows – On each monthly payment date, the borrower is required to escrow 1/12th of the annual estimated insurance payments, which currently equates to approximately $21,151.
Replacement Reserves – On each monthly payment date beginning on the first payment date of September 6, 2021 until and including the payment date on August 6, 2024, the borrower is required to escrow approximately $21,213 (approximately $1.25 per square foot annually) and on each monthly payment date beginning September 6, 2024 and thereafter, the borrower is required to escrow approximately $4,242 (approximately $0.25 per square foot annually) for replacement reserves.
TI/LC Reserves – On each monthly payment date, the borrower is required to escrow $16,970 (approximately $1.00 per square foot annually) for tenant improvement and leasing commission reserves, subject to a cap of $610,926.
Lockbox / Cash Management. The Gainey Ranch Corporate Center II Mortgage Loan is structured with a hard lockbox and in-place cash management. Revenues from the Gainey Ranch Corporate Center II Property are required to be deposited directly into the lockbox account and transferred on each business day into the cash management account controlled by the lender to be applied and disbursed in accordance with the Gainey Ranch Corporate Center II Mortgage Loan documents. While a Cash Sweep Period (as defined below) is in effect, all excess cash is required to be held by the lender as additional collateral for the Gainey Ranch Corporate Center II Mortgage Loan.
A “Cash Sweep Period” will commence upon any of the following: (i) an event of default; (ii) the debt yield being less than 9.0%; and (iii) the occurrence of a Specified Tenant Sweep Event (as defined below).
A Cash Sweep Period will end, with respect to clause (i), upon the cure of such event of default; with respect to clause (ii), upon the debt yield being greater than or equal to 9.5% for two consecutive calendar quarters; and with respect clause (iii) the expiration of all Specified Tenant Sweep Events.
A “Specified Tenant” means, individually and collectively, Dansons, and any parent company of Dansons, and guarantor of such tenant’s lease, and any replacement tenant occupying all or any portion of the space at the Gainey Ranch Corporate Center II Property.
A “Specified Tenant Sweep Event” will commence upon any of the following: (i) a Specified Tenant defaults under its lease beyond all applicable notice and/or cure periods; (ii) a Specified Tenant going dark, vacating or otherwise failing to occupy 50% or more of its leased space or giving notice of its intent to do any of the foregoing; (iii) any bankruptcy or similar insolvency of a Specified Tenant; (iv) a Specified Tenant terminating, cancelling or surrendering its lease, or giving notice of its intent to do any of the foregoing; (v) the earlier of (a) the date that is 12 months prior to the scheduled expiration of such Specified Tenant’s lease or (b) the date under such Specified Tenant’s Lease by which such Specified Tenant is required to give notice of its exercise of a renewal option, unless such applicable cure has already occurred; and (vi) a Specified Tenant has its rating downgraded by at least two notches by any rating agency from such rating as of the origination date, or if the lease is entered after the origination date, the date that such lease is entered into.
A Specified Tenant Sweep Event will end: with respect to clause (i), the cure of such event of default has been accepted by the borrower, with respect to clause (ii) (a) the Specified Tenant has resumed occupancy and normal business operations at all of its leased space and (b) the Specified Tenant delivering to the lender an acceptable tenant estoppel certificate, with respect to clause (iii) the Specified Tenant no longer is insolvent or subject to any bankruptcy or insolvency proceedings and has affirmed its lease pursuant to a final, non-appealable order of a court of competent jurisdiction, with respect to clause (iv), (a) the Specified Tenant revokes any notification of any termination, cancellation or surrender of its lease and resuming ordinary course business operations at all of its leased space and (b) the Specified Tenant delivering to the lender an acceptable tenant estoppel certificate, with respect to clause (v), (a) acceptable evidence that such Specified Tenant has given notice of renewal under terms of its lease, and all landlord obligations (including the payment of any leasing commissions) have been satisfied in full (or sufficient funds have been reserved for such purposes and to cover any operating shortfalls relating to the delay in the commencement of full rent payments and (b) the Specified Tenant delivering to the lender an acceptable tenant estoppel certificate, and with respect to clause (vi), the Specified Tenant’s rating is increased to at least the same rating assigned to such Specified Tenant as of the origination date, or if the lease is entered into after the origination date, the date that such lease is entered into, and with respect to any Specified Tenant Sweep Event, all of the space leased to the Specified Tenant (a) all of the space leased to the Specified Tenant is leased to one or more replacement tenants on terms acceptable to lender, and all landlord obligations (including the payment of any leasing commissions) have been satisfied in full (or sufficient funds have been reserved for such purposes and to cover any operating shortfalls relating to the delay in the commencement of full rent payments) and (b) such replacement tenants delivering to lender acceptable tenant estoppel certificate(s).
Subordinate and Mezzanine Debt. None.
Partial Release. Not permitted.
Ground Lease. None.
THE INFORMATION IN THIS STRUCTURAL AND COLLATERAL TERM SHEET IS NOT COMPLETE AND MAY BE AMENDED PRIOR TO THE TIME OF SALE. THIS TERM SHEET IS NOT AN OFFER TO SELL THESE SECURITIES AND IT IS NOT A SOLICITATION OF AN OFFER TO BUY THESE SECURITIES IN ANY JURISDICTION WHERE THE OFFER OR SALE IS NOT PERMITTED.
114
(THIS PAGE INTENTIONALLY LEFT BLANK)
THE INFORMATION IN THIS STRUCTURAL AND COLLATERAL TERM SHEET IS NOT COMPLETE AND MAY BE AMENDED PRIOR TO THE TIME OF SALE. THIS TERM SHEET IS NOT AN OFFER TO SELL THESE SECURITIES AND IT IS NOT A SOLICITATION OF AN OFFER TO BUY THESE SECURITIES IN ANY JURISDICTION WHERE THE OFFER OR SALE IS NOT PERMITTED.
115
| Structural and Collateral Term Sheet | BBCMS 2021-C11 | |
| No. 9 – Pleasant Valley Apartments | ||

THE INFORMATION IN THIS STRUCTURAL AND COLLATERAL TERM SHEET IS NOT COMPLETE AND MAY BE AMENDED PRIOR TO THE TIME OF SALE. THIS TERM SHEET IS NOT AN OFFER TO SELL THESE SECURITIES AND IT IS NOT A SOLICITATION OF AN OFFER TO BUY THESE SECURITIES IN ANY JURISDICTION WHERE THE OFFER OR SALE IS NOT PERMITTED.
116
| Structural and Collateral Term Sheet | BBCMS 2021-C11 | |
| No. 9 – Pleasant Valley Apartments | ||
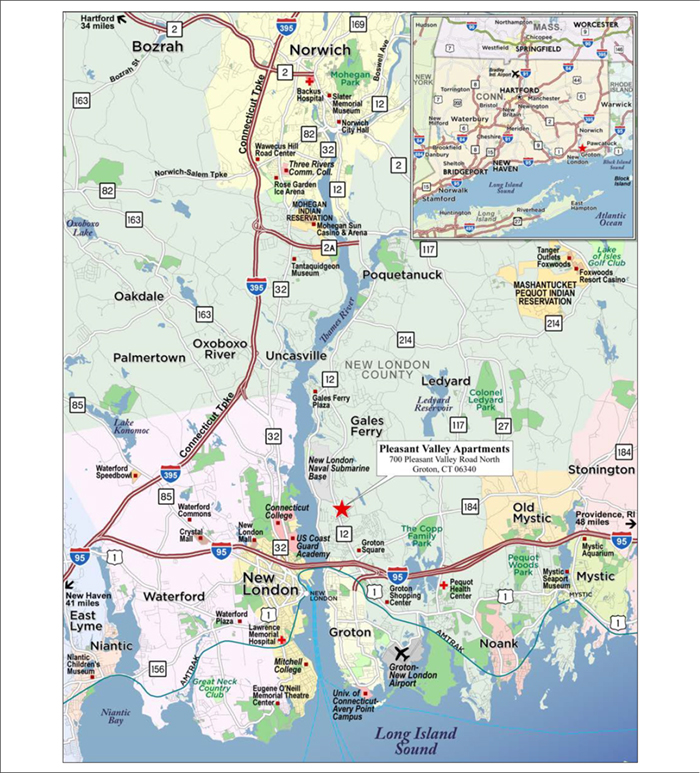
THE INFORMATION IN THIS STRUCTURAL AND COLLATERAL TERM SHEET IS NOT COMPLETE AND MAY BE AMENDED PRIOR TO THE TIME OF SALE. THIS TERM SHEET IS NOT AN OFFER TO SELL THESE SECURITIES AND IT IS NOT A SOLICITATION OF AN OFFER TO BUY THESE SECURITIES IN ANY JURISDICTION WHERE THE OFFER OR SALE IS NOT PERMITTED.
117
| Structural and Collateral Term Sheet | BBCMS 2021-C11 | |
| No. 9 – Pleasant Valley Apartments | ||
| Mortgage Loan Information | Property Information | |||
| Mortgage Loan Seller: | Barclays | Single Asset / Portfolio: | Single Asset | |
| Original Principal Balance: | $28,930,000 | Title: | Fee | |
| Cut-off Date Principal Balance: | $28,930,000 | Property Type – Subtype: | Multifamily – Garden | |
| % of IPB: | 2.9% | Net Rentable Area (Units): | 132 | |
| Loan Purpose: | Refinance | Location: | Groton, CT | |
| Borrower: | Pleasant Valley Apartments, LLC | Year Built / Renovated: | 2019-2021 / NAP | |
| Borrower Sponsor: | A. Richard Nernberg | Occupancy: | 100.0% | |
| Interest Rate: | 3.30000% | Occupancy Date: | 8/4/2021 | |
| Note Date: | 8/16/2021 | 4th Most Recent NOI (As of)(1): | NAV | |
| Maturity Date: | 9/6/2031 | 3rd Most Recent NOI (As of)(1): | NAV | |
| Interest-only Period: | 120 months | 2nd Most Recent NOI (As of)(2): | $1,027,449 (12/31/2020) | |
| Original Term: | 120 months | Most Recent NOI (As of)(2): | $1,513,106 (TTM 7/31/2021) | |
| Original Amortization Term: | None | UW Economic Occupancy: | 95.0% | |
| Amortization Type: | Interest Only | UW Revenues: | $2,913,811 | |
| Call Protection: | L(24),D(92),O(4) | UW Expenses: | $738,187 | |
| Lockbox / Cash Management: | Springing | UW NOI(2): | $2,175,624 | |
| Additional Debt: | No | UW NCF: | $2,142,624 | |
| Additional Debt Balance: | N/A | Appraised Value / Per Unit: | $41,700,000 / $315,909 | |
| Additional Debt Type: | N/A | Appraisal Date: | 7/8/2021 | |
| Escrows and Reserves(3) | Financial Information | |||||||
| Initial | Monthly | Initial Cap | Cut-off Date Loan / Unit: | $219,167 | ||||
| Taxes: | $77,887 | $19,472 | N/A | Maturity Date Loan / Unit: | $219,167 | |||
| Insurance: | $0 | Springing | N/A | Cut-off Date LTV: | 69.4% | |||
| Replacement Reserves: | $0 | Springing | $165,000 | Maturity Date LTV: | 69.4% | |||
| TI/LC: | $0 | $0 | N/A | UW NCF DSCR: | 2.21x | |||
| Other: | $0 | $0 | N/A | UW NOI Debt Yield: | 7.5% | |||
| Sources and Uses | ||||||
| Sources | Proceeds | % of Total | Uses | Proceeds | % of Total | |
| Mortgage Loan | $28,930,000 | 100.0% | Payoff Existing Debt | $19,225,378 | 66.5% | |
| Return of Equity | 9,339,156 | 32.3 | ||||
| Closing Costs | 287,579 | 1.0 | ||||
| Upfront Reserves | 77,887 | 0.3 | ||||
| Total Sources | $28,930,000 | 100.0% | Total Uses | $28,930,000 | 100.0% | |
| (1) | The Pleasant Valley Apartments Property (as defined below) was built in one phase with a staged delivery of the buildings over a period of 24 months and completed in 2021, as such 3rd Most Recent NOI and 4th Most Recent NOI are unavailable. |
| (2) | The increase from 2nd Most Recent NOI and Most Recent NOI to UW NOI was due to the lease up at the Pleasant Valley Apartments Property as units came online following their completion. See “The Property” section below for a full description of the renovations. |
| (3) | For a full description of Escrows and Reserves, please refer to “Escrows and Reserves” below. |
The Loan. The Pleasant Valley Apartments mortgage loan (the “Pleasant Valley Apartments Mortgage Loan”) has an original and Cut-off Date balance of $28,930,000 and is secured by a first mortgage lien on the borrower’s fee interest in a 132-unit multifamily property located in Groton, Connecticut (the “Pleasant Valley Apartments Property”). The Pleasant Valley Apartments Mortgage Loan has a 10-year term and is interest-only for the entire term.
The Property. The Pleasant Valley Apartments Property is a 132-unit, Class A, garden-style multifamily property located on 12.4 acres in Groton, Connecticut. Completed in 2021, the Pleasant Valley Apartments Property has 18 studio units, 48 one-bedroom units and 66 two-bedroom units located across three three-story buildings. The studio, one-bedroom and two-bedroom units at the Pleasant Valley Apartments Property are offered in seven different unit types, ranging from 623 square feet to 1,245 square feet, with an average unit size of 967 square feet. There are a total of 196 parking spaces, including 161 carport and surfaces spaces and 35 spaces in detached garages. The improvements consist of wood frame-construction and are elevator serviced. All of the units have a balcony, a patio, walk-in closets, in-unit washer/dryers, air conditioning and hardwood floors. Additionally, the Pleasant Valley Apartments Property amenities
THE INFORMATION IN THIS STRUCTURAL AND COLLATERAL TERM SHEET IS NOT COMPLETE AND MAY BE AMENDED PRIOR TO THE TIME OF SALE. THIS TERM SHEET IS NOT AN OFFER TO SELL THESE SECURITIES AND IT IS NOT A SOLICITATION OF AN OFFER TO BUY THESE SECURITIES IN ANY JURISDICTION WHERE THE OFFER OR SALE IS NOT PERMITTED.
118
| Structural and Collateral Term Sheet | BBCMS 2021-C11 | |
| No. 9 – Pleasant Valley Apartments | ||
include a package service, controlled access, maintenance on site, a property manager on site, 24-hour availability trash pickup, storage space, a fitness center, a pool, bike storage, a fenced lot, a grill area and a picnic area.
COVID-19 Update. As of September 2, 2021, 99.2% of gross potential rent was collected through the period ending in July 2021, and 99.2% of gross potential rent was collected through the period ending in June 2021. As of the date of this term sheet, the Pleasant Valley Apartments Mortgage Loan is not subject to any modification or forbearance request.
The following table presents detailed information with respect to the unit mix of the Pleasant Valley Apartments Property:
| Unit Mix(1) | |||||||
| Unit Type | # of Units | % of Units | Occupied Units | Occupancy | Average SF | Average Monthly Rental Rate(2) | Average Monthly Rental Rate PSF |
| Studio | 18 | 13.6% | 18 | 100.0% | 623 | $1,406 | $2.26 |
| One Bedroom | 48 | 36.4% | 48 | 100.0% | 845 | $1,540 | $1.82 |
| Two Bedroom | 66 | 50.0% | 66 | 100.0% | 1,150 | $1,730 | $1.51 |
| Collateral Total/Wtd. Avg. | 132 | 100.0% | 132 | 100.0% | 967 | $1,617 | $1.67 |
| (1) | Based on the underwritten rent roll dated August 4, 2021. |
| (2) | Average Monthly Rental Rate is calculated using the in-place contract rent of the Occupied Units. |
Environmental. According to the Phase I environmental site assessment dated July 22, 2021, there is no evidence of any recognized environmental conditions or controlled recognized environmental conditions at the Pleasant Valley Apartments Property.
| Historical and Current Occupancy | |
| 2020(1) | Current(2) |
| NAP | 100.0% |
| (1) | The Pleasant Valley Apartments Property was built in one phase with a staged delivery of the buildings over a period of 24 months and completed in 2021, as such historical occupancy is unavailable. |
| (2) | Current Occupancy is based on the underwritten rent roll dated August 4, 2021. |
| Operating History and Underwritten Net Cash Flow | |||||
| 2020(1) | TTM(1)(2) | Underwritten(1) | Per Unit | %(3) | |
| Rents in Place | $1,281,185 | $1,784,302 | $2,549,665 | $19,316 | 83.1% |
| Other Income(4) | 236,385 | 344,008 | 517,504 | 3,920 | 16.9 |
| Gross Potential Rent | $1,517,570 | $2,128,310 | $3,067,169 | $23,236 | 100.0% |
| Total Reimbursements | 0 | 0 | 0 | 0 | 0.0 |
| Net Rental Income | $1,517,570 | $2,128,310 | $3,067,169 | $23,236 | 100.0% |
| (Vacancy/Credit Loss) | 0 | 0 | (153,358) | (1,162) | (5.0) |
| Effective Gross Income | $1,517,570 | $2,128,310 | $2,913,811 | $22,074 | 95.0% |
| Total Expenses | $490,121 | $615,204 | $738,187 | $5,592 | 25.3% |
| Net Operating Income | $1,027,449 | $1,513,106 | $2,175,624 | $16,482 | 74.7% |
| Total TI/LC, Capex/RR | 0 | 0 | 33,000 | 250.00 | 1.1 |
| Net Cash Flow | $1,027,449 | $1,513,106 | $2,142,624 | $16,232 | 73.5% |
| (1) | The increase in Rents in Place from 2020 and TTM to Underwritten was driven by the lease up at the Pleasant Valley Apartments Property as units came online following their completion. |
| (2) | TTM column represents the trailing 12 months ending July 2021. |
| (3) | % column represents percentage of Net Rental Income for all revenue lines and represents percentage of Effective Gross Income for the remainder of fields. |
| (4) | Other Income is comprised of water & sewer, late fees, application fees, administrative fees, short term fees, pet fees and damages. |
The Market. The Pleasant Valley Apartments Property is located in Groton, Connecticut, within the Norwich-New London market and New London submarket. The Pleasant Valley Apartments Property is approximately halfway between New York, NY and Boston, MA. The Pleasant Valley Apartments Property offers connectivity to the greater northeast corridor via I-95 and State Route 184 which are both
THE INFORMATION IN THIS STRUCTURAL AND COLLATERAL TERM SHEET IS NOT COMPLETE AND MAY BE AMENDED PRIOR TO THE TIME OF SALE. THIS TERM SHEET IS NOT AN OFFER TO SELL THESE SECURITIES AND IT IS NOT A SOLICITATION OF AN OFFER TO BUY THESE SECURITIES IN ANY JURISDICTION WHERE THE OFFER OR SALE IS NOT PERMITTED.
119
| Structural and Collateral Term Sheet | BBCMS 2021-C11 | |
| No. 9 – Pleasant Valley Apartments | ||
within two miles of the Pleasant Valley Apartments Property. The immediate area around the Pleasant Valley Apartments Property consists of office, retail and industrial along the major throughways. Groton is home to the Naval Submarine Base New London and the submarine construction facilities of the Electric Boat Division of General Dynamics, the principal contractor for submarine work in the Navy. Additionally, the Global Research and Development campus of Pfizer, Inc. is headquartered in Groton less than four miles from the Pleasant Valley Apartments Property. The Pleasant Valley Apartments Property is less than two miles from Groton Square Shopping Center which is home to national retailers including Walmart and Kohl’s, and the Pleasant Valley Apartments Property is within 12 miles of the Mohegan Sun and Foxwood Resort casinos.
As of the first quarter of 2021, the New London submarket contained 9,454 units with a vacancy rate of 2.7% and an average asking rent of $1,302 per unit. According to the appraisal, the estimated 2020 population within a one-, three- and five-mile radius of the Pleasant Valley Apartments Property was approximately 7,025, 39,880 and 80,733, respectively, and the estimated 2020 average household income within the same radii was approximately $75,478, $74,933 and $80,424, respectively.
The following table presents certain information relating to comparable multifamily rentals for the Pleasant Valley Apartments Property as identified in the appraisal:
| Comparable Rentals(1) | |||||||
| Property Name/Location | Units | Average SF per Unit | Year Built / Renov. | Occupancy | Average Asking Rent (Studio) | Average Asking Rent (1 Bed) | Average Asking Rent (2 Beds) |
| Pleasant Valley Apartments Groton, CT | 132(2) | 967(2) | 2021 / NAP | 100.0%(2) | $1,406(2) | $1,563(2) | $1,740(2) |
| The Ledges Apartments Groton, CT | 339 | 1,042 | 2003 / NAP | 96.2% | NAP | $1,700 | $2,278 |
| Waterford Parc Waterford, CT | 72 | 983 | 2020 / NAP | 94.4% | NAP | $1,695 | $1,950 |
| LaTriumphe Groton, CT | 292 | 953 | 1993 / NAP | 99.0% | NAP | $1,373 | $1,588 |
| The Docks New London, CT | 137 | 662 | 2021 / NAP | 56.2%(3) | $1,230 | $1,598 | $2,023 |
| The Sound at Gateway Com. East Lyme, CT | 280 | 1,007 | 2015 / NAP | 99.0% | $1,560 | $1,655 | $1,876 |
| 60 Mansfield Road Apts New London, CT | 104 | 697 | 2018 / NAP | 99.0% | $1,293 | $1,670 | $1,918 |
| (1) | Source: Appraisal. |
| (2) | Based on the underwritten rent roll dated August 4, 2021. |
| (3) | The Docks was constructed in 2021 and is currently in its lease-up phase. |
The following table presents certain information relating to comparable multifamily sales for the Pleasant Valley Apartments Property as identified in the appraisal:
| Comparable Sales(1) | ||||||||
| Property Name/Location | Units | Average SF per Unit | Year Built/ Renov. | Occupancy | Sales Date | Sales Price | Sales Price Per Unit | Adjusted Sales Price Per Unit |
| Pleasant Valley Apartments Groton, CT | 132(2) | 967(2) | 2021 / NAP | 100.0%(2) | NAP | NAP | NAP | NAP |
| One Mansfield Mansfield, MA | 81 | 878 | 2017 / NAP | NAV | June-21 | $25,360,000 | $313,086 | NAP |
| The Point at Wrentham Wrentham, MA | 240 | NAV | 2019 / NAP | NAV | Dec-20 | $84,500,000 | $352,083 | $320,044 |
| The Grand Luxury Apartments Granby, CT | 130 | 1,053 | 2018 / NAP | NAV | May-20 | $33,300,000 | $256,154 | $274,341 |
| Multifamily Complex Plymouth, MA | 56 | 1,117 | 2018 / NAP | NAV | May-21 | $21,250,000 | $379,464 | $341,518 |
| The Westerly at Forge Park Franklin, MA | 280 | 956 | 2017 / NAP | NAV | Nov-19 | $84,250,000 | $300,893 | $325,416 |
| (1) | Source: Appraisal. |
| (2) | Based on the underwritten rent roll dated August 4, 2021. |
THE INFORMATION IN THIS STRUCTURAL AND COLLATERAL TERM SHEET IS NOT COMPLETE AND MAY BE AMENDED PRIOR TO THE TIME OF SALE. THIS TERM SHEET IS NOT AN OFFER TO SELL THESE SECURITIES AND IT IS NOT A SOLICITATION OF AN OFFER TO BUY THESE SECURITIES IN ANY JURISDICTION WHERE THE OFFER OR SALE IS NOT PERMITTED.
120
| Structural and Collateral Term Sheet | BBCMS 2021-C11 | |
| No. 9 – Pleasant Valley Apartments | ||
The Borrower. The borrower is Pleasant Valley Apartments, LLC, a single purpose, Connecticut limited liability company.
The Borrower Sponsor. The borrower sponsor and nonrecourse carve-out guarantor of the Pleasant Valley Apartments Mortgage Loan is A. Richard Nernberg. A. Richard Nernberg is the founder of A.R. Building Company, Inc., a real estate development and management company that focuses on multifamily properties. Founded in 1968, A.R. Building Company has over 50 years of experience and currently owns and operates 8,600 apartment and townhouse units at 50 properties in 10 states, as well as two office buildings.
Property Management. The Pleasant Valley Apartments Property is managed by A.R. Building Company, Inc., an affiliate of the borrower sponsor.
Escrows and Reserves.
Tax Escrows – The borrower deposited approximately $77,887 into a real estate tax reserve at origination and is required to escrow an ongoing monthly real estate tax reserve payment in an amount equal to 1/12th of the annual estimated real estate taxes (initially approximately $19,472).
Insurance Escrows – On a monthly basis, the borrower is required to escrow 1/12th of the annual estimated insurance payments if the borrower does not maintain a blanket policy acceptable to the lender.
Replacement Reserves – On a monthly basis commencing on September 6, 2023, the borrower is required to escrow $2,750 (equal to approximately $250 per unit per annum) for capital expenditures until the balance of the replacement reserve equals at least $165,000 (the “Replacement Reserve Cap”). In the event the balance of funds in the replacement reserve falls below the Replacement Reserve Cap, the replacement reserve monthly deposit will recommence until the Replacement Reserve Cap is reached again.
Lockbox / Cash Management. The Pleasant Valley Apartments Mortgage Loan is structured with a springing lockbox and springing cash management. Upon the first occurrence of a Trigger Period (as defined below), the borrower is required to establish an eligible account and deposit, or cause to be deposited, all income, security deposits and other revenue from the Pleasant Valley Apartments Property received by the borrower or property management. Upon the occurrence and during the continuance of a Trigger Period, all funds received by the borrower or property management are required to be deposited into the lockbox account no later than one business day after receipt. On each business day, all funds on deposit in the lockbox account are required to be transferred to (a) during any time other than during a Trigger Period, an account specified by the borrower and (b) during the continuance of a Trigger Period, to a cash management account under the control of the lender to be applied and disbursed in accordance with the Pleasant Valley Apartments Mortgage Loan documents. Excess cash on deposit in the cash management account will be applied as follows: (a) during the continuance of a Low DSCR Period (as defined below), the excess cash flow subaccount, or (b) if no Low DSCR Period has occurred and is continuing, to an account specified by the borrower.
A “Trigger Period” will commence upon: (i) the occurrence of an event of default; or (ii) the debt service coverage ratio being less than 1.15x assuming a 30-year amortization schedule (1.81x is the interest-only debt service coverage ratio equivalent) on a trailing twelve-month basis. A Trigger Period will end (a) with respect to clause (i), once the event of default has been cured or (b) with respect to clause (ii), upon the date that the debt service coverage ratio is greater than or equal to 1.20x assuming a 30-year amortization schedule (1.88x is the interest- only debt service coverage ratio equivalent) for two consecutive calendar quarters.
A “Low DSCR Period” will commence upon the last day of any two consecutive calendar quarters for which the debt service coverage ratio is less than 1.15x assuming a 30-year amortization schedule (1.81x is the interest-only debt service coverage ratio equivalent). A Low DSCR Period will end on the last day of any two consecutive calendar quarters thereafter for each of which the debt service coverage ratio is greater than or equal to 1.20x assuming a 30-year amortization schedule (1.88x is the interest-only debt service coverage ratio equivalent).
Subordinate and Mezzanine Debt. None.
Partial Release. Not permitted.
Ground Lease. None.
THE INFORMATION IN THIS STRUCTURAL AND COLLATERAL TERM SHEET IS NOT COMPLETE AND MAY BE AMENDED PRIOR TO THE TIME OF SALE. THIS TERM SHEET IS NOT AN OFFER TO SELL THESE SECURITIES AND IT IS NOT A SOLICITATION OF AN OFFER TO BUY THESE SECURITIES IN ANY JURISDICTION WHERE THE OFFER OR SALE IS NOT PERMITTED.
121
| Structural and Collateral Term Sheet | BBCMS 2021-C11 | |
| No. 10 – Cooper Standard HQ | ||

THE INFORMATION IN THIS STRUCTURAL AND COLLATERAL TERM SHEET IS NOT COMPLETE AND MAY BE AMENDED PRIOR TO THE TIME OF SALE. THIS TERM SHEET IS NOT AN OFFER TO SELL THESE SECURITIES AND IT IS NOT A SOLICITATION OF AN OFFER TO BUY THESE SECURITIES IN ANY JURISDICTION WHERE THE OFFER OR SALE IS NOT PERMITTED.
122
| Structural and Collateral Term Sheet | BBCMS 2021-C11 | |
| No. 10 – Cooper Standard HQ | ||

THE INFORMATION IN THIS STRUCTURAL AND COLLATERAL TERM SHEET IS NOT COMPLETE AND MAY BE AMENDED PRIOR TO THE TIME OF SALE. THIS TERM SHEET IS NOT AN OFFER TO SELL THESE SECURITIES AND IT IS NOT A SOLICITATION OF AN OFFER TO BUY THESE SECURITIES IN ANY JURISDICTION WHERE THE OFFER OR SALE IS NOT PERMITTED.
123
| Structural and Collateral Term Sheet | BBCMS 2021-C11 | |
| No. 10 – Cooper Standard HQ | ||
| Mortgage Loan Information | Property Information | |||
| Mortgage Loan Seller: | UBS AG | Single Asset / Portfolio: | Single Asset | |
| Original Principal Balance: | $27,300,000 | Title: | Fee | |
| Cut-off Date Principal Balance: | $27,300,000 | Property Type – Subtype: | Office – Suburban | |
| % of IPB: | 2.8% | Net Rentable Area (SF): | 110,165 | |
| Loan Purpose: | Acquisition | Location: | Northville, MI | |
| Borrowers: | Novi 730 LLC and Hamilton Northville LLC | Year Built / Renovated: | 2020 / NAP | |
| Borrower Sponsors: | Sidney A. Borenstein and Shimmie Horn | Occupancy: | 100.0% | |
| Interest Rate: | 3.71000% | Occupancy Date: | 7/19/2021 | |
| Note Date: | 7/19/2021 | 4th Most Recent NOI (As of)(2): | NAV | |
| Maturity Date: | 8/6/2031 | 3rd Most Recent NOI (As of)(2): | NAV | |
| Interest-only Period: | 24 months | 2nd Most Recent NOI (As of)(2): | NAV | |
| Original Term: | 120 months | Most Recent NOI (As of)(2): | NAV | |
| Original Amortization Term: | 360 months | UW Economic Occupancy: | 95.0% | |
| Amortization Type: | Interest Only, Amortizing Balloon | UW Revenues: | $3,809,548 | |
| Call Protection: | L(25),D(88),O(7) | UW Expenses: | $803,663 | |
| Lockbox / Cash Management: | Hard / Springing | UW NOI: | $3,005,886 | |
| Additional Debt: | No | UW NCF: | $2,913,586 | |
| Additional Debt Balance: | N/A | Appraised Value / Per SF: | $42,800,000 / $389 | |
| Additional Debt Type: | N/A | Appraisal Date: | 6/3/2021 | |
| Escrows and Reserves(1) | Financial Information | ||||||||
| Initial | Monthly | Initial Cap | Cut-off Date Loan / SF: | $248 | |||||
| Taxes: | $0 | Springing | N/A | Maturity Date Loan / SF: | $207 | ||||
| Insurance: | $0 | Springing | N/A | Cut-off Date LTV: | 63.8% | ||||
| Replacement Reserves: | $0 | Springing | N/A | Maturity Date LTV: | 53.3% | ||||
| TI/LC Reserve: | $0 | Springing | Various | UW NCF DSCR: | 1.93x | ||||
| Material Tenant Rollover Reserve: | $0 | Springing | Various | UW NOI Debt Yield: | 11.0% | ||||
| Sources and Uses | ||||||
| Sources | Proceeds | % of Total | Uses | Proceeds | % of Total | |
| Mortgage Loan | $27,300,000 | 64.3% | Purchase Price | $42,000,000 | 98.9% | |
| Borrower Sponsors Equity | 15,172,242 | 35.7 | Closing Costs | 472,242 | 1.1 | |
| Total Sources | $42,472,242 | 100.0% | Total Uses | $42,472,242 | 100.0% | |
| (1) | For a full description of Escrows and Reserves, see “Escrows and Reserves” below. |
| (2) | Historical financial information is not available as the Cooper Standard HQ Property (as defined below) was built in 2020 and the borrower sponsors purchased the Cooper Standard HQ Property in July 2021. |
The Loan. The Cooper Standard HQ mortgage loan (the “Cooper Standard HQ Mortgage Loan”) has an original and Cut-off Date principal balance of $27,300,000 and is secured by a first lien mortgage on the borrowers’ fee interest in a 110,165 square foot office property located in Northville, Michigan (the “Cooper Standard HQ Property”). The Cooper Standard HQ Mortgage Loan has a 10-year term and is interest only for the first 24 months of the term, followed by a 30-year amortization period.
The Property. The Cooper Standard HQ Property is a three-story, Class A office building totaling 110,165 square feet located in Northville, Michigan. The Cooper Standard HQ Property was built in 2020 and is situated on approximately 10.2 acres of land. The Cooper Standard HQ Property includes 401 parking spaces (approximately 3.6 parking spaces per 1,000 square feet of NRA). The sole tenant at the Cooper Standard HQ Property is Cooper-Standard Automotive Inc. (“CSA”). CSA invested approximately $10.0 million when building out its space. The Cooper Standard HQ Property serves as the global headquarters for Cooper-Standard Holdings Inc. (“Cooper Standard”) (NYSE: CPS) (S&P: B-).
COVID-19 Update. As of August 20, 2021, the Cooper Standard HQ Property was open and operating. The sole tenant at the Cooper Standard HQ Property, CSA, is current on its rental obligations. As of August 20, 2021, the Cooper Standard HQ Mortgage Loan is not subject to any forbearance, modification or debt service relief requests.
THE INFORMATION IN THIS STRUCTURAL AND COLLATERAL TERM SHEET IS NOT COMPLETE AND MAY BE AMENDED PRIOR TO THE TIME OF SALE. THIS TERM SHEET IS NOT AN OFFER TO SELL THESE SECURITIES AND IT IS NOT A SOLICITATION OF AN OFFER TO BUY THESE SECURITIES IN ANY JURISDICTION WHERE THE OFFER OR SALE IS NOT PERMITTED.
124
| Structural and Collateral Term Sheet | BBCMS 2021-C11 | |
| No. 10 – Cooper Standard HQ | ||
Major Tenant. CSA (110,165 square feet; 100.0% of the NRA; 100.0% of the underwritten base rent): CSA is a wholly-owned subsidiary of Cooper Standard. Cooper Standard, a materials science and manufacturing company, operates in 21 countries with 25,000 employees. Cooper Standard develops materials, systems and components for a wide range of diverse markets including the transportation, building and construction, industrial and consumer goods, recreational vehicles and heavy equipment industries. The lease with CSA commenced on March 1, 2020 and is scheduled to expire on February 28, 2035, with four, five-year renewal options remaining. The lease is guaranteed by CS Intermediate HoldCo 1 LLC, a wholly-owned subsidiary of CSA’s parent company, Cooper Standard.
Environmental. According to a Phase I environmental site assessment dated May 18, 2021, there was no evidence of any recognized environmental conditions at the Cooper Standard HQ Property.
| Historical and Current Occupancy | |||
| 2018(1) | 2019(1) | 2020(2) | Current(3) |
| NAV | NAV | 100.0% | 100.0% |
| (1) | Historical occupancy is not available as the Cooper Standard HQ Property was built in 2020. |
| (2) | 2020 occupancy is based on the lease commencement of the sole tenant at the Cooper Standard HQ Property, CSA, in March 2020. |
| (3) | Current Occupancy is as of July 19, 2021. |
| Top Tenant Summary(1) | |||||||
| Tenant | Ratings Moody’s/S&P/ Fitch(2) | Net Rentable Area (SF) | % of Total NRA | UW Base Rent PSF(3) | UW Base Rent(3) | % of Total UW Base Rent | Lease Exp. Date |
| Cooper-Standard Automotive Inc.(4) | NR/B-/NR | 110,165 | 100.0% | $29.80 | $3,282,579 | 100.0% | 2/28/2035 |
| Occupied Collateral Total | 110,165 | 100.0% | $29.80 | $3,282,579 | 100.0% | ||
| Vacant Space | 0 | 0.0% | |||||
| Collateral Total | 110,165 | 100.0% | |||||
| (1) | Based on the underwritten rent roll dated July 19, 2021. |
| (2) | Ratings provided are for the parent company of the entity listed in the “Tenant” field whether or not the parent company guarantees the lease. |
| (3) | UW Base Rent PSF and UW Base Rent include rent steps totaling $72,233 through March 2022. |
| (4) | CSA has four, five-year renewal options remaining. |
| Lease Rollover Schedule(1) | |||||||||
| Year | Number of Leases Expiring | Net Rentable Area Expiring | % of NRA Expiring | UW Base Rent Expiring(2) | % of UW Base Rent Expiring | Cumulative Net Rentable Area Expiring | Cumulative % of NRA Expiring | Cumulative UW Base Rent Expiring(2) | Cumulative % of UW Base Rent Expiring |
| Vacant | NAP | 0 | 0.0% | NAP | NAP | 0 | 0.0% | NAP | NAP |
| 2021 & MTM | 0 | 0 | 0.0 | $0 | 0.0% | 0 | 0.0% | $0 | 0.0% |
| 2022 | 0 | 0 | 0.0 | 0 | 0.0 | 0 | 0.0% | $0 | 0.0% |
| 2023 | 0 | 0 | 0.0 | 0 | 0.0 | 0 | 0.0% | $0 | 0.0% |
| 2024 | 0 | 0 | 0.0 | 0 | 0.0 | 0 | 0.0% | $0 | 0.0% |
| 2025 | 0 | 0 | 0.0 | 0 | 0.0 | 0 | 0.0% | $0 | 0.0% |
| 2026 | 0 | 0 | 0.0 | 0 | 0.0 | 0 | 0.0% | $0 | 0.0% |
| 2027 | 0 | 0 | 0.0 | 0 | 0.0 | 0 | 0.0% | $0 | 0.0% |
| 2028 | 0 | 0 | 0.0 | 0 | 0.0 | 0 | 0.0% | $0 | 0.0% |
| 2029 | 0 | 0 | 0.0 | 0 | 0.0 | 0 | 0.0% | $0 | 0.0% |
| 2030 | 0 | 0 | 0.0 | 0 | 0.0 | 0 | 0.0% | $0 | 0.0% |
| 2031 | 0 | 0 | 0.0 | 0 | 0.0 | 0 | 0.0% | $0 | 0.0% |
| 2032 & Beyond(3) | 1 | 110,165 | 100.0 | 3,282,579 | 100.0 | 110,165 | 100.0% | $3,282,579 | 100.0% |
| Total | 1 | 110,165 | 100.0% | $3,282,579 | 100.0% | ||||
| (1) | Based on the underwritten rent roll dated July 19, 2021. |
| (2) | UW Base Rent Expiring and Cumulative UW Base Rent Expiring include rent steps totaling $72,233 through March 2022. |
| (3) | The lease with the sole tenant at the Cooper Standard HQ Property, CSA, expires in 2035. |
THE INFORMATION IN THIS STRUCTURAL AND COLLATERAL TERM SHEET IS NOT COMPLETE AND MAY BE AMENDED PRIOR TO THE TIME OF SALE. THIS TERM SHEET IS NOT AN OFFER TO SELL THESE SECURITIES AND IT IS NOT A SOLICITATION OF AN OFFER TO BUY THESE SECURITIES IN ANY JURISDICTION WHERE THE OFFER OR SALE IS NOT PERMITTED.
125
| Structural and Collateral Term Sheet | BBCMS 2021-C11 | |
| No. 10 – Cooper Standard HQ | ||
| Underwritten Net Cash Flow(1) | |||
| Underwritten | Per Square Foot | %(2) | |
| Rents in Place(3) | $3,282,579 | $29.80 | 81.9% |
| Vacant Income | 0 | 0.00 | 0.0 |
| Gross Potential Rent | $3,282,579 | $29.80 | 81.9% |
| Total Reimbursements | 727,472 | 6.60 | 18.1 |
| Net Rental Income | $4,010,051 | $36.40 | 100.0% |
| Other Income | 0 | 0.00 | 0.0 |
| (Vacancy/Credit Loss) | (200,503) | (1.82) | (5.0) |
| Effective Gross Income | $3,809,548 | $34.58 | 95.0% |
| Total Expenses | $803,663 | $7.30 | 21.1% |
| Net Operating Income | $3,005,886 | $27.29 | 78.9% |
| Capital Expenditures | 22,033 | 0.20 | 0.6 |
| TI/LC | 70,266 | 0.64 | 1.8 |
| Net Cash Flow | $2,913,586 | $26.45 | 76.5% |
| (1) | Historical financial information is not available as the Cooper Standard HQ Property was built in 2020 and the borrower sponsors purchased the Cooper Standard HQ Property in July 2021. |
| (2) | % column represents percent of Net Rental Income for all revenue lines and represents percent of Effective Gross Income for the remainder of fields. |
| (3) | Underwritten Rents in Place is based on the underwritten rent roll dated July 19, 2021 with rent steps totaling $72,233 through March 2022. |
The Market. The Cooper Standard HQ Property is located in Northville, Wayne County, Michigan within the Detroit-Warren-Dearborn, MI metropolitan statistical area. With the presence of Ford Motor Company, General Motors Company and Stellantis, the regional economy is known for the automotive industry. These three companies are Cooper Standard’s largest customers by revenue. The automotive industry provides a majority of the employment for the metropolitan area. The economy in Wayne County is driven by the manufacturing, finance/insurance, healthcare/social assistance, public administration and education industries. Major employers include Ford Motor Company, Rocket Company, Henry Ford Health System, City of Detroit and FCA US LLC. Ford Motor Company is the largest employer and has two manufacturing facilities and several dealerships in the area.
The immediate area surrounding the Cooper Standard HQ Property consists of residential, office, industrial and retail uses. Two major interstate highways, I-275 and I-96, are located approximately 1.6 miles and 3.8 miles, respectively, from the Cooper Standard HQ Property. Air transportation is provided by Detroit Metropolitan Wayne County Airport, which is located approximately 19.8 miles from the Cooper Standard HQ Property. Ann Arbor and Detroit are located approximately 22.8 miles and 26.4 miles, respectively, from the Cooper Standard HQ Property.
According to a third-party market report, as of May 26, 2021, the Detroit office market had an inventory of approximately 197.7 million square feet, overall vacancy in the market of approximately 11.2% and average asking rents of $20.91 per square foot. The Cooper Standard HQ Property is located in the Southern Interstate 275 Corridor office submarket. According to a third-party market report, as of May 26, 2021, the Southern Interstate 275 Corridor office submarket had an inventory of approximately 12.4 million square feet, overall vacancy of approximately 11.2% and average asking rents of $19.69 per square foot.
According to a third-party market research provider and excluding the Cooper Standard HQ Property, there are five Class A office properties totaling 213,097 square feet located in Northville, Michigan. Including the Cooper Standard HQ Property within this dataset results in a weighted average vacancy of 5.1% for Class A office properties in Northville, Michigan. The appraiser concluded to a total vacancy and credit loss of 3.5%.
According to a third-party market report, the estimated 2021 population within a one-, three- and five-mile radius of the Cooper Standard HQ Property is 1,391, 41,816 and 102,050, respectively. The estimated 2021 average household income within the same radii is $232,019, $204,378 and $165,476, respectively.
THE INFORMATION IN THIS STRUCTURAL AND COLLATERAL TERM SHEET IS NOT COMPLETE AND MAY BE AMENDED PRIOR TO THE TIME OF SALE. THIS TERM SHEET IS NOT AN OFFER TO SELL THESE SECURITIES AND IT IS NOT A SOLICITATION OF AN OFFER TO BUY THESE SECURITIES IN ANY JURISDICTION WHERE THE OFFER OR SALE IS NOT PERMITTED.
126
| Structural and Collateral Term Sheet | BBCMS 2021-C11 | |
| No. 10 – Cooper Standard HQ | ||
The following table presents certain information relating to comparable office leases for the Cooper Standard HQ Property:
| Comparable Office Leases(1) | ||||||||
| Property Location | Year Built | NRA (SF) | Tenant | Lease Size (SF) | Rent PSF | Commencement | Lease Term (Years) | Lease Type |
| 40300 Traditions Drive Northville, MI | 2020 | 110,165(2) | Cooper-Standard Automotive Inc. | 110,165(2) | $29.80(2) | March-2020 | 15 Yrs. | Triple Net |
| 26555 Northwestern Highway Southfield, MI | 1982 | 218,000 | Marelli North America | 218,000 | $23.20 | May-2021 | 16 Yrs. | Triple Net |
| 17450 College Parkway Livonia, MI | 2017 | 91,220 | MASCO Corporation | 91,220 | $22.10 | September-2017 | 15 Yrs. | Triple Net |
| 770 East Eisenhower Parkway Ann Arbor, MI | 1975 | 290,530 | University of Michigan | 120,518 | $28.00 | May-2019 | 11 Yrs. | Modified Gross |
| 2373 Oak Valley Drive Pittsfield Township, MI | 2018 | 62,585 | Verint | 31,728 | $22.80 | January-2019 | 10 Yrs. | Triple Net |
| 1000 Town Center, Ste 300 Southfield, MI | 1989 | 598,232 | USCAR | 33,880 | $22.48 | July-2020 | 10 Yrs. | Triple Net |
| (1) | Source: Appraisal. |
| (2) | Based on the underwritten rent roll dated July 19, 2021 with rent steps totaling $72,233 through March 2022. |
The following table presents certain information relating to comparable office sales for the Cooper Standard HQ Property:
| Comparable Office Sales(1) | ||||||
| Property Location | Sale Date | Total NRA (SF) | Total Occupancy | Sale Price | Sale Price PSF | Adjusted Sales Price PSF |
| 40300 Traditions Drive Northville, MI | July-2021 | 110,165(2) | 100.0%(2) | $42,000,000 | $381 | NAP |
| 300 West Summit Avenue Charlotte, NC | January-2021 | 63,933 | 87.0% | $28,775,000 | $450 | $383 |
| 1000 Marietta Street Atlanta, GA | January-2020 | 194,000 | 100.0% | $79,330,000 | $409 | $392 |
| 6100 and 6700 Tower Circle Franklin, TN | October-2020 | 550,881 | 95.9% | $200,000,000 | $363 | $367 |
| 1050 Constitution Avenue Philadelphia, PA | January-2020 | 175,000 | 100.0% | $61,200,000 | $350 | $372 |
| 7000 West William Cannon Drive Austin, TX | December-2020 | 136,075 | 100.0% | $50,000,000 | $367 | $367 |
| 200 North Grand Avenue Lansing, MI | July-2020 | 364,180 | 100.0% | $90,974,025 | $250 | $329 |
| (1) | Source: Appraisal. |
| (2) | Based on the underwritten rent roll dated July 19, 2021. |
The Borrowers. The borrowing entities are two tenants-in-common, Novi 730 LLC and Hamilton Northville LLC (collectively, the “Cooper Standard HQ Borrowers”). Each borrowing entity is a special purpose, bankruptcy-remote Delaware limited liability company with one independent director. Legal counsel for the Cooper Standard HQ Borrowers delivered a non-consolidation opinion in connection with the origination of the Cooper Standard HQ Mortgage Loan.
The Borrower Sponsors. The borrower sponsors and guarantors are Sidney A. Borenstein (the “Key Principal”) and Shimmie Horn (together, individually and collectively as the context may require, the “Guarantor”). Sidney A. Borenstein, President and CEO of Hamilton Equity Partners (“Hamilton”), is also the founder of Sid Borenstein & Company, a CPA firm established in 1986 that specializes in real estate syndication, finance and taxes. Sidney A. Borenstein has been an active principal in real estate investments since the late 1980’s. Sidney A. Borenstein has interests ranging from 1% to 100% in over 30 real estate investments, including 16 hotels in New York, six office buildings in New York, North Carolina and South Carolina, two multifamily properties in New York and New Jersey, three nursing home properties in Pennsylvania and Ohio, a charter school in New York, a shopping center in New York and a land parcel in New Jersey. Shimmie Horn, a principal founder of Hamilton, is a seasoned real estate investor and manager. Shimmie Horn has acted as the proprietor of his family’s three generations hotel enterprise since 1994 and has expanded its holdings to include other real estate ventures. Shimmie Horn has interests ranging from 1.5% to 50% in 23 real estate investments, including hotel and residential properties in New York. The principal founders of Hamilton have collectively developed and invested in office buildings, industrial warehouses, multifamily properties, hospitality properties, student housing properties, charter schools, skilled nursing homes and assisted living facilities.
Property Management. The Cooper Standard HQ Property is managed by 1009 LLC, an affiliate of the borrower sponsors.
Escrows and Reserves. At loan origination, the Cooper Standard HQ Borrowers were not required to deposit any initial reserves.
THE INFORMATION IN THIS STRUCTURAL AND COLLATERAL TERM SHEET IS NOT COMPLETE AND MAY BE AMENDED PRIOR TO THE TIME OF SALE. THIS TERM SHEET IS NOT AN OFFER TO SELL THESE SECURITIES AND IT IS NOT A SOLICITATION OF AN OFFER TO BUY THESE SECURITIES IN ANY JURISDICTION WHERE THE OFFER OR SALE IS NOT PERMITTED.
127
| Structural and Collateral Term Sheet | BBCMS 2021-C11 | |
| No. 10 – Cooper Standard HQ | ||
Tax Escrows – For so long as (i) no event of default under the Cooper Standard HQ Mortgage Loan documents has occurred and is continuing, (ii) all of the Cooper Standard HQ Property is demised to CSA pursuant to the CSA lease, (iii) the CSA lease remains in full force and effect, (iv) no Material Tenant Trigger Event (as defined below) has occurred and is continuing, (v) CSA is expressly obligated pursuant to the terms and conditions of the CSA lease to pay all taxes and other charges directly to the applicable governmental authorities in full and in a timely manner and (vi) CSA performs its obligation in a timely manner and the Cooper Standard HQ Borrowers provide written evidence of such performance in a timely manner, no reserves for real estate taxes are required under the Cooper Standard HQ Mortgage Loan documents. If at any time any or all of these conditions are no longer met, the Cooper Standard HQ Mortgage Loan documents provide for ongoing monthly reserves for real estate taxes in an amount equal to 1/12th of the real estate taxes that the lender estimates will be payable during the next 12 months at least 30 days prior to their respective due dates.
Insurance Escrows – For so long as (i) no event of default under the Cooper Standard HQ Mortgage Loan documents has occurred and is continuing, (ii) all of the Cooper Standard HQ Property is demised to CSA pursuant to the CSA lease, (iii) the CSA lease remains in full force and effect, (iv) no Material Tenant Trigger Event has occurred and is continuing, (v) CSA is expressly obligated pursuant to the terms and conditions of the CSA lease to maintain insurance, and with insurance companies, that, in each case, satisfy the requirements set forth in the Cooper Standard HQ Mortgage Loan documents and to pay all insurance premiums required to maintain all such insurance in full force and effect and (vi) CSA performs its obligation in a timely manner and the Cooper Standard HQ Borrowers provide written evidence of such performance in a timely manner, no reserves for insurance premiums are required under the Cooper Standard HQ Mortgage Loan documents. If at any time any or all of these conditions are no longer met, the Cooper Standard HQ Mortgage Loan documents provide for ongoing monthly reserves for insurance premiums in an amount equal to 1/12th of the insurance premiums that the lender estimates will be payable for the renewal of the insurance policies at least 30 days prior to the expiration thereof.
Replacement Reserve – For so long as (i) no event of default under the Cooper Standard HQ Mortgage Loan documents has occurred and is continuing, (ii) all of the Cooper Standard HQ Property is demised to CSA pursuant to the CSA lease, (iii) the CSA lease remains in full force and effect, (iv) neither CSA nor its lease guarantor is downgraded below “B-” or the equivalent by any nationally recognized statistical rating agency, (v) no Material Tenant Trigger Event has occurred and is continuing, (vi) CSA is expressly obligated pursuant to the terms and conditions of the CSA lease to maintain the Cooper Standard HQ Property at its sole cost and expense in the condition required pursuant to the terms and conditions of the Cooper Standard HQ Mortgage Loan documents and (vii) CSA performs its obligation in a timely manner and the Cooper Standard HQ Borrowers provide written evidence of such performance in a timely manner, no reserves for capital expenditures are required under the Cooper Standard HQ Mortgage Loan documents. If at any time any or all of these conditions are no longer met, the Cooper Standard HQ Mortgage Loan documents provide for ongoing monthly reserves of approximately $1,836 for replacement reserves.
TI/LC Reserve – For so long as (i) no event of default under the Cooper Standard HQ Mortgage Loan documents has occurred and is continuing, (ii) all of the Cooper Standard HQ Property is demised to CSA pursuant to the CSA lease, (iii) the CSA lease remains in full force and effect and (iv) neither CSA nor its lease guarantor is downgraded below “B-” or the equivalent by any nationally recognized statistical rating agency, no reserves for tenant allowances, tenant improvement costs and lease commissions are required under the Cooper Standard HQ Mortgage Loan documents. If at any time any or all of these conditions are no longer met, the Cooper Standard HQ Mortgage Loan documents provide for ongoing monthly reserves of approximately $11,476 for tenant allowances, tenant improvement costs and lease commissions.
If a monthly escrow for tenant allowances, tenant improvement costs and lease commissions is required solely as a result of a downgrade of CSA or its lease guarantor and to the extent that a Material Tenant Trigger Event with respect to CSA (or its lease or lease guarantor) has occurred and remains outstanding, and such Material Tenant Trigger Event consists solely of a Material Tenant Downgrade Trigger Event (as defined below) relating to CSA (or its lease or lease guarantor) (it being understood and agreed that if any other Material Tenant Trigger Event has occurred and remains outstanding with respect to CSA (or its lease or lease guarantor), the limitations set forth in clauses (a) and (b) will not apply), then (a) the aggregate amount on deposit in the TI/LC reserve and the Material Tenant (as defined below) rollover reserve sub-account for CSA may not exceed $15.00 per square foot of CSA's rentable square footage; provided that CSA or its lease guarantor, as the case may be, is not rated lower than "CCC" or the equivalent by any nationally recognized statistical rating agency, and (b) the aggregate amount on deposit in the TI/LC reserve and the Material Tenant rollover reserve sub-account for CSA may not exceed $30.00 per square foot of CSA's rentable square footage; provided that CSA or its lease guarantor, as the case may be, is rated lower than "CCC" or the equivalent by any nationally recognized statistical rating agency.
Material Tenant Rollover Reserve – On a monthly basis during a Material Tenant Trigger Event, excess funds are required to be escrowed as detailed in the section below.
If a Material Tenant Downgrade Trigger Event is and remains the sole Material Tenant Trigger Event relating to any Material Tenant (or its lease or lease guarantor) and such Material Tenant or its lease guarantor is downgraded below "CCC+" or the equivalent, but not below "CCC" or the equivalent, by any nationally recognized statistical rating agency (a "Material Tenant Category 1 Downgrade Trigger Event"), 75.0% of the excess funds are required to be deposited into the Material Tenant rollover reserve sub-account relating to such Material Tenant; provided that the aggregate amount deposited into the Material Tenant rollover reserve sub-account for such Material Tenant may not exceed $15.00 per square foot of such Material Tenant's rentable square footage and (ii) if a Material Tenant Downgrade Trigger Event is and remains the sole Material Tenant Trigger Event relating to any Material Tenant (or its lease or lease guarantor) and such Material Tenant or its lease guarantor is downgraded below "CCC" or the equivalent by any nationally recognized
THE INFORMATION IN THIS STRUCTURAL AND COLLATERAL TERM SHEET IS NOT COMPLETE AND MAY BE AMENDED PRIOR TO THE TIME OF SALE. THIS TERM SHEET IS NOT AN OFFER TO SELL THESE SECURITIES AND IT IS NOT A SOLICITATION OF AN OFFER TO BUY THESE SECURITIES IN ANY JURISDICTION WHERE THE OFFER OR SALE IS NOT PERMITTED.
128
| Structural and Collateral Term Sheet | BBCMS 2021-C11 | |
| No. 10 – Cooper Standard HQ | ||
statistical rating agency (a "Material Tenant Category 2 Downgrade Trigger Event"), 100.0% of the excess funds are required to be deposited into the Material Tenant rollover reserve sub-account relating to such Material Tenant; provided that the aggregate amount deposited into the Material Tenant rollover reserve sub-account for such Material Tenant may not exceed $30.00 per SF of such Material Tenant's rentable square footage. The Cooper Standard HQ Borrowers have the right to deliver cash or a letter of credit in an amount equal to the applicable Material Tenant Downgrade Trigger Event cap amount to prevent or suspend a cash flow sweep based solely on a Material Tenant Downgrade Trigger Event.
Lockbox / Cash Management. The Cooper Standard HQ Mortgage Loan is structured with a hard lockbox and springing cash management upon the occurrence and continuance of a Cash Management Trigger Event (as defined below). During the term of the Cooper Standard HQ Mortgage Loan, the Cooper Standard HQ Borrowers are required to deliver written instructions to all existing and future tenants directing them to deposit all rents payable under leases directly into a lender-controlled lockbox account. The Cooper Standard HQ Mortgage Loan documents require that all rents received by the Cooper Standard HQ Borrowers or the property manager be deposited into the lockbox account within one business day of receipt. During the continuance of a Cash Management Trigger Event, all funds in the lockbox account are required to be swept each business day to a lender-controlled cash management account and disbursed in accordance with the Cooper Standard HQ Mortgage Loan documents, and excess funds on deposit in the cash management account (after payments of required monthly reserve deposits, debt service payment on the Cooper Standard HQ Mortgage Loan, operating expenses and cash management bank fees) will be applied as follows: (a) if a Material Tenant Trigger Event has occurred and is continuing, to a Material Tenant rollover reserve, (b) if a Cash Sweep Period (as defined below) has occurred and is continuing, to an excess cash flow account or (c) if no Material Tenant Trigger Event or Cash Sweep Period has occurred and is continuing, to the Cooper Standard HQ Borrowers.
A “Cash Management Trigger Event” will commence upon the earliest to occur of (i) an event of default under the Cooper Standard HQ Mortgage Loan documents, (ii) a bankruptcy action of the Cooper Standard HQ Borrowers, the Guarantor, the Key Principal or the property manager, (iii) as of any date, the debt service coverage ratio being less than 1.15x, (iv) an indictment for fraud or misappropriation of funds by the Cooper Standard HQ Borrowers, the Guarantor, the Key Principal or the property manager (provided, that in the case of a third party property manager, such indictment is related to the Cooper Standard HQ Property), (v) a Material Tenant Trigger Event, or (vi) an event of default under the Approved Mezzanine Loan (as defined below) documents. A Cash Management Trigger Event will end upon the occurrence of: with regard to clause (i) above, the end of such event of default; with regard to clause (ii) above, the filing being discharged, stayed or dismissed within 45 days for the Cooper Standard HQ Borrowers, the Guarantor or the Key Principal, or within 120 days for the property manager, and the lender’s determination that such filing does not materially affect the Cooper Standard HQ Borrowers’, the Guarantor’s, the Key Principal’s or the property manager’s monetary obligations, or the property manager is replaced with a manager acceptable to the lender; with regard to clause (iii) above, the debt service coverage ratio being equal to or greater than 1.20x for two consecutive calendar quarters; with regard to clause (iv) above, the dismissal of the applicable indictment, the acquittal of each applicable person with respect to the related charge(s) or the replacement of the affiliated property manager with a qualified property manager under a replacement property management agreement; with regard to clause (v) above, the cure of such Material Tenant Trigger Event; or with regard to clause (vi) above, the end of such event of default.
A “Cash Sweep Period” will commence upon the earliest to occur of (i) an event of default under the Cooper Standard HQ Mortgage Loan documents, (ii) a bankruptcy action of the Cooper Standard HQ Borrowers, the Guarantor, the Key Principal or the affiliated property manager, (iii) as of any date, the debt service coverage ratio being less than 1.10x, or (iv) an event of default under the Approved Mezzanine Loan documents. A Cash Sweep Period will end upon the occurrence of: with regard to clause (i) above, the end of such event of default; with regard to clause (ii) above, the filing being discharged, stayed or dismissed within 90 days for the Cooper Standard HQ Borrowers, the Guarantor or the Key Principal, or within 120 days for the affiliated property manager, and the lender’s determination that such filing does not materially affect the Cooper Standard HQ Borrowers’, the Guarantor’s, the Key Principal’s or the affiliated property manager’s monetary obligations, or the affiliated property manager is replaced with a manager acceptable to the lender; with regard to clause (iii) above, the debt service coverage ratio being equal to or greater than 1.15x for two consecutive calendar quarters; or with regard to clause (iv) above, the end of such event of default.
A “Material Tenant Trigger Event” will commence upon the earliest to occur of (i) a Material Tenant giving notice of its intention to terminate or not to extend or renew its lease, (ii) on or prior to the date that is 12 months prior to the expiration date of a Material Tenant’s lease, the related Material Tenant failing to extend or renew its lease, (iii) on or prior to the date on which a Material Tenant is required under its lease to provide notification of its election to renew its lease, such Material Tenant failing to give such notice, (iv) an event of default under a Material Tenant lease that continues beyond any applicable notice and cure period, (v) any Material Tenant or any guarantor of the applicable Material Tenant lease becoming insolvent or a debtor in any bankruptcy action, (vi) a Material Tenant lease being terminated (in whole or in part, including in connection with the exercise of any contraction option), (vii) any Material Tenant “going dark”, vacating or ceasing to occupy or conduct business at its space or a portion thereof; provided, that in connection with any such event or occurrence or a series of such events or occurrences with respect to a portion of such Material Tenant’s lease premises at the Cooper Standard HQ Property, the applicable Material Tenant “goes dark”, vacates or ceases to occupy or conduct business at 20.0% or more of the total rentable square footage demised to such Material Tenant at the Cooper Standard HQ Property pursuant to such Material Tenant lease, or (viii) if the long term unsecured debt rating of a Material Tenant or a lease guarantor of such Material Tenant lease is less than “CCC+” by S&P or the equivalent by a nationally recognized statistical rating agency, to the extent such entity is rated. A Material Tenant Trigger Event will end upon the occurrence of: with regard to clause (i) above, (a) the revocation or rescission by the
THE INFORMATION IN THIS STRUCTURAL AND COLLATERAL TERM SHEET IS NOT COMPLETE AND MAY BE AMENDED PRIOR TO THE TIME OF SALE. THIS TERM SHEET IS NOT AN OFFER TO SELL THESE SECURITIES AND IT IS NOT A SOLICITATION OF AN OFFER TO BUY THESE SECURITIES IN ANY JURISDICTION WHERE THE OFFER OR SALE IS NOT PERMITTED.
129
| Structural and Collateral Term Sheet | BBCMS 2021-C11 | |
| No. 10 – Cooper Standard HQ | ||
applicable Material Tenant of all termination or cancellation notices with respect to such Material Tenant lease, (b) an acceptable Material Tenant lease extension with respect to the applicable Material Tenant space, or (c) all of the applicable Material Tenant space being leased to a replacement tenant; with regard to clauses (ii) and (iii) above, (x) an acceptable Material Tenant lease extension with respect to such Material Tenant space or (y) all of the applicable Material Tenant space being leased to a replacement tenant; with regard to clause (iv) above, a cure of the applicable event of default under the applicable Material Tenant lease; with regard to clause (v) above, an affirmation of the Material Tenant lease in the applicable bankruptcy proceeding and confirmation that the Material Tenant is actually paying all rents and other amounts due under its lease; with regard to clause (vi) above, all of the applicable Material Tenant space being leased to a replacement tenant; with regard to clause (vii) above, the applicable Material Tenant having re-commenced its operations and no longer being dark, and having not vacated or ceased to conduct business at 20.0% or more of the total rentable square footage demised to such Material Tenant at the Cooper Standard HQ Property pursuant to such Material Tenant lease; or with regard to clause (viii) above, the long term unsecured debt rating of the applicable Material Tenant or the applicable lease guarantor is subsequently raised or otherwise modified such that it is at least “CCC+” by S&P or the equivalent by a nationally recognized statistical rating agency if such entity is rated.
A “Material Tenant” means CSA or any other tenant whose lease, either individually or when taken together with any other lease with the same tenant or affiliate tenant, (x) covers no less than 20.0% of the total rentable square footage of the Cooper Standard HQ Property or (y) requires the payment of base rent that is no less than 20.0% of the total in-place base rent at the Cooper Standard HQ Property.
A “Material Tenant Downgrade Trigger Event” means, individually and/or collectively, as the context may require, a Material Tenant Category 1 Downgrade Trigger Event or a Material Tenant Category 2 Downgrade Trigger Event.
Subordinate and Mezzanine Debt. The Cooper Standard HQ Mortgage Loan documents permit an affiliate of the Cooper Standard HQ Borrowers to incur future mezzanine debt (the “Approved Mezzanine Loan”) subject to satisfaction of certain conditions, including: (i) the execution of an intercreditor agreement in form and substance reasonably acceptable to the lender; (ii) based on the Cooper Standard HQ Mortgage Loan and the mezzanine loan, (a) the combined loan-to-value ratio is not greater than 65.0%, (b) the debt yield is not less than 10.7% and (c) the debt service coverage ratio is not less than 1.93x; and (iii) receipt of a rating agency confirmation.
Partial Release. Not permitted.
Ground Lease. None.
THE INFORMATION IN THIS STRUCTURAL AND COLLATERAL TERM SHEET IS NOT COMPLETE AND MAY BE AMENDED PRIOR TO THE TIME OF SALE. THIS TERM SHEET IS NOT AN OFFER TO SELL THESE SECURITIES AND IT IS NOT A SOLICITATION OF AN OFFER TO BUY THESE SECURITIES IN ANY JURISDICTION WHERE THE OFFER OR SALE IS NOT PERMITTED.
130
(THIS PAGE INTENTIONALLY LEFT BLANK)
THE INFORMATION IN THIS STRUCTURAL AND COLLATERAL TERM SHEET IS NOT COMPLETE AND MAY BE AMENDED PRIOR TO THE TIME OF SALE. THIS TERM SHEET IS NOT AN OFFER TO SELL THESE SECURITIES AND IT IS NOT A SOLICITATION OF AN OFFER TO BUY THESE SECURITIES IN ANY JURISDICTION WHERE THE OFFER OR SALE IS NOT PERMITTED.
131
| Structural and Collateral Term Sheet | BBCMS 2021-C11 | |
| No. 11 – 356-362 E 148th Street | ||
| Mortgage Loan Information | Property Information | |||
| Mortgage Loan Seller: | Barclays | Single Asset / Portfolio: | Single Asset | |
| Original Principal Balance(1): | $24,000,000 | Title: | Fee | |
| Cut-off Date Principal Balance(1): | $24,000,000 | Property Type – Subtype: | Office - CBD | |
| % of IPB: | 2.4% | Net Rentable Area (SF)(3): | 80,169 | |
| Loan Purpose: | Refinance | Location: | Bronx, NY | |
| Borrowers: | CSB Courtlandt LLC and CSB Lessee LLC | Year Built / Renovated: | 2021 / NAP | |
| Borrower Sponsors: | Justin Stern, Evan Stern, Henry Hewes, Fredric Roy Schoenberg and Gary Spindler | Occupancy: | 97.2% | |
| Interest Rate: | 3.90000% | Occupancy Date: | 7/15/2021 | |
| Note Date: | 7/22/2021 | 4th Most Recent NOI (As of)(4): | NAV | |
| Maturity Date: | 8/6/2031 | 3rd Most Recent NOI (As of)(4): | NAV | |
| Interest-only Period: | 120 months | 2nd Most Recent NOI (As of)(4): | NAV | |
| Original Term: | 120 months | Most Recent NOI (As of)(4): | NAV | |
| Original Amortization Term: | None | UW Economic Occupancy: | 95.0% | |
| Amortization Type: | Interest Only | UW Revenues: | $2,767,709 | |
| Call Protection(2): | L(25),D(91),O(4) | UW Expenses: | $88,831 | |
| Lockbox / Cash Management: | Hard / Springing | UW NOI: | $2,678,878 | |
| Additional Debt(1): | Yes | UW NCF: | $2,526,326 | |
| Additional Debt Balance(1): | $14,000,000 | Appraised Value / Per SF: | $54,400,000 / $679 | |
| Additional Debt Type(1): | Pari Passu | Appraisal Date: | 4/28/2021 | |
| Escrows and Reserves(5) | Financial Information(1) | ||||||
| Initial | Monthly | Initial Cap | Cut-off Date Loan / SF: | $474 | |||
| Taxes: | $771 | $385 | N/A | Maturity Date Loan / SF: | $474 | ||
| Insurance: | $21,023 | $7,008 | N/A | Cut-off Date LTV: | 69.9% | ||
| Replacement Reserves(5): | $0 | Springing | N/A | Maturity Date LTV: | 69.9% | ||
| TI/LC(6): | $0 | Springing | N/A | UW NCF DSCR: | 1.68x | ||
| Free Rent Reserve: | $436,317 | $0 | N/A | UW NOI Debt Yield: | 7.0% | ||
| Sources and Uses | |||||||
| Sources | Proceeds | % of Total | Uses | Proceeds | % of Total | ||
| Whole Loan(1) | $38,000,000 | 100.0% | Payoff Existing Debt(7) | $25,275,122 | 66.5% | ||
| Return of Equity | 9,991,581 | 26.3 | |||||
| Closing Costs(8) | 2,275,186 | 6.0 | |||||
| Upfront Reserves | 458,111 | 1.2 | |||||
| Total Sources | $38,000,000 | 100.0% | Total Uses | $38,000,000 | 100.0% | ||
| (1) | The 356-362 E 148th Street Mortgage Loan (as defined below) is part of a whole loan evidenced by two pari passu promissory notes with an aggregate original principal balance of $38,000,000. The financial information presented in the chart above reflects the Cut-off Date or Maturity Date balance of the 356-362 E 148th Street Whole Loan (as defined below). |
| (2) | Defeasance of the 356-362 E 148th Street Whole Loan is permitted at any time after the date that is the earlier to occur of (i) two years after the closing date of the securitization that includes the last note to be securitized and (ii) July 22, 2024. The assumed defeasance lockout period of 25 payments is based on the anticipated closing date of the BBCMS 2021-C11 securitization trust in September 2021. The actual lockout period may be longer. |
| (3) | Net Rentable Area is comprised of 67,652 square feet of office space and 12,517 square feet of below grade parking pace. |
| (4) | Historical financials are not available as the 356-362 E 148th Street Property was built in 2021. |
| (5) | During the continuance of a Trigger Period (as defined below) the borrowers will be required to escrow approximately $1,670 (equal to approximately $0.25 per square foot per annum) on a monthly basis for replacement reserves. A “Trigger Period” will commence upon any of the following: (i) the occurrence of an event of default, (ii) as of any calculation date, the debt service coverage ratio being less than 1.10x assuming a 30-year amortization schedule (1.57x is the interest-only debt service coverage ratio equivalent), or (iii) the occurrence of a Samaritan Trigger Event. A “Samaritan Trigger Event” will commence upon any of the following: (i) Samaritan Village giving notice that it is terminating its lease, (ii) Samaritan Village has abandoned, vacated or fails to operate in 30% or more of its leased space (a “Samaritan Go Dark Event”), provided however that a Samaritan Go Dark Event shall not be a Samaritan Trigger Event if, among other things outlined in the 356-362 E 148th Street Whole Loan documents, such Samaritan Go Dark Event is the result of complying with a mandatory stay-at-home order, (iii) Samaritan Village (or its parent or any guarantor of its lease) files for bankruptcy, (iv) Samaritan Village’s lease is terminated, amended or restated without obtaining prior written consent of the lender, or (v) Samaritan Village is in default under its lease past the applicable cure periods. |
THE INFORMATION IN THIS STRUCTURAL AND COLLATERAL TERM SHEET IS NOT COMPLETE AND MAY BE AMENDED PRIOR TO THE TIME OF SALE. THIS TERM SHEET IS NOT AN OFFER TO SELL THESE SECURITIES AND IT IS NOT A SOLICITATION OF AN OFFER TO BUY THESE SECURITIES IN ANY JURISDICTION WHERE THE OFFER OR SALE IS NOT PERMITTED.
132
| Structural and Collateral Term Sheet | BBCMS 2021-C11 | |
| No. 11 – 356-362 E 148th Street | ||
| (6) | During the continuance of a Trigger Period the 356-362 E 148th Street borrowers will be required escrow approximately $10,021 (equal to approximately $1.50 per square foot per annum) on a monthly basis for TI/LC reserves. |
| (7) | Includes $1,043,000 of costs related to the prepayment of the existing debt. |
| (8) | Closing Costs include a $509,296 development fee. |
The Loan. The 356-362 E 148th Street mortgage loan (the “356-362 E 148th Street Mortgage Loan”) is part of a whole loan evidenced by two pari passu promissory notes with an aggregate original principal balance of $38,000,000 (the “356-362 E 148th Street Whole Loan”). The 356-362 E 148th Street Whole Loan is secured by a first lien mortgage encumbering the 356-362 E 148th Street borrowers’ fee and leasehold interest in a 67,652 square foot, newly-built Class A office building and 12,517 square foot below grade parking area serving the office building located in the Bronx, New York (together, the “356-362 E 148th Street Property”). The controlling Note A-1 with an aggregate original principal balance of $24,000,000, will be included in the BBCMS 2021-C11 securitization trust. The non-controlling note A-2 is currently held by an affiliate of Barclays and is expected to be contributed to one or more future securitization trust. The 356-362 E 148th Street Whole Loan will be serviced pursuant to the pooling and servicing agreement for the BBCMS 2021-C11 trust. See “Description of the Mortgage Pool—The Whole Loans— The Serviced Pari Passu Whole Loans” and “Pooling and Servicing Agreement” in the Preliminary Prospectus.
| Whole Loan Summary | |||
| Note | Original Balance | Note Holder | Controlling Piece |
| A-1 | $24,000,000 | BBCMS 2021-C11 | Yes |
| A-2 | $14,000,000 | An affiliate of Barclays | No |
| Total | $38,000,000 | ||
The Property. The 356-362 E 148th Street Property is a six-story, 80,169 square foot, Class A office building located in the Bronx, New York. Situated on an approximately 0.3-acre site with a 12,517 square foot below grade parking area that has a total of 67 parking spots, the 356-362 E 148th Street Property has a parking ratio of 0.84 parking space per 1,000 square feet of net rentable area. The 67 parking spaces are composed of 29 paved spaces with double height stackers and 9 standard paved spaces. A portion of the 356-362 E 148th Street Property was acquired in 2015 and the remainder was acquired in 2019, and the borrower sponsors completed the approximately $36.0 million development in 2021. As of July 15, 2021, the 356-362 E 148th Street Property is 81.6% leased to Samaritan Village (96.7% excluding parking net rentable area), a not for profit provider of comprehensive health and human services in New York City. The 65,399 square foot portion of 356-362 E 148th Street Property leased to Samaritan Village is expected to be home to The Richard Pruss Wellness Center. Samaritan Village plans for The Richard Pruss Wellness Center to be a one-stop shop for the behavioral and primary health care services that they provide to the community. Due to the nature of Samaritan Village’s use of the property, a portion of the 356-362 E 148th Street Property will be used for medical services, and the other areas of the building, which are not intended for pure medical use and/or parking, will be healthcare related, and include above average level of buildout as compared to traditional/professional office use.
CSB Courtlandt LLC acquired the subject land in 2015 and 2019. In order to develop the 356-362 E 148th Street Property under the opportunity zone program, CSB Courtlandt LLC ground leased the 356-362 E 148th Street Property to CSB Lessee LLC. CSB Lessee LLC subsequently bifurcated its leasehold interest into a garage condominium unit and a condominium unit 100% leased to Samaritan Village, a 501(c)(3) non-profit organization. Samaritan Village intends to create its own leasehold condominium structure within its condominium unit, which NYC’s Department of Finance treats as Samaritan Village’s ownership, granting Samaritan Village a 100.0% real property tax exemption with respect to the unit leased to the Samaritan Village. CSB Courtlandt LLC wholly owns the fee simple interest in the 356-362 E 148th Street Property and CSB Lessee LLC wholly owns the leasehold interest in the 356-362 E 148th Street Property, and both the fee simple and leasehold interests are collateral for the 356-362 E 148th Street Whole Loan.
COVID-19 Update. As of September 1, 2021, the 356-362 E 148th Street Property is open, and according to the borrower sponsors, Samaritan Village has been phasing into its space since the middle of August. Samaritan Village and CSB Parking LLC have not requested rent relief, rent deferral, or any other lease modifications. As of the date of this term sheet, the 356-362 E 148th Street Whole Loan is not subject to any forbearance, modification, or debt service relief requests.
Historical and Current Occupancy | |||
| 2018(1) | 2019(1) | 2020(1) | Current(2) |
| NAP | NAP | NAP | 97.2% |
| (1) | Historical occupancy is not available as the 356-362 E 148th Street Property was completed in 2021. |
| (2) | Current Occupancy is as of July 15, 2021. |
THE INFORMATION IN THIS STRUCTURAL AND COLLATERAL TERM SHEET IS NOT COMPLETE AND MAY BE AMENDED PRIOR TO THE TIME OF SALE. THIS TERM SHEET IS NOT AN OFFER TO SELL THESE SECURITIES AND IT IS NOT A SOLICITATION OF AN OFFER TO BUY THESE SECURITIES IN ANY JURISDICTION WHERE THE OFFER OR SALE IS NOT PERMITTED.
133
| Structural and Collateral Term Sheet | BBCMS 2021-C11 | |
| No. 11 – 356-362 E 148th Street | ||
Major Tenant. Samaritan Village (65,399 square feet; 81.6% of NRA; 94.6% of underwritten base rent). Samaritan Village is a 501(c)(3) non-profit organization that was founded in 1960. Samaritan Village has spent over 60 years helping New Yorkers improve the quality of their lives through treatment of substance use and mental health disorders, transitional and supportive housing, and specialized services for veterans, seniors and families. Samaritan Village annually serves over 33,000 New Yorkers in need with more than 60 locations throughout 10 counties including New York City, Long Island and the lower Hudson Valley. Samaritan Village anticipates that more than 6,000 individuals will visit The Richard Pruss Wellness Center annually. Samaritan Village will offer a range of behavioral health services at the 356-362 E 148th Street Property, and with multiple programs under one roof, clients no longer need to travel across different locations to benefit from multiple healthcare specialties.
Samaritan Village’s lease expires on July 14, 2051, and Samaritan Village has one, ten-year renewal option at fair market rent with at least 18 months’ notice. Samaritan Village pays base rent of $40.52 per square foot on a 63,753 square foot portion of the space and $21.20 per square foot on the remaining 1,656 square foot portion. Samaritan Village’s entire 65,399 square foot is on a triple-net lease and Samaritan Village is required to reimburse the borrowers for all expenses. The lease also includes 2.0% annual rent escalations and has no termination options.
The Market. The 356-362 E 148th Street Property is located in the Morrisania/Longwood neighborhood of the Bronx, New York. According to the appraiser, the 356-362 E 148th Street Property is located in the OuterBorough market and the Bronx submarket. The surrounding area is viewed urban, with the immediate vicinity of the 356-362 E 148th Street Property predominantly composed of a mixture of retail, mixed commercial uses and residential. Access to the 356-362 E 148th Street Property is provided by Third Avenue in a north/south direction and East 149th Street in an east/west direction. Highway access is provided by either the Major Deegan Expressway to the west, or the Bruckner Expressway to the east. Additionally, access to the 2 and 5 MTA trains is available at the 3rd Avenue – 149th Street MTA station which is approximately one block from the 356-362 E 148th Street Property. Bus service is also available along Third Avenue with a stop adjacent to the 356-362 E 148th Street Property.
According to the appraisal, as of the fourth quarter of 2020, the OuterBorough office market had an inventory of approximately 101.2 million square feet, overall vacancy in the market of 11.7% and direct asking rent of $38.36. As of the fourth quarter of 2020, the Bronx office submarket had an inventory of approximately 12.9 million square feet, overall vacancy of 8.5% and direct asking rent of $35.58. The estimated 2020 population within a 0.5-, 1- and 1.5-mile radius was 43,545, 163,404 and 379,264, respectively. According to the appraisal, the estimated 2020 median household income within a 0.5-, 1- and 1.5-mile radius was $21,457, $27,132 and $29,118, respectively.
| Tenant Summary(1) | |||||||
| Tenant | Ratings S&P/ Fitch | Net Rentable Area (SF) | % of Total NRA | UW Base Rent PSF(2) | UW Base Rent(2) | % of Total UW Base Rent | Lease Exp. Date |
| Samaritan Village | NR/NR/NR | 65,399 | 81.6% | $40.83 | $2,670,258 | 94.6% | 7/14/2051(3) |
| Major Tenant Total | 65,399 | 81.6% | $40.83 | $2,670,258 | 94.6% | ||
| CSB Parking LLC(4) | NR/NR/NR | 12,517 | 15.6% | $12.22 | $153,000 | 5.4% | 7/20/2051 |
| Occupied Collateral Total | 77,916 | 97.2% | $36.23 | $2,823,258 | 100.0% | ||
| Vacant Space | 2,253 | 2.8% | |||||
| Collateral Total | 80,169 | 100.0% | |||||
| (1) | Based on the underwritten rent roll dated July 15, 2021. |
| (2) | UW Base Rent PSF and UW Base Rent are inclusive of contractual rent steps through September 2022. |
| (3) | Samaritan Village has one, 10-year renewal option. |
| (4) | CSB Parking LLC, an affiliate of the borrower sponsors, leases and operates the 12,517 square feet of parking space at the 356-362 E 148th Street Property. CSB Parking LLC is required to pay an annual rent of $150,000 with 2.0% annual rent escalations. |
THE INFORMATION IN THIS STRUCTURAL AND COLLATERAL TERM SHEET IS NOT COMPLETE AND MAY BE AMENDED PRIOR TO THE TIME OF SALE. THIS TERM SHEET IS NOT AN OFFER TO SELL THESE SECURITIES AND IT IS NOT A SOLICITATION OF AN OFFER TO BUY THESE SECURITIES IN ANY JURISDICTION WHERE THE OFFER OR SALE IS NOT PERMITTED.
134
| Structural and Collateral Term Sheet | BBCMS 2021-C11 | |
| No. 11 – 356-362 E 148th Street | ||
| Lease Rollover Schedule(1) | |||||||||
| Year | Number of Leases Expiring | Net Rentable Area Expiring | % of NRA Expiring | UW Rent Expiring(2) | % of UW Rent Expiring | Cumulative Net Rentable Area Expiring | Cumulative % of NRA Expiring | Cumulative UW Rent Expiring(2) | Cumulative % of UW Rent Expiring |
| Vacant | NAP | 2,253 | 2.8% | NAP | NAP | 2,253 | 2.8% | NAP | NAP |
| 2021 | 0 | 0 | 0.0 | $0 | 0.0 | 2,253 | 2.8% | $0 | 0.0% |
| 2022 | 0 | 0 | 0.0 | 0 | 0.0 | 2,253 | 2.8% | $0 | 0.0% |
| 2023 | 0 | 0 | 0.0 | 0 | 0.0 | 2,253 | 2.8% | $0 | 0.0% |
| 2024 | 0 | 0 | 0.0 | 0 | 0.0 | 2,253 | 2.8% | $0 | 0.0% |
| 2025 | 0 | 0 | 0.0 | 0 | 0.0 | 2,253 | 2.8% | $0 | 0.0% |
| 2026 | 0 | 0 | 0.0 | 0 | 0.0 | 2,253 | 2.8% | $0 | 0.0% |
| 2027 | 0 | 0 | 0.0 | 0 | 0.0 | 2,253 | 2.8% | $0 | 0.0% |
| 2028 | 0 | 0 | 0.0 | 0 | 0.0 | 2,253 | 2.8% | $0 | 0.0% |
| 2029 | 0 | 0 | 0.0 | 0 | 0.0 | 2,253 | 2.8% | $0 | 0.0% |
| 2030 | 0 | 0 | 0.0 | 0 | 0.0 | 2,253 | 2.8% | $0 | 0.0% |
| 2031 | 0 | 0 | 0.0 | 0 | 0.0 | 2,253 | 2.8% | $0 | 0.0% |
| 2032 & Beyond | 2 | 77,916 | 97.2% | $2,823,258 | 100.0 | 80,169 | 100.0% | $2,823,258 | 100.0% |
| Total | 2 | 80,169 | 100.0% | $2,823,258 | 100.0% | ||||
| (1) | Based on underwritten rent roll dated July 15, 2021. |
| (2) | UW Rent Expiring and Cumulative UW Rent Expiring include contractual rent steps through September 2022. |
| Operating History and Underwritten Net Cash Flow(1) | |||
| Underwritten | Per Square Foot | %(2) | |
| Base Rent | $2,767,900 | $34.53 | 95.0% |
| Rent Steps | 55,358 | 0.69 | 1.9 |
| Vacant Income | 90,120 | 1.12 | 3.1 |
| Gross Potential Rent | $2,913,378 | $36.34 | 100.0% |
| Total Reimbursements | 0 | 0.00 | 0.0 |
| Net Rental Income | $2,913,378 | $36.34 | 100.0% |
| (Vacancy/Credit Loss) | (145,669) | (1.82) | (5.0) |
| Effective Gross Income | $2,767,709 | $34.52 | 95.0% |
| Total Expenses | $88,831 | $1.11 | 3.2% |
| Net Operating Income | $2,678,878 | $33.42 | 96.8% |
| Total TI/LC, Capex/RR | 152,552 | 1.90 | 5.5 |
| Net Cash Flow | $2,526,326 | $31.51 | 91.3% |
| (1) | Historical financials are not available as the 356-362 E 148th Street Property was completed in 2021. |
| (2) | % column represents percent of Net Rental Income for all revenue lines and represents percent of Effective Gross Income for the remainder of fields. |
THE INFORMATION IN THIS STRUCTURAL AND COLLATERAL TERM SHEET IS NOT COMPLETE AND MAY BE AMENDED PRIOR TO THE TIME OF SALE. THIS TERM SHEET IS NOT AN OFFER TO SELL THESE SECURITIES AND IT IS NOT A SOLICITATION OF AN OFFER TO BUY THESE SECURITIES IN ANY JURISDICTION WHERE THE OFFER OR SALE IS NOT PERMITTED.
135
| Structural and Collateral Term Sheet | BBCMS 2021-C11 | |
| No. 12 – Murrieta Spectrum | ||
Mortgage Loan Information | Property Information | |||
| Mortgage Loan Seller: | UBS AG | Single Asset / Portfolio: | Single Asset | |
| Original Principal Balance: | $23,030,000 | Title: | Fee | |
| Cut-off Date Principal Balance: | $23,030,000 | Property Type – Subtype: | Mixed Use – Retail / Office | |
| % of IPB: | 2.3% | Net Rentable Area (SF): | 172,357 | |
| Loan Purpose: | Refinance | Location: | Murrieta, CA | |
| Borrower: | Murrieta Spectrum, L.P. | Year Built / Renovated: | 2005 / NAP | |
| Borrower Sponsors: | Ming Yang Lee, Tsu Ho Lee and Steve Chengche Chou | Occupancy(1): | 94.8% | |
| Interest Rate: | 3.73000% | Occupancy Date(1): | 8/19/2021 | |
| Note Date: | 8/27/2021 | 4th Most Recent NOI (As of): | $1,965,902 (12/31/2018) | |
| Maturity Date: | 9/6/2031 | 3rd Most Recent NOI (As of): | $2,007,378 (12/31/2019) | |
| Interest-only Period: | None | 2nd Most Recent NOI (As of): | $1,842,672 (12/31/2020) | |
| Original Term: | 120 months | Most Recent NOI (As of)(2): | $2,137,347 (TTM 7/31/2021) | |
| Original Amortization Term: | 360 months | UW Economic Occupancy: | 93.7% | |
| Amortization Type: | Amortizing Balloon | UW Revenues: | $3,876,899 | |
| Call Protection: | L(12),YM1(104),O(4) | UW Expenses: | $1,117,934 | |
| Lockbox / Cash Management: | Hard / Springing | UW NOI(2): | $2,758,965 | |
| Additional Debt: | No | UW NCF: | $2,624,421 | |
| Additional Debt Balance: | N/A | Appraised Value / Per SF: | $45,250,000 / $263 | |
| Additional Debt Type: | N/A | Appraisal Date: | 4/22/2021
| |
| Escrows and Reserves | Financial Information | |||||||
| Initial | Monthly | Initial Cap | Cut-off Date Loan / SF: | $134 | ||||
| Taxes: | $288,488 | $43,710 | N/A | Maturity Date Loan / SF: | $105 | |||
| Insurance: | $13,903 | $3,022 | N/A | Cut-off Date LTV: | 50.9% | |||
| Replacement Reserves: | $300,000 | Springing(3) | N/A | Maturity Date LTV: | 40.0% | |||
| TI/LC Reserve: | $500,000 | $10,793 | N/A | UW NCF DSCR: | 2.06x | |||
| Other(4): | $843,179 | $0 | N/A | UW NOI Debt Yield: | 12.0% | |||
| Sources and Uses | ||||||||
| Sources | Proceeds | % of Total | Uses | Proceeds | % of Total | |||
| Mortgage Loan | $23,030,000 | 100.0% | Payoff Existing Debt | $20,201,795 | 87.7% | |||
| Upfront Reserves | 1,945,569 | 8.4 | ||||||
| Closing Costs | 590,798 | 2.6 | ||||||
| Return of Equity | 291,838 | 1.3 | ||||||
| Total Sources | $23,030,000 | 100.0% | Total Uses | $23,030,000 | 100.0% | |||
| (1) | Reflects leased occupancy. STG International (14.9% of the NRA, 14.7% of the underwritten base rent) is expected to occupy its space in October 2021. |
| (2) | The increase in UW NOI from Most Recent NOI is primarily driven by STG International (14.9% of the NRA, 14.7% of the underwritten base rent) executing a lease that commences in October 2021, underwriting rent steps of $116,543 through October 2022 and underwriting an additional $166,844 in recoveries. At origination, $94,981 was reserved for gap rent until STG International’s lease commences. |
| (3) | On each monthly payment date during a Cash Management Trigger Event (as defined below) and/or a Cash Sweep Trigger Event (as defined below), the borrower is required to deposit $2,154 into a replacement reserve. A “Cash Management Trigger Event” will commence upon the earliest to occur of (i) an event of default under the Murrieta Spectrum Mortgage Loan (as defined below) documents, (ii) a bankruptcy action of the borrower, a guarantor, a key principal or the property manager, (iii) as of any date, the debt service coverage ratio being less than 1.35x, (iv) an indictment for fraud or misappropriation of funds by the borrower, a guarantor, a key principal or the property manager (provided, that in the case of a third party property manager, such indictment is related to the Murrieta Spectrum Property (as defined below)) or (v) a material tenant trigger event. A Cash Management Trigger Event will end upon the occurrence of: with regard to clause (i) above, the end of such event of default; with regard to clause (ii) above, the filing being discharged, stayed or dismissed within 45 days for the borrower, the applicable guarantor or the applicable key principal, or within 120 days for the property manager, and the lender’s determination that such filing does not materially affect the borrower’s, the guarantors’, the key principals’ or the property manager’s monetary obligations, or the property manager is replaced with a manager acceptable to the lender; with regard to clause (iii) above, the debt service coverage ratio being equal to or greater than 1.40x for two consecutive calendar quarters; with regard to clause (iv) above, the dismissal of the applicable indictment, the acquittal of each applicable person with respect to the related charge(s) or the replacement of an affiliated property manager with a qualified property manager under a replacement property management agreement; or with regard to clause (v) above, the cure of such material tenant trigger event. A “Cash Sweep Trigger Event” will commence upon the earliest to occur of (i) an event of default under the Murrieta Spectrum Mortgage Loan documents, (ii) a bankruptcy action of the borrower, a guarantor, a key principal or the property manager or (iii) as of any date, the debt service coverage ratio being less than 1.25x. A Cash Sweep Period will end upon the occurrence of: with regard to clause (i) above, the end of such event of default; with regard to clause (ii) above, the filing being discharged, stayed or dismissed within 45 days for the borrower, the applicable guarantor or the applicable key principal, or within 120 days for the property manager, and the lender’s determination that such filing does not materially affect the borrower’s, the guarantors’, the key principals’ or the property manager’s monetary obligations, or an affiliated property manager is replaced with a manager acceptable to the lender; or with regard to clause (iii) above, the debt service coverage ratio being equal to or greater than 1.30x for two consecutive calendar quarters. |
THE INFORMATION IN THIS STRUCTURAL AND COLLATERAL TERM SHEET IS NOT COMPLETE AND MAY BE AMENDED PRIOR TO THE TIME OF SALE. THIS TERM SHEET IS NOT AN OFFER TO SELL THESE SECURITIES AND IT IS NOT A SOLICITATION OF AN OFFER TO BUY THESE SECURITIES IN ANY JURISDICTION WHERE THE OFFER OR SALE IS NOT PERMITTED.
136
| Structural and Collateral Term Sheet | BBCMS 2021-C11 | |
| No. 12 – Murrieta Spectrum | ||
| (4) | Other escrows include (i) $527,019 for tenant allowance, tenant improvement costs and leasing commissions related to STG International and Ashley Furniture, (ii) $221,179 for deferred maintenance and (iii) $94,981 for rent concessions related to STG International. |
The Loan. The Murrieta Spectrum mortgage loan (the “Murrieta Spectrum Mortgage Loan”) has an original and Cut-off Date principal balance of $23,030,000 and is secured by a first lien mortgage on the borrower’s fee interest in a 172,357 square foot mixed use property located in Murrieta, California (the “Murrieta Spectrum Property”). The Murrieta Spectrum Mortgage Loan has a 10-year term and amortizes on a 30-year schedule.
The Property. The Murrieta Spectrum Property consists of seven, one-story, mixed use buildings totaling 172,357 square feet, located in Murrieta, California. The Murrieta Spectrum Property was built in 2005 and is situated on approximately 16.6 acres of land. The Murrieta Spectrum Property includes 913 parking spaces (approximately 5.3 parking spaces per 1,000 square feet of NRA). The Murrieta Spectrum Property was 94.8% leased as of August 19, 2021 to 20 tenants. STG International (14.9% of the NRA, 14.7% of the underwritten base rent) is expected to occupy its space in October 2021. The borrower sponsors acquired the Murrieta Spectrum Property in 2005 as a vacant lot for approximately $10.4 million and have invested approximately $27.4 million in capital improvements and soft costs for a total project cost of approximately $37.8 million.
COVID-19 Update. As of August 30, 2021, the Murrieta Spectrum Property is open and operating and all tenants made their June 2021 and July 2021 rental payments. Elias Shoes (2.2% of the NRA, 2.3% of the underwritten base rent) is in the process of paying back two months of deferred rent and recoveries in 10 installments from May 2021 through February 2022. Haute Nails (0.6% of the NRA, 1.4% of the underwritten base rent) is in the process of paying back three months of deferred rent and recoveries in six installments from May 2021 through October 2021. The first debt service payment date for the Murrieta Spectrum Mortgage Loan is in October 2021. As of August 30, 2021, the Murrieta Spectrum Mortgage Loan is not subject to any forbearance, modification or debt service relief requests.
| Historical and Current Occupancy | |||
| 2018(1) | 2019(1) | 2020(1) | Current(2) |
| 81.1% | 78.7% | 79.9% | 94.8% |
| (1) | 2018, 2019 and 2020 Occupancy figures were provided by the borrower and are based on the monthly average of each respect respective year. |
| (2) | Current Occupancy is as of August 19, 2021 and reflects leased occupancy. STG International (14.9% of the NRA, 14.7% of the underwritten rent) is expected to occupy its space in October 2021. |
Major Tenants.
Ashley Furniture (50,902 square feet; 29.5% of the NRA; 15.5% of the underwritten base rent): Ashley Furniture began as a furniture sales company in 1945 and has become the world’s largest furniture manufacturer. There are more than 600 Ashley HomeStore locations that sell Ashley Furniture products and 15 manufacturing and distribution facilities across the world. Ashley Furniture’s products are sold by more than 6,000 retail partners with over 20,000 storefronts in 123 countries and Ashley Furniture’s manufacturing and distribution facilities cover more than 13 million square feet. Ashley Furniture has been a tenant at the Murrieta Spectrum Property since 2005 and most recently extended its lease on July 21, 2021, 12 months early, through October 31, 2027. Ashley Furniture has one, five-year renewal option remaining.
Savers (26,194 square feet; 15.2% of the NRA; 9.5% of the underwritten base rent): Savers, a retailer that offers secondhand clothes and household goods, opened its first thrift store in 1954 in a movie theater in San Francisco’s Mission District. Since then, Savers has opened over 300 stores in the United States, Canada and Australia and has grown to become the largest for-profit thrift-store chain in the United States. Savers has created a leading recycling and reuse program, where it keeps, on average, 700 million pounds of reusable items out of area landfills every year. In March 2019, Savers was acquired by Ares Management Corp. and Crescent Capital Group LP through a restructuring agreement that cut its debt load by 40%. Savers has been a tenant at the Murrieta Spectrum Property since 2012 and most recently extended its lease on May 1, 2020, 23 months early, through September 30, 2027. Savers has one, five-year renewal option remaining.
STG International (25,732 square feet; 14.9% of the NRA; 14.7% of the underwritten base rent): Founded in 1997, STG International provides professional services and solutions to federal, state and local government customers nationwide. STG International executed a lease with a commencement date of October 1, 2021 that is scheduled to expire on September 30, 2031. At origination, $94,981 was reserved for gap rent until the lease commencement. STG International has a one-time right to terminate its lease after September 2028 if its contract with the Veterans Administration is terminated by providing three months’ prior written notice and payment of a fee equal to the sum of all unamortized tenant improvement allowance and/or leasing commissions. STG International has two, five-year renewal options remaining.
THE INFORMATION IN THIS STRUCTURAL AND COLLATERAL TERM SHEET IS NOT COMPLETE AND MAY BE AMENDED PRIOR TO THE TIME OF SALE. THIS TERM SHEET IS NOT AN OFFER TO SELL THESE SECURITIES AND IT IS NOT A SOLICITATION OF AN OFFER TO BUY THESE SECURITIES IN ANY JURISDICTION WHERE THE OFFER OR SALE IS NOT PERMITTED.
137
| Structural and Collateral Term Sheet | BBCMS 2021-C11 | |
| No. 12 – Murrieta Spectrum | ||
The Market. The Murrieta Spectrum Property is located in Murrieta, California, which is located in the Temecula Valley area of Riverside County. Access to the Temecula Valley is provided primarily from Interstate 15 and Interstate 215, which intersect approximately 2.0 miles from the Murrieta Spectrum Property. Public transit in Murrieta is provided by the Riverside Transit Agency. Murrieta’s major employers include Murrieta Valley Unified School District, Southwest Healthcare System, Loma Linda University Medical Center, County of Riverside and Target. The Madison Square shopping mall, located approximately 0.3 miles from the Murrieta Spectrum Property, is anchored by Smart & Final Extra!. The Murrieta Springs Plaza shopping mall, located approximately 0.3 miles from the Murrieta Spectrum Property, is anchored by Home Depot, PetSmart and Big 5 Sporting Goods. Madison Center, located approximately 0.9 miles from the Murrieta Spectrum Property, is anchored by Lowe’s Home Improvement and Kohl’s. The Murrieta Spectrum Property is located approximately 63.8 miles north of San Diego, 80.6 miles southeast of Los Angeles and 37.3 miles south of Riverside.
The Murrieta Spectrum Property is located in the Inland Empire retail market. According to a third-party market report, as of March 11, 2021, the Inland Empire retail market had an inventory of approximately 197.8 million square feet, overall vacancy in the market of approximately 8.0% and average asking rents of $21.95 per square foot. The Murrieta Spectrum Property is located in the South Riverside retail submarket. According to a third-party market report, as of March 11, 2021, the South Riverside retail submarket had an inventory of approximately 21.4 million square feet, overall vacancy of approximately 6.3% and average asking rents of $24.78 per square foot. According to a third-party market report, the estimated 2020 population within a one-, three- and five-mile radius of the Murrieta Spectrum Property is 9,387, 92,164 and 168,914, respectively. The estimated 2020 average household income within the same radii is $89,137, $112,017 and $115,562, respectively.
| Top Tenant Summary(1) | |||||||
| Tenant | Ratings Moody’s/S&P/ Fitch | Net Rentable Area (SF) | % of Total NRA | UW Base Rent PSF(2) | UW Base Rent(2) | % of Total UW Base Rent | Lease Exp. Date |
| Ashley Furniture(3) | NR/NR/NR | 50,902 | 29.5% | $8.59 | $437,338 | 15.5% | 10/31/2027 |
| Savers(4) | NR/NR/NR | 26,194 | 15.2 | 10.25 | 268,488 | 9.5 | 9/30/2027 |
| STG International(5) | NR/NR/NR | 25,732 | 14.9 | 16.08 | 413,771 | 14.7 | 9/30/2031 |
| Auto Club (AAA)(6) | NR/NR/NR | 9,870 | 5.7 | 17.19 | 169,708 | 6.0 | 7/31/2026 |
| USHW-Concentra Health(7) | NR/NR/NR | 8,724 | 5.1 | 27.01 | 235,655 | 8.3 | 2/28/2028 |
| Major Tenants | 121,422 | 70.4% | $12.56 | $1,524,960 | 54.0% | ||
| Other Tenants | 42,029 | 24.4% | $30.88 | $1,297,833 | 46.0% | ||
| Occupied Collateral Total / Wtd. Avg. | 163,451 | 94.8% | $17.27 | $2,822,792 | 100.0% | ||
| Vacant Space | 8,906 | 5.2% | |||||
| Collateral Total | 172,357 | 100.0% | |||||
| (1) | Based on underwritten rent roll dated August 19, 2021. |
| (2) | UW Base Rent PSF and UW Base Rent include rent steps totaling $116,543 through October 2022. |
| (3) | Ashley Furniture has one, five-year renewal option remaining. |
| (4) | Savers has one, five-year renewal option remaining. |
| (5) | STG International has a one-time right to terminate its lease after September 2028 if its contract with the Veterans Administration is terminated by providing three months’ prior written notice and payment of a fee equal to the sum of all unamortized tenant improvement allowances and/or leasing commissions. STG International has two, five-year renewal options remaining. |
| (6) | Auto Club (AAA) has one, five-year renewal option remaining. |
| (7) | USHW-Concentra Health has two, five-year renewal options remaining. |
THE INFORMATION IN THIS STRUCTURAL AND COLLATERAL TERM SHEET IS NOT COMPLETE AND MAY BE AMENDED PRIOR TO THE TIME OF SALE. THIS TERM SHEET IS NOT AN OFFER TO SELL THESE SECURITIES AND IT IS NOT A SOLICITATION OF AN OFFER TO BUY THESE SECURITIES IN ANY JURISDICTION WHERE THE OFFER OR SALE IS NOT PERMITTED.
138
| Structural and Collateral Term Sheet | BBCMS 2021-C11 | |
| No. 12 – Murrieta Spectrum | ||
| Lease Rollover Schedule(1)(2) | |||||||||
| Year | Number of Leases Expiring | Net Rentable Area Expiring | % of NRA Expiring | UW Base Rent Expiring(3) | % of UW Base Rent Expiring | Cumulative Net Rentable Area Expiring | Cumulative % of NRA Expiring | Cumulative UW Base Rent Expiring(3) | Cumulative % of UW Base Rent Expiring |
| Vacant | NAP | 8,906 | 5.2% | NAP | NAP | 8,906 | 5.2% | NAP | NAP |
| 2021 & MTM | 0 | 0 | 0.0 | $0 | 0.0% | 8,906 | 5.2% | $0 | 0.0% |
| 2022 | 2 | 4,159 | 2.4 | 97,277 | 3.4 | 13,065 | 7.6% | $97,277 | 3.4% |
| 2023 | 1 | 3,806 | 2.2 | 65,083 | 2.3 | 16,871 | 9.8% | $162,360 | 5.8% |
| 2024 | 2 | 3,057 | 1.8 | 65,906 | 2.3 | 19,928 | 11.6% | $228,266 | 8.1% |
| 2025 | 7 | 25,664 | 14.9 | 933,333 | 33.1 | 45,592 | 26.5% | $1,161,598 | 41.2% |
| 2026 | 2 | 12,677 | 7.4 | 215,539 | 7.6 | 58,269 | 33.8% | $1,377,137 | 48.8% |
| 2027 | 2 | 77,096 | 44.7 | 705,826 | 25.0 | 135,365 | 78.5% | $2,082,964 | 73.8% |
| 2028 | 2 | 9,829 | 5.7 | 275,204 | 9.7 | 145,194 | 84.2% | $2,358,168 | 83.5% |
| 2029 | 1 | 1,431 | 0.8 | 50,854 | 1.8 | 146,625 | 85.1% | $2,409,022 | 85.3% |
| 2030 | 0 | 0 | 0.0 | 0 | 0.0 | 146,625 | 85.1% | $2,409,022 | 85.3% |
| 2031 | 1 | 25,732 | 14.9 | 413,771 | 14.7 | 172,357 | 100.0% | $2,822,792 | 100.0% |
| 2032 & Beyond | 0 | 0 | 0.0 | 0 | 0.0 | 172,357 | 100.0% | $2,822,792 | 100.0% |
| Total | 20 | 172,357 | 100.0% | $2,822,792 | 100.0% | ||||
| (1) | Based on the underwritten rent roll dated August 19, 2021. |
| (2) | Certain leases may have termination options that are exercisable prior to the originally stated expiration date of the lease and that are not considered in this Lease Rollover Schedule. |
| (3) | UW Base Rent Expiring and Cumulative UW Base Rent Expiring include rent steps totaling $116,543 through October 2022. |
Operating History and Underwritten Net Cash Flow
| |||||||
| 2018 | 2019 | 2020 | TTM(1) | Underwritten | Per Square Foot | %(2) | |
| Rents in Place(3) | $2,270,971 | $2,094,206 | $2,038,047 | $2,352,294 | $2,822,792 | $16.38 | 68.2% |
| Vacant Income | 0 | 0 | 0 | 0 | 206,988 | 1.20 | 5.0 |
| Gross Potential Rent | $2,270,971 | $2,094,206 | $2,038,047 | $2,352,294 | $3,029,780 | $17.58 | 73.2% |
| Total Reimbursements | 752,924 | 978,555 | 862,340 | 884,809 | 1,107,312 | 6.42 | 26.8 |
| Net Rental Income | $3,023,896 | $3,072,761 | $2,900,387 | $3,237,103 | $4,137,092 | $24.00 | 100.0% |
| Other Income(4) | 171 | 2,082 | 3,117 | 2,453 | 2,453 | 0.01 | 0.1 |
| (Vacancy/Credit Loss) | 0 | 0 | 0 | 0 | (262,646) | (1.52) | (6.3) |
| Effective Gross Income | $3,024,067 | $3,074,843 | $2,903,504 | $3,239,557 | $3,876,899 | $22.49 | 93.7% |
| Total Expenses | $1,058,165 | $1,067,465 | $1,060,832 | $1,102,210 | $1,117,934 | $6.49 | 28.8% |
| Net Operating Income(5) | $1,965,902 | $2,007,378 | $1,842,672 | $2,137,347 | $2,758,965 | $16.01 | 71.2% |
| Capital Expenditures | 0 | 0 | 0 | 0 | 25,854 | 0.15 | 0.7 |
| TI/LC | 0 | 0 | 0 | 0 | 108,691 | 0.63 | 2.8 |
| Net Cash Flow | $1,965,902 | $2,007,378 | $1,842,672 | $2,137,347 | $2,624,421 | $15.23 | 67.7% |
| (1) | TTM represents the trailing 12 months ending July 31, 2021. |
| (2) | % column represents percent of Net Rental Income for all revenue lines and represents percent of Effective Gross Income for the remainder of fields. |
| (3) | Underwritten Rents in Place is based on the August 19, 2021 rent roll and includes rent steps totaling $116,543 through October 2022. |
| (4) | Other Income includes late fees, administrative fees and assignment fees. |
| (5) | The increase in Underwritten Net Operating Income from TTM Net Operating Income is primarily driven by STG International (14.9% of the NRA, 14.7% of the underwritten rent) executing a lease that commences in October 2021, underwriting rent steps of $116,543 through October 2022 and underwriting an additional $166,844 in recoveries. At origination, $94,981 was reserved for gap rent until STG International’s lease commences. |
THE INFORMATION IN THIS STRUCTURAL AND COLLATERAL TERM SHEET IS NOT COMPLETE AND MAY BE AMENDED PRIOR TO THE TIME OF SALE. THIS TERM SHEET IS NOT AN OFFER TO SELL THESE SECURITIES AND IT IS NOT A SOLICITATION OF AN OFFER TO BUY THESE SECURITIES IN ANY JURISDICTION WHERE THE OFFER OR SALE IS NOT PERMITTED.
139
| Structural and Collateral Term Sheet | BBCMS 2021-C11 | |
| No. 13 – Merit Medical Systems | ||
| Mortgage Loan Information | Property Information | |||
| Mortgage Loan Seller: | Barclays | Single Asset / Portfolio: | Single Asset | |
| Original Principal Balance: | $20,751,500 | Title: | Fee | |
| Cut-off Date Principal Balance: | $20,751,500 | Property Type – Subtype: | Industrial – Manufacturing | |
| % of IPB: | 2.1% | Net Rentable Area (SF): | 95,500 | |
| Loan Purpose: | Acquisition | Location: | Houston, TX | |
| Borrower: | CX Texas Industrial, DST | Year Built / Renovated: | 2014 / NAP | |
| Borrower Sponsors: | Carter Exchange Fund | Occupancy: | 100.0% | |
| Management Company, LLC | Occupancy Date: | 8/24/2021 | ||
| Interest Rate: | 3.04600% | 4th Most Recent NOI (As of)(1): | NAV | |
| Note Date: | 8/24/2021 | 3rd Most Recent NOI (As of)(1): | NAV | |
| Maturity Date: | 9/6/2028 | 2nd Most Recent NOI (As of)(1): | NAV | |
| Interest-only Period: | 84 months | Most Recent NOI (As of)(1): | NAV | |
| Original Term: | 84 months | UW Economic Occupancy: | 95.0% | |
| Original Amortization Term: | None | UW Revenues: | $2,003,537 | |
| Amortization Type: | Interest Only | UW Expenses: | $40,071 | |
| Call Protection: | L(24),D(56),O(4) | UW NOI: | $1,963,467 | |
| Lockbox / Cash Management: | Hard / Springing | UW NCF: | $1,834,976 | |
| Additional Debt: | No | Appraised Value / Per SF: | $41,800,000 / $438 | |
| Additional Debt Balance: | N/A | Appraisal Date: | 7/22/2021 | |
| Additional Debt Type: | N/A | |||
| Escrows and Reserves | Financial Information | |||||
| Initial | Monthly | Initial Cap | Cut-off Date Loan / SF: | $217 | ||
| Taxes(2): | $0 | Springing | N/A | Maturity Date Loan / SF: | $217 | |
| Insurance: | $473 | Springing | N/A | Cut-off Date LTV: | 49.6% | |
| Replacement Reserves: | $0 | $0 | N/A | Maturity Date LTV: | 49.6% | |
| TI/LC: | $0 | Springing | N/A | UW NCF DSCR: | 2.86x | |
| Other(3): | $53,406 | $0 | N/A | UW NOI Debt Yield: | 9.5% | |
| Sources and Uses | ||||||
| Sources | Proceeds | % of Total | Uses | Proceeds | % of Total | |
| Mortgage Loan | $20,751,500 | 47.8% | Purchase Price | $41,503,000 | 95.7% | |
| Borrower Sponsor Equity | 22,621,683 | 52.2 | Closing Costs(4) | 1,816,304 | 4.2 | |
| Reserves | 53,878 | 0.1 | ||||
| Total Sources | $43,373,183 | 100.0% | Total Uses | $43,373,183 | 100.0% | |
| (1) | Historical cash flows are unavailable due to the borrower’s recent acquisition of the Merit Medical Systems Property (as defined below). The Merit Medical Systems Property was built to suit for Merit Medical (as defined below) and has been 100.0% leased by Merit Medical since 2014 on an absolute triple-net lease through October 31, 2033. |
| (2) | The borrower is not required to make monthly tax payments if the following conditions are satisfied: (i) no event of default has occurred or is continuing, (ii) no monetary default exists under the Merit Medical lease or any replacement lease and (iii) Merit Medical is paying taxes in full directly to the applicable governmental authority. |
| (3) | Other escrows consist of the first month’s debt service payment. |
| (4) | Closing costs include the interest rate-buy down by the borrower of approximately $570,666 and include a $522,000 reserve held at the master lessee level. |
The Loan. The Merit Medical Systems mortgage loan (the “Merit Medical Systems Mortgage Loan”) has an original and cut-off date principal balance of $20,751,500 and is secured by a first lien mortgage on the borrower’s fee interest in a 95,500 square foot industrial property located in Houston, Texas (the “Merit Medical Systems Property”). The Merit Medical Systems Mortgage Loan has a seven-year term and is interest-only for the entire term. The borrowing entity for the Merit Medical Systems Mortgage Loan is CX Texas Industrial, DST, a Delaware statutory trust and special purpose entity with one independent director.
THE INFORMATION IN THIS STRUCTURAL AND COLLATERAL TERM SHEET IS NOT COMPLETE AND MAY BE AMENDED PRIOR TO THE TIME OF SALE. THIS TERM SHEET IS NOT AN OFFER TO SELL THESE SECURITIES AND IT IS NOT A SOLICITATION OF AN OFFER TO BUY THESE SECURITIES IN ANY JURISDICTION WHERE THE OFFER OR SALE IS NOT PERMITTED.
140
| Structural and Collateral Term Sheet | BBCMS 2021-C11 | |
| No. 13 – Merit Medical Systems | ||
The Property. The Merit Medical Systems Property is a single-story, single tenant industrial building with a total net rentable area of 95,500 square feet situated on an approximately 7.7-acre site in Houston, Texas. Built in 2014, the Merit Medical Systems Property is an industrial life sciences manufacturing building. On-site amenities include training rooms, a dining area, a quality assurance lab and clean rooms. The Merit Medical Systems Property features 228 parking spaces, resulting in a parking ratio of approximately 2.4 spaces per 1,000 square feet. As of August 24, 2021, the Merit Medical Systems Property was 100.0% leased to Merit Medical Systems, Inc. (“Merit Medical”).
COVID-19 Update. As of August 18, 2021, the Merit Medical Systems Property was open and operating. As of August 18, 2021, Merit Medical was current on all lease obligations and had not requested rent relief. As of the date of this term sheet, the Merit Medical Systems Mortgage Loan is not subject to any modification or forbearance request.
Major Tenant. The Merit Medical Systems Property is 100.0% leased, as of August 24, 2021, by Merit Medical (NASDAQ: MMSI). Merit Medical is a leading manufacturer of medical devices used in diagnostic and interventional cardiology and radiology procedures. The Merit Medical Systems Property serves as Merit Medical’s medical research and manufacturing facility. The Merit Medical Systems Property was built to suit for Merit Medical in 2014, and the facility currently has approximately 300 employees. As of the end of the first quarter of 2021, Merit Medical announced revenue of $248.9 million for the quarter, which had increased by 2.2% over the first quarter of 2020. The Merit Medical Systems Property is recognized by the company as one of its Centers of Excellence, specializing in polymer extrusions and catheter production. Merit Medical’s current lease extends through October 2033 with three, five-year extension options, no termination options and with 2.0% annual rent increases. A full cash flow sweep will commence if, among other events, Merit Medical (i) terminates or gives notice to terminate its lease; (ii) vacates or goes dark on its space; (iii) becomes subject (or its parent company or lease guarantor becomes the subject) of bankruptcy action; or (iv) defaults under its lease beyond all applicable cure periods.
The Market. The Merit Medical Systems Property is located in the city of Houston, Texas, approximately 20 miles south of the Houston central business district. According to the appraisal, the Houston region is home to more than 18,000 biotech specialists, 25,700 of the world’s top medical researchers and more than 1,760 life science companies. The Merit Medical Systems Property is located approximately 10 miles from Texas Medical Center, the largest medical complex worldwide. There are numerous universities in the surrounding area including University of Houston (approximately 10 miles from the Merit Medical Systems Property), Rice University (approximately 11 miles from the Merit Medical Systems Property), Baylor College of Medicine (approximately 11 miles from the Merit Medical Systems Property) and Houston Community College – Coleman College for Health Sciences (approximately 10 miles from the Merit Medical Systems Property). Additionally, according to the appraisal, the region is a national leader in business relocations and expansions due to state and local tax incentives, manufacturing sales tax exemptions and research and development tax credits.
According to the appraisal, the Merit Medical Systems Property is located in the Houston life sciences market. As of year-end 2020, the market had a total inventory of approximately 7.0 million square feet. The triple-net rent range was $21.00-$27.00 with 5.0% increase in rents over the previous five years. The average vacancy rate was 5.2%.
| Top Tenant Summary(1) | |||||||
| Tenant | Ratings Moody’s/S&P/Fitch | Net Rentable Area (SF) | % of Total NRA | UW Base PSF | UW Base Rent(2) | % of Total UW Base Rent | Lease Expiration Date |
| Merit Medical | NR / NR / NR | 95,500 | 100.0% | $22.08 | $2,108,987 | 100.0% | 10/31/2033(3) |
| Occupied Collateral Total / Wtd. Avg. | 95,500 | 100.0% | $22.08 | $2,108,987 | 100.0% | ||
| Vacant Space | 0 | 0.0% | |||||
| Collateral Total | 95,500 | 100.0% | |||||
| (1) | Based on underwritten rent roll dated August 24, 2021. |
| (2) | Base Rent includes approximately $41,353 of rent steps through January 2022. |
| (3) | Merit Medical has three, five-year extension options and no termination options. |
THE INFORMATION IN THIS STRUCTURAL AND COLLATERAL TERM SHEET IS NOT COMPLETE AND MAY BE AMENDED PRIOR TO THE TIME OF SALE. THIS TERM SHEET IS NOT AN OFFER TO SELL THESE SECURITIES AND IT IS NOT A SOLICITATION OF AN OFFER TO BUY THESE SECURITIES IN ANY JURISDICTION WHERE THE OFFER OR SALE IS NOT PERMITTED.
141
| Structural and Collateral Term Sheet | BBCMS 2021-C11 | |
| No. 13 – Merit Medical Systems | ||
| Lease Rollover Schedule(1) | |||||||||
| Year | Number of Leases Expiring | NRA Expiring | % of NRA Expiring | UW Base Rent Expiring(2) | % of UW Base Rent Expiring | Cumulative Net Rentable Area Expiring | Cumulative % of NRA Expiring | Cumulative UW Base Rent Expiring | Cumulative % of UW Base Rent Expiring |
| Vacant | NAP | 0 | 0.0% | NAP | NAP | 0 | 0.0% | NAP | NAP |
| 2021 & MTM | 0 | 0 | 0.0 | $0 | 0.0% | 0 | 0.0% | $0 | 0.0% |
| 2022 | 0 | 0 | 0.0 | 0 | 0.0 | 0 | 0.0% | $0 | 0.0% |
| 2023 | 0 | 0 | 0.0 | 0 | 0.0 | 0 | 0.0% | $0 | 0.0% |
| 2024 | 0 | 0 | 0.0 | 0 | 0.0 | 0 | 0.0% | $0 | 0.0% |
| 2025 | 0 | 0 | 0.0 | 0 | 0.0 | 0 | 0.0% | $0 | 0.0% |
| 2026 | 0 | 0 | 0.0 | 0 | 0.0 | 0 | 0.0% | $0 | 0.0% |
| 2027 | 0 | 0 | 0.0 | 0 | 0.0 | 0 | 0.0% | $0 | 0.0% |
| 2028 | 0 | 0 | 0.0 | 0 | 0.0 | 0 | 0.0% | $0 | 0.0% |
| 2029 | 0 | 0 | 0.0 | 0 | 0.0 | 0 | 0.0% | $0 | 0.0% |
| 2030 | 0 | 0 | 0.0 | 0 | 0.0 | 0 | 0.0% | $0 | 0.0% |
| 2031 | 0 | 0 | 0.0 | 0 | 0.0 | 0 | 0.0% | $0 | 0.0% |
| 2032 & Beyond | 1 | 95,500 | 100.0 | 2,108,987 | 100.0 | 95,500 | 100.0% | $2,108,987 | 100.0% |
| Total | 1 | 95,500 | 100.0% | $2,108,987 | 100.0% | ||||
| (1) | Based on the underwritten rent roll dated August 24, 2021. |
| (2) | Base Rent includes approximately $41,350 of rent steps through January 2022. |
| Operating History and Underwriting Net Cash Flow(1) | |||
| Underwritten | Per Square Foot | %(2) | |
| Rents in Place | $2,067,634 | $21.65 | 98.0% |
| Rent Steps(3) | 41,353 | 0.43 | 2.0 |
| Vacant Income | 0 | 0.00 | 0.0 |
| Gross Potential Rent | $2,108,987 | $22.08 | 100.0% |
| Total Reimbursements | 0 | 0.00 | 0.0 |
| Net Rental Income | $2,108,987 | $22.08 | 100.0% |
| Other Income | 0 | 0.00 | 0.0 |
| (Vacancy/Credit Loss) | (105,449) | (1.10) | (5.0) |
| Effective Gross Income | $2,003,537 | $20.98 | 95.0% |
| Total Expenses | $40,071 | $0.42 | 2.0% |
| Net Operating Income | $1,963,467 | $20.56 | 98.0% |
| Cap Ex, Total TI/LC | 128,491 | 1.35 | 6.4 |
| Net Cash Flow | $1,834,976 | $19.21 | 91.6% |
| (1) | Historical cash flows are unavailable due to the borrower’s recent acquisition of the Merit Medical Systems Property. The Merit Medical Systems Property was built to suit for Merit Medical and has been 100.0% leased by Merit Medical since 2014 on an absolute triple-net lease through October 31, 2033. |
| (2) | % column represents (i) percent of Net Rental Income for all revenue lines and (ii) percent of Effective Gross Income for the remainder of the fields. |
| (3) | Rent Steps include approximately $41,353 of rent steps through January 2022. |
THE INFORMATION IN THIS STRUCTURAL AND COLLATERAL TERM SHEET IS NOT COMPLETE AND MAY BE AMENDED PRIOR TO THE TIME OF SALE. THIS TERM SHEET IS NOT AN OFFER TO SELL THESE SECURITIES AND IT IS NOT A SOLICITATION OF AN OFFER TO BUY THESE SECURITIES IN ANY JURISDICTION WHERE THE OFFER OR SALE IS NOT PERMITTED.
142
(THIS PAGE INTENTIONALLY LEFT BLANK)
THE INFORMATION IN THIS STRUCTURAL AND COLLATERAL TERM SHEET IS NOT COMPLETE AND MAY BE AMENDED PRIOR TO THE TIME OF SALE. THIS TERM SHEET IS NOT AN OFFER TO SELL THESE SECURITIES AND IT IS NOT A SOLICITATION OF AN OFFER TO BUY THESE SECURITIES IN ANY JURISDICTION WHERE THE OFFER OR SALE IS NOT PERMITTED.
143
| Structural and Collateral Term Sheet | BBCMS 2021-C11 | |
| No. 14 – Upstate NY Portfolio | ||
| Mortgage Loan Information | Property Information | |||
| Mortgage Loan Seller: | LMF | Single Asset / Portfolio: | Portfolio | |
| Original Principal Balance: | $19,800,000 | Title: | Fee | |
| Cut-off Date Principal Balance: | $19,800,000 | Property Type - Subtype: | Various – Various | |
| % of Pool by IPB: | 2.0% | Net Rentable Area (Units)(4): | 436 | |
| Loan Purpose: | Refinance | Location: | Various, NY | |
| Borrowers(1): | Various | Year Built / Renovated: | Various / Various | |
| Borrower Sponsor: | Brian H. Murray | Occupancy: | 92.7% | |
| Interest Rate: | 3.30000% | Occupancy Date: | 8/2/2021 | |
| Note Date: | 8/23/2021 | 4th Most Recent NOI (As of): | $1,033,240 (12/31/2018) | |
| Maturity Date: | 9/6/2031 | 3rd Most Recent NOI (As of): | $1,571,215 (12/31/2019) | |
| Interest-only Period: | 60 months | 2nd Most Recent NOI (As of): | $1,987,386 (12/31/2020) | |
| Original Term: | 120 months | Most Recent NOI (As of): | $2,266,455 (TTM 7/31/2021) | |
| Original Amortization: | 360 months | UW Economic Occupancy: | 97.4% | |
| Amortization Type: | Interest Only, Amortizing Balloon | UW Revenues: | $4,232,483 | |
| Call Protection(2): | L(24),D(92),O(4) | UW Expenses: | $1,975,181 | |
| Lockbox / Cash Management: | Springing | UW NOI: | $2,257,302 | |
| Additional Debt: | No | UW NCF: | $2,138,162 | |
| Additional Debt Balance: | N/A | Appraised Value / Per Unit(3): | $28,800,000 / $66,055 | |
| Additional Debt Type: | N/A | Appraisal Date: | 5/24/2021 | |
| ||||
| Escrows and Reserves | Financial Information | |||||
| Initial | Monthly | Initial Cap | Cut-off Date Loan / Unit: | $45,413 | ||
| Taxes: | $132,920 | $31,648 | N/A | Maturity Date Loan / Unit: | $40,704 | |
| Insurance: | $27,882 | $13,277 | N/A | Cut-off Date LTV(3): | 68.8% | |
| Replacement Reserves: | $0 | $9,224 | N/A | Maturity Date LTV(3): | 61.6% | |
| TI/LC: | $0 | $600 | N/A | UW NCF DSCR: | 2.05x | |
| Deferred Maintenance: | $161,345 | $0 | N/A | UW NOI Debt Yield: | 11.4% | |
| Sources and Uses | ||||||
| Sources | Proceeds | % of Total | Uses | Proceeds | % of Total | |
| Mortgage Loan | $19,800,000 | 100.0% | Loan Payoff | $18,086,105 | 91.3% | |
| Closing Costs | 974,700 | 4.9 | ||||
| Upfront Reserves | 322,146 | 1.6 | ||||
| Return of Equity | 417,049 | 2.1 | ||||
| Total Sources | $19,800,000 | 100.0% | Total Uses | $19,800,000 | 100.0% | |
| (1) | The borrowers under the Upstate NY Portfolio Mortgage Loan (as defined below) are Madison Barracks LLC, Arsenal Apartments LLC, Colonial Manor LLC, Solar Building LLC and Jefferson Heights, LLC. |
| (2) | At any time after permitted prepayment date and prior to the free window date, the Upstate NY Portfolio borrowers may release any individual property provided that, among other conditions stated in the Upstate NY Portfolio Mortgage Loan documents, (i) no event of default has occurred and is continuing; (ii) the amount of the Upstate NY Portfolio Mortgage Loan defeased will be 125% of the allocated loan amount for the related Upstate NY Portfolio property being released; (iii) the debt service coverage ratio for the remaining properties after such release is not less than the greater of (a) 2.04x and (b) the debt service coverage ratio for the remaining properties and the property to be released for the preceding 12 months; and (iv) the loan-to-value ratio after such release is less than or equal to the lesser of (a) 68.8% and (b) the loan-to-value ratio for the remaining properties and the property to be released immediately preceding the release of the property. |
| (3) | The Appraised Value / Unit, Cut-Off Date LTV and Maturity Date LTV are based on the As-Portfolio Value of $28,800,000. The combined “as-is” individual appraised value is $27,600,000. The Cut-off Date LTV and Maturity Date LTV on the combined “as-is” individual appraised value are 71.7% and 64.3%, respectively. |
| (4) | The Upstate NY Portfolio Properties (as defined below) consist of 436 multifamily units and six retail suites totaling 7,200 SF. |
The Loan. The Upstate NY Portfolio mortgage loan (the “Upstate NY Portfolio Mortgage Loan”) has an outstanding principal balance as of the Cut-off Date of $19,800,000 and is secured by a first mortgage lien on the borrowers’ fee interests in a 436-unit multifamily and 6 retail suites portfolio located in Watertown and Sackets Harbor, New York (the “Upstate NY Portfolio Properties”). The Upstate NY Portfolio Mortgage Loan has a 10-year term and is interest-only for the first 60 months of the term followed by a 30-year amortization schedule. The borrowing entities for the Upstate NY Portfolio Mortgage Loan are Madison Barracks LLC, Arsenal Apartments LLC, Colonial Manor LLC, Solar Building LLC and Jefferson Heights, LLC, each a New York limited liability company and special purpose entity.
THE INFORMATION IN THIS STRUCTURAL AND COLLATERAL TERM SHEET IS NOT COMPLETE AND MAY BE AMENDED PRIOR TO THE TIME OF SALE. THIS TERM SHEET IS NOT AN OFFER TO SELL THESE SECURITIES AND IT IS NOT A SOLICITATION OF AN OFFER TO BUY THESE SECURITIES IN ANY JURISDICTION WHERE THE OFFER OR SALE IS NOT PERMITTED.
144
| Structural and Collateral Term Sheet | BBCMS 2021-C11 | |
| No. 14 – Upstate NY Portfolio | ||
The Properties. The Upstate NY Portfolio Properties consist of four multifamily garden properties and one mixed use property located in Watertown, New York and Sackets Harbor, New York. The Upstate NY Portfolio Properties are comprised of 436 multifamily units and six retail spaces totaling 7,200 SF.
The following table presents certain information relating to the Upstate NY Portfolio Properties:
| Portfolio Summary | ||||||||
| Property Name | Property - Subtype | Year Built / Year Renovated | Units | Allocated Cut-off Date Loan Amount (“ALA”) | % of ALA | Appraised Value | UW NOI | % of UW NOI |
| Jefferson Heights | Multifamily - Garden | 1967-1987 / 2012 | 121 | $6,500,000 | 32.8% | $8,700,000 | $792,942 | 35.1% |
| Madison Barracks | Multifamily - Garden | 1996 / 2010 | 127 | 5,700,000 | 28.8 | 7,700,000 | 616,327 | 27.3 |
| Colonial Manor | Multifamily - Garden | 1972 / NAP | 71 | 3,650,000 | 18.4 | 5,100,000 | 393,514 | 17.4 |
| Solar Building(1) | Mixed Use - Multifamily / Retail | 1906 / 1950 | 69 | 2,300,000 | 11.6 | 3,600,000 | 260,974 | 11.6 |
| Arsenal Apartments | Multifamily - Garden | 1991 / 2015 | 48 | 1,650,000 | 8.3 | 2,500,000 | 193,546 | 8.6 |
| Total/Wtd. Avg. | 436 | $19,800,000 | 100.0% | $28,800,000(2) | $2,257,302 | 100.0% | ||
| (1) | The Solar Building property also includes six commercial spaces totaling 7,200 SF. |
| (2) | The total Appraised Value is based on the As-Portfolio Value. The sum of the “as-is” individual appraised values of the individual properties is $27,600,000, resulting in a Cut-off Date LTV and Maturity Date LTV of 71.7% and 64.3%, respectively. |
Jefferson Heights. The Jefferson Heights property includes three non-contiguous garden style multifamily properties located less than 2.0 miles from each other, known individually as Hycliff Apartments, Palmer Street Apartments and College Heights Apartments (collectively “Jefferson Heights”) located in Watertown, New York. The Jefferson Heights property consists of three buildings that operate as one economic unit. Built between 1967-1987 and renovated in 2012, the Jefferson Heights property is comprised of 121-units within 11, two and three-story buildings situated on a 10.87-acre site. The Jefferson Heights property’s unit mix includes 10 one-bedroom/one-bathroom units, 97 two-bedroom/two-bathroom units and 14 three-bedroom/two-bathroom units, with an average unit size of 1,053 square feet. Community amenities include: laundry facilities, a playground and a picnic area. Unit amenities include an appliance package, wood cabinets, hardwood flooring in kitchen areas and patios for some units. Since acquisition, the borrowers have invested approximately $1.6 million into the three properties for interior renovations, appliance upgrades, roof replacement, and exterior renovations. Onsite parking is provided by 227 surface parking spaces, resulting in a parking ratio of approximately 2.3 spaces per unit. As of August 2, 2021, the Jefferson Heights property was 91.7% occupied.
Madison Barracks. The Madison Barracks property is a 127-unit garden style multifamily property located in Sackets Harbor, New York. Built in 1996 and renovated in 2010, the Madison Barracks property consists of 17, predominantly two-story buildings situated on a 7.20-acre site. The Madison Barracks property’s unit mix includes three studio units, 30 one-bedroom/one-bathroom units, 73 two-bedroom/two-bathroom units and 21 three-bedroom/two-bathroom units, with an average unit size of 1,179 square feet. Common area amenities at the Madison Barracks property include laundry facilities at some buildings. Unit amenities include an appliance package, wood cabinets and hardwood flooring in the kitchen areas. Since acquisition, the borrowers have invested approximately $780,550 in the Madison Barracks property to renovate 55 down units, roof replacements and exterior renovations. Onsite parking consists of 250 parking spaces, resulting in a parking ratio of approximately 1.97 spaces per unit. As of August 2, 2021, the Madison Barracks property was 91.3% occupied.
Colonial Manor. The Colonial Manor property is a 71-unit garden style multifamily property located in Watertown, New York. Built in 1972, the Colonial Manor property consists of six, two-story buildings, situated on a 12.53-acre site. The Colonial Manor property’s unit mix includes 12 one-bedroom/one-bathroom units and 59 two-bedroom/two-bathroom units, with an average unit size of 883 square feet. Common area amenities at the Colonial Manor property include a dog park and laundry facilities. Unit amenities include an appliance package, balcony and patios. Since acquisition, the borrowers have invested approximately $30,000 in the Colonial Manor property for appliance upgrades to 20 units and interior renovations to five units. Onsite parking is provided by 45 parking spaces, resulting in a parking ratio of approximately 0.63 spaces per unit. As of August 2, 2021, the Colonial Manor property was 95.8% occupied.
Solar Building. The Solar Building property is a 52,802 square-foot mixed use, multifamily and retail property located in Watertown, New York. Built in 1906 and renovated in 1950, the Solar Building property consists of one, six-story building, situated on a 0.18-acre site. The Solar Building property’s unit mix includes 27 studio units, 26 one-bedroom/one-bathroom units, 16 two-bedroom/one-bathroom units and six commercial units, with an average unit size of 704 square feet. The six commercial units comprise of 7,200 square feet and are leased to three tenants. Common area amenities at the Solar Building property include controlled access, elevator and laundry facilities. Unit amenities include an appliance package, hardwood floors and security systems. Since acquisition, the borrowers have invested approximately $1,244,000 in the Solar Building property for interior renovations to some units, replacing the roof, improvements to the
THE INFORMATION IN THIS STRUCTURAL AND COLLATERAL TERM SHEET IS NOT COMPLETE AND MAY BE AMENDED PRIOR TO THE TIME OF SALE. THIS TERM SHEET IS NOT AN OFFER TO SELL THESE SECURITIES AND IT IS NOT A SOLICITATION OF AN OFFER TO BUY THESE SECURITIES IN ANY JURISDICTION WHERE THE OFFER OR SALE IS NOT PERMITTED.
145
| Structural and Collateral Term Sheet | BBCMS 2021-C11 | |
| No. 14 – Upstate NY Portfolio | ||
plumbing and exterior renovations. On-site parking is not provided for the Solar Building property. As of August 2, 2021, the Solar Building property was 89.0% occupied.
Arsenal Apartments. The Arsenal Apartments property is a 48-unit garden style multifamily property located in Watertown, New York. Built in 1991 and renovated in 2015, the Arsenal Apartments property consists of one, two-story building, situated on a 0.78-acre site. The Arsenal Apartments property’s unit mix includes 44 studio units, three one-bedroom/one-bathroom units and one two-bedroom/two-bathroom unit, with an average unit size of 304 square feet. Common area amenities at the Arsenal Apartments property include laundry facilities. Unit amenities include an appliance package, vinyl flooring and security systems. Since acquisition, the borrowers have invested approximately $775,000 in the Arsenal Apartments property for interior and exterior renovations, common area renovations and plumbing upgrades. Onsite parking is provided via 45 parking spaces, resulting in a parking ratio of approximately 0.94 spaces per unit. As of August 2, 2021, the Arsenal Apartments property was 89.6% occupied.
The following table presents certain information relating to the unit mix of the Upstate NY Portfolio Properties:
| Upstate NY Portfolio Unit Mix(1) | |||||||
| Unit Type | # of Units | % of Total | Occupied Units | Occupancy | Average Unit Size (SF) | Average Monthly Rental Rate | Market Monthly Rental Rate Per Unit(2) |
| Jefferson Heights | |||||||
| 1 Bedroom, 1 Bath | 10 | 2.3% | 9 | 90.0% | 860 | $758 | $800 |
| 2 Bedroom, 2 Bath | 97 | 21.9% | 90 | 92.8% | 980 | $834 | $950 |
| 3 Bedroom, 2 Bath | 14 | 3.2% | 12 | 85.7% | 1,700 | $1,045 | $1,050 |
| Madison Barracks | |||||||
| Studio | 3 | 0.7% | 2 | 66.7% | 600 | $441 | $700 |
| 1 Bedroom, 1 Bath | 30 | 6.8% | 22 | 73.3% | 790 | $769 | $775 |
| 2 Bedroom, 2 Bath | 73 | 16.5% | 71 | 97.3% | 1,215 | $946 | $1,100 |
| 3 Bedroom, 2 Bath | 21 | 4.8% | 21 | 100.0% | 1,692 | $1,030 | $1,400 |
| Colonial Manor | |||||||
| 1 Bedroom, 1 Bath | 12 | 2.7% | 11 | 91.7% | 800 | $806 | $900 |
| 2 Bedroom, 2 Bath | 59 | 13.3% | 57 | 96.6% | 900 | $904 | $1,000 |
| Solar Building | |||||||
| Studio | 27 | 6.1% | 26 | 96.3% | 466 | $539 | $575 |
| 1 Bedroom, 1 Bath | 26 | 5.9% | 25 | 96.2% | 686 | $670 | $675 |
| 2 Bedroom, 1 Bath | 16 | 3.6% | 15 | 93.8% | 949 | $754 | $800 |
| Retail | 6 | 1.4% | 3 | 50.0% | 1,200 | $675 | $650 |
| Arsenal Apartments | |||||||
| Studio | 44 | 10.0% | 39 | 88.6% | 285 | $553 | $600 |
| 1 Bedroom, 1 Bath | 3 | 0.7% | 3 | 100.0% | 474 | $680 | $700 |
| 2 Bedroom, 2 Bath | 1 | 0.2% | 1 | 100.0% | 608 | $705 | $1,100 |
| Total/Wtd. Avg.(3) | 442 | 100.0% | 407 | 92.1% | 921 | $806 | $903 |
| (1) | Based on the underwritten rent rolls dated August 2, 2021. |
| (2) | Market Monthly Rental Rate Per Unit is based on the Appraisals. |
| (3) | Total / Wtd. Avg. is based on number of units of each unit type. |
COVID-19 Update. As of September 2, 2021, the Upstate NY Portfolio Properties were open and operating. As of the date of this term sheet, the Upstate NY Portfolio Mortgage Loan is not subject to any modification or forbearance request.
THE INFORMATION IN THIS STRUCTURAL AND COLLATERAL TERM SHEET IS NOT COMPLETE AND MAY BE AMENDED PRIOR TO THE TIME OF SALE. THIS TERM SHEET IS NOT AN OFFER TO SELL THESE SECURITIES AND IT IS NOT A SOLICITATION OF AN OFFER TO BUY THESE SECURITIES IN ANY JURISDICTION WHERE THE OFFER OR SALE IS NOT PERMITTED.
146
| Structural and Collateral Term Sheet | BBCMS 2021-C11 | |
| No. 14 – Upstate NY Portfolio | ||
The Markets. The following table presents certain market information relating to the Upstate NY Portfolio Properties:
| Market Summary(1) | |||||||
| Property Name | Location | 5-mile Population | 10-mile Population | 15-mile Population | 5-mile Median | 10-mile Median | 15-mile Median Household Income |
| Jefferson Heights | Watertown, NY | 37,234 | 70,808 | 88,413 | $47,208 | $51,010 | $52,045 |
| Madison Barracks | Sackets Harbor, NY | 4,756 | 30,193 | 64,491 | $58,127 | $54,292 | $51,951 |
| Colonial Manor | Watertown, NY | 47,398 | 68,050 | 91,812 | $47,067 | $50,649 | $51,753 |
| Solar Building | Watertown, NY | 37,675 | 69,535 | 91,053 | $47,543 | $50,874 | $51,930 |
| Arsenal Apartments | Watertown, NY | 37,656 | 71,400 | 88,806 | $47,543 | $51,071 | $52,022 |
| (1) | Source: Appraisals. |
Historical and Current Occupancy | |||
| 2018(1) | 2019(1) | 2020(1) | Current(2) |
| 78.8% | 85.1% | 91.1% | 92.7% |
| (1) | Historical occupancy is as of December 31 of each respective year. |
| (2) | Current Occupancy is as of August 2, 2021. |
| Operating History and Underwritten Net Cash Flow | |||||||
| 2018 | 2019 | 2020 | TTM(1) | Underwritten | Per Unit | %(2) | |
| Rents in Place | $1,929,325 | $3,548,029 | $3,868,593 | $4,142,571 | $4,142,571 | $9,501 | 95.5% |
| Other Income(3) | 124,316 | 183,440 | 171,957 | 196,571 | 196,571 | 451 | 4.5 |
| Gross Potential Rent | $2,053,641 | $3,731,469 | $4,040,550 | $4,339,142 | $4,339,142 | $9,952 | 100.0% |
| Total Reimbursements | 0 | 0 | 0 | 0 | 0 | 0 | 0.0 |
| Net Rental Income | $2,053,641 | $3,731,469 | $4,040,550 | $4,339,142 | $4,339,142 | $9,952 | 100.0% |
| (Vacancy/Credit Loss) | (19,028) | (24,624) | (1,090) | (1,888) | (1,888) | (4) | (0.0) |
| (Concessions) | (23,840) | (158,617) | (156,758) | (104,771) | (104,771) | (240) | (2.4) |
| Effective Gross Income | $2,010,774 | $3,548,228 | $3,882,702 | $4,232,483 | $4,232,483 | $9,708 | 97.5% |
| Total Expenses | $977,534 | $1,977,013 | $1,895,316 | $1,966,027 | $1,975,181 | $4,530 | 46.7% |
| Net Operating Income | $1,033,240 | $1,571,215 | $1,987,386 | $2,266,455 | $2,257,302 | $5,177 | 53.3% |
| Total TI/LC, Capex/RR | 0 | 0 | 0 | 0 | 119,140 | 273 | 2.8 |
| Net Cash Flow | $1,033,240 | $1,571,215 | $1,987,386 | $2,266,455 | $2,138,162 | $4,904 | 50.5% |
| (1) | TTM column represents the trailing 12 months ending July 2021. |
| (2) | % column represents percentage of Net Rental Income for all revenue lines and represents percentage of Effective Gross Income for the remainder of fields. |
| (3) | Other Income consists of laundry facilities fees, security deposits, pet fees, cleaning fees, late fees and application fees. |
THE INFORMATION IN THIS STRUCTURAL AND COLLATERAL TERM SHEET IS NOT COMPLETE AND MAY BE AMENDED PRIOR TO THE TIME OF SALE. THIS TERM SHEET IS NOT AN OFFER TO SELL THESE SECURITIES AND IT IS NOT A SOLICITATION OF AN OFFER TO BUY THESE SECURITIES IN ANY JURISDICTION WHERE THE OFFER OR SALE IS NOT PERMITTED.
147
| Structural and Collateral Term Sheet | BBCMS 2021-C11 |
| No. 15 – Wyndham National Hotel Portfolio |
| Mortgage Loan Information | Property Information | |||
| Mortgage Loan Seller: | UBS AG | Single Asset / Portfolio: | Portfolio | |
| Original Principal Balance(1): | $20,000,000 | Title(3): | Various | |
| Cut-off Date Principal Balance(1): | $19,130,750 | Property Type – Subtype: | Hospitality – Limited Service | |
| % of IPB: | 1.9% | Net Rentable Area (Rooms): | 3,729 | |
| Loan Purpose: | Acquisition | Location: | Various | |
| Borrower: | Lodging Enterprises, LLC | Year Built / Renovated: | Various / Various | |
| Borrower Sponsor: | Tom Vukota | Occupancy / ADR / RevPAR: | 54.0% / $69.35 / $37.43 | |
| Interest Rate: | 4.85000% | Occupancy / ADR / RevPAR Date: | 7/31/2021 | |
| Note Date: | 11/27/2019 | 4th Most Recent NOI (As of): | $24,470,573 (12/31/2018) | |
| 3rd Most Recent NOI (As of): | $21,959,585 (12/31/2019) | |||
| Maturity Date: | 12/6/2029 | 2nd Most Recent NOI (As of): | $19,468,261 (12/31/2020) | |
| Interest-only Period: | None | Most Recent NOI (As of): | $19,744,845 (TTM 7/31/2021) | |
| Original Term: | 120 months | UW Occupancy / ADR / RevPAR: | 54.0% / $69.35 / $37.43 | |
| Original Amortization Term: | 270 months | UW Revenues: | $64,113,826 | |
| Amortization Type: | Amortizing Balloon | UW Expenses: | $43,686,317 | |
| Call Protection(2): | L(24),YM2(92),O(4) | UW NOI: | $20,427,509 | |
| Lockbox / Cash Management: | Hard / Springing | UW NCF: | $17,862,956 | |
| Additional Debt(1): | Yes | Appraised Value / Per Room(4): | $215,000,000 / $57,656 | |
| Additional Debt Balance(1): | $119,567,189 | Appraisal Date: | 8/1/2019 | |
| Additional Debt Type(1): | Pari Passu | |||
| Escrows and Reserves | Financial Information(1) | ||||||
| Initial | Monthly | Initial Cap | Cut-off Date Loan / Room: | $37,194 | |||
| Maturity Date Loan / Room: | $26,916 | ||||||
| Taxes: | $436,502 | $160,955 | N/A | Cut-off Date LTV(4): | 64.5% | ||
| Insurance: | $790,391 | $116,681 | N/A | Maturity Date LTV(4): | 46.7% | ||
| FF&E Reserve: | $0 | $235,965 | N/A | UW NCF DSCR: | 1.69x | ||
| Immediate Repairs Reserve: | $2,014,340 | $0 | N/A | UW NOI Debt Yield: | 14.7% | ||
| Replacement Reserve: | $7,417,247 | $235,965 | N/A | ||||
| Railroad Contract Renewal Reserve: | $7,000,000 | $0 | N/A | ||||
| Post-Closing Obligations Reserve: | $500,000 | $0 | N/A | ||||
| Sources and Uses | |||||||
| Sources | Proceeds | % of Total | Uses | Proceeds | % of Total | ||
| Whole Loan(1) | $145,000,000 | 59.7% | Purchase Price(5) | $215,500,000 | 88.7% | ||
| Borrower Sponsor Equity | 97,876,778 | 40.3 | Upfront Reserves | 18,158,480 | 7.5 | ||
| Closing Costs | 9,218,299 | 3.8 | |||||
| Total Sources | $242,876,778 | 100.0% | Total Uses | $242,876,778 | 100.0% | ||
| (1) | The Wyndham National Hotel Portfolio Mortgage Loan (as defined below) is part of a whole loan evidenced by 12 pari passu promissory notes with an aggregate Cut-off Date balance of approximately $138,697,940. The financial information presented in the chart above reflects the Wyndham National Hotel Portfolio Whole Loan (as defined below). |
| (2) | Partial release is permitted. See “Description of the Mortgage Pool—Certain Terms of the Mortgage Loans—Releases; Partial Releases” in the Preliminary Prospectus. |
| (3) | The Wyndham National Hotel Portfolio Whole Loan is secured by the borrower’s fee simple interest in 43 properties and fee simple/leasehold interests in the Travelodge - 2307 Wyoming Avenue property. |
| (4) | The Appraised Value / Per Room, Cut-off Date LTV and Maturity Date LTV are based on the aggregate sum of the available “as is” and “as complete” appraised values for each property on an individual basis of $215,000,000 as of August 1, 2019. On a stand-alone basis, the Wyndham National Hotel Portfolio Properties (as defined below) have an aggregate “as is” appraised value of $209,500,000 as of August 1, 2019. The Cut-off Date LTV and Maturity Date LTV based on the aggregate stand-alone “as is” appraised value of $209,500,000 are 66.2% and 47.9%, respectively. |
| (5) | Includes one property with an allocated purchase price of $3,000,000 that is not collateral for the Wyndham National Hotel Portfolio Whole Loan. |
The Loan. The Wyndham National Hotel Portfolio mortgage loan (the “Wyndham National Hotel Portfolio Mortgage Loan”) is part of a whole loan evidenced by 12 pari passu notes with an aggregate original principal balance of $145,000,000 (the “Wyndham National Hotel Portfolio Whole Loan”). The Wyndham National Hotel Portfolio Whole Loan is secured by first priority fee or fee/leasehold mortgages encumbering a 44-property, limited service hospitality portfolio totaling 3,729 rooms located across 23 states (each, a “Wyndham National
THE INFORMATION IN THIS STRUCTURAL AND COLLATERAL TERM SHEET IS NOT COMPLETE AND MAY BE AMENDED PRIOR TO THE TIME OF SALE. THIS TERM SHEET IS NOT AN OFFER TO SELL THESE SECURITIES AND IT IS NOT A SOLICITATION OF AN OFFER TO BUY THESE SECURITIES IN ANY JURISDICTION WHERE THE OFFER OR SALE IS NOT PERMITTED.
148
| Structural and Collateral Term Sheet | BBCMS 2021-C11 |
| No. 15 – Wyndham National Hotel Portfolio |
Hotel Portfolio Property”, and collectively, the “Wyndham National Hotel Portfolio Properties” or the “Wyndham National Hotel Portfolio”). Promissory Note A-2, with an original principal balance of $20,000,000, represents the Wyndham National Hotel Portfolio Mortgage Loan, and will be included in the BBCMS 2021-C11 Trust. The below table summarizes the Wyndham National Hotel Portfolio Whole Loan, including the remaining promissory notes. The mortgage loan seller provides no assurances that the non-securitized notes will not be split further. The Wyndham National Hotel Portfolio Whole Loan is serviced pursuant to the pooling and servicing agreement for the UBS 2019-C18 Trust. See “Description of the Mortgage Pool—The Whole Loans—The Non-Serviced Pari Passu Whole Loans” and “Pooling and Servicing Agreement—Servicing of the Non-Serviced Mortgage Loans” in the Preliminary Prospectus.
| Whole Loan Summary | ||||
| Note | Original Balance | Cut-off Date Balance | Note Holder | Controlling Piece |
| A-1 | $25,000,000 | $23,913,438 | UBS 2019-C18 | Yes |
| A-2 | $20,000,000 | $19,130,750 | BBCMS 2021-C11 | No |
| A-3 | $20,000,000 | $19,130,750 | UBS AG | No |
| A-4 | $20,000,000 | $19,130,750 | UBS AG | No |
| A-5 | $10,000,000 | $9,565,375 | BBCMS 2021-C10 | No |
| A-6 | $10,000,000 | $9,565,375 | UBS AG | No |
| A-7 | $10,000,000 | $9,565,375 | UBS AG | No |
| A-8 | $10,000,000 | $9,565,375 | UBS 2019-C18 | No |
| A-9 | $5,000,000 | $4,782,688 | UBS AG | No |
| A-10 | $5,000,000 | $4,782,688 | UBS AG | No |
| A-11 | $5,000,000 | $4,782,688 | UBS AG | No |
| A-12 | $5,000,000 | $4,782,688 | UBS AG | No |
| Total | $145,000,000 | $138,697,940 | ||
The Properties. The Wyndham National Hotel Portfolio is comprised of 44 limited service hospitality properties totaling 3,729 rooms. The hotels range in size from 21 to 192 rooms with an average count of 85 rooms. The portfolio benefits from geographic diversity across 23 states, in addition to an overall granular property mix. No individual Wyndham National Hotel Portfolio Property accounts for greater than 5.1% of total rooms or 9.1% of underwritten net cash flow. The Wyndham National Hotel Portfolio Properties were built between 1978 and 2015, with an average year built of 2001. Renovations have occurred at 19 of the Wyndham National Hotel Portfolio Properties since 2013, representing 48.7% of the portfolio based on underwritten net cash flow.
Since 2013, approximately $20.6 million ($5,535 per room) was spent on FF&E and capital improvements at the Wyndham National Hotel Portfolio Properties. At loan origination, approximately $7.4 million was escrowed in connection with the scheduled property improvement plans (“PIP”), which represents 115% of the estimated cost of the current brand mandated PIP work at the Wyndham National Hotel Portfolio Properties.
| Portfolio Overview | |||||||||||
| Property Flag | No. of Properties | Rooms | % of Total Rooms | Allocated Whole Loan Cut-Off Date Balance | % of Allocated Whole Loan Cut-off Date Balance | Appraised Value(1) | Cut-off Date LTV (1) | UW NCF | % of UW NCF | UW NCF DSCR | UW NOI Debt Yield |
| Travelodge | 27 | 2,064 | 55.3% | $80,322,408 | 57.9% | $115,700,000 | 69.4% | $10,264,417 | 57.5% | 1.67x | 14.6% |
| Baymont Inn & Suites | 14 | 1,356 | 36.4% | $48,485,780 | 35.0% | $83,300,000 | 58.2% | $7,062,302 | 39.5% | 1.91x | 16.6% |
| Super 8 | 2 | 235 | 6.3% | $8,416,573 | 6.1% | $13,500,000 | 62.3% | $384,060 | 2.2% | 0.60x | 5.6% |
| Days Inn | 1 | 74 | 2.0% | $1,473,179 | 1.1% | $2,500,000 | 58.9% | $152,177 | 0.9% | 1.35x | 13.6% |
| Total/Wtd. Avg. | 44 | 3,729 | 100.0% | $138,697,940 | 100.0% | $215,000,000 | 64.5% | $17,862,956 | 100.0% | 1.69x | 14.7% |
| (1) | Appraised Value and Cut-off Date LTV are based on the aggregate sum of the available “as is” and “as complete” appraised values for each property on an individual basis of $215,000,000 as of August 1, 2019. On a stand-alone basis, the Wyndham National Hotel Portfolio Properties have an aggregate “as is” appraised value of $209,500,000 as of August 1, 2019. The Cut-off Date LTV based on the aggregate stand-alone “as is” appraised value of $209,500,000 is 66.2%. |
The Wyndham National Hotel Portfolio Properties operate under franchise agreements with subsidiaries of Wyndham Hotel & Resorts, Inc. (“Wyndham”), all of which were renewed for 15-year terms upon acquisition and have an expiration date of January 1, 2035. The franchise agreements stipulate a combined royalty and system assessment fee per annum of $16,778 per hotel, payable in equal monthly installments.
Wyndham is a global hotel franchisor company, operating in approximately 95 countries and territories under 20 brand names. As of year-end 2020, Wyndham had 49,400 rooms associated with company-owned and/or managed properties and 746,500 rooms associated with franchised properties, for a total of 795,900 rooms (8,941 properties). Wyndham’s portfolio of global brands includes Super 8, Days Inn, Ramada, La Quinta, Howard Johnson, Baymont Inn & Suites, Travelodge, Microtel, Wyndham Garden, TRYP, and Wyndham Grand. Approximately 61% and 32% of its franchised hotels operate within the economy and midscale segments, respectively.
THE INFORMATION IN THIS STRUCTURAL AND COLLATERAL TERM SHEET IS NOT COMPLETE AND MAY BE AMENDED PRIOR TO THE TIME OF SALE. THIS TERM SHEET IS NOT AN OFFER TO SELL THESE SECURITIES AND IT IS NOT A SOLICITATION OF AN OFFER TO BUY THESE SECURITIES IN ANY JURISDICTION WHERE THE OFFER OR SALE IS NOT PERMITTED.
149
| Structural and Collateral Term Sheet | BBCMS 2021-C11 |
| No. 15 – Wyndham National Hotel Portfolio |
Based on the trailing 12-month period ending July 31, 2021, the Wyndham National Hotel Portfolio Properties as a whole outperformed their competitive set with occupancy, ADR and RevPAR penetration rates in excess of 100.0%. On an individual property basis, 63.6%, 43.2% and 52.3% of the Wyndham National Hotel Portfolio Properties, based on property count, outperformed their competitive set with occupancy, ADR and RevPAR penetration rates in excess of 100.0%, respectively.
Occupancy, ADR, and RevPAR of the Wyndham National Hotel Portfolio Properties in relation to their respective competitive sets are provided below:
| Historical Occupancy, ADR, RevPAR(1)(2)(3) | |||||||||
Competitive Set | Wyndham National Hotel Portfolio | Penetration Factor | |||||||
| Year | Occupancy | ADR | RevPAR | Occupancy | ADR | RevPAR | Occupancy | ADR | RevPAR |
| 2018 | 56.1% | $83.18 | $46.62 | 73.2% | $55.76 | $40.80 | 133.1% | 74.9% | 99.6% |
| 2019(4) | 56.1% | $79.96 | $44.88 | 68.6% | $58.29 | $40.01 | 124.6% | 79.8% | 100.3% |
| 2020 | 35.2% | $62.85 | $22.09 | 51.5% | $50.06 | $25.80 | 155.3% | 85.0% | 133.4% |
| TTM(5) | 49.0% | $73.37 | $35.94 | 54.1% | $68.34 | $36.99 | 112.3% | 103.5% | 114.0% |
| (1) | Data provided by third party market research reports. |
| (2) | The variances between the underwriting, the appraisal and the industry report data with respect to Occupancy, ADR and RevPAR at Wyndham National Hotel Portfolio Properties are attributable to differing reporting methodologies, and/or timing differences. |
| (3) | Metrics are based on the weighted average of the Wyndham National Hotel Portfolio Properties room count. |
| (4) | Information for the Travelodge - 2680 Airport Road property is based on the industry report as of 8/31/2019 TTM as the operating performance of its competitive set was unavailable between September 2019 and December 2019 as such hotels did not report to the third party market research report during this period. |
| (5) | TTM represents the trailing 12-month period ending July 31, 2021. |
Each Wyndham National Hotel Portfolio Property, with the exception of the Travelodge - 1177 East 16th Street property, benefits from corporate contracts with one (or, at two properties, two) of four North American railway companies, Union Pacific Railroad Company (Moody’s/S&P: Baa1/A-), BNSF Railway Company (Moody’s/S&P: A3/A+), CSX Transportation, Inc. (Moody’s/S&P: Baa1/BBB+) and Canadian Pacific Railway Company (S&P: BBB+) (each, a “Railway Company”). The current Railway Company contracts typically have a term of five years, with renewal options. At loan origination, an upfront $7.0 million Rail Contract Renewal Reserve was escrowed related to the renewal of the UP15 Railroad Contract, a lodging facility agreement dated November 1, 2015 between Union Pacific and the borrower sponsor, covering 15 Wyndham National Hotel Portfolio Properties as detailed in the related Wyndham National Hotel Portfolio Whole Loan documents.
Amenities available at most of the Wyndham National Hotel Portfolio Properties include meeting rooms, fitness centers, self-service guest laundry, high-speed internet, and private lounges dedicated to the railway crew members. Certain hotels feature computer workstations, entertainment game rooms, oversized vehicle parking, dedicated locker rooms, and other amenities. The rooms at the Wyndham National Hotel Portfolio Properties were specifically designed to comply with “Dark and Quiet” requirements as stipulated in the contracts. Such “Dark and Quiet” specifications include noise abatement measures, and light-proofing measures such as custom curtains and blackout drapes that seal from wall to center and door sweeps, and more. Each room is equipped with an individual HVAC unit, a remote guest detection/energy management system, and a television set with cable and/or satellite service. Additionally, 27 of the 44 Wyndham National Hotel Portfolio Properties are serviced by a 24-hour on-site restaurant, Penny’s Diner.
COVID-19 Update. As of August 31, 2021, the Wyndham National Hotel Portfolio Properties were open and operating. All of the Wyndham National Hotel Portfolio Properties continued operating through the pandemic period as essential businesses through their support of the railroad industry. Throughout the COVID-19 pandemic, 42.4% of the total contracted room nights was renewed. The borrower sponsor was able to successfully renew contracts with expiration dates in 2020 and 2021, including the UP15 Railroad Contract. Union Pacific and the borrower sponsor agreed to a three-year extension of the UP15 Railroad Contract in October 2020. The renewal took effect on November 1, 2020 and will guaranty the payments from Union Pacific of approximately $15.4 million through October 31, 2023. While there was a decrease in the number of guaranteed room nights from 783 to 679, the ADR of the Wyndham National Hotel Portfolio Properties increased 6.5% to $50.20, increased food and beverage subsidies by 74.7% (to $542,800) and transportation revenue by 28.1% (to $1,709,000). The Union Pacific contract at the Travelodge - 1710 Jefferson Street property was not renewed. That contract represented 16,790 annual rooms, which equated to approximately 2.0% of the overall guaranteed room nights underwritten at the time of origination. A new contract with a new rail company not previously included at origination, Norfolk Southern, was added to the Baymont Inn & Suites - 3475 Union Road property in November 2020 through May 2022 at $59.00 per night with no guaranteed minimum stays. Since origination, after giving effect to the rail companies having adjusted their guaranteed room nights in accordance with their contracts, non-renewed contracts, and new contracts added, the net effect to total guaranteed room nights as of July 2021 in comparison to loan origination is a decrease of 11.1%. In that same period, the average ADR under the contracts has increased by 4.3%, resulting in a net effect to contract value of -7.3% during the COVID-19 pandemic. The non-rail business was affected in line with all hospitality product, as transient hospitality reduced during the COVID-19 pandemic and has recovered well at a 16.5% increase in the T-12 through July 2021 over 2020. Of note, July 2021 saw a 12.8% increase in month-over-month non-rail revenue and a 50.1% increase year-over-year. The PIP work at each Wyndham National Hotel Portfolio Property was scheduled to take place in the second and third quarters of 2020. Due to the COVID-19 pandemic, the PIP work was put on hold to prevent additional persons from entering the Wyndham National Hotel Portfolio Properties. The PIP work is currently underway and a draw request was submitted to the lender for approval in May 2021. As of August 31, 2021, the Wyndham National Hotel Portfolio Whole Loan is not subject to any forbearance, modification or debt service relief requests.
��
THE INFORMATION IN THIS STRUCTURAL AND COLLATERAL TERM SHEET IS NOT COMPLETE AND MAY BE AMENDED PRIOR TO THE TIME OF SALE. THIS TERM SHEET IS NOT AN OFFER TO SELL THESE SECURITIES AND IT IS NOT A SOLICITATION OF AN OFFER TO BUY THESE SECURITIES IN ANY JURISDICTION WHERE THE OFFER OR SALE IS NOT PERMITTED.
150
| Structural and Collateral Term Sheet | BBCMS 2021-C11 |
| No. 15 – Wyndham National Hotel Portfolio |
The Markets. The Wyndham National Hotel Portfolio’s largest room count concentrations by state are Wyoming (six hotels), Nebraska (four hotels), Kansas (five hotels) and New Mexico (three hotels), which collectively comprise 49.9% of the total rooms and 52.1% of the UW NCF. The Wyndham National Hotel Portfolio Properties are strategically located in close proximity to high volume railroad hubs and switching terminals, as well as major highways. Demand at the Wyndham National Hotel Portfolio Properties is supplemented by walk-in and transient guest business.
A summary of the Wyndham National Hotel Portfolio Properties based on geographical distribution is provided below:
| Distribution By State | ||||||||||
| State | No. of Properties | No. of Rooms | % of Total Rooms | Allocated Whole Loan Cut-Off Date Balance | % of Allocated Whole Loan Cut-off Date Balance | UW Occupancy | UW ADR | UW RevPAR | Appraised Value(1) | Cut-off Date LTV (1) |
| AZ | 2 | 191 | 5.1% | $8,453,305 | 6.1% | 69.5% | $59.20 | $41.13 | $12,400,000 | 68.2% |
| CA | 2 | 86 | 2.3% | $1,397,121 | 1.0% | 57.5% | $72.39 | $41.59 | $2,600,000 | 53.7% |
| CO | 1 | 37 | 1.0% | $309,079 | 0.2% | 32.7% | $114.05 | $37.27 | $900,000 | 34.3% |
| IA | 2 | 164 | 4.4% | $5,209,210 | 3.8% | 51.6% | $67.16 | $34.65 | $7,200,000 | 72.4% |
| KS | 5 | 449 | 12.0% | $12,746,355 | 9.2% | 48.3% | $66.08 | $31.93 | $20,700,000 | 61.6% |
| LA | 1 | 60 | 1.6% | $2,824,846 | 2.0% | 60.6% | $75.86 | $46.00 | $4,200,000 | 67.3% |
| MD | 1 | 25 | 0.7% | $765,230 | 0.6% | 38.0% | $145.01 | $55.06 | $800,000 | 95.7% |
| MN | 1 | 56 | 1.5% | $575,948 | 0.4% | 52.0% | $77.53 | $40.30 | $1,900,000 | 30.3% |
| MO | 2 | 210 | 5.6% | $8,042,737 | 5.8% | 42.1% | $72.89 | $30.68 | $14,400,000 | 55.9% |
| MT | 2 | 138 | 3.7% | $5,764,378 | 4.2% | 62.8% | $81.73 | $51.30 | $8,200,000 | 70.3% |
| ND | 1 | 74 | 2.0% | $1,473,179 | 1.1% | 69.9% | $56.95 | $39.82 | $2,500,000 | 58.9% |
| NE | 4 | 464 | 12.4% | $16,008,816 | 11.5% | 41.8% | $67.05 | $28.04 | $23,900,000 | 67.0% |
| NM | 3 | 274 | 7.3% | $14,915,613 | 10.8% | 83.2% | $57.45 | $47.77 | $18,400,000 | 81.1% |
| NV | 1 | 119 | 3.2% | $4,015,735 | 2.9% | 67.5% | $60.69 | $40.98 | $6,500,000 | 61.8% |
| NY | 1 | 56 | 1.5% | $1,222,674 | 0.9% | 57.6% | $75.94 | $43.75 | $3,800,000 | 32.2% |
| OK | 1 | 61 | 1.6% | $2,047,623 | 1.5% | 64.2% | $58.40 | $37.47 | $3,700,000 | 55.3% |
| OR | 1 | 86 | 2.3% | $3,893,881 | 2.8% | 64.4% | $63.09 | $40.61 | $6,500,000 | 59.9% |
| SD | 1 | 55 | 1.5% | $2,118,372 | 1.5% | 50.1% | $87.51 | $43.84 | $3,100,000 | 68.3% |
| TN | 1 | 103 | 2.8% | $4,464,301 | 3.2% | 49.0% | $70.33 | $34.43 | $8,000,000 | 55.8% |
| TX | 3 | 241 | 6.5% | $8,658,124 | 6.2% | 56.5% | $73.02 | $41.29 | $16,600,000 | 52.2% |
| UT | 1 | 75 | 2.0% | $2,312,622 | 1.7% | 59.2% | $61.66 | $36.50 | $3,400,000 | 68.0% |
| VA | 1 | 30 | 0.8% | $3,230,048 | 2.3% | 65.2% | $108.95 | $71.03 | $3,700,000 | 87.3% |
| WY | 6 | 675 | 18.1% | $28,248,741 | 20.4% | 45.6% | $77.64 | $35.43 | $41,600,000 | 67.9% |
| Total/Wtd. Avg. | 44 | 3,729 | 100.0% | $138,697,940 | 100.0% | 54.0% | $69.35 | $37.43 | $215,000,000 | 64.5% |
| (1) | Appraised Value and Cut-off Date LTV are based on the aggregate sum of the available “as is” and “as complete” appraised values for each property on an individual basis of $215,000,000 as of August 1, 2019. On a stand-alone basis, the Wyndham National Hotel Portfolio Properties have an aggregate “as is” appraised value of $209,500,000 as of August 1, 2019. The Cut-off Date LTV based on the aggregate stand-alone “as is” appraised value of $209,500,000 is 66.2%. |
| Operating History and Underwritten Net Cash Flow | ||||||
| 2018 | 2019 | 2020 | July 2021 TTM | UW | UW Per Room | |
| Occupancy | 72.9% | 68.3% | 52.6% | 54.0% | 54.0% | |
| ADR | $55.92 | $60.43 | $69.99 | $69.35 | $69.35 | |
| RevPAR | $40.79 | $41.28 | $36.80 | $37.43 | $37.43 | |
| Rooms Revenue | $55,521,726 | $56,181,472 | $50,230,202 | $50,949,689 | $50,949,689 | $13,663 |
| Food & Beverage | 11,171,202 | 10,954,219 | 8,683,823 | 9,881,455 | 9,881,455 | 2,650 |
| Other Income | 3,353,940 | 3,195,108 | 3,032,945 | 3,282,682 | 3,282,682 | 880 |
| Total Revenue | $70,046,868 | $70,330,799 | $61,946,970 | $64,113,826 | $64,113,826 | $17,193 |
| Total Expenses | $45,576,295 | $48,371,215 | $42,478,709 | $44,368,981 | $43,686,317 | $11,715 |
| Net Operating Income | $24,470,573 | $21,959,585 | $19,468,261 | $19,744,845 | $20,427,509 | $5,478 |
| FF&E(1) | 1,665,659 | 1,139,804 | 0 | 0 | 2,564,553 | 688 |
| Net Cash Flow | $22,804,914 | $20,819,781 | $19,468,261 | $19,744,845 | $17,862,956 | $4,790 |
| (1) | FF&E includes revenue derived primarily from the operation of a 24-hour on-site restaurant, Penny’s Diner, at 27 of the 44 Wyndham National Hotel Portfolio Properties. |
THE INFORMATION IN THIS STRUCTURAL AND COLLATERAL TERM SHEET IS NOT COMPLETE AND MAY BE AMENDED PRIOR TO THE TIME OF SALE. THIS TERM SHEET IS NOT AN OFFER TO SELL THESE SECURITIES AND IT IS NOT A SOLICITATION OF AN OFFER TO BUY THESE SECURITIES IN ANY JURISDICTION WHERE THE OFFER OR SALE IS NOT PERMITTED.
151
| Structural and Collateral Term Sheet | BBCMS 2021-C11 |
| Contacts |
| Barclays CMBS Capital Markets & Banking | ||
| Contact | Phone Number | |
| Daniel Vinson | daniel.vinson@barclays.com | (212) 528-8224 |
| Managing Director | ||
| Daniel Schmidt | daniel.schmidt@barclays.com | (212) 528-7479 |
| Director | ||
| Sammy Hamididdin | sammy.hamididdin@barclays.com | (212) 526-4751 |
| Director | ||
| Barclays CMBS Trading | ||
| Contact | Phone Number | |
| David Kung | david.kung@barclays.com | (212) 528-7374 |
| Director | ||
| Peter Taylor | peter.w.taylor@barclays.com | (212) 526-1528 |
| Vice President | ||
| Barclays Securitized Products Syndicate | ||
| Contact | Phone Number | |
| Brian Wiele | brian.wiele@barclays.com | (212) 412-5780 |
| Managing Director | ||
| Sean Foley | sean.foley@barclays.com | (212) 412-5780 |
| Vice President | ||
| Societe Generale CMBS Capital Markets & Banking | ||
| Contact | Phone Number | |
| Adam Ansaldi | adam.ansaldi@sgcib.com | (212) 278-6126 |
| Managing Director | ||
| Jim Barnard | jim.barnard@sgcib.com | (212) 278-6263 |
| Director | ||
| Justin Cappuccino | justin.cappuccino@sgcib.com | (212) 278-6393 |
| Director | ||
| UBS CMBS Capital Markets & Banking | ||
| Contact | Phone Number | |
| Nicholas Galeone | nicholas.galeone@ubs.com | (212) 891-5702 |
| Executive Director | ||
| Siho Ham | siho.ham@ubs.com | (212) 713-1278 |
| Executive Director | ||
THE INFORMATION IN THIS STRUCTURAL AND COLLATERAL TERM SHEET IS NOT COMPLETE AND MAY BE AMENDED PRIOR TO THE TIME OF SALE. THIS TERM SHEET IS NOT AN OFFER TO SELL THESE SECURITIES AND IT IS NOT A SOLICITATION OF AN OFFER TO BUY THESE SECURITIES IN ANY JURISDICTION WHERE THE OFFER OR SALE IS NOT PERMITTED.
152