 |  |
December 6, 2017
VIA EDGAR TRANSMISSION
Daniel F. Duchovny
Special Counsel
Office of Mergers and Acquisitions
United States Securities and Exchange Commission
100 F Street, N.E.
Washington, D.C. 20549
| Re: | Deckers Outdoor Corporation (“Deckers” or the “Company”) |
Definitive Additional Materials on Schedule 14A
Filed by Marcato International Master Fund, LTD., et. al. (“Marcato”)
on November 30 and December 4, 2017
FileNo. 001-36436
Dear Mr. Duchovny:
We are writing on behalf of Marcato in response to the comments of the staff (the “Staff”) of the Office of Mergers and Acquisitions of the Securities and Exchange Commission (the “Commission”) set forth in the letter dated December 4, 2017 (the “Comment Letter”), with respect to Marcato’s solicitation of proxies from the stockholders of the Company to elect three (3) nominees to the Company’s board of directors (the “Board”).
Each comment of the Staff is set forth below, followed by the corresponding response. For ease of reference the heading and numbered paragraphs below correspond to the heading and numbered comments in the Comment Letter.
Definitive Additional Soliciting Materials filed November 30, 2017
| 1. | You must avoid issuing statements that directly or indirectly impugn the character, integrity or personal reputation or make charges of illegal, improper or immoral conduct without factual foundation. Provide us supplementally, or disclose, the factual foundation for the statements listed below. In this regard, note that the factual foundation for such assertion must be reasonable. Refer to Rule14a-9. We note your disclosure that: |
| • | “…Deckers has inundated stockholders with falsities…” |
With respect to Marcato’s statement that “Deckers has inundated stockholders with falsities regarding its ‘measurable progress’ and ‘business transformation,’” Marcato respectfully notes that slides 31 and 44 of Marcato’s stockholder presentation filed with the Commission on Schedule 14A on November 13, 2017 (the “Stockholder
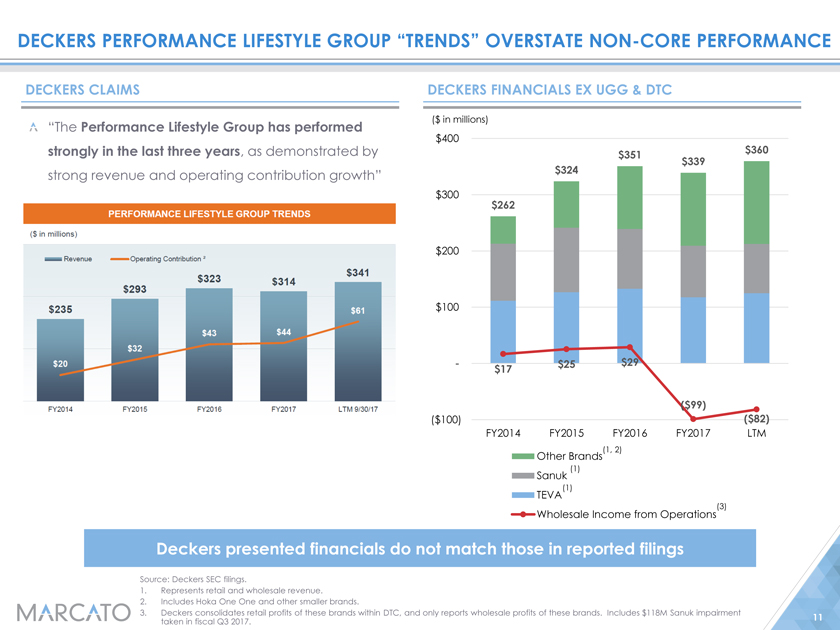
Presentation”) and attached hereto asExhibit A, provide factual foundation for such statement. Each of these slides demonstrate falsities Deckers has made in communications with stockholders regarding the Company’s capital structure plan and profit improvement goals. Additionally, slides 4, 5, 6, 8, 9 and 11 of Marcato’s stockholder presentation filed with the Commission on Schedule 14A on November 21, 2017 (the “Response Presentation”) and attached hereto asExhibit B, provide further factual foundation for such statement. Slides 4 and 5 of the Response Presentation reflect falsities communicated by the Company to its stockholders regarding Deckers’ claims with respect to when its “business transformation” plan commenced. Slides 6, 8, 9 and 11 of the Response Presentation reflect falsities communicated by the Company to its stockholders regarding the Company’s total shareholder returns, the performance of the Company’s stock price during the tenure of each of the Company’s independent, incumbent directors, the use of total shareholder return as a metric in current compensation plans and the performance of the Company’s Performance Lifestyle Group, respectively.
| • | “…Deckers consolidated its retail ande-commerce segments to form a single Direct-to-Consumer segment: we believe that this constitutes aDESPERATEattempt toCAMOUFLAGEitsEVEN WEAKERstandalone retail performance.” (emphasis added). |
| • | “We can only assume that Deckers took such steps to mask the deterioration of its retail store network…” |
With respect to Marcato’s statements that “Deckers consolidated its retail ande-commerce segments to form a single Direct-to-Consumer segment: we believe that this constitutes aDESPERATEattempt toCAMOUFLAGE itsEVEN WEAKER standalone retail performance” and “We can only assume that Deckers took such steps to mask the deterioration of its retail store network,” we refer the Commission to slides 25 and 26 of the Stockholder Presentation for the factual foundation for such statements. These slides demonstrate that, after four straight quarters of same store sales declines, Deckers consolidated its retail ande-commerce segments and stopped reporting standalone retail same store sales. As noted on slide 26 of the Stockholder Presentation, this combination in reporting makes it very difficult to isolate retail results, and thus, effectively camouflages the Company’s standalone retail performance. Furthermore, in the report published by Institutional Shareholder Services, Inc. (“ISS”) with respect to the Company, ISS highlighted that “it is somewhat disconcerting that, in the face of clear investor demand for the information, [Deckers] would not commit to continue to break out more granular detail regarding store and individual brand results, especially given that this is a key criticism raised by [Marcato]. While management has stated that shared costs and results have entangled retail and ecommerce operations past the point of being easily segregated (for instance, an online sale can be made at a kiosk within a company store), this would not preclude the company from providing estimates, or reporting the points of information which remain reasonably discernable without applying assumptions.” It is Marcato’s reasonable belief that the Company’s refusal to provide such readily available information is likely because such results had not improved. In other words, Marcato believes that it is highly unlikely that the Company would have withheld such information had results improved.
2
Additionally, Marcato notes that the Commission has highlighted the importance of segment reporting, and representatives of the Commission have publicly stated that “segment reporting is by no means a new topic of conversation . . . but the importance to investors is undeniable. Segment disclosures are often described as the unit of valuation by an analyst and arguably one of the most important disclosures in the financial statements.”1 Given this importance and the lack of any viable explanation from the Company as to its rationale for ceasing to provide any standalone information with respect to its retail business, Marcato finds no reason more likely for Deckers to have combined its retail ande-commerce reporting segments than an attempt to mask the deterioration of its retail store network.
| 2. | We note your disclosure regarding the Sterne Agee report dated February 5, 2016. Please tell us, with a view towards revised disclosure, whether Sterne Agee has issued a report since then that presents an improved view of investing in the company’s stock. |
In response to the Staff’s comment, Marcato respectfully notes that Sterne Agee ceased coverage of the Company as of May 2016 and issued its last report on the Company on May 26, 2016 (the “May 26 Report”). Marcato respectfully submits that in each report following its February 5, 2016 report (the “February 5 Report”), Stern Agee reiterated its “Underperform” rating for the Company. According to these reports, “Underperform” means that Sterne Agee “expect[s Deckers’] stock to underperform the industry over the next 12 months.” Furthermore, in the May 26 Report, Sterne Agee lowered its estimates for the Company, criticized management’s decision to add lower tier distribution and claimed the “UGG brand may be in a dicey situation.” Marcato therefore respectfully submits that following the February 5 Report, Sterne Agee did not issue a report that presented an improved view of investing in the Company’s stock.
Definitive Additional Soliciting Materials filed December 4, 2017
| 3. | Please provide us supplementally support for each of the statements attributed to ISS in its ISS December 1, 2017 report. |
Marcato acknowledges the Staff’s comment and is providing to the Staff on a supplemental basis the ISS Governance Services US Proxy Advisory Services report dated December 1, 2017 with respect to Deckers’ 2017 annual meeting of stockholders (the “ISS Report”). Each of the ISS quotations, in the order they are presented in Marcato’s letter, dated December 4, 2017, were set forth on pages 1, 28, 20, 23, 24, 21, 24 and 24 of the ISS Report, respectively.
* * *
| 1 | See Dan Murdock, Deputy Chief Accountant, SEC, Remarks before the 2014 AICPA National Conference on Current SEC and PCAOB Developments (Dec. 8, 2014), https://www.sec.gov/news/speech/2014-spch120814dm. |
3
Please do not hesitate to contact me at212-504-5757 if there are any comments or questions concerning the foregoing or if I can be of assistance in any way.
| Sincerely, |
| /s/ Richard M. Brand |
| Richard M. Brand |
| cc: | Richard T. McGuire III |
Managing Partner
Marcato Capital Management LP
Frank Pigott
Staff Attorney
United States Securities and Exchange Commission
4

Deckers Outdoor Corporation ISS Presentation November 2017 Exhibit A

Disclaimer The views expressed in this presentation (the “Presentation”) represent the opinions of Marcato Capital Management LP and/or certain affiliates (“Marcato”) and the investment funds it manages that hold shares in Deckers Outdoor Corporation (the “Company”). This Presentation is for informational purposes only, and it does not have regard to the specific investment objective, financial situation, suitability or particular need of any specific person who may receive the Presentation, and should not be taken as advice on the merits of any investment decision. The views expressed in the Presentation represent the opinions of Marcato, and are based on publicly available information and Marcato analyses. Certain financial information and data used in the Presentation have been derived or obtained from filings made with the Securities and Exchange Commission (“SEC”) by the company or other companies that Marcato considers comparable. Marcato has not sought or obtained consent from any third party to use any statements or information indicated in the Presentation as having been obtained or derived from a third party. Any such statements or information should not be viewed as indicating the support of such third party for the views expressed in the Presentation. Information contained in the Presentation has not been independently verified by Marcato, and Marcato disclaims any and all liability as to the completeness or accuracy of the information and for any omissions of material facts. Marcato disclaims any obligation to correct, update or revise the Presentation or to otherwise provide any additional materials. Marcato recognizes that the Company may possess confidential information that could lead it to disagree with Marcato’s views and/or conclusions. Funds managed by Marcato currently beneficially own, and/or have an economic interest in, shares of the Company. These funds are in the business of trading—buying and selling—securities. Marcato may buy or sell or otherwise change the form or substance of any of its investments in any manner permitted by law and expressly disclaims any obligation to notify any recipient of the Presentation of any such changes. There may be developments in the future that cause funds managed by Marcato to engage in transactions that change the beneficial ownership and/or economic interest in the Company. The Presentation may contain forward-looking statements which reflect Marcato’s views with respect to, among other things, future events and financial performance. Forward-looking statements are subject to various risks and uncertainties and assumptions. There can be no assurance that any idea or assumption herein is, or will be proven, correct. If one or more of the risks or uncertainties materialize, or if Marcato’s underlying assumptions prove to be incorrect, the actual results may vary materially from outcomes indicated by these statements. Accordingly, forward-looking statements should not be regarded as a representation by Marcato that the future plans, estimates or expectations contemplated will ever be achieved. The securities or investment ideas listed are not presented in order to suggest or show profitability of any or all transactions. There should be no assumption that any specific portfolio securities identified and described in the Presentation were or will be profitable. Under no circumstances is the Presentation to be used or considered as an offer to sell or a solicitation of an offer to buy any security, nor does the Presentation constitute either an offer to sell or a solicitation of an offer to buy any interest in funds managed by Marcato. Any such offer would only be made at the time a qualified offeree receives the Confidential Explanatory Memorandum of such fund. Any investment in the Marcato Funds is speculative and involves substantial risk, including the risk of losing all or substantially all of such investment. This document is the property of Marcato and may not be published or distributed without the express written consent of Marcato.

CAUTIONARY STATEMENT REGARDING FORWARD-LOOKING STATEMENTS The information herein contains “forward-looking statements.” Specific forward-looking statements can be identified by the fact that they do not relate strictly to historical or current facts and include, without limitation, words such as “may,” “will,” “expects,” “believes,” “anticipates,” “plans,” “estimates,” “projects,” “targets,” “forecasts,” “seeks,” “could,” “should” or the negative of such terms or other variations on such terms or comparable terminology. Similarly, statements that describe our objectives, plans or goals are forward-looking. Forward-looking statements are subject to various risks and uncertainties and assumptions. There can be no assurance that any idea or assumption herein is, or will be proven, correct. If one or more of the risks or uncertainties materialize, or if Marcato’s underlying assumptions prove to be incorrect, the actual results may vary materially from outcomes indicated by these statements. Accordingly, forward-looking statements should not be regarded as a representation by Marcato that the future plans, estimates or expectations contemplated will ever be achieved. Certain statements and information included herein have been sourced from third parties. Marcato does not make any representations regarding the accuracy, completeness or timeliness of such third party statements or information. Except as may be expressly set forth herein, permission to cite such statements or information has neither been sought nor obtained from such third parties. Any such statements or information should not be viewed as an indication of support from such third parties for the views expressed herein.

CERTAIN INFORMATION CONCERNING THE PARTICIPANTS Marcato International Master Fund, Ltd. (“Marcato International”), Marcato Capital Management LP (“Marcato”) and the other Participants (as defined below) have filed with the Securities and Exchange Commission (the “SEC”) a definitive proxy statement and accompanying GOLD proxy card to be used to solicit (the “Solicitation”) proxies for, among other matters, the election of its slate of director nominees at the 2017 annual stockholders meeting (the “Annual Meeting”) of Deckers Outdoor Corporation (“Deckers” or the “Company”). Stockholders are advised to read the definitive proxy statement and any other documents related to the Solicitation because they contain important information, including information relating to the Participants in the Solicitation. These materials and other materials filed by Marcato with the SEC in connection with the Solicitation are available at no charge on the SEC’s website at http://www.sec.gov. The definitive proxy statement and other relevant documents filed by Marcato with the SEC are also available, without charge, by directing a request to Marcato’s proxy solicitor, D.F. King & Co., Inc., 48 Wall Street, 22nd Floor, New York, New York 10005 (Call Collect: (212) 269-5550, Call Toll Free: (800) 761-6521 or Email: Deckers@dfking.com). The participants in the proxy solicitation are Marcato International, Marcato, MCM Encore IM LLC (“Marcato Encore LLC”), Marcato Encore Master Fund, Ltd. (“Marcato Encore Fund”), Richard T. McGuire III, Deborah M. Derby, Kirsten J. Feldman, Steve Fuller, Matthew P. Hepler, Robert D. Huth, Jan Rogers Kniffen, Mitchell A. Kosh, Nathaniel J. Lipman and Anne Waterman (collectively, the “Participants”). As of the date hereof, Mr. McGuire, Marcato, Marcato International, Marcato Encore LLC and Marcato Encore Fund may be deemed to beneficially own the equity securities of the Company as described in Marcato’s statement on Schedule 13D in respect of the Company initially filed with the SEC on February 8, 2017, as it may be amended from time to time.

Overview: Deckers outdoor corporation (“DECK”) Ticker: “DECK” Recent Stock Price: $65 Source: Company filings, CapitalIQ. Market data as of 11/6/17. See appendix for footnotes. Multi-branded footwear and apparel company: UGG Hoka One One Sanuk Teva Consensus Estimates (FYE 3/31/18E): 2018E EBITDA: $245 million 2018E EPS: $4.30 Valuation (FYE 3/31/18E): EV/EBITDA: 7x P/E: 15x Capitalization: Market Cap: $2.1b 3/31/18E Enterprise Value: $1.7b Current Investment: 2nd largest position in fund Beneficial Ownership: 8.4% (1) (1)

Deckers brand overview Item UGG Product Type Comfort Shoes & Apparel Running Shoes Casual Shoes Outdoor Shoes & Sandals Revenue FYE 3/31/17 $1,451m ~$115m $92m $118m Growth Profile Mature grower Rapid growth Low growth Low growth (1) Source: Company filings, Marcato estimates. See appendix for footnotes.

Why is change needed at deckers? Shareholders cannot trust Deckers’ Board and management to deliver on short-term and long-term financial goals Track record of failing to meet targets New targets are incoherent Incumbent Board not qualified due to continued poor oversight and governance behavior Executive pay not consistent with performance Inadequate capital allocation plan Board repeatedly rejected shareholder input Entrenchment tactics necessitating lawsuit in Delaware Marcato has the right nominees with right experience to improve Deckers Highly qualified nominees have fashion, apparel, retail, marketing & finance experience needed in board room Independent of Marcato (8 of 9); Independent of management (9 of 9) Deckers value creation opportunity: Focus on profitable growth of the core UGG Brand; Sell or spin off non-core brands; Target more aggressive closure of physical retail stores; Reduce excessive SG&A; Recapitalize the balance sheet; and Align management compensation with margins, profitable growth, and total stockholder return

Why is Change Needed?

Deckers’ board is responsible for company’s unacceptable performance Chronic stock price underperformance Missed margin targets Decreased long-term margin targets Missed EPS targets 55% deterioration in EBIT margin from 2011 to 2017 70% increase in SG&A since 2011 32% increase in Corporate Expense since 2011 Unprofitable acquisitions Large writedowns Why give Board another opportunity to fail? Deckers has failed to meet nearly every strategic priority over the last 5 years:

5 Year Total shareholder return Deckers shares have underperformed against relevant benchmarks Source: CapIQ, Bloomberg. See appendix for footnotes. Note: Deckers is shown through its intraday price of $44.37 on 2/8/17, just before the release of Marcato’s 13D filing. Five year period from 2/8/12 to 2/8/17. Returns based on dividend adjusted share price. Deckers has underperformed its proxy peers by 85% over the last 5 years (1)

3 Year Total shareholder return Deckers shares have underperformed against relevant benchmarks Deckers has underperformed its proxy peers by 31% over the last 3 years Source: CapIQ, Bloomberg. See appendix for footnotes. Note: Deckers is shown through its intraday price of $44.37 on 2/8/17, just before the release of Marcato’s 13D filing. Three year period from 2/7/14 to 2/8/17. Returns based on dividend adjusted share price. (1)

Deckers’ share price reacted favorably to marcato’s call for change Source: CapitalIQ. Bloomberg Marcato’s 13D Filing on 2/8/17 13D filed intra-day at $44 Deckers reports FQ3 earnings 2/2/17: EPS:$1.27 actual vs. $4.22 est. Deckers share price Share price declines 16% after FQ3 earnings report Share price improves 18% following Marcato’s 13D and 35% through 3/31/17

board and management have failed repeatedly to achieve margin targets Source: Company transcripts accessed through CapIQ. See appendix for footnotes. Note: Company has no 2014 fiscal year. (1) (2) (3) Margin targets have been consistently missed and lowered. Why should investors trust this Board to execute on yet another plan to improve margins?

board and management have failed repeatedly to achieve margin targets Source: Company transcripts, accessed through CapIQ Promise Who/When Result “We really focus more on the overall operating margin of 20 or above, low 20s kind of thing is really how we focus anything on 2012 and beyond. So that could be a combination of the SG&A expenses versus what our margins and so forth. So that's really how we approach past 2011 at this point in time.” Thomas George, CFO, 2/24/11 earnings call “And we'll get more visibility as the year goes on to what the fall of '12 sheepskin prices will be then we'll have a better idea to answer that. That being said, still longer term, we believe with the Sanuk, the retail expansion of e-commerce, some stabilization of sheepskin, cost, we think longer term, we can still -- we still are targeting an operating income margin of 20%.” Thomas George, CFO, 2/23/12 earnings call “We have talked previously about a 15% operating margin goal. That continues to be the target and we anticipate achieving this primarily through gross margin expansion that will come from lower input costs and increased penetration of our direct-to-consumer channel.” Angel Martinez, CEO, 2/27/14 earnings call “I'd say from a target perspective, we've never before more confident, more comfortable in our ability to gain more and more leverage as the years go by. So we're very comfortable reiterating our targets, relative to a mid-teens operating margin going forward.” Angel Martinez, CEO, 7/30/15 earnings call “Over time, we believe the ongoing changes we are making allow us to achieve mid-teen operating margin levels.” Thomas George, CFO, 2/4/16 earnings call “So the cost savings, as I said, are going to be a key player in that, driving growth back into the business, will be a key player in that including the margin improvement. But as we said in the past, getting to a midteens number is still on the radar for us.” Dave Powers, CEO, 2/2/17 earnings call “As we look forward, the entire company is intensely focused on achieving our 13% operating margin target for 2020.” Dave Powers, CEO, 5/25/17 earnings call MISS ? MISS MISS MISS MISS MISS Margin targets have been consistently missed and lowered. Why should investors trust this Board to execute on yet another plan to improve margins?

board and management have FAILED repeatedly TO achieve eps targets Source: CapIQ, company filings. See appendix for footnotes. Note: Guidance is for GAAP Diluted EPS and is as of Q4 of the previous fiscal year. Company has no 2014 fiscal year. Deckers has missed earnings targets in 3 of the past 5 years, and each of the last 2 years Deckers has still not achieved its FY2012 EPS Goal (1) (2) (3) (4) (5)

Retail expansion has damaged ROIC and EBIT margins Source: Company filings. See appendix for footnotes. Note: 2006-2013 are 12/31 fiscal end. 2014-2017 are 3/31 fiscal end. Due to a change in reporting period, the company has no 2014 fiscal year. 2014 is the LTM period through 3/31/14. (3) (4) (4) (5) Significant retail expansion (1) (2)

Sell-side analysts recognize Deckers’ lack of margin progress Source: Wall Street research. 2/4/16 Earnings call Research Analyst: “…on the mid-teens operating margin goal for longer term. Can you just give some color on what sort of the drivers are to that? Like how much of it is gross margin versus SG&A? Should we think it's more SG&A now going forward with the new initiatives?” Answer from Thomas George (CFO): “Right. It's still early in the planning process.” In 2011, Deckers initially targeted a long term operating margin in the low 20s, yet still claims to be “in the planning process” The Board and management should be held accountable for their lack of urgency

SG&A and Unallocated Overhead have grown significantly faster than revenue SG&A Source: Company filings. See appendix for footnotes. Note: 2011-2013 are 12/31 fiscal end. 2014-2017 are 3/31 fiscal end. Due to a change in reporting period, the company has no 2014 fiscal year. 2014 is the LTM period through 3/31/14. (1) Unallocated overhead

Sell-side Research also concerned about increase of SG&A expenses Source: Wall Street research. 2/2/17 Earnings Call Research Analyst:“…it looks like if you take out that $7 million of cost savings you're talking about in 4Q, you're still looking at almost 10% SG&A growth in fourth quarter against the minus 5% top line. So I'm just wondering what are you spending on that you need to grow SG&A that much in the 4Q.” Answer from Thomas George (CFO): “Yes, Scott, some of that is related to retail stores, and that we're closing about 21 stores this year. A lot of those are going to close in the fourth quarter. So we had some additional stores in the third quarter. Some of it is some additional marketing around our E-Commerce business. And another item is there are some increased incentive comp this year relative to year ago, and that's really related to -- incentive comp related to lower levels of management relative to a year ago.” “Despite a reduced investment outlook, we remain concerned with the pace of SG&A spend to support growth of owned retail doors, which could still generate lower marginal returns than anticipated leaving earnings growth challenged longer-term. Total SG&A intensity is up 600bp over the last three years.” -1/30/15 Credit Suisse

Board’s Failed Capital Allocation Strategy

Poor track record of capital allocation $606m of Total Capex and investment 2011-2017 Market cap & EPS declined Despite spending over $600m of shareholder capital, Deckers’ market cap and EPS have declined dramatically Written down by 60% Includes ~$67m for new headquarters Source: Company filings, CapIQ. See appendix for footnotes. Note: 2/8/17 intraday market cap based on price of $44.37, just before Marcato’s 13D filing. (2) (1) (3)

Healthy Free cash flow generation even during the financial crisis board has approved an inefficient capital structure For over 10 years Source: CapIQ, Company filings. See appendix for footnotes. Note: 2005-2013 are 12/31 fiscal end. 2014-2017 are 3/31 fiscal end. Due to a change in reporting period, the company has no 2014 fiscal year. 2014 is the LTM period through 3/31/14. Deckers has operated with a net cash balance for over 10 Years (1) (3) (2) Inventory increases by $128m or ~50% with new retail expansion strategy

Current Board is not Qualified to Oversee Deckers

Deckers’ board has a poor record of governance Responsible for a compensation design that is not aligned with shareholders’ interests Changed segment reporting structure, which hides retail weakness Abused change of control provisions to entrench themselves Chairman engaged in mayoral campaign during strategic review process Lacks a credible capital allocation plan Actions generally taken only after significant shareholder pressure Incumbent directors are long-tenured and lack relevant industry experience Directors lack meaningful stock ownership and have not made open market stock purchases in 5 years Long pattern of irresponsible governance practices necessitates a replacement of the Board Deckers’ Board has not acted in best interests of shareholders:

Equity incentive awards board has designed a poor compensation plan Source: Company filings Deckers’ Annual Cash incentive Revenue (50%) Operating Income (50%) Time Based RSUs (20%): Vest based on continuing employment Annual PSUs (20%): Vest based on EPS target Non-qualified Stock Options (60%): Based on 2019 pre-tax income target EPS: EPS Guidance $4.43 $5.07 $3.62 $4.62 $5.09 $4.23 GAAP EPS Achieved $5.07 $3.45 $4.18 $4.66 $3.70 $0.18 Hit/Miss 14% (32%) 15% 1% (27%) (96%) Incentives: Annual Cash Incentive EPS & “Management Based Objectives” EBITDA & “Management Based Objectives” EBITDA & “Management Based Objectives EBITDA and Revenue EBITDA and Revenue EBIT and Revenue Equity Incentive Awards Earnings goals and Revenue EPS and Revenue Revenue, EPS, and EBITDA Revenue, EPS, and EBITDA Revenue, EPS, and EBITDA; TSR Modifier for 2016 LTIP awards EPS, Pre-Tax Income, or continued employment CEO well compensated regardless of execution and stock price Elevated compensation in years with earnings misses and share price underperformance

E-commerce and Retail Segments Were Combined, which Hides Retail Weakness Source: Company filings Note: 2011-2013 are 12/31 fiscal end. 2015 is 3/31/15 fiscal end. Due to a change in reporting period, the company has no 2014 fiscal year. Deckers Same store retail sales DECK consolidates retail and e-commerce segments; Stops reporting standalone retail same store sales Deckers stopped reporting same store sales for its retail stores after four consective quarters of negative results 4 straight quarters of same store sales declines: FY 2011 FY 2012 FY 2013 FY 2015 FY 2016

E-commerce and Retail Segments Were Combined, which Hides Retail Weakness Direct to Consumer EBIT Breakdown Direct to Consumer EBIT % Margin Source: Company filings, Marcato estimates. See appendix for footnotes. In 2016, Deckers combined its e-commerce and retail segments into a single segment called Direct-to-Consumer (DTC). This combination in reporting makes it very difficult to isolate retail results. Allowing for a modest decline in e-commerce margins would still imply a single digit margin for retail in FY2016 and FY2017 $102 Reported Ex. Rest. & Impair. (4) (1) (2) (2) (5) $110 Reported Ex. Rest. & Impair. (5) (5)(6) (3) (3)

Failure to allocate overhead overstates retail profitability Retail EBIT % Margin Before and After Estimated Corporate Allocation Retail ROA Before and After estimated corporate allocation(4)(5) Source: Company filings, Marcato estimates. See appendix for footnotes. (2)(3) (4) (2)(3) (4) (1) (1) (1) (1) (2)(3) (2)(3)

board is responsible for this Lack of transparency Source: Red Mountain Capital Letter, SEC filings, Wall Street research Masking retail results: “Since the end of fiscal 2015, Deckers has combined the reporting of its retail store and e-commerce performance in a broad direct-to-consumer (“DTC”) category, and no longer breaks out the performance of its retail stores. While we understand the importance of omni-channel distribution, we can only assume that the performance of the retail store network continues to deteriorate, and that management would prefer not to highlight it.” – Red Mountain Capital (Top 10 Deckers Shareholder 12/5/16) Segment reporting changes have drawn inquiry from SEC: SEC on DTC segmment: “Please provide a more comprehensive discussion and analysis of the material factors impacting net sales and loss from operations for the DTC reportable segment. In this regard, we note your discussion and analysis provided during the earnings call by David Powers, President of Deckers Brands. Please note that to the extent an underlying business is materially impacting the segment results, disaggregated analysis of that business may be necessary.” – SEC letter dated 10/1/2015 Other reporting changes have also drawn the scrutiny of research analysts: “Do not own this stock. DECK is changing its reporting segments from 4 to 2, and is no longer providing supplemental commentary. The aforementioned actions demonstrate an unconscionable lack of transparency.” – Sterne Agee 2/5/16

Board attempted to use change of control provisions to entrench themselves Best governance practices require a double trigger for accelerating compensation in the event of a change of control; many of Deckers’ outstanding compensation awards contained single trigger provisions The election of Marcato’s nominees would have resulted in the triggering of a $32.6m(1) windfall to company executives and acceleration of the company’s existing credit agreement Deckers refused to approve Marcato’s nominees and Marcato was forced to sue Deckers’ Board in Delaware to prevent these avoidable costs from occurring Only after a costly litigation process did the Board agree to alter the compensation plan and credit agreement The Board continues to act only as a result of shareholder pressure Source: Company filings

Timeline of Chairman’s mayoral campaign highlights lack of board leadership Source: Company filings Date Description Compensation 5/24/16 Mr. Martinez announces retirement as CEO, but remains as consultant and Board Chairman $500k consulting contract $285k board compensation 6/1/16 Mr. Martinez begins consulting contract $500k consulting contract $285k board compensation 4/25/17 Deckers announces review of strategic alternatives $500k consulting contract $285k board compensation 5/9/17 Mr. Martinez announces intention to run for Mayor of Santa Barbara $500k consulting contract $285k board compensation 5/31/17 End of Mr. Martinez’s one year consulting agreement with Deckers $285k board compensation 7/10/17 Mr. Martinez joins board of Korn Ferry $285k board compensation 8/31/17 Board announces Mr. Martinez will step down as chairman, but remain on Board $285k board compensation 10/24/17 Company issues press release that Mr. Martinez will step down from Board of Directors $0 10/26/17 Company announces failure of sale process 10/31/17 Mr. Martinez sells over 59,000 DECK shares 11/1/17 Mr. Martinez sells over 71,000 DECK shares 11/7/17 Mr. Martinez loses mayoral election Mr. Martinez announced his mayoral candidacy just two weeks after company began its strategic review, the same month that his $500k consulting contract ended. Following failure of strategic review Mr. Martinez sold ~43% of his shares in 2 days.

Recently announced capital structure plan is incoherent Research Analyst: “Just in terms of the comment about the debt, so is that an ongoing target, like, as you generate cash and EBITDA goes up, then you'll continue to buy back stock to maintain that 1x leverage? Answer from Thomas George (CFO): No, it's not an ongoing target. I think the comment about that was, historically, we've had a conservative balance sheet. Now that we're executing well on our long-term plan and we got -- see further improvement in profitability going forward and further working capital improvements, we feel that it's an appropriate point in time to consider and evaluate the concept of some long-term debt, and we'll start slow, i.e., we think the company can easily support 1x EBITDA. So that's more of an evaluation of some initial thoughts around raising some long-term debt. That doesn't necessarily mean we'll always maintain that 1x EBITDA.” -10/26/17 earnings call CFO contradicts Board’s commitments on the same day of earnings Source: Company filings Deckers’ Board of Directors: “The Board believes that the business can conservatively support a debt to EBITDA ratio of 1x, while also providing significant flexibility to support Deckers’ growth initiatives and seasonal working capital needs.” -10/26/17 press release

Deckers will fail to achieve Board’s stated 1.0x leverage target By 2020 Deckers will still have an estimated net cash position of $335m(1) Source: Company filings, Marcato estimates. See appendix for footnotes. (2)

Action has generally been taken only following significant shareholder pressure Source: Company filings. See appendix for footnotes. Date Description 2/4/16 2016 FQ3 Call Deckers’ Promise Close 20 stores $35m SG&A savings “Mid-teens” margin target (1) Failure Stores increase by 17 from 12/31/15 to 12/31/16(2) Only $25m of net savings $10m of “re-investment” 10% EBIT margin in FY2016 Aug 2016 Marcato meets with David Powers to discuss retail optimization 2/2/17 2017 FQ3 Call Deckers’ Promise $150m savings by end of FY2019 “Mid-teens” margin target (3) Failure $60m already announced, incremental savings only $90m Undisclosed portion to be “re-invested” 9% EBIT margin in FY2017 2/8/17 Marcato Files 13D April 2017 Deckers’ Promise Deckers announces review of strategic alternatives Failure On 10/26/17 terminated strategic review 5/25/17 2017 FQ4 Call Deckers’ Promise $100m operating profit improvement by 2020 (vs. 2017) 125 stores by 2020 $2b sales and 13% margin by 2020 Failure Targets imply estimated savings of only ~$32m 6/27/17 Marcato sends letter questioning Mr. Martinez’s leadership as Chairman during his mayoral campaign 9/15/17 Marcato nominates directors 10/24/17 Company issues press release that Mr. Martinez will step down from Board of Directors 10/26/17 2018 FQ2 Call Deckers’ Promise 1x debt to EBITDA Target $400m repurchase authorization Failure CFO contradicts Board’s statements on conference call Says 1x is not an ongoing target Financial projections imply persistent net cash balance

Board has rejected shareholders’ recommendations Source: Red Mountain Capital Letter Lack of urgency on cost saving plan: “As you know, we introduced you to a leading global retail consultant in July 2015. We understand that this consultant identified the opportunity to significantly enhance Deckers’ operating profit through store rationalization and SG&A expense and COGS reductions. Inexplicably, the board declined to retain this consultant (or any other consultant of comparable reputation and quality) to pursue this path to create shareholder value. Management told us that it would be “too disruptive.” Lack of urgency in retail closure plan: “Deckers’ board and management have determined not to pursue the rationalization of its retail store network in a meaningful way…. In our view, a serious approach to rationalizing the retail store network would target all stores that do not generate acceptable returns on a fully-allocated basis and would close them on an accelerated timetable, even if leases must be broken in order to do so.” – Red Mountain Capital (Top 10 Deckers Shareholder 12/5/16)

Longest tenured directors lack both relevant experience and alignment with shareholders John Gibbons Chairman of the Board Board Tenure John Perenchio Director 17 Years Shareholder Alignment Source:Company filings, Bloomberg, CapIQ Note:Ownership information and open market purchases as reported by Bloomberg based on Form 4 data as of 10/26/17. Open market sales include outright sales only and do not include shares gifted, transferred, or delivered or withheld for tax purposes. Open market purchases include outright purchases only and do not include shares granted pursuant to the Compensation Plan for the Company's Board of Directors. 12 Years In 17 years has never made an open market purchase Sold over 36,000 shares during the same period No open market purchases since 2009 Sold over 100,000 shares during the same period Primary Industry Experience Communications & Telecom TMC Communications TRI-M Communications Com Systems Fitness Clubs The Sports Club Company Media & Entertainment Ultimatum Music Fearless Records Name Experience Sector John Gibbons TRI-M Communications TMC Communications Computer Communications Technology Corp. Digital Sound Visteck (Photo retail) Com Systems PWC audit The sports Club company Communications Telecom Accounting Sports Clubs David Powers Deckers, Nike, Converse, Timberland Footwear Michael Devine Coach CFO Mothers work (Maternity Apparel) Retail, Apparel & Accessories James Quinn President of Tiffany & Co. Citibank Retail, Apparel & Accessories Lauri Shanahan Maroon Peak Advisors The Gap Retail, Apparel & Accessories Karyn Barsa Headstart Custom Helmets Patagonia Smith&Hawking (specialty gardening retailer) Retail, Apparel & Accessories Nelson Chan Magellan Navigation Sandisk ( Technology Semiconductors Angel Martinez Deckers Reebock Rockport Footwear John Perenchio Ultimatum Music Chartwell Partners Media & Entertainment Bonita Stewart Google Daimler Chrysler IBM Technology Auto John Perenchio Other Chartwell Partners-investment holding company (14 years) Club ride apparel John Gibbons The Learning Network (since 2000)

other board members lack relevant experience and share responsibility for underperformance How far back to go for experience? Some relevant history not shown – example Karyn Barsa was COO and CFO of Patagonia Also no distinction for CEO/COO vs legal or other. Lauri Shanahan was chief legal officer at the GAP Name # of years on Deckers Board Primary Experience Share price performance vs. proxy peer(1) group since start date Karyn Barsa 9 Bedding, Pet Supplies, Gardening (148%) Michael Devine 6 Coach (107%) James Quinn 6 Tiffany (101%) Lauri Shanahan 6 The Gap (101%) Nelson Chan 3 Semiconductors (32%) Bonita Stewart 3 Chrysler / Google (29%) Name Experience Sector John Gibbons TRI-M Communications TMC Communications Computer Communications Technology Corp. Digital Sound Visteck (Photo retail) Com Systems PWC audit The sports Club company Communications Telecom Accounting Sports Clubs David Powers Deckers, Nike, Converse, Timberland Footwear Michael Devine Coach CFO Mothers work (Maternity Apparel) Retail, Apparel & Accessories James Quinn President of Tiffany & Co. Citibank Retail, Apparel & Accessories Lauri Shanahan Maroon Peak Advisors The Gap Retail, Apparel & Accessories Karyn Barsa Headstart Custom Helmets Patagonia Smith&Hawking (specialty gardening retailer) Retail, Apparel & Accessories Nelson Chan Magellan Navigation Sandisk ( Technology Semiconductors Angel Martinez Deckers Reebock Rockport Footwear John Perenchio Ultimatum Music Chartwell Partners Media & Entertainment Bonita Stewart Google Daimler Chrysler IBM Technology Auto Source: CapIQ, Bloomberg, company filings. See appendix for footnotes. Note: Relative share price performance is shown through Deckers intraday price of $44.37 on 2/8/17, just before the release of Marcato’s 13D filing. Dividend adjust share price, adjusted for stock splits. Relative performance compares DECK shareholder returns vs. proxy peers from the date of each director’s start through 2/8/17 intraday. (2)

Open Market Transactions Sales Purchases Total Current Directors 8 – Current Directors John Gibbons – John Perenchio 3 – Karyn Barsa 2 – Michael Devine – James Quinn – Lauri Shanahan – Nelson Chan – Bonita Stewart – David Powers 3 – Source:Bloomberg, Company form 4 filings for the 5 year period from 10/30/12 to 10/30/17. Note:Open market sales include outright sales only and do not include shares gifted, transferred, or delivered or withheld for tax purposes. Open market purchases include outright purchases only and do not include shares granted pursuant to the Compensation Plan for the Company's Board of Directors. Open market Sale Open market Purchase No open market purchases in the last 5 years current board has made No open market purchases in the last 5 years

Chairman and Former CEO has demonstrated a lack of confidence in the current plan Source: SEC Form 4 and Form 144 filings. See appendix for footnotes Mr. Martinez recently sold 43% of his Deckers shares in two days (1) If former Chairman and CEO does not believe in this Board and management, why should shareholders?

Marcato’s Plan to Create Meaningful Shareholder Value

Focus on Core UGG Brand, Exit Non-Core Brands Source: Marcato estimates. See appendix for footnotes. (1)

Rationalize retail footprint to reverse trend of declining margins Retail stores (Year end) Retail EBIT and Margins (2)(3) Source: Company filings, Marcato estimates. See appendix for footnotes. Δ in Retail Same Store Sales (1) (1) (3.4%) 2.8% NA (8.4%) 6.3% ? ? (3) (3) $3.2 $2.9 $2.9 $2.7 $4.2 Est. $2.5 Est. $2.3 Revenue per Store($m) (4) (5) (5) Retail consolidated with e-commerce

further retail consolidation is accretive to profitability Source: Marcato and consulting firm estimates $11m of EBIT retail lost from closing company owned retail stores 50% of lost revenue recaptured with new partnerships, US wholesale customers and e-commerce channels E-commerce and wholesale margins are 2.5x to 3.9x more profitable vs. retail Recapturing revenue in other more profitable channels is accretive by $4.5m Further retail consolidation is even more accretive to profitability with further reduction of associated overhead Retail experts believe at least 50% of retail revenue could be recaptured through channels that are ~3x more profitable:

Eliminate undisciplined frameworks for evaluating store economics Source: FierceRetail, Footwearnews.com Location: Disney Springs, Orange County, Florida Date opened: 2016 Size: 2,800 Square feet “The purpose of these stores has shifted slightly so it's not strictly about maximizing sales; it's about being directional" - Gerard Marceda, VP of Deckers North America Retail

“…we are pleased to share that $150 million announced cumulative savings will drive a $100 million improvement in operating profit for the fiscal year 2020 [relative to 2017]. With these savings, along with modest low single-digit revenue growth, we believe we can achieve an operating margin of 13% in fiscal year 2020.” – 5/25/17 FQ4 2017 earnings call Deckers’ current Profit Improvement Goals are misleading Source: Company filings, Marcato estimates $63m of EBIT would be generated alone from future revenue growth at a 30% incremental margin Using Deckers’ 2020 guidance of $2b in sales and a 13% EBIT margin, implied EBIT improvement is $94m -- slightly below Deckers’ target of $100m Deckers’ announcement of savings program This implies only ~$30m in EBIT improvement from cost savings Is Deckers “re-investing” ~$120m of the $150m in “savings”? Cost savings implied by company plan ($m) 2020 Sales Guidance $2,000 2020 EBIT % Margin Guidance 13% Implied 2020 EBIT Guidance $260 2017 Adj EBIT (ex restructuring) $166 Total Change in EBIT 2017-2020 $94 2020 Sales 2,000 2017 Sales 1,790 Incremental Sales 2017-2020 $210 Assumed flow through margin on incremental sales 30% Change in EBIT due to rising sales $63 Total Change in EBIT 2017-2020 $94 Less: Change due to rising sales ($63) Implied change in EBIT due to cost saves $32

Retail experts Estimate true Savings Opportunity of $150-$200M Best-in-class consultant that has worked with leading footwear and apparel companies including Nike, Adidas, Timberland and Wolverine Worldwide has identified $150-$200m of savings potential Source: External consulting firm estimates Item Description Opportunity Rationalize Retail Optimize network Improve store operations Revise trade terms and inventory $40-$50m Reduce SG&A Bring in-line with peer benchmarks Personnel reductions Selective outsourcing Optimize indirect costs $50-$70m Reduce COGS Optimize assortment Supplier negotiations $50-$70m Other Opportunities $10m Total $150-$200m Deckers Implied Savings Target $32m

Deckers shares have opportunity to double over next 3 years Source: Company filings, Marcato estimates. See appendix for footnotes. Note: Company’s fiscal year ends 3/31 20% 26% 31% ROIC(1) EPS 7.0x 7.5x EV/EBITDA 24 17 15 Ending Shares Outstanding FY2018E FY2019E FY2020E Marcato Proposal (Margin improvement, divestitures and share repurchases) $158@ 8.0x EBITDA $146@ 7.5x EBITDA $135@ 7.0x EBITDA Recent Price: $65 11% 16% 19% EBIT % Margin $4.23 $7.29 $11.64 +82% (53%) +108% FY2017 17% 32 9% Δ 2017 – 2021E +232% 32% 15 FY2021E 19% $12.68 $3.82 (2) (3) (3%) 2.6% 3.2% Core UGG Revenue Growth 2.0% 1.2% CAGR (4)

Sell-side analysts recognize value of Marcato’s involvement Source: Wall Street research. “��with Marcato establishing a 6% position in the stock, we think it is likely that 1) management will be under pressure to realize a more meaningful portion of the cost savings to EPS versus potential reinvestment 2) initiates a dialogue around the strategic value of DECK’s non-core brands in its portfolio including potential alternatives 3) creates a greater sense of urgency around shareholder value enhancing initiatives including accelerated share repurchases.” – Buckingham 3/3/17

Sell-side analysts recognize value of Marcato’s involvement “We see these estimates (Marcato’s) as ambitious but plausible in the context of international opportunities, potential in other categories helped by improved segmentation (to begin Spring ’18), and revenue recapture from closed stores… …Cost savings initiatives over this period are more aggressive than those of management but, in our view, a fair directional assessment of opportunity. We are in directional agreement with Marcato on opportunities for financial engineering given the durable cash flow of the business (which could be helped by net working capital benefits from retail closures). While cash balances are principally overseas, the company could both borrow against these cash balances and use foreign cash to support foreign working capital needs. A revolving line of credit or the combination of revolver and term-loan could both accommodate working capital demands and be used to reduce the share count with accretive results.” – Stifel 10/19/17 Source: Wall Street research.

Proxy peer Wolverine Worldwide (WWW) has executed against its plan WWW One-year Share price performance Source: Company Filings, Wall Street research. See appendix for footnotes. Tracking to achieve 2018 targets As of 11/2/17 run rate margins are 11.7% vs. 12% target Improved margins by X% from X% in 2016 to X% in 2017 Closed X stores Repurchased $X of stock Recpitalized balance sheet Released significant working capital with Retail closures PROGRESS ON RESULTS $2.5b mkt cap multi-branded shoe manufacturer Successfully executing against a plan to improve margins by ~36%(1) In 2016 announced plan to improve EBIT margins from 8.8%(1) to 12% by 2018 30bps shy of achieving target 12 months ahead of schedule(2) WWW’s margin target is only 100bps lower than Deckers’ despite having a gross margin that is over 800bp lower(3) Rationalized retail footprint Plan to reduce store count from 466 to 80 (213 stores to be closed in 2017(4)) Optimized capital structure Refinanced debt to 1.8x net debt to EBITDA(5) with a $300m share repurchase authorization Monetized non-core assets Divested or discontinued smaller and lower margin brands (Robeez, Cushe, Sebago) Streamlined global supply chain Consolidated factory base by nearly one third Tracking to achieve 2018 targets As of 11/2/17 run rate margins are 11.7% vs. 12% target Margins increasing from ~8% in 2016 to 11.7% by end of ‘17 Closed 180 stores in 2017 as of Q2, with plans to close 33 more by end of year Repurchased $22m of stock through Q2 2017 Recapitalized balance sheet Released significant working capital with Retail closures Value Creation plan “WWW Puts Margin Run-rate Target In-sight nearly 12 mos. Ahead of Plan” - Stifel 11/8/17

Marcato Has the Right Nominees to Improve Deckers

We have the right nominees to Improve deckers Built brands Led direct-to-consumer apparel businesses Restructured and reduced physical retail store networks Reduced bloated corporate cost centers Managed and advised retail and apparel companies on: Capital structure Capital allocation Acquisitions, divestitures and spin-off transactions Independent fashion, apparel, retail, marketing, and finance experts who have:

We have the right nominees to improve deckers Deborah M. Derby Proven operator with successful cost reduction experience that will add value to Deckers’ cost savings initiative Helped deliver significant expense reductions as the Executive Vice Chairman of Toys “R” Us Consulted for Kenneth Cole, founder of Kenneth Cole Productions Kirsten J. Feldman Xx Xx Xx xx Photo Steve Fuller Xx Xx Xx xx Photo Kirsten J. Feldman Veteran investment banker in the retail industry that adds value to Deckers’ portfolio and capital structure optimization process Global group head of the retail investment banking group at Morgan Stanley from 1992 to 2001 Executed numerous strategic and financing transactions in retail sector Selected retail clients include: Dillard’s; Duty Free Shoppers; Polo Ralph Lauren; Martha Stewart Living; May Department Stores; Ralph’s; Safeway; Talbots; and Wal-Mart Steve Fuller Experienced marketing executive that will enhance Deckers’ efforts in growing its e-commerce business Senior Vice-President and Chief Marketing Officer for L.L.Bean, Inc. from 2001 until his retirement in 2016 Led marketing functions for L.L. Bean, including branding, advertising, customer satisfaction, e-commerce, partnerships, database analytics and marketing operations Former board member of L.L.Bean

We have the right nominees to improve deckers Robert D. Huth Veteran retail executive with brand building experience important to a refocused strategy at Deckers President and Chief Executive Officer of David's Bridal, Inc. from 1999 until March 2013 Board member of David’s Bridal Served as Executive Vice President and Chief Financial and Administrative Officer of Melville Corporation from 1987 to 1995 where he was also a Director and Member of the Operating and Executive Committees Jan R. Kniffen 30 years of retail and consulting experience that will prove valuable to Deckers’ strategic decision making process Founder and CEO of Kniffen Worldwide Enterprises LLC (“JRKWWE”), an equity research and management consulting firm for the retail sector Spent 20 years as a senior executive at The May Department Stores Company, serving as Senior Vice President and Treasurer from 1991 to 2005 Matthew P. Hepler Large shareholder with capital allocation expertise that will ensure Deckers’ strategic plan is aligned with shareholder interests Currently a Partner at Marcato Capital Management LP Member of the Board of Directors of Terex Corporation, a global manufacturing equipment company

We have the right nominees to improve deckers Nathaniel J. Lipman Experienced CEO with knowledge of consumer insights and owner orientation President and Chief Executive Officer of Affinion from October 2005 until 2012 Chairman of Affinion from September 2012 until his retirement in November 2015 Served in various senior roles at Cendant Corporation, Planet Hollywood, House of Blues Entertainment, and The Walt Disney Company Anne Waterman Public relations and strategic communications expert in the fashion industry that will bring global brand development experience to Deckers Served in various senior positions at Michael Kors for 15 years, including as Senior Vice President, Global Image and Senior Vice President and Fashion Director Mitchell A. Kosh Veteran operations executive from Ralph Lauren who can add value to Deckers’ retail consolidation, G&A reduction, and portfolio optimization process Head of Global Human Resources of Ralph Lauren Corporation for 15 years from 2000 to 2015

Appendix: Footnotes

Appendix: Footnotes Page 4 Based on estimated 3/31/18 enterprise value (PF for est. FQ3 and FQ4 cash flow). Following the latest quarter (FQ2) the company has elevated short term debt and inventory levels , as it prepares for the winter season Page 5 Marcato estimate based on FY2017 “Other Brands” revenue of $130m, less an assumed $15m for Koolaburra. Assume any Ahnu revenue is negligible. Page 9 The proxy peer index is based on companies listed in Deckers’ proxy statement for the 2017 annual meeting. KATE was still public as of Marcato’s 13D filing and is included. Index is an equal weighted average of constituents. Page 10 The proxy peer index is based on companies listed in Deckers’ proxy statement for the 2017 annual meeting. KATE was still public as of Marcato’s 13D filing and is included. Index is an equal weighted average of constituents. Page 12 “Low 20s” EBIT margin target from 2/24/11 earnings call 15% operating margin target given on 2/27/14 earnings call and “Mid-teens operating margin” target given on 7/30/15 earnings call “Mid-teen operating margin” target given on 2/4/16 earnings call Page 14 "The Company expects full year diluted earnings per share to be approximately flat with 2011.“ 2011 diluted EPS was $5.07 “The Company expects full year diluted earnings per share to increase approximately 5% over 2012 levels.” 2012 diluted EPS was $3.45 “The Company expects fiscal year 2015 diluted earnings per share to increase approximately 13.5% over the twelve month period ended March 31, 2014.” EPS for the 12m ended 3/31/14 was $4.07 “On a reported basis, earnings per share are expected to be $5.09” Midpoint of guided range of $4.05 to $4.40 Page 15 10 stores in the U.S (“four UGG Australia concept stores and six retail outlet stores”), 2 international stores in the UK, and 1 JV in China 12 stores in the U.S (“five UGG Australia concept stores and seven retail outlet stores”), 5 international stores, and 1 JV in China ROIC Defined as (EBIT*(1-Tax Rate)/ (Average period net PPE + Working capital). Working capital defined as (Current assets – cash) – (Current liabilities – short term debt) 2016 based on adjusted EBIT (ex. restructuring) of$196m; 2017 based on adjusted EBIT (ex. restructuring) of $166m Assumes normalized tax rate of 27% (similar to 2018 guidance) Page 17 2017 SG&A excludes $167.5m in restructuring and other charges Page 20 In 2016 and 2017 DECK stopped reporting retail capex. Retail capex estimate assumes that 97% of DTC capex in 2016 and 2017 was for retail (in 2015 retail was 97% of combined retail and e-commerce capex) Based on Sanuk’s 9/30/16 asset value, just prior to the $118m write-down Adj. EPS as reported by the company (excludes goodwill impairment, restructuring, and other non-core charges) Page 21 Defined as gross cash balance less debt Market cap as of fiscal year end Free cash flow defined as operating cash flow less purchase of PP&E

Appendix: Footnotes Page 26 Adjusted to exclude $11m of retail fleet restructuring expense and $10m of other retail related impairment charges Retail EBIT reporting methodology was changed in 2013. The 2012 and 2011 EBIT numbers are pro forma for the reporting change Adjusted for unusual items. Margins adjusted for restructuring and impairment charges related to the retail segment. Reported DTC margin was 16%, but adjusted for $11m of restructuring and $10m of impairment would be 19%. Estimate retail without adjusting for unusual items was 2%, but after adjusting for restructuring and impairment was 7%. See footnote 4 Total reported 2016 DTC segment revenue was $644m and EBIT was $102m. Estimate that e-commerce revenue was $265m with a ~36% EBIT margin (2015 e-commerce margin was ~40% but believe margins came down somewhat due to promotional pricing), implying an e-commerce EBIT estimate of ~$95m. The implied retail portion of the DTC segment is therefore ~$379m of revenue and $6m of EBIT, giving an implied retail margin of ~2%. Further adjusting retail to exclude $11m of retail fleet restructuring expense and $10m of impairment charges would increase the retail EBIT margin to ~7% (and increase the combined DTC margin to ~19%) Adjusted for unusual items. Excludes $13m in restructuring charges (assume related to retail transformation) Assumes an e-commerce margin of 35% and that all restructuring charges are retail related Page 27 Retail EBIT reporting methodology was changed in 2013. The 2012 and 2011 EBIT numbers are pro forma for the reporting change Adjusted to exclude restructuring expenses of $11m and impairment charges of $10m in 2016. Adjusted to exclude $13m of restructuring in 2017 2016 and 2017 are a best estimate because company stopped reporting the segment. See footnotes for p26. Assumes assets per store similar to 2015 levels. Allocates a portion of unallocated corporate overhead to the retail segment based on retail revenue as a percentage of total company revenue ROA defined as (Retail EBIT*(1-Tax Rate)/ (Average quarterly retail assets during the period) Page 29 (1) The acceleration of the company’s single-trigger equity compensation would result in a windfall of up to $32.6 million, based on the closing stock price of $66.50 as of November 9, 2017 and depending on the exercise price for any outstanding stock options. Page 32 Based on company guidance of $2b in revenue and 13% EBIT % margins by 2020. Also assumes 2018 free cash flow of approximately $150m and assumes the company’s $400m share repurchase authorization is split over FY2019 and FY 2020. Net cash defined as gross cash balance less debt Page 33 On 2/4/16 call company says long-term operating margin target is “mid-teens” Total retail stores increased from 155 on 12/31/15 to 172 on 12/31/16 On 2/2/17 call company reiterates that long-term operating margin target is “mid-teens” Page 36 The proxy peer index is based on companies listed in Deckers proxy statement for the 2017 annual meeting. KATE was still public as of Marcato’s 13D filing and is included. Index is an equal weighted average of constituents. Joined in May 2008. Share price performance assumes 5/15/08 start date. For other board members, the day of their start is available in Bloomberg. Page 38 Dollar value as of each date shown in the timeline Page 40 Based on conversations with industry experts Page 41 Retail EBIT reporting methodology was changed in 2013. The 2012 and 2011 EBIT numbers are pro forma for the reporting change Beginning in 2016 company combined its legacy retail segment with e-commerce to form the Direct-to-Consumer (DTC) segment. Total 2016 DTC segment revenue was $644m and EBIT was $102m. Estimate that e-commerce revenue was $265m with a ~36% EBIT margin (2015 e-commerce margin was ~40% but believe margins came down somewhat due to promotional pricing), implying an e-commerce EBIT estimate of ~$95m. The implied retail portion of the DTC segment is therefore ~$379m of revenue and $6m of EBIT, which would give an implied retail margin of ~2% (this is unadjusted for unusual items, see footnote 3) Adjusted for unusual items. Adjusted to exclude $11m of retail fleet restructuring expense and $10m of other retail related impairment charges (which would imply an adjusted retail EBIT margin of 7% vs the estimated 2% unadjusted retail EBIT margin) Estimate that the e-commerce business did $295m in revenue in FY2017 at a ~35%margin, which would imply $103m of e-commerce EBIT and $7m of retail EBIT (given that total DTC EBIT was $110m) Adjusted for unusual items. Adjusts for $12.9m in DTC restructuring costs (assume these are all retail related)

Appendix: Footnotes Page 46 ROIC Defined as (EBIT*(1-Tax Rate)/ (Average period net PPE + Working capital) 2017 ROIC Based on adjusted EBIT (ex. restructuring) of $166m and an assumed normalized tax rate of 27% Adjusted EBIT % margin EPS ex. restructuring items Page 49 Based on 2015 EBIT ex. restructuring margin of 8.8% and stated company company target of 12% Pro forma for remaining 2017 restructuring items and store closures, estimate company is run rating at 11.7% EBIT margin Wolverine 2016 gross margins of 39% vs. Deckers FY2018 guided gross margin of 47.5%, implies over 800bps of gross margin difference 180 stores closed in 2017 through Q2 and an additional 33 store closings to occur by year end. In 2013 company had 466 stores. Net debt/LTM EBITDA as of Q4 2016 (period when the debt refinancing was finalized) Original 2017 guidance, adjusted for impact of restructuring initiatives
EXHIBIT B
 |
Response to DECK Investor Presentation November 2017
 |
DISCLAIMER The views expressed in this presentation (the “Presentation”) represent the opinions of Marcato Capital Management LP and/or certain affiliates (“Marcato”) and the investment funds it manages that hold shares in Deckers Outdoor Corporation (the “Company”). This Presentation is for informational purposes only, and it does not have regard to the specific investment objective, financial situation, suitability or particular need of any specific person who may receive the Presentation, and should not be taken as advice on the merits of any investment decision. The views expressed in the Presentation represent the opinions of Marcato, and are based on publicly available information and Marcato analyses. Certain financial information and data used in the Presentation have been derived or obtained from filings made with the Securities and Exchange Commission (“SEC”) by the company or other companies that Marcato considers comparable. Marcato has not sought or obtained consent from any third party to use any statements or information indicated in the Presentation as having been obtained or derived from a third party. Any such statements or information should not be viewed as indicating the support of such third party for the views expressed in the Presentation. Information contained in the Presentation has not been independently verified by Marcato, and Marcato disclaims any and all liability as to the completeness or accuracy of the information and for any omissions of material facts. Marcato disclaims any obligation to correct, update or revise the Presentation or to otherwise provide any additional materials. Marcato recognizes that the Company may possess confidential information that could lead it to disagree with Marcato’s views and/or conclusions. Funds managed by Marcato currently beneficially own, and/or have an economic interest in, shares of the Company. These funds are in the business of trading—buying and selling—securities. Marcato may buy or sell or otherwise change the form or substance of any of its investments in any manner permitted by law and expressly disclaims any obligation to notify any recipient of the Presentation of any such changes. There may be developments in the future that cause funds managed by Marcato to engage in transactions that change the beneficial ownership and/or economic interest in the Company. The Presentation may contain forward-looking statements which reflect Marcato’s views with respect to, among other things, future events and financial performance. Forward-looking statements are subject to various risks and uncertainties and assumptions. There can be no assurance that any idea or assumption herein is, or will be proven, correct. If one or more of the risks or uncertainties materialize, or if Marcato’s underlying assumptions prove to be incorrect, the actual results may vary materially from outcomes indicated by these statements. Accordingly, forward-looking statements should not be regarded as a representation by Marcato that the future plans, estimates or expectations contemplated will ever be achieved. The securities or investment ideas listed are not presented in order to suggest or show profitability of any or all transactions. There should be no assumption that any specific portfolio securities identified and described in the Presentation were or will be profitable. Under no circumstances is the Presentation to be used or considered as an offer to sell or a solicitation of an offer to buy any security, nor does the Presentation constitute either an offer to sell or a solicitation of an offer to buy any interest in funds managed by Marcato. Any such offer would only be made at the time a qualified offeree receives the Confidential Explanatory Memorandum of such fund. Any investment in the Marcato Funds is speculative and involves substantial risk, including the risk of losing all or substantially all of such investment. This document is the property of Marcato and may not be published or distributed without the express written consent of Marcato.
 |
CAUTIONARY STATEMENT REGARDING FORWARD-LOOKING STATEMENTS The information herein contains “forward-looking statements.” Specific forward-looking statements can be identified by the fact that they do not relate strictly to historical or current facts and include, without limitation, words such as “may,” “will,” “expects,” “believes,” “anticipates,” “plans,” “estimates,” “projects,” “targets,” “forecasts,” “seeks,” “could,” “should” or the negative of such terms or other variations on such terms or comparable terminology. Similarly, statements that describe our objectives, plans or goals are forward-looking. Forward-looking statements are subject to various risks and uncertainties and assumptions. There can be no assurance that any idea or assumption herein is, or will be proven, correct. If one or more of the risks or uncertainties materialize, or if Marcato’s underlying assumptions prove to be incorrect, the actual results may vary materially from outcomes indicated by these statements. Accordingly, forward-looking statements should not be regarded as a representation by Marcato that the future plans, estimates or expectations contemplated will ever be achieved. Certain statements and information included herein have been sourced from third parties. Marcato does not make any representations regarding the accuracy, completeness or timeliness of such third party statements or information. Except as may be expressly set forth herein, permission to cite such statements or information has neither been sought nor obtained from such third parties. Any such statements or information should not be viewed as an indication of support from such third parties for the views expressed herein.
 |
CERTAIN INFORMATION CONCERNING THE PARTICIPANTS Marcato International Master Fund, Ltd. (“Marcato International”), Marcato Capital Management LP (“Marcato”) and the other Participants (as defined below) have filed with the Securities and Exchange Commission (the “SEC”) a definitive proxy statement and accompanying GOLD proxy card to be used to solicit (the “Solicitation”) proxies for, among other matters, the election of its slate of director nominees at the 2017 annual stockholders meeting (the “Annual Meeting”) of Deckers Outdoor Corporation (“Deckers” or the “Company”). Stockholders are advised to read the definitive proxy statement and any other documents related to the Solicitation because they contain important information, including information relating to the Participants in the Solicitation. These materials and other materials filed by Marcato with the SEC in connection with the Solicitation are available at no charge on the SEC’s website at http://www.sec.gov. The definitive proxy statement and other relevant documents filed by Marcato with the SEC are also available, without charge, by directing a request to Marcato’s proxy solicitor, D.F. King & Co., Inc., 48 Wall Street, 22nd Floor, New York, New York 10005 (Call Collect: (212)269-5550, Call Toll Free: (800)761-6521 or Email: Deckers@dfking.com). The participants in the proxy solicitation are Marcato International, Marcato, MCM Encore IM LLC (“Marcato Encore LLC”), Marcato Encore Master Fund, Ltd. (“Marcato Encore Fund”), Richard T. McGuire III, Deborah M. Derby, Kirsten J. Feldman, Steve Fuller, Matthew P. Hepler, Robert D. Huth, Jan Rogers Kniffen, Mitchell A. Kosh, Nathaniel J. Lipman and Anne Waterman (collectively, the “Participants”). As of the date hereof, Mr. McGuire, Marcato, Marcato International, Marcato Encore LLC and Marcato Encore Fund may be deemed to beneficially own the equity securities of the Company as described in Marcato’s statement on Schedule 13D in respect of the Company initially filed with the SEC on February 8, 2017, as it may be amended from time to time.
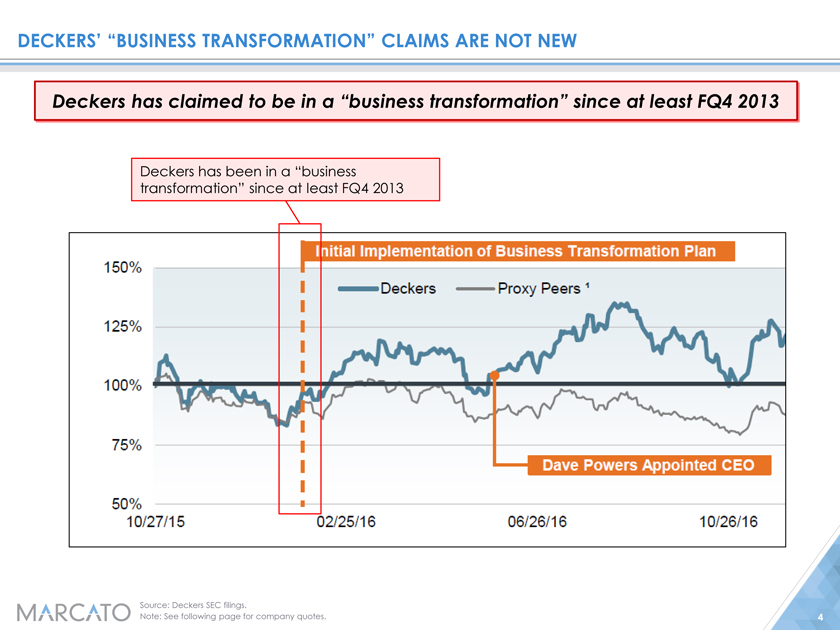 |
DECKERS’ “BUSINESS TRANSFORMATION” CLAIMS ARE NOT NEW Deckers has claimed to be in a “business transformation” since at least FQ4 2013 Deckers has been in a “business transformation” since at least FQ4 2013 Source: Deckers SEC filings. Note: See following page for company quotes.
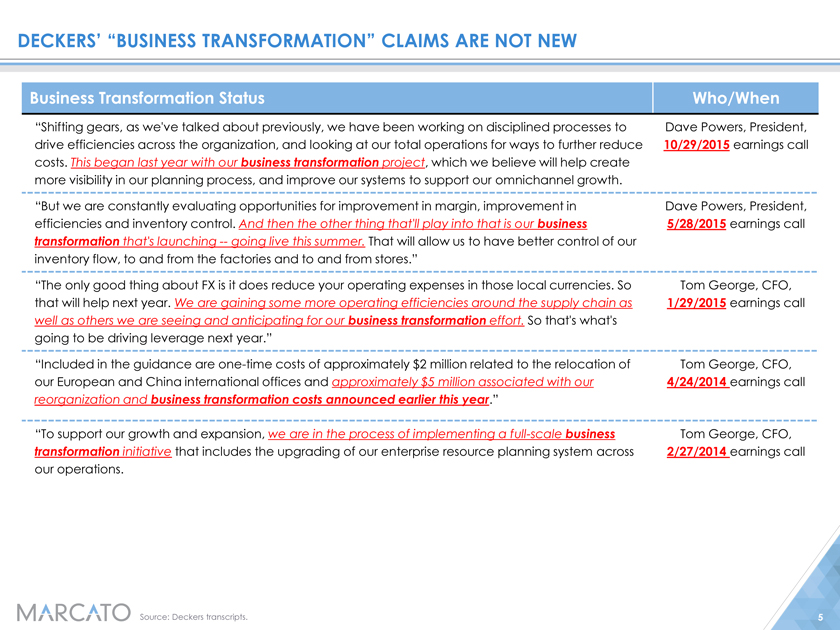 |
DECKERS’ “BUSINESS TRANSFORMATION” CLAIMS ARE NOT NEW Business Transformation Status Who/When “Shifting gears, as we’ve talked about previously, we have been working on disciplined processes to Dave Powers, President, drive efficiencies across the organization, and looking at our total operations for ways to further reduce10/29/2015 earnings call costs. This began last year with our business transformation project, which we believe will help create more visibility in our planning process, and improve our systems to support our omnichannel growth. “But we are constantly evaluating opportunities for improvement in margin, improvement inDave Powers, President, efficiencies and inventory control. And then the other thing that’ll play into that is our business5/28/2015 earnings call transformation that’s launching — going live this summer. That will allow us to have better control of our inventory flow, to and from the factories and to and from stores.” “The only good thing about FX is it does reduce your operating expenses in those local currencies. SoTom George, CFO, that will help next year. We are gaining some more operating efficiencies around the supply chain as 1/29/2015 earnings call well as others we are seeing and anticipating for our business transformation effort. So that’s what’s going to be driving leverage next year.” “Included in the guidance areone-time costs of approximately $2 million related to the relocation ofTom George, CFO, our European and China international offices and approximately $5 million associated with our 4/24/2014 earnings call reorganization and business transformation costs announced earlier this year.” “To support our growth and expansion, we are in the process of implementing a full-scale businessTom George, CFO, transformation initiative that includes the upgrading of our enterprise resource planning system across 2/27/2014 earnings call our operations. Source: Deckers transcripts.
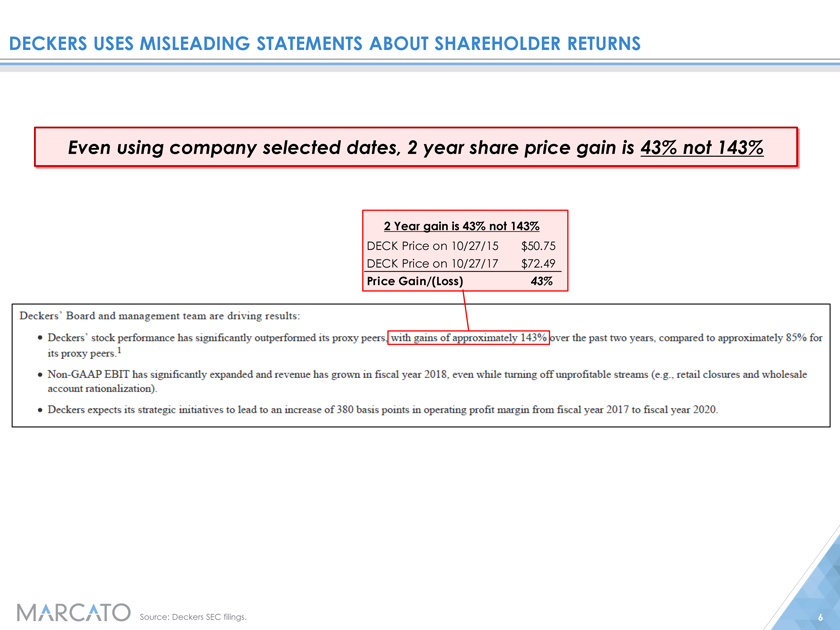 |
DECKERS USES MISLEADING STATEMENTS ABOUT SHAREHOLDER RETURNS Even using company selected dates, 2 year share price gain is 43% not 143% 2 Year gain is 43% not 143% DECK Price on 10/27/15 $50.75 DECK Price on 10/27/17 $72.49 Price Gain/(Loss) 43% Source: Deckers SEC filings. 6 Deckers’ Board and management team are driving results: Deckers’ stock performance has significantly outperformed its proxy peers with gains of approximately 143% over the past two years. Compared to approximately 85% for its proxy peers.1 Non-GAAP EBIT has significantly expanded and revenue has grown in fiscal year 2018, even while turning off unprofitable streams (e.g., retail closures and wholesale account rationalization). Deckers expects its strategic initiatives to lead to an increase of380 basis points in operating profit margin from fiscal year 2017 to fiscal year 2020.
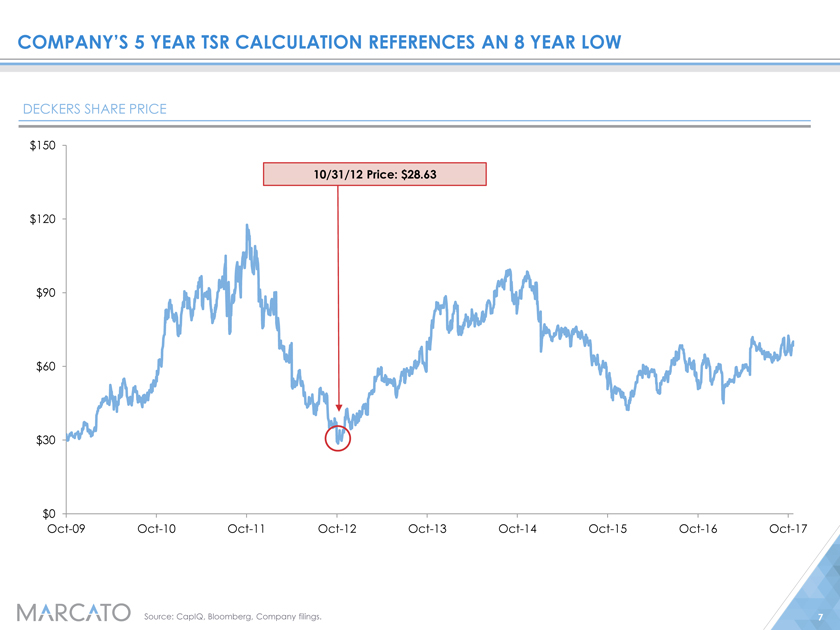 |
COMPANY’S 5 YEAR TSR CALCULATION REFERENCES AN 8 YEAR LOW DECKERS SHARE PRICE $150 10/31/12 Price: $28.63 $120 $90 $60 $30 $0 Oct-09 Oct-10 Oct-11 Oct-12 Oct-13 Oct-14 Oct-15 Oct-16 Oct-17 Source: CapIQ, Bloomberg, Company filings. 7
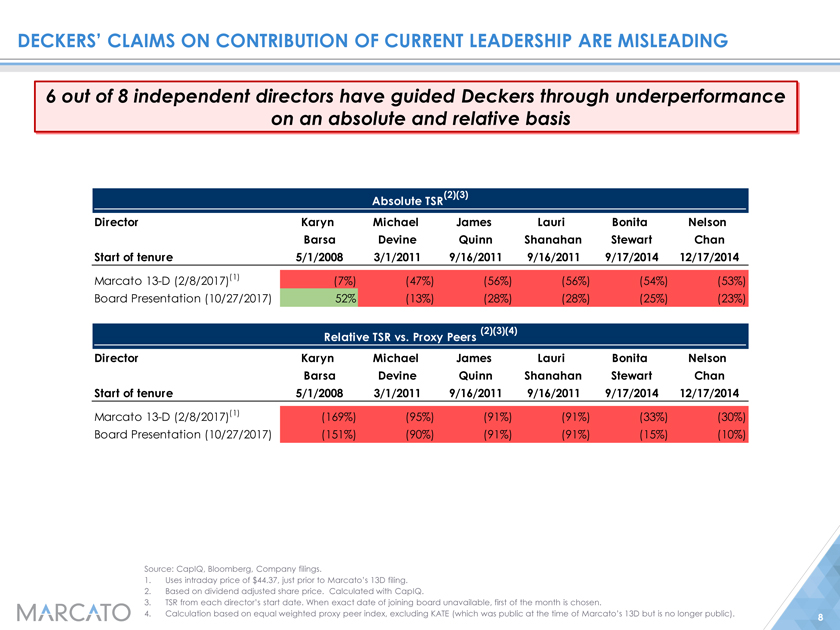 |
DECKERS’ CLAIMS ON CONTRIBUTION OF CURRENT LEADERSHIP ARE MISLEADING 6 out of 8 independent directors have guided Deckers through underperformance on an absolute and relative basis Absolute TSR(2)(3) Director Karyn Michael James Lauri Bonita Nelson Barsa Devine Quinn Shanahan Stewart Chan Start of tenure 5/1/2008 3/1/2011 9/16/2011 9/16/2011 9/17/2014 12/17/2014 Marcato 13-D (2/8/2017)(1) (7%) (47%) (56%) (56%) (54%) (53%) Board Presentation (10/27/2017) 52% (13%) (28%) (28%) (25%) (23%) Relative TSR vs. Proxy Peers (2)(3)(4) Director Karyn Michael James Lauri Bonita Nelson Barsa Devine Quinn Shanahan Stewart Chan Start of tenure 5/1/2008 3/1/2011 9/16/2011 9/16/2011 9/17/2014 12/17/2014 Marcato 13-D (2/8/2017)(1) (169%) (95%) (91%) (91%) (33%) (30%) Board Presentation (10/27/2017) (151%) (90%) (91%) (91%) (15%) (10%) Source: CapIQ, Bloomberg, Company filings. 1. Uses intraday price of $44.37, just prior to Marcato’s 13D filing. 2. Based on dividend adjusted share price. Calculated with CapIQ. 3. TSR from each director’s start date. When exact date of joining board unavailable, first of the month is chosen. 4. Calculation based on equal weighted proxy peer index, excluding KATE (which was public at the time of Marcato’s 13D but is no longer public).
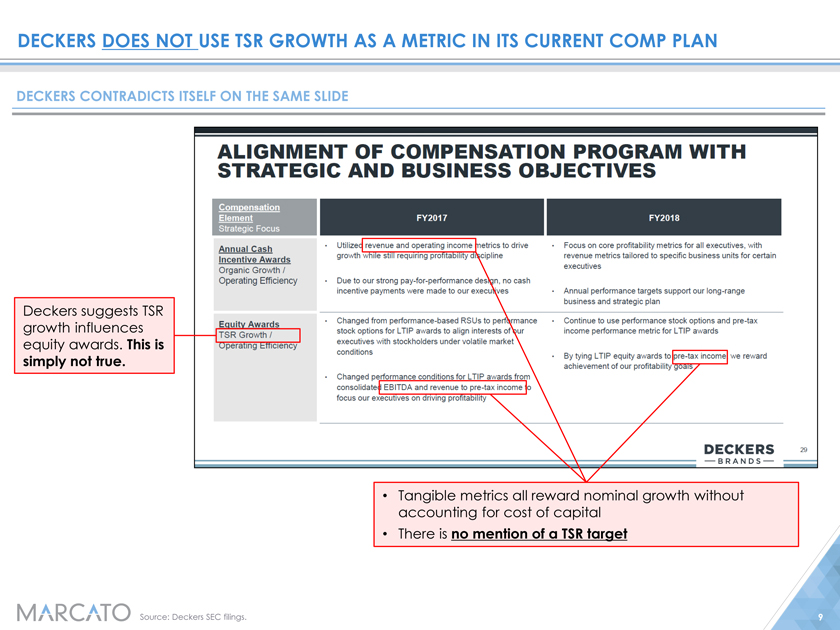 |
DECKERS DOES NOT USE TSR GROWTH AS A METRIC IN ITS CURRENT COMP PLAN DECKERS CONTRADICTS ITSELF ON THE SAME SLIDE ALIGNMENT OF COMPENSATION PROGRAM WITH STRATEGIC AND BUSINESS OBJECTIVES Deckers suggests TSR growth influences equity awards. This is simply not true. Annual Cash Incentive Awards Organic Growth Operating Efficiency Utilized revenue and operating income jnetrics to drive growth while still requiring profitability discipline Due to our strong pay-tor-performance design, no cash incentive payments were made to our executives Focus on core profitability metrics for all executives, with revenue metrics tailored to specific business units for certain executives Annual performance targets support our long-range business and strategic plan Equity Awards — TSR Growth / operating Operating Efficiency Changed from performance-based RSUs to performance stock options for LTIP awards to align interests of our executives with stockholders under volatile market conditions Chanaed performance conditions for LTIP awards from consolidated EBITDA and revenue to pre-tax income to - Continue to use performance stock options and pre-tax income performance metric for LTIP awards By tying LTIP equity awards to pre-tax income we reward achievement of our profitability goals DECKERS — BRANDS I I Tangible metrics all reward nominal growth without accounting for cost of capital There is no mention of a TSR target
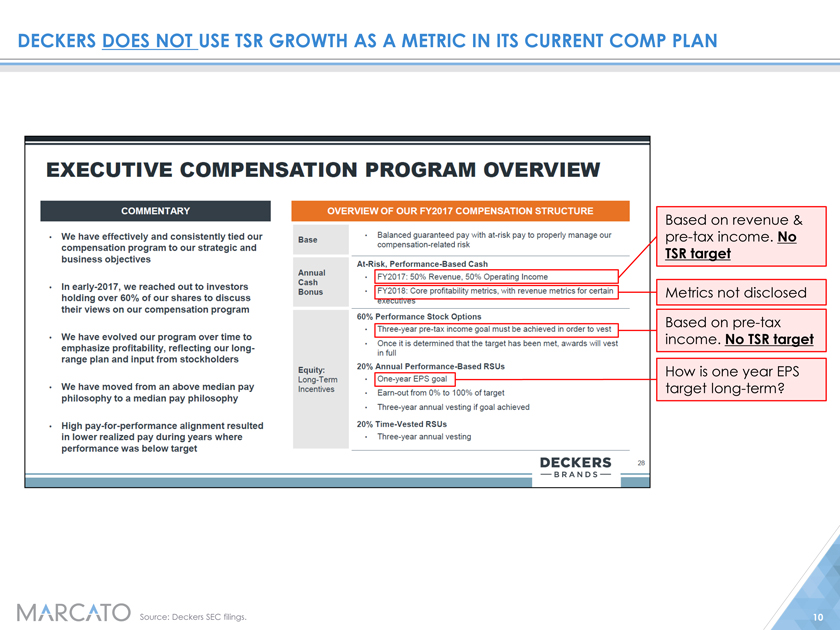 |
DECKERS DOES NOT USE TSR GROWTH AS A METRIC IN ITS CURRENT COMP PLAN EXECUTIVE COMPENSATION We have effectively and consistently tied our compensation program to our strategic and business objectives In early-2017, we reached out to investors holding over 60% of our shares to discuss their views on our compensation program We have evolved our program over time to emphasize profitability, reflecting our long-range plan and input from stockholders We have moved from an above median pay philosophy to a median pay philosophy High pay-for-performance alignment resulted in lower realized pay during years where performance was below target PROGRAM OVERVIEW Base Balanced guaranteed pay with at-risk pay to properly manage our compensation-related risk At-Risk, Performance-Based Cash Annual Cash FY2017:50% Revenue, 50% Operating Income Bonus FY2018: Core profitability metrics, with revenue metrics for certain executives 60% Performance Stock Options Three-year pre-tax income goal must be achieved in order to vest Once it is determined that the target has been met, awards will vest in full Equity. 20% Annual Performance-Based RSUs Long-Term One-year EPS goal Incentives .Earn-out from 0% to 100% of target Three-year annual vesting if goal achieved 20% Time-Vested RSUs Three-year annual vesting Based on revenue & pre-tax income. No TSR target Metrics not disclosed Based on pre-tax income. No TSR target How is one year EPS target long-term?
 |
DECKERS PERFORMANCE LIFESTYLE GROUP “TRENDS” OVERSTATE NON-CORE PERFORMANCE DECKERS CLAIMS “The Performance Lifestyle Group has performed strongly in the last three years, as demonstrated by strong revenue and operating contribution growth” DECKERS FINANCIALS EX UGG & DTC ($ in millions) $400 $351 $360 $339 $324 $300 $262 $200 $100 - $25 $29 $17 ($99) ($100) ($82) FY2014 FY2015 FY2016 FY2017 LTM (1, 2) Other Brands (1) Sanuk (1) TEVA (3) Wholesale Income from Operations Deckers presented financials do not match those in reported filings Source: Deckers SEC filings. 1. Represents retail and wholesale revenue. 2. Includes Hoka One One and other smaller brands. 3. Deckers consolidates retail profits of these brands within DTC, and only reports wholesale profits of these brands. Includes $118M Sanuk impairment taken in fiscal Q3 2017.