Issuer Free Writing Prospectus
Dated June 11, 2012
Filed Pursuant to Rule 433
Registration Statement No. 333-180018
| Georgetown Bancorp, Inc. GTWN Second Step Conversion June 2012 Robert E. Balletto – President & Chief Executive Officer Joseph W. Kennedy – Senior Vice President & Chief Financial Officer |
| Georgetown Bancorp, Inc. (the “Company”) has filed a registration statement (including a prospectus) with the Securities and Exchange Commission (the “SEC”) for the offering to which this communication relates. Before you invest, you should read the prospectus in that registration statement and other documents the Company has filed with the SEC for more complete information about the Company and this offering. You may get these documents for free by visiting EDGAR on the SEC Web site at www.sec.gov. Alternatively, the Company, or any dealer participating in the offering, will arrange to send you the prospectus if you request it by calling Keefe, Bruyette & Woods, Inc. toll free at (877) 860-2086. This presentation contains “forward-looking statements” within the meaning of Section 27A of the Securities Act of 1933, as amended and Section 21E of the Securities Exchange Act of 1934, as amended. We intend such forward-looking statements to be covered by the safe harbor provisions for forward-looking statements contained in the Private Securities Litigation Reform Act of 1995, and are including this statement for purposes of said safe harbor provisions. You can identify these forward-looking statements through our use of words such as “may,” “will,” “anticipate,” “assume,” “should,” “indicate,” “would,” “believe,” “contemplate,” “expect,” “estimate,” “continue,” “plan,” “project,” “could,” “intend,” “target” and other similar words and expressions of the future. These forward-looking statements include, but are not limited to: statements of our goals, intentions and expectations; statements regarding our business plans, prospects, growth and operating strategies; statements regarding the asset quality of our loan and investment portfolios; and estimates of our risks and future costs and benefits. These forward-looking statements are based on current beliefs and expectations of our management and are inherently subject to significant business, economic and competitive uncertainties and contingencies, many of which are beyond our control. In addition, these forward-looking statements are subject to assumptions with respect to future business strategies and decisions that are subject to change. 2 |
| The following factors, among others, could cause actual results to differ materially from the anticipated results or other expectations expressed in the forward-looking statements: • general economic conditions, either nationally or in our market areas, that are worse than expected; • competition among depository and other financial institutions; • inflation and changes in the interest rate environment that reduce our margins or reduce the fair value of financial instruments; • adverse changes in securities markets; • changes in laws or government regulations or policies affecting financial institutions, including changes in regulatory fees and capital requirements; • our ability to enter new markets successfully and capitalize on growth opportunities; • our ability to successfully integrate acquired entities, if any; • changes in consumer spending, borrowing and savings habits; • changes in accounting policies and practices, as may be adopted by the bank regulatory agencies, the Financial Accounting Standards Board, the Securities and Exchange Commission and the Public Company Accounting Oversight Board; • changes in our organization, compensation and benefit plans; and • changes in the financial condition, results of operations or future prospects of issuers of securities that we own. This list of important factors is not all inclusive. For a discussion of these and other risks that may cause actual results to differ from expectations, please refer to the Company’s Prospectus dated May 14, 2012 on file with the SEC. Readers are cautioned not to place undue reliance on the forward-looking statements contained herein, which speak only as of the date of this Presentation. Except as required by applicable law or regulation, we do not undertake, and specifically disclaim any obligation, to update any forward-looking statements, whether written or oral, that may be made from time to time by or on behalf of the Company. Throughout this presentation, the appraisal peer companies include: BFED, CEBK, CBNK, CMSB, COBK, HBNK, MFLR, NFSB, ONFC, and PEOP. The data presented in this presentation relating to the peer companies is based on calendar year information. Data for peers is sourced from SNL Financial LC. 3 |
| 4 A Brief Corporate History of Georgetown Savings Bank 1868 Originally founded as a Massachusetts state-chartered mutual savings bank 2005 In January of 2005, Georgetown Bancorp, MHC and Georgetown Bancorp, Inc. reorganize into the mutual two-tier holding company form of organization. Concurrently with this reorganization, Georgetown Bancorp, Inc. completes a minority stock offering selling 1,249,763 shares, or 45% of its outstanding common stock raising $11.8 million in net proceeds 2011 On November 28, 2011, Georgetown Bancorp, MHC, Georgetown Bancorp, Inc. and Georgetown Savings Bank adopts a plan of conversion and reorganization and intends to offer between 850,000 and 1,322,500 common shares in connection with a second-step conversion of Georgetown Bancorp, MHC 2005 In connection with its mutual holding company reorganization, Georgetown Savings Bank converts from a Massachusetts-chartered savings bank to a federally chartered savings bank 1999 Expansion outside of Georgetown, MA begins with branch opening in Rowley, MA 2006 Continued expansion with branch opening in North Andover, MA Georgetown Savings Bank had total assets at March 31, 2012 of approx. $205.8 million |

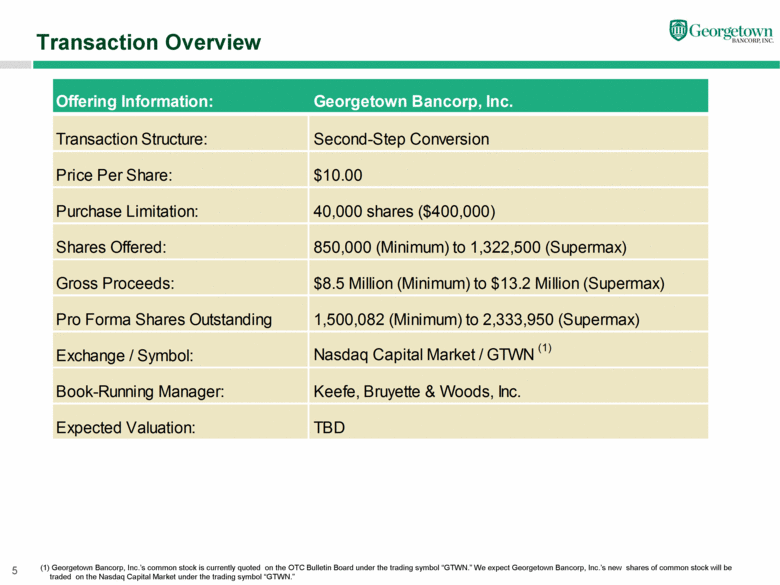
| (1) Georgetown Bancorp, Inc.’s common stock is currently quoted on the OTC Bulletin Board under the trading symbol “GTWN.” We expect Georgetown Bancorp, Inc.’s new shares of common stock will be traded on the Nasdaq Capital Market under the trading symbol “GTWN.” 5 Transaction Overview Offering Information: Georgetown Bancorp, Inc. Transaction Structure: Second-Step Conversion Price Per Share: $10.00 Purchase Limitation: 40,000 shares ($400,000) Shares Offered: 850,000 (Minimum) to 1,322,500 (Supermax) Gross Proceeds: $8.5 Million (Minimum) to $13.2 Million (Supermax) Pro Forma Shares Outstanding 1,500,082 (Minimum) to 2,333,950 (Supermax) Exchange / Symbol: Nasdaq Capital Market / GTWN (1) Book-Running Manager: Keefe, Bruyette & Woods, Inc. Expected Valuation: TBD |
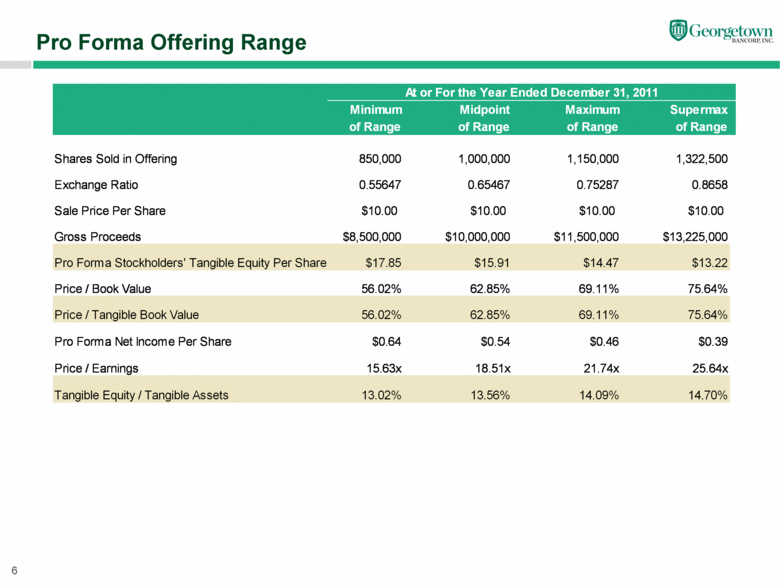
| 6 Pro Forma Offering Range Minimum Midpoint Maximum Supermax of Range of Range of Range of Range Shares Sold in Offering 850,000 1,000,000 1,150,000 1,322,500 Exchange Ratio 0.55647 0.65467 0.75287 0.8658 Sale Price Per Share $10.00 $10.00 $10.00 $10.00 Gross Proceeds $8,500,000 $10,000,000 $11,500,000 $13,225,000 Pro Forma Stockholders' Tangible Equity Per Share $17.85 $15.91 $14.47 $13.22 Price / Book Value 56.02% 62.85% 69.11% 75.64% Price / Tangible Book Value 56.02% 62.85% 69.11% 75.64% Pro Forma Net Income Per Share $0.64 $0.54 $0.46 $0.39 Price / Earnings 15.63x 18.51x 21.74x 25.64x Tangible Equity / Tangible Assets 13.02% 13.56% 14.09% 14.70% At or For the Year Ended December 31, 2011 |
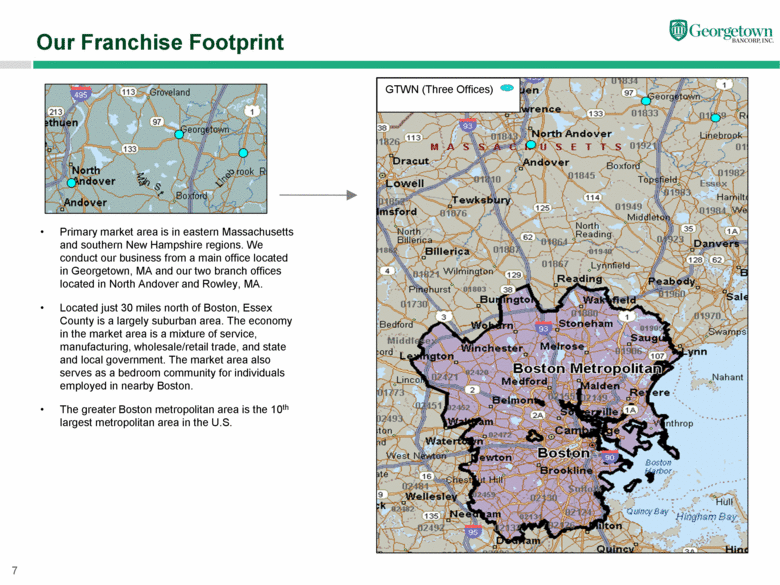
| Primary market area is in eastern Massachusetts and southern New Hampshire regions. We conduct our business from a main office located in Georgetown, MA and our two branch offices located in North Andover and Rowley, MA. Located just 30 miles north of Boston, Essex County is a largely suburban area. The economy in the market area is a mixture of service, manufacturing, wholesale/retail trade, and state and local government. The market area also serves as a bedroom community for individuals employed in nearby Boston. The greater Boston metropolitan area is the 10th largest metropolitan area in the U.S. 7 Our Franchise Footprint GTWN (Three Offices) |
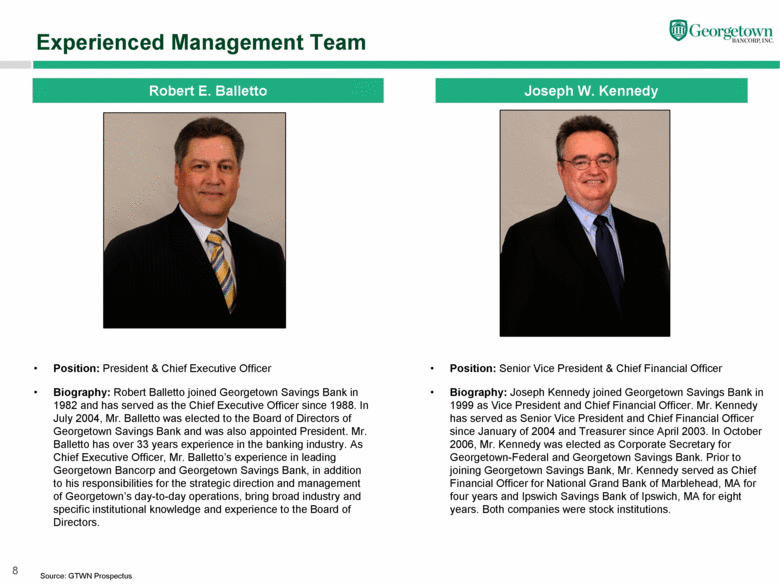
| Position: President & Chief Executive Officer Biography: Robert Balletto joined Georgetown Savings Bank in 1982 and has served as the Chief Executive Officer since 1988. In July 2004, Mr. Balletto was elected to the Board of Directors of Georgetown Savings Bank and was also appointed President. Mr. Balletto has over 33 years experience in the banking industry. As Chief Executive Officer, Mr. Balletto’s experience in leading Georgetown Bancorp and Georgetown Savings Bank, in addition to his responsibilities for the strategic direction and management of Georgetown’s day-to-day operations, bring broad industry and specific institutional knowledge and experience to the Board of Directors. Source: GTWN Prospectus 8 Experienced Management Team Robert E. Balletto Joseph W. Kennedy Position: Senior Vice President & Chief Financial Officer Biography: Joseph Kennedy joined Georgetown Savings Bank in 1999 as Vice President and Chief Financial Officer. Mr. Kennedy has served as Senior Vice President and Chief Financial Officer since January of 2004 and Treasurer since April 2003. In October 2006, Mr. Kennedy was elected as Corporate Secretary for Georgetown-Federal and Georgetown Savings Bank. Prior to joining Georgetown Savings Bank, Mr. Kennedy served as Chief Financial Officer for National Grand Bank of Marblehead, MA for four years and Ipswich Savings Bank of Ipswich, MA for eight years. Both companies were stock institutions. |
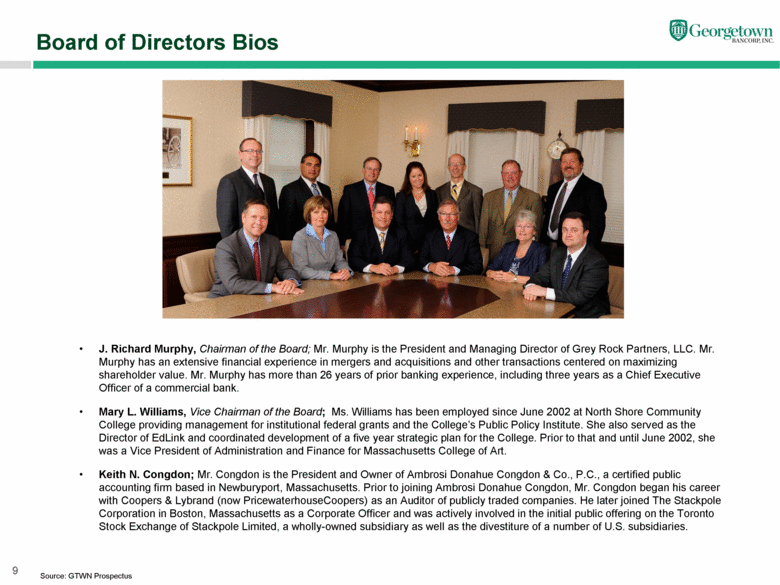
| J. Richard Murphy, Chairman of the Board; Mr. Murphy is the President and Managing Director of Grey Rock Partners, LLC. Mr. Murphy has an extensive financial experience in mergers and acquisitions and other transactions centered on maximizing shareholder value. Mr. Murphy has more than 26 years of prior banking experience, including three years as a Chief Executive Officer of a commercial bank. Mary L. Williams, Vice Chairman of the Board; Ms. Williams has been employed since June 2002 at North Shore Community College providing management for institutional federal grants and the College’s Public Policy Institute. She also served as the Director of EdLink and coordinated development of a five year strategic plan for the College. Prior to that and until June 2002, she was a Vice President of Administration and Finance for Massachusetts College of Art. Keith N. Congdon; Mr. Congdon is the President and Owner of Ambrosi Donahue Congdon & Co., P.C., a certified public accounting firm based in Newburyport, Massachusetts. Prior to joining Ambrosi Donahue Congdon, Mr. Congdon began his career with Coopers & Lybrand (now PricewaterhouseCoopers) as an Auditor of publicly traded companies. He later joined The Stackpole Corporation in Boston, Massachusetts as a Corporate Officer and was actively involved in the initial public offering on the Toronto Stock Exchange of Stackpole Limited, a wholly-owned subsidiary as well as the divestiture of a number of U.S. subsidiaries. Source: GTWN Prospectus 9 Board of Directors Bios |
| Anthony S. Conte, Jr.; Mr. Conte is the Owner of Conte Funeral Homes, Inc., located in North Andover, Andover and Georgetown, Massachusetts. Mr. Conte has 22 years of experience as Owner and Manager. Stephen L. Flynn; Mr. Flynn is the President and Owner of Nunan Florist and Greenhouse, Inc., located in Georgetown, Massachusetts. Mr. Flynn has 27 years of experience as Owner and Manager of the company. Thomas L. Hamelin; Mr. Hamelin has been a Mechanical Engineer for Varian Semiconductor Equipment Associates since October 2010. Prior to that, Mr. Hamelin was a Mechanical Engineer for Tokyo Electron since March 1998. Marybeth McInnis, Esquire; Ms. McInnis owns McInnis Law Offices, a boutique law firm located in North Andover, Massachusetts, that has provided full-service estate planning services to the Merrimack Valley for more than forty-five years. Ms. McInnis is actively involved with many local charitable organizations and has served on the Board of Trustees of Merrimack College since July of 2008 and the Board of Trustees of the James W. O’Brien Foundation, Inc., since June of 2000. Kathleen R. Sachs; Ms. Sachs holds a CFP certification, and is the Founder and a Principal of Sachs Financial Planning. Ms. Sachs also teaches risk management at Merrimack College. Richard F. Spencer; Mr. Spencer retired as Chief of Police for the town of Georgetown, Massachusetts in July 2002. As a well known community leader and long-time resident of Georgetown Savings Bank’s market area, Mr. Spencer brings a unique perspective to the Board on community issues affecting Georgetown Savings Bank and residents of Georgetown Savings Bank’s market area. David A. Splaine; Mr. Splaine is a Partner in Ellis Insurance Agency, Inc located in York, Maine and Portsmouth, New Hampshire. He is also currently a partner in a consulting firm, specializing in the sports industry. From 2001 to 2006 he served as Senior Vice President of Sales for the TDBank Garden and Boston Bruins. Prior experience includes senior lending positions at Fleet Bank (now Bank of America). He has served as a Director of the Boston Celtics Limited Partnership, and is currently a Director of several private companies. Robert T. Wyman; Mr. Wyman is an attorney and partner at the law firm Wyman & Barton, LLC, of Andover and Chelmsford, Massachusetts, representing clients in the areas of civil and criminal litigation, real estate litigation and real estate conveyance. John H. Yeaton; Mr. Yeaton has been employed since July 2010 by Quest Diagnostics as Controller for the Cambridge, MA Business Unit. Prior to joining Quest Diagnostics, Mr. Yeaton was the Director of Financial Planning and Analysis for the products division and controller for the pharmaceuticals business unit for Fresenius Medical Care North America of Waltham, Massachusetts. In August 2011, Mr. Yeaton became a Certified Public Accountant, licensed in the State of New Hampshire. Source: GTWN Prospectus 10 Board of Directors Bios (Continued) |
| Our principal objective is to build long-term value for our shareholders by operating a profitable community bank dedicated to meeting the banking needs of our customers. Our board of directors has sought to accomplish this objective with a strategy designed to increase profitability, while maintaining a strong capital position and high asset quality. We cannot assure you that we will successfully implement our business strategy in pursuit of these goals. We seek to achieve these results by focusing on the following objectives: Continuing to emphasize the origination of commercial loans Maintaining high asset quality through conservative underwriting and aggressive monitoring of assets Continuing to emphasize core deposit growth to reduce funding costs Expanding secondary mortgage marketing capabilities Remaining a customer service focused community bank 11 Business and Operating Strategies and Goals |
| Our primary reasons for converting to the fully public stock form of ownership and undertaking the stock offering are to: increase our capital to support continued growth and future business activities; transition from the mutual holding company structure to a more familiar and flexible organizational structure; improve the trading liquidity of our shares of common stock; and eliminate uncertainties associated with the mutual holding company structure resulting from the Dodd-Frank Wall Street Reform and Consumer Protection Act and the sunset of the Office of Thrift Supervision. 12 Reasons for the Conversion and Offering |
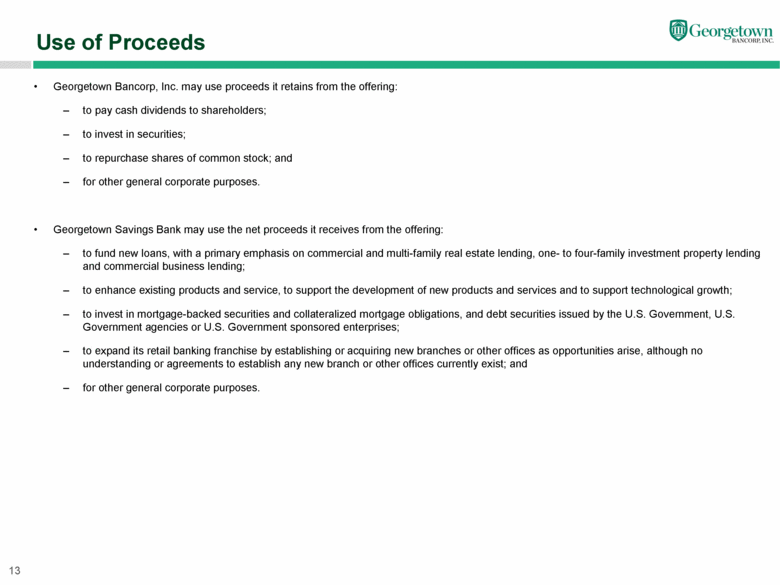
| Georgetown Bancorp, Inc. may use proceeds it retains from the offering: to pay cash dividends to shareholders; to invest in securities; to repurchase shares of common stock; and for other general corporate purposes. Georgetown Savings Bank may use the net proceeds it receives from the offering: to fund new loans, with a primary emphasis on commercial and multi-family real estate lending, one- to four-family investment property lending and commercial business lending; to enhance existing products and service, to support the development of new products and services and to support technological growth; to invest in mortgage-backed securities and collateralized mortgage obligations, and debt securities issued by the U.S. Government, U.S. Government agencies or U.S. Government sponsored enterprises; to expand its retail banking franchise by establishing or acquiring new branches or other offices as opportunities arise, although no understanding or agreements to establish any new branch or other offices currently exist; and for other general corporate purposes. 13 Use of Proceeds |
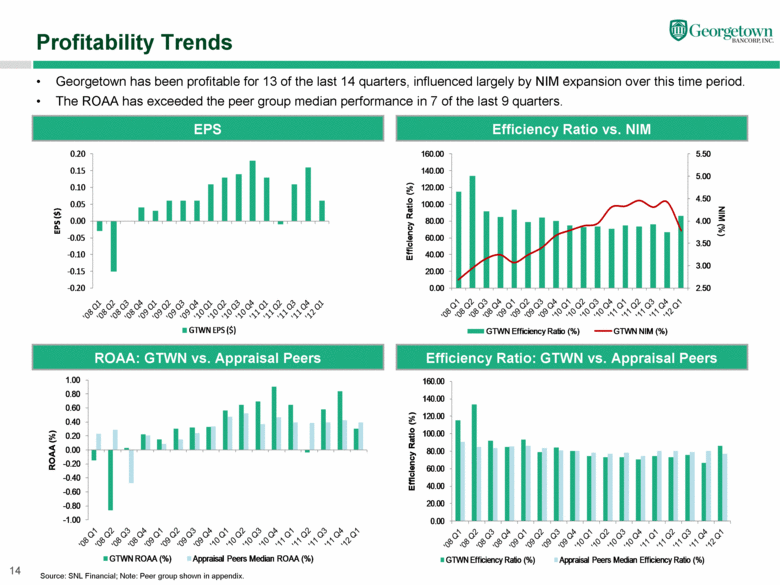
| Georgetown has been profitable for 13 of the last 14 quarters, influenced largely by NIM expansion over this time period. The ROAA has exceeded the peer group median performance in 7 of the last 9 quarters. Source: SNL Financial; Note: Peer group shown in appendix. 14 Profitability Trends EPS Efficiency Ratio vs. NIM ROAA: GTWN vs. Appraisal Peers Efficiency Ratio: GTWN vs. Appraisal Peers 0.00 20.00 40.00 60.00 80.00 100.00 120.00 140.00 160.00 Efficiency Ratio (%) GTWN Efficiency Ratio (%) Appraisal Peers Median Efficiency Ratio (%) 2.50 3.00 3.50 4.00 4.50 5.00 5.50 0.00 20.00 40.00 60.00 80.00 100.00 120.00 140.00 160.00 NIM (%) Efficiency Ratio (%) GTWN Efficiency Ratio (%) GTWN NIM (%) - 1.00 - 0.80 - 0.60 - 0.40 - 0.20 0.00 0.20 0.40 0.60 0.80 1.00 ROAA (%) GTWN ROAA (%) Appraisal Peers Median ROAA (%) EPS ($) GTWN EPS ($) |
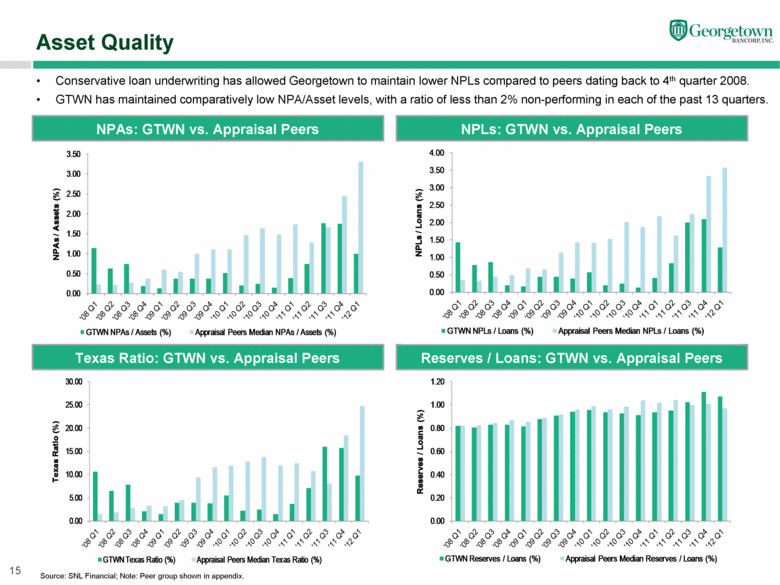
| Conservative loan underwriting has allowed Georgetown to maintain lower NPLs compared to peers dating back to 4th quarter 2008. GTWN has maintained comparatively low NPA/Asset levels, with a ratio of less than 2% non-performing in each of the past 13 quarters. Source: SNL Financial; Note: Peer group shown in appendix. 15 Asset Quality NPAs: GTWN vs. Appraisal Peers NPLs: GTWN vs. Appraisal Peers Texas Ratio: GTWN vs. Appraisal Peers Reserves / Loans: GTWN vs. Appraisal Peers 0.00 0.20 0.40 0.60 0.80 1.00 1.20 Reserves / Loans (%) GTWN Reserves / Loans (%) Appraisal Peers Median Reserves / Loans (%) 0.00 0.50 1.00 1.50 2.00 2.50 3.00 3.50 NPAs / Assets (%) GTWN NPAs / Assets (%) Appraisal Peers Median NPAs / Assets (%) 0.00 0.50 1.00 1.50 2.00 2.50 3.00 3.50 4.00 NPLs / Loans (%) GTWN NPLs / Loans (%) Appraisal Peers Median NPLs / Loans (%) 0.00 5.00 10.00 15.00 20.00 25.00 30.00 Texas Ratio (%) GTWN Texas Ratio (%) Appraisal Peers Median Texas Ratio (%) |
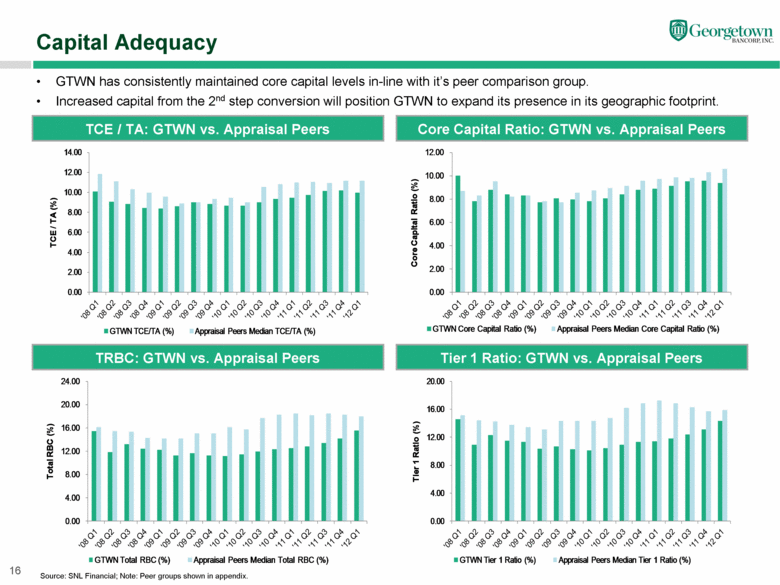
| GTWN has consistently maintained core capital levels in-line with it’s peer comparison group. Increased capital from the 2nd step conversion will position GTWN to expand its presence in its geographic footprint. Source: SNL Financial; Note: Peer groups shown in appendix. 16 Capital Adequacy TCE / TA: GTWN vs. Appraisal Peers Core Capital Ratio: GTWN vs. Appraisal Peers TRBC: GTWN vs. Appraisal Peers Tier 1 Ratio: GTWN vs. Appraisal Peers 0.00 4.00 8.00 12.00 16.00 20.00 24.00 Total RBC (%) GTWN Total RBC (%) Appraisal Peers Median Total RBC (%) 0.00 2.00 4.00 6.00 8.00 10.00 12.00 Core Capital Ratio (%) GTWN Core Capital Ratio (%) Appraisal Peers Median Core Capital Ratio (%) 0.00 4.00 8.00 12.00 16.00 20.00 Tier 1 Ratio (%) GTWN Tier 1 Ratio (%) Appraisal Peers Median Tier 1 Ratio (%) TCE/TA (%) GTWN TCE/TA (%) Appraisal Peers Median TCE/TA (%) |
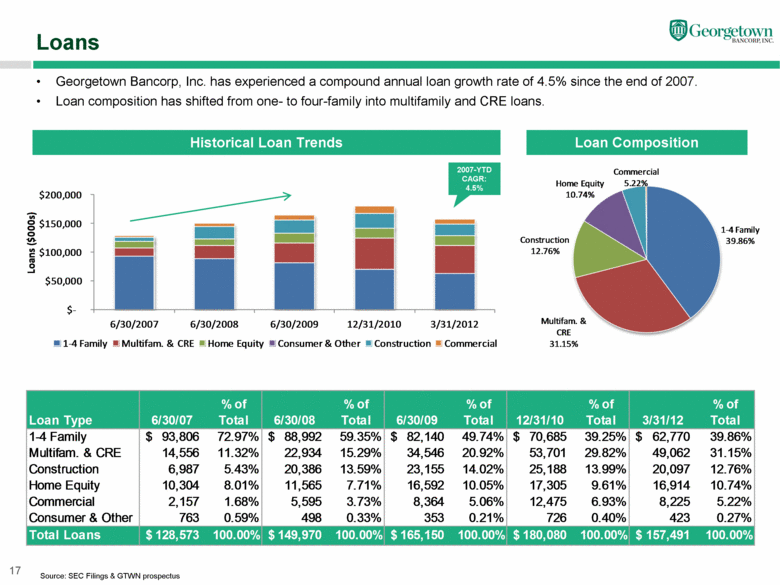
| Georgetown Bancorp, Inc. has experienced a compound annual loan growth rate of 4.5% since the end of 2007. Loan composition has shifted from one- to four-family into multifamily and CRE loans. Source: SEC Filings & GTWN prospectus 17 Loans Historical Loan Trends Loan Composition 2007-YTD CAGR: 4.5% 1 - 4 Family 39.86% Multifam. & CRE 31.15% Construction 12.76% Home Equity 10.74% Commercial 5.22% Loan Type 6/30/07 % of Total 6/30/08 % of Total 6/30/09 % of Total 12/31/10 % of Total 3/31/12 % of Total 1-4 Family 93,806 $ 72.97% 88,992 $ 59.35% 82,140 $ 49.74% 70,685 $ 39.25% 62,770 $ 39.86% Multifam. & CRE 14,556 11.32% 22,934 15.29% 34,546 20.92% 53,701 29.82% 49,062 31.15% Construction 6,987 5.43% 20,386 13.59% 23,155 14.02% 25,188 13.99% 20,097 12.76% Home Equity 10,304 8.01% 11,565 7.71% 16,592 10.05% 17,305 9.61% 16,914 10.74% Commercial 2,157 1.68% 5,595 3.73% 8,364 5.06% 12,475 6.93% 8,225 5.22% Consumer & Other 763 0.59% 498 0.33% 353 0.21% 726 0.40% 423 0.27% Total Loans 128,573 $ 100.00% 149,970 $ 100.00% 165,150 $ 100.00% 180,080 $ 100.00% 157,491 $ 100.00% $ - $50,000 $100,000 $150,000 $200,000 6/30/2007 6/30/2008 6/30/2009 12/31/2010 3/31/2012 Loans ($000s) 1 - 4 Family Multifam. & CRE Home Equity Consumer & Other Construction Commercial |
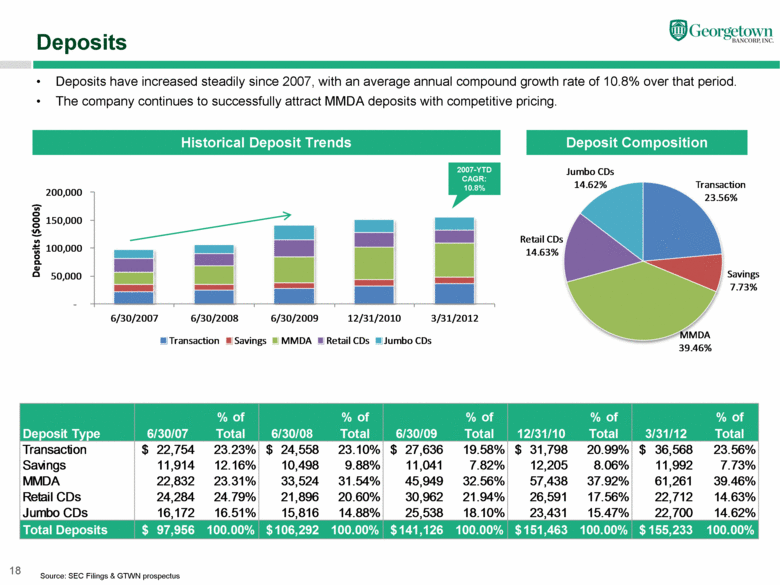
| Deposits have increased steadily since 2007, with an average annual compound growth rate of 10.8% over that period. The company continues to successfully attract MMDA deposits with competitive pricing. Source: SEC Filings & GTWN prospectus 18 Deposits Historical Deposit Trends Deposit Composition 2007-YTD CAGR: 10.8% Transaction 23.56% Savings 7.73% MMDA 39.46% Retail CDs 14.63% Jumbo CDs 14.62% Deposit Type 6/30/07 % of Total 6/30/08 % of Total 6/30/09 % of Total 12/31/10 % of Total 3/31/12 % of Total Transaction 22,754 $ 23.23% 24,558 $ 23.10% 27,636 $ 19.58% 31,798 $ 20.99% 36,568 $ 23.56% Savings 11,914 12.16% 10,498 9.88% 11,041 7.82% 12,205 8.06% 11,992 7.73% MMDA 22,832 23.31% 33,524 31.54% 45,949 32.56% 57,438 37.92% 61,261 39.46% Retail CDs 24,284 24.79% 21,896 20.60% 30,962 21.94% 26,591 17.56% 22,712 14.63% Jumbo CDs 16,172 16.51% 15,816 14.88% 25,538 18.10% 23,431 15.47% 22,700 14.62% Total Deposits 97,956 $ 100.00% 106,292 $ 100.00% 141,126 $ 100.00% 151,463 $ 100.00% 155,233 $ 100.00% - 50,000 100,000 150,000 200,000 6/30/2007 6/30/2008 6/30/2009 12/31/2010 3/31/2012 Deposits ($000s) Transaction Savings MMDA Retail CDs Jumbo CDs |
| Experienced management team Successful execution of defined operating strategy and goals: Continuing to emphasize the origination of commercial loans Maintaining high asset quality through conservative underwriting and aggressive monitoring of assets Continuing to emphasize core deposit growth to reduce funding costs Expanding secondary mortgage marketing capabilities Remaining a customer service focused community bank Intends to pay cash dividends 19 Summary |
| Appendix |

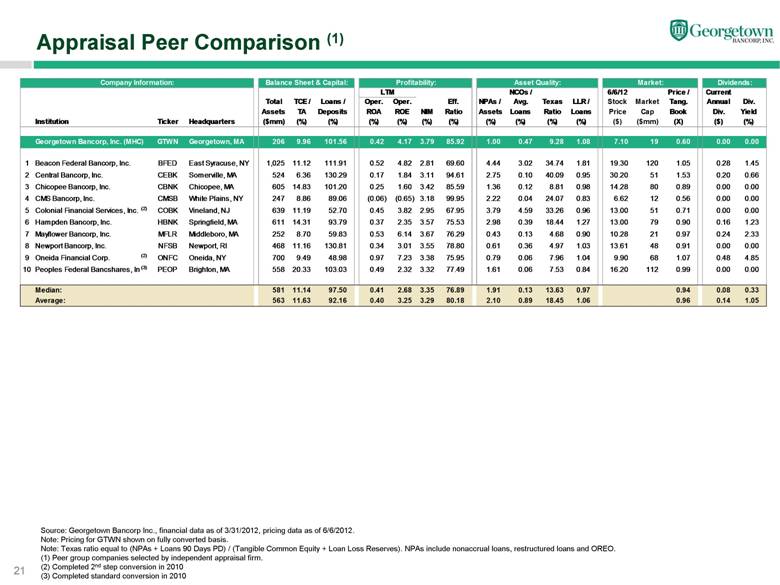
| 21 Appraisal Peer Comparison (1) Source: Georgetown Bancorp Inc., financial data as of 3/31/2012, pricing data as of 6/6/2012. Note: Pricing for GTWN shown on fully converted basis. Note: Texas ratio equal to (NPAs + Loans 90 Days PD) / (Tangible Common Equity + Loan Loss Reserves). NPAs include nonaccrual loans, restructured loans and OREO. (1) Peer group companies selected by independent appraisal firm. (2) Completed 2nd step conversion in 2010 (3) Completed standard conversion in 2010 Company Information: Balance Sheet & Capital: Profitability: Asset Quality: Market: Dividends: Ownership: LTM NCOs / 6/6/12 Price / Current Total TCE / Loans / Oper. Oper. Eff. NPAs / Avg. Texas LLR / Stock Market Tang. Annual Div. Ownership Assets TA Deposits ROA ROE NIM Ratio Assets Loans Ratio Loans Price Cap Book Div. Yield Institution Ticker Headquarters ($mm) (%) (%) (%) (%) (%) (%) (%) (%) (%) (%) ($) ($mm) (X) ($) (%) Georgetown Bancorp, Inc. (MHC) GTWN Georgetown, MA 206 9.96 101.56 0.42 4.17 3.79 85.92 1.00 0.47 15.70 1.08 7.10 19 0.60 0.00 0.00 1 Beacon Federal Bancorp, Inc. BFED East Syracuse, NY 1,025 11.12 111.91 0.52 4.82 2.81 69.60 4.44 3.02 34.74 1.81 19.30 120 1.05 0.28 1.45 2 Central Bancorp, Inc. CEBK Somerville, MA 524 6.36 130.29 0.17 1.84 3.11 94.61 2.75 0.10 40.09 0.95 30.20 51 1.53 0.20 0.66 3 Chicopee Bancorp, Inc. CBNK Chicopee, MA 605 14.83 101.20 0.25 1.60 3.42 85.59 1.36 0.12 8.81 0.98 14.28 80 0.89 0.00 0.00 4 CMS Bancorp, Inc. CMSB White Plains, NY 247 8.86 89.06 (0.06) (0.65) 3.18 99.95 2.22 0.04 24.07 0.83 6.62 12 0.56 0.00 0.00 5 Colonial Financial Services, Inc. (2) COBK Vineland, NJ 639 11.19 52.70 0.45 3.82 2.95 67.95 3.79 4.59 33.26 0.96 13.00 51 0.71 0.00 0.00 6 Hampden Bancorp, Inc. HBNK Springfield, MA 611 14.31 93.79 0.37 2.35 3.57 75.53 2.98 0.39 18.44 1.27 13.00 79 0.90 0.16 1.23 7 Mayflower Bancorp, Inc. MFLR Middleboro, MA 252 8.70 59.83 0.53 6.14 3.67 76.29 0.43 0.13 4.68 0.90 10.28 21 0.97 0.24 2.33 8 Newport Bancorp, Inc. NFSB Newport, RI 468 11.16 130.81 0.34 3.01 3.55 78.80 0.61 0.36 4.97 1.03 13.61 48 0.91 0.00 0.00 9 Oneida Financial Corp. (2) ONFC Oneida, NY 700 9.49 48.98 0.97 7.23 3.38 75.95 0.79 0.06 7.96 1.04 9.90 68 1.07 0.48 4.85 10 Peoples Federal Bancshares, Inc. (3) PEOP Brighton, MA 558 20.33 103.03 0.49 2.32 3.32 77.49 1.61 0.06 7.53 0.84 16.20 112 0.99 0.00 0.00 Median: 581 11.14 97.50 0.41 2.68 3.35 76.89 1.91 0.13 13.63 0.97 0.94 0.08 0.33 Average: 563 11.63 92.16 0.40 3.25 3.29 80.18 2.10 0.89 18.45 1.06 0.96 0.14 1.05 9.28 |
| [LOGO] |