Filed Pursuant to Rule 424(b)(3)
Registration No. 333-208751
RREEF PROPERTY TRUST, INC.
SUPPLEMENT NO. 14 DATED NOVEMBER 20, 2019
TO THE PROSPECTUS DATED APRIL 11, 2019
This document supplements, and should be read in conjunction with, our prospectus dated April 11, 2019, as supplemented by Supplement No. 1 dated April 11, 2019, Supplement No. 2 dated May 2, 2019, Supplement No. 3 dated May 17, 2019, Supplement No. 4 dated June 3, 2019, Supplement No. 5 dated June 14, 2019, Supplement No. 6 dated July 2, 2019, Supplement No. 7 dated August 1, 2019, Supplement No. 8 dated August 15, 2019, Supplement No. 9 dated September 3, 2019, Supplement No. 10 dated September 4, 2019, Supplement No. 11 dated September 17, 2019, Supplement No.12 dated October 2, 2019 and Supplement No. 13 dated November 1, 2019. Unless otherwise defined herein, capitalized terms shall have the same meanings as set forth in the prospectus.
The purpose of this supplement is to disclose:
•an update to the valuation of our properties;
•an update to the “Experts” section of our prospectus;
•our Quarterly Report on Form 10-Q for the period ended September 30, 2019;
•an update to the “Suitability Standards” section of the prospectus;
•an update to the “Prospectus Summary” section of the prospectus;
•an update to the “Risk Factors” section of the prospectus;
•an update to the “Management” section of the prospectus; and
•the Historical Summary of Gross Income and Direct Operating Expenses for the Six
Months Ended June 30, 2019 (unaudited) and the Year Ended December 31, 2018, and related pro forma financial statements, for our Providence Square property that we acquired on September 16, 2019, which are attached to this Supplement No. 14 as Appendix B.
Valuation of Properties
The estimated market values of our office, retail, industrial and apartment properties as of September 30, 2019 were $100,200,000, $126,260,621, $49,400,000 and $35,500,000, respectively.
Experts
The following disclosure is added to the “Experts” section of our prospectus.
The Historical Summary of Gross Income and Direct Operating Expenses of Providence Square for the year ended December 31, 2018, has been included herein and in the registration statement in reliance upon the report of KPMG LLP, independent registered public accounting firm, appearing elsewhere herein, and upon the authority of said firm as experts in accounting and auditing.
The amount of the estimated market values of our real properties as of September 30, 2019 presented on page 1 of this Supplement No. 14 under the section “Valuation of Properties” has been reviewed by Altus Group U.S. Inc., an independent valuation firm, and is included in this Supplement No. 14 given the
authority of such firm as experts in property valuations and appraisals. Altus Group U.S. Inc. will not calculate or be responsible for our daily NAV per share for any class of our shares.
Quarterly Report on Form 10-Q
The prospectus is hereby supplemented with our Quarterly Report on Form 10-Q, excluding exhibits, for the period ended September 30, 2019 that was filed with the SEC on November 14, 2019, a copy of which is attached to this Supplement No. 14 as Appendix A.
Update to “Suitability Standards”
The following is added to the end of the seventh paragraph on page iv in the “Suitability Standards” section of the prospectus.
Our board of directors has determined that, notwithstanding the provisions regarding participant-directed purchases under a 401(k) or other defined contribution plan in our charter, should our shares be available in the future under a participant-directed 401(k) or other defined contribution plan, we shall require that any applicable suitability standard shall be met by the investor, beneficiary, or donor or grantor who directly or indirectly supplies the funds.
Update to “Prospectus Summary”
The following replaces the fourth bullet beginning on page 15 in the “Prospectus Summary—Summary Risk Factors” section of the prospectus.
| |
| • | The amount of distributions we may make is uncertain. Until December 31, 2015, expense support from our advisor contributed to funding our distributions. In the future, we may, and likely will, pay distributions and fund redemptions from sources other than cash flow from operations, including, without limitation, the sale of assets, borrowings or offering proceeds, and we have no limits on the amounts we may pay from such sources. For the year ended December 31, 2018, our distributions were covered 82.0% by cash flow from operations and 18.0% by offering proceeds. Payments of distributions from sources other than cash flow from operations may reduce the amount of capital we ultimately invest in real estate, which may negatively impact the value of your investment and our daily NAV per share. |
Update to “Risk Factors”
The following replaces the fourth sentence of the risk factor on page 37 titled “We may pay distributions from sources other than our funds from operations, or FFO. To the extent that we pay distributions from sources other than FFO, we will have reduced funds available for investment and the overall return to our stockholders may be reduced.”
For the year ended December 31, 2018, our distributions were not covered by our FFO and our distributions were covered 82.0% by cash flow from operations and 18.0% by offering proceeds.
Update to “Investment Objectives and Strategy”
The following is added as the fifth full paragraph to page 76 in the “Investment Objectives and Strategy—Investments in Real Estate Loans—Investing in and Originating Real Estate Loans” section of
the prospectus.
We will not invest in mortgage pools, commercial mortgage-backed securities and residential mortgage-backed securities in which the underlying mortgages exceed an amount equal to 85% of the value of the underlying assets, and in which appraisals have not been obtained on the underlying assets.
Update to “Management”
The following is added to the end of the first paragraph on page 105 in the “Management—The Advisory Agreement—Limit on Total Operating Expenses” section of the prospectus.
With respect to “total operating expenses” as defined above, and with respect to “acquisition expenses” in clause (1)(f) above, our board of directors has determined that we will not read the defined terms “Total Operating Expenses” and “Acquisition Expenses” in our charter in a manner that is inconsistent with the NASAA REIT Guidelines, and further, total operating expenses shall include any Company-level management fees and we will pay any acquisition expenses in compliance therewith.
UNITED STATES
SECURITIES AND EXCHANGE COMMISSION
Washington, D.C. 20549
__________________________________________
Form 10-Q
_________________________________________
|
| |
| x | QUARTERLY REPORT PURSUANT TO SECTION 13 OR 15(d) OF THE SECURITIES EXCHANGE ACT OF 1934 |
For the quarterly period ended September 30, 2019
OR
|
| |
| o | TRANSITION REPORT PURSUANT TO SECTION 13 OR 15(d) OF THE SECURITIES EXCHANGE ACT OF 1934 |
For the transition period from ____ to ____
Commission file number 000-55598
__________________________________________
RREEF Property Trust, Inc.
(Exact name of registrant as specified in its charter)
__________________________________________
|
| |
| Maryland | 45-4478978 |
(State or other jurisdiction of incorporation or organization) | (I.R.S. Employer Identification Number) |
| 345 Park Avenue, 26th Floor, New York, NY 10154 | (212) 454-6260 |
| (Address of principal executive offices; zip code) | (Registrant’s telephone number, including area code) |
Not Applicable
(Former name, former address and former fiscal year, if changed since last report)
________________________________________________________________________
Securities registered pursuant to Section 12(b) of the Act: None.
Indicate by check mark whether the registrant (1) has filed all reports required to be filed by Section 13 or 15(d) of the Securities Exchange Act of 1934 during the preceding 12 months (or for such shorter period that the registrant was required to file such reports), and (2) has been subject to such filing requirements for the past 90 days. Yes x No o
Indicate by check mark whether the registrant has submitted electronically every Interactive Data File required to be submitted pursuant to Rule 405 of Regulation S-T (§ 232.405 of this chapter) during the preceding 12 months (or for such shorter period that the registrant was required to submit such files). Yes x No o
Indicate by check mark whether the registrant is a large accelerated filer, an accelerated filer, a non-accelerated filer, smaller reporting company or an emerging growth company. See the definitions of “large accelerated filer,” “accelerated filer,” “smaller reporting company,” and “emerging growth company” in Rule 12b-2 of the Exchange Act.
|
| | | |
| Large accelerated filer | o | Accelerated filer | o |
| Non-accelerated filer | x | Smaller reporting company | x |
| | | Emerging growth company | o |
If an emerging growth company, indicate by check mark if the registrant has elected not to use the extended transition period for complying with any new or revised financial accounting standards provided pursuant to Section 13(a) of the Exchange Act. o
Indicate by check mark whether the registrant is a shell company (as defined in Rule 12b-2 of the Exchange Act). Yes o No x
As of November 8, 2019, the registrant had 3,786,956 shares of Class A common stock, $.01 par value, outstanding, 9,221,337 shares of Class I common stock, $.01 par value, outstanding, 832,511 shares of Class T common stock, $.01 par value, outstanding, 176,101 shares of Class D common stock, $.01 par value, outstanding, and no shares of Class N common stock, $.01 par value, outstanding.
RREEF PROPERTY TRUST, INC.
QUARTERLY REPORT ON FORM 10-Q
For the Quarter Ended September 30, 2019
TABLE OF CONTENTS
PART I
FINANCIAL INFORMATION
ITEM 1. FINANCIAL STATEMENTS
RREEF PROPERTY TRUST, INC.
CONSOLIDATED BALANCE SHEETS
(in thousands, except share and per share data) |
| | | | | | | |
| | September 30, 2019 (unaudited) | | December 31, 2018 |
| ASSETS |
| |
|
| Investment in real estate assets: |
| |
|
| Land | $ | 74,167 |
| | $ | 64,426 |
|
| Buildings and improvements, less accumulated depreciation of $19,831 and $15,901, respectively | 143,670 |
| | 108,585 |
|
| Furniture, fixtures and equipment, less accumulated depreciation of $350 and $292, respectively | 199 |
| | 229 |
|
| Acquired intangible lease assets, less accumulated amortization of $23,006 and $19,682, respectively | 33,429 |
| | 29,017 |
|
| Total investment in real estate assets, net | 251,465 |
| | 202,257 |
|
| Investment in marketable securities | 19,247 |
| | 14,735 |
|
| Total investment in real estate assets and marketable securities, net | 270,712 |
| | 216,992 |
|
| Cash and cash equivalents | 2,141 |
| | 2,002 |
|
| Restricted cash | 167 |
| | — |
|
| Receivables, net of allowance for doubtful accounts of $40 and $6, respectively | 4,358 |
| | 3,324 |
|
| Deferred leasing costs, net of amortization of $636 and $373, respectively | 2,166 |
| | 2,340 |
|
| Prepaid and other assets | 2,180 |
| | 1,541 |
|
| Total assets | $ | 281,724 |
| | $ | 226,199 |
|
| LIABILITIES AND STOCKHOLDERS' EQUITY |
| |
|
| Line of credit, net | $ | 51,924 |
| | $ | 84,046 |
|
| Mortgage loans payable, net | 80,745 |
| | 34,055 |
|
| Accounts payable and accrued expenses | 2,877 |
| | 2,041 |
|
| Due to affiliates | 6,495 |
| | 4,292 |
|
| Note to affiliate, net of unamortized discount of $1,254 and $1,365, respectively | 7,696 |
|
| 7,585 |
|
| Acquired below market lease intangibles, less accumulated amortization of $4,127 and $3,461, respectively | 14,438 |
| | 14,970 |
|
| Distributions payable | 412 |
| | 334 |
|
| Other liabilities | 1,699 |
| | 1,369 |
|
| Total liabilities | 166,286 |
| | 148,692 |
|
| Stockholders' Equity: |
| |
|
| Preferred stock, $0.01 par value; 50,000,000 shares authorized; none issued | — |
| | — |
|
| Class A common stock, $0.01 par value; 200,000,000 shares authorized; 3,778,100 and 3,574,584 issued and outstanding, respectively | 38 |
| | 36 |
|
| Class I common stock, $0.01 par value; 200,000,000 shares authorized; 8,779,937 and 6,132,292 issued and outstanding, respectively | 88 |
| | 61 |
|
| Class T common stock, $0.01 par value; 250,000,000 shares authorized; 824,656 and 628,863 issued and outstanding, respectively | 8 |
| | 6 |
|
| Class D common stock, $0.01 par value; 50,000,000 shares authorized; 176,101 and none issued and outstanding, respectively | 2 |
| | — |
|
| Class N common stock, $0.01 par value; 300,000,000 shares authorized; none issued | — |
| | — |
|
| Additional paid-in capital | 157,354 |
| | 115,025 |
|
| Deficit | (42,052 | ) | | (37,621 | ) |
| Total stockholders' equity | 115,438 |
| | 77,507 |
|
| Total liabilities and stockholders' equity | $ | 281,724 |
| | $ | 226,199 |
|
The accompanying notes are an integral part of these consolidated financial statements.
RREEF PROPERTY TRUST, INC.
CONSOLIDATED STATEMENTS OF OPERATIONS
(Unaudited)
(in thousands, except share and per share data)
|
| | | | | | | | | | | | | | | |
| | Three Months Ended September 30, | | Nine Months Ended September 30, |
| | 2019 | | 2018 | | 2019 | | 2018 |
| Revenues |
| | | | | | |
| Property related income | $ | 5,787 |
| | $ | 4,991 |
| | $ | 17,113 |
| | $ | 13,877 |
|
| Investment income on marketable securities | 158 |
| | 137 |
| | 459 |
| | 346 |
|
| Total revenues | 5,945 |
| | 5,128 |
| | 17,572 |
| | 14,223 |
|
| Expenses |
| | | | | |
|
| General and administrative expenses | 470 |
| | 435 |
| | 1,510 |
| | 1,442 |
|
| Property operating expenses | 1,830 |
| | 1,598 |
| | 5,435 |
| | 4,347 |
|
| Advisory fees | 1,014 |
| | 542 |
| | 1,946 |
| | 1,211 |
|
| Depreciation | 1,342 |
| | 1,163 |
| | 3,988 |
| | 3,326 |
|
| Amortization | 1,128 |
| | 1,125 |
| | 3,428 |
| | 2,938 |
|
| Total operating expenses | 5,784 |
| | 4,863 |
| | 16,307 |
| | 13,264 |
|
| Net realized gain (loss) upon sale of marketable securities | 274 |
| | 202 |
| | 539 |
| | (206 | ) |
| Net unrealized change in fair value of investment in marketable securities | 1,254 |
| | (201 | ) | | 3,609 |
| | 279 |
|
| Operating income | 1,689 |
| | 266 |
| | 5,413 |
| | 1,032 |
|
| Interest expense | (1,138 | ) | | (1,014 | ) | | (3,627 | ) | | (2,802 | ) |
| Net income (loss) | $ | 551 |
| | $ | (748 | ) | | $ | 1,786 |
| | $ | (1,770 | ) |
|
| | | |
| | |
| Basic and diluted net income (loss) per share of Class A common stock | $ | 0.04 |
| | $ | (0.08 | ) | | $ | 0.16 |
| | $ | (0.20 | ) |
| Basic and diluted net income (loss) per share of Class I common stock | $ | 0.04 |
| | $ | (0.08 | ) | | $ | 0.15 |
| | $ | (0.20 | ) |
| Basic and diluted net income (loss) per share of Class T common stock | $ | 0.05 |
| | $ | (0.07 | ) | | $ | 0.16 |
| | $ | (0.19 | ) |
| Basic and diluted net income (loss) per share of Class D common stock | $ | 0.06 |
| | $ | — |
| | $ | 0.14 |
| | $ | — |
|
The accompanying notes are an integral part of these consolidated financial statements.
RREEF PROPERTY TRUST, INC.
CONSOLIDATED STATEMENTS OF STOCKHOLDERS' EQUITY
(Unaudited)
(in thousands, except share and per share data)
|
| | | | | | | | | | | | | | | | | | | | | | | | | | | | | | | | | | | | | | | | | | | | | | | |
| | Preferred Stock | | Class A Common Stock | | Class I Common Stock | | Class T Common Stock | | Class D Common Stock | | Class N Common Stock | | Additional Paid-in Capital | | Deficit | | Total
Stockholders'
Equity |
| | Number of
Shares | Par
Value | | Number of
Shares | Par
Value | | Number of
Shares | Par
Value | | Number of
Shares | Par
Value | | Number of
Shares | Par
Value | | Number of
Shares | Par
Value | | | |
| Balance, December 31, 2018 | — |
| $ | — |
| | 3,574,584 |
| $ | 36 |
| | 6,132,292 |
| $ | 61 |
| | 628,863 |
| $ | 6 |
| | — |
| $ | — |
| | — |
| $ | — |
| | $ | 115,025 |
| | $ | (37,621 | ) | | $ | 77,507 |
|
| Issuance of common stock | — |
| — |
| | 131,830 |
| 1 |
| | 641,503 |
| 7 |
| | 55,679 |
| 1 |
| | — |
| — |
| | — |
| — |
| | 11,913 |
| | — |
| | 11,922 |
|
| Issuance of common stock through the distribution reinvestment plan | — |
| — |
| | 22,405 |
| — |
| | 34,329 |
| — |
| | 2,250 |
| — |
| | — |
| — |
| | — |
| — |
| | 841 |
| | — |
| | 841 |
|
| Redemption of common stock | — |
| — |
| | (68,408 | ) | (1 | ) | | (43,806 | ) | — |
| | (9,363 | ) | — |
| | — |
| — |
| | — |
| — |
| | (1,723 | ) | | — |
| | (1,724 | ) |
| Distributions to investors | — |
| — |
| | — |
| — |
| | — |
| — |
| | — |
| — |
| | — |
| — |
| | — |
| — |
| | — |
| | (1,841 | ) | | (1,841 | ) |
| Offering costs | — |
| — |
| | — |
| — |
| | — |
| — |
| | — |
| — |
| | — |
| — |
| | — |
| — |
| | (916 | ) | | — |
| | (916 | ) |
| Equity based compensation | — |
| — |
| | — |
| — |
| | 5,042 |
| — |
| | — |
| — |
| | — |
| — |
| | — |
| — |
| | 72 |
| | — |
| | 72 |
|
| Net income | — |
| — |
| | — |
| — |
| | — |
| — |
| | — |
| — |
| | — |
| — |
| | — |
| — |
| | — |
| | 1,604 |
| | 1,604 |
|
| Balance, March 31, 2019 | — |
| $ | — |
| | 3,660,411 |
| $ | 36 |
| | 6,769,360 |
| $ | 68 |
| | 677,429 |
| $ | 7 |
| | — |
| $ | — |
| | — |
| $ | — |
| | $ | 125,212 |
| | $ | (37,858 | ) | | $ | 87,465 |
|
| Issuance of common stock | — |
| — |
| | 114,470 |
| 1 |
| | 592,305 |
| 6 |
| | 100,827 |
| 1 |
| | 176,101 |
| 2 |
| | — |
| — |
| | 14,185 |
| | — |
| | 14,195 |
|
| Issuance of common stock through the distribution reinvestment plan | — |
| — |
| | 23,894 |
| — |
| | 39,949 |
| 1 |
| | 2,736 |
| — |
| | — |
| — |
| | — |
| — |
| | 953 |
| | — |
| | 954 |
|
| Redemption of common stock | — |
| — |
| | (67,671 | ) | — |
| | (17,720 | ) | (1 | ) | | (3,334 | ) | — |
| | — |
| — |
| | — |
| — |
| | (1,262 | ) | | — |
| | (1,263 | ) |
| Distributions to investors | — |
| — |
| | — |
| — |
| | — |
| — |
| | — |
| — |
| | — |
| — |
| | — |
| — |
| | — |
| | (2,059 | ) | | (2,059 | ) |
| Offering costs | — |
| — |
| | — |
| — |
| | — |
| — |
| | — |
| — |
| | — |
| — |
| | — |
| — |
| | (1,070 | ) | | — |
| | (1,070 | ) |
| Equity based compensation | — |
| — |
| | — |
| — |
| | 1,514 |
| — |
| | — |
| — |
| | — |
| — |
| | — |
| — |
| | 22 |
| | — |
| | 22 |
|
| Net loss | — |
| — |
| | — |
| — |
| | — |
| — |
| | — |
| — |
| | — |
| — |
| | — |
| — |
| | — |
| | (369 | ) | | (369 | ) |
| Balance, June 30, 2019 | — |
| $ | — |
| | 3,731,104 |
| $ | 37 |
| | 7,385,408 |
| $ | 74 |
| | 777,658 |
| $ | 8 |
| | 176,101 |
| $ | 2 |
| | — |
| $ | — |
| | $ | 138,040 |
| | $ | (40,286 | ) | | $ | 97,875 |
|
| Issuance of common stock | — |
| — |
| | 64,556 |
| 1 |
| | 1,386,478 |
| 14 |
| | 54,575 |
| — |
| | — |
| — |
| | — |
| — |
| | 21,773 |
| | — |
| | 21,788 |
|
| Issuance of common stock through the distribution reinvestment plan | — |
| — |
| | 24,576 |
| — |
| | 47,367 |
| — |
| | 2,891 |
| — |
| | — |
| — |
| | — |
| — |
| | 1,079 |
| | — |
| | 1,079 |
|
| Redemption of common stock | — |
| — |
| | (42,136 | ) | — |
| | (41,101 | ) | — |
| | (10,468 | ) | — |
| | — |
| — |
| | — |
| — |
| | (1,349 | ) | | — |
| | (1,349 | ) |
| Distributions to investors | — |
| — |
| | — |
| — |
| | — |
| — |
| | — |
| — |
| | — |
| — |
| | — |
| — |
| | — |
| | (2,317 | ) | | (2,317 | ) |
| Offering costs | — |
| — |
| | — |
| — |
| | — |
| — |
| | — |
| — |
| | — |
| — |
| | — |
| — |
| | (2,214 | ) | | — |
| | (2,214 | ) |
| Equity based compensation | — |
| — |
| | — |
| — |
| | 1,785 |
| — |
| | — |
| — |
| | — |
| — |
| | — |
| — |
| | 25 |
| | — |
| | 25 |
|
| Net income | — |
| — |
| | — |
| — |
| | — |
| — |
| | — |
| — |
| | — |
| — |
| | — |
| — |
| | — |
| | 551 |
| | 551 |
|
| Balance, September 30, 2019 | — |
| $ | — |
| | 3,778,100 |
| $ | 38 |
| | 8,779,937 |
| $ | 88 |
| | 824,656 |
| $ | 8 |
| | 176,101 |
| $ | 2 |
| | — |
| $ | — |
| | $ | 157,354 |
| | $ | (42,052 | ) | | $ | 115,438 |
|
RREEF PROPERTY TRUST, INC.
CONSOLIDATED STATEMENTS OF STOCKHOLDERS' EQUITY
(Unaudited)
(in thousands, except share and per share data)
|
| | | | | | | | | | | | | | | | | | | | | | | | | | | | | | | | | | | | | | | | | | | | | | | | | | | |
| | Preferred Stock | | Class A Common Stock | | Class I Common Stock | | Class T Common Stock | | Class D Common Stock | | Class N Common Stock | | Additional Paid-in Capital | | Deficit | | Accumulated Other Comprehensive Income | | Total
Stockholders'
Equity |
| | Number of
Shares | Par
Value | | Number of
Shares | Par
Value | | Number of
Shares | Par
Value | | Number of
Shares | Par
Value | | Number of
Shares | Par
Value | | Number of
Shares | Par
Value | | | | |
| Balance, December 31, 2017 | — |
| $ | — |
| | 3,666,927 |
| $ | 37 |
| | 4,352,050 |
| $ | 44 |
| | 71,316 |
| $ | 1 |
| | — |
| $ | — |
| | — |
| $ | — |
| | $ | 86,813 |
| | $ | (28,290 | ) | | $ | 736 |
| | $ | 59,341 |
|
| Cumulative effect adjustment for change in accounting principle | — |
| — |
| | — |
| — |
| | — |
| — |
| | — |
| — |
| | — |
| — |
| | — |
| — |
| | — |
| | 736 |
| | (736 | ) | | — |
|
| Balance January 1, 2018, as adjusted | | | | 3,666,927 |
| 37 |
| | 4,352,050 |
| 44 |
| | 71,316 |
| 1 |
| | — |
| — |
| | — |
| — |
| | 86,813 |
| | (27,554 | ) | | — |
| | 59,341 |
|
| Issuance of common stock | — |
| — |
| | 55,887 |
| 1 |
| | 273,546 |
| 2 |
| | 19,256 |
| — |
| | — |
| — |
| | — |
| — |
| | 4,840 |
| | — |
| | — |
| | 4,843 |
|
| Issuance of common stock through the distribution reinvestment plan | — |
| — |
| | 22,714 |
| — |
| | 21,479 |
| — |
| | 678 |
| — |
| | — |
| — |
| | — |
| — |
| | 619 |
| | — |
| | — |
| | 619 |
|
| Redemption of common stock | — |
| — |
| | (64,468 | ) | (1 | ) | | (53,455 | ) | — |
| | — |
| — |
| | — |
| — |
| | — |
| — |
| | (1,622 | ) | | — |
| | — |
| | (1,623 | ) |
| Distributions to investors | — |
| — |
| | — |
| — |
| | — |
| — |
| | — |
| — |
| | — |
| — |
| | — |
| — |
| | — |
| | (1,400 | ) | | — |
| | (1,400 | ) |
| Offering costs | — |
| — |
| | — |
| — |
| | — |
| — |
| | — |
| — |
| | — |
| — |
| | — |
| — |
| | (622 | ) | | — |
| | — |
| | (622 | ) |
| Net loss | — |
| — |
| | — |
| — |
| | — |
| — |
| | — |
| — |
| | — |
| — |
| | — |
| — |
| | — |
| | (1,264 | ) | | — |
| | (1,264 | ) |
| Balance, March 31, 2018 | — |
| $ | — |
| | 3,681,060 |
| $ | 37 |
| | 4,593,620 |
| $ | 46 |
| | 91,250 |
| $ | 1 |
| | — |
| $ | — |
| | — |
| $ | — |
| | $ | 90,028 |
| | $ | (30,218 | ) | | $ | — |
| | $ | 59,894 |
|
| Issuance of common stock | — |
| — |
| | 102,652 |
| 1 |
| | 405,944 |
| 5 |
| | 140,238 |
| 1 |
| | — |
| — |
| | — |
| — |
| | 9,175 |
| | — |
| | — |
| | 9,182 |
|
| Issuance of common stock through the distribution reinvestment plan | — |
| — |
| | 22,901 |
| — |
| | 23,520 |
| — |
| | 976 |
| — |
| | — |
| — |
| | — |
| — |
| | 662 |
| | — |
| | — |
| | 662 |
|
| Redemption of common stock | — |
| — |
| | (74,710 | ) | (1 | ) | | (64,144 | ) | (1 | ) | | — |
| — |
| | — |
| — |
| | — |
| — |
| | (1,926 | ) | | — |
| | — |
| | (1,928 | ) |
| Distributions to investors | — |
| — |
| | — |
| — |
| | — |
| — |
| | — |
| — |
| | — |
| — |
| | — |
| — |
| | — |
| | (1,493 | ) | | — |
| | (1,493 | ) |
| Offering costs | — |
| — |
| | — |
| — |
| | — |
| — |
| | — |
| — |
| | — |
| — |
| | — |
| — |
| | (1,227 | ) | | — |
| | — |
| | (1,227 | ) |
| Net income | — |
| — |
| | — |
| — |
| | — |
| — |
| | — |
| — |
| | — |
| — |
| | — |
| — |
| | — |
| | 242 |
| | — |
| | 242 |
|
| Balance, June 30, 2018 | — |
| $ | — |
| | 3,731,903 |
| $ | 37 |
| | 4,958,940 |
| $ | 50 |
| | 232,464 |
| $ | 2 |
| | — |
| $ | — |
| | — |
| $ | — |
| | $ | 96,712 |
| | $ | (31,469 | ) | | $ | — |
| | $ | 65,332 |
|
| Issuance of common stock | — |
| — |
| | 151,589 |
| 2 |
| | 679,042 |
| 6 |
| | 306,424 |
| 3 |
| | — |
| — |
| | — |
| — |
| | 16,236 |
| | — |
| | — |
| | 16,247 |
|
| Issuance of common stock through the distribution reinvestment plan | — |
| — |
| | 23,500 |
| — |
| | 27,180 |
| — |
| | 1,548 |
| — |
| | — |
| — |
| | — |
| — |
| | 732 |
| | — |
| | — |
| | 732 |
|
| Redemption of common stock | — |
| — |
| | (95,496 | ) | (1 | ) | | (44,865 | ) | — |
| | — |
| — |
| | — |
| — |
| | — |
| — |
| | (1,965 | ) | | — |
| | — |
| | (1,966 | ) |
| Distributions to investors | — |
| — |
| | — |
| — |
| | — |
| — |
| | — |
| — |
| | — |
| — |
| | — |
| — |
| | — |
| | (1,662 | ) | | — |
| | (1,662 | ) |
| Offering costs | — |
| — |
| | — |
| — |
| | — |
| — |
| | — |
| — |
| | — |
| — |
| | — |
| — |
| | (1,070 | ) | | — |
| | — |
| | (1,070 | ) |
| Net loss | — |
| — |
| | — |
| — |
| | — |
| — |
| | — |
| — |
| | — |
| — |
| | — |
| — |
| | — |
| | (748 | ) | | — |
| | (748 | ) |
| Balance, September 30, 2018 | — |
| $ | — |
| | 3,811,496 |
| $ | 38 |
| | 5,620,297 |
| $ | 56 |
| | 540,436 |
| $ | 5 |
| | — |
| $ | — |
| | — |
| $ | — |
| | $ | 110,645 |
| | $ | (33,879 | ) | | $ | — |
| | $ | 76,865 |
|
The accompanying notes are an integral part of these consolidated financial statements.
RREEF PROPERTY TRUST, INC.
CONSOLIDATED STATEMENTS OF CASH FLOWS
(Unaudited)
(in thousands)
|
| | | | | | | |
| | Nine Months Ended September 30, |
| | 2019 | | 2018 |
| Cash flows from operating activities: | | | |
| Net income (loss) | $ | 1,786 |
| | $ | (1,770 | ) |
| Adjustments to reconcile net income (loss) to net cash provided by operating activities: |
| |
|
| Depreciation | 3,988 |
| | 3,326 |
|
| Net realized (gain) loss upon sale of marketable securities | (539 | ) | | 206 |
|
| Net unrealized change in fair value of marketable securities | (3,609 | ) | | (279 | ) |
| Share based compensation | 119 |
| | — |
|
| Amortization of intangible lease assets and liabilities | 2,922 |
| | 2,783 |
|
| Amortization of deferred financing costs | 248 |
| | 217 |
|
| Allowance for doubtful accounts | 33 |
| | 11 |
|
| Straight line rent | (628 | ) | | 53 |
|
| Amortization of discount on note to affiliate | 111 |
| | 109 |
|
| Changes in assets and liabilities: |
| |
|
| Receivables | (171 | ) | | (56 | ) |
| Deferred leasing costs | (180 | ) | | (346 | ) |
| Prepaid and other assets | (67 | ) | | (5 | ) |
| Accounts payable and accrued expenses | 638 |
| | 556 |
|
| Other liabilities | 1 |
| | (162 | ) |
| Due to affiliates | 145 |
| | (332 | ) |
| Net cash provided by operating activities | 4,797 |
| | 4,311 |
|
| Cash flows from investing activities: |
| |
|
| Investment in real estate and related assets | (54,947 | ) | | (20,619 | ) |
| Improvements to real estate assets | (1,263 | ) | | (103 | ) |
| Investment in marketable securities | (16,994 | ) | | (22,178 | ) |
| Proceeds from sale of marketable securities | 16,555 |
| | 16,556 |
|
| Net cash used in investing activities | (56,649 | ) | | (26,344 | ) |
| Cash flows from financing activities: |
| |
|
| Proceeds from line of credit | 20,500 |
| | 19,900 |
|
| Repayment of line of credit | (52,819 | ) | | (15,500 | ) |
| Proceeds from mortgage loans payable | 47,300 |
| | — |
|
| Repayment of mortgage loans payable | (189 | ) | | — |
|
| Proceeds from issuance of common stock | 47,777 |
| | 30,376 |
|
| Payment of financing costs | (471 | ) | | (682 | ) |
| Payment of offering costs | (2,490 | ) | | (2,976 | ) |
| Distributions to investors | (3,265 | ) | | (2,488 | ) |
| Redemption of common stock | (4,185 | ) | | (5,517 | ) |
| Net cash provided by financing activities | 52,158 |
| | 23,113 |
|
| Net increase in cash and cash equivalents and restricted cash | 306 |
| | 1,080 |
|
| Cash and cash equivalents and restricted cash, beginning of period | 2,002 |
| | 2,442 |
|
| Cash and cash equivalents and restricted cash, end of period | $ | 2,308 |
| | $ | 3,522 |
|
The accompanying notes are an integral part of these consolidated financial statements.
RREEF PROPERTY TRUST, INC.
CONSOLIDATED STATEMENTS OF CASH FLOWS
(continued)
(Unaudited)
|
| | | | | | | |
| | Nine Months Ended September 30, |
| Supplemental Disclosures of Non-Cash Investing and Financing Activities: | 2019 | | 2018 |
| Distributions declared and unpaid | $ | 412 |
|
| $ | 311 |
|
| Common stock issued through the distribution reinvestment plan | 2,874 |
|
| 2,013 |
|
| Purchases of marketable securities not yet paid | 172 |
|
| 26 |
|
| Proceeds from sale of marketable securities not yet received | 231 |
|
| 42 |
|
| Proceeds from issuance of common stock not yet received | 227 |
|
| 119 |
|
| Accrued offering costs not yet paid | 2,978 |
| | 1,537 |
|
| Capital expenditures not yet paid | 313 |
| | 145 |
|
| Redemptions of common stock not yet paid | 151 |
| | — |
|
| | | | |
| Supplemental Cash Flow Disclosures: |
| |
|
| Interest paid | $ | 3,195 |
|
| $ | 2,413 |
|
| | | | |
| In connection with the purchase of investments in real estate and related assets, the Company also assumed certain non-real estate assets and liabilities: |
| |
|
| Purchase price | $ | 55,061 |
| | $ | 20,842 |
|
| Prepaid and other assets assumed | 183 |
| | — |
|
| Other liabilities assumed | (297 | ) | | (223 | ) |
| Investment in real estate and related assets | $ | 54,947 |
| | $ | 20,619 |
|
The accompanying notes are an integral part of these consolidated financial statements.
RREEF PROPERTY TRUST, INC.
NOTES TO CONSOLIDATED FINANCIAL STATEMENTS
September 30, 2019
(Unaudited)
(in thousands except share and per share data)
NOTE 1 — ORGANIZATION
RREEF Property Trust, Inc. (the “Company”) was formed on February 7, 2012 as a Maryland corporation and has elected to qualify as a real estate investment trust (“REIT”) for federal income tax purposes. Substantially all of the Company's business is conducted through RREEF Property Operating Partnership, LP, the Company's operating partnership (the “Operating Partnership”). The Company is the sole general partner of the Operating Partnership. RREEF Property OP Holder, LLC (the “OP Holder”), a wholly-owned subsidiary of the Company, is the limited partner of the Operating Partnership. As the Company completes the settlement for purchase orders for shares of its common stock in its continuous public offering, it will continue to transfer substantially all of the proceeds to the Operating Partnership.
The Company was organized to invest primarily in a diversified portfolio consisting primarily of high quality, income-producing commercial real estate located in the United States, including, without limitation, office, industrial, retail and apartment properties (“Real Estate Properties”). Although the Company intends to invest primarily in Real Estate Properties, it also intends to acquire common and preferred stock of REITs and other real estate companies (“Real Estate Equity Securities”) and debt investments backed principally by real estate (“Real Estate Loans” and, together with Real Estate Equity Securities, “Real Estate-Related Assets”).
On January 3, 2013, the Securities and Exchange Commission ("SEC") declared effective the Company's registration statement on Form S-11 (File No. 333-180356), filed under the Securities Act of 1933, as amended (the "Initial Registration Statement"). On May 30, 2013, RREEF America L.L.C., a Delaware limited liability company (“RREEF America”), the Company's sponsor and advisor, purchased $10,000 of the Company's Class I common stock, $0.01 par value per share ("Class I Shares"), and the Company’s board of directors authorized the release of the escrowed funds to the Company, thereby allowing the Company to commence operations.
On January 15, 2016, the Company filed articles supplementary to its articles of incorporation to add a newly-designated Class D common stock, $0.01 par value per share ("Class D Shares"). On January 20, 2016, the Company commenced a private offering of up to a maximum of $350,000 in Class D Shares (the "Private Offering," and together with the Follow-On Public Offering (defined below), the "Offerings").
On July 12, 2016, the SEC declared effective the Company's registration statement on Form S-11 (File No. 333-208751), filed under the Securities Act of 1933, as amended (the "Registration Statement"). Pursuant to the Registration Statement, the Company is offering for sale up to $2,100,000 of shares of its Class A common stock, $0.01 par value per share ("Class A Shares"), Class I Shares, and Class T common stock, $0.01 par value per share ("Class T Shares"), in its primary offering and up to $200,000 of Class A Shares, Class I Shares, Class N common stock, $0.01 par value per share ("Class N Shares") and Class T Shares pursuant to its distribution reinvestment plan, to be sold on a "best efforts" basis for the Company's follow-on public offering (the "Follow-On Public Offering"). The Company's initial public offering terminated upon the commencement of the Follow-On Public Offering.
On June 28, 2019, the Company filed a registration statement on Form S-11 (File No. 333-232425) for the Company's second follow-on offering. This registration statement is not yet effective.
Shares of the Company’s common stock are sold at the Company’s net asset value (“NAV”) per share, plus, for Class A, T and D Shares only, applicable selling commissions. Each class of shares may have a different NAV per share because of certain class-specific fees. NAV per share is calculated by dividing the NAV at the end of each business day for each class by the number of shares outstanding for that class on such day.
RREEF PROPERTY TRUST, INC.
NOTES TO CONSOLIDATED FINANCIAL STATEMENTS - continued
September 30, 2019
(Unaudited)
(in thousands, except share and per share data)
The Company's NAV per share for its Class A, Class I and Class T Shares is posted to the Company's website at www.rreefpropertytrust.com after the stock market close each business day. Additionally, the Company's NAV per share for its Class A, Class I and Class T Shares is published daily via NASDAQ's Mutual Fund Quotation System under the symbols ZRPTAX, ZRPTIX and ZRPTTX for its Class A Shares, Class I Shares and Class T Shares, respectively.
NOTE 2 — SUMMARY OF SIGNIFICANT ACCOUNTING POLICIES
Basis of Presentation and Principles of Consolidation
The accompanying consolidated financial statements have been prepared in accordance with the Financial Accounting Standards Board (“FASB”) Accounting Standards Codification (“ASC”), the authoritative reference for U.S. generally accepted accounting principles (“GAAP”). There have been no significant changes to the Company's significant accounting policies during the nine months ended September 30, 2019 except for the adoption of Accounting Standards Updates (“ASU”) noted below in Note 2. The interim financial data as of September 30, 2019 and for the three and nine months ended September 30, 2019 and 2018 is unaudited. In the Company’s opinion, the interim data includes all adjustments, consisting only of normal recurring adjustments, necessary for a fair presentation of the results for the interim periods.
Use of Estimates
The preparation of the consolidated financial statements in conformity with GAAP requires management to make estimates and assumptions that affect the amounts reported in the consolidated financial statements and accompanying notes. Actual results could differ from those estimates.
Real Estate Investments and Lease Intangibles
Entities are required to evaluate whether transactions should be accounted for as acquisitions (and dispositions) of assets or businesses. When substantially all of the fair value of the gross assets acquired (or disposed of) is concentrated in a single identifiable asset or a group of similar identifiable assets, the set is not a business. Generally, a real estate asset and its related leases will be considered a single identifiable asset and therefore will not meet the definition of a business. If the real estate and related leases in an acquisition are determined to be an asset and not a business, then the acquisition related costs would be capitalized onto the consolidated balance sheets. Otherwise, such costs will be expensed upon completion of the transaction.
Organization and Offering Costs
Organizational expenses and other expenses which do not qualify as offering costs are expensed as incurred. Offering costs are those costs incurred by the Company, RREEF America and its affiliates on behalf of the Company which relate directly to the Company’s activities of raising capital in the Offerings, preparing for the Offerings, the qualification and registration of the Offerings and the marketing and distribution of the Company’s shares. This includes, but is not limited to, accounting and legal fees, including the legal fees of the dealer manager for the public offerings, costs for registration statement amendments and prospectus supplements, printing, mailing and distribution costs, filing fees, amounts to reimburse RREEF America as the Company’s advisor or its affiliates for the salaries of employees and other costs in connection with preparing supplemental sales literature, amounts to reimburse the dealer manager for amounts that it may pay to reimburse the bona fide due diligence expenses of any participating broker-dealers supported by detailed and itemized invoices, telecommunication costs, fees of the transfer agent, registrars, trustees, depositories and experts, the cost of educational conferences held by the Company (including the travel, meal and lodging costs of registered representatives of any participating broker-dealers) and attendance fees and cost reimbursement for employees of affiliates to attend retail seminars conducted by broker-dealers. Offering costs will be paid from the proceeds of the Offerings. These costs will be treated as a reduction of the total proceeds. Total organization and offering costs incurred by the Company with respect to a particular Offering will not exceed 15% of the gross proceeds from such particular Offering. In addition, the Company will
RREEF PROPERTY TRUST, INC.
NOTES TO CONSOLIDATED FINANCIAL STATEMENTS - continued
September 30, 2019
(Unaudited)
(in thousands, except share and per share data)
not reimburse RREEF America or the dealer manager for any underwriting compensation (a subset of organization and offering costs) which would cause the Company’s total underwriting compensation to exceed 10% of the gross proceeds from the primary portion of a particular offering.
Included in offering costs are (1) distribution fees paid on a trailing basis at the rate of (a) 0.50% per annum on the NAV of the outstanding Class A Shares, and (b) 1.00% per annum for approximately three years on the NAV of the outstanding Class T Shares, and (2) dealer manager fees paid on a trailing basis at the rate of 0.55% per annum on the NAV of the outstanding Class A and Class I Shares (collectively, the "Trailing Fees"). The Trailing Fees are computed daily based on the respective NAV of each share class as of the beginning of each day and paid monthly. However, at each reporting date, the Company accrues an estimate for the amount of Trailing Fees that ultimately may be paid on the outstanding shares. Such estimate reflects the Company's assumptions for certain variables, including future redemptions, share price appreciation and the total gross proceeds raised or to be raised during each Offering. In addition, the estimated accrual for future Trailing Fees as of a given reporting date may be reduced by the aforementioned limits on total organization and offering costs and total underwriting compensation. Changes in this estimate will be recorded prospectively as an adjustment to additional paid-in capital. As of September 30, 2019 and December 31, 2018, the Company has accrued $5,326 and $3,107, respectively, in Trailing Fees to be payable in the future, which was included in due to affiliates on the consolidated balance sheets.
Revenue Recognition
Effective January 1, 2019, the Company adopted ASU 2016-02, Leases (Topic 842) (ASC 842), and related ASU's that amended or clarified certain provisions of ASC 842. Under ASC 842, as amended, the Company elected (a) a package of three practical expedients whereby the Company will not be required to reassess (i) whether any expired or existing contracts are or contain leases, (ii) the lease classification (operating versus capital/financing leases) for any expired or existing leases and (iii) initial direct costs for any existing leases (Package of Three Practical Expedients), and (b) a practical expedient to not separate lease and non-lease components of a lease and instead account for them as a single component if two criteria are met: (i) the timing and pattern of transfer of the non-lease component(s) and associated lease component are the same, and (ii) the lease component, if accounted for separately, would be classified as an operating lease. In addition, the Company elected to adopt ASU 2016-02 on its effective date, and the Company did not have a cumulative effect adjustment to its opening deficit balance as of January 1, 2019. In accordance with the Company's adoption of the provisions of ASC 842, the accounting for leases in place as of December 31, 2018 that remain unmodified after the adoption of ASC 842 will remain unchanged while any new or modified leases entered into by the Company after December 31, 2018 will be accounted for under the provisions of ASC 842.
The Company has evaluated the lease and non-lease components within its leases under the practical expedient and will now report rental and other property income and common area expense reimbursement income as a single component on the Company’s consolidated statements of operations. Rental and other property income and tenant reimbursement income for prior periods have similarly been combined to conform to the current year presentation.
Lessor accounting for lease and non-lease components, while presented differently under ASC 842, is largely unchanged from prior GAAP. Contractual base rental revenue from real estate leases is recognized on a straight-line basis over the terms of the related leases. The differences between contractual base rental revenue earned from real estate leases on a straight-line basis and amounts due under the respective lease agreements are amortized or accreted, as applicable, to deferred rent receivable. Property related income will also include amortization of above- and below-market leases as well as amortization of lease incentives. Revenues relating to lease termination fees for the termination of an entire lease will be recognized at the time that a tenant’s right to occupy the leased space is terminated and collectibility is reasonably assured.
Under ASC 842, the future revenue stream from leases must be evaluated for collectibility. Pursuant to these provisions, if an entity has determined that the collectibility of substantially all future lease payments from a particular lease is not at least probable, then the entity must write off its existing receivable balances (except
RREEF PROPERTY TRUST, INC.
NOTES TO CONSOLIDATED FINANCIAL STATEMENTS - continued
September 30, 2019
(Unaudited)
(in thousands, except share and per share data)
receivable amounts which are under dispute by the tenant), including any deferred rent amounts recognized on a straight-line basis, and instead begin recognizing revenue from such lease on cash basis. The factors used to evaluate the collectibility of future lease payments for each lease may include, but not be limited to, the tenant's payment history, current payment status, publicly available information about the financial condition of the tenant and other information about the tenant of which the entity may be aware. As of September 30, 2019, the Company has assessed all of its future lease payments to be at least probable.
To the extent the Company's revenues do not qualify for treatment under ASC 842 or under other specific guidance, the Company is required to recognize revenue in its financial statements in a manner that depicts the transfer of the promised goods or services to its customers in an amount that reflects the consideration to which the Company is entitled at the time of transfer of those goods or services. Such treatment may apply to other types of real estate related contracts, such as for dispositions or development of real estate.
Investment income from marketable securities is accrued at each distribution record date.
Net Earnings or Loss Per Share
Net earnings or loss per share is calculated using the two-class method. The two-class method is utilized when an entity (1) has different classes of common stock that participate differently in net earnings or loss, or (2) has issued participating securities, which are securities that participate in distributions separately from the entity’s common stock. Pursuant to the advisory agreement between the Company and its advisor (see Note 8), the advisor may earn a performance component of the advisory fee which is calculated separately for each class of common stock which therefore may result in a different allocation of net earnings or loss to each class of common stock. In addition, in March and May 2019, the Company granted shares of its Class I common stock to its independent directors (see Note 9), which qualify as participating securities.
Concentration of Credit Risk
As of September 30, 2019 and December 31, 2018, the Company had cash on deposit at multiple financial institutions which were in excess of federally insured levels. The Company limits significant cash holdings to accounts held by financial institutions with a high credit standing. Therefore, the Company believes it is not exposed to any significant credit risk on its cash deposits.
Cash and Cash Equivalents
For purposes of the presentation of the accompanying consolidated financial statements, all unrestricted short-term investments purchased with an initial maturity of three months or less are considered to be cash equivalents. The Company maintains cash and cash equivalents with various financial institutions. The combined cash balances at each institution periodically exceed Federal Deposit Insurance Corporation (“FDIC”) insurance coverage and, as a result, there is a concentration of credit risk related to amounts on deposit in excess of FDIC insurance coverage. The Company believes the risk is not significant.
Restricted Cash
All cash amounts that are considered restricted in nature are classified as such on the consolidated balance sheets. Restricted cash is comprised of seller-funded escrows.
Recent Accounting Pronouncements
In August 2018, FASB issued ASU 2018-13, Fair Value Measurement (Topic 820) - Disclosure Framework - Changes to Disclosure Requirements for Fair Value Measurement. ASU 2018-13 changes the fair value measurement disclosure requirements of ASC 820 by eliminating, modifying or adding certain disclosure
RREEF PROPERTY TRUST, INC.
NOTES TO CONSOLIDATED FINANCIAL STATEMENTS - continued
September 30, 2019
(Unaudited)
(in thousands, except share and per share data)
requirements for fair value measurements. The Company elected to early adopt the provisions regarding eliminating or modifying certain disclosures and defer adopting the provisions regarding additional disclosures until the effective date of ASU 2018-13, which is for fiscal years beginning after December 15, 2019, including interim periods therein. The early adoption of the provisions regarding eliminating or modifying certain disclosures of ASU 2018-13 did not have a material impact on the Company's consolidated financial statements.
In March 2019, FASB issued ASU 2019-01, Leases (Topic 842), which provides guidance for determining the fair value and its application to lease classification and measurement for lessors that are not manufacturers or dealers, referred to as qualifying lessors. For qualifying lessors, the fair value of the underlying asset at lease commencement would be its cost, including any acquisition costs, however if a significant amount of time has elapsed between the asset acquisition date and the lease commencement, the fair value would be based on the guidance in ASC 820. ASU 2019-01 is effective for fiscal years beginning after December 15, 2019, including interim periods therein. The Company is evaluating the impact of ASU 2019-01 but does not expect adoption to have a material impact.
NOTE 3 — FAIR VALUE MEASUREMENTS
Fair value measurements are determined based on the assumptions that market participants would use in pricing an asset or liability. As a basis for considering market participant assumptions in fair value measurements, FASB ASC 820, Fair Value Measurement and Disclosures, establishes a fair value hierarchy that distinguishes between market participant assumptions based on market data obtained from sources independent of the reporting entity (observable inputs that are classified within Levels 1 and 2 of the hierarchy) and the reporting entity's own assumptions about market participant assumptions (unobservable inputs classified within Level 3 of the hierarchy).
Level 1 inputs utilize quoted prices (unadjusted) in active markets for identical assets or liabilities that the Company has the ability to access. Level 2 inputs are inputs other than quoted prices included in Level 1 that are observable for the asset or liability, either directly or indirectly. Level 2 inputs may include quoted prices for similar assets and liabilities in active markets, as well as inputs that are observable for the asset or liability (other than quoted prices), such as interest rates and yield curves that are observable at commonly quoted intervals. Level 3 inputs are the unobservable inputs for the asset or liability, which are typically based on an entity's own assumption, as there is little, if any, related market activity. In instances where the determination of the fair value measurement is based on input from different levels of the fair value hierarchy, the level in the fair value hierarchy within which the entire fair value measurement falls is based on the lowest level input that is significant to the fair value measurement in its entirety. The Company's assessment of the significance of a particular input to the fair value measurement in its entirety requires judgment and considers factors specific to the asset or liability.
The Company's investments in marketable securities are valued using Level 1 inputs as the securities are publicly traded on major stock exchanges.
The fair value of the Company's lines of credit and mortgage loans payable are determined using Level 2 and Level 3 inputs and a discounted cash flow approach with an interest rate, property valuation and other assumptions that estimate current market conditions. The carrying amount of the Company's line of credit, exclusive of deferred financing costs, approximated its fair value of $52,300 and $84,619 at September 30, 2019 and December 31, 2018, respectively. The Company estimated the fair value of the Company's mortgage loans payable at $80,911 and $33,560 as of September 30, 2019 and December 31, 2018, respectively. If the valuation of the Company's properties as of September 30, 2019 were significantly lower, the market interest rate assumption would be higher (due to higher loan-to-value ratios) potentially resulting in a significantly lower estimated fair value for these liabilities.
The Company has estimated the fair value of its note to affiliate at approximately $4,000 and $2,900 as of September 30, 2019 and December 31, 2018, respectively. The estimated market interest rate is impacted by a number of factors. Material changes in those factors may cause a material change to the estimated market interest
RREEF PROPERTY TRUST, INC.
NOTES TO CONSOLIDATED FINANCIAL STATEMENTS - continued
September 30, 2019
(Unaudited)
(in thousands, except share and per share data)
rate, thereby materially affecting the estimated fair value of the note to affiliate. The Company has estimated the fair value of the note to affiliate in the middle of the range of reasonably estimable values.
The Company's financial instruments, other than those referred to above, are generally short-term in nature and contain minimal credit risk. These instruments consist of cash and cash equivalents, accounts and other receivables and accounts payable. The carrying amounts of these assets and liabilities in the consolidated balance sheets approximate their fair value.
NOTE 4 — REAL ESTATE INVESTMENTS
The Company acquired one real estate property during the three and nine months ended September 30, 2019 and three real estate properties during three and nine months ended September 30, 2018.
On September 16, 2019, the Company acquired Providence Square for a purchase price of $54,842 (excluding closing costs). The acquisition was funded with proceeds from the Offerings, a borrowing of $18,300 under the Company's line of credit and a secured, fully non-recourse loan for $29,700 from Nationwide Life Insurance Company. Providence Square is a home improvement anchored community retail shopping center in Marietta, Georgia with a grocery component totaling 222,805 square feet fully leased to 26 tenants, including one freestanding building of 5,779 square feet subject to a ground lease.
All leases at Providence Square have been classified as operating leases. Under ASU 2017-01, the transaction was determined to be an asset acquisition, resulting in the Company's capitalization of $219 of acquisition-related costs. The Company's allocation of the purchase price (including acquisition related costs) of Providence Square is as follows:
|
| | | |
| | Providence Square |
| Land | $ | 9,741 |
|
| Building and improvements | 37,718 |
|
| Acquired in-place leases | 7,625 |
|
| Acquired above-market leases | 111 |
|
| Acquired below-market leases | (134 | ) |
| Total purchase price | $ | 55,061 |
|
On July 17, 2018, the Company acquired three industrial properties located in Miami, Florida ("Miami Industrial") for a purchase price of $20,700 (excluding closing costs). The acquisition was funded with proceeds from the Offerings and by borrowing $19,900 under the Company's line of credit. Miami Industrial consists of three warehouse distribution buildings totaling 289,919 square feet fully leased to three tenants, with one tenant per building.
All leases at Miami Industrial have been classified as operating leases. Under ASU 2017-01, the transaction was determined to be an asset acquisition, resulting in the Company's capitalization of $142 of acquisition related costs. The Company's allocation of the purchase price (including acquisition related costs) of Miami Industrial is as follows:
RREEF PROPERTY TRUST, INC.
NOTES TO CONSOLIDATED FINANCIAL STATEMENTS - continued
September 30, 2019
(Unaudited)
(in thousands, except share and per share data)
|
| | | |
| | Miami Industrial |
| Land | $ | 9,420 |
|
| Building and improvements | 8,125 |
|
| Acquired in-place leases | 3,752 |
|
| Acquired below-market leases | (455 | ) |
| Total purchase price | $ | 20,842 |
|
The Company recorded revenues and net loss related to Providence Square, acquired during the three and nine months ended September 30, 2019 as follows:
|
| | | |
| | Three and Nine Months Ended September 30, 2019 |
| Revenues | $ | 166 |
|
| Net loss | (34 | ) |
The Company’s estimated revenues and net loss, on a pro forma basis (as if the acquisition of Providence Square was completed on January 1, 2018), for the three and nine months ended September 30, 2019 are as follows:
|
| | | | | | |
| | Three Months Ended September 30, 2019 | Nine Months Ended September 30, 2019 |
| Revenues | $ | 6,843 |
| $ | 20,599 |
|
| Net income | 299 |
| 961 |
|
| Basic and diluted net loss per share of Class A common stock | $ | 0.02 |
| $ | 0.09 |
|
| Basic and diluted net loss per share of Class I common stock | $ | 0.02 |
| $ | 0.08 |
|
| Basic and diluted net loss per share of Class T common stock | $ | 0.03 |
| $ | 0.09 |
|
| Basic and diluted net loss per share of Class D common stock | $ | 0.04 |
| $ | 0.07 |
|
The Company recorded revenues and net loss related to Miami Industrial, acquired during the three and nine months ended September 30, 2018, as follows:
|
| | | |
| | Three and Nine Months Ended September 30, 2018 |
| Revenues | $ | 417 |
|
| Net loss | (117 | ) |
The Company’s estimated revenues and net loss, on a pro forma basis (as if the acquisition of Miami Industrial was completed on January 1, 2017), for the three and nine months ended September 30, 2018, are as follows:
RREEF PROPERTY TRUST, INC.
NOTES TO CONSOLIDATED FINANCIAL STATEMENTS - continued
September 30, 2019
(Unaudited)
(in thousands, except share and per share data)
|
| | | | | | |
| | Three Months Ended September 30, 2018 | Nine Months Ended September 30, 2018 |
| Revenues | $ | 5,208 |
| $ | 15,211 |
|
| Net loss | (777 | ) | (2,132 | ) |
| Basic and diluted net loss per share of Class A common stock | $ | (0.08 | ) | $ | (0.24 | ) |
| Basic and diluted net loss per share of Class I common stock | $ | (0.08 | ) | $ | (0.25 | ) |
| Basic and diluted net loss per share of Class T common stock | $ | (0.07 | ) | $ | (0.23 | ) |
The pro forma information is presented for informational purposes only and may not be indicative of what actual results of operations would have been had the transactions occurred at the beginning of period presented, nor does it purport to represent the results of future operations.
NOTE 5 — RENTALS UNDER OPERATING LEASES
As of September 30, 2019, the Company owned four office properties (including one medical office property), four retail properties and four industrial properties with a total of 59 tenants, and one student housing property with 316 beds. As of September 30, 2018, the Company owned four office properties (including one medical office property), two retail properties and four industrial properties with a total of 21 tenants, and one student housing property with 316 beds. All leases at the Company's properties have been classified as operating leases. The Company's property related income from its real estate investments is comprised of the following:
|
| | | | | | | | | | | | | | | |
| | Three Months Ended September 30, | | Nine Months Ended September 30, |
| | 2019 | | 2018 | | 2019 | | 2018 |
Lease revenue 1 | $ | 5,413 |
| | $ | 4,668 |
| | $ | 15,979 |
| | $ | 13,774 |
|
| Straight-line revenue | 207 |
| | 258 |
| | 628 |
| | (53 | ) |
| Above- and below-market lease amortization, net | 193 |
| | 91 |
| | 583 |
| | 233 |
|
| Lease incentive amortization | (26 | ) | | (26 | ) | | (77 | ) | | (77 | ) |
| Property related income | $ | 5,787 |
| | $ | 4,991 |
| | $ | 17,113 |
| | $ | 13,877 |
|
1Lease revenue includes $818 and $688 of variable income from tenant reimbursements for the three months ended September 30, 2019 and 2018, respectively and $2,611 and $1,907 of variable income from tenant reimbursements for the nine months ended September 30, 2019 and 2018, respectively. |
The future minimum rentals to be received, excluding tenant reimbursements, under the non-cancelable portions of all of the in-place leases in effect as of September 30, 2019 are as follows:
RREEF PROPERTY TRUST, INC.
NOTES TO CONSOLIDATED FINANCIAL STATEMENTS - continued
September 30, 2019
(Unaudited)
(in thousands, except share and per share data)
|
| | | | |
| Nine Months Ended September 30, 2019 | | Future Minimum Rent |
| 2019 | | $ | 5,369 |
|
| 2020 | | 20,272 |
|
| 2021 | | 16,938 |
|
| 2022 | | 15,336 |
|
| 2023 | | 11,446 |
|
| Thereafter | | 48,268 |
|
| | | $ | 117,629 |
|
Percentages of property related income by property and tenant representing more than 10% of the Company's total property related income are shown below.
|
| | | | | | |
| | | Percent of property related income |
| Property | | Three Months Ended September 30, 2019 | | Nine Months Ended September 30, 2019 |
| Flats at Carrs Hill, Athens, GA | | 14.8 | % | | 14.4 | % |
| Allied Drive, Dedham, MA | | 12.9 |
| | 12.8 |
|
| Loudoun Gateway, Sterling, VA | | 12.6 |
| | 13.2 |
|
| Elston Plaza, Chicago, IL | | 12.1 |
| | 13.6 |
|
| Total | | 52.4 | % | | 54.0 | % |
| | | | | |
| | | Percent of property related income |
| Tenant | | Three Months Ended September 30, 2019 | | Nine Months Ended September 30, 2019 |
| Orbital ATK Inc. - Loudoun Gateway | | 12.6 | % | | 13.2 | % |
| New England Baptist Hospital - Allied Drive | | 11.4 |
| | 11.4 |
|
| Total | | 24.0 | % | | 24.6 | % |
RREEF PROPERTY TRUST, INC.
NOTES TO CONSOLIDATED FINANCIAL STATEMENTS - continued
September 30, 2019
(Unaudited)
(in thousands, except share and per share data)
|
| | | | | | |
| | | Percent of property related income |
| Property | | Three Months Ended September 30, 2018 | | Nine Months Ended September 30, 2018 |
| Flats at Carrs Hill, Athens, GA | | 16.2 | % | | 16.7 | % |
| Loudoun Gateway, Sterling, VA | | 14.8 |
| | 16.2 |
|
| Allied Drive, Dedham, MA | | 14.6 |
| | 15.9 |
|
| Anaheim Hills Office Plaza, Anaheim, CA | | 11.7 |
| | 12.5 |
|
| Terra Nova Plaza, Chula Vista, CA | | 11.1 |
| | 11.9 |
|
| Commerce Corner, Logan Township, NJ | | 10.5 |
| | 10.4 |
|
| Total | | 78.9 | % | | 83.6 | % |
| | | | | |
| | | Percent of property related income |
| Tenant | | Three Months Ended September 30, 2018 | | Nine Months Ended September 30, 2018 |
| Orbital ATK Inc. - Loudoun Gateway | | 14.8 | % | | 16.2 | % |
| New England Baptist Hospital - Allied Drive | | 12.6 |
| | 13.5 |
|
| Total | | 27.4 | % | | 29.7 | % |
The Company's tenants representing more than 10% of in-place annualized base rental revenues were as follows:
|
| | | | | | |
| | | Percent of in-place annualized base rental revenues as of |
| Property | | September 30, 2019 | | September 30, 2018 |
| Orbital ATK Inc. - Loudoun Gateway | | 13.6 | % | | 17.5 | % |
| Total | | 13.6 | % | | 17.5 | % |
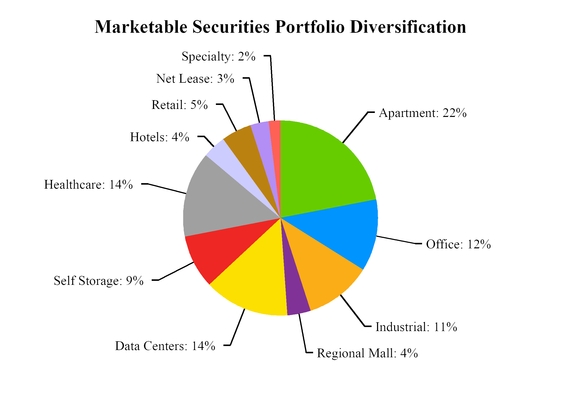
NOTE 6 — MARKETABLE SECURITIES
The following is a summary of the Company's marketable securities held as of the dates indicated, which consisted entirely of publicly-traded shares of common stock in REITs as of each date.
|
| | | | | | | |
| | September 30, 2019 | | December 31, 2018 |
| Marketable securities—cost | $ | 15,549 |
| | $ | 14,646 |
|
| Unrealized gains | 3,716 |
| | 676 |
|
| Unrealized losses | (18 | ) | | (587 | ) |
| Net unrealized gain | 3,698 |
| | 89 |
|
| Marketable securities—fair value | $ | 19,247 |
| | $ | 14,735 |
|
Upon the sale of a particular security, the realized net gain or loss is computed assuming the shares with the highest cost are sold first. During the three months ended September 30, 2019 and 2018, marketable securities sold generated proceeds of $6,631 and $5,469, respectively, resulting in gross realized gains of $335 and $297, respectively, and gross realized losses of $61 and $95, respectively. During the nine months ended September 30, 2019 and 2018, marketable securities sold generated proceeds of $16,695 and $16,524, respectively, resulting in gross realized gains of $804 and $508, respectively, and gross realized losses of $265 and $714, respectively.
RREEF PROPERTY TRUST, INC.
NOTES TO CONSOLIDATED FINANCIAL STATEMENTS - continued
September 30, 2019
(Unaudited)
(in thousands, except share and per share data)
NOTE 7 — NOTES PAYABLE
Wells Fargo Line of Credit
On February 27, 2018, the Company, as guarantor, and certain of the wholly owned subsidiaries of the Operating Partnership, as co-borrowers, entered into an amended and restated secured revolving credit facility (the “Revised Wells Fargo Line of Credit”) with Wells Fargo Bank, National Association, as administrative agent, and other lending institutions that may become parties to the credit agreement. The Revised Wells Fargo Line of Credit has an initial three-year term maturing February 27, 2021. The Company has two one-year extension options following the initial term subject to satisfaction of certain conditions and payment of applicable extension fees.
The interest rate under the Revised Wells Fargo Line of Credit is based on the 1-month London Inter-bank Offered Rate ("LIBOR") with a spread of 160 to 180 basis points depending on the debt yield as defined in the agreement. In addition, the Revised Wells Fargo Line of Credit has a maximum capacity of $100,000 and is expandable by the Company up to a maximum capacity of $200,000 upon satisfaction of specified conditions. Each requested expansion must be for at least $25,000 and may result in the Revised Wells Fargo Line of Credit being syndicated. As of September 30, 2019, the outstanding balance under the Revised Wells Fargo Line of Credit was $52,300 and the weighted average interest rate was 3.64%. As of December 31, 2018, the outstanding balance was $84,619 and the weighted average interest rate was 4.07%.
At any time, the borrowing capacity under the Revised Wells Fargo Line of Credit is based on the lesser of (1) an amount equal to 65% of the aggregate value of the properties in the collateral pool as determined by lender appraisals, (2) an amount that results in a minimum debt yield of 10% based on the in-place net operating income of the collateral pool as defined, or (3) the maximum capacity of the Revised Wells Fargo Line of Credit. Proceeds from the Revised Wells Fargo Line of Credit can be used to fund acquisitions, redeem shares pursuant to the Company's redemption plan and for any other corporate purpose. As of September 30, 2019, the Company's maximum borrowing capacity was $82,954.
The Revised Wells Fargo Line of Credit agreement contains customary representations, warranties, borrowing conditions and affirmative, negative and financial covenants, including that there must be at least five properties in the collateral pool at all times and that the collateral pool must also meet specified concentration provisions, unless waived by the lender. In addition, the Company, as guarantor, must meet tangible net worth hurdles. The Company was in compliance with all financial covenants as of September 30, 2019.
Nationwide Life Insurance Loan-Flats
On March 1, 2016, RPT Flats at Carrs Hill, LLC, a wholly-owned subsidiary of the Operating Partnership, entered into a credit agreement with Nationwide Life Insurance Company (the "Flats Nationwide Loan"). Proceeds of $14,500 obtained from the Flats Nationwide Loan were used to repay outstanding balances under the Wells Fargo Line of Credit, thereby releasing The Flats at Carrs Hill from the Revised Wells Fargo Line of Credit. The Flats Nationwide Loan is a secured, fully non-recourse loan maturing after ten years on March 1, 2026 with no extension options. The Flats Nationwide Loan carries a fixed interest rate of 3.63% and requires monthly interest-only payments of $44 during the entire term.
RREEF PROPERTY TRUST, INC.
NOTES TO CONSOLIDATED FINANCIAL STATEMENTS - continued
September 30, 2019
(Unaudited)
(in thousands, except share and per share data)
Hartford Life Insurance Loan
On December 1, 2016, RPT 1109 Commerce Boulevard, LLC, a wholly-owned subsidiary of the Operating Partnership, entered into a credit agreement with Hartford Life Insurance Company (the "Hartford Loan"). Proceeds of $13,000 obtained from the Hartford Loan were used to repay outstanding balances under the Wells Fargo Line of Credit, thereby releasing Commerce Corner from the Revised Wells Fargo Line of Credit. The Hartford Loan is a secured, fully non-recourse loan maturing after seven years on December 1, 2023 with no extension options. The Hartford Loan carries a fixed interest rate of 3.41% with interest-only payments for the first 24 months of the term, then principal and interest payments for the remainder of the term based upon a 30-year amortization schedule.
Transamerica Life Insurance Loan
On December 6, 2018, RPT Wallingford Plaza, LLC, a wholly-owned subsidiary of the Operating Partnership, entered into a credit agreement with Transamerica Premier Life Insurance Company (the "Transamerica Loan"). Proceeds of $6,950, net of transaction costs, obtained from the Transamerica Loan were used to repay outstanding balances under the Revised Wells Fargo Line of Credit, thereby releasing Wallingford Plaza from the Revised Wells Fargo Line of Credit. The Transamerica Loan is a secured, fully non-recourse loan maturing after ten years on January 1, 2029 with no extension options. The Transamerica Loan carries a fixed interest rate of 4.56% with interest-only payments for the first 24 months of the term, then principal and interest payments for the remainder of the term, based upon a 30-year amortization schedule.
State Farm Life Insurance Loan
On June 11, 2019, RPT Elston Plaza, LLC, a wholly-owned subsidiary of the Operating Partnership, entered into a credit agreement with State Farm Life Insurance Company (the "State Farm Loan"). Proceeds of $17,600 obtained from the State Farm Loan were used to repay outstanding balances under the Revised Wells Fargo Line of Credit, thereby releasing Elston Plaza from the Revised Wells Fargo Line of Credit. The State Farm Loan is a secured, fully non-recourse loan maturing after seven years on July 1, 2026 with no extension options. The State Farm Loan carries a fixed interest rate of 3.89% with interest-only payments for the first 24 months of the term, then principal and interest payments for the remainder of the term, based upon a 30-year amortization schedule.
Nationwide Life Insurance Loan-Providence
On September 16, 2019, RPT Providence Square, LLC, a wholly-owned subsidiary of the Operating Partnership, entered into a credit agreement with Nationwide Life Insurance Company (the "Providence Nationwide Loan"). Proceeds of $29,700 obtained from the Providence Nationwide Loan were used to fund the acquisition of Providence Square. The Providence Nationwide Loan is a secured, fully non-recourse loan maturing after ten years on October 5, 2029 with no extension options. The Providence Nationwide Loan carries a fixed interest rate of 3.67% with interest-only payments for the entire ten year term.
The following is a reconciliation of the carrying amount of the Revised Wells Fargo Line of Credit and mortgage loans payable:
RREEF PROPERTY TRUST, INC.
NOTES TO CONSOLIDATED FINANCIAL STATEMENTS - continued
September 30, 2019
(Unaudited)
(in thousands, except share and per share data)
|
| | | | | | | |
| | September 30, 2019 | | December 31, 2018 |
| Line of credit | $ | 52,300 |
| | $ | 84,619 |
|
| Deduct: Deferred financing costs, less accumulated amortization | (376 | ) | | (573 | ) |
| Line of credit, net | $ | 51,924 |
| | $ | 84,046 |
|
| | | | |
| Mortgage loans payable | $ | 81,561 |
| | $ | 34,450 |
|
| Deduct: Deferred financing costs, less accumulated amortization | (816 | ) | | (395 | ) |
| Mortgage loans payable, net | $ | 80,745 |
| | $ | 34,055 |
|
Aggregate future principal payments due on the Revised Wells Fargo Line of Credit and mortgage loans payable as of September 30, 2019 are as follows:
|
| | | | |
| Year | | Amount |
| Remainder of 2019 | | $ | 64 |
|
| 2020 | | 262 |
|
| 2021 | | 52,803 |
|
| 2022 | | 717 |
|
| 2023 | | 12,388 |
|
| Thereafter | | 67,627 |
|
| Total | | $ | 133,861 |
|
NOTE 8 — RELATED PARTY ARRANGEMENTS
Advisory Agreement
RREEF America is entitled to compensation and reimbursements in connection with the management of the Company's investments in accordance with an advisory agreement between RREEF America and the Company (the "Advisory Agreement"). The Advisory Agreement has a one-year term and is renewable annually upon the review and approval of the Company's board of directors, including the approval of a majority of the Company's independent directors. The Advisory Agreement has a current expiration date of January 20, 2021. There is no limit to the number of terms for which the Advisory Agreement can be renewed.
Fees
Under the Advisory Agreement, RREEF America can earn an advisory fee comprised of two components as described below.
| |
| 1. | The fixed component accrues daily in an amount equal to 1/365th of 1.0% of the NAV of the outstanding shares of each class of common stock for such day. The fixed component of the advisory fee is payable monthly in arrears. |
| |
| 2. | The performance component is calculated for each class of common stock on the basis of the total return to stockholders and is measured by the total distributions per share declared to such class plus the change in the NAV per share for such class. For any calendar year in which the total return per share allocable to a class exceeds 6% per annum (the “Hurdle Amount”), RREEF America will receive up to 10% of the aggregate total return allocable to such class with a Catch-Up (defined below) calculated as follows: first, if |
RREEF PROPERTY TRUST, INC.
NOTES TO CONSOLIDATED FINANCIAL STATEMENTS - continued
September 30, 2019
(Unaudited)
(in thousands, except share and per share data)
the total return for the applicable period exceeds the Hurdle Amount, 25% of such total return in excess of the Hurdle Amount (the “Excess Profits”) until the total return reaches 10% (commonly referred to as a “Catch-Up”); and second, to the extent there are remaining Excess Profits, 10% of such remaining Excess Profits. The performance component earned by RREEF America for each class is subject to certain other adjustments which do not apply unless the NAV per share is below $12.00 per share. The performance component is payable annually in arrears.
The performance component is calculated daily on a year-to-date basis by reference to a proration of the per annum hurdle as of the date of calculation. Any resulting performance component as of a given date is deducted from the Company's published NAV per share for such date. At each interim balance sheet date, the Company considers the estimated performance component that is probable to be due as of the end of the current calendar year in assessing whether the calculated performance component as of the interim balance sheet date meets the threshold for recognition in accordance with GAAP in the Company's consolidated financial statements. The ultimate amount of the performance component as of the end of the current calendar year, if any, may be more or less than the amount recognized by the Company as of any interim date and will depend on a variety of factors, including but not limited to, the performance of the Company's investments, interest rates, capital raise and redemptions. The Company considers the estimated performance component as of September 30, 2019 to be sufficiently probable to warrant recognition of a performance component as of September 30, 2019 in the Company's consolidated financial statements. The fixed component earned by RREEF America and the performance component recognized by the Company are shown below.
|
| | | | | | | | | | | | | | | |
| | Three Months Ended September 30, | | Nine Months Ended September 30, |
| | 2019 | | 2018 | | 2019 | | 2018 |
| Fixed component | $ | 464 |
| | $ | 332 |
| | $ | 1,246 |
| | $ | 911 |
|
| Performance component | 550 |
| | 210 |
| | 700 |
| | 300 |
|
| | $ | 1,014 |
| | $ | 542 |
| | $ | 1,946 |
| | $ | 1,211 |
|
Expense Reimbursements
Under the Advisory Agreement, RREEF America is entitled to reimbursement of certain costs incurred by RREEF America or its affiliates that were not incurred under the Expense Support Agreement, as described below. Costs eligible for reimbursement, if they were not incurred under the Expense Support Agreement, include most third-party operating expenses, salaries and related costs of RREEF America's employees who perform services for the Company (but not those employees for which RREEF America earns a separate fee or those employees who are executive officers of the Company) and travel related costs for RREEF America's employees who incur such costs on behalf of the Company. Reimbursement payments to RREEF America are subject to the limitations described below under "Reimbursement Limitations."
For the three months ended September 30, 2019 and 2018, RREEF America incurred $69 and $70 of reimbursable operating expenses and offering costs, respectively, that were subject to reimbursement under the Advisory Agreement. For the nine months ended September 30, 2019 and 2018, RREEF America incurred $209 and $234 of reimbursable operating expenses and offering costs, respectively, that were subject to reimbursement under the Advisory Agreement. As of September 30, 2019 and December 31, 2018, the Company had a payable to RREEF America of $56 and $73, respectively, of operating expenses and offering costs reimbursable under the Advisory Agreement.
Organization and Offering Costs
Under the Advisory Agreement, RREEF America agreed to pay all of the Company’s organization and offering costs incurred through January 3, 2013. In addition, RREEF America agreed to pay certain of the Company’s
RREEF PROPERTY TRUST, INC.
NOTES TO CONSOLIDATED FINANCIAL STATEMENTS - continued
September 30, 2019
(Unaudited)
(in thousands, except share and per share data)
organization and offering costs from January 3, 2013 through January 3, 2014 that were incurred in connection with certain offering related activities. In total, RREEF America incurred $4,618 of these costs (the “Deferred O&O”) on behalf of the Company from the Company’s inception through January 3, 2014. Pursuant to the Advisory Agreement, the Company reimbursed RREEF America monthly for the Deferred O&O on a pro rata basis over 60 months beginning in January 2014. The Deferred O&O balance was fully reimbursed as of December 31, 2018. The Company reimbursed RREEF America $233 for Deferred O&O for the three months ended September 30, 2018. The Company reimbursed RREEF America $690 for Deferred O&O for the nine months ended September 30, 2018.
Expense Support Agreement
Pursuant to the terms of the expense support agreement, as most recently amended on January 20, 2016 (the "Expense Support Agreement"), RREEF America agreed to defer reimbursement of certain expenses related to the Company's operations that RREEF America has incurred that are not part of the Deferred O&O described above and, therefore, are in addition to the Deferred O&O amount (the “Expense Payments”). The Expense Payments include organization and offering costs and operating expenses as described above under the Advisory Agreement. RREEF America incurred these expenses until the date upon which the aggregate Expense Payments by RREEF America reached $9,200. As of December 31, 2015, the Company had incurred a total of $9,200 in Expense Payments in addition to the $4,618 of Deferred O&O noted above. The balance of $9,200 in Expense Payments consisted of $3,775 in organization and offering costs related to the Company's initial public offering, $196 of offering costs for the Private Offering and $5,229 in operating expenses. The Company has not received any Expense Payments since December 31, 2015.
In accordance with the Expense Support Agreement, the Company was to reimburse RREEF America $250 per quarter (the "Quarterly Reimbursement"), representing a non-interest bearing note due to RREEF America ("Note to Affiliate") which was subject to the imputation of interest. In accordance therewith, on January 1, 2016, the Company recorded a discount on the Note to Affiliate in the amount of $1,862 which was to be amortized to interest expense over the contractual reimbursement period using the effective interest method.
On April 25, 2016, the Company and RREEF America entered into a letter agreement that amended certain provisions of the Advisory Agreement and the Expense Support Agreement (the "Letter Agreement"). The Letter Agreement provides, in part, that the Company's obligations to reimburse RREEF America for Expense Payments under the Expense Support Agreement are suspended until the first calendar month following the month in which the Company has reached $500,000 in offering proceeds from the offerings (the "ESA Commencement Date"). The Company currently owes $8,950 to RREEF America under the Expense Support Agreement in the form of the Note to Affiliate. Beginning the month following the ESA Commencement Date, the Company will make monthly reimbursement payments to RREEF America in the amount of $417 for the first 12 months and $329 for the second 12 months, subject to monthly reimbursement payment limitations described in the Letter Agreement. The execution of the Letter Agreement represented a modification of the Note to Affiliate, and as such, the unamortized discount on the Note to Affiliate as of April 25, 2016 is instead being amortized over the estimated repayment period pursuant to the Letter Agreement. In accordance therewith, the Company is amortizing the remaining discount using an interest rate of 1.93%. For the three months ended September 30, 2019 and 2018, the Company amortized $37 and $36, respectively, of the discount on the Note to Affiliate into interest expense. For the nine months ended September 30, 2019 and 2018, the Company amortized $111 and $109, respectively, of the discount on the Note to Affiliate into interest expense.
In addition, pursuant to the Letter Agreement, if RREEF America is serving as the Company's advisor at the time that the Company or the Operating Partnership undertakes a liquidation, the Company's remaining obligations to reimburse RREEF America for the unreimbursed Expense Payments under the Expense Support Agreement shall be waived.
Dealer Manager Agreement
RREEF PROPERTY TRUST, INC.
NOTES TO CONSOLIDATED FINANCIAL STATEMENTS - continued
September 30, 2019
(Unaudited)
(in thousands, except share and per share data)
The Company and its Operating Partnership entered into a dealer manager agreement (the "Dealer Manager Agreement") with DWS Distributors, Inc., an affiliate of the Company's sponsor and advisor (the "Dealer Manager"), which was most recently amended and restated on March 7, 2019. The Dealer Manager Agreement governs the distribution by the Dealer Manager of the Company’s Class A Shares, Class I Shares, Class N Shares and Class T Shares in the Follow-On Public Offering and any subsequent registered public offering. In connection with the ongoing Trailing Fees to be paid in the future, the Company and the Dealer Manager entered into an agreement whereby the Company will pay to the Dealer Manager the Trailing Fees that are attributable to the Company's shares issued in the Company's initial public offering that remain outstanding. In addition, the Company is obligated to pay to the Dealer Manager Trailing Fees that are attributable to the Company's shares issued in the Follow-On Public Offering. As of September 30, 2019 and December 31, 2018, the Company has accrued $107 and $86, respectively, in Trailing Fees currently payable to the Dealer Manager, and $5,326 and $3,107, respectively, in Trailing Fees estimated to become payable in the future to the Dealer Manager, both of which are included in due to affiliates on the consolidated balance sheets. The Company also pays the Dealer Manager upfront selling commissions and upfront dealer manager fees in connection with its Offerings, as applicable. For the three months ended September 30, 2019 and 2018, the Dealer Manager earned upfront selling commissions and upfront dealer manager fees totaling $70 and $277, respectively. For the nine months ended September 30, 2019 and 2018, the Dealer Manager earned upfront selling commissions and upfront dealer manager fees totaling $284 and $441, respectively.
Under the Dealer Manager Agreement, the Company is obligated to reimburse the Dealer Manager for certain offering costs incurred by the Dealer Manager on the Company's behalf, including but not limited to broker-dealer sponsorships, attendance fees for retail seminars conducted by broker-dealers or the Dealer Manager, and travel costs for certain personnel of the Dealer Manager who are dedicated to the distribution of the Company's shares of common stock. For the three months ended September 30, 2019 and 2018, the Dealer Manager incurred $26 and $67, respectively, in such costs on behalf of the Company. For the nine months ended September 30, 2019 and 2018, the Dealer Manager incurred $146 and $288, respectively, in such costs on behalf of the Company. As of September 30, 2019 and December 31, 2018, the Company had payable to the Dealer Manager $146 and $329, respectively, of such costs which was included in due to affiliates on the consolidated balance sheets.
Reimbursement Limitations
Organization and Offering Costs
The Company will not reimburse RREEF America under the Advisory Agreement or the Expense Support Agreement and will not reimburse the Dealer Manager under the Dealer Manager Agreement for any organization and offering costs which would cause the Company's total organization and offering costs with respect to a public offering to exceed 15% of the gross proceeds from such public offering. Further, the Company will not reimburse RREEF America or the Dealer Manager for any underwriting compensation (a subset of organization and offering costs) which would cause the Company's total underwriting compensation with respect to a public offering to exceed 10% of the gross proceeds from the primary portion of such public offering. For the Company's initial public offering that ended on June 30, 2016, the Company raised $102,831 in gross proceeds and incurred $15,424 in organization and offering costs, including, as of September 30, 2019, estimated accrued Trailing Fees payable in the future of $362.
As of September 30, 2019, in the Follow-On Public Offering, the Company raised $116,362 in gross proceeds and incurred total organization and offering costs of $11,146, including estimated accrued Trailing Fees payable in the future of $4,964.
Operating Expenses
Pursuant to the Company’s charter, the Company may reimburse RREEF America, at the end of each fiscal quarter, for total operating expenses incurred by RREEF America, whether under the Expense Support Agreement or
RREEF PROPERTY TRUST, INC.
NOTES TO CONSOLIDATED FINANCIAL STATEMENTS - continued
September 30, 2019
(Unaudited)
(in thousands, except share and per share data)
otherwise. However, the Company may not reimburse RREEF America at the end of any fiscal quarter for total operating expenses (as defined in the Company’s charter) that, in the four consecutive fiscal quarters then ended, exceed the greater of 2% of average invested assets or 25% of net income determined without reduction for any additions to reserves for depreciation, bad debts or other similar non-cash reserves and excluding any gain from the sale of the Company's assets for that period (the “2%/25% Guidelines”). Notwithstanding the foregoing, the Company may reimburse RREEF America for expenses in excess of the 2%/25% Guidelines if a majority of the Company’s independent directors determines that such excess expenses are justified based on unusual and non-recurring factors. For the four fiscal quarters ended September 30, 2019, total operating expenses of the Company were $4,514, which did not exceed the amount prescribed by the 2%/25% Guidelines.
Due to Affiliates and Note to Affiliate
In accordance with all the above, the Company owed its affiliates the following amounts:
|
| | | | | | | |
| | September 30, 2019 | | December 31, 2018 |
| Reimbursable under the Advisory Agreement | $ | 56 |
| | $ | 73 |
|
| Reimbursable under the Dealer Manager Agreement | 146 |
| | 329 |
|
| Advisory fees | 859 |
| | 697 |
|
| Accrued Trailing Fees | 5,434 |
| | 3,193 |
|
| Due to affiliates | $ | 6,495 |
| | $ | 4,292 |
|
| | | | |
| Note to Affiliate | $ | 8,950 |
| | $ | 8,950 |
|
| Unamortized discount | (1,254 | ) | | (1,365 | ) |
| Note to Affiliate, net of unamortized discount | $ | 7,696 |
| | $ | 7,585 |
|
NOTE 9 — CAPITALIZATION
Under the Company's charter, as most recently amended on February 16, 2017, the Company has the authority to issue 1,000,000,000 shares of common stock and 50,000,000 shares of preferred stock. All shares of such stock have a par value of $0.01 per share. The Company's authorized shares of common stock are allocated between classes as follows:
|
| | | |
| Common Stock | | No. of Authorized Shares |
| Class A Shares | | 200,000,000 |
|
| Class I Shares | | 200,000,000 |
|
| Class T Shares | | 250,000,000 |
|
| Class D Shares | | 50,000,000 |
|
| Class N Shares | | 300,000,000 |
|
| | | 1,000,000,000 |
|
Class A Shares are subject to selling commissions of up to 3% of the purchase price, and annual dealer manager fees of 0.55% and distribution fees of 0.50% of NAV, both paid on a trailing basis. Class I Shares are subject to annual dealer manager fees of 0.55% of NAV paid in a trailing basis, but are not subject to any selling commissions or distribution fees. Class T Shares are subject to selling commissions of up to 3% of the purchase price, an up-front dealer manager fee of up to 2.50% of the purchase price, and annual distribution fees of 1.0% of NAV paid on a trailing basis for approximately three years. Class D shares sold in the Private Offering are subject to selling
RREEF PROPERTY TRUST, INC.
NOTES TO CONSOLIDATED FINANCIAL STATEMENTS - continued
September 30, 2019
(Unaudited)
(in thousands, except share and per share data)
commissions of up to 1.0% of the purchase price, but do not incur any dealer manager or distribution fees.
Class N Shares are not sold in the primary Follow-On Public Offering, but will be issued upon conversion of an investor's Class T Shares once (i) the investor's Class T Share account for a given offering has incurred a maximum of 8.5% of commissions, dealer manager fees and distribution fees; (ii) the total underwriting compensation from whatever source with respect to the Follow-On Public Offering exceeds 10% of the gross proceeds from the primary portion of the Follow-On Public Offering; (iii) a listing of the Class N Shares; or (iv) the Company's merger or consolidation with or into another entity or the sale or other disposition of all or substantially all of the Company's assets.
Distribution Reinvestment Plan
The Company has adopted a distribution reinvestment plan that allows stockholders to have the cash distributions attributable to the class of shares that the stockholder owns automatically invested in additional shares of the same class. Shares are offered pursuant to the Company's distribution reinvestment plan at the NAV per share applicable to that class, calculated as of the distribution date and after giving effect to all distributions. Stockholders who elect to participate in the distribution reinvestment plan, and who are subject to U.S. federal income taxation laws, will incur a tax liability on an amount equal to the fair value on the relevant distribution date of the shares of the Company's common stock purchased with reinvested distributions, even though such stockholders have elected not to receive the distributions used to purchase those shares of the Company's common stock in cash.
Redemption Plan
In an effort to provide the Company's stockholders with liquidity in respect of their investment in shares of the Company's common stock, the Company has adopted a redemption plan whereby on a daily basis stockholders may request the redemption of all or any portion of their shares. The redemption price per share is equal to the Company's NAV per share of the class of shares being redeemed on the date of redemption, subject to a short-term trading discount, if applicable. The total amount of redemptions in any calendar quarter will be limited to shares whose aggregate value (based on the redemption price per share on the date of the redemption) is equal to 5% of the Company's combined NAV for all classes of shares as of the last day of the previous calendar quarter. In addition, if redemptions do not reach the 5% limit in a calendar quarter, the unused portion generally will be carried over to the next quarter and not any subsequent quarter, except that the maximum amount of redemptions during any quarter may never exceed 10% of the combined NAV for all classes of shares as of the last day of the previous calendar quarter. If the quarterly volume limitation is reached on or before the third business day of a calendar quarter, redemption requests during the next quarter will be satisfied on a stockholder by stockholder basis, which the Company refers to as a per stockholder allocation, instead of a first-come, first-served basis. Pursuant to the per stockholder allocation, each stockholder would be allowed to request redemption at any time during such quarter of a total number of shares not to exceed 5% of the shares of common stock the stockholder held as of the end of the prior quarter. The per stockholder allocation requirement will remain in effect for each succeeding quarter for which the total redemptions for the immediately preceding quarter exceeded 4% of the Company's NAV on the last business day of such preceding quarter. If total redemptions during a quarter for which the per stockholder allocation applies are equal to or less than 4% of the Company's NAV on the last business day of such preceding quarter, then redemptions will again be satisfied on a first-come, first-served basis for the next succeeding quarter and each quarter thereafter.
Each redemption request will be evaluated by the Company in consideration of rules and regulations promulgated by the Internal Revenue Service with respect to dividend equivalent redemptions. Redemptions that may be considered dividend equivalent redemptions may adversely affect the Company or its stockholders. Accordingly, the Company may reject any redemption request that it reasonably believes may be treated as a dividend equivalent redemption.
While there is no minimum holding period, shares redeemed within 365 days of the date of the investor's initial
RREEF PROPERTY TRUST, INC.
NOTES TO CONSOLIDATED FINANCIAL STATEMENTS - continued
September 30, 2019
(Unaudited)
(in thousands, except share and per share data)
purchase of the Company's shares will be redeemed at the Company's NAV per share of the class of shares being redeemed on the date of redemption less a short-term trading discount equal to 2% of the gross proceeds otherwise payable with respect to the redemption.
In the event that any stockholder fails to maintain a minimum balance of $500 (not in thousands) worth of shares of common stock, the Company may redeem all of the shares held by that stockholder at the redemption price per share in effect on the date it is determined that the stockholder has failed to meet the minimum balance, less the short-term trading discount of 2%, if applicable. Minimum account redemptions will apply even in the event that the failure to meet the minimum balance is caused solely by a decline in the Company's NAV.
During the three and nine months ended September 30, 2019 and 2018, redemptions were as shown below. The Company funded these redemptions with cash flow from operations, proceeds from its Offerings or borrowings. The weighted average redemption prices are shown before allowing for any applicable 2% short-term trading discounts.
|
| | | | | | | | | | | |
| Three Months Ended September 30, 2019 | | Shares | | Weighted Average Share Price | | Amount |
| Class A | | 42,136 |
| | $ | 14.35 |
| | $ | 605 |
|
| Class I | | 41,101 |
| | 14.44 |
| | 593 |
|
| Class T | | 10,468 |
| | 14.47 |
| | 151 |
|
| Class D | | — |
| | — |
| | — |
|
|
| | | | | | | | | | | |
| Nine Months Ended September 30, 2019 | | Shares | | Weighted Average Share Price | | Amount |
| Class A | | 178,215 |
| | $ | 14.25 |
| | $ | 2,539 |
|
| Class I | | 102,627 |
| | 14.30 |
| | 1,466 |
|
| Class T | | 23,165 |
| | 14.35 |
| | 331 |
|
| Class D | | — |
| | — |
| | — |
|
|
| | | | | | | | | | | |
| Three Months Ended September 30, 2018 | | Shares | | Weighted Average Share Price | | Amount |
| Class A | | 95,496 |
| | $ | 13.98 |
| | $ | 1,334 |
|
| Class I | | 44,865 |
| | 14.08 |
| | 632 |
|
| Class T | | — |
| | — |
| | — |
|
| Class D | | — |
| | — |
| | — |
|
|
| | | | | | | | | | | |
| Nine Months Ended September 30, 2018 | | Shares | | Weighted Average Share Price | | Amount |
| Class A | | 234,674 |
| | $ | 13.87 |
| | $ | 3,255 |
|
| Class I | | 162,464 |
| | 13.96 |
| | 2,262 |
|
| Class T | | — |
| | — |
| | — |
|
| Class D | | — |
| | — |
| | — |
|
The Company's board of directors has the discretion to suspend or modify the redemption plan at any time, including in circumstances in which it (1) determines that such action is in the best interest of the Company's stockholders, (2) determines that it is necessary due to regulatory changes or changes in law or (3) becomes aware of undisclosed material information that it believes should be publicly disclosed before shares are redeemed. In addition, the Company's board of directors may suspend the Offerings and the redemption plan, if it determines that the calculation of NAV is materially incorrect or there is a condition that restricts the valuation of a material portion of the Company's assets. If the board of directors materially amends (including any reduction of the quarterly limit)
RREEF PROPERTY TRUST, INC.
NOTES TO CONSOLIDATED FINANCIAL STATEMENTS - continued
September 30, 2019
(Unaudited)
(in thousands, except share and per share data)
or suspends the redemption plan during any quarter, other than any temporary suspension to address certain external events unrelated to the Company's business, any unused portion of that quarter’s 5% limit will not be carried forward to the next quarter or any subsequent quarter.
Equity-Based Compensation
The Company has in place an incentive compensation plan and an independent directors compensation plan (the “Compensation Plans”). The Compensation Plans were created to attract, retain and compensate highly-qualified individuals, who are not employees of RREEF Property Trust, Inc. or any of its subsidiaries or affiliates, for service as members of the board by providing them with competitive compensation. The Compensation Plans provided for 5,000 shares of restricted stock to be issued to each of the Company's independent directors once the Company had issued 12,500,000 shares of its common stock in the aggregate from its Offerings.
On March 29, 2019, pursuant to the Company having met the issued share requirement, the Company granted 5,000 shares of restricted Class I common stock to each of the Company's independent directors for a total of 20,000 shares (the "Initial Stock Awards"). The Initial Stock Awards shall vest and become non-forfeitable in three equal annual installments on each of the first three anniversaries of the grant date with the exception of one independent director whose Initial Stock Award vested immediately upon grant. The fair value of the Initial Stock Awards is determined using the Company’s Class I Share price on the date of grant, which was $14.34. The Company has elected to account for any forfeitures of restricted stock awards as they occur.
On May 15 2019, pursuant to the new independent director compensation plan, the Company granted $10 of shares of restricted Class I common stock to each of the Company's independent directors (the "Annual Share Grant Awards"). The fair value of the Annual Share Grant Awards is determined using the Company’s Class I Share price on the date of grant, which was $14.32, which resulted in a total of 2,094 shares granted. The Annual Share Grant Awards shall vest and become non-forfeitable at the next annual shareholder meeting (approximately one year from issue date). The Company has elected to account for any forfeitures of restricted stock awards as they occur.
Below is a summary of the activity, per share value and recognized expense for the stock awards. No stock awards were granted prior to 2019.
|
| | | | | | | | | | | | | | | | | |
| | | | Three Months Ended September 30, 2019 | | Nine Months Ended September 30, 2019 |
| Stock Awards | | Class I Shares | | Weighted Average Grant Date Fair Value | | Class I Shares | | Weighted Average Grant Date Fair Value |
| Outstanding, beginning of period | | 17,094 |
| | $ | 14.34 |
| | — |
| | — |
|
| Changes during the period: | | | | | | | | |
| | Granted | | — |
| | — |
| | 22,094 |
| | $ | 14.34 |
|
| | Vested | | — |
| | — |
| | (5,000 | ) | | 14.34 |
|
| | Forfeited | | — |
| | — |
| | — |
| | — |
|
| Outstanding, end of period | | 17,094 |
| | 14.34 |
| | 17,094 |
| | 14.34 |
|
| | | | | | | | | | |
| Amount included in general and administrative expenses | | $ | 25 |
| | | | $ | 119 |
| | |
NOTE 10 - NET INCOME (LOSS) PER SHARE
RREEF PROPERTY TRUST, INC.
NOTES TO CONSOLIDATED FINANCIAL STATEMENTS - continued
September 30, 2019
(Unaudited)
(in thousands, except share and per share data)
The Company computes net income (loss) per share for each class of common stock with shares outstanding using the two-class method. RREEF America may earn a performance component of the advisory fee (see Note 8) which may impact the net income (loss) of each class of common stock differently. The performance component and the impact on each class of common stock, if any, are shown below.
Basic and diluted net income (loss) per share for each class of common stock is computed using the weighted-average number of common shares outstanding during the period for each class of common stock. The Initial Stock Awards and the Annual Share Grant Awards granted to the Company's independent directors (see Note 9) qualify as participating securities and therefore also require use of the two-class method for computing net income (loss) per share. However, the unvested Initial Stock Awards and the unvested Annual Share Grant Awards are anti-dilutive or immaterially dilutive, and therefore are ignored in the diluted net income per share calculation for the three and nine months ended September 30, 2019.
The following table sets forth the computation of basic and diluted net income (loss) per share for each class of the Company’s common stock which had shares outstanding during the relevant period.
|
| | | | | | | | | | | | | | | | | |
|
|
| Three Months Ended September 30, 2019 |
|
| Class A |
| Class I |
| Class T | | Class D* |
| Basic and diluted net income per share: |
|
|
|
|
|
| | |
| | Allocation of net income before performance fee | | $ | 323 |
| | $ | 693 |
| | $ | 70 |
| | $ | 15 |
|
| Allocation of performance fees |
| (161 | ) |
| (353 | ) |
| (31 | ) | | (5 | ) |
| Total numerator |
| $ | 162 |
|
| $ | 340 |
|
| $ | 39 |
| | $ | 10 |
|
| Denominator - weighted average number of common shares outstanding |
| 3,756,326 |
|
| 8,058,111 |
|
| 806,338 |
| | 176,101 |
|
| Basic and diluted net income per share: |
| $ | 0.04 |
|
| $ | 0.04 |
|
| $ | 0.05 |
| | $ | 0.06 |
|
|
|
|
|
|
|
|
| | |
|
|
| Nine Months Ended September 30, 2019 |
|
| Class A |
| Class I |
| Class T | | Class D* |
| Basic and diluted net income per share: |
|
|
|
|
|
| | |
| | Allocation of net income before performance fee | | $ | 787 |
| | $ | 1,529 |
| | $ | 156 |
| | $ | 14 |
|
| Allocation of performance fees |
| (207 | ) |
| (449 | ) |
| (39 | ) | | (5 | ) |
| Total numerator |
| $ | 580 |
| | $ | 1,080 |
|
| $ | 117 |
| | $ | 9 |
|
| Denominator - weighted average number of common shares outstanding |
| 3,684,649 |
|
| 7,171,178 |
|
| 731,825 |
| | 63,216 |
|
| Basic and diluted net income per share: |
| $ | 0.16 |
|
| $ | 0.15 |
|
| $ | 0.16 |
| | $ | 0.14 |
|
| * Class D Shares were initially issued in June 2019. |
RREEF PROPERTY TRUST, INC.
NOTES TO CONSOLIDATED FINANCIAL STATEMENTS - continued
September 30, 2019
(Unaudited)
(in thousands, except share and per share data)
|
| | | | | | | | | | | | | |
| | | | Three Months Ended September 30, 2018 |
| | | Class A | | Class I | | Class T |
| Basic and diluted net loss per share: | | | | | | |
| | Allocation of net loss before performance fee | | $ | (216 | ) | | $ | (298 | ) | | $ | (24 | ) |
| | Allocation of performance fees | | (82 | ) | | (124 | ) | | (4 | ) |
| | Total numerator | | $ | (298 | ) | | $ | (422 | ) | | $ | (28 | ) |
| | Denominator - weighted average number of common shares outstanding | | 3,777,836 |
| | 5,202,959 |
| | 426,209 |
|
| Basic and diluted net loss per share: | | $ | (0.08 | ) | | $ | (0.08 | ) | | $ | (0.07 | ) |
| | | | | | | | |
| | | | Nine Months Ended September 30, 2018 |
| | | Class A | | Class I | | Class T |
| Basic and diluted net loss per share: | | | | | | |
| | Allocation of net loss before performance fee | | $ | (624 | ) | | $ | (809 | ) | | $ | (37 | ) |
| | Allocation of performance fees | | (117 | ) | | (177 | ) | | (6 | ) |
| | Total numerator | | $ | (741 | ) | | $ | (986 | ) | | $ | (43 | ) |
| | Denominator - weighted average number of common shares outstanding | | 3,719,098 |
| | 4,823,708 |
| | 220,030 |
|
| Basic and diluted net loss per share: | | $ | (0.20 | ) | | $ | (0.20 | ) | | $ | (0.19 | ) |
NOTE 11 — DISTRIBUTIONS
In order to qualify as a REIT, the Company is required, among other things, to make distributions each taxable year of at least 90% of its taxable income determined without regard to the dividends-paid deduction and excluding net capital gains, and to meet certain tests regarding the nature of the Company's income and assets. The Company expects that its board of directors will continue to declare distributions with a daily record date, payable monthly in arrears. Any distributions the Company makes will be at the discretion of its board of directors, considering factors such as its earnings, cash flow, capital needs and general financial condition and the requirements of Maryland law. The Company commenced operations on May 30, 2013 and elected taxation as a REIT for the year ended December 31, 2013. Distributions for each month are payable on or before the first business day of the following month. However, any distributions reinvested by the stockholders in accordance with the Company's dividend reinvestment plan are reinvested at the per share NAV of the same class determined at the close of business on the last business day of the month in which the distributions were accrued.
Shown below are details of the Company's distributions.
RREEF PROPERTY TRUST, INC.
NOTES TO CONSOLIDATED FINANCIAL STATEMENTS - continued
September 30, 2019
(Unaudited)
(in thousands, except share and per share data)
|
| | | | | | | | | | | | | | | |
| | Three Months Ended | | Nine Months Ended September 30, 2019 |
| | March 31, 2019 | | June 30, 2019 | | September 30, 2019 | |
| Declared daily distribution rate, before adjustment for class-specific fees | $ | 0.00193545 |
| | $ | 0.00195924 |
| | $ | 0.00197058 |
| | |
| Distributions paid or payable in cash | $ | 1,000 |
| | $ | 1,105 |
| | $ | 1,238 |
| | $ | 3,343 |
|
| Distributions reinvested | 841 |
| | 954 |
| | 1,079 |
| | 2,874 |
|
| Distributions declared | $ | 1,841 |
| | $ | 2,059 |
| | $ | 2,317 |
| | $ | 6,217 |
|
| Class A Shares issued upon reinvestment | 22,405 |
| | 23,894 |
| | 24,576 |
| | 70,875 |
|
| Class I Shares issued upon reinvestment | 34,329 |
| | 39,949 |
| | 47,367 |
| | 121,645 |
|
| Class T Shares issued upon reinvestment | 2,250 |
| | 2,736 |
| | 2,891 |
| | 7,877 |
|
| Class D Shares issued upon reinvestment* | — |
| | — |
| | — |
| | — |
|
| * Class D Shares were initially issued in June 2019. |
|
| | | | | | | | | | | | | | | |
| | Three Months Ended | | Nine Months Ended September 30, 2018 |
| | March 31, 2018 | | June 30, 2018 | | September 30, 2018 | |
| Declared daily distribution rate, before adjustment for class-specific fees | $ | 0.00189004 |
| | $ | 0.00190140 |
| | $ | 0.00192261 |
| | |
| Distributions paid or payable in cash | $ | 781 |
| | $ | 831 |
| | $ | 930 |
| | $ | 2,542 |
|
| Distributions reinvested | 619 |
| | 662 |
| | 732 |
| | 2,013 |
|
| Distributions declared | $ | 1,400 |
| | $ | 1,493 |
| | $ | 1,662 |
| | $ | 4,555 |
|
| Class A Shares issued upon reinvestment | 22,714 |
| | 22,901 |
| | 23,500 |
| | 69,115 |
|
| Class I Shares issued upon reinvestment | 21,479 |
| | 23,520 |
| | 27,180 |
| | 72,179 |
|
| Class T Shares issued upon reinvestment | 678 |
| | 976 |
| | 1,548 |
| | 3,202 |
|
Shown below are details by share class of the Company's distributions.
RREEF PROPERTY TRUST, INC.
NOTES TO CONSOLIDATED FINANCIAL STATEMENTS - continued
September 30, 2019
(Unaudited)
(in thousands, except share and per share data)
|
| | | | | | | | | | | | | | | |
| | Three Months Ended | | Nine Months Ended September 30, 2019 |
| | March 31, 2019 | | June 30, 2019 | | September 30, 2019 | |
| Class A | $ | 588 |
| | $ | 620 |
| | $ | 636 |
| | $ | 1,844 |
|
| Class I | 1,147 |
| | 1,314 |
| | 1,508 |
| | 3,969 |
|
| Class T | 106 |
| | 123 |
| | 137 |
| | 366 |
|
| Class D* | — |
| | 2 |
| | 36 |
| | 38 |
|
| Distributions declared | $ | 1,841 |
| | $ | 2,059 |
| | $ | 2,317 |
| | $ | 6,217 |
|
| * Class D Shares were initially issued in June 2019. |
|
| | | | | | | | | | | | | | | |
| | Three Months Ended | | Nine Months Ended September 30, 2018 |
| | March 31, 2018 | | June 30, 2018 | | September 30, 2018 | |
| Class A | $ | 593 |
| | $ | 603 |
| | $ | 631 |
| | $ | 1,827 |
|
| Class I | 794 |
| | 866 |
| | 960 |
| | 2,620 |
|
| Class T | 13 |
| | 24 |
| | 71 |
| | 108 |
|
| Distributions declared | $ | 1,400 |
| | $ | 1,493 |
| | $ | 1,662 |
| | $ | 4,555 |
|
NOTE 12 — INCOME TAXES
The Company believes that it has operated in such a manner to qualify to be taxed as a REIT for federal income tax purposes beginning with the taxable year ended December 31, 2013, when it first elected REIT status. In each calendar year that the Company qualifies for taxation as a REIT, the Company generally will not be subject to federal income tax to the extent it meets certain criteria and distributes its REIT taxable income to its stockholders. Distributions declared and paid by the Company may consist of ordinary income, qualifying dividends, return of capital, capital gains or a combination thereof. The characterization of the distributions into these various components will impact how the distributions are taxable to the stockholder who received them. Distributions that constitute a return of capital generally are non-taxable and will reduce the stockholder's basis in the shares. The characterization of the distributions is generally determined during the month of January following the close of the tax year.
Net worth and similar taxes paid to certain states where the Company owns real estate properties were zero for the three months ended September 30, 2019 and 2018, respectively. Net worth and similar taxes paid to certain states where the Company owns real estate properties were $24 and $23 for the nine months ended September 30, 2019 and 2018, respectively.
RREEF PROPERTY TRUST, INC.
NOTES TO CONSOLIDATED FINANCIAL STATEMENTS - continued
September 30, 2019
(Unaudited)
(in thousands, except share and per share data)
NOTE 13 — SEGMENT INFORMATION
For the nine months ended September 30, 2019 and 2018, the Company had two segments with reportable information: Real Estate Properties and Real Estate Equity Securities. The Company organizes and analyzes the operations and results of each of these segments independently, due to inherently different considerations for each segment. Such considerations include, but are not limited to, the nature and characteristics of the investment and investment strategies and objectives. The following tables set forth the carrying value, revenue and the components of operating income of the Company's segments reconciled to total assets as of September 30, 2019 and December 31, 2018 and net income (loss) for the three and nine months ended September 30, 2019 and 2018.
|
| | | | | | | | | | | | |
| | | Real Estate Properties | | Real Estate Equity Securities | | Total |
| Carrying value as of September 30, 2019 | $ | 251,465 |
| | $ | 19,247 |
| | $ | 270,712 |
|
| | | | | | | |
| Reconciliation to total assets of September 30, 2019 | | | | |
| | Carrying value per reportable segments | | | | | $ | 270,712 |
|
| | Corporate level assets | | | | | 11,012 |
|
| | Total assets | | | | | $ | 281,724 |
|
| | | | | | | |
| Carrying value as of December 31, 2018 | $ | 202,257 |
| | $ | 14,735 |
| | $ | 216,992 |
|
| | | | | | | |
| Reconciliation to total assets of December 31, 2018 | | | | |
| | Carrying value per reportable segments | | | | | $ | 216,992 |
|
| | Corporate level assets | | | | | 9,207 |
|
| | Total assets | | | | | $ | 226,199 |
|
RREEF PROPERTY TRUST, INC.
NOTES TO CONSOLIDATED FINANCIAL STATEMENTS - continued
September 30, 2019
(Unaudited)
(in thousands, except share and per share data)
|
| | | | | | | | | | | |
| Three Months Ended September 30, 2019 | Real Estate Properties |
| Real Estate Equity Securities |
| Total |
| Property related income | $ | 5,787 |
| | $ | — |
| | $ | 5,787 |
|
| Investment income on marketable securities | — |
| | 158 |
| | 158 |
|
| Total revenues | 5,787 |
| | 158 |
| | 5,945 |
|
| Segment operating expenses | 1,830 |
| | 11 |
| | 1,841 |
|
| Net realized gain upon sale of marketable securities | — |
| | 274 |
| | 274 |
|
| Net unrealized change in fair value of investment in marketable securities | — |
| | 1,254 |
| | 1,254 |
|
| Operating income - segments | $ | 3,957 |
| | $ | 1,675 |
| | $ | 5,632 |
|
| | | | | | |
| Three Months Ended September 30, 2018 | | | | | |
| Property related income | $ | 4,991 |
| | $ | — |
| | $ | 4,991 |
|
| Investment income on marketable securities | — |
| | 137 |
| | 137 |
|
| Total revenues | 4,991 |
| | 137 |
| | 5,128 |
|
| Segment operating expenses | 1,598 |
| | 14 |
| | 1,612 |
|
| Net realized gain upon sale of marketable securities | — |
| | 202 |
| | 202 |
|
| Net unrealized change in fair value of investment in marketable securities | — |
| | (201 | ) | | (201 | ) |
| Operating income - segments | $ | 3,393 |
| | $ | 124 |
| | $ | 3,517 |
|
| | | | | | |
| | | | Three Months Ended September 30, |
| Reconciliation to net income (loss) | | | 2019 | | 2018 |
| Operating income - segments |
| | $ | 5,632 |
| | $ | 3,517 |
|
| General and administrative expenses | | | (459 | ) | | (421 | ) |
| Advisory expenses | | | (1,014 | ) | | (542 | ) |
| Depreciation | | | (1,342 | ) | | (1,163 | ) |
| Amortization | | | (1,128 | ) | | (1,125 | ) |
| Operating income | | | 1,689 |
| | 266 |
|
| Interest expense | | | (1,138 | ) | | (1,014 | ) |
| Net income (loss) | | | $ | 551 |
| | $ | (748 | ) |
RREEF PROPERTY TRUST, INC.
NOTES TO CONSOLIDATED FINANCIAL STATEMENTS - continued
September 30, 2019
(Unaudited)
(in thousands, except share and per share data)
|
| | | | | | | | | | | |
| Nine Months Ended September 30, 2019 | Real Estate Properties | | Real Estate Equity Securities | | Total |
| Property related income | $ | 17,113 |
| | $ | — |
| | $ | 17,113 |
|
| Investment income on marketable securities | — |
| | 459 |
| | 459 |
|
| Total revenues | 17,113 |
| | 459 |
| | 17,572 |
|
| Segment operating expenses | 5,435 |
| | 30 |
| | 5,465 |
|
| Net realized gain upon sale of marketable securities | — |
| | 539 |
| | 539 |
|
| Net unrealized change in fair value of investment in marketable securities | — |
| | 3,609 |
| | 3,609 |
|
| Operating income - segments | $ | 11,678 |
| | $ | 4,577 |
| | $ | 16,255 |
|
| | | | | | |
| Nine Months Ended September 30, 2018 | | | | | |
| Property related income | $ | 13,877 |
| | $ | — |
| | $ | 13,877 |
|
| Investment income on marketable securities | — |
| | 346 |
| | 346 |
|
| Total revenues | 13,877 |
| | 346 |
| | 14,223 |
|
| Segment operating expenses | 4,347 |
| | 37 |
| | 4,384 |
|
| Net realized loss upon sale of marketable securities | — |
| | (206 | ) | | (206 | ) |
| Net unrealized change in fair value of investment in marketable securities | — |
| | 279 |
| | 279 |
|
| Operating income - segments | $ | 9,530 |
| | $ | 382 |
| | $ | 9,912 |
|
| | | | | | |
| | | | Nine Months Ended September 30, |
| Reconciliation to net income (loss) | | | 2019 | | 2018 |
| Operating income - segments | | | $ | 16,255 |
| | $ | 9,912 |
|
| General and administrative expenses | | | (1,480 | ) | | (1,405 | ) |
| Advisory expenses | | | (1,946 | ) | | (1,211 | ) |
| Depreciation | | | (3,988 | ) | | (3,326 | ) |
| Amortization | | | (3,428 | ) | | (2,938 | ) |
| Operating income | | | 5,413 |
| | 1,032 |
|
| Interest expense | | | (3,627 | ) | | (2,802 | ) |
| Net income (loss) | | | $ | 1,786 |
| | $ | (1,770 | ) |
NOTE 14 — ECONOMIC DEPENDENCY
The Company depends on RREEF America and the Dealer Manager for certain services that are essential to the Company, including the sale of the Company's shares of common stock, asset acquisition and disposition decisions and other general and administrative responsibilities. In the event that RREEF America or the Dealer Manager is unable to provide such services, the Company would be required to find alternative service providers.
RREEF PROPERTY TRUST, INC.
NOTES TO CONSOLIDATED FINANCIAL STATEMENTS - continued
September 30, 2019
(Unaudited)
(in thousands, except share and per share data)
NOTE 15 — COMMITMENTS AND CONTINGENCIES
In the normal course of business, from time to time, the Company may be involved in legal actions relating to the ownership and operations of real estate investments. In the Company's opinion, the liabilities, if any, that may ultimately result from such legal actions are not expected to have a material adverse effect on the Company's consolidated financial position, results of operations or liquidity.
The Company, as an owner of real estate, is subject to various environmental laws of federal and local governments. All of the Company's properties were subject to assessments, involving visual inspections of the properties and their neighborhoods. The Company carries environmental liability insurance on its properties that provides coverage for remediation liability and pollution liability for third-party bodily injury and property damage claims. The Company does not believe such environmental assessments will have a material adverse impact on the Company's consolidated financial position or results of operations in the future.
NOTE 16 — SUBSEQUENT EVENTS
On October 2, 2019, the Company disclosed that its board of directors declared a daily cash distribution equal to $0.00198517 per share of common stock (before adjustment for applicable class-specific fees) for all such shares of record on each day from October 1, 2019 through December 31, 2019. As of October 1, 2019, there were no Class N Shares outstanding.
On November 12, 2019, the board of directors of the Company, including a majority of the independent directors, approved the renewal of the Advisory Agreement by and among the Company, the Operating Partnership and RREEF America effective as of January 20, 2020 for an additional one-year term expiring January 20, 2021. The terms of the Advisory Agreement otherwise remain unchanged.
On November 13, 2019, we entered into a first amendment to our Wells Fargo line of credit agreement (the "Amendment"). The Amendment makes the following two changes to our Wells Fargo line of credit, both of which took effect on November 13, 2019: (1) for purposes of determining our maximum borrowing capacity, reduced the minimum debt yield from 10% to 9%; and (2) sets the maximum borrowing capacity of our Wells Fargo line of credit to $86,000 until the earlier of (a) (i) December 2, 2019, provided that our tenant at our Loudoun Gateway property has not exercised its option to terminate its lease, or (ii) the date that we provide Wells Fargo evidence that our tenant at our Loudoun Gateway property has elected not to exercise its option to terminate its lease; and (b) in the event that our tenant at our Loudoun Gateway property has validly exercised its option to terminate its lease, the date that we have paid the applicable minimum repayment amount to Wells Fargo as defined in the Wells Fargo line of credit agreement. Further, after the earlier of (a) and (b) under clause (2) above, our maximum borrowing capacity shall be determined in accordance with the terms of the Wells Fargo line of credit agreement.
ITEM 2. MANAGEMENT'S DISCUSSION AND ANALYSIS OF FINANCIAL CONDITION AND RESULTS OF OPERATIONS
The following discussion and analysis of our financial condition and results of operations should be read in conjunction with our unaudited consolidated financial statements, the notes thereto and the other unaudited financial data included in this Quarterly Report on Form 10-Q, or this Quarterly Report. The following discussion should also be read in conjunction with our audited consolidated financial statements and the notes thereto, included in our Annual Report on Form 10-K for the year ended December 31, 2018. We further invite you to visit our website, www.rreefpropertytrust.com, where we routinely post additional information about our Company, such as, without limitation, our daily net asset value, or NAV, per share. The contents of our website are not incorporated by reference. The terms “we,” “us,” “our” and the “Company” refer to RREEF Property Trust, Inc. and its subsidiaries.
The NAV per share is published daily via NASDAQ's Mutual Fund Quotation System under the symbols ZRPTAX, ZRPTIX and ZRPTTX for our Class A shares, Class I shares and Class T shares, respectively.
All dollar amounts included in this Quarterly Report on Form 10-Q are presented in thousands, except for per share data.
Forward-Looking Statements
Certain statements contained in this Quarterly Report on Form 10-Q, other than historical facts, may be considered forward-looking statements within the meaning of Section 27A of the Securities Act of 1933, as amended, or the Securities Act, or Section 21E of the Securities Exchange Act of 1934, as amended, or the Exchange Act. We intend for all such forward-looking statements to be covered by the safe harbor provisions for forward-looking statements contained in Section 27A of the Securities Act and Section 21E of the Exchange Act, as applicable by law. Such statements include, in particular, statements about our plans, strategies and prospects and are subject to certain risks and uncertainties, as well as known and unknown risks, which could cause actual results to differ materially from those projected or anticipated. Therefore, such statements are not intended to be a guaranty of our performance in future periods. Such forward-looking statements can generally be identified by our use of forward-looking terminology such as “may,” “will,” “would,” “could,” “should,” “expect,” “intend,” “anticipate,” “estimate,” “believe,” “continue,” “plan,” “potential,” “predict” or other similar words.
The forward-looking statements included herein are based upon our current expectations, plans, estimates, assumptions and beliefs that involve numerous risks and uncertainties. Assumptions relating to the foregoing involve judgments with respect to, among other things, future economic, competitive and market conditions and future business decisions, all of which are difficult or impossible to predict accurately and many of which are beyond our control. Although we believe that the expectations reflected in such forward-looking statements are based on reasonable assumptions, our actual results and performance could differ materially from those set forth in the forward-looking statements. Factors which could have a material adverse effect on our operations and future prospects include, but are not limited to:
| |
| • | our ability to raise capital and effectively deploy the proceeds; |
| |
| • | changes in economic conditions generally and the real estate and securities markets specifically; |
| |
| • | legislative or regulatory changes (including changes to the laws governing the taxation of REITs); |
| |
| • | the effect of financial leverage, including changes in interest rates, availability of credit, loss of flexibility due to negative and affirmative covenants, refinancing risk at maturity and generally the increased risk of loss if our investments fail to perform as expected; |
| |
| • | our ability to access sources of liquidity when we have the need to fund redemptions of common stock in excess of the proceeds from the sales of shares of our common stock in our continuous offering and the consequential risk that we may not have the resources to satisfy redemption requests; and |
| |
| • | changes to accounting principles generally accepted in the United States of America, or GAAP. |
Forward-looking statements that were true at the time made may ultimately prove to be incorrect or false. We caution readers not to place undue reliance on forward-looking statements, which reflect our management’s view
only as of the date this Quarterly Report on Form 10-Q is filed with the Securities and Exchange Commission, or the SEC. We make no representation or warranty (express or implied) about the accuracy of any such forward-looking statements contained in this Quarterly Report on Form 10-Q. Additionally, we undertake no obligation to update or revise forward-looking statements to reflect changed assumptions, the occurrence of unanticipated events or changes to future operating results. The forward-looking statements should be read in light of the risk factors identified in “Risk Factors” of this Quarterly Report on Form 10-Q and our Annual Report on Form 10-K for the year ended December 31, 2018.
Overview
We are a Maryland corporation formed on February 7, 2012, our inception date, to invest in a diversified portfolio of high quality, income-producing commercial real estate properties and other real estate-related assets. We are an externally advised, perpetual-life corporation that believes that it has operated in such a manner to qualify to be taxed as a REIT for federal income tax purposes beginning with the taxable year ended December 31, 2013, when we first elected REIT status. We invest primarily in the office, industrial, retail and apartment sectors of the commercial real estate industry in the United States. We may also invest in real estate-related assets, which include common and preferred stock of publicly-traded REITs and other real estate companies, which we refer to as “real estate equity securities,” and debt investments backed by real estate, which we refer to as “real estate loans.” We hold our properties, real estate-related assets and other investments through RREEF Property Operating Partnership, LP, or our operating partnership, of which we are the sole general partner.
Our board of directors will at all times have ultimate oversight and policy-making authority over us, including responsibility for governance, financial controls, compliance and disclosure. Pursuant to our advisory agreement, our board has delegated to RREEF America L.L.C., or our advisor, authority to manage our day-to-day business in accordance with our investment objectives, strategy, guidelines, policies and limitations. Our advisory agreement is renewable annually upon approval by our board of directors, including a majority of the independent board members. The current term expires January 20, 2021.
Our initial public offering commenced on January 3, 2013, pursuant to our Registration Statement on Form S-11 (File No. 333-180356) under which we offered up to $2,500,000 of shares of our common stock in any combination of Class A and Class I shares, which we refer to as the initial offering. On May 30, 2013, upon receipt of purchase orders from our sponsor for $10,000 of Class I shares of our common stock and the release to us of funds in the escrow account, we commenced operations. Our initial offering terminated on July 1, 2016. We raised a total of $102,831 in proceeds from our initial offering.
On January 15, 2016, we filed articles supplementary to our articles of incorporation to add a newly-designated Class D common stock, $0.01 par value per share, or our Class D shares. On January 20, 2016, we commenced a private offering of up to a maximum of $350,000 in Class D shares.
On July 12, 2016, the SEC declared effective our Registration Statement on Form S-11 (File No. 333-208751) for our follow-on public offering for up to $2,300,000 of shares of our common stock in any combination of our Class A, Class I, Class T and Class N shares, which we refer to as our follow-on offering. Our follow-on offering includes up to $2,100,000 in shares in our primary offering and up to $200,000 in shares in our distribution reinvestment plan. Class T shares contain a conversion feature whereby upon the occurrence of a specified event (generally related to a Class T stockholder's account having incurred a maximum of 8.5% of underwriting compensation), Class T shares owned in a stockholder's account will automatically convert to Class N shares.
We have engaged DWS Distributors, Inc., an affiliate of our advisor, to serve as our dealer manager for our follow-on offering pursuant to our dealer manager agreement. Our initial offering and our follow-on offering are each referred to as an offering.
On June 28, 2019, we filed a registration statement on Form S-11 (File No. 333-232425) for our second follow-on offering. This registration statement is not yet effective.
Portfolio Information
Real Estate Property Portfolio
As of September 30, 2019, we owned 13 properties diversified across geography and sector, including one medical office property and one student housing property (a subset of apartment). Excluding The Flats at Carrs Hill, our apartment property with leases that roll over every year, as of September 30, 2019, our weighted average remaining lease term for active leases was 5.0 years. The following table sets forth certain additional information about the properties we owned as of September 30, 2019:
|
| | | | | | | | | | | |
| Property | | Location | | Rentable Square Feet | | Number of Leases/Units | | Leased(1) |
| Office Property | | | | | | | | |
| Heritage Parkway | | Woodridge, IL | | 94,233 |
| | 1 |
| | 100.0 | % |
| Anaheim Hills Office Plaza | | Anaheim, CA | | 73,892 |
| | 5 |
| | 69.2 |
|
| Loudoun Gateway | | Sterling, VA | | 102,015 |
| | 1 |
| | 100.0 |
|
| Allied Drive | | Dedham, MA | | 64,127 |
| | 3 |
| | 100.0 |
|
| Office Total | | | | 334,267 |
| | 10 |
| | 90.9 |
|
| Retail Property | | | | | | | | |
Wallingford Plaza(2) | | Seattle, WA | | 30,761 |
| | 5 |
| | 100.0 |
|
| Terra Nova Plaza | | Chula Vista, CA | | 96,114 |
| | 2 |
| | 100.0 |
|
Elston Plaza(3) | | Chicago, IL | | 92,806 |
| | 11 |
| | 95.5 |
|
Providence Square(4) | | Marietta, GA | | 222,805 |
| | 26 |
| | 100.0 |
|
| Retail Total | | | | 442,486 |
| | 44 |
| | 98.9 |
|
| Industrial Property | | | | | | | | |
| Commerce Corner | | Logan Township, NJ | | 259,910 |
| | 2 |
| | 100.0 |
|
| Miami Industrial | | | | | | | | |
| Palmetto Lakes | | Miami Lakes, FL | | 182,919 |
| | 1 |
| | 100.0 |
|
| Hialeah I | | Miami, FL | | 57,000 |
| | 1 |
| | 100.0 |
|
| Hialeah II | | Miami, FL | | 50,000 |
| | 1 |
| | 100.0 |
|
| Industrial Total | | | | 549,829 |
| | 5 |
| | 100.0 |
|
| Apartment Property | | | | | | | | |
| The Flats at Carrs Hill | | Athens, GA | | 135,864 |
| | 138 |
| | 100.0 |
|
| Apartment Total | | | | 135,864 |
| | 138 |
| | 100.0 |
|
| Grand total | | | | 1,462,446 |
| | 59/138 |
| | 97.3 | % |
(1) Leased percentage is based on executed leases as of September 30, 2019, is calculated based on square footage for a single property, and is weighted by relative property value when calculated for more than one property together.
(2) Wallingford Plaza is ground floor retail plus two floors of office space. The retail portion comprises the majority of the rental revenue for the property.
(3) The total square footage for Elston Plaza includes a freestanding bank branch of 4,860 square feet that is subject to a ground lease to a single tenant.
(4) The total square footage for Providence Square includes a freestanding restaurant of 5,779 square feet that is subject to a ground lease to a single tenant.
Real Estate Equity Securities Portfolio
As of September 30, 2019, our real estate equity securities portfolio consisted of publicly-traded common stock of 37 REITs with a value of $19,247. We believe that investing a portion of our proceeds from our offerings into a diversified portfolio of common and preferred shares of REITs and other real estate operating companies will provide the overall portfolio some flexibility with near-term liquidity as well as potentially enhance our NAV over a longer period. The portfolio is regularly reviewed and evaluated to determine whether the marketable securities held at any time continue to serve their original intended purposes.
The following chart summarizes our marketable securities by property type as of September 30, 2019:
As of September 30, 2019, our top ten holdings in our real estate equity securities portfolio were as follows:
|
| | | |
| Security | | Percent of Securities Portfolio |
| Equinix, Inc. | | 8.0 | % |
| Prologis, Inc. | | 6.9 |
|
| Welltower, Inc. | | 5.5 |
|
| Equity Residential | | 5.2 |
|
| Extra Space Storage, Inc. | | 4.8 |
|
| Alexandria Real Estate Equities, Inc. | | 4.2 |
|
| Simon Property Group, Inc. | | 4.0 |
|
| Mid-America Apartment Communities, Inc. | | 3.9 |
|
| Invitation Homes, Inc. | | 3.8 |
|
| HCP, Inc. | | 3.7 |
|
| Total | | 50.0 | % |
Market Outlook
We believe this has been a pivotal year for U.S. real estate. On the surface, not much changed: according to the National Council of Real Estate Investment Fiduciaries (“NCREIF”) in September 2019, total returns of 6.2% for the trailing four quarters ended September 30, 2019 were within the 6%-7% range that has prevailed since mid-2017. Fundamentals were stalwart, with NCREIF reporting in September 2019 that vacancies were holding near a 30-year low with net operating income (“NOI”) increasing 5% year-over-year based on a four-quarter moving average as of September 30, 2019. Yet, we believe favorable topline numbers masked sharp disparities: the gap between the best- and worst-performing sectors (industrial and retail, respectively) reached its widest level in 25 years, according to NCREIF in September 2019. NCREIF reporting in September 2019 further indicates that divergence was also notable across subsectors (e.g., garden and high-rise apartments) and geographies (e.g., San Francisco and New York).
We believe that real estate performance will remain buoyant and may even pick up somewhat over the next 12 months. Although trade disputes appear to have weighed on exports and business investment (25% of Gross Domestic Product, as reported by the Bureau of Economic Analysis in September 2019), we believe low unemployment and interest rates should underpin housing and consumer spending (70% of Gross Domestic Product, as reported by the Bureau of Economic Analysis in September 2019), sustaining occupational demand for real estate. Meanwhile, in our view construction should continue to gradually unwind from its moderate 2017 peak, according to CBRE Economic Analysis in September 2019. We therefore expect that vacancy rates will remain historically low, promoting sturdy NOI growth. Low interest rates may also attract additional capital into real estate from various sources, including levered private investors and yield-seeking institutions, fueling increased transaction activity and price appreciation.
In our view, the drop in interest rates that has helped to buffer our near-term outlook is also symptomatic of medium-term risks. While the yield curve recently steepened, as reported by the Federal Reserve, which is typical in the later stages of a cycle when the Federal Reserve loosens policy, if history is a guide, we believe the yield curve’s inversion through the summer raises the specter of a recession in one to two years. We believe a recession would lower property demand. Yet relative to past cycles, and indeed many investment alternatives, we feel that U.S. real estate appears well positioned to withstand adverse economic pressures thanks to a moderate supply pipeline (CBRE Economic Analysis, September 2019), reasonable valuations relative to interest rates (NCREIF, September 2019), and manageable debt burdens (Federal Reserve, September 2019).
In the near term, capital infusions stemming from low interest rates might temporarily suppress divergent performance trends. However, when the liquidity ebbs, disparities will ultimately reassert themselves, we believe, favoring property with robust underlying structural, rather than cyclical, drivers. This includes the industrial sector (supported by e-commerce) as well as technology- and growth-oriented markets.
Results of Operations
Through September 30, 2019, we have acquired 13 properties and invested in real estate equity securities as described above under "Portfolio Information." We expect to continue to raise additional capital, increase our borrowings and make future investments in our targeted segments of real estate properties, real estate equity securities and real estate loans, which we believe will have a significant impact on our future results of operations.
We review our stabilized operating results, measured by contractual rental revenue, including tenant reimbursement income, less property operating expenses, which we refer to as net operating income, for properties that we owned for the entirety of both the current and prior year reporting periods, which we refer to as “same-store” properties. We believe that net operating income, a non-GAAP financial measure, in combination with net income (loss) and cash flows from operating activities, as defined by GAAP, is a useful supplemental performance measure that helps us evaluate our operating performance. We believe this metric is useful to our stockholders and other users of our reports because it provides additional information regarding our property acquisitions and their impact on our portfolio. Net operating income should not be considered as an alternative to net income (loss) or to cash flows from
operating activities (both as defined by GAAP) as an indication of our performance and is not intended to be used as a liquidity measure indicative of cash flow available to fund our cash needs, including our ability to make distributions to our stockholders. No single measure can provide users of financial information with sufficient information, and only our disclosures read as a whole can be relied upon to adequately portray our financial position, liquidity and results of operations.
Three and Nine Months Ended September 30, 2019 and 2018
The following table illustrates the changes in lease revenue, property operating expenses, and net operating income for the three and nine months ended September 30, 2019 and 2018. "Non-same-store," as reflected in the table below, includes properties acquired after January 1, 2018, which for the three and nine months ended September 30, 2019 and 2018 are Miami Industrial, Elston Plaza and Providence Square. For purposes of comparative analysis, the table below reconciles the net operating income to net income (loss) determined in accordance with GAAP for the three and nine months ended September 30, 2019 and 2018.
|
| | | | | | | | | | | | | | | | | | | | | | | |
| | Three Months Ended September 30, | | | | Nine Months Ended September 30, | | |
| | 2019 | | 2018 | | Change | | 2019 | | 2018 | | Change |
| Lease revenue | | | | | | | | | | | |
| Lease revenue - same-store portfolio | $ | 4,224 |
| | $ | 4,293 |
| | $ | (69 | ) | | 12,482 |
| | 13,399 |
| | (917 | ) |
| Lease revenue - non-same-store portfolio | 1,189 |
| | 375 |
| | 814 |
| | 3,497 |
| | 375 |
| | 3,122 |
|
| Total lease revenue | 5,413 |
| | 4,668 |
| | 745 |
| | 15,979 |
| | 13,774 |
| | 2,205 |
|
| | | | | | | | | | | | |
| Property operating expenses | | | | | | | | | | | |
| Same-store portfolio | 1,482 |
| | 1,486 |
| | (4 | ) | | 4,228 |
| | 4,236 |
| | (8 | ) |
| Non-same-store portfolio | 348 |
| | 112 |
| | 236 |
| | 1,207 |
| | 111 |
| | 1,096 |
|
| Total property operating expenses | 1,830 |
| | 1,598 |
| | 232 |
| | 5,435 |
| | 4,347 |
| | 1,088 |
|
| | | | | | | | | | | | |
| Net operating income | | | | | | | | | | | |
| Same-store portfolio | 2,742 |
| | 2,807 |
| | (65 | ) | | 8,254 |
| | 9,163 |
| | (909 | ) |
| Non-same-store portfolio | 841 |
| | 263 |
| | 578 |
| | 2,290 |
| | 264 |
| | 2,026 |
|
| Total net operating income | 3,583 |
| | 3,070 |
| | 513 |
| | 10,544 |
| | 9,427 |
| | 1,117 |
|
| | | | | | | | | | | | |
| Adjustments to lease revenue | | | | | | | | | | | |
| Straight-line revenue | 207 |
| | 258 |
| | (51 | ) | | 628 |
| | (53 | ) | | 681 |
|
| Above- and below-market lease amortization, net | 193 |
| | 91 |
| | 102 |
| | 583 |
| | 233 |
| | 350 |
|
| Lease incentive amortization | (26 | ) | | (26 | ) | | — |
| | (77 | ) | | (77 | ) | | — |
|
| Depreciation | (1,342 | ) | | (1,163 | ) | | (179 | ) | | (3,988 | ) | | (3,326 | ) | | (662 | ) |
| Amortization | (1,128 | ) | | (1,125 | ) | | (3 | ) | | (3,428 | ) | | (2,938 | ) | | (490 | ) |
| General and administrative expenses | (470 | ) | | (435 | ) | | (35 | ) | | (1,510 | ) | | (1,442 | ) | | (68 | ) |
| Advisory fees | (1,014 | ) | | (542 | ) | | (472 | ) | | (1,946 | ) | | (1,211 | ) | | (735 | ) |
| Interest expense | (1,138 | ) | | (1,014 | ) | | (124 | ) | | (3,627 | ) | | (2,802 | ) | | (825 | ) |
| | | | | | | | | | | | |
| Marketable securities | | | | | | | | | | | |
| Investment income on marketable securities | 158 |
| | 137 |
| | 21 |
| | 459 |
| | 346 |
| | 113 |
|
| Net realized gain (loss) on marketable securities | 274 |
| | 202 |
| | 72 |
| | 539 |
| | (206 | ) | | 745 |
|
| Net unrealized change in fair value of marketable securities | 1,254 |
| | (201 | ) | | 1,455 |
| | 3,609 |
| | 279 |
| | 3,330 |
|
| Net income (loss) | $ | 551 |
| | $ | (748 | ) | | $ | 1,299 |
| | $ | 1,786 |
| | $ | (1,770 | ) | | $ | 3,556 |
|
Property Operations
Our total lease revenue and total property operating expenses for the three and nine months ended September 30, 2019 increased compared to those from the same periods in 2018 primarily due to the acquisition of Miami
Industrial and Elston Plaza during the year ended December 31, 2018, and the acquisition of Providence Square in September 2019. Our total same-store net operating income for the three and nine months ended September 30, 2019 and 2018 reflects eight of the 13 properties in the portfolio. Lease revenue for the nine months ended September 30, 2019 decreased from the same period in 2018 primarily due to one-time income of $742 related to the modification of the lease with Gateway One Lending and Finance at Anaheim Hills Office Plaza. The $742 was collected in February 2018 but was recognized under GAAP on a straight-line basis over the remaining lease term of 13 months from January 2018 through January 2019. In this modification, Gateway One Lending and Finance reduced their occupied space from 50,000 square feet to 25,000 square feet. The lease with Gateway One Lending and Finance naturally expired on January 31, 2019, additionally contributing to lower lease revenue in the 2019 period compared to the 2018 period. Lease revenue for the three months ended September 30, 2019 decreased from the same period in 2018 due to vacancy at Anaheim Hills Office Plaza. Two new leases have commenced at this property, both of which were in a free rent period during third quarter of 2019. The decreases in same-store lease revenues during the 2019 periods referred to above were partially offset by higher lease revenues from certain leases renewed at higher rental rates as well as leases with contractually stepped up rents.
Same-store property operating expenses for the three and nine months ended September 30, 2019 decreased slightly from the same periods in 2018 primarily due to decreased utilities at Allied Drive and Loudoun Gateway, and decreased third party management fees at Anaheim Hills Office Plaza.
Straight-Line Revenue
The change in straight-line revenue for the three and nine months ended September 30, 2019 compared to the 2018 period was due to the aforementioned $742 of lease modification income received from Gateway One Lending and Finance in February 2018 which was recognized on a straight-line basis over the remaining lease term of 13 months from January 2018 through January 2019. For the three months ended September 30, 2019, the decrease was partially offset by additional straight-line revenue from the acquisitions of Miami Industrial and Elston Plaza during the year ended December 31, 2018 and Providence Square in September 2019.
Lease Intangible Amortization
During the three and nine months ended September 30, 2019, the net amount of above- and below-market lease amortization is higher than the same period in 2018 primarily due to the acquisitions of Miami Industrial, Elston Plaza and Providence Square. Lease incentive amortization represents amortization of the lease incentive paid to Dick's Sporting Goods, Inc. at Terra Nova Plaza, which is being amortized over the approximate 10-year term of that lease.
Depreciation and Amortization
The depreciation and amortization on properties increased in the 2019 period as a result of the acquisitions of Miami Industrial, Elston Plaza and Providence Square.
General and Administrative
Our general and administrative expenses include a variety of corporate expenses, the largest of which were directors and officers insurance, audit fees, legal fees and independent director compensation. The amount for the nine months ended September 30, 2019 increased from the same period in 2018 primarily due to the grant of Class I shares to our independent directors, a portion of which vested immediately upon grant, resulting in share-based compensation expense of $120 for the nine months ended September 30, 2019. This increase was partially offset by decreases in audit fees, professional fees and travel costs. For the three months ended September 30, 2019, the increase from the same period in 2018 is due to higher legal fees, higher appraisal fees, and independent director share-based compensation.
Advisory Fees
The fixed component of the advisory fee pursuant to the advisory agreement is equal to 1% per annum of the NAV for each share class and is calculated and accrued daily and reflected in our NAV per share. For the three and nine months ended September 30, 2019 and 2018, the advisory fee was comprised of fixed and performance components. The fixed component of the advisory fee was higher in the 2019 period compared to the 2018 period which is commensurate with the overall increase in our NAV, as we continue to raise and invest capital.
In accordance with our advisory agreement, our advisor can earn the performance component of the advisory fee when the total return to stockholders exceeds a required 6% per annum hurdle. The performance component is calculated separately for each share class and is comprised of the distributions paid to stockholders in each share class combined with the change in price of each share class. For any calendar year in which the total return per share allocable to a class exceeds 6% per annum (the “Hurdle Amount”), RREEF America will receive up to 10% of the aggregate total return allocable to such class with a Catch-Up (defined below) calculated as follows: first, if the total return for the applicable period exceeds the Hurdle Amount, 25% of such total return in excess of the Hurdle Amount (the “Excess Profits”) until the total return reaches 10% (commonly referred to as a “Catch-Up”); and second, to the extent there are remaining Excess Profits, 10% of such remaining Excess Profits. The performance component of the advisory fee is payable annually based on the results for the entire calendar year. The actual performance component that our advisor could earn in the current calendar year depends on several factors, including but not limited to the performance of our investments, our expenses and interest rates. For the three and nine months ended September 30, 2019 and 2018, the total return of each share class exceeded the required 6% per annum hurdle, applied on a pro rata basis as applicable. We accrued a performance component of $550 and $700 for the three and nine months ended September 30, 2019, respectively, and $210 and $300 for the three and nine months ended September 30, 2018, respectively.
Interest Expense
The increase in interest expense for the three and nine months ended September 30, 2019 over the same periods in 2018 was primarily due to a greater weighted average outstanding aggregate balance on our fixed rate loans. We originated a $6,950 loan on Wallingford Plaza with a fixed interest rate of 4.56% in December 2018, a $17,600 loan on Elston Plaza with a fixed interest rate of 3.89% in June 2019, and a $29,700 loan on Providence Square with a fixed interest rate of 3.67% in September 2019. As a result, the weighted average outstanding aggregate balance and interest rate on all of our loan obligations was $108,639 at 3.92% and $91,938 at 3.50% for the nine months ended September 30, 2019 and 2018, respectively. An increase in the 1-month LIBOR resulted in our all-in interest rate on our Wells Fargo line of credit averaging 4.0% and 3.5% for the nine months ended September 30, 2019 and 2018, respectively, contributing to the increase in our overall weighted average interest rate for the two periods.
For the three months ended September 30, 2019 and 2018, the increase in our fixed rate loans as noted above was partially offset by a decrease in our weighted average outstanding balance on our line of credit. As a result of the aforementioned activities, our outstanding loan balance as of September 30, 2019 consisted of 61% fixed rate loans and 39% floating rate loans.
The overall increase in interest expense was partially offset by decreased amortization of loan financing costs. We expect our interest expense to increase in future periods because we anticipate acquiring additional properties with borrowings, including by utilizing additional property-specific debt as a form of permanent financing along with continuing to use our line of credit.
Marketable Securities
The increase in investment income for the three and nine months ended September 30, 2019 compared to the 2018 periods is primarily due to the larger investment basis as we made additional investments into our securities portfolio at various times during 2018. Our portfolio of investments in publicly-traded REIT securities is actively managed and thus is regularly adjusted by increasing and decreasing specific holdings primarily based upon changes in sector allocations and to a lesser degree based upon performance of specific securities. These continual portfolio refinements generate realized gains and losses by using the highest cost method whereby a sale of any particular security is first attributed to the shares of that security with the highest cost basis. Our marketable securities portfolio
exhibited strong performance during the first three quarters of 2019, riding the upward trend in the equities markets, supported by recent interest rate reductions by the Federal Reserve. As a result, our marketable securities portfolio has experienced net realized and unrealized gains for the three and nine months ended September 30, 2019.
Inflation
In our view, the real estate property sector has not been affected significantly by inflation in the past several years due to the relatively low inflation rate. With the exception of leases with tenants in apartment properties, we will seek to include provisions in our tenant leases designed to protect us from the impact of inflation. These provisions will include reimbursement billings for operating expense pass-through charges, real estate tax and insurance reimbursements, or in some cases, annual reimbursement of operating expenses above a certain allowance. Due to the generally long-term nature of these leases, annual rent increases may not be sufficient to cover inflation and rent may be below market. Leases in apartment properties generally turn over on an annual basis and do not typically present the same concerns regarding inflation protection due to their short-term nature.
NAV per Share
Our NAV per share is calculated in accordance with the valuation guidelines approved by our board of directors for the purposes of establishing a purchase price for our shares sold in our offerings as well as establishing a redemption price for our share repurchase plan. The following table provides a breakdown of the major components of our total NAV and NAV per share as of September 30, 2019:
|
| | | | | | | | | | | | | | | | | | | | |
| Components of NAV | | Total NAV | | Per Class A Share |
| Per Class I Share | | Per Class T Share | | Per Class D Share |
Investments in real estate (1) | | $ | 311,361 |
| | $ | 22.84 |
|
| $ | 23.02 |
|
| $ | 22.88 |
| | $ | 22.99 |
|
Investments in real estate equity securities (2) | | 19,247 |
| | 1.41 |
|
| 1.42 |
|
| 1.41 |
| | 1.42 |
|
| Other assets, net | | 6,401 |
| | 0.48 |
|
| 0.45 |
|
| 0.49 |
| | 0.47 |
|
| Line of credit | | (52,300 | ) | | (3.84 | ) |
| (3.87 | ) |
| (3.84 | ) | | (3.86 | ) |
| Mortgage loans payable | | (81,561 | ) | | (5.98 | ) |
| (6.03 | ) |
| (5.99 | ) | | (6.02 | ) |
| Other liabilities, net | | (6,441 | ) | | (0.48 | ) |
| (0.47 | ) |
| (0.48 | ) | | (0.48 | ) |
| Net asset value | | $ | 196,707 |
| | $ | 14.43 |
| | $ | 14.52 |
| | $ | 14.47 |
| | $ | 14.52 |
|
| Note: Class D shares were first issued on June 25, 2019. No Class N shares were outstanding as of September 30, 2019. |
| |
| (1) | The value of our investments in real estate was approximately 11.6% more than their historical cost. |
| |
| (2) | The value of our investments in real estate securities was approximately 23.8% more than their historical cost. |
The table below sets forth a reconciliation of our stockholders' equity to our NAV, which we calculate for the purpose of establishing the purchase and redemption price for our shares, as of September 30, 2019.
|
| | | | | | | | | | | | | | | | | | | |
| | Total NAV | | Per Class A Share |
| Per Class I Share |
| Per Class T Share | | Per Class D Share |
| Total stockholders' equity | $ | 115,438 |
| | $ | 8.48 |
| | $ | 8.51 |
| | $ | 8.50 |
| | $ | 8.49 |
|
| Plus: |
|
| |
| | | | | | |
| Unrealized gain on real estate investments | 32,472 |
| | 2.38 |
| | 2.40 |
| | 2.39 |
| | 2.40 |
|
| Accumulated depreciation | 20,181 |
| | 1.48 |
| | 1.49 |
| | 1.48 |
| | 1.49 |
|
| Accumulated amortization | 19,515 |
| | 1.43 |
| | 1.44 |
| | 1.43 |
| | 1.44 |
|
| Deferred costs and expenses, net | 11,865 |
| | 0.86 |
|
| 0.88 |
|
| 0.87 |
| | 0.90 |
|
| Less: |
| |
| |
| |
| | |
| Deferred rent receivable | (2,764 | ) | | (0.20 | ) |
| (0.20 | ) |
| (0.20 | ) | | (0.20 | ) |
| Net asset value | $ | 196,707 |
| | $ | 14.43 |
| | $ | 14.52 |
| | $ | 14.47 |
| | $ | 14.52 |
|
| Note: Class D shares were first issued on June 25, 2019. No Class N shares were outstanding as of September 30, 2019. |
With respect to the unrealized gain on real estate investments reflected above, as of September 30, 2019, all properties had been appraised by a third-party appraisal firm in addition to our independent valuation advisor. Set forth below are the weighted averages of the key assumptions used in the appraisals of the office, retail and industrial properties as of September 30, 2019. Once we own more than one property for the apartment property type, we will include the key assumptions for that property type.
|
| | | |
| | Discount Rate | | Exit Capitalization Rate |
| Office properties | 7.57% | | 6.92% |
| Retail properties | 6.50% | | 6.09% |
| Industrial properties | 6.20% | | 5.62% |
These assumptions are determined by our independent valuation advisor or by separate third-party appraisers. A change in these assumptions would impact the calculation of the value of our property investments. For example, assuming all other factors remain unchanged, an increase in the weighted-average discount rate used as of September 30, 2019 of 0.25% would yield decreases in the office, retail and industrial property investment values of 1.8%, 1.9% and 2.1%, respectively. Similarly, an increase in the weighted-average exit capitalization rate used as of September 30, 2019 of 0.25% would yield decreases in the office, retail and industrial property investment values of 2.0%, 2.4% and 2.9%, respectively.
The deferred costs and expenses of $11,865 includes amounts that are initially excluded from the NAV calculation. This includes $7,500 payable to our advisor, which is less than the total amount payable to our advisor as reflected on our consolidated balance sheet as of September 30, 2019, because (1) certain amounts payable to our advisor as of September 30, 2019 were recorded as assets and as such have no impact on our NAV as of September 30, 2019, and (2) the amount payable to our advisor as reflected in due to affiliates and note to affiliate on our consolidated balance sheet includes accrued advisory fees and other amounts due under the advisory agreement. The deferred amounts will be included in the NAV calculation as such costs are reimbursed to our advisor, in accordance with the advisory agreement, the expense support agreement and the ESA letter agreement dated April 25, 2016 amending the advisory agreement and expense support agreement (defined below). The deferred costs and expenses above additionally includes $5,326 in estimated trailing fees that will be deducted from the NAV on a daily basis as and when they become payable to DWS Distributors, Inc., or the dealer manager. Lastly, the deferred cost and expenses above is net of (1) the portion of the performance component of the advisory fee that is reflected in the NAV calculation but does not yet meet the threshold for accrual under GAAP, and (2) the difference in recognition of (i) certain offering costs and (ii) compensation costs related to the shares granted to our independent board members.
Limitations and Risks
As with any valuation methodology, our methodology is based upon a number of estimates and assumptions that may not be accurate or complete. Different parties with different assumptions and estimates could derive a different NAV per share. Accordingly, with respect to our NAV per share, we can provide no assurance that:
| |
| • | a stockholder would be able to realize this NAV per share upon attempting to resell his or her shares; |
| |
| • | we would be able to achieve, for our stockholders, the NAV per share, upon a listing of our shares of common stock on a national securities exchange, selling our real estate portfolio, or merging with another company; or |
| |
| • | the NAV per share, or the methodologies relied upon to estimate the NAV per share, will be found by any regulatory authority to comply with any regulatory requirements. |
Furthermore, the NAV per share was calculated as of a particular point in time. The NAV per share will fluctuate over time in response to, among other things, changes in real estate market fundamentals, capital markets activities, and attributes specific to the properties and leases within our portfolio.
Funds from Operations and Modified Funds from Operations
We believe that funds from operations, or FFO, FFO as adjusted and modified funds from operations, or MFFO, in combination with net income or loss and cash flows from operating activities, as defined by GAAP, are useful supplemental performance measures that we use to evaluate our operating performance. However, these supplemental, non-GAAP measures should not be considered as an alternative to net income or loss or to cash flows from operating activities, both as determined by GAAP, as an indication of our performance and are not intended to be used as a liquidity measure indicative of cash flow available to fund our cash needs, including our ability to make distributions to our stockholders. No single measure can provide users of financial information with sufficient information, and only our disclosures read as a whole can be relied upon to adequately portray our financial position, liquidity and results of operations. In addition, other REITs may define FFO and similar measures differently and thus choose to treat certain accounting line items in a manner different from us due to differences in investment and operating strategy or for other reasons.
As defined by the National Association of Real Estate Investment Trusts, or NAREIT, FFO is a non-GAAP supplemental financial performance measure that excludes certain items such as real estate-related depreciation and amortization and the impact of certain non-recurring items such as realized gains and losses on sales of real estate. We believe FFO is a meaningful supplemental financial performance measure of our operating performance that is useful to investors because depreciation and amortization in accordance with GAAP implicitly assume that the value of real estate assets diminishes predictably over time. Additionally, realized gains and losses on sales of real estate generally occur infrequently. As a result, excluding these items from FFO aids our analysis of our ongoing operations. We use FFO as an indication of our operating performance and as a guide to making decisions about future investments.
As defined by the Institute for Portfolio Alternatives, or IPA, MFFO is a non-GAAP supplemental financial performance measure used to assist us in evaluating our operating performance. We believe that MFFO is helpful as a measure of ongoing operating performance because it excludes costs that management considers more reflective of investing activities and other non-operating items included in FFO. Compared to FFO, MFFO additionally excludes items such as acquisition-related costs (if expensed in accordance with GAAP), non-cash amounts related to straight-line rent, amortization of above- and below-market lease intangibles and mark to market valuation adjustments on securities. In addition, there are certain other MFFO adjustments as defined by the IPA that are not applicable to us at this time and are not included in our presentation of MFFO. We believe that excluding acquisition costs from MFFO, if such costs were expensed in accordance with GAAP, provides investors with supplemental performance information that is consistent with our analysis of the operating performance of our portfolio over time, including periods after our acquisition stage.
Effective January 1, 2018, we adopted Financial Accounting Standards Board Accounting Standard Update 2016-01, Financial Statements - Overall (Subtopic 825-10) - Recognition and Measurement of Financial Assets and Financial Liabilities (ASU 2016-01), which revised the accounting related to the classification and measurement of investments in equity securities. Beginning January 1, 2018, under ASU 2016-01 the net unrealized change in the fair value of our investments in marketable securities for the period presented is recorded in earnings as part of operating income or loss. As a result, under the current NAREIT definition of FFO, the net unrealized change in the fair value of our investments in marketable securities is included in our FFO. Our investment objective with our investments in marketable securities is to generate consistent income while providing an opportunity for long term price appreciation. Additionally, we believe that investing a portion of our proceeds from our offerings into a diversified portfolio of common and preferred shares of REITs and other real estate operating companies will provide our overall investment portfolio some flexibility with near-term liquidity as well as potentially enhance our NAV over a longer period. The securities portfolio is regularly reviewed and evaluated to determine whether the marketable securities held at any time continue to serve their original intended purposes. In accordance with our objectives, it is our view that providing FFO as adjusted for the net unrealized change in the fair value of our securities portfolio will enhance an investor's understanding of the impact of our securities portfolio on our ongoing operations.
We use FFO, MFFO and FFO as adjusted, among other things: (i) to evaluate and compare the potential performance of the portfolio after the acquisition phase is complete, and (ii) as metrics in evaluating our ongoing distribution policy. We believe investors are best served if the information that is made available to them allows them to align their analyses and evaluation with these same performance metrics used by us in planning and executing our business strategy. We believe that these performance metrics will assist investors in evaluating the potential performance of the portfolio after the completion of the acquisition phase. However, these supplemental, non-GAAP measures are not necessarily indicative of future performance and should not be considered as an alternative to net income or loss or to cash flows from operating activities, both as determined by GAAP, and are not intended to be used as a liquidity measure indicative of cash flow available to fund our cash needs, including our ability to make distributions to our stockholders. Neither the SEC, NAREIT, nor any regulatory body has passed judgment on the acceptability of the adjustments used to calculate FFO as adjusted or MFFO. In the future, the SEC, NAREIT, or a regulatory body may decide to standardize the allowable adjustments across the non-listed REIT industry at which point we may adjust our calculation and characterization of FFO as adjusted or MFFO.
The following unaudited table presents a reconciliation of net income (loss) to FFO, FFO as adjusted, and MFFO.
|
| | | | | | | | | | | | | | | |
| | Three Months Ended September 30, | | Nine Months Ended September 30, |
| | 2019 | | 2018 | | 2019 | | 2018 |
| Net income (loss) | $ | 551 |
| | $ | (748 | ) | | $ | 1,786 |
| | $ | (1,770 | ) |
| | | | | | | | |
| Real estate related depreciation | 1,342 |
| | 1,163 |
| | 3,988 |
| | 3,326 |
|
| Real estate related amortization | 1,128 |
| | 1,125 |
| | 3,428 |
| | 2,938 |
|
| NAREIT defined FFO | 3,021 |
| | 1,540 |
| | 9,202 |
| | 4,494 |
|
| Net unrealized change in fair value of investments in marketable securities | (1,254 | ) | | 201 |
| | (3,609 | ) | | (279 | ) |
| FFO as adjusted | 1,767 |
| | 1,741 |
| | 5,593 |
| | 4,215 |
|
| | | | | | | | |
| Additional adjustments: | | | | | | | |
| Straight line rents, net | (207 | ) | | (258 | ) | | (628 | ) | | 53 |
|
| Amortization of above- and below-market lease intangibles, net | (193 | ) | | (91 | ) | | (583 | ) | | (233 | ) |
| Amortization of lease incentive | 26 |
|
| 26 |
| | 77 |
| | 77 |
|
| IPA defined MFFO | $ | 1,393 |
| | $ | 1,418 |
| | $ | 4,459 |
| | $ | 4,112 |
|
Liquidity and Capital Resources
Our primary needs for liquidity and capital resources are to fund our investments in accordance with our investment strategy and policies, make distributions to our stockholders, redeem shares of our common stock pursuant to our redemption plan, pay our offering and operating fees and expenses and pay interest on any outstanding indebtedness.
Over time, we generally intend to fund our cash needs for items, other than asset acquisitions and material capital improvements, from operations. Our cash needs for acquisitions and material capital improvements will be funded primarily from the sale of shares of our common stock in our offerings, and the amount we may raise in such offerings is uncertain. We intend to contribute any additional net proceeds from our offerings that are not used or retained to pay the fees and expenses attributable to our operations to our operating partnership.
We may also satisfy our cash needs for acquisitions and material capital improvements through the assumption or incurrence of debt. On February 27, 2018, we entered into an amended and restated secured revolving line of credit with Wells Fargo Bank, National Association. The Wells Fargo line of credit has a three-year term with two one-year extension options exercisable by us upon satisfaction of certain conditions and payment of applicable extension fees. The first extension option becomes exercisable in November 2020. The interest rate under the Wells Fargo line of credit is based on the 1-month LIBOR with a spread of 160 to 180 basis points depending on the debt yield as defined in the agreement. The Wells Fargo line of credit has a current maximum capacity of $100,000, and we have the option to expand the Wells Fargo line of credit up to a maximum capacity of $200,000 upon satisfaction of specified conditions. Each requested expansion must be for at least $25,000 and may result in the Wells Fargo line of credit being syndicated.
The Wells Fargo line of credit has as co-borrowers certain of the wholly-owned subsidiaries of our operating partnership, with the Company serving as the guarantor. At any time, the borrowing capacity under the Wells Fargo line of credit is based on the lesser of (1) an amount equal to 65% of the aggregate value of the properties in the
collateral pool as determined by lender appraisals, (2) an amount that results in a minimum debt yield of 10% based on the in-place net operating income of the collateral pool as defined or (3) the maximum capacity of the Wells Fargo line of credit. Proceeds from the Wells Fargo line of credit can be used to fund acquisitions, redeem shares pursuant to our redemption plan and for any other corporate purpose. As of September 30, 2019, our maximum borrowing capacity was $82,954, our outstanding balance was $52,300 and our weighted average interest rate was 3.64%.
On November 13, 2019, we entered into a first amendment to our Wells Fargo line of credit agreement (the "Amendment"). The Amendment makes the following two changes to our Wells Fargo line of credit, both of which took effect on November 13, 2019: (1) for purposes of determining our maximum borrowing capacity, reduced the minimum debt yield from 10% to 9%; and (2) sets the maximum borrowing capacity of our Wells Fargo line of credit to $86,000 until the earlier of (a) (i) December 2, 2019, provided that our tenant at our Loudoun Gateway property has not exercised its option to terminate its lease, or (ii) the date that we provide Wells Fargo evidence that our tenant at our Loudoun Gateway property has elected not to exercise its option to terminate its lease; and (b) in the event that our tenant at our Loudoun Gateway property has validly exercised its option to terminate its lease, the date that we have paid the applicable minimum repayment amount to Wells Fargo as defined in the Wells Fargo line of credit agreement. Our tenant at our Loudoun Gateway property has an option, at its sole discretion, to terminate its lease with respect a single floor of the property, Further, after the earlier of (a) and (b) under clause (2) above, our maximum borrowing capacity shall be determined in accordance with the terms of the Wells Fargo line of credit agreement.
The Wells Fargo line of credit agreement contains customary representations, warranties, borrowing conditions and affirmative, negative and financial covenants, including that there must be at least five properties in the collateral pool at all times, and the collateral pool must also meet specified concentration provisions, unless waived by the lender. In addition, the guarantor must meet tangible net worth hurdles. As of September 30, 2019, we were in compliance with all covenants.
On March 1, 2016, we, through an indirect wholly-owned subsidiary as borrower, entered into a credit agreement providing for a $14,500 fully non-recourse loan with Nationwide Life Insurance Company, or Nationwide, secured by The Flats at Carrs Hill, our 138 unit student housing apartment property in Athens, Georgia, which we refer to as the Flats Nationwide loan. The interest rate for the Flats Nationwide loan is fixed at 3.63% with interest-only payments for the full term of the loan. The maturity date of the Flats Nationwide loan is March 1, 2026 with no extension options. The Flats Nationwide loan permits voluntary prepayment of the full amount of the loan at any time subject to payment of the applicable prepayment premium, which is (a) the greater of a yield maintenance calculation or 1.0% of the principal amount outstanding for prepayments occurring up to and including the 96th month of the term, (b) 2.0% of the principal amount outstanding for prepayments occurring during months 97 through 102 of the term, or (c) 1.0% of the principal amount outstanding for prepayments occurring during months 103 through 114 of the term. The Flats Nationwide loan is prepayable at par during the last six months of the term. Additionally, the Flats Nationwide loan contains a one-time option to be assumed by a new borrower subject to satisfaction, in Nationwide's sole discretion, of specified conditions and payment of a fee equal to 1.0% of the outstanding balance of the loan. Proceeds of $14,500 were applied to our initial Wells Fargo line of credit that was originated in March 2015. Prior to closing of the Flats Nationwide loan, The Flats at Carrs Hill served as additional collateral under the initial Wells Fargo line of credit.
On December 1, 2016, we, through an indirect wholly-owned subsidiary as borrower, entered into a credit agreement with Hartford Life Insurance Company, or Hartford. Proceeds of $13,000 obtained from Hartford were used to repay outstanding balances under the initial Wells Fargo line of credit, thereby releasing Commerce Corner from the initial Wells Fargo line of credit. The Hartford loan is a secured, fully non-recourse loan with a term of seven years and no extension options. The Hartford loan carries a fixed interest rate of 3.41% with interest-only payments for the first 24 months of the term, followed by principal and interest payments for the remainder of the term, based upon a 30-year amortization schedule. As of September 30, 2019, the outstanding balance on the Hartford loan was $12,811. The Hartford Loan permits voluntary prepayment of the full amount of the Hartford Loan at any time after 18th month of the term the subject to payment of the applicable prepayment premium, which is (a) equal to a yield maintenance calculation for prepayments occurring from the beginning of the 19th month of
the term up to and including the 60th month of the term, or (b) 1.0% of the principal amount outstanding for prepayments occurring during months 61 through 72 of the term. The Hartford Loan is prepayable at par during the last twelve months of the term. Additionally, the Hartford Loan contains a one-time option to be assumed by a new borrower subject to satisfaction, in Hartford's sole discretion, of specified conditions and payment of a fee equal to 1.0% of the outstanding balance of the Hartford Loan.
On December 6, 2018, we, through an an indirect wholly owned subsidiary as borrower, entered into a credit agreement with Transamerica Premier Life Insurance Company, or Transamerica. Proceeds of $6,950 net of transaction costs, obtained from the Transamerica loan were used to repay outstanding balances under the revised Wells Fargo line of credit, thereby releasing Wallingford Plaza from the revised Wells Fargo line of credit. The Transamerica loan is a secured, fully non-recourse loan with a term of ten years with no extension options. The Transamerica loan carries a fixed interest rate of 4.56% with interest-only payments for the first 24 months of the term, then principal and interest payments for the remainder of the term, based upon a 30-year amortization schedule. The Transamerica loan permits voluntary prepayment of the full amount of the Transamerica loan at any time subject to payment of the applicable prepayment premium, which is equal to a yield maintenance calculation for prepayments occurring from the beginning the term up to 90 days before the maturity date. The Transamerica loan is prepayable at par during the last ninety days of the term. Additionally, the Transamerica loan contains a one-time option to be assumed by a new borrower subject to satisfaction, in Transamerica’s sole discretion, of specified conditions and payment of a fee equal to 1.0% of the outstanding balance of the Transamerica loan.
On June 11, 2019, we, through an indirect wholly owned subsidiary as borrower, entered into a credit agreement with State Farm Life Insurance Company, or State Farm. Proceeds of $17,600 obtained from the State Farm loan were used to repay outstanding balances under the Wells Fargo line of credit, thereby releasing Elston Plaza from the Wells Fargo line of credit. The State Farm loan is a secured, fully non-recourse loan with a term of seven years with no extension options. The State Farm loan carries a fixed interest rate of 3.89% with interest-only payments for the first 24 months of the term, then principal and interest payments for the remainder of the term, based upon a 30-year amortization schedule. The State Farm loan permits voluntary prepayment of the full amount of the State Farm loan at any time after the first 24 monthly payments have been made subject to payment of the applicable prepayment premium, which is (a) the greater of a yield maintenance calculation or 1.0% of the principal amount outstanding for prepayments occurring from months 25 through 48 of the term, or (b) 1.0% of the principal amount outstanding for prepayments occurring during months 49 through 60 of the term. The State Farm loan is prepayable at par during the last 24 months of the term. Additionally, the State Farm loan contains a one-time option to be assumed by a new borrower subject to satisfaction, in State Farm's sole discretion, of specified conditions and payment of a fee equal to 1.0% of the outstanding balance of the State Farm loan.
On September 16, 2019, in connection with the acquisition of Providence Square, we, through an indirect wholly owned subsidiary as borrower, entered into a credit agreement with Nationwide for a $29,700 secured, fully non-recourse loan, which we refer to as the Providence Nationwide loan. The Providence Nationwide loan has a term of ten years with no extension options. The Providence Nationwide loan carries a fixed interest rate of 3.67% with interest-only payments for the entire term. The Providence Nationwide loan permits voluntary prepayment of the full amount of the outstanding balance subject to payment of the applicable prepayment premium, which is equal to (a) the greater of a yield maintenance calculation or 1% of the principal balance for prepayments occurring during the first seven years of the term, (b) 2% of the principal balance for prepayments occurring during the eighth year of the term, or (c) 1% of the principal balance for prepayments occurring during the ninth year of the term. The Providence Nationwide loan can be prepaid at par during the tenth year of the term. Additionally, the Providence Nationwide loan contains a one-time option to be assumed by a new borrower subject to satisfaction, in Nationwide’s sole discretion, of specified conditions and payment of a fee equal to 1% of the outstanding balance of the Providence Nationwide loan.
In the future, as our assets increase, it may not be commercially feasible or we may not be able to secure an adequate line of credit to fund acquisitions, redemptions or other needs. Moreover, actual availability may be reduced at any given time if the values of our real estate or our marketable securities portfolio decline.
Expense Payments by Our Advisor
In connection with our advisory agreement, RREEF America agreed to pay all of our organization and offering costs through January 3, 2013, and certain of our organization and offering costs through January 3, 2014, all of which were incurred on our behalf and which we refer to as the Deferred O&O. These costs amounted to $4,618. The total of the Deferred O&O was reimbursed to RREEF America on a pro rata basis over a 60-month period that began January 3, 2014 and with the final payment being made in December 2018.
Also pursuant to the advisory agreement, RREEF America is entitled to reimbursement of certain costs incurred by RREEF America or its affiliates. Costs eligible for reimbursement include most third-party operating expenses, salaries and related costs of its employees who perform services for us (but not those employees for which RREEF America earns a separate fee or those employees who are our executive officers) and travel related costs for its employees who incur such costs on our behalf. We will reimburse our advisor for all expenses paid or incurred by our advisor in connection with the services provided to us, subject to the limitations described below regarding the 2%/25% guidelines as defined in our advisory agreement. As of September 30, 2019, we owed $56 to our advisor for such costs.
On May 29, 2013, we entered into an expense support agreement with our advisor, which was amended and restated most recently on January 20, 2016, which we refer to as the expense support agreement. Pursuant to the terms of the expense support agreement, our advisor incurred expenses related to our operations in addition to the Deferred O&O, which we refer to as expense payments. As of December 31, 2015, our advisor had incurred $9,200 in expense payments, which was the maximum amount of expense payments allowed under the expense support agreement.
As the expense payment limit had been reached, pursuant to the expense support agreement, in January 2016 the reimbursement provisions were triggered. During the first quarter of 2016, we reimbursed $250 to our advisor under the expense support agreement. On April 25, 2016, we and our advisor entered into a letter agreement that amended certain provisions of the advisory agreement and the expense support agreement, which we refer to as the ESA letter agreement. The ESA letter agreement provides, in part, that our obligations to reimburse our advisor for expense payments under the expense support agreement are suspended until the first calendar month following the month in which we have reached $500,000 in offering proceeds from our offerings, which we refer to as the ESA commencement date. Since our inception through September 30, 2019, we raised $221,713 from the sale of shares of our common stock, including proceeds from our dividend reinvestment plan. We currently owe $8,950 to our advisor under the expense support agreement. Beginning the month following the ESA commencement date, we will make monthly reimbursement payments to our advisor in the amount of $417 for the first 12 months and $329 for the second 12 months, subject to monthly reimbursement payment limitations described in the ESA letter agreement. In addition, pursuant to the ESA letter agreement, if RREEF America is serving as our advisor at the time that we or our operating partnership undertakes a liquidation, our remaining obligations to reimburse our advisor for the unpaid monthly reimbursements under the expense support agreement shall be waived.
Limits on Expense Reimbursement
In all cases, reimbursement payments to our advisor will be subject to reduction as necessary in order to ensure that such reimbursement payment will not cause the aggregate organization and offering costs paid by us for an offering to exceed 15% of the gross proceeds from the sale of shares in such offering as of the date of the reimbursement payment, and such reimbursement payment will not adversely affect our ability to maintain our status as a REIT for federal tax purposes.
In addition to the reimbursement limitations for organization and offering costs, we are also limited in the amount of operating expenses that we may reimburse our advisor. Pursuant to our charter, we may reimburse our advisor, at the end of each fiscal quarter, for total operating expenses incurred by our advisor; provided, however, that we may not reimburse our advisor at the end of any fiscal quarter for total operating expenses (as defined in our charter) that, in the four consecutive fiscal quarters then ended, exceed the greater of 2% of our average invested assets or 25% of our net income determined without reduction for any additions to reserves for depreciation, bad debts or other similar non-cash reserves and excluding any gain from the sale of our assets for that period (which we
refer to as the 2%/25% guidelines) for such four-quarter period. Notwithstanding the foregoing, we may reimburse our advisor for expenses in excess of the 2%/25% guidelines if a majority of our independent directors determine that such excess expenses, which we refer to as an excess amount, are justified based on unusual and non-recurring factors. For the four fiscal quarters ended September 30, 2019, our total operating expenses (as defined in our charter) were $4,514, which did not exceed the amount prescribed by the 2%/25% guidelines.
Pursuant to the expense support agreement, the amount of the reimbursement payment paid in any calendar quarter will not be aggregated with our cumulative operating expenses for any four consecutive calendar quarters that includes the calendar quarter in which such reimbursement payment is paid, and instead the amount of the unreimbursed expense payments comprising such reimbursement payment will have previously been aggregated with our total operating expenses for the four calendar quarter periods ending with the calendar quarter in which such expense payment was originally incurred, which we refer to as prior 2%/25% periods. If an unreimbursed expense payment incurred during a prior 2%/25% period exceeded the 2%/25% guidelines for such prior 2%/25% period, the amount of such excess will only be reimbursed pursuant to the expense support agreement to the extent that our independent directors previously approved such excess with respect to the applicable prior 2%/25% period. Our independent directors approved the excess amount for every period of four consecutive quarters since we were first subject to this limitation for the four consecutive quarters ended June 30, 2014 through September 30, 2016. During the fiscal quarter ended March 31, 2017, our advisor reimbursed us for the excess amount related to the four fiscal quarters ended December 31, 2016. Our total operating expenses have not exceeded the 2%/25% guidelines for any four-quarter period ending after December 31, 2016.
We anticipate our offering and operating fees and expenses will include, among other things, the advisory fee that we pay to our advisor, the selling commissions, dealer manager and distribution fees we pay to the dealer manager, legal and audit expenses, federal and state filing fees, printing expenses, transfer agent fees, marketing and distribution expenses and fees related to appraising and managing our properties. We will not have any office or personnel expenses as we do not have any employees. Our advisor will incur certain of these expenses and fees, for which we may reimburse our advisor, subject to certain limitations. Additionally, our advisor may allocate to us out-of-pocket expenses in connection with providing services to us, including our allocable share of our advisor’s overhead, such as rent, utilities and personnel costs for personnel who are directly involved in the performance of services to us and are not our executive officers. Furthermore, our former dealer manager incurred certain bona fide offering expenses in connection with the distribution of our shares for which our former dealer manager was fully repaid in July 2016. Ultimately, total organization and offering costs incurred in a given offering will not exceed 15% of the gross proceeds from such offering. During our initial offering, our advisor paid on our behalf or reimbursed us for $3,975 in organization and offering costs and $5,229 in operating expenses. The total organization and offering costs paid by our advisor and the former dealer manager did not cause us to exceed the 15% limitation as of September 30, 2019 with respect to the initial offering. If, in future periods, the total organization and offering costs paid by our advisor and the dealer manager cause us to exceed the 15% limitation with respect to the initial offering, the excess would not be reflected on our consolidated balance sheet as of the end of such period. A similar limitation will apply to the total organization and offering costs incurred with respect to the follow-on offering. In such event, we may become obligated to reimburse all or a portion of this excess as we raise additional proceeds from our follow-on offering. As of September 30, 2019, our total organization and offering costs incurred with respect to the follow-on offering did not exceed the 15% limitation for the follow-on offering.
Other potential future sources of capital include secured or unsecured financings from banks or other lenders and proceeds from the sale of assets. If necessary, we may use financings or other sources of capital in the event of unforeseen significant capital expenditures.
Cash Flow Analysis
Cash flow provided by operating activities during the nine months ended September 30, 2019 and 2018 was $4,797 and $4,311, respectively. The increase in cash flow from operating activities for the nine months ended September 30, 2019 compared to the nine months ended September 30, 2018 is due to additional operating cash flows from our 2018 and 2019 acquisitions, offset by decreased operating cash flow at Anaheim Hills Office Plaza due to vacancies. These net increases were partially offset by higher debt service costs in 2019 as a result of our
higher average outstanding debt balances.
Cash flow used in investing activities during the nine months ended September 30, 2019 and 2018 was $56,649 and $26,344, respectively. During the 2019 period, we acquired Providence Square for $55,061 less prorations of $114 (see “Portfolio Information - Real Estate Property Portfolio” above). During the 2018 period, we acquired Miami Industrial for $20,842 less prorations of $223. In 2019 we paid approximately $1,263 on improvements to our real estate investments, primarily for tenant improvements at Anaheim Hills Office Plaza related to new leases. This compares to paid real estate improvements of only $103 in the 2018 period. During the 2019 period we did not invest additional capital into our real estate securities portfolio, however, during 2018, we invested an additional $5,300.
Cash flow provided by financing activities was $52,158 for the nine months ended September 30, 2019. We received proceeds of $47,777 in our offerings and paid $2,490 in offering costs. Cash distributions to stockholders paid during the nine months ended September 30, 2019 were $3,265. Of the total distributions declared for the nine months ended September 30, 2019, $2,874 was reinvested via our distribution reinvestment plan. Additionally, we processed redemptions during the nine months ended September 30, 2019 that resulted in payments by us of $4,185, after deductions for any applicable 2% short-term trading discounts. We originated $47,300 in property specific loans from State Farm on Elston Plaza and Nationwide on Providence Square, and used the proceeds along with proceeds from our offerings to repay $52,819 against our outstanding balance on the Wells Fargo line of credit. In connection with these new loans we paid $471 in financing costs. We borrowed $20,500 from our Wells Fargo line of credit during 2019, of which $18,300 was utilized to acquire Providence Square. Additionally, we made principal payments on the Hartford Loan of $189 which requires monthly principal payments beginning in January 2019.
Cash flow provided by financing activities was $23,113 for the nine months ended September 30, 2018. We received proceeds of $30,376 in our offerings and paid $2,976 in offering costs. Cash distributions to stockholders paid during the nine months ended September 30, 2018 were $2,488. Of the total distributions declared for the nine months ended September 30, 2018, $2,013 was reinvested via our distribution reinvestment plan. Additionally, we processed redemptions during the nine months ended September 30, 2018 that resulted in payments by us of $5,517, after deductions for any applicable 2% short-term trading discounts. We also borrowed $19,900 from our Wells Fargo line of credit to acquire Miami Industrial, and we made net repayments of $15,500 against our outstanding balance on the Wells Fargo line of credit. Lastly, we amended and restated the Wells Fargo line of credit and added Miami Industrial to the Wells Fargo line of credit, and in relation thereto paid $682 in financing costs.
Distributions
Our board of directors authorized and declared daily cash distributions for each quarter which were payable monthly for each share of Class A, Class I, Class T and Class D common stock outstanding. Shown below are details of the distributions:
|
| | | | | | | | | | | | | | | |
| | Three Months Ended | | Nine Months Ended September 30, 2019 |
| | March 31, 2019 | | June 30, 2019 | | September 30, 2019 | |
| Distributions: | | | | | | | |
| Declared daily distribution rate, before adjustment for class-specific fees | $ | 0.00193545 |
| | $ | 0.00195924 |
| | $ | 0.00197058 |
| | |
| Distributions paid or payable in cash | $ | 1,000 |
| | $ | 1,105 |
| | $ | 1,238 |
| | $ | 3,343 |
|
| Distributions reinvested | 841 |
| | 954 |
| | 1,079 |
| | 2,874 |
|
| Distributions declared | $ | 1,841 |
| | $ | 2,059 |
| | $ | 2,317 |
| | $ | 6,217 |
|
| | | | | | | | |
| Net Cash Provided by Operating Activities: | $ | 789 |
| | $ | 1,704 |
| | $ | 2,304 |
| | $ | 4,797 |
|
| | | | | | | | |
| Funds From Operations: | $ | 4,083 |
| | 2,098 |
| | $ | 3,021 |
| | $ | 9,202 |
|
For the nine months ended September 30, 2019, our distributions were covered 77.2% by cash flow from operations and 22.8% by borrowings. We expect that we will continue to pay distributions monthly in arrears. Any distributions not reinvested will be payable in cash, and there can be no assurances regarding the portion of the distributions that will be reinvested. We intend to fund distributions from cash generated by operations. However, we may fund distributions from borrowings under our line of credit, from the proceeds of our offering or any other source.
As discussed above under “Funds from Operations and Modified Funds from Operations,” we adopted ASU 2016-01 effective January 1, 2018, which impacted our FFO by including within FFO, as defined by NAREIT, the net unrealized change in fair value of our investments in marketable securities. For the three and nine months ended September 30, 2019, the net unrealized change in fair value of our investments in marketable securities was $1,254 and $3,609, respectively. Without this net unrealized change in fair value, our FFO for the three and nine months ended September 30, 2019 would have been $1,767 and $5,593, respectively, which we refer to as FFO as adjusted, and which is presented above under "Funds from Operations and Modified Funds from Operations" for the three and nine months ended September 30, 2019 and 2018.
The payment of distributions from sources other than cash flow from operations or FFO may be dilutive to our NAV per share because it may reduce the amount of proceeds available for investment and operations or cause us to incur additional interest expense as a result of borrowed funds.
Redemptions
For details on our redemptions, please see Note 9 (“Capitalization”) to our consolidated financial statements included in this quarterly report on Form 10-Q.
Critical Accounting Policies
Our accounting policies have been established to conform with GAAP. The preparation of financial statements in conformity with GAAP requires management to use judgment in the application of accounting policies, including making estimates and assumptions. These judgments affect the reported amounts of assets and liabilities and disclosure of contingent assets and liabilities at the dates of the financial statements and the reported amounts of revenue and expenses during the reporting periods. If management’s judgment or interpretation of the facts and circumstances relating to various transactions had been different, it is possible that different accounting policies would have been applied, thus resulting in a different presentation of the financial statements. Additionally, other
companies may utilize different estimates that may impact the comparability of our results of operations to those of companies in similar businesses. We consider our critical accounting policies to be the policies that relate to the following concepts:
•Real Estate Investments and Lease Intangibles
•Revenue Recognition
•Organization and Offering Expenses
A complete description of such policies and our considerations is contained in Note 2 ("Summary of Significant Accounting Policies") to our consolidated financial statements included in our Annual Report on Form 10-K for the year ended December 31, 2018, as supplemented by the most recent quarterly report on Form 10-Q. For the nine months ended September 30, 2019, certain of our critical accounting policies were updated pursuant to adoption of certain Accounting Standards Updates, as further described in Note 2, (“Summary of Significant Accounting Policies”) to our consolidated financial statements included in this quarterly report on Form 10-Q.
Certain Accounting Pronouncements Effective in the Future
We refer you to Note 2 (“Summary of Significant Accounting Policies”) to our consolidated financial statements included in this quarterly report on Form 10-Q for a discussion of the potential impact on us from certain accounting pronouncements that become effective in the future.
REIT Compliance and Income Taxes
We elected to be taxed as a REIT under Sections 856 through 860 of the Internal Revenue Code beginning with the year ended December 31, 2013, and we believe that we have operated in such a manner to continue to be taxed as a REIT for federal income tax purposes. In order to maintain our qualification as a REIT, we are required to, among other things, distribute as dividends at least 90% of our REIT taxable income, determined without regard to the dividends-paid deduction and excluding net capital gains, to our stockholders and meet certain tests regarding the nature of our income and assets. If we qualify for taxation as a REIT, we generally will not be subject to federal income tax to the extent our income meets certain criteria and we distribute our REIT taxable income to our stockholders. Even if we qualify for taxation as a REIT, we may be subject to (1) certain state and local taxes on our income, property or net worth and (2) federal income and excise taxes on undistributed income, if any income remains undistributed. Many of these requirements are highly technical and complex. We will monitor the business and transactions that may potentially impact our REIT status. If we were to fail to meet these requirements, we could be subject to federal income tax on our taxable income at regular corporate rates. We would not be able to deduct distributions paid to stockholders in any year in which we fail to qualify as a REIT. We will also be disqualified for the four taxable years following the year during which qualification was lost unless we are entitled to relief under specific statutory provisions.
Off Balance Sheet Arrangements
As of September 30, 2019, we had no material off-balance sheet arrangements that had or are reasonably likely to have a current or future effect on our financial condition, results of operations, liquidity or capital resources.
ITEM 3. QUANTITATIVE AND QUALITATIVE DISCLOSURES ABOUT MARKET RISK
In connection with our line of credit, which has a variable interest rate, we are subject to market risk associated with changes in LIBOR. As of September 30, 2019, we had $52,300 outstanding under our Wells Fargo line of credit bearing interest at approximately 3.6%, representing approximately a 38.7% loan-to-cost ratio. At this balance, a change in the interest rate of 0.50% would result in a change in our interest expense of $262 per annum. In the future, we may be exposed to additional market risk associated with interest rate changes as a result of additional short-term debt, such as additional borrowings under our line of credit, and long-term debt, which, in either case,i may be used to maintain liquidity, fund capital expenditures and expand our investment portfolio. Market fluctuations in real estate financing may affect the availability and cost of funds needed to expand our investment
portfolio. In addition, restrictions upon the availability of real estate financing or high interest rates for real estate loans could adversely affect our ability to dispose of real estate in the future. We will seek to limit the impact of interest rate changes on earnings and cash flows and to lower our overall borrowing costs. We intend to manage market risk associated with our variable-rate financing by assessing our interest rate cash flow risk through continually identifying and monitoring changes in interest rate exposures that may adversely impact expected future cash flows and by evaluating hedging opportunities. We may use derivative financial instruments to hedge exposures to changes in interest rates on loans secured by our assets.
We may be exposed to credit risk, which is the risk that the counterparty will fail to perform under the terms of the derivative contract. If the fair value of a derivative contract is positive, the counterparty will owe us, which creates credit risk for us. If the fair value of a derivative contract is negative, we will owe the counterparty and, therefore, do not have credit risk. We will seek to minimize the credit risk in derivative instruments by entering into transactions with high-quality counterparties. We are not currently a party to any such derivative contracts.
We will be exposed to financial market risk with respect to our marketable securities portfolio. Financial market risk is the risk that we will incur economic losses due to adverse changes in equity security prices. Our exposure to changes in equity security prices is a result of our investment in these types of securities. Market prices are subject to fluctuation and, therefore, the amount realized in the subsequent sale of an investment may significantly differ from the reported market value. Fluctuation in the market prices of a security may result from any number of factors, including perceived changes in the underlying fundamental characteristics of the issuer, the relative price of alternative investments, interest rates, default rates and general market conditions. In addition, amounts realized in the sale of a particular security may be affected by the relative quantity of the security being sold. We do not currently engage in derivative or other hedging transactions to manage our security price risk. As of September 30, 2019, we owned marketable securities with a value of $19,247. While it is difficult to project what factors may affect the prices of equity securities and how much the effect might be, a 10% change in the value of the marketable securities we owned as of September 30, 2019 would result in a change of $1,925 to the unrealized gain on marketable securities.
ITEM 4. CONTROLS AND PROCEDURES
Evaluation of Disclosure Controls and Procedures
As required by Rules 13a-15(b) and 15d-15(b) of the Exchange Act, we, under the supervision and with the participation of our chief executive officer and chief financial officer, carried out an evaluation of the effectiveness of our disclosure controls and procedures (as defined in Rules 13a-15(e) and 15d-15(e) of the Exchange Act) as of the end of the period covered by this Quarterly Report on Form 10-Q. Based on that evaluation, our chief executive officer and chief financial officer concluded that our disclosure controls and procedures, as of September 30, 2019, were effective to ensure that information required to be disclosed by us in this Quarterly Report is recorded, processed, summarized and reported within the time periods specified by the rules and forms promulgated under the Exchange Act and is accumulated and communicated to management, including our chief executive officer and chief financial officer, as appropriate to allow timely decisions regarding required disclosures.
Internal Control over Financial Reporting
No change occurred in our internal control over financial reporting (as defined in Rules 13a-15(f) and 15d -15(f) of the Exchange Act) during the three months ended September 30, 2019 that has materially affected, or is reasonably likely to materially affect, our internal control over financial reporting.
PART II
OTHER INFORMATION
ITEM 1. LEGAL PROCEEDINGS
As of September 30, 2019, there were no material pending legal proceedings.
ITEM 1A. RISK FACTORS
We refer you to the risk factors contained in Part I, Item 1A of our Annual Report on Form 10-K for the year ended December 31, 2018, filed with the SEC on March 8, 2019. Since that filing, there have been no material changes to our risk factors.
ITEM 2. UNREGISTERED SALES OF EQUITY SECURITIES AND USE OF PROCEEDS
Unregistered Sales of Equity Securities
No unregistered sales of our common stock occurred during the three months ended September 30, 2019.
Share Redemption Plan
On November 27, 2012 we adopted a share redemption plan whereby on a daily basis stockholders may request that we repurchase all or a portion of their shares of common stock. The redemption price per share is equal to our NAV per share of the class of shares being redeemed on the date of redemption. The total amount of redemptions in any calendar quarter will be limited to shares whose aggregate value (based on the redemption price per share on the date of the redemption) is equal to 5% of our combined NAV for all classes of shares as of the last day of the previous calendar quarter. In addition, if redemptions do not reach the 5% limit in a calendar quarter, the unused portion generally will be carried over to the next quarter and not any subsequent quarter, except that the maximum amount of redemptions during any quarter may never exceed 10% of the combined NAV for all classes of shares as of the last day of the previous calendar quarter. While there is no minimum holding period, shares redeemed within 365 days of an investor's initial date of purchase will be redeemed at our NAV per share of the class of shares being redeemed on the date of redemption, less a short-term trading discount equal to 2% of the gross proceeds otherwise payable with respect to the redemption. Our board of directors has the discretion to suspend or modify the share redemption plan at any time.
The following tables set forth information regarding our redemption of shares of our common stock by share class. The weighted average redemption prices are shown before allowing for any applicable 2% short-term trading discounts.
|
| | | | | | | |
| Three Months Ended September 30, 2019 | | Shares | | Weighted Average Share Price |
| Class A | | 42,136 |
| | $ | 14.35 |
|
| Class I | | 41,101 |
| | 14.44 |
|
| Class T | | 10,468 |
| | 14.47 |
|
| Class D | | — |
| | — |
|
We funded these redemptions with cash flow from operations, proceeds from our offerings or borrowings on our line of credit.
The following table sets forth information regarding redemptions of shares of our common stock by month. As of September 30, 2019, we had no unfulfilled redemption requests.
|
| | | | | | | | |
| Period | | Total Number of Shares Redeemed | | Average Price Paid per Share | | Total Number of Shares Purchased as Part of Publicly Announced Plans or Programs | | Maximum Number of Shares that May Yet Be Purchased Pursuant to the Program (1) |
| July 1 - July 31, 2019 | | 14,132 | | $14.38 | | 14,132 | | (1) |
| August 1 - August 31, 2019 | | 11,036 | | $14.36 | | 11,036 | | (1) |
| September 1 - September 30, 2019 | | 68,537 | | $14.42 | | 68,537 | | (1) |
| (1) Redemptions are limited as described above. | | |
ITEM 3. DEFAULTS UPON SENIOR SECURITIES
Not applicable.
ITEM 4. MINE SAFETY DISCLOSURES
Not applicable.
ITEM 5. OTHER INFORMATION
The following disclosure would have otherwise been filed in a Current Report on Form 8-K:
Amendment to Wells Fargo Line of Credit
On November 13, 2019, we entered into a first amendment to our Wells Fargo line of credit agreement (the “Amendment”). The Amendment makes the following two changes to our Wells Fargo line of credit, both of which took effect on November 13, 2019: (1) for purposes of determining our maximum borrowing capacity, reduced the minimum debt yield from 10% to 9%; and (2) sets the maximum borrowing capacity of our Wells Fargo line of credit to $86,000 until the earlier of (a) (i) December 2, 2019, provided that our tenant at our Loudoun Gateway property has not exercised its option to terminate its lease, or (ii) the date that we provide Wells Fargo evidence that our tenant at our Loudoun Gateway property has elected not to exercise its option to terminate its lease; and (b) in the event that our tenant at our Loudoun Gateway property has validly exercised its option to terminate its lease, the date that we have paid the applicable minimum repayment amount to Wells Fargo as defined in the Wells Fargo line of credit agreement. Further, after the earlier of (a) and (b) under clause (2) above, our maximum borrowing capacity shall be determined in accordance with the terms of the Wells Fargo line of credit agreement.
The foregoing description of the Amendment is qualified in its entirety by reference to the Amendment, a copy of which is attached as Exhibit 10.5 to this Quarterly Report on Form 10-Q.
Renewal of Advisory Agreement
We previously entered into that certain Amended and Restated Advisory Agreement dated as of January 20, 2016 (the “Advisory Agreement”) with RREEF Property Operating Partnership, LP, our operating partnership, and RREEF America L.L.C., our affiliated external advisor. On November 12, 2019, our board of directors approved the renewal of the Advisory Agreement effective as of January 20, 2020 for an additional one-year term expiring January 20, 2021. The terms of the Advisory Agreement otherwise remain unchanged.
ITEM 6. EXHIBITS
|
| | |
| Exhibit No. | | Description |
10.1*+ | | Purchase and Sale Agreement, dated August 8, 2019, by and between 4101 Roswell Road (Marietta), LLC and RREEF America L.L.C. |
| 10.2* | | Assignment and Assumption of Purchase and Sale Agreement, dated September 16, 2019, by and between RREEF America L.L.C. and RPT Providence Square, LLC. |
| 10.3* | | Loan Agreement, dated September 16, 2019, by and between Nationwide Life Insurance Company and RPT Providence Square, LLC. |
| 10.4* | | Indemnity Agreement, dated September 16, 2019, by and between Nationwide Life Insurance Company and RPT Providence Square, LLC. |
| 10.5* | | First Amendment to Amended and Restated Revolving Loan Agreement and Omnibus Amendment to Loan Documents, dated November 13, 2019, by and among RPT Anaheim Hills Office Plaza, LLC, RPT Heritage Parkway, LLC, RPT Terra Nova Plaza, LLC, RPT Loudon Gateway I, LLC, RPT Allied Drive, LLC, RPT Palmetto Lakes, LLC, RPT Hialeah I, LLC, RPT Hialeah II, LLC, and Wells Fargo Bank, National Association, as Lender and administrative agent. |
| 31.1* | | Certification of the Principal Executive Officer of the Company pursuant to Exchange Act Rule 13a-14(a) or 15d-14(a), as adopted pursuant to Section 302 of the Sarbanes-Oxley Act of 2002. |
| 31.2* | | Certification of the Principal Financial Officer of the Company pursuant to Exchange Act Rule 13a-14(a) or 15d-14(a), as adopted pursuant to Section 302 of the Sarbanes-Oxley Act of 2002. |
| 32.1* | | Certification of the Principal Executive Officer and Principal Financial Officer of the Company pursuant to 18 U.S.C. Section 1350, as adopted pursuant to Section 906 of the Sarbanes-Oxley Act of 2002. |
| 101.INS | | XBRL Instance Document |
| 101.SCH | | XBRL Taxonomy Extension Schema Document |
| 101.CAL | | XBRL Taxonomy Extension Calculation Linkbase Document |
| 101.DEF | | XBRL Taxonomy Extension Definition Linkbase Document |
| 101.LAB | | XBRL Taxonomy Extension Label Linkbase Document |
| 101.PRE | | XBRL Taxonomy Extension Presentation Linkbase Document |
|
| |
| * | Filed herewith |
| + | Certain identified confidential information has been redacted from this exhibit because it both (i) is not material and (ii) would be competitively harmful if publicly disclosed. |
SIGNATURES
Pursuant to the requirements of the Securities Exchange Act of 1934, as amended, the registrant has duly caused this report to be signed on its behalf by the undersigned thereunto duly authorized.
|
| |
RREEF Property Trust, Inc. |
| By: | /s/ W. Todd Henderson |
| Name: | W. Todd Henderson |
| Title: | Chief Executive Officer (Principal Executive Officer) |
|
| |
| By: | /s/ Eric M. Russell |
| Name: | Eric M. Russell |
| Title: | Chief Financial Officer (Principal Financial and Accounting Officer) |
Date: November 14, 2019
INDEPENDENT AUDITORS' REPORT
To the Stockholders and Board of Directors
RREEF Property Trust, Inc.:
We have audited the accompanying Historical Summary of Gross Income and Direct Operating Expenses of Providence Square (the Property) for the year ended December 31, 2018, and the related notes (the historical summary).
Management’s Responsibility for the Historical Summary
Management is responsible for the preparation and fair presentation of this historical summary in accordance with U.S. generally accepted accounting principles; this includes the design, implementation, and maintenance of internal control relevant to the preparation and fair presentation of the historical summary that are free from material misstatement, whether due to fraud or error.
Auditors’ Responsibility
Our responsibility is to express an opinion on the historical summary based on our audit. We conducted our audit in accordance with auditing standards generally accepted in the United States of America. Those standards require that we plan and perform the audit to obtain reasonable assurance about whether the historical summary is free from material misstatement. An audit involves performing procedures to obtain audit evidence about the amounts and disclosures in the historical summary. The procedures selected depend on the auditors’ judgment, including the assessment of the risks of material misstatement of the historical summary, whether due to fraud or error. In making those risk assessments, the auditor considers internal control relevant to the entity’s preparation and fair presentation of the historical summary in order to design audit procedures that are appropriate in the circumstances, but not for the purpose of expressing an opinion on the effectiveness of the entity’s internal control. Accordingly, we express no such opinion. An audit also includes evaluating the appropriateness of accounting policies used and the reasonableness of significant accounting estimates made by management, as well as evaluating the overall presentation of the historical summary.
We believe that the audit evidence we have obtained is sufficient and appropriate to provide a basis for our audit opinion.
Opinion
In our opinion, the historical summary referred to above presents fairly, in all material respects, the gross income and direct operating expenses described in Note 2 for the year ended December 31, 2018, in accordance with U.S. generally accepted accounting principles.
Emphasis of Matter
We draw attention to Note 2 to the historical summary, which describes that the accompanying historical summary was prepared for the purpose of complying with the rules and regulations of the Securities and Exchange Commission (for inclusion in the filing of Form 8-K/A of RREEF Property Trust, Inc.) and is not intended to be a complete presentation of the Property's revenues and expenses. Our opinion is not modified with respect to this matter.
/s/ KPMG LLP
San Francisco, California
November 8, 2019
Providence Square
Historical Summary of Gross Income and Direct Operating Expenses
For the Six Months Ended June 30, 2019 (unaudited)
and Year Ended December 31, 2018
(in thousands)
|
| | | | | | | |
| | Six Months Ended June 30, 2019 (unaudited) | | Year Ended December 31, 2018 |
| Gross income: | | | |
| Base rental income | $ | 1,656 |
| | $ | 3,227 |
|
| Tenant reimbursements | 475 |
| | 927 |
|
| Total gross income | 2,131 |
| | 4,154 |
|
| Direct operating expenses: | | | |
| Property operating | 310 |
| | 535 |
|
| Real estate tax | 205 |
| | 405 |
|
| Insurance | 14 |
| | 28 |
|
| Total direct operating expenses | 529 |
| | 968 |
|
| Excess of gross income over direct operating expenses | $ | 1,602 |
| | $ | 3,186 |
|
See accompanying notes to historical summary of gross income and direct operating expenses.
Providence Square
Notes to Historical Summary of Gross Income and Direct Operating Expenses
For the Six Months Ended June 30, 2019 (unaudited)
and Year Ended December 31, 2018
(dollar amounts in thousands)
NOTE 1 — BUSINESS
On September 16, 2019, RREEF Property Trust, Inc. (the "Company") acquired Providence Square, a home improvement anchored community retail center with a grocery component located in Marietta, Georgia (the "Property"). The purchase price for the Property was $54,842, exclusive of closing costs. The Property contains five buildings leased to 26 tenants across 222,805 square feet, inclusive of one freestanding building of 5,779 square feet subject to a ground lease. All leases in Providence Square are modified gross leases obligating the tenants to pay their share of certain common area costs as defined in each respective lease. Providence Square is managed by a third party manager.
NOTE 2 — BASIS OF PRESENTATION
Basis of presentation
The Historical Summary of Gross Income and Direct Operating Expenses ("Historical Summary") has been prepared for the purpose of complying with the rules and regulations of the Securities and Exchange Commission (the "SEC") and is not intended to be a complete presentation of the Property's revenues and expenses.
The unaudited Historical Summary for the six months ended June 30, 2019 has been prepared in accordance with accounting principles generally accepted in the United States of America ("GAAP") for interim financial information. In the opinion of the Company's management, all adjustments (consisting of normal recurring adjustments) considered necessary for a fair presentation have been included. The Historical Summary for the six months ended June 30, 2019 is not necessarily indicative of the expected results for the entire year ended December 31, 2019.
Direct operating expenses include only those expenses expected to be comparable to the proposed future operations of the Property. Accordingly, expenses such as interest, depreciation and certain landlord costs are excluded.
Revenue recognition
Base rental revenues are recognized on a straight-line basis over the terms of the respective leases. Tenant reimbursement revenue is recognized as the related expenses are incurred and become recoverable from tenants.
Use of estimates
The Historical Summary has been prepared on the accrual basis of accounting and requires management of the Property to make estimates and assumptions that affect the reported amounts of the revenues and expenses during the reporting period. Actual results may differ from those estimates.
The Historical Summary is being presented for the most recent year available instead of the three most recent years based on the following factors: (1) the Property was acquired from an unaffiliated party; and (2) based on due diligence of the Property conducted by the Company, except as disclosed in these Notes to the Historical Summary of Gross Income and Direct Operating Expenses, management is not aware of any material factors relating to the Property that would cause this financial information not to be indicative of future operating results.
NOTE 3 — GROSS INCOME
The Property is 100% occupied under 26 lease agreements as of December 31, 2018. The table below shows the tenants that individually accounted for at least 10% of the total base rental income for the Property for the year ended December 31, 2018. None of the remaining tenants individually exceeded 10% of the base rental income for the Property for the year ended December 31, 2018.
Providence Square
Notes to Historical Summary of Gross Income and Direct Operating Expenses
For the Six Months Ended June 30, 2019 (unaudited)
and Year Ended December 31, 2018
(dollar amounts in thousands)
|
| | | | | | | | | |
| Tenant | | % of Net Rentable Area | | Lease Commencement Date | | Lease Expiration Date | | Percent of Base Rental Income |
Home Depot U.S.A., Inc. (1) | | 30.3 | % | | 1/1/1994 | | 6/30/2027 | | 17.6% |
The TJX Companies, Inc. (2) | | 24.6 | % | | 10/20/2002 | | 1/31/2023 | | 14.8% |
SFM, LLC (3) | | 13.0 | % | | 1/6/2016 | | 1/31/2031 | | 15.3% |
| Remaining 23 tenants | | 32.1 | % | | various | | various | | 52.3% |
| | | 100.0 | % | | | | | | 100.0% |
(1) Home Depot U.S.A., Inc. has six renewal options of five years each at fixed, pre-defined rental rates.
(2) The TJX Companies, Inc. has two renewal options of five years each at fixed, pre-defined rental rates.
(3) SFM, LLC has three renewal options of five years each at fixed, pre-defined rental rates.
All leases are classified as operating leases. Although some of the leases provide for increases in minimum lease payments over the term of the lease, rental income accrues for the full period of occupancy on a straight-line basis. Related adjustments increased base rental income by $15 (unaudited) for the six months ended June 30, 2019 and $32 for the year ended December 31, 2018. The Property was 100% occupied (unaudited) as of June 30, 2019.
Minimum base rents to be received during the non-cancelable terms under the operating leases in place as of December 31, 2018, are as follows:
|
| | | | |
| 2019 | | $ | 3,289 |
|
| 2020 | | 3,102 |
|
| 2021 | | 2,954 |
|
| 2022 | | 2,970 |
|
| 2023 | | 2,402 |
|
| Thereafter | | 10,259 |
|
| | | $ | 24,976 |
|
NOTE 4 — MANAGEMENT FEES
The Property has a monthly management fee in place equal to 4.0% of revenues collected, as defined. Additionally, the management agreement provides for the reimbursement of certain direct costs, including on-site management costs incurred in operating the Property. Management fee expenses during the six months ended June 30, 2019 and the year ended December 31, 2018 were $86 (unaudited) and $161, respectively, and are included within property operating expenses in the accompanying Historical Summary.
NOTE 5 — SUBSEQUENT EVENTS
Subsequent events were evaluated from December 31, 2018 through November 8, 2019, the date on which the Historical Summary was issued.
RREEF PROPERTY TRUST, INC.
PRO FORMA CONSOLIDATED BALANCE SHEET
June 30, 2019
(unaudited, in thousands, except share and per share data)
The accompanying unaudited Pro Forma Consolidated Balance Sheet of the Company as of June 30, 2019 reflects adjustments for the completed acquisition and related transactions.
The Pro Forma Consolidated Balance Sheet assumes all of the following occurred on June 30, 2019:
| |
| • | The acquisition of Providence Square for $54,842, excluding closing costs; |
| |
| • | The borrowing of a secured, fully non-recourse loan for $29,700 from Nationwide Life Insurance Company; |
| |
| • | The additional borrowing of $18,300 from the Company's line of credit with Wells Fargo Bank, at the average interest rate in effect during the period presented; and |
| |
| • | Additional capital raised of $5,125, all of which was raised subsequent to June 30, 2019 and before closing of the acquisition. |
This Pro Forma Consolidated Balance Sheet should be read in conjunction with the Company’s historical financial statements and notes thereto for the quarter ended June 30, 2019, as contained in the Company's Quarterly Report on Form 10-Q. In the opinion of the Company’s management, all material adjustments necessary to reflect the effects of the preceding transactions have been made. The unaudited Pro Forma Consolidated Balance Sheet is presented for illustrative purposes only and is not necessarily indicative of what the actual financial position would have been had the transactions described above occurred on June 30, 2019, nor does it purport to represent the future financial position of the Company.
|
| | | | | | | | | | | |
| | Historical
(as reported) | | Providence Square | | Pro Forma |
| ASSETS | | | | | |
| Investment in real estate assets: | | | | | |
| Land | $ | 64,426 |
| | $ | 9,741 |
| (a) | $ | 74,167 |
|
| Buildings and improvements, less accumulated depreciation of $18,508 and $15,901, respectively | 106,947 |
| | 37,718 |
| (a) | 144,665 |
|
| Furniture, fixtures and equipment, less accumulated depreciation of $331 and $292, respectively | 213 |
| | — |
| | 213 |
|
| Acquired intangible lease assets, less accumulated amortization of $21,917 and $19,682, respectively | 26,783 |
| | 7,736 |
| (a) | 34,519 |
|
| Total investment in real estate assets, net | 198,369 |
| | 55,195 |
| | 253,564 |
|
| Investment in marketable securities | 17,627 |
| | — |
| | 17,627 |
|
| Total investment in real estate assets and marketable securities, net | 215,996 |
| | 55,195 |
| | 271,191 |
|
| Cash and cash equivalents | 2,065 |
| | (2,065 | ) | (b) | — |
|
| Restricted Cash | 376 |
| | — |
| | 376 |
|
| Receivables, net of allowance for doubtful accounts of $6 and $6, respectively | 3,861 |
| | — |
| | 3,861 |
|
| Deferred leasing costs, net of amortization of $545 and $373, respectively | 2,209 |
| | — |
| | 2,209 |
|
| Prepaid and other assets | 1,941 |
| | 183 |
| (d) | 2,124 |
|
| Total assets | $ | 226,448 |
| | $ | 53,313 |
| | $ | 279,761 |
|
| LIABILITIES AND STOCKHOLDERS' EQUITY | | | | | |
| Line of credit, net | $ | 46,558 |
| | $ | 18,300 |
| (c) | $ | 64,858 |
|
| Mortgage loans payable, net | 51,373 |
| | 29,450 |
| (c) | 80,823 |
|
| Accounts payable and accrued expenses | 2,239 |
| | 15 |
| (d) | 2,254 |
|
| Due to affiliates | 4,593 |
| | — |
| | 4,593 |
|
| Note to affiliate, net of unamortized discount of $1,291 and $1,365, respectively | 7,659 |
| | — |
| | 7,659 |
|
RREEF PROPERTY TRUST, INC.
PRO FORMA CONSOLIDATED BALANCE SHEET
June 30, 2019
(unaudited, in thousands, except share and per share data)
|
| | | | | | | | | | | |
| Acquired below market lease intangibles, less accumulated amortization of $3,907 and $3,461, respectively | 14,524 |
| | 134 |
| (a) | 14,658 |
|
| Distributions payable | 375 |
| | — |
| | 375 |
|
| Other liabilities | 1,252 |
| | 289 |
| (d) | 1,541 |
|
| Total liabilities | 128,573 |
| | 48,188 |
| | 176,761 |
|
| Stockholders' Equity: | | | | | |
| Preferred stock, $0.01 par value; 50,000,000 shares authorized; none issued | — |
| | — |
| | — |
|
| Class A common stock, $0.01 par value; 200,000,000 shares authorized; 3,731,104 and 3,574,584 issued and outstanding, respectively | 37 |
| | — |
| | 37 |
|
| Class I common stock, $0.01 par value; 200,000,000 shares authorized; 7,385,408 and 6,132,292 issued and outstanding, respectively | 74 |
| | 4 |
| (e) | 78 |
|
| Class T common stock, $0.01 par value; 250,000,000 shares authorized; 777,658 and 628,863 issued and outstanding, respectively | 8 |
| | — |
| | 8 |
|
| Class D common stock, $0.01 par value; 50,000,000 shares authorized; 176,101 and none issued and outstanding, respectively | 2 |
| | — |
| | 2 |
|
| Class N common stock, $0.01 par value; 300,000,000 shares authorized; none issued | — |
| | — |
| | — |
|
| Additional paid-in capital | 138,040 |
| | 5,121 |
| (e) | 143,161 |
|
| Deficit | (40,286 | ) | | — |
| | (40,286 | ) |
| Accumulated other comprehensive income | — |
| | — |
| | — |
|
| Total stockholders' equity | 97,875 |
| | 5,125 |
| | 103,000 |
|
| Total liabilities and stockholders' equity | $ | 226,448 |
| | $ | 53,313 |
| | $ | 279,761 |
|
The accompanying notes are an integral part of this pro forma consolidated balance sheet.
RREEF PROPERTY TRUST, INC.
NOTES TO PRO FORMA CONSOLIDATED BALANCE SHEET
June 30, 2019
(unaudited, dollar amounts in thousands)
NOTE 1 — ACQUISITION
On September 16, 2019, RREEF Property Trust, Inc. (the "Company") acquired Providence Square, a home improvement anchored community retail center with a grocery component located in Marietta, Georgia (the "Property"). The purchase price for the Property was $54,842, exclusive of closing costs. The Property contains five buildings leased to 26 tenants across 222,805 square feet, inclusive of one freestanding building of 5,779 square feet subject to a ground lease. All leases in Providence Square are modified gross leases obligating the tenants to pay their share of certain common area costs as defined in each respective lease. Providence Square is managed by a third party manager.
NOTE 2 — PRO FORMA ADJUSTMENTS
| |
| (a) | Reflects the purchase price allocation for the acquisition of Providence Square including $219 of acquisition costs that are capitalized because the transaction was determined to be an asset acquisition. |
| |
| (b) | Reflects utilization of existing cash to close the acquisition. |
| |
| (c) | Reflects the borrowing of $18,300 under the Company's line of credit and a secured, fully non-recourse loan for $29,700, net of $250 of deferred financing costs. |
| |
| (d) | Reflects prepaid assets and liabilities assumed upon acquisition, which primarily related to prepaid rents, accrued real estate taxes and security deposits. |
| |
| (e) | Reflects additional capital required to close the acquisition. Such capital was raised subsequent to June 30, 2019 and prior to closing the acquisition. |
RREEF PROPERTY TRUST, INC.
PRO FORMA CONSOLIDATED STATEMENT OF OPERATIONS
For the Six Months Ended June 30, 2019
(unaudited, in thousands, except per share data)
The accompanying unaudited Pro Forma Consolidated Statement of Operations of the Company for the six months ended June 30, 2019 are based on the Historical Consolidated Statement of Operations of the Company adjusted for the completed acquisition and related transactions.
The Pro Forma Consolidated Statement of Operations for the six months ended June 30, 2019 assumes all of the following occurred on January 1, 2018:
| |
| • | The acquisition of Providence Square for $54,842, excluding closing costs; |
| |
| • | The borrowing of a secured, fully non-recourse loan for $29,700 from Nationwide Life Insurance Company; and |
| |
| • | The additional borrowing of $18,300 from the Company's line of credit with Wells Fargo Bank, at the average interest rate in effect during the period presented. |
This Pro Forma Consolidated Statement of Operations should be read in conjunction with the Company’s historical financial statements and notes thereto for the six months ended June 30, 2019, as contained in the Company’s Quarterly Report on Form 10-Q. In the opinion of the Company’s management, all material adjustments necessary to reflect the effects of the preceding transactions have been made. The unaudited Pro Forma Consolidated Statement of Operations is presented for illustrative purposes only and is not necessarily indicative of what the actual results of operations would have been had the transactions described above occurred on January 1, 2018, nor does it purport to represent the future results of operations of the Company.
|
| | | | | | | | | | | |
| | Historical - Six months ended June 30, 2019 (as reported) | | Providence Square | | Pro Forma |
| Revenues | | | | | |
| Property related income | $ | 11,326 |
| | $ | 2,129 |
| (a) | $ | 13,455 |
|
| Investment income on marketable securities | 301 |
| | — |
| | 301 |
|
| Total revenues | 11,627 |
| | 2,129 |
| | 13,756 |
|
| Expenses | | | | | |
| General and administrative expenses | 1,040 |
| | — |
| | 1,040 |
|
| Property operating expenses | 3,605 |
| | 529 |
| (a) | 4,134 |
|
| Advisory fees | 932 |
| | — |
| | 932 |
|
| Depreciation | 2,646 |
| | 648 |
| (a) | 3,294 |
|
| Amortization | 2,300 |
| | 576 |
| (a) | 2,876 |
|
| Total operating expenses | 10,523 |
| | 1,753 |
| | 12,276 |
|
| Net realized gain upon sale of marketable securities | 265 |
| | — |
| | 265 |
|
| Net unrealized change in fair value of investment in marketable securities | 2,355 |
| | — |
| | 2,355 |
|
| Operating income | 3,724 |
| | 376 |
| | 4,100 |
|
| Interest expense | (2,489 | ) | | (949 | ) | (b) | (3,438 | ) |
| Net (loss) income | $ | 1,235 |
| | $ | (573 | ) | | $ | 662 |
|
| Basic and diluted net income per share of Class A common stock | $ | 0.11 |
| | | | $ | 0.06 |
|
| Basic and diluted net income per share of Class I common stock | $ | 0.11 |
| | | | $ | 0.06 |
|
| Basic and diluted net income per share of Class T common stock | $ | 0.11 |
| | | | $ | 0.06 |
|
| Basic and diluted net income per share of Class D common stock | $ | 0.13 |
| | | | $ | 0.07 |
|
The accompanying notes are an integral part of this pro forma consolidated statement of operations.
RREEF PROPERTY TRUST, INC.
NOTES TO PRO FORMA CONSOLIDATED STATEMENT OF OPERATIONS
For the Six Months Ended June 30, 2019
(unaudited, in thousands except square foot data)
NOTE 1 — ACQUISITION
On September 16, 2019, RREEF Property Trust, Inc. (the "Company") acquired Providence Square, a home improvement anchored community retail center with a grocery component located in Marietta, Georgia (the "Property"). The purchase price for the Property was $54,842, exclusive of closing costs. The Property contains five buildings leased to 26 tenants across 222,805 square feet, inclusive of one freestanding building of 5,779 square feet subject to a ground lease. All leases in Providence Square are modified gross leases obligating the tenants to pay their share of certain common area costs as defined in each respective lease. Providence Square is managed by a third party manager.
NOTE 2 — PRO FORMA ADJUSTMENTS
| |
| (a) | Reflects the operating results of the properties, including depreciation expense, amortization expense, and a decrease to rental revenue related to allocation of the purchase price to building and improvements, acquired intangible lease assets, and acquired above- and below-market lease intangibles in accordance with ASC 805. Commercial building and improvements are depreciated over 20 to 40 years on a straight-line basis. Amounts allocated to acquired intangible lease assets and acquired above- and below-market lease intangibles are amortized over the remaining term of the leases. Rental revenue was reduced by $2 for amortization of above- and below-market lease intangibles. |
| |
| (b) | Includes (1) interest expense on the additional borrowing of $18,300 on the Company's Wells Fargo line of credit as of January 1, 2018 at an effective interest rate of 4.44%, which is the average rate of the one-month LIBOR for the six months ended June 30, 2019 plus a spread of 1.60%, and which is a close approximation of the actual interest rates in effect during the first two quarters of 2019, (2) interest expense on the origination of a $29,700 secured, fully non-recourse loan with Nationwide Life Insurance Company as of January 1, 2018 at a fixed interest rate of 3.67% for the first 2 quarters of 2019, and (3) amortization of the associated $250 of deferred financing costs over the term of the Nationwide Life Insurance Company loan of 10 years. |
The actual interest rate on the additional borrowing of $18,300 on the Providence Square acquisition date of September 16, 2019 was 3.78%. If this interest rate had been used in the pro forma consolidated statement of operations for the six months ended June 30, 2019, the interest expense adjustment would have been approximately $66 lower.
RREEF PROPERTY TRUST, INC.
PRO FORMA CONSOLIDATED STATEMENT OF OPERATIONS
For the Year Ended December 31, 2018
(unaudited, in thousands, except per share data)
The accompanying unaudited Pro Forma Consolidated Statement of Operations of the Company for the year ended December 31, 2018 is based on the Historical Consolidated Statement of Operations of the Company adjusted for the completed acquisition and related transactions.
The Pro Forma Consolidated Statement of Operations for the year ended December 31, 2018 assumes all of the following occurred on January 1, 2018:
| |
| • | The acquisition of Providence Square for $54,842, excluding closing costs; |
| |
| • | The borrowing of a secured, fully non-recourse loan for $29,700 from Nationwide Life Insurance Company; and |
| |
| • | The additional borrowing of $18,300 from the Company's line of credit with Wells Fargo Bank, at the average interest rate in effect during the period presented. |
This Pro Forma Consolidated Statement of Operations should be read in conjunction with the Company’s historical financial statements and notes thereto for the year ended December 31, 2018, as contained in the Company’s Annual Report on Form 10-K. In the opinion of the Company’s management, all material adjustments necessary to reflect the effects of the preceding transactions have been made. The unaudited Pro Forma Consolidated Statement of Operations is presented for illustrative purposes only and is not necessarily indicative of what the actual results of operations would have been had the transactions described above occurred on January 1, 2018, nor does it purport to represent the future results of operations of the Company.
|
| | | | | | | | | | | |
| | Historical - Year ended December 31, 2018 (as reported) | | Providence Square | | Pro Forma |
| Revenues | | | | | |
| Rental and other property income | 16,372 |
| | $ | 3,224 |
| (a) | $ | 19,596 |
|
| Tenant reimbursement income | 2,540 |
| | 927 |
| (a) | 3,467 |
|
| Investment income on marketable securities | 506 |
| | — |
| | 506 |
|
| Total revenues | 19,418 |
| | 4,151 |
| | 23,569 |
|
| Expenses | | | | | |
| General and administrative expenses | 1,894 |
| | — |
| | 1,894 |
|
| Property operating expenses | 5,876 |
| | 968 |
| (a) | 6,844 |
|
| Advisory expenses | 1,842 |
| | — |
| | 1,842 |
|
| Depreciation | 4,504 |
| | 1,295 |
| (a) | 5,799 |
|
| Amortization | 4,133 |
| | 1,432 |
| (a) | 5,565 |
|
| Total operating expenses | 18,249 |
| | 3,695 |
| | 21,944 |
|
| Net realized loss upon sale of marketable securities | (416 | ) | | — |
| | (416 | ) |
| Net unrealized change in fair value of investment in marketable securities | (647 | ) | | — |
| | (647 | ) |
| Operating income | 106 |
| | 456 |
| | 562 |
|
| Interest expense | (3,835 | ) | | (1,753 | ) | (b) | (5,588 | ) |
| Net loss | $ | (3,729 | ) | | $ | (1,297 | ) | | $ | (5,026 | ) |
| Basic and diluted net loss per share of Class A common stock | $ | (0.40 | ) | | | | $ | (0.55 | ) |
| Basic and diluted net loss per share of Class I common stock | $ | (0.42 | ) | | | | $ | (0.56 | ) |
| Basic and diluted net loss per share of Class T common stock | $ | (0.39 | ) | | | | $ | (0.54 | ) |
The accompanying notes are an integral part of this pro forma consolidated statement of operations.
RREEF PROPERTY TRUST, INC.
NOTES TO PRO FORMA CONSOLIDATED STATEMENT OF OPERATIONS
For the Year Ended December 31, 2018
(unaudited, in thousands except square foot data)
NOTE 1 — ACQUISITIONS
On September 16, 2019, RREEF Property Trust, Inc. (the "Company") acquired Providence Square, a home improvement anchored community retail center with a grocery component located in Marietta, Georgia (the "Property"). The purchase price for the Property was $54,842, exclusive of closing costs. The Property contains five buildings leased to 26 tenants across 222,805 square feet, inclusive of one freestanding building of 5,779 square feet subject to a ground lease. All leases in Providence Square are modified gross leases obligating the tenants to pay their share of certain common area costs as defined in each respective lease. Providence Square is managed by a third party manager.
NOTE 2 — PRO FORMA ADJUSTMENTS
| |
| (a) | Reflects the operating results of the properties, including depreciation expense, amortization expense, and a decrease to rental revenue related to allocation of the purchase price to building and improvements, acquired intangible lease assets, and acquired above- and below-market lease intangibles in accordance with ASC 805. Commercial building and improvements are depreciated over 20 to 40 years on a straight-line basis. Amounts allocated to acquired intangible lease assets and acquired above- and below-market lease intangibles are amortized over the remaining term of the leases. Rental revenue was reduced by $3 for amortization of above- and below-market lease intangibles. |
| |
| (b) | Includes (1) interest expense on the additional borrowing of $18,300 on the Company's Wells Fargo line of credit as of January 1, 2018 at an effective interest rate of 3.64%, which is the average rate of the one-month LIBOR for the year ended December 31, 2018 plus a weighted average spread of 1.62%, and which is a close approximation of the actual interest rates in effect during the year ended December 31, 2018, (2) interest expense on the origination of a $29,700 secured, fully non-recourse loan with Nationwide Life Insurance Company as of January 1, 2018 at a fixed interest rate of 3.67%, and (3) amortization of the associated $250 of deferred financing costs over the term of the Nationwide Life Insurance Company loan of 10 years. |
The actual interest rate on the additional borrowing of $18,300 on the Providence Square acquisition date of September 16, 2019 was 3.78%. If this interest rate had been used in the pro forma consolidated statement of operations for the year ended December 31, 2018, the interest expense adjustment would have been approximately $26 higher.
SIGNATURES
Pursuant to the requirements of the Securities Exchange Act of 1934, as amended, the registrant has duly caused this report to be signed on its behalf by the undersigned thereunto duly authorized.
|
| |
RREEF Property Trust, Inc. |
| By: | /s/ Eric Russell |
| Name: | Eric Russell |
| Title: | Chief Financial Officer (Principal Financial and Accounting Officer) |
Date: November 8, 2019