Issuer Free Writing Prospectus
Filed Pursuant to Rule 433
Registration File No.: 333-172366-02
Date: March 12, 2012
 |  |
Free Writing Prospectus
Structural and Collateral Term Sheet
$925,007,833
(Approximate Aggregate Cut-off Date Balance of Mortgage Pool)
$790,881,000
(Approximate Aggregate Principal Balance of Offered Certificates)
WFRBS Commercial Mortgage Trust 2012-C6
as Issuing Entity
Wells Fargo Commercial Mortgage Securities, Inc.
as Depositor
Wells Fargo Bank, National Association
The Royal Bank of Scotland
Liberty Island Group I LLC
C-III Commercial Mortgage LLC
Basis Real Estate Capital II, LLC
as Sponsors and Mortgage Loan Sellers
Commercial Mortgage Pass-Through Certificates
Series 2012-C6
March 12, 2012
| WELLS FARGO SECURITIES | RBS | |
| Co-Lead Manager and | Co-Lead Manager and | |
| Co-Bookrunner | Co-Bookrunner | |
Citigroup
Co-Manager
STATEMENT REGARDING THIS FREE WRITING PROSPECTUS
The depositor has filed a registration statement (including a prospectus) with the Securities and Exchange Commission (“SEC”) (SEC File No. 333-172366) for the offering to which this communication relates. Before you invest, you should read the prospectus in the registration statement and other documents the depositor has filed with the SEC for more complete information about the depositor, the issuing entity and this offering. You may get these documents for free by visiting EDGAR on the SEC Web site at www.sec.gov. Alternatively, the depositor, any underwriter, or any dealer participating in the offering will arrange to send you the prospectus after filing if you request it by calling toll free 1-800-745-2063 (8 a.m. – 5 p.m. EST) or by emailing wfs.cmbs@wellsfargo.com.
Nothing in this document constitutes an offer of securities for sale in any other jurisdiction where the offer or sale is not permitted. The information contained herein is preliminary as of the date hereof, supersedes any such information previously delivered to you and will be superseded by any such information subsequently delivered and ultimately by the final prospectus relating to the securities. These materials are subject to change, completion, supplement or amendment from time to time.
STATEMENT REGARDING ASSUMPTIONS AS TO SECURITIES, PRICING ESTIMATES AND OTHER INFORMATION
The attached information contains certain tables and other statistical analyses (the “Computational Materials”) which have been prepared in reliance upon information furnished by the Mortgage Loan Sellers. Numerous assumptions were used in preparing the Computational Materials, which may or may not be reflected herein. As such, no assurance can be given as to the Computational Materials’ accuracy, appropriateness or completeness in any particular context; or as to whether the Computational Materials and/or the assumptions upon which they are based reflect present market conditions or future market performance. The Computational Materials should not be construed as either projections or predictions or as legal, tax, financial or accounting advice. You should consult your own counsel, accountant and other advisors as to the legal, tax, business, financial and related aspects of a purchase of these securities. Any weighted average lives, yields and principal payment periods shown in the Computational Materials are based on prepayment and/or loss assumptions, and changes in such prepayment and/or loss assumptions may dramatically affect such weighted average lives, yields and principal payment periods. In addition, it is possible that prepayments or losses on the underlying assets will occur at rates higher or lower than the rates shown in the attached Computational Materials. The specific characteristics of the securities may differ from those shown in the Computational Materials due to differences between the final underlying assets and the preliminary underlying assets used in preparing the Computational Materials. The principal amount and designation of any security described in the Computational Materials are subject to change prior to issuance. None of Wells Fargo Securities, LLC (“WFS”), RBS Securities Inc. (“RBSSI”), Citigroup Global Markets Inc. or any of their respective affiliates make any representation or warranty as to the actual rate or timing of payments or losses on any of the underlying assets or the payments or yield on the securities. The information in this presentation is based upon management forecasts and reflects prevailing conditions and management’s views as of this date, all of which are subject to change. In preparing this presentation, we have relied upon and assumed, without independent verification, the accuracy and completeness of all information available from public sources or which was provided to us by or on behalf of the Mortgage Loan Sellers or which was otherwise reviewed by us.
This free writing prospectus contains certain forward-looking statements. If and when included in this free writing prospectus, the words “expects”, “intends”, “anticipates”, “estimates” and analogous expressions and all statements that are not historical facts, including statements about our beliefs or expectations, are intended to identify forward-looking statements. Any forward-looking statements are made subject to risks and uncertainties which could cause actual results to differ materially from those stated. Those risks and uncertainties include, among other things, declines in general economic and business conditions, increased competition, changes in demographics, changes in political and social conditions, regulatory initiatives and changes in customer preferences, many of which are beyond our control and the control of any other person or entity related to this offering. The forward-looking statements made in this free writing prospectus are made as of the date stated on the cover. We have no obligation to update or revise any forward-looking statement.
Wells Fargo Securities is the trade name for certain capital markets and investment banking services of Wells Fargo & Company and its subsidiaries, including Wells Fargo Securities, LLC, member FINRA and SIPC, and Wells Fargo Bank, National Association.
RBS is a trade name for the investment banking business of RBSSI. Securities, syndicated loan arranging, financial advisory and other investment banking activities are performed by RBSSI and their securities affiliates. Lending, derivatives and other commercial banking activities are performed by The Royal Bank of Scotland plc and their banking affiliates. RBSSI is a member of SIPC, FINRA and the NYSE.
IRS CIRCULAR 230 NOTICE
THIS TERM SHEET IS NOT INTENDED OR WRITTEN TO BE USED, AND CANNOT BE USED, FOR THE PURPOSE OF AVOIDING U.S. FEDERAL, STATE OR LOCAL TAX PENALTIES. THIS TERM SHEET IS WRITTEN AND PROVIDED BY THE DEPOSITOR IN CONNECTION WITH THE PROMOTION OR MARKETING BY THE DEPOSITOR AND THE CO-LEAD BOOKRUNNING MANAGERS OF THE TRANSACTION OR MATTERS ADDRESSED HEREIN. INVESTORS SHOULD SEEK ADVICE BASED ON THEIR PARTICULAR CIRCUMSTANCES FROM AN INDEPENDENT TAX ADVISOR.
IMPORTANT NOTICE REGARDING THE OFFERED CERTIFICATES
The Offered Certificates referred to in these materials and the asset pool backing them are subject to modification or revision (including the possibility that one or more classes of certificates may be split, combined or eliminated at any time prior to issuance or availability of a final prospectus) and are offered on a “when, as and if issued” basis. Prospective investors should understand that, when considering the purchase of the Offered Certificates, a contract of sale will come into being no sooner than the date on which the relevant class of certificates has been priced and the underwriters have confirmed the allocation of certificates to be made to investors; any “indications of interest” expressed by any prospective investor, and any “soft circles” generated by the underwriters, will not create binding contractual obligations for such prospective investors, on the one hand, or the underwriters, the depositor or any of their respective agents or affiliates, on the other hand.
As a result of the foregoing, a prospective investor may commit to purchase certificates that have characteristics that may change, and each prospective investor is advised that all or a portion of the certificates referred to in these materials may be issued without all or certain of the characteristics described in these materials. The underwriters’ obligation to sell certificates to any prospective investor is conditioned on the certificates and the transaction having the characteristics described in these materials. If the underwriters determine that a condition is not satisfied in any material respect, such prospective investor will be notified, and neither the depositor nor the underwriters will have any obligation to such prospective investor to deliver any portion of the Offered Certificates which such prospective investor has committed to purchase, and there will be no liability between the underwriters, the depositor or any of their respective agents or affiliates, on the one hand, and such prospective investor, on the other hand, as a consequence of the non-delivery.
Each prospective investor has requested that the underwriters provide to such prospective investor information in connection with such prospective investor’s consideration of the purchase of the certificates described in these materials. These materials are being provided to each prospective investor for informative purposes only in response to such prospective investor’s specific request. The underwriters described in these materials may from time to time perform investment banking services for, or solicit investment banking business from, any company named in these materials. The underwriters and/or their affiliates or respective employees may from time to time have a long or short position in any security or contract discussed in these materials.
The information contained herein supersedes any previous such information delivered to any prospective investor and will be superseded by information delivered to such prospective investor prior to the time of sale.
IMPORTANT NOTICE RELATING TO AUTOMATICALLY-GENERATED EMAIL DISCLAIMERS
Any legends, disclaimers or other notices that may appear at the bottom of any email communication to which this free writing prospectus is attached relating to (1) these materials not constituting an offer (or a solicitation of an offer), (2) no representation that these materials are accurate or complete and may not be updated or (3) these materials possibly being confidential, are not applicable to these materials and should be disregarded. Such legends, disclaimers or other notices have been automatically generated as a result of these materials having been sent via Bloomberg or another system.
THE INFORMATION IN THIS STRUCTURAL AND COLLATERAL TERM SHEET IS NOT COMPLETE AND MAY BE AMENDED PRIOR TO THE TIME OF SALE. THIS TERM SHEET IS NOT AN OFFER TO SELL THESE SECURITIES AND IT IS NOT A SOLICITATION OF AN OFFER TO BUY THESE SECURITIES IN ANY JURISDICTION WHERE THE OFFER OR SALE IS NOT PERMITTED.
2
WFRBS Commercial Mortgage Trust 2012-C6 | Certificate Structure |
| I. | Certificate Structure |
Class | Expected Ratings | Approximate Initial Certificate Balance or Notional Amount(2) | Approx. Initial Credit Support(3) | Pass- Through Rate Description | Weighted Average Life (Years)(4) | Expected Principal | Certificate Principal to Value Ratio(5) | Certificate Principal U/W NOI Debt Yield(6) | ||||||||
| Offered Certificates | ||||||||||||||||
A-1 | AAA(sf)/Aaa(sf)/AAA(sf) | $57,427,000 | 30.000% | (7) | 2.30 | 5/2012 – 7/2016 | 41.8% | 17.7% | ||||||||
A-2 | AAA(sf)/Aaa(sf)/AAA(sf) | $136,818,000 | 30.000% | (7) | 4.47 | 7/2016 – 4/2017 | 41.8% | 17.7% | ||||||||
A-3 | AAA(sf)/Aaa(sf)/AAA(sf) | $67,832,000 | 30.000% | (7) | 7.20 | 4/2017 – 6/2021 | 41.8% | 17.7% | ||||||||
A-4 | AAA(sf)/Aaa(sf)/AAA(sf) | $385,428,000 | 30.000% | (7) | 9.45 | 6/2021 – 1/2022 | 41.8% | 17.7% | ||||||||
A-S | AAA(sf)/Aaa(sf)/AAA(sf) | $100,595,000 | 19.125% | (7) | 9.82 | 1/2022 – 2/2022 | 48.3% | 15.3% | ||||||||
B | AA(sf)/Aa2(sf)/AA(sf) | $42,781,000 | 14.500% | (7) | 9.95 | 2/2022 – 3/2022 | 51.0% | 14.5% | ||||||||
| Non-Offered Certificates | ||||||||||||||||
X-A | AAA(sf)/Aaa(sf)/AAA(sf) | $748,100,000(8) | N/A | Variable(9) | N/A | N/A | N/A | N/A | ||||||||
X-B | NR/NR/NR | $176,907,832(10) | N/A | Variable(11) | N/A | N/A | N/A | N/A | ||||||||
C | A(sf)/A2(sf)/A(sf) | $31,219,000 | 11.125% | (7) | 9.95 | 3/2022 – 3/2022 | 53.0% | 14.0% | ||||||||
D | BBB-(sf)/Baa3(sf)/BBB-(sf) | $47,407,000 | 6.000% | (7) | 9.96 | 3/2022 – 4/2022 | 56.1% | 13.2% | ||||||||
E | BB(sf)/Ba2(sf)/BB(sf) | $13,875,000 | 4.500% | (7) | 10.03 | 4/2022 – 4/2022 | 57.0% | 13.0% | ||||||||
F | B(sf)/B2(sf)/B(sf) | $13,875,000 | 3.000% | (7) | 10.03 | 4/2022 – 4/2022 | 57.9% | 12.8% | ||||||||
G | NR/NR/NR | $27,750,832 | 0.000% | (7) | 10.03 | 4/2022 – 4/2022 | 59.7% | 12.4% | ||||||||
Notes:
| (1) | The expected ratings presented are those of Fitch, Inc. (“Fitch”), Moody’s Investors Service, Inc. (“Moody’s”) and Kroll Bond Rating Agency, Inc. (“KBRA”) which the depositor hired to rate the rated offered certificates. One or more other nationally recognized statistical ratings organizations that were not hired by the depositor may use information they receive pursuant to Rule 17g-5 under the Securities Exchange Act of 1934, as amended (the “Exchange Act”), to rate or provide market reports and/or published commentary related to the offered certificates. We cannot assure you as to what ratings a non-hired nationally recognized statistical ratings organization would assign or that its reports will not express differing, possibly negative, views of the mortgage loans and/or the offered certificates. See “Risk Factors—Risks Related to the Offered Certificates—Ratings of the Certificates Have Substantial Limitations” and “Ratings” in the free writing prospectus, dated March 12, 2012 (the “Free Writing Prospectus”). |
| (2) | The principal balances and notional amounts set forth in the table are approximate. The actual initial principal balances and notional amounts may be larger or smaller depending on the aggregate cut-off date principal balance of the mortgage loans definitively included in the pool of mortgage loans, which aggregate cut-off date principal balance may be as much as 5% larger or smaller than the amount presented in the Free Writing Prospectus. |
| (3) | The approximate initial credit support with respect to the Class A-1, A-2, A-3 and A-4 Certificates represents the approximate credit enhancement for the Class A-1, A-2, A-3 and A-4 Certificates in the aggregate. |
| (4) | Weighted Average Lives and Expected Principal Windows are calculated based on an assumed prepayment rate of 0% CPR and the “Structuring Assumptions” described under “Glossary” in the Free Writing Prospectus. |
| (5) | The Certificate Principal to Value Ratio for each Class of Certificates (other than the Class A-1, A-2, A-3 and A-4 Certificates) is calculated by dividing the aggregate principal balance of such class of certificates and all classes of certificates senior to such class by the aggregate appraised value of $1,550,180,000 (calculated as described in the Free Writing Prospectus) of the mortgaged properties securing the mortgage loans. The Certificate Principal to Value Ratios for each of the Class A-1, A-2, A-3 and A-4 Certificates are calculated by dividing the aggregate principal balance of the Class A-1, A-2, A-3 and A-4 Certificates by such aggregate appraised value. However, excess mortgaged property value associated with a mortgage loan will not be available to offset losses on any other mortgage loan (unless such mortgage loans are cross-collateralized and the cross-collateralization remains in effect). |
| (6) | The Certificate Principal U/W NOI Debt Yield for each Class of Certificates (other than the Class A-1, A-2, A-3 and A-4 Certificates) is calculated by dividing the underwritten net operating income for the mortgage pool of $114,804,775 (calculated as described in the Free Writing Prospectus) by the aggregate certificate balance of such class of certificates and all classes of certificates senior to such class of certificates. The Underwritten NOI Debt Yield for each of the Class A-1, A-2, A-3 and A-4 Certificates is calculated by dividing such mortgage pool underwritten net operating income by the aggregate principal balance of the Class A-1, A-2, A-3 and A-4 Certificates. However, cash flow from each mortgaged property supports only the related mortgage loan and will not be available to support any other mortgage loan (unless such mortgage loans are cross-collateralized and the cross-collateralization remains in effect). |
| (7) | The pass-through rates for the Class A-1, A-2, A-3, A-4, A-S, B, C, D, E, F and G Certificates in each case will be one of the following: (i) a fixed rateper annum, (ii) the WAC Rate (as defined in the Free Writing Prospectus) for the related distribution date, (iii) a variable rateper annum equal to the lesser of (a) a fixed rate and (b) the WAC Rate for the related distribution date or (iv) a variable rateper annum equal to the WAC Rate for the related distribution date minus a specified percentage. |
| (8) | The Class X-A Certificates are notional amount certificates. The Notional Amount of the Class X-A Certificates will be equal to the aggregate principal balance of the Class A-1, A-2, A-3, A-4 and A-S Certificates outstanding from time to time. The Class X-A Certificates will not be entitled to distributions of principal. |
| (9) | The pass-through rate for the Class X-A Certificates for any distribution date will equal the excess, if any, of (a) the WAC Rate for the related distribution date, over (b) the weighted average of the pass-through rates on the Class A-1, A-2, A-3, A-4 and A-S Certificates for the related distribution date, weighted on the basis of their respective aggregate principal balances outstanding immediately prior to that distribution date. |
| (10) | The Class X-B Certificates are notional amount certificates. The Notional Amount of the Class X-B Certificates will be equal to the aggregate principal balance of the Class B, C, D, E, F and G Certificates outstanding from time to time. The Class X-B Certificates will not be entitled to distributions of principal. |
| (11) | The pass-through rate for the Class X-B Certificates for any distribution date will equal the excess, if any, of (a) the WAC Rate for the related distribution date, over (b) the weighted average of the pass-through rates on the Class B, C, D, E, F and G Certificates for the related distribution date, weighted on the basis of their respective aggregate principal balances outstanding immediately prior to that distribution date. |
THE INFORMATION IN THIS STRUCTURAL AND COLLATERAL TERM SHEET IS NOT COMPLETE AND MAY BE AMENDED PRIOR TO THE TIME OF SALE. THIS TERM SHEET IS NOT AN OFFER TO SELL THESE SECURITIES AND IT IS NOT A SOLICITATION OF AN OFFER TO BUY THESE SECURITIES IN ANY JURISDICTION WHERE THE OFFER OR SALE IS NOT PERMITTED.
3
WFRBS Commercial Mortgage Trust 2012-C6 | Transaction Highlights |
| II. | Transaction Highlights |
Mortgage Loan Sellers:
Mortgage Loan Seller | Number of Mortgage Loans | Number of Mortgaged Properties | Aggregate Cut-off Date Balance | % of Cut-off Date Pool Balance | ||||||
Wells Fargo Bank, National Association | 35 | 63 | $506,055,754 | 54.7% | ||||||
The Royal Bank of Scotland(1) | 24 | 26 | 210,002,034 | 22.7 | ||||||
Liberty Island Group I LLC | 7 | 11 | 85,439,504 | 9.2 | ||||||
C-III Commercial Mortgage LLC | 17 | 21 | 74,362,217 | 8.0 | ||||||
Basis Real Estate Capital II, LLC | 6 | 31 | 49,148,324 | 5.3 | ||||||
|
|
|
|
|
| |||||
Total | 89 | 152 | $925,007,833 | 100.0% | ||||||
|
|
|
|
| ||||||
| (1) | The mortgage loan seller referred to herein as The Royal Bank of Scotland is comprised of two affiliated companies: The Royal Bank of Scotland plc and RBS Financial Products Inc. With respect to the mortgage loans being sold for the deposit into the trust by The Royal Bank of Scotland (a) Twenty (20) mortgage loans, having an aggregate cut-off date principal balance of $174,648,065 and representing 18.9% of the aggregate principal balance of the pool of mortgage loans as of the cut-off date, are being sold for deposit into the trust only by The Royal Bank of Scotland plc and (b) Four (4) mortgage loans, having an aggregate cut-off date principal balance of $35,353,969 and representing 3.8% of the aggregate principal balance of the pool of mortgage loans as of the cut-off date are being sold for the deposit into the trust only by RBS Financial Products Inc. |
Loan Pool:
Cut-off Date Balance: | $ | 925,007,833 | ||
Number of Mortgage Loans: | 89 | |||
Average Cut-off Date Balance per Mortgage Loan: | $10,393,346 | |||
Number of Mortgaged Properties: | 152 | |||
Average Cut-off Date Balance per Mortgaged Property(1): | $6,085,578 | |||
Weighted Average Mortgage Interest Rate: | 5.598% | |||
Ten Largest Mortgage Loans as % of Cut-off Date Pool Balance: | 37.5% | |||
Weighted Average Original Term to Maturity (months): | 111 | |||
Weighted Average Remaining Term to Maturity (months): | 106 | |||
Weighted Average Original Amortization Term (months)(2): | 332 | |||
Weighted Average Remaining Amortization Term (months)(2): | 329 | |||
Weighted Average Seasoning (months): | 5 |
| (1) | Information regarding mortgage loans secured by multiple properties (other than through cross-collateralization with other mortgage loans) is based on an allocation according to relative appraised values or the allocated loan amounts or property-specific release prices set forth in related loan documents. Information regarding mortgage loans that are cross-collateralized with other mortgage loans is based upon the individual loan balances, except that the applicable loan-to-value ratio, debt service coverage ratio or debt yield for each such mortgage loan is based upon the ratio or yield (as applicable) for the aggregate indebtedness evidenced by all loans in the group. On an individual basis, without regard to the cross-collateralization feature, any mortgage loan that is part of a cross-collateralized group of mortgage loans may have a higher loan-to-value ratio, lower debt service coverage ratio and/or lower debt yield than is presented herein. |
| (2) | Excludes any mortgage loan that does not amortize. |
Credit Statistics:
Weighted Average U/W Net Cash Flow DSCR(1): | 1.58x | |||
Weighted Average U/W Net Operating Income Debt Yield Ratio(1): | 12.4% | |||
Weighted Average Cut-off Date Loan-to-Value Ratio(1): | 61.1% | |||
Weighted Average Balloon Loan-to-Value Ratio(1): | 51.2% | |||
% of Mortgage Loans with Additional Debt: | 2.3% | |||
% of Mortgage Loans with Single Tenants(2): | 12.8% |
| (1) | Information regarding mortgage loans secured by multiple properties (other than through cross-collateralization with other mortgage loans) is based on an allocation according to relative appraised values or the allocated loan amounts or property-specific release prices set forth in related loan documents. Information regarding mortgage loans that are cross- collateralized with other mortgage loans is based upon the individual loan balances, except that the applicable loan-to-value ratio, debt service coverage ratio or debt yield for each such mortgage loan is based upon the ratio or yield (as applicable) for the aggregate indebtedness evidenced by all loans in the group. On an individual basis, without regard to the cross-collateralization feature, any mortgage loan that is part of a cross-collateralized group of mortgage loans may have a higher loan-to-value ratio, lower debt service coverage ratio and/or lower debt yield than is presented herein. |
| (2) | Excludes mortgage loans that are secured by multiple single-tenant properties. |
THE INFORMATION IN THIS STRUCTURAL AND COLLATERAL TERM SHEET IS NOT COMPLETE AND MAY BE AMENDED PRIOR TO THE TIME OF SALE. THIS TERM SHEET IS NOT AN OFFER TO SELL THESE SECURITIES AND IT IS NOT A SOLICITATION OF AN OFFER TO BUY THESE SECURITIES IN ANY JURISDICTION WHERE THE OFFER OR SALE IS NOT PERMITTED.
4
WFRBS Commercial Mortgage Trust 2012-C6 | Transaction Highlights |
Loan Structural Features:
Amortization: Based on the Cut-off Date Balance, 99.0% of the mortgage pool (88 mortgage loans) has scheduled amortization, as follows:
79.2% (82 mortgage loans) requires amortization during the entire loan term
19.8% (6 mortgage loans) provides for an interest-only period followed by an amortization period
Interest-Only: Based on the Cut-off Date Balance, 1.0% of the mortgage pool (1 mortgage loan) provides for interest-only payments during the entire loan term.
Hard Lockboxes(1): Based on the Cut-off Date Balance, 53.0% of the mortgage pool (29 mortgage loans) has hard lockboxes in place.
| (1) | With respect to the WPC Self Storage Portfolio, 25 of the underlying properties are subject to hard lockboxes with springing cash management; one property, Metro - Forth Worth, is subject to a soft lockbox with springing cash management. With respect to Parrish Portfolio, 2 of the underlying properties have soft lockboxes with springing cash management and the third property has soft lockbox with upfront cash management. Please refer to Annex A-1 for further details. |
Reserves: The mortgage loans require amounts to be escrowed monthly as follows (excluding any mortgage loans with springing provisions):
Real Estate Taxes: | 81.7% of the pool | |||||||||||||||||||||||||||||
Insurance Premiums: | 71.1% of the pool | |||||||||||||||||||||||||||||
Capital Replacements: | 89.2% of the pool | |||||||||||||||||||||||||||||
TI/LC: | 69.3% of the pool | * | ||||||||||||||||||||||||||||
* The percentage of Cut-off Date Balance for loans with TI/LC reserves is based on the aggregate principal balance allocable to office, retail, mixed-use and industrial properties. | ||||||||||||||||||||||||||||||
Call Protection/Defeasance: Based on the Cut-off Date Balance, the mortgage pool has the following call protection and defeasance features:
89.3% of the mortgage pool (75 mortgage loans) features a lockout period, then defeasance only until an open period
10.7% of the mortgage pool (14 mortgage loans) features a lockout period, then the greater of a prepayment premium or yield maintenance until an open period
Please refer to Annex A-1 to the Free Writing Prospectus for further description of individual loan call protection.
THE INFORMATION IN THIS STRUCTURAL AND COLLATERAL TERM SHEET IS NOT COMPLETE AND MAY BE AMENDED PRIOR TO THE TIME OF SALE. THIS TERM SHEET IS NOT AN OFFER TO SELL THESE SECURITIES AND IT IS NOT A SOLICITATION OF AN OFFER TO BUY THESE SECURITIES IN ANY JURISDICTION WHERE THE OFFER OR SALE IS NOT PERMITTED.
5
WFRBS Commercial Mortgage Trust 2012-C6 | Issue Characteristics |
| III. | Issue Characteristics |
Securities Offered: | $790,881,000 approximate monthly pay, multi-class, commercial mortgage REMIC pass-through certificates consisting of six classes (Classes A-1, A-2, A-3, A-4, A-S and B), which are offered pursuant to a registration statement filed with the SEC. |
Mortgage Loan Sellers: | Wells Fargo Bank, National Association (“WFB”); The Royal Bank of Scotland (“RBS”); Liberty Island Group I LLC (“LIG I”); C-III Commercial Mortgage LLC (“CIIICM”); and Basis Real Estate Capital II, LLC (“Basis”). |
Co-lead Bookrunning
Managers: | Wells Fargo Securities, LLC and RBS Securities Inc. |
Co-Manager: | Citigroup Global Markets Inc. |
Rating Agencies: | Fitch, Inc., Moody’s Investors Service, Inc. and Kroll Bond Rating Agency, Inc. |
Master Servicer: | Wells Fargo Bank, National Association |
Special Servicer: | Midland Loan Services, a division of PNC Bank, National Association |
Certificate Administrator: | Wells Fargo Bank, National Association |
Trustee: | Deutsche Bank Trust Company Americas |
Trust Advisor: | Pentalpha Surveillance LLC |
Cut-off Date: | The Cut-off Date with respect to each mortgage loan is the due date for the monthly debt service payment that is due in April 2012 (or, in the case of any mortgage loan that has its first due date in May 2012, the date that would have been its due date in April 2012 under the terms of that mortgage loan if a monthly debt service payment were scheduled to be due in that month). |
Expected Closing Date: | On or about April 4, 2012. |
Determination Dates: | The 11th day of each month (or if that day is not a business day, the next succeeding business day), commencing in May 2012. |
Distribution Dates: | The fourth business day following the Determination Date in each month, commencing in May 2012. |
Rated Final Distribution
Date: | The Distribution Date in April 2045. |
Interest Accrual Period: | With respect to any Distribution Date, the calendar month preceding the month in which such Distribution Date occurs. |
Day Count: | The Offered Certificates will accrue interest on a 30/360 basis. |
Minimum
Denominations: | $25,000 for each Class of Offered Certificates. Investments may also be made in any whole dollar denomination in excess of the applicable minimum denomination. |
Clean-up Call: | 1% |
Delivery: | DTC, Euroclear and Clearstream Banking |
ERISA/SMMEA Status: | Each Class of Offered Certificates is expected to be eligible for exemptive relief under ERISA. No Class of Offered Certificates will be SMMEA eligible. |
Risk Factors: | THE CERTIFICATES INVOLVE CERTAIN RISKS AND MAY NOT BE SUITABLE FOR ALL INVESTORS. SEE THE “RISK FACTORS” SECTION OF THE FREE WRITING PROSPECTUS. |
Bond Analytics Information: | The Certificate Administrator will generally be required to make distribution date settlements, CREFC reports and certain supplemental reports (other than confidential information) available to certain financial modeling and data provision services, including Bloomberg L.P., Trepp LLC, Intex Solutions, Inc., Markit Group Limited and BlackRock Financial Management Inc. |
THE INFORMATION IN THIS STRUCTURAL AND COLLATERAL TERM SHEET IS NOT COMPLETE AND MAY BE AMENDED PRIOR TO THE TIME OF SALE. THIS TERM SHEET IS NOT AN OFFER TO SELL THESE SECURITIES AND IT IS NOT A SOLICITATION OF AN OFFER TO BUY THESE SECURITIES IN ANY JURISDICTION WHERE THE OFFER OR SALE IS NOT PERMITTED.
6
WFRBS Commercial Mortgage Trust 2012-C6 | Characteristics of the Mortgage Pool |
| IV. | Characteristics of the Mortgage Pool |
| A. | Ten Largest Mortgage Loans |
Mortgage | Mortgage Loan Name | City | State | Number of Mortgage Loans / Mortgaged Properties | Mortgage Loan Cut-off Date Balance ($) | % of Cut-off Date Balance (%) | Property Type | Number of SF, Rooms or Pads | Cut-off Date Balance Per SF, Room or Pad ($) | Cut-off Date LTV Ratio (%) | Balloon LTV Ratio (%) | U/W NCF DSCR (x) | U/W NOI Debt Yield (%) | |||||||||||||||||
WFB | National Cancer Institute Center | Frederick | MD | 1 / 1 | $76,500,000 | 8.3% | Office | 341,271 | $224 | 61.7% | 51.2% | 1.30x | 10.2% | |||||||||||||||||
WFB | Windsor Hotel Portfolio II | Various | Various | 1 / 4 | 67,279,272 | 7.3 | Hospitality | 901 | 74,672 | 59.9 | 54.5 | 1.66 | 14.7 | |||||||||||||||||
WFB | WPC Self Storage Portfolio | Various | Various | 1 / 26 | 48,157,500 | 5.2 | Self Storage | 1,718,350 | 28 | 49.1 | 45.4 | 1.84 | 12.9 | |||||||||||||||||
WFB | Norwalk Town Square | Norwalk | CA | 1 / 1 | 27,259,020 | 2.9 | Retail | 232,987 | 117 | 58.6 | 49.0 | 1.64 | 11.8 | |||||||||||||||||
WFB | Resort MHC | Mesa | AZ | 1 / 1 | 22,801,387 | 2.5 | Manufactured Housing Community | 791 | 28,826 | 74.1 | 62.1 | 1.51 | 10.3 | |||||||||||||||||
WFB | Citrus Crossing | Azusa | CA | 1 / 1 | 22,307,737 | 2.4 | Retail | 172,533 | 129 | 54.4 | 45.6 | 1.54 | 11.5 | |||||||||||||||||
WFB | Boca Industrial Park | Boca Raton | FL | 1 / 1 | 22,250,000 | 2.4 | Industrial | 386,846 | 58 | 60.3 | 55.7 | 1.59 | 11.5 | |||||||||||||||||
RBS | Lexington Hotel Portfolio | West Chester | OH | 1 / 2 | 20,473,784 | 2.2 | Hospitality | 226 | 90,592 | 60.4 | 46.8 | 1.58 | 13.7 | |||||||||||||||||
LIG I | Seven Trees Retail Portfolio | San Jose | CA | 1 / 3 | 19,958,826 | 2.2 | Retail | 156,085 | 128 | 46.0 | 38.9 | 1.74 | 13.6 | |||||||||||||||||
LIG I | El Mercado Shopping Center | Union City | CA | 1 / 1 | 19,941,865 | 2.2 | Retail | 109,468 | 182 | 55.7 | 47.2 | 1.49 | 11.6 | |||||||||||||||||
|
|
|
|
|
|
|
| |||||||||||||||||||||||
Top Three Total / Weighted Average | 3 / 31 | $191,936,772 | 20.7% | 57.9% | 50.9% | 1.56x | 12.5% | |||||||||||||||||||||||
Top Five Total / Weighted Average | 5 / 33 | $241,997,178 | 26.2% | 59.5% | 51.7% | 1.57x | 12.2% | |||||||||||||||||||||||
Top Ten Total / Weighted Average | 10 / 41 | $346,929,390 | 37.5% | 58.3% | 50.3% | 1.57x | 12.2% | |||||||||||||||||||||||
|
|
|
|
|
|
|
| |||||||||||||||||||||||
| B. | Mortgage Loans with Additional Secured and Mezzanine Financing(1) |
Loan No. | Mortgage Loan Seller | Mortgage Loan Name | Mortgage Loan Cut-off Date Balance ($) | % of Cut- off Date Balance (%) | Non-Trust Mortgage Loan Cut-off Date Balance ($) | Mezzanine Debt Cut-off Date Balance ($) | Total Debt Interest Rate (%) | Mortgage Loan U/W NCF DSCR (x) | Total Debt U/W NCF DSCR (x) | Mortgage Loan Cut- off Date U/W NOI Debt Yield (%) | Total Debt Cut-off Date U/W NOI Debt Yield (%) | Mortgage Loan Cut-off Date LTV Ratio (%) | Total Debt Cut-off Date LTV Ratio (%) | |||||||||||||||||
14 | WFB | Claremont Village Square(2) | $15,049,818 | 1.6% | $1,243,000 | $0 | 4.832% | 1.67x | 1.67x | 12.2% | 11.3% | 43.4% | 47.0% | |||||||||||||||||
53 | WFB | Elks Building(3) | 6,419,098 | 0.7 | 850,000 | 0 | 4.687 | 1.58 | 1.58 | 13.6 | 12.0 | 57.3 | 64.9 | |||||||||||||||||
|
|
|
|
|
|
|
|
|
|
|
| |||||||||||||||||||
Total/Weighted Average | $21,468,916 | 2.3% | $2,093,000 | $0 | 1.64x | 1.64x | 12.6% | 11.5% | 47.6% | 52.4% | ||||||||||||||||||||
|
|
|
|
|
|
|
|
|
|
|
| |||||||||||||||||||
| (1) | In addition, the borrowers under certain of the mortgage loans also have incurred unsecured additional debt as described in the Free Writing Prospectus. |
| (2) | The subordinate debt is secured by the mortgaged property. The secured subordinate debt requires payments to the subordinate lender from time to time only to the extent of a specified portion of cash available taking into account all debts, liabilities and obligations of the borrower then due or net insurance proceeds, condemnation proceeds or sale or refinancing proceeds after repayment of other outstanding debt. Each of the Total Debt Interest Rate and Total Debt U/W NCF DSCR for the mortgage loan and the secured subordinate debt presented in the table is the same as that for the mortgage loan only. |
| (3) | The subordinate debt is secured by the mortgaged property. The secured subordinate debt bears no interest and requires periodic payments of principal before maturity only to the extent that a restaurant operated on the premises generates income in excess of specified thresholds. Each of the Total Debt Interest Rate and Total Debt U/W NCF DSCR for the mortgage loan and the secured subordinate debt presented in the table is the same as that for the mortgage loan only. |
THE INFORMATION IN THIS STRUCTURAL AND COLLATERAL TERM SHEET IS NOT COMPLETE AND MAY BE AMENDED PRIOR TO THE TIME OF SALE. THIS TERM SHEET IS NOT AN OFFER TO SELL THESE SECURITIES AND IT IS NOT A SOLICITATION OF AN OFFER TO BUY THESE SECURITIES IN ANY JURISDICTION WHERE THE OFFER OR SALE IS NOT PERMITTED.
7
WFRBS Commercial Mortgage Trust 2012-C6 | Characteristics of the Mortgage Pool |
| C. | Previous Securitization History(1) |
Loan No. | Mortgage Loan Seller | Mortgage | City | State | Property | Mortgage Loan Cut-off Date Balance ($) | % of Cut-off Date Balance (%) | Previous Securitization | ||||||||||
| 2 | WFB | Windsor Hotel Portfolio II | Various | Various | Hospitality | $67,279,272 | 7.3% | GMACC 2005-C1 | ||||||||||
| 4 | WFB | Norwalk Town Square | Norwalk | CA | Retail | 27,259,020 | 2.9 | CCMSC 1997-2 | ||||||||||
| 7 | WFB | Boca Industrial Park | Boca Raton | FL | Industrial | 22,250,000 | 2.4 | GMACC 2002-C1 | ||||||||||
| 10 | LIG I | El Mercado Shopping Center | Union City | CA | Retail | 19,941,865 | 2.2 | JPMCC 2003-ML1A | ||||||||||
| 11 | Basis | Sunwest Portfolio | Various | Various | Retail | 19,500,000 | 2.1 | ASC 1997-D4 | ||||||||||
| 13 | WFB | Williams Centre Plaza | Tucson | AZ | Retail | 16,605,456 | 1.8 | CSFB 2005-C5 | ||||||||||
| 15 | RBS | Commerce Park IV & V | Beachwood | OH | Office | 14,985,810 | 1.6 | BACM 2002-PB2 | ||||||||||
| 22 | RBS | Hulen Bend Shopping Center | Fort Worth | TX | Retail | 13,061,681 | 1.4 | FULBA 1998-C2 | ||||||||||
| 24 | RBS | Summerhill Marketplace | East Brunswick | NJ | Retail | 12,173,719 | 1.3 | BSCMS 2005-PWR9 | ||||||||||
| 26 | RBS | Santa Rosa Southside | Santa Rosa | CA | Retail | 11,400,000 | 1.2 | GMACC 2002-C2 | ||||||||||
| 27 | RBS | Buford Plaza | Doraville | GA | Retail | 10,985,545 | 1.2 | MSC 2004-HQ3 | ||||||||||
| 33 | RBS | Southland Plaza | San Diego | CA | Retail | 9,500,000 | 1.0 | BSCMS 2004-T14 | ||||||||||
| 34 | LIG I | Lottsford Business Center | Upper Marlboro | MD | Office | 9,200,000 | 1.0 | GMACC 2002-C2 | ||||||||||
| 42 | WFB | Hilton Garden Inn - Denver Airport | Aurora | CO | Hospitality | 7,913,148 | 0.9 | BACM 2006-4 | ||||||||||
| 45 | WFB | 64th & Greenway | Phoenix | AZ | Retail | 7,550,000 | 0.8 | SBM7 2001-C2(2) | ||||||||||
| 52 | RBS | Grande Pointe Apartments | Jacksonville | FL | Multifamily | 6,465,992 | 0.7 | CSFB 1998-C2 | ||||||||||
| 55 | CIIICM | Crossings at Roswell | Roswell | GA | Retail | 3,357,178 | 0.4 | GECMC 2003-C2 | ||||||||||
| 56 | CIIICM | Cumberland Place | Smyrna | GA | Retail | 2,797,649 | 0.3 | LBUBS 2004-C2 | ||||||||||
| 57 | WFB | Natomas Self Storage | Sacramento | CA | Self Storage | 5,959,466 | 0.6 | CSFB 2002-CKP1 | ||||||||||
| 58 | CIIICM | LaCarreta | Miami | FL | Retail | 5,733,807 | 0.6 | GMACC 2002-C1 | ||||||||||
| 59 | RBS | Shady Grove Shopping Center | Irving | TX | Retail | 5,476,530 | 0.6 | BACM 2001-1 | ||||||||||
| 61 | WFB | Van Buren Estates | Belleville | MI | Manufactured Housing Community | 4,691,556 | 0.5 | JPMCC 2001-C1 | ||||||||||
| 62 | RBS | All Storage Mesquite | Mesquite | TX | Self Storage | 3,013,632 | 0.3 | BACM 2002-2 | ||||||||||
| 64 | CIIICM | King’s Row MHC | Houston | TX | Manufactured Housing Community | 4,481,943 | 0.5 | BACM 2002-2 | ||||||||||
| 67 | RBS | Shoppes at Garland | Garland | TX | Retail | 2,492,764 | 0.3 | BACM 2001-PB1 | ||||||||||
| 70 | CIIICM | Walker Plaza | Walker | LA | Retail | 3,986,102 | 0.4 | JPMCC 2005-CB11 | ||||||||||
| 72 | CIIICM | Parkway 3&4 | Virginia Beach | VA | Industrial | 3,803,723 | 0.4 | MSC 1997-C1 | ||||||||||
| 76 | Basis | Canton Center Crossing | Canton Township | MI | Retail | 3,146,097 | 0.3 | MSC 2005-HQ7 | ||||||||||
| 80 | Basis | Westfield Ridge Apartments | Humble | TX | Multifamily | 2,466,659 | 0.3 | GMACC 2002-C2 | ||||||||||
| 82 | CIIICM | Northwest Self Storage | Fort Worth | TX | Self Storage | 2,150,000 | 0.2 | BSCMS 2006-T22 | ||||||||||
| 83 | CIIICM | Leisure Living MHC | Fort Worth | TX | Manufactured Housing Community | 2,116,198 | 0.2 | LBUBS 2002-C1 | ||||||||||
| 87 | CIIICM | Apple Valley MHC | Fort Wayne | IN | Manufactured Housing Community | 1,500,000 | 0.2 | BACM 2006-4 | ||||||||||
| 89 | CIIICM | Kirkwood MHC | Binghamton | NY | Manufactured Housing Community | 1,468,823 | 0.2 | JPMCC 2002-CIB4 | ||||||||||
|
|
| ||||||||||||||||
| Total | $334,713,635 | 36.2% | ||||||||||||||||
|
|
| ||||||||||||||||
| (1) | The table above represents the most recent securitization with respect to the mortgaged property securing the related mortgage loan, based on information provided by the related borrower or obtained through searches of a third-party database. The information has not otherwise been confirmed by the mortgage loan sellers. |
| (2) | The shop space at the subject property (not including the Fry’s parcel) was securitized in SBM7 2001-C2. |
THE INFORMATION IN THIS STRUCTURAL AND COLLATERAL TERM SHEET IS NOT COMPLETE AND MAY BE AMENDED PRIOR TO THE TIME OF SALE. THIS TERM SHEET IS NOT AN OFFER TO SELL THESE SECURITIES AND IT IS NOT A SOLICITATION OF AN OFFER TO BUY THESE SECURITIES IN ANY JURISDICTION WHERE THE OFFER OR SALE IS NOT PERMITTED.
8
WFRBS Commercial Mortgage Trust 2012-C6 | Characteristics of the Mortgage Pool |
| D. | Mortgage Loans with Scheduled Balloon Payments and Related Classes |
| Class A-2(1) | ||||||||||||||||||||||||||||||||||||
Loan No. | Mortgage Loan Seller | Mortgage Loan Name | State | Property Type | Mortgage Loan Cut-off Date Balance ($) | % of Cut-off Date Balance (%) | Mortgage Loan Balance at Maturity ($) | % of Class A-2 Certificate Principal Balance (%) | SF/ Rooms/ Pads/ Units | Loan per SF/ Room/ Pad/ Unit | U/W NCF DSCR (x) | U/W NOI Debt Yield (%) | Cut-off Date LTV Ratio (%) | Balloon LTV Ratio (%) | Rem. IO Period (mos.) | Rem. Term to Maturity (mos.) | ||||||||||||||||||||
| 2 | WFB | Windsor Hotel Portfolio II | Various | Hospitality | $67,279,272 | 7.3% | $61,194,328 | 49.2% | 901 | $74,672 | 1.66x | 14.7% | 59.9% | 54.5% | 0 | 51 | ||||||||||||||||||||
| 17 | WFB | Pyramid Office | TX | Office | 14,832,658 | 1.6 | 13,387,679 | 10.8 | 218,836 | 68 | 1.51 | 13.5 | 55.3 | 50.0 | 0 | 53 | ||||||||||||||||||||
| 19 | Basis | Holiday Inn Maingate East | FL | Hospitality | 14,000,000 | 1.5 | 12,743,833 | 10.2 | 444 | 31,532 | 1.58 | 13.7 | 54.7 | 49.8 | 0 | 60 | ||||||||||||||||||||
| 23 | WFB | Hacienda MHC | CA | Manufactured Housing Community | 12,878,295 | 1.4 | 11,974,706 | 9.4 | 149 | 86,432 | 1.40 | 9.1 | 70.4 | 65.5 | 0 | 52 | ||||||||||||||||||||
| 36 | CIIICM | Florida Hotel Portfolio | FL | Hospitality | 9,092,762 | 1.0 | 8,311,993 | 6.6 | 228 | 39,881 | 1.70 | 15.8 | 56.1 | 51.3 | 0 | 58 | ||||||||||||||||||||
| 42 | WFB | Hilton Garden Inn - Denver Airport | CO | Hospitality | 7,913,148 | 0.9 | 7,349,879 | 5.8 | 157 | 50,402 | 2.10 | 16.1 | 39.6 | 36.7 | 0 | 51 | ||||||||||||||||||||
| 45 | WFB | 64th & Greenway | AZ | Retail | 7,550,000 | 0.8 | 7,073,737 | 5.5 | 79,903 | 94 | 1.25 | 10.3 | 66.2 | 62.1 | 13 | 55 | ||||||||||||||||||||
| 81 | WFB | High Cliff Estates MHP | IL | Manufactured Housing Community | 2,341,619 | 0.3 | 2,145,230 | 1.7 | 224 | 10,454 | 1.61 | 13.4 | 64.9 | 59.4 | 0 | 54 | ||||||||||||||||||||
|
|
|
|
|
|
|
|
|
|
|
| |||||||||||||||||||||||||
| Total/Weighted Average | $135,887,755 | 14.7% | $124,181,386 | 99.3% | 1.62x | 13.8% | 58.9% | 53.8% | 1 | 53 | ||||||||||||||||||||||||||
|
|
|
|
|
|
|
|
|
|
|
| |||||||||||||||||||||||||
| (1) | The table above presents the mortgage loans whose balloon payments would be applied to pay down the principal balance of the Class A-2 Certificates, assuming a 0% CPR and applying the “Structuring Assumptions” described in the Free Writing Prospectus, including the assumptions that (i) none of the mortgage loans in the pool experience prepayments, defaults or losses; (ii) there are no extensions of maturity dates of any mortgage loans in the pool; and (iii) each mortgage loan in the pool is paid in full on its stated maturity date. Each class of Certificates, including the Class A-2 Certificates, evidences undivided ownership interests in the entire pool of mortgage loans. |
THE INFORMATION IN THIS STRUCTURAL AND COLLATERAL TERM SHEET IS NOT COMPLETE AND MAY BE AMENDED PRIOR TO THE TIME OF SALE. THIS TERM SHEET IS NOT AN OFFER TO SELL THESE SECURITIES AND IT IS NOT A SOLICITATION OF AN OFFER TO BUY THESE SECURITIES IN ANY JURISDICTION WHERE THE OFFER OR SALE IS NOT PERMITTED.
9
WFRBS Commercial Mortgage Trust 2012-C6 | Characteristics of the Mortgage Pool |
| E. | Property Type Distribution |
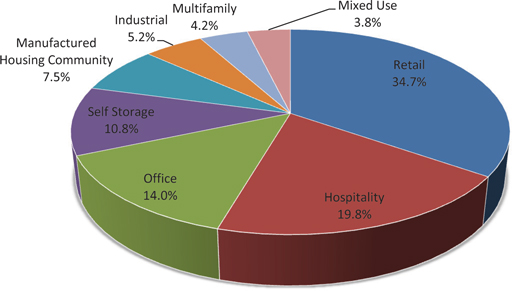
Property Type | Number of Mortgaged Properties | Aggregate Cut- off Date Balance ($)(1) | % of Cut-off Date Balance (%) | Weighted Average Cut-off Date LTV Ratio (%) | Weighted Average Balloon LTV Ratio (%) | Weighted Average U/W NCF DSCR (x) | Weighted Average U/W NOI Debt Yield (%) | Weighted Average U/W NCF Debt Yield (%) | Weighted Average Mortgage Rate (%) | |||||||||||||||||||||||||
Retail | 60 | $321,169,891 | 34.7 | % | 61.6 | % | 51.5 | % | 1.59 | x | 11.9 | % | 11.0 | % | 5.642 | % | ||||||||||||||||||
Anchored | 24 | 224,198,768 | 24.2 | 61.5 | 51.6 | 1.54 | 11.7 | 10.8 | 5.605 | |||||||||||||||||||||||||
Unanchored | 11 | 56,552,870 | 6.1 | 63.3 | 53.1 | 1.58 | 12.3 | 11.3 | 5.821 | |||||||||||||||||||||||||
Shadow Anchored | 4 | 20,266,287 | 2.2 | 54.2 | 48.8 | 2.24 | 13.8 | 12.8 | 5.444 | |||||||||||||||||||||||||
Single Tenant | 21 | 20,151,966 | 2.2 | 64.6 | 49.5 | 1.47 | 12.3 | 11.0 | 5.751 | |||||||||||||||||||||||||
Hospitality | 21 | 182,862,016 | 19.8 | 58.8 | 49.1 | 1.69 | 14.9 | 12.9 | 5.729 | |||||||||||||||||||||||||
Full Service | 6 | 89,862,408 | 9.7 | 59.1 | 52.4 | 1.66 | 14.8 | 12.5 | 5.546 | |||||||||||||||||||||||||
Limited Service | 14 | 84,410,606 | 9.1 | 58.3 | 45.8 | 1.74 | 15.2 | 13.4 | 5.898 | |||||||||||||||||||||||||
Extended Stay | 1 | 8,589,002 | 0.9 | 60.4 | 46.8 | 1.58 | 13.7 | 12.2 | 5.990 | |||||||||||||||||||||||||
Office | 6 | 129,491,535 | 14.0 | 61.4 | 51.5 | 1.40 | 11.3 | 10.0 | 5.435 | |||||||||||||||||||||||||
Medical | 2 | 84,053,969 | 9.1 | 62.1 | 51.6 | 1.31 | 10.3 | 9.3 | 5.417 | |||||||||||||||||||||||||
Suburban | 3 | 39,018,468 | 4.2 | 60.5 | 52.5 | 1.58 | 13.2 | 11.2 | 5.494 | |||||||||||||||||||||||||
CBD | 1 | 6,419,098 | 0.7 | 57.3 | 43.9 | 1.58 | 13.6 | 11.6 | 5.300 | |||||||||||||||||||||||||
Self Storage | 39 | 99,897,423 | 10.8 | 57.6 | 49.8 | 1.74 | 12.5 | 12.0 | 5.497 | |||||||||||||||||||||||||
Self Storage | 39 | 99,897,423 | 10.8 | 57.6 | 49.8 | 1.74 | 12.5 | 12.0 | 5.497 | |||||||||||||||||||||||||
Manufactured Housing Community | 12 | 68,990,219 | 7.5 | 69.4 | 58.0 | 1.49 | 10.9 | 10.6 | 5.605 | |||||||||||||||||||||||||
Manufactured Housing Community | 12 | 68,990,219 | 7.5 | 69.4 | 58.0 | 1.49 | 10.9 | 10.6 | 5.605 | |||||||||||||||||||||||||
Industrial | 5 | 48,405,671 | 5.2 | 66.6 | 54.4 | 1.49 | 11.6 | 10.8 | 5.489 | |||||||||||||||||||||||||
Flex | 4 | 43,419,135 | 4.7 | 66.2 | 53.8 | 1.48 | 11.5 | 10.7 | 5.403 | |||||||||||||||||||||||||
Warehouse | 1 | 4,986,536 | 0.5 | 69.7 | 59.7 | 1.60 | 12.8 | 11.9 | 6.240 | |||||||||||||||||||||||||
Multifamily | 6 | 39,231,090 | 4.2 | 64.7 | 52.6 | 1.50 | 12.2 | 10.9 | 5.771 | |||||||||||||||||||||||||
Garden | 4 | 21,560,867 | 2.3 | 64.5 | 50.3 | 1.58 | 13.0 | 11.7 | 5.676 | |||||||||||||||||||||||||
High Rise | 1 | 13,681,440 | 1.5 | 72.2 | 61.5 | 1.28 | 9.8 | 9.1 | 5.840 | |||||||||||||||||||||||||
Low Rise | 1 | 3,988,783 | 0.4 | 40.7 | 34.7 | 1.84 | 15.8 | 13.3 | 6.050 | |||||||||||||||||||||||||
Mixed Use | 3 | 34,959,988 | 3.8 | 50.4 | 42.0 | 1.60 | 12.0 | 10.7 | 5.331 | |||||||||||||||||||||||||
Retail/Office | 2 | 25,768,761 | 2.8 | 56.3 | 47.0 | 1.56 | 11.3 | 10.4 | 5.288 | |||||||||||||||||||||||||
Retail/Hotel/Office | 1 | 9,191,228 | 1.0 | 33.8 | 28.2 | 1.70 | 13.7 | 11.5 | 5.450 | |||||||||||||||||||||||||
|
|
|
|
|
|
|
|
|
|
|
|
|
|
|
|
| ||||||||||||||||||
Total/Weighted Average | 152 | $925,007,833 | 100 | % | 61.1 | % | 51.2 | % | 1.58 | x | 12.4 | % | 11.3 | % | 5.598 | % | ||||||||||||||||||
|
|
|
|
|
|
|
|
|
|
|
|
|
|
|
|
| ||||||||||||||||||
| (1) | Because this table presents information relating to the mortgaged properties and not the mortgage loans, (a) the information for mortgage loans secured by more than one mortgaged property (other than through cross-collateralization with other mortgage loans) is based on allocated amounts (allocating the mortgage loan principal balance to each of those properties according to the relative appraised values of the mortgaged properties or the allocated loan amounts or property-specific release prices set forth in the related mortgage loan documents), and (b) the information for each mortgaged property that relates to a mortgage loan that is cross-collateralized with other mortgage loans is based upon the principal balance of that mortgage loan, except that the applicable loan-to-value ratio, debt service coverage ratio or debt yield for each such mortgaged property is based upon the ratio or yield (as applicable) for the aggregate indebtedness evidenced by all loans in the group. On an individual basis, without regard to the cross-collateralization feature, any mortgaged property securing a mortgage loan that is part of a cross-collateralized group of mortgage loans may have a higher loan-to-value ratio, lower debt service coverage ratio and/or lower debt yield than is presented herein. |
THE INFORMATION IN THIS STRUCTURAL AND COLLATERAL TERM SHEET IS NOT COMPLETE AND MAY BE AMENDED PRIOR TO THE TIME OF SALE. THIS TERM SHEET IS NOT AN OFFER TO SELL THESE SECURITIES AND IT IS NOT A SOLICITATION OF AN OFFER TO BUY THESE SECURITIES IN ANY JURISDICTION WHERE THE OFFER OR SALE IS NOT PERMITTED.
10
WFRBS Commercial Mortgage Trust 2012-C6 | Characteristics of the Mortgage Pool |
| F. | Geographic Distribution* |
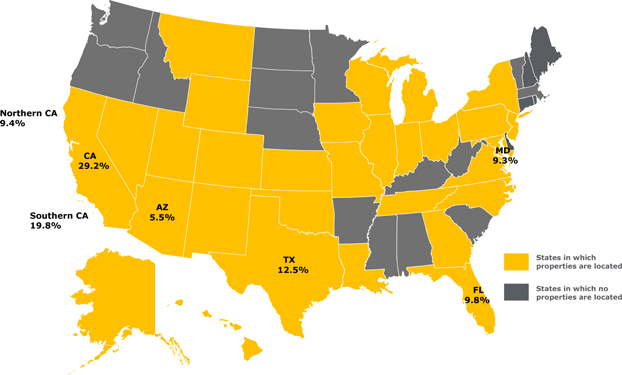
Location(1) | Number of Mortgaged Properties | Aggregate Cut- off Date Balance ($)(2) | % of Cut- off Date Balance | Weighted Average Cut-off Date LTV Ratio (%) | Weighted Average Balloon or ARD LTV Ratio (%) | Weighted Average U/W NCF DSCR (x) | Weighted Average U/W NOI Debt Yield (%) | Weighted Average U/W NCF Debt Yield (%) | Weighted Average Mortgage Rate (%) | |||||||||||||||||||||||||
California | 40 | $ | 269,939,159 | 29.2 | % | 55.3 | % | 47.6 | % | 1.69 | x | 12.4 | % | 11.4 | % | 5.417 | % | |||||||||||||||||
Southern | 29 | 182,911,798 | 19.8 | 53.7 | 46.5 | 1.75 | 12.6 | 11.6 | 5.329 | |||||||||||||||||||||||||
Northern | 11 | 87,027,360 | 9.4 | 58.7 | 50.0 | 1.58 | 11.9 | 11.0 | 5.603 | |||||||||||||||||||||||||
Texas | 32 | 115,490,731 | 12.5 | 65.7 | 53.6 | 1.51 | 12.3 | 11.1 | 5.751 | |||||||||||||||||||||||||
Florida | 11 | 90,424,378 | 9.8 | 58.2 | 49.7 | 1.61 | 13.2 | 11.6 | 5.667 | |||||||||||||||||||||||||
Maryland | 2 | 85,700,000 | 9.3 | 62.2 | 51.9 | 1.32 | 10.4 | 9.3 | 5.422 | |||||||||||||||||||||||||
Arizona | 4 | 50,945,626 | 5.5 | 67.4 | 57.8 | 1.46 | 10.9 | 10.3 | 5.641 | |||||||||||||||||||||||||
Other States(3) | 63 | 312,507,939 | 33.8 | 64.0 | 52.5 | 1.60 | 13.1 | 11.8 | 5.717 | |||||||||||||||||||||||||
|
|
|
|
|
|
|
|
|
|
|
|
|
|
|
|
| ||||||||||||||||||
Total/ Weighted Average | 152 | $ | 925,007,833 | 100.0 | % | 61.1 | % | 51.2 | % | 1.58x | 12.4 | % | 11.3 | % | 5.598 | % | ||||||||||||||||||
|
|
|
|
|
|
|
|
|
|
|
|
|
|
|
|
| ||||||||||||||||||
| * | The Mortgaged Properties are located in 30 states. |
| (1) | For purposes of determining whether a mortgaged property is in Northern California or Southern California, Northern California includes areas with zip codes above 93600 and Southern California includes areas with zip codes of 93600 and below. |
| (2) | Because this table presents information relating to the mortgaged properties and not the mortgage loans, (a) the information for mortgage loans secured by more than one mortgaged property (other than through cross-collateralization with other mortgage loans) is based on allocated amounts (allocating the mortgage loan principal balance to each of those properties according to the relative appraised values of the mortgaged properties or the allocated loan amounts or property-specific release prices set forth in the related mortgage loan documents), and (b) the information for each mortgaged property that relates to a mortgage loan that is cross-collateralized with other mortgage loans is based upon the principal balance of that mortgage loan, except that the applicable loan-to-value ratio, debt service coverage ratio or debt yield for each such mortgaged property is based upon the ratio or yield (as applicable) for the aggregate indebtedness evidenced by all loans in the group. On an individual basis, without regard to the cross-collateralization feature, any mortgaged property securing a mortgage loan that is part of a cross-collateralized group of mortgage loans may have a higher loan-to-value ratio, lower debt service coverage ratio and/or lower debt yield than is presented herein. |
| (3) | Includes 25 other states. |
THE INFORMATION IN THIS STRUCTURAL AND COLLATERAL TERM SHEET IS NOT COMPLETE AND MAY BE AMENDED PRIOR TO THE TIME OF SALE. THIS TERM SHEET IS NOT AN OFFER TO SELL THESE SECURITIES AND IT IS NOT A SOLICITATION OF AN OFFER TO BUY THESE SECURITIES IN ANY JURISDICTION WHERE THE OFFER OR SALE IS NOT PERMITTED.
11
WFRBS Commercial Mortgage Trust 2012-C6 | Characteristics of the Mortgage Pool |
| G. | Characteristics of the Mortgage Pool(1) |
CUT-OFF DATE BALANCE
Range of Cut-off Date | Number of | Aggregate Cut- | % of Cut-off | |||||
1,468,823 – 2,000,000 | 7 | $11,477,361 | 1.2% | |||||
2,000,001 – 3,000,000 | 10 | 24,490,573 | 2.6 | |||||
3,000,001 – 4,000,000 | 10 | 35,659,906 | 3.9 | |||||
4,000,001 – 5,000,000 | 5 | 22,809,780 | 2.5 | |||||
5,000,001 – 6,000,000 | 3 | 17,169,803 | 1.9 | |||||
6,000,001 – 7,000,000 | 7 | 46,200,468 | 5.0 | |||||
7,000,001 – 8,000,000 | 8 | 61,353,173 | 6.6 | |||||
8,000,001 – 9,000,000 | 2 | 17,345,670 | 1.9 | |||||
9,000,001 – 10,000,000 | 6 | 55,911,098 | 6.0 | |||||
10,000,001 – 15,000,000 | 17 | 215,005,338 | 23.2 | |||||
15,000,001 – 20,000,000 | 6 | 110,555,965 | 12.0 | |||||
20,000,001 – 30,000,000 | 5 | 115,091,928 | 12.4 | |||||
30,000,001 – 50,000,000 | 1 | 48,157,500 | 5.2 | |||||
50,000,001 – 70,000,000 | 1 | 67,279,272 | 7.3 | |||||
70,000,001 – 76,500,000 | 1 | 76,500,000 | 8.3 | |||||
|
|
| ||||||
Total: | 89 | $925,007,833 | 100.0% | |||||
|
|
| ||||||
Average: | $10,393,346 | |||||||
|
UNDERWRITTEN NOI DEBT SERVICE COVERAGE RATIO
Range of U/W NOI | Number of Mortgage Loans | Aggregate Cut- off Date Balance | % of Cut-off Date Balance | |||||||
1.27 – 1.30 | 1 | $14,817,796 | 1.6% | |||||||
1.31 – 1.40 | 8 | 74,734,032 | 8.1 | |||||||
1.41 – 1.50 | 6 | 121,941,124 | 13.2 | |||||||
1.51 – 1.60 | 12 | 115,188,299 | 12.5 | |||||||
1.61 – 1.70 | 15 | 93,309,425 | 10.1 | |||||||
1.71 – 1.80 | 15 | 146,868,208 | 15.9 | |||||||
1.81 – 1.90 | 10 | 71,344,092 | 7.7 | |||||||
1.91 – 2.00 | 11 | 197,351,916 | 21.3 | |||||||
2.01 – 2.25 | 7 | 61,243,916 | 6.6 | |||||||
2.26 – 2.50 | 2 | 10,795,877 | 1.2 | |||||||
2.51 – 3.00 | 1 | 7,913,148 | 0.9 | |||||||
3.01 – 3.24 | 1 | 9,500,000 | 1.0 | |||||||
|
|
|
|
| ||||||
Total: | 89 | $925,007,833 | 100.0 | % | ||||||
|
|
|
|
| ||||||
Weighted Average: | 1.74x | |||||||||
| ||||||||||
UNDERWRITTEN NCF DEBT SERVICE COVERAGE RATIO
Range of U/W NCF | Number of Mortgage Loans | Aggregate Cut- off Date Balance | % of Cut-off Date Balance | |||||||
1.25 – 1.30 | 5 | $120,549,235 | 13.0% | |||||||
1.31 – 1.40 | 11 | 124,932,973 | 13.5 | |||||||
1.41 – 1.50 | 13 | 90,717,330 | 9.8 | |||||||
1.51 – 1.60 | 19 | 194,471,957 | 21.0 | |||||||
1.61 – 1.70 | 18 | 194,029,236 | 21.0 | |||||||
1.71 – 1.80 | 13 | 86,873,697 | 9.4 | |||||||
1.81 – 1.90 | 3 | 63,131,827 | 6.8 | |||||||
1.91 – 2.00 | 2 | 20,239,048 | 2.2 | |||||||
2.01 – 2.25 | 3 | 13,632,332 | 1.5 | |||||||
2.26 – 2.50 | 1 | 6,930,195 | 0.7 | |||||||
2.51 – 3.04 | 1 | 9,500,000 | 1.0 | |||||||
|
|
|
|
| ||||||
Total/Weighted Average: | 89 | $925,007,833 | 100.0 | % | ||||||
|
|
|
|
| ||||||
Weighted Average: | 1.58x | |||||||||
| ||||||||||
LOAN PURPOSE(1)
Loan Purpose | Number of Mortgage Loans | Aggregate Cut- off Date Balance | % of Cut-off Date Balance | |||||||||
Refinance | 77 | $815,103,248 | 88.1% | |||||||||
Acquisition | 11 | 103,330,659 | 11.2 | |||||||||
Various | 1 | 6,573,925 | 0.7 | |||||||||
|
|
|
|
|
| |||||||
Total: | 89 | $925,007,833 | 100.0 | % | ||||||||
|
|
|
|
|
| |||||||
| (1) | With respect to the T&M Retail Portfolio, Three Bears Supermarket was an acquisition and Marsh Supermarket was a refinance. Please refer to Annex A-1 for further details. |
MORTGAGE RATE
Range of Mortgage Rates | Number of Mortgage Loans | Aggregate Cut- off Date Balance | % of Cut-off Date Balance | |||||||
4.740 – 4.750 | 1 | $7,913,148 | 0.9% | |||||||
4.751 – 5.000 | 2 | 22,378,295 | 2.4 | |||||||
5.001 – 5.250 | 9 | 155,154,655 | 16.8 | |||||||
5.251 – 5.500 | 19 | 319,875,281 | 34.6 | |||||||
5.501 – 5.750 | 8 | 54,928,389 | 5.9 | |||||||
5.751 – 6.000 | 26 | 218,558,116 | 23.6 | |||||||
6.001 – 6.250 | 19 | 118,342,503 | 12.8 | |||||||
6.251 – 6.500 | 4 | 18,764,683 | 2.0 | |||||||
6.501 – 6.550 | 1 | 9,092,762 | 1.0 | |||||||
|
|
|
|
| ||||||
Total: | 89 | $925,007,833 | 100.0 | % | ||||||
|
|
|
|
| ||||||
Weighted Average: | 5.598% | |||||||||
| ||||||||||
UNDERWRITTEN NOI DEBT YIELD
Range of U/W NOI | Number of Mortgage Loans | Aggregate Cut- off Date Balance | % of Cut-off Date Balance | |||||||
9.1 – 10.0 | 6 | $73,133,454 | 7.9% | |||||||
10.1 – 11.0 | 11 | 187,607,302 | 20.3 | |||||||
11.1 – 12.0 | 22 | 183,433,202 | 19.8 | |||||||
12.1 – 13.0 | 13 | 138,972,073 | 15.0 | |||||||
13.1 – 14.0 | 22 | 169,218,223 | 18.3 | |||||||
14.1 – 15.0 | 3 | 89,644,488 | 9.7 | |||||||
15.1 – 16.0 | 9 | 56,173,541 | 6.1 | |||||||
16.1 – 17.0 | 2 | 16,496,284 | 1.8 | |||||||
17.1 – 18.1 | 1 | 10,329,266 | 1.1 | |||||||
|
|
|
|
| ||||||
Total: | 89 | $925,007,833 | 100.0 | % | ||||||
|
|
|
|
| ||||||
Weighted Average: | 12.4% | |||||||||
| ||||||||||
UNDERWRITTEN NCF DEBT YIELD
Range of U/W NCF | Number of Mortgage Loans | Aggregate Cut- off Date Balance | % of Cut-off Date Balance | |||||||
8.7 – 9.0 | 3 | $27,778,295 | 3.0% | |||||||
9.1 – 10.0 | 8 | 164,283,527 | 17.8 | |||||||
10.1 – 11.0 | 22 | 272,865,373 | 29.5 | |||||||
11.1 – 12.0 | 24 | 135,300,079 | 14.6 | |||||||
12.1 – 13.0 | 18 | 221,491,273 | 23.9 | |||||||
13.1 – 14.0 | 6 | 45,150,570 | 4.9 | |||||||
14.1 – 15.0 | 4 | 30,442,617 | 3.3 | |||||||
15.1 – 16.0 | 3 | 17,366,834 | 1.9 | |||||||
16.1 – 16.4 | 1 | 10,329,266 | 1.1 | |||||||
|
|
|
|
| ||||||
Total: | 89 | $925,007,833 | 100.0 | % | ||||||
|
|
|
|
| ||||||
Weighted Average: | 11.3% | |||||||||
| ||||||||||
| (1) | Information regarding mortgage loans secured by multiple properties (other than through cross-collateralization with other mortgage loans) is based on an allocation according to relative appraised values or the allocated loan amounts or property-specific release prices set forth in related loan documents. Information regarding mortgage loans that are cross-collateralized with other mortgage loans is based upon the individual loan balances, except that the applicable loan-to-value ratio, debt service coverage ratio or debt yield for each such mortgage loan is based upon the ratio or yield (as applicable) for the aggregate indebtedness evidenced by all loans in the group. On an individual basis, without regard to the cross-collateralization feature, any mortgage loan that is part of a cross-collateralized group of mortgage loans may have a higher loan-to-value ratio, lower debt service coverage ratio and/or lower debt yield than is presented herein. |
THE INFORMATION IN THIS STRUCTURAL AND COLLATERAL TERM SHEET IS NOT COMPLETE AND MAY BE AMENDED PRIOR TO THE TIME OF SALE. THIS TERM SHEET IS NOT AN OFFER TO SELL THESE SECURITIES AND IT IS NOT A SOLICITATION OF AN OFFER TO BUY THESE SECURITIES IN ANY JURISDICTION WHERE THE OFFER OR SALE IS NOT PERMITTED.
12
WFRBS Commercial Mortgage Trust 2012-C6 | Characteristics of the Mortgage Pool |
ORIGINAL TERM TO MATURITY
Range of Original Terms to | Number of Mortgage Loans | Aggregate Cut- off Date Balance | % of Cut-off Date Balance | |||||
60 | 8 | $135,887,753 | 14.7% | |||||
85 – 120 | 81 | 789,120,079 | 85.3 | |||||
|
|
|
| |||||
Total: | 89 | $925,007,833 | 100.0% | |||||
|
|
|
| |||||
Weighted Average: | 111 | |||||||
| ||||||||
REMAINING TERM TO MATURITY
Range of Remaining Terms to | Number of Mortgage Loans | Aggregate Cut- off Date Balance | % of Cut-off Date Balance | |||||
51 – 60 | 8 | $135,887,753 | 14.7% | |||||
85 – 120 | 81 | 789,120,079 | 85.3 | |||||
|
|
|
| |||||
Total: | 89 | $925,007,833 | 100.0% | |||||
|
|
|
| |||||
Weighted Average: | 106 | |||||||
| ||||||||
ORIGINAL AMORTIZATION TERM
Range of Original | Number of Mortgage Loans | Aggregate Cut- off Date Balance | % of Cut-off Date Balance | |||||
Non-Amortizing | 1 | $9,500,000 | 1.0% | |||||
240 | 4 | 35,825,894 | 3.9 | |||||
241 – 300 | 28 | 271,221,628 | 29.3 | |||||
301 – 360 | 56 | 608,460,311 | 65.8 | |||||
|
|
|
| |||||
Total: | 89 | $925,007,833 | 100.0% | |||||
|
|
|
| |||||
Weighted Average:* | 332 | |||||||
| ||||||||
| * | Excludes the non-amortizing loans. |
REMAINING AMORTIZATION TERM(1)
Range of Remaining | Number of Mortgage Loans | Aggregate Cut- off Date Balance | % of Cut-off Date Balance | |||||
Non-Amortizing | 1 | $9,500,000 | 1.0% | |||||
230 – 240 | 4 | 35,825,894 | 3.9 | |||||
241 – 300 | 28 | 271,221,628 | 29.3 | |||||
301 – 360 | 56 | 608,460,311 | 65.8 | |||||
|
|
|
| |||||
Total: | 89 | $925,007,833 | 100.0% | |||||
|
|
|
| |||||
Weighted Average:* | 329 | |||||||
| ||||||||
| * | Excludes the non-amortizing loans. |
| (1) | The remaining amortization term shown for any mortgage loan that is interest-only for part of its term does not include the number of months in its interest-only period and reflects only the number of months as of the commencement of amortization remaining from the end of such interest-only period. |
LOCKBOXES
Type of Lockbox | Number of Mortgage Loans | Aggregate Cut- off Date Balance | % of Cut-off Date Balance | |||||
Hard/Springing Cash Management | 20 | $285,149,802 | 30.8% | |||||
None | 26 | 220,055,637 | 23.8 | |||||
Hard/Upfront Cash Management | 8 | 158,791,341 | 17.2 | |||||
Soft/Springing Cash Management | 21 | 139,957,108 | 15.1 | |||||
Various(1) | 2 | 63,014,395 | 6.8 | |||||
Springing (Without Established Account) | 10 | 51,884,722 | 5.6 | |||||
Springing (With Established Account) | 2 | 6,154,827 | 0.7 | |||||
|
|
|
| |||||
Total: | 89 | $925,007,833 | 100.0% | |||||
|
|
|
| |||||
| (1) | With respect to the WPC Self Storage Portfolio, 25 of the underlying properties are subject to hard lockboxes with springing cash management; one property (Metro - Forth Worth) is subject to a soft lockbox with springing cash management. With respect to Parrish Portfolio, 2 of the underlying properties have soft lockboxes with springing cash management and the third property has soft lockbox with upfront cash management. Please refer to Annex A-1 for further details. |
PREPAYMENT PROVISION SUMMARY
Prepayment Provision | Number of Mortgage Loans | Aggregate Cut- off Date Balance | % of Cut-off Date Balance | |||||
Lockout/Defeasance/Open | 75 | $825,879,947 | 89.3% | |||||
Lockout/YM%/Open | 14 | 99,127,886 | 10.7 | |||||
|
|
|
| |||||
Total: | 89 | $925,007,833 | 100.0% | |||||
|
|
|
| |||||
CUT-OFF DATE LOAN-TO-VALUE RATIO
Range of Cut-off Date LTV | Number of Mortgage Loans | Aggregate Cut- off Date Balance | % of Cut-off Date Balance | |||||
33.8 – 35.0 | 1 | $9,191,228 | 1.0% | |||||
35.1 – 40.0 | 2 | 17,413,148 | 1.9 | |||||
40.1 – 45.0 | 2 | 19,038,601 | 2.1 | |||||
45.1 – 50.0 | 3 | 81,573,862 | 8.8 | |||||
50.1 – 55.0 | 7 | 74,305,296 | 8.0 | |||||
55.1 – 60.0 | 10 | 164,871,713 | 17.8 | |||||
60.1 – 65.0 | 19 | 210,627,130 | 22.8 | |||||
65.1 – 70.0 | 33 | 220,041,646 | 23.8 | |||||
70.1 – 74.4 | 12 | 127,945,209 | 13.8 | |||||
|
|
|
| |||||
Total: | 89 | $925,007,833 | 100.0% | |||||
|
|
|
| |||||
Weighted Average: | 61.1% | |||||||
| ||||||||
BALLOON LOAN-TO-VALUE RATIO
Range of Balloon LTV Ratios | Number of Mortgage Loans | Aggregate Cut- off Date Balance | % of Cut-off Date Balance | |||||||
28.2 – 30.0 | 1 | $9,191,228 | 1.0% | |||||||
30.1 – 35.0 | 2 | 14,318,048 | 1.5 | |||||||
35.1 – 40.0 | 5 | 61,004,928 | 6.6 | |||||||
40.1 – 45.0 | 8 | 58,763,105 | 6.4 | |||||||
45.1 – 50.0 | 20 | 257,962,708 | 27.9 | |||||||
50.1 – 55.0 | 15 | 228,218,128 | 24.7 | |||||||
55.1 – 60.0 | 29 | 178,274,741 | 19.3 | |||||||
60.1 – 65.0 | 8 | 104,396,651 | 11.3 | |||||||
65.1 – 65.5 | 1 | 12,878,295 | 1.4 | |||||||
|
|
|
|
| ||||||
Total: | 89 | $925,007,833 | 100.0% | |||||||
|
|
|
|
| ||||||
Weighted Average: | 51.2 | % | ||||||||
|
| |||||||||
AMORTIZATION TYPE
Type of Amortization | Number of Mortgage Loans | Aggregate Cut- off Date Balance | % of Cut-off Date Balance | |||||
Amortizing Balloon | 82 | $732,350,333 | 79.2% | |||||
Interest-only, Amortizing Balloon | 6 | 183,157,500 | 19.8 | |||||
Interest-only, Balloon | 1 | 9,500,000 | 1.0 | |||||
|
|
|
| |||||
Total: | 89 | $925,007,833 | 100.0% | |||||
|
|
|
| |||||
ORIGINAL TERM OF INTEREST-ONLY PERIOD FOR PARTIAL IO LOANS*
IO Term (months) | Number of Mortgage Loans | Aggregate Cut- off Date Balance | % of Cut-off Date Balance | |||||
12 | 1 | $9,200,000 | 1.0% | |||||
13 – 18 | 1 | 7,550,000 | 0.8 | |||||
19 – 24 | 2 | 96,000,000 | 10.4 | |||||
49 – 60 | 2 | 70,407,500 | 7.6 | |||||
|
|
|
| |||||
Total: | 6 | $183,157,500 | 19.8% | |||||
|
|
|
| |||||
Weighted Average: | 37 | |||||||
| ||||||||
| * | Excludes non-amortizing loans and amortizing loans that do not provide for a partial interest-only period. |
SEASONING
Seasoning (months) | Number of Mortgage Loans | Aggregate Cut- off Date Balance | % of Cut-off Date Balance | |||||
0 | 9 | $92,450,000 | 10.0% | |||||
1 – 3 | 45 | 330,254,314 | 35.7 | |||||
4 – 6 | 14 | 81,785,126 | 8.8 | |||||
7 – 9 | 20 | 405,700,597 | 43.9 | |||||
10 | 1 | 14,817,796 | 1.6 | |||||
|
|
|
| |||||
Total: | 89 | $925,007,833 | 100.0% | |||||
|
|
|
| |||||
Weighted Average: | 5 | |||||||
| ||||||||
THE INFORMATION IN THIS STRUCTURAL AND COLLATERAL TERM SHEET IS NOT COMPLETE AND MAY BE AMENDED PRIOR TO THE TIME OF SALE. THIS TERM SHEET IS NOT AN OFFER TO SELL THESE SECURITIES AND IT IS NOT A SOLICITATION OF AN OFFER TO BUY THESE SECURITIES IN ANY JURISDICTION WHERE THE OFFER OR SALE IS NOT PERMITTED.
13
WFRBS Commercial Mortgage Trust 2012-C6 | Certain Terms and Conditions |
| V. | Certain Terms and Conditions |
Interest Entitlements: | The interest entitlement of each Class of Offered Certificates on each Distribution Date generally will be the interest accrued during the related Interest Accrual Period on the related Certificate Principal Balance or Notional Amount at the related pass-through rate, net of any prepayment interest shortfalls allocated to that Class for such Distribution Date as described below. If prepayment interest shortfalls arise from voluntary prepayments (without special servicer consent) on non-specially serviced mortgage loans during any collection period, the Master Servicer is required to make a compensating interest payment to offset those shortfalls, generally up to an amount equal to the portion of its master servicing fees that accrues at two basis pointsper annum. The remaining amount of prepayment interest shortfalls will be allocated to reduce the interest otherwise distributable on all Classes of Certificates (other than the Class X-A and Class X-B Certificates),pro rata, based on their respective amounts of accrued interest for the related Distribution Date. If a Class receives less than the entirety of its interest entitlement on any Distribution Date, then the shortfall will be added to its interest entitlement for the next succeeding Distribution Date. Interest entitlements on the Class D, C and B Certificates, in that order, may be reduced by certain Trust Advisor expenses. |
Principal Distribution Amount: | The Principal Distribution Amount for each Distribution Date generally will be the aggregate amount of principal received or advanced in respect of the mortgage loans, net of any nonrecoverable advances and interest thereon that are reimbursed to the Master Servicer, the Special Servicer or the Trustee during the related collection period. Nonrecoverable advances and interest thereon are reimbursable from principal collections and advances before reimbursement from other amounts. The Principal Distribution Amount may also be reduced, with a corresponding loss to the Class D, C, B and A-S Certificates, then to the Class A-1, A-2, A-3 and A-4 Certificates (with any losses on the Class A-1, A-2, A-3 and A-4 Certificates allocatedpro rata according to their respective Certificate Principal Balances immediately prior to that Distribution Date), in that order, in connection with certain Trust Advisor expenses to the extent that interest entitlements on the Class B, C and D Certificates are insufficient to absorb the effect of the expense on any particular Distribution Date. |
Distributions: | On each Distribution Date, funds available for distribution from the mortgage loans, net of specified trust fees, expenses and reimbursements will generally be distributed in the following amounts and order of priority (in each case to the extent of remaining available funds): |
| 1. | Class A-1, A-2, A-3, A-4, X-A and X-B Certificates: To interest on the Class A-1, A-2, A-3, A-4, X-A and X-B Certificates,pro rata, according to their respective interest entitlements. |
| 2. | Class A-1, A-2, A-3 and A-4 Certificates: To principal on the Class A-1, A-2, A-3 and A-4 Certificates in the following amounts and order of priority: (i) first, to principal on the Class A-1 Certificates until their Certificate Principal Balance is reduced to zero, up to the Principal Distribution Amount for such Distribution Date; (ii) second, to principal on the Class A-2 Certificates until their Certificate Principal Balance is reduced to zero, up to the remainder of the Principal Distribution Amount for such Distribution Date; (iii) third, to principal on the Class A-3 Certificates until their Certificate Principal Balance is reduced to zero, up to the remainder of the Principal Distribution Amount for such Distribution Date; (iv) fourth, to principal on the Class A-4 Certificates until their Certificate Principal Balance is reduced to zero, up to the remainder of the Principal Distribution Amount for such Distribution Date. However, if the Certificate Principal Balance of each and every Class of Principal Balance Certificates other than the Class A-1, A-2, A-3 and A-4 Certificates has been reduced to zero as a result of the allocation of Mortgage Loan losses and expenses and any of the Class A-1, A-2, A-3 and/or A-4 Certificates remain outstanding, then the Principal Distribution Amount will be distributed on the Class A-1, A-2, A-3 and A-4 Certificates,pro rata, based on their respective outstanding Certificate Principal Balances, until their Certificate Principal Balances have been reduced to zero. |
| 3. | Class A-1, A-2, A-3 and A-4 Certificates: To reimburse the holders of the Class A-1, A-2, A-3 and A-4 Certificates,pro rata, for any previously unreimbursed losses (other than certain Trust Advisor expenses) on the mortgage loans that were previously allocated in reduction of the Certificate Principal Balances of such Classes. |
THE INFORMATION IN THIS STRUCTURAL AND COLLATERAL TERM SHEET IS NOT COMPLETE AND MAY BE AMENDED PRIOR TO THE TIME OF SALE. THIS TERM SHEET IS NOT AN OFFER TO SELL THESE SECURITIES AND IT IS NOT A SOLICITATION OF AN OFFER TO BUY THESE SECURITIES IN ANY JURISDICTION WHERE THE OFFER OR SALE IS NOT PERMITTED.
14
WFRBS Commercial Mortgage Trust 2012-C6 | Certain Terms and Conditions |
| 4. | Class A-S Certificates: To make distributions on the Class A-S Certificates as follows: (a) first, to interest on Class A-S Certificates in the amount of the interest entitlement for that Class; (b) next, to the extent of the portion of the Principal Distribution Amount remaining after distributions in respect of principal to each Class with a higher distribution priority (in this case, the Class A-1, A-2, A-3 and A-4 Certificates), to principal on Class A-S Certificates until their Certificate Principal Balance is reduced to zero; and (c) next, to reimburse the holders of the Class A-S Certificates for any previously unreimbursed losses (other than certain Trust Advisor expenses) on the mortgage loans that were previously allocated to that Class in reduction of its Certificate Principal Balance. |
| 5. | Class B Certificates: To make distributions on the Class B Certificates as follows: (a) first, to interest on Class B Certificates in the amount of the interest entitlement for that Class; (b) next, to the extent of the portion of the Principal Distribution Amount remaining after distributions in respect of principal to each Class with a higher distribution priority (in this case, the Class A-1, A-2, A-3, A-4 and A-S Certificates), to principal on Class B Certificates until their Certificate Principal Balance is reduced to zero; and (c) next, to reimburse the holders of the Class B Certificates for any previously unreimbursed losses (other than certain Trust Advisor expenses) on the mortgage loans that were previously allocated to that Class in reduction of its Certificate Principal Balance. |
| 6. | After the Class A-1, A-2, A-3, A-4, A-S and B Certificates are paid all amounts to which they are entitled, the remaining funds available for distribution will be used to pay interest, principal and loss reimbursement amounts (other than certain Trust Advisor expenses) on the Class C, D, E, F and G Certificates sequentially in that order in a manner analogous to the Class B Certificates. |
Allocation of Yield Maintenance and Prepayment Premiums: | If any yield maintenance charges and prepayment premiums are collected during any particular collection period with respect to any mortgage loan, then on the distribution date corresponding to that collection period, the certificate administrator will pay a portion of the yield maintenance charges and prepayment premiums (net of liquidation fees payable therefrom) in the following manner: (1)pro rata, between the (x) the group (the “YM Group A”) of the Class A-1, A-2, A-3, A-4, A-S and X-A Certificates, and (y) the group (the “YM Group B” and, collectively with the YM Group A, the “YM Groups”) of the Class B, C, D and X-B Certificates, based upon the aggregate amount of principal distributed to the classes of principal balance certificates in each YM Group for that distribution date, and (2) among the classes of certificates in each YM Group, in the following manner, up to an amount equal to the product of (a) the yield maintenance or prepayment premium allocated to such YM Group, (b) the related Base Interest Fraction (as defined in the Free Writing Prospectus), and (c) a fraction, which in no event may be greater than 1.0, the numerator of which is equal to the amount of principal distributed to the holder(s) of such class for that distribution date, and the denominator of which is the aggregate amount of principal distributed to all the certificates in that YM Group for that distribution date. Any yield maintenance charges or prepayment premium allocated to such YM Group remaining after such distributions will be distributed to the Class X-A and/or Class X-B Certificates, as applicable, in such YM Group. |
| No prepayment premiums or yield maintenance charges will be distributed to the holders of the Class E, F, G or R Certificates. The holders of the Class X-B Certificates will be entitled to all prepayment premiums and yield maintenance charges collected after the Class A-1, A-2, A-3, A-4, A-S, B, C and D Certificates are retired. For a description of when prepayment premiums and yield maintenance charges are generally required on the mortgage loans, see Annex A-1 to the Free Writing Prospectus. See also “Certain Legal Aspects of Mortgage Loans — Enforceability of Certain Provisions” in the Free Writing Prospectus. Prepayment premiums and yield maintenance charges will be distributed on each Distribution Date only to the extent they are actually received on the mortgage loans as of the related Determination Date. |
Realized Losses: | The Certificate Principal Balances of the Class A-1, A-2, A-3, A-4, A-S, B, C, D, E, F and G Certificates will be reduced without distribution on any Distribution Date as a write-off to the extent of any losses realized on the mortgage loans allocated to such Class on such Distribution Date. Such losses (other than certain Trust Advisor expenses) will be applied in the following order, in each case until the related Certificate Principal Balance is reduced to zero: first, to Class G; second, to Class F; third, to Class E; fourth, to Class D; fifth, to Class C; sixth, to Class B; seventh, to Class A-S; and, finally,pro rata, to Classes A-1, A-2, A-3 and A-4 based on their outstanding Certificate Principal Balances. Certain Trust Advisor expenses (if not absorbed by reductions of interest entitlements on Classes D, C and B) will be applied as write-offs in a similar manner, except that such write-offs will be applied only to the Class D, C, B, A-S and A-1, A-2, A3 and A-4 Certificates (with any write-offs on the Class A-1, A-2, A-3 and A-4 Certificates to be allocatedpro rata according to their respective Certificate Principal Balances immediately prior to |
THE INFORMATION IN THIS STRUCTURAL AND COLLATERAL TERM SHEET IS NOT COMPLETE AND MAY BE AMENDED PRIOR TO THE TIME OF SALE. THIS TERM SHEET IS NOT AN OFFER TO SELL THESE SECURITIES AND IT IS NOT A SOLICITATION OF AN OFFER TO BUY THESE SECURITIES IN ANY JURISDICTION WHERE THE OFFER OR SALE IS NOT PERMITTED.
15
WFRBS Commercial Mortgage Trust 2012-C6 | Certain Terms and Conditions |
| that Distribution Date). The notional amount of the Class X-A Certificates will be reduced by the amount of all losses that are allocated to the Class A-1, A-2, A-3, A-4 or A-S Certificates as write- offs in reduction of their Certificate Principal Balances. The notional amount of the Class X-B Certificates will be reduced by the amount of all losses that are allocated to the Class B, C, D, E, F or G Certificates as write-offs in reduction of their Certificate Principal Balances. |
Debt Service Advances: | The Master Servicer or, if the Master Servicer fails to do so, the Trustee, will be obligated to advance delinquent debt service payments (other than balloon payments and default interest) and assumed debt service payments on the mortgage loans, except to the extent they are deemed non-recoverable from collections on the related mortgage loan. In addition, if an Appraisal Reduction Amount exists for a given mortgage loan, the interest portion of any debt service advance for such mortgage loan will be reduced, which will have the effect of reducing the amount of interest available for distribution to the Certificates in reverse alphabetical order of their Class designations (except that interest payments on the Class A-1, A-2, A-3, A-4, X-A and X-B Certificates would be affected on apari passu basis). |
Servicing Advances: | The Master Servicer or, if the Master Servicer fails to do so, the Trustee, will be obligated to make servicing advances, including the payment of delinquent property taxes, insurance premiums and ground rent, except to the extent that those advances are deemed non-recoverable from collections on the related mortgage loan. |
Appraisal Reduction Amounts: | An Appraisal Reduction Amount generally will be created in the amount, if any, by which the principal balance of a required appraisal loan (which is a mortgage loan with respect to which certain defaults, modifications or insolvency events have occurred as further described in the Free Writing Prospectus) plus other amounts overdue or advanced in connection with such mortgage loan exceeds 90% of the appraised value of the related mortgaged property plus certain escrows and reserves (including letters of credit) held with respect to the mortgage loan. |
A mortgage loan will cease to be a required appraisal loan when the same has ceased to be a specially serviced mortgage loan (if applicable), has been brought current for at least three consecutive months and no other circumstances exist that would cause such mortgage loan to be a required appraisal loan.
Appraisal Reduction Amounts will affect the amount of debt service advances on the related mortgage loan. Appraisal Reduction Amounts will also be taken into account in the determination of the identity of the Class whose majority constitutes the “majority subordinate certificateholder” and is entitled to appoint the subordinate class representative.
Clean-Up Call and Exchange Termination: | On each Distribution Date occurring after the aggregate unpaid principal balance of the mortgage loans is reduced below 1% of the initial aggregate principal balance of the mortgage loans of the Cut-off Date, certain specified persons will have the option to purchase all of the remaining mortgage loans (and all property acquired through exercise of remedies in respect of any mortgage loan) at the price specified in the Free Writing Prospectus. Exercise of the option will terminate the trust and retire the then-outstanding certificates. |
| If the aggregate Certificate Principal Balances of each of the Class A-1, A-2, A-3, A-4, A-S, B, C and D Certificates have been reduced to zero, the trust may also be terminated in connection with an exchange of all the then-outstanding certificates, including the Class X-B Certificates, for the mortgage loans and REO properties then remaining in the issuing entity, but all of the holders of those Classes of outstanding certificates would have to voluntarily participate in the exchange. |
Liquidated Loan Waterfall: | Following the liquidation of any loan or property, the net liquidation proceeds generally will be applied (after reimbursement of advances and certain trust fund expenses), first, as a recovery of accrued interest, other than delinquent interest that was not advanced as a result of Appraisal Reduction Amounts, and then as a recovery of principal until all principal has been recovered. Any liquidation proceeds remaining thereafter will be applied as a recovery to delinquent interest that was not advanced as a result of Appraisal Reduction Amounts. |
THE INFORMATION IN THIS STRUCTURAL AND COLLATERAL TERM SHEET IS NOT COMPLETE AND MAY BE AMENDED PRIOR TO THE TIME OF SALE. THIS TERM SHEET IS NOT AN OFFER TO SELL THESE SECURITIES AND IT IS NOT A SOLICITATION OF AN OFFER TO BUY THESE SECURITIES IN ANY JURISDICTION WHERE THE OFFER OR SALE IS NOT PERMITTED.
16
WFRBS Commercial Mortgage Trust 2012-C6 | Certain Terms and Conditions |
Majority SubordinateCertificateholder andSubordinate ClassRepresentative: | A subordinate class representative may be appointed by the “majority subordinate certificate holder”, which will be the holder(s) of a majority of: (a) during a “subordinate control period”, the most subordinate class among the Class E, F and G Certificates that has a Certificate Principal Balance, as notionally reduced by any Appraisal Reduction Amounts allocable to that class, that is at least equal to 25% of its total initial principal balance and (b) during a “collective consultation period”, the most subordinate class among the Class E, F and G Certificates that has a total principal balance, without regard to Appraisal Reduction Amounts, that is at least equal to 25% of its initial Certificate Principal Balance. The majority subordinate certificateholder will have a continuing right to appoint, remove or replace the subordinate class representative in its sole discretion. This right may be exercised at any time and from time to time. See “Servicing of the Mortgage Loans and Administration of the Trust Fund”- The Majority Subordinate Certificateholder and the Subordinate Class Representative” in the Free Writing Prospectus. |
Control and Consultation: | The rights of various parties to replace the Special Servicer and approve or consult with respect to major actions of the Special Servicer will vary according to defined periods. A “subordinate control period” will exist when the Class E Certificates have a Certificate Principal Balance, net of any Appraisal Reduction Amounts allocable to that class, that is not less than 25% of the initial principal balance of that class. In general, during a subordinate control period, (i) the subordinate class representative will be entitled to grant or withhold approval of asset status reports prepared, and material servicing actions proposed, by the Special Servicer, and (ii) the majority subordinate certificateholder, or the subordinate class representative on its behalf, will be entitled to terminate and replace the Special Servicer with or without cause, and appoint itself or another person as the successor special servicer. It will be a condition to such appointment that Fitch, Moody’s and KBRA confirm that the appointment would not result in a qualification, downgrade or withdrawal of any of their then-current ratings of certificates. A “collective consultation period” will exist when the Class E Certificates have a Certificate Principal Balance that both (i) as notionally reduced by any Appraisal Reduction Amounts allocable to that class, is less than 25% of its initial principal balance and (ii) without regard to any Appraisal Reduction Amounts allocable to that class, is 25% or more of its initial Certificate Principal Balance. In general, during a collective consultation period, the Special Servicer will be required to consult with each of the subordinate class representative and the Trust Advisor in connection with asset status reports and material special servicing actions. A “senior consultation period” will exist when either the Class E Certificates have an aggregate principal balance, without regard to any Appraisal Reduction Amounts allocable to that class, that is less than 25% of its initial principal balance. In general, during a senior consultation period, the Special Servicer must seek to consult with the Trust Advisor in connection with asset status reports and material special servicing actions, and, in general, no subordinate class representative will be recognized or have any right to terminate the Special Servicer or approve, direct, or consult with respect to servicing matters. |
Replacement of SpecialServicer by General Vote of Certificateholders: | During any “collective consultation period” or “senior consultation period”, the Special Servicer may be terminated and replaced upon the affirmative direction of certificate owners holding not less than 75% of the appraisal-reduced voting rights of all certificates, following a proposal from certificate owners holding not less than 25% of the appraisal-reduced voting rights of all certificates. The certificateholders who initiate a vote on a termination and replacement of the Special Servicer without cause must cause Fitch, Moody’s and KBRA to confirm the then-current ratings of the certificates (or decline to review the matter) and cause the payment of the fees and expenses incurred in the replacement. |
Appraisal Remedy: | Solely for purposes of determining whether a “subordinate control period” is in effect, whenever the Special Servicer obtains an appraisal or updated appraisal under the pooling and servicing agreement, the subordinate class representative will have the right (at its expense) to direct the Special Servicer to hire a qualified appraiser to prepare a second appraisal of the mortgaged property. The Special Servicer must thereafter determine whether, based on its assessment of such second appraisal, any recalculation of the Appraisal Reduction Amount is warranted. The Appraisal Reduction Amount, whether based on the first or the second appraisal, will become effective following the second appraisal, except that the Appraisal Reduction Amount based on the first appraisal shall become effective if the subordinate class representative declines to demand a second appraisal within a specified number of business days, or if a second appraisal is not received within 90 days after the direction of the subordinate class representative. In addition, for the same purposes, if there is a material change in the mortgaged property securing any mortgage loan for which an Appraisal Reduction Amount has been calculated, the majority certificateholder of the Class E, F or G Certificates will be entitled (at its expense) to present an additional appraisal to the Special Servicer, which will generally be required to recalculate the Appraisal Reduction Amount based upon such additional appraisal. This latter right may not be exercised more frequently than once in any 12-month period for each mortgage loan for which an Appraisal Reduction Amount was calculated and can only be exercised during a subordinate control |
THE INFORMATION IN THIS STRUCTURAL AND COLLATERAL TERM SHEET IS NOT COMPLETE AND MAY BE AMENDED PRIOR TO THE TIME OF SALE. THIS TERM SHEET IS NOT AN OFFER TO SELL THESE SECURITIES AND IT IS NOT A SOLICITATION OF AN OFFER TO BUY THESE SECURITIES IN ANY JURISDICTION WHERE THE OFFER OR SALE IS NOT PERMITTED.
17
WFRBS Commercial Mortgage Trust 2012-C6 | Certain Terms and Conditions |
| period or a collective consultation period as further described in the Free Writing Prospectus. |
Sale of Defaulted Assets: | There will be no “fair value” purchase option. Instead, the pooling and servicing agreement will authorize the Special Servicer to sell defaulted mortgage loans to the highest bidder in a manner generally similar to sales of REO properties. The subordinate class representative will have certain preferential rights, including a right of first refusal other than during a “senior consultation period”, in respect of sales of defaulted mortgage loans and REO properties as described in the Free Writing Prospectus. |
“As-Is” Appraisals: | Appraisals must be conducted on an “as-is” basis, and must be no more than 9 months old, for purposes of determining Appraisal Reduction Amounts, market value in connection with REO sales, etc. Required appraisals may consist of updates of prior appraisals. Internal valuations by the Special Servicer are permitted if the principal balance of a mortgage loan is less than $2,000,000. |
Trust Advisor: | The Trust Advisor will perform certain review duties that will generally include a limited annual review of and report regarding the Special Servicer to the Certificate Administrator. The review and report generally will be based on: (a) during a subordinate control period, each final asset status report delivered to the Trust Advisor by the Special Servicer, (b) during a collective consultation period or senior consultation period, any asset status reports and additional information delivered to the Trust Advisor by the Special Servicer, and/or (c) during a senior consultation period, in addition to the applicable information described above, a meeting with the Special Servicer to conduct a limited review of the Special Servicer’s operational practices on a platform basis in light of the servicing standard. In addition, during any collective consultation period or senior consultation period, the Special Servicer must seek to consult with the Trust Advisor (in addition to the subordinate class representatives during a collective consultation period) in connection with material special servicing actions with respect to specially serviced mortgage loans. Furthermore, under certain circumstances, but only during a senior consultation period, the Trust Advisor may recommend the replacement of the Special Servicer, in which case the Certificate Administrator will deliver notice of such recommendation to the certificateholders, and certificateholders with specified percentages of the voting rights may direct the replacement of the Special Servicer at their expense. |
| The Trust Advisor may be removed and replaced without cause upon the affirmative direction of certificates owners holding not less than 75% of the appraisal-reduced voting rights of all certificates, following a proposal from certificate owners holding not less than 25% of the appraisal-reduced voting rights of all certificates. The certificateholders who initiate a vote on a termination and replacement of the Trust Advisor without cause must cause Fitch, Moody’s and KBRA to confirm the then-current ratings of the certificates (or decline to review the matter) and cause the payment of the fees and expenses incurred in the replacement. During any “subordinate control period”, the proposed replacement trust advisor will be subject to the subordinate class representative’s consent (such consent not to be unreasonably withheld). If a proposed termination and replacement of the Trust Advisor is not consummated within 180 days following the initial request of the certificateholders who requested a vote, the proposed termination and replacement shall have no further force or effect. The Trust Advisor will be discharged from its duties if and when the Class A-1, A-2, A-3, A-4, A-S, B, C and D Certificates are retired. |
Certain Fee Offsets: | If a workout fee is earned by the Special Servicer following a loan default, then certain limitations will apply to the collection and retention of a modification fee from the borrower. The modification fee generally must not exceed 1% of the principal balance of the loan as modified. In addition, if the loan re-defaults within a specified period of months and other conditions are satisfied, any subsequent workout or liquidation fee on that loan must be reduced by a portion of the previously- collected modification fee. |
Deal Website: | The Certificate Administrator will be required to maintain a deal website which will include, among other items: (a) summaries of asset status reports prepared by the Special Servicer, (b) inspection reports, (c) appraisals, (d) various “special notices” described in the Free Writing Prospectus, (e) the “Investor Q&A Forum” and (f) a voluntary “Investor Registry”. Investors may access the deal website following execution of a certification and confidentiality agreement. |
Initial Majority Subordinate Certificateholder: | It is expected that RREF CMBS AIV, LP, an affiliate of Rialto Real Estate Fund, LP, will be the initial majority subordinate certificateholder. |
THE INFORMATION IN THIS STRUCTURAL AND COLLATERAL TERM SHEET IS NOT COMPLETE AND MAY BE AMENDED PRIOR TO THE TIME OF SALE. THIS TERM SHEET IS NOT AN OFFER TO SELL THESE SECURITIES AND IT IS NOT A SOLICITATION OF AN OFFER TO BUY THESE SECURITIES IN ANY JURISDICTION WHERE THE OFFER OR SALE IS NOT PERMITTED.
18
[THIS PAGE INTENTIONALLY LEFT BLANK.]
19
NATIONAL CANCER INSTITUTE CENTER
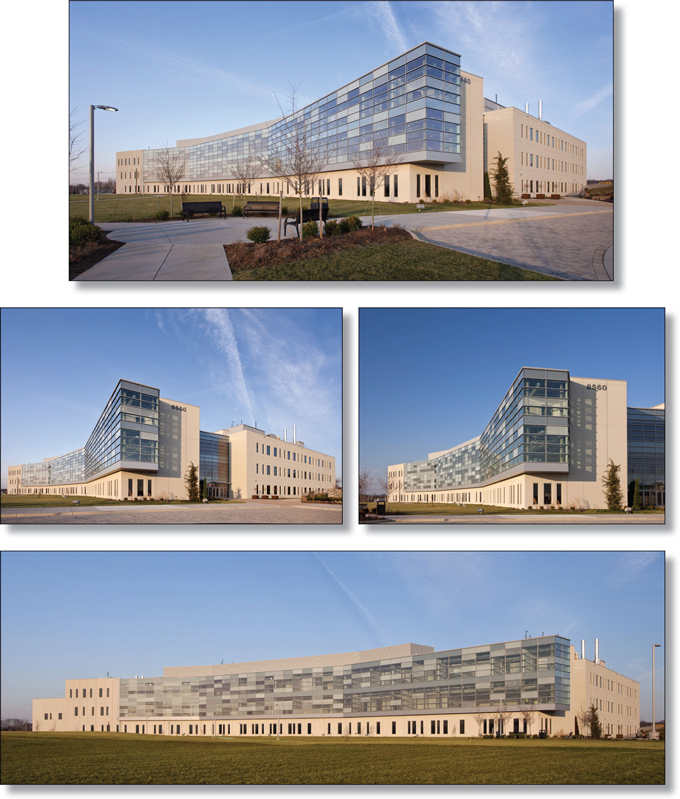
THE INFORMATION IN THIS STRUCTURAL AND COLLATERAL TERM SHEET IS NOT COMPLETE AND MAY BE AMENDED PRIOR TO THE TIME OF SALE. THIS TERM SHEET IS NOT AN OFFER TO SELL THESE SECURITIES AND IT IS NOT A SOLICITATION OF AN OFFER TO BUY THESE SECURITIES IN ANY JURISDICTION WHERE THE OFFER OR SALE IS NOT PERMITTED.
20
NATIONAL CANCER INSTITUTE CENTER

THE INFORMATION IN THIS STRUCTURAL AND COLLATERAL TERM SHEET IS NOT COMPLETE AND MAY BE AMENDED PRIOR TO THE TIME OF SALE. THIS TERM SHEET IS NOT AN OFFER TO SELL THESE SECURITIES AND IT IS NOT A SOLICITATION OF AN OFFER TO BUY THESE SECURITIES IN ANY JURISDICTION WHERE THE OFFER OR SALE IS NOT PERMITTED.
21
National Cancer Institute Center
Loan Information
| ||
Mortgage Loan Seller: | Wells Fargo Bank, National Association | |
| Credit Assessment (Fitch/Moody’s/KBRA): | NAP | |
| Original Principal Balance: | $76,500,000 | |
Cut-off Date Principal Balance | $76,500,000 | |
% of Initial Pool Balance: | 8.3% | |
Loan Purpose: | Refinance | |
Borrower Name: | Riv 402 Sub, LLC | |
Sponsors: | FCP Riverside NCI I, LLC; Matan 402 Member, LLC | |
Mortgage Rate: | 5.350% | |
Note Date: | July 13, 2011 | |
Anticipated Repayment Date: | NAP | |
Maturity Date: | August 1, 2021 | |
IO Period: | 24 months | |
Loan Term (Original): | 120 months | |
Seasoning: | 8 months | |
Amortization Term (Original): | 312 months | |
Loan Amortization Type: | Interest-Only, Amortizing Balloon | |
Interest Accrual Method: | Actual/360 | |
Call Protection: | L(32),D(84),O(4) | |
Lockbox Type: | Hard/Springing Cash Management | |
Additional Debt: | None | |
Additional Debt Type: | NAP | |
Escrows and Reserves:
Type: | Initial | Monthly | Cap (If Any) | |||
Taxes(1) | $0 | Springing | NAP | |||
Insurance(2) | $0 | Springing | NAP | |||
| Replacement Reserves | $0 | $853 | NAP | |||
TI/LC(3) | $6,570,698 | $0 | NAP |
Property Information
| ||
Single Asset/Portfolio: | Single Asset | |
Property Type: | Office | |
Specific Property Type: | Medical | |
Location: | Frederick, MD | |
Size: | 341,271 SF | |
| Cut-off Date Principal Balance Per Unit/SF: | $224.16 | |
Year Built/Renovated: | 2011/NAP
| |
Occupancy %(4): | 100.0% | |
Occupancy % Source Date: | January 18, 2012 | |
Title Vesting: | Fee | |
Property Manager: | Matan Companies, LLLP | |
3rd Most Recent NOI (As of)(5): | NAV | |
2nd Most Recent NOI (As of)(5): | NAV | |
Most Recent NOI (As of)(5): | NAV | |
U/W Revenues: | $11,746,062 | |
U/W Expenses: | $3,972,287 | |
U/W NOI: | $7,773,775 | |
U/W NCF: | $7,068,290 | |
U/W NOI DSCR: | 1.43x | |
U/W NCF DSCR: | 1.30x | |
U/W NOI Debt Yield: | 10.2% | |
U/W NCF Debt Yield: | 9.2% | |
Appraised Value(6): | $124,000,000 | |
Appraisal Valuation Date: | June 13, 2011 | |
Cut-off Date LTV Ratio(6): | 61.7% | |
| LTV Ratio at Maturity or ARD(6): | 51.2% | |
| (1) | Monthly tax escrows are waived so long as no event of default has occurred and is continuing and the borrower delivers to lender satisfactory evidence of payment of taxes. |
| (2) | Monthly insurance escrows are waived so long as no event of default has occurred and is continuing and the borrower provides satisfactory evidence that the property is insured in accordance with the loan documents. |
| (3) | The TI/LC escrow was established for outstanding tenant improvement costs owed to the sole tenant, SAIC-Frederick, Inc. a wholly owned subsidiary of SAIC, Inc. The remaining balance as of the Cut-off Date is $21,067. |
| (4) | As of the Cut-off Date, the tenant was in possession of its space, paying full contractual rent and in the process of improving its space, but not yet in occupancy. |
| (5) | Historical operating statements are not available because the property was recently constructed in 2011. |
| (6) | The Appraised Value represents an “as-completed” value, which assumes completion of the tenant’s build-out of its space. The appraisal also presented an “as-is” appraised value of $118,000,000. Based on the “as-is” appraised value, the Cut-off Date LTV would be 64.8% and the LTV at Maturity would be 53.8%. The appraisal further presents a “go dark as-completed” appraised value of $84,700,000, which assumes termination of the lease by the tenant pursuant to the termination option. See “Major Tenant” below. Based on the “go dark as-completed” appraised value, the Cut-off Date LTV would be 90.3%, and the LTV at Maturity would be 75.0%. |
The Mortgage Loan.The mortgage loan (the “National Cancer Institute Center Mortgage Loan”) is evidenced by a single promissory note that is secured by a first mortgage encumbering a recently constructed, research facility for the National Cancer Institute (“NCI”), located in Frederick, Maryland (the “National Cancer Institute Center Property”). The National Cancer Institute Center Mortgage Loan was originated on July 13, 2011 by Wells Fargo Bank, National Association. The National Cancer Institute Center Mortgage Loan had an original principal balance of $76,500,000, has an outstanding principal balance as of the Cut-off Date of $76,500,000 and accrues interest at an interest rate of 5.350%per annum. The National Cancer Institute Center Mortgage Loan had an initial term of 120 months, has a remaining term of 112 months as of the Cut-off Date and requires interest-only payments for the first 24 payments following origination and thereafter requires payments of interest and principal based on a 26-year amortization schedule. The National Cancer Institute Center Mortgage Loan matures on August 1, 2021. The proceeds from the National Cancer Institute Center Mortgage Loan were used to refinance existing debt on the National Cancer Institute Center Property of approximately $43.8 million, fund upfront reserves of approximately $6.6 million, pay closing costs of approximately $773,187, and return approximately $25.5 million of equity to the sponsor.
THE INFORMATION IN THIS STRUCTURAL AND COLLATERAL TERM SHEET IS NOT COMPLETE AND MAY BE AMENDED PRIOR TO THE TIME OF SALE. THIS TERM SHEET IS NOT AN OFFER TO SELL THESE SECURITIES AND IT IS NOT A SOLICITATION OF AN OFFER TO BUY THESE SECURITIES IN ANY JURISDICTION WHERE THE OFFER OR SALE IS NOT PERMITTED.
22
NATIONAL CANCER INSTITUTE CENTER
Following the lockout period, the borrower has the right to defease the National Cancer Institute Center Mortgage Loan in whole, but not in part, on any due date before the scheduled maturity date. In addition, the National Cancer Institute Center Mortgage Loan is prepayable without penalty on or after May 1, 2021.
The Property. The National Cancer Institute Center Property is a three-story, four-wing research facility containing approximately 341,271 rentable square feet situated on 32.0 acres of land. The property was built in 2011 and is located within Riverside Research Park in Frederick, Maryland, approximately 40 miles northwest of Washington, D.C. The improvements include approximately 84,557 square feet of office/administrative space, approximately 194,630 square feet of laboratory space and approximately 62,084 square feet of manufacturing space. The National Cancer Institute Center Property is operated as an advanced technology research facility for the NCI. The National Cancer Institute Center Property is 100.0% leased to SAIC-Frederick, Inc. (the “Tenant”), a wholly-owned subsidiary of SAIC, Inc. under a 10-year lease term that is scheduled to expire on September 25, 2021 and contains two 10-year renewal options in favor of the Tenant. The Tenant holds a government contract pursuant to which it is the sole operations and technical support contractor for the National Cancer Institute’s federally-funded research and development center at Fort Detrick, Maryland. In addition, the Tenant has reserved the right to expand by an additional 100,000 square feet on land adjacent to the National Cancer Institute Center Property.
The Tenant is a government services contractor that provides information technology services primarily to federal and state agencies, including various divisions of the United States military. Services offered by the Tenant include providing technological needs for national security, energy and the environment departments, cyber security and health research.
The following table represents certain information relating to the tenant at the National Cancer Institute Center Property:
Major Tenant
Tenant Name | Credit Rating (Fitch/Moody’s/ S&P)(1) | Tenant NRSF | % of NRSF | Annual U/W Base Rent PSF(2) | Annual U/W Base Rent(2) | % of Total Annual U/W Base Rent | Lease Expiration Date | |||||||||||||||||||||
Major Tenant | ||||||||||||||||||||||||||||
SAIC – Frederick, Inc.(3) | NR/A3/A- | 341,271 | 100.0 | % | $ | 24.60 | $ | 8,394,276 | 100.0 | % | 9/25/2021 | (4) | ||||||||||||||||
|
|
|
|
|
|
|
| |||||||||||||||||||||
Total Major Tenant | 341,271 | 100.0 | % | $ | 24.60 | $ | 8,394,276 | 100.0 | % | |||||||||||||||||||
|
|
|
|
|
|
|
| |||||||||||||||||||||
| (1) | Credit ratings are those of the parent company whether or not the parent guarantees the lease. |
| (2) | The Annual U/W Base Rent PSF and Annual U/W Base Rent were derived by averaging the annual contractual rental increases through the lease term. The current in-place rent is $22.10 per square foot. |
| (3) | The Tenant possesses a purchase option at a price equal to fair market value of the National Cancer Institute Center Property at the time of purchase. Fair market value shall be considered the price that a willing buyer would pay and a willing seller would accept on the basis that the lease term is ten years and is not subject to any tenant early termination rights. See “Risk Factors –Renewal, Termination and Expiration and Reletting Entails Risks that May Adversely Affect Your Investment” in the Free Writing Prospectus. |
| (4) | The Tenant may terminate the lease with 240 days notice after the occurrence of various events, including but not limited to the following: (i) the United States government terminates in whole or in part the NCI contract with Tenant for any reason, (ii) the United States government reduces or changes the scope of the contract with Tenant for any reason, such that the reduction eliminates the need for Tenant’s activity conducted on the premises, (iii) funds available to Tenant for the services to be performed under the NCI contract are abolished or substantially eliminated by the United States government, or (iv) a termination for convenience occurs pursuant to applicable federal acquisition regulations with the Tenant. If the Tenant decides to terminate the lease prior to the following conditions: (i) the issuance of a certificate of occupancy, (ii) all of the Tenant’s fixtures, leasehold improvements, furniture and equipment being installed within the entire property and all government approvals and consents are issued, and (iii) not less than 250 employees of the Tenant are physically occupying the building, then the Tenant is responsible to reimburse the sponsor for any and all development costs and fees incurred by the sponsor as well as an early termination fee equal to 12% per annumof the sponsor’s cost to date (subject to a cap of $105 million). |
THE INFORMATION IN THIS STRUCTURAL AND COLLATERAL TERM SHEET IS NOT COMPLETE AND MAY BE AMENDED PRIOR TO THE TIME OF SALE. THIS TERM SHEET IS NOT AN OFFER TO SELL THESE SECURITIES AND IT IS NOT A SOLICITATION OF AN OFFER TO BUY THESE SECURITIES IN ANY JURISDICTION WHERE THE OFFER OR SALE IS NOT PERMITTED.
23
NATIONAL CANCER INSTITUTE CENTER
The following tables present certain information relating to the lease rollover schedule at the National Cancer Institute Center Property:
Lease Expiration Schedule(1)
Year Ending | No. of Leases Expiring(2) | Expiring NRSF | % of Total NRSF | Cumulative of Total NRSF | Cumulative % of Total NRSF | Annual U/W Base Rent | Annual U/W Base Rent PSF | |||||||||||||||||||
MTM | 0 | 0 | 0.0 | % | 0 | 0.0 | % | $0 | $0.00 | |||||||||||||||||
2012 | 0 | 0 | 0.0 | % | 0 | 0.0 | % | $0 | $0.00 | |||||||||||||||||
2013 | 0 | 0 | 0.0 | % | 0 | 0.0 | % | $0 | $0.00 | |||||||||||||||||
2014 | 0 | 0 | 0.0 | % | 0 | 0.0 | % | $0 | $0.00 | |||||||||||||||||
2015 | 0 | 0 | 0.0 | % | 0 | 0.0 | % | $0 | $0.00 | |||||||||||||||||
2016 | 0 | 0 | 0.0 | % | 0 | 0.0 | % | $0 | $0.00 | |||||||||||||||||
2017 | 0 | 0 | 0.0 | % | 0 | 0.0 | % | $0 | $0.00 | |||||||||||||||||
2018 | 0 | 0 | 0.0 | % | 0 | 0.0 | % | $0 | $0.00 | |||||||||||||||||
2019 | 0 | 0 | 0.0 | % | 0 | 0.0 | % | $0 | $0.00 | |||||||||||||||||
2020 | 0 | 0 | 0.0 | % | 0 | 0.0 | % | $0 | $0.00 | |||||||||||||||||
2021 | 1 | 341,271 | 100.0 | % | 341,271 | 100.0 | % | $8,394,276 | $24.60 | |||||||||||||||||
2022 | 0 | 0 | 0.0 | % | 341,271 | 100.0 | % | $0 | $0.00 | |||||||||||||||||
Thereafter | 0 | 0 | 0.0 | % | 341,271 | 100.0 | % | $0 | $0.00 | |||||||||||||||||
Vacant | 0 | 0 | 0.0 | % | 341,271 | 100.0 | % | $0 | $0.00 | |||||||||||||||||
|
|
|
|
|
|
|
|
| ||||||||||||||||||
Total /Weighted Average | 1 | 341,271 | 100.0 | % | $8,394,276 | $24.60 | ||||||||||||||||||||
|
|
|
|
|
|
|
|
| ||||||||||||||||||
| (1) | Source: Information obtained from the underwritten rent roll. |
| (2) | The Tenant has a lease termination option that is exercisable prior to the originally stated expiration date of the subject lease and is not considered in the Lease Expiration Schedule. |
Operating History and Underwritten Net Cash Flow. The following table presents certain information relating to the Underwritten Net Cash Flow at the National Cancer Institute Center Property:
Cash Flow Analysis(1)
| U/W(2) | U/W $ per SF(2) | |||||||
Base Rent | $ | 8,394,276 | $ | 24.60 | ||||
Grossed Up Vacant Space | 0 | 0.00 | ||||||
Total Reimbursables | 3,970,000 | 11.63 | ||||||
Other Income | 0 | 0.00 | ||||||
Less Vacancy & Credit Loss | (618,214 | ) | (1.81 | ) | ||||
|
|
|
| |||||
Effective Gross Income | $ | 11,746,062 | $ | 34.42 | ||||
Total Operating Expenses | $ | 3,972,287 | $ | 11.64 | ||||
|
|
|
| |||||
Net Operating Income | $ | 7,773,775 | $ | 22.78 | ||||
TI/LC | 620,167 | 1.82 | ||||||
Capital Expenditures | 85,318 | 0.25 | ||||||
|
|
|
| |||||
Net Cash Flow | $ | 7,068,290 | $ | 20.71 | ||||
NOI DSCR | 1.43x | |||||||
NCF DSCR | 1.30x | |||||||
NOI DY | 10.2% | |||||||
NCF DY | 9.2% | |||||||
| (1) | Historical operating statements are not available because the property was recently constructed in 2011. |
| (2) | The Annual U/W Base Rent PSF and Annual U/W Base Rent were derived by averaging the annual contractual rental increases through the lease term. The Tenant’s lease is triple-net and the current in-place rent is $22.10 per square foot. |
Appraisal. According to the appraisal, the National Cancer Institute Center Property had an “as-is” appraised value of $118,000,000, an “as-completed” appraised value of $124,000,000, which assumes completion of the Tenant’s build-out of it space, and a “go dark as-completed” appraised value of $84,700,000, which assumes a termination of the lease by the Tenant pursuant to the termination option described above. All of the aforementioned appraised values have an effective date of June 13, 2011.
Environmental Matters. According to the Phase I environmental site assessment dated June 9, 2011 there was no evidence of any recognized environmental conditions.
Market Overview and Competition. According to the appraisal, the National Cancer Institute Center Property is located within The Riverside Research Park, a 450-acre master planned corporate campus with approximately 177 acres dedicated primarily for medical research. The National Cancer Institute Center Property is located approximately four miles from Fort Detrick, a United
THE INFORMATION IN THIS STRUCTURAL AND COLLATERAL TERM SHEET IS NOT COMPLETE AND MAY BE AMENDED PRIOR TO THE TIME OF SALE. THIS TERM SHEET IS NOT AN OFFER TO SELL THESE SECURITIES AND IT IS NOT A SOLICITATION OF AN OFFER TO BUY THESE SECURITIES IN ANY JURISDICTION WHERE THE OFFER OR SALE IS NOT PERMITTED.
24
NATIONAL CANCER INSTITUTE CENTER
States Army medical installation that houses the principal offices of the United States Army Medical Research and Material Command. The National Cancer Institute Center Property is also located within approximately four miles of the National Interagency of Biodefense Camps and the existing properties at which the NCI or contractors on behalf of NCI maintain offices or research facilities.
The National Cancer Institute Center Property is located in the Suburban Maryland market within the greater Washington DC/Baltimore/Suburban Maryland market. The Washington DC/Baltimore/Suburban Maryland market has a concentration of life science, medical research and biotechnology facilities. Other government research entities located within the market include the Food and Drug Administration, the Department of Health and Human Services, the National Institutes of Health, and the U.S. Army’s Medical Research Institute for Infectious Diseases. Due to its laboratory build-out, the National Cancer Institute Center Property is classified as a life science property. Within the life science sector of the Suburban Maryland market, as of the second quarter 2011, vacancy is less than 6% and average market rents for similar space average $27.50 per square foot, triple net.
The Borrower. The National Cancer Institute Center Loan is structured as a Maryland Indemnity Deed of Trust (“IDOT”). The borrower is a single member Delaware limited liability company and a single purpose entity with two independent directors, whose sole member RIV 402, LLC is the owner of the National Cancer Institute Center Property and the indemnitor under the IDOT. Legal counsel to the borrower delivered a non-consolidation opinion in connection with the origination of the National Cancer Institute Center Mortgage Loan. The borrower is a joint venture between Matan Companies (“Matan”) and Federal Capital Partners (“FCP”). Matan has a 49.5% ownership interest via Matan 402 Member, LLC (“Matan 402”) and a 0.5% ownership interest via Matan 402 SPC, Inc. FCP has a 50.0% ownership interest via FCP Riverside NCI I, LLC (“FCP Riverside”). Matan 402 is 100% owned by Wedgewood Investment Group 2008, LLC, which is an investment entity controlled by Mark C. Matan. FCP Riverside is solely owned by FCP Fund 1, LP, FCP’s first real estate private equity fund, focused on equity and debt investments in properties and land in the Mid-Atlantic region. FCP Fund 1, LP is majority owned by third party investors, but is controlled by the FCP partners, who serve as the fund’s general partners. Mark C. Matan is the General Manager of the joint venture and ultimately maintains a 32% ownership in the property.
The Sponsor. The sponsor is a joint venture between FCP Riverside and Matan 402 and Mark C. Matan is the General Manager of the joint venture. Mr. Matan founded Matan Companies in 1995, which is an office and industrial real estate company based in Frederick, Maryland. The company’s current portfolio includes interests in over 41 buildings in excess of 3.5 million square feet. Over 50% of the company’s projects are located in Frederick, MD and only two projects are located outside of the greater Washington, D.C. metro area.
Escrows. The loan documents waive monthly escrows of real estate taxes provided the following conditions are met: (i) no event of default has occurred and is continuing and (ii) borrower delivers to lender evidence of timely payment of taxes not less than fifteen days prior to the delinquency of such payment. The loan documents waive monthly escrows of insurance for so long as the following conditions are satisfied: (i) no event of default has occurred and is continuing, (ii) the liability and casualty polices covering the property are part of a blanket or umbrella policy approved by lender and (iii) the borrower provides the lender with evidence of renewal of such policy and receipts for the payment of insurance premiums in accordance with the loan documents. The loan documents provide for monthly escrows of $853 for replacement reserves. The loan documents provide for an upfront escrow in the amount of $6,570,698 for outstanding tenant improvement costs and leasing commissions owed to the tenant.
Lockbox and Cash Management. The National Cancer Institute Center Mortgage Loan requires a lender-controlled lockbox account, which is already in place, and the Tenant is directed to pay its rents directly to such lockbox account. The loan documents also require that all cash revenues and all other monies received by the borrower or the property manager relating to the National Cancer Institute Center Property be deposited into the lockbox account within two business days after receipt. Upon the occurrence of a Cash Trap Event Period, as defined below, all funds on deposit in the lockbox account will be swept to certain restricted accounts, and if an event of default exists, the lender has the exclusive control of, and the right to withdraw and apply, the funds in the deposit account to payment of any and all debts, liabilities and obligations of the borrower in such order, proportion and priority as lender may determine in its sole discretion.
A “Cash Trap Event Period” shall commence upon the date the Tenant gives notice that it will vacate its space at the National Cancer Institute Center Property and a Cash Trap Event Period shall expire upon the earlier of (i) the date that the Tenant revokes its notice of early lease termination, or (ii) upon the date the National Cancer Institute Center Property is leased to new tenant(s) acceptable to lender upon terms reasonably acceptable to lender; such new tenant(s) are occupying the space and paying rent and has delivered estoppel certificate(s), and (iii) such lease(s) is generating a debt yield of not less than 9.9%.
Property Management. The National Cancer Institute Center Property is managed by Matan Companies, LLLP, an affiliate of the borrower. The property manager is currently entitled to a base management fee in an amount equal to 4.0% of the gross receipts collected from the National Cancer Institute Center Property. The borrower may not extend, renew, or cancel the management agreement or otherwise replace the manager or enter into any other management agreement without written consent from the lender (which consent may not be unreasonably withheld).
Assumption. The National Cancer Institute Center Mortgage Loan has a three-time right to transfer the National Cancer Institute Center Property with the consent of lender, provided that no event of default has occurred and is continuing under the National Cancer Institute Center Mortgage Loan and certain other conditions are satisfied, including lender’s reasonable determination that the proposed transferee and guarantor satisfy lender’s credit review and underwriting standards taking into consideration, (i) experience and financial strength and credit quality, (ii) requirements that the transferee will execute a recourse guaranty and an
THE INFORMATION IN THIS STRUCTURAL AND COLLATERAL TERM SHEET IS NOT COMPLETE AND MAY BE AMENDED PRIOR TO THE TIME OF SALE. THIS TERM SHEET IS NOT AN OFFER TO SELL THESE SECURITIES AND IT IS NOT A SOLICITATION OF AN OFFER TO BUY THESE SECURITIES IN ANY JURISDICTION WHERE THE OFFER OR SALE IS NOT PERMITTED.
25
NATIONAL CANCER INSTITUTE CENTER
environmental indemnity, (iii) rating agency confirmation that the transfer will not result in a downgrade, withdrawal or qualification of the respective ratings from Fitch, Moody’s and KBRA assigned to the Series 2012-C6 Certificates and (iv) other factors relied upon by lender in the original underwriting of the National Cancer Institute Center Mortgage Loan.
Purchase Option. The Tenant or its nominee, the United States Government, has the option to purchase the National Cancer Institute Center Property at any time for fair market value as agreed, or, absent an agreed value, as determined by a consensus of a board of three licensed MAI real estate appraisers or the average of the two closest values provided by such appraisers. If the tenant exercises such purchase option during the defeasance lockout period, the National Cancer Institute Center Borrower will be required to pay a yield maintenance-based prepayment premium, together with outstanding loan balance and other amounts payable under the related loan documents. If the purchase option is exercised following the defeasance lockout period, the National Cancer Institute Center borrower must defease the loan.
Release. The borrower is permitted to a partial release of two undeveloped land parcels (a 4.3 acre parcel on the west side of the existing parking lot and a 1.2 acre parcel on the east side of the existing building) of the National Cancer Institute Center upon the satisfaction of certain conditions, including but not limited to: (i) there is no event of default continuing, (ii) lender shall receive a legal non-consolidation opinion that the single purpose nature and bankruptcy remoteness of the borrower are in accordance with Fitch, Moody’s and KBRA’s standards, and (iii) the lender receives a legal opinion that following the release of the parcel the securitization will not fail to maintain its status as a REMIC trust.
Real Estate Substitution. Not permitted.
Subordinate and Mezzanine Indebtedness. Not permitted.
Ground Lease. None.
Terrorism Insurance. The loan documents require that the “all risk” insurance policy required to be maintained by the borrower provides coverage for terrorism in an amount equal to the full replacement cost of the National Cancer Institute Center Property, as well as business interruption insurance covering no less than the 18-month period from the occurrence of a casualty event, together with a 12-month extended period of indemnity.
THE INFORMATION IN THIS STRUCTURAL AND COLLATERAL TERM SHEET IS NOT COMPLETE AND MAY BE AMENDED PRIOR TO THE TIME OF SALE. THIS TERM SHEET IS NOT AN OFFER TO SELL THESE SECURITIES AND IT IS NOT A SOLICITATION OF AN OFFER TO BUY THESE SECURITIES IN ANY JURISDICTION WHERE THE OFFER OR SALE IS NOT PERMITTED.
26
[THIS PAGE INTENTIONALLY LEFT BLANK.]
27
WINDSOR HOTEL PORTFOLIO II

THE INFORMATION IN THIS STRUCTURAL AND COLLATERAL TERM SHEET IS NOT COMPLETE AND MAY BE AMENDED PRIOR TO THE TIME OF SALE. THIS TERM SHEET IS NOT AN OFFER TO SELL THESE SECURITIES AND IT IS NOT A SOLICITATION OF AN OFFER TO BUY THESE SECURITIES IN ANY JURISDICTION WHERE THE OFFER OR SALE IS NOT PERMITTED.
28
WINDSOR HOTEL PORTFOLIO II
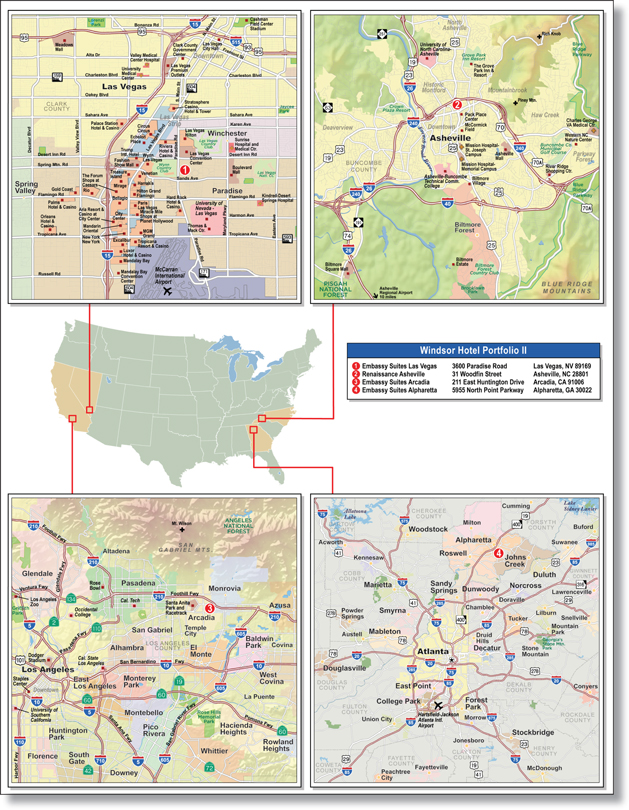
THE INFORMATION IN THIS STRUCTURAL AND COLLATERAL TERM SHEET IS NOT COMPLETE AND MAY BE AMENDED PRIOR TO THE TIME OF SALE. THIS TERM SHEET IS NOT AN OFFER TO SELL THESE SECURITIES AND IT IS NOT A SOLICITATION OF AN OFFER TO BUY THESE SECURITIES IN ANY JURISDICTION WHERE THE OFFER OR SALE IS NOT PERMITTED.
29
Windsor Hotel Portfolio II
Loan Information
| ||
Mortgage Loan Seller: | Wells Fargo Bank, National Association | |
| Credit Assessment (Fitch/Moody’s/KBRA): | NAP | |
Original Principal Balance: | $68,200,000 | |
Cut-off Date Principal Balance: | $67,279,272 | |
% of Initial Pool Balance: | 7.3% | |
Loan Purpose: | Refinance | |
Borrower Name(1): | Various | |
Sponsor: | Patrick M. Nesbitt | |
Mortgage Rate: | 5.500% | |
Note Date: | June 6, 2011 | |
Anticipated Repayment Date: | NAP | |
Maturity Date: | July 1, 2016 | |
IO Period: | None | |
Loan Term (Original): | 60 months | |
Seasoning: | 9 months | |
Amortization Term (Original): | 300 months | |
Loan Amortization Type: | Amortizing Balloon | |
Interest Accrual Method: | Actual/360 | |
Call Protection: | L(33),D(23),O(4) | |
Lockbox Type: | Hard/Upfront Cash Management | |
Additional Debt: | None | |
Additional Debt Type: | NAP | |
Escrows and Reserves:
Type: | Initial | Monthly | Cap (If Any) | |||
Taxes | $459,374 | $84,166 | NAP | |||
Insurance | $0 | $31,658 | NAP | |||
| Deferred Maintenance | $206,576 | $0 | NAP | |||
FF&E Reserve(2) | $3,275,440 | Various | NAP | |||
Seasonality Reserve | $300,000 | Excess Cash Flow | $300,000 |
Property Information
| ||
Single Asset/Portfolio: | Portfolio | |
Property Type: | Hospitality | |
Specific Property Type: | Full Service | |
Location: | Various | |
Size: | 901 Rooms | |
| Cut-off Date Principal Balance Per Room: | $74,671.78 | |
Year Built/Renovated: | Various | |
Occupancy %: | 76.2% | |
Occupancy % Source Date: | December 31, 2011 | |
Title Vesting: | Fee | |
Property Manager: | Windsor Capital Group, Inc. | |
3rd Most Recent NOI (As of): | $9,346,844 (12/31/2009) | |
2nd Most Recent NOI (As of): | $8,864,415 (12/31/2010) | |
Most Recent NOI (As of): | $9,892,114 (12/31/2011) | |
U/W Revenues: | $35,767,588 | |
U/W Expenses: | $25,879,265 | |
U/W NOI: | $9,888,323 | |
U/W NCF: | $8,332,866 | |
U/W NOI DSCR: | 1.97x | |
U/W NCF DSCR: | 1.66x | |
U/W NOI Debt Yield: | 14.7% | |
U/W NCF Debt Yield: | 12.4% | |
As-Is Appraised Value: | $112,300,000 | |
As-Is Appraisal Valuation Date | Various | |
Cut-off Date LTV Ratio: | 59.9% | |
LTV Ratio at Maturity or ARD: | 54.5% | |
| (1) | Borrower names are Alpharetta Hotel Venture, LP, Arcadia Hotel Venture, LP, Nesbitt Asheville Venture LLC, and Nesbitt L.V.C.C., LLC. |
| (2) | Monthly payments of 4.0% of gross monthly income are payable into a FF&E reserve fund for each of the Embassy Suites Alpharetta, Embassy Suites Arcadia and Embassy Suites Las Vegas and 5.0% of monthly gross income for the Renaissance Asheville. |
The Mortgage Loan. The mortgage loan (the “Windsor Hotel Portfolio II Mortgage Loan”) is evidenced by a single promissory note secured by a first mortgage encumbering the borrower’s fee interest in three Embassy Suites Hotels and one Renaissance Hotel located in four states (the “Windsor Hotel Portfolio II Properties”). The Windsor Hotel Portfolio II Mortgage Loan was originated on June 6, 2011 by Wells Fargo Bank, National Association. The Windsor Hotel Portfolio II Mortgage Loan had an original principal balance of $68,200,000, has an outstanding principal balance as of the Cut-off-Date of $67,279,272 and accrues interest at an interest rate of 5.550% per annum. The Windsor Hotel Portfolio II Mortgage Loan had an initial term of 60 months, has a remaining term of 51 months as of the Cut-off Date and requires payments of interest and principal based on a 25-year amortization schedule. The Windsor Hotel Portfolio II Mortgage Loan matures on July 1, 2016. The proceeds from the Windsor Hotel Portfolio II Mortgage Loan, a preferred equity investment in the amount of $37.0 million from CBREI Capital Partners, and $2.1 million from the carryover of previous escrow accounts were used to refinance existing debt on the Windsor Hotel Portfolio II Properties and associated costs of $101.0 million securitized in GMACC 2005-C1, fund escrow accounts of approximately $4.2 million, and fund closing costs of approximately $2.0 million.
Following the lockout period, the borrower has the right to defease the Windsor Hotel Portfolio II Mortgage Loan in whole but not in part, on any due date before the scheduled maturity date. In addition, the Windsor Hotel Portfolio II Mortgage Loan is prepayable without penalty on or after April 1, 2016.
The Properties. The Windsor Hotel Portfolio II Mortgage Loan is secured by the fee interest in three full-service Embassy Suites hotels and one full-service Renaissance hotel located in Nevada, North Carolina, California, and Georgia. The properties comprise a total of 901 rooms.
THE INFORMATION IN THIS STRUCTURAL AND COLLATERAL TERM SHEET IS NOT COMPLETE AND MAY BE AMENDED PRIOR TO THE TIME OF SALE. THIS TERM SHEET IS NOT AN OFFER TO SELL THESE SECURITIES AND IT IS NOT A SOLICITATION OF AN OFFER TO BUY THESE SECURITIES IN ANY JURISDICTION WHERE THE OFFER OR SALE IS NOT PERMITTED.
30
WINDSOR HOTEL PORTFOLIO II
Embassy Suites Las Vegas
The property is a 286-room, full-service hotel located in Las Vegas, Nevada. The eleven-story property was built in 2000 and is located along Paradise Road, approximately 5 miles south of Downtown Las Vegas and just south of the Las Vegas Convention Center. On-site amenities include an outdoor pool, fitness center, restaurant, business center and approximately 11,025 square feet of meeting and banquet space. The Embassy Suites’ franchise agreement expires on March 27, 2018.
Renaissance Asheville
The property is a 275-room, full-service hotel located in Asheville, North Carolina. The 13-story property is located in the central business district of Asheville and the property was built in 1970 and renovated in 2008. On-site amenities consist of a restaurant, indoor swimming pool, fitness center, business center, and 20,789 square feet of meeting space. The Renaissance franchise agreement expires on December 15, 2018.
Embassy Suites Arcadia
The property is a 190-room, full service hotel located in Arcadia, California. The seven-story property is located approximately 17 miles northeast of Los Angeles and was built in 1984 and renovated in 2002. On-site amenities include a swimming pool, restaurant and lounge, fitness center, business center and approximately 7,568 square feet of meeting space. The Embassy Suites franchise agreement expires on November 11, 2017.
Embassy Suites Alpharetta
The property is a 150-room, full-service hotel located in Alpharetta, Georgia. The six-story property was built in 2001 and is located in close proximity to North Point Mall and approximately 25 miles north of Atlanta. On-site amenities include a restaurant and bar, fitness room, indoor pool, business center and 3,156 square feet of meeting space. The Embassy Suites franchise agreement expires on February 11, 2020.
The following table represents certain information relating to the Windsor Hotel Portfolio II Properties:
Property Name | Allocated Cut-off Date Principal Balance | % of Portfolio Cut-off Date Principal Balance | Rooms | Loan/Room | Year Built/ Renovated | Appraised Value | ||||||||
Embassy Suites Las Vegas | $21,431,703 | 31.9 | % | 286 | $74,936 | 2000/NAP | $33,400,000 | |||||||
Renaissance Asheville | $20,203,511 | 30.0 | 275 | $73,467 | 1970/2008 | $31,500,000 | ||||||||
Embassy Suites Arcadia | $17,559,692 | 26.1 | 190 | $92,419 | 1984/2002 | $34,800,000 | ||||||||
Embassy Suites Alpharetta | $8,084,364 | 12.0 | 150 | $53,896 | 2001/NAP | $12,600,000 | ||||||||
|
|
|
|
|
| |||||||||
Total/Weighted Average | $67,279,272 | 100.0 | % | 901 | $74,672 | $112,300,000 | ||||||||
|
|
|
|
|
| |||||||||
THE INFORMATION IN THIS STRUCTURAL AND COLLATERAL TERM SHEET IS NOT COMPLETE AND MAY BE AMENDED PRIOR TO THE TIME OF SALE. THIS TERM SHEET IS NOT AN OFFER TO SELL THESE SECURITIES AND IT IS NOT A SOLICITATION OF AN OFFER TO BUY THESE SECURITIES IN ANY JURISDICTION WHERE THE OFFER OR SALE IS NOT PERMITTED.
31
WINDSOR HOTEL PORTFOLIO II
Operating History and Underwritten Net Cash Flow. The following table presents certain information relating to the historical operating performance and the Underwritten Net Cash Flow at the Windsor Hotel Portfolio II Properties:
Cash Flow Analysis
| 2009 | 2010 | 2011 | U/W | U/W $ per Room | ||||||||||||||||
Occupancy | 69.8% | 74.0% | 76.2% | 76.2% | ||||||||||||||||
ADR | $123.46 | $116.58 | $119.75 | $119.75 | ||||||||||||||||
RevPAR | $86.15 | $86.26 | $91.30 | $91.30 | ||||||||||||||||
Total Revenue | $33,916,268 | $33,899,394 | $35,767,588 | $35,767,588 | $39,698 | |||||||||||||||
Total Department Expenses | 11,589,572 | 11,806,557 | 12,168,730 | 12,168,730 | 13,506 | |||||||||||||||
|
|
|
|
|
|
|
|
|
| |||||||||||
Gross Operating Profit | $22,326,696 | $22,092,837 | $23,598,858 | $23,598,858 | $26,192 | |||||||||||||||
Total Undistributed Expenses | 11,581,661 | 11,789,895 | 12,319,571 | 12,308,760 | $13,661 | |||||||||||||||
|
|
|
|
|
|
|
|
|
| |||||||||||
Profit Before Fixed Charges | $10,745,035 | $10,302,942 | $11,279,287 | $11,290,098 | $12,531 | |||||||||||||||
Total Fixed Charges | 1,398,191 | 1,438,527 | 1,387,173 | 1,401,775 | 1,556 | |||||||||||||||
|
|
|
|
|
|
|
|
|
| |||||||||||
Net Operating Income | $9,346,844 | $8,864,415 | $9,892,114 | $9,888,323 | $10,975 | |||||||||||||||
FF&E | 1,360,877 | 1,358,758 | 1,434,160 | 1,555,457 | 1,726 | |||||||||||||||
|
|
|
|
|
|
|
|
|
| |||||||||||
Net Cash Flow | $7,985,967 | $7,505,657 | $8,457,954 | $8,332,866 | $9,249 | |||||||||||||||
NOI DSCR | 1.86x | 1.76x | 1.97x | 1.97x | ||||||||||||||||
NCF DSCR | 1.59x | 1.49x | 1.68x | 1.66x | ||||||||||||||||
NOI DY | 13.9% | 13.2% | 14.7% | 14.7% | ||||||||||||||||
NCF DY | 11.9% | 11.2% | 12.6% | 12.4% | ||||||||||||||||
Appraisal. According to the appraisals performed between March 14, 2011 and April 8, 2011, the Windsor Hotel Portfolio II had an aggregated “as-is” appraised value of $112,300,000.
Environmental Matters. According to a Phase I environmental site assessment dated April 11, 2011, the continued implementation of an existing asbestos operations and maintenance plan was recommended with respect to the Renaissance Asheville property.
According to Phase I environmental site assessments dated April 8, 2011 and April 11, 2011, there was no evidence of recognized environmental conditions at Embassy Suites Las Vegas, Embassy Suites Arcadia and Embassy Suites Alpharetta.
Market Overview and Competition. The Windsor Hotel Portfolio II Properties are located in Nevada, North Carolina, California and Georgia.
Embassy Suites Las Vegas
The Embassy Suites Las Vegas property is located in Las Vegas, Clark County, Nevada, south of the Las Vegas Convention Center, one mile east of Las Vegas Boulevard (“the Strip”) and five miles south of downtown Las Vegas. The property is also located just east of Hughes Center, a master planned office, retail and residential community that includes approximately 1.4 million square feet of office space and restaurants. The demand segment for the competitive market is estimated at 47% commercial, 30% meeting and group and 23% leisure.
Subject and Market Historical Occupancy, ADR and RevPAR (Embassy Suites Las Vegas)
| Competitive Set(1) | Embassy Suites Las Vegas(1) | Penetration Factor | ||||||||||||||||
Year | Occupancy | ADR | RevPAR | Occupancy | ADR | RevPAR | Occupancy | ADR | RevPAR | |||||||||
12/31/2011 | 76.6% | $100.37 | $76.89 | 79.6% | $111.14 | $88.43 | 103.9% | 110.7% | 115.0% | |||||||||
12/31/2010 | 70.2% | $99.74 | $70.03 | 75.9% | $109.58 | $83.19 | 108.1% | 109.9% | 118.8% | |||||||||
12/31/2009 | 63.7% | $111.01 | $70.76 | 75.5% | $115.91 | $87.52 | 118.5% | 104.4% | 123.7% | |||||||||
| (1) | Data provided by a December 31, 2011 hospitality research report. |
THE INFORMATION IN THIS STRUCTURAL AND COLLATERAL TERM SHEET IS NOT COMPLETE AND MAY BE AMENDED PRIOR TO THE TIME OF SALE. THIS TERM SHEET IS NOT AN OFFER TO SELL THESE SECURITIES AND IT IS NOT A SOLICITATION OF AN OFFER TO BUY THESE SECURITIES IN ANY JURISDICTION WHERE THE OFFER OR SALE IS NOT PERMITTED.
32
WINDSOR HOTEL PORTFOLIO II
Renaissance Ashesville
The Renaissance Asheville property is located in Asheville, Buncombe County, North Carolina. Asheville is located in Western North Carolina, approximately 130 miles northwest of Charlotte, North Carolina and approximately 116 miles southeast of Knoxville, Tennessee. The property is located within the Asheville central business district at the southeast corner of Sweeten Creek and Roberts Roads and south of Interstate 240. The demand segment for the competitive market is estimated at 44% leisure, 43% commercial and 13% meeting and group.
Subject and Market Historical Occupancy, ADR and RevPAR (Renaissance Asheville)
| Competitive Set(1) | Renaissance Asheville(1) | Penetration Factor | ||||||||||||||||
Year | Occupancy | ADR | RevPAR | Occupancy | ADR | RevPAR | Occupancy | ADR | RevPAR | |||||||||
12/31/2011 | 58.3% | $102.10 | $59.49 | 71.6% | $130.92 | $93.74 | 122.9% | 128.2% | 157.6% | |||||||||
12/31/2010 | 56.6% | $98.53 | $55.77 | 68.9% | $122.31 | $84.33 | 121.8% | 124.1% | 151.2% | |||||||||
12/31/2009 | 54.4% | $100.34 | $54.60 | 63.7% | $129.50 | $82.45 | 117.0% | 129.1% | 151.0% | |||||||||
| (1) | Data provided by a December 31, 2011 hospitality research report. |
Embassy Suites Arcadia
The Embassy Suites Arcadia property is located in Arcadia, Los Angeles County, California. Arcadia is located approximately 14 miles to the northeast of Downtown Los Angeles. The property is located on the northeast corner of Huntington Drive and Second Avenue in downtown Arcadia and access is provided by Interstate 210, Interstate 10 and Interstate 605. The property is located approximately one mile west of the Santa Anita Park and Raceway and in close proximity to offices maintained by Exxon Mobile, IBM, Northrup Grumman and Boeing Company. The demand segment for the competitive market is estimated at 69% commercial, 24% leisure, and 7% meeting and group.
Subject and Market Historical Occupancy, ADR and RevPAR (Embassy Suites Arcadia)
| Competitive Set(1) | Embassy Suites Arcadia(1) | Penetration Factor | ||||||||||||||||
Year | Occupancy | ADR | RevPAR | Occupancy | ADR | RevPAR | Occupancy | ADR | RevPAR | |||||||||
12/30/2011 | 81.1% | $114.45 | $92.83 | 79.5% | $127.40 | $101.25 | 98.0% | 111.3% | 109.1% | |||||||||
12/30/2010 | 75.6% | $109.98 | $83.16 | 81.4% | $123.67 | $100.63 | 107.6% | 112.4% | 121.0% | |||||||||
12/30/2009 | 68.6% | $114.24 | $78.41 | 73.0% | $132.53 | $96.74 | 106.3% | 116.0% | 123.4% | |||||||||
| (1) | Data provided by December 31, 2011 hospitality research report. |
Embassy Suites Alpharetta
The Embassy Suites Alpharetta property is located in Alpharetta, Georgia within Fulton County. Alpharetta is approximately 25 miles northeast of Atlanta central business district. Georgia Highway 400 is located just west of the property and provides north/south access from the Atlanta central business district. The property is located near several office parks, the North Point Mall and the Verizon Wireless Amphitheatre, a 12,000 seat music venue that opened in 2010, as well as local offices maintained by AT&T, General Electric, Johnson & Johnson, Siemens and Verizon. The demand segment for the competitive market is estimated at 59% commercial, 23% meeting and group and 18% leisure.
Subject and Market Historical Occupancy, ADR and RevPAR (Embassy Suites Alpharetta)
| Competitive Set(1) | Embassy Suites Alpharetta(1) | Penetration Factor | ||||||||||||||||
Year | Occupancy | ADR | RevPAR | Occupancy | ADR | RevPAR | Occupancy | ADR | RevPAR | |||||||||
12/31/2011 | 65.5% | $108.95 | $71.32 | 72.5% | $111.94 | $81.15 | 110.7% | 102.7% | 113.8% | |||||||||
12/31/2010 | 64.4% | $100.83 | $64.90 | 71.5% | $108.97 | $77.86 | 111.0% | 108.1% | 120.0% | |||||||||
12/31/2009 | 58.0% | $103.82 | $60.22 | 66.8% | $114.59 | $76.51 | 115.1% | 110.4% | 127.0% | |||||||||
| (1) | Data provided by December 31, 2011 hospitality research report. |
The Borrower. The borrowers consist of two Delaware limited partnerships and two limited liability companies, all single purpose entities with two independent directors. Legal counsel for the borrower delivered a non-consolidation opinion in connection with the origination of the Windsor Hotel Portfolio II Mortgage Loan. Patrick M. Nesbitt, the indirect owner of the borrower, is the guarantor of certain nonrecourse carveouts under the Windsor Hotel Portfolio II Mortgage Loan.
THE INFORMATION IN THIS STRUCTURAL AND COLLATERAL TERM SHEET IS NOT COMPLETE AND MAY BE AMENDED PRIOR TO THE TIME OF SALE. THIS TERM SHEET IS NOT AN OFFER TO SELL THESE SECURITIES AND IT IS NOT A SOLICITATION OF AN OFFER TO BUY THESE SECURITIES IN ANY JURISDICTION WHERE THE OFFER OR SALE IS NOT PERMITTED.
33
WINDSOR HOTEL PORTFOLIO II
The Sponsor. Patrick M. Nesbitt is the founder, Chairman and CEO of Windsor Capital Group, Inc., (“WCG”) which is based in Santa Monica, California. Since creating WCG over 36 years ago, the company has become one of the largest private owners and operators of Embassy Suites hotels. In addition, WCG owns and manages a number of other hospitality assets under the Marriott flag. In total, WCG owns and/or operates 22 branded hotels in 11 states. Two loans for which Mr. Nesbitt and WCG are the sponsors, Windsor Capital Embassy Suites Portfolio and Citadel Crossing, which were sold into commercial mortgage securitizations in 2006, are currently in maturity default and were transferred to special servicing. See “Risk Factors — Prior Bankruptcies or Other Proceedings May Be Relevant to Future Performance” in the Free Writing Prospectus.
Escrows. The loan documents provide for initial deposits of $459,374 for real estate taxes, $206,576 for deferred maintenance, $3,275,440 for an FF&E reserve, and $300,000 for a seasonality reserve. The loan documents provide for ongoing monthly escrow deposits in the amount of $84,166 for real estate taxes (subject to adjustment according to the lender’s estimate of real estate taxes) and $31,658 of insurance (subject to adjustment according to the lender’s estimate of insurance premiums). The borrower is also required to deposit monthly into a franchise, fixture and equipment (“FF&E”) reserve account an amount equal to 4.0% of total revenue during the corresponding calendar month for each of the Embassy Suites Las Vegas, Embassy Suites Arcadia and Embassy Suites Alpharetta and 5.0% of total revenue during the corresponding calendar month for the Renaissance Asheville. The borrower is also required to deposit monthly (subject to a cap of $300,000 on the amount required to be on deposit at any one time) with lender an amount equal to all remaining excess cash flow into a reserve account (a “Seasonality Reserve”) for the purpose of maintaining adequate reserves to fund the aggregate shortfalls for debt service, operating expenses and required reserves that the lender estimates will occur due to seasonal fluctuations in the performance of each of the Windsor Hotel Portfolio II Properties.
A “Cash Trap Event Period” will commence upon any of the following: (i) an event of default under the loan documents, or (ii) if, as of the last day of any calendar quarter during the loan term, the debt service coverage ratio is equal to or less than 1.20x. So as long as no event of default exists and is continuing, a Cash Trap Event Period shall end if and when the Windsor Hotel Portfolio II Properties achieve a debt service coverage ratio greater than 1.20x for two consecutive calendar quarters after the commencement of a Cash Trap Event Period. If no Cash Trap Event Period has occurred and is continuing and no event of default has occurred and is continuing, all excess cash flow after fulfilling the requirements of the Seasonality Reserve, will be returned to the borrower.
Lockbox and Cash Management. The Windsor Hotel Portfolio II Mortgage Loan requires a lender-controlled lockbox account, which is already in place, and that the borrower direct all tenants and credit card companies/banks to deliver all receipts payable with respect to the Windsor Hotel Portfolio II Properties directly into the lockbox account. The loan documents also require that all revenues received by the borrower or property manager be deposited into the lockbox account within one business day after receipt.
Property Management. The Windsor Hotel Portfolio II Properties are managed by WCG, an affiliate of the borrower. See “The Sponsor” above. According to the management agreement for all of the Windsor Hotel Portfolio II Properties, the manager is entitled to 3.5% of gross revenues of each operating year. The borrower may not enter into a third party property or asset management contract without prior written consent from lender.
Assumption.The Windsor Hotel Portfolio II Mortgage Loan has a two-time right to transfer the Windsor Hotel Portfolio II Properties and cause an assumption of the loan, subject to various conditions set forth in the loan documents, including but not limited to (i) no event of default has occurred and is continuing under the Windsor Hotel Portfolio II Mortgage Loan, (ii) the transferee borrower is a reputable entity or person of good character, creditworthy with sufficient financial worth, (iii) the borrow pays an assumption fee in an amount equal to 1% of the then outstanding principal balance of the loan, (iv) the lender receives a new non-consolidation opinion, and (v) rating agency confirmation that the transfer will not result in a downgrade, withdrawal or qualification of the respective ratings from Fitch, Moody’s and KBRA assigned to the Series 2012-C6 Certificates.
Right of First Refusal. For the Renaissance Asheville property only, Marriott International, Inc., as franchisor, has a right of first refusal to acquire the related property if there is transfer of hotel or controlling direct or indirect interest in the related borrower to a “competitor” (any person having an interest, other than as a passive investor, in another hotel brand comprised of at least 10 hotels).
Release. Not permitted.
Real Estate Substitution. Not permitted.
Subordinate and Mezzanine Indebtedness. Not permitted.
Preferred Equity. A subsidiary of CBRE Capital Partners, CPUSI SS Co-Investment Windsor Owner, LLC, is a preferred member in the borrower (the “Preferred Member”) and is entitled to a preferred return on an equity investment of $37,000,000, which is fully payable on June 1, 2016, which is one month before the scheduled maturity of the Windsor Hotel Portfolio II Mortgage Loan. The managing member in the borrower is currently NFT SPE 3 LLC, which is an affiliate of WCG (the “Managing Member”). The current interest rate on the unreturned initial preferred capital is 8% per annum, with a minimum required internal rate of return of 16% on the Preferred Member’s initial preferred capital contribution. However, following any removal of the Managing Member, the interest rate increases to 21% per annum. The Managing Member is subject to removal upon the occurrence of various events, including but not limited to: (i) failure to pay the preferred return on any scheduled distribution date, (ii) failure to pay the Preferred Member the entire preferred capital return amount when due, (iii) the Managing Member is indicted for a felony, engages in misapplication
THE INFORMATION IN THIS STRUCTURAL AND COLLATERAL TERM SHEET IS NOT COMPLETE AND MAY BE AMENDED PRIOR TO THE TIME OF SALE. THIS TERM SHEET IS NOT AN OFFER TO SELL THESE SECURITIES AND IT IS NOT A SOLICITATION OF AN OFFER TO BUY THESE SECURITIES IN ANY JURISDICTION WHERE THE OFFER OR SALE IS NOT PERMITTED.
34
WINDSOR HOTEL PORTFOLIO II
or theft of funds or commits fraud, and (iv) as of December 1, 2012 and each subsequent twelve month period until loan maturity, if both the property’s net operating income for the twelve month period immediately preceding December 1, 2012 is less than the property’s net operating income for the twelve-month period immediately preceding June 1, 2011 and the Preferred Member’s investment-to-value ratio is greater than 95% based on a capitalization rate of 8.75%.
Ground Lease. None.
Terrorism Insurance. The loan documents require that the “all-risk” insurance policy required to be maintained by the borrower provide coverage for terrorism in an amount equal to the full replacement cost of the Windsor Hotel Portfolio II Properties, as well as business interruption insurance covering no less than the 12-month period following the occurrence of a casualty event, together with 12 months of extended period of indemnity.
THE INFORMATION IN THIS STRUCTURAL AND COLLATERAL TERM SHEET IS NOT COMPLETE AND MAY BE AMENDED PRIOR TO THE TIME OF SALE. THIS TERM SHEET IS NOT AN OFFER TO SELL THESE SECURITIES AND IT IS NOT A SOLICITATION OF AN OFFER TO BUY THESE SECURITIES IN ANY JURISDICTION WHERE THE OFFER OR SALE IS NOT PERMITTED.
35
WPC SELF STORAGE PORTFOLIO
THE INFORMATION IN THIS STRUCTURAL AND COLLATERAL TERM SHEET IS NOT COMPLETE AND MAY BE AMENDED PRIOR TO THE TIME OF SALE. THIS TERM SHEET IS NOT AN OFFER TO SELL THESE SECURITIES AND IT IS NOT A SOLICITATION OF AN OFFER TO BUY THESE SECURITIES IN ANY JURISDICTION WHERE THE OFFER OR SALE IS NOT PERMITTED.
36
WPC SELF STORAGE PORTFOLIO
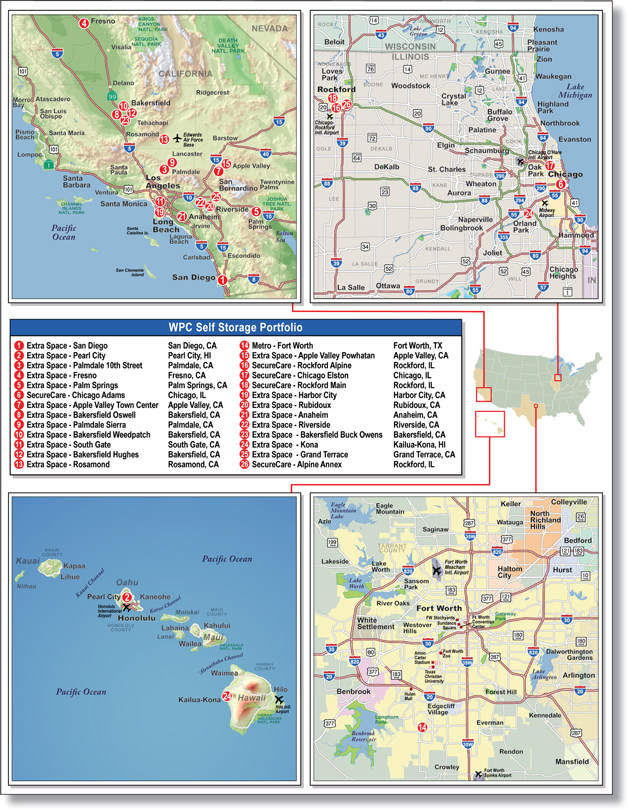
THE INFORMATION IN THIS STRUCTURAL AND COLLATERAL TERM SHEET IS NOT COMPLETE AND MAY BE AMENDED PRIOR TO THE TIME OF SALE. THIS TERM SHEET IS NOT AN OFFER TO SELL THESE SECURITIES AND IT IS NOT A SOLICITATION OF AN OFFER TO BUY THESE SECURITIES IN ANY JURISDICTION WHERE THE OFFER OR SALE IS NOT PERMITTED.
37
WPC Self Storage Portfolio
Loan Information
| ||
Mortgage Loan Seller: | Wells Fargo Bank, National Association | |
| Credit Assessment (Fitch/Moody’s/KBRA): | NAP | |
Original Principal Balance: | $48,157,500 | |
Cut-off Date Principal Balance: | $48,157,500 | |
% of Initial Pool Balance: | 5.2% | |
Loan Purpose: | Acquisition | |
Borrower Names: | American WPC Storage (Multi) LLC; Alamo WPC Storage (TX) LLC | |
Sponsor: | Corporate Property Associates 17 – Global Incorporated | |
Mortgage Rate: | 5.200% | |
Note Date: | June 27, 2011 | |
Anticipated Repayment Date: | NAP | |
Maturity Date: | July 1, 2021 | |
IO Period: | 60 months | |
Loan Term (Original): | 120 months | |
Seasoning: | 9 months | |
Amortization Term (Original): | 360 months | |
Loan Amortization Type: | Interest-only, Amortizing Balloon | |
Interest Accrual Method: | Actual/360 | |
Call Protection: | L(33),D(83),O(4) | |
Lockbox Type(1): | Various | |
Additional Debt: | None | |
Additional Debt Type: | NAP | |
Escrows and Reserves:
Type: | Initial | Monthly | Cap (If Any) | |||
Taxes(2) | $0 | Springing | NAP | |||
Insurance(3) | $0 | Springing | NAP | |||
| Replacement Reserves(4) | $0 | Springing | NAP | |||
Deferred Maintenance | $381,334 | $0 | NAP |
Property Information
| ||
Single Asset/Portfolio: | Portfolio | |
Property Type: | Self Storage | |
Specific Property Type: | Self Storage | |
Location: | Various | |
Size: | 1,718,350 IF | |
| Cut-off Date Principal Balance Per Unit/SF: | $28.03 | |
Year Built/Renovated: | Various/Various | |
Occupancy %: | 63.8% | |
Occupancy % Source Date: | December 31, 2011 | |
Title Vesting(5): | Various | |
Property Manager(6): | Various | |
3rd Most Recent NOI (As of): | $8,446,909(12/31/2009) | |
2nd Most Recent NOI (As of): | $7,452,196(12/31/2010) | |
Most Recent NOI (As of)(7): | $6,592,302 (Annualized Q1/Q3/Q4 2011) | |
U/W Revenues(8): | $12,026,743 | |
U/W Expenses(8): | $5,833,071 | |
U/W NOI(8): | $6,193,672 | |
U/W NCF(8): | $5,850,002 | |
U/W NOI DSCR(8): | 1.95x | |
U/W NCF DSCR(8): | 1.84x | |
U/W NOI Debt Yield(8): | 12.9% | |
U/W NCF Debt Yield(8): | 12.1% | |
As-Is Appraised Value: | $98,145,000 | |
| As-Is Appraisal Valuation Date: | Various | |
Cut-off Date LTV Ratio: | 49.1% | |
LTV Ratio at Maturity or ARD: | 45.4% | |
| (1) | Rents from 25 of the properties are subject to hard lockboxes with springing cash management; rents from one property (Forth Worth) are subject to springing cash management with an established account. |
| (2) | Monthly tax escrows are waived so long as no event of default has occurred and is continuing and the borrower provides satisfactory evidence of payment of taxes. |
| (3) | Monthly insurance escrows are waived so long as no event of default has occurred and is continuing and the borrower provides satisfactory evidence that the properties are insured in accordance with the loan documents. |
| (4) | Monthly replacement reserves are waived so long as no event of default has occurred and is continuing. |
| (5) | Twenty-five of the properties are fee interests; one property (Pearl City) is a leasehold interest. |
| (6) | See “Property Management” below for more details. |
| (7) | Financials for the second quarter of 2011 were not provided upon the borrower’s acquisition of the properties. |
| (8) | Underwritten NOI is based on the annualized trailing three-month period ending December 31, 2011. |
The Mortgage Loan.The mortgage loan (the “WPC Self Storage Portfolio Mortgage Loan”) is evidenced by a single promissory note that is secured by a first mortgage encumbering 26 self storage facilities located in California, Illinois, Hawaii and Texas (the “WPC Self Storage Portfolio Properties”). The WPC Self Storage Portfolio Mortgage Loan was originated on June 27, 2011 by Wells Fargo Bank, National Association. The WPC Self Storage Portfolio Mortgage Loan had an original principal balance of $48,157,500, has an outstanding balance as of the Cut-off Date of $48,157,500, and accrues interest at an interest rate of 5.200% per annum. The WPC Self Storage Portfolio Mortgage Loan had an initial term of 120 months, has a remaining term of 111 months as of the Cut-off Date and requires interest-only payments for the first 60 months and thereafter requires payments of interest and principal based on a 30-year amortization schedule. The WPC Self Storage Portfolio Mortgage Loan matures on July 1, 2021. The proceeds from the WPC Self Storage Mortgage Loan were used to acquire the WPC Self Storage Portfolio Properties for approximately $96.3 million and fund $381,334 in upfront reserves; in addition, the borrower contributed approximately $48.5 million in equity.
THE INFORMATION IN THIS STRUCTURAL AND COLLATERAL TERM SHEET IS NOT COMPLETE AND MAY BE AMENDED PRIOR TO THE TIME OF SALE. THIS TERM SHEET IS NOT AN OFFER TO SELL THESE SECURITIES AND IT IS NOT A SOLICITATION OF AN OFFER TO BUY THESE SECURITIES IN ANY JURISDICTION WHERE THE OFFER OR SALE IS NOT PERMITTED.
38
WPC SELF STORAGE PORTFOLIO
Following the lockout period, the borrower has the right to defease the WPC Self Storage Portfolio Mortgage Loan in whole, but not in part (except in conjunction with a partial release as hereafter described), on any due date before the scheduled maturity date. In addition, the WPC Self Storage Portfolio Mortgage Loan is prepayable without penalty on or after April 1, 2021.
The Properties. The WPC Self Storage Portfolio Mortgage Loan is secured by a fee interest in 25 self storage properties and the leasehold interest in one self storage property, together consisting of approximately 1,718,350 square feet. The WPC Self Storage Portfolio Properties are located in California, Illinois, Hawaii and Texas. The properties range from 28,553 square feet to 161,525 square feet. As of December 31, 2011, the WPC Self Storage Portfolio Properties were 63.8% occupied.
The following table represents certain information relating to the WPC Self Storage Portfolio Properties:
Property Name | Property Type | Location | Allocated Cut- off Date Principal Balance | Occupancy | Year Built/ Renovated | Net Rentable Area (SF) | Appraised Value | |||||||||
San Diego | Self Storage | San Diego, CA | $6,273,000 | 77.4% | 1986/NAP | 97,605 | $12,400,000 | |||||||||
Pearl City | Self Storage | Pearl City, HI | $3,450,000 | 57.2% | 1977/NAP | 72,324 | $7,000,000 | |||||||||
Palmdale 10th Street | Self Storage | Palmdale, CA | $2,773,000 | 46.7% | 1988/2005 | 126,290 | $5,650,000 | |||||||||
Fresno | Self Storage | Fresno, CA | $2,638,000 | 58.5% | 1976/1999 | 161,525 | $5,450,000 | |||||||||
Palm Springs | Self Storage | Palm Springs, CA | $2,511,000 | 70.6% | 1989/NAP | 64,541 | $4,720,000 | |||||||||
Chicago Adams | Self Storage | Chicago, IL | $2,342,000 | 71.7% | 1916/2002 | 39,271 | $4,150,000 | |||||||||
Apple Valley Town Center | Self Storage | Apple Valley, CA | $2,300,000 | 50.5% | 1989/2005 | 107,455 | $4,440,000 | |||||||||
Bakersfield Oswell | Self Storage | Bakersfield, CA | $2,130,000 | 71.6% | 1987/NAP | 73,960 | $4,060,000 | |||||||||
Palmdale Sierra | Self Storage | Palmdale, CA | $2,081,000 | 55.4% | 1988/2003 | 69,037 | $4,400,000 | |||||||||
Bakersfield Weedpatch | Self Storage | Bakersfield, CA | $2,013,000 | 62.6% | 1990/NAP | 80,980 | $4,100,000 | |||||||||
South Gate | Self Storage | South Gate, CA | $1,774,000 | 56.2% | 1925/2004 | 56,074 | $3,650,000 | |||||||||
Bakersfield Hughes | Self Storage | Bakersfield, CA | $1,713,700 | 63.2% | 1974/NAP | 82,970 | $3,515,000 | |||||||||
Rosamond | Self Storage | Rosamond, CA | $1,700,000 | 63.7% | 1995/NAP | 64,060 | $3,900,000 | |||||||||
Fort Worth | Self Storage | Fort Worth, TX | $1,538,000 | 79.2% | 2004/NAP | 74,750 | $3,200,000 | |||||||||
Apple Valley Powhatan | Self Storage | Apple Valley, CA | $1,445,900 | 75.9% | 1989/2000 | 45,337 | $2,650,000 | |||||||||
Rockford Alpine | Self Storage | Rockford, IL | $1,363,000 | 79.0% | 1978/NAP | 59,457 | $3,100,000(1) | |||||||||
Chicago Elston | Self Storage | Chicago, IL | $1,321,500 | 66.3% | 1968/1999 | 39,541 | $2,690,000 | |||||||||
Rockford Main | Self Storage | Rockford, IL | $1,318,600 | 70.5% | 1957/1997 | 65,485 | $2,250,000 | |||||||||
Harbor City | Self Storage | Harbor City, CA | $1,293,000 | 67.2% | 1987/NAP | 28,533 | $2,400,000 | |||||||||
Rubidoux | Self Storage | Rubidoux, CA | $1,247,000 | 69.5% | 1986/2004 | 51,998 | $2,320,000 | |||||||||
Anaheim | Self Storage | Anaheim, CA | $1,148,600 | 74.1% | 1988/NAP | 35,705 | $2,250,000 | |||||||||
Riverside | Self Storage | Riverside, CA | $1,124,000 | 60.5% | 1985/NAP | 51,732 | $2,220,000 | |||||||||
Bakersfield Buck Owens | Self Storage | Bakersfield, CA | $849,000 | 59.2% | 1972/NAP | 62,964 | $2,800,000 | |||||||||
Kona | Self Storage | Kailua Kona, HI | $832,000 | 50.6% | 1987/NAP | 34,064 | $2,500,000 | |||||||||
Grand Terrace | Self Storage | Grand Terrace, CA | $728,200 | 68.3% | 1978/NAP | 30,776 | $2,330,000 | |||||||||
Alpine Annex | Self Storage | Rockford, IL | $250,000 | 65.1% | 1975/NAP | 41,916 | $3,100,000(1) | |||||||||
|
|
|
| |||||||||||||
Total/Weighted Average | $48,157,500 | 63.8% | 1,718,350 | $98,145,000 | ||||||||||||
|
|
|
| |||||||||||||
| (1) | The Rockford Alpine and Alpine Annex properties were assessed together in one appraisal; the appraised value of $3,100,000 represents the combined value of the two properties. |
THE INFORMATION IN THIS STRUCTURAL AND COLLATERAL TERM SHEET IS NOT COMPLETE AND MAY BE AMENDED PRIOR TO THE TIME OF SALE. THIS TERM SHEET IS NOT AN OFFER TO SELL THESE SECURITIES AND IT IS NOT A SOLICITATION OF AN OFFER TO BUY THESE SECURITIES IN ANY JURISDICTION WHERE THE OFFER OR SALE IS NOT PERMITTED.
39
WPC SELF STORAGE PORTFOLIO
Operating History and Underwritten Net Cash Flow. The following table presents certain information relating to the historical operating performance and the Underwritten Net Cash Flow for the WPC Self Storage Portfolio Properties:
Cash Flow Analysis
| 2009 | 2010 | Annualized Q1/Q3/Q4 2011(1) | U/W(2) | U/W $ per SF | ||||||||||||||||
Base Rent | $13,833,575 | $12,704,080 | $11,829,323 | $11,108,888 | $6.46 | |||||||||||||||
Grossed Up Vacant Space | 0 | 0 | 0 | 6,303,213 | 3.67 | |||||||||||||||
Less Concessions | (119,483 | ) | (97,158 | ) | (25,211 | ) | 0 | 0.00 | ||||||||||||
Other Income | 1,439,180 | 1,645,559 | 1,215,996 | 917,855 | 0.53 | |||||||||||||||
Less Vacancy & Credit Loss | 0 | 0 | 0 | (6,303,213 | ) | (3.67 | ) | |||||||||||||
|
|
|
|
|
|
|
|
|
| |||||||||||
Effective Gross Income | $15,153,272 | $14,252,481 | $13,020,099 | $12,026,743 | $7.00 | |||||||||||||||
Total Operating Expenses | $6,706,363 | $6,800,285 | $6,427,797 | $5,833,071 | $3.39 | |||||||||||||||
|
|
|
|
|
|
|
|
|
| |||||||||||
Net Operating Income | $8,446,909 | $7,452,196 | $6,592,302 | $6,193,672 | $3.60 | |||||||||||||||
TI/LC | 0 | 0 | 0 | 0 | 0.00 | |||||||||||||||
Capital Expenditures | 0 | 0 | 0 | 343,670 | 0.20 | |||||||||||||||
|
|
|
|
|
|
|
|
|
| |||||||||||
Net Cash Flow | $8,446,909 | $7,452,196 | $6,592,302 | $5,850,002 | $3.40 | |||||||||||||||
NOI DSCR | 2.66x | 2.35x | 2.08x | 1.95x | ||||||||||||||||
NCF DSCR | 2.66x | 2.35x | 2.08x | 1.84x | ||||||||||||||||
NOI DY | 17.5% | 15.5% | 13.7% | 12.9% | ||||||||||||||||
NCF DY | 17.5% | 15.5% | 13.7% | 12.1% | ||||||||||||||||
| (1) | Financials for the second quarter of 2011 were not provided upon the borrower’s acquisition of the properties. |
| (2) | Underwritten NOI is based on the annualized trailing three-month period ending December 31, 2011. |
Appraisal. According to the individual appraisals, the WPC Self Storage Portfolio Properties had an aggregate “as-is” appraised value of $98,145,000 as of the effective appraisal dates ranging from May 12, 2011 to May 26, 2011.
Environmental Matters. Phase I environmental site assessments (“ESA”) were performed from April 21, 2011 to May 16, 2011 for all WPC Self Storage Portfolio Properties. Following the Phase I environmental assessments, the environmental consultant recommended no further material action for 18 of the properties. A $2,000,000 environmental insurance policy with a 10-year term is in place to cover potential losses from the risks identified in the environmental reports (as described below) for the following properties: Chicago Adams, Chicago Elston, Fresno and South Gate.
At the Chicago Adams property, the Phase I assessment revealed that numerous commercial printing businesses occupied the building from 1920 to 2002. The environmental consultant determined this matter not to be an immediate health risk to the occupants of the building because no evidence of release or staining was observed, the presence of a basement lessens the likelihood for a release to the subsurface at the property and groundwater is not utilized as a drinking source at the property. The ESA concluded that if remediation were to be needed, experience in remediating similar facilities with actual known contamination indicates a likely cost of approximately $250,000.
At the Chicago Elston property, the Phase I assessment revealed that a coal and fuel oil storage operation was located at the property from approximately 1924 to approximately 1963. Building permit records suggested the possible presence of four 2,000- gallon fuel oil underground storage tanks (“UST”) and evidence of the presence of at least one gas tank. Based on these conditions, the Phase I assessment recommended that, in the absence of documentation regarding the disposition of the USTs or impacted soils, that a ground penetrating radar survey and subsurface investigation be conducted. Subsurface sampling as part of a Phase II environmental site assessment in May 2011 identified trichloroethylene impacts in two soil borings that exceeded regulatory clean-up standards. Additional investigation is planned in order to determine the potential severity and the extent of such impacts, and to determine what, if any, remediation might be necessary as a prerequisite to seeking a No Further Action determination from the state environmental agency. The ESA concluded that if remediation were to be needed, experience in remediating similar facilities with actual known contamination indicates a likely cost of approximately $400,000.
At the Fresno property, the Phase I assessment revealed that the site is a former machine shop and Leaking Underground Storage Tank (“LUST”) facility. The LUST incident was discovered during the in-place permanent abandonment and closure of three 10,000- gallon fuel USTs that were reportedly historically used to store fuel oil. The incident was granted regulatory closure, with approval to leave the LUST-impacted soil in place, by the Fresno County Environmental Health System on November 16, 2001. The ESA concluded that if remediation were to be needed, experience in remediating similar facilities with actual known contamination indicates a likely cost of approximately $400,000.
At the South Gate property, the Phase I assessment revealed that an environmental database indicates that pesticides were manufactured at the property in 1994, although historical records indicate that the building was occupied by a furniture manufacturer from approximately 1973 through 2000. Although the assessment did not identify any contamination at the property, these reported uses could be a concern. Phase II environmental site assessments were also performed in June 2011 for the following four WPC Self Storage Portfolio Properties: Rockford Main, Rockford Alpine, Anaheim and Pearl City. Following the Phase II assessments, the environmental consultant recommended no further action for these properties.
THE INFORMATION IN THIS STRUCTURAL AND COLLATERAL TERM SHEET IS NOT COMPLETE AND MAY BE AMENDED PRIOR TO THE TIME OF SALE. THIS TERM SHEET IS NOT AN OFFER TO SELL THESE SECURITIES AND IT IS NOT A SOLICITATION OF AN OFFER TO BUY THESE SECURITIES IN ANY JURISDICTION WHERE THE OFFER OR SALE IS NOT PERMITTED.
40
WPC SELF STORAGE PORTFOLIO
The Borrower. The borrowers are American WPC Storage (Multi) LLC and Alamo WPC Storage (TX) LLC, each of which is a single purpose entity and has an independent director (collectively the “WPC Self Storage Portfolio Borrower”). Legal counsel to the WPC Self Storage Portfolio Borrower delivered a non-consolidation opinion in connection with the origination of the WPC Self Storage Portfolio Mortgage Loan. Corporate Property Associates 17 – Global Incorporated, the indirect owner of the WPC Self Storage Portfolio Borrower, is the guarantor of certain nonrecourse carveouts under the WPC Self Storage Portfolio Mortgage Loan.
The Sponsor. The sponsor is Corporate Property Associates 17 – Global Incorporated (“CPA 17- Global”), a non-traded real estate investment trust (“REIT”). The sponsor is managed by Carey Asset Management Corp., a wholly-owned subsidiary of W.P. Carey (NYSE:WPC), an investment management company that provides long-term sale-leaseback and build-to-suit financing for companies worldwide. W.P. Carey manages a global investment portfolio of more than 900 commercial properties in 17 countries comprising approximately 110 million square feet, and along with its three non-traded REITs (CPA 15, CPA 16 – Global and CPA 17 – Global), has raised approximately $5.5 billion in equity since 1979.
Escrows. The loan documents waive monthly escrows for real estate taxes provided the following conditions are satisfied: (i) no event of default has occurred and is continuing and (ii) borrower provides lender with paid receipts and other evidence satisfactory to lender that all taxes have been and continue to be fully and timely paid 10 business days prior to the date such taxes would be delinquent. The loan documents waive monthly escrows for insurance provided the following conditions are satisfied: (i) no event of default exists and is continuing, (ii) the insurance required to be maintained by borrower is maintained pursuant to one or more blanket policies, and (iii) borrower provides lender with paid receipts and other evidence satisfactory to lender that all insurance premiums have been and continue to be fully and timely paid, and in any event, at least fifteen days prior to the date the policies would, in the absence of payment, expire, lapse, be canceled or the coverage be impaired. The loan documents provide for an upfront deferred maintenance escrow in the amount of $381,334, which is approximately 125% of the estimated costs of the immediate repairs outlined in the property condition report. The loan documents waive monthly escrows for replacement reserves; however, upon an event of default, monthly replacement reserve payments will be required in the amount of $28,639.
Lockbox and Cash Management. The WPC Self Storage Portfolio Mortgage Loan requires a lender-controlled lockbox account, which is already in place, and that the borrower directs tenants to pay their rents directly to such lockbox account (except for rents from the Fort Worth property, which are required to be deposited directly to such lockbox account only upon the occurrence of a Cash Trap Event Period, as defined below). The loan documents also require that all cash revenues relating to the WPC Self Storage Portfolio Properties and all other monies received by the borrower or the property manager be deposited into the lockbox account within three business days after receipt. Funds in the lockbox account are transferred into a cash management account each week. Prior to the occurrence of a Cash Trap Event Period, all funds on deposit in the cash management account are disbursed to the WPC Self Storage Portfolio Mortgage Loan borrower.
A “Cash Trap Event Period” shall commence upon: (i) the occurrence and continuance of an event of default or (ii) the debt service coverage ratio, as defined in the loan documents, being less than 1.10x. Any Cash Trap Event Period commenced in connection with clause (i) above shall expire upon the cure of such event of default. Any Cash Trap Event Period commenced in connection with clause (ii) above shall expire upon the earlier of (a) the DSCR being equal to or greater than 1.10x for two consecutive calendar quarters; (b) the DSCR being equal to or greater than 1.20x for one calendar quarter; or (c) the delivery by borrower of a letter of credit in an amount sufficient to cause the DSCR to be equal or greater than 1.20x if such amount was deducted from the outstanding principal balance of the WPC Self Storage Portfolio Mortgage Loan.
Property Management. The WPC Self Storage Portfolio Properties located in California and Hawaii are managed by Extra Space Management, Inc (“Extra Space”); the WPC Self Storage Portfolio Properties located in Illinois are managed by SecureCare Self Storage, Inc.; and the WPC Self Storage Portfolio Property located in Texas is managed by Metro Storage LLC. Each of the aforementioned managers is entitled to a base management fee in an amount equal to 6.0% of total monthly gross income from the associated WPC Self Storage Portfolio Properties. In addition, at the 20 properties managed by Extra Space, the management fee for two calendar months shall be waived each year if the gross revenue of the properties (taken as an aggregate for 19 of the properties and as a standalone value for the Pearl City property) does not increase by an amount equal to or greater than 4.0% when compared with the immediately preceding year of operations.
Assumption. The WPC Self Storage Portfolio Mortgage Loan has a two-time right to transfer all of the remaining WPC Self Storage Portfolio Properties at once, provided that no event of default has occurred and is continuing and certain other conditions are satisfied, including the lender’s reasonable determination that the proposed transferee and guarantor satisfy lender’s credit review and underwriting standards taking into consideration, (i) transferee experience and financial strength and credit quality, (ii) requirements that the transferee will execute a recourse guaranty and an environmental indemnity, (iii) rating agency confirmation that the transfer will not result in a downgrade, withdrawal or qualification of the respective ratings from Fitch, Moody’s and KBRA assigned to the Series 2012-C6 Certificates and (iv) other factors relied upon by lender in the original underwriting of the WPC Self Storage Portfolio Mortgage Loan.
The WPC Self Storage Portfolio Mortgage Loan also has the right to transfer any individual WPC Self Storage Portfolio Property and cause a severance of the WPC Self Storage Portfolio Mortgage Loan into two loans, one secured by the transferred property and the other secured by the remaining properties (“Partial Assumption”), provided that no event of default has occurred and is continuing and certain other conditions are satisfied, including (i) through (iv) above, as well as (v) the loan-to-value ratio with respect to the transfer property as well as the remaining properties shall be no greater than 50%; (vi) the debt service coverage ratio with respect to the transfer property and remaining properties shall be no less than 2.10x; and (vii) the portion of the loan relating to the transfer property shall no longer be cross-collateralized and/or cross-defaulted with the remaining portion of the loan.
THE INFORMATION IN THIS STRUCTURAL AND COLLATERAL TERM SHEET IS NOT COMPLETE AND MAY BE AMENDED PRIOR TO THE TIME OF SALE. THIS TERM SHEET IS NOT AN OFFER TO SELL THESE SECURITIES AND IT IS NOT A SOLICITATION OF AN OFFER TO BUY THESE SECURITIES IN ANY JURISDICTION WHERE THE OFFER OR SALE IS NOT PERMITTED.
41
WPC SELF STORAGE PORTFOLIO
Notwithstanding the foregoing, (i) any Partial Assumption with respect to the Rockford Alpine property and the Alpine Annex property must include both properties and (ii) upon the completion of a Partial Assumption, the following properties shall not consist of more than 40% of the outstanding principal balance of the remaining properties: Apple Valley Town Center, Bakersfield Hughes, Bakersfield Buck Owens, Grand Terrace, Rosamond, Kona and Palmdale 10th Street.
Release. Following the second anniversary of the issuance of the Series 2012–C6 Certificates, the WPC Self Storage Portfolio Borrower is permitted to partially release any constituent properties in connection with a partial defeasance, subject to certain conditions including: (i) partial defeasance of the WPC Self Storage Portfolio Mortgage Loan as evidenced by an amended note secured by the remaining properties and having principal balance reduced by 125% of the released property’s allocated loan balance; (ii) the loan-to-value ratio with respect to the remaining properties shall be no greater than 50%; (iii) the debt service coverage ratio with respect to the remaining properties shall be no less than 2.10x; and (iv) the lender receives rating agency confirmation from Fitch, Moody’s and KBRA that the release will not result in a downgrade, withdrawal or qualification of the respective rating then assigned to any of the Series 2012-C6 Certificates.
Real Estate Substitution. The WPC Self Storage Portfolio Borrower may obtain a release of any individual WPC Self Storage Portfolio Property from the lien of the mortgage in connection with a substitution of a different parcel subject to the satisfaction of certain conditions, including without limitation that: (i) no event of default shall have occurred and be continuing; (ii) the substituted property must have a current appraised value equal to or greater than that of the applicable substitution property, and the loan-to- value ratio of the remaining properties must be no greater than 50%; (iii) the substituted property shall be equal or superior to that of the release property as to physical condition, building use and quality, lease terms favorable to borrower and market attributes as determined by lender in accordance with prudent lending standards; (iv) the assumed debt service coverage ratio for the remaining properties on a trailing 12-month basis shall be no less than the assumed debt service coverage ratio for the 12 months preceding the substitution; and (v) the lender receives a legal opinion that the substitution satisfies REMIC requirements.
Subordinate and Mezzanine Indebtedness. Not permitted.
Ground Lease. The borrower’s interest in one of the WPC Self Storage Portfolio Properties is a leasehold interest. The Pearl City property ground lease has a 60-year term, with no options to extend, and expires in December 2036.
Terrorism Insurance. The loan documents require that the “all risk” insurance policy required to be maintained by the borrower provide coverage for terrorism in an amount equal to the full replacement cost of the WPC Self Storage Portfolio Properties, as well as business interruption insurance covering no less than the 18-month period following the occurrence of a casualty event, together with a 6-month extended period of indemnity.
THE INFORMATION IN THIS STRUCTURAL AND COLLATERAL TERM SHEET IS NOT COMPLETE AND MAY BE AMENDED PRIOR TO THE TIME OF SALE. THIS TERM SHEET IS NOT AN OFFER TO SELL THESE SECURITIES AND IT IS NOT A SOLICITATION OF AN OFFER TO BUY THESE SECURITIES IN ANY JURISDICTION WHERE THE OFFER OR SALE IS NOT PERMITTED.
42
[THIS PAGE INTENTIONALLY LEFT BLANK.]
43
NORWALK TOWN SQUARE
THE INFORMATION IN THIS STRUCTURAL AND COLLATERAL TERM SHEET IS NOT COMPLETE AND MAY BE AMENDED PRIOR TO THE TIME OF SALE. THIS TERM SHEET IS NOT AN OFFER TO SELL THESE SECURITIES AND IT IS NOT A SOLICITATION OF AN OFFER TO BUY THESE SECURITIES IN ANY JURISDICTION WHERE THE OFFER OR SALE IS NOT PERMITTED.
44
NORWALK TOWN SQUARE

THE INFORMATION IN THIS STRUCTURAL AND COLLATERAL TERM SHEET IS NOT COMPLETE AND MAY BE AMENDED PRIOR TO THE TIME OF SALE. THIS TERM SHEET IS NOT AN OFFER TO SELL THESE SECURITIES AND IT IS NOT A SOLICITATION OF AN OFFER TO BUY THESE SECURITIES IN ANY JURISDICTION WHERE THE OFFER OR SALE IS NOT PERMITTED.
45
Norwalk Town Square
Loan Information
| ||
Mortgage Loan Seller: | Wells Fargo Bank, National Association | |
Credit Assessment (Fitch/Moody’s/KBRA): | NAP | |
Original Principal Balance: | $27,500,000 | |
Cut-off Date Principal Balance: | $27,259,020 | |
% of Initial Pool Balance: | 2.9% | |
Loan Purpose: | Refinance | |
Borrower Names: | Levian Family Norwalk, LLC; Hekmatravan Family Norwalk LLC | |
Sponsors: | Hamid Hekmatravan; Hekmat Hekmatravan; Javid Levian; Jamshid Levian; Manoochehr Levian; Shokrollah Levian | |
Mortgage Rate: | 5.230% | |
Note Date: | July 20, 2011 | |
Anticipated Repayment Date: | NAP | |
Maturity Date: | August 1, 2021 | |
IO Period: | None | |
Loan Term (Original): | 120 months | |
Seasoning: | 8 months | |
Amortization Term (Original): | 360 months | |
Loan Amortization Type: | Amortizing Balloon | |
Interest Accrual Method: | Actual/360 | |
Call Protection: | L(32),D(84),O(4) | |
Lockbox Type: | Soft/Springing Cash Management | |
Additional Debt: | None | |
Additional Debt Type: | NAP | |
Escrows and Reserves:
Type: | Initial | Monthly | Cap (If Any) | |||
Taxes(1) | $183,385 | $36,677 | NAP | |||
Insurance(1) | $63,279 | $7,031 | NAP | |||
Replacement Reserves | $0 | $3,883 | $186,384 | |||
TI/LC | $0 | $15,520 | $744,916 | |||
Deferred Maintenance | $330,881 | $0 | NAP | |||
Tenant Specific Holdback(2) | $1,500,000 | $0 | NAP | |||
Norwalk Buffet Rent Reserve(3) | $31,727 | $0 | NAP |
Property Information
| ||
Single Asset/Portfolio: | Single Asset | |
Property Type: | Retail | |
Specific Property Type: | Anchored | |
Location: | Norwalk, CA | |
Size: | 232,987 SF | |
Cut-off Date Principal Balance Per Unit/SF: | $117.00 | |
Year Built/Renovated: | 1953/1990 | |
Occupancy %: | 93.9% | |
Occupancy % Source Date: | February 17, 2012 | |
Title Vesting: | Fee | |
Property Manager: | Newmark Merrill Companies, LLC | |
3rd Most Recent NOI (As of): | $3,454,155(12/31/2009) | |
2nd Most Recent NOI (As of): | $3,282,695(12/31/2010) | |
Most Recent NOI (As of): | $3,316,268 (TTM 11/30/2011) | |
U/W Revenues: | $4,623,880 | |
U/W Expenses: | $1,394,251 | |
U/W NOI: | $3,229,628 | |
U/W NCF: | $2,981,153 | |
U/W NOI DSCR: | 1.78x | |
U/W NCF DSCR: | 1.64x | |
U/W NOI Debt Yield: | 11.8% | |
U/W NCF Debt Yield: | 10.9% | |
As-Is Appraised Value: | $46,500,000 | |
As-Is Appraisal Valuation Date: | May 7, 2011 | |
Cut-off Date LTV Ratio: | 58.6% | |
LTV Ratio at Maturity or ARD: | 49.0% | |
| (1) | Monthly payments are subject to adjustment per lender’s estimate of real estate taxes and insurance premiums. |
| (2) | See “Escrows” below for a description of the holdback. $1,400,000 of the Tenant Specific Holdback has been released. $100,000 remains in the form of a tenant improvement allowance. |
| (3) | $31,727 was reserved upfront for outstanding TI/LC work for Norwalk Grill Buffet. The Norwalk Buffet Rent Reserve was released upon satisfaction of the related conditions. |
The Mortgage Loan.The mortgage loan (the “Norwalk Town Square Mortgage Loan”) is evidenced by a single promissory note secured by a first mortgage encumbering an anchored retail shopping center located in Norwalk, California (the “Norwalk Town Square Property”). The Norwalk Town Square Mortgage Loan was originated on July 20, 2011 by Wells Fargo Bank, National Association. The Norwalk Town Square Mortgage Loan had an original principal balance of $27,500,000, has an outstanding principal balance as of the Cut-off Date of $27,259,020 and accrues interest at an interest rate of 5.230% per annum. The Norwalk Town Square Mortgage Loan had an initial term of 120 months, has a remaining term of 112 months as of the Cut-off Date and requires payments of interest and principal based on a 30-year amortization schedule. The Norwalk Town Square Mortgage Loan matures on August 1, 2021. The proceeds from the Norwalk Town Square Mortgage Loan were used to pay defeasance costs and refinance existing debt on the Norwalk Town Square Property of approximately $19.1 million that was securitized in CCMSC 1997-2, fund $2.1 million in upfront reserves and return approximately $6.5 million of equity to the borrower.
THE INFORMATION IN THIS STRUCTURAL AND COLLATERAL TERM SHEET IS NOT COMPLETE AND MAY BE AMENDED PRIOR TO THE TIME OF SALE. THIS TERM SHEET IS NOT AN OFFER TO SELL THESE SECURITIES AND IT IS NOT A SOLICITATION OF AN OFFER TO BUY THESE SECURITIES IN ANY JURISDICTION WHERE THE OFFER OR SALE IS NOT PERMITTED.
46
NORWALK TOWN SQUARE
Following the lockout period, the borrower has the right to defease the Norwalk Town Square Mortgage Loan in whole, but not in part, on any due date before the scheduled maturity date. In addition, the Norwalk Town Square Mortgage Loan is prepayable without penalty on or after May 1, 2021.
The Property.The Norwalk Town Square Property is a 232,987 square foot anchored retail center situated on 14.7 acres located in Norwalk, California. Major tenants at the property include LA Fitness, Regency Theatres, Ross Dress for Less, 99 Cent Only, AutoZone and Dollar Tree. The center was constructed in phases between 1953 and 1976, and renovated in 1990. The property is located at the intersection of Rosecrans Avenue and Pioneer Boulevard with access to the area’s major freeways: State Route 91, Interstate 605 (which connects to Interstate 105) and Interstate 5; all located within two miles of the Norwalk Town Square Property.
As of February 17, 2012, the Norwalk Town Square Property was 93.9% occupied. The six anchor tenants, representing 54.9% of the NRA, have been in occupancy (on average) for 15 years. Parking is provided by 863 surface spaces resulting in a parking ratio of 3.70 spaces per every 1,000 square feet of net rentable area.
The following table presents certain information relating to the tenancies at the Norwalk Town Square Property:
Major Tenants
Tenant Name | Credit Rating (Fitch/ Moody’s/ S&P)(1) | Tenant NRSF | % of NRSF | Annual U/W Base Rent PSF | Annual U/W Base Rent | % of Total Annual U/W Base Rent | Sales PSF(2) | Occupancy Cost(2) | Lease Expiration Date | |||||||||
Anchor Tenants – Collateral | ||||||||||||||||||
LA Fitness | NR/NR/NR | 30,718 | 13.2% | $10.95 | $336,312 | 9.2% | NAV | NAV | 12/31/2020 | |||||||||
Regency Theatres | NR/NR/NR | 26,751 | 11.5% | $9.87 | $264,000(3) | 7.2% | NAP(4) | NAV | 1/31/2022 | |||||||||
Ross Dress for Less | NR/NR/BBB+ | 20,911 | 9.0% | $12.50 | $261,387 | 7.1% | NAV | NAV | 1/31/2019(5) | |||||||||
99 Cent Only | NR/B2/B | 17,000 | 7.3% | $12.00 | $204,000 | 5.6% | NAV | NAV | 1/31/2017 | |||||||||
AutoZone | BBB/Baa2/BBB | 16,288 | 7.0% | $11.12 | $181,200 | 5.0% | NAV | NAV | 5/31/2017 | |||||||||
Fallas Parades J&M Sales | NR/NR/NR | 16,250 | 7.0% | $17.03 | $276,705 | 7.6% | $143 | 15.8% | 2/28/2014 | |||||||||
|
|
|
| |||||||||||||||
Total Anchor Tenants – Collateral | 127,918 | 54.9% | $11.91 | $1,523,605 | 41.6% | |||||||||||||
Other Major Tenants – Collateral | ||||||||||||||||||
Dollar Tree | NR/NR/NR | 11,147 | 4.8% | $18.48 | $205,997 | 5.6% | $175 | 13.6% | 8/31/2016 | |||||||||
Bank of America | A/Baa1/A- | 9,000 | 3.9% | $16.80 | $151,200 | 4.1% | NAV | NAV | 3/31/2015 | |||||||||
Norwalk Grill Buffet | NR/NR/NR | 8,813 | 3.8% | $14.40 | $126,907 | 3.5% | NAV | NAV | 8/31/2016 | |||||||||
|
|
|
| |||||||||||||||
Total Other Major Tenants – Collateral | 28,960 | 12.4% | $16.72 | $484,104 | 13.2% | |||||||||||||
Non-Major Tenants | 61,812 | 26.5% | $26.71(6) | $1,651,216(6) | 45.1% | |||||||||||||
|
|
|
| |||||||||||||||
Occupied Collateral Total | 218,690 | 93.9% | $16.73 | $3,658,925 | 100.0% | |||||||||||||
|
| |||||||||||||||||
Vacant Space | 14,297 | 6.1% | ||||||||||||||||
|
| |||||||||||||||||
Collateral Total | 232,987 | 100.0% | ||||||||||||||||
|
| |||||||||||||||||
| (1) | Certain ratings are those of the parent company whether or not the parent guarantees the lease. |
| (2) | Sales per square foot are for the full year ending December 31, 2011. |
| (3) | Under the terms of its lease, Regency Theatres has the right to release of $100,000 from the borrower (which will be held in the Tenant Specific Holdback Reserve), which Regency Theatres may take either as cash or in equivalent free rent. While Regency Theatres is currently paying full, unabated rent, no election has been made. Full rent has been underwritten. $100,000 remains in the Tenant Specific Holdback. |
| (4) | Regency Theatres lease commenced February 1, 2012 when they took occupancy and opened for business. |
| (5) | Ross Dress for Less has a co-tenancy remedy that is triggered by (i) both of 99 Cent Only and Fallas Parades not being open for 6 months, or (ii) less than 65% of retail tenants (including the required co-tenant) in specified areas being open. Such co-tenancy remedy is not currently triggered. |
| (6) | Annual U/W Base Rent for Non-Major Tenants includes income from five cellular tower leases, for which no square footage is attributed. On a combined basis, the cellular tower leases contribute $180,579 to Annual U/W Base Rent (4.9% of Total Annual U/W Base Rent). Annual U/W Base Rent PSF (for Non-Major Tenants) excluding this income is $23.79 per square foot. Annual U/W Base Rent PSF for Occupied Collateral is $15.91 per square foot. |
THE INFORMATION IN THIS STRUCTURAL AND COLLATERAL TERM SHEET IS NOT COMPLETE AND MAY BE AMENDED PRIOR TO THE TIME OF SALE. THIS TERM SHEET IS NOT AN OFFER TO SELL THESE SECURITIES AND IT IS NOT A SOLICITATION OF AN OFFER TO BUY THESE SECURITIES IN ANY JURISDICTION WHERE THE OFFER OR SALE IS NOT PERMITTED.
47
NORWALK TOWN SQUARE
The following table presents certain information relating to the lease rollover schedule at the Norwalk Town Square Property:
Lease Expiration Schedule(1)
Year Ending | No. of Leases Expiring(2)(3) | Expiring NRSF | % of Total NRSF | Cumulative of Total NRSF | Cumulative % of Total NRSF | Annual U/W Base Rent | Annual U/W Base Rent PSF | |||||||||||||||||||||
MTM | 1 | 4,636 | 2.0% | 4,636 | 2.0% | $100,119 | $21.60 | |||||||||||||||||||||
2012 | 2 | 1,840 | 0.8% | 6,476 | 2.8% | $58,791 | $31.95 | |||||||||||||||||||||
2013(2) | 10 | 18,365 | 7.9% | 24,841 | 10.7% | $477,088 | $25.98 | |||||||||||||||||||||
2014(2) | 6 | 24,120 | 10.4% | 48,961 | 21.0% | $482,309 | $20.00 | |||||||||||||||||||||
2015 | 9 | 27,913 | 12.0% | 76,874 | 33.0% | $601,154 | $21.54 | |||||||||||||||||||||
2016 | 6 | 29,280 | 12.6% | 106,154 | 45.6% | $599,352 | $20.47 | |||||||||||||||||||||
2017(2) | 4 | 34,156 | 14.7% | 140,310 | 60.2% | $445,428 | $13.04 | |||||||||||||||||||||
2018(2) | 1 | 0 | 0.0% | 140,310 | 60.2% | $32,985 | $0.00 | |||||||||||||||||||||
2019 | 1 | 20,911 | 9.0% | 161,221 | 69.2% | $261,387 | $12.50 | |||||||||||||||||||||
2020 | 1 | 30,718 | 13.2% | 191,939 | 82.4% | $336,312 | $10.95 | |||||||||||||||||||||
2021 | 0 | 0 | 0.0% | 191,939 | 82.4% | $0 | $0.00 | |||||||||||||||||||||
2022 | 1 | 26,751 | 11.5% | 218,690 | 93.9% | $264,000 | $9.87 | |||||||||||||||||||||
Thereafter | 0 | 0 | 0.0% | 218,690 | 93.9% | $0 | $0.00 | |||||||||||||||||||||
Vacant | 0 | 14,297 | 6.1% | 232,987 | 100.0% | $0 | $0.00 | |||||||||||||||||||||
|
|
|
|
|
|
|
|
| ||||||||||||||||||||
Total / Weighted Average | 42 | 232,987 | 100.0% | $3,658,925 | $16.73 | |||||||||||||||||||||||
|
|
|
|
|
|
|
|
| ||||||||||||||||||||
| (1) | Source: Information obtained from underwritten rent roll. |
| (2) | Expiring leases include certain leases of cellular towers, which are not attributed any square footage. |
| (3) | Certain tenants may have lease termination options that are exercisable prior to the originally stated expiration date of the subject lease and that are not considered in the Lease Expiration Schedule. |
The following table presents historical occupancy percentages at the Norwalk Town Square Property:
Historical Occupancy Percentages*
12/31/2009 | 12/31/2010 | 12/31/2011 | ||
|
|
| ||
91% | 99% | 97% |
| * | Source: Information obtained from borrower rent rolls. |
Operating History and Underwritten Net Cash Flow. The following table presents certain information relating to the historical operating performance and the Underwritten Net Cash Flow at the Norwalk Town Square Property:
Cash Flow Analysis
| 2009 | 2010 | TTM 11/30/2011 | U/W | U/W $ per SF | ||||||||||||||||
Base Rent | $3,601,730 | $3,498,328 | $3,551,602 | $3,658,925(1) | $15.70 | |||||||||||||||
Grossed Up Vacant Space | 0 | 0 | 0 | 205,314 | 0.88 | |||||||||||||||
Percentage Rent | (1,408) | 3,704 | 4,409 | 0 | 0.00 | |||||||||||||||
Total Reimbursables | 1,308,860 | 1,187,075 | 1,072,845 | 1,032,538 | 4.43 | |||||||||||||||
Other Income | 21,013 | 40,774 | 27,483 | 27,483 | 0.12 | |||||||||||||||
Less Vacancy & Credit Loss | 0 | 0 | 0 | (300,380) | (1.29) | |||||||||||||||
|
|
|
|
|
|
|
|
|
| |||||||||||
Effective Gross Income | $4,930,195 | $4,729,880 | $4,656,339 | $4,623,880 | $19.85 | |||||||||||||||
Total Operating Expenses | $1,476,040 | $1,447,186 | $1,340,071 | $1,394,251 | $5.98 | |||||||||||||||
|
|
|
|
|
|
|
|
|
| |||||||||||
Net Operating Income | $3,454,155 | $3,282,695 | $3,316,268 | $3,229,628 | $13.86 | |||||||||||||||
TI/LC | 738 | 3,396 | 1,227 | 201,878 | 0.87 | |||||||||||||||
Capital Expenditures | 0 | 0 | 0 | 46,597 | 0.20 | |||||||||||||||
|
|
|
|
|
|
|
|
|
| |||||||||||
Net Cash Flow | $3,453,417 | $3,279,298 | $3,315,041 | $2,981,153 | $12.80 | |||||||||||||||
NOI DSCR | 1.90x | 1.81x | 1.82x | 1.78x | ||||||||||||||||
NCF DSCR | 1.90x | 1.80x | 1.82x | 1.64x | ||||||||||||||||
NOI DY | 12.7% | 12.0% | 12.2% | 11.8% | ||||||||||||||||
NCF DY | 12.7% | 12.0% | 12.2% | 10.9% | ||||||||||||||||
| (1) | Contractual rent increases for several tenants were underwritten through July 2012. |
Appraisal. According to the appraisal dated May 7, 2011, the Norwalk Town Square Property has an “as-is” appraised value of $46,500,000.
THE INFORMATION IN THIS STRUCTURAL AND COLLATERAL TERM SHEET IS NOT COMPLETE AND MAY BE AMENDED PRIOR TO THE TIME OF SALE. THIS TERM SHEET IS NOT AN OFFER TO SELL THESE SECURITIES AND IT IS NOT A SOLICITATION OF AN OFFER TO BUY THESE SECURITIES IN ANY JURISDICTION WHERE THE OFFER OR SALE IS NOT PERMITTED.
48
NORWALK TOWN SQUARE
Environmental Matters. According to the Phase I environmental site assessment performed on May 19, 2011, there was evidence of two recognized environmental conditions. The Phase I assessment recommended the performance of a comprehensive asbestos survey and the adoption of an O&M plan, along with a subsurface investigation to address a former on-site dry cleaning facility that operated after 1996. A Phase II environmental site assessment was performed on June 17, 2011. Based on the results of the subsurface assessment of the former dry cleaner space and the absence of an active dry cleaning operation, no evidence of a significant release of chemicals of concern to the subsurface was identified and no further investigative action was recommended.
Market Overview and Competition. The Norwalk Town Square Property is an anchored retail center located in Norwalk, California. Norwalk is a suburb of Los Angeles and is situated in Los Angeles County, approximately 16 miles southeast of the Los Angeles Central Business District. Traffic count is estimated at 30,012 cars per day along Rosecrans Avenue and 20,888 cars per day along Pioneer Boulevard.
The Los Angeles County retail market consists of 65.9 million square feet of retail space divided into twelve submarkets. As of December 31, 2011, the market was 6.5% vacant with an average quoted rental rate of $28.90 per square foot triple net. The Norwalk Town Square Property is located in the Paramount/Downey/East County submarket, which consists of approximately 4.5 million square feet. As of December 31, 2011, the submarket was 5.9% vacant with an average quoted rental rate of $25.06 per square foot triple net. The foregoing information was provided by a 4th quarter 2011 third party market research report.
The following table presents certain information relating to some comparable retail centers provided in the appraisal for the Norwalk Town Square Property:
Competitive Set(1)
| Norwalk Town Square (Subject) | Bellflower Plaza | Paddison Square | Norwalk Plaza | Firestone & Studebaker | Santa Fe Springs Plaza | |||||||
Market | Norwalk, CA | Bellflower, CA | Norwalk, CA | Norwalk, CA | Norwalk, CA | SantaFe Springs, CA | ||||||
Distance from Subject | — | 3.0 miles | 0.3 miles | 0.9 miles | 2.0 miles | 4.7 miles | ||||||
Property Type | Anchored Retail | Community Center | Community Center | Community Center | Neighborhood Center | Community Center | ||||||
Year Built/Renovated | 1953/1990 | 1973/NAV | 1966/2008 | 1988/NAV | 2008/NAV | 1982/2009 | ||||||
Anchors | LA Fitness, Regency Theatres, Ross Dress for Less, 99 Cent Only Stores, Fallas Parades J&M Sales | Big Lots, 99 Cents | Target, Rite Aid, Payless Foods, O’Reilly | Northgate Market, TJ Maxx | Walgreens, 99 Cents Only | DD’s Discounts, Food 4 Less | ||||||
Total GLA | 232,987 SF | 77,656 SF | 300,000 SF | 116,371 SF | 69,341 SF | 194,270 SF | ||||||
Total Occupancy | 94% | 96% | 99% | 89% | 96% | 90% | ||||||
| (1) | Source: Information obtained from appraisal dated May 7, 2011. |
The Borrower. The borrower consists of two tenants-in-common, Hekmatravan Family Norwalk LLC and Levian Family Norwalk, LLC, both California limited liability companies and single-purpose entities with independent directors. Each own 50% of the Norwalk Town Square Property. Legal counsel to the borrower delivered a non-consolidation opinion in connection with the origination of the Norwalk Town Square Mortgage Loan. Hamid Hekmatravan, Hekmat Hekmatravan, Javid Levian, Jamshid Levian, Manoochehr Levian and Shokrollah Levian, are principals of each borrower entity, and are the guarantors of certain nonrecourse carveouts under the Norwalk Town Square Mortgage Loan. The tenants-in-common have waived their rights to “partition” the Norwalk Town Square Property.
The Sponsor. The principals of Hekmatravan Family Norwalk LLC are Dr. Hamid Hekmatravan and his brother Hekmat Hekmatravan, who have been investing in real estate since the late 1970’s. Dr. Hamid Hekmatravan owns an interest in approximately eleven retail properties in the Los Angeles area, eight of which are owned free and clear. The principals of Levian Family Norwalk, LLC are Javid Levian, Jamshid Levian, Manoochehr Levian, and Shokrollah Levian, with a 24.5%, 25.0%, 25.0% and 25.0% ownership interest, respectively. The Levians started Levian Brothers (dba Fabricland L.A.) in 1994, a family owned fabric importer and wholesaler. The Levians started their real estate company in 1978 and own a majority interest in over 17 shopping centers, located mainly in the Los Angeles area. Included in this number are four properties that are also owned in partnership with the Hekmatravan family.
Escrows. The loan documents provide for upfront escrows at closing in the amount of $183,385 for real estate taxes, $63,279 for insurance, $31,727 for the Norwalk Buffet Rent Reserve (which was subsequently released) and $330,881 for deferred maintenance. The loan documents provide for ongoing, monthly escrows in the amount of: $36,677 (subject to adjustment according to the lender’s estimate) for real estate taxes, $7,031 (subject to adjustment according to the lender’s estimate) for insurance premiums, $15,520 for ongoing tenant improvements and leasing commissions (subject to a cap of $744,916), and $3,883 for replacement reserves (subject to a cap of $186,384).
THE INFORMATION IN THIS STRUCTURAL AND COLLATERAL TERM SHEET IS NOT COMPLETE AND MAY BE AMENDED PRIOR TO THE TIME OF SALE. THIS TERM SHEET IS NOT AN OFFER TO SELL THESE SECURITIES AND IT IS NOT A SOLICITATION OF AN OFFER TO BUY THESE SECURITIES IN ANY JURISDICTION WHERE THE OFFER OR SALE IS NOT PERMITTED.
49
NORWALK TOWN SQUARE
The loan documents also provide for a $1.5 million holdback for Regency Theatres, which had not taken occupancy under a new lease at the time of loan closing. Regency Theatres is now in occupancy, open for business and paying full rent. $1,400,000 of the Tenant Specific Holdback has been released to the borrower after meeting the eligibility criteria. $100,000 remains for outstanding tenant improvement amounts owed, which Regency Theatres may take either as cash or in equivalent free rent. The remaining $100,000 will not be released until Regency Theatres elects to receive cash or their rent abatement period expires.
On each payment date occurring during the continuance of a Tenant Trigger Event (as defined below), the borrower will be required to deposit all excess cash flow, referred to herein as the “Tenant Trigger Cash Sweep Reserve Funds”. A “Tenant Trigger Event” will occur if any tenant occupying more than 10,000 square feet at the Norwalk Town Square Property fails to renew or extend the term of its lease, upon the earlier to occur of: (i) receipt by the borrower of such tenant’s notification of non-renewal or (ii) six months prior to the expiration of the applicable lease, unless, within ten days of such event, the borrower deposits the “Tenant Trigger Cash Sweep Reserve Funds”, which equates to $15 per rentable square foot of the applicable space of each tenant that causes a Tenant Trigger Event.
The “Tenant Sweep Termination Event” will occur following the earlier of: (i) lender’s receipt of evidence that each tenant which caused a Tenant Trigger Event has renewed its lease, and (ii) lender’s receipt of evidence that; (a) one or more replacement tenants have entered into a lease or leases and (b) such tenants are in occupancy, open for business and paying full unabated rent; and (iii) borrower deposits funds in an amount equal to $15 per applicable square foot.
Lockbox and Cash Management. The Norwalk Town Square Mortgage Loan requires a lockbox account, which is already in place, and that the borrower deposits all rents directly to such lockbox account within one business day after receipt. Prior to the occurrence of a Cash Trap Event Period (as defined below), all funds on deposit in the lockbox account are swept into the borrower’s operating account on a daily basis. During a Cash Trap Event Period, the borrower must instruct tenants to deliver all payments and rents to the lender controlled lockbox account. All funds on deposit in the lockbox account are swept to a cash management account each business day.
A “Cash Trap Event Period” will commence: (i) if an event of default has occurred and is continuing under the Norwalk Town Square Loan, (ii) if the actual debt service coverage ratio is less than 1.10x, (iii) on the date on which the borrower is in breach of any lease to a tenant occupying more than 10,000 square feet, beyond all applicable cure periods or (iv) upon the occurrence of a Tenant Trigger Event. A Cash Trap Event Period will expire upon the cure of such event of default, the actual debt service coverage ratio being equal to or greater than 1.20x for six consecutive calendar months, with respect to a Cash Trap Event Period commenced in connection with clause (iii), the lender’s receipt of satisfactory evidence that all then existing breaches have been cured or the occurrence of a Tenant Sweep Termination Event.
Property Management. The Norwalk Town Square Property is managed by Newmark Merrill Companies, LLC, which is not an affiliate of the borrower. According to the management agreement, the property manager is entitled to a base management fee in an amount equal to 3.75% of gross revenues collected including reimbursement revenue. In addition, the Norwalk Town Square Property manager must be reimbursed for the expense of an on-site manager and assistant if warranted at the Norwalk Town Square Property; however, in that event the 3.75% fee shall be reduced by the amount so reimbursed to the Norwalk Town Square Property manager. The borrower may not amend, extend, renew or cancel the management agreement or otherwise replace the manager or enter into any management agreement without written consent from the lender.
Assumption. The Norwalk Town Square Mortgage Loan has a two-time right to transfer the Norwalk Town Square Property and cause an assumption of the loan, provided that no event of default has occurred and is continuing under the Norwalk Town Square Mortgage Loan and certain other conditions are satisfied, including that; (a) the borrower pays an assumption fee of 1.0% of the outstanding principal balance of the Norwalk Town Square Mortgage Loan; (b) the transferee satisfies certain criteria; (c) transferee assumes the obligations of the borrower under the management agreement or enters into a new management agreement with a manager that satisfies certain criteria, and (d) confirmation from Fitch, Moody’s and KBRA that the transfer will not result in a downgrade, withdrawal or qualification of the respective ratings assigned to the Series 2012-C6 Certificates.
Release. Not permitted.
Real Estate Substitution. Not permitted.
Subordinate and Mezzanine Indebtedness. Not permitted.
Ground Lease. None.
Terrorism Insurance. The loan documents require that the “all risk” insurance policy required to be maintained by the borrower provide coverage for terrorism in an amount equal to the full replacement cost of the Norwalk Town Square Property, as well as
business interruption insurance covering no less than the 12-month period following the occurrence of a casualty event, together with a 6-month extended period of indemnity.
Earthquake Insurance.The Norwalk Town Square Property is located in a seismic zone 4 and has an aggregate probable maximum loss of 22%. Earthquake insurance is in place with a $5 million limit, and excess earthquake insurance has been obtained with a sub-limit of $25 million inclusive of business interruption insurance due to peril of earthquake.
THE INFORMATION IN THIS STRUCTURAL AND COLLATERAL TERM SHEET IS NOT COMPLETE AND MAY BE AMENDED PRIOR TO THE TIME OF SALE. THIS TERM SHEET IS NOT AN OFFER TO SELL THESE SECURITIES AND IT IS NOT A SOLICITATION OF AN OFFER TO BUY THESE SECURITIES IN ANY JURISDICTION WHERE THE OFFER OR SALE IS NOT PERMITTED.
50
[THIS PAGE INTENTIONALLY LEFT BLANK.]
51
RESORT MHC
THE INFORMATION IN THIS STRUCTURAL AND COLLATERAL TERM SHEET IS NOT COMPLETE AND MAY BE AMENDED PRIOR TO THE TIME OF SALE. THIS TERM SHEET IS NOT AN OFFER TO SELL THESE SECURITIES AND IT IS NOT A SOLICITATION OF AN OFFER TO BUY THESE SECURITIES IN ANY JURISDICTION WHERE THE OFFER OR SALE IS NOT PERMITTED.
52
RESORT MHC
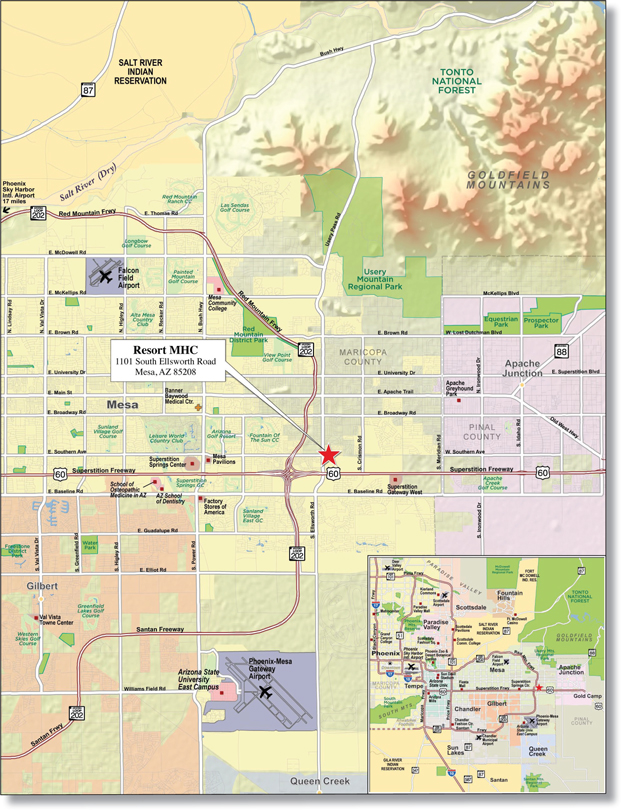
THE INFORMATION IN THIS STRUCTURAL AND COLLATERAL TERM SHEET IS NOT COMPLETE AND MAY BE AMENDED PRIOR TO THE TIME OF SALE. THIS TERM SHEET IS NOT AN OFFER TO SELL THESE SECURITIES AND IT IS NOT A SOLICITATION OF AN OFFER TO BUY THESE SECURITIES IN ANY JURISDICTION WHERE THE OFFER OR SALE IS NOT PERMITTED.
53
Resort MHC
Loan Information
| ||
Mortgage Loan Seller: | Wells Fargo Bank, National Association | |
| Credit Assessment (Fitch/Moody’s/KBRA): | NAP | |
Original Principal Balance: | $23,000,000 | |
Cut-off Date Principal Balance: | $22,801,387 | |
% of Initial Pool Balance: | 2.5% | |
Loan Purpose: | Refinance | |
Borrower Name: | ILA Resort II, LLC | |
Sponsors: | Albert J. LaCanne; Catherine E. Ivy | |
Mortgage Rate: | 5.300% | |
Note Date: | July 29, 2011 | |
Anticipated Repayment Date: | NAP | |
Maturity Date: | August 1, 2021 | |
IO Period: | None | |
Loan Term (Original): | 120 months | |
Seasoning: | 8 months | |
Amortization Term (Original) : | 360 months | |
Loan Amortization Type: | Amortizing Balloon | |
Interest Accrual Method: | Actual/360 | |
Call Protection: | L(32),D(84),O(4) | |
Lockbox Type: | None | |
Additional Debt: | None | |
Additional Debt Type: | NAP | |
Escrows and Reserves:
Type: | Initial | Monthly | Cap (If Any) | |||
Taxes | $50,652 | $12,663 | NAP | |||
Insurance(1) | $0 | Springing | NAP | |||
Replacement Reserve | $0 | $3,296 | NAP | |||
Seasonality Reserve(2) | $400,000 | Springing | $440,319 |
Property Information
| ||
Single Asset/Portfolio: | Single Asset | |
Property Type: | Manufactured Housing Community | |
Specific Property Type: | Manufactured Housing Community | |
Location: | Mesa, AZ | |
Size: | 791 Pads | |
Cut-off Date Principal | ||
Balance Per Unit/Pad: | $28,826.03 | |
Year Built/Renovated: | 1984/2010 | |
Occupancy %(3): | 98.5% | |
Occupancy % Source Date(3): | January 30, 2012 | |
Title Vesting: | Fee | |
Property Manager: | Interstate Investments, Inc. | |
3rd Most Recent NOI (As of): | $2,058,863(12/31/2009) | |
2nd Most Recent NOI (As of): | $2,297,911(12/31/2010) | |
Most Recent NOI (As of): | $2,404,575(12/31/2011) | |
U/W Revenues: | $3,495,083 | |
U/W Expenses: | $1,143,216 | |
U/W NOI: | $2,351,867 | |
U/W NCF: | $2,312,317 | |
U/W NOI DSCR: | 1.53x | |
U/W NCF DSCR: | 1.51x | |
U/W NOI Debt Yield: | 10.3% | |
U/W NCF Debt Yield: | 10.1% | |
As-Is Appraised Value: | $30,770,000 | |
| As-Is Appraisal Valuation Date: | May 23, 2011 | |
Cut-off Date LTV Ratio: | 74.1% | |
LTV Ratio at Maturity or ARD: | 62.1% | |
| (1) | Monthly insurance escrows are waived so long as no event of default has occurred and is continuing and the borrower delivers to lender satisfactory evidence that the property is insured in accordance with the loan documents. |
| (2) | Monthly seasonality escrows are waived so long as the borrower does not request or obtain any disbursement from the initial seasonality escrow deposit. Upon disbursement, a monthly escrow amount of $42,268 is required from September through April of each year during the loan term subject to a cap. |
| (3) | Current occupancy does not reflect seasonality at the Resort MHC Property. |
The Mortgage Loan. The mortgage loan (the “Resort MHC Mortgage Loan”) is evidenced by a single promissory note that is secured by a first mortgage encumbering a manufactured housing community and recreational vehicle park located in Mesa, Arizona (the “Resort MHC Property”). The Resort MHC Mortgage Loan was originated on July 29, 2011 by Wells Fargo Bank, National Association. The Resort MHC Mortgage Loan had an original principal balance of $23,000,000, has an outstanding principal balance as of the Cut-off Date of $22,801,387 and accrues interest at an interest rate of 5.300% per annum. The Resort MHC Mortgage Loan had an initial term of 120 months, has a remaining term of 112 months as of the Cut-off Date and requires payment of interest and principal based on a 30-year amortization schedule. The Resort MHC Mortgage Loan matures on August 1, 2021. The proceeds from the Resort MHC Mortgage Loan were used to refinance existing debt on the Resort MHC Property of approximately $11.6 million, buy-out partnerships with approximately $7.9 million, fund reserves of approximately $450,000, pay closing and other costs of approximately $210,000, and return approximately $2.9 million of equity to the sponsor.
Following the lockout period, the borrower has the right to defease the Resort MHC Mortgage Loan in whole, but not in part, on any due date before the scheduled maturity date. In addition, the Resort MHC Mortgage Loan is prepayable without penalty on or after May 1, 2021.
The Property. The Resort MHC Property is a 791-pad, age-restricted (55 and older), manufactured housing community and recreational vehicle park located in Mesa, Arizona. The Resort MHC Property consists of 642 pads containing resident owned manufactured homes and 149 pads available for daily, weekly, monthly or seasonal recreational vehicle rental. Each pad site is approximately 2,000 square feet, has a hose bib and underground electricity, water, sewer, telephone and cable connections. Community amenities and improvements at the Resort MHC Property consist of a swimming pool and heated spa, four tennis
THE INFORMATION IN THIS STRUCTURAL AND COLLATERAL TERM SHEET IS NOT COMPLETE AND MAY BE AMENDED PRIOR TO THE TIME OF SALE. THIS TERM SHEET IS NOT AN OFFER TO SELL THESE SECURITIES AND IT IS NOT A SOLICITATION OF AN OFFER TO BUY THESE SECURITIES IN ANY JURISDICTION WHERE THE OFFER OR SALE IS NOT PERMITTED.
54
RESORT MHC
courts, two pickle ball courts, shuffle board courts, horseshoe pits, a baseball field, a fenced pet park area, exterior concrete block fencing and striped standard parking spaces. The improvements were primarily constructed in 1984 and renovated in 2010 to add a 10,000 square foot building housing a storage room, recreation room, woodshop and bathrooms and the newly constructed tennis courts, pickleball courts and baseball field.
The following table presents historical occupancy percentages at the Resort MHC Property:
Historical Occupancy Percentages*
| 12/31/2009 | 12/31/2010 | 1/30/2012 | ||||||
|
|
|
|
| ||||
| 94% | 94% | 99% |
| * | Source: Information based on borrower provided operating statements. |
Operating History and Underwritten Net Cash Flow. The following table presents certain information relating to the historical operating performance and the Underwritten Net Cash Flow at the Resort MHC Property:
Cash Flow Analysis
| 2009 | 2010 | 2011 | U/W(1) | U/W $ per Pad | ||||||||||||||||
Gross Potential Rent | $ | 2,947,799 | $ | 3,147,615 | $ | 3,359,029 | $ | 3,359,029 | $ | 4,246.56 | ||||||||||
Other Income(2) | 111,999 | 118,296 | 136,054 | 136,054 | 172.00 | |||||||||||||||
Less Vacancy & Credit Loss | 0 | 0 | 0 | 0 | 0 | |||||||||||||||
|
|
|
|
|
|
|
|
|
| |||||||||||
Effective Gross Income | $ | 3,059,798 | $ | 3,265,911 | $ | 3,495,083 | $ | 3,495,083 | $ | 4,418.56 | ||||||||||
Total Operating Expenses | $ | 1,000,935 | $ | 968,000 | $ | 1,090,507 | $ | 1,143,216 | $ | 1,445.28 | ||||||||||
|
|
|
|
|
|
|
|
|
| |||||||||||
Net Operating Income | $ | 2,058,863 | $ | 2,297,911 | $ | 2,404,575 | $ | 2,351,367 | $ | 2,973.28 | ||||||||||
Capital Expenditures | 0 | 0 | 0 | 39,550 | 50.00 | |||||||||||||||
|
|
|
|
|
|
|
|
|
| |||||||||||
Net Cash Flow | $ | 2,058,863 | $ | 2,297,911 | $ | 2,404,575 | $ | 2,312,317 | $ | 2,923.28 | ||||||||||
NOI DSCR | 1.34x | 1.50x | 1.57x | 1.53x | ||||||||||||||||
NCF DSCR | 1.34x | 1.50x | 1.57x | 1.51x | ||||||||||||||||
NOI DY | 9.0% | 10.1% | 10.5% | 10.3% | ||||||||||||||||
NCF DY | 9.0% | 10.1% | 10.5% | 10.1% | ||||||||||||||||
| (1) | Gross Potential Rent is based on 2011 rent collection. |
| (2) | Other Income includes utilities, postal, community activities, wood shop and miscellaneous income. |
Appraisal. According to the appraisal report dated May 23, 2011, the Resort MHC Property had an “as-is” appraised value of $30,770,000.
Environmental Matters. According to the Phase I environmental site assessment dated May 31, 2011, there was no evidence of any recognized environmental conditions at the Resort MHC Property.
Market Overview and Competition. The Resort MHC Property is an age-restricted manufactured housing community and recreational vehicle park located in Mesa, Arizona, which is part of the metropolitan Phoenix market in Maricopa County. The Resort MHC Property is located approximately 11 miles east of the Mesa central business district and approximately 15 miles east of Phoenix. According to the appraisal, the Resort MHC Property is within four miles of the 1.3 million square foot Superstition Springs Regional Mall and within ten miles of seven master planned residential communities spread across more than 7,600 acres. According to a 3rd party population report, Mesa, Arizona had a 2010 reported population of 439,041, representing a population increase of 10.8% since 2000. The 2010 average household income for Mesa, Arizona was $50,079. Major employers in Mesa, Arizona include Mesa Public Schools (9,100), Banner Medical Centers (5,900) and The Boeing Company (4,500). Mesa, Arizona is also home to a variety of outdoor activities including parks, sports facilities, golf courses and Chicago Cubs Spring Training baseball.
The Borrower. The borrower, ILA Resort II, LLC, is an Arizona limited liability company and a single-purpose entity. Legal counsel to the ILA Resort II, LLC delivered a non-consolidation opinion in connection with the origination of the Resort MHC Mortgage Loan. The borrower is owned indirectly by Catherine E. Ivy and Albert J. LaCanne, who are the guarantors of certain nonrecourse carveouts under the Resort MHC Mortgage Loan.
The Sponsors. Catherine E. Ivy served as the president of a financial planning firm in Palo Alto, California. Ms. Ivy’s late husband, Ben Ivy, was previously a financial planner who specialized in real estate investment. Albert J. LaCanne is the owner and president of Interstate Investments Incorporated, which is based in Tempe, Arizona and specializes in the marketing and management of manufactured housing communities. Interstate Investments Incorporated has 30 years of experience in brokerage, acquisition, management and joint ventures of manufactured housing and recreational vehicle communities, and currently owns and manages four manufactured housing and recreational vehicle communities, including the Resort MHC Property.
THE INFORMATION IN THIS STRUCTURAL AND COLLATERAL TERM SHEET IS NOT COMPLETE AND MAY BE AMENDED PRIOR TO THE TIME OF SALE. THIS TERM SHEET IS NOT AN OFFER TO SELL THESE SECURITIES AND IT IS NOT A SOLICITATION OF AN OFFER TO BUY THESE SECURITIES IN ANY JURISDICTION WHERE THE OFFER OR SALE IS NOT PERMITTED.
55
RESORT MHC
Escrows. The loan documents provide for monthly escrows of $12,663 for real estate taxes (subject to adjustment per lender’s estimate of real estate taxes) and $3,296 for replacement reserves. Upon origination, the borrower was also required to make initial escrow deposits equal to $50,652 for real estate taxes. No reserves for insurance are required so long as no event of default has occurred and is continuing under the Resort MHC Mortgage Loan and the borrower delivers to lender satisfactory evidence that the property is covered by an acceptable blanket insurance policy and the borrower provides evidence of payment of insurance.
In connection with the origination of the Resort HMC Mortgage Loan, the borrower made an initial deposit of $400,000 into a seasonality reserve and the loan documents require upon any disbursement being requested or made from the initial deposit, from September through April of each year during the loan term, a monthly deposit of $42,268 (subject to a cap of $440,319) (the “Seasonality Reserve”), all for the purpose of funding potential debt service shortfalls resulting from seasonal fluctuations in the performance of the Resort MHC Mortgage Property. In no event is the borrower entitled to a disbursement in any single month of more than 25% of the amount on deposit in the Seasonality Reserve as of the first day of May.
Lockbox and Cash Management. None.
Property Management. The Resort MHC Property is managed by Interstate Investments, Inc, an affiliate of the borrower. The manager is entitled to a management fee equal to $10,000 per month. The borrower may not surrender, terminate or cancel the management agreement or otherwise replace or enter into any other management agreement without prior written consent from the lender (which consent may not be unreasonably withheld).
Assumption. The Resort MHC Mortgage Loan has a two-time right to transfer the Resort MHC Property and cause an assumption of the loan, provided that no event of default has occurred and is continuing under the Resort MHC Mortgage Loan and certain other conditions are satisfied, including that: (i) the borrower pays an assumption fee of 1.0% of the outstanding principal balance of the Resort MHC Loan; (ii) the transferee satisfies certain criteria; (iii) the transferee assumes the obligations of the borrower under the management agreement or enters into a new management agreement with a manager satisfying certain criteria; (iv) the lender receives confirmation from Fitch, Moody’s and KBRA that the transfer will not result in a downgrade, withdrawal or qualification of the respective ratings assigned to the Series 2012-C6 Certificates; and (v) other factors relied upon by lender in the original underwriting of the Resort MHC Mortgage Loan.
Release. Not permitted.
Real Estate Substitution. Not permitted.
Subordinate and Mezzanine Indebtedness. Not permitted.
Ground Lease. None.
Terrorism Insurance. The loan documents require the borrower to maintain an “all risk” insurance policy, with no exclusion for terrorism, in an amount equal to the full replacement cost of the Resort MHC Property, as well as business interruption insurance continuing until the earlier of: (i) the date when estimated gross income returns to the same level as before the loss or (ii) 12 months from the date the property is repaired and/or replaced and operations are resumed together with a 12-month extended period of indemnity.
THE INFORMATION IN THIS STRUCTURAL AND COLLATERAL TERM SHEET IS NOT COMPLETE AND MAY BE AMENDED PRIOR TO THE TIME OF SALE. THIS TERM SHEET IS NOT AN OFFER TO SELL THESE SECURITIES AND IT IS NOT A SOLICITATION OF AN OFFER TO BUY THESE SECURITIES IN ANY JURISDICTION WHERE THE OFFER OR SALE IS NOT PERMITTED.
56
[THIS PAGE INTENTIONALLY LEFT BLANK.]
57
CITRUS CROSSING
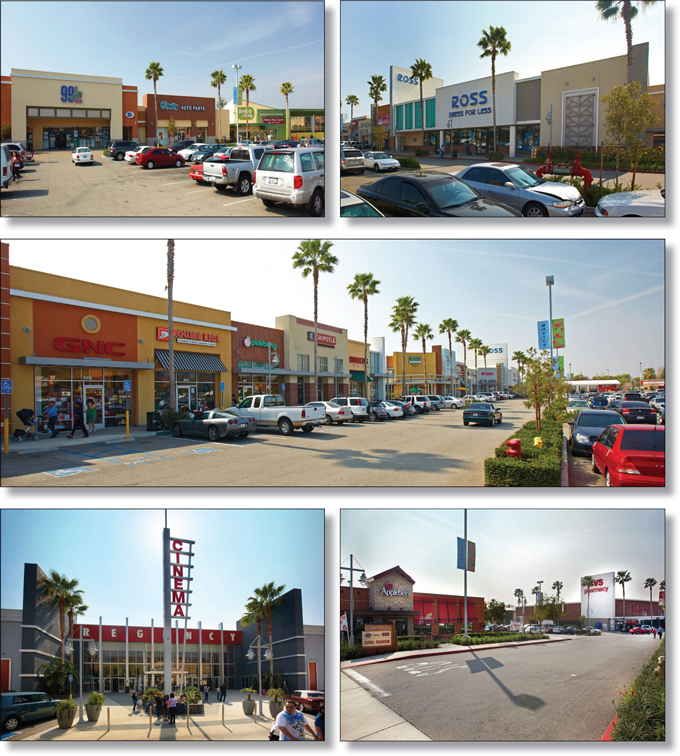
THE INFORMATION IN THIS STRUCTURAL AND COLLATERAL TERM SHEET IS NOT COMPLETE AND MAY BE AMENDED PRIOR TO THE TIME OF SALE. THIS TERM SHEET IS NOT AN OFFER TO SELL THESE SECURITIES AND IT IS NOT A SOLICITATION OF AN OFFER TO BUY THESE SECURITIES IN ANY JURISDICTION WHERE THE OFFER OR SALE IS NOT PERMITTED.
58
CITRUS CROSSING

THE INFORMATION IN THIS STRUCTURAL AND COLLATERAL TERM SHEET IS NOT COMPLETE AND MAY BE AMENDED PRIOR TO THE TIME OF SALE. THIS TERM SHEET IS NOT AN OFFER TO SELL THESE SECURITIES AND IT IS NOT A SOLICITATION OF AN OFFER TO BUY THESE SECURITIES IN ANY JURISDICTION WHERE THE OFFER OR SALE IS NOT PERMITTED.
59
Citrus Crossing
Loan Information
| ||
Mortgage Loan Seller: | Wells Fargo Bank, National Association | |
| Credit Assessment (Fitch/Moody’s/KBRA): | NAP | |
Original Principal Balance: | $22,500,000 | |
Cut-off Date Principal Balance: | $22,307,737 | |
% of Initial Pool Balance: | 2.4% | |
Loan Purpose: | Refinance | |
Borrower Name: | Citrus Crossing Properties Fee LLC | |
Sponsors: | John Francis; Richard Francis | |
Mortgage Rate: | 5.350% | |
Note Date: | July 14, 2011 | |
Anticipated Repayment Date: | NAP | |
Maturity Date: | August 1, 2021 | |
IO Period: | None | |
Loan Term (Original): | 120 months | |
Seasoning: | 8 months | |
Amortization Term (Original): | 360 months | |
Loan Amortization Type: | Amortizing Balloon | |
Interest Accrual Method: | Actual/360 | |
Call Protection: | L(32),D(84),O(4) | |
Lockbox Type: | Hard/Upfront Cash Management | |
Additional Debt: | None | |
Additional Debt Type: | NAP | |
Escrows and Reserves:
Type: | Initial | Monthly | Cap (If Any) | |||
Taxes | $105,000 | $21,160 | NAP | |||
Insurance | $8,900 | $2,967 | NAP | |||
Replacement Reserves | $0 | $2,876 | NAP | |||
TI/LC(1) | $0 | $18,381 | $661,716 | |||
Tenant Specific Reserve(2) | $1,303,676 | $0 | NAP |
Property Information
| ||
Single Asset/Portfolio: | Single Asset | |
Property Type: | Retail | |
Specific Property Type: | Anchored | |
Location: | Azusa, CA | |
Size: | 172,533 SF | |
Cut-off Date Principal | ||
Balance Per Unit/SF: | $129.30 | |
Year Built/Renovated: | 1960/2008 | |
Occupancy %: | 99.1% | |
Occupancy % Source Date: | December 1, 2011 | |
Title Vesting: | Fee | |
Property Manager: | Trachman Indevco LLC | |
3rd Most Recent NOI (As of): | $2,453,168(12/31/2009) | |
2nd Most Recent NOI (As of): | $2,452,015(12/31/2010) | |
Most Recent NOI (As of): | $2,522,380 (TTM 11/30/2011) | |
U/W Revenues: | $3,311,266 | |
U/W Expenses: | $735,914 | |
U/W NOI: | $2,575,351 | |
U/W NCF: | $2,325,562 | |
U/W NOI DSCR: | 1.71x | |
U/W NCF DSCR: | 1.54x | |
U/W NOI Debt Yield: | 11.5% | |
U/W NCF Debt Yield: | 10.4% | |
As-Is Appraised Value: | $41,000,000 | |
As-Is Appraisal Valuation Date: | August 1, 2011 | |
Cut-off Date LTV Ratio: | 54.4% | |
LTV Ratio at Maturity or ARD: | 45.6% | |
| (1) | Monthly tenant improvement and leasing commission reserves are waived so long as the leasing reserve fund is greater than or equal to $661,716 and at least 85% of net rentable area at the Citrus Crossing Property is leased to tenants in occupancy and paying rent. |
| (2) | The borrower made an up-front deposit into a reserve to pay for tenant improvements associated with the lease with Applebee’s. Applebee’s is in occupancy and substantially all of the funds deposited have been released. A Certificate of Occupancy for Applebee’s was issued on October 11, 2011. The remaining balance of the Applebee’s Leasing Reserve is $76,044 as of March 5, 2012. |
The Mortgage Loan. The mortgage loan (the “Citrus Crossing Mortgage Loan”) is evidenced by a single promissory note that is secured by a first mortgage encumbering an anchored retail center located in Azusa, California (the “Citrus Crossing Property”). The Citrus Crossing Mortgage Loan was originated on July 14, 2011 by Wells Fargo Bank, National Association. The Citrus Crossing Mortgage Loan had an original principal balance of $22,500,000, has an outstanding principal balance as of the Cut-off Date of $22,307,737 and accrues interest at an interest rate of 5.350% per annum. The Citrus Crossing Mortgage Loan had an initial term of 120 months, has a remaining term of 112 months as of the Cut-off Date and requires payments of interest and principal based on a 30-year amortization schedule. The Citrus Crossing Mortgage Loan matures on August 1, 2021. The proceeds from the Citrus Crossing Mortgage Loan were used to refinance existing debt on the Citrus Crossing Mortgage Property of $21.9 million, fund upfront reserves of approximately $1.4 million and pay closing costs of approximately $413,000. The borrower contributed approximately $1.2 million in additional equity to bridge the funding gap.
Following the lockout period, the borrower has the right to defease the Citrus Crossing Mortgage Loan in whole, but not in part, on any due date before the scheduled maturity date. In addition, the Citrus Crossing Mortgage Loan is prepayable without penalty on or after May 1, 2021.
The Property. The Citrus Crossing Property is an anchored retail center totaling approximately 172,533 square feet situated on 17.2 acres at the northwest corner of Alosta Avenue and Citrus Avenue in Azusa, California. The property was originally constructed in 1960 and underwent a redevelopment in 2008. Major tenants at the property include Regency Theatres, Ross Dress for Less, 99 Cents Only Store, and Fresh & Easy. The Citrus Crossing Property also includes six outparcels leased to Burger King, Taco Bell, Kentucky Fried Chicken, Jiffy Lube, Pizza Hut and a recently constructed Applebee’s. Parking is provided by
THE INFORMATION IN THIS STRUCTURAL AND COLLATERAL TERM SHEET IS NOT COMPLETE AND MAY BE AMENDED PRIOR TO THE TIME OF SALE. THIS TERM SHEET IS NOT AN OFFER TO SELL THESE SECURITIES AND IT IS NOT A SOLICITATION OF AN OFFER TO BUY THESE SECURITIES IN ANY JURISDICTION WHERE THE OFFER OR SALE IS NOT PERMITTED.
60
CITRUS CROSSING
approximately 915 surface spaces resulting in a parking ratio of 5.3 spaces per 1,000 square feet of net rentable area. As of December 1, 2011, the Citrus Crossing Property was 99.1% occupied by 25 tenants.
The following table presents certain information relating to the tenancies at the Citrus Crossing Property:
Major Tenants
Tenant Name | Credit Rating (Fitch/ Moody’s/ S&P)(1) | Tenant NRSF | % of NRSF | Annual U/W Base Rent PSF | Annual U/W Base Rent | % of Total Annual U/W Base Rent | Sales PSF(2) | Occupancy Cost(2) | Lease Expiration Date(3) | |||||||||||||||||||||||
Anchor Tenants - Collateral | ||||||||||||||||||||||||||||||||
Regency Theatres | NR/NR/NR | 37,977 | 22.0 | % | $14.15 | $537,504 | 19.5 | % | $387K | (4) | 18.8% | 9/30/2026 | ||||||||||||||||||||
Ross Dress for Less | NR/NR/BBB+ | 27,890 | 16.2 | % | $11.65 | $325,000 | 11.8 | % | $268 | 5.0% | 1/31/2014 | |||||||||||||||||||||
Fresh & Easy | NR/NR/NR | 13,969 | 8.1 | % | $20.63 | $288,180 | 10.4 | % | NAV | NAV | 1/31/2029 | |||||||||||||||||||||
Applebee’s(5) | B/B2/B | 5,700 | 3.3 | % | $35.96 | $205,000 | 7.4 | % | NAV | NAV | 8/31/2031 | |||||||||||||||||||||
99 Cents Only Store(6) | NR/B2/B | 32,134 | 18.6 | % | $4.82 | $154,908 | 5.6 | % | $161 | 4.8% | 6/30/2016 | |||||||||||||||||||||
|
|
|
|
|
|
|
|
|
|
| ||||||||||||||||||||||
Total Anchor Tenants - Collateral | 117,670 | 68.2 | % | $12.84 | $1,510,592 | 54.8 | % | |||||||||||||||||||||||||
Non-Major Tenants | 53,363 | 30.9 | % | $23.39 | $1,247,930 | 45.2 | % | |||||||||||||||||||||||||
|
|
|
|
|
|
|
| |||||||||||||||||||||||||
Occupied Collateral Total | 171,033 | 99.1 | % | $16.13 | $2,758,522 | 100.0 | % | |||||||||||||||||||||||||
|
|
|
| |||||||||||||||||||||||||||||
Vacant Space | 1,500 | 0.9 | % | |||||||||||||||||||||||||||||
|
|
|
| |||||||||||||||||||||||||||||
Collateral Total | 172,533 | 100.0 | % | |||||||||||||||||||||||||||||
|
|
|
| |||||||||||||||||||||||||||||
| (1) | Certain ratings are those of the parent company whether or not the parent guarantees the lease. |
| (2) | Sales per square foot and occupancy costs are for the twelve months ended on December 31, 2010. |
| (3) | Several leases include co-tenancy remedies. Ross Dress for Less has a co-tenancy trigger based on minimum occupancy of 65% and Applebee’s has a co-tenancy trigger based on a maximum of one anchor tenant not in operation without being replaced by another anchor, and minimum occupancy of 60% of other retail floor area. As of March 5, 2012, none of the remedies have been triggered. |
| (4) | Regency Theatres, which operates a 10-screen theatre, reported sales of $387,361 per screen for the twelve months ended on December 31, 2010. |
| (5) | Applebee’s may terminate its lease if their gross revenue between August 31, 2020 and August 31, 2021 or between August 31, 2025 and August 31, 2026 do not exceed $2.3 million, within 60 days after the end of the applicable lease year. The tenant must provide financial statement certified by the tenant’s chief financial officer evidencing the tenant’s gross sales for the applicable lease year. Termination would be effective as of the last day of the eleventh or sixteenth lease year and all rents would be paid until the effective date of termination. |
| (6) | 99 Cents Only Store subleases approximately 7,560 square feet to O’Reilly Auto Parts, Inc. at a rate of $17.25 per square foot, resulting in annual sublease payments to 99 Cents Only Store of $130,410, which is not otherwise reflected in the table. The term of the sublease extends through June 30, 2016. |
The following table presents certain information relating to the lease rollover schedule at the Citrus Crossing Property:
Lease Expiration Schedule(1)
Year Ending | No. of Leases Expiring(2) | Expiring NRSF | % of Total NRSF | Cumulative of Total NRSF | Cumulative % of Total NRSF | Annual U/W Base Rent | Annual U/W Base Rent PSF | |||||||||||||||||||
MTM | 1 | 1,300 | 0.8 | % | 1,300 | 0.8 | % | $49,699 | $38.23 | |||||||||||||||||
2012 | 1 | 2,000 | 1.2 | % | 3,300 | 1.9 | % | $76,460 | $38.23 | |||||||||||||||||
2013 | 4 | 7,462 | 4.3 | % | 10,762 | 6.2 | % | $255,924 | $34.30 | |||||||||||||||||
2014 | 3 | 33,619 | 19.5 | % | 44,381 | 25.7 | % | $449,518 | $13.37 | |||||||||||||||||
2015 | 1 | 1,841 | 1.1 | % | 46,222 | 26.8 | % | $62,952 | $34.19 | |||||||||||||||||
2016 | 5 | 41,543 | 24.1 | % | 87,765 | 50.9 | % | $429,588 | $10.34 | |||||||||||||||||
2017 | 2 | 17,600 | 10.2 | % | 105,365 | 61.1 | % | $122,606 | $6.97 | |||||||||||||||||
2018 | 3 | 4,442 | 2.6 | % | 109,807 | 63.6 | % | $155,648 | $35.04 | |||||||||||||||||
2019 | 1 | 1,680 | 1.0 | % | 111,487 | 64.6 | % | $58,867 | $35.04 | |||||||||||||||||
2020 | 0 | 0 | 0.0 | % | 111,487 | 64.6 | % | $0 | $0.00 | |||||||||||||||||
2021 | 0 | 0 | 0.0 | % | 111,487 | 64.6 | % | $0 | $0.00 | |||||||||||||||||
2022 | 0 | 0 | 0.0 | % | 111,487 | 64.6 | % | $0 | $0.00 | |||||||||||||||||
Thereafter | 4 | 59,546 | 34.5 | % | 171,033 | 99.1 | % | $1,097,260 | $18.43 | |||||||||||||||||
Vacant | 0 | 1,500 | 0.9 | % | 172,533 | 100.0 | % | $0 | $0.00 | |||||||||||||||||
|
|
|
|
|
|
|
|
| ||||||||||||||||||
Total / Weighted Average | 25 | 172,533 | 100.0 | % | $2,758,522 | $16.13 | ||||||||||||||||||||
|
|
|
|
|
|
|
|
| ||||||||||||||||||
| (1) | Source: Information obtained from underwritten rent roll. |
| (2) | Certain tenants may have lease termination options that are exercisable prior to the originally stated expiration date of the subject lease and that are not considered in the Lease Expiration Schedule. |
THE INFORMATION IN THIS STRUCTURAL AND COLLATERAL TERM SHEET IS NOT COMPLETE AND MAY BE AMENDED PRIOR TO THE TIME OF SALE. THIS TERM SHEET IS NOT AN OFFER TO SELL THESE SECURITIES AND IT IS NOT A SOLICITATION OF AN OFFER TO BUY THESE SECURITIES IN ANY JURISDICTION WHERE THE OFFER OR SALE IS NOT PERMITTED.
61
CITRUS CROSSING
The following table presents historical occupancy percentages at the Citrus Crossing Property:
Historical Occupancy Percentages*
12/31/2009 | 12/31/2010 | 12/31/2011 | ||
| 92% | 96% | 100% |
| * | Source: Information obtained from borrower rent roll. |
Operating History and Underwritten Net Cash Flow. The following table presents certain information relating to the historical operating performance and the Underwritten Net Cash Flow at the Citrus Crossing Property:
Cash Flow Analysis
| 2009 | 2010 | TTM 11/30/2011 | U/W | U/W $ per SF | ||||||||||||||||
Base Rent | $2,424,817 | $2,494,377 | $2,593,720 | $2,758,522 | $15.99 | |||||||||||||||
Grossed Up Vacant Space | 0 | 0 | 0 | 52,560 | 0.30 | |||||||||||||||
Percentage Rent | 25,631 | 46,870 | 39,412 | 0 | 0.00 | |||||||||||||||
Total Reimbursables | 570,201 | 583,593 | 595,680 | 686,753 | 3.98 | |||||||||||||||
Other Income | 15,000 | 17,500 | 23,300 | 24,787 | 0.14 | |||||||||||||||
Less Vacancy & Credit Loss | 0 | 0 | 0 | (211,357) | (1.23) | |||||||||||||||
|
|
|
|
|
|
|
|
|
| |||||||||||
Effective Gross Income | $3,035,649 | $3,142,340 | $3,252,112 | $3,311,266 | $19.19 | |||||||||||||||
Total Operating Expenses | $582,481 | $690,325 | $729,732 | $735,914 | $4.27 | |||||||||||||||
|
|
|
|
|
|
|
|
|
| |||||||||||
Net Operating Income | $2,453,168 | $2,452,015 | $2,522,380 | $2,575,351 | $14.93 | |||||||||||||||
TI/LC | 0 | 0 | 0 | 215,282 | 1.25 | |||||||||||||||
Capital Expenditures | 0 | 0 | 0 | 34,507 | 0.20 | |||||||||||||||
|
|
|
|
|
|
|
|
|
| |||||||||||
Net Cash Flow | $2,453,168 | $2,452,015 | $2,522,380 | $2,325,562 | $13.48 | |||||||||||||||
NOI DSCR | 1.63x | 1.63x | 1.67x | 1.71x | ||||||||||||||||
NCF DSCR | 1.63x | 1.63x | 1.67x | 1.54x | ||||||||||||||||
NOI DY | 11.0% | 11.0% | 11.3% | 11.5% | ||||||||||||||||
NCF DY | 11.0% | 11.0% | 11.3% | 10.4% | ||||||||||||||||
Appraisal. According to the appraisal dated August 1, 2011, the Citrus Crossing Property had an “as-is” appraised value of $41,000,000.
Environmental Matters. According to the Phase I environmental site assessment dated June 10, 2011, there was no evidence of recognized environmental conditions at the Citrus Crossing Property. However an operations and maintenance program was recommended for the management of suspected asbestos-containing materials and lead based paint.
Market Overview and Competition. The Citrus Crossing Property is located in Azusa, California, approximately 27 miles northeast of Los Angeles and 15 miles east of Pasadena. The city of Azusa is located in the San Gabriel Valley portion of northeast Los Angeles County and the Citrus Crossing Property is approximately one mile north of Interstate 210, approximately 4.5 miles east of Interstate 605 and approximately 4.0 miles west of Orange State Route 57. According to the appraisal, Azusa encompasses 9.1 square miles and is also home to Azusa Pacific University and Citrus College, which together have more than 20,000 enrolled students. Pacific University is located adjacent to the Citrus Crossing Property.
According to the appraisal, Azusa had a 2010 population of 49,099 residents, reflecting an increase of approximately 1.0 percent annually from 2000 to 2010. As of 2010, the population within a 3-mile radius and 5-mile radius of the Citrus Crossing Property was 151,645 and 295,219, respectively. The 2010 average household income within a 3-mile radius and a 5-mile radius of the Citrus Crossing Property was $79,999 and $84,425, respectively.
The following table presents certain information relating to some comparable retail centers provided in the appraisal for the Citrus Crossing Property:
Competitive Set(1)
| Citrus Crossing (Subject) | Azusa Promenade | Glendora Center | Foothill Plaza | Covina Town Square | ||||||
Market | Azusa, CA | Azusa, CA | Glendora, CA | Glendora, CA | Covina, CA | |||||
Distance from Subject | — | 0.10 miles | 1.45 miles | 1.15 miles | 2.00 miles | |||||
Property Type | Community Center | Neighborhood Center | Neighborhood Center | Neighborhood Center | Community Center | |||||
Year Built / Renovated | 1960 / 2008 | 1989/NAP | 1955 / 2001 | 1980 / 1997 | 1988 / 1998 | |||||
Anchors | Ross Stores, CVS, Regency Theatre, 99 Cent Store | Big Lots, Good Year Tires, Radio Shack | Albertsons, Ace Hardware, Sav-on Pharmacy | Von’s, CVS, Wells Fargo, | AMC Theatre, Lowes, Staples | |||||
Total GLA | 172,533 SF | 169,121 SF | 106,746 SF | 106,380 SF | 269,433 SF | |||||
Total Occupancy | 99% | 91% | 94% | 95% | 97% |
| (1) | Source: Information obtained from appraisal dated August 1, 2011. |
THE INFORMATION IN THIS STRUCTURAL AND COLLATERAL TERM SHEET IS NOT COMPLETE AND MAY BE AMENDED PRIOR TO THE TIME OF SALE. THIS TERM SHEET IS NOT AN OFFER TO SELL THESE SECURITIES AND IT IS NOT A SOLICITATION OF AN OFFER TO BUY THESE SECURITIES IN ANY JURISDICTION WHERE THE OFFER OR SALE IS NOT PERMITTED.
62
CITRUS CROSSING
The Borrower. The borrower is a Delaware limited liability company and a single-purpose entity with an independent director. John Francis and Richard Francis, the managers of the borrower, are the guarantors of certain non-recourse carve-outs under the Citrus Crossing Mortgage Loan.
The Sponsors. The sponsors and the carve-out guarantors for the Citrus Crossing Mortgage Loan are John and Richard Francis. John and Richard Francis have directly or indirectly acquired over $750 million of commercial real estate over the past 40 years.
Escrows. The mortgage loan documents provide for monthly escrows of $21,160 for real estate taxes (subject to adjustments according to lender’s estimate of real estate tax), monthly escrows of $2,967 for insurance (subject to adjustment according to lender’s estimate of insurance premiums), monthly escrows of $2,876 for replacement reserves, and monthly escrows of $18,381 for tenant improvements and leasing commission reserves (subject to a cap of $661,716). Upon origination, the borrower was also required to make initial escrow deposits equal to $105,000 for real estate taxes, $8,900 for insurance and $1,303,676 to pay for tenant improvements associated with the Applebee’s lease.
On each monthly payment date occurring during a Lease Sweep Period (as defined below), the borrower is required to pay to the lender all excess cash flow (after the payment of debt service and reserves) and any lease termination payments received from Ross Dress for Less and/or 99 Cents Only Store (the “Rollover Tenants”) for deposit into a special rollover reserve. As an alternative to the payment of excess cash flow to the lender during a Lease Sweep Period, the borrower may deposit at any time cash in an amount which, when combined with all amounts already on deposit with lender as a result of the Lease Sweep Period is not less than $450,000. Provided the Rollover Tenants enter into renewal leases acceptable to lender as after a Lease Sweep Period expires, lender shall remit to borrower all amounts deposited with lender in excess of tenant improvements and leasing costs during the Lease Sweep Period.
A “Lease Sweep Period” will commence on the first monthly payment date following any of: (i) six months prior to the scheduled expiration of the Rollover Tenants’ leases, (ii) the date required under the Rollover Tenants’ leases by which either Rollover Tenants are required to give notice of exercising a renewal right, (iii) any surrender, cancelation or termination of any Rollover Tenants’ leases, (iv) (a) any Rollover Tenant goes dark or gives notice that it intends to discontinue its business, or (b) the debt yield, excluding the Rollover Tenant, is less than 10.3%, or (v) any default under any rollover lease by the applicable Rollover Tenant. The Lease Sweep Period will end upon the occurrence of an escrow deposit of $450,000 or the first payment date following the earlier of; (i) the lender determines there are sufficient funds in the Special Rollover Reserve to pay for anticipated expenses expected to arise in relation to re-tenanting the space under the applicable rollover lease that gave rise to the Lease Sweep Period, or (ii) the occurrence of any of the following: (a) for a Lease Sweep Period triggered by clause (i) through (iv), the applicable Rollover Tenant exercises its renewal or extension option and the lender determines there are sufficient funds in the Special Rollover Reserve to pay for anticipated expenses expected to arise from renewing the applicable rollover lease that gave rise to the Lease Sweep Period, (b) for a Lease Sweep Period triggered by clause (v) above, the Rollover Tenant’s default has been cured and no other default has occurred for a period of six months.
Lockbox and Cash Management. The Citrus Crossing Mortgage Loan requires a lender-controlled lockbox account, which is already in place, and that the borrower directs tenants to pay their rents directly to such lockbox account. The loan documents also require that all cash revenues and all other monies received by the borrower or the property manager relating to the Citrus Crossing Property be deposited into the lockbox account within one business days after receipt. Funds in the lockbox account are transferred into a cash management account on each business day. Other than during a Cash Trap Event Period (as defined below), all excess funds on deposit in the cash management account are disbursed to the Citrus Crossing Mortgage Loan borrower.
A “Cash Trap Event Period” will commence upon the earlier of (i) the occurrence and continuance of an event of default or (ii) the debt service coverage ratio is less than 1.20x during any calendar quarter. A Cash Trap Event Period will expire upon the cure of such event of default or the actual debt service coverage ratio being equal to or greater than 1.20x for six consecutive calendar months.
Property Management. The Citrus Crossing Property is managed by Trachman Indevco LLC, which is not an affiliate of the borrower. The property manager is entitled to a base management fee in the amount equal to 4.0% of monthly gross revenues. The borrower may not amend, extend, renew or cancel the management agreement or otherwise replace the manager or enter into any management agreement without written consent from the lender.
Assumption. The Citrus Crossing Mortgage Loan has a two-time right to transfer the Citrus Crossing Property and cause an assumption of the loan, provided that no event of default has occurred and is continuing under the Citrus Crossing Mortgage Loan and certain other conditions are satisfied, including that: (i) the borrower pays an assumption fee of 1.0% of the outstanding principal balance of the Citrus Crossing Mortgage Loan; (ii) the transferee satisfies certain criteria; (iii) the transferee assumes the obligations of the borrower under the management agreement or enters into a new management agreement with a manager that satisfies certain criteria; and (iv) confirmation from Fitch, Moody’s and KBRA that the transfer will not result in a downgrade, withdrawal or qualification of the respective ratings assigned to the Series 2012-C6 Certificates is delivered.
Release. Not permitted.
Real Estate Substitution. Not permitted.
Subordinate and Mezzanine Indebtedness. Not permitted.
THE INFORMATION IN THIS STRUCTURAL AND COLLATERAL TERM SHEET IS NOT COMPLETE AND MAY BE AMENDED PRIOR TO THE TIME OF SALE. THIS TERM SHEET IS NOT AN OFFER TO SELL THESE SECURITIES AND IT IS NOT A SOLICITATION OF AN OFFER TO BUY THESE SECURITIES IN ANY JURISDICTION WHERE THE OFFER OR SALE IS NOT PERMITTED.
63
CITRUS CROSSING
Ground Lease. None.
Terrorism Insurance. The loan documents require that the “all risk” insurance policy required to be maintained by the borrower provide coverage for terrorism in an amount equal to the full replacement cost of the Citrus Crossing Property, as well as business interruption insurance covering no less than the 12-month period following the occurrence of a casualty event, together with a 6- month extended period of indemnity.
THE INFORMATION IN THIS STRUCTURAL AND COLLATERAL TERM SHEET IS NOT COMPLETE AND MAY BE AMENDED PRIOR TO THE TIME OF SALE. THIS TERM SHEET IS NOT AN OFFER TO SELL THESE SECURITIES AND IT IS NOT A SOLICITATION OF AN OFFER TO BUY THESE SECURITIES IN ANY JURISDICTION WHERE THE OFFER OR SALE IS NOT PERMITTED.
64
[THIS PAGE INTENTIONALLY LEFT BLANK.]
65
BOCA INDUSTRIAL PARK
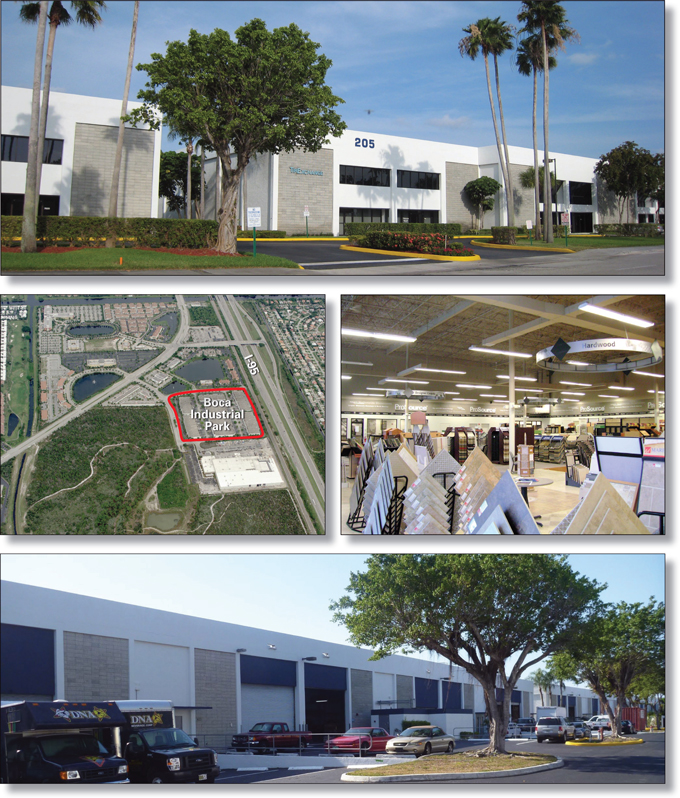
THE INFORMATION IN THIS STRUCTURAL AND COLLATERAL TERM SHEET IS NOT COMPLETE AND MAY BE AMENDED PRIOR TO THE TIME OF SALE. THIS TERM SHEET IS NOT AN OFFER TO SELL THESE SECURITIES AND IT IS NOT A SOLICITATION OF AN OFFER TO BUY THESE SECURITIES IN ANY JURISDICTION WHERE THE OFFER OR SALE IS NOT PERMITTED.
66
BOCA INDUSTRIAL PARK
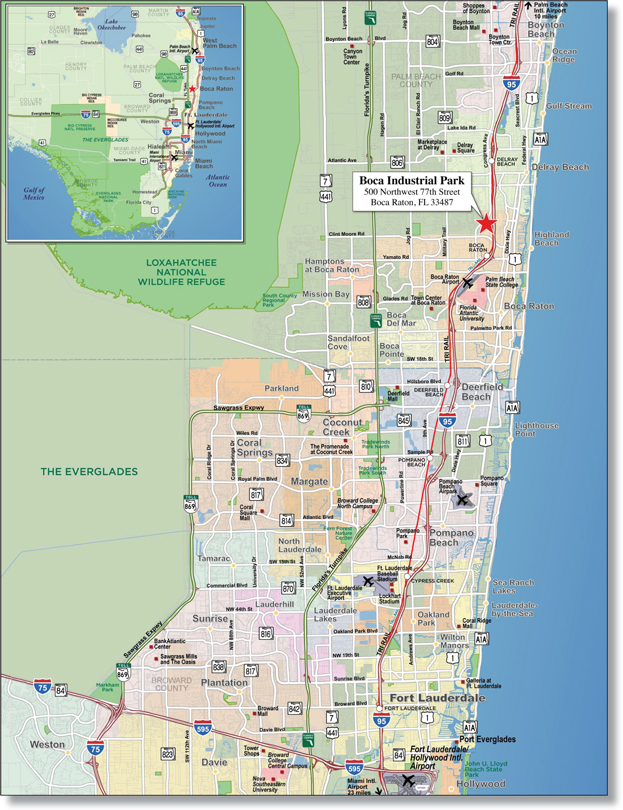
THE INFORMATION IN THIS STRUCTURAL AND COLLATERAL TERM SHEET IS NOT COMPLETE AND MAY BE AMENDED PRIOR TO THE TIME OF SALE. THIS TERM SHEET IS NOT AN OFFER TO SELL THESE SECURITIES AND IT IS NOT A SOLICITATION OF AN OFFER TO BUY THESE SECURITIES IN ANY JURISDICTION WHERE THE OFFER OR SALE IS NOT PERMITTED.
67
Boca Industrial Park
Loan Information
Mortgage Loan Seller: | Wells Fargo Bank, National Association | |
Credit Assessment (Fitch/Moody’s/KBRA): | NAP | |
Original Principal Balance: | $22,250,000 | |
Cut-off Date Principal Balance: | $22,250,000 | |
% of Initial Pool Balance: | 2.4% | |
Loan Purpose: | Refinance | |
Borrower Name: | Boca Industrial Park, LTD. | |
Sponsors: | Jamie Danburg; Tilmar Hansen | |
Mortgage Rate: | 5.080% | |
Note Date: | July 5, 2011 | |
Anticipated Repayment Date: | NAP | |
Maturity Date: | August 1, 2021 | |
IO Period: | 60 months | |
Loan Term (Original): | 120 months | |
Seasoning: | 8 months | |
Amortization Term (Original): | 360 months | |
Loan Amortization Type: | Interest-only, Amortizing Balloon | |
Interest Accrual Method: | Actual/360 | |
Call Protection: | L(32),D(84),O(4) | |
Lockbox Type: | None | |
Additional Debt: | None | |
Additional Debt Type: | NAP | |
Escrows and Reserves:
Type: | Initial | Monthly | Cap (If Any) | |||
Taxes(1) | $0 | Springing | NAP | |||
Insurance(2) | $0 | Springing | NAP | |||
Replacement Reserve(3) | $0 | Springing | NAP | |||
TI/LC(4) | $0 | Springing | NAP |
Property Information
Single Asset/Portfolio: | Single Asset | |
Property Type: | Industrial | |
Specific Property Type: | Flex | |
Location: | Boca Raton, FL | |
Size: | 386,846 SF | |
Cut-off Date Principal | ||
Balance Per Unit/SF: | $57.52 | |
Year Built/Renovated: | 1984/NAP | |
Occupancy %: | 91.9% | |
Occupancy % Source Date: | December 8, 2011 | |
Title Vesting: | Fee | |
Property Manager: | Danburg Management Corporation | |
3rd Most Recent NOI (As of): | $3,105,005(12/31/2009) | |
2nd Most Recent NOI (As of): | $2,749,235(12/31/2010) | |
Most Recent NOI (As of): | $2,573,239 (TTM 11/30/2011) | |
U/W Revenues: | $3,865,598 | |
U/W Expenses: | $1,309,921 | |
U/W NOI: | $2,555,677 | |
U/W NCF: | $2,292,609 | |
U/W NOI DSCR: | 1.77x | |
U/W NCF DSCR: | 1.59x | |
U/W NOI Debt Yield: | 11.5% | |
U/W NCF Debt Yield: | 10.3% | |
As-Is Appraised Value: | $36,900,000 | |
As-Is Appraisal Valuation Date: | May 18, 2011 | |
Cut-off Date LTV Ratio: | 60.3% | |
LTV Ratio at Maturity or ARD: | 55.7% | |
| (1) | Monthly tax escrows are waived so long as no event of default has occurred and is continuing and the borrower delivers to lender satisfactory evidence of payment of taxes. |
| (2) | Monthly insurance escrows are waived so long as no event of default has occurred and is continuing and the borrower delivers to lender satisfactory evidence that the property is insured in accordance with the loan documents. |
| (3) | Monthly replacement reserve escrows are waived so long as no event of default has occurred and is continuing and the borrower is properly maintaining the Boca Industrial Park Property. |
| (4) | Monthly TI/LC escrows are waived so long as no event of default has occurred and is continuing and the Deposit Waiving Requirements have been satisfied. See “Escrows” below for a description of the Deposit Waiving Requirements. |
The Mortgage Loan. The mortgage loan (the “Boca Industrial Park Mortgage Loan”) is evidenced by a single promissory note that is secured by a first mortgage encumbering an industrial facility located in Boca Raton, Florida (the “Boca Industrial Park Property”). The Boca Industrial Park Mortgage Loan was originated on July 5, 2011 by Wells Fargo Bank, National Association. The Boca Industrial Park Mortgage Loan had an original principal balance of $22,250,000, has an outstanding principal balance as of the Cut-off Date of $22,250,000 and accrues interest at an interest rate of 5.080% per annum. The Boca Industrial Park Mortgage Loan had an initial term of 120 months, has a remaining term of 112 months as of the Cut-off Date, and requires interest-only payments for the first 60 payments following origination and thereafter requires payments of interest and principal based on a 30-year amortization schedule thereafter. The Boca Industrial Park Mortgage Loan matures on August 1, 2021. The proceeds from the Boca Industrial Park Mortgage Loan were used to refinance existing debt on the Boca Industrial Park Property of approximately $17.8 million securitized in GMACC 2002-C1, fund closing and other costs of approximately $259,000, and return approximately $4.2 million of equity to the sponsors.
Following the lockout period, the borrower has the right to defease the Boca Industrial Park Mortgage Loan in whole, but not in part, on any due date before the scheduled maturity date. In addition, the Boca Industrial Park Mortgage Loan is prepayable without penalty on or after May 1, 2021.
The Property. The Boca Industrial Park Property is a 386,846 square foot industrial flex facility located in Boca Raton, Florida. The improvements consist of six one-story buildings constructed in 1984. The net rentable area at the Boca Industrial Park Property
THE INFORMATION IN THIS STRUCTURAL AND COLLATERAL TERM SHEET IS NOT COMPLETE AND MAY BE AMENDED PRIOR TO THE TIME OF SALE. THIS TERM SHEET IS NOT AN OFFER TO SELL THESE SECURITIES AND IT IS NOT A SOLICITATION OF AN OFFER TO BUY THESE SECURITIES IN ANY JURISDICTION WHERE THE OFFER OR SALE IS NOT PERMITTED.
68
BOCA INDUSTRIAL PARK
includes 306,156 square feet (79.1% of the net rentable area) of warehouse space and 80,690 square feet (20.9% of the net rentable area) of office space. The warehouse space has clear heights of 22 to 24 feet, 40 dock-high loading entrances and 30 drive-in loading entrances. As of December 8, 2011, the Boca Industrial Park Property was 91.9% leased to 36 tenants.
The following table presents certain information relating to the tenancies at the Boca Industrial Park Property:
Major Tenants
Tenant Name | Credit Rating (Fitch/ Moody’s/ S&P)(1) | Tenant NRSF | % of NRSF | Annual U/W Base Rent PSF | Annual U/W Base Rent | % of Total Annual U/W Base Rent | Lease Expiration Date | |||||||||||||||||||
Major Tenants – Collateral | ||||||||||||||||||||||||||
Relli Technologies, Inc.(2) | NR/NR/NR | 30,000 | 7.8% | $8.97 | $269,100 | 9.5 | % | 8/31/2015 | ||||||||||||||||||
Merit Systems, Inc | NR/NR/NR | 22,890 | 5.9% | $11.25 | $257,416 | 9.1 | % | 9/30/2013 | ||||||||||||||||||
Norbar Fabrics, Co. | NR/NR/NR | 35,000 | 9.0% | $5.73 | $200,550 | 7.1 | % | 11/30/2013 | ||||||||||||||||||
Distinctive Kitchens and Baths, Inc | NR/NR/NR | 26,690 | 6.9% | $6.87 | $183,485 | 6.5 | % | 10/31/2013 | ||||||||||||||||||
Quality Systems | NR/NR/NR | 11,600 | 3.0% | $11.50 | $133,400 | 4.7 | % | 4/30/2016 | ||||||||||||||||||
|
|
|
|
|
|
|
| |||||||||||||||||||
Total Major Tenants – Collateral | 126,180 | 32.6% | $8.27 | $1,043,951 | 36.7 | % | ||||||||||||||||||||
Non-Major Tenants(3) – Collateral | 229,466 | 59.3% | $7.84 | $1,799,915 | 63.3 | % | ||||||||||||||||||||
|
|
|
|
|
|
|
| |||||||||||||||||||
Occupied Collateral Total | 355,646 | 91.9% | $8.00 | $2,843,866 | 100.0 | % | ||||||||||||||||||||
|
|
|
| |||||||||||||||||||||||
Vacant Space | 31,200 | 8.1% | ||||||||||||||||||||||||
|
|
|
| |||||||||||||||||||||||
Collateral Total | 386,846 | 100.0% | ||||||||||||||||||||||||
|
|
|
| |||||||||||||||||||||||
| (1) | Certain ratings are those of the parent company whether or not the parent guarantees the lease. |
| (2) | Relli Technologies, Inc. is entitled to terminate its lease at any time following August 31, 2011 if the tenant: (i) purchases a building comprising at least 30,000 square feet located in Palm Beach County and relocates its distribution operations to that building; (ii) provides at least 180 days written notice (including documentation evidencing the building purchase and relocation); (iii) pays a lease termination payment to the borrower; and (iv) reimburses the borrower for any unamortized TIs and LCs and the prorated cost of any HVAC repairs or replacements. |
| (3) | Pinar International, Inc., an existing tenant, executed a lease for an additional 5,445 square feet (1.4% of net rentable square feet) that commences May 1, 2012. Such space is considered occupied for purposes of the table, notwithstanding that the lease has not started and the tenant has not taken possession. |
The following table presents certain information relating to the lease rollover schedule at the Boca Industrial Park Property:
Lease Expiration Schedule(1)
Year Ending December 31, | No. of Leases Expiring(2) | Expiring NRSF | % of Total NRSF | Cumulative of Total NRSF | Cumulative % of Total NRSF | Annual U/W Base Rent | Annual U/W Base Rent PSF | |||||||||||||||||||
MTM | 0 | 0 | 0.0% | 0 | 0.0 | % | $0 | $0.00 | ||||||||||||||||||
2012 | 10 | 66,451 | 17.2% | 66,451 | 17.2 | % | $564,660 | $8.50 | ||||||||||||||||||
2013 | 11 | 124,599 | 32.2% | 191,050 | 49.4 | % | $942,819 | $7.57 | ||||||||||||||||||
2014 | 5 | 42,998 | 11.1% | 234,048 | 60.5 | % | $291,295 | $6.77 | ||||||||||||||||||
2015 | 5 | 59,000 | 15.3% | 293,048 | 75.8 | % | $451,568 | $7.65 | ||||||||||||||||||
2016 | 4 | 33,690 | 8.7% | 326,738 | 84.5 | % | $308,702 | $9.16 | ||||||||||||||||||
2017 | 1 | 11,863 | 3.1% | 338,601 | 87.5 | % | $96,921 | $8.17 | ||||||||||||||||||
2018 | 1 | 5,800 | 1.5% | 344,401 | 89.0 | % | $67,918 | $11.71 | ||||||||||||||||||
2019 | 0 | 0 | 0.0% | 344,401 | 89.0 | % | $0 | $0.00 | ||||||||||||||||||
2020 | 0 | 0 | 0.0% | 344,401 | 89.0 | % | $0 | $0.00 | ||||||||||||||||||
2021 | 0 | 0 | 0.0% | 344,401 | 89.0 | % | $0 | $0.00 | ||||||||||||||||||
2022(3) | 2 | 11,245 | 2.9% | 355,646 | 91.9 | % | $119,984 | $10.67 | ||||||||||||||||||
Thereafter | 0 | 0 | 0.0% | 355,646 | 91.9 | % | $0 | $0.00 | ||||||||||||||||||
Vacant | 31,200 | 8.1% | 386,846 | 100.0 | % | $0 | $0.00 | |||||||||||||||||||
|
|
|
|
|
|
|
|
| ||||||||||||||||||
Total / Weighted Average | 39 | 386,846 | 100.0% | $2,843,866 | $8.00 | |||||||||||||||||||||
|
|
|
|
|
|
|
|
| ||||||||||||||||||
| (1) | Source: Information obtained from underwritten rent roll. |
| (2) | Certain tenants may have lease termination options that are exercisable prior to the originally stated expiration date of the subject lease and that are not considered in the Lease Expiration Schedule. |
| (3) | Pinar International, Inc., an existing tenant, executed a lease for an additional 5,445 square feet (1.4% of net rentable square feet) that commences May 1, 2012. Such space is considered occupied for purposes of the table, notwithstanding that the lease has not started and the tenant has not taken possession. |
THE INFORMATION IN THIS STRUCTURAL AND COLLATERAL TERM SHEET IS NOT COMPLETE AND MAY BE AMENDED PRIOR TO THE TIME OF SALE. THIS TERM SHEET IS NOT AN OFFER TO SELL THESE SECURITIES AND IT IS NOT A SOLICITATION OF AN OFFER TO BUY THESE SECURITIES IN ANY JURISDICTION WHERE THE OFFER OR SALE IS NOT PERMITTED.
69
BOCA INDUSTRIAL PARK
The following table presents historical occupancy percentages at the Boca Industrial Park Property:
Historical Occupancy Percentages*
12/31/2008 | 12/31/2009 | 12/31/2010 | ||
| 99% | 94% | 95% |
| * | Source: Information provided by the borrower. |
Operating History and Underwritten Net Cash Flow. The following table presents certain information relating to the historical operating performance and the Underwritten Net Cash Flow at the Boca Industrial Park Property:
Cash Flow Analysis
| 2009 | 2010 | TTM 11/30/2011 | U/W | U/W $ per SF | ||||||||||||||||
Base Rent | $2,503,348 | $2,499,105 | $2,707,056 | $2,843,866 | $7.35 | |||||||||||||||
Grossed Up Vacant Space | 0 | 0 | 0 | 339,486 | 0.88 | |||||||||||||||
Total Reimbursables | 1,850,630 | 1,561,400 | 1,191,456 | 1,045,036 | 2.70 | |||||||||||||||
Other Income(1) | 126,821 | 163,566 | 52,494 | 98,666 | 0.26 | |||||||||||||||
Less Vacancy & Credit Loss | (91,880 | ) | (201,256 | ) | (112,471 | ) | (461,455 | ) | (1.19) | |||||||||||
|
|
|
|
|
|
|
|
|
| |||||||||||
Effective Gross Income | $4,388,919 | $4,022,815 | $3,838,535 | $3,865,598 | $9.99 | |||||||||||||||
Total Operating Expenses | $1,283,914 | $1,273,581 | $1,265,296 | $1,309,921 | $3.39 | |||||||||||||||
|
|
|
|
|
|
|
|
|
| |||||||||||
Net Operating Income | $3,105,005 | $2,749,235 | $2,573,239 | $2,555,677 | $6.61 | |||||||||||||||
TI/LC | 177,184 | 114,300 | 0 | 154,819 | 0.40 | |||||||||||||||
Capital Expenditures | 0 | 0 | 0 | 108,249 | 0.28 | |||||||||||||||
|
|
|
|
|
|
|
|
|
| |||||||||||
Net Cash Flow | $2,927,821 | $2,634,935 | $2,573,239 | $2,292,609 | $5.93 | |||||||||||||||
NOI DSCR | 2.15x | 1.90x | 1.78x | 1.77x | ||||||||||||||||
NCF DSCR | 2.02x | 1.82x | 1.78x | 1.59x | ||||||||||||||||
NOI DY | 14.0 | % | 12.4 | % | 11.6 | % | 11.5 | % | ||||||||||||
NCF DY | 13.2 | % | 11.8 | % | 11.6 | % | 10.3 | % | ||||||||||||
| (1) | Other income consists of move out and late fees and FPL and legal reimbursements. |
Appraisal. According to the appraisal dated May 18, 2011, the Boca Industrial Park Property had an “as-is” appraised value of $36,900,000.
Environmental Matters. The Phase I environmental site assessment (“ESA”) dated May 31, 2011 identified an environmental issue in connection with waste oil drums in a tenant space. The ESA noted no evidence of spills or leakage and no further investigation was required; however, the ESA recommended the use of secondary containment for the waste oil drums to minimize the potential for impact in the event of a spill or leak. See “Risk Factors – Environmental Condition of the Mortgaged Properties May Subject the Trust to Fund to Liability under Federal and State Laws, Reducing the Value and Cash Flow of the Mortgaged Properties Which May Result in Reduced Distributions On Your Offered Certificates” in the Free Writing Prospectus for further detail.
Market Overview and Competition. The Boca Industrial Park Property is located in Boca Raton, Florida, and, according to a year-end 2011 third party market research report, is within the Boca Raton East submarket within Palm Beach County. Access to Interstate 95 and the Florida Turnpike are located within two and six miles, respectively, of the Boca Industrial Park Property. As of December 31, 2011, the inventory of industrial flex buildings in the Boca Raton East submarket is stable at approximately 3.5 million square feet of rentable building area, with an overall occupancy of 93.4% and average rent per square foot of $10.97 triple-net. According to the appraisal, the population as of 2010 within a five mile radius of the Boca Industrial Park Property is 173,262, representing annual growth of 0.41% from 2000 to 2010.
Competitive Set(1)
| Boca Industrial Park (Subject) | Weston Center (A-D) | Weston Center (E-F) | Palmetto Distribution Center | Sawgrass International Corporate Park | ||||||
Distance from Subject | — | 39 miles | 39 miles | 52 miles | 34 miles | |||||
Property Type | Industrial Flex | Industrial Flex | Industrial Flex | Industrial Flex | Industrial | |||||
Year Built / Renovated | 1984/NAP | 1998/NAP | 1998/NAP | 1992/NAP | 1987/NAP | |||||
Clear Heights | 22’ – 24’ | 24’ – 30’ | 24’ – 30’ | 24’ – 26’ | 20’ – 24’ | |||||
% Office | 20.9% | 18.5% | 26.4% | 10.4% | 5.0% | |||||
Total GLA | 386,846 SF | 679,918 SF | 396,090 SF | 880,443 SF | 401,650 SF | |||||
Total Occupancy | 92% | 100% | 100% | 95% | 92% |
| (1) | Source: Information obtained from appraisal dated May 18, 2011. |
THE INFORMATION IN THIS STRUCTURAL AND COLLATERAL TERM SHEET IS NOT COMPLETE AND MAY BE AMENDED PRIOR TO THE TIME OF SALE. THIS TERM SHEET IS NOT AN OFFER TO SELL THESE SECURITIES AND IT IS NOT A SOLICITATION OF AN OFFER TO BUY THESE SECURITIES IN ANY JURISDICTION WHERE THE OFFER OR SALE IS NOT PERMITTED.
70
BOCA INDUSTRIAL PARK
The Borrower. The borrower is Boca Industrial Park, LTD., a Florida limited partnership and a single-purpose entity with an independent director. Legal counsel to the borrower delivered a non-consolidation opinion in connection with the origination of the Boca Industrial Park Mortgage Loan. The borrower is owned by Tilmar Hansen (50%) and Jamie A. Danburg (49%). The general partner of the borrower, Boca Industrial, Inc., a Delaware corporation, owns a 1% interest in the borrower and is 100% owned by Jamie A. Danburg. Jamie A. Danburg and Tilmar Hansen are the guarantors of certain nonrecourse carveouts under the Boca Industrial Park Mortgage Loan.
The Sponsors. The sponsors of the Boca Industrial Park Mortgage Loan are Tilmar Hansen and Jamie A. Danburg. Both sponsors are managing members of Danburg Hansen LLC, which wholly owns Danburg Management Corporation. Danburg Management Corporation owns and manages approximately one million square feet of office and warehouse space in Palm Beach County.
Escrows. The loan documents waive monthly escrows of real estate taxes provided the following conditions are met: (i) no event of default has occurred and is continuing and (ii) borrower delivers to lender evidence of timely payment of taxes not less than ten days prior to the delinquency of such payments. The loan documents waive monthly escrows of insurance for so long as the following conditions are satisfied: (i) no event of default has occurred and is continuing; (ii) the liability and casualty policies covering the property are part of a blanket or umbrella policy approved by lender; and (iii) the borrower provides the lender with evidence of renewal of such policy and receipts for the payment of insurance premiums in accordance with the loan documents. In addition, the loan documents waive monthly escrows for capital expenditures so long as no event of default has occurred and is continuing and the borrower is properly maintaining the Boca Industrial Park Property. Finally, the loan documents waive monthly escrows for future tenant improvements and leasing commissions so long as no event of default has occurred and is continuing and the borrower satisfies the Deposit Waiving Requirements (as defined below).
The “Deposit Waiving Requirements” shall mean that the borrower maintains a balance in its operating account of not less than $500,000 at all times, provided, however, that the borrower may use up to $225,000 of that balance for tenant improvement and leasing commission costs related to the Boca Industrial Park Mortgage Property so long as: (i) the balance of the operating account at no time falls below $275,000 and (ii) at any time when the amount in the operating account is less than $500,000, the borrower replenishes the operating balance by no less than $25,000 per month.
Lockbox and Cash Management. None.
Property Management. The Boca Industrial Park Property is managed by Danburg Management Corporation, an affiliate to the borrower. The property manager is entitled to a management fee equal to 3% of effective gross income collected from the Boca Industrial Park Property. The borrower may not amend, surrender, terminate or cancel the management agreement or otherwise replace or enter into any other management agreement without prior written consent from the lender (which consent may not be unreasonably withheld).
Assumption. The Boca Industrial Park Mortgage Loan has a two-time right to transfer the Boca Industrial Park Property and cause an assumption of the loan, provided that no event of default has occurred and is continuing under the Boca Industrial Park Mortgage Loan and certain other conditions are satisfied, including that: (i) the borrower pays an assumption fee of 1.0% of the outstanding principal balance of the Boca Industrial Park Mortgage Loan; (ii) and the transferee satisfies certain criteria; (iii) transferee assumes the obligations of the borrower under the management agreement or enters into a new management agreement with a manager satisfies certain criteria; (iv) the lender receives confirmation from Fitch, Moody’s and KBRA that the transfer will not result in a downgrade, withdrawal or qualification of the respective ratings assigned to the Series 2012-C6 Certificates; and (v) other factors relied upon by lender in the original underwriting of the Boca Industrial Park Mortgage Loan.
Release. Not permitted.
Real Estate Substitution. Not permitted.
Subordinate and Mezzanine Indebtedness. Not permitted.
Ground Lease. None.
Terrorism Insurance. The mortgage loan documents require the borrower to maintain an “all risk” insurance policy, with no exclusion for terrorism, in an amount equal to the full replacement cost of the Boca Industrial Park Property, as well as business interruption insurance covering no less than the 12-month period following the occurrence of a casualty event together with a 12- month extended period of indemnity. If coverage for terrorism is excluded under such policy or under the general liability and excess liability/umbrella policy, the borrower must obtain stand-alone coverage for terrorism, provided that such coverage is available.
THE INFORMATION IN THIS STRUCTURAL AND COLLATERAL TERM SHEET IS NOT COMPLETE AND MAY BE AMENDED PRIOR TO THE TIME OF SALE. THIS TERM SHEET IS NOT AN OFFER TO SELL THESE SECURITIES AND IT IS NOT A SOLICITATION OF AN OFFER TO BUY THESE SECURITIES IN ANY JURISDICTION WHERE THE OFFER OR SALE IS NOT PERMITTED.
71
LEXINGTON HOTEL PORTFOLIO

THE INFORMATION IN THIS STRUCTURAL AND COLLATERAL TERM SHEET IS NOT COMPLETE AND MAY BE AMENDED PRIOR TO THE TIME OF SALE. THIS TERM SHEET IS NOT AN OFFER TO SELL THESE SECURITIES AND IT IS NOT A SOLICITATION OF AN OFFER TO BUY THESE SECURITIES IN ANY JURISDICTION WHERE THE OFFER OR SALE IS NOT PERMITTED.
72
LEXINGTON HOTEL PORTFOLIO

THE INFORMATION IN THIS STRUCTURAL AND COLLATERAL TERM SHEET IS NOT COMPLETE AND MAY BE AMENDED PRIOR TO THE TIME OF SALE. THIS TERM SHEET IS NOT AN OFFER TO SELL THESE SECURITIES AND IT IS NOT A SOLICITATION OF AN OFFER TO BUY THESE SECURITIES IN ANY JURISDICTION WHERE THE OFFER OR SALE IS NOT PERMITTED.
73
Lexington Hotel Portfolio
Loan Information
Mortgage Loan Seller: | The Royal Bank of Scotland | |
Credit Assessment (Fitch/Moody’s/KBRA): | NAP | |
Original Principal Balance: | $20,500,000 | |
Cut-off Date Principal Balance: | $20,473,784 | |
% of Initial Pool Balance: | 2.2% | |
Loan Purpose: | Refinance | |
Borrower Names: | WC III, LLC; WC IV, LLC | |
Sponsor: | R. Todd Smith | |
Mortgage Rate: | 5.990% | |
Note Date: | February 24, 2012 | |
Anticipated Repayment Date: | NAP | |
Maturity Date: | March 1, 2022 | |
IO Period: | None | |
Loan Term (Original): | 120 months | |
Seasoning: | 1 month | |
Amortization Term (Original): | 300 months | |
Loan Amortization Type: | Amortizing Balloon | |
Interest Accrual Method: | Actual/360 | |
Call Protection: | L(25),D(91),O(4) | |
Lockbox Type: | Hard/Upfront Cash Management | |
Additional Debt: | None | |
Additional Debt Type: | NAP | |
Escrows and Reserves:
Type: | Initial | Monthly | Cap (If Any) | |||
Taxes | $133,455 | $16,682 | NAP | |||
Insurance | $38,500 | $3,500 | NAP | |||
FF&E Reserve(1) | $23,295 | $23,295 | NAP | |||
Seasonality Reserve(2) | $44,173 | $11,043 | NAP |
Property Information
Single Asset/Portfolio: | Portfolio | |
Property Type: | Hospitality | |
Specific Property Type: | Limited Service Extended Stay | |
Location: | West Chester, OH | |
Size: | 226 rooms | |
Cut-off Principal Balance Per Unit/SF: | $90,591.96 | |
Year Built/Renovated: | Various/Various | |
Occupancy %: | 76.6% | |
Occupancy % Source Date: | December 31, 2011 | |
Title Vesting: | Fee | |
Property Manager: | Lexington Management Corp. | |
3rd Most Recent NOI (As of): | $2,106,476(12/31/2009) | |
2nd Most Recent NOI (As of): | $2,144,373(12/31/2010) | |
Most Recent NOI (As of): | $2,665,407(12/31/2011) | |
U/W Revenues: | $7,241,405 | |
U/W Expenses: | $4,445,987 | |
U/W NOI: | $2,795,417 | |
U/W NCF: | $2,505,761 | |
U/W NOI DSCR: | 1.77x | |
U/W NCF DSCR: | 1.58x | |
U/W NOI Debt Yield: | 13.7% | |
U/W NCF Debt Yield: | 12.2% | |
As-Is Appraised Value: | $33,900,000 | |
As-Is Appraisal Valuation Date: | November 17, 2011 | |
Cut-off Date LTV Ratio: | 60.4% | |
LTV Ratio at Maturity or ARD: | 46.8% | |
| (1) | Monthly payments of one-twelfth of 4% of the preceding annual gross revenue (initially $23,295). See “Escrows” below. |
| (2) | Monthly payments (initially $11,043) will be required commencing April 1, 2012 such that the amount on reserve is required to be $132,518 by December 1, 2012. Thereafter, the borrower will, on a monthly basis commencing in February of each year, maintain a minimum balance on reserve equal to 110% of the cumulative monthly shortfalls for the prior 12-month period. |
The Mortgage Loan. The mortgage loan (the “Lexington Hotel Portfolio Mortgage Loan”) is evidenced by a single promissory note that is secured by a first mortgage encumbering one limited service hotel and one extended stay hotel located in West Chester, Ohio (the “Lexington Hotel Portfolio Properties”). The Lexington Hotel Portfolio Mortgage Loan was originated on February 24, 2012 by The Royal Bank of Scotland. The Lexington Hotel Portfolio Mortgage Loan had an original principal balance of $20,500,000, has an outstanding principal balance as of the Cut-off Date of $20,473,784 and accrues interest at an interest rate of 5.990%per annum. The Lexington Hotel Portfolio Mortgage Loan had an initial term of 120 months, has a remaining term of 119 months as of the Cut-off Date and requires payments of interest and principal based on a 25-year amortization schedule. The Lexington Hotel Portfolio Mortgage Loan matures on March 1, 2022. The proceeds from the Lexington Hotel Portfolio Mortgage Loan were used to refinance existing debt on the Lexington Hotel Portfolio Properties of approximately $20.0 million, pay closing costs of approximately $509,000, and fund approximately $239,000 in upfront reserves.
Following the lockout period, the borrower has the right to defease the Lexington Hotel Portfolio Mortgage Loan in whole, or in part (see partial defeasance provisions in “Release” below), on any due date before the scheduled maturity date. In addition, the Lexington Hotel Portfolio Mortgage Loan is prepayable without penalty on or after December 1, 2021.
The Properties. The Lexington Hotel Portfolio Mortgage Loan is secured by a fee interest in one limited service hotel and one extended stay hotel in West Chester, Ohio totaling 226 rooms. The Courtyard Cincinnati North at Union Centre is a 126-room, limited service hotel located in West Chester, Butler County, Ohio. The hotel is located in downtown West Chester at the intersection of West Chester Road and Muhlhauser Road, a quarter of a mile west of I-75. The sponsor developed the five-story hotel, which opened in June 2007. In 2011, the hotel’s lobby and dining areas were renovated to incorporate the most current
THE INFORMATION IN THIS STRUCTURAL AND COLLATERAL TERM SHEET IS NOT COMPLETE AND MAY BE AMENDED PRIOR TO THE TIME OF SALE. THIS TERM SHEET IS NOT AN OFFER TO SELL THESE SECURITIES AND IT IS NOT A SOLICITATION OF AN OFFER TO BUY THESE SECURITIES IN ANY JURISDICTION WHERE THE OFFER OR SALE IS NOT PERMITTED.
74
LEXINGTON HOTEL PORTFOLIO
Courtyard Cincinnati North at Union Centre lobby and The Bistro design concepts. The renovation also included the hotel’s meeting space and fitness center. Amenities include a 24-hour business center, indoor swimming pool, fitness facility, breakfast dining area (The Bistro), 900 square feet of meeting space, guest laundry room and market pantry. The Courtyard Cincinnati North at Union Centre franchise agreement expires in 2034.
The Residence Inn West Chester is a 100-room, extended stay hotel located in West Chester, Butler County, Ohio. The hotel is located in downtown West Chester near the intersection of West Chester Road and Muhlhauser Road, a quarter of a mile west of I- 75. The sponsor developed the five-story hotel, which opened in November 2008. Amenities include an indoor swimming pool, fitness facility, 1,600 square feet of meeting space, lobby workstation, breakfast dining area, guest laundry room and market pantry. The Residence Inn West Chester franchise agreement expires in 2028.
The following table presents certain information relating to the Lexington Hotel Portfolio Properties:
Property Name | Allocated Cut-off Date Principal Balance | % of Portfolio Cut-off Date Principal Balance | Rooms | Loan/ Room | Year Built/ Renovated | Appraised Value | ||||||||||||||||||
Courtyard Cincinnati North at Union | ||||||||||||||||||||||||
Centre | $ | 11,884,782 | 58.0 | % | 126 | $ | 94,324 | 2007/2011 | $18,800,000 | |||||||||||||||
Residence Inn West Chester | $ | 8,589,002 | 42.0 | % | 100 | $ | 85,290 | 2008/NAP | $15,100,000 | |||||||||||||||
|
|
|
|
|
|
|
|
|
| |||||||||||||||
Total/Weighted Average | $ | 20,473,784 | 100.0 | % | 226 | $ | 90,592 | $33,900,000 | ||||||||||||||||
|
|
|
|
|
|
|
|
|
| |||||||||||||||
Operating History and Underwritten Net Cash Flow. The following table presents certain information relating to the historical
operating performance and the Underwritten Net Cash Flow at the Lexington Hotel Portfolio Properties:
Cash Flow Analysis(1)
| 2009 | 2010 | 2011 | U/W(1) | U/W $ per Room | ||||||||||||||||
Occupancy | 70.1% | 73.8% | 76.6% | 76.6% | ||||||||||||||||
ADR | $105.72 | $104.84 | $108.98 | $108.95 | ||||||||||||||||
RevPAR | $74.14 | $77.39 | $83.49 | $83.46 | ||||||||||||||||
Total Revenue | $6,419,487 | $6,707,054 | $7,243,372 | $7,241,405 | $32,042 | |||||||||||||||
Total Department Expenses | 1,706,886 | 1,668,438 | 1,767,137 | 1,767,137 | 7,819 | |||||||||||||||
|
|
|
|
|
|
|
|
|
| |||||||||||
Gross Operating Profit | $4,712,601 | $5,038,616 | $5,476,235 | $5,474,268 | $24,222 | |||||||||||||||
Total Undistributed Expenses | 2,051,961 | 2,437,730 | 2,302,566 | 2,236,485 | 9,896 | |||||||||||||||
|
|
|
|
|
|
|
|
|
| |||||||||||
Profit Before Fixed Charges | $2,660,640 | $2,600,886 | $3,173,669 | $3,237,783 | $14,326 | |||||||||||||||
Total Fixed Charges | 554,164 | 456,513 | 508,262 | 442,366 | 1,957 | |||||||||||||||
|
|
|
|
|
|
|
|
|
| |||||||||||
Net Operating Income | $2,106,476 | $2,144,373 | $2,665,407 | $2,795,417 | $12,369 | |||||||||||||||
FF&E | 0 | 0 | 0 | 289,656 | 1,282 | �� | ||||||||||||||
|
|
|
|
|
|
|
|
|
| |||||||||||
Net Cash Flow | $2,106,476 | $2,144,373 | $2,665,407 | $2,505,761 | $11,087 | |||||||||||||||
NOI DSCR | 1.33x | 1.35x | 1.68x | 1.77x | ||||||||||||||||
NCF DSCR | 1.33x | 1.35x | 1.68x | 1.58x | ||||||||||||||||
NOI DY | 10.3% | 10.5% | 13.0% | 13.7% | ||||||||||||||||
NCF DY | 10.3% | 10.5% | 13.0% | 12.2% | ||||||||||||||||
| (1) | The U/W NOI is higher than historical NOIs due to several factors including but not limited to underwriting actual 2011 real estate taxes and a 4.0% management fee. |
Appraisal. According to the related appraisals, the Lexington Hotel Portfolio Properties had an aggregate “as-is” appraised value of $33,900,000 as of the appraisal effective date of November 17, 2011.
Environmental Matters. According to the Phase I environmental site assessments dated November 28, 2011, there was no evidence of any recognized environmental conditions.
Market Overview and Competition. The Lexington Hotel Portfolio Properties are located in West Chester, Ohio. Per the appraisal, West Chester has become a major employment center with over 3,000 businesses and over 50,000 employees. According to the appraisal, three of the ten largest regional industrial parks are located in West Chester, as is a regional medical campus with a full-service hospital. Specific employers in West Chester include the Kroger Company, University of Cincinnati, Procter & Gamble, General Electric and Liberty Mutual Group. The Lexington Hotel Portfolio Properties are located approximately 32 miles northeast of the Cincinnati/Northern Kentucky International Airport and 42 miles south of the Dayton International Airport.
THE INFORMATION IN THIS STRUCTURAL AND COLLATERAL TERM SHEET IS NOT COMPLETE AND MAY BE AMENDED PRIOR TO THE TIME OF SALE. THIS TERM SHEET IS NOT AN OFFER TO SELL THESE SECURITIES AND IT IS NOT A SOLICITATION OF AN OFFER TO BUY THESE SECURITIES IN ANY JURISDICTION WHERE THE OFFER OR SALE IS NOT PERMITTED.
75
LEXINGTON HOTEL PORTFOLIO
According to a hospitality industry report, the Courtyard Cincinnati North at Union Centre and the Residence Inn West Chester are located within the Cincinnati lodging market. As of December 2011, the Cincinnati area lodging market contained a total of 252 hotels with an inventory of 27,939 rooms. The Cincinnati market’s trailing 12-month period through December 2011 had an aggregate occupancy level of 55.6% with an ADR of $84.71, reflecting a RevPAR of $47.11, up 8.4% over the previous corresponding trailing 12-month period. Gains in occupancy of 5.1% were coupled with a 3.2% increase in ADR.
The following table presents certain information relating to the Courtyard Cincinnati North at Union Centre’s competitive set:
Subject and Market Historical Occupancy, ADR and RevPAR (Courtyard Cincinnati North at Union Centre)
| Competitive Set | Courtyard Cincinnati North at Union Centre(1)(2) | Penetration Factor | ||||||||||||||||
| Year | Occupancy | ADR | RevPAR | Occupancy | ADR | RevPAR | Occupancy | ADR | RevPAR | |||||||||
12/31/2011 TTM | 68.1% | $90.45 | $61.57 | 69.6% | $117.33 | $81.64 | 102.2% | 129.7% | 132.6% | |||||||||
12/31/2010 TTM | 65.5% | $89.33 | $58.56 | 66.6% | $113.66 | $75.66 | 101.6% | 127.2% | 129.2% | |||||||||
12/31/2009 TTM | 62.1% | $89.33 | $55.50 | 63.7% | $114.25 | $72.81 | 102.6% | 127.9% | 131.2% | |||||||||
| (1) | Data provided by a December 31, 2011 hospitality report. |
| (2) | Courtyard Cincinnati North at Union Centre opened in June 2007. |
The following table presents certain information relating to the Residence Inn West Chester’s competitive set:
Subject and Market Historical Occupancy, ADR and RevPAR (Residence Inn West Chester)
| Competitive Set | Residence Inn West Chester(1)(2) | Penetration Factor | ||||||||||||||||
| Year | Occupancy | ADR | RevPAR | Occupancy | ADR | RevPAR | Occupancy | ADR | RevPAR | |||||||||
12/31/2011 TTM | 69.3% | $92.11 | $63.83 | 84.4% | $102.14 | $86.23 | 121.8% | 110.9% | 135.1% | |||||||||
12/31/2010 TTM | 66.5% | $91.66 | $60.93 | 81.7% | $97.97 | $80.00 | 122.8% | 106.9% | 131.3% | |||||||||
12/31/2009 TTM | 64.1% | $91.64 | $58.71 | 77.2% | $98.94 | $76.36 | 120.5% | 108.0% | 130.1% | |||||||||
| (1) | Data provided by a December 31, 2011 hospitality report. |
| (2) | Residence Inn West Chester opened in November 2008. |
The Borrower. The borrower is comprised of two Delaware limited liability companies, each of which is a single purpose entity and has one independent director (collectively, the “Lexington Hotel Portfolio Borrower”). Legal counsel to the Lexington Hotel Portfolio Borrower delivered a non-consolidation opinion in connection with the origination of the Lexington Hotel Portfolio Mortgage Loan. R. Todd Smith is the guarantor of certain nonrecourse carveouts under the Lexington Hotel Portfolio Mortgage Loan.
The Sponsor. The Lexington Hotel Portfolio Borrower is controlled by R. Todd Smith. R. Todd Smith, owner of Lexington Management Corp., has over 15 years of experience in the hospitality construction, development and management. R. Todd Smith’s current portfolio consists of four limited service hotels located in West Chester, Ohio comprising over 418 rooms. Lexington Management Corp. is a fully integrated owner, developer and manager of premium branded hotels. The company’s hospitality relationships include Marriott International, Inc., Hilton Hotels Corporation, Intercontinental Hotels Group, and Choice Hotels International.
Escrows. The loan documents provide for upfront escrows at closing in the amount of $133,455 for real estate taxes, $38,500 for insurance premiums, $23,295 for an FF&E reserve, and $44,173 for a seasonality reserve.
The loan documents provide for ongoing monthly escrows in the amount of $16,682 for real estate taxes (subject to adjustment per lender’s estimate) and $3,500 for insurance premiums (subject to adjustment per lender’s estimate). The loan documents also provide for an ongoing FF&E reserve equal to one-twelfth of 4% of the preceding annual gross revenue (initially $23,295). Additionally, the loan documents provide for an ongoing seasonality reserve. Monthly payments (initially $11,043) will be required commencing April 1, 2012 such that the amount on reserve is required to be $132,518 by December 1, 2012. Thereafter, the borrower will, on a monthly basis commencing in February of each year, maintain a minimum balance on reserve equal to 110% of the cumulative monthly shortfalls for the prior 12-month period.
Lockbox and Cash Management. The Lexington Hotel Portfolio Mortgage Loan requires a lender-controlled lockbox account, which is already in place. The Lexington Hotel Portfolio Mortgage Loan requires all revenue and credit card receipts payable with respect to the Lexington Hotel Portfolio Properties to be deposited directly into the lockbox account. The loan documents also require that all revenues received by the borrower or property manager be deposited into the lockbox account within one business day, provided, however, that all cash received by the borrower or property manager is required to be deposited into the lockbox account on the seventh and twenty first day of each calendar month. All funds on deposit in the lockbox account are swept on a daily basis to a cash management account under the control of the lender.
A “Cash Trap Period” will commence upon: (i) the occurrence and continuance of an event of default or (ii) if, as of the last day of any calendar quarter during the Lexington Hotel Portfolio Mortgage Loan term, the debt service coverage ratio is less than 1.20x.
THE INFORMATION IN THIS STRUCTURAL AND COLLATERAL TERM SHEET IS NOT COMPLETE AND MAY BE AMENDED PRIOR TO THE TIME OF SALE. THIS TERM SHEET IS NOT AN OFFER TO SELL THESE SECURITIES AND IT IS NOT A SOLICITATION OF AN OFFER TO BUY THESE SECURITIES IN ANY JURISDICTION WHERE THE OFFER OR SALE IS NOT PERMITTED.
76
LEXINGTON HOTEL PORTFOLIO
Property Management. The Lexington Hotel Portfolio Properties are managed by Lexington Management Corp., an affiliate of the Lexington Hotel Portfolio Borrower, based on 10-year management agreements each dated January 8, 2009. According to the management agreements, the manager is entitled to a base management fee equal 5.0% of monthly gross revenues. The Lexington Hotel Portfolio Borrower may not surrender, terminate, cancel, extend or renew the management agreements or otherwise replace the manager or enter into any other management agreements without the prior written consent of the lender.
Assumption. The Lexington Hotel Portfolio Mortgage Loan has a one-time right to transfer the Lexington Hotel Portfolio Properties, with the consent of the lender, subject to customary conditions set forth in the loan documents, including but not limited to: (i) payment of an assumption fee of 1.00% of the outstanding principal balance of the Lexington Hotel Portfolio Mortgage Loan, (ii) no event of default has occurred and is continuing under the Lexington Hotel Portfolio Mortgage Loan, (iii) the Lexington Hotel Portfolio Borrower has submitted to the lender true, correct and complete copies of any and all information and documents requested, (iv) evidence satisfactory to the lender has been provided showing that the transferee borrower complies with the special purpose entity provisions, (v) the lender receives written confirmation from Fitch, Moody’s and KBRA that the assumption will not, in and of itself, result in a downgrade, qualification or withdrawal of the then current ratings assigned to any class of Series 2012-C6 Certificates, (vi) all of the lender’s reasonable costs and expenses have been paid in connection to the transfer, (vii) replacement guarantors and indemnitors have executed and delivered all documents required by the lender and in form and substance required by the lender, (viii) the identity, experience, financial condition and creditworthiness of the transferee borrower and the replacement guarantors and indemnitors are satisfactory to the lender, and (ix) the manager and proposed management agreement is satisfactory to the lender, Fitch, Moody’s and KBRA.
Release. Following the second anniversary of the issuance of the Series 2012-C6 Certificates, the Lexington Hotel Portfolio Borrower may obtain the release of an individual property from the lien of mortgage (and the related loan documents) in connection with a partial defeasance upon the satisfaction of certain conditions including without limitation: (i) Lexington Hotel Portfolio Borrower will provide lender a written request at least 30 days prior to the proposed release date, (ii) no event of default has occurred or is continuing at the time that the release occurs, (iii) the partial defeasance of the Lexington Hotel Portfolio Mortgage Loan in an amount equal to the greater of 100% of the gross proceeds of the sale and 125% of the allocated loan amount for the individual property to be released, (iv) the debt service coverage ratio of the remaining property must not be less than the greater of the debt service coverage ratio at closing (inclusive of such release parcel) and the debt service coverage ratio (inclusive of such release parcel) immediately prior to the release, (v) the loan to value ratio shall not be greater than the lesser of the loan to value ratio on the closing date and the loan to value ratio immediately prior to the release, and (vi) receipt of confirmation that the partial release will not result in any ratings of Series 2012-C6 Certificates being downgraded, qualified or withdrawn by Fitch, Moody’s and or KBRA.
Real Estate Substitution. Not permitted.
Subordinate and Mezzanine Indebtedness. Not permitted.
Ground Lease. None.
Terrorism Insurance. The loan documents require that the “all risk” insurance policy maintained by the Lexington Hotel Portfolio Borrower provide coverage for terrorism in an amount equal to the full replacement cost of the Lexington Hotel Portfolio Properties, as well as business interruption insurance covering no less than the 18-month period following the occurrence of a casualty event.
THE INFORMATION IN THIS STRUCTURAL AND COLLATERAL TERM SHEET IS NOT COMPLETE AND MAY BE AMENDED PRIOR TO THE TIME OF SALE. THIS TERM SHEET IS NOT AN OFFER TO SELL THESE SECURITIES AND IT IS NOT A SOLICITATION OF AN OFFER TO BUY THESE SECURITIES IN ANY JURISDICTION WHERE THE OFFER OR SALE IS NOT PERMITTED.
77
SEVEN TREES RETAIL PORTFOLIO
THE INFORMATION IN THIS STRUCTURAL AND COLLATERAL TERM SHEET IS NOT COMPLETE AND MAY BE AMENDED PRIOR TO THE TIME OF SALE. THIS TERM SHEET IS NOT AN OFFER TO SELL THESE SECURITIES AND IT IS NOT A SOLICITATION OF AN OFFER TO BUY THESE SECURITIES IN ANY JURISDICTION WHERE THE OFFER OR SALE IS NOT PERMITTED.
78
SEVEN TREES RETAIL PORTFOLIO
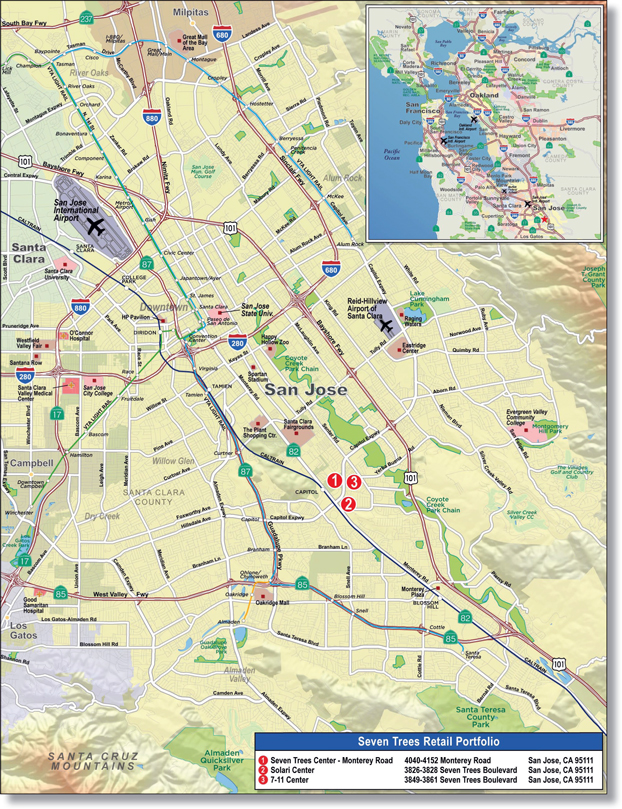
THE INFORMATION IN THIS STRUCTURAL AND COLLATERAL TERM SHEET IS NOT COMPLETE AND MAY BE AMENDED PRIOR TO THE TIME OF SALE. THIS TERM SHEET IS NOT AN OFFER TO SELL THESE SECURITIES AND IT IS NOT A SOLICITATION OF AN OFFER TO BUY THESE SECURITIES IN ANY JURISDICTION WHERE THE OFFER OR SALE IS NOT PERMITTED.
79
Seven Trees Retail Portfolio
Loan Information
Mortgage Loan Seller: | Liberty Island Group I LLC | |
Credit Assessment (Fitch/Moody’s/KBRA): | NAP | |
Original Principal Balance: | $20,000,000 | |
Cut-off Date Principal Balance: | $19,958,826 | |
% of Initial Pool Balance: | 2.2% | |
Loan Purpose: | Refinance | |
Borrower Name(1): | Gold Touch Investment SPE, LLC | |
Sponsors: | Albert J. Wang; Hung Nguy; Lai-Ching; Meei-Hwa Huang | |
Mortgage Rate: | 5.840% | |
Note Date: | January 11, 2012 | |
Anticipated Repayment Date: | NAP | |
Maturity Date: | February 1, 2022 | |
IO Period: | None | |
Loan Term (Original): | 120 months | |
Seasoning: | 2 months | |
Amortization Term (Original): | 360 months | |
Loan Amortization Type: | Amortizing Balloon | |
Interest Accrual Method: | Actual/360 | |
Call Protection: | L(48),D(68),O(4) | |
Lockbox Type: | Hard/Springing Cash Management | |
Additional Debt: | None | |
Additional Debt Type: | NAP | |
Escrows and Reserves:
Type: | Initial | Monthly | Cap (If Any) | |||
Taxes | $27,686 | $27,686 | NAP | |||
Insurance | $29,576 | $2,689 | NAP | |||
Replacement Reserves | $5,790 | $5,700 | NAP | |||
TI/LC | $19,000 | $19,000 | $300,000 | |||
Deferred Maintenance | $36,469 | $0 | NAP | |||
Environmental | $500,000 | $0 | NAP |
Property Information
Single Asset/Portfolio: | Portfolio | |
Property Type: | Retail | |
Specific Property Type: | Various | |
Location: | San Jose, CA | |
Size: | 156,085 SF | |
Cut-off Date Principal Balance Per Unit/SF: | $127.87 | |
Year Built/Renovated: | Various/Various | |
Occupancy %: | 92.5% | |
Occupancy % Source Date: | October 31, 2011 | |
Title Vesting: | Fee | |
Property Manager: | Altos Enterprises, Inc. | |
3rd Most Recent NOI (As of): | $2,729,119(12/31/2009) | |
2nd Most Recent NOI (As of): | $2,716,062(12/31/2010) | |
Most Recent NOI (As of): | $2,735,684 (Annualized YTD 8/31/2011) | |
U/W Revenues: | $3,620,837 | |
U/W Expenses: | $907,227 | |
U/W NOI: | $2,713,645 | |
U/W NCF: | $2,453,974 | |
U/W NOI DSCR: | 1.92x | |
U/W NCF DSCR: | 1.74x | |
U/W NOI Debt Yield: | 13.6% | |
U/W NCF Debt Yield: | 12.3% | |
As-Is Appraised Value: | $43,400,000 | |
As-Is Appraisal Valuation Date: | October 17, 2011 | |
Cut-off Date LTV Ratio: | 46.0% | |
LTV Ratio at Maturity or ARD: | 38.9% | |
| (1) | Borrower is an affiliate of the El Mercado Shopping Center borrower. |
The Mortgage Loan. The mortgage loan (“The Seven Trees Retail Portfolio Mortgage Loan”) is evidenced by a single promissory note secured by a first mortgage encumbering three retail centers (Seven Trees Center, 7-11 Center, and Solari Center) that are located in San Jose, California (collectively, the “Seven Trees Retail Portfolio Properties”). The Seven Trees Retail Portfolio Mortgage Loan was originated on January 11, 2012 by Prudential Mortgage Capital Company. The Seven Trees Retail Portfolio Mortgage Loan had an original principal balance of $20,000,000, has an outstanding principal balance as of the Cut-off Date of $19,958,826 and accrues interest at an interest rate of 5.840% per annum. The Seven Trees Retail Portfolio Mortgage Loan had an initial term of 120 months, has a remaining term of 118 months as of the Cut-off Date, and requires payments of interest and principal based on a 30-year amortization schedule. The Seven Trees Retail Portfolio Mortgage Loan matures on February 1, 2022. The proceeds from The Seven Trees Retail Portfolio Mortgage Loan were used to refinance existing debt on The Seven Trees Retail Portfolio Properties totaling $12.2 million, pay closing and other costs of approximately $228,394 and fund approximately $618,521 in upfront reserves, resulting in a return of equity to the sponsors of $6.6 million.
Following the lockout period, the borrower has the right to defease the Seven Trees Retail Portfolio Mortgage Loan in whole, but not in part, on any payment date before the scheduled maturity date. The Seven Trees Retail Portfolio Mortgage Loan is prepayable without penalty on or after November 1, 2021.
The Properties. The Seven Trees Retail Portfolio Properties is comprised of three separate retail centers with a total of 156,085 square feet located in San Jose, California. The buildings were developed in 1964 (Seven Trees Center), 1979 (7-11 Center), and 1999 (Solari Center). The Seven Trees Center is anchored by Marina Grocery, and as of October 31, 2011, the Seven Trees Retail Portfolio Properties were 92.5% occupied.
THE INFORMATION IN THIS STRUCTURAL AND COLLATERAL TERM SHEET IS NOT COMPLETE AND MAY BE AMENDED PRIOR TO THE TIME OF SALE. THIS TERM SHEET IS NOT AN OFFER TO SELL THESE SECURITIES AND IT IS NOT A SOLICITATION OF AN OFFER TO BUY THESE SECURITIES IN ANY JURISDICTION WHERE THE OFFER OR SALE IS NOT PERMITTED.
80
SEVEN TREES RETAIL PORTFOLIO
The three retail centers are Seven Trees Center (50 suites in six buildings anchored by Marina Foods, totaling 136,215 square feet),
7-11 Center (7 suites in two buildings totaling 8,515 square feet), and Solari Center (8 suites in two buildings totaling 11,355 square feet). The 7-11 Center and Solari Center are located across Seven Trees Boulevard from each other, while Seven Trees Center is located one-third mile south. The buildings are in average condition.
The following table presents certain information relating to the tenancies at the Seven Trees Retail Portfolio Properties:
Major Tenants
Tenant Name | Credit Rating (Fitch/ Moody’s/ S&P)(1) | Tenant NRSF | % of NRSF | Annual U/W Base Rent PSF | Annual U/W Base Rent | % of Total Annual U/W Base Rent | Sales PSF | Occupancy Cost | Lease Expiration Date | |||||||||||||||||||||||||||
Major Tenants | ||||||||||||||||||||||||||||||||||||
Marina Grocery(2) | NR/NR/NR | 27,300 | 17.5% | $10.99 | $300,000 | 9.6% | $ | 671(3) | 2.1%(4) | 9/30/2026 | ||||||||||||||||||||||||||
Bank of America | A/Baa1/A- | 9,280 | 5.9% | $25.29 | $234,732 | 7.5% | NAV | NAV | 4/09/2015 | |||||||||||||||||||||||||||
Grand Fortune Restaurant | NR/NR/NR | 8,340(5) | 5.3% | $21.57 | $179,880 | 5.7% | NAV | NAV | MTM(6) | |||||||||||||||||||||||||||
All Discount Grocery Store | NR/NR/NR | 6,396 | 4.1% | $20.64 | $132,000 | 4.2% | NAV | NAV | 11/30/2016 | |||||||||||||||||||||||||||
|
|
|
|
|
|
|
|
|
|
|
|
|
| |||||||||||||||||||||||
Occupied Collateral Total | 144,425 | 92.5% | $21.73 | $3,138,852 | 100.0% | |||||||||||||||||||||||||||||||
|
|
|
| |||||||||||||||||||||||||||||||||
Vacant Space | 11,660 | 7.5% | ||||||||||||||||||||||||||||||||||
|
|
|
| |||||||||||||||||||||||||||||||||
Collateral Total | 156,085 | 100.0% | ||||||||||||||||||||||||||||||||||
|
|
|
| |||||||||||||||||||||||||||||||||
| (1) | Certain ratings are those of the parent company whether or not the parent guarantees the lease. |
| (2) | Marina Grocery is an Asian and Hispanic grocer that has been at the site since 2001 and is a borrower-affiliated entity. |
| (3) | Sales per square foot are for the twelve months ended on December 31, 2010. |
| (4) | Occupancy costs are based on sales for the twelve months ended on December 31, 2010 and Marina Grocery’s total monthly rent due as of November 1, 2011. |
| (5) | A 6,820 square foot lease with Grand Fortune is month-to-month. A 1,520 square foot lease with Grand Fortune expires on December 31, 2013. |
| (6) | Month-to-month tenants are prevalent at the property and in the market. Forty-one tenants representing 77% of underwritten gross potential rent have been in occupancy for 5 years or more. |
The following table presents certain information relating to the lease rollover schedule at the Seven Trees Retail Portfolio Properties:
Lease Expiration Schedule(1)
Year Ending | No. of Leases Expiring(2) | Expiring NRSF | % of Total NRSF | Cumulative of Total NRSF | Cumulative % of Total NRSF | Annual U/W Base Rent | Annual U/W Base Rent PSF | |||||||||||||||||||||
MTM | 13 | 20,705 | 13.3%(3) | 20,705 | 13.3% | $463,998 | $22.41 | |||||||||||||||||||||
2012 | 2 | 2,690 | 1.7% | 23,395 | 15.0% | $65,438 | $24.33 | |||||||||||||||||||||
2013 | 8 | 15,488 | 9.9% | 38,883 | 24.9% | $439,933 | $28.40 | |||||||||||||||||||||
2014 | 13 | 20,424 | 13.1% | 59,307 | 38.0% | $530,178 | $25.96 | |||||||||||||||||||||
2015 | 8 | 24,850 | 15.9% | 84,157 | 53.9% | $601,500 | $24.21 | |||||||||||||||||||||
2016 | 10 | 23,018 | 14.7% | 107,175 | 68.7% | $477,021 | $20.72 | |||||||||||||||||||||
2017 | 0 | 0 | 0.0% | 107,175 | 68.7% | $0 | $0.00 | |||||||||||||||||||||
2018 | 3 | 6,000 | 3.8% | 113,175 | 72.5% | $183,132 | $30.52 | |||||||||||||||||||||
2019 | 0 | 0 | 0.0% | 113,175 | 72.5% | $0 | $0.00 | |||||||||||||||||||||
2020 | 1 | 1,250 | 0.8% | 114,425 | 73.3% | $22,104 | $17.68 | |||||||||||||||||||||
2021 | 1 | 2,700 | 1.7% | 117,125 | 75.0% | $55,548 | $20.57 | |||||||||||||||||||||
2022 | 0 | 0 | 0.0% | 117,125 | 75.0% | $0 | $0.00 | |||||||||||||||||||||
Thereafter | 1 | 27,300 | 17.5% | 144,425 | 92.5% | $300,000 | $10.99 | |||||||||||||||||||||
Vacant | 0 | 11,660 | 7.5% | 156,085 | 100.0% | $0 | $0.00 | |||||||||||||||||||||
|
|
|
|
|
|
|
|
|
| |||||||||||||||||||
Total/Weighted Average | 60 | 156,085 | 100.0 | % | $ | 3,138,852 | $21.73 | |||||||||||||||||||||
|
|
|
|
|
|
|
|
|
| |||||||||||||||||||
| (1) | Source: Information obtained from underwritten rent roll. |
| (2) | Certain tenants may have lease termination options that are exercisable prior to the originally stated expiration date of the subject lease and that are not considered in the Lease Expiration Schedule. |
| (3) | Month-to-month tenancy is prevalent in the market and at the property. All thirteen month-to-month tenants have been at the property for three or more years. |
THE INFORMATION IN THIS STRUCTURAL AND COLLATERAL TERM SHEET IS NOT COMPLETE AND MAY BE AMENDED PRIOR TO THE TIME OF SALE. THIS TERM SHEET IS NOT AN OFFER TO SELL THESE SECURITIES AND IT IS NOT A SOLICITATION OF AN OFFER TO BUY THESE SECURITIES IN ANY JURISDICTION WHERE THE OFFER OR SALE IS NOT PERMITTED.
81
SEVEN TREES RETAIL PORTFOLIO
The following table presents historical occupancy percentages at the Seven Trees Retail Portfolio Properties:
Historical Occupancy Percentages*
| 12/31/2009 | 12/31/2010 | 10/31/2011 YTD | ||
| 97% | 95% | 95% |
| * | Source: Information obtained from the borrower. |
Operating History and Underwritten Net Cash Flow. The following table presents certain information relating to the historical operating performance and the Underwritten Net Cash Flow at the Seven Trees Retail Portfolio Properties:
Cash Flow Analysis
| 2009 | 2010 | Annualized 8/31/2011 | U/W | U/W $ per SF | ||||||||||||||||
Base Rent | $3,155,197 | $3,119,955 | $3,135,675 | $3,138,852 | $20.11 | |||||||||||||||
Grossed Up Vacant Space | 0 | 0 | 0 | 269,745 | 1.73 | |||||||||||||||
Total Reimbursables | 422,179 | 446,812 | 414,812 | 481,555 | 3.09 | |||||||||||||||
Other Income | 0 | 0 | 0 | 0 | 0 | |||||||||||||||
Less Vacancy & Credit Loss | 0 | 0 | 0 | (269,279 | ) | (1.73 | ) | |||||||||||||
|
|
|
|
|
|
|
|
|
| |||||||||||
Effective Gross Income | $3,577,376 | $3,566,767 | $3,550,487 | $3,620,873 | $23.20 | |||||||||||||||
Total Operating Expenses | $848,257 | $850,705 | $814,802 | $907,227 | $5.81 | |||||||||||||||
|
|
|
|
|
|
|
|
|
| |||||||||||
Net Operating Income | $2,729,119 | $2,716,062 | $2,735,684 | $2,713,645 | $17.39 | |||||||||||||||
TI/LC | 0 | 0 | 0 | 190,994 | 1.22 | |||||||||||||||
Capital Expenditures | 0 | 0 | 0 | 68,677 | 0.44 | |||||||||||||||
|
|
|
|
|
|
|
|
|
| |||||||||||
Net Cash Flow | $2,729,119 | $2,716,062 | $2,735,684 | $2,453,974 | $15.72 | |||||||||||||||
NOI DSCR | 1.93x | 1.92x | 1.93x | 1.92x | ||||||||||||||||
NCF DSCR | 1.93x | 1.92x | 1.93x | 1.74x | ||||||||||||||||
NOI DY | 13.7% | 13.6% | 13.7% | 13.6% | ||||||||||||||||
NCF DY | 13.7% | 13.6% | 13.7% | 12.3% | ||||||||||||||||
Appraisal. According to the related appraisal, The Seven Trees Retail Portfolio Properties had an aggregate “as-is” appraised value of $43,400,000 as of an effective date of October 17, 2011.
Environmental Matters. According to the Phase I environmental site assessment performed on October 18, 2011, there was evidence of recognized environmental conditions. The Phase I recommended the performance of a subsurface investigation at Seven Trees Center to address a former on-site dry cleaning facility that operated at the property from 1970 to July of 2011. A Phase II environmental site assessment performed on November 22, 2011, revealed concentrations of chemicals in excess of reportable levels and recommended that the results of the investigation be reported to the San Francisco Bay Regional Water Quality Control Board (“SFBRWQCB”) and to proceed as it directs. The loan documents require the Seven Trees Retail Portfolio Borrower to comply with the directions of SFBRWQCB, and an environmental reserve of $500,000 was required at the closing of the Seven Trees Retail Portfolio Mortgage Loan, which amount is required to be released to the Seven Trees Retail Portfolio Borrower upon receipt of a “no further action” letter with respect to this matter.
An operations and maintenance program was also recommended for the management of suspected asbestos-containing materials.
Market Overview and Competition. The centers comprising the Seven Trees Retail Portfolio Properties are located in the Seven Trees neighborhood which, according to the related appraiser, is part of the San Jose/South County submarket in the City of San Jose.
With approximately 1,027,900 residents in 2010, San Jose is the 10th largest city in the nation and the third largest city on the West Coast. According to a 2009 third party survey, the city ranks as the largest and most influential high-tech center in the world and is the self-proclaimed “Capitol of Silicon Valley.” A third party report concluded that Metro San Jose’s unemployment rate will remain above 10% through 2013, but that the city’s cluster of leading technology firms, its ability to create innovative companies, and its highly educated population will lead to average to above-average long-term performance. A third party study reports a 9.8% unemployment rate for the San Jose-Sunnyvale-Santa Clara California MSA as of October 2011. Mean household income in San Jose in 2010 was $88,400, which is lower than the 2000 mean household income of $105,100 but higher than the 2005 mean household income of $85,400.
According to market sources, the San Jose metro market reports existing retail supply of 19,968,000 square feet and negative absorption of 24,000 square feet in the second quarter of 2011. Average occupancy declined from 97.3% in 2006 to 93.9% in the second quarter of 2011. Rental rates decreased from a high of $31.58 per square foot in 2007 to average annual rent of $30.57 per square foot in the second quarter of 2011.
According to market sources, the San Jose/South County submarket reports existing retail supply of 9,696,000 square feet and negative absorption of 15,000 square feet in the second quarter of 2011. Average occupancy has fallen from 97.4% in 2006 to
THE INFORMATION IN THIS STRUCTURAL AND COLLATERAL TERM SHEET IS NOT COMPLETE AND MAY BE AMENDED PRIOR TO THE TIME OF SALE. THIS TERM SHEET IS NOT AN OFFER TO SELL THESE SECURITIES AND IT IS NOT A SOLICITATION OF AN OFFER TO BUY THESE SECURITIES IN ANY JURISDICTION WHERE THE OFFER OR SALE IS NOT PERMITTED.
82
SEVEN TREES RETAIL PORTFOLIO
95.4% in the second quarter of 2011. The submarket vacancy has climbed no higher than 7.1% since 2006. Rental rates increased from 2006 to 2007, were flat between 2007 and 2008 at $29.95 per square foot, and have declined since 2008 to average annual rent of $29.09 per square foot in the second quarter of 2011.
The Seven Trees Retail Portfolio Properties are located four miles south of the San Jose Central Business District. The neighborhood is defined by Tully Road to the North, Branham Lane to the South, Hellyer County Park/US101 to the East and State Highway 87 to the West. While the neighborhood primarily consists of single and multifamily residential uses, the area also includes established retail and commercial centers. According to the appraiser, the daily traffic count at Seven Trees Center is 36,500 vehicles and 56,000 vehicles for the 7-11 and Solari Centers. There are 571,874 people living within a 5 mile radius, with median household income of $81,931. According to a third party report, within a one-mile radius of the subject, 44% of the population is Hispanic or Latino and 32% is Asian.
Supporting commercial and retail uses are primarily located along the adjacent major arterials of Monterey Highway and Capitol Expressway. The closest neighborhood shopping center is located one mile south, and is anchored by a Safeway, Wells Fargo and McDonalds. Access to the Seven Trees neighborhood is good, with access provided by many north-south and east-west routes. According to the related appraiser, the neighborhood has shown minimal population growth reflecting the built-up nature of the area, and is considered to be in the stable stage of its life. According to the related appraisal, 317,000 square feet of retail space was projected to come online in the San Jose/South County submarket in 2011, and 152,000 square feet in 2012.
The following table presents certain information relating to some comparable retail centers provided in the related appraisal for The Seven Trees Retail Portfolio Properties.
Competitive Set
| Seven Trees Retail Portfolio | 1040 McLaughlin Avenue | White Road Plaza | 1102 Bird Avenue | |||||
Market | San Jose, CA | San Jose, CA | San Jose, CA | San Jose, CA | ||||
Distance from Subject | — | 4.8 miles | 6.7 miles | 4.9 miles | ||||
Property Type | Community Center | Strip Center | Community Center | Community Center | ||||
Year Built/Renovated | Various/Various | 1966/1972/1993 | 1988/NAP | 1985/NAP | ||||
Anchors | Marina Grocery | NAP | Rite Aid | NAP (adjacent to Walgreens) | ||||
Total GLA | 156,085 SF | 16,433 SF | 153,846 SF | 27,830 SF | ||||
Total Occupancy | 93% | 100% | 79% | 100% |
The Borrower. The Seven Trees Retail Portfolio Mortgage Loan has one borrowing entity, Gold Touch Investment SPE, LLC (“Seven Trees Retail Portfolio Borrower”), which is a Delaware limited liability company and a special purpose entity formed for the sole purpose of owning the subject property. Legal counsel to the Seven Trees Retail Portfolio Borrower delivered a non-consolidation opinion in connection with the origination of the Seven Trees Retail Portfolio Mortgage Loan. Gold Touch Investment, LLC, a California limited liability company, is the sole member and manager of Gold Touch Investments SPE, LLC. Gold Touch Investments, LLC, is also a special purpose entity. There are 19 members of Gold Touch Investments, LLC with ownership interests ranging from 1% to 26%. The following four members are guarantors of the recourse carveouts: Albert Wang (manager, 9% interest), Hung Nguy (26% interest), Lai-Ching Huang (12% interest), and Meei-Hwa Huang (12% interest).
The Sponsor. Albert Wang is the primary sponsor of the Seven Trees Retail Portfolio Borrower. Mr. Wang is a real estate owner and operator based in the San Francisco Bay Area. He manages the subject property through an affiliated company, Altos Enterprises, Inc. Altos Enterprises, Inc. manages over 550,000 square feet of retail and commercial properties including the Seven Trees Retail Portfolio Properties. Mr. Wang is a licensed real estate broker and has been in the real estate sales, management and development businesses since 1979. His company has developed more than 10 shopping centers and residential properties.
Escrows. The loan documents provide for upfront escrows at closing in the amount of $27,686 for real estate taxes, $29,576 for insurance, $5,790 for replacement reserves, and $19,000 for tenant improvements and leasing commissions. In connection with the origination of the Seven Trees Retail Portfolio Mortgage Loan, the Seven Trees Retail Portfolio Borrower was required to deposit $36,469 into a repair and remediation reserve to remedy deferred maintenance (including ADA accessibility, roof repair, and HVAC replacement) as outlined in the related property condition report. The Seven Trees Retail Portfolio Borrower was also required to deposit $500,000 into an environmental reserve with respect to remediation of chemical concentrations that exceed acceptable levels according to the SFBRWQCB. Any Funds remaining in the environmental reserve are required to be released to the Seven Trees Retail Portfolio Borrower upon receipt of a “no further action” letter with respect to this matter.
The loan documents provide for ongoing monthly escrows in the amount of: $27,686 for real estate taxes (subject to adjustment per lender’s estimate), $2,689 for insurance (subject to adjustment per lender’s estimate), $5,700 for replacement reserves, and $19,000 for tenant improvements and leasing commissions (subject to a cap of $300,000).
Lockbox and Cash Management. The Seven Trees Retail Portfolio Mortgage Loan is subject to a cash management agreement which requires that the tenants remit all rents and profits to a clearing bank account in the name of the Seven Trees Retail Portfolio Borrower and controlled by lender. Prior to the occurrence of a Seven Trees Retail Portfolio Trigger Event, (as defined below) the Seven Trees Retail Portfolio Borrower has access to all rents and profits deposited into the clearing bank account to be used in connection with the operation of the property. Following a Seven Trees Retail Portfolio Trigger Event, the Seven Trees Retail Portfolio Borrower is required to cause all tenants at the property to pay directly into the clearing bank account, and amounts on deposit in the clearing bank account will be transferred to a lender controlled account and administered as set forth in the cash management agreement.
THE INFORMATION IN THIS STRUCTURAL AND COLLATERAL TERM SHEET IS NOT COMPLETE AND MAY BE AMENDED PRIOR TO THE TIME OF SALE. THIS TERM SHEET IS NOT AN OFFER TO SELL THESE SECURITIES AND IT IS NOT A SOLICITATION OF AN OFFER TO BUY THESE SECURITIES IN ANY JURISDICTION WHERE THE OFFER OR SALE IS NOT PERMITTED.
83
SEVEN TREES RETAIL PORTFOLIO
A “Seven Trees Retail Portfolio Trigger Event” will exist upon the occurrence of (i) an event of default under the loan documents until cured, (ii) the debt service coverage ratio of the property for the two most recent calendar quarters is less than 1.10x until the debt service coverage ratio for the two most recent calendar quarters is at least 1.50x, (iii) the failure of Marina Food LLC (or a successor acceptable to lender) to remain in occupancy and open for business during the term of the loan (until a replacement lease meeting certain criteria is in place) or Marina Food LLC becoming insolvent or a debtor in bankruptcy, or (iv) any applicable governmental authority provides notice of a violation with respect to a certificate of occupancy concerning the property until such time as such violation is cured in accordance with the loan documents.
Property Management. The Seven Trees Retail Portfolio Properties are managed by Altos Enterprises Inc., an affiliate of the Seven Trees Retail Portfolio Borrower. According to the management agreements, the property manager is entitled to a base management fee in an amount equal to 3.0% of the gross monthly receipts excluding security deposits. The Seven Trees Retail Portfolio Borrower may not modify or amend in any material respect, the terms of the management agreement, replace or remove the manager, or enter into any management agreement without prior written consent from the lender.
Assumption. The Seven Trees Retail Portfolio Mortgage Loan has a two-time right to transfer the Seven Trees Retail Portfolio Properties and cause an assumption of the loan, provided that no event of default has occurred and is continuing under the Seven Trees Retail Portfolio Mortgage Loan and certain other conditions are satisfied, including that: (a) the borrower pays an assumption fee of 1.0% of the outstanding principal balance of the Seven Trees Retail Portfolio Mortgage Loan; (b) the transferee satisfies certain criteria; and (c) confirmation from Fitch, Moody’s and KBRA that the transfer will not result in a downgrade, withdrawal or qualification of the respective ratings assigned to the Series 2012-C6 Certificates is delivered.
Release. Not permitted.
Real Estate Substitution. Not permitted.
Subordinate and Mezzanine Indebtedness. Not permitted.
Other Additional Financing. Not permitted.
Ground Lease. None.
Terrorism Insurance. The loan documents require that the “all risk” insurance policy required to be maintained by the borrower provide coverage for terrorism in an amount equal to the full replacement cost of the Seven Trees Retail Portfolio Properties, as well as business interruption insurance covering no less than the 18-month period following the occurrence of a casualty event.
THE INFORMATION IN THIS STRUCTURAL AND COLLATERAL TERM SHEET IS NOT COMPLETE AND MAY BE AMENDED PRIOR TO THE TIME OF SALE. THIS TERM SHEET IS NOT AN OFFER TO SELL THESE SECURITIES AND IT IS NOT A SOLICITATION OF AN OFFER TO BUY THESE SECURITIES IN ANY JURISDICTION WHERE THE OFFER OR SALE IS NOT PERMITTED.
84
[THIS PAGE INTENTIONALLY LEFT BLANK.]
85
EL MERCADO SHOPPING CENTER
THE INFORMATION IN THIS STRUCTURAL AND COLLATERAL TERM SHEET IS NOT COMPLETE AND MAY BE AMENDED PRIOR TO THE TIME OF SALE. THIS TERM SHEET IS NOT AN OFFER TO SELL THESE SECURITIES AND IT IS NOT A SOLICITATION OF AN OFFER TO BUY THESE SECURITIES IN ANY JURISDICTION WHERE THE OFFER OR SALE IS NOT PERMITTED.
86
EL MERCADO SHOPPING CENTER

THE INFORMATION IN THIS STRUCTURAL AND COLLATERAL TERM SHEET IS NOT COMPLETE AND MAY BE AMENDED PRIOR TO THE TIME OF SALE. THIS TERM SHEET IS NOT AN OFFER TO SELL THESE SECURITIES AND IT IS NOT A SOLICITATION OF AN OFFER TO BUY THESE SECURITIES IN ANY JURISDICTION WHERE THE OFFER OR SALE IS NOT PERMITTED.
87
El Mercado Shopping Center
| Loan Information | ||
Mortgage Loan Seller: | Liberty Island Group I LLC | |
Credit Assessment (Fitch/Moody’s/KBRA): | NAP | |
| Original Principal Balance: | $20,000,000 | |
Cut-off Date Principal Balance: | $19,941,865 | |
% of Initial Pool Balance: | 2.2% | |
Loan Purpose: | Refinance | |
Borrower Name(1): | El Mercado SPE, LLC | |
Sponsors: | Albert J. Wang; Hung Nguy; William & My-Huong Cheung; et al. | |
Mortgage Rate: | 5.880% | |
Note Date: | December 21, 2011 | |
Anticipated Repayment Date: | NAP | |
Maturity Date: | January 1, 2022 | |
IO Period: | None | |
Loan Term (Original): | 120 months | |
Seasoning: | 3 months | |
Amortization Term (Original): | 360 months | |
Loan Amortization Type: | Amortizing Balloon | |
Interest Accrual Method: | Actual/360 | |
Call Protection: | L(48),D(68),O(4) | |
Lockbox Type: | Hard/Springing Cash Management | |
Additional Debt: | None | |
Additional Debt Type: | NAP | |
Escrows and Reserves:
Type: | Initial | Monthly | Cap (If Any) | |||
Taxes | $178,891 | $35,778 | NAP | |||
Insurance | $24,116 | $2,412 | NAP | |||
Replacement Reserves | $2,375 | $2,375 | NAP | |||
TI/LC | $13,000 | $13,000 | $300,000 | |||
Deferred Maintenance | $15,750 | NAP | NAP | |||
Environmental Escrow | $50,000 | NAP | NAP | |||
Daiso Japan Leasing Reserve(2) | $400,000 | NAP | NAP |
| Property Information | ||
Single Asset/Portfolio: | Single Asset | |
Property Type: | Retail | |
Specific Property Type: | Anchored | |
Location: | Union City, CA | |
Size: | 109,468 SF | |
| Cut-off Date Principal | ||
Balance Per Unit/SF: | $182.17 | |
Year Built/Renovated: | 1981/NAP | |
Occupancy %: | 100.0% | |
Occupancy % Source Date: | October 1, 2011 | |
Title Vesting: | Fee | |
Property Manager: | Altos Enterprises, Inc. | |
3rd Most Recent NOI (As of): | $2,210,232(12/31/2009) | |
2nd Most Recent NOI (As of): | $2,259,123(12/31/2010) | |
Most Recent NOI (As of): | $2,609,483 (Annualized YTD 8/31/2011) | |
U/W Revenues: | $3,335,004 | |
U/W Expenses: | $1,031,375 | |
U/W NOI: | $2,303,629 | |
U/W NCF: | $2,122,138 | |
U/W NOI DSCR: | 1.62x | |
U/W NCF DSCR: | 1.49x | |
U/W NOI Debt Yield: | 11.6% | |
U/W NCF Debt Yield: | 10.6% | |
As-Is Appraised Value: | $35,800,000 | |
As-Is Appraisal Valuation Date: | October 17, 2011 | |
Cut-off Date LTV Ratio: | 55.7% | |
LTV Ratio at Maturity or ARD: | 47.2% | |
| (1) | Borrower is an affiliate of the Seven Trees Retail Portfolio borrower. |
| (2) | See “Escrows” below for a description of the holdback. |
The Mortgage Loan. The mortgage loan (the “El Mercado Shopping Center Mortgage Loan”) is evidenced by a single promissory note that is secured by a first mortgage encumbering a grocery-anchored retail center located in Union City, California (the “El Mercado Shopping Center Property”). The El Mercado Shopping Center Mortgage Loan was originated on December 21, 2011 by Prudential Mortgage Capital Company. The El Mercado Shopping Center Mortgage Loan had an original principal balance of $20,000,000, has an outstanding principal balance as of the Cut-off Date of $19,941,865 and accrues interest at an interest rate of 5.880% per annum. The El Mercado Shopping Center Mortgage Loan had an initial term of 120 months, has a remaining term of 117 months as of the Cut-off Date, and requires payments of interest and principal based on a 30-year amortization schedule. The El Mercado Shopping Center Mortgage Loan matures on January 1, 2022. The proceeds from the El Mercado Shopping Center Mortgage Loan were used to refinance existing debt on the El Mercado Shopping Center Property of $15.7 million, pay closing and other costs and fund approximately $684,132 in upfront reserves, resulting in a return of equity to the sponsors of approximately $3.3 million.
Following the lockout period, the borrower has the right to defease the El Mercado Shopping Center Mortgage Loan in whole, but not in part, on any payment date before the scheduled maturity date. The El Mercado Shopping Center Mortgage Loan is prepayable without penalty on or after October 1, 2021.
The Property. The El Mercado Shopping Center Property is a 109,468 square foot grocery-anchored retail center located in Union City, California. The El Mercado Shopping Center Property was 100.0% leased to 29 tenants as of October 1, 2011 and the property
THE INFORMATION IN THIS STRUCTURAL AND COLLATERAL TERM SHEET IS NOT COMPLETE AND MAY BE AMENDED PRIOR TO THE TIME OF SALE. THIS TERM SHEET IS NOT AN OFFER TO SELL THESE SECURITIES AND IT IS NOT A SOLICITATION OF AN OFFER TO BUY THESE SECURITIES IN ANY JURISDICTION WHERE THE OFFER OR SALE IS NOT PERMITTED.
88
EL MERCADO SHOPPING CENTER
has averaged 100.0% occupancy from 2009 to 2011. The El Mercado Shopping Center Property was constructed in 1981, and has not undergone any significant renovations.
The El Mercado Shopping Center Property is located at the northwest corner of Decoto Road and Alvarado Niles Road in Union City. The immediate area surrounding the El Mercado Shopping Center Property includes established residential and commercial developments. The region is substantially built out with little vacant land available for development. Office uses in the neighborhood include low and mid-rise developments, while retail uses include strip, neighborhood and community shopping centers, restaurants and gas stations. Retail growth patterns have occurred along primary commercial thoroughfares such as Decoto Road, Alvarado Niles Road, and Paseo Padre Parkway. The appraiser’s traffic analysis reflects 37,000 vehicles per day. Freeway access to I-880 is located two miles from the subject and there is a BART station one quarter mile east of the subject. There are public bus transit stops in many locations in the neighborhood, with a stop near the El Mercado Shopping Center Property.
The following table presents certain information relating to the tenancies at the El Mercado Shopping Center Property:
Major Tenants
Tenant Name | Credit Rating (Fitch/ Moody’s/ S&P)(1) | Tenant NRSF | % of NRSF | Annual U/W Base Rent PSF | Annual U/W Base Rent | % of Total Annual U/W Base Rent | Sales PSF(2) | Occupancy Cost(2) | Lease Expiration Date | |||||||||||||||||||||||||
Major Tenants | ||||||||||||||||||||||||||||||||||
Marina Grocery | NR/NR/NR | 30,000 | 27.4% | $14.40 | $432,000 | 14.6 | % | $480 | 3.9% | 9/30/2026 | ||||||||||||||||||||||||
Daiso Japan | NR/NR/NR | 17,700 | 16.2% | $20.27 | $358,800 | 12.1 | % | NAV | NAV | 4/30/2012 | ||||||||||||||||||||||||
Mayflower Seafood | NR/NR/NR | 7,353 | 6.7% | $38.85 | $285,660 | 9.6 | % | NAV | NAV | 12/31/2016 | ||||||||||||||||||||||||
O’Reilly (Kragen) Auto Parts | NR/NR/NR | 6,748 | 6.2% | $24.01 | $162,000 | 5.5 | % | NAV | NAV | 4/30/2016 | ||||||||||||||||||||||||
|
|
|
|
|
|
|
|
|
|
|
| |||||||||||||||||||||||
Occupied Collateral Total | 109,468 | 100.0% | $27.05 | $ | 2,961,144 | 100.0 | % | |||||||||||||||||||||||||||
|
|
|
| |||||||||||||||||||||||||||||||
Vacant Space | 0 | 0% | ||||||||||||||||||||||||||||||||
|
|
|
| |||||||||||||||||||||||||||||||
Collateral Total | 109,468 | 100.0% | ||||||||||||||||||||||||||||||||
|
|
|
| |||||||||||||||||||||||||||||||
| (1) | Certain ratings are those of the parent company whether or not the parent guarantees the lease. |
| (2) | Sales per square foot and occupancy costs are for the twelve months ended on December 31, 2010. |
The following table presents certain information relating to the lease rollover schedule at the El Mercado Shopping Center Property:
Lease Expiration Schedule(1)
Year Ending | No. of Leases Expiring | Expiring NRSF | % of Total NRSF | Cumulative of Total NRSF | Cumulative % of Total NRSF | Annual U/W Base Rent | Annual U/W Base Rent PSF | |||||||||||||||||||||
MTM | 0 | 0 | 0.0% | 0 | 0.0 | % | $0 | $0.00 | ||||||||||||||||||||
2012 | 3 | 20,867 | 19.1% | 20,867 | 19.1 | % | $477,408 | $22.88 | ||||||||||||||||||||
2013 | 4 | 5,435 | 5.0% | 26,302 | 24.0 | % | $220,140 | $40.50 | ||||||||||||||||||||
2014 | 2 | 3,600 | 3.3% | 29,902 | 27.3 | % | $135,936 | $37.76 | ||||||||||||||||||||
2015 | 6 | 16,220 | 14.8% | 46,122 | 42.1 | % | $537,168 | $33.12 | ||||||||||||||||||||
2016 | 10 | 26,656 | 24.4% | 72,778 | 66.5 | % | $936,684 | $35.14 | ||||||||||||||||||||
2017 | 2 | 3,190 | 2.9% | 75,968 | 69.4 | % | $129,648 | $40.64 | ||||||||||||||||||||
2018 | 0 | 0 | 0.0% | 75,968 | 69.4 | % | $0 | $0.00 | ||||||||||||||||||||
2019 | 0 | 0 | 0.0% | 75,968 | 69.4 | % | $0 | $0.00 | ||||||||||||||||||||
2020 | 0 | 0 | 0.0% | 75,968 | 69.4 | % | $0 | $0.00 | ||||||||||||||||||||
2021 | 0 | 0 | 0.0% | 75,968 | 69.4 | % | $0 | $0.00 | ||||||||||||||||||||
2022 | 0 | 0 | 0.0% | 75,968 | 69.4 | % | $0 | $0.00 | ||||||||||||||||||||
Thereafter | 2 | 33,500 | 30.6% | 109,468 | 100.0 | % | $524,160 | $15.65 | ||||||||||||||||||||
Vacant | 0 | 0 | 0.0% | 109,468 | 100.0 | % | $0 | $0.00 | ||||||||||||||||||||
|
|
|
|
|
|
|
|
|
| |||||||||||||||||||
Total / Weighted Average | 29 | 109,468 | 100.0% | $ | 2,961,144 | $27.05 | ||||||||||||||||||||||
|
|
|
|
|
|
|
|
|
| |||||||||||||||||||
| (1) | Source: Information obtained from underwritten rent roll. |
The following table presents historical occupancy percentages at the El Mercado Shopping Center Property:
Historical Occupancy Percentages*
12/31/2009 | 12/31/2010 | 10/1/2011 | ||
| 100% | 100% | 100% |
| * | Source: Information obtained from underwritten rent roll. |
THE INFORMATION IN THIS STRUCTURAL AND COLLATERAL TERM SHEET IS NOT COMPLETE AND MAY BE AMENDED PRIOR TO THE TIME OF SALE. THIS TERM SHEET IS NOT AN OFFER TO SELL THESE SECURITIES AND IT IS NOT A SOLICITATION OF AN OFFER TO BUY THESE SECURITIES IN ANY JURISDICTION WHERE THE OFFER OR SALE IS NOT PERMITTED.
89
EL MERCADO SHOPPING CENTER
Operating History and Underwritten Net Cash Flow. The following table presents certain information relating to the historical operating performance and the Underwritten Net Cash Flow at the El Mercado Shopping Center Property:
Cash Flow Analysis
| 2009 | 2010 | Annualized 8/31/2011 | U/W | U/W $ per SF | ||||||||||||||||
Base Rent | $2,631,744 | $2,755,603 | $2,901,501 | $2,961,144 | $27.05 | |||||||||||||||
Grossed Up Vacant Space | 0 | 0 | 0 | 0 | 0 | |||||||||||||||
Total Reimbursables | 537,494 | 490,741 | 549,098 | 571,699 | 5.22 | |||||||||||||||
Other Income | 0 | 0 | 0 | 0 | 0 | |||||||||||||||
Less Vacancy & Credit Loss | 0 | 0 | 0 | (197,839) | (1.81) | |||||||||||||||
|
|
|
|
|
|
|
|
|
| |||||||||||
Effective Gross Income | $3,169,239 | $3,246,344 | $3,450,599 | $3,335,004 | $30.47 | |||||||||||||||
Total Operating Expenses | $959,006 | $987,221 | $841,116 | $1,031,375 | $9.42 | |||||||||||||||
|
|
|
|
|
|
|
|
|
| |||||||||||
Net Operating Income | $2,210,232 | $2,259,123 | $2,609,483 | $2,303,629 | $21.04 | |||||||||||||||
TI/LC | 0 | 0 | 0 | 153,029 | 1.40 | |||||||||||||||
Capital Expenditures | 0 | 0 | 56,850 | 28,462 | 0.26 | |||||||||||||||
|
|
|
|
|
|
|
|
|
| |||||||||||
Net Cash Flow | $2,210,232 | $2,259,123 | $2,552,633 | $2,122,138 | $19.39 | |||||||||||||||
NOI DSCR | 1.56x | 1.59x | 1.84x | 1.62x | ||||||||||||||||
NCF DSCR | 1.56x | 1.59x | 1.80x | 1.49x | ||||||||||||||||
NOI DY | 11.1% | 11.3% | 13.1% | 11.6% | ||||||||||||||||
NCF DY | 11.1% | 11.3% | 12.8% | 10.6% | ||||||||||||||||
Appraisal. According to the related appraisal, the El Mercado Shopping Center Property had an “as-is” appraised value of $35,800,000 as of an effective date of October 17, 2011.
Environmental Matters. According to the Phase I environmental assessment dated December 2, 2011 there was no evidence of any recognized environmental conditions at the El Mercado Shopping Center Property. However, an operations and maintenance program was recommended for the management of suspected asbestos-containing materials and removal of the six 55 gallon drums.
Market Overview and Competition. The El Mercado Shopping Center Property is located in Union City, which is part of the South Alameda submarket in the larger Oakland-East Bay market.
The Oakland-East Bay market is comprised of Contra Costa and Alameda counties, and the subject property is located in Alameda County, which has a population of 1,549,800 residents as of 2010. The largest employment sectors in the area are government (17.6%), professional and business services (15.6%), and educational and health services (14.7%). Oakland is one of the most populous cities in the San Francisco Bay Area and a major industrial center. The city contains the Port of Oakland, the fifth busiest intermodal container port in the United States.
A third party report indicates that the 10.1% current unemployment rate for the Oakland, California Metropolitan Division is expected to decrease as growing output and employment in manufacturing and healthcare sectors are more than offsetting contractions in finance, insurance, and the public sector. State and local budget cuts are a risk to the area’s near-term forecast, since University of California Berkeley and Oakland Unified School District are major employers in the region.
The top employers according to a third party report are comprised of University of California, Berkeley (21,437 employees), Kaiser Permanente (16,705 employees), Safeway, Inc. (9,121 employees), Chevron Corporation (7,535 employees), John Muir Health (6,420 employees), Lawrence Livermore National Laboratory (6,405 employees), Wells Fargo and Company (5,885 employees), Alta Bates Summit Medical Center (5,281 employees), Pacific Gas and Electric Company (3,139 employees), and Lawrence Berkeley National Laboratory (3,000 employees).
According to market sources, the Oakland-East Bay market reports existing retail supply of 27,553,000 square feet and negative absorption of 26,000 square feet in the second quarter of 2011. Average occupancy has fallen from 96.9% in 2006 to 93.6% in the second quarter of 2011. Average rental rates reached a high of $29.12 per square foot in 2007, declined to $28.01 per square foot in the fourth quarter of 2010, and have increased to $28.06 per square foot in the second quarter of 2011.
Union City is a suburban community located in the southern part of the East Bay and is bordered by Hayward to the north and Fremont to the south. 2010 mean household income in Union City was $103,800. From 1990-2005, the city’s population grew at a 1.85% annual rate and households grew at a 1.50% annual rate. According to the appraisal, manufacturing, wholesale and transportation jobs comprise the largest industries in Union City. Tech manufacturing in the area has experienced some upheaval due to the shutdown of Solyndra and temporary closure of the NUMMI auto plant, both located in neighboring Fremont.
Recent market sources in the South Alameda submarket report existing retail supply of 4,667,000 square feet and negative absorption of 16,000 square feet in the second quarter of 2011. Average occupancy has fallen from 98.1% in 2006 to 94.4% in the second quarter of 2011. Average rental rates declined from a high of $27.44 per square foot in 2007 to $25.16 per square foot in the fourth quarter 2010 and have since increased to $25.25 per square foot in the second quarter of 2011.
THE INFORMATION IN THIS STRUCTURAL AND COLLATERAL TERM SHEET IS NOT COMPLETE AND MAY BE AMENDED PRIOR TO THE TIME OF SALE. THIS TERM SHEET IS NOT AN OFFER TO SELL THESE SECURITIES AND IT IS NOT A SOLICITATION OF AN OFFER TO BUY THESE SECURITIES IN ANY JURISDICTION WHERE THE OFFER OR SALE IS NOT PERMITTED.
90
EL MERCADO SHOPPING CENTER
The following table presents certain information relating to some comparable retail centers provided in the related appraisal for the El Mercado Shopping Center Property.
Competitive Set(1)
| El Mercado Shopping Center | Lido Faire Shopping Center | Raley’s Center | ||||
Market | Union City, CA | Newark, CA | Newark, CA | |||
Distance from Subject | — | 3.6 miles | 3.6 miles | |||
Property Type | Neighborhood Shopping Center | Neighborhood Shopping Center | Neighborhood Shopping Center | |||
Year Built/Renovated | 1981/NAP | 1966/1999 | 1987/NAP | |||
Anchors | Marina Grocery | 99 Ranch Market (Asian Grocer), Dollar Tree | Raley’s | |||
Total GLA | 109,468 SF | 114,727 SF | 123,374 SF | |||
Total Occupancy | 100% | 90% | 100% |
| (1) | Source: Information obtained from appraisal dated October 31, 2011. |
The Borrower. The El Mercado Shopping Center Mortgage Loan has one borrowing entity, El Mercado SPE, LLC (“The El Mercado Shopping Center Property Borrower”), which is a Delaware limited liability company and a special purpose entity formed for the sole purpose of owning the El Mercado Shopping Center Property. Legal counsel to the El Mercado Shopping Center Borrower delivered a non-consolidation opinion in connection with the origination of the El Mercado Shopping Center Mortgage Loan. El Mercado, LLC, a California limited liability company, is the sole member and manager of El Mercado SPE, LLC. El Mercado, LLC, is also a special purpose entity. There are 23 members of El Mercado, LLC with ownership interests ranging from 0.8% to 16%. The following four members are guarantors of the recourse carveouts: Albert Wang (manager, 6% interest), Hung Nguy (16% interest), William Cheung (15% interest), and Sen-Lin Lee (14.2% interest).
The Sponsor. Albert Wang is the primary sponsor of the El Mercado Shopping Center Borrower. Mr. Wang is a real estate owner and operator based in the San Francisco Bay Area. He manages the subject property through an affiliated company, Altos Enterprises, Inc. Altos Enterprises, Inc. manages over 550,000 square feet of retail and commercial properties including the El Mercado Shopping Center Property. Mr. Wang is a licensed real estate broker and has been in the real estate sales, management and development businesses since 1979. Mr. Wang’s company has developed more than 10 shopping centers and residential properties. Hung Nguy is a co-owner and managing member of El Mercado, LLC. Mr. Nguy has 26 years of real estate experience. William Cheung has 23 years of real estate experience. Sen-Lin Lee has been investing in real estate for 40 years and has been the general partner and managing member for a number of residential and commercial properties.
Escrows. The loan documents provide for upfront escrows at closing in the amount of $178,891 for real estate taxes, $24,116 for insurance, $13,000 for leasing and tenant improvement costs, and $2,375 for replacement reserves. In connection with the origination of the El Mercado Shopping Center Mortgage Loan, the El Mercado Shopping Center Borrower was required to deposit $15,750 into a repair and remediation reserve to remedy deferred maintenance. The El Mercado Shopping Center Borrower deposited $50,000 into an environmental reserve to address (i) the testing and remediation of potential asbestos-containing material and (ii) the disposal of six 55 gallon drums (which may contain materials associated with the investigation of the former dry cleaning tenant), The El Mercado Shopping Center Borrower deposited $400,000 into a leasing reserve to address leasing commissions and tenant improvements associated with the portion of the property currently leased to Daiso California, LLC. The loan documents provide for ongoing monthly escrows in the amount of: $35,778 for real estate taxes (subject to adjustment per lender’s estimate), $2,412 for insurance (subject to adjustment per lender’s estimate), $2,375 for replacement reserves, and $13,000 for tenant improvements and leasing commissions (subject to a cap of $300,000).
Lockbox and Cash Management. The El Mercado Shopping Center Mortgage Loan is subject to a cash management agreement that requires the El Mercado Shopping Center Property tenants remit all rents to a clearing bank account in the name of the El Mercado Shopping Center Borrower and controlled by the lender. Prior to the occurrence of an El Mercado Shopping Center Trigger Event (as defined below), all funds will be swept into an account controlled by the El Mercado Shopping Center Borrower on a daily basis. Following an El Mercado Shopping Center Trigger Event, amounts on deposit in the clearing bank account will be transferred to certain accounts controlled by the lender.
An “El Mercado Shopping Center Trigger Event” will exist upon the occurrence of (i) an event of default under the loan documents until cured, (ii) the debt service coverage ratio of the property for the two most recent calendar quarters is less than 1.10x until the debt service coverage ratio for the two most recent calendar quarters is at least 1.25x, or (iii) the failure of Marina Food LLC (or a successor acceptable to lender) to remain in occupancy and open for business during the term of the loan (until a replacement lease meeting certain criteria is in place) or Marina Food LLC becoming insolvent or a debtor in bankruptcy.
Property Management. The El Mercado Shopping Center Property is managed by Altos Enterprises, Inc., an affiliate of the El Mercado Shopping Center Borrower. The property manager is entitled to a base management fee in an amount equal to 4.0% of the gross monthly receipts excluding security deposits. The manager may not be removed or replaced and the terms of any management agreement may not be modified or amended in any material respect without the prior written consent of lender.
Assumption. The El Mercado Shopping Center Mortgage Loan has a two-time right to transfer the El Mercado Shopping Center Property and cause an assumption of the loan, provided that no event of default has occurred and is continuing under the El
THE INFORMATION IN THIS STRUCTURAL AND COLLATERAL TERM SHEET IS NOT COMPLETE AND MAY BE AMENDED PRIOR TO THE TIME OF SALE. THIS TERM SHEET IS NOT AN OFFER TO SELL THESE SECURITIES AND IT IS NOT A SOLICITATION OF AN OFFER TO BUY THESE SECURITIES IN ANY JURISDICTION WHERE THE OFFER OR SALE IS NOT PERMITTED.
91
EL MERCADO SHOPPING CENTER
Mercado Shopping Center Mortgage Loan and certain other conditions are satisfied, including that: (a) the borrower pays an assumption fee of 1.0% of the outstanding principal balance of the El Mercado Shopping Center Mortgage Loan; (b) the transferee satisfies certain criteria; and (c) confirmation from Fitch, Moody’s and KBRA that the transfer will not result in a downgrade, withdrawal or qualification of the respective ratings assigned to the Series 2012-C6 Certificates is delivered.
The limited partnership and non-managing membership interests in the El Mercado Shopping Center Borrower are freely transferable at El Mercado Shopping Center Borrower’s sole cost and expense without the consent of lender so long as (i) the persons responsible for the management and/or control of the El Mercado Shopping Center Property and/or the El Mercado Shopping Center Borrower remain in legal, beneficial and actual control and (ii) the El Mercado Shopping Center Borrower remains in compliance with the representations, warranties, and covenants set forth in the loan documents.
Without lender consent, the El Mercado Shopping Center Borrower may not (i) transfer 49% or more of the interests in the El Mercado Shopping Center Borrower or (ii) change the management or control of the El Mercado Shopping Center Borrower.
Release. Not permitted.
Real Estate Substitution. Not permitted.
Subordinate and Mezzanine Indebtedness. Not permitted.
Other Additional Financing. Not permitted.
Ground Lease. None.
Terrorism Insurance. The loan documents require that the “all risk” insurance policy required to be maintained by the borrower provide coverage for terrorism in an amount equal to the full replacement cost of the El Mercado Shopping Center Property, as well as business interruption insurance covering no less than the 18-month period following the occurrence of a casualty event.
THE INFORMATION IN THIS STRUCTURAL AND COLLATERAL TERM SHEET IS NOT COMPLETE AND MAY BE AMENDED PRIOR TO THE TIME OF SALE. THIS TERM SHEET IS NOT AN OFFER TO SELL THESE SECURITIES AND IT IS NOT A SOLICITATION OF AN OFFER TO BUY THESE SECURITIES IN ANY JURISDICTION WHERE THE OFFER OR SALE IS NOT PERMITTED.
92
[THIS PAGE INTENTIONALLY LEFT BLANK.]
93
Sunwest Portfolio
Loan Information
Mortgage Loan Seller: | Basis Real Estate Capital II, LLC | |
Credit Assessment (Fitch/Moody’s/KBRA): | NAP | |
Original Principal Balance: | $19,500,000 | |
Cut-off Date Principal Balance: | $19,500,000 | |
% of Initial Pool Balance: | 2.1% | |
Loan Purpose: | Refinance | |
Borrower Name: | Rainier Sunwest 2012, LLC | |
Sponsor: | J. Kenneth Dunn | |
Mortgage Rate: | 6.000% | |
Note Date: | March 7, 2012 | |
Anticipated Repayment Date: | NAP | |
Maturity Date: | April 1, 2022 | |
IO Period: | None | |
Loan Term (Original): | 120 months | |
Seasoning: | 0 months | |
Amortization Term (Original): | 271 months | |
Loan Amortization Type(1): | Amortizing Balloon | |
Interest Accrual Method: | Actual/360 | |
Call Protection: | L(24),D(93),O(3) | |
Lockbox Type: | Hard/Upfront Cash Management | |
Additional Debt: | None | |
Additional Debt Type: | NAP | |
Escrows and Reserves:
Type: | Initial | Monthly | Cap (If Any) | |||
Real Estate Tax | $169,299 | $54,218 | NAP | |||
Insurance | $25,090 | $4,302 | NAP | |||
Deferred Maintenance(2) | $241,678 | NAP | NAP | |||
Replacement Reserves(3) | $0 | $3,617 | NAP | |||
TI/LC | $0 | (4) | $750,000 | |||
Debt Service | $0 | (5) | $200,000 | |||
Wichita Lease | $28,500 | (6) | $114,000 | |||
Ground Rent(7) | $22,686 | $9,403 | NAP | |||
Environmental(8) | $13,188 | NAP | NAP |
Property Information
Single Asset/Portfolio: | Portfolio | |
Property Type: | Retail | |
Specific Property Type: | Various – See Table | |
Location: | Various – See Table | |
Size: | 611,528 SF | |
Cut-off Date Principal | ||
Balance Per Unit/SF: | $31.89 | |
Year Built/Year Renovated: | Various – See Table | |
Occupancy %: | 98.5% | |
Occupancy % Source Date: | January 30, 2012 | |
Title Vesting: | Various – See Table | |
Property Manager: | Emersons Commercial Management | |
3rd Most Recent NOI (As of): | $2,542,272(12/31/2009) | |
2nd Most Recent NOI (As of): | $2,766,792(12/31/2010) | |
Most Recent NOI (As of): | $2,641,252(12/31/2011) | |
U/W Revenues: | $3,750,830 | |
U/W Expenses: | $1,258,345 | |
U/W NOI: | $2,492,486 | |
U/W NCF: | $2,133,000 | |
U/W NOI DSCR: | 1.58x | |
U/W NCF DSCR: | 1.35x | |
U/W NOI Debt Yield: | 12.8% | |
U/W NCF Debt Yield: | 10.9% | |
As-Is Appraised Value: | $29,265,000 | |
As-Is Appraisal Valuation Date: | Various | |
Cut-off Date LTV Ratio: | 66.6% | |
LTV Ratio at Maturity or ARD: | 48.3% | |
| (1) | There are 5 mortgaged properties that secure the Sunwest Portfolio Mortgage Loan (totaling 113,359 square feet or 18.5% of the portfolio’s net rentable square feet that represent $2,850,000 of the allocated loan proceeds) that amortize according to a 10-year amortization schedule (the “Self-Amortizing Properties”). The portion of the Sunwest Portfolio Mortgage Loan that is allocated to the remaining 20 mortgaged properties is $16,650,000 and amortizes according to a 30-year amortization schedule. |
| (2) | The Sunwest Portfolio property condition reports have identified $775,297 in total deferred maintenance, of which the Borrower is responsible for $193,342 (the “Borrower’s Required Repairs Responsibility”) and certain tenants are responsible for $581,995 (the “Tenants’ Required Repairs Responsibility”). A required repair reserve of $241,678 equal to 125% of the Borrower’s Required Repair Responsibility was established at loan closing. In lieu of collecting an upfront required repair deposit to cover the Tenants’ Required Reserve Responsibility, the Borrower and Sponsor have provided a guaranty (completion and lien free performance) for the completion of the Tenants’ Required Repairs Responsibility. |
| (3) | The Sunwest Portfolio property condition reports have identified $120,550 in necessary annual replacement reserves, of which the related Borrower is responsible for $43,406 per year (the “Borrower’s Replacement Reserve Responsibility”) and certain tenants are responsible for $77,144 (the “ Tenants’ Replacement Reserve Responsibility”). An ongoing monthly replacement reserve of $3,617 will be collected on each payment date to cover the Borrower’s Replacement Reserve Responsibility. In lieu of collecting replacement reserves for the Tenants’ Replacement Reserve Responsibility, the Borrower and Sponsor have provided a guaranty (completion and lien free performance) for the on-going repair items that are the Tenants’ Replacement Reserve Responsibility. |
| (4) | The TI/LC reserve will be funded monthly out of excess cash flow until, and for so long as, the balance in the TI/LC reserve is less than the TI/LC reserve cap of $750,000. |
| (5) | A debt service reserve will be funded monthly out of excess cash flow until, and for so long as, the balance in such debt service reserve is less than $200,000. |
| (6) | The Borrower is currently negotiating the possible renewal of the lease with the sole tenant at the Wichita Falls, Texas property, which is currently occupied under a month-to-month lease. To mitigate the risk of non-renewal: (i) $28,500 was deposited at closing into the Wichita Lease Reserve, which is an amount equal to 3 months of the current tenant’s rent and estimated expense recovery obligation; (ii) if, by September 6, 2012, the Borrower has not entered into a lease renewal or a new lease for a minimum term of 5 years and on terms otherwise reasonably acceptable to the Lender, then excess cash flow will be swept into the Wichita Lease Reserve until the amount in such reserve is equal to $114,000 (which is equal to 12 months of current rent and expense recovery obligation) and (iii) an affiliate of the Borrower has entered into a 5-year master lease at an annual minimum triple net rent of $81,566 plus recoveries, which lease will terminate on the earlier to occur of |
THE INFORMATION IN THIS STRUCTURAL AND COLLATERAL TERM SHEET IS NOT COMPLETE AND MAY BE AMENDED PRIOR TO THE TIME OF SALE. THIS TERM SHEET IS NOT AN OFFER TO SELL THESE SECURITIES AND IT IS NOT A SOLICITATION OF AN OFFER TO BUY THESE SECURITIES IN ANY JURISDICTION WHERE THE OFFER OR SALE IS NOT PERMITTED.
94
SUNWEST PORTFOLIO
| (a) March 7, 2017, and (b) the date the Borrower has entered into a lease renewal or a new lease for a minimum term of 5 years and on terms otherwise reasonably acceptable to Lender. The tenant obligations under the master lease are guaranteed by the Sponsor. |
| (7) | The Borrower is required to make monthly payments of $9,403 into the ground rent reserve account and the ground rent will be paid out of such ground rent reserve account. |
| (8) | An environmental reserve of $13,188 was established at closing. This represents 125% of the estimated costs provided by the Borrower and approved by engineer to encapsulate asbestos located in tile flooring at the Craig, CO and Vernal, UT properties. |
The mortgage loan (the “Sunwest Portfolio Mortgage Loan”) is secured by a first mortgage encumbering 19 single-tenant retail buildings and 6 multi-tenant anchored and unanchored retail centers; with such properties located in the following states: Texas (12), Colorado (3), Missouri (3), Kansas (2), Wyoming (2), Utah (1), Oklahoma (1) and Montana (1) (the “Sunwest Portfolio Properties”). The Sunwest Portfolio Mortgage Loan was 98.5% occupied by 33 tenants and 100.0% leased to 34 tenants as of January 30, 2012. The improvements consist of a total net rentable area of 611,528 square feet. The Sunwest Portfolio Properties were built between 1950 and 2009, with renovations occurring between 1987 and 2008.
The following table represents certain information relating to the Sunwest Portfolio Properties:
Property Name – Location | Specific Property Type | Allocated Cut-off Date Principal Balance | Total Occupancy | Year Built/Year Renovated | Net Rentable Area (SF) | Appraised Value | Title Vesting(1) | |||||||||||||
1937 Parker Road, Plano, TX | Anchored | $2,599,000 | 80.2% | 1988/NAP | 47,890 | $3,550,000 | Fee/Leasehold | |||||||||||||
2010 South Sheridan, Tulsa, OK | Anchored | 1,721,000 | 100.0% | 1979/NAP | 44,785 | 2,350,000 | Fee | |||||||||||||
2524 North Galloway, Mesquite, TX | Single Tenant | 1,677,000 | 100.0% | 1991/NAP | 36,874 | 2,350,000 | Fee | |||||||||||||
2770 Trinity Mills Road, Carrollton, TX | Single Tenant | 1,654,000 | 100.0% | 1983/NAP | 43,046 | 2,250,000 | Fee/Leasehold | |||||||||||||
100 Cleveland S.C., Cleveland, TX | Single Tenant | 1,508,000 | 100.0% | 1983/NAP | 38,438 | 2,060,000 | Fee/Leasehold | |||||||||||||
1201 South Stockton, Monahans, TX | Single Tenant | 1,208,000 | 100.0% | 1982/NAP | 30,375 | 1,650,000 | Fee/Leasehold | |||||||||||||
3065 Josey Lane, Carrollton, TX | Anchored | 1,025,000 | 100.0% | 1979/NAP | 26,810 | 2,150,000 | Leasehold | |||||||||||||
709 North Federal, Riverton, WY | Single Tenant | 882,000 | 100.0% | 1959/NAP | 23,463 | 1,200,000 | Fee | |||||||||||||
6400 Nieman Road, Shawnee, KS | Single Tenant | 809,000 | 100.0% | 1962/1995 | 19,022 | 1,100,000 | Fee/Leasehold | |||||||||||||
335 South Cedar Ridge, Duncanville, TX | Anchored | 682,000 | 100.0% | 1979/2008 | 30,885 | 1,575,000 | Fee/Leasehold | |||||||||||||
535 Green Street, Craig, CO | Unanchored | 659,000 | 100.0% | 1961/NAP | 18,539 | 900,000 | Fee/Leasehold | |||||||||||||
1300 North Highway 7, Blue Springs, MO | Single Tenant | 615,000 | 100.0% | 1973/2005 | 23,556 | 840,000 | Fee | |||||||||||||
1380 North Main Street, Vidor, TX | Single Tenant | 490,000 | 100.0% | 1983/2008 | 38,168 | 710,000 | Fee | |||||||||||||
14th Street & Grand Avenue, Billings, MT | Anchored | 486,000 | 100.0% | 1969/2005 | 22,080 | 900,000 | Leasehold | |||||||||||||
1818 Ninth Street, Wichita Falls, TX | Single Tenant | 476,000 | 100.0% | 1964/NAP | 19,340 | 650,000 | Fee/Leasehold | |||||||||||||
1343 Miner Street, Idaho Springs, CO | Single Tenant | 456,000 | 100.0% | 2009/NAP | 10,978 | 620,000 | Fee | |||||||||||||
280 West Main Street, Vernal, UT | Single Tenant | 439,000 | 100.0% | 1960/NAP | 13,558 | 600,000 | Fee | |||||||||||||
1605 West Pioneer Parkway, Arlington, TX | Single Tenant | 349,000 | 100.0% | 1974/NAP | 24,880 | 940,000 | Fee/Leasehold | |||||||||||||
712 West Commercial, Springfield, MO | Single Tenant | 337,000 | 100.0% | 1966/1987 | 20,663 | 460,000 | Fee/Leasehold | |||||||||||||
306 East Paisano Avenue, El Paso, TX | Single Tenant | 308,000 | 100.0% | 1950/NAP | 8,704 | 695,000 | Leasehold | |||||||||||||
111 Park Street, Powell, WY | Single Tenant | 249,000 | 100.0% | 1955/NAP | 7,918 | 350,000 | Fee/Leasehold | |||||||||||||
2215 South Marsalis Ave., Dallas, TX | Single Tenant | 244,000 | 100.0% | 1967/NAP | 20,223 | 375,000 | Fee/Leasehold | |||||||||||||
3510 Prospect, Kansas City, MO | Single Tenant | 229,000 | 100.0% | 1963/NAP | 19,240 | 350,000 | Fee/Leasehold | |||||||||||||
259 14th Street, Burlington, CO | Single Tenant | 217,000 | 100.0% | 1961/1988 | 7,493 | 340,000 | Fee/Leasehold | |||||||||||||
4601 Parallel Street, Kansas City, KS | Single Tenant | 181,000 | 100.0% | 1963/2002 | 14,600 | 300,000 | Fee/Leasehold | |||||||||||||
|
|
|
|
|
|
| ||||||||||||||
Total/Weighted Average | $ | 19,500,000 | 98.5% | 611,528 | $ | 29,265,000 | ||||||||||||||
| (1) | The fully extended ground lease expiration dates of the ground leases that encumber the Self-Amortizing Properties range from November 30, 2029 to April 30, 2046. The appraised value of the portfolio excluding the Self-Amortizing Properties is $23,005,000, which results in an adjusted loan-to-value ratio of 84.8% for the portfolio (assuming an original mortgage loan principal balance of $19.5 million). These ground leases do not grant notice and cure rights to the lender. However, the lender obtained title insurance on these properties and escrowed approximately 2 months of ground rent at closing. In addition, the Borrower is required to make monthly ground rent deposits of $9,403. In addition, excess cash flow will be retained in the rollover reserve if any space tenant (a) files a voluntary bankruptcy or insolvency proceeding, or if an involuntary bankruptcy or insolvency proceeding is commenced by any person (other than lender) against such leasehold tenant, (b) provides notice of its intent to terminate its lease or terminates its lease, (c) provides notice of its intent to close its business to the general public at its premises (i.e., “goes dark”) or closes its business to the general public at its premises, or (d) the earlier of (i) the date that is 6 months prior to the expiration date of any leasehold tenant’s lease and (ii) the date upon which any leasehold tenant fails, pursuant to the terms of its lease, to provide timely notice of its intent to renew its lease. |
THE INFORMATION IN THIS STRUCTURAL AND COLLATERAL TERM SHEET IS NOT COMPLETE AND MAY BE AMENDED PRIOR TO THE TIME OF SALE. THIS TERM SHEET IS NOT AN OFFER TO SELL THESE SECURITIES AND IT IS NOT A SOLICITATION OF AN OFFER TO BUY THESE SECURITIES IN ANY JURISDICTION WHERE THE OFFER OR SALE IS NOT PERMITTED.
95
SUNWEST PORTFOLIO
The following table presents certain information relating to the tenancies at the Sunwest Portfolio Properties:
Major Tenants
Tenant Name | Credit Rating (Fitch/ Moody’s/ S&P)(1) | Tenant NRSF | % of NRSF | Annual U/W Base Rent PSF | Annual U/W Base Rent | % of Total Annual U/W Base Rent | PSF Sales(2) | Occupancy Cost | Lease Expiration Date | |||||||||||||||||||
Major Tenants | ||||||||||||||||||||||||||||
24 Hour Fitness | NR/B3/B | 43,046 | 7.0 | % | $ | 5.75 | $247,515 | 8.2 | % | NAV | NAV | 10/31/2014 | ||||||||||||||||
Champions United Inc. | NR/NR/NR | 31,227 | 5.1 | % | $ | 7.25 | $226,396 | 7.5 | % | NAV | NAV | 4/30/2017 | ||||||||||||||||
HE Butt | NR/NR/NR | 38,438 | 6.3 | % | $ | 5.07 | $194,833 | 6.4 | % | $450 | 1.1% | 6/15/2013 | ||||||||||||||||
Just Fitness | NR/NR/NR | 36,874 | 6.0 | % | $ | 5.05 | $186,395 | 6.2 | % | NAV | NAV | 1/31/2021 | ||||||||||||||||
Office Depot | NR/NR/NR | 25,000 | 4.1 | % | $ | 6.60 | $165,000 | 5.5 | % | $161 | 4.4% | 5/31/2016 | ||||||||||||||||
Lowe’s Supermarket | NR/NR/NR | 30,375 | 5.0 | % | $ | 5.25 | $159,469 | 5.3 | % | $505 | 1.0% | 10/31/2012 | ||||||||||||||||
Brookshire Brothers | NR/NR/NR | 38,168 | 6.2 | % | $ | 1.99 | $75,954 | 2.5 | % | $315 | 0.6% | 1/31/2015 | ||||||||||||||||
|
|
|
|
|
|
|
| |||||||||||||||||||||
Seven Largest Tenants | 243,128 | 39.8 | % | $ | 5.16 | $1,255,561 | 41.5 | % | ||||||||||||||||||||
|
|
|
|
|
|
|
| |||||||||||||||||||||
Remaining 26 Tenants | 358,937 | 58.7 | % | $ | 4.71 | $1,690,064 | 55.8 | % | ||||||||||||||||||||
|
|
|
|
|
|
|
| |||||||||||||||||||||
Occupied Collateral Total | 602,065 | 98.5 | % | $ | 4.89 | $2,945,625 | 97.3 | % | ||||||||||||||||||||
|
|
|
|
|
|
|
| |||||||||||||||||||||
Leased But Not Yet Occupied(3) | 9,463 | 1.5 | % | $ | 8.55 | $80,909 | 2.7 | % | ||||||||||||||||||||
|
|
|
|
|
|
|
| |||||||||||||||||||||
Collateral Total | 611,528 | 100.0 | % | $ | 4.95 | $3,026,533 | 100.0 | % | ||||||||||||||||||||
|
|
|
|
|
|
|
| |||||||||||||||||||||
| (1) | Ratings are those of the parent company whether or not the parent guarantees the lease. |
| (2) | Sales per square foot and occupancy costs are for the twelve months ended December 31, 2010. Approximately 56% of the portfolio’s net rentable square feet is occupied by tenants that report sales, including most of the grocery tenants. The weighted average occupancy cost of grocery anchored tenants that report sales is 1.1%. |
| (3) | One 9,463 square feet tenant (1.5% of net rentable square feet) is currently completing improvements to its space and intends to open at the end of March, 2012; it would then start paying rent as of April 1, 2012. The lease expires April 30, 2017. |
THE INFORMATION IN THIS STRUCTURAL AND COLLATERAL TERM SHEET IS NOT COMPLETE AND MAY BE AMENDED PRIOR TO THE TIME OF SALE. THIS TERM SHEET IS NOT AN OFFER TO SELL THESE SECURITIES AND IT IS NOT A SOLICITATION OF AN OFFER TO BUY THESE SECURITIES IN ANY JURISDICTION WHERE THE OFFER OR SALE IS NOT PERMITTED.
96
SUNWEST PORTFOLIO
The following table presents certain information relating to the lease rollover schedule at the Sunwest Portfolio Properties:
Lease Expiration Schedule(1)
Year Ending December 31, | No. of Leases Expiring | Expiring NRSF | % of Total NRSF | Cumulative of Total NRSF | Cumulative % of Total NRSF | Annual U/W Base Rent | Annual U/W Base Rent PSF | |||||||||||||||||||
MTM | 1 | 19,340 | 3.16 | % | 19,340 | 3.16 | % | $81,566 | $4.22 | |||||||||||||||||
2012 | 0 | 0 | 0.00 | % | 19,340 | 3.16 | % | $0 | $0.00 | |||||||||||||||||
2013 | 5 | 99,313 | 16.24 | % | 118,653 | 19.40 | % | $508,787 | $5.12 | |||||||||||||||||
2014 | 5 | 98,094 | 16.04 | % | 216,747 | 35.44 | % | $507,083 | $5.17 | |||||||||||||||||
2015 | 5 | 75,892 | 12.41 | % | 292,639 | 47.85 | % | $240,549 | $3.17 | |||||||||||||||||
2016 | 7 | 81,008 | 13.25 | % | 373,647 | 61.10 | % | $424,130 | $5.24 | |||||||||||||||||
2017 | 3 | 70,690 | 11.56 | % | 444,337 | 72.66 | % | $314,624 | $4.45 | |||||||||||||||||
2018 | 1 | 13,027 | 2.13 | % | 457,364 | 74.79 | % | $66,698 | $5.12 | |||||||||||||||||
2019 | 0 | 0 | 0.00 | % | 457,364 | 74.79 | % | $0 | $0.00 | |||||||||||||||||
2020 | 0 | 0 | 0.00 | % | 457,364 | 74.79 | % | $0 | $0.00 | |||||||||||||||||
2021 | 2 | 56,569 | 9.25 | % | 513,933 | 84.04 | % | $283,413 | $5.01 | |||||||||||||||||
2022 | 2 | 44,545 | 7.28 | % | 558,478 | 91.33 | % | $283,465 | $6.36 | |||||||||||||||||
Thereafter | 3 | 43,587 | 7.13 | % | 602,065 | 98.45 | % | $235,310 | $5.40 | |||||||||||||||||
Vacant(2) | 0 | 9,463 | 1.55 | % | 611,528 | 100.00 | % | $80,909 | $8.55 | |||||||||||||||||
|
|
|
|
|
|
|
|
| ||||||||||||||||||
Total/Weighted Average | 34 | 611,528 | 100.00 | % | $3,026,533 | $4.95 | ||||||||||||||||||||
|
|
|
|
|
|
|
|
| ||||||||||||||||||
| (1) | Source: Information obtained from the underwritten rent roll. |
| (2) | One 9,463 square feet tenant (1.5% of net rentable square feet) is currently completing improvements to its space and intends to open at the end of March, 2012; it would then start paying rent as of April 1, 2012. The lease expires April 30, 2017. |
Operating History and Underwritten Net Cash Flow. The following table presents certain information relating to the Underwritten Net Cash Flow for the Sunwest Portfolio properties:
Cash Flow Analysis
| 2009 | 2010 | 2011 | U/W | U/W $ per SF | ||||||||||||||||
Gross Potential Rent | $ | 2,896,789 | $ | 2,988,809 | $ | 2,889,570 | $ | 3,026,533 | $ | 4.95 | ||||||||||
Total Reimbursables | 405,530 | 552,284 | 562,275 | 921,875 | 1.51 | |||||||||||||||
Other Income | 34,353 | 0 | 0 | 62,425 | 0.10 | |||||||||||||||
Less Vacancy & Credit Loss | 0 | 0 | 0 | (260,003 | ) | (0.43 | ) | |||||||||||||
|
|
|
|
|
|
|
|
|
| |||||||||||
Effective Gross Income | $ | 3,336,672 | $ | 3,541,093 | $ | 3,451,845 | $ | 3,750,830 | $ | 6.13 | ||||||||||
Total Operating Expenses | $794,400 | $ | 774,301 | $ | 810,593 | $ | 1,258,345 | $ | 2.06 | |||||||||||
|
|
|
|
|
|
|
|
|
| |||||||||||
Net Operating Income | $ | 2,542,272 | $ | 2,766,792 | $ | 2,641,252 | $ | 2,492,486 | $ | 4.08 | ||||||||||
TI/LC | 0 | 0 | 0 | 223,262 | 0.37 | |||||||||||||||
Capital Expenditures | 0 | 0 | 0 | 136,224 | 0.22 | |||||||||||||||
|
|
|
|
|
|
|
|
|
| |||||||||||
Net Cash Flow | $ | 2,542,272 | $ | 2,766,792 | $ | 2,641,252 | $ | 2,133,000 | $ | 3.49 | ||||||||||
NOI DSCR | 1.58x | |||||||||||||||||||
NCF DSCR | 1.35x | |||||||||||||||||||
NOI DY | 12.8% | |||||||||||||||||||
NCF DY | 10.9% | |||||||||||||||||||
THE INFORMATION IN THIS STRUCTURAL AND COLLATERAL TERM SHEET IS NOT COMPLETE AND MAY BE AMENDED PRIOR TO THE TIME OF SALE. THIS TERM SHEET IS NOT AN OFFER TO SELL THESE SECURITIES AND IT IS NOT A SOLICITATION OF AN OFFER TO BUY THESE SECURITIES IN ANY JURISDICTION WHERE THE OFFER OR SALE IS NOT PERMITTED.
97
Whole Foods
Loan Information
| ||
Mortgage Loan Seller: | The Royal Bank of Scotland | |
| Credit Assessment (Fitch/Moody’s/KBRA): | NAP | |
Original Principal Balance: | $19,500,000 | |
| Cut-off Date Principal Balance: | $19,500,000 | |
% of Initial Pool Balance: | 2.1% | |
Loan Purpose: | Refinance | |
Borrower Name: | North Halsted (Chicago), DST | |
Sponsor: | Syndicated Equities | |
Mortgage Rate: | 5.650% | |
Note Date: | March 5, 2012 | |
Anticipated Repayment Date: | NAP | |
Maturity Date: | April 1, 2022 | |
IO Period: | 24 months | |
Loan Term (Original): | 120 months | |
Seasoning: | 0 months | |
| Amortization Term (Original): | 360 months | |
Loan Amortization Type: | Interest-only, Amortizing Balloon | |
Interest Accrual Method: | Actual/360 | |
Call Protection: | L(24),D(92),O(4) | |
Lockbox Type: | Hard/Springing Cash Management | |
Additional Debt: | None | |
Additional Debt Type: | NAP | |
Escrows and Reserves:
Type: | Initial | Monthly | Cap (If Any) | |||
Taxes | $53,257 | $26,629 | NAP | |||
Insurance | $15,557 | $1,414 | NAP | |||
Replacement Reserves | $0 | $1,079 | NAP |
Property Information
| ||
Single Asset/Portfolio: | Single Asset | |
Property Type: | Retail | |
Specific Property Type: | Anchored | |
Location: | Chicago, IL | |
Size: | 43,169 SF | |
Cut-off Date Principal: | ||
Balance Per Unit/SF: | $451.71 | |
Year Built/Year Renovated: | 2007/NAP | |
Occupancy %: | 100.0% | |
Occupancy % Source Date: | April 1, 2012 | |
Title Vesting: | Leasehold(1) | |
Property Manager: | North Halsted Asset Manager, LLC | |
| 3rd Most Recent NOI (As of): | $1,749,992(12/31/2009) | |
| 2nd Most Recent NOI (As of): | $1,749,992(12/31/2010) | |
Most Recent NOI (As of): | $1,749,992(12/31/2011) | |
U/W Revenues: | $1,901,191 | |
U/W Expenses: | $57,036 | |
U/W NOI: | $1,844,156 | |
U/W NCF: | $1,826,422 | |
U/W NOI DSCR: | 1.37x | |
U/W NCF DSCR: | 1.35x | |
U/W NOI Debt Yield: | 9.5% | |
U/W NCF Debt Yield: | 9.4% | |
As-Is Appraised Value: | $28,150,000 | |
| As-Is Appraisal Valuation Date: | January 14, 2012 | |
Cut-off Date LTV Ratio: | 69.3% | |
| LTV Ratio at Maturity or ARD: | 60.9% | |
| (1) | The mortgaged property consists of the borrower’s fee interest in the facade and leasehold interest under a long-term space lease which has a remaining lease term that exceeds 94 years. The borrower has prepaid all rent due through July 2032. |
The Whole Foods mortgage loan is secured by a first mortgage encumbering a 99-year space lease for a 43,169 square foot grocery anchored retail property and associated parking garage, which are part of a larger mixed-use property in the Lakeview neighborhood of Chicago, IL (the “Whole Foods Property”). The Whole Foods Property is located in a dense infill location approximately three blocks from Wrigley Field, three blocks from the Addison Red Line train station and three blocks from Lake Shore Drive. The space lease commenced in June 2007 and is subleased by the sponsor to Whole Foods Market under a 25-year triple-net sublease, which also commenced in June 2007 and expires in 2032 subject to five, 5-year extension options. The Whole Foods Market sublease is guaranteed by Whole Foods Market, Inc. The Whole Foods sublease is triple-net and contains contractual rent steps every five years. See “Risk Factors – Risks Related to the Mortgage Loans – Loans Secured by Mortgages on a Leasehold Interest Will Subject Your Investment to a Risk of Loss Upon a Lease Default” and “Description of the Mortgage Pool – Certain Characteristics of the Mortgage Pool” in the Free Writing Prospectus for more information regarding the space lease.
THE INFORMATION IN THIS STRUCTURAL AND COLLATERAL TERM SHEET IS NOT COMPLETE AND MAY BE AMENDED PRIOR TO THE TIME OF SALE. THIS TERM SHEET IS NOT AN OFFER TO SELL THESE SECURITIES AND IT IS NOT A SOLICITATION OF AN OFFER TO BUY THESE SECURITIES IN ANY JURISDICTION WHERE THE OFFER OR SALE IS NOT PERMITTED.
98
WHOLE FOODS
The following table presents certain information relating to the tenancies at the Whole Foods Property:
Major Tenant
Tenant Name | Credit Rating (Fitch/ Moody’s/ S&P)(1) | Tenant NRSF | % of NRSF | Annual U/W Base Rent PSF | Annual U/W Base Rent | % of Total Annual U/W Base Rent(2) | Sales PSF(3) | Occupancy Costs | Lease Expiration Date | |||||||||||||||||||||||||||
Major Tenant | ||||||||||||||||||||||||||||||||||||
Whole Foods Market | NR/NR/BB+ | 43,169 | 100.0 | % | $45.40 | $1,959,991 | 100.0 | % | $709 | NAV | 6/30/2032 | |||||||||||||||||||||||||
|
|
|
|
|
|
|
|
|
|
|
|
|
| |||||||||||||||||||||||
Total Major Tenant - Collateral | 43,169 | 100.0 | % | $45.40 | $1,959,991 | 100.0 | % | |||||||||||||||||||||||||||||
| (1) | Certain ratings are those of the parent company whether or not the parent guarantees the lease. |
| (2) | The in-place rent is currently $1,749,992 but steps up to $1,959,991 in June 2012, $2,195,190 in June 2017, $2,458,613 in June 2022 and $2,753,647 in June 2027. |
| (3) | Sales per square foot are for the full year ending December 31, 2010. |
The following table presents certain information relating to the lease rollover schedule at the Whole Foods Property:
Lease Expiration Schedule(1)
Year Ending December 31, | No. of Leases Expiring | Expiring NRSF | % of Total NRSF | Cumulative of Total NRSF | Cumulative % of Total NRSF | Annual U/W Base Rent(2) | Annual U/W Base Rent PSF(3) | |||||||||||||||||||
MTM | 0 | 0 | 0.0 | % | 0 | 0.0 | % | $0 | $0.00 | |||||||||||||||||
2012 | 0 | 0 | 0.0 | % | 0 | 0.0 | % | $0 | $0.00 | |||||||||||||||||
2013 | 0 | 0 | 0.0 | % | 0 | 0.0 | % | $0 | $0.00 | |||||||||||||||||
2014 | 0 | 0 | 0.0 | % | 0 | 0.0 | % | $0 | $0.00 | |||||||||||||||||
2015 | 0 | 0 | 0.0 | % | 0 | 0.0 | % | $0 | $0.00 | |||||||||||||||||
2016 | 0 | 0 | 0.0 | % | 0 | 0.0 | % | $0 | $0.00 | |||||||||||||||||
2017 | 0 | 0 | 0.0 | % | 0 | 0.0 | % | $0 | $0.00 | |||||||||||||||||
2018 | 0 | 0 | 0.0 | % | 0 | 0.0 | % | $0 | $0.00 | |||||||||||||||||
2019 | 0 | 0 | 0.0 | % | 0 | 0.0 | % | $0 | $0.00 | |||||||||||||||||
2020 | 0 | 0 | 0.0 | % | 0 | 0.0 | % | $0 | $0.00 | |||||||||||||||||
2021 | 0 | 0 | 0.0 | % | 0 | 0.0 | % | $0 | $0.00 | |||||||||||||||||
2022 | 0 | 0 | 0.0 | % | 0 | 0.0 | % | $0 | $0.00 | |||||||||||||||||
Thereafter | 1 | 43,169 | 100.0 | % | 43,169 | 100.0 | % | $1,959,991 | $45.40 | |||||||||||||||||
Vacant | 0 | 0 | 0.0 | % | 43,169 | 100.0 | % | $0 | $0.00 | |||||||||||||||||
|
|
|
|
|
|
|
|
| ||||||||||||||||||
Total/Weighted Average | 1 | 43,169 | 100.0 | % | $1,959,991 | $45.40 | ||||||||||||||||||||
|
|
|
|
|
|
|
|
| ||||||||||||||||||
| (1) | Source: Information obtained from the underwritten rent roll. |
| (2) | The in-place rent is currently $1,749,992 but steps up to $1,959,991 in June 2012, $2,195,190 in June 2017, $2,458,613 in June 2022 and $2,753,647 in June 2027. |
| (3) | Annual U/W base rent PSF excludes vacant space. |
The following table presents historical occupancy percentages at the Whole Foods Property:
Historical Occupancy Percentages*
12/31/2009 | 12/31/2010 | 12/31/2011 | ||
| 100% | 100% | 100% |
| * Source: Information provided by the borrower. | ||||
THE INFORMATION IN THIS STRUCTURAL AND COLLATERAL TERM SHEET IS NOT COMPLETE AND MAY BE AMENDED PRIOR TO THE TIME OF SALE. THIS TERM SHEET IS NOT AN OFFER TO SELL THESE SECURITIES AND IT IS NOT A SOLICITATION OF AN OFFER TO BUY THESE SECURITIES IN ANY JURISDICTION WHERE THE OFFER OR SALE IS NOT PERMITTED.
99
WHOLE FOODS
The following table presents certain information relating to the historical operating performance and the Underwritten Net Cash Flow at the Whole Foods Property:
Cash Flow Analysis
| 2009 | 2010 | 2011 | U/W | U/W $ per SF | ||||||||||||||||
Base Rent | $ | 1,749,992 | $ | 1,749,992 | $ | 1,749,992 | $ | 1,959,991 | (1) | $ | 45.40 | |||||||||
Grossed Up Vacant Space | 0 | 0 | 0 | 0 | 0.00 | |||||||||||||||
Total Reimbursables | 0 | 0 | 0 | 0 | 0.00 | |||||||||||||||
Other Income | 0 | 0 | 0 | 0 | 0.00 | |||||||||||||||
Less Vacancy & Credit Loss | 0 | 0 | 0 | (58,800 | ) | (1.36 | ) | |||||||||||||
|
|
|
|
|
|
|
|
|
| |||||||||||
Effective Gross Income | $ | 1,749,992 | $ | 1,749,992 | $ | 1,749,992 | $ | 1,901,191 | $ | 44.04 | ||||||||||
Total Operating Expenses | $0 | $0 | $0 | $57,036 | $1.32 | |||||||||||||||
|
|
|
|
|
|
|
|
|
| |||||||||||
Net Operating Income | $ | 1,749,992 | $ | 1,749,992 | $ | 1,749,992 | $ | 1,844,156 | $ | 42.72 | ||||||||||
TI/LC | 0 | 0 | 0 | 13,417 | 0.31 | |||||||||||||||
Capital Expenditures | 0 | 0 | 0 | 4,317 | 0.10 | |||||||||||||||
|
|
|
|
|
|
|
|
|
| |||||||||||
Net Cash Flow | $ | 1,749,992 | $ | 1,749,992 | $ | 1,749,992 | $ | 1,826,422 | $ | 42.31 | ||||||||||
NOI DSCR | 1.30x | 1.30x | 1.30x | 1.37x | ||||||||||||||||
NCF DSCR | 1.30x | 1.30x | 1.30x | 1.35x | ||||||||||||||||
NOI DY | 9.0% | 9.0% | 9.0% | 9.5% | ||||||||||||||||
NCF DY | 9.0% | 9.0% | 9.0% | 9.4% | ||||||||||||||||
| (1) | The U/W NOI is higher than historical NOIs due to underwriting the contractual rent increase through June 15, 2012. The annual rent increases to $2,195,190 in June 2017, $2,458,613 in June 2022 and $2,753,647 in June 2027. |
THE INFORMATION IN THIS STRUCTURAL AND COLLATERAL TERM SHEET IS NOT COMPLETE AND MAY BE AMENDED PRIOR TO THE TIME OF SALE. THIS TERM SHEET IS NOT AN OFFER TO SELL THESE SECURITIES AND IT IS NOT A SOLICITATION OF AN OFFER TO BUY THESE SECURITIES IN ANY JURISDICTION WHERE THE OFFER OR SALE IS NOT PERMITTED.
100
[THIS PAGE INTENTIONALLY LEFT BLANK.]
101
Williams Centre Plaza
Loan Information
Mortgage Loan Seller: | Wells Fargo Bank, National Association | |
Credit Assessment | ||
(Fitch/Moody’s/KBRA): | NAP | |
Original Principal Balance: | $16,750,000 | |
Cut-off Date Principal Balance: | $16,605,456 | |
% of Initial Pool Balance: | 1.8% | |
Loan Purpose: | Refinance | |
Borrower Name: | The Plaza at Williams Centre, L.L.C. | |
Sponsors: | Donald L. Baker; George C. Larsen | |
Mortgage Rate: | 5.820% | |
Note Date: | June 16, 2011 | |
Anticipated Repayment Date: | NAP | |
Maturity Date: | July 1, 2021 | |
IO Period: | None | |
Loan Term (Original): | 120 months | |
Seasoning: | 9 months | |
Amortization Term (Original): | 360 months | |
Loan Amortization Type: | Amortizing Balloon | |
Interest Accrual Method: | Actual/360 | |
Call Protection: | L(33),GRTR 1% or YM(83),O(4) | |
Lockbox Type: | None | |
Additional Debt(1): | Yes | |
Additional Debt Type(1): | Future Unsecured Subordinate Debt | |
Escrows and Reserves:
Type: | Initial | Monthly | Cap (If Any) | |||
Taxes | $73,785 | $24,595 | NAP | |||
Insurance(2) | $0 | Springing | NAP | |||
Replacement Reserves | $0 | $1,345 | NAP | |||
TI/LC(3) | $0 | $10,728 | $257,468 | |||
Deferred Maintenance | $129,210 | $0 | NAP |
Property Information
Single Asset/Portfolio: | Single Asset | |
Property Type: | Retail | |
Specific Property Type: | Unanchored | |
Location: | Tucson, AZ | |
Size: | 108,914 SF | |
Cut-off Date Principal | ||
Balance Per Unit/SF: | $152.46 | |
Year Built/Renovated: | 1987/NAP | |
Occupancy %: | 92.5% | |
Occupancy % Source Date: | September 30, 2011 | |
Title Vesting: | Fee | |
Property Manager: | Larsen Baker LLC | |
3rd Most Recent NOI (As of): | $1,797,452(12/31/2009) | |
2nd Most Recent NOI (As of): | $1,661,692(12/31/2010) | |
Most Recent NOI (As of): | $1,808,952 (TTM 11/30/2011) | |
U/W Revenues: | $2,678,143 | |
U/W Expenses: | $875,624 | |
U/W NOI: | $1,802,519 | |
U/W NCF: | $1,657,647 | |
U/W NOI DSCR: | 1.53x | |
U/W NCF DSCR: | 1.40x | |
U/W NOI Debt Yield: | 10.9% | |
U/W NCF Debt Yield: | 10.0% | |
Appraised Value: | $25,500,000 | |
Appraisal Valuation Date: | April 28, 2011 | |
Cut-off Date LTV Ratio: | 65.1% | |
LTV Ratio at Maturity or ARD: | 55.4% | |
| (1) | Future unsecured debt is permitted from members of the borrower in an aggregate amount not to exceed 1% of outstanding principal balance of the Williams Centre Plaza mortgage loan. Subordination and standstill provisions required to be included in member loan documentation. |
| (2) | Monthly insurance escrow requirements are waived provided no event of default has occurred and is continuing and the borrower provides satisfactory evidence that the mortgaged property is insured in accordance with the loan documents. |
| (3) | An additional monthly deposit amount of $1,829 is required from August 1, 2011 through December 1, 2014 if the TI/LC reserve balance is less than the cap. |
The Williams Centre Plaza mortgage loan is secured by a first mortgage encumbering an unanchored retail center located in Tucson, Arizona (the “Williams Centre Plaza Property”). According to the appraisal, Tucson, Arizona is the second most populous city in the State of Arizona and has a 2010 population base of 540,084. The improvements consist of six, one to two-story buildings constructed between 1987 and 1992. The Williams Centre Plaza Property is part of Williams Centre, a master-planned mixed use development with approximately 236 single family homes, 344 apartment units, three hotels and more than 500,000 square feet of office space. Parking for the Williams Centre Plaza is provided by 582 spaces in surrounding surface parking, resulting in a ratio of approximately 5.3 spaces per 1,000 square feet of net rentable area. The Williams Centre Plaza Property was 92.5% leased as of September 30, 2011 by 32 tenants.
THE INFORMATION IN THIS STRUCTURAL AND COLLATERAL TERM SHEET IS NOT COMPLETE AND MAY BE AMENDED PRIOR TO THE TIME OF SALE. THIS TERM SHEET IS NOT AN OFFER TO SELL THESE SECURITIES AND IT IS NOT A SOLICITATION OF AN OFFER TO BUY THESE SECURITIES IN ANY JURISDICTION WHERE THE OFFER OR SALE IS NOT PERMITTED.
102
WILLIAMS CENTRE PLAZA
The following table presents certain information relating to the tenancies at the Williams Centre Plaza Property:
Major Tenants
Tenant Name | Credit Rating (Fitch/ Moody’s/ S&P)(1) | Tenant NRSF | % of NRSF | Annual U/W Base Rent PSF | Annual U/W Base Rent | % of Total Annual U/W Base Rent | Sales PSF(2) | Occupancy Cost(2) | Lease Expiration Date | |||||||||||||||||||
Anchor Tenants - Collateral |
| |||||||||||||||||||||||||||
Cactus Moon Café | NR/NR/NR | 11,800 | 10.8% | $28.00 | $330,400 | 17.2% | $221 | 28.8% | 8/31/2019 | |||||||||||||||||||
Fed-Ex Kinko’s | NR/Baa1/BBB | 6,858 | 6.3% | $20.50 | $140,589 | 7.3% | NAV | NAV | 6/30/2015(3) | |||||||||||||||||||
Olive Garden | BBB/Baa2/BBB | 8,650 | 7.9% | $14.55 | $125,882 | 6.6% | $767 | 4.9% | 8/14/2015 | |||||||||||||||||||
Coldwell Banker | NR/NR/NR | 7,234 | 6.6% | $16.50 | $119,333 | 6.2% | NAV | NAV | 5/31/2014(4) | |||||||||||||||||||
Aaron Brothers | NR/NR/NR | 6,500 | 6.0% | $17.00 | $110,500 | 5.8% | NAV | NAV | 2/28/2015 | |||||||||||||||||||
|
|
|
|
|
|
|
| |||||||||||||||||||||
Total Anchor Tenants - Collateral | 41,042 | 37.7% | $20.14 | $826,704 | 43.1% | |||||||||||||||||||||||
Non-Major Tenants | 59,667 | 54.8% | $18.27 | $1,090,398 | 56.9% | |||||||||||||||||||||||
|
|
|
|
|
|
|
| |||||||||||||||||||||
Occupied Collateral Total | 100,709 | 92.5% | $19.04 | $1,917,102 | 100.0% | |||||||||||||||||||||||
|
|
|
| |||||||||||||||||||||||||
Vacant Space | 8,205 | 7.5% | ||||||||||||||||||||||||||
|
|
|
| |||||||||||||||||||||||||
Collateral Total | 108,914 | 100.0% | ||||||||||||||||||||||||||
|
|
|
| |||||||||||||||||||||||||
| (1) | Certain ratings are those of the parent company whether or not the parent guarantees the lease. |
| (2) | Sales per square foot and occupancy costs are for the twelve months ended December 31, 2010. |
| (3) | Fed-Ex Kinko’s may terminate its lease at anytime on or after July 1, 2013 upon 6 months written notice. |
| (4) | Coldwell Banker has executed a new lease commencing August 1, 2012 and terminating July 31, 2017. The new lease includes a contraction of the leased area to 3,179 square feet and a base rent of $16.50 per square foot for 3 years, followed by $18.67 per square foot for 2 years. The new lease also includes a one-time right to terminate on July 31, 2015 upon providing 90 days prior written notice and payment of a $50,724 termination fee. |
The following table presents certain information relating to the lease rollover schedule at the Williams Centre Plaza Property:
Lease Expiration Schedule(1)
Year Ending | No. of Leases Expiring(2) | Expiring NRSF | % of Total NRSF | Cumulative of Total NRSF | Cumulative % of Total NRSF | Annual U/W Base Rent | Annual U/W Base Rent PSF | |||||||||||||||||||
MTM | 0 | 0 | 0.0% | 0 | 0.0% | $0 | $0.00 | |||||||||||||||||||
2012 | 3 | 4,395 | 4.0% | 4,395 | 4.0% | $73,680 | $16.76 | |||||||||||||||||||
2013 | 5 | 8,544 | 7.8% | 12,939 | 11.9% | $170,723 | $19.98 | |||||||||||||||||||
2014 | 7 | 16,399 | 15.1% | 29,338 | 26.9% | $284,303 | $17.34 | |||||||||||||||||||
2015 | 5 | 28,698 | 26.3% | 58,036 | 53.3% | $474,681 | $16.54 | |||||||||||||||||||
2016 | 4 | 12,264 | 11.3% | 70,300 | 64.5% | $202,457 | $16.51 | |||||||||||||||||||
2017 | 2 | 4,552 | 4.2% | 74,852 | 68.7% | $97,871 | $21.50 | |||||||||||||||||||
2018 | 1 | 810 | 0.7% | 75,662 | 69.5% | $14,580 | $18.00 | |||||||||||||||||||
2019 | 2 | 13,720 | 12.6% | 89,382 | 82.1% | $364,960 | $26.60 | |||||||||||||||||||
2020 | 1 | 3,200 | 2.9% | 92,582 | 85.0% | $60,800 | $19.00 | |||||||||||||||||||
2021 | 2 | 8,127 | 7.5% | 100,709 | 92.5% | $173,048 | $21.29 | |||||||||||||||||||
2022 | 0 | 0 | 0.0% | 100,709 | 92.5% | $0 | $0.00 | |||||||||||||||||||
Thereafter | 0 | 0 | 0.0% | 100,709 | 92.5% | $0 | $0.00 | |||||||||||||||||||
Vacant | 0 | 8,205 | 7.5% | 108,914 | 100.0% | $0 | $0.00 | |||||||||||||||||||
|
|
|
|
|
|
|
|
| ||||||||||||||||||
Total/Weighted Average | 32 | 108,914 | 100.0% | $1,917,102 | $19.04 | |||||||||||||||||||||
|
|
|
|
|
|
|
|
| ||||||||||||||||||
| (1) | Source: Information obtained from underwritten rent roll. |
| (2) | Certain tenants may have lease termination options that are exercisable prior to the originally stated expiration date of the subject lease and that are not considered in the Lease Expiration Schedule. |
The following table presents historical occupancy percentages at the Williams Centre Plaza Property:
Historical Occupancy Percentages*
12/31/2009 | 12/31/2010 | 12/31/2011 | ||
| 94% | 94% | 94% |
| * | Source: Information obtained from borrower rent roll. |
THE INFORMATION IN THIS STRUCTURAL AND COLLATERAL TERM SHEET IS NOT COMPLETE AND MAY BE AMENDED PRIOR TO THE TIME OF SALE. THIS TERM SHEET IS NOT AN OFFER TO SELL THESE SECURITIES AND IT IS NOT A SOLICITATION OF AN OFFER TO BUY THESE SECURITIES IN ANY JURISDICTION WHERE THE OFFER OR SALE IS NOT PERMITTED.
103
WILLIAMS CENTRE PLAZA
Operating History and Underwritten Net Cash Flow. The following table presents certain information relating to the historical operating performance and the Underwritten Net Cash Flow at the Williams Centre Plaza Property:
Cash Flow Analysis
| 2009 | 2010 | TTM 11/30/2011 | U/W | U/W $ per SF | ||||||||||||||||
Base Rent | $1,887,194 | $1,801,243 | $1,855,162 | $1,917,102 | $17.60 | |||||||||||||||
Grossed Up Vacant Space | 0 | 0 | 0 | 158,850 | 1.46 | |||||||||||||||
Percentage Rent | 79,635 | 66,292 | 66,292 | 66,292 | 0.61 | |||||||||||||||
Total Reimbursables | 653,554 | 632,757 | 686,624 | 757,808 | 6.96 | |||||||||||||||
Less Vacancy & Credit Loss | 0 | 0 | 0 | (221,909) | (2.04) | |||||||||||||||
|
|
|
|
|
|
|
|
|
| |||||||||||
Effective Gross Income | $2,620,384 | $2,500,292 | $2,608,078 | $2,678,143 | $24.59 | |||||||||||||||
Total Operating Expenses | $822,931 | $838,600 | $799,126 | $875,624 | $8.04 | |||||||||||||||
|
|
|
|
|
|
|
|
|
| |||||||||||
Net Operating Income | $1,797,452 | $1,661,692 | $1,808,952 | $1,802,519 | $16.55 | |||||||||||||||
TI/LC | 9,391 | 10,630 | 8,400 | 128,734 | 1.18 | |||||||||||||||
Capital Expenditures | 15,040 | 66,343 | 55,502 | 16,137 | 0.15 | |||||||||||||||
|
|
|
|
|
|
|
|
|
| |||||||||||
Net Cash Flow | $1,773,021 | $1,584,719 | $1,745,050 | $1,657,647 | $15.22 | |||||||||||||||
NOI DSCR | 1.52x | 1.41x | 1.53x | 1.53x | ||||||||||||||||
NCF DSCR | 1.50x | 1.34x | 1.48x | 1.40x | ||||||||||||||||
NOI DY | 10.8% | 10.0% | 10.9% | 10.9% | ||||||||||||||||
NCF DY | 10.7% | 9.5% | 10.5% | 10.0% | ||||||||||||||||
THE INFORMATION IN THIS STRUCTURAL AND COLLATERAL TERM SHEET IS NOT COMPLETE AND MAY BE AMENDED PRIOR TO THE TIME OF SALE. THIS TERM SHEET IS NOT AN OFFER TO SELL THESE SECURITIES AND IT IS NOT A SOLICITATION OF AN OFFER TO BUY THESE SECURITIES IN ANY JURISDICTION WHERE THE OFFER OR SALE IS NOT PERMITTED.
104
[THIS PAGE INTENTIONALLY LEFT BLANK.]
105
Claremont Village Square
Loan Information
Mortgage Loan Seller: | Wells Fargo Bank, National Association | |
Credit Assessment | ||
(Fitch/Moody’s/KBRA): | NAP | |
Original Principal Balance: | $15,100,000 | |
Cut-off Date Principal Balance: | $15,049,818 | |
% of Initial Pool Balance: | 1.6% | |
Loan Purpose: | Refinance | |
Borrower Name: | Claremont Village Expansion Borrower LLC | |
Sponsors: | Jonathan Tolkin | |
Mortgage Rate: | 5.230% | |
Note Date: | December 29, 2011 | |
Anticipated Repayment Date: | NAP | |
Maturity Date: | January 1, 2022 | |
IO Period: | None | |
Loan Term (Original): | 120 months | |
Seasoning: | 3 months | |
Amortization Term (Original): | 360 months | |
Loan Amortization Type: | Amortizing Balloon | |
Interest Accrual Method: | Actual/360 | |
Call Protection(1): | L(35),GRTR 1% or YM(81),O(4) | |
Lockbox Type: | Soft/Springing Cash Management | |
Additional Debt: | Yes | |
Additional Debt Type(2): | Subordinate Secured | |
Escrows and Reserves:
Type: | Initial | Monthly | Cap (If Any) | |||
Taxes | $68,080 | $17,020 | NAP | |||
Insurance | $16,765 | $1,863 | NAP | |||
Replacement Reserves | $0 | $1,602 | $80,000 | |||
TI/LC | $350,000 | $8,333 | $350,000 | |||
Deferred Maintenance | $4,900 | $0 | NAP |
Property Information
Single Asset/Portfolio: | Single Asset | |
Property Type: | Mixed Use | |
Specific Property Type: | Retail/Office | |
Location: | Claremont, CA | |
Size: | 96,119 SF | |
Cut-off Date Principal | ||
Balance Per Unit/SF: | $156.57 | |
Year Built/Renovated: | 2007/NAP | |
Occupancy %: | 91.8% | |
Occupancy % Source Date: | October 31, 2011 | |
Title Vesting: | Fee | |
Property Manager: | The Tolkin Group, Inc. | |
3rd Most Recent NOI (As of): | $1,971,753(12/31/2009) | |
2nd Most Recent NOI (As of): | $2,062,812(12/31/2010) | |
Most Recent NOI (As of): | $2,247,165 (TTM 10/31/2011) | |
U/W Revenues: | $2,488,217 | |
U/W Expenses: | $650,524 | |
U/W NOI: | $1,837,694 | |
U/W NCF: | $1,669,803 | |
U/W NOI DSCR: | 1.84x | |
U/W NCF DSCR: | 1.67x | |
U/W NOI Debt Yield: | 12.2% | |
U/W NCF Debt Yield: | 11.1% | |
Appraised Value: | $34,700,000 | |
Appraisal Valuation Date: | November 28, 2011 | |
Cut-off Date LTV Ratio: | 43.4% | |
LTV Ratio at Maturity or ARD: | 36.0% | |
| (1) | The yield maintenance premium is calculated based on an amount equal to the greater of: (i) 1% of the outstanding principal balance of the loan; and (ii) the excess of the sum of the present value, using a discount rate equal to 50 basis points plus a periodic Treasury yield of P&I through maturity date over the outstanding principal balance. |
| (2) | The Claremont Village Square mortgage loan has a non-pooled subordinate secured loan with a balance as of origination of $1,243,000. The subordinate secured loan is with the Claremont Redevelopment Agency, does not accrue interest, has an unlimited term and does not require regular debt service payments. The inplace total debt LTV ratio is 47.0%, the in-place total debt U/W NCF DSCR is 1.67x and the in-place total debt NCF Debt Yield is 10.2%. |
The Claremont Village Square mortgage loan is secured by a first mortgage encumbering a mixed use property located in Claremont, California (the “Claremont Village Square Property”). According to the appraisal, Claremont, California is in eastern Los Angeles County, has an estimated 2010 population base of 36,618 and is home to the Claremont College consortium. The improvements consist of six, one to three-story buildings with a total net rentable area of 96,119 square feet. Parking for the Claremont Village Square Property is provided by 495 spaces in an adjacent public parking garage (under agreement with the city of Claremont), resulting in a parking ratio of approximately 5.1 spaces per 1,000 square feet of net rentable area. The Claremont Village Square Property was 91.8% leased as of October 31, 2011 to 38 tenants.
THE INFORMATION IN THIS STRUCTURAL AND COLLATERAL TERM SHEET IS NOT COMPLETE AND MAY BE AMENDED PRIOR TO THE TIME OF SALE. THIS TERM SHEET IS NOT AN OFFER TO SELL THESE SECURITIES AND IT IS NOT A SOLICITATION OF AN OFFER TO BUY THESE SECURITIES IN ANY JURISDICTION WHERE THE OFFER OR SALE IS NOT PERMITTED.
106
CLAREMONT VILLAGE SQUARE
The following table presents certain information relating to the tenancies at the Claremont Village Square Property:
Major Tenants
Tenant Name | Credit Rating (Fitch/ Moody’s/ S&P)(1) | Tenant NRSF | % of NRSF | Annual U/W Base Rent PSF | Annual U/W Base Rent | % of Total Annual U/W Base Rent | Sales PSF(2) | Occupancy Cost(2) | Lease Expiration Date | |||||||||||||||||||||||||
Anchor Tenants - Collateral | ||||||||||||||||||||||||||||||||||
Technip USA | NR/NR/BBB+ | 16,966 | 17.7% | $18.00 | $305,388 | 15.2% | NAV | NAV | Various(3)(4 | ) | ||||||||||||||||||||||||
Casa Moreno | NR/NR/NR | 4,451 | 4.6% | $30.00 | $133,530 | 6.7% | $341 | 9.3% | 5/14/2020(5 | ) | ||||||||||||||||||||||||
Chico’s | NR/NR/NR | 3,706 | 3.9% | $30.00 | $111,180 | 5.6% | $342 | 10.3% | 9/30/2012 | |||||||||||||||||||||||||
American Apparel | NR/NR/NR | 3,694 | 3.8% | $27.00 | $99,738 | 5.0% | NAV | NAV | 9/30/2017 | |||||||||||||||||||||||||
La Parolaccia | NR/NR/NR | 3,034 | 3.2% | $30.00 | $91,020 | 4.5% | $359 | 9.7 | 4/30/2018 | |||||||||||||||||||||||||
|
|
|
|
|
|
|
| |||||||||||||||||||||||||||
Total Anchor Tenants - Collateral | 31,851 | 33.1% | $23.26 | $740,856 | 37.0% | |||||||||||||||||||||||||||||
Non-Major Tenants | 56,343 | 58.6% | $22.40 | $1,262,120 | 63.0% | |||||||||||||||||||||||||||||
|
|
|
|
|
|
|
| |||||||||||||||||||||||||||
Occupied Collateral Total | 88,194 | 91.8% | $22.71 | $2,002,976 | 100.0% | |||||||||||||||||||||||||||||
|
|
|
| |||||||||||||||||||||||||||||||
Vacant Space | 7,925 | 8.2% | ||||||||||||||||||||||||||||||||
|
|
|
| |||||||||||||||||||||||||||||||
Collateral Total | 96,119 | 100.0% | ||||||||||||||||||||||||||||||||
|
|
|
| |||||||||||||||||||||||||||||||
| (1) | Certain ratings are those of the parent company whether or not the parent guarantees the lease. |
| (2) | Sales per square foot and occupancy costs are for the twelve months ended on December 31, 2011. |
| (3) | Technip USA’s space is comprised of two leases as follows: a 11,581 square foot lease which expires on December 11, 2017 and a 5,385 square foot lease which expires December 11, 2012. |
| (4) | Technip has the right to terminate its 11,581 square foot lease commencing in January 2013 and upon providing 9 months prior notice. Upon termination, the tenant is required to pay a termination fee equal to all unamortized leasing costs and commissions and legal fees upon the termination date |
| (5) | Casa Moreno has the right to terminate its lease at anytime on or after November 30, 2012. |
The following table presents certain information relating to the lease rollover schedule at the Claremont Village Square Property:
Lease Expiration Schedule(1)(2)
Year Ending | No. of Leases Expiring | Expiring NRSF | % of Total NRSF | Cumulative of Total NRSF | Cumulative % of Total NRSF | Annual U/W Base Rent | Annual U/W Base Rent PSF | |||||||||||||||||||
MTM | 1 | 1,075 | 1.1% | 1,075 | 1.1% | $29,025 | $27.00 | |||||||||||||||||||
2012 | 6 | 16,326 | 17.0% | 17,401 | 18.1% | $346,548 | $21.23 | |||||||||||||||||||
2013 | 2 | 5,745 | 6.0% | 23,146 | 24.1% | $103,410 | $18.00 | |||||||||||||||||||
2014 | 8 | 11,031 | 11.5% | 34,177 | 35.6% | $237,054 | $21.49 | |||||||||||||||||||
2015 | 9 | 9,803 | 10.2% | 43,980 | 45.8% | $244,077 | $24.90 | |||||||||||||||||||
2016 | 3 | 4,741 | 4.9% | 48,721 | 50.7% | $112,020 | $23.63 | |||||||||||||||||||
2017 | 8 | 24,215 | 25.2% | 72,936 | 75.9% | $498,635 | $20.59 | |||||||||||||||||||
2018 | 4 | 6,430 | 6.7% | 79,366 | 82.6% | $171,948 | $26.74 | |||||||||||||||||||
2019 | 0 | 0 | 0.0% | 79,366 | 82.6% | $0 | $0.00 | |||||||||||||||||||
2020 | 1 | 4,451 | 4.6% | 83,817 | 87.2% | $133,530 | $30.00 | |||||||||||||||||||
2021 | 1 | 1,527 | 1.6% | 85,344 | 88.8% | $41,229 | $27.00 | |||||||||||||||||||
2022 | 1 | 2,850 | 3.0% | 88,194 | 91.8% | $85,500 | $30.00 | |||||||||||||||||||
Thereafter | 0 | 0 | 0.0% | 88,194 | 91.8% | $0 | $0.00 | |||||||||||||||||||
Vacant | 0 | 7,925 | 8.2% | 96,119 | 100.0% | $0 | $0.00 | |||||||||||||||||||
|
|
|
|
|
|
|
|
| ||||||||||||||||||
Total/Weighted Average | 44 | 96,119 | 100.0% | $2,002,976 | $22.71 | |||||||||||||||||||||
|
|
|
|
|
|
|
|
| ||||||||||||||||||
| (1) | Source: Information obtained from underwritten rent roll. |
| (2) | Certain tenants may have lease termination options that are exercisable prior to the originally stated expiration date of the subject lease and that are not considered in the Lease Expiration Schedule. |
The following table presents historical occupancy percentages at the Claremont Village Square Property:
Historical Occupancy Percentages*
12/31/2009 | 12/31/2010 | 12/31/2011 | ||
| 80% | 92% | 95% |
| * | Source: Information obtained from borrower rent roll. |
THE INFORMATION IN THIS STRUCTURAL AND COLLATERAL TERM SHEET IS NOT COMPLETE AND MAY BE AMENDED PRIOR TO THE TIME OF SALE. THIS TERM SHEET IS NOT AN OFFER TO SELL THESE SECURITIES AND IT IS NOT A SOLICITATION OF AN OFFER TO BUY THESE SECURITIES IN ANY JURISDICTION WHERE THE OFFER OR SALE IS NOT PERMITTED.
107
CLAREMONT VILLAGE SQUARE
Operating History and Underwritten Net Cash Flow. The following table presents certain information relating to the historical operating performance and the Underwritten Net Cash Flow at the Claremont Village Square Property:
Cash Flow Analysis
| 2009 | 2010 | TTM 10/31/2011 | U/W | U/W $ per SF | ||||||||||||||||
Base Rent | $2,121,233 | $2,262,741 | $2,349,487 | $2,002,976 | $20.84 | |||||||||||||||
Grossed Up Vacant Space | 0 | 0 | 0 | 193,833 | 2.02 | |||||||||||||||
Percentage Rent | 38,181 | 84,554 | 95,846 | 45,000 | 0.47 | |||||||||||||||
Total Reimbursables | 376,432 | 408,269 | 461,767 | 434,893 | 4.52 | |||||||||||||||
Other Income | 12,336 | 4,834 | 4,312 | 4,834 | 0.05 | |||||||||||||||
Less Vacancy & Credit Loss | 0 | 0 | 0 | (193,319) | (2.01) | |||||||||||||||
|
|
|
|
|
|
|
|
|
| |||||||||||
Effective Gross Income | $2,548,182 | $2,760,398 | $2,911,412 | $2,488,217 | $25.89 | |||||||||||||||
Total Operating Expenses | $576,429 | $697,586 | $664,247 | $650,524 | $6.77 | |||||||||||||||
|
|
|
|
|
|
|
|
|
| |||||||||||
Net Operating Income | $1,971,753 | $2,062,812 | $2,247,165 | $1,837,694 | $19.12 | |||||||||||||||
TI/LC | 0 | 0 | 0 | 148,667 | 1.55 | |||||||||||||||
Capital Expenditures | 0 | 0 | 0 | 19,224 | 0.20 | |||||||||||||||
|
|
|
|
|
|
|
|
|
| |||||||||||
Net Cash Flow | $1,971,753 | $2,062,812 | $2,247,165 | $1,669,803 | $17.37 | |||||||||||||||
NOI DSCR | 1.98x | 2.07x | 2.25x | 1.84x | ||||||||||||||||
NCF DSCR | 1.98x | 2.07x | 2.25x | 1.67x | ||||||||||||||||
NOI DY | 13.1% | 13.7% | 14.9% | 12.2% | ||||||||||||||||
NCF DY | 13.1% | 13.7% | 14.9% | 11.1% | ||||||||||||||||
THE INFORMATION IN THIS STRUCTURAL AND COLLATERAL TERM SHEET IS NOT COMPLETE AND MAY BE AMENDED PRIOR TO THE TIME OF SALE. THIS TERM SHEET IS NOT AN OFFER TO SELL THESE SECURITIES AND IT IS NOT A SOLICITATION OF AN OFFER TO BUY THESE SECURITIES IN ANY JURISDICTION WHERE THE OFFER OR SALE IS NOT PERMITTED.
108
[THIS PAGE INTENTIONALLY LEFT BLANK.]
109
Commerce Park IV & V
Loan Information
Mortgage Loan Seller: | The Royal Bank of Scotland | |
Credit Assessment | ||
(Fitch/Moody’s/KBRA): | NAP | |
Original Principal Balance: | $15,000,000 | |
Cut-off Date Principal Balance: | $14,985,810 | |
% of Initial Pool Balance: | 1.6% | |
Loan Purpose: | Refinance | |
Borrower Names: | Commerce Park IV & V Associates LLC; UI Commerce Park LLC | |
Sponsors: | Mark Munsell; Herbert Luxenburg | |
Mortgage Rate: | 5.482% | |
Note Date: | February 24, 2012 | |
Anticipated Repayment Date: | NAP | |
Maturity Date: | March 1, 2022 | |
IO Period: | None | |
Loan Term (Original): | 120 months | |
Seasoning: | 1 month | |
Amortization Term (Original): | 360 months | |
Loan Amortization Type: | Amortizing Balloon | |
Interest Accrual Method: | Actual/360 | |
Call Protection: | L(25),D(91),O(4) | |
Lockbox Type: | Hard/Springing Cash Management | |
Additional Debt: | None | |
Additional Debt Type: | NAP | |
Escrows and Reserves:
Type: | Initial | Monthly | Cap (If Any) | |||
Taxes | $259,437 | $49,937 | NAP | |||
Insurance(1) | $10,764 | $2,691 | NAP | |||
Capital Expenditures | $3,824 | $3,824 | NAP | |||
General TI/LC | $19,122 | $19,122 | $500,000 | |||
Tenant Specific Reserve(2) | $86,867 | $0 | NAP |
Property Information
Single Asset/Portfolio: | Single Asset | |
Property Type: | Office | |
Specific Property Type: | Suburban | |
Location: | Beachwood, OH | |
Size: | 229,459 SF | |
Cut-off Date Principal | ||
Balance Per Unit/SF: | $65.31 | |
Year Built/Renovated: | 1984/NAP | |
Occupancy %: | 93.2% | |
Occupancy % Source Date: | February 17, 2012 | |
Title Vesting: | Fee | |
Property Manager: | Munsell Realty Advisors | |
3rd Most Recent NOI (As of): | $1,734,311(12/31/2009) | |
2nd Most Recent NOI (As of): | $1,507,961(12/31/2010) | |
Most Recent NOI (As of): | $1,848,960(12/31/2011) | |
U/W Revenues: | $4,252,792 | |
U/W Expenses: | $2,199,959 | |
U/W NOI: | $2,052,833 | |
U/W NCF: | $1,777,482 | |
U/W NOI DSCR: | 2.01x | |
U/W NCF DSCR: | 1.74x | |
U/W NOI Debt Yield: | 13.7% | |
U/W NCF Debt Yield: | 11.9% | |
As-Is Appraised Value: | $24,100,000 | |
As-Is Appraisal Valuation | ||
Date: | January 17, 2012 | |
Cut-off Date LTV Ratio: | 62.2% | |
LTV Ratio at Maturity or ARD: | 52.0% | |
| (1) | The monthly insurance escrow will be waived as long as no event of default has occurred and is continuing and the insurance required to be maintained by the borrower is effected under an acceptable blanket policy. |
| (2) | The borrower deposited $86,867 in an upfront reserve to cover partial rent concessions associated with the Howard Wershbale & Company lease. Provided no event of default has occurred or is continuing, lender shall disburse these funds to the borrower in an amount equal to $21,717 on the payment dates occurring in August 2012, September 2012, October 2012 and November 2012. |
The Commerce Park IV & V mortgage loan is secured by a first mortgage encumbering two Class A office buildings that contain a total of 229,459 square feet (the “Commerce Park IV & V Property”). The Commerce IV & V Property is located on Chagrin Boulevard in Beachwood, Ohio, approximately 1.5 miles west of Interstate Highway I-271 and approximately 10 mile east of Downtown Cleveland, Ohio. As of February 17, 2012, the Commerce IV & V Property was 93.2% leased to 64 tenants. The Commerce IV & V Property contains 947 surface and underground garage parking spaces, resulting in a parking ratio of 4.13 spaces per 1,000 square feet.
THE INFORMATION IN THIS STRUCTURAL AND COLLATERAL TERM SHEET IS NOT COMPLETE AND MAY BE AMENDED PRIOR TO THE TIME OF SALE. THIS TERM SHEET IS NOT AN OFFER TO SELL THESE SECURITIES AND IT IS NOT A SOLICITATION OF AN OFFER TO BUY THESE SECURITIES IN ANY JURISDICTION WHERE THE OFFER OR SALE IS NOT PERMITTED.
110
COMMERCE PARK IV & V
The following table presents certain information relating to the tenancies at the Commerce Park IV & V Property:
Major Tenants
Tenant Name | Credit Rating (Fitch/ Moody’s/ S&P)(1) | Tenant NRSF | % of NRSF | Annual U/W Base Rent PSF | Annual U/W Base Rent | % of Total Annual U/W Base Rent | Lease Expiration Date | |||||||||||||||||||||
Major Tenants | ||||||||||||||||||||||||||||
Howard Wershbale & Company(2) | NR/NR/NR | 24,881 | 10.8% | $19.00 | $472,739 | 12.3% | 6/30/2018 | |||||||||||||||||||||
Dorsky & Associates | NR/NR/NR | 13,162 | 5.7% | $18.00 | 236,916 | 6.2% | 2/29/2016 | |||||||||||||||||||||
Windsor Laurelwood Center | NR/NR/NR | 9,085 | 4.0% | $14.00 | 127,190 | 3.3% | 8/31/2013 | |||||||||||||||||||||
University Hospital | NR/NR/NR | 8,756 | 3.8% | $14.77 | 129,326 | 3.4% | 8/31/2015 | |||||||||||||||||||||
|
|
|
|
|
|
|
| |||||||||||||||||||||
Total Major Tenants | 55,884 | 24.4% | $17.29 | $966,171 | 25.1% | |||||||||||||||||||||||
Non-Major Tenants | 157,902 | 68.8% | $18.27 | $2,884,697 | 74.9% | |||||||||||||||||||||||
|
|
|
|
|
|
|
| |||||||||||||||||||||
Occupied Collateral | 213,786 | 93.2% | $18.01 | $3,850,868 | 100.0% | |||||||||||||||||||||||
|
|
|
| |||||||||||||||||||||||||
Vacant Space | 15,673 | 6.8% | ||||||||||||||||||||||||||
|
|
|
| |||||||||||||||||||||||||
Collateral Total | 229,459 | 100.0% | ||||||||||||||||||||||||||
|
|
|
| |||||||||||||||||||||||||
| (1) | Certain ratings are those of the parent company whether or not the parent guarantees the lease. |
| (2) | Howard, Wershbale & Company has a one-time right to terminate its lease on August 31, 2016 provided that the tenant provides notification by November 30, 2015 and pays a termination fee equal to the sum of the unamortized cost of the improvements with 8% annual interest. The exercise will trigger a lease sweep period. |
The following table presents certain information relating to the lease rollover schedule at the Commerce Park IV & V Property:
Lease Expiration Schedule(1)
Year Ending | No. of Leases Expiring | Expiring NRSF | % of Total NRSF | Cumulative of Total NRSF | Cumulative % of Total NRSF | Annual U/W Base Rent | Annual U/W Base Rent PSF(2) | |||||||||||||||||||
MTM(3) | 3 | 1,890 | 0.8% | 1,890 | 0.8% | $3,900 | $2.06 | |||||||||||||||||||
2012 | 4 | 7,129 | 3.1% | 9,019 | 3.9% | $146,046 | $20.49 | |||||||||||||||||||
2013 | 11 | 43,663 | 19.0% | 52,682 | 23.0% | $766,577 | $17.56 | |||||||||||||||||||
2014 | 15 | 50,429 | 22.0% | 103,111 | 44.9% | $960,997 | $19.06 | |||||||||||||||||||
2015 | 13 | 30,088 | 13.1% | 133,199 | 58.0% | $528,902 | $17.58 | |||||||||||||||||||
2016 | 6 | 32,686 | 14.2% | 165,885 | 72.3% | $581,194 | $17.78 | |||||||||||||||||||
2017 | 4 | 14,379 | 6.3% | 180,264 | 78.6% | $215,450 | $14.98 | |||||||||||||||||||
2018 | 2 | 29,381 | 12.8% | 209,645 | 91.4% | $549,239 | $18.69 | |||||||||||||||||||
2019 | 3 | 4,141 | 1.8% | 213,786 | 93.2% | $98,563 | $23.80 | |||||||||||||||||||
2020 | 0 | 0 | 0.0% | 213,786 | 93.2% | $0 | $0.00 | |||||||||||||||||||
2021 | 0 | 0 | 0.0% | 213,786 | 93.2% | $0 | $0.00 | |||||||||||||||||||
2022 | 0 | 0 | 0.0% | 213,786 | 93.2% | $0 | $0.00 | |||||||||||||||||||
Thereafter | 0 | 0 | 0.0% | 213,786 | 93.2% | $0 | $0.00 | |||||||||||||||||||
Vacant | 0 | 15,673 | 6.8% | 229,459 | 100.0% | $0 | $0.00 | |||||||||||||||||||
|
|
|
|
|
|
|
|
| ||||||||||||||||||
Total / Weighted Average | 61 | 229,459 | 100.0% | $ | 3,850,868 | $ | 18.01 | |||||||||||||||||||
|
|
|
|
|
|
|
|
| ||||||||||||||||||
| (1) | Source: Information obtained from underwritten rent roll. |
| (2) | Annual U/W base rent PSF excludes vacant space. |
| (3) | Includes a management office (980 square feet) and conference room (712 square feet) that do not pay rent at the Commerce IV & V Property. |
The following table presents historical occupancy percentages at the Commerce Park IV & V Property:
Historical Occupancy Percentages*
12/31/2009 | 12/31/2010 | 12/31/2011 | ||
| 92% | 92% | 90% |
| * | Source: Information provided by the borrower. |
THE INFORMATION IN THIS STRUCTURAL AND COLLATERAL TERM SHEET IS NOT COMPLETE AND MAY BE AMENDED PRIOR TO THE TIME OF SALE. THIS TERM SHEET IS NOT AN OFFER TO SELL THESE SECURITIES AND IT IS NOT A SOLICITATION OF AN OFFER TO BUY THESE SECURITIES IN ANY JURISDICTION WHERE THE OFFER OR SALE IS NOT PERMITTED.
111
COMMERCE PARK IV & V
The following table presents certain information relating to the historical operating performance and the Underwritten Net Cash Flow at the Commerce Park IV & V Property:
Cash Flow Analysis
| 2009 | 2010 | 2011 | U/W | U/W $ per SF | ||||||||||||||||
Base Rent | $3,575,938 | $3,441,292 | $3,492,312 | $3,850,868 | $16.78 | |||||||||||||||
Grossed Up Vacant Space | 0 | 0 | 0 | 297,787 | 1.30 | |||||||||||||||
Total Reimbursables | 308,092 | 299,694 | 441,169 | 337,595 | 1.47 | |||||||||||||||
Other Income | 58,612 | 63,163 | 64,329 | 64,329 | 0.28 | |||||||||||||||
Less Vacancy & Credit Loss | 0 | 0 | 0 | (297,787) | (1.30) | |||||||||||||||
|
|
|
|
|
|
|
|
|
| |||||||||||
Effective Gross Income | $3,942,642 | $3,804,149 | $3,997,810 | $4,252,792 | $18.53 | |||||||||||||||
Total Operating Expenses | $2,208,331 | $2,296,188 | $2,148,850 | $2,199,959 | $9.59 | |||||||||||||||
|
|
|
|
|
|
|
|
|
| |||||||||||
Net Operating Income(1) | $1,734,311 | $1,507,961 | $1,848,960 | $2,052,833 | $8.95 | |||||||||||||||
TI/LC | 0 | 0 | 0 | 229,459 | 1.00 | |||||||||||||||
Capital Expenditures | 0 | 0 | 0 | 45,892 | 0.20 | |||||||||||||||
|
|
|
|
|
|
|
|
|
| |||||||||||
Net Cash Flow | $1,734,311 | $1,507,961 | $1,848,960 | $1,777,482 | $7.75 | |||||||||||||||
NOI DSCR | 1.70x | 1.48x | 1.81x | 2.01x | ||||||||||||||||
NCF DSCR | 1.70x | 1.48x | 1.81x | 1.74x | ||||||||||||||||
NOI DY | 11.6% | 10.1% | 12.3% | 13.7% | ||||||||||||||||
NCF DY | 11.6% | 10.1% | 12.3% | 11.9% | ||||||||||||||||
| (1) | The U/W NOI is higher than the historical NOIs due to several factors but not limited to new leases that were signed in 2012 as well as partial rent concession afforded to Howard Wershbale & Company, which were reserved at closing by the borrower. |
THE INFORMATION IN THIS STRUCTURAL AND COLLATERAL TERM SHEET IS NOT COMPLETE AND MAY BE AMENDED PRIOR TO THE TIME OF SALE. THIS TERM SHEET IS NOT AN OFFER TO SELL THESE SECURITIES AND IT IS NOT A SOLICITATION OF AN OFFER TO BUY THESE SECURITIES IN ANY JURISDICTION WHERE THE OFFER OR SALE IS NOT PERMITTED.
112
| WFRBS Commercial Mortgage Trust 2012-C6 | Transaction Contact Information |
| VI. | Transaction Contact Information |
Questions regarding this Structural and Collateral Term Sheet may be directed to any of the following individuals:
Wells Fargo Securities, LLC | RBS Securities Inc. | |||||
Kara McShane | Tel. (212) 214-5617 | Jeff Wilson | Tel. (203) 897-2900 | |||
| Fax (212) 214-8970 | ||||||
Brigid Mattingly | Tel. (312) 269-3062 | Adam Ansaldi | Tel. (203) 897-0881 | |||
| Fax (312) 658-0140 | Fax (203) 873-3542 | |||||
Matthew Orrino | Tel. (212) 214-5608 | Jim Barnard | Tel. (203) 897-4417 | |||
| Fax (212) 214-8970 | Fax (203) 873-4310 | |||||
THE INFORMATION IN THIS STRUCTURAL AND COLLATERAL TERM SHEET IS NOT COMPLETE AND MAY BE AMENDED PRIOR TO THE TIME OF SALE. THIS TERM SHEET IS NOT AN OFFER TO SELL THESE SECURITIES AND IT IS NOT A SOLICITATION OF AN OFFER TO BUY THESE SECURITIES IN ANY JURISDICTION WHERE THE OFFER OR SALE IS NOT PERMITTED.
113