
 | Arctic Project S-K 1300 Technical Report Summary Ambler Mining District, Alaska Report Date: November 30, 2022 Prepared for: Trilogy Metals Inc. 1150 – Granville Street Vancouver, British COlumbia Canada V7Y 1G5 Prepared by: Ausenco Engineering Canada Inc. 1050 W Pender St, Suite 1200
Vancouver, British Columbia
Canada V6E 4T3 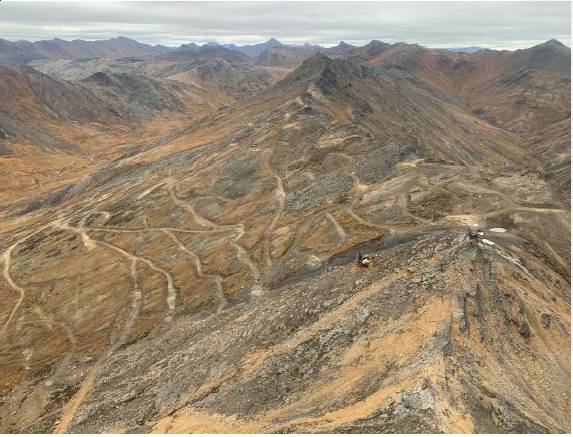
|
Table of Contents
| 1 | Executive Summary | 1 |
| | 1.1 | Introduction | 1 |
| | 1.2 | Property Description | 1 |
| | | 1.2.1 | Mineral Tenure, Surface Rights, Water Rights, Royalties and Agreements | 1 |
| | 1.3 | Accessibility, Climate, Local Resources, and Infrastructure | 2 |
| | 1.4 | History | 3 |
| | 1.5 | Geological Setting, Mineralization, and Deposit | 3 |
| | 1.6 | Exploration | 4 |
| | 1.7 | Sample Preparation, Analysis and Security | 4 |
| | 1.8 | Data Verification | 4 |
| | 1.9 | Mineral Processing and Metallurgical Testing | 5 |
| | 1.10 | Mineral Resource Estimates | 8 |
| | 1.11 | Mineral Reserve Estimates | 11 |
| | 1.12 | Mining Methods | 14 |
| | 1.13 | Processing and Recovery Methods | 14 |
| | 1.14 | Infrastructure | 15 |
| | | 1.14.1 | Infrastructure Requirements | 15 |
| | | 1.14.2 | Access | 16 |
| | | 1.14.3 | Power | 16 |
| | | 1.14.4 | Accommodation | 16 |
| | | 1.14.5 | Waste Rock Facility | 16 |
| | | 1.14.6 | Overburden Stockpiles | 17 |
| | | 1.14.7 | Tailings Management Facility | 17 |
| | | 1.14.8 | Water Management | 17 |
| | | 1.14.9 | Water Treatment Plant | 17 |
| | 1.15 | Market Studies | 18 |
| | 1.16 | Environmental Studies, Permitting, and Plans, Negotiations, or Agreements with Local Individuals or Groups | 18 |
| | | 1.16.1 | Permitting Considerations | 18 |
| | | 1.16.2 | Social and Community | 19 |
| | | 1.16.3 | Closure Planning | 20 |
| | 1.17 | Capital and Operating Cost Estimates | 20 |
| | | 1.17.1 | Capital Costs | 20 |
| | | 1.17.2 | Operating Costs | 21 |
| | 1.18 | Economic Analysis | 21 |
| | |
| Arctic Project | Page i |
| S-K 1300 Technical Report Summary | November 30, 2022 |
| | |
 |  |
| | |
| | 1.19 | Interpretations and Conclusions | 22 |
| | 1.20 | Recommendations | 22 |
| | | 1.20.1 | Mining | 23 |
| | | 1.20.2 | Geology and Resource Models | 23 |
| | | 1.20.3 | Open Pit Geotechnical work | 24 |
| | | 1.20.4 | Hydrogeology | 24 |
| | | 1.20.5 | Tailings Management Facility | 24 |
| | | 1.20.6 | Closure | 25 |
| | | 1.20.7 | Water Treatment | 25 |
| | | 1.20.8 | Metallurgical testing | 25 |
| | | 1.20.9 | Recovery methods | 25 |
| | | 1.20.10 | Operational Readiness Plan | 25 |
| 2 | Introduction | 27 |
| | 2.1 | Introduction | 27 |
| | 2.2 | Terms of Reference | 27 |
| | 2.3 | Qualified Persons | 27 |
| | 2.4 | Site Visits | 28 |
| | 2.5 | Currency of Report | 28 |
| | 2.6 | Information Sources and References | 28 |
| | 2.7 | Previous Reports | 29 |
| | 2.8 | Abbreviations and Acronyms | 29 |
| 3 | Property Description and Location | 36 |
| | 3.1 | Introduction | 36 |
| | 3.2 | Property Ownership | 37 |
| | 3.3 | Mineral Tenure | 37 |
| | 3.4 | Royalties, Agreements and Encumbrances | 42 |
| | | 3.4.1 | Kennecott Agreements | 42 |
| | | 3.4.2 | NANA Agreement | 42 |
| | 3.5 | State Royalty | 43 |
| | 3.6 | Surface Rights | 43 |
| | 3.7 | Environmental Considerations | 44 |
| | 3.8 | Permits | 44 |
| | 3.9 | Social Considerations | 44 |
| | 3.10 | Comment on Property Description and Location | 44 |
| 4 | ACESSIBILITY, CLIMATE, LOCAL RESOURCES, INFRASTRUCTURE and PHYSIOGRAPHY | 45 |
| | 4.1 | Accessibility | 45 |
| | | 4.1.1 | Air | 45 |
| | | 4.1.2 | Road | 45 |
| | | 4.1.3 | Water | 45 |
| | 4.2 | Climate | 45 |
| | |
| Arctic Project | Page ii |
| S-K 1300 Technical Report Summary | November 30, 2022 |
| | |
| | |
| | |
| | 4.3 | Local Resources and Infrastructure | 46 |
| | 4.4 | Physiography | 46 |
| | 4.5 | Comments on Accessibility, Climate, Local Resources, Infrastructure and Physiography | 47 |
| 5 | HISTORY | 48 |
| | 5.1 | Regional History | 48 |
| | 5.2 | Prior Ownership and Ownership Changes – Arctic Deposit and the Ambler Lands | 49 |
| | 5.3 | Previous Exploration and Development Results – Arctic Deposit | 49 |
| | | 5.3.1 | Introduction | 49 |
| | | 5.3.2 | Geochemistry | 56 |
| | | 5.3.3 | Geophysics | 56 |
| | | 5.3.4 | Drilling | 56 |
| | | 5.3.5 | Specific Gravity | 57 |
| | | 5.3.6 | Petrology, Mineralogy, and Research Studies | 57 |
| | | 5.3.7 | Geotechnical, Hydrogeological and Acid-Base Accounting Studies | 57 |
| | | | 5.3.7.1 | Geotechnical and Hydrogeological Studies | 57 |
| | | | 5.3.7.2 | Acid-Base Accounting Studies | 60 |
| | | 5.3.8 | Metallurgical Studies | 60 |
| | | 5.3.9 | Historical Mineral Resource and Mineral Reserve Estimates | 60 |
| | | 5.3.10 | Development Studies | 60 |
| 6 | Geological Setting, Mineralization, and Deposit | 62 |
| | 6.1 | Deposit Types | 62 |
| | | 6.1.1 | Deposit Model | 62 |
| | 6.2 | Regional Geology – Southern Brooks Range | 62 |
| | | 6.2.1 | Terrane Descriptions | 63 |
| | | 6.2.2 | Regional Tectonic Setting | 65 |
| | 6.3 | Local Geology | 65 |
| | | 6.3.1 | General Stratigraphy of the Ambler Sequence | 67 |
| | | 6.3.2 | Structural Framework of the Ambler Mining District | 69 |
| | | | 6.3.2.1 | F1 Deformation | 69 |
| | | | 6.3.2.2 | F2 Deformation | 70 |
| | 6.4 | Arctic Property Geology | 71 |
| | | 6.4.1 | Lithologies and Lithologic Domain Descriptions | 72 |
| | | | 6.4.1.1 | Greenstone (GNST) | 73 |
| | | | 6.4.1.2 | Chlorite Schist (ChS) | 73 |
| | | | 6.4.1.3 | Talc Schist (TS) | 73 |
| | | | 6.4.1.4 | Black to Grey Schist (GS) | 73 |
| | | | 6.4.1.5 | Button Schist (MRP) | 74 |
| | | | 6.4.1.6 | Quartz-Mica-(Feldspar) Schist (QMS/QFMS) | 74 |
| | | | 6.4.1.7 | Debris Flow (DM) | 74 |
| | | | 6.4.1.8 | Greywacke (GW) | 74 |
| | | | 6.4.1.9 | Lithogeochemistry of Immobile Trace Elements | 74 |
| | | | 6.4.1.10 | Lithologic Domains | 75 |
| | |
| Arctic Project | Page iii |
| S-K 1300 Technical Report Summary | November 30, 2022 |
| | |
| | |
| | |
| | | 6.4.2 | Structure | 75 |
| | | 6.4.3 | Arctic Deposit Alteration | 75 |
| | | 6.4.4 | Arctic Deposit Mineralization | 76 |
| | 6.5 | Prospects | 77 |
| 7 | EXPLORATION | 79 |
| | 7.1 | Exploration | 79 |
| | | 7.1.1 | Grids and Surveys | 81 |
| | | 7.1.2 | Geological Mapping | 81 |
| | | 7.1.3 | Geochemistry | 83 |
| | | 7.1.4 | Geophysics | 83 |
| | | 7.1.5 | Petrology, Minerology and Research Studies | 86 |
| | 7.2 | Drilling | 87 |
| | | 7.2.1 | Overview | 87 |
| | | 7.2.2 | Drill Companies | 98 |
| | | 7.2.3 | Drill Core Procedures | 100 |
| | | | 7.2.3.1 | BCMC/Kennecott | 100 |
| | | | 7.2.3.2 | NovaGold/Trilogy (formerly, NovaCopper)/Ambler Metals | 100 |
| | | 7.2.4 | Geotechnical and Hydrogeological Drilling | 101 |
| | | 7.2.5 | Collar Surveys | 104 |
| | | | 7.2.5.1 | Kennecott | 104 |
| | | | 7.2.5.2 | NovaGold/Trilogy (formerly, NovaCopper)/Ambler Metals | 104 |
| | | 7.2.6 | Downhole Surveys | 105 |
| | | 7.2.7 | Recovery | 105 |
| | | | 7.2.7.1 | Kennecott | 105 |
| | | | 7.2.7.2 | NovaGold/Trilogy (formerly, NovaCopper)/Ambler Metals | 105 |
| | | 7.2.8 | Drill Intercepts | 106 |
| 8 | Sample Preparation, Ananlyses and Security | 111 |
| | 8.1 | Sample Preparation | 111 |
| | | 8.1.1 | Core | 111 |
| | | | 8.1.1.1 | Kennecott and BCMC | 111 |
| | | | 8.1.1.2 | NovaGold/Trilogy (formerly, NovaCopper) | 111 |
| | | 8.1.2 | Acid-Base Accounting Sampling | 112 |
| | | 8.1.3 | Density Determinations | 113 |
| | | 8.1.4 | Sample Security | 114 |
| | | 8.1.5 | Assay Laboratories | 114 |
| | | 8.1.6 | Sample Preparation and Analytical Methods | 115 |
| | 8.2 | Quality Assurance/Quality Control | 116 |
| | | 8.2.1 | Database Verification | 116 |
| | | 8.2.2 | NovaGold QA/QC Review of Historical Analytical Results | 116 |
| | | 8.2.3 | NovaGold/Trilogy (2004 to 2019) QA/QC Results Review | 120 |
| | |
| Arctic Project | Page iv |
| S-K 1300 Technical Report Summary | November 30, 2022 |
| | |
| | |
| | |
| | | | 8.2.3.1 | 2004 | 121 |
| | | | 8.2.3.2 | 2005 | 121 |
| | | | 8.2.3.3 | 2006 | 121 |
| | | | 8.2.3.4 | 2007 | 121 |
| | | | 8.2.3.5 | 2008 | 121 |
| | | | 8.2.3.6 | 2011 (analysed in 2013) | 122 |
| | | | 8.2.3.7 | 2015 | 122 |
| | | | 8.2.3.8 | 2016 | 122 |
| | | | 8.2.3.9 | 2017 | 122 |
| | | | 8.2.3.10 | 2019 | 122 |
| | | 8.2.4 | Density Determination QA/QC | 123 |
| | | | 8.2.4.1 | Laboratory vs. Fields Determinations | 123 |
| | | | 8.2.4.2 | Stoichiometric Method | 124 |
| | | | 8.2.4.3 | Multiple Regressions Method | 125 |
| | | | 8.2.4.4 | Random Forest Machine Learning Method | 126 |
| | | | 8.2.4.5 | Comments on Density Determinations | 127 |
| | | 8.2.5 | Acid-Base Accounting Sampling QA/QC | 127 |
| | 8.3 | Comments on Sample Preparation, Analyses and Security | 128 |
| 9 | Data Verification | 129 |
| | 9.1 | Comments on Data Verification | 129 |
| 10 | Mineral Processing and Metallurgical Testing | 130 |
| | 10.1 | Introduction | 130 |
| | 10.2 | Historical Testwork Review | 132 |
| | | 10.2.1 | Metallurgical Testing – Kennecott Research Centre (1968 to 1976) | 132 |
| | | 10.2.2 | Metallurgical Testwork – Lakefield (1998 to 1999) | 133 |
| | 10.3 | Mineralogical and Metallurgical Testwork – 2012 to 2019 | 134 |
| | | 10.3.1 | Introduction | 134 |
| | | 10.3.2 | Test Samples | 135 |
| | | 10.3.3 | Mineralogical Investigations | 139 |
| | | 10.3.4 | Comminution Testwork | 140 |
| | | 10.3.5 | Flotation Testwork | 142 |
| | | 10.3.6 | Copper/Lead Separation Testwork | 145 |
| | 10.4 | Mineralogical and Metallurgical Testwork – 2021 to 2022 | 150 |
| | | 10.4.1 | Introduction | 150 |
| | | 10.4.2 | Test Samples | 151 |
| | | 10.4.3 | Mineralogical Investigations | 157 |
| | | | 10.4.3.1 | Talc Optimization Samples | 157 |
| | | | 10.4.3.2 | Flow Sheet Development Samples | 158 |
| | | | 10.4.3.3 | Variability Samples | 160 |
| | | 10.4.4 | Comminution Testwork | 162 |
| | | 10.4.5 | Flotation Testwork | 164 |
| | |
| Arctic Project | Page v |
| S-K 1300 Technical Report Summary | November 30, 2022 |
| | |
| | |
| | |
| | | | 10.4.5.1 | Talc Optimization Testwork | 164 |
| | | | 10.4.5.2 | Flowsheet Development Testwork | 165 |
| | | | 10.4.5.3 | Variability Testwork | 166 |
| | | | 10.4.5.4 | Copper/Lead Separation Testwork | 169 |
| | 10.5 | Comment on Mineral Processing and Metallurgical Testwork | 172 |
| 11 | Mineral Resource Estimates | 173 |
| | 11.1 | Introduction | 173 |
| | 11.2 | Drill Hole Database | 174 |
| | 11.3 | Interpretations and Geological Modelling Procedures | 177 |
| | | 11.3.1 | Lithology Modelling | 177 |
| | | 11.3.2 | Talc Modelling | 178 |
| | | 11.3.3 | Mineralization Domains | 179 |
| | 11.4 | Exploratory Data Analysis | 180 |
| | | 11.4.1 | Specific Gravity | 180 |
| | | 11.4.2 | Compositing | 183 |
| | | 11.4.3 | Grade Capping | 185 |
| | | 11.4.4 | Spatial Analysis | 185 |
| | | 11.4.5 | Block Model Setup | 193 |
| | 11.5 | Mineral Resource Estimation | 193 |
| | | 11.5.1 | Validation | 197 |
| | | | 11.5.1.1 | Visual Inspection | 197 |
| | | | 11.5.1.2 | Statistical Validation | 200 |
| | | | 11.5.1.3 | Swath Plots | 200 |
| | | | 11.5.1.4 | Validation of Block Model with the New Drill Holes | 207 |
| | | 11.5.2 | Mineral Resource Classification | 208 |
| | | 11.5.3 | Uncertainties Affecting Mineral Resource Confidence Classification | 210 |
| | | 11.5.4 | Reasonable Prospects for Economic Extraction | 210 |
| | | | 11.5.4.1 | Basis of Commodity Prices and Cost Assumptions | 210 |
| | | 11.5.5 | Mineral Resource Statement | 211 |
| 12 | Mineral Reserve Estimates | 213 |
| | 12.1 | Introduction | 213 |
| | 12.2 | Basis of Commodity Prices and Cost Assumptions Used in Pit Optimization and Cut-Off Determination | 213 |
| | 12.3 | Pit Optimization | 213 |
| | 12.4 | Dilution and Ore Losses | 217 |
| | 12.5 | Cut-Off Definition | 219 |
| | 12.6 | Mineral Reserves Statement | 220 |
| | 12.7 | Risk Factors that Could Materially Affect the Mineral Reserve Estimates | 220 |
| 13 | Mining Methods | 222 |
| | 13.1 | Overview | 222 |
| | 13.2 | Mine Design | 222 |
| | |
| Arctic Project | Page vi |
| S-K 1300 Technical Report Summary | November 30, 2022 |
| | |
| | |
| | |
| | 13.3 | Interim Phase Design | 227 |
| | 13.4 | Waste Rock Facilities and Stockpile Designs | 229 |
| | 13.5 | Production Schedule | 230 |
| | 13.6 | Waste Material Handling | 233 |
| | 13.7 | Operating Schedule | 233 |
| | 13.8 | Mining Equipment | 234 |
| | | 13.8.1 | Blasting | 234 |
| | | 13.8.2 | Drilling | 237 |
| | | 13.8.3 | Loading | 240 |
| | | 13.8.4 | Hauling | 243 |
| | | 13.8.5 | Support | 244 |
| | | 13.8.6 | Auxiliary | 246 |
| | | 13.8.7 | Labour | 247 |
| | 13.9 | Geotechnical and Hydrogeological Assessments | 248 |
| | | 13.9.1 | Data Sources | 249 |
| | | 13.9.2 | Geology and Structure | 249 |
| | | 13.9.3 | Geotechnical Laboratory Testing | 251 |
| | | 13.9.4 | Rock Mass Assessment | 254 |
| | | 13.9.5 | Kinematic Stability Assessment | 255 |
| | | 13.9.6 | Hydrogeology | 255 |
| | | 13.9.7 | Pit Inflow | 257 |
| | | 13.9.8 | Pore Pressure | 258 |
| | | 13.9.9 | Stability Modelling | 260 |
| | | 13.9.10 | Slope Design | 261 |
| | 13.10 | Geotechnical Review of Open Pit Design | 263 |
| | | 13.10.1 | Slope Stability Risks | 263 |
| | 13.11 | Geochemistry Assessment | 265 |
| | | 13.11.1 | Acid Base Accounting Studies | 265 |
| | | 13.11.2 | Geochemical Kinetic Studies | 265 |
| | | | 13.11.2.1 | Waste Rock Program | 265 |
| | | | 13.11.2.2 | Tailings Program | 266 |
| | | | 13.11.2.3 | Ore Program | 266 |
| 14 | Processing and Recovery Methods | 267 |
| | 14.1 | Overview | 267 |
| | 14.2 | Process Flowsheet and Area Plan | 267 |
| | 14.3 | Process Design Criteria | 271 |
| | 14.4 | Plant Description | 274 |
| | | 14.4.1 | Crushing Plant | 274 |
| | | 14.4.2 | Coarse Ore Storage | 274 |
| | | 14.4.3 | Grinding and Classification | 274 |
| | | | 14.4.3.1 | Primary Grinding and Classification | 274 |
| | |
| Arctic Project | Page vii |
| S-K 1300 Technical Report Summary | November 30, 2022 |
| | |
| | |
| | |
| | | 14.4.4 | Flotation | 275 |
| | | | 14.4.4.1 | Talc Pre-Flotation | 275 |
| | | | 14.4.4.2 | Copper – Lead Bulk Flotation and Regrinding | 275 |
| | | | 14.4.4.3 | Copper and Lead Separation Flotation Circuit | 276 |
| | | | 14.4.4.4 | Zinc Flotation and Regrind | 276 |
| | | 14.4.5 | Product Dewatering | 277 |
| | | | 14.4.5.1 | Copper Concentrate Dewatering | 277 |
| | | | 14.4.5.2 | Lead Concentrate Dewatering | 278 |
| | | | 14.4.5.3 | Zinc Concentrate Dewatering | 278 |
| | | 14.4.6 | Tailings Disposal | 279 |
| | | 14.4.7 | Reagent Handling and Storage | 279 |
| | | | 14.4.7.1 | Collectors | 279 |
| | | | 14.4.7.2 | Frother | 280 |
| | | | 14.4.7.3 | Lime | 280 |
| | | | 14.4.7.4 | Flocculant | 280 |
| | | | 14.4.7.5 | Other Reagents | 280 |
| | | 14.4.8 | Power Supply | 280 |
| | | 14.4.9 | Water Supply | 280 |
| | | | 14.4.9.1 | Fresh Water Supply System | 281 |
| | | | 14.4.9.2 | WRCP Water Supply System | 281 |
| | | | 14.4.9.3 | Process Water Supply System | 281 |
| | | 14.4.10 | Air Supply | 281 |
| | | 14.4.11 | Assay/Metallurgical Laboratory and Quality Control | 281 |
| | 14.5 | Personnel | 282 |
| 15 | Infrastructure | 283 |
| | 15.1 | Introduction | 283 |
| | 15.2 | Access Roads | 286 |
| | | 15.2.1 | Ambler Mining District Industrial Access Road | 286 |
| | | 15.2.2 | Arctic Access Road | 288 |
| | 15.3 | Airstrip | 290 |
| | 15.4 | Camps | 290 |
| | | 15.4.1 | Bornite Exploration Camp | 290 |
| | | 15.4.2 | Construction Camp | 290 |
| | | 15.4.3 | Permanent Accommodations Facility | 291 |
| | 15.5 | Fuel Supply, Storage and Distribution | 291 |
| | 15.6 | Power Generation | 291 |
| | 15.7 | Electrical System | 292 |
| | 15.8 | Surface Water Management | 292 |
| | | 15.8.1 | Process Water Supply | 295 |
| | | 15.8.2 | Water Management Infrastructure | 295 |
| | | | 15.8.2.1 | Diversions and Collection Channels | 295 |
| | |
| Arctic Project | Page viii |
| S-K 1300 Technical Report Summary | November 30, 2022 |
| | |
| | |
| | |
| | | | 15.8.2.2 | Culverts | 296 |
| | | | 15.8.2.3 | Collections Ponds | 297 |
| | | 15.8.3 | Waste Rock Collection Pond | 297 |
| | | 15.8.4 | Process Pond | 300 |
| | | 15.8.5 | Groundwater Management System | 300 |
| | | 15.8.6 | Site Water and Load Balance | 301 |
| | 15.9 | Water Treatment Plant | 301 |
| | 15.10 | Tailings Management Facility | 303 |
| | | 15.10.1 | General Description | 303 |
| | | 15.10.2 | Design Criteria | 303 |
| | | 15.10.3 | Overburden Geotechnical Investigation | 304 |
| | | 15.10.4 | Site Selection | 305 |
| | | 15.10.5 | Starter Dam | 305 |
| | | 15.10.6 | Dam Raises and Final Dam | 308 |
| | | 15.10.7 | TMF Water Pool and Water Return | 308 |
| | | 15.10.8 | Tailings Delivery and Return Systems | 308 |
| | 15.11 | Waste Rock Facility and Overburden Stockpiles | 308 |
| | | 15.11.1 | Waste Rock Facility | 309 |
| | | 15.11.2 | Overburden and Topsoil Stockpiles | 309 |
| | 15.12 | Compressed Air Supply | 309 |
| | 15.13 | Site Communications | 310 |
| | 15.14 | Fire Protection | 310 |
| | 15.15 | Plant Buildings | 310 |
| | | 15.15.1 | Truck Shop and Mine Offices | 310 |
| | | 15.15.2 | Laboratory | 311 |
| | | 15.15.3 | Administration Building | 311 |
| | | 15.15.4 | Mill Dry Facility | 311 |
| | | 15.15.5 | Plant Workshop and Warehouse | 311 |
| | | 15.15.6 | Primary Crushing | 311 |
| | | 15.15.7 | Crushed Ore Stockpile | 311 |
| | | 15.15.8 | Process Plant | 311 |
| | | 15.15.9 | Concentrate Loadout | 312 |
| | | 15.15.10 | Reagent Storage and Handling | 312 |
| | | 15.15.11 | Water Supply | 312 |
| | 15.16 | Concentrate Transportation | 312 |
| 16 | Market Studies | 314 |
| | 16.1 | Introduction | 314 |
| | 16.2 | Metal Prices | 314 |
| | 16.3 | Markets and Contracts | 317 |
| | | 16.3.1 | Chinese Import Restrictions | 318 |
| | | 16.3.2 | Copper Concentrate | 318 |
| | |
| Arctic Project | Page ix |
| S-K 1300 Technical Report Summary | November 30, 2022 |
| | |
| | |
| | |
| | | 16.3.3 | Zinc Concentrate | 318 |
| | | 16.3.4 | Lead Concentrate | 319 |
| | 16.4 | Smelter Term Assumptions | 320 |
| | | 16.4.1 | Copper | 321 |
| | | 16.4.2 | Zinc | 321 |
| | | 16.4.3 | Lead | 321 |
| | 16.5 | Transportation and Logistics | 322 |
| | 16.6 | Insurance | 322 |
| | 16.7 | Representation and Marketing | 322 |
| | 16.8 | Comments on Market Studies and Contracts | 322 |
| 17 | Environmental Studies, Permitting, and Plans, Negotiations, or Agreements with Local Individuals or Groups | 323 |
| | 17.1 | Environmental Studies | 323 |
| | | 17.1.1 | Hydrology | 323 |
| | | | 17.1.1.1 | Recommendations | 325 |
| | | 17.1.2 | Water Management | 325 |
| | | 17.1.3 | Wetlands Data | 326 |
| | | 17.1.4 | Aquatic Life Data | 326 |
| | | 17.1.5 | Hydrogeology Data | 328 |
| | | 17.1.6 | Cultural Resources Data | 329 |
| | | 17.1.7 | Subsistence Data | 330 |
| | | 17.1.8 | Endangered Species, Migratory Birds, and Bald and Golden Eagle protection | 331 |
| | | 17.1.9 | Metal Leaching / Acid Base Accounting Data | 331 |
| | 17.2 | Operational Site Monitoring | 332 |
| | 17.3 | Mine Reclamation and Closure | 332 |
| | | 17.3.1 | Reclamation and Closure Plan | 332 |
| | | 17.3.2 | Closure Objectives and Closure Criteria | 333 |
| | | 17.3.3 | Closure Activities | 333 |
| | | | 17.3.3.1 | Open Pit Workings | 336 |
| | | | 17.3.3.2 | Waste Rock Facility and Tailings Management Facility | 336 |
| | | | 17.3.3.3 | Buildings and Equipment | 337 |
| | | | 17.3.3.4 | Mine Infrastructure | 337 |
| | | | 17.3.3.5 | Landfill | 338 |
| | | | 17.3.3.6 | Water Management System | 338 |
| | | 17.3.4 | Closure Water Treatment | 338 |
| | | 17.3.5 | Post-Closure | 339 |
| | | 17.3.6 | Closure Cost Estimate | 339 |
| | | | 17.3.6.1 | General | 339 |
| | | | 17.3.6.2 | Closure Water Treatment Costs | 341 |
| | | 17.3.7 | Reclamation and Closure Financial Assurance | 341 |
| | 17.4 | Permitting Considerations | 342 |
| | |
| Arctic Project | Page x |
| S-K 1300 Technical Report Summary | November 30, 2022 |
| | |
| | |
| | |
| | | 17.4.1 | Exploration Permits | 342 |
| | | 17.4.2 | Major Mine Permits | 342 |
| | 17.5 | Social or Community Considerations | 344 |
| | 17.6 | Comment on Environmental Studies, Permitting, and Plans, Negotiations, or Agreements with Local Individuals or Groups | 345 |
| 18 | Capital and Operating Costs | 346 |
| | 18.1 | Capital Costs | 346 |
| | | 18.1.1 | Introduction | 346 |
| | | 18.1.2 | Arctic Project Execution | 346 |
| | | 18.1.3 | Work Breakdown Structure | 347 |
| | | 18.1.4 | Estimate Summary | 347 |
| | | 18.1.5 | Definition | 349 |
| | | | 18.1.5.1 | Definition of Costs | 349 |
| | | | 18.1.5.2 | General Methodology | 349 |
| | | | 18.1.5.3 | Basic Information | 350 |
| | | | 18.1.5.4 | Exchange Rates | 350 |
| | | | 18.1.5.5 | Market Availability | 350 |
| | | 18.1.6 | Mining (WBS 1000) | 351 |
| | | | 18.1.6.1 | Mining Capital Cost Basis of Estimate | 353 |
| | | | 18.1.6.2 | Mining Equipment | 353 |
| | | | 18.1.6.3 | Ancillary Equipment | 355 |
| | | | 18.1.6.4 | Capital Spares | 356 |
| | | | 18.1.6.5 | Other Capital Costs | 357 |
| | | 18.1.7 | Crushing and Process Plant (WBS 2000 & 3000) | 357 |
| | | 18.1.8 | Tailings Management Facility (WBS 4000) | 358 |
| | | 18.1.9 | Onsite Infrastructure (WBS 5000) | 359 |
| | | | 18.1.9.1 | Water Treatment Plant | 359 |
| | | | 18.1.9.2 | Other Onsite Infrastructure Costs | 359 |
| | | 18.1.10 | Offsite Infrastructure (WBS 6000) | 360 |
| | | | 18.1.10.1 | Main Access Road | 360 |
| | | | 18.1.10.2 | Other Offsite Infrastructure Costs | 360 |
| | | 18.1.11 | Indirects (WBS 7000) | 360 |
| | | 18.1.12 | Provisions / Contingency (WBS 8000) | 361 |
| | | 18.1.13 | Owner’s Costs (WBS 9000) | 362 |
| | | 18.1.14 | Sustaining Capital and Closure Costs | 363 |
| | 18.2 | Operating Cost Estimate | 364 |
| | | 18.2.1 | Operating Cost Summary | 364 |
| | | 18.2.2 | Mining Operating Cost Estimate | 365 |
| | | | 18.2.2.1 | Mining Operating Cost Basis of Estimate | 369 |
| | | | 18.2.2.2 | Personnel Costs | 369 |
| | | | 18.2.2.3 | Maintenance and Repair Cost | 370 |
| | | | 18.2.2.4 | Diesel and Fuel Consumption | 371 |
| | |
| Arctic Project | Page xi |
| S-K 1300 Technical Report Summary | November 30, 2022 |
| | |
| | |
| | |
| | | | 18.2.2.5 | Explosives Cost | 372 |
| | | | 18.2.2.6 | Tires Cost | 373 |
| | | | 18.2.2.7 | Other Operating Costs | 374 |
| | | 18.2.3 | Processing Operating Cost Estimate | 374 |
| | | | 18.2.3.1 | Power | 375 |
| | | | 18.2.3.2 | Consumables | 375 |
| | | | 18.2.3.3 | Maintenance Consumables | 376 |
| | | | 18.2.3.4 | Labour | 376 |
| | | 18.2.4 | General and Administrative and Surface Services Cost Estimates | 376 |
| | | 18.2.5 | Road Toll Cost Estimate | 378 |
| | | 18.2.6 | Water Treatment Costs | 378 |
| 19 | Economic Analysis | 379 |
| | 19.1 | Forward-Looking Information Cautionary Statements | 379 |
| | 19.2 | Methodology | 380 |
| | 19.3 | Financial Model Parameters | 380 |
| | 19.4 | Economic Analysis | 381 |
| | | 19.4.1 | Pre-Tax Financial Analysis | 381 |
| | | | 19.4.1.1 | Basis of Pre-Tax Financial Evaluation | 381 |
| | | | 19.4.1.2 | Pre-Tax Financial Results | 382 |
| | | 19.4.2 | Post-Tax Financial Analysis | 383 |
| | | | 19.4.2.1 | US Federal Tax | 383 |
| | | | 19.4.2.2 | Alaska State Tax | 384 |
| | | | 19.4.2.3 | Alaska Mining License Tax | 384 |
| | | | 19.4.2.4 | Post-Tax Financial Results | 384 |
| | 19.5 | Cash Flow | 384 |
| | 19.6 | Sensitivity Analysis | 388 |
| 20 | Adjacent Properties | 393 |
| 21 | Other Relevant Data and Information | 394 |
| | 21.1 | Project Execution Plan | 394 |
| | | 21.1.1 | Constraints and Interfaces | 394 |
| | | 21.1.2 | Key Project Milestones | 394 |
| | | 21.1.3 | Proven Technology | 396 |
| | | 21.1.4 | Engineering, Procurement and Construction Management Approach | 396 |
| | | | 21.1.4.1 | Early Engineering Only with 2-Stage Procurement | 396 |
| | | | 21.1.4.2 | Early EPCM Leading to Plant Care and Maintenance | 397 |
| 22 | Interpretations and Conclusions | 398 |
| | 22.1 | Introduction | 398 |
| | 22.2 | Mineral Tenure, Surface Rights, Royalties and Agreements | 398 |
| | 22.3 | Geology and Mineralization | 398 |
| | |
| Arctic Project | Page xii |
| S-K 1300 Technical Report Summary | November 30, 2022 |
| | |
| | |
| | |
| | 22.4 | Exploration, Drilling and Analytical Data Collection in Support of Mineral Resource Estimation | 398 |
| | 22.5 | Metallurgical Testwork | 399 |
| | 22.6 | Mineral Resource Estimates | 399 |
| | 22.7 | Mineral Reserve Estimates | 400 |
| | 22.8 | Mining Recovery | 401 |
| | 22.9 | Recovery Methods | 401 |
| | 22.10 | Infrastructure | 401 |
| | 22.11 | Environmental, Permitting and Social | 402 |
| | 22.12 | Market Studies and Contracts | 402 |
| | 22.13 | Capital Costs | 403 |
| | 22.14 | Operating Costs | 403 |
| | 22.15 | Economic Analysis | 404 |
| | 22.16 | Conclusions | 404 |
| | 22.17 | Risks and Opportunities | 404 |
| | | 22.17.1 | Permitting | 404 |
| | | 22.17.2 | Mining | 404 |
| | | 22.17.3 | Geotechnical | 404 |
| | | 22.17.4 | Hydrogeology | 405 |
| | | 22.17.5 | Tailings Management, Waste Rock and Water Management Facilities | 406 |
| | | 22.17.6 | Hydrology | 407 |
| | | 22.17.7 | Water and Load Balance | 408 |
| | | 22.17.8 | Metallurgical Testwork | 409 |
| 23 | Recommendations | 410 |
| | 23.1 | Introduction | 410 |
| | 23.2 | Mining | 410 |
| | 23.3 | Geology and Resource Models | 411 |
| | 23.4 | Open Pit Geotechnical work | 412 |
| | 23.5 | Hydrogeology | 412 |
| | 23.6 | Tailings Management Facility | 413 |
| | 23.7 | Closure | 413 |
| | 23.8 | Water Treatment | 414 |
| | 23.9 | Metallurgical testing | 414 |
| | 23.10 | Recovery Methods | 414 |
| | 23.11 | Operational Readiness Plan | 414 |
| 24 | References | 416 |
| 25 | RELIANCE ON INFORMATION PROVIDED BY THE REGISTRANT | 424 |
| | 25.1 | Introduction | 424 |
| | 25.2 | Legal Matters | 424 |
| | 25.3 | Taxation | 424 |
| | 25.4 | Environmental Matters and Community Accommodations | 425 |
| | 25.5 | Marketing Information | 425 |
Appendix A – Mineral Claims
| | |
| Arctic Project | Page xiii |
| S-K 1300 Technical Report Summary | November 30, 2022 |
| | |
List of Tables
| Table 1-1: | Comparison of Bulk versus Sequential Locked-Cycle Test Results – ALS 2021 | 7 |
| Table 1-2: | Summary of Overall Metal Recovery – Arctic Project | 8 |
| Table 1-3: | Mineral Resource Summary Table, Inclusive of Mineral Reserves | 10 |
| Table 1-4: | Mineral Resource Summary Table, Exclusive of Mineral Reserves | 10 |
| Table 1-5: | Optimization Inputs | 11 |
| Table 1-6: | Mineral Reserve Statement | 13 |
| Table 1-7: | LOM Average Recovery and Grade | 15 |
| Table 1-8: | Capital Cost Summary | 20 |
| Table 1-9: | Overall Operating Cost Estimate | 21 |
| Table 1-10: | Summary of Recommended Work Packages | 23 |
| Table 2-1: | Report Contributors | 27 |
| Table 2-2: | Unit Abbreviations | 29 |
| Table 2-3: | Acronyms and Abbreviations | 31 |
| Table 5-1: | Known Mapping, Geochemical, and Geophysical Programs Targeting VMS Prospects in the Ambler Mining District | 51 |
| Table 5-2: | Summary of Previous Geotechnical and Hydrogeological Work Completed After 1998 | 58 |
| Table 5-3: | Mining and Technical Services | 61 |
| Table 7-1: | Summary of NovaGold/Trilogy/Ambler Metals Exploration Activities Targeting VMS-style Mineralization in the Ambler Sequence Stratigraphy and the Arctic Deposit | 79 |
| Table 7-2: | TDEM Loops and Locations | 84 |
| Table 7-3: | Companies, Campaigns, Drill Holes and Meters Drilled at the Arctic Deposit | 87 |
| Table 7-4: | Summary of NovaGold/Trilogy/Ambler Metals Arctic Deposit Drilling | 88 |
| Table 7-5: | Drill, Meterage and Average Drill Depth for Ambler Sequence VMS Targets | 90 |
| Table 7-6: | Ambler Metals Exploration Drilling – Ambler Schist Belt | 91 |
| Table 7-7: | 2019-2021 Regional Prospect Drilling Significant Intercepts | 92 |
| Table 7-8: | Drill Contractors, Drill Holes, Meterage and Core Sizes by Drill Campaign at the Arctic Deposit | 99 |
| Table 7-9: | Summary of Geotechnical Drilling | 101 |
| Table 7-10: | Summary of Geotechnical Drilling by Year and Purposes | 102 |
| Table 7-11: | Recovery and RQD 2004 to 2008 Arctic Drill Campaigns | 106 |
| Table 8-1: | Analytical Laboratories used for Acid Base Accounting and Kinetic Studies for the Arctic Project | 113 |
| | |
| Arctic Project | Page xiv |
| S-K 1300 Technical Report Summary | November 30, 2022 |
| | |
| | |
| | |
| Table 8-2: | Analytical Laboratories Used by Operators of the Arctic Project | 115 |
| Table 10-1: | Summary of Overall Forecast Metal Recovery – Arctic Deposit | 131 |
| Table 10-2: | Summary of Testwork Chronology and Reporting | 131 |
| Table 10-3: | Head Analysis, Lakefield Research 1999 | 133 |
| Table 10-4: | Flotation Test on Ambler Low Talc Composite | 134 |
| Table 10-5: | SGS Burnaby Head Grades – Composite Samples – 2012 | 135 |
| Table 10-6: | ALS Metallurgy Head Grades – Composite Samples – 2017 | 136 |
| Table 10-7: | Mineral Modal Abundance for Composite Samples – SGS Burnaby 2012 | 139 |
| Table 10-8: | Bond Ball Mill Work Index and Abrasion Index Test Results | 140 |
| Table 10-9: | Summary of SMC Test Results and Additional BMI Data | 141 |
| Table 10-10: | Summary of Locked Cycle Recovery Data for Composite Sample Testing | 143 |
| Table 10-11: | Locked Cycle Metallurgical Test Results – SGS Burnaby 2012 | 144 |
| Table 10-12: | Locked Cycle Metallurgical Test Results – ALS Metallurgy 2017 | 144 |
| Table 10-13: | SGS Burnaby Open Circuit Copper and Lead Separation Test Results | 146 |
| Table 10-14: | ALS Metallurgy Locked Cycle Testing of Copper-Lead Separation Process | 146 |
| Table 10-15: | Summary of Lead Concentrate Grades for Various Talc Grades in Feed | 147 |
| Table 10-16: | Summary of Flotation Reagent and Grind Size Objectives | 148 |
| Table 10-17: | Summary of Lead Concentrate Quality | 148 |
| Table 10-18: | Summary of Copper Concentrate Quality | 149 |
| Table 10-19: | Summary of Zinc Concentrate Quality | 149 |
| Table 10-20: | ALS Head Grades – Pre-Flotation Samples – 2021 | 151 |
| Table 10-21: | ALS Flowsheet Development Head Composites – 2021 | 151 |
| Table 10-22: | ALS Flowsheet Development Composites Head Assays – 2021 | 152 |
| Table 10-23: | ALS Variability Sample Details – 2022 | 153 |
| Table 10-24: | ALS Variability Samples Head Assays – 2022 | 154 |
| Table 10-25: | Bond Ball Mill Work Index and Abrasion Index Test Results | 162 |
| Table 10-26: | Summary of SPI Test Results | 163 |
| | |
| Arctic Project | Page xv |
| S-K 1300 Technical Report Summary | November 30, 2022 |
| | |
| | |
| | |
| Table 10-27: | Summary of Baseline Pre-Flotation Tests | 164 |
| Table 10-28: | Comparison of Bulk vs. Sequential Locked-Cycle Test Results – ALS 2021 | 165 |
| Table 10-29: | Summary of Variability Open Circuit Flotation Test Results – ALS 2022 | 167 |
| Table 10-30: | ALS Lead Separation Test Results | 171 |
| Table 11-1: | List of Drill Holes used in 2022 Ambler Metals Resource Model that were Not Included in the 2020 SRK Model | 173 |
| Table 11-2: | Summary Statistics of Assay Database, Length Weighted | 175 |
| Table 11-3: | Arctic Lithological Units | 178 |
| Table 11-4: | Summary of Mineralized Zone Domains | 180 |
| Table 11-5: | Summary Statistics for SG by Mineralized Zone | 181 |
| Table 11-6: | Summary Statistics for SG Measured and SG Predicted | 182 |
| Table 11-7: | Mean SG Values for Measured and Predicted by Bins | 182 |
| Table 11-8: | Summary Statistics of the Composite Database | 184 |
| Table 11-9: | Capping Values | 186 |
| Table 11-10: | Summary Statistics of Uncapped and Capped Values for Payable Metal | 187 |
| Table 11-11: | Summary Statistics of Uncapped and Capped Values for Deleterious Elements | 188 |
| Table 11-12: | Estimation Domains | 189 |
| Table 11-13: | Variogram Models for the Bottom Group | 190 |
| Table 11-14: | Variogram Models for the Middle Group | 191 |
| Table 11-15: | Variogram Models for the Top Group | 192 |
| Table 11-16: | Variogram Model for Talc | 193 |
| Table 11-17: | Arctic Block Model Parameters | 193 |
| Table 11-18: | Search Ellipsoid Parameters Used for Payable Metals (Cu, Zn, Ag, and Au) | 194 |
| Table 11-19: | Search Ellipsoid Parameters Used for Deleterious Elements | 195 |
| Table 11-20: | Search Ellipsoid Parameters Used for Talc | 195 |
| Table 11-21: | Search Ellipsoid Parameters Used for SG | 196 |
| Table 11-22: | Statistics of OK and NN for Payable Metals for the Main Mineralized Zones | 202 |
| | |
| Arctic Project | Page xvi |
| S-K 1300 Technical Report Summary | November 30, 2022 |
| | |
| | |
| | |
| Table 11-23: | Mineral Resource Classification and Criteria | 208 |
| Table 11-24: | Parameters Used to Generate a Resource Constraining Pit Shell | 210 |
| Table 11-25: | Mineral Resource Summary Table, Inclusive of Mineral Reserves | 211 |
| Table 11-26: | Mineral Resource Summary Table, Exclusive of Mineral Reserves | 211 |
| Table 12-1: | Optimization Inputs | 213 |
| Table 12-2: | Variable Process Recoveries Used in the NSR Calculation | 219 |
| Table 12-3: | Mineral Reserve Statement | 220 |
| Table 13-1: | Geotechnical Design Parameters | 223 |
| Table 13-2: | Production Schedule | 231 |
| Table 13-3: | Gross Operating Hours per Year | 233 |
| Table 13-4: | Equipment Utilization and Efficiency | 234 |
| Table 13-5: | Blasting Design Input | 235 |
| Table 13-6: | Material Blasted Quantities | 236 |
| Table 13-7: | Explosives Quantities | 236 |
| Table 13-8: | Rock Type Weight and UCS | 238 |
| Table 13-9: | Workman, Szumanski (1996,1997) Inputs | 238 |
| Table 13-10: | Drill Penetration Rates | 239 |
| Table 13-11: | Drill Requirements and Performance | 239 |
| Table 13-12: | Loading Requirements and Performance | 240 |
| Table 13-13: | Hydraulic Shovel Productivity | 241 |
| Table 13-14: | Front End Loader Productivity | 242 |
| Table 13-15: | Truck Speed Limits | 243 |
| Table 13-16: | Truck Speed Limits | 243 |
| Table 13-17: | Truck Requirements and Performance | 244 |
| Table 13-18: | Support Equipment | 245 |
| Table 13-19: | Auxiliary Equipment | 246 |
| Table 13-20: | Ratio Maintenance Hours to Equipment Operated Hours | 248 |
| Table 13-21: | Summary of Unconfined Compressive Strength by Lithological Units | 252 |
| | |
| Arctic Project | Page xvii |
| S-K 1300 Technical Report Summary | November 30, 2022 |
| | |
| | |
| | |
| Table 13-22: | Shear Strength Laboratory Test Results Excluding Talc Samples | 253 |
| Table 13-23: | Summary of Derived Rock Mass Parameter Values per Rock Mass Domain | 255 |
| Table 13-24: | Estimate Pit Inflow | 258 |
| Table 13-25: | Selected Slope Stability Acceptance Criteria | 260 |
| Table 14-1: | Process Design Criteria – Overview | 271 |
| Table 14-2: | Comminution Design Criteria | 271 |
| Table 14-3: | Flotation Plant Design Criteria | 272 |
| Table 14-4: | Annual Reagent Consumption | 279 |
| Table 15-1: | Personnel Onsite during Operations | 291 |
| Table 15-2: | Process Water Supply Summary | 295 |
| Table 15-3: | TMF Design Parameters and Design Criteria | 304 |
| Table 15-4: | Mode of Transport and Distances for Concentrate Shipping | 313 |
| Table 16-1: | Average Metal Prices (Data from S&P Market Intelligence and CIBC, 2022) | 314 |
| Table 16-2: | Chinese Import Restrictions for Copper, Zinc, and Lead Concentrates | 318 |
| Table 16-3: | Concentrate Transport Costs | 322 |
| Table 17-1: | Summary of Closure and Reclamation Costs | 340 |
| Table 17-2: | Major Mine Permits Required for the Arctic Project | 343 |
| Table 18-1: | Estimate Summary Level 1 Major Facility | 347 |
| Table 18-2: | Initial Estimate by Major Discipline | 348 |
| Table 18-3: | Estimate Exchange Rates | 350 |
| Table 18-4: | Mining Initial and Sustaining Capital Cost | 351 |
| Table 18-5: | Sustaining Capital Cost Distribution | 352 |
| Table 18-6: | 141t Truck Capital Pricing | 354 |
| Table 18-7: | Mine Equipment Capital Cost Inputs | 354 |
| Table 18-8: | Ancillary Equipment Capital Cost Inputs | 355 |
| Table 18-9: | Capital Spares | 356 |
| Table 18-10: | Other Capital Costs | 357 |
| Table 18-11: | Crushing and Process Plant Capital Costs | 357 |
| Table 18-12: | TMF Capital Costs | 359 |
| Table 18-13: | Onsite Infrastructure Costs | 359 |
| Table 18-14: | Offsite Infrastructure Costs | 360 |
| Table 18-15: | Indirect Capital Costs | 360 |
| Table 18-16: | Estimate Contingency | 361 |
| Table 18-17: | Owner’s Costs | 362 |
| Table 18-18: | Sustaining Capital and Closure Costs | 363 |
| | |
| Arctic Project | Page xviii |
| S-K 1300 Technical Report Summary | November 30, 2022 |
| | |
| | |
| | |
| Table 18-19: | Overall Operating Cost Estimate | 365 |
| Table 18-20: | Mining Operating Cost Summary by Cost Centre | 367 |
| Table 18-21: | Operating Cost Summary by Cost Centre | 367 |
| Table 18-22: | Annual Mine Expenditure | 368 |
| Table 18-23: | Maintenance and Repair Cost | 370 |
| Table 18-24: | Equipment Fuel Burn Rates | 371 |
| Table 18-25: | Annual Diesel Consumption | 372 |
| Table 18-26: | Blasting Explosives and Accessories Cost and Service Fee | 373 |
| Table 18-27: | Tire Sizes, Pricing, and Life | 373 |
| Table 18-28: | Other Operating Costs | 374 |
| Table 18-29: | Summary of Processing Operating Cost Estimates | 375 |
| Table 18-30: | G&A Cost Estimates | 377 |
| Table 19-1: | Mine and Payable Metal Production for the Arctic Mine | 380 |
| Table 19-2: | Summary of Pre-Tax Financial Results | 382 |
| Table 19-3: | Summary of Post-Tax Financial Results | 384 |
| Table 19-4: | Pre and Post-Tax Arctic Project Production and Cashflow Forecast | 385 |
| Table 19-5: | Pre-Tax Sensitivity Summary | 389 |
| Table 19-6: | Post-Tax Sensitivity Summary | 392 |
| Table 23-1: | Summary of Recommended Work Packages | 410 |
| | |
| Arctic Project | Page xix |
| S-K 1300 Technical Report Summary | November 30, 2022 |
| | |
| | |
| | |
| | List of Figures | |
| | | |
| Figure 3-1: | Arctic Project Location Map | 36 |
| Figure 3-2: | Upper Kobuk Mineral Projects Lands | 38 |
| Figure 3-3: | Arctic Project Mineral Tenure Plan | 39 |
| Figure 3-4: | Mineral Tenure Layout Plan | 40 |
| Figure 3-5: | Arctic Deposit Location | 41 |
| Figure 6-1: | Regional Geologic Terranes of the Southern Brooks Range | 64 |
| Figure 6-2: | Local Geology of the Ambler Mining District | 66 |
| Figure 6-3: | Ambler Sequence Stratigraphy in the Arctic Deposit Area | 68 |
| Figure 6-4: | Generalized Geology of the Central Ambler Mining | 69 |
| Figure 6-5: | Typical F1 Isoclinal Folds Developed in Calcareous Gnurgle Gneiss | 70 |
| Figure 6-6: | Generalized Geologic Map of the Arctic Deposit | 72 |
| Figure 6-7: | Major Prospects of the Ambler Mining District | 78 |
| Figure 7-1: | Mapping Campaigns in and around the Arctic Deposit | 82 |
| Figure 7-2: | VTEM Flight Lines Over the Ambler Belt and Cosmos Hill Prospective Areas | 85 |
| Figure 7-3: | ZTEM Flight Lines Over the Ambler VMS Belt and the Bornite Deposit | 86 |
| Figure 7-4: | Plan Map of Drill Holes coloured by Year in the Vicinity of the Arctic Deposit. Dark Grey is Limits of 2021 Conceptual Pit | 89 |
| Figure 7-5: | Collar Locations and Principal Target Areas – Ambler Mining District | 90 |
| Figure 7-6: | Sunshine Prospect and Drill Hole Locations | 93 |
| Figure 7-7: | Snow Project and Drill Hole Locations | 94 |
| Figure 7-8: | Northeast and Southeast Arctic and Drill Hole Locations | 95 |
| Figure 7-9: | 98-9(NEN) Prospect and Drill Hole Locations | 96 |
| Figure 7-10: | East Dead Creek Prospect and Drill Hole Locations | 97 |
| Figure 7-11: | Plan Map of Drill Holes in the Vicinity of the Arctic Deposit | 98 |
| Figure 7-12: | Locations of Geotechnical Drilling | 103 |
| Figure 7-13: | Locations of Hydrogeological Drilling | 104 |
| Figure 7-14: | Drill Plan of Arctic Copper Results | 107 |
| Figure 7-15: | Cross-Section 1 of Arctic Copper Results Looking South | 108 |
| Figure 7-16: | Cross-Section 2 of Arctic Copper Results Looking South | 108 |
| Figure 7-17: | Drill Plan of Arctic Zinc Results | 109 |
| Figure 7-18: | Cross-Section 1 of Arctic Zinc Results Looking South | 110 |
| Figure 7-19: | Cross-Section 2 of Arctic Zinc Results Looking South | 110 |
| Figure 8-1: | Historical Cu Re-Assay RMA Chart | 117 |
| Figure 8-2: | Historical Pb Re-Assay RMA Chart | 118 |
| Figure 8-3: | Distribution of Historical Samples with Original Laboratory Results (Original Historic Assay Intervals are Indicated in Magenta, Recent Assays are Indicated in Green) | 119 |
| Figure 8-4: | Spatial Availability of QA/QC Data | 120 |
| | | |
| | |
| Arctic Project | Page xx |
| S-K 1300 Technical Report Summary | November 30, 2022 |
| | |
| | |
| | |
| Figure 8-5: | Graph showing Good Agreement between Wet-Dry Measured Specific Gravity and Pycnometer Measured Specific Gravity | 124 |
| Figure 8-6: | Measured vs. Stoichiometric Specific Gravities | 125 |
| Figure 8-7: | Scatter Plot Showing the Measured Specific Gravity vs. Multiple (Copper, Iron, Zinc, Barium) Regression | 126 |
| Figure 8-8: | Reduced to Major Axis (RMA) Scatter Plot Showing the Predicted and Measured SG Values | 127 |
| Figure 10-1: | Cu and Zn Test Sample Grades for ALS Metallurgy/SGS Burnaby Programs | 137 |
| Figure 10-2: | Cu and Pb Test Sample Grades for ALS Metallurgy/SGS Burnaby Programs | 137 |
| Figure 10-3: | Distribution of Talc Content within the 2012 and 2017 Test Samples | 138 |
| Figure 10-4: | Cu and Pb Test Sample Grades for ALS Metallurgy Test Program | 156 |
| Figure 10-5: | Cu and Zn Test Sample Grades for ALS Metallurgy Test Program | 156 |
| Figure 10-6: | Talc Optimization Composites Mineral Content | 158 |
| Figure 10-7: | Parent Composite Mineral Content | 159 |
| Figure 10-8: | Mineral Modal Abundance for Variability Samples | 161 |
| Figure 10-9: | Variability Composite Copper Recovery vs. Concentrate Grade | 169 |
| Figure 10-10: | Variability Composite Lead Recovery vs. Concentrate Grade | 170 |
| Figure 11-1: | East-West Cross Section for Copper Drill Hole Data, Looking North (Resource pit depicted in red) | 176 |
| Figure 11-2: | East-West Cross-Section of the Arctic Geological Model, Looking North | 177 |
| Figure 11-3: | East-West Cross-Section of Talc Model Wireframes, Looking North | 178 |
| Figure 11-4: | East-West Cross-Section of the Arctic Deposit Showing Mineralized Zones | 179 |
| Figure 11-5: | Cumulative Probability Plot for SG in the Resource Block Model | 183 |
| Figure 11-6: | Histogram of Composite Lengths | 184 |
| Figure 11-7: | Cross-Section of Estimation Domains and Talc | 189 |
| Figure 11-8: | LVA Search Ellipsoids Used in Minzone 5 (Red, Top Group) for Cu Estimation | 197 |
| Figure 11-9: | East-West Cross-Section for Cu Block Model and Composite Data, Looking North (Resource pit depicted in red) | 198 |
| Figure 11-10: | East-West Cross-Section for Zn Block Model and Composite Data, Looking North (Resource pit depicted in red) | 198 |
| Figure 11-11: | East-West Cross-Section for Pb Block Model and Composite Data, Looking North (Resource pit depicted in red) | 199 |
| Figure 11-12: | East-West Cross-Section for Ag Block Model and Composite Data, Looking North (Resource pit depicted in red) | 199 |
| Figure 11-13: | East-West Cross-Section for Au Block Model and Composite Data, Looking North (Resource pit depicted in red) | 200 |
| Figure 11-14: | Cu Swath Plot, OK (Red), NN (Green) and Composite (Black), North-South Direction | 203 |
| Figure 11-15: | Pb Swath Plot, OK (Red), NN (Green) and Composite (Black), North-South Direction | 204 |
| Figure 11-16: | Zn Swath Plot, OK (Red), NN (Green) and Composite (Black), North-South Direction | 205 |
| Figure 11-17: | Ag Swath Plot, OK (Red), NN (Green) and Composite (Black), North-South Direction | 206 |
| Figure 11-18: | Au Swath Plot, OK (Red), NN (Green) and Composite (Black), North-South Direction | 207 |
| Figure 11-19: | Oblique View of Mineral Resource Classification Model | 209 |
| Figure 11-20: | Cross-Section of Mineral Resource Classification Model, Looking North | 209 |
| Figure 11-21: | Isometric View of Arctic Mineral Resource | 212 |
| Figure 12-1: | Pit-by-Pit Analysis | 216 |
| Figure 12-2: | Selected Pit Shell | 217 |
| Figure 12-3: | Contact Dilution Concept | 218 |
| Figure 12-4: | Contact Dilution Estimation Procedure | 219 |
| Figure 13-1: | Geotechnical Slope Design Domains | 223 |
| | | |
| | |
| Arctic Project | Page xxi |
| S-K 1300 Technical Report Summary | November 30, 2022 |
| | |
| | |
| | |
| Figure 13-2: | Ultimate Pit Design | 225 |
| Figure 13-3: | Section 1 Showing Mine Design and Selected Pit Shells (looking NW) | 226 |
| Figure 13-4: | Section 2 Showing Mine Design and Selected Pit Shells (looking W) | 226 |
| Figure 13-5: | Phase 1 Design | 227 |
| Figure 13-6: | Phase 2 Design | 228 |
| Figure 13-7: | Phase 3 Design | 228 |
| Figure 13-8: | Waste Rock Facility | 229 |
| Figure 13-9: | Ore Stockpile | 230 |
| Figure 13-10: | Annual Production Schedule | 232 |
| Figure 13-11: | Total Tonnage Mined, Scheduled by Phase | 232 |
| Figure 13-12: | Isometric View (looking southeast) of Talc Zone Domain Modelled by SRK (2022) Using Leapfrog on the EoY12 design pit | 249 |
| Figure 13-13: | SRK Structural Model (SRK, 2019) used in the Slope Stability Analysis on the EoY12 Design Pit | 250 |
| Figure 13-14: | Location Plan, Structural and Geomechanical Domains | 251 |
| Figure 13-15: | Talc Geotechnical Laboratory Testing Results | 254 |
| Figure 13-16: | Summarized Hydrogeological Conceptual Model for Pit Area | 257 |
| Figure 13-17: | Pore Pressure Management Assumptions for East and Northeast Pit Walls | 259 |
| Figure 13-18: | Recommended Inter-Ramp Angles by Slope Design Domains Projected on EOY12 Design Pit | 262 |
| Figure 13-19: | Potential Areas of Slope Instability Risks in the 2022 Open Pit Designs | 264 |
| Figure 14-1: | Process Plant Flowsheet | 268 |
| Figure 14-2: | Overall Plant Area Plan | 269 |
| Figure 14-3: | Process Plant Plan | 270 |
| Figure 15-1: | Proposed Site Layout | 284 |
| Figure 15-2: | Proposed Location of the Processing Plant and Other Buildings | 285 |
| Figure 15-3: | Proposed Route of AAP Road | 287 |
| Figure 15-4: | Arctic Access Road | 289 |
| Figure 15-5: | Surface Water Management Plan During Operations (Year 2) | 293 |
| Figure 15-6: | Surface Water Management Plan at the End of LOM (Year 13) | 294 |
| Figure 15-7: | WRCP and Process Pond Plan | 298 |
| Figure 15-8: | WRCP and Process Pond | 299 |
| Figure 15-9: | WRCP and Process Pond | 299 |
| Figure 15-10: | Cross Section of the TMF & WRF showing Starter Dam to Elevation 805 m | 307 |
| Figure 15-11: | Cross Section of the TMF and Raises to Final Design Evaluation | 307 |
| Figure 16-1: | 5-year Average Daily Closing Price for Copper | 315 |
| Figure 16-2: | 5-year Average Daily Closing Price for Zinc | 315 |
| Figure 16-3: | 5-year Average Daily Closing Price for Lead | 316 |
| Figure 16-4: | 5-year Average Daily Closing Price for Gold | 316 |
| Figure 16-5: | 5-year Average Daily Closing Price for Silver | 317 |
| Figure 17-1: | Current Water Quality and Hydrology Stations’ Location Map | 324 |
| Figure 17-2: | 2021 Aquatics Sampling Sites | 327 |
| Figure 17-3: | Phase One Closure | 334 |
| Figure 17-4: | Phase Two Closure | 335 |
| Figure 18-1: | Initial Mining Capital Cost Distribution by Cost Centre | 353 |
| Figure 18-2: | Costs by Cost Centre | 365 |
| | | |
| | |
| Arctic Project | Page xxii |
| S-K 1300 Technical Report Summary | November 30, 2022 |
| | |
| Figure 18-3: | Costs by Cost Item | 366 |
| Figure 18-4: | Total Material Mined and Mine Operating Cost | 368 |
| Figure 19-1: | Pre-Tax NPV Sensitivity Analysis | 390 |
| Figure 19-2: | Pre-Tax IRR Sensitivity Analysis | 391 |
| Figure 21-1: | Project Execution Schedule | 395 |
| | |
| Arctic Project | Page xxiii |
| S-K 1300 Technical Report Summary | November 30, 2022 |
| | |
Trilogy Metals Inc. (Trilogy or Trilogy Metals) is listed on the Toronto Stock Exchange (TSX) and the New York Stock Exchange (NYSE). As a result, Trilogy is a reporting issuer in Canada and must comply with National Instrument 43-101 Standards of Disclosure for Mineral Projects (NI 43-101) and is a registrant with the United States Securities and Exchange Commission (SEC) and must also comply with subpart 229.1300 – Disclosure by Registrants Engaged in Mining Operations of Regulation S-K (S-K 1300).
Trilogy commissioned Ausenco Engineering Canada Inc. (Ausenco) to manage the update of the 2020 Arctic Feasibility Study Technical Report (2020 FS) prepared in accordance with NI 43-101 into a prefeasibility-level study (the Arctic Project) and summarize into a S-K 1300 Technical Report Summary (the Report) on the Arctic deposit in the Ambler Mining District of northwest Alaska.
This Report was prepared by Ausenco, Brown & Caldwell (B&C), SRK Consulting (Canada) Inc. (SRK or SRK Canada), and Wood Canada Limited (Wood) for Trilogy to support disclosures in its Annual Report on Form 10-K for the fiscal year ended November 30, 2022.
The Report supports Mineral Resources and Mineral Reserves using the standards and definitions in S-K 1300.
The Report presents Mineral Resource and Mineral Reserve estimates for the Project, and an economic assessment based on open pit mining operations and a conventional processing circuit that would produce copper, zinc, and lead concentrates.
All units of measurement in this Report are metric, unless otherwise stated. Monetary units are in US dollars, unless otherwise stated.
The Arctic property is located in the Ambler mining district (Ambler Mining District) of the southern Brooks Range, in the Northwest Arctic Borough (NWAB) of Alaska. The property is geographically isolated with no current road access or nearby power infrastructure. The property is located 270 km east of the town of Kotzebue, 37 km northeast of the village of Kobuk, and 260 km west of the Dalton Highway, an all-weather state-maintained highway and centred around geographic coordinates N67.17° latitude and W156.39° longitude.
| 1.2.1 | Mineral Tenure, Surface Rights, Water Rights, Royalties and Agreements |
NovaGold Resources Inc. (NovaGold) acquired the Arctic Project from Kennecott Exploration Company and Kennecott Arctic Company (collectively, Kennecott) in 2004. In 2011, NovaGold transferred all copper projects to NovaCopper Inc. and spun-out NovaCopper to its then existing shareholders in 2012. NovaCopper Inc. subsequently underwent a name change to Trilogy Metals Inc. in 2016. Under the Kennecott Purchase and Termination Agreement, Kennecott retained a 1% net smelter return (NSR) royalty that has been subsequently sold by Kennecott. The 1% NSR runs with the lands and is purchasable at any time from the royalty holder for a one-time payment of $10 million.
The Project is directly held by Ambler Metals LLC (Ambler Metals), in a 50/50 joint venture formed between South32 Limited (South32) and Trilogy Metals in February 2020. Upon the formation of the joint venture, Trilogy Metals contributed all of its Alaskan assets, including the Project and the agreement with NANA (see below), to Ambler Metals in exchange for a 50% membership interest and at the same time, South32 contributed $145 million in cash for a 50% membership interest.
| | |
| Arctic Project | Page 1 |
| S-K 1300 Technical Report Summary | November 30, 2022 |
| | |
| | |
| | |
The UKMP consists of an approximately 448,217-acre land package containing state, patented and native lands within an area of interest. There are two discrete mineralized belts within the UKMP – the Devonian Ambler Schist Belt and the Devonian Bornite Carbonate Sequence. The Project is located within the Ambler Schist Belt which comprises approximately 231,008 acres (93,446 ha) of State of Alaska mining claims and US Federal patented mining claims in the Kotzebue Recording District. Exclusive of native lands, the UKMP land tenure consists of 2,136 contiguous State claims totalling 230,736 acres (93,336 ha), including 905 40-acre claims, 1,231 160-acre claims, and 18 Federal patented claims comprising 271.9 acres (110 ha) held in the name of Ambler Metals LLC. Surface use of the private land held as Federal patented claims is limited only by reservations in the patents and by generally applicable environmental laws. Surface use of State claims allows the owner of the mining claim to make such use of the surface as is “necessary for prospecting for, extraction of, or basic processing of minerals.”
The UKMP also consists of lands owned by NANA Regional Corporation, Inc. (NANA), who controls lands granted under the Alaska Native Claims Settlement Act (ANCSA) to the south of the Project boundary. Ambler Metals and NANA are parties to an agreement dated October 19, 2011 (the NANA Agreement) that consolidates the parties’ land holdings into an approximately 190,929 ha land package and provides a framework for the exploration and development of the area. The NANA Agreement has a term of 20 years, with an option in favour of Ambler Metals to extend the term for an additional 10 years. If, following receipt of a feasibility study and the release for public comment of a related draft environmental impact statement, a decision is made to proceed with construction of a mine on the lands subject to the NANA Agreement, NANA will have 120 days to elect to either (a) exercise a non-transferrable back-in-right to acquire between 16% and 25% (as specified by NANA) of that specific project; or (b) not exercise its back-in-right, and instead receive a net proceeds royalty equal to 15% of the net proceeds realized from such project. In the event that NANA elects to exercise its back-in-right, the parties will, as soon as reasonably practicable, form a joint venture with NANA electing to participate between 16% to 25%, and Ambler Metals owning the balance of the interest in the joint venture. If Ambler Metals decides to proceed with construction of a mine on its own lands subject to the NANA Agreement, NANA will enter into a surface use agreement which will afford Ambler Metals access to the project along routes approved by NANA. In consideration for the grant of such surface use rights, NANA will receive a 1% net smelter royalty on production and provide an annual payment on a per acre basis.
| 1.3 | Accessibility, Climate, Local Resources, and Infrastructure |
Primary access to the Project is by air, using both fixed wing aircraft and helicopters.
There are four well-maintained, approximately 1,500 m-long gravel airstrips located near the Project, capable of accommodating charter fixed wing aircraft. These airstrips are located 64 km west at Ambler, 46 km southwest at Shungnak, 37 km southwest at Kobuk, and 34 km southwest at Dahl Creek. There is daily commercial air service from Kotzebue to the village of Kobuk, the closest community to the Project. During the summer months, the Dahl Creek Camp airstrip is suitable for larger aircraft, such as a C-130 and DC-6.
In addition to the four 1,500 m airstrips, there is a 700 m airstrip located at the Bornite Camp. The airstrip at Bornite is suited to smaller aircraft, which support the Bornite Camp with personnel and supplies. There is also a 450 m airstrip (Arctic airstrip) located at the base of Arctic Ridge that can support smaller aircraft.
A winter trail and a one-lane dirt track suitable for high-clearance vehicles or construction equipment links the Arctic Project’s main camp located at Bornite to the Dahl Creek airstrip southwest of the Arctic deposit. An unimproved gravel track connects the Arctic airstrip with the Arctic deposit.
| | |
| Arctic Project | Page 2 |
| S-K 1300 Technical Report Summary | November 30, 2022 |
| | |
The climate in the region is typical of a sub-arctic environment. Weather conditions on the Project can vary significantly from year to year and can change suddenly. During the summer exploration season, average maximum temperatures range from 10 °C to 20 °C, while average lows range from -2°C to 7°C (Western Regional Climate Center: WRCC - Alaska Climate Summaries: Kobuk 1971 to 2000). By early October, unpredictable weather limits safe helicopter travel to the Project. During winter months, the Project can be accessed by snow machine, track vehicle, or fixed wing aircraft. Winter temperatures are routinely below -25°C and can exceed -50°C. Annual precipitation in the region varies with elevation.
It is expected that any future mining activity will be conducted on a year-round basis. Exploration activities are generally confined to the period from late May to late September.
Kotzebue is a potential source of limited mining-related supplies and labourers, and is the nearest centre serviced by regularly scheduled, large commercial aircraft (via Nome or Anchorage). In addition, there are seven other villages in the region that will be a potential source of some of the workforce for the Project. Fairbanks (population 32,515; 2020 US Census) has a long mining history along with currently operating mines and can provide most mining-related supplies and support that cannot be sourced closer to the Project area.
Drilling and mapping programs are seasonal and have been supported out of the Bornite Camp and Dahl Creek Camp. The Bornite Camp facilities are located on Ruby Creek on the northern edge of the Cosmos Hills. The camp provides office space and accommodations for the geologists, drillers, pilots, and support staff. Power is supplied by two diesel generators – one 300 kW and one 225 kW. Water was supplied by the permitted artesian well located 250 m from camp; however, a water well was drilled in camp during the 2017 field season that was permitted by 2019 to provide all potable water for the Bornite Camp.
Prior to Trilogy’s Project interest, work programs were conducted by Bear Creek Mining Company (BCMC), an exploration subsidiary of Kennecott Exploration (Kennecott) and Anaconda. Exploration activities included geological and reconnaissance mapping, geochemical sampling, airborne and ground geophysical surveys, drilling, metallurgical testwork, petrological and mineralogical studies, and resource estimates.
Trilogy obtained its project interest from NovaGold in 2011. NovaGold obtained its project interest in 2004, when the Alaska Gold Company, a wholly-owned subsidiary of NovaGold completed an Exploration and Option Agreement with Kennecott to earn an interest in the Ambler land holdings. In 2010, NovaGold acquired a 100% controlling interest by buying out Kennecott’s interest, although Kennecott retained an NSR royalty. Work conducted by NovaGold and Trilogy Metals (formerly, NovaCopper) included geological mapping, soil and silt geochemical sampling, time-domain electromagnetic (TDEM) ground geophysical surveys, airborne DIGHEM geophysical surveys, down-hole geophysics, drilling programs, metallurgical testwork, Mineral Resource and Mineral Reserve estimates, mining studies, and baseline environmental studies.
| 1.5 | Geological Setting, Mineralization, and Deposit |
The Arctic deposit is hosted in the Ambler Sequence, in the upper part of the regional Anirak Schist, in the Ambler Mining District on the southern margin of the Brooks Range in Alaska. Ambler Sequence is a group of Middle Devonian to Early Mississippian, metamorphosed, bimodal volcanic rocks with interbedded tuffaceous, graphitic, and calcareous volcaniclastic metasediments. The Arctic deposit has characteristics that are representative of a volcanogenic massive sulphide (VMS) deposit based on its geologic setting, associated host rocks, ore morphology, and ore mineralogy. VMS-style mineralization is found along the entire 110 km strike length of the Ambler Sequence.
| | |
| Arctic Project | Page 3 |
| S-K 1300 Technical Report Summary | November 30, 2022 |
| | |
Mineralization occurs as stratiform semi-massive sulphide (SMS) to massive sulphide (MS) beds within primarily graphitic chlorite schists and fine-grained quartz schists. The sulphide beds average 4 m in thickness but vary from less than 1 m up to as much as 18 m in thickness.
The bulk of the mineralization occurs within eight modelled SMS and MS zones lying along the upper and lower limbs of the interpreted Arctic isoclinal anticline. All the zones are within an area of roughly 1 km2 with mineralization extending to a depth of approximately 250 m below the surface. Mineralization is predominately coarse-grained sulphides consisting mainly of chalcopyrite, sphalerite, galena, tetrahedrite-tennantite, pyrite, arsenopyrite, and pyrrhotite. Trace amounts of electrum are also present.
Drilling at the Arctic deposit and within the Ambler Mining District has been ongoing since its discovery in 1966. Approximately 67,639 m of drilling was completed within the Ambler Mining District, including 55,038 m of drilling in 285 drill holes at the Arctic deposit or on potential extensions in 32 campaigns spanning 56 years. Drill programs were completed by Kennecott and its subsidiaries, Anaconda, NovaGold, Trilogy and Ambler Metals.
Drill collar and downhole survey measurement collected since 2004 have used industry-recognized instrumentation and methods. Many historical collar locations have been resurveyed using these current methods. Between 1998 and 2011, Specific Gravity (SG) measurements were collected from short whole core samples using water displacement or water immersion methods. Since 2011 SG measurements are collected from assay sample intervals of half or whole core using water immersion methods. Core recovery is good.
| 1.7 | Sample Preparation, Analysis and Security |
Analytical methods and laboratory accreditations used for historical samples are not known. Samples from the NovaGold/NovaCopper/Trilogy/Ambler Metals programs were submitted to ALS Minerals of Vancouver, British Columbia, Canada for multielement analysis by Inductively Coupled Plasma Mass Spectrometry (ICP MS) following a 4-acid digestion, and for gold analysis of a 30-gram sample by Fire Assay (FA) with an Atomic Absorption (AA) finish. Over limit ICP-MS samples were resubmitted for analysis by ICP-Atomic Emission Spectroscopy (AES) or AA following a 4-acid digestion. Over limit gold results were resubmitted for analysis of a 30-gram sample by FA with a Gravimetric finish.
Standard reference materials, blanks, duplicates, and check samples have been regularly submitted for all NovaGold/NovaCopper/Trilogy and Ambler Metals era sampling campaigns. No significant quality control issues are evident in samples analysed since 2004. Samples analyzed since 2004 are in the QP’s opinion appropriate for the mineralization style observed at Arctic and provide adequate confidence in the reported assay values. Historical copper and lead values (pre-2004) that remain in the primary assay database appear to be biased high and low, respectively. The broad spatial distribution of these original historical samples and density of samples with more recent assay values surrounding these samples in the QP’s opinion reduces the risk associated with these observed biases.
Kennecott entered the historical drill hole information into tables in 1995. In 2006, NovaGold geologists verified the geologic data from the original paper logs against the Kennecott electronic format, and then merged the data into a Microsoft SQL database. In 2013, NovaCopper retained GeoSpark Consulting to complete a 100% verification of the collar survey, downhole survey, and sample interval data. Geospark was also retained to generate QA/QC reports for the NovaGold-era 2004 to 2008 and NovaCopper/Trilogy-era 2011, 2015, 2016, 2017, and 2019 drill campaigns. All data for the Arctic resource area is stored in the GeoSpark Core Database System created and managed by GeoSpark Consulting.
| | |
| Arctic Project | Page 4 |
| S-K 1300 Technical Report Summary | November 30, 2022 |
| | |
Between 2004 and 2005 NovaGold completed a resampling program of historic drill holes. As a result, 85 % of the entire assay interval database now has well supported recent assay results. The resampling program included reassay of 289 previously assayed historic sample intervals. Analysis of the paired historic and reassay results indicates there is a 10 % high bias in the legacy Cu values and a 13 % low bias in the legacy Pb values. Legacy sample represent only 15% of the entire assay database and are generally evenly distributed spatially between samples with more recent assay reducing the risk associated with these observed biases.
It is the QP’s opinion the drill database and topographic information for the Arctic deposit are reliable and sufficient to support the current estimate of Mineral Resources.
| 1.9 | Mineral Processing and Metallurgical Testing |
Since 1970, metallurgical testwork has been conducted to evaluate the ability of the Arctic deposit to produce copper, lead and zinc concentrates. In-general, the samples tested produced similar metallurgical performances and the project has seen the development of a robust metal recovery process to support the current operational plans. Work conducted included mineralogy and flotation testing, locked cycle tests, comminution tests, copper/lead separation testwork, talc optimization testwork, and thickening and filtration testing.
Testwork can be broken into four key time periods:
| 1. | Historical testwork completed prior to 2012, primarily by Kennecott Research Centre (KRC) in Utah, and Lakefield Research Ltd., Lakefield, Ontario; |
| 2. | Preliminary Trilogy Metals testwork conducted at SGS Mineral Services, Vancouver (SGS Vancouver), in 2012 to 2015; |
| 3. | Detailed Trilogy Metals testwork conducted at ALS Metallurgy in Kamloops, BC (ALS Metallurgy) in 2015 to 2019; and |
| 4. | Ambler Metals testwork conducted at ALS Metallurgy and SGS Mineral Services in 2021 to 2022. |
In 2012, SGS Vancouver conducted a metallurgical test program to further study metallurgical responses of the samples produced from Zones 1, 2, 3, and 5 of the Arctic deposit. The flotation test procedures used talc pre-flotation, conventional copper-lead bulk flotation and zinc flotation, followed by copper and lead separation. In general, the 2012-2015 test results indicated that the samples responded well to the flowsheet tested. The average results of the locked cycle tests (without copper and lead separation) were as follows:
| • | The copper recoveries to the bulk copper-lead concentrates ranged from 89% to 93% excluding the Zone 1 & 2 composite which produced a copper recovery of approximately 84%; the copper grades of the bulk concentrates were 24% to 28%. |
| • | Approximately 92% to 94% of the lead was recovered to the bulk copper–lead concentrates containing 9% to 13% lead. |
| | |
| Arctic Project | Page 5 |
| S-K 1300 Technical Report Summary | November 30, 2022 |
| | |
| • | The zinc recovery was 84.2% from Composite Zone 1 & 2, 93.0% from Composite Zone 3 and 90.5% from Composite Zone 5. On average, the zinc grades of the concentrates produced were higher than 55%, excluding the concentrate generated from Composite Zone 1 & 2, which contained only 44.5% zinc. |
| • | Gold and silver were predominantly recovered into the bulk copper–lead concentrates. Gold recoveries to this concentrate ranged from 65% to 80%, and silver recoveries ranged from 80% to 86%. |
Using an open circuit procedure, the copper and lead separation tests on the bulk copper–lead concentrate produced from the locked cycle tests generated reasonable copper and lead separation. The copper concentrates produced contained approximately 28% to 31% copper, while the grades of the lead concentrates were in the range of 41% to 67% lead. In this testwork program, it appeared that most of the gold reported to the copper concentrate and on average the silver was equally recovered into the copper and lead concentrates. Subsequent testwork to better define the copper and lead separation process was conducted in 2017, including a more detailed evaluation of the precious metal deportment in the copper and lead separation process.
Grindability testing was completed during both the SGS Vancouver and ALS Metallurgy testwork programs to support the design and economics of efficient grinding of the Arctic materials. Semi-autogenous grind (SAG) mill test results included a single JKTech drop-weight test and 19 SAG media competency (SMC) tests using variability samples. Test results show the material is amenable to SAG milling and is relatively soft, with a reported breakage (axb) average value of 189.7. Bond ball mill work index (BWi) tests were completed on 44 samples and values ranged from 5.4 to 13.1 kWh/t with an average BWi of 8.82 kWh/t. Abrasion index (Ai) tests were completed on five samples and values fluctuated from 0.017 to 0.072 g for the measured samples. The data indicate that the samples are neither resistant nor abrasive to ball mill grinding. The materials are considered to be soft or very soft in terms of grinding requirements. The grinding testwork was used to support detailed grinding circuit design.
In 2017, ALS Metallurgy conducted detailed copper and lead separation flotation testwork using a bulk sample of copper–lead concentrate produced from the operation of a pilot plant. This testwork confirmed high lead recoveries in locked cycle testing of the copper–lead separation process and confirmed precious metal recoveries into the representative copper and lead concentrates. This testwork indicated a clear tendency of the gold values to follow the lead concentrate, giving it a significant gold grade and value. Detailed mineralogical analysis showed that a majority of gold values were occurring as liberated fine-grained gold particles.
The conclusions of testwork conducted both in 2012 and 2017 indicate that the Arctic materials are well-suited to the production of high-quality copper and zinc concentrates using flotation techniques which are industry standard. Copper and zinc recovery data were reported in the range of 88% to 92%, which reflected the high-grade nature of the deposit as well as the coarse-grained nature of these minerals. Grade variations within the deposit will be observed as indicated by the grade variations observed in variability samples, however, mill feed variability is expected to be limited and readily manageable with good plant operational practices. Lead concentrates have the potential to be of good quality and can also be impacted by zones of very high talc. Considerable care will be required to ensure maximum talc recovery to remove talc, which has the potential to dilute lead concentrate grades. The lead concentrate is also shown to be rich in precious metals, which has some advantages in terms of marketability of this material.
Ancillary testwork was completed by third party consultants on representative concentrate samples, to provide thickening and filtration data for the various concentrates. Settling and filtration rates were observed to be typical for sulphide concentrates and moisture contents in final filter cakes were observed to be lower than expected.
Metallurgical testwork was completed to provide representative tailings samples for use in detailed solids settling and compaction testwork to provide data for tailings design studies.
| | |
| Arctic Project | Page 6 |
| S-K 1300 Technical Report Summary | November 30, 2022 |
| | |
A detailed study of water treatment chemistry was undertaken to evaluate and confirm the option of destroying cyanide contained in solutions from the proposed copper–lead separation process. The use of an SO2/air process in a small-scale pilot plant demonstrated removal of 99% of the contained cyanide and supported the concept of maintaining low cyanide concentrations within the proposed tailings pond solutions.
In 2021, various metallurgical testwork programs were conducted at ALS Metallurgy, SGS, and MO Group. ALS Metallurgy completed several testwork programs, including flotation testing with the Preflotation circuit only to establish talc performance; further flowsheet development testwork to investigate the benefits of sequential flotation versus the original bulk flow sheet; and a variability testwork to support the development of improved metallurgical recovery models.
The objective of the ALS Metallurgy program was to investigate bulk and sequential flotation flowsheets with composites formed from two parent composites, and then select a flowsheet for a geo-metallurgical evaluation through testing with variability samples.
The mineralization was amenable to either a bulk flowsheet followed by copper-lead separation, or a sequential flowsheet, both following a pre-flotation stage to remove talc.
Table 1-1 shows average performance obtained for the Avg Talc Composite in the Flowsheet Development phase of the testing.
| Table 1-1: | Comparison of Bulk versus Sequential Locked-Cycle Test Results – ALS 2021 |
| | | Assays | | | Distribution (%) | |
| Composite | | Cu
(%) | | | Pb
(%) | | | Zn
(%) | | | Ag
(g/t) | | | Au
(g/t) | | | Mg
(%) | | | Cu | | | Pb | | | Zn | | | Ag | | | Au | |
| Avg Talc Bulk | | | | | | | | | | | | | | | | | | | | | | | | | | | | | | | | | | | | | | | | | | | | |
| Copper concentrate | | | 28.0 | | | | 0.86 | | | | 4.27 | | | | 181 | | | | 4.17 | | | | 0.46 | | | | 87.3 | | | | 8.3 | | | | 9.1 | | | | 36.0 | | | | 60.9 | |
| Lead concentrate | | | 7.90 | | | | 39.0 | | | | 6.30 | | | | 1124 | | | | 4.75 | | | | 1.23 | | | | 5.1 | | | | 78.1 | | | | 2.8 | | | | 46.0 | | | | 14.3 | |
| Zinc concentrate | | | 0.87 | | | | 0.38 | | | | 55.9 | | | | 41 | | | | 0.35 | | | | 0.04 | | | | 1.9 | | | | 2.6 | | | | 83.3 | | | | 5.7 | | | | 3.5 | |
| Avg Talc – Sequential | | | | | | | | | | | | | | | | | | | | | | | | | | | | | | | | | | | | | | | | | | | | |
| Copper concentrate | | | 27.6 | | | | 0.87 | | | | 2.05 | | | | 168 | | | | 3.23 | | | | 1.96 | | | | 90.2 | | | | 8.9 | | | | 4.7 | | | | 34.9 | | | | 48.7 | |
| Lead concentrate | | | 2.72 | | | | 49.3 | | | | 9.71 | | | | 1360 | | | | 5.31 | | | | 1.40 | | | | 1.2 | | | | 69.9 | | | | 3.1 | | | | 39.4 | | | | 11.2 | |
| Zinc concentrate | | | 0.98 | | | | 1.09 | | | | 54.5 | | | | 47 | | | | 0.77 | | | | 0.17 | | | | 2.1 | | | | 7.3 | | | | 83.5 | | | | 6.5 | | | | 7.7 | |
Copper recovery to the copper concentrate was slightly higher for the sequential flowsheet; however, gold recovery to the copper concentrate was substantially lower. The lead concentrate grade for the Avg Talc composite could likely be improved over that shown above with optimization of copper-lead separation conditions given the higher lead concentrate grade measured with other composites.
Zinc circuit performance was similar for the two flowsheets, although higher zinc recovery to the copper concentrate was recorded for the bulk circuit. Magnesium content in the copper concentrate was higher for the sequential circuit, but similar in the lead concentrate for both circuits.
| | |
| Arctic Project | Page 7 |
| S-K 1300 Technical Report Summary | November 30, 2022 |
| | |
Based on economic analysis comparing the bulk and sequential circuit, the bulk circuit flowsheet was selected for the Variability testing.
An overall metallurgical balance for the project is summarized in Table 1-2. The projected metallurgical recoveries are based on an expected average recovery over the life-of-mine (LOM), and results of metallurgical variability testwork conducted in 2021 and 2022.
| Table 1-2: | Summary of Overall Metal Recovery – Arctic Project |
| | | | | | Concentrate Grade | | | Metal Recoveries | |
| Process stream | | Mass
(%) | | | Cu
(%) | | | Pb
(%) | | | Zn
(%) | | | Au
(g/t) | | | Ag
(g/t) | | | Cu
(%) | | | Pb
(%) | | | Zn
(%) | | | Au
(%) | | | Ag
(%) | |
| Process Feed | | | 100 | | | | 2.1 | | | | 0.5 | | | | 2.8 | | | | 0.4 | | | | 31.1 | | | | - | | | | - | | | | - | | | | - | | | | - | |
| Copper Conc. | | | 6.3 | | | | 30.3 | | | | 1.7 | | | | 0.7 | | | | 3.4 | | | | 160.5 | | | | 92.1 | | | | 19.4 | | | | 1.6 | | | | 52.2 | | | | 32.4 | |
| Lead Conc. | | | 0.6 | | | | 2.0 | | | | 53.9 | | | | 5.9 | | | | 14.1 | | | | 2425.8 | | | | 0.6 | | | | 61.3 | | | | 1.3 | | | | 21.4 | | | | 48.8 | |
| Zinc Conc. | | | 4.7 | | | | 1.0 | | | | 0.5 | | | | 53.6 | | | | 0.3 | | | | 38.3 | | | | 2.2 | | | | 4.4 | | | | 88.4 | | | | 3.2 | | | | 5.7 | |
| Tailings | | | 88.4 | | | | 0.1 | | | | 0.1 | | | | 0.3 | | | | 0.1 | | | | 4.6 | | | | 5.1 | | | | 14.8 | | | | 8.7 | | | | 23.2 | | | | 13.1 | |
SGS conducted SAG Power Index (SPI®) tests to investigate the effect of friable ores on the plant throughput.
MO Group conducted talc circuit modelling using the data obtained from the ALS Metallurgy Preflotation testwork program to investigate the benefits of talc circuit open and closed-circuit cleaning. The MO Group also conducted dewatering and filtration testwork on the talc concentrate and final tailings generated from the Preflotation testwork program.
Thickening and filtration testwork were completed by the MO Group on representative preflotation concentrate and tailings samples, to investigate opportunities to improve water recovery and reduce operating costs. The results were used to incorporate a tailings thickener in the process plant flow sheet.
| 1.10 | Mineral Resource Estimates |
Mineral resource estimates are performed from a 3D block model based on geostatistical applications using Leapfrog software. The resource estimate was generated using drill hole sample assay results and the interpretation of a geological model which relates to the spatial distribution of copper, lead, zinc, gold, and silver. The grade models have been validated using a combination of visual and statistical methods. The resources were classified according to their proximity to the sample data locations and are reported using the standards and definitions of S-K 1300. Model blocks estimated by three or more drill holes spaced at a maximum distance of 100 m are included in the Indicated category. Inferred blocks are within a maximum distance of 150 m from a drill hole.
| | |
| Arctic Project | Page 8 |
| S-K 1300 Technical Report Summary | November 30, 2022 |
| | |
The deposit is amenable to open pit extraction methods. The reasonable prospects for economic extraction was established by the constraining mineralization within a pit shell derived based on a series of technical and economic assumptions. Mineral Resources were established within the constraining pit shell using the copper equivalent (CuEq) grade of 0.5%.
Mineral Resources are reported in accordance with the standards and definitions of S-K 1300. The Mineral Resource estimate inclusive of Mineral Reserves is stated in Table 1-3. The Mineral Resource estimate exclusive of Mineral Reserves is stated in Table 1-4. All Indicated Mineral Resources have been converted to Mineral Reserves. Mineral Resources are reported in place (point of reference) and on a 100% basis; however, Trilogy’s attributable interest is 50% of the tonnes and metal content.
| | |
| Arctic Project | Page 9 |
| S-K 1300 Technical Report Summary | November 30, 2022 |
| | |
| Table 1-3: | Mineral Resource Summary Table, Inclusive of Mineral Reserves |
| | | | | | Average Grade | | | Contained Metal Content | |
| Confidence | | Tonnage | | | Cu | | | Pb | | | Zn | | | Au | | | Ag | | | Cu | | | Pb | | | Zn | | | Au | | | Ag | |
| Category | | (Mt) | | | (%) | | | (%) | | | (%) | | | (g/t) | | | (g/t) | | | (Mlb) | | | (Mlb) | | | (Mlb) | | | (koz) | | | (Moz) | |
| Indicated | | | 35.7 | | | | 2.98 | | | | 0.79 | | | | 4.09 | | | | 0.59 | | | | 45.2 | | | | 2,347 | | | | 621 | | | | 3,216 | | | | 675 | | | | 52 | |
| Inferred | | | 4.5 | | | | 1.92 | | | | 0.70 | | | | 2.93 | | | | 0.43 | | | | 35.6 | | | | 189 | | | | 69 | | | | 288 | | | | 62 | | | | 5 | |
Notes:
| 1. | Mineral Resources are current as of November 30, 2022 and were verified by a Wood QP. |
| 2. | Mineral Resources were prepared in accordance with the standards and definitions of S-K 1300. |
| 3. | Mineral Resources stated are contained within a conceptual pit shell developed using metal prices of $3.00/lb Cu, $0.90/lb Pb, $1.00/lb Zn, $1300/oz Au and $18/oz Ag and metallurgical recoveries of 92% Cu, 77% Pb, 88% Zn, 63% Au and 56% Ag and operating costs of $3/t mining and $35/t process and G&A. The assumed average pit slope angle is 43°. |
| 4. | The cut-off grade is 0.5% copper equivalent. CuEq = (Cu%x0.92) + (Zn%x0.290) + (Pb%x0.231) + (Au g/tx0.398) + (Ag g/tx0.005). |
| 5. | As a result of flattening the north end of the reserve pit to stabilize the pit wall due to the presence of talc, a portion of the reserve pit extended beyond the resource constraining pit shell. Approximately 568kt of 1.72% Cu, 0.77% Pb, 0.23 g/t Au and 21.3 g/t Ag in the Indicated category, and approximately 319 kt of 2.01% Cu, 0.87% Pb, 2.53% Zn, 0.50 g/t Au and 37.5 g/t Ag in the Inferred category were added to the Mineral Resource tabulation. |
| 6. | The Mineral Resource estimate is reported inclusive of those Mineral Resource that were converted to Mineral Reserves. |
| 7. | Trilogy’s attributable interest is 50% of the tonnage and contained metal stated in the table. |
| 8. | Figures may not sum due to rounding. |
| Table 1-4: | Mineral Resource Summary Table, Exclusive of Mineral Reserves |
| | | | | | Average Grade | | | Contained Metal Content | |
| Confidence | | Tonnage | | | Cu | | | Pb | | | Zn | | | Au | | | Ag | | | Cu | | | Pb | | | Zn | | | Au | | | Ag | |
| Category | | (Mt) | | | (%) | | | (%) | | | (%) | | | (g/t) | | | (g/t) | | | (Mlb) | | | (Mlb) | | | (Mlb) | | | (koz) | | | (Moz) | |
| Inferred | | | 4.5 | | | | 1.92 | | | | 0.70 | | | | 2.93 | | | | 0.43 | | | | 35.6 | | | | 189 | | | | 69 | | | | 288 | | | | 62 | | | | 5 | |
Notes:
| 1. | Mineral Resources are current as of November 30, 2022 and were verified by a Wood QP. |
| 2. | Mineral Resources were prepared in accordance with the standards and definitions of S-K 1300. |
| 3. | Mineral Resources stated are contained within a conceptual pit shell developed using metal prices of $3.00/lb Cu, $0.90/lb Pb, $1.00/lb Zn, $1,300/oz Au and $18/oz Ag and metallurgical recoveries of 92% Cu, 77% Pb, 88% Zn, 63% Au and 56% Ag and operating costs of $3/t mining and $35/t process and general and administrative costs. The assumed average pit slope angle is 43º. |
| 4. | As a result of flattening the north end of the reserve pit to stabilize the pit wall due to the presence of talc, a portion of the reserve pit extended beyond the resource constraining pit shell and approximately 319 kt of 2.01% Cu, 0.87% Pb, 2.53% Zn, 0.50 g/t Au and 37.5 g/t Ag in the Inferred category were added to the Mineral Resource tabulation. |
| 5. | The cut-off grade is 0.5% copper equivalent: CuEq = (Cu% x 0.92) + (Zn% x 0.290) + (Pb% x 0.231) + (Au g/t x 0.398) + (Ag g/t x 0.005). |
| 6. | The Mineral Resource estimate is reported exclusive of those Mineral Resources that were converted to Mineral Reserves. |
| 7. | Trilogy’s attributable interest is 50% of the tonnage and contained metal stated in the table. |
| 8. | Figures may not sum due to rounding. |
| | |
| Arctic Project | Page 10 |
| S-K 1300 Technical Report Summary | November 30, 2022 |
| | |
| 1.11 | Mineral Reserve Estimates |
Mineral Reserves were classified in accordance with the standards and definitions of S-K 1300. Modifying factors were applied to the Indicated Mineral Resources to convert them to Probable Mineral Reserves. Mineral Reserves for the Arctic deposit incorporate appropriate mining dilution and mining recovery estimations for the open pit mining method.
The pit shell that defines the ultimate pit limit was derived in Whittle using the Pseudoflow pit optimization algorithm. The optimization procedure uses the block value and pit slopes to determine a group of blocks representing pits of valid slopes that yield the maximum profit. The block value is calculated using information stored in the geological block model, commodity prices, mining and processing costs, process recovery, and the sales cost for the metals produced. The pit slopes are used as constraints for removal precedence of the blocks (Xiaoyu Bai, et al., 2017). Table 1-5 provides a summary of the primary optimization inputs.
| Table 1-5: | Optimization Inputs |
| Parameter | | Unit | | Value | | | Cu Conc. | | | Pb Conc. | | | Zn Conc. | |
| | | | | | | | | | | | | | | |
| Metal Prices | |
| Copper | | $/lb | | | 3.46 | | | | | | | | | | | | | |
| Lead | | $/lb | | | 0.91 | | | | | | | | | | | | | |
| Zinc | | $/lb | | | 1.12 | | | | | | | | | | | | | |
| Gold | | $/oz | | | 1,615 | | | | | | | | | | | | | |
| Silver | | $/oz | | | 21.17 | | | | | | | | | | | | | |
| Discount Rate | | % | | | 8 | | | | | | | | | | | | | |
| Dilution and Mine Losses | | % | | | Estimated in a block-by-block basis, adding up 30% to 40%. | |
| Mining Cost | |
| Reference Bench Elevation | | m | | | 790 | | | | | | | | | | | | | |
| Base Cost | | $/t | | | 2.52 | | | | | | | | | | | | | |
| Incremental Mining Cost | | | | | | | | | | | | | | | | | | |
| Uphill (below 790m) | | $/t/5m | | | 0.02 | | | | | | | | | | | | | |
| Downhill (above 790m) | | $/t/5m | | | 0.012 | | | | | | | | | | | | | |
| Process Costs | |
| Operating Cost | | $/t milled | | | 18.31 | | | | | | | | | | | | | |
| G&A | | $/t milled | | | 5.83 | | | | | | | | | | | | | |
| Sustaining Capital | | $/t milled | | | 2.37 | | | | | | | | | | | | | |
| Road Toll Cost | | $/t milled | | | 8.04 | | | | | | | | | | | | | |
| Closure | | $/t milled | | | 4.27 | | | | | | | | | | | | | |
| Processing Rate | | kt/d | | | 10 | | | | | | | | | | | | | |
| | |
| Arctic Project | Page 11 |
| S-K 1300 Technical Report Summary | November 30, 2022 |
| | |
| | |
| | |
| Parameter | | Unit | | | Value | | | Cu Conc. | | | Pb Conc. | | | Zn Conc. | |
| | | | | | | | | | | | | | | | |
| Process Recovery |
| Copper | | | % | | | | | | | | 89.9 | | | | 2.4 | | | | 2.7 | |
| Lead | | | % | | | | | | | | 8.1 | | | | 79 | | | | 2.2 | |
| Zinc | | | % | | | | | | | | 3.4 | | | | 0.4 | | | | 90.6 | |
| Gold | | | % | | | | | | | | 10.9 | | | | 62.1 | | | | 5.4 | |
| Silver | | | % | | | | | | | | 26.4 | | | | 63.1 | | | | 3.4 | |
| Payable – Main Element | | | % | | | | | | | | 96.5 | | | | 95 | | | | 85 | |
| Treatment Cost | | | $/dmt | | | | | | | | 80 | | | | 160 | | | | 215 | |
| Refining Cost |
| Copper | | | $/lb | | | | | | | | 0.08 | | | | - | | | | - | |
| Gold | | | $/oz | | | | | | | | 5 | | | | 10 | | | | - | |
| Silver | | | $/oz | | | | | | | | 0.5 | | | | 1.25 | | | | - | |
| Transport Cost | | | $/dmt | | | | 271 | | | | | | | | | | | | | |
| Concentrate Losses | | | % weight | | | | 0.42 | | | | | | | | | | | | | |
| Insurance Cost | | | % | | | | 0.15 | | | | | | | | | | | | | |
| Representation/Marketing | | | $/wmt | | | | 2.5 | | | | | | | | | | | | | |
| Slope Angles |
| Geotechnical Sector 1 (2L-E) | | | degrees | | | Variable based on slope dip direction. IRA ranging from 26 to 56. | |
| Geotechnical Sector 2 (2L-W) | | | degrees | | | Variable based on slope dip direction IRA ranging from 38 to 56. | |
| Geotechnical Sector 3 (2U) | | | degrees | | | Variable based on slope dip direction IRA ranging from 29 to 56. | |
| Geotechnical Sector 4 (3) | | | degrees | | | Variable based on slope dip direction IRA ranging from 30 to 56. | |
| Geotechnical Sector 5 (4L) | | | degrees | | | Variable based on slope dip direction IRA ranging from 34 to 56. | |
| Geotechnical Sector 6 (4U) | | | degrees | | | Variable based on slope dip direction IRA ranging from 37 to 56. | |
| Royalties |
| NANA Surface Use | | | %NSR | | | | 1 | | | | | | | | | | | | | |
Note: IRA = inter ramp angle
| | |
| Arctic Project | Page 12 |
| S-K 1300 Technical Report Summary | November 30, 2022 |
| | |
The Mineral Reserve estimates are shown in Table 1-6. Only Probable Mineral Reserves have been classified. The point of reference for the Mineral Reserves is defined at the point where the ore is delivered to the processing plant. Trilogy’s attributable interest is 50% of the tonnes of the Mineral Reserves.
| Table 1-6: | Mineral Reserve Statement |
| | | Tonnage | | | Average Grade | |
| Confidence Category | | Mt | | | Cu (%) | | | Pb (%) | | | Zn (%) | | | Au (g/t) | | | Ag (g/t) | |
| Probable Mineral Reserves | | | 46.7 | | | | 2.11 | | | | 0.56 | | | | 2.90 | | | | 0.42 | | | | 31.8 | |
Notes:
| 1. | Mineral Reserves estimates are current as of November 30, 2022 and were prepared by a Wood QP. |
| 2. | Mineral Reserves were estimated assuming open pit mining methods and include a combination of internal and contact dilution. Total dilution is expected to be between 30% and 40%. Pit slopes vary by sector and range from 26° to 56°. A marginal NSR cut-off of $38.8 /t is used. |
| 3. | Mineral Reserves are based on prices of $3.46/lb Cu, $0.91/lb Pb, $1.12/lb Zn, $1,615/oz Au, and $21.17/oz Ag. |
| 4. | Variable process recoveries averaging 92.2% Cu in Cu concentrate, 62.2% Pb in Pb concentrate, 8887.6% Zn in Zn concentrate, 16.0% Pb in Cu concentrate, 1.9% Zn in Cu concentrate, 47.2% Au in Cu concentrate, 32.7% Ag in Cu concentrate, 0.8% Cu in Pb concentrate, 1.3% Zn in Pb concentrate, 26.1% Au in Pb concentrate, 48.7% Ag in Pb concentrate, 2.1% Cu in Zn concentrate, 4.5% Pb in Zn concentrate, 3.3% Au in Zn concentrate, 5.8% Ag in Zn concentrate. |
| 5. | Mineral Reserves are based on mining cost of $2.52/t incremented at $0.02/t/5m and $0.012/t/5m below and above 790 m elevation, respectively. |
| 6. | Costs applied to processed material following process operating cost of $18.31/t, G&A of $5.83/t, sustaining capital cost of $2.37/t, closure cost of $4.27/t, road toll cost of $8.04/t. |
| 7. | Strip ratio (waste: ore) is 7.3:1. |
| 8. | Selling terms following payables of 96.5% of Cu, 95% of Pb and 85% of Zn, treatment costs of $80/t Cu concentrate, $160/t Pb concentrate and $215/t Zn concentrate; refining costs of $0.08/lb Cu in Cu concentrate, $10/oz Au, $1.25/oz Ag in Pb concentrate; and transport cost $270.98/t concentrate. |
| 9. | Fixed royalty percentage of 1% NSR. |
| 10. | Trilogy’s attributable interest is 50% of the tonnage stated in the table. |
Specific risks to the Arctic Mineral Reserve estimate include:
| • | The uncertainty in the construction and timing of the Ambler Mining District Industrial Access Project (AMDIAP) road, also called the Ambler Access Project (AAP), and whether a favourable road toll agreement can be negotiated. |
| • | The presence of talc layers in the rock that have not been included in the current geological model could affect metallurgical recoveries and slope stability. |
Other risk factors that may affect the Mineral Reserve estimates include: metal price assumptions; changes to the assumptions used to generate the NSR cut-offs that constrains the estimate; changes in local interpretations of mineralization geometry and continuity of mineralized zones; changes to geological and mineralization shapes, and geological and grade continuity assumptions; density and domain assignments; changes to geotechnical and hydrological assumptions, changes to mining and metallurgical recovery assumptions; changes to the input and design parameter assumptions that pertain to the conceptual pit constraining the estimates; assumptions as to concentrate marketability, payability and penalty terms; assumptions as to the continued ability to access the site, retain mineral tenure and obtain surface rights titles, obtain environment and other regulatory permits, and maintain the social license to operate.
| | |
| Arctic Project | Page 13 |
| S-K 1300 Technical Report Summary | November 30, 2022 |
| | |
The Arctic Project is designed as a conventional truck-shovel operation with 144 t trucks and 15 m3 shovels. The pit design includes four nested phases to balance stripping requirements while satisfying the concentrator requirements.
The design parameters include a ramp width of 30 m, road grades of 10%, bench height of 5 m, targeted mining width between 70 m and 100 m, berm interval of 20 m, variable slope angles by sector and a minimum mining width of 30 m.
The smoothed final pit design contains approximately 46.7 Mt of ore and 340.2 Mt of waste for a resulting stripping ratio of 7.3:1. Within the 46.7 Mt of ore, the average grades are estimated to be 2.11% Cu, 2.90% Zn, 0.56% Pb, 0.42 g/t Au and 31.8 g/t Ag.
The scheduling constraints set the maximum mining capacity at 35 Mt/a, and the maximum process capacity at 10 kt/d. The production schedule based on the Probable Mineral Reserves shows a total LOM of 15 years, including 2 years of pre-production and 13 years of production.
| 1.13 | Processing and Recovery Methods |
The 10,000 t/d process plant design is conventional for the industry and will operate two 12- hour shifts per day, 365 d/a with an overall plant availability of 92%. The process plant will produce three concentrates: 1) copper concentrate, 2) zinc concentrate, and 3) lead concentrate. Gold and silver are expected to be payable at a smelter; both silver and gold are expected to be payable in the copper and lead concentrates.
While there are several deleterious elements reporting to the concentrates at levels that could incur penalties, special processing provisions have been included in the flowsheet to make a readily saleable concentrate. The presence of naturally hydrophobic talc minerals was consistently observed in the various testwork programs. There is little reason to expect concentrates will be impaired by talc contamination as talc can be effectively removed from the flotation process prior to base metal flotation. Talc and fluorine levels will be managed by optimization of the talc pre-float circuit, effectively removing talc and fluorine to ensure the quality of the lead concentrate.
The mill feed will be hauled from the open pit to a primary crushing facility where the material will be crushed by a jaw crusher to a particle size of 80% passing 80 mm.
The crushed material will be ground by two stages of grinding, consisting of one SAG mill and one ball mill in closed circuit with hydrocyclones (SAB circuit). The hydrocyclone overflow with a grind size of approximately 80% passing 70 μm will first undergo talc pre-flotation, and then be processed by conventional bulk flotation (to recover copper, lead, and associated gold and silver), followed by zinc flotation. The bulk rougher concentrate will be cleaned and followed by copper and lead separation to produce a lead concentrate and a copper concentrate. The final tailings from the zinc flotation circuit will be pumped to a tailings management facility (TMF). Copper, lead, and zinc concentrates will be thickened and pressure-filtered before being transported by truck to a port and shipped to smelters.
Based on the mine plan developed for the Report and metallurgical testwork results, the LOM average metal recoveries and concentrate grades are as presented in Table 1-7.
| | |
| Arctic Project | Page 14 |
| S-K 1300 Technical Report Summary | November 30, 2022 |
| | |
| Table 1-7: | LOM Average Recovery and Grade |
| Description | | Unit | | | Cu con | | Pb con | | Zn con | |
| LOM Production | | t/a | | | 234,132 | | 23,300 | | | 174,202 | |
| Grade | | % | | | 30.3% Cu | | 53.9% Pb | | | 53.7% Zn | |
| Recovery | | % | | | 92.1% Cu
52.2% Au
32.5% Ag | | 61.3% Pb
21.6% Au
48.6% Ag | | | 88.5% Zn | |
The recovery plan includes provision for reagents, and water and power requirements.
| 1.14.1 | Infrastructure Requirements |
The Project site is a remote, greenfield site that is remote from existing infrastructure. Infrastructure that will be required for the mining and processing operations will include:
| • | Stockpiles and Waste Rock Facility (WRF) |
| • | Truck workshop, truck wash, mine offices, mine dry facility and warehouse |
| • | Plant workshop and warehouse |
| • | Primary crushing building |
| • | Fine ore stockpile building |
| • | Process plant and laboratory |
| • | Concentrate loadout building |
| • | Reagent storage and handling building |
| • | Raw water supply building |
| • | Explosives storage silos and magazines |
| • | Avalanche mitigation structures |
| • | Surface water diversion and collection channels, culverts, and containment structures |
| • | Waste rock collection pond (WRCP) |
| • | Water treatment plant (WTP) |
| | |
| Arctic Project | Page 15 |
| S-K 1300 Technical Report Summary | November 30, 2022 |
| | |
The Project site will be accessed through a combination of State of Alaska-owned highways (existing), an Alaska Industrial Development and Export Authority (AIDEA)-owned private road (proposed) and Ambler Metals-owned access roads (proposed). The AAP road is proposed by AIDEA to connect the Ambler Mining District to the Dalton Highway. The AAP road will be permitted as a private road with restricted access for industrial use. To connect the Arctic Project site and the existing exploration camp to the proposed AAP road, a 30.7 km access road (the Arctic access road) will need to be built.
The State of Alaska-owned, public Dahl Creek airport will require upgrades to support the planned regular transportation of crews to and from Fairbanks. The cost of these upgrades has been included in the capital cost estimate.
Power generation will be by five diesel generators, producing a supply voltage of 13.8 kV. The total connected load will be 25.9 MW with a normal running load of 21.0 MW. Diesel will be supplied via existing fuel supply networks in the region and shipped along the AAP road.
The Project will require three self-contained camps, in two different locations, equipped with their own power and heat generation capabilities, potable WTP (PWTP), sewage treatment plant (STP), and garbage incinerator. The existing 90-person Bornite Camp currently used for exploration will be expanded and used to start the construction of the Arctic access road and the logistics yard and construction camp. This Bornite Camp will be expanded and available prior to surface access from the Dalton Highway via the AAP road is available. A 250-person construction camp (CC) will be constructed at location near the intersection of the AAP road and Arctic Mine Access road (AMA), across the road from the Logistics Yard. CC will be constructed when limited access via the AAP is available for the transport of camp modules. A 400-person Permanent Accommodations Facility (PAF) will be constructed in the same location as CC. The PAF will be constructed when the AAP is available to transportation of the modules by truck and will be operational by the peak accommodation requirements for the construction phase. CC will be adjacent to the PAF, and the accommodation sections will be integrated and operated with the kitchen, dining, and support facilities of the PAF. The PWTP, STP, and garbage incinerator will be transported to site and constructed with the CC and will be sized to support the future PAF and the capacities of both the CC and PAF (650-persons).
| 1.14.5 | Waste Rock Facility |
The WRF will be developed north of the Arctic pit in the upper part of the Subarctic Creek valley. The WRF is designed as part of the tailings dam structure to provide a buttress for tailings containment in the adjacent footprint. The total volume of waste rock is expected to be 162.6 Mm3 (340 Mt); however, there is potential for expanded volume in the waste if placement density is <2.0 t/m3. The WRF will have a final height of 340 m to an elevation of 990 masl and is planned to be constructed in lifts of either 5, 10 or 20 m height with catch benches every 20 m to achieve an overall slope angle of 2.5H:1V.
Most of the waste rock is anticipated to be potentially acid-generating (PAG) and there will be no separation of waste based on acid generation potential. Rather, seepage from the WRF will be collected and treated.
| | |
| Arctic Project | Page 16 |
| S-K 1300 Technical Report Summary | November 30, 2022 |
| | |
| 1.14.6 | Overburden Stockpiles |
There will also be three overburden stockpiles to store the stripped topsoil and overburden from the TMF and WRF footprint. The topsoil stockpile will be placed between the haul roads to store up to 325,000 m3 while the overburden stockpile will be located south of the WRF to store up to 2,200,000 m3.
| 1.14.7 | Tailings Management Facility |
The TMF will be located at the headwaters of Subarctic Creek, in the upper-most portion of the creek valley. The 59 ha footprint of the TMF will be fully lined with a geomembrane liner. Tailings containment will be provided by an engineered dam, buttressed by the WRF that will be constructed immediately downstream of the TMF, and the natural topography on the valley sides. A starter dam will be constructed to elevation 830 m. Three subsequent raises will bring the final dam crest elevation to 892 m, which is 98 m lower than the final elevation of the WRF. The TMF is designed to store approximately 37.4Mm3 (41.2 Mt) of tailings produced over the 13-year mine life, 3.3 Mm3 of additional pond water, as well as 1.5 times the probable maximum flood, with 2.5 m of freeboard.
The proposed mine development is located in the valley of Subarctic Creek, a tributary to the Shungnak River. A surface water management system will be constructed to segregate contact and non-contact water. Non-contact water will be diverted around mine infrastructure to Subarctic Creek. A groundwater seepage monitoring and collection system will be located down gradient of the WRF and seepage collection pond. Contact water will be conveyed to treatment facilities prior to discharge to the receiving environment.
A WRCP will be located directly below the toe of the WRF and will be used to collect seepage from the WRF, runoff from the WRF and haul road corridor area, and water pumped from the open pit.
The Project water and load balance model was updated to include the current water management plan. The model indicates that during operations, excess water from the WRCP will need to be treated prior to discharge to the receiving environment. During closure, water from the dewatering of the TMF will also need to be treated prior to discharge to the receiving environment.
| 1.14.9 | Water Treatment Plant |
It was assumed the site will be assigned water quality-based effluent limits (WQBEL) matching the state’s Water Quality Standards (WQS) for the nearby Subarctic Creek. Therefore, Water Treatment Plant (WTP) is designed to treat all parameters in the predicted site wastewater to the WQS of Subarctic Creek. This will eliminate the need for a mixing zone and allow treated water to be discharged year-round if needed.
A single WTP, built in stages, will be used. During Operations phase the WTP will treat effluent from the Waste Rock Collection Pond (WRCP), and during Closure phase effluent from the pit. The WTP will initially consist of chemical/physical treatment with reverse osmosis (RO) filtration. During operations, the RO reject will be sent to the TMF, and only RO permeate will be discharged to Subarctic Creek. When the TMF is closed at the end of the operations, a biological/chemical/physical plant will be added to treat the RO reject. The biologic plant discharge will be mixed with the RO prior to discharge.
| | |
| Arctic Project | Page 17 |
| S-K 1300 Technical Report Summary | November 30, 2022 |
| | |
Metal pricing was guided by 3-year trailing average prices and long-term price forecasts from analysts as published by CIBC in 2022.
The long-term consensus metal price assumptions selected for the economic analysis in the Report were:
Smelter terms were prepared in January 2023 by StoneHouse Consulting Inc. Smelter terms were applied for the delivery of copper, zinc and lead concentrate. It was assumed that delivery of all concentrates would be to a smelter in the Asia Pacific region at currently available freight rates. Total transport costs for the concentrate are estimated at $324.37/dmt.
| 1.16 | Environmental Studies, Permitting, and Plans, Negotiations, or Agreements with Local Individuals or Groups |
The Arctic Project area includes the Ambler lowlands and Subarctic Creek within the Shungnak River drainage. A significant amount of baseline environmental data collection has occurred in the area including surface and groundwater quality sampling, surface hydrology monitoring, wetlands mapping, aquatic life surveys, avian and mammal habitat surveys, cultural resource surveys, hydrogeology studies, meteorological monitoring, and metal leaching and acid rock drainage (ML/ARD) studies.
| 1.16.1 | Permitting Considerations |
Current mineral exploration activities are conducted at the Arctic deposit under State of Alaska and Northwest Arctic Borough (NWAB) permits. The State of Alaska Miscellaneous Land Use Permit (MLUP) and the NWAB Permit both expires at the end of 2022 and will be renewed.
Mine development permitting will be largely driven by the underlying land ownership with regulatory requirements varying depending on land ownership. The Arctic Project area includes patented mining claims owned by Ambler Metals (private land), NANA land (private land), and State of Alaska land.
The Arctic deposit is mainly on private lands owned by Ambler Metals and infrastructure for the Arctic Project is situated to a large extent on State land. It will be necessary to obtain a Plan of Operation Approval (which includes the Reclamation Plan and Closure Cost Estimate) from the Alaska Department of Natural Resources (ADNR). The Project will also require certificates to construct and operate dams (tailings and water storage) from the ADNR (Dam Safety Unit) as well as water use and discharge authorizations, an upland mining lease and a mill site lease, as well as several minor permits including those that authorize access to construction material sites from ADNR.
The Alaska Department of Environmental Conservation (ADEC) would authorize waste management under an Integrated Waste Management permit, air emissions during construction and operations under an air permit, and an Alaska Pollutant Discharge Elimination System (APDES) permit for any wastewater discharges, and a Multi-Sector General Permit for stormwater discharges. The ADEC would also be required to review the US Army Corps of Engineers (USACE) Section 404 permit to certify that it complies with Section 401 of the Clean Water Act (CWA).
| | |
| Arctic Project | Page 18 |
| S-K 1300 Technical Report Summary | November 30, 2022 |
| | |
The Alaska Department of Fish and Game (ADF&G) would have to authorize any culverts or bridges that are required to cross fish-bearing streams or other impacts to fish-bearing streams that result in the altering or affecting fish habitat.
US Army Corps of Engineers (USACE) would require a CWA Section 404 permit for dredging and filling activities in Waters of the United States including jurisdictional wetlands. The USACE Section 404 permitting action would require the USACE to comply with the Natural Environmental Policy Act (NEPA) and, for a project of this magnitude, the development of an Environmental Impact Statement (EIS) is anticipated. The USACE would likely be the lead federal agency for the NEPA process. As part of the Section 404 permitting process, the Arctic Project will have to meet USACE wetlands guidelines to avoid, minimize and mitigate impacts to waters of the US including wetlands.
The Arctic Project will also have to obtain approval for a Master Plan from the NWAB. In addition, actions will have to be taken to change the borough zoning for the Arctic Project area from Subsistence Conservation and General Conservation to Resource Development and Transportation.
The overall timeline required for permitting would be largely driven by the time required for the NEPA process, which is triggered by the submission of the Section 404 permit application to the USACE. The timeline includes the development and publication of a draft and final EIS and ends with a Record of Decision and Section 404-permit issuance. In Alaska, the EIS and other State and Federal permitting processes are generally coordinated so that permitting and environmental review occurs in parallel. The NEPA process could require about three years to complete and could potentially take longer.
| 1.16.2 | Social and Community |
The Arctic Project is located approximately 40 km northeast of the villages of Shungnak and Kobuk, and 65 km east-northeast of the community of Ambler. The population in these villages are 151 in Kobuk (2020 Census), 210 in Shungnak (2020 Census), and 275 in Ambler (2020 Census). Residents largely live a subsistence lifestyle with incomes supplemented by guiding, local development projects, employment through tribal and city councils, government aid, and employment both in and outside of their home villages.
The Arctic Project has the potential to significantly improve work opportunities for residents during the exploration phase, construction, and during full operation. Trilogy’s joint venture, Ambler Metals works directly with the Upper Kobuk villages and communities throughout the region to employ residents as mechanics, geotechnicians, core cutters, administrative staff, camp services, heavy equipment operators, drill helpers, and environmental technicians.
Stakeholder outreach and community meetings in the region by the Project’s owners over many years have provided the opportunity to engage with residents, provide updated information on the project and future plans for the UKMP, hear concerns, answer questions, and build relationships.
This engagement has also identified various hurdles residents have faced when applying for employment. Opportunities have been created for NANA shareholders to apply and receive educational scholarships, participate in job shadowing at Bornite, driver’s license courses, and heavy equipment operator training sponsored by the Project’s owners.
It is the company’s goal to continue and grow these efforts throughout the permitting process and the life of the project – encouraging and supporting education, job training, employment, and economic growth.
| | |
| Arctic Project | Page 19 |
| S-K 1300 Technical Report Summary | November 30, 2022 |
| | |
Mine reclamation and closure are largely driven by State of Alaska regulations that specify that a mine must be reclaimed concurrent with mining operations to the greatest extent possible and then closed in a way that leaves the site stable in terms of erosion and avoids degradation of water quality from acid rock drainage or metal leaching on the site. A detailed Reclamation Plan will be submitted to the State of Alaska agencies for review and approval in the future, during the formal mine permitting process.
Owing to the fact that the Arctic Project is likely to have facilities on a combination of private (patented mining claims and native land) and State land, the Reclamation Plan will be submitted and approved as part of the Plan of Operations, which is approved by the ADNR. However, since the Reclamation and Closure Plan must meet regulations of both ADNR and the ADEC, both agencies will review and approve the Reclamation Plan. In addition, private landowners must formally concur with the portion of the Reclamation Plan for their lands so that it is compatible with their intended post-mining land use.
| 1.17 | Capital and Operating Cost Estimates |
The capital cost estimate has an estimated accuracy of ±15% and uses Q3/Q4-2022 US dollars as the base currency. The total estimated initial capital cost for the design, construction, installation, and commissioning of the Arctic Project is estimated to be $1,177 million including ≤15% contingency. A summary of the estimated initial capital cost, sustaining capital cost and closure costs is shown in Table 1-8.
| Table 1-8: | Capital Cost Summary |
WBS
Level 1 | | | WBS Level 1 Description | | Initial Capex
($ M) | | | Sustaining Capex
($ M) | | | Total Capex
($ M) | |
| 1000 | | | Mining | | | 277.4 | | | | 17.5 | | | | 294.9 | |
| 2000 | | | Crushing | | | 42.5 | | | | 0 | | | | 42.5 | |
| 3000 | | | Process Plant | | | 158.0 | | | | 1.3 | | | | 159.3 | |
| 4000 | | | Tailings | | | 88.3 | | | | 32.4 | | | | 120.7 | |
| 5000 | | | On-site Infrastructure | | | 172.8 | | | | 35.1 | | | | 207.9 | |
| 6000 | | | Off-site Infrastructure | | | 75.8 | | | | 0 | | | | 75.8 | |
| Sub-total Direct Costs | | | 834.1 | | | | 86.3 | | | | 920.4 | |
| 7000 | | | Indirects | | | 177.4 | | | | 15.1 | | | | 192.5 | |
| 8000 | | | Contingency (~12% of total project cost) | | | 138.5 | | | | 13.0 | | | | 151.5 | |
| 9000 | | | Owner’s Costs | | | 26.8 | | | | 0 | | | | 26.8 | |
| Sub-total Indirect Costs | | | 342.7 | | | | 28.1 | | | | 370.8 | |
| Project Total | | | 1,176.8 | | | | 114.4 | | | | 1,291.2 | |
| Project Total – Closure Costs | | | | | | | | | | | 170.8 | |
| | |
| Arctic Project | Page 20 |
| S-K 1300 Technical Report Summary | November 30, 2022 |
| | |
The operating cost estimates use US dollars as the base currency and have an accuracy of ±15% and include contingency. An average operating cost was estimated for the Arctic Project based on the proposed mining schedule. These costs included mining, processing, G&A, surface services, and road toll & maintenance costs. The average LOM unit operating cost for the Arctic Project is estimated to be $59.83/t milled. The breakdown of costs in Table 1-9 is estimated based on the LOM average mill feed rate of 3,650,000 t/a.
All pre-production costs have been included in the capital cost estimate in Section 1.1 above.
| Table 1-9: | Overall Operating Cost Estimate |
| Description | | LOM Average Unit Operating Cost
($/ t milled) | | | LOM Average Annual Cost
($ M/a) | | | Percentage of Total Annual
Operating Costs | |
| Mining* | | | 22.49 | | | | 82.1 | | | | 37.6 | % |
| Processing | | | 22.60 | | | | 82.5 | | | | 37.8 | % |
| G&A | | | 5.85 | | | | 21.3 | | | | 9.8 | % |
| Road Toll and Maintenance | | | 7.72 | | | | 28.2 | | | | 12.9 | % |
| Water Treatment | | | 1.17 | | | | 4.3 | | | | 2.0 | % |
| Total Operating Cost | | | 59.83 | | | | 218.4 | | | | 100 | % |
* Excludes pre-production costs. Includes contingency which is less than 15%.
The results of this economic analysis represent forward looking information. The results depend on the inputs that are subject to several known and unknown risks, uncertainties, and other factors that may cause actual results to differ materially from those presented in this section. Information that is forward looking includes mineral reserve estimates, commodity prices, the proposed mine production plan, construction schedule, projected recovery rates, proposed capital and operating cost estimates, closure cost estimates, toll road cost estimates, and assumptions on geotechnical, environmental, permitting, royalties, and hydrogeological information.
An economic analysis was undertaken on a 100% project ownership basis to determine the internal rate of return (IRR), net present value (NPV) and payback on initial investment of the Arctic Project. Trilogy holds 50% interest in the Arctic Project through its ownership in Ambler Metals. The Project consists of a three-year construction period, followed by 13 years of production.
Ausenco developed a pre-tax cash flow model for the Arctic Project and the NPV and IRR were calculated at the beginning of the construction period in Year -3.
The pre-tax financial model incorporated the production schedule and smelter term assumptions to produce annual recovered payable metal, or gross revenue, in each concentrate stream by year. Off-site costs, including the applicable refining and treatment costs, penalties, concentrate transportation charges, marketing and representation fees, and royalties were then deducted from gross revenue to determine the NSR. The operating cash flow was then produced by deducting annual mining, processing, G&A, surface services, and road toll & maintenance charges from the NSR. Initial and sustaining capital was deducted from the operating cash flow in the years they occur, to determine the net cash flow before taxes. Initial capital cost includes all estimated expenditures in the construction period, from Year -3 to Year -1 inclusive. First production occurs at the beginning of Year 1. Sustaining capital expenditure includes all capital expenditures purchased after first production, including mine closure and rehabilitation. The model includes an allocation of a 1% NSR attributable to NANA.
| | |
| Arctic Project | Page 21 |
| S-K 1300 Technical Report Summary | November 30, 2022 |
| | |
With total capital costs of $1,719 million over LOM ($1,177 million initial capital cost, $114 million sustaining capital cost and $428 million closure costs), the project demonstrates a pre-tax NPV of $1,500 million at an 8% discount rate, IRR of 25.8% and payback period of 2.9 years. Post-tax financials have an NPV of $1,108 million at an 8% discount rate, IRR of 22.8% and payback period of 3.1 years.
| 1.19 | Interpretations and Conclusions |
The Arctic deposit will be mined at an annual rate of 35 Mt of ore per year with an overall stripping ratio of 7.3. Ore will be processed by conventional methods to annually produce 234 kt of copper, 23 kt of lead, and 174 kt of zinc, all in concentrates for provision to third party refiners. Waste and tailings materials will be stored in surface facilities, which will be closed and reclaimed at the end of the mine; contact water will be treated and discharged to the environment throughout the LOM. Precious metals attendant with the concentrates will be largely payable. While there are deleterious elements reporting to the concentrates at levels that could incur penalties, special processing provisions have been included in the flowsheet to make a readily saleable concentrate.
In terms of project execution, the mine requires nominally two years of pre-strip operations, tailings pond starter dam development and water accumulation before actual production mining operations can commence.
For that pre-strip work to start, the Arctic access road from the AMDIAP intersection to the mine site will have to be constructed to at least a pioneer road condition that will allow the mine fleet and the support facilities to be delivered, built, and made operational.
Positive financial results support the declaration of Mineral Reserves.
It is the QPs’ opinion that the identified technical and economic risks and uncertainly related to the property can be reduced and improved with the additional recommended work programs as outlined below, helping to continue developing the Project through engineering and de-risking, and into construction at a total cost of $14.4 million.
Table 1-10 and the following subsections summarize the key recommendations arising from a review of each major area of investigation completed as part of this study to improve the base case design.
| | |
| Arctic Project | Page 22 |
| S-K 1300 Technical Report Summary | November 30, 2022 |
| | |
| Table 1-10: | Summary of Recommended Work Packages |
| Description | | Cost ($) | |
| Mining | | | 1,073,000 | |
| Geology and Resource Models | | | 10,190,000 | |
| Open Pit Geotechnical Work | | | 150,000 | |
| Hydrogeology | | | 490,000 | |
| Tailings Management Facility | | | 1,420,000 | |
| Closure | | | 250,000 | |
| Water Treatment | | | 170,000 | |
| Metallurgical Testing | | | 175,000 | |
| Recovery Methods | | | 350,000 | |
| Operational Readiness Plan | | | 120,000 | |
| Total | | | 14,388,000 | |
| • | Perform a SMU study to define an optimal block size that can support the envisioned production rate while minimizing dilution |
| • | Requote explosives as Ammonium nitrate prices are currently in record highs due to the Ukraine-Russia conflict |
| • | Assess the use of alternate fuel sources for the mine mobile equipment |
| • | Confirm the location, thickness, and continuity of the talc layers near to the northeast wall of the final pit. |
| 1.20.2 | Geology and Resource Models |
| • | Bias in historical copper and lead assays: compare the current Mineral Resource estimate with an estimate prepared using a correction factor applied to the historic Cu and Pb assay values that remain in the assay database or an estimate that does not use these historical intervals |
| • | Bias in predicted SG values: review methodology and dataset used to generate the predicted SG values to minimize or mitigate apparent bias |
| • | Mineral Resource Classification confidence related to geological complexity: consider putting additional in-fill holes in drill grids to mitigate the risk of complex geology within the first 5 years of production. This is recommended to classify Measured Resources which can then be converted to Proven Mineral Reserves and provide high confidence in the production plan at project start and payback period. |
| | |
| Arctic Project | Page 23 |
| S-K 1300 Technical Report Summary | November 30, 2022 |
| | |
| • | Update the geological and resource model using all available data, including that from the 2022 drilling program |
| ○ | Review and update variogram models for all metals and SG using all available data |
| ○ | Review and update the resource model estimation parameters for all metals and SG |
| ○ | Review the current compositing length of 1m that is more in agreement with the average sample length |
| ○ | Update the geological model wireframes with all available data. |
| • | Address minor database issues: transcription error checks, removing survey measurements causing excessive deviation, reviewing detection limits, and including additional fields to indicate if chosen values are supported by QC |
| 1.20.3 | Open Pit Geotechnical work |
| • | Update the 3D talc model to include all available drilling and laboratory testing data and complete a geotechnical review to update the slope designs |
| • | Consider potential slope instability risks identified in the interim and final mining phases of the open pit design |
| • | Re-evaluate seismic impact on the slope design |
| • | Review the pore pressure monitoring system and mitigation plan as additional data becomes available, adopting mitigation efforts as appropriate. |
| • | Update the hydrogeological conceptual model for the pit and valley areas as more data becomes available |
| • | For the pit, continue water level monitoring, assess potential effects of seasonal or rapid and high amplitude recharge events (i.e., freshet), assess pit sump locations, assess drainage ditches around and set back from the pit perimeter, consider snow removal or clearing off high elevation portions of the pit, update pit Groundwater Management Plan as mine design advances, and install general pit perimeter groundwater monitoring on the north, south and west sides of the pit. |
| • | For the valley bottom, conduct hydrogeological drilling at location of the groundwater seepage interception system (SIS), update conceptual model, update estimates of potential groundwater bypass of the WRCP and the groundwater SIS design, and initiate baseline monitoring of groundwater quality around groundwater SIS. |
| 1.20.5 | Tailings Management Facility |
| • | Complete geotechnical and hydrogeological investigations in the foundations of the TMF, WRF, WRCP, and Process Pond including borehole drilling and laboratory testing |
| • | Conduct Dam Breach Assessment, based on site specific hazard assessment for the TMF, the WRCP and Process pond |
| • | Finite element consolidation and seepage modelling of the TMF |
| • | Tailings deposition planning and water balance update |
| • | Evaluate tailings consolidation and requirement for an underdrain system |
| • | Update WRF, TMF, WRCP, and Process Pond stability analyses (including liquefaction assessment) based on additional field investigation results and lab testing |
| | |
| Arctic Project | Page 24 |
| S-K 1300 Technical Report Summary | November 30, 2022 |
| | |
| • | Evaluate whether heat or gas generation during oxidation of waste rock may adversely affect the closure cover. |
| • | Conduct revegetation and cover study, and conduct trials during operations to develop a revegetation program, including climatic variables |
| • | Consult with the Alaska Plant Materials Center to develop a revegetation program utilizing native species to determine the optimal growth media depth, amendments, and soil cover to optimize plant survival. |
| • | Review and adjust the WTP design as the discharge permitting advances and the actual permitted discharge criteria become more defined |
| • | Continue to track and address identified project risks and opportunities |
| • | Implement bench-scale and pilot-scale treatment tests to confirm high treatment rates required to meet the WQS and to right-size treatment equipment |
| • | Evaluate RO reject treatment train once real mine-impacted water is generated during the operation phase |
| • | Refine the acids and bases used in the WTP to reduce the risk of TDS WQS compliance issues |
| • | Continue to refine WTP influent water quality predictions. |
| 1.20.8 | Metallurgical testing |
| • | Additional testwork to further refine metallurgical performance and recovery estimates for the flowsheet, including: |
| ○ | Variability testing on samples with characteristics that match the LOM feed material |
| ○ | Circuit flowsheet modifications to improve concentrate quality and reduce deleterious elements, where applicable |
| ○ | Comminution testing on new samples to optimize comminution power. |
| • | Capital cost optimization and a thorough review of equipment sizing/selection based on the geometallurgy outcomes. |
| 1.20.10 | Operational Readiness Plan |
| • | Develop a robust Operational Readiness (OR) plan to address risks and challenges associated with operating at a remote site: |
| ○ | Review project and operating assumptions to take into consideration the impacts of labour availability and logistical challenges with availability of equipment |
| ○ | Create a start-up/operational risk register to highlight issues for decisions taken during design |
| ○ | Incorporate development and implementation considerations for the remote cold-weather project site with limited access. |
| | |
| Arctic Project | Page 25 |
| S-K 1300 Technical Report Summary | November 30, 2022 |
| | |
| ○ | Develop alternatives for supply, transportation and logistics for reagents, concentrate, and any other goods |
| ○ | Track environment and operations-related permits to avoid costly alternatives |
| ○ | Explore opportunities to develop synergies with existing businesses and build an “industrial base” required to sustain mining and processing operations |
| ○ | Identify vendors to support contracts, parts, warehousing, training and first fills |
| ○ | Consider strategic Human Resources (HR) staffing decisions such as innovative labour scheduling and local sourcing |
| ○ | Identify Health, Safety, Environment and Community (HSEC) policies and procedures for a remote site to leverage local resources and other tie-ins where possible |
| ○ | Early mobilization of key technical functions to support mining and operations. |
| | |
| Arctic Project | Page 26 |
| S-K 1300 Technical Report Summary | November 30, 2022 |
| | |
Trilogy Metals Inc. (Trilogy or Trilogy Metals) is listed on the Toronto Stock Exchange (TSX) and the New York Stock Exchange (NYSE). As a result, Trilogy is a reporting issuer in Canada and must comply with National Instrument 43-101 Standards of Disclosure for Mineral Projects (NI 43-101) and is a registrant with the United States Securities and Exchange Commission (SEC) and must also comply with subpart 229.1300 - Disclosure by Registrants Engaged in Mining Operations of Regulation S-K (S-K 1300).
Trilogy commissioned Ausenco Engineering Canada Inc. (Ausenco) to manage the update of the 2020 Arctic Feasibility Study Technical Report (2020 FS) prepared in accordance with NI 43-101 into a prefeasibility-level study (the Arctic Project) and summarize into a S-K 1300 Technical Report Summary (the Report) on the Arctic deposit in the Ambler Mining District of northwest Alaska.
The Arctic Project is directly held by Ambler Metals, a 50/50 joint venture formed between South32 and Trilogy in February 2020. Upon the formation of the joint venture, Trilogy contributed all of its Alaskan assets, including the Arctic Project and Trilogy's agreement with NANA (see Section 3.4.2), to Ambler Metals in exchange for a 50% ownership interest and at the same time, South32 contributed $145 million in cash for their 50% ownership interest.
The firms and consultants who have provided updates and are co-authors of this Report are Ausenco, B&C, SRK and Wood.
The Report excludes the Bornite group of claims, which is a separate project and subject to a separate technical report summary.
All units of measurement in this Report are metric, unless otherwise stated.
The monetary units are in US dollars, unless otherwise stated.
Mineral Resources and Mineral Reserves are prepared in accordance with the standards and definitions of S-K 1300.
Table 2-1 provides a list of the firms and individuals that acted as third party Qualified Persons (QPs) in the preparation of this Report.
| Table 2-1: | Report Contributors |
| Qualified Person | Report Responsibilities | Report Sections |
| Ausenco | Plant and infrastructure design, metallurgy, recovery methods, consolidation of the capital costs and operating costs and the overall financial model | 1.1, 1.3, 1.4, 1.9, 1.13, 1.14.1, 1.14.2, 1.14.3, 1.14.4, 1.15, 1.17, 1.18, 1.19, 1.20.8, 1.20.9, 1.20.10, 2, 3.1, 3.2, 3,10, 4, 5.3.8, 10, 14, 15.1, 15.2, 15.3, 15.4, 15.5, 15.6, 15.7, 15.10.8, 15.12, 15.13, 15.14, 15.15, 15.16, 16, 18.1.1, 18.1.2, 18.1.3, 18.1.4, 18.1.5, 18.1.7, 18.1.9, 18.1.10, 18.1.11, 18.1.12, 18.1.13, 18.1.14, 18.2.1, 18.2.3, 18.2.4, 18.2.5, 18.2.6, 19, 21, 22.1, 22.5, 22.9, 22.10, 22.12, 22.13, 22.14, 22.15, 22.16, 22.17.8, 22.17.9, 23.1, 23.9, 23.10, 23.11, 24, 25.1, 25.3, 25.5 |
| B&C | Water treatment | 1.14.9, 1.20.7, 2.3, 15.9, 17.3.4, 17.3.6.2, 18.1.9.1, 18.2.6, 23.8, 25.2 |
| SRK | Tailings waste design, pit slope design, hydrology, water management, hydrogeology | 1.14.6, 1.14.7, 1.14.8, 1.16.3, 1.20.3, 1.20.4, 1.20.5, 1.20.6, 2.3, 2.4, 3.7, 3.8, 3.9, 3.10, 5.3.7, 7.2.4, 8.1.2, 8.2.5, 13.9, 13.10.1, 13.11, 15.8, 15.10.1, 15.10.2, 15.10.3, 15.10.4, 15.10.5, 15.10.6, 15.10.7, 15.11, 17.3.1, 17.3.2, 17.3.3, 17.3.5, 17.6, 22.17.3, 22.17.4, 22.17.5, 22.17.6, 22.17.7, 23.4, 23.5, 23.6, 23.7, 25.2, 25.4 |
| Wood | Geology, mine design, mineral resource estimate, mineral reserve estimates | 1.2.1, 1.5, 1.6, 1.7, 1.8, 1.10, 1.11, 1.12, 1.14.5, 1.20.1, 1.20.2, 2.3, 2.4, 2.5, 2.6, 3.3, 3.4, 3.5, 3.6, 3.10, 6, 7.1, 7.2.1, 7.2.2, 7.2.3, 7.2.5, 7.2.6, 7.2.7, 7.2.8, 8.1.1, 8.1.3, 8.1.4, 8.1.5, 8.1.6, 8.2.1, 8.2.2, 8.2.3, 8.2.4, 8.3, 9, 11, 12, 13.1, 13.2, 13.3, 13.4, 13.5, 13.6, 13.7, 13.8, 13.10, 17.1, 17.2, 18.1.6, 18.2.2, 22.2, 22.3, 22.4, 22.6, 22.7, 22.8, 22.17.1, 22.17.2, 23.2, 23.3, 25.2, 25.4, 25.5 |
| | |
| Arctic Project | Page 27 |
| S-K 1300 Technical Report Summary | November 30, 2022 |
| | |
Ausenco's process QP relied on information from another Ausenco QP's visit to the Arctic Project site on July 25, 2017, during which that QP inspected the property access, viewed the surface topography in the area proposed for the process plant and supporting infrastructure.
SRK's tailings QP visited the Arctic Project site from July 24-25, 2017, and July 10-12, 2018. He inspected property access and surface topography where the waste rock facility and tailings management facilities are to be located, as well as available space for other mine facilities.
SRK's geotechnical QP visited the Arctic Project site August 27-29, 2019. During the visit he reviewed selected drill core, and inspected the Arctic deposit discovery outcrop, 2019 drill pads at Arctic, and a talc outcrop.
Wood's geology and resource QP visited the Arctic Project site during August 29 to September 8, 2022. During the site visit, he observed the diamond drill core logging processes that include geology, structure and geotechnical logging, sampling, and specific gravity (SG) measurement process. He also visited Arctic site area, measured historical collar locations with a handheld global positioning system (GPS), reviewed representative drill cores, observed active drilling process. He visited drill core and pulp storage sites at camp and in Fairbanks office/warehouse.
Wood's mining QP visited the site on August 30, 2022. During the visit, Wood inspected the property access and viewed the surface topography in the areas proposed for the locations of the open pit, mine infrastructure and waste rock facility are to be located; inspected lithologies in selected drill cores that would support the pit walls; and observed talc outcrop and main foliation that could affect pit slope stability.
This Report is current as of November 30, 2022.
| 2.6 | Information Sources and References |
Reports and documents listed in Section 2.7 and Section 24 were used to support the preparation of the Report. Additional information was sought from Trilogy where required.
Trilogy contributed to Sections 1.16, 2.3, 5, 17.1, 17.2, 17.3, 17.4, 18.1, 22.11 and 25 of this Report.
This is the first S-K 1300 Technical Report Summary filed by Trilogy on the Arctic Project.
| | |
| Arctic Project | Page 28 |
| S-K 1300 Technical Report Summary | November 30, 2022 |
| | |
Previous reports filed by NovaGold and NovaCopper/Trilogy and available on SEDAR (www.sedar.com) include:
| • | Staples, P., Davis, B., MacDonald AJ., Austin, J., Sim, R., Boese, C., Murphy, B., and Sharp, T., Peralta Romero, A., 2020: Arctic Project, Northwest Alaska, USA, NI 43-101 Technical Report on Feasibility Study, report prepared by Ausenco Engineering Canada Inc. for Trilogy Metals Inc., effective date August 20, 2020. |
| • | Staples, P., Hannon, J., Peralta Romero, A., Davis, B., DiMarchi, J., Austin, J., Sim, R., Boese, C., Murphy, B., and Sharp, T., 2018: Arctic Project, Northwest Alaska, USA, NI 43-101 Technical Report on Pre-Feasibility Study, report prepared by Ausenco Engineering Canada Inc. for Trilogy Metals Inc., effective date February 20, 2018. |
| • | Davis, B., Sim, R., and Austin, J., 2017: NI 43-101 Technical Report on the Arctic Project, Northwest Alaska, USA: report prepared by BD Resource Consulting, Inc., SIM Geological Inc., and International Metallurgical & Environmental Inc. for Trilogy Metals Inc., effective date April 25, 2017. |
| • | Wilkins, G., Stoyko, H.W., Ghaffari, H., DiMarchi, J., Huang, J., Silva, M., O’Brien, M.F., Chin, M., and Hafez, S.A., 2013: Preliminary Economic Assessment Report on the Arctic Project, Ambler Mining District, Northwest Alaska: report prepared by Tetra Tech for NovaCopper inc., effective date September 12, 2013. |
| • | Rigby, N., White, R., Volk, J., Braun, T., and Olin, E.J., 2012: NI 43-101 Preliminary Economic Assessment Ambler Project Kobuk, AK: report prepared by SRK Consulting (US) Inc. for NovaCopper inc., effective date February 1, 2012. |
| • | Rigby, N., and White, R., 2011: NI 43-101 Preliminary Economic Assessment Ambler Project Kobuk, AK: report prepared by SRK Consulting (US) Inc. for NovaGold Resources Inc., effective date May 9, 2011. |
| • | Rigby, N., and White, R., 2008: NI 43-101 Technical Report on Resources Ambler Project Arctic Deposit, Alaska: report prepared by SRK Consulting (US) Inc. for NovaGold Resources Inc., effective date January 31, 2008. |
| 2.8 | Abbreviations and Acronyms |
A list of unit abbreviations is provided in Table 2-2 and an acronyms and abbreviations in Table 2-3.
| Table 2-2: | Unit Abbreviations |
| Abbreviation | Definition | Abbreviation | Definition |
| % | Percent | km/h | Kilometres per hour |
| ‘ | Minute (plane angle) | km2 | Square kilometer |
| “ | Second (plane angle) | kPa | Kilopascal |
| < | Less than | kt | Thousand tonnes |
| > | Greater than | kV | Kilovolt |
| ° | Degree | kW | Kilowatt |
| °C | Degrees Celsius | kWh | Kilowatt hour |
| °F | Degrees Fahrenheit | kWh/a | Kilowatt hours per year (annum) |
| µm | Microns | kWh/t | Kilowatt hours per tonne (metric ton) |
| A | Ampere | L | Litres |
| | |
| Arctic Project | Page 29 |
| S-K 1300 Technical Report Summary | November 30, 2022 |
| | |
| | |
| | |
| Abbreviation | Definition | Abbreviation | Definition |
| a | Annum (year) | L/m | Litres per minute |
| ac | Acre | lb | Pounds |
| B | Billion | lb/ton | Pounds per ton |
| cfm | Cubic feet per minute | m | Metres |
| cm | Centimetre | M | Million |
| cm2 | Square centimetre | m2 | Square metre |
| cm3 | Cubic centimetre | m3 | Cubic metre |
| d | Day | masl | Metres above sea level |
| d/a | Days per year (annum) | mg | Milligram |
| d/wk | Days per week | mg/l | Milligrams per litre |
| ft | Feet | mi | Mile |
| ft2 | Square foot | min | Minute (time) |
| ft3 | Cubic foot | mL | Millilitre |
| ft3/s | Cubic feet per second | mm | Millimetre |
| g | Gram | mo | Month |
| g/cm3 | Grams per cubic centimetre | Mt | Million tonnes |
| g/L | Grams per litre | MW | Megawatts |
| g/t | Grams per tonne | MWh | Megawatt hour |
| GPM | US Gallons per minute | oz | Ounce |
| h | Hour | ppb | Parts per billion |
| h/a | Hours per year (annum) | ppm | Parts per million |
| h/d | Hours per day | psi | Pounds per square inch |
| h/w | Hours per week | rpm | Revolutions per minute |
| ha | Hectare (10,000 m2) | s | Second (time) |
| hp | Horsepower | t | Tonnes (metric - 1,000 kg) |
| in | Inch | ton | Tons (imperial – 2,000 lb) |
| in2 | Square inch | t/a | tonnes per year (annum) |
| in3 | Cubic inch | USG | US Gallons |
| k | Kilo (thousand) | V | Volt |
| kg | Kilogram | wk | Week |
| kg/h | Kilograms per hour | y | Year (annum) |
| kg/m2 | Kilograms per square metre | | |
| km | Kilometre | | |
| | |
| Arctic Project | Page 30 |
| S-K 1300 Technical Report Summary | November 30, 2022 |
| | |
| Table 2-3: | Acronyms and Abbreviations |
| Acronym/Abbreviation | Definition |
| AA | Atomic Absorption |
| AACE | Association for the Advancement of Cost Engineering |
| | |
| Arctic Project | Page 31 |
| S-K 1300 Technical Report Summary | November 30, 2022 |
| | |
| | |
| | |
| Acronym/Abbreviation | Definition |
| AAP | Ambler Access Project |
| AAS | Atomic Adsorption Spectroscopy |
| ABA | Acid Base Accounting |
| ADEC | Alaska Department of Environmental Conservation |
| ADNR | Alaska Department of Natural Resources |
| AES | Atomic Emission Spectroscopy |
| AFD | Approved For Design |
| AHEA | Annual Hardrock Exploration Activity |
| AIDEA | Alaska Industrial Development and Export Authority |
| AMA | Arctic Mine Access |
| AMDIAP | Ambler Mining District Industrial Access Project |
| AMJ | Arctic Mine Junction |
| AMR | Aphanitic Metarhyolite |
| AMLT | Alaska Mining License Tax |
| ANCSA | Alaska Native Claims Settlement Act |
| ANFO | Ammonium Nitrate Fuel Oil |
| ANILCA | Alaska National Interest Land Conservation Act |
| AP | Acid Potential |
| APDES | Alaska Pollutant Discharge Elimination System |
| ARD | Acid Rock Drainage |
| AST | Alaska State Income Tax |
| BCMC | Bear Creek Mining Company |
| BFA | Bench Face Angle |
| BMAL | Bulk Mineral Analysis with Liberation |
| BV | Bureau Veritas |
| BWi | Ball Mill Work Index |
| CC | Construction Camp |
| ChS | Chlorite Schist |
| ChTS | Chlorite Talc Schist |
| CSAMT | Controlled Source Audio Magneto Telluric |
| CuEq | Copper Equivalent |
| CWA | Clean water act. |
| DCF | Discounted Cash Flow |
| DDH | Diamond Drill Hole |
| DGPS | Differential GPS |
| DTY | Dalton Transfer Yard |
| DWi | Drop Weight Index |
| EGL | Effective Grinding Length |
| | |
| Arctic Project | Page 32 |
| S-K 1300 Technical Report Summary | November 30, 2022 |
| | |
| | |
| | |
| Acronym/Abbreviation | Definition |
| EIS | Environmental Impact Assessment |
| EM | Electromagnetic |
| EPCM | Engineering, Procurement, and Construction Management |
| FA | Fire Assay |
| FEL | Front End Loaders (Loading) |
| FOS | Factors of Safety |
| FS | Feasibility Study |
| GISTM | Global Industry Standard on Tailings Management |
| GOH | Gross Operating Hours |
| GPS | Global Positioning System |
| GS | Grey Schist |
| HA | Heavy ANFO |
| HCTs | Humidity Cell Tests |
| HDPE | High-density Polyethylene |
| HR | Human Resources |
| HSEC | Health, Safety, Environment and Community |
| ICP | Inductively Coupled Plasma |
| ICP-MS | Inductively Coupled Plasma Mass Spectroscopy |
| IP | Induced Polarization |
| IPR | Instantaneous Penetration Rates |
| IRA | Inter Ramp Angle |
| IRR | Internal Rate of Return |
| JV | Joint Venture |
| KRC | Kennecott Research Centre |
| LBMA | London Bullion Market Association |
| LiDAR | Light Detection and Ranging Survey |
| LME | London Metal Exchange |
| LOM | Life of Mine |
| MAR | Mean Annual Runoff |
| MIBC | Methyl Isobutyl Carbinol |
| ML | Metal Leaching |
| MLUP | Miscellaneous Land Use Permit |
| MMU | Mobile Mixing (Manufacturing) Unit |
| MO | Metso Outotec |
| MS | Massive Sulphide |
| NAD | North American Datum |
| NEPA | natural environmental policy act |
| NI | National Instrument |
| | |
| Arctic Project | Page 33 |
| S-K 1300 Technical Report Summary | November 30, 2022 |
| | |
| | |
| | |
| Acronym/Abbreviation | Definition |
| NN | Nearest Neighbour |
| NOH | Net Operating Hours |
| NP | Neutralization Potential |
| NPV | Net Present Value |
| NSR | Net Smelter Return |
| NWAB | Northwest Arctic Borough |
| NYSE | New York Stock Exchange |
| OR | Operational Readiness |
| PAF | Permanent Accommodations Facility |
| PAG | Potentially Acid Generating |
| PE | Professional Engineer |
| PEA | Preliminary Economic Assessment |
| PFD | Process Flow Diagram |
| PFS | Pre-Feasibility Study |
| PGA | Peak Ground Acceleration |
| PIMA | Portable Infrared Mineral Analyzer |
| PMF | Probable Maximum Flood |
| PoF | Potential of Failure |
| PP | Process Plant |
| PWTP | Potable Water Treatment Plant |
| QA | Quality Assurance |
| QC | Quality Control |
| QPs | Qualified Persons |
| RAA | Resource Associates of Alaska |
| RF | Revenue Factor |
| RFQ | Request for Quotation |
| RMR | Rock Mass Rating |
| RO | Reverse Osmosis |
| ROD | record of decision |
| ROM | Run of Mine |
| RQD | Rock Quality Designation |
| RTDs | Rubber Tire Dozers |
| S-K 1300 | Subpart 229.1300 – Disclosure by Registrants Engaged in Mining Operations in Regulations |
| SAB | SAG/Ball |
| SAG | Semi Autogenous Grind |
| SG | Specific Gravity |
| SMC | SAG Mill Comminution (?) |
| SMS | Semi Massive Sulphide |
| | |
| Arctic Project | Page 34 |
| S-K 1300 Technical Report Summary | November 30, 2022 |
| | |
| Acronym/Abbreviation | Definition |
| SPI | Significant Potential Incidents |
| ST | Sodium Tungsten |
| STP | Sewage Treatment Plant |
| TAC | Transportation Association of Canada |
| TCJA | Tax Cuts & Jobs Act |
| TDEM | Time Domain Electromagnetic |
| THH | Top Head Hammer |
| THPVC | Thompson Howarth Precision Versus Concentration |
| TIC | Total Inorganic Carbon |
| TMF | Tailings Management Facilities |
| ToC | Time of Concentration |
| TS | Talc Schist |
| TSX | Toronto Stock Exchange |
| UCS | Unconfined Compressive Strength |
| UKMP | Upper Kobuk Mineral |
| USACE | US Army Corps of Engineers |
| USFW | US Fish and Wildlife |
| USGS | US Geological Survey |
| UTM | Universal Transverse Mercator |
| VAT | Value Added Tax |
| VHF | Very High Frequency |
| VMS | Volcanogenic Massive Sulphide |
| VWPs | Vibrating Wire Piezometers |
| WGM | Watts, Griffis and McOuat |
| WQS | Waste Rock Collection Pond |
| WQBEL | Water Quality-Based Effluent Limits |
| WRCP | Waste Rock Contact Pond |
| WRF | Waste Rock Facility |
| WTP | Water Treatment Plant |
| | |
| Arctic Project | Page 35 |
| S-K 1300 Technical Report Summary | November 30, 2022 |
| | |
| 3 | PROPERTY DESCRIPTION AND LOCATION |
The Property is situated in the Ambler mining district of the southern Brooks Range, in the Northwest Arctic Borough (NWAB) of Alaska (Figure 3-1). The Property is located in Ambler River A-2 quadrangle, Kateel River Meridian T 20N, R 11E, section 2 and T 21N, R 11E, sections 34 and 35.
The Property is about 270 km east of the town of Kotzebue, 37 km northeast of the village of Kobuk, and 260 km west of the Dalton Highway, an all-weather State maintained public road, at geographic coordinates N67.17° latitude and W156.39° longitude and Universal Transverse Mercator (UTM) North American Datum (NAD) 83, Zone 4 coordinates 7453080N, 613110E.
| Figure 3-1: | Arctic Project Location Map |

Source: Ambler Metals, 2022.
| | |
| Arctic Project | Page 36 |
| S-K 1300 Technical Report Summary | November 30, 2022 |
| | |
The Property is directly held by Ambler Metals, a 50/50 joint venture formed between South32 and Trilogy in February 2020. Upon the formation of the joint venture, Trilogy contributed all of its Alaskan assets, including the Property to Ambler Metals in exchange for a 50% ownership interest and at the same time, South32 contributed $145 million in cash for a 50% ownership interest.
Prior to the joint venture formation, the Property was held 100% by a wholly owned subsidiary of Trilogy. Trilogy acquired the Property from NovaGold in 2011. In 2011, NovaGold transferred all copper projects to NovaCopper and subsequently spun-out NovaCopper to its then existing shareholders by way of a Plan of Arrangement in 2012. NovaCopper Inc. subsequently underwent a name change to Trilogy Metals Inc. in 2016.
The UKMP consists of an approximately 448,217-acre land package containing state, patented and native lands within an area of interest. There are two discrete mineralized belts within the UKMP - the Devonian Ambler Schist Belt and the Devonian Bornite Carbonate Sequence. The Property is located within the Ambler Schist Belt which comprises approximately 231,008 acres (93,446 ha) of State of Alaska mining claims and US Federal patented mining claims in the Kotzebue Recording District. Exclusive of native lands, the UKMP land tenure consists of 2,136 contiguous State claims totalling 230,736 acres (93,336 ha), including 905 40-acre claims, 1,231 160-acre claims, and 18 Federal patented claims comprising 271.9 acres (110 ha) held in the name of Ambler Metals. Claim locations are shown in Figure 3-2 to Figure 3-4 and listed in Appendix A. The Arctic deposit is located near the southern edge of the centre of the claim block shown in Figure 3-5, primarily within the Federal patented claims, which do not expire and provides exclusive rights to the locatable minerals, and in most cases, the surface and all resources.
The Federal patented claim corners were located by the US Geological Survey (USGS). In Appendix A, a total of 18 Federal patented claims are reported using the completed mineral survey MS 2245 which includes Federal patent number 50-81-0127 covering16 Federal patented claims (Arctic 1, 2, 4, 9, 11, 13, 15, 17, 19, 23, 24, 25, 26, 27, 28, and 29), and Federal patent number 50-83-0174 covering 2 Federal patented claims (Arctic 10 and 495). Figure 3 4 included the locations of the Federal patented claims. There is no expiration date or labour requirement on the Federal patented claims.
The UKMP also consists of lands owned by NANA Regional Corporation, Inc. (NANA), who controls lands granted under the Alaska Native Claims Settlement Act (ANCSA) to the south of the Property boundary. Ambler Metals and NANA are parties to an agreement dated October 19, 2011 (the NANA Agreement) that consolidates the parties' land holdings into an approximately 190,929 ha land package and provides a framework for the exploration and development of the area, including non-exclusive rights for surface access across NANA lands. The NANA Agreement has a term of 20 years, with an option in favour of Ambler Metals to extend the term for an additional 10 years.
Rent for each State claim is up to date and is paid annually to the ADNR. An Annual Labour Statement must be submitted to maintain the State claims in good standing.
| | |
| Arctic Project | Page 37 |
| S-K 1300 Technical Report Summary | November 30, 2022 |
| | |
| Figure 3-2: | Upper Kobuk Mineral Projects Lands |
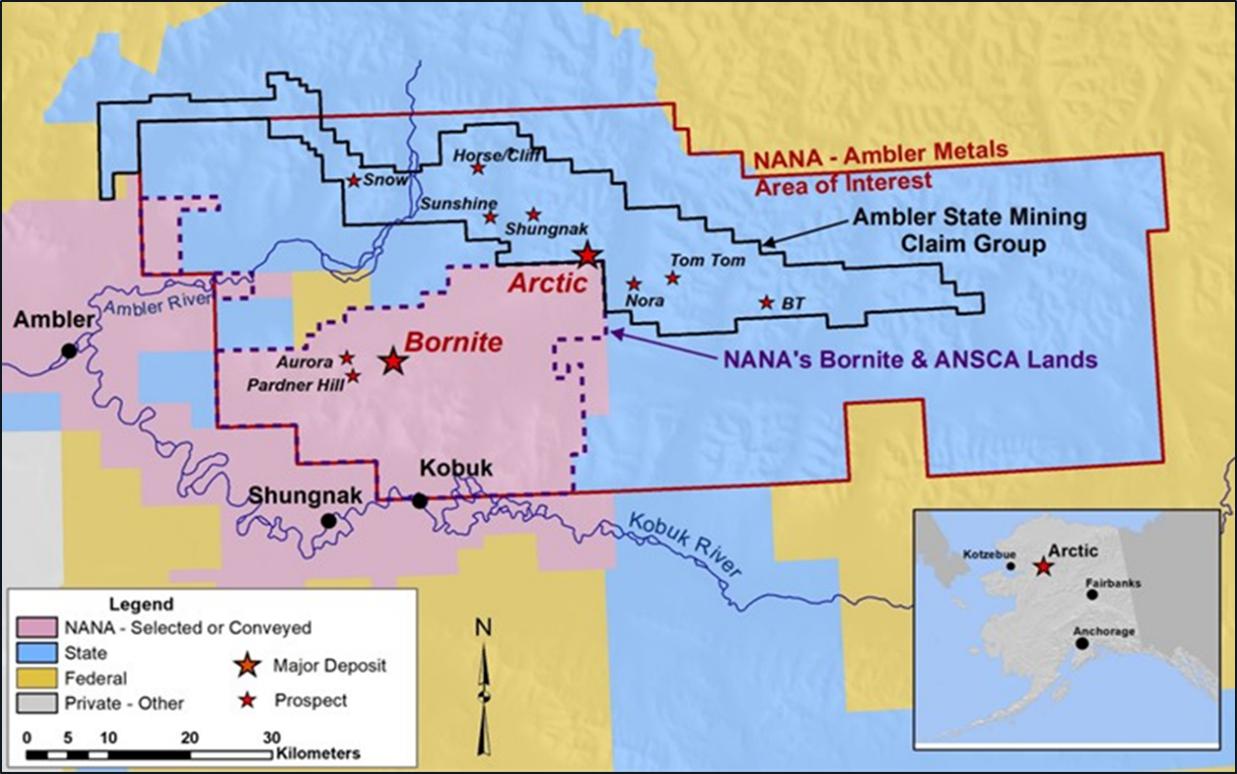
Source: Ambler Metals, 2022.
Note: NANA’s Bornite and ANCSA Lands are not part of the Arctic Property
| | |
| Arctic Project | Page 38 |
| S-K 1300 Technical Report Summary | November 30, 2022 |
| | |
| Figure 3-3: | Arctic Project Mineral Tenure Plan |
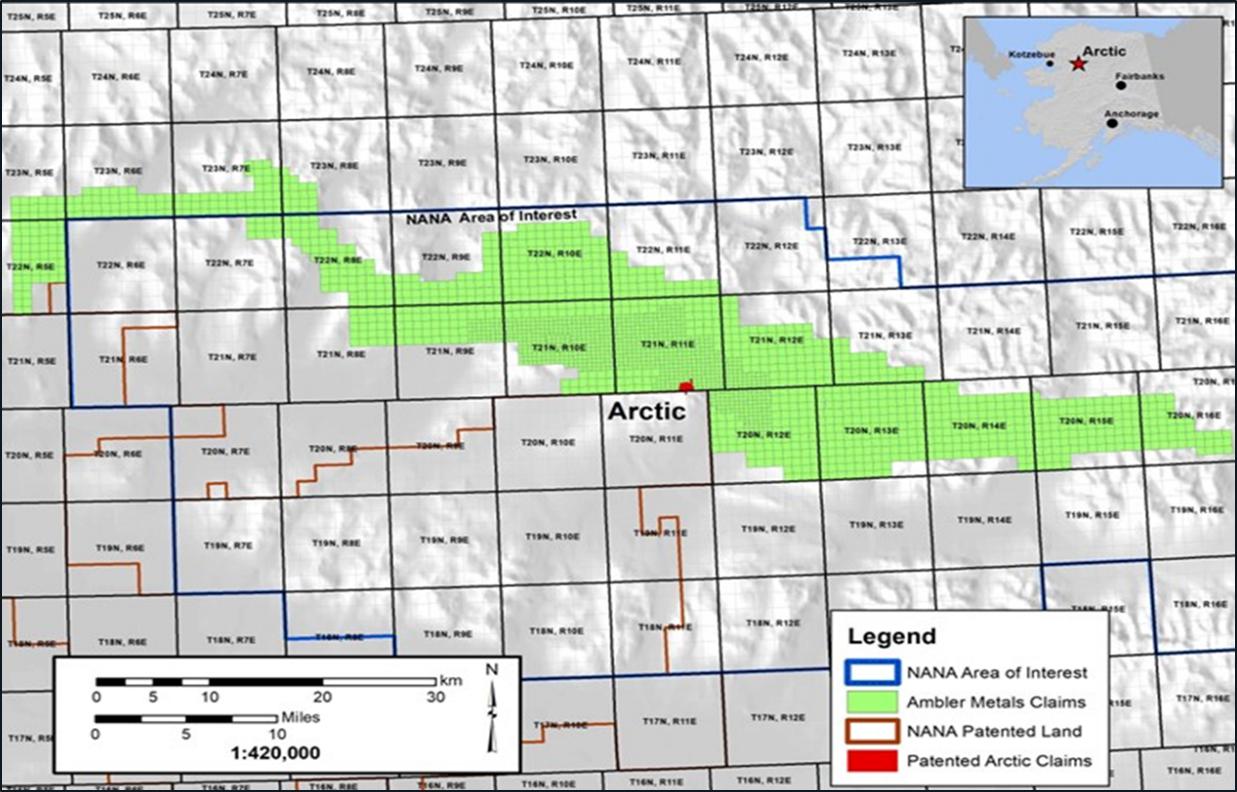
Source: Ambler Metals, 2022.
| | |
| Arctic Project | Page 39 |
| S-K 1300 Technical Report Summary | November 30, 2022 |
| | |
| Figure 3-4: | Mineral Tenure Layout Plan |
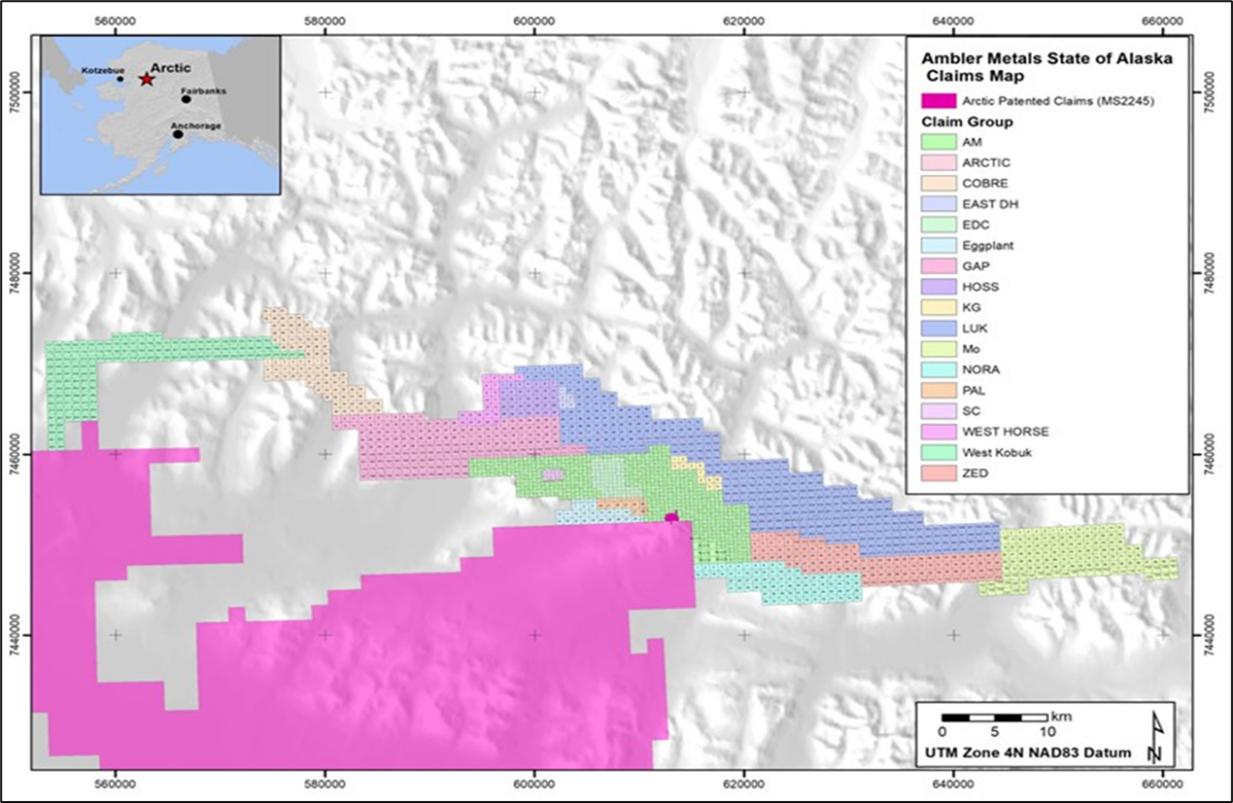
Source: Ambler Metals, 2022.
| | |
| Arctic Project | Page 40 |
| S-K 1300 Technical Report Summary | November 30, 2022 |
| | |
| Figure 3-5: | Arctic Deposit Location |

Source: Ambler Metals, 2022.
| | |
| Arctic Project | Page 41 |
| S-K 1300 Technical Report Summary | November 30, 2022 |
| | |
| 3.4 | Royalties, Agreements and Encumbrances |
| 3.4.1 | Kennecott Agreements |
The Kennecott Royalty Agreement dated effective January 7, 2010, was entered into by and among Kennecott, Alaska Gold Company and NovaGold. A copy of the Kennecott Agreement was recorded in the Kotzebue Recording District on January 8, 2010, as document no. 2010-000013-0.
The Kennecott Royalty Agreement documents a net smelter returns royalty that was reserved to Kennecott in a Purchase and Sale Agreement dated December 18, 2009, whereby Alaska Gold Company and NovaGold acquired mining properties from Kennecott. The mining properties referenced in the Kennecott Royalty Agreement consist of the Federal patented mining claims and many, but not all, of the State mining claims that are the subject of this Report.
Under the Kennecott Purchase and Termination Agreement, Kennecott retained a 1% NSR royalty that has been subsequently sold by Kennecott. The 1% NSR runs with the lands and is purchasable at any time from the royalty holder for a one-time payment of $10 million.
In 1971, the US Congress passed the ANCSA which settled land and financial claims made by the Alaska Natives and provided for the establishment of 13 regional corporations to administer those claims. These 13 corporations are known as the Alaska Native Regional Corporations (ANCSA Corporations). One of these 13 regional corporations is NANA. ANCSA Lands controlled by NANA bound the southern border of the Arctic Project claim block (refer to Figure 3-5).
On October 19, 2011, Trilogy and NANA entered into the NANA Agreement for the cooperative development of their respective resource interests in the Ambler mining district. The NANA Agreement consolidates Trilogy’s and NANA’s land holdings into an approximately 142,831 ha land package and provides a framework for the exploration and development of the area. The NANA Agreement provides that NANA will grant Trilogy the nonexclusive right to enter on, and the exclusive right to explore, the Bornite Lands and the ANCSA Lands (each as defined in the NANA Agreement) and in connection therewith, to construct and use temporary access roads, camps, airstrips, and other incidental works.
The NANA Agreement has been assigned by Trilogy to Ambler Metals upon the formation of the joint venture.
The NANA Agreement has a term of 20 years, with an option in favour of Ambler Metals to extend the term for an additional 10 years. The NANA Agreement may be terminated by mutual agreement of the parties or by NANA if Ambler Metals does not meet certain expenditure requirements on NANA’s lands.
If, following receipt of a feasibility study and the release for public comment of a related draft EIS, Ambler Metals decides to proceed with construction of a mine on the lands subject to the NANA Agreement, Ambler Metals will notify NANA in writing and NANA will have 120 days to elect to either (a) exercise a non-transferrable back-in-right to acquire between 16% and 25% (as specified by NANA) of that specific project; or (b) not exercise its back-in-right, and instead receive a net proceeds royalty equal to 15% of the net proceeds realized by Ambler Metals from such project. The cost to exercise such back-in-right is equal to the percentage interest in the Arctic Project multiplied by the difference between (i) all costs incurred by Ambler Metals or its affiliates on the project, including historical costs incurred prior to the date of the NANA Agreement together with interest on the historical costs; and (ii) $40 million (subject to exceptions). This amount will be payable by NANA to Ambler Metals in cash at the time the parties enter into a joint venture agreement and in no event will the amount be less than zero.
| | |
| Arctic Project | Page 42 |
| S-K 1300 Technical Report Summary | November 30, 2022 |
| | |
| | |
| | |
In the event that NANA elects to exercise its back-in-right, the parties will, as soon as reasonably practicable, form a joint venture with NANA electing to participate between 16% to 25%, and Ambler Metals owning the balance of the interest in the joint venture. Upon formation of the joint venture, the joint venture will assume all of the obligations of Ambler Metals and be entitled to all the benefits of Ambler Metals under the NANA Agreement in connection with the mine to be developed and the related lands. A party’s failure to pay its proportionate share of costs in connection with the joint venture will result in dilution of its interest. Each party will have a right of first refusal over any proposed transfer of the other party’s interest in the joint venture other than to an affiliate or for the purposes of granting security. A transfer by either party of a net smelter royalty return on the project or any net proceeds royalty interest in a project other than for financing purposes will also be subject to a first right of refusal.
In connection with possible development on the Bornite Lands or ANCSA Lands, Ambler Metals and NANA will execute a mining lease to allow Ambler Metals or a joint venture vehicle to construct and operate a mine on the Bornite Lands or ANCSA Lands. The mining lease will provide NANA with a 2% NSR as to production from the Bornite Lands and a 2.5% NSR as to production from the ANCSA Lands.
If Ambler Metals decides to proceed with construction of a mine on its own lands subject to the NANA Agreement, NANA will enter into a surface use agreement with Ambler Metals which will afford Ambler Metals access to the Arctic Project along routes approved by NANA (the Surface Use Agreement). In consideration for the grant of such surface use rights, Ambler Metals will grant NANA a 1% NSR on production and an annual payment of $755 per acre (as adjusted for inflation each year beginning with the second anniversary of the effective date of the NANA Agreement) and for each of the first 400 acres and $100 for each additional acre, of the lands owned by NANA and used for access which are disturbed and not reclaimed.
Figure 3-5 showed the locations of the Bornite and ANCSA Lands that are included in the NANA Agreement. The Bornite Lands are not considered to be part of the Arctic Project, because the mineralization styles identified to date in the Bornite Lands are distinctly different to the mineralization styles in the Ambler claims, and it is expected that any mining operation in the Bornite Lands would be developed as a stand-alone operation using different infrastructure.
The owner of a State mining claim or lease will be obligated to pay a production royalty to the State of Alaska in the amount of 3% of net income received from minerals produced from the State mining claims.
This royalty does not apply to patented federal mining claims.
Surface use of the private land held as Federal patented claims is limited only by reservations in the patents and by generally applicable environmental laws. These do not restrict access or the ability to do work.
Surface use of State claims allows the owner of the mining claim to make such use of the surface as is “necessary for prospecting for, extraction of, or basic processing of minerals.”
| | |
| Arctic Project | Page 43 |
| S-K 1300 Technical Report Summary | November 30, 2022 |
| | |
| 3.7 | Environmental Considerations |
Environmental considerations are discussed in Section 17.
There may be some environmental liabilities associated with sites explored during the 1950s and 1960s. The exploration camp would require rehabilitation if the Arctic Project is closed.
Permitting considerations for the Arctic Project are discussed in Section 17. Permits necessary to advance to the next stage are also discussed in Section 17.
There have been no significant violations or fines on the Property.
Social considerations for the Arctic Project are discussed in Section 17.
| 3.10 | Comment on Property Description and Location |
The QPs consider that there are no other significant factors or material risks that may affect access, mineral tenure, title or the right or ability to perform work on the Property other than what is described in this Report. All mineral tenure, mining leases and crown land title are in good standing. Surface and aerial access to the project site is permitted and well-established. Permits to authorize work program activities are in place and applied for sufficiently in advance of work requirements. It is a reasonable expectation that any additional surface rights that would be required to support Arctic Project development and operations can be obtained through appropriate negotiation.
| | |
| Arctic Project | Page 44 |
| S-K 1300 Technical Report Summary | November 30, 2022 |
| | |
| 4 | ACESSIBILITY, CLIMATE, LOCAL RESOURCES, INFRASTRUCTURE and PHYSIOGRAPHY |
Primary access to the Property is by air, using both fixed wing aircraft and helicopters.
There are four well-maintained, approximately 1,500 m-long gravel airstrips located near the Arctic Project, capable of accommodating charter fixed wing aircraft. These airstrips are located 64 km west at Ambler, 46 km southwest at Shungnak, 37 km southwest at Kobuk, and 34 km southwest at Dahl Creek. There is daily commercial air service from Kotzebue to the village of Kobuk, the closest community to the Arctic Project. During the summer months, the Dahl Creek Camp airstrip is suitable for larger aircraft, such as a C-130 and DC-6.
In addition to the four 1,500 m airstrips, there is a 700 m airstrip located at the Bornite Camp. The airstrip at Bornite is suited to smaller aircraft, which support the Bornite Camp with personnel and supplies. There is also a 450 m airstrip (Arctic airstrip) located at the base of Arctic Ridge that can support smaller aircraft.
A winter trail and a one-lane dirt track suitable for high-clearance vehicles or construction equipment links the Bornite Camp to the Dahl Creek airstrip southwest of the Arctic deposit. An unimproved gravel track connects the Arctic airstrip with the Arctic deposit.
There is no direct water access to the Property. During spring runoff, river access is possible by barge from Kotzebue Sound to Ambler, Shungnak, and Kobuk via the Kobuk River.
The climate in the region is typical of a sub-arctic environment. Weather conditions on the Property can vary significantly from year to year and can change suddenly. During the summer exploration season, average maximum temperatures range from 10°C to 20°C, while average lows range from -2°C to 7°C (Western Regional Climate Center: WRCC – Alaska Climate Summaries: Kobuk 1971 to 2000). By early October, unpredictable weather limits safe helicopter travel to the Arctic Project. During winter months, the Arctic Project can be accessed by snow machine, track vehicle, or fixed wing aircraft. Winter temperatures are routinely below -25°C and can exceed -50°C. Annual total precipitation (rainfall and snowfall) in the region averages 1,219 mm with the most rainfall occurring from July through September, and the most snowfall occurring from October through February.
It is expected that any future mining activity will be conducted on a year-round basis. Past exploration activities are generally confined to the period from late May to late September.
| | |
| Arctic Project | Page 45 |
| S-K 1300 Technical Report Summary | November 30, 2022 |
| | |
| 4.3 | Local Resources and Infrastructure |
The Property is currently isolated from major public infrastructure. Infrastructure assumptions including sources of water and electricity, and the proposed infrastructure layout for the Arctic Project are discussed in Section 15 of the Report.
The Property is approximately 270 km east of the town of Kotzebue, on the edge of Kotzebue Sound, 37 km northeast of the village of Kobuk, 260 km west of the Dalton Highway, and 470 km northwest of Fairbanks. Kobuk (population 191; 2020 US Census) is the location of one of the airstrips near the Arctic Project. Several other villages are also near the Arctic Project, including Shungnak located 46 km to the southwest with a population of 272 (2020 US Census) and Ambler, 64 km to the west with a population of 274 (2020 US Census). Kotzebue has a population of 3,102 (2020 US Census) and is the largest population centre in the Northwest Arctic Borough. Kotzebue is a potential source of limited mining-related supplies and labourers, and is the nearest centre serviced by regularly scheduled, large commercial aircraft (via Nome or Anchorage). In addition, there are seven other villages in the region that will be a potential source of some of the workforce for the Arctic Project. Fairbanks (population 32,515; 2020 US Census) has a long mining history and can provide most mining-related supplies and support that cannot be sourced closer to the Property.
Drilling and mapping programs are seasonal and have been supported out of the Bornite Camp and Dahl Creek Camp. The Bornite Camp facilities are located on Ruby Creek on the northern edge of the Cosmos Hills. The camp provides office space and accommodations for the geologists, drillers, pilots, and support staff. Power is supplied by two diesel generators. Water was supplied by the permitted artesian well located 250 m from camp; however, a water well was drilled in camp during the 2017 field season that was permitted by 2019 to provide all potable water for the Bornite Camp.
There is sufficient area within the Property to host an open pit mining operation, including mine and plant infrastructure, and waste rock and tailings management facilities.
The Property is located along the south slope of the Brooks Range, which separates the Arctic region from the interior of Alaska. Nearby surface water includes Subarctic Creek, the Shungnak and Kogoluktuk Rivers, the Kobuk River, and numerous small lakes. The Property is located at the eastern end of Subarctic Creek, a tributary of the Shungnak River to the west, along a ridge between Subarctic Creek and the Kogoluktuk River Valley. The Property area is marked by steep and rugged terrain with high topographic relief. Elevations range from 30 masl along the Kobuk River to 1,180 masl on a peak immediately north of the Arctic Project area. The divide between the Shungnak and Kogoluktuk Rivers in the Ambler Lowlands is approximately 220 masl.
The Kobuk Valley is located at the transition between boreal forest and Arctic tundra. Spruce, birch, and poplar are found in portions of the valley, with a ground cover of lichens (reindeer moss). Willow and alder thickets and isolated cottonwoods follow drainages, and alpine tundra is found at higher elevations. Tussock tundra and low, heath-type vegetation covers most of the valley floor. Intermittent permafrost exists on the Property.
Permafrost is a layer of soil at variable depths beneath the surface where the temperature has been below freezing continuously from a few to several thousands of years (Climate of Alaska 2007). Permafrost exists where summer heating fails to penetrate to the base of the layer of frozen ground and occurs in most of the northern third of Alaska as well as in discontinuous or isolated patches in the central portion of the State.
Wildlife in the Arctic Project area is typical of Arctic and subarctic fauna (Kobuk Valley National Park 2007). Larger animals include caribou, moose, Dall sheep, bears (grizzly and black), wolves, wolverines, coyotes, lynx and foxes. There are no anadromous fish species in the upper reaches of the Shungnak and Kogoluktuk Rivers due to natural fish barriers. Other fish species such as trout, sculpin, and grayling are common. The caribou seen on the Property belong to the Western Arctic herd that migrate once a year heading south in late August through October from their summer range north of the Brooks Range. The caribou migrate north in March from their winter range along the Buckland River to the north slope of the Brooks Range, a more westerly route and do not cross the Project during that migration.
| | |
| Arctic Project | Page 46 |
| S-K 1300 Technical Report Summary | November 30, 2022 |
| | |
| 4.5 | Comments on Accessibility, Climate, Local Resources, Infrastructure and Physiography |
In the opinion of the QP:
| • | The planned infrastructure, availability of staff, power, water, and communications facilities, the design and budget for such facilities, and the methods whereby goods could be transported to the proposed mine, and any planned modifications or supporting studies are reasonably well-established, or the requirements to establish such, are reasonably well understood by Trilogy, and can support the declaration of Mineral Resources and Mineral Reserves. |
| • | There is sufficient area within the Property to host an open pit mining operation, including mine and plant infrastructure, and waste rock and tailings management facilities. |
| • | It is a reasonable expectation that any additional surface rights that would be required to support Project development and operations can be obtained through appropriate negotiation. |
| • | It is expected that any future mining operations will be able to be conducted year-round. |
| | |
| Arctic Project | Page 47 |
| S-K 1300 Technical Report Summary | November 30, 2022 |
| | |
| | |
| | |
Prospectors in search of gold, travelling up the Kobuk River in 1898-99 (Grinnell, 1901), found several small gold placer deposits in the southern Cosmos Hills, south of the Arctic deposit, which were worked intermittently over the ensuing decades. Around this time, copper mineralization at Ruby Creek and Pardner Hill in the northern Cosmos Hills was explored using small shafts and adits (Smith and Eakin, 1911). In 1947, Rhinehart “Rhiny” Berg staked claims over the Ruby Creek prospects, carried out extensive trenching and the first diamond drilling, and constructed an airstrip for access (alaskamininghalloffame.org 2012). BCMC, an exploration subsidiary of Kennecott, optioned the Ruby Creek property from Berg in 1957. The prospect became known as Bornite and Kennecott conducted extensive exploration over the next decade, culminating in the discovery of the high-grade No. 1 zone and the sinking of an exploration shaft to conduct underground drilling.
While exploring the Bornite deposit, BCMC carried out reconnaissance exploration throughout the western Brooks Range, including a large regional stream sediment survey in 1962. Initial follow up did not identify mineralization of interest however in 1965, Riz Bigelow (BCMC) and his team of geologists found boulders of massive sulphides at an anomaly (1400 ppm Cu) located 28 km northeast of Bornite that led to the discovery of outcropping mineralization the following year. The area was subsequently staked and, in 1967, nine core holes were drilled at the Arctic deposit, eight of which yielded massive sulphide intercepts over an almost 500-m strike length.
BCMC conducted intensive exploration on the property until 1977 and then intermittently through to 1998. No drilling or additional exploration was conducted on the Property between 1999 and 2003.
In addition to drilling and exploration at the Arctic deposit, BCMC also conducted exploration at numerous other prospects in the Ambler Mining District (most notably Dead Creek, Sunshine, Cliff, and Horse). The abundance of Volcanogenic Massive Sulphide (VMS) prospects in the district resulted in a series of competing companies in the area, including Sunshine Mining Company, Anaconda Company, Noranda Exploration Company, GCO Minerals Company, Cominco American Resource Inc. (Cominco), Teck Cominco, Resource Associates of Alaska (RAA), Watts, Griffis and McOuat Ltd. (WGM), and Houston Oil and Minerals Company, culminating into a claim staking war in the district in 1973. Falconbridge and Union Carbide also conducted work later in the district.
District exploration by Sunshine Mining Company and Anaconda resulted in two additional significant discoveries in the district; the Sun deposit located 60 km east of the Arctic deposit, and the Smucker deposit located 36 km west of the Arctic deposit. These two deposits are outside the current Property.
District exploration continued until the early 1980s on the four larger deposits in the district (Arctic, Bornite, Smucker and Sun) when the district fell into a hiatus due to depressed metal prices.
In 1987, Cominco acquired the claims covering the Sun and Smucker deposits from Anaconda. Teck Resources Limited, as Cominco’s successor company, continues to hold the Smucker deposit. In 2007, Andover Mining Corporation purchased a 100% interest in the Sun deposit for $13 million and explored the property through 2013. The Sun deposit and adjacent lands were acquired by Valhalla Metals Inc., a private company, staked over the Sun deposit in 2017 after the creditors for the bankrupt Andover Mining Corporation failed to pay the annual rent of the state claims and submit the Annual Labour Statement.
| | |
| Arctic Project | Page 48 |
| S-K 1300 Technical Report Summary | November 30, 2022 |
| | |
In 1981 and 1983, Kennecott received three US Mineral Survey patents (MS2245 totaling 240 acres over the Arctic deposit – later amended to include another 32 acres; and MS2233 and MS2234 for 25 claims totaling 516.5 acres at Bornite). The Bornite patented claims and surface development were subsequently sold to NANA Regional Corporation, Inc. in 1986.
No production has occurred at the Arctic deposit or at any of the other deposits within the Ambler Mining District.
| 5.2 | Prior Ownership and Ownership Changes – Arctic Deposit and the Ambler Lands |
BCMC initially staked federal mining claims covering the Arctic deposit area beginning in 1966. The 1960’s drill programs defined a significant high-grade polymetallic resource at the Arctic deposit and, in the early 1970s, Kennecott began the patent process to obtain complete legal title to the Arctic deposit. In 1981, Kennecott received US Mineral Survey patent M2245 covering 16 mining claims totalling 240.018 acres. In 1983, US Mineral Survey patent M2245 was amended to include two additional claims totalling 31.91 acres.
With the passage of the Alaska National Interest Lands Conservation Act (ANILCA) in 1980, which expedited native land claims outlined in the ANSCA and State lands claims under the Alaska Statehood Act, both the State of Alaska and NANA selected significant areas of land within the Ambler Mining District. State selections covered much of the Ambler schist belt, host to the VMS deposits including the Arctic deposit, while NANA selected significant portions of the Ambler Lowlands to the immediate south of the Arctic deposit as well as much of the Cosmos Hills including the area immediately around Bornite.
In 1995, Kennecott renewed exploration in the Ambler schist belt containing the Arctic deposit patented claims by staking an additional 48 state claims at Nora and 15 state claims at Sunshine Creek. In the fall of 1997, Kennecott staked 2,035 state claims in the belt consolidating their entire land position and acquiring the majority of the remaining prospective terrain in the VMS belt. Five more claims were subsequently added in 1998. After a short period of exploration which focused on geophysics and geochemistry combined with limited drilling, exploration work on the Arctic Project again entered a hiatus.
On March 22, 2004, Alaska Gold Company, a wholly-owned subsidiary of NovaGold completed an Exploration and Option Agreement with Kennecott to earn an interest in the Ambler land holdings.
| 5.3 | Previous Exploration and Development Results – Arctic Deposit |
Kennecott’s ownership of the Property saw two periods of intensive work from 1965 to 1985 and from 1993 to 1998, before optioning the property to NovaGold in 2004.
Though reports, memos, and files exist in Kennecott’s Salt Lake City office, only limited digital compilation of the data exists for the earliest generation of exploration at the Arctic deposit and within the VMS belt. Beginning in 1993, Kennecott initiated a re-evaluation of the Arctic deposit and assembled a computer database of previous work at the Arctic deposit and in the district. A computer-generated block model was constructed in 1995 and an updated resource estimate was preformed using from block model. Subsequently, Kennecott staked a total of 2,035 State of Alaska claims in 1997 and, in 1998 undertook the first field program since 1985.
| | |
| Arctic Project | Page 49 |
| S-K 1300 Technical Report Summary | November 30, 2022 |
| | |
Due to the number of companies and the patchwork exploration that occurred as a result of the 1973 staking war, much of the earliest exploration work on the Ambler Schist belt was lost during the post-1980 hiatus in district exploration. The following subsections outline the best documented data at the Arctic deposit as summarized in the 1998 Kennecott exploration report, including the assembled computer database; however, this outline is not considered to be either exhaustive or in-depth.
In 1982, geologists with Kennecott, Anaconda and the State of Alaska published the definitive geologic map of the Ambler schist belt (Hitzman et al. 1982).
Table 5-1 lists known exploration mapping, geochemical, and geophysical programs conducted for VMS targets in the Ambler Mining District.
| | |
| Arctic Project | Page 50 |
| S-K 1300 Technical Report Summary | November 30, 2022 |
| | |
| Table 5-1: | Known Mapping, Geochemical, and Geophysical Programs Targeting VMS Prospects in the Ambler Mining District |
| Area | Prospects | Company | Mineralization | Mapping | Soil Geochem | Geophysics | Reports |
| Arctic Center of the Universe (COU) Back Door | Arctic | BCMC-KEX | Two (or more) sulphide bands with thickness up to ~40 m with Zn, Cu, Pb, Ag, Au, ±Ba mineralization. | Proffett 1998; Lindberg and others 2004, 2005; NG personnel 2008 at 1:2,000 scale | Extensive 2006 NG program (>670 samples) | Numerous surveys including the 1998 Dighem EM and Mag aerial surveys, 1998 CSAMT survey, TEM downhole and surface surveys in 2005, TDEM ground survey in 2006 | Numerous |
| COU Back Door, 4th of July Creek | NG-Anaconda | No exposed or drilled mineralization, target is the projection of the Arctic horizon | NG 1:2,000 mapping in 2006 | Extensive 2006 NG program | 4 TDEM ground surveys in 2005 and 2006 | 2005 and 2006 NG Progress Reports; Lindberg’s 2005 report |
| Sunshine Bud CS | Sunshine Creek | BCMC and BCMC-Noranda | Disseminated to semi-massive lens up to 18 m thick. Upper mineralized limb is Ba-rich | BCMC 1983; Paul Lindberg 2006; NG 2011 | Numerous eras of soil sampling, most recent 1998 by Kennecott (Have data) and 2006 by NG | BCMC completed Recon IP survey and Crone vertical shoot back EM in 1977, 2 TDEM surveys to the NW | Various BCMC reports; Lindberg’s 2006 Sunshine progress report; 2006 NG Progress report |
| Bud-CS | SMC and TAC | Au-rich gossan and 3+ m intercept of 1.7% Cu, 0.4% Pb, 1.5% Zn, 2 oz/ton Ag, 0.017 oz/ton Au | Anaconda (TAC) and Sunshine (SMC) | SMC soil sampling | Anaconda completed downhole resistivity survey in 1981 on Bud 7 | 1981 through 1983 Anaconda Progress reports |
| | |
| Arctic Project | Page 51 |
| S-K 1300 Technical Report Summary | November 30, 2022 |
| | |
| | |
| | |
| Area | Prospects | Company | Mineralization | Mapping | Soil Geochem | Geophysics | Reports |
| Dead Creek Shungnak SK | Shungnak (Dead Creek) | BCMC, Cominco | Thin (0.1 to 3 m) disseminated to semi-massive lenses of Cu, Zn, Pb, Ag mineralization | Bruce Otto and others 2006; Proffett 1998 | NG in 2006 (355 samples); KEX in 1998 (~240 samples) | 2 CEM surveys by BCMC at DH with no anomalous responses (do not have data) | 2006 NG report; 1982 and 1983 Anaconda Ambler Progress reports |
| SK | GCO and BCMC/GCO-HOMEX JV | Mineralized float up to 0.4% Cu, 4.8% Pb, 8.7% Zn, 5 oz/ton Ag | BCMC | BCMC 1982 soil grid | CEM and Max-min completed by BCMC (do not have data) | 1982 Annual Progress Report, BCMC; Bruce Otto 2006 Memo |
| Horse Cliff DH | Horse-Cliff DH | Horse – BCMC, Cliff SMC, DH – BCMC and BCMC/GCO-HOMEX | Disseminate to semi-massive with local massive lens, thicknesses up to tens of feet. | KEX 1983 1:1000 prospect map | SMC soil surveys 1976-1978 and 1980 | No known ground-based survey; occurrences within a large resistivity high | 1985 Progress Report BCMC-GCO-Homex J; 1980 Summary of Ambler Field Investigations – Sunshine Mining, Horse Creek Memo – Robinson 1981; 1978 Ellis Geologic Evaluation and Assessment of the Northern Belt Claims |
Snow Ambler RB Nani Frost | Snow | Cominco | Ag-Pb-Zn mineralization as massive and semi-massive bands hosted within thin bands of graphitic schist (GS). | Noranda-Cominco scanned map with no 72eochem72enced; Prospect scale | KEX Soil gird in 1997 or 1998 | No known ground-based survey; Anaconda completed downhole resistivity survey in 1981 on Ambler-4 | “Snow Prospect Miscellaneous Notes and Maps.pdf” is only known report |
| | |
| Arctic Project | Page 52 |
| S-K 1300 Technical Report Summary | November 30, 2022 |
| | |
| | |
| | |
| Area | Prospects | Company | Mineralization | Mapping | Soil Geochem | Geophysics | Reports |
| | Ambler | Anaconda TAC | Massive, disseminated chalcopyrite and pyrite associated with chert | Numerous Anaconda geologists; no digitized maps | Only scattered soils in database | Max-min surveys, no data is available | 1983 Ambler River Memo (Sunshine Progress Report); 1982 Anaconda Progress Report |
| Nani-Frost | BCMC and BCMC-Noranda | Outcrops of 2-3 m of 0.8% Cu, 0.4% Pb, 1.2% Zn, 0.05 oz/ton Ag within felsic schist | BCMC (do not have data) | BCMC identified numerous weak soil anomalies (do not have data) | CEM, Max-min, and PEM completed by BCMC (do not have data) | 1982 Annual Progress Report, BCMC |
| Red Nora | Nora | BCMC/GCO-HOMEX | Disseminated chalcopyrite within chlorite altered volcanics in two zones (Sulphide Gulch and Northern Horizon) | Generalized geologic map created by WGM for BCMC-GCO-HOMEX | No known data | Two PEM over the Sulphide Gulch horizon | 1984 and 1985 Progress Report BCMC-GCO-Homex JV |
| Red | BCMC | Thin discordant bands of sphalerite, chalcopyrite, galena, and pyrrhotite with calcite and fluorite cutting ‘siltites’ and metacarbonates | None | KEX soil lines 1998 | KEX identified EM anomalies 1998, follow-up gravity and Max-min EM; TDEM survey in 2006; DIGHEM helicopter EM and radiometric survey in 2006 | Kennecott’s final 1998 field report; 2006 NG Progress Report |
| | |
| Arctic Project | Page 53 |
| S-K 1300 Technical Report Summary | November 30, 2022 |
| | |
| | |
| | |
| Area | Prospects | Company | Mineralization | Mapping | Soil Geochem | Geophysics | Reports |
| Other | BT, Jerri Creek | Anaconda, AMC | Massive sulphide bands up to 1.5 m thick extend nearly 2.3 km along an E-W strike | Hitzman and others | Historic soils at Jerri Creek | No known surveys. | Hitzman thesis and Anaconda (BT) and Bear Creek (Jerri) Assessment reports; 1982 and 1983 Anaconda Ambler Progress reports |
| Kogo-White Creek | Bud – SMC or AMC | Discovered by hydrochemistry of high Cu ions in White Creek. | SMC? | Soil 74eochem surveys by SMC in 1978 and KEX in 1998 | Recon IP survey in 1977; Max-Min Mag survey in 1980; Follow-up Max-Min and gravity by KEX in 1998; TDEM by NG in 2006. | 1980 Summary of Ambler Field Investigations, SMC; Kennecott’s Final 1998 Field Report |
| Pipe | BCMC and SMC | Podiform zones of sulphide mineralization within calc-schists and QMS | Schmidt in 1978, SMC in 1982 | Kennecott soil grid in 1997-1998 | Not known | Schmidt’s 1978 report (Part IV) for Anaconda’s (?) annual report |
| | |
| Arctic Project | Page 54 |
| S-K 1300 Technical Report Summary | November 30, 2022 |
| | |
| | |
| | |
| Area | Prospects | Company | Mineralization | Mapping | Soil Geochem | Geophysics | Reports |
| | Tom | Anaconda and SMC | 1982 ‘Discovery’ trench by SMC uncovered massive sulphide boulders with up to 6 oz/ton Ag, 5.4% Pb, 6.3% Zn, only 0.2% Cu | Sunshine in 1982 (?) | SMC soils in 1982 | Gamma mag survey by SMC in 1982; TDEM by NG in 2006. | 1982 Sunshine Mining Company Memo by E.R. Modroo; Schmidt’s 1978 report (Part IV) for Anaconda’s (?) annual report |
| Sun | Sun-Picnic Creek | Anaconda – AMC-Cominco; Valhalla Metals is current owner | Three zones of sulphide mineralization varying from 1 to 10 m; Upper zone is Zn-Pb-Ag rich while the two lower zones are Cu rich | Various Anaconda geologists | Not known, but most likely extensive | Not known, but most likely extensive | 1981 Anaconda progress report; Anaconda 1977 prefeasibility study (not in NG possession) |
| Smucker | Smucker-Charlie-Puzzle-4B-Patti | Anaconda, Cominco, and Bear Creek; now owned by Teck | A single mineralized Ag-Zn-Pb-Cu horizon varying from 1 to 8 m in thickness | Detailed mapping by Anaconda and BCMC geologists | Strong soil 75eochem anomalies in lowlands SE of Smucker horizon; Kennecott soil grid in 1997 or 1998 | Not known | 1985 Progress Report BCMC-GCO-Homex JV |
Note: EM = electromagnetic; TDEM = time domain electromagnetic; CSAMT = Controlled Source Audio Magnetotelluric.
| | |
| Arctic Project | Page 55 |
| S-K 1300 Technical Report Summary | November 30, 2022 |
| | |
Historical geochemistry for the district, compiled in the 1998 Kennecott database, includes 2,255 soil samples, 922 stream silt samples, 363 rock samples, and 37 panned concentrate samples. Data have been sourced from several companies including Kennecott, Sunshine Mining, RAA, and NANA. Sourcing of much of the data had been poorly documented in the database.
During 1998, Kennecott renewed its effort in the district, and, as a follow-up to the 1998 electromagnetic (EM) survey, undertook soil and rock chip sampling in and around EM anomalies generated in the geophysical targeting effort. During this period Kennecott collected 962 soils and 107 rocks and for the first time used extensive multi-element inductively coupled plasma (ICP) analysis.
Prior to 1998, Kennecott conducted a series of geophysical surveys which are poorly documented or are unavailable to Ambler Metals. With the renewed interest in the belt, Kennecott carried out a helicopter-supported airborne EM (five frequency DIGHEM system) and magnetic survey covering approximately a 70 km stretch of the Ambler belt in March 1998. A total 2,509-line kilometres was flown using 400 m line spacing except at the Arctic deposit where 200 m line spacing was used. The Arctic deposit presented a strong 900 Hz EM conductive signature. From the initial interpretation of the airborne EM data a two-year ground follow-up program to evaluate and drill test the best targets was recommended (Fueg, 1998).
During the summer of 1998, Kennecott carried out a well-planned and systematic ground follow-up program. Of the 46 EM anomalies that were identified 17 were ranked A and B and were mapped and evaluated in the field: 12 using soil geochemistry, 9 using a combination of ground EM (Maxmin 2 horizontal loop) and gravity (LaCoste and Romberg Model G gravimeter), and two anomalies were drilled. Eight of the 17 anomalies occurred in prospective geology and coincident anomalous geochemistry and two were drilled in the same summer (Kennecott, 1998).
At anomaly 98-3, later named East Dead Creek, located approximately 6 km northwest of the Arctic deposit and 2 km east-northeast of the Dead Creek prospect, Kennecott found sub-cropping gossan roughly coincident with the centre of their airborne and ground EM anomalies. A single vertical hole encountered semi-massive sulphides in three intervals in the upper 40 m of the hole, the best being 0.8% Zn, 0.35% Cu and 0.16% Pb over 15 feet (Kennecott, 1998).
Based on the results of the 1998 program, Kennecott made the following recommendations: anomaly 98-3 required further drilling, two other anomalies were drill ready, and five other anomalies, including anomaly 98-9, required additional exploration to define a drill target. Despite the encouraging regional exploration results, Kennecott conducted no further field exploration in the district after 1998 and subsequently optioned the property to NovaGold in 2004.
In addition to the regional program, Kennecott completed five lines of controlled source audio magneto telluric (CSAMT) data in Subarctic Valley. The Arctic deposit showed an equally strong conductive response in the CSAMT data as was seen in the EM data. As a result of the survey, Kennecott recommended additional CSAMT for the deposit area.
Between 1967 and July 1985, Kennecott (BCMC) completed 86 holes (including 14 large diameter metallurgical test holes) totalling 16,080 m. In 1998, Kennecott drilled an additional six core holes totalling 1,492 m to test for:
| • | Extensions of the known Arctic mineralization. |
| | |
| Arctic Project | Page 56 |
| S-K 1300 Technical Report Summary | November 30, 2022 |
| | |
| • | Grade and thickness continuity. |
| • | EM anomaly 98-3 (East Dead Creek). |
Drilling for all BCMC/Kennecott campaigns in the Arctic deposit area (1966 to 1998) totals 92 core holes for a combined 17,572 m (refer to Section 7 for additional information).
Prior to 1998, no SG measurements were available for the Arctic deposit rocks. A “factored” average bulk density was used to calculate a tonnage factor for resource estimations. A total of 38 samples from the 1998 drilling at the Arctic deposit were measured for SG determinations. Additional information on density determinations is provided in Section 8.
| 5.3.6 | Petrology, Mineralogy, and Research Studies |
There have been numerous internal studies done by Kennecott on the petrology and mineralogy of the Arctic deposit that exist as internal memos, file notes, and reports from as early as 1967. These data have been used in support of geological and mineralogical interpretations.
Portable infrared mineral analyzer (PIMA) alteration studies by Kennecott on a limited amount of core show that hydrothermal alteration (Na/Ba-rich micas) can still be spectrally recognized despite later regional metamorphism and continued use was recommended to assist in the structural interpretation of the known mineralization and in tracing the ‘ore horizon’.
D. Schmandt completed an undergraduate thesis at Smith College in 2009 entitled “Mineralogy and origin of Zn-rich horizons within the Arctic Volcanogenic Massive Sulphide deposit, Ambler District, Alaska”. Jeanine Schmidt completed a doctoral dissertation at Stanford University in 1983 entitled “The Geology and Geochemistry of the Arctic Prospect, Ambler District, Alaska”; and Bonnie Broman completed a master’s thesis at University of Alaska, Fairbanks in 2014 entitled “Metamorphism and Element Redistribution: Investigations of Ag-bearing and associated minerals in the Arctic Volcanogenic Massive Sulphide deposit, SW Brooks Range, NW Alaska”. These studies have provided additional information on geological and mineralogical settings in the Arctic Project area.
| 5.3.7 | Geotechnical, Hydrogeological and Acid-Base Accounting Studies |
A series of geotechnical, hydrological, hydrogeological, and acid-base accounting (ABA) studies were conducted prior to the 2020 FS. Rock geotechnical and hydrogeological studies completed after 1998 are listed in Table 5-2. ABA studies completed after 1998 are listed in Section 13.11.1.
| 5.3.7.1 | Geotechnical and Hydrogeological Studies |
In December 1998, URSA Engineering prepared a geotechnical study for Kennecott titled “Arctic Project – 1998 Rock Mass Characterization”. Though general in scope, the report summarized some of the basic rock characteristics as follows:
| • | Compressive strengths average 6,500 psi for the quartz mica schists, 14,500 psi for the graphitic schists, and 4,000 psi for talc schists. |
| | |
| Arctic Project | Page 57 |
| S-K 1300 Technical Report Summary | November 30, 2022 |
| | |
| • | Rock mass quality can be described as average to good quality, massive with continuous jointing except the talc schist, which was characterized as poor quality. The rock mass rating (RMR) averages 40 to 50 for most units except the talc schist which averages 30. |
In 1998, Robertson Geoconsultants, Inc. (Robertson) of Vancouver prepared a report for Kennecott titled “Initial Assessment of Geochemical and Hydrological Conditions at Kennecott’s Arctic Project”. The report presented the results of the acid generation potential of mine waste and wall rock for the Arctic Project in the context of a hydrological assessment of the climate, hydrology, and water balance analyses at the Arctic deposit. Climatic studies at the time were limited to regional analyses as no climatic data had been collected at the Arctic Project site prior to the review. Regional data, most specifically a government installed gauging station about 32 km to the southwest at Dahl Creek, provided information in assessing the hydrology of the Arctic Project at the time. A total of nine regional gauges were utilized to evaluate the overall potential runoff in the area.
| Table 5-2: | Summary of Previous Geotechnical and Hydrogeological Work Completed After 1998 |
| | Rock Geotechnical | Hydrogeological |
| Field Investigations | SRK 2020 Completed geotechnical and hydrogeological drill investigation program consisting of nine (9) drill holes. Detailed geotechnical core logging completed for four (4) drill holes, basic geotechnical logging completed for 5 drill holes. Laboratory testing conducted. | SRK 2020 Completed geotechnical and hydrogeological drill investigation program consisting of nine (9) drill holes. Hydraulic conductivity tests, piezometer installations, and extended duration injection tests were completed in five (5) drill holes. |
SRK 2017 Completed staged geotechnical field investigation programs in 2015 and 2016. Five HQ3 drill holes were completed for combined geotechnical and hydrogeological data acquisition purposes. Thirteen drill holes were surveyed using acoustic televiewer. Laboratory testing was conducted. | SRK 2017 Completed staged geotechnical field investigation programs in 2015 and 2016. Five HQ3 drill holes were completed for combined geotechnical and hydrogeological data acquisition purposes. Conducted downhole hydraulic conductivity tests and installed standpipe and vibrating wire piezometers. |
Tetra Tech 2013 No geotechnical field investigations were completed. Review of historical geotechnical studies suggests work completed to a high standard. | Tetra Tech 2013 No hydrogeological field investigations were completed. |
BGC 2012 Underground focus. Completed five HQ3 drill holes with lab testing, core logging and lithology descriptions (see Section 3.2). Completed structural geology mapping. Completed laboratory strength testing. | BGC 2012 Installed seven (7) vibe wires in five holes (see Section 3.2 for drill hole locations). Completed hydraulic conductivity testing for various geotechnical units. Installed one thermistor. Hydraulic head measurements at selected drill holes. |
| | |
| Arctic Project | Page 58 |
| S-K 1300 Technical Report Summary | November 30, 2022 |
| | |
| | |
| | |
| | Rock Geotechnical | Hydrogeological |
| | URSA 1998 Mapping of major geological structures, faults, and joints. Completed structural lab strength testing and collected geotechnical data from resource drill holes | URSA 1998 No hydrogeological work completed |
| Technical Findings | SRK 2020 Updated the geotechnical characterization and structural geology model. Sloped designs were updated based on updated geotechnical assessments. 3-D numerical stability models were utilized to review the influence of talc in the northeast wall. | SRK 2020 Hydrogeological assessments were completed for both the open pit and valley bottom water/waste management areas. Pit inflow and pore pressure conditions were assessed using numerical and analytical tools. |
SRK 2017 Established six geotechnical domains based on the rock mass characteristics and structural orientations. Kinematic and 2-D numerical stability analyses were conducted to provide the recommended slope configurations. The slope design for the east walls that are sub-parallel to the foliation consisted of 60 m high slopes that are stripped along the dip of the foliation fabric. The recommended IRA in the east walls were 26°-30°. Slope design of other areas of the proposed open pit were controlled by kinematic failure mechanisms. | SRK 2017 Two alternative conceptual hydrogeological models were established – a multiple water system model (regional shallow perched water table in northeast, deeper water table over the pit footprint), and compartmentalized water system model (water levels compartmentalized by faults, talc, and/or permafrost). A conservative pore pressure conditions were estimated for slope stability analysis. |
Tetra Tech 2013 Considers 7 lithogeochemical units; modeled as 3-D volumes (as supplied by Trilogy) PEA pit with OSA = 43°, triple benched with 5 m benches, 8 m catch berms (single domain/design sector) | Tetra Tech 2013 Assumes groundwater levels will follow topography. No continuous permafrost in area. |
| | |
| Arctic Project | Page 59 |
| S-K 1300 Technical Report Summary | November 30, 2022 |
| | |
| | |
| | |
| | Rock Geotechnical | Hydrogeological |
| | BGC 2012 Two-dimensional geotechnical model using six (6) units combining lithological units of similar rock mass properties (RMR and other criteria defined for each unit). No 3-D structural model, plan view map only with two regional thrust faults (West Fault at 50° dipping south-southeast and WSFC at 40° dipping to the south). Mapped strong foliation sets dipping shallowly to the west and moderately to the southwest. | BGC 2012 Conceptual model of ground water flow. High flow rates in fault zones should be expected, groundwater flow follows topography. Not enough information to comment on recharge rate due to uncertainty in permafrost. Permeability data for main geotechnical units ranging from 3 x 10⁻⁹ to 6 x 10⁻⁷ m/s. |
URSA 1998 Developed six (6) geotechnical units based on drill holes and mapping, classified rocks as weak to moderately strong, talc mica schist is worst unit with RMR = 31. Mapped E-W trending faults with gouge of muscovite and talc and south dipping thrust fault. Two sets of joint/foliation present that intersect at 25°. | URSA 1998 No hydrogeological analyses completed. Suggests permafrost not present based on down hole observations |
| 5.3.7.2 | Acid-Base Accounting Studies |
The 1998 Robertson study first documented ABA results, based on the selection of 60 representative core samples from the deposit. Since then, SRK has advanced the understanding of acid rock drainage potential with studies in 2010, 2013, and 2015-2017 based on an accumulated dataset from over 1550 ABA drill core samples from waste rock and ore, indicating that about 75% of samples were classified as potentially acid generating. Tailings from metallurgical testing in 2017 and 2019 were analysed for ABA and also shown to be potentially acid generating. Kinetic testing studies have subsequently been conducted on waste rock, ore and tailings, to inform rates of acid generation and metal leaching, and are documented in Section 13.11.2.
| 5.3.8 | Metallurgical Studies |
Kennecott undertook an extensive series of studies regarding the metallurgy and processing of the Arctic mineralization (refer to summary in Section 10.2 of this Report).
A number of mining and technical studies have been completed over the Arctic Project history, as summarized in Table 5-3.
| | |
| Arctic Project | Page 60 |
| S-K 1300 Technical Report Summary | November 30, 2022 |
| | |
| Table 5-3: | Mining and Technical Services |
| Company | Year | Consultant | Study |
| Kennecott | 1974 | internal | Ambler District Evaluation |
| 1976 | internal | Arctic Deposit Order of Magnitude Evaluation |
| 1978 | internal | Arctic Prospect Summary File Report Arctic Deposit |
| 1981 | internal | Evaluation of the Arctic and Ruby Creek Deposits |
| 1984 | internal | Evaluation Update |
| 1985 | internal | Pre-AFD Report |
| 1990 | internal | Re-Evaluation |
| 1997 | internal | Arctic Project Mining Potential |
| 1999 | internal | Interim Report Conceptual Level Economic Evaluations of the Arctic Resource |
| 1998 | SRK | Preliminary Arctic Scoping Study |
| NovaGold | 2011 | SRK | Preliminary Economic Assessment |
| Trilogy (previously, NovaCopper) | 2012 | SRK | Preliminary Economic Assessment |
| 2013 | Tetra Tech | Preliminary Economic Assessment |
| 2018 | Ausenco | Pre-Feasibility Report |
| Trilogy | 2020 | Ausenco | Feasibility Report |
| Ambler Metals | 2021 | Ausenco | Tailings Evaluation |
| | |
| Arctic Project | Page 61 |
| S-K 1300 Technical Report Summary | November 30, 2022 |
| | |
| 6 | GEOLOGICAL SETTING, MINERALIZATION, AND Deposit |
The mineralization at the Arctic deposit and at several other known occurrences within the Ambler Sequence stratigraphy of the Ambler Mining District consists of Devonian age, polymetallic (zinc-copper-lead-silver-gold) VMS-like occurrences.
Observations and interpretations at the Arctic deposit such as: 1) the tectonic setting with Devonian volcanism in an evolving continental rift; 2) the geologic setting with bimodal volcanic rocks including pillow basalts and felsic volcanic tuffs; 3) an alteration assemblage with well-defined magnesium-rich footwall alteration and sodium-rich hanging wall alteration; and 4) typical polymetallic base-metal mineralization with massive and semi-massive sulphides, are indicative of a Volcanogenic Massive Sulphide (VMS) deposit that has undergone high strain and complex folding and faulting.
A variety of VMS types have been well documented in the literature (Franklin et al., 2005), with the Ambler Schist belt deposits most like deposits associated with bimodal felsic dominant volcanism related to incipient rifting. However, the abundance of volcaniclastic rocks with argillaceous sedimentary rocks and the tabular nature of mineralization are considered by Piercey (2022) to be similar to felsic silicilastic VMS environments.
Evidence exists for both exhalation and emplacement on the seafloor and replacement of rocks in the sub-seafloor, either via filling of void space or via dissolution of original rocks and replacement by new minerals (Piercey, 2022). For example, the presence of barite, attributed to the mixing of BaCl2(aq)from hydrothermal fluids with seawater sulphate (SO4(aq)) at the vent-seawater interface supports some of the mineralization at Arctic likely precipitated on the seafloor. In contrast, there is ample textural evidence of subseafloor replacement at Arctic, such as the presence of transitions from massive sulphides into selective replacement of interpreted permeable tuff beds in the hanging wall mudstones.
The tonnage, grades, and stratigraphic setting of the Arctic deposit, and its broader tectonostratigraphic setting, are similar to other felsic siliclastic VMS environments globally. The deposit has strong similarities to deposits found the Finlayson Lake VMS district, Yukon, Bathurst district, New Brunswick, and some parts of the Iberian Pyrite Belt, Spain-Portugal (Piercey, 2022).
A VMS model is considered applicable for use in exploration targeting in the project area and the interpretation of the geological model supporting the Mineral Resource estimate.
| 6.2 | Regional Geology – Southern Brooks Range |
The Ambler Mining District occurs along the southern margin of the Brooks Range within an east-west trending zone of Devonian to Jurassic age submarine volcanic and sedimentary rocks (Hitzman et al., 1986). The district covers both: 1) VMS-like deposits and prospects hosted in the Devonian age Ambler Sequence (or Ambler Schist belt or Schist belt), a group of metamorphosed bimodal volcanic rocks with interbedded tuffaceous, graphitic, and calcareous volcaniclastic metasediments; and 2) epigenetic carbonate-hosted copper deposits occurring in Silurian to Devonian age carbonate and phyllitic rocks of the Bornite Carbonate Sequence. The Ambler Sequence occurs in the upper part of the Anirak Schist, the thickest member of the Schist belt or Coldfoot subterrane (Moore et al., 1994). VMS-like stratabound mineralization can be found along the entire 110 km strike length of the district. Immediately south of the Schist belt in the Cosmos Hills, a time equivalent section of the Anirak Schist that includes the approximately 1 km thick Bornite Carbonate Sequence. Mineralization of both the VMS-like deposits of the Schist belt and the carbonate-hosted deposits of the Cosmos Hills has been dated at 375 to 387 Ma (Selby et al., 2009; McClelland et al., 2006).
| | |
| Arctic Project | Page 62 |
| S-K 1300 Technical Report Summary | November 30, 2022 |
| | |
The Ambler Mining District is characterized by increasing metamorphic grade to the north, perpendicular to the strike of the east-west trending units. The district shows isoclinal folding in the northern portion and thrust faulting to south (Schmidt, 1983). The Devonian to Late Jurassic age Angayucham basalt and the Triassic to Jurassic age mafic volcanic rocks are in low angle over thrust contact with various units of the Ambler Schist belt and Bornite Carbonate Sequence along the northern edge of the Ambler Lowlands.
| 6.2.1 | Terrane Descriptions |
The terminology used to describe the terranes in the southern Brooks Range evolved during the 1980s because of the region’s complex juxtaposition of rocks of various compositions, ages and metamorphic grade. Hitzman et al. (1986) divided the Ambler Mining District into the Ambler and Angayucham terranes. Further work (Till et al., 1988; Silberling et al., 1992; Moore et al., 1994) includes the rocks of the previously defined Ambler terrane as part of the regionally extensive Schist belt or Coldfoot subterrane along the southern flank of the Arctic Alaska terrane as shown in Figure 6-1 (Moore et al., 1994). In general, the southern Brooks Range is composed of east-west trending structurally bound allochthons of variable metasedimentary and volcanogenic rocks of Paleozoic age.
| | |
| Arctic Project | Page 63 |
| S-K 1300 Technical Report Summary | November 30, 2022 |
| | |
| Figure 6-1: | Regional Geologic Terranes of the Southern Brooks Range |
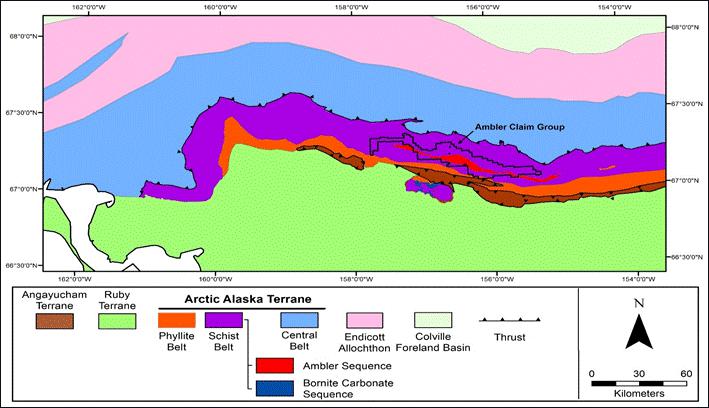
Source: Trilogy Metals, 2019.
The Angayucham terrane, which lies along the southern margin of the Brooks Range, is locally preserved as a klippen within the eastern Cosmos Hills and is composed of weakly metamorphosed to unmetamorphosed massive-to-pillowed basalt rocks with minor radiolarian cherts, marble lenses and isolated ultramafic rocks. This package of Devonian to Late Jurassic age (Plafker et al., 1977) mafic and ultramafic rocks is interpreted to represent portions of an obducted and structurally dismembered ophiolite that formed in an ocean basin south of the present-day Brooks Range (Hitzman et al., 1986; Gottschalk and Oldow, 1988). Locally, the Angayucham terrane overlies the Schist belt to the north along a poorly exposed south-dipping structure.
Gottschalk and Oldow (1988) describe the Schist belt as a composite of structurally bound packages composed of dominantly greenschist facies rocks, including pelitic to semi-pelitic quartz-mica schist with associated mafic schists, metagabbro and marbles. Locally, the Schist belt includes the Upper Silurian to middle Devonian age Bornite Carbonate Sequence, the lower Paleozoic age Anirak pelitic, variably siliceous and graphic schists, and the mineralized Devonian age Ambler sequence consisting of volcanogenic and siliciclastic rocks variably associated with marbles, calc-schists, metabasites and mafic schists (Hitzman et al., 1982; Hitzman et al., 1986). The lithologic assemblage of the Schist belt is consistent with an extensional, epicontinental tectonic origin.
| | |
| Arctic Project | Page 64 |
| S-K 1300 Technical Report Summary | November 30, 2022 |
| | |
Structurally overlying the Schist belt to the north is the Central belt. The Central belt is in unconformable contact with the Schist belt along a north-dipping low-angle structure (Till et al., 1988). The Central belt consists of lower Paleozoic age metaclastic and carbonate rocks, and Proterozoic age schists (Dillon et al., 1980). Both the Central belt and Schist belt are intruded by meta-to-peraluminous orthogneisses, which locally yield a slightly discordant U-Pb thermal ionization mass spectrometry zircon crystallization age of middle to late Devonian (Dillon et al., 1980; Dillon et al., 1987). This igneous protolith age is supported by Devonian orthogneiss ages obtained along the Dalton Highway, 161 km to the east of the Ambler Mining District (Aleinikoff et al., 1993).
Overlying the Schist belt to the south is the Phyllite belt, characterized in the Ambler mining district as phyllitic black carbonaceous schists of the Beaver Creek Phyllite which may underlie much of the Ambler Lowlands between the Brooks Range and the Arctic deposit to the north and the Cosmos Hills and the Bornite deposit to the south. The recessive weathering nature of the Beaver Creek Phyllite limits the exposure, but the unit is assumed to occur as a thrust sheet overlying the main Schist belt rocks.
| 6.2.2 | Regional Tectonic Setting |
Rocks exposed along the southern Brooks Range consist of structurally bound imbricate allochthons that have experienced an intense and complex history of deformation and metamorphism. Shortening in the fold and thrust belt has been estimated by some workers to exceed 500 km (Oldow et al., 1987) based on balanced cross sections across the central Brooks Range. In general, the metamorphic grade and tectonism in the Brooks Range increases to the south and is greatest in the Schist belt. The tectonic character and metamorphic grade decreases south of the Schist belt in the overlying Angayucham terrane.
During the late Jurassic to early Cretaceous, the Schist belt experienced penetrative thrust-related deformation accompanied by recrystallization under high-pressure and low-temperature metamorphic conditions (Till et al., 1988). The northward directed compressional tectonics were likely related to crustal thickening caused by obduction of the Angayucham ophiolitic section over a south-facing passive margin. Thermobarometry of schists from the structurally deepest section of the northern Schist belt yield relict metamorphic temperatures of 475°C, ±35°C, and pressures from 7.6 to 9.8 kb (Gottschalk and Oldow, 1988). Metamorphism grades from lower greenschist facies in the southern Cosmos Hills to upper greenschist facies, locally overprinting blueschist mineral assemblages in the Schist belt (Hitzman et al., 1986).
Compressional tectonics, which typically place older rocks on younger, does not adequately explain the relationship of young, low-metamorphic-grade over older and higher-grade metamorphic rocks observed in the southern Brooks Range hinterland. Mull (1982) interpreted the Schist belt as a late antiformal uplift of the basement to the fold and thrust belt. More recent models propose that the uplift of the structurally deep Schist belt occurred along duplexed, north-directed, thin-skinned thrust faults, followed by post-compressional south-dipping low angle normal faults along the south flank of the Schist belt, accommodating for an over-steepened imbricate thrust stack (Gottschalk and Oldow, 1988; Moore et al., 1994). Rapid cooling and exhumation of the Schist belt began at the end of the early Cretaceous age at 105 to 103 Ma, based on Ar40/Ar39 cooling ages of hornblende and white mica from near Mount Igikpak, and lasted only a few million years (Vogl et al., 2003). Additional post-extension compressive events during the Paleocene age further complicate the southern Brooks Range (Mull, 1985).
Rocks that form the Ambler Sequence consist of a lithologically diverse sequence of lower Devonian age carbonate and siliciclastic strata with interlayered mafic lava flows and sills. The clastic strata, derived from terrigenous continental and volcanic sources, were deposited primarily by mass-gravity flow into the sub-wavebase environment of an extending marginal basin.
| | |
| Arctic Project | Page 65 |
| S-K 1300 Technical Report Summary | November 30, 2022 |
| | |
The Ambler Sequence underwent two periods of intense, penetrative deformation. Sustained upper greenschist-facies metamorphism with coincident formation of a penetrative schistosity and isoclinal transposition of bedding marks the first deformation period. Pervasive similar-style folds on all scales deform the transposed bedding and schistosity, defining the subsequent event. At least two later non-penetrative compressional events deform these earlier fabrics. Observations of the structural and metamorphic history of the Ambler Mining District are consistent with current tectonic evolution models for the Schist belt, based on the work of others elsewhere in the southern Brooks Range (Gottschalk and Oldow, 1988; Till et al., 1988; Vogl et al., 2002).
Figure 6-2 shows the location and geology of the Ambler mining district and the Schist belt terrane including the Anirak Schist, the Kogoluktuk Schist and the Ambler Sequence, the contemporaneous Bornite Carbonate Sequence in the Cosmos Hills to the south, and the allochthonous overthrust Cretaceous sedimentary rocks and Devonian Angayucham Terrane volcanic rocks.
| Figure 6-2: | Local Geology of the Ambler Mining District |
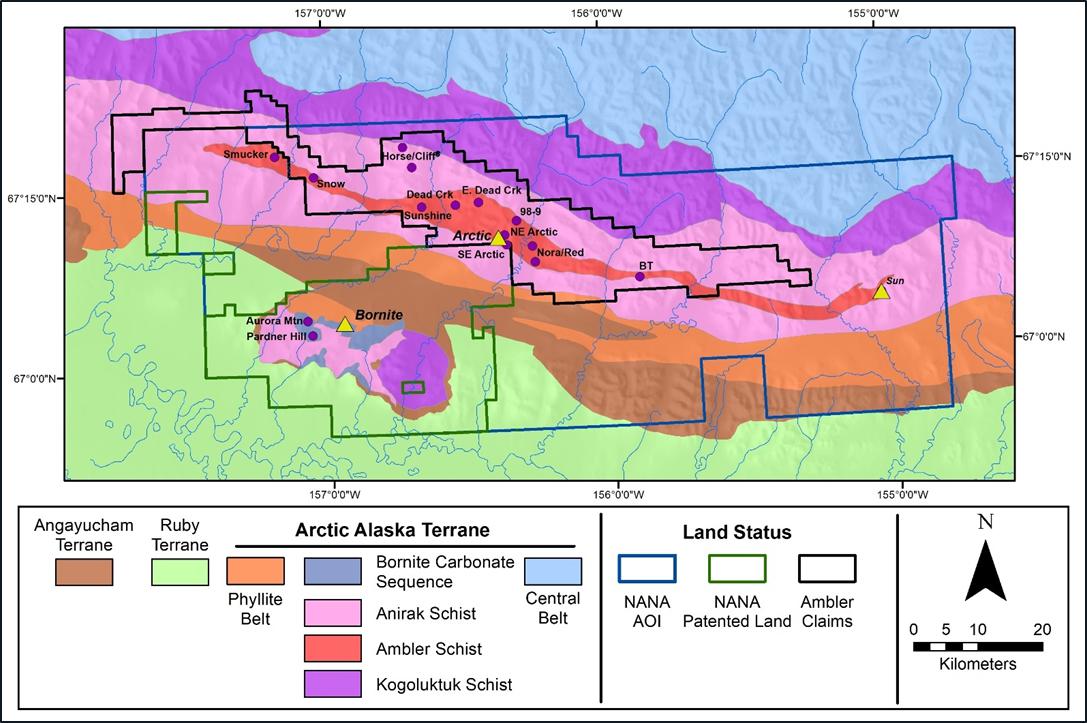
Source: Ambler Metals, 2022.
| | |
| Arctic Project | Page 66 |
| S-K 1300 Technical Report Summary | November 30, 2022 |
| | |
| 6.3.1 | General Stratigraphy of the Ambler Sequence |
Though the Ambler Sequence is exposed over 110 km of strike length, the following descriptions and comments refer to an area between the Kogoluktuk River on the east and the Shungnak River on the west where Trilogy has focused the majority of its exploration efforts over the last decade.
The local base of the Ambler Sequence consists of variably metamorphosed carbonates historically referred to as the Gnurgle Gneiss. Trilogy’s joint venture, Ambler Metals interprets these strata as calc-turbidites, perhaps deposited in a sub-wavebase environment adjacent to a carbonate bank. Calcareous schists overlie the Gnurgle Gneiss and host sporadically distributed mafic sills and pillowed lavas. These fine-grained clastic strata indicate a progressively quieter depositional environment up section, and the presence of pillowed lavas indicates a rifting, basinal environment.
Overlying these basal carbonates and pillowed basalts is a section of predominantly fine-grained carbonaceous siliciclastic rocks that host most of the mineralization in the district including the Arctic deposit. This quiescent section indicates further isolation from a terrigenous source terrain.
Above the stratigraphy hosting the Arctic deposit is a section with voluminous reworked silicic volcanic strata. At the base of this section is the Button Schist, a regionally continuous and distinctive K-feldspar porphyroblastic unit that serves as an excellent marker above the main mineralized stratigraphy. Figure 6-3 shows idealized sections for several different areas in and around the Arctic deposit.
Several rock units show substantial changes in thickness and distribution in the vicinity of the Arctic deposit that may have resulted from the basin architecture existing at the time of deposition. Between the Arctic Ridge, geographically above the Arctic deposit, and the Riley Ridge to the west, several significant differences have been documented including:
| • | The Gnurgle Gneiss is thickest in exposures along the northern extension of Arctic Ridge and appears to thin to the west. |
| • | Mafic lavas and sills thicken from east to west. They occur as thick units in upper Subarctic Creek and to the west but are sparsely distributed to the east. |
| • | The quartzite section within and above the Arctic sulphide horizon does not occur in abundance east of Arctic Ridge; it is thicker and occurs voluminously to the west. |
| • | Button Schist thickens dramatically to the west from exposures on Arctic Ridge; exposures to the east are virtually non-existent. |
| • | Greywacke sands do not exist east of Subarctic Creek but occur in abundance as massive, channelled accumulations to the west, centred on Riley Ridge. |
These data are interpreted by Trilogy’s joint venture, Ambler Metals to define a generally north-northwest-trending depocentre through the central Ambler Mining District. Volcanic debris flow occurrences as well as these formational changes suggest that the depocentre had a fault-controlled eastern margin. The basin deepened to the west; the Riley Ridge section was deposited along a high-energy axis, and the COU section lies to the west-southwest distally from a depositional energy point of view. This original basin architecture appears to have controlled mineralization of the sulphide systems at Arctic and Shungnak (Dead Creek), concentrating fluid flow along structures on the eastern basin margin.
| | |
| Arctic Project | Page 67 |
| S-K 1300 Technical Report Summary | November 30, 2022 |
| | |
| Figure 6-3: | Ambler Sequence Stratigraphy in the Arctic Deposit Area |
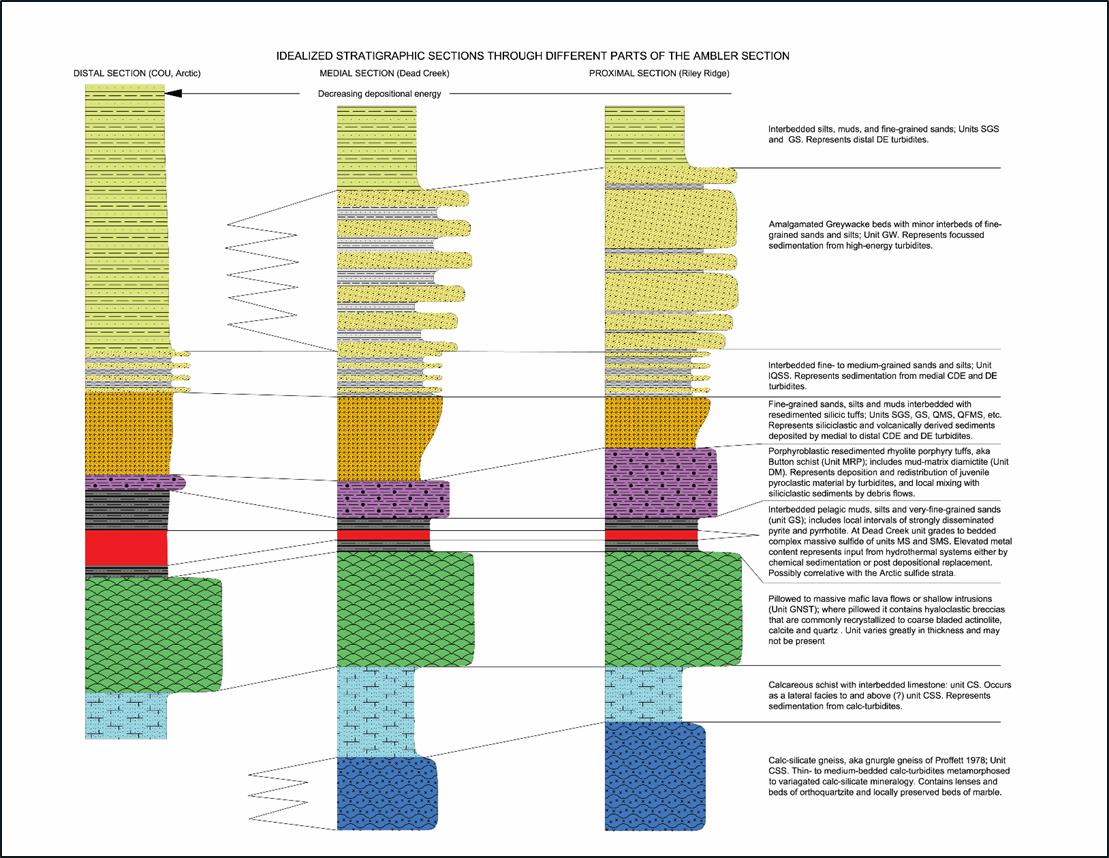
Source: Trilogy Metals, 2019.
Figure 6-4 is a simplified geologic map of the area between the Kogoluktuk and the Shungnak Rivers.
| | |
| Arctic Project | Page 68 |
| S-K 1300 Technical Report Summary | November 30, 2022 |
| | |
| Figure 6-4: | Generalized Geology of the Central Ambler Mining |
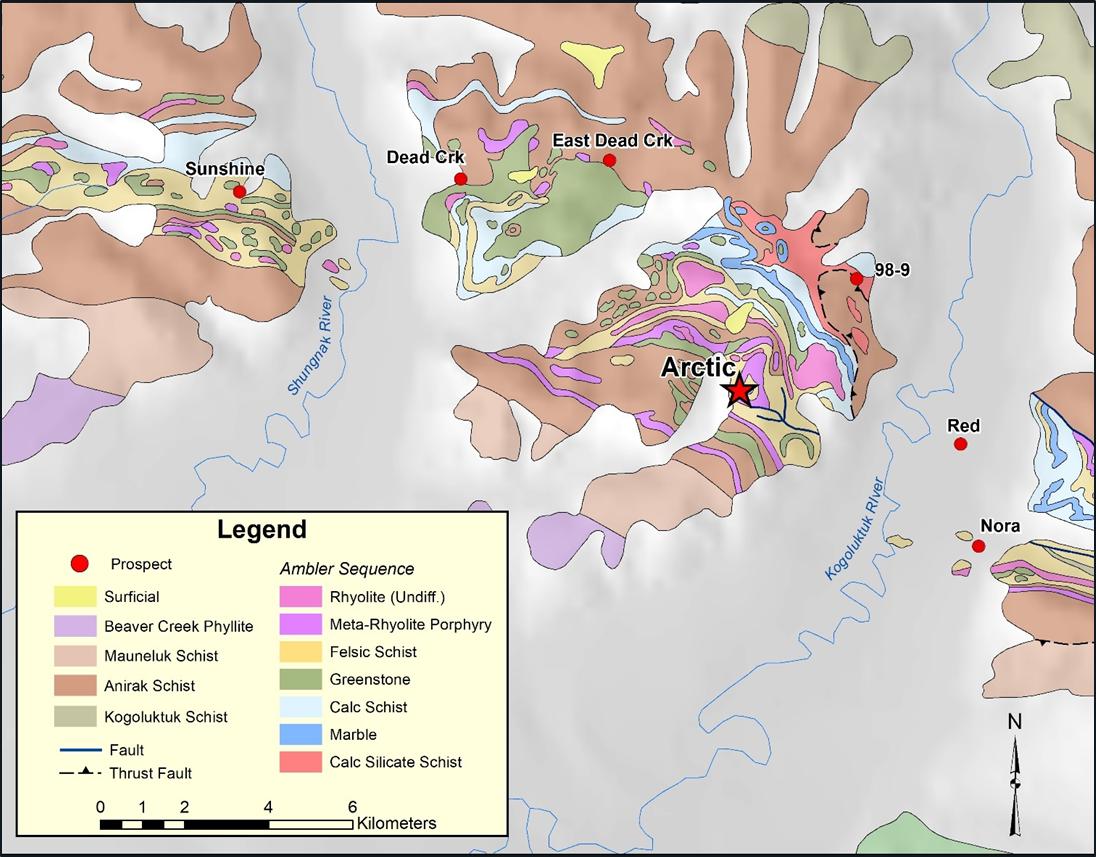
Source: Trilogy Metals, 2022.
| 6.3.2 | Structural Framework of the Ambler Mining District |
In addition to the underlying pre-deformational structural framework of the district suggested by the stratigraphic thickening of various facies around the Arctic deposit, the Ambler Sequence is deformed by two penetrative deformational events that significantly complicate the distribution and spatial arrangement of the local stratigraphy.
The earliest penetrative deformation event is associated with greenschist metamorphism and the development of regional schistosity. True isoclinal folds are developed, and fold noses typically are thickened. The most notable F1 fold is the Arctic antiform that defines the upper and lower limbs of the Arctic deposit. The fold closes along a north-northeast-trending fold axis roughly mimicking the trace of Subarctic Creek and opening to the east. Importantly, the overturned lower limb implies that the permissive stratigraphy should be repeated on a lower synformal isocline beneath the currently explored limbs and would connect with the permissive mineralized stratigraphy to the northwest at Shungnak (Dead Creek). Figure 6-5 shows typical F1 folds developed in calcareous Gnurgle Gneiss.
| | |
| Arctic Project | Page 69 |
| S-K 1300 Technical Report Summary | November 30, 2022 |
| | |
| Figure 6-5: | Typical F1 Isoclinal Folds Developed in Calcareous Gnurgle Gneiss |
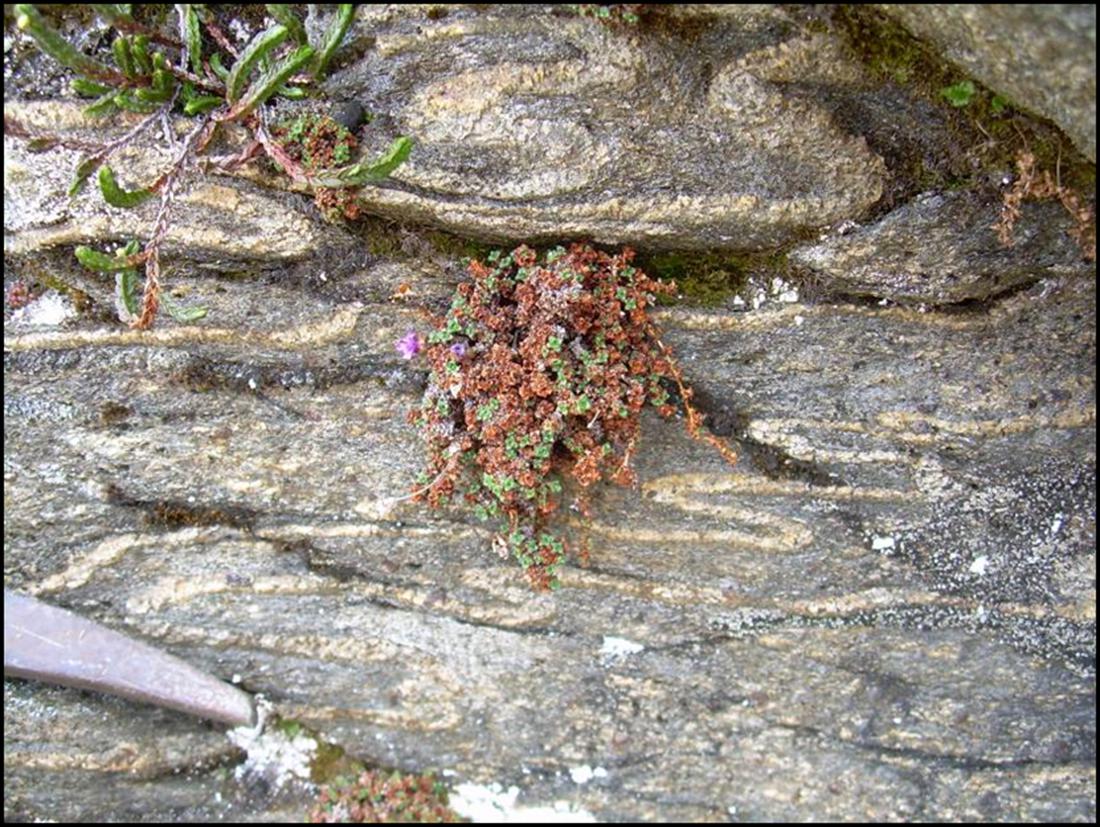
Source: Trilogy Metals, 2019.
The earlier F1 schistosity is in turn deformed by an F2 deformational event that resulted in the local development of an axial planar cleavage. The deformational event is well defined throughout the Schist belt and results in a series of south-verging, open to moderately overturned folds that define a series of east-west trending folds of similar vergence across the entire Schist belt stratigraphy.
| | |
| Arctic Project | Page 70 |
| S-K 1300 Technical Report Summary | November 30, 2022 |
| | |
This event is likely temporally related to the emplacement of the Devonian Angayucham volcanics sequences, the obducted Jurassic ophiolites and Cretaceous sediments within the Schist belt stratigraphy.
In addition to the earlier penetrative deformation events, a series of poorly defined non-penetrative deformation events, likely due to Cretaceous extension, are seen as a series of warps or arches across the district.
The interplay between the complex local stratigraphy, the isoclinal F1 event, the overturned south verging F2 event and the series of post-penetrative deformational events often makes district geological interpretation extremely difficult at a local scale.
| 6.4 | Arctic Property Geology |
Previous workers at the Arctic deposit (Russell 1995 and Schmidt 1983) describe three mineralized horizons: the Main Sulphide Horizon, the Upper South Horizon and the Warm Springs Horizon. The Main Sulphide Horizon was further subdivided into three zones: the southeast zone, the central zone, and the northwest zone. Previous deposit modelling was grade-based resulting in numerous individual mineralized zones representing relatively thin sulphide horizons.
Recent work by Ambler Metals defines the Arctic deposit as two or more discrete horizons of sulphide mineralization contained in a complexly deformed isoclinal fold with an upright upper limb and an overturned lower limb hosting the main mineralization. Nearby drilling suggests that a third upright lower limb, likely occurs beneath the currently explored stratigraphy. Figure 6-6 is a generalized geologic map of the immediate Arctic deposit area.
| | |
| Arctic Project | Page 71 |
| S-K 1300 Technical Report Summary | November 30, 2022 |
| | |
| Figure 6-6: | Generalized Geologic Map of the Arctic Deposit |
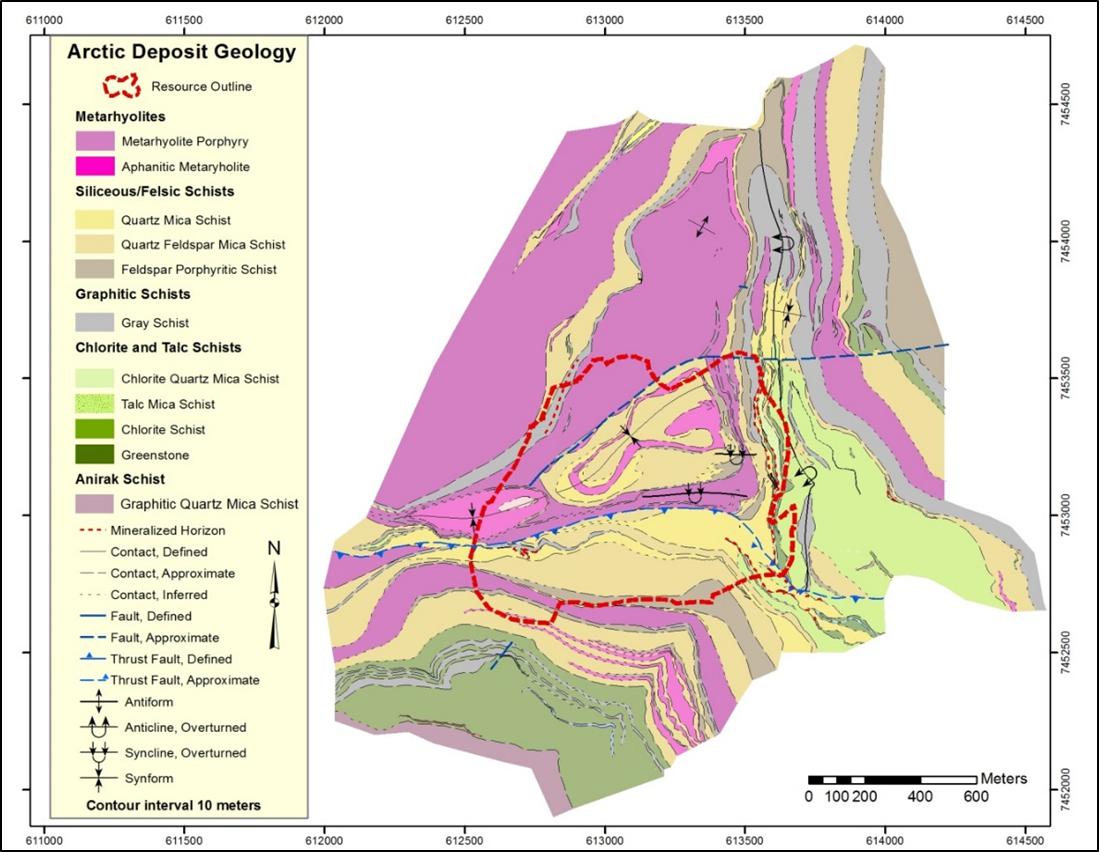
Source: Trilogy Metals, 2019.
| 6.4.1 | Lithologies and Lithologic Domain Descriptions |
Historically, five lithologic groupings were used by Kennecott (URSA Engineering, 1998 and Russell, 1995) to describe the local stratigraphy of the deposit. These groupings of rock types and protoliths include: 1) metarhyolite (Button Schist) or porphyroblastic quartz feldspar porphyry and rhyolitic volcaniclastic and tuffaceous rocks; 2) quartz mica schists composed of tuffaceous and volcaniclastic sediments; 3) graphitic schists composed of carbonaceous sedimentary rocks; 4) base metal sulphide bearing schists; and 5) talc schists composed of talc altered volcanic and sedimentary rocks. Trilogy’s joint venture, Ambler Metals has subsequently re-interpreted and modified the lithological groupings. In 2022, Piercey provided further interpretation of the stratigraphy, lithofacies, alteration and mineralization at Arctic based on a study of core from six holes drilled in 2022 and a field visit to Arctic.
| | |
| Arctic Project | Page 72 |
| S-K 1300 Technical Report Summary | November 30, 2022 |
| | |
The principal lithologic units captured in logging and mapping by Trilogy’s joint venture, Ambler Metals are summarized and described in the following subsections, in broadly chronologically order from oldest to youngest. A summary of the interpretation of geology in cross section is shown in Figure 7-14, Figure 7-15, Figure 7-17 and Figure 7-18. These cross sections illustrate significant mineralized zones encountered on the Property including, a summary of the surrounding rock types, relevant geological controls, and the length, width, depth and continuity of the mineralization.
Greenstones consists of massive dark-green amphibole and garnet-bearing rocks, differentiated by their low quartz content and dark green colour. Intervals of greenstone range up to 80 m in thickness and are identified as pillowed flows, sills, and dikes. Multiple ages of deposition are implied by the presence of both basal pillowed units as well as intrusive sill and dike-like bodies higher in the local stratigraphy. Textural and colour similarities along with similar garnet components and textures often cause confusion with some metasedimentary greywackes within the Ambler Sequence stratigraphy.
| 6.4.1.2 | Chlorite Schist (ChS) |
This unit is likely alteration-related but has been used for rocks where more than half of the sheet silicates are composed of chlorite. In the field, some samples of chlorite schist show a distinctive dark green to blue-green colour, but in drill core the chlorite schists commonly have a lighter green colour. Some intervals of chlorite schist are associated with talc-rich units. The footwall to the Arctic deposit is dominated by this lithofacies which Piercey (2022) describes as variably chlorite (and talc) altered tuffs and lapilli tuffs. Immediately beneath mineralization the rocks are tuffaceous and are strongly and pervasively chlorite and talc (- sericite) altered and, with depth, there are alternating layers of finer chlorite-talc bearing tuffs and quartz and feldspar and/or felsic fragment lapilli tuffs.
Talc-bearing schists are often in contact with chlorite-rich units and reflect units which contain trace to as much as 30% talc, often occurring on partings. Like the chlorite schist this unit is likely alteration related.
| 6.4.1.4 | Black to Grey Schist (GS) |
Black or grey schists appear in many stratigraphic locations particularly higher in the stratigraphy but principally constitute the mineralized permissive stratigraphy of the Arctic deposit lying immediately below the Button Schist (MRP). The schist is typically composed of muscovite, quartz, feldspar, graphite, pyrite and/or pyrrhotite, and sometimes chlorite and/or biotite, interpreted to be an argillite with minor laminae of felsic ash and mm-sized crystals of feldspar and quartz (Piercey, 2022) The texture is phyllitic, variably crenulated, and suggests a pelitic protolith, likely deposited in a basin that was progressively filled with terrigenous fine sediment. This unit is host to the MS and SMS horizons that constitute the Arctic deposit.
Piercey (2022) recognized a distinct laminated argillite/mudstone that is more siliceous and 30 cm to several metres in thickness above massive sulphides. This argillite is interlayered with mm to cm scale tuffaceous beds that contain quartz and rhyolite ash and is variably pyritic with flecks and spots of pyrite.
| | |
| Arctic Project | Page 73 |
| S-K 1300 Technical Report Summary | November 30, 2022 |
| | |
| 6.4.1.5 | Button Schist (MRP) |
This rock type consists of quartz-muscovite-feldspar schists with abundant distinctive 1 to 3 cm K-feldspar porphyroblasts of metamorphic origin and occasional 0.5 to 2 cm blue quartz phenocrysts of likely igneous origin. The unit shows a commonly massive to weakly foliated texture, although locally the rocks have a well-developed foliation with elongate feldspars. Piercey (2022) observed the crystals are hosted within a grey to black argillaceous to tuffaceous matrix and interprets the Button Schist to be a crystal-rich lapilli tuff to tuff.
| 6.4.1.6 | Quartz-Mica-(Feldspar) Schist (QMS/QFMS) |
This schistose rock contains variable proportions of quartz, muscovite, and sometimes feldspar. The schist usually contains high amounts of interstitial silica, and sometimes have feldspar or quartz porphyroblasts. The texture of the unit shows significant variability and likely represents both altered and texturally distinct felsic tuffs and other volcaniclastic lithologies.
Piercey (2022) distinguishes four distinct units within the hanging wall quartz-mica (feldspar) schist: rhyolitic tuff with argillite laminae and wisps; rhyolitic tuffs to lapilli tuffs; clotted feldspar lapilli tuff, and a lapilli tuff with lenticular cm-sized fragments variably replaced by pyrite and sphalerite that is referred to as the lenticular unit. This unit sits directly atop mineralization or stratigraphically above the distinct laminated argillite/mudstone described above.
This unit contains a range of unsorted, matrix supported polylithic clasts including clasts of the Button Schist, occurring in black to dark grey, very fine-grained graphitic schist. The unit occurs as lenses within other stratigraphic units, and likely represents locally derived debris flows or slumps.
This unit consists of massive green rocks with quartz, chlorite, probably amphibole, feldspar, muscovite, and accessory garnet, biotite, and calcite/carbonate. Voluminous accumulations of medium-grained greywacke occur within, but generally above, the quartz mica schist and are differentiated from texturally similar greenstones by the presence of detrital quartz, fine-grained interbeds, graded bedding and flute casts.
| 6.4.1.9 | Lithogeochemistry of Immobile Trace Elements |
In 2007, work by NovaGold suggested that many of the nondescript felsic metavolcanic lithologies were simply alteration and textural variants of the felsic rock units and logging was not adequately capturing true compositional lithological differences between units. Twelker (2008) demonstrated that the use of immobile trace elements, specifically Al2O3:TiO2 (aluminum oxide: titanium dioxide) ratios, could be used to effectively differentiate between different felsic volcanic and sedimentary suites of rocks at the Arctic deposit.
Lithogeochemistry shows three major felsic rock suites in the Arctic deposit area: a rhyolite suite; and intermediate volcanic suite and a volcaniclastic suite. These suites are partially in agreement with the logged lithology but in some instances the lithogeochemistry showed that alteration in texture and composition masked actual lithologic differences.
Results of the lithogeochemistry have led to a better understanding of the stratigraphic continuity of the various units and have been utilized to model the lithologic domains of the Arctic deposit more accurately.
| | |
| Arctic Project | Page 74 |
| S-K 1300 Technical Report Summary | November 30, 2022 |
| | |
| 6.4.1.10 | Lithologic Domains |
Though a variety of detailed lithologies are logged during data capture, Ambler Metals models the deposit area as two distinct structural plates, an Upper Plate and a Lower Plate separated by the Warm Springs Fault. The Upper and Lower Plates contain similar lithologic domains that are primarily defined by lithogeochemical characteristics but are also consistent with their respective acid-generating capacities and spatial distribution around the fold axes. The domains include the following units: the Button Schist (a meta-rhyolite porphyry - MRP), aphanitic meta-rhyolite (AMR), a series of felsic quartz mica schists (QMS), and carbonaceous schists of the Grey Schist unit (GS). An alteration model was built to adequately characterize the chlorite and talc schists found within the deposit (ChS, ChTS, and TS). The mineralization is modelled as eight distinct zones (Zones 1–8) found both in the Upper and Lower Plates and range from MS to SMS.
Earlier studies (Russell, 1977, 1995; Schmidt, 1983) concluded mineralization at the Arctic deposit was part of a normal stratigraphic sequence striking northeast and dipping gently southwest. Subsequent reinterpretation by Kennecott in 1998 and 1999 suggested the entire Ambler Sequence could be overturned. Proffett (1999) reviewed the Arctic deposit geology and suggested that a folded model with mineralization as part of an isoclinal anticline opening east and closing west could account for the mapped and logged geology. His interpretation called for an F2 fold superimposed on a north-trending F1 fabric.
Lindberg (2004) supported a similar folded model though he considered that the main fold at Arctic to be northwest-closing and southeast-opening. Lindberg named this feature the Arctic antiform and interpreted it to be an F1 fold.
Lindberg believed most folding within the deposit occurred in the central part, within a southwest plunging “Cascade zone.” The increased thicknesses of mineralized intervals in this part of the property can in part be explained by the multiple folding of two main mineralized horizons as opposed to numerous individual mineralized beds as shown in the 1995 geologic model. The Cascade zone appears to be confined to the upper sulphide limbs of the Arctic antiform.
in 2008, closer spaced drilling across the Cascade zone confirmed the continuity of the two mineralized horizons but did not support the complexity proposed by Lindberg. Dodd et al. (2004) suggested that some of the complexity might be related to minor thrusting. Results of mapping in 2006 supported the interpretation of an F2 fold event that may fold the lower Button Schist back to the north under the deposit in this area (Otto, 2006). To test this concept, deep drilling on the north side of the deposit in 2007 encountered the appropriate upright stratigraphy at depth. Though the target horizon was not reached due to the drill rig limitations, the hole did encounter significant mineralization below the Button Schist immediately above the sulphide-bearing permissive stratigraphy.
| 6.4.3 | Arctic Deposit Alteration |
Schmidt (1988) defined three main zones of hydrothermal alteration occurring at the Arctic deposit:
| • | A main chloritic zone occurring within the footwall of the deposit consisting of phengite and magnesium-chlorite. |
| • | A mixed alteration zone occurring below and lateral to sulphide mineralization consisting of phengite and phlogopite together with talc, calcite, dolomite, and quartz. |
| • | A pyritic zone overlying the sulphide mineralization. |
| | |
| Arctic Project | Page 75 |
| S-K 1300 Technical Report Summary | November 30, 2022 |
| | |
Field observations conducted by NovaGold in 2004 and 2005 supported by logging and short-wave infrared (SWIR) spectrometry only partially support Schmidt’s observations.
Talc and magnesium chlorite are the dominant alteration products associated with the sulphide-bearing horizons. Talc alteration grades downward and outward to mixed talc-magnesium chlorite with minor phlogopite, into zones of dominantly magnesium chlorite, then into mixed magnesium chlorite-phengite with outer phengite-albite alteration zones. Thickness of alteration zones vary with stratigraphic interpretation, but tens of metres for the outer zones is likely, as seen in phengite-albite exposures on the east side of Arctic Ridge. Stratigraphically above the sulphide-bearing horizons significant muscovite as paragonite is developed and results in a marked shift in sodium/magnesium ratios across the sulphide bearing horizons.
Piercey (2022) describes footwall alteration dominated by an assemblage of chlorite and talc with lesser sericite, quartz and carbonate with intense, pervasive talc-chlorite alteration extending between 10-50 m into the immediate footwall. Chlorite-talc alteration extends at least +200m into the footwall, decreasing in intensity with depth.
Hanging wall alteration extends approximately 50-100 metres into the hanging wall with intense talc-sericite alteration and sulphide replacement in the lenticular unit, decreasing in intensity upwards, to be patchier to semi-pervasive talc-sericite alteration in the upper parts of the stratigraphy (Piercey, 2022).Visual and quantitative determination of many of the alteration products is difficult at best due to their light colours and the well-developed micaceous habit of many of the alteration species. Logging in general has poorly captured the alteration products and the SWIR methodology though far more effective in capturing the presence or absence of various alteration minerals adds little in any quantitative assessment.
Of particular note are the barium species including barite, cymrite (a high-pressure barium phyllosilicate), and barium-bearing muscovite, phlogopite and biotite. These mineral species are associated with both alteration and mineralization and demonstrate local remobilization during metamorphism (Schmandt, 2009). Though little has been done to document their distribution to date, they do have a significant impact on bulk density measurements (refer to discussions in Section 10 and Section 11).
Talc is of particular importance at the Arctic deposit due to its potential negative impact on flotation characteristics during metallurgical processing, and on pit slope stability. The majority of the talc zones occur between the upper, stratigraphically up-right mineralized zones and the lower, overturned mineralized zones. Piercey (2022) noted that the strong talc alteration prevalent at Arctic is rather unique in this type of setting and may be due to the Mg-rich nature of the calc-silicates and carbonate-bearing rocks in the Anirak Schist underlying the felsic-dominated package.
| 6.4.4 | Arctic Deposit Mineralization |
Mineralization occurs as stratiform SMS to MS beds within primarily graphitic schists and fine-grained quartz mica schists. The sulphide beds average 4 m in thickness but vary from less than 1 m up to as much as 18 m in thickness. The sulphide mineralization occurs within eight modelled zones lying along the upper and lower limbs of the Arctic isoclinal anticline. The zones are all within an area of roughly 1 km2 with mineralization extending to a depth of approximately 250 m below the surface. There are five zones of MS and SMS that occur at specific pseudo-stratigraphic levels which make up the bulk of the Mineral Resource estimate. The other three zones also occur at specific pseudo-stratigraphic levels but are too discontinuous.
Unlike more typical VMS deposits, mineralization is not characterized by steep metal zonation or massive pyritic zones. Mineralization dominantly consists of sheet-like zones of base metal sulphides with variable pyrite and only minor zonation, usually on a small scale.
| | |
| Arctic Project | Page 76 |
| S-K 1300 Technical Report Summary | November 30, 2022 |
| | |
Mineralization is predominately coarse-grained sulphides comprising chalcopyrite, sphalerite, galena, tetrahedrite-tennantite, pyrite, arsenopyrite, and pyrrhotite. Sulphides occur as disseminated (<30%), semi-massive (30 to 50% sulphide) to massive (greater than 50% sulphide) layers. Trace amounts of electrum are also present. Gangue minerals associated with the mineralized horizons include quartz, barite, white mica, chlorite, stilpnomelane, talc, calcite, dolomite and cymrite.
In addition to the Arctic deposit, numerous other VMS-like occurrences are present in the UKMP land package. The most notable of these occurrences are the Dead Creek (also known as Shungnak), Sunshine, Cliff, Horse, and the Snow prospects to the west of the Arctic deposit and the Red, Nora, Tom-Tom and BT prospects to the east. Four kilometres northwest of Arctic is target 98-9 where chalcopyrite and sphalerite associated with pyrrhotite and quartz carbonate veins are found in chlorite-biotite schists. Figure 6-7 shows the UKMP land package and the prospect locations. Figure 6-7 also shows: 1) the Smucker deposit on the far west end of the Ambler Sequence which is currently owned by Teck Alaska Inc.; 2) the Sun deposit at the eastern end of the Ambler Sequence and owned by Valhalla Metals Inc, and 3) carbonate-hosted deposits and prospects in the Bornite Carbonate Sequence controlled by Ambler Metals/NANA.
| | |
| Arctic Project | Page 77 |
| S-K 1300 Technical Report Summary | November 30, 2022 |
| | |
| Figure 6-7: | Major Prospects of the Ambler Mining District |
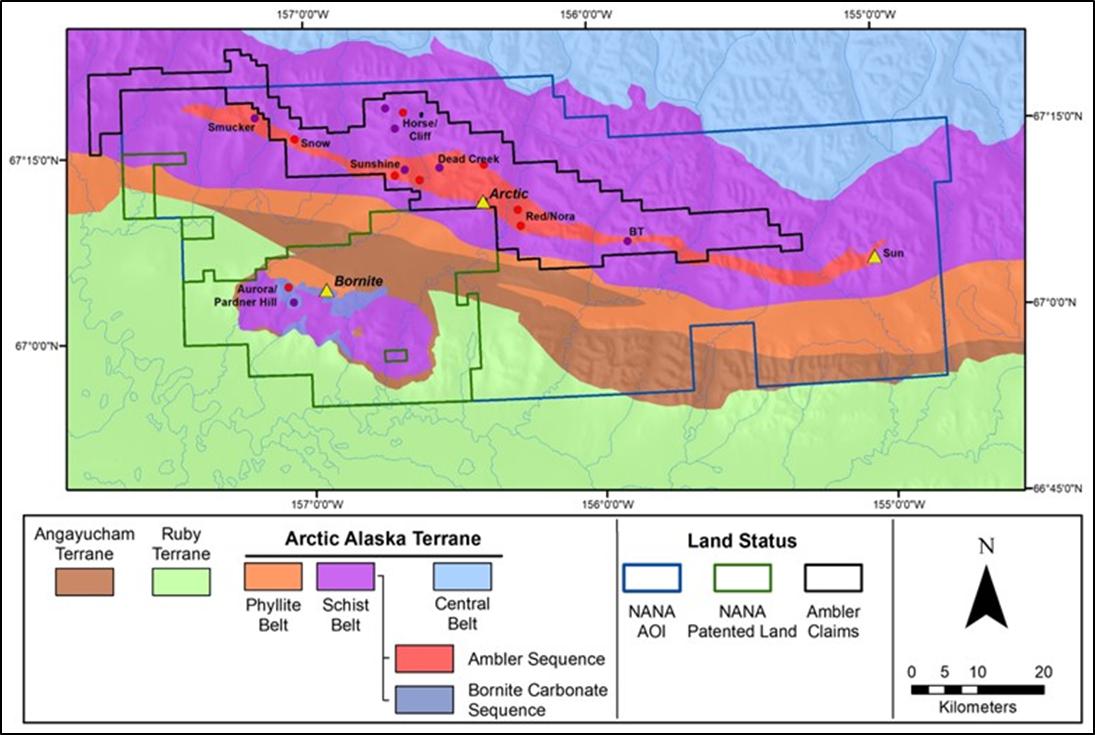
Source: Ambler Metals, 2022.
| | |
| Arctic Project | Page 78 |
| S-K 1300 Technical Report Summary | November 30, 2022 |
| | |
Table 7-1 summarizes the exploration work conducted by NovaGold, Trilogy (formerly, NovaCopper), and Ambler Metals from 2004 to the present. Field exploration was largely conducted during the period between 2004 to 2007 with associated engineering and characterization studies between 2008 and the present.
| Table 7-1: | Summary of NovaGold/Trilogy/Ambler Metals Exploration Activities Targeting VMS-style Mineralization in the Ambler Sequence Stratigraphy and the Arctic Deposit |
| Work Completed | Year | Details | Focus |
| Geological Mapping |
| - | 2004 | - | Arctic deposit surface geology |
| - | 2005 | - | Ambler Sequence west of the Arctic deposit |
| - | 2006 | - | COU, Dead Creek, Sunshine, Red |
| - | 2015, 2016 | SRK | Geotechnical Structural Mapping |
| - | 2016 | - | Arctic deposit surface geology |
| - | 2021 | - | Snow, Ambler, Nani, DH, Cliff, Sunshine, Dead Creek, BT, 98-9/Pipe, COU, SE Arctic, Nora |
| - | 2022 | - | Snow, Ambler, Nani, DH, Bud, Sunshine, Dead Creek, BT, 98-9/Pipe, COU, East Arctic, Nora, South Cliff, SK, Cynbad, Z, Tom Tom, Kogo/White Creek |
| Geophysical Surveys |
| SWIR Spectrometry | 2004 | 2004 drill holes | Alteration characterization |
| TDEM | 2005 | 2 loops | Follow-up of Kennecott DIGHEM EM survey |
| 2006 | 13 loops | District targets |
| 2007 | 6 loops | Arctic extensions |
| Downhole EM | 2007 | 4 drill holes | Arctic deposit |
| VTEM Plus (Versatile Time Domain Electromagnetic) airborne helicopter geophysical | 2019 | 400m line spacing with 200m infill with tie lines 4000m spacing | Ambler Mining District and Cosmos Hills with infill over Arctic, Sunshine and Horse-Cliff |
| | |
| Arctic Project | Page 79 |
| S-K 1300 Technical Report Summary | November 30, 2022 |
| | |
| | |
| | |
| Work Completed | Year | Details | Focus |
| ZTEM (Z-Axis Tipper Electromagnetic) airborne helicopter geophysical | 2019 | 400m line spacing with tie lines 4000m spacing | Ambler Mining District and Cosmos Hills with infill over Arctic, Sunshine and Horse-Cliff |
| Geochemistry |
| - | 2005 | - | Stream silts – core area prospects |
| - | 2006 | - | Soils – core area prospects |
| - | - | Stream silts – core area prospects |
| - | 2007 | - | Soils – Arctic deposit area |
| - | 2021 | - | Soils - VTEM 26-29, JA Creek, West Dead Creek, Dead Creek |
| - | 2022 | - | Soils - Sub Arctic Valley, South Cliff, VTEM 26-29, VTEM-41, VTEM-23 , East and West Sunshine, Tom Tom, Kogo/White Creek, SK, Cynbad, East Arctic, West Dead Creek, Dead Creek, 98-9/Pipe, Z, Nora, Ambler, Nani |
| - | | Streams silts - Core area prospects |
| Survey |
| Collar | 2004 to 2011, 2018, 2019, 2021, 2022 | DGPS | All 2004 to 2019 NovaCopper drill holes |
| 2004, 2008 | Resurveys | Historical Kennecott drill holes |
| Photography/Topography | 2010 | - | Photography/topography |
| LiDAR Survey | 2015, 2016 | - | LiDAR over Arctic deposit |
| Technical Studies |
| Geotechnical | 2010 | BGC | Preliminary geotechnical and hazards |
| ML/ARD | 2011 | SRK | Preliminary ML and ARD |
| Metallurgy | 2012 | SGS | Preliminary mineralogy and metallurgy |
| Geotechnical and Hydrology | 2012 | BGC | Preliminary rock mechanics and hydrology |
| Geotechnical and Hydrology | 2015, 2016, 2018, 2019, 2021, 2022 | SRK | Arctic PFS and FS slope design |
| | |
| Arctic Project | Page 80 |
| S-K 1300 Technical Report Summary | November 30, 2022 |
| | |
| Work Completed | Year | Details | Focus |
| ML/ARD | 2015, 2016, 2017, 2018, 2019 | SRK | Static kinetic tests and ABA update - ongoing |
| Metallurgy | 2015, 2016, 2017, 2018, 2019, 2021 | SGS, ALS | Cu-Pb Separation Testwork; Flotation and Variability Testwork; SAG Mill Comminution (SMC) Testwork, filtration Testwork, thickener Testwork, and tailings settling testing |
| Arctic Project Evaluation |
| Resource Estimation | 2008 | SRK | Resource estimation |
| PEA | 2011 | SRK | PEA - Underground |
| | 2012 | Tetra Tech | PEA – Open Pit |
| PFS | 2018 | Ausenco | Pre-Feasibility Study |
| FS | 2020 | Ausenco | Feasibility Study |
| Note: | SWIR = short wave infrared; LiDAR = light detection and ranging; ML = metal leaching; BGC = BGC Engineering Inc.; SGS = SGS Canada; ALS = ALS Metallurgy; PEA = preliminary economic assessment. |
Survey and data capture during the Kennecott’s programs used the UTM coordinates system Zone 4, NAD27 datum. In 2010, NovaGold converted all historical geology and topographic data for the Arctic deposit into the NAD83 datum for consistency. At that time NovaGold contracted WH Pacific, Inc. (WHPacific) to re-establish project-wide survey control and benchmarks for the Arctic deposit. Current Mineral Resource estimate and geologic models use topography completed in 2010 by PhotoSat Inc. The resolution of the satellite imagery used was at 0.5 m and a 1 m contour map and digital elevation model were generated.
Trilogy retained WHPacific (and sub-consultant Quantum Spatial, Inc.) to conduct an aerial LiDAR survey over the Upper Kobuk area during 2015. Due to scheduling difficulties and poor weather conditions only 70% of the survey was completed in 2015. The remaining 30% of the aerial survey, as well as the final post-processing work, was completed between June and October 2016.
NovaGold focused its exploration mapping efforts on an area covering approximately 18 km of strike length of the permissive Ambler Sequence rocks of the Schist belt stratigraphy. This area is centred on the Arctic deposit and covers the thickest portion of the Ambler Sequence rocks. The area covers many of the most notable mineralized occurrences including the Red prospect east of the Kogoluktuk River, the Arctic deposit, and the nearby occurrences at the West Dead Creek and Dead Creek prospects, and the CS, Bud and Sunshine prospects west of the Shungnak River.
In 2004, mapping focused on the surface geology in and around the Arctic deposit while exploration in 2005 extended the Ambler Sequence stratigraphy to the west. In 2006 with expansion of the exploration focus to encompass the immediate district and to support a major TDEM geophysical program, mapping was extended to include the area between the Sunshine prospect on the west and the Red prospect on the east. Figure 7-1 shows areas mapped by successive campaigns, which resulted in the generalized geological interpretation shown in Figure 6-4.
| | |
| Arctic Project | Page 81 |
| S-K 1300 Technical Report Summary | November 30, 2022 |
| | |
| Figure 7-1: | Mapping Campaigns in and around the Arctic Deposit |

Source: Trilogy Metals, 2019.
SRK was contracted in 2015 to create a structural geology model primarily based on brittle structures of the Arctic deposit for pit design and mine scheduling. The majority of the structural mapping took place along the north-south trending Arctic Ridge, and along the northwest trending ridge above a cirque to the south of the deposit, both of which provided the greatest exposure.
Geologic and structural mapping were completed by Trilogy geologists during the 2016 field season. The objectives of the mapping project were threefold; 1) to ground-truth the northeast and north-south trending fault structures identified by SRK in 2015 and to otherwise support SRK’s 2016 geotechnical mapping efforts, 2) field check the outcrops mapped in 2006 and 2008 recorded in the current GIS database, and 3) determine the nature of the Warm Springs Fault by mapping in the immediate hanging wall of this apparent structural feature. The first objective was successfully accomplished and the pending SRK geotechnical structural model was considered to be robust. The two other objectives were partly met during the short field season.
| | |
| Arctic Project | Page 82 |
| S-K 1300 Technical Report Summary | November 30, 2022 |
| | |
Geological mapping was completed by Ambler Metals geologists during the 2021 and 2022 field seasons. The mapping and geochemical sampling occurred at numerous prospects throughout the Ambler Belt, including the Snow, Ambler, Nora, Sunshine, Centre of the Universe, Pipe, DH, Cliff, 98-9 and BT prospects. The purpose of geologic mapping and sampling was to increase mapped extents at known prospects, collect mineralized and non-mineralized surface samples for various analyses and evaluate VTEM anomalies identified from the 2019 survey.
Soil and silt geochemical sampling were used to target many of the VMS prospects in the Ambler Sequence particularly in the core area around the Arctic deposit. Between 2005 and 2007, NovaGold collected 2,272 soils and 278 silt samples. Much of the reconnaissance soil sampling used gridding layouts of 200 m lines and 50 m sample intervals oriented perpendicular to stratigraphy. Results of the sampling were used to refine areas for geophysical surveying, and to define drill targets.
Ambler Metals completed soil sampling on numerous prospect areas within the Ambler VMS Belt during the 2021 and 2022 field seasons. In 2021, 731 soil samples were collected at Dead Creek, West Dead Creek, JA Creek, and over four VTEM (anomalies 26-29). Collection points spacing varied by prospect but were generally at 30 m spacing along parallel lines 100-200 m apart oriented to cross-cut stratigraphy. The 2021 program used the same analysis methods as the NovaGold programs.
In 2021, soil and silt samples were submitted directly to either ALS Minerals in Fairbanks (a division of ALS Global, formerly ALS Chemex) or Alaska Assay Labs in Fairbanks for sample preparation. The samples were dried and sieved to 80 mesh and forwarded to ALS Minerals for analysis. The samples were analysed using the ME-ICP61 method and a four acid near total digestion with 27 elements measured.
During NovaGold’s tenure, the geophysical surveys were largely focused on ground and downhole EM methods to follow-up on the 1998 DIGHEM airborne EM survey conducted by Kennecott.
From 2005 to 2007, NovaGold conducted TDEM surveys and completed 21 different loops targeting the Arctic deposit, extensions to the Arctic deposit and a series of DIGHEM airborne anomalies in and around known prospects and permissive stratigraphy. Table 7-2 summarizes the TDEM loops and locations.
Frontier Geosciences of Vancouver, BC completed all of the geophysical programs using a Geonics PROTEM 37 transmitter, a TEM-57 receiver and either a single channel surface coil or a three component BH43-3D downhole probe.
| | |
| Arctic Project | Page 83 |
| S-K 1300 Technical Report Summary | November 30, 2022 |
| | |
| Table 7-2: | TDEM Loops and Locations |
| Area | | 2005 | | 2006 | | 2007 |
| Arctic | | 1 | | - | | 6 |
| COU | | 1 | | 3 | | - |
| Dead Creek | | - | | 4 | | - |
| Sunshine | | - | | 2 | | - |
| Red | | - | | 1 | | - |
| Tom | | - | | 1 | | - |
| Kogo/Pipe | | - | | 2 | | - |
| Total | | 2 | | 13 | | 6 |
In addition to the TDEM surveys, Frontier Geosciences surveyed four drill holes (AR05-89, AR07-110, AR07-111, and AR07-112). All of the drill holes produced off-hole anomalies, notably AR07-111, which showed evidence of a strong EM conductor north of the hole. Follow-up of this conductor is warranted.
In 2019, Trilogy contracted GeoTech Ltd. of Aurora, Ontario to complete VTEM Plus (Versatile Time Domain Electromagnetic) and ZTEM (Z-Axis Tipper Electromagnetic) airborne helicopter geophysical surveys over the Cosmos Hills and the Ambler VMS belt. These survey methods are a significant upgrade over the previous DIGHEM survey flown by Kennecott in 1998 over the VMS belt and the DIGHEM survey flown by NovaGold over the Bornite Sequence in 2006 due to the greater resolution and deeper penetration ability. The magnetic field was also measured using a cesium vapor sensor, though radiometric data were not collected due to snow cover.
The program was designed, managed, and results interpreted by Resource Potential, a geophysical consulting company based in Perth, Australia.
The VTEM survey was flown at a 400 m line spacing over the Ambler VMS Belt along lines oriented at 20°-200° for the western portion of the belt and along north-south lines for the eastern portion (see Figure 7-2). In-fill lines at 200 m spacing were flown over the Arctic, Sunshine, and Horse-Cliff areas to provide greater resolution in those high priority areas. Tie lines at ~4 km spacing were flown perpendicular to the EM flight lines to provide control for the magnetic survey.
| | |
| Arctic Project | Page 84 |
| S-K 1300 Technical Report Summary | November 30, 2022 |
| | |
| Figure 7-2: | VTEM Flight Lines Over the Ambler Belt and Cosmos Hill Prospective Areas |
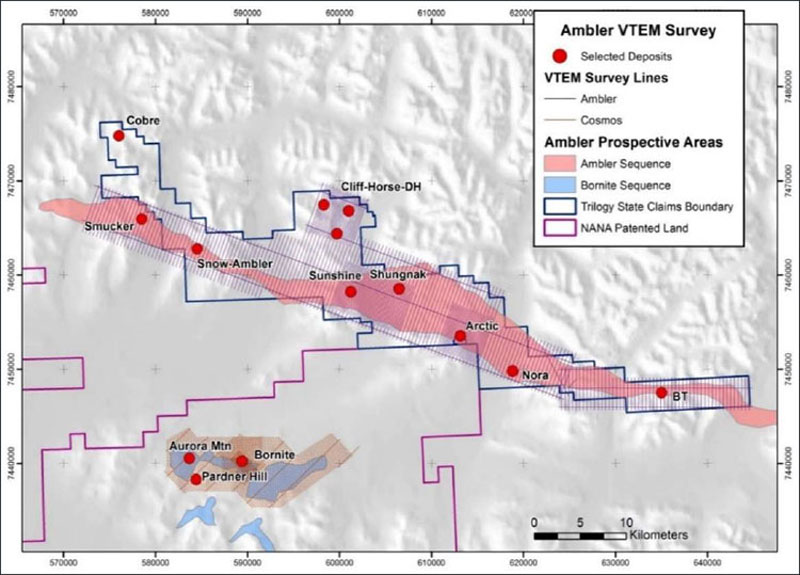
Source: Ambler Metals, 2019.
The ZTEM survey was flown along lines with the same orientation as the VTEM survey at 400m line spacing, with tie lines at every 4 km. (Figure 7-3). Resource Potential re-processed the data from GeoTech and provided a 3D EM block model and both plan view depth slices and sectional EM images for the ZTEM survey. Numerous anomalies identified from both the VTEM and ZTEM surveys need further evaluation.
| | |
| Arctic Project | Page 85 |
| S-K 1300 Technical Report Summary | November 30, 2022 |
| | |
| Figure 7-3: | ZTEM Flight Lines Over the Ambler VMS Belt and the Bornite Deposit |
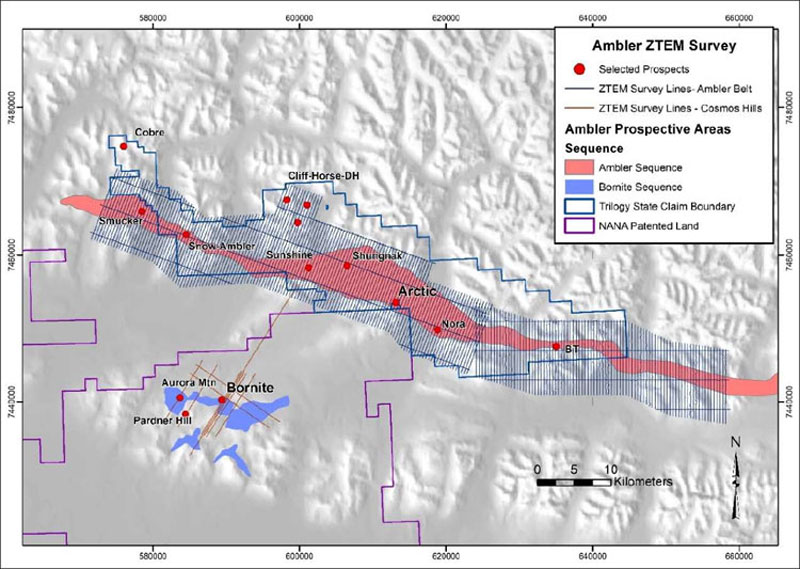
Source: Trilogy Metals, 2019
| 7.1.5 | Petrology, Minerology and Research Studies |
Trilogy supported a series of academic studies of the Arctic deposit. In 2009, Danielle Schmandt completed an undergraduate thesis entitled “Mineralogy and Origin of Zn-rich Horizons within the Arctic Volcanogenic Massive Sulphide deposit, Ambler District, Alaska” for Smith College. The Schmandt thesis focused on a structural and depositional reconstruction of the Arctic deposit with the goal of locating the hydrothermal vents to aid in exploration.
Bonnie Broman, a Trilogy geologist, completed a Master of Science thesis in 2014 at the University of Alaska Fairbanks, focusing on the nature and distribution of the silver-bearing mineral species within the Arctic deposit. The thesis is titled “Metamorphism and Element Redistribution: Investigations of Ag-bearing and associated minerals in the Arctic Volcanogenic Massive Sulphide deposit, SW Brooks Range, NW Alaska.”
| | |
| Arctic Project | Page 86 |
| S-K 1300 Technical Report Summary | November 30, 2022 |
| | |
Drilling at the Arctic deposit and within the Ambler Mining District has been ongoing since the initial discovery of mineralization in 1966. Approximately 67,639 m of drilling has been completed within the Ambler Mining District, including 55,038 m of drilling in 285 drill holes sat the Arctic deposit or on potential extensions in 32 campaigns spanning 56 years. Drilling outside the Arctic deposit area is discussed in Section 7.2.2.
All of the drill campaigns at the Arctic deposit utilize diamond drill holes and have been run under the supervision of either: 1) Kennecott and its subsidiaries (BCMC), 2) Anaconda, or 3) Trilogy (formerly, NovaCopper) and its predecessor company, NovaGold and its successor joint venture Company, Ambler Metals. Table 7-3 summarizes operators, campaigns, holes, and meters drilled on the Arctic deposit. All drill holes listed in Table 7-3 - except 11 geotechnical holes in 2017, 24 geotechnical holes drilled in 2018, 8 holes from the 2021 program and 34 holes from the 2022 program, for which assay results were not available - were used to validate the geologic model.
| Table 7-3: | Companies, Campaigns, Drill Holes and Meters Drilled at the Arctic Deposit |
| Year | | Company | | No. of Holes | | Metres | |
| 1967 | | BCMC | | 7 | | 752 | |
| 1968 | | BCMC | | 18 | | 3,836 | |
| 1969 | | BCMC | | 3 | | 712 | |
| 1970 | | BCMC | | 3 | | 831 | |
| 1971 | | BCMC | | 1 | | 257 | |
| 1972 | | BCMC | | 1 | | 407 | |
| 1973 | | BCMC | | 2 | | 557 | |
| 1974 | | BCMC | | 3 | | 900 | |
| 1975 | | BCMC | | 26 | | 4,942 | |
| 1976 | | BCMC, Anaconda | | 10 | | 805 | |
| 1977 | | BCMC, Anaconda | | 4 | | 645 | |
| 1979 | | BCMC, Anaconda | | 3 | | 586 | |
| 1980 | | Anaconda | | 1 | | 183 | |
| 1981 | | BCMC, Anaconda | | 2 | | 632 | |
| 1982 | | BCMC, Anaconda | | 5 | | 677 | |
| 1983 | | BCMC | | 1 | | 153 | |
| 1984 | | BCMC | | 2 | | 253 | |
| 1986 | | BCMC | | 1 | | 184 | |
| 1998 | | Kennecott | | 6 | | 1,523 | |
| 2004 | | NovaGold | | 11 | | 2,996 | |
| 2005 | | NovaGold | | 9 | | 3,393 | |
| 2007 | | NovaGold | | 4 | | 2,606 | |
| 2008 | | NovaGold | | 14 | | 3,306 | |
| 2011 | | NovaGold | | 5 | | 1,193 | |
| | |
| Arctic Project | Page 87 |
| S-K 1300 Technical Report Summary | November 30, 2022 |
| | |
| Year | | Company | | No. of Holes | | Metres | |
| 2015 | | NovaCopper | | 14 | | 3,055 | |
| 2016 | | NovaCopper | | 13 | | 3,058 | |
| 2017 | | Trilogy Metals | | 5 | | 790 | |
| 2018 | | Trilogy Metals | | 24 | | 906 | |
| 2019 | | Trilogy Metals | | 9 | | 2,433 | |
| 2021 | | Ambler Metals | | 18 | | 4,131 | |
| 2022 | | Ambler Metals | | 47 | | 8,376 | |
| Total | | - | | 272 | | 55,078 | |
Trilogy (formerly, NovaCopper) and its predecessor company, NovaGold and its successor joint venture Company, Ambler Metals, drilled 36,243 m in 173 holes targeting the Arctic deposit and several other prospects within the Ambler Schist belt. Table 7-4 summarizes all the NovaGold/Trilogy/Ambler Metals tenure drilling on the Project.
| Table 7-4: | Summary of NovaGold/Trilogy/Ambler Metals Arctic Deposit Drilling |
| Year | | Metres | | No. of Drillholes | | Sequence | | Purpose of Drilling |
| 2004 | | 2,996 | | 11 | | AR04-78 to 88 | | Deposit scoping and verification |
| 2005 | | 3,393 | | 9 | | AR05-89 to 97 | | Extensions to the Arctic deposit |
| 2006* | | 3,010 | | 12 | | AR06-98 to 109 | | Property-wide exploration drilling |
| 2007 | | 2,606 | | 4 | | AR07-110 to 113 | | Deep extensions of the Arctic deposit |
| 2008* | | 3,306 | | 14 | | AR08-114 to 126 | | Grade continuity and metallurgy |
| 2011 | | 1,193 | | 5 | | AR11-127 to 131 | | Geotechnical studies |
| 2012* | | 1,752 | | 4 | | SC12-014 to 017 | | Exploration drilling – Sunshine |
| 2015 | | 3,055 | | 14 | | AR15-132 to 145 | | Geotechnical-hydrogeological studies, resource infill |
| 2016 | | 3,058 | | 13 | | AR16-146 to 158 | | Geotechnical-hydrogeological studies, resource infill |
| 2017** | | 790 | | 5 | | AR17-159 to 163 | | Ore sorting studies |
| 2018 | | 906 | | 24 | | GT18-AR-01 to 19 | | Geotechnical studies for site facilities |
| | | | MS18-AR-01 to 05 | |
| 2019* | | 2433 | | 9 | | AR19-0164 to 172 | | Geotechnical and hydrogeological studies for 2020 FS |
| | 1,357 | | 6 | | SC19-018 to 023 | | Exploration drilling – Sunshine |
| 2021** | | 4,131 | | 18 | | AR21-0173 to 190 | | Geotechnical and hydrogeological studies for 2021 FS and In-fill |
| | 2,414 | | 6 | | Various holes | | Property-wide exploration drilling |
| 2022*** | | 8,376 | | 47 | | AR22-0191 to 237 | | Geotechnical and infill drilling |
| | 1,644 | | 5 | | Various holes | | Property-wide exploration drilling |
| Total | | 46,420 | | 206 | | - | | - |
Notes:
*Drilling in 2006, 2012, and some holes in 2019 and 2021 targeted exploration targets elsewhere in the VMS belt.
**Holes drilled in 2018 are not included in the current resource estimate as they were completed geotechnical site facilities studies.
***8 holes drilled in 2021 and 2022 are not included in the current resource database and were used to validate the resource model, as the results were not available at the time of updating the resource database.
| | |
| Arctic Project | Page 88 |
| S-K 1300 Technical Report Summary | November 30, 2022 |
| | |
Geotechnical holes drilled in 2017 and 2018 are not included in the current resource estimate as they were completed for geotechnical site facilities studies. Assays for 8 out of 18 holes drilled at Arctic in 2021 and 34 out of 34 holes drilled in 2022 were not available for use in grade estimation in the current mineral resource estimate because the assays were not available at the time of resource estimation. Figure 7-4 shows the locations of drill holes in the vicinity of the Arctic deposit.
| Figure 7-4: | Plan Map of Drill Holes coloured by Year in the Vicinity of the Arctic Deposit. Dark Grey is Limits of 2021 Conceptual Pit |
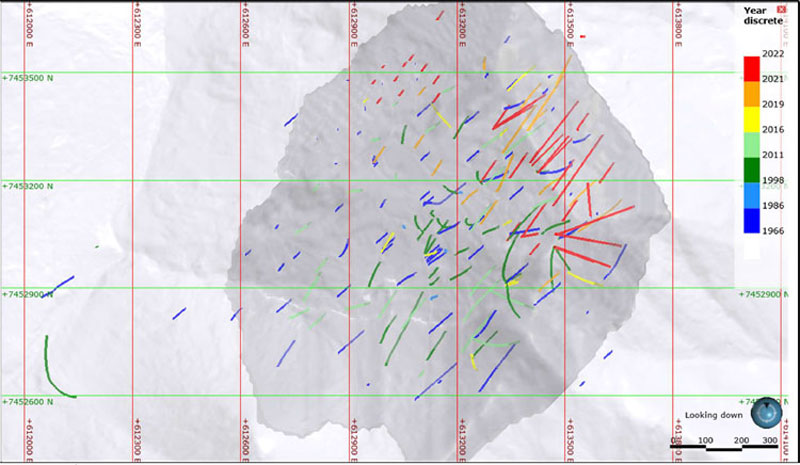
Source: Wood, 2022.
Significant exploration drilling has been carried out elsewhere within the UKMP targeting numerous occurrences along the Ambler Schist belt. Table 7-5 summarizes the drilling within the UKMP outside of the Arctic deposit.
Figure 7-5 shows the locations of known major prospects and drill collar locations for the Ambler Mining District. Note that none of these drill holes are located within the current Arctic Project and are therefore not included in the resource calculation.
| | |
| Arctic Project | Page 89 |
| S-K 1300 Technical Report Summary | November 30, 2022 |
| | |
| Table 7-5: | Drill, Meterage and Average Drill Depth for Ambler Sequence VMS Targets |
| Area | | Drill Holes
(number) | | Metres | | Average
Depth (m) | |
| Dead Creek/West Dead Creek | | 21 | | 3,470 | | 165 | |
| Sunshine/Bud | | 42 | | 8,468 | | 201 | |
| Snow/Trilogy | | 11 | | 1,527 | | 139 | |
| Horse/Cliff/DH | | 22 | | 2,277 | | 104 | |
| Red/Nora/BT | | 18 | | 2,399 | | 133 | |
| Total | | 114 | | 18,141 | | 148 | |
| Figure 7-5: | Collar Locations and Principal Target Areas – Ambler Mining District |

Source: Ambler Metals, 2022.
| | |
| Arctic Project | Page 90 |
| S-K 1300 Technical Report Summary | November 30, 2022 |
| | |
Exploration in 2006 investigated a series of geophysical anomalies in the central portion of the Ambler Schist belt near the Arctic deposit. In 2012, Trilogy drilled an additional four holes totalling 1,752 m to explore the down dip extension of the Sunshine prospect. Twelve holes totalling 3,100 m were drilled. In 2012, Trilogy drilled an additional four holes totalling 1,752 m to explore the down dip extension of the Sunshine prospect. In 2019, Trilogy drilled 10 holes totalling 3,823 m at four regional targets. Regional drilling is summarized in Table 7-6 and Table 7-7 and in Figure 7-6 to Figure 7-11.
| Table 7-6: | Ambler Metals Exploration Drilling – Ambler Schist Belt |
Hole
ID | | Area | | Target | | UTM
East | | UTM
North | | Azimuth
(°) | | Dip
(°) | | Depth
(m) |
| AR06-98 | | COU | | EM Anomaly | | 609490 | | 7454374 | | 0 | | -90 | | 712.6 |
| AR06-99 | | 98-3 | | EM Anomaly | | 610111 | | 7458248 | | 0 | | -90 | | 420.0 |
| AR06-100 | | 98-3 | | EM Anomaly | | 609989 | | 7458633 | | 0 | | -90 | | 225.6 |
| AR06-101 | | Red | | EM Anomaly | | 618083 | | 7451673 | | 0 | | -90 | | 141.7 |
| AR06-102 | | Sunshine | | West Extension | | 601176 | | 7457834 | | 30 | | -65 | | 97.8 |
| AR06-103 | | Red | | EM Anomaly | | 618073 | | 7451806 | | 0 | | -90 | | 209.7 |
| AR06-104 | | Red | | EM Anomaly | | 617926 | | 7451693 | | 0 | | -90 | | 183.2 |
| AR06-105 | | Red | | EM Anomaly | | 618074 | | 7451537 | | 0 | | -90 | | 136.6 |
| AR06-106 | | Red | | EM Anomaly | | 618083 | | 7451677 | | 310 | | -60 | | 185.0 |
| AR06-107 | | Sunshine | | West Extension | | 601018 | | 7458119 | | 30 | | -60 | | 294.4 |
| AR06-108 | | Dead Creek | | Downdip Extension | | 607618 | | 7458406 | | 0 | | -90 | | 289.0 |
| SC12-014 | | Sunshine | | Sunshine Extension | | 601948 | | 7457759 | | 20 | | -57 | | 537.8 |
| SC12-015 | | Sunshine | | Sunshine Extension | | 601860 | | 7457637 | | 20 | | -65 | | 477.0 |
| SC12-016 | | Sunshine | | Sunshine Extension | | 601649 | | 7457637 | | 45 | | -77 | | 386.2 |
| SC12-017 | | Sunshine | | Sunshine Extension | | 602063 | | 7457701 | | 20 | | -60 | | 351.1 |
| SC19-018 | | Sunshine | | Sunshine Infill | | 601748 | | 7457922 | | 15 | | -52 | | 296.3 |
| SC19-019 | | Sunshine | | Sunshine Infill | | 601748.2 | | 7457923 | | 0 | | -90 | | 160.6 |
| SC19-020 | | Sunshine | | Sunshine Infill | | 601863.2 | | 7457873 | | 70 | | -48 | | 230.4 |
| SC19-021 | | Sunshine | | Sunshine Infill | | 601862.2 | | 7457872 | | 70 | | -48 | | 212.8 |
| SC19-022 | | Sunshine | | Sunshine Infill | | 601692.2 | | 7457866 | | 345 | | -80 | | 203.6 |
| SC19-023 | | Sunshine | | Sunshine Infill | | 601691.6 | | 7457868 | | 345 | | -45 | | 253.0 |
| NEN22-001 | | 98-9 | | Surface occurrence | | 615906 | | 7456176 | | 90 | | -55 | | 223.72 |
| NEN22-002 | | 98-9 | | Surface occurrence | | 615907 | | 7456178 | | 90 | | -50 | | 376.12 |
| NEN22-003 | | 98-9 | | Surface occurrence w/EM anomaly | | 615881 | | 7456028 | | 109 | | -45 | | 451.1 |
| NEN22-004 | | 98-9 | | Surface occurrence w/EM anomaly | | 615880 | | 7456029 | | 140 | | -45 | | 348.09 |
| SNO21-001 | | Snow | | Extension of Snow w/coincident EM Anomaly | | 584650 | | 7462550 | | 340 | | -80 | | 529.74 |
| SNO21-002 | | Snow | | Extension of Snow w/coincident EM Anomaly | | 584650 | | 7462551 | | 11 | | -45 | | 413 |
| XAR21-001 | | NE Arctic | | Extension of Arctic | | 613803 | | 7453218 | | 135 | | -45 | | 448.67 |
| XAR21-002 | | NE Arctic | | Extension of Arctic | | 613805 | | 7453217 | | 135 | | -80 | | 291.39 |
| XAR21-003 | | SE Arctic | | EM Anomaly | | 614750 | | 7451885 | | 340 | | -55 | | 401.42 |
| XAR21-004 | | SE Arctic | | EM Anomaly | | 614894 | | 7451990 | | 32 | | -57 | | 339.85 |
| AR06-109 | | Dead Creek | | Stratigraphy Hole | | 608187.7 | | 7458314.5 | | 0 | | -90 | | 114.91 |
| | |
| Arctic Project | Page 91 |
| S-K 1300 Technical Report Summary | November 30, 2022 |
| | |
| Table 7-7: | 2019-2021 Regional Prospect Drilling Significant Intercepts |
| Sunshine Drill Results |
| 1.5% CuEq Cut-off |
| | | Hole | | From (m) | | To (m) | | Length_m | | CuEq% | | Cu_% | | Zn_% | | Pb_% | | Au_g/t | | Ag_g/t | | Ba_pct | |
| Sunshine | | SC19-018 | | 139.52 | | 144.76 | | 5.24 | | 3.93 | | 2.08 | | 3.13 | | 0.63 | | 0.154 | | 41.643 | | - | |
| | SC19-018 | | 238.72 | | 245.06 | | 6.34 | | 2.38 | | 1.63 | | 1.45 | | 0.09 | | 0.070 | | 13.380 | | - | |
| | SC19-018 | | 247.86 | | 255.06 | | 7.20 | | 1.69 | | 0.72 | | 2.18 | | 0.21 | | 0.030 | | 6.640 | | - | |
| | SC19-018 | | 260.46 | | 261.60 | | 1.14 | | 1.71 | | 1.53 | | 0.35 | | 0.01 | | 0.027 | | 3.670 | | - | |
| | SC19-019 | | 57.00 | | 66.14 | | 9.14 | | 3.95 | | 3.02 | | 1.42 | | 0.27 | | 0.137 | | 24.651 | | - | |
| | SC19-019 | | 68.85 | | 72.15 | | 3.30 | | 2.82 | | 1.68 | | 1.77 | | 0.47 | | 0.121 | | 27.573 | | - | |
| | SC19-019 | | 98.81 | | 102.54 | | 3.73 | | 5.51 | | 4.74 | | 0.97 | | 0.13 | | 0.153 | | 28.957 | | - | |
| | SC19-019 | | 122.36 | | 125.40 | | 3.04 | | 1.63 | | 0.75 | | 1.40 | | 0.35 | | 0.077 | | 21.020 | | - | |
| | SC19-019 | | 138.17 | | 146.05 | | 7.88 | | 5.23 | | 2.23 | | 5.62 | | 1.10 | | 0.180 | | 46.947 | | - | |
| | SC19-020 | | 176.37 | | 179.74 | | 3.37 | | 6.54 | | 4.15 | | 3.42 | | 0.48 | | 0.258 | | 74.354 | | - | |
| | SC19-020 | | 188.55 | | 190.10 | | 1.55 | | 3.77 | | 1.43 | | 1.65 | | 0.40 | | 0.061 | | 23.300 | | - | |
| | SC19-020 | | 204.15 | | 209.09 | | 4.94 | | 5.77 | | 4.47 | | 3.42 | | 0.01 | | 0.002 | | 0.117 | | - | |
| | SC19-020 | | 219.30 | | 221.98 | | 2.68 | | 3.87 | | 3.70 | | 0.44 | | 0.00 | | 0.002 | | 0.396 | | - | |
| | SC19-021 | | 146.62 | | 156.28 | | 9.66 | | 6.10 | | 3.93 | | 3.00 | | 0.77 | | 0.216 | | 73.104 | | - | |
| | SC19-022 | | 114.12 | | 115.47 | | 1.35 | | 5.90 | | 2.89 | | 4.87 | | 1.41 | | 0.172 | | 68.300 | | - | |
| | SC19-022 | | 130.40 | | 134.61 | | 4.21 | | 1.85 | | 0.34 | | 2.28 | | 1.07 | | 0.066 | | 30.634 | | - | |
| | SC19-022 | | 143.73 | | 159.01 | | 15.28 | | 3.08 | | 1.35 | | 2.91 | | 0.78 | | 0.158 | | 32.584 | | - | |
| | SC19-023 | | 163.50 | | 168.51 | | 5.01 | | 2.09 | | 0.87 | | 1.92 | | 0.66 | | 0.101 | | 24.687 | | - | |
| Northeast Arctic 2021 | | XAR21-001 | | 421.00 | | 422.52 | | 1.52 | | 0.20 | | 0.07 | | 0.04 | | 0.26 | | 0.014 | | 1.000 | | - | |
| | XAR21-001 | | 436.12 | | 436.57 | | 0.45 | | 2.08 | | 0.11 | | 0.02 | | 0.05 | | 0.003 | | 216.000 | | - | |
| | XAR21-002 | | 235.65 | | 236.11 | | 0.46 | | 2.14 | | 0.55 | | 1.04 | | 2.77 | | 0.025 | | 23.800 | | - | |
| | XAR21-002 | | 239.02 | | 240.10 | | 1.08 | | 0.25 | | 0.09 | | 0.01 | | 0.39 | | 0.009 | | 0.710 | | - | |
| | XAR21-003 | | 358.75 | | 359.34 | | 0.59 | | 0.48 | | 0.29 | | 0.10 | | 0.35 | | 0.003 | | 3.710 | | - | |
| Snow | | SNO21-001 | | 137.87 | | 138.21 | | 0.34 | | 5.85 | | 0.35 | | 5.47 | | 7.04 | | 0.321 | | 99.600 | | 0.16 | |
| | SNO21-001 | | 138.21 | | 140.04 | | 1.83 | | 0.81 | | 0.04 | | 0.96 | | 0.83 | | 0.088 | | 10.500 | | 0.21 | |
| | SNO21-001 | | 137.87 | | 140.04 | | 2.17 | | 1.60 | | 0.09 | | 1.67 | | 1.80 | | 0.125 | | 24.460 | | 0.20 | |
| | SNO21-001 | | 329.59 | | 330.70 | | 1.11 | | 0.92 | | 0.61 | | 0.15 | | 0.51 | | 0.035 | | 6.260 | | 0.16 | |
| | SNO21-002 | | 167.16 | | 167.48 | | 0.32 | | 7.49 | | 0.23 | | 7.25 | | 9.13 | | 0.391 | | 139.000 | | 0.08 | |
| | SNO21-002 | | 167.48 | | 168.26 | | 0.78 | | 1.07 | | 0.09 | | 0.89 | | 1.22 | | 0.147 | | 16.350 | | 0.34 | |
| | SNO21-002 | | 168.26 | | 168.62 | | 0.36 | | 1.22 | | 0.02 | | 1.35 | | 1.66 | | 0.072 | | 10.200 | | 0.29 | |
| | SNO21-002 | | 168.62 | | 169.16 | | 0.54 | | 1.49 | | 0.08 | | 1.55 | | 2.06 | | 0.075 | | 10.000 | | 0.29 | |
*Cu-Eq calculation uses the Trilogy’s 2020 Arctic FS metal prices of $3.00 Cu, $1.10 Zn, $1.00 Pb, $18.00 Ag and $1,300 Au.
| | |
| Arctic Project | Page 92 |
| S-K 1300 Technical Report Summary | November 30, 2022 |
| | |
| Figure 7-6: | Sunshine Prospect and Drill Hole Locations |
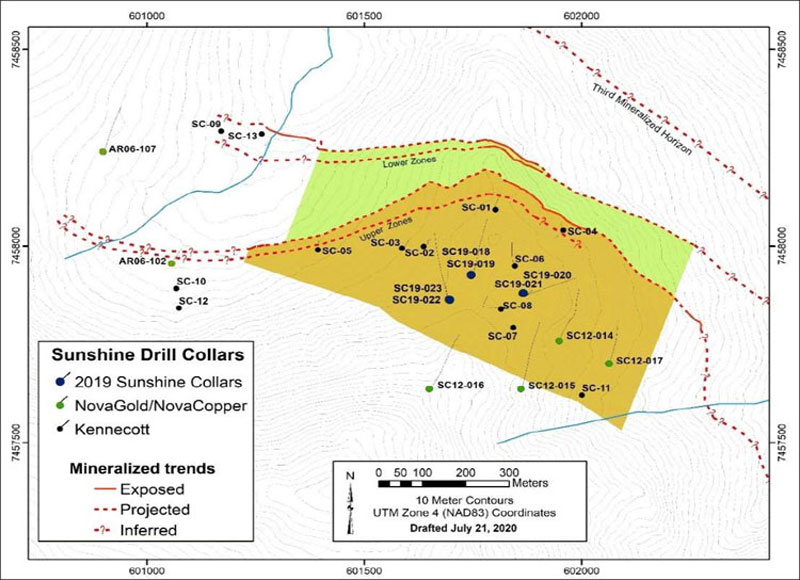
Source: Trilogy Metals, 2020.
| | |
| Arctic Project | Page 93 |
| S-K 1300 Technical Report Summary | November 30, 2022 |
| | |
| Figure 7-7: | Snow Project and Drill Hole Locations |
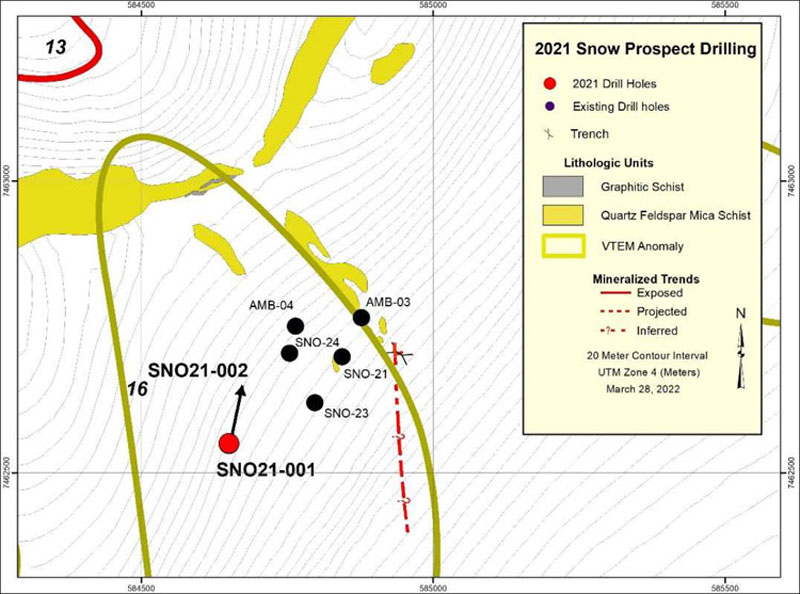
Source: Ambler Metals, 2021.
| | |
| Arctic Project | Page 94 |
| S-K 1300 Technical Report Summary | November 30, 2022 |
| | |
| Figure 7-8: | Northeast and Southeast Arctic and Drill Hole Locations |
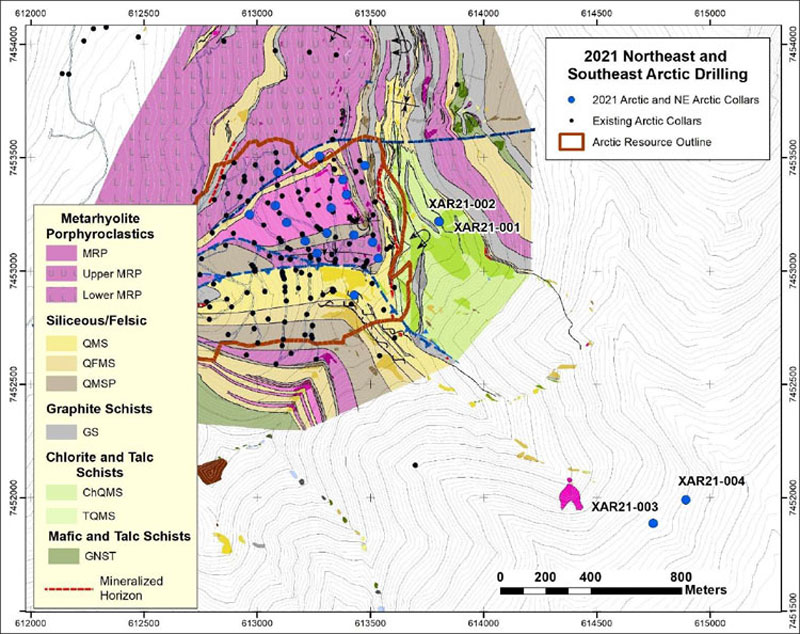
Source: Ambler Metals, 2021.
| | |
| Arctic Project | Page 95 |
| S-K 1300 Technical Report Summary | November 30, 2022 |
| | |
| Figure 7-9: | 98-9(NEN) Prospect and Drill Hole Locations |
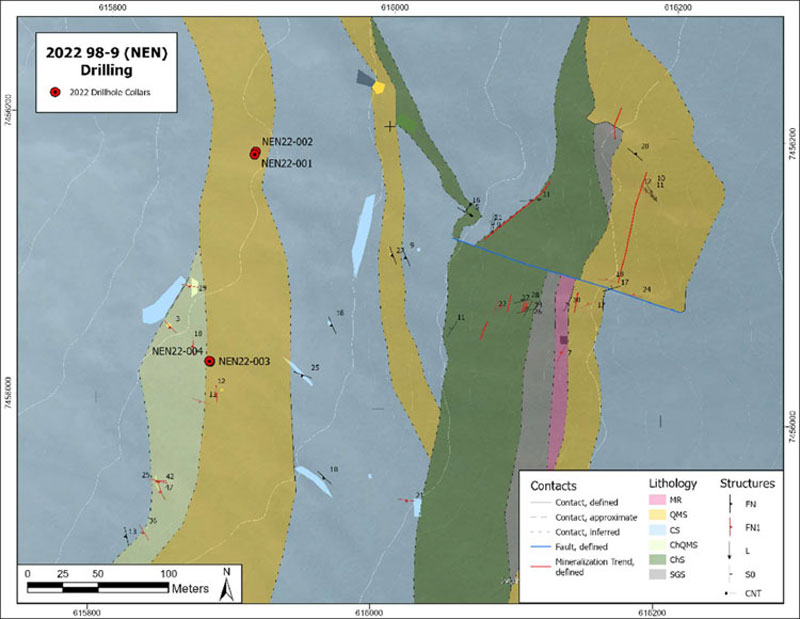
Source: Ambler Metals, 2021.
| | |
| Arctic Project | Page 96 |
| S-K 1300 Technical Report Summary | November 30, 2022 |
| | |
| Figure 7-10: | East Dead Creek Prospect and Drill Hole Locations |
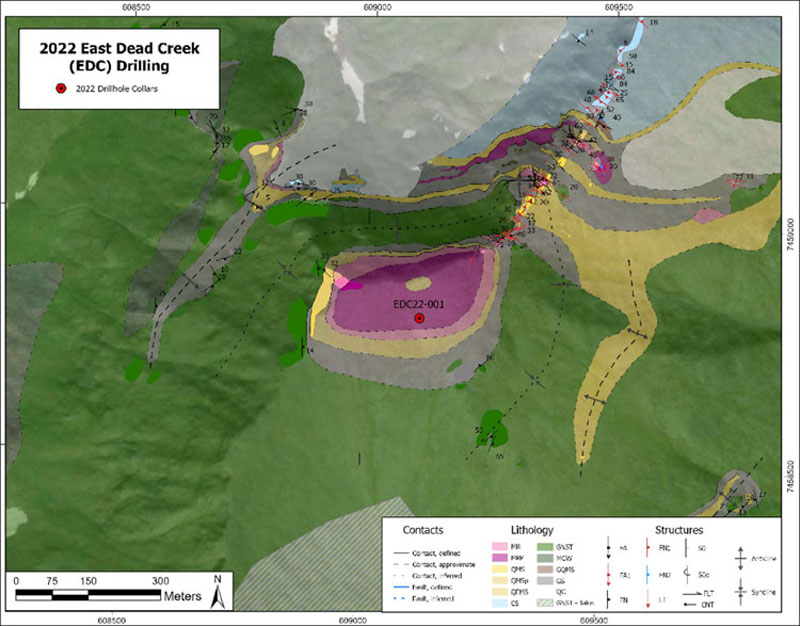
Source: Ambler Metals, 2021.
| | |
| Arctic Project | Page 97 |
| S-K 1300 Technical Report Summary | November 30, 2022 |
| | |
| Figure 7-11: | Plan Map of Drill Holes in the Vicinity of the Arctic Deposit |
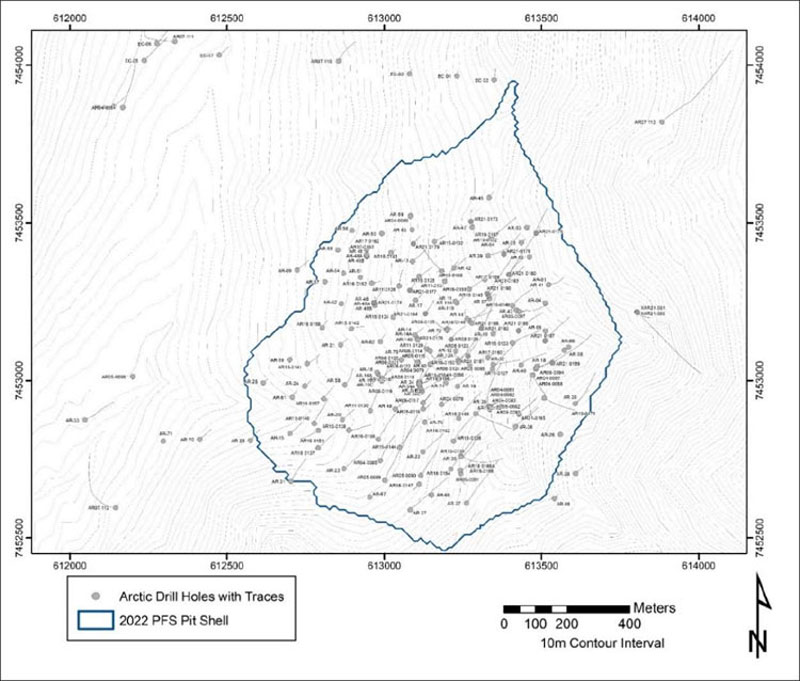
Source: Trilogy Metals, 2022.
Over the Arctic Project’s history, a relatively limited number of drill companies have been used by both Kennecott, NovaGold, Trilogy/NovaCopper and Ambler Metals at the Arctic deposit. During Kennecott’s work programs, Sprague and Henwood, a Pennsylvania-based drilling company was the principal contractor. Tonto Drilling provided services to Kennecott during Kennecott’s short return to the district in the late 1990s. NovaCopper and NovaGold used Boart Longyear as their only drill contractor. Trilogy has used Major Drilling and Tuug Drilling. Ambler Metals used Tuuq Drilling in 2021. Table 7-8 summarizes drill companies and core sizes used.
| | |
| Arctic Project | Page 98 |
| S-K 1300 Technical Report Summary | November 30, 2022 |
| | |
| Table 7-8: | Drill Contractors, Drill Holes, Meterage and Core Sizes by Drill Campaign at the Arctic Deposit |
| Year | | Company | | No. of
Drill Holes | | Metres | | Core Size | | Drill Contractor |
| 1967 | | Bear Creek | | 7 | | 752 | | BX | | Sprague and Henwood |
| 1968 | | Bear Creek | | 18 | | 3,782 | | BX | | Sprague and Henwood |
| 1969 | | Bear Creek | | 3 | | 712 | | BX | | Sprague and Henwood |
| 1970 | | Bear Creek | | 3 | | 831 | | BX | | Sprague and Henwood |
| 1971 | | Bear Creek | | 2 | | 257 | | BX | | Sprague and Henwood |
| 1972 | | Bear Creek | | 1 | | 407 | | BX | | Sprague and Henwood |
| 1973 | | Bear Creek | | 2 | | 557 | | BX | | Sprague and Henwood |
| 1974 | | Bear Creek | | 3 | | 900 | | NX and BX | | Sprague and Henwood |
| 1975 | | Bear Creek | | 26 | | 4,942 | | NX and BX | | Sprague and Henwood |
| 1976 | | Bear Creek | | 8 | | 479 | | NXWL and BXWL | | Sprague and Henwood |
| 1977 | | Bear Creek | | 3 | | 497 | | NXWL and BXWL | | Sprague and Henwood |
| 1979 | | Bear Creek | | 2 | | 371 | | NXWL and BXWL | | Sprague and Henwood |
| 1981 | | Bear Creek | | 1 | | 458 | | NXWL and BXWL | | Sprague and Henwood |
| 1982 | | Bear Creek | | 4 | | 494 | | NXWL and BXWL | | Sprague and Henwood |
| 1983 | | Bear Creek | | 1 | | 153 | | NXWL and BXWL | | Sprague and Henwood |
| 1984 | | Bear Creek | | 2 | | 253 | | NXWL and BXWL | | Sprague and Henwood |
| 1986 | | Bear Creek | | 1 | | 184 | | NXWL and BXWL | | Sprague and Henwood |
| 1998 | | Kennecott | | 6 | | 1,523 | | HQ | | Tonto |
| 2004 | | NovaGold | | 11 | | 2,996 | | NQ and HQ | | Boart Longyear |
| 2005 | | NovaGold | | 9 | | 3,393 | | NQ and HQ | | Boart Longyear |
| 2007 | | NovaGold | | 4 | | 2,606 | | NQ and HQ | | Boart Longyear |
| 2008 | | NovaGold | | 14 | | 3,306 | | NQ and HQ | | Boart Longyear |
| 2011 | | NovaGold | | 5 | | 1,193 | | NQ3 and HQ3 | | Boart Longyear |
| 2015 | | NovaCopper | | 14 | | 3,055 | | NQ and HQ | | Boart Longyear |
| 2016 | | NovaCopper | | 13 | | 3,058 | | NQ and HQ | | Boart Longyear |
| 2017 | | Trilogy Metals | | 5 | | 790 | | PQ | | Major Drilling/Tuuq Drilling |
| 2018 | | Trilogy Metals | | 24 | | 906 | | PQ | | Tuuq Drilling |
| 2019 | | Trilogy Metals | | 9 | | 2,433 | | PQ and HQ3 | | Tuuq Drilling |
| 2021 | | Ambler Metals | | 18 | | 4,131 | | PQ and HQ3 | | Tuuq Drilling |
| 2022 | | Ambler Metals | | 47 | | 8,376 | | HQ3 | | Major Drilling |
| | |
| Arctic Project | Page 99 |
| S-K 1300 Technical Report Summary | November 30, 2022 |
| | |
| | |
| | |
Sprague and Henwood used company-manufactured drill rigs during their work programs on the Project. Many of their rigs remain at the Bornite deposit and constitute a historical inventory of 1950s and 1960s exploration artifacts. The 2004 to 2011 NovaGold drill programs used a single skid-mounted LF-70 core rig, drilling HQ (63.5 mm core diameter) or NQ (47.6 mm) core. The drill was transported by skid to the various drill pads using a D-8 bulldozer located on site. The D-8 was also used in road and site preparation. Fuel, supplies, and personnel were transported by helicopter. The 2015 and 2016 NovaCopper drill programs used two helicopter-portable LF-70 core rigs, drilling HQ or NQ core. The drill was transported by helicopter to various drill pads. The 2017 Trilogy metallurgical drill program used a helicopter-portable LF-90 core rig, drilling PQ (85 mm) core to be used in future metallurgical testwork. The drill was transported by helicopter to various drill pads. In 2018, Trilogy used a helicopter-portable Duralite 1400N, drilling PQ core to be used for geotechnical studies in plant site facilities. Drilling during 2019 consisted of two helicopter-portable Duralite 1400N core rigs, drilling PQ and HQ core used for geotechnical and hydrogeological studies to support Trilogy’s 2020 FS. The 2021 Ambler Metals program was completed by Tuuq Drilling utilizing three helicopter-portable Duralite 1400N rigs for geotechnical, hydrogeological, resource conversion drilling, and to collect mineralized material for metallurgical testwork. The 2022 Ambler Metals program was completed by Major Drilling utilizing 3 helicopter-portable (2 Discovery EF-75 and 1 Longyear LF-90) rigs for geotechnical, hydrogeological, resource conversion drilling, and to collect mineralized material for metallurgical testwork.
| 7.2.3 | Drill Core Procedures |
There is only partial knowledge of specific drill core handling procedures used by Kennecott during their drill programs at the Arctic deposit. The drill data collected during the Kennecott drilling programs (1965 to 1998) were logged on paper drill logs, copies of which are stored in the Kennecott office in Salt Lake City, Utah. Electronic scanned copies of the paper logs, in PDF format, are held by Trilogy. Drill core was hydraulically split or cut with half core submitted to various assay laboratories and the remainder stored in Kennecott’s core storage facility at the Bornite Camp. Between 1965 and 1986 analyses were conducted primarily by Union Assay Office Inc. of Salt Lake City, Utah. At least six other labs were also used during that time period, but mostly as check labs or for special analytical work. ALS Minerals was used for analyses submitted by Kennecott in 1998.
| 7.2.3.2 | NovaGold/Trilogy (formerly, NovaCopper)/Ambler Metals |
Throughout Trilogy’s work programs, the following standardized core handling procedures have been implemented. Core is slung by helicopter to either the Dahl Creek (2004 to 2008) or Bornite (2011 to 2019) Camp core-logging facilities. Upon receiving a basket of core, geologists and geotechnicians first mark the location of each drilling block on the core box, and then convert footages on the blocks into metres. All further data capture is then based on metric measurements. Geotechnicians or geologists measure the intervals (or “from/to”) for each box of core using the drilling blocks and written measurements on the boxes.
Geotechnicians fill out metal tags with the hole ID, box number and “from/to”, and staple them to each core box. Geotechnicians then measure the core to calculate percent recovery and rock quality designation (RQD).
| | |
| Arctic Project | Page 100 |
| S-K 1300 Technical Report Summary | November 30, 2022 |
| | |
Geologists then mark sample intervals to capture each lithology or other geologically appropriate intervals. Geologists staple sample tags on the core boxes at the start of each sample interval and mark the core itself with a wax pencil to designate sample intervals. Sample intervals used are well within the width of the average mineralized zones in the resource area. This sampling approach is considered appropriate for the style of mineralization and alteration.
Core is logged with lithology and visual alteration features captured on observed interval breaks. Geological and geotechnical parameters are recorded based on defined sample intervals and/or drill run intervals (defined by the placement of a wooden block at the end of a core run). Logged parameters are reviewed annually and slight modifications have been made between campaigns, but generally include rock type, mineral abundance, major structures, SG, point load testing, recovery and rock quality designation measurements, and magnetic susceptibility. Mineralization data, including total sulphide (recorded as percent), sulphide type (recorded as an absolute amount), gangue and vein mineralogy are collected for each sample interval with an average interval of approximately 2 m. Structural data are collected as point data. Geotechnical data (core recovery, RQD) are collected over drill run intervals.
Drill hole data are recorded in a digital format and, after a QA/QC review, are forwarded to the Database Manager who then imports them into the master database.
After logging, the core is digitally photographed and cut in half using diamond core saws. Specific attention to core orientation is maintained during core sawing to ensure the most representative sampling. Not all core is oriented; however, core that has been oriented is identified to samplers by a line drawn down the core stick. If core was not competent, it was split by using a spoon to transfer half of the core into the sample bag.
One-half of the core is returned to the core box for storage on site and the other half is bagged and labelled for sample processing and analysis. Select specific gravity measurements are also taken (refer to 8.1.3).
| 7.2.4 | Geotechnical and Hydrogeological Drilling |
Geotechnical and hydrogeological drilling is summarized in Table 7-9 and Table 7-10. The collar locations of the geotechnical drilling and hydrogeological drilling are presented Figure 7-12 and Figure 7-13. The number of holes reported for each year are the holes that were staffed by a geotechnician and/or hydrogeologist at the rig and primary purpose was to gather geotechnical and hydrogeological data. Geotechnical data (besides PLT’s) and hydrogeological installs may have been completed on holes from other programs, such as in-fill or metallurgical holes. Triple tube core barrels were used for geotechnical drill holes in 2015, 2016, and 2019. The geotechnical and hydrogeological field and laboratory testing approach and the results are discussed in Section 13.9 and Section 17.1.5.
| Table 7-9: | Summary of Geotechnical Drilling |
| | | 2011 | | 2015 | | 2016 | | 2017 | | 2018 | | 2019 | | 2021 | | 2022 |
| Number of Holes | | 5 | | 2 | | 3 | | 11 | | 24 | | 4 | | 8 | | 5 |
| Oriented core | | X | | X | | X | | | | | | X | | X | | X |
| Water level monitoring | | X | | X | | X | | X | | X | | X | | X | | X |
| Falling head packer tests | | X | | | | | | | | | | | | | | |
| Point load tests | | X | | X | | X | | | | | | X | | X | | X |
| Uniaxial compressive strength | | | | X | | X | | | | | | X | | | | |
| Direct shear testing | | | | X | | X | | | | | | X | | X | | X |
| Modulus testing | | | | X | | X | | | | | | X | | | | |
| Triaxial testing | | | | X | | X | | | | | | X | | X | | X |
| Acoustic Televiewer | | | | | | X | | | | | | | | | | |
| Falling Head, Single or Straddle packer tests | | X | | | | X | | | | | | | | | | |
| Airlift pump test | | | | | | X | | | | | | | | | | |
| Hydraulic conductivity testing (slug testing) | | | | | | | | X | | | | | | | | |
| Cohesive and residual shear strength tests on soils | | | | | | | | X | | X | | | | | | |
| Compressive strength test on core and rock | | | | | | | | X | | X | | | | | | |
| Extended duration injection tests | | | | | | | | | | | | X | | | | |
| | |
| Arctic Project | Page 101 |
| S-K 1300 Technical Report Summary | November 30, 2022 |
| | |
| Table 7-10: | Summary of Geotechnical Drilling by Year and Purposes |
| Year | Purpose |
| 2011 | Obtain geotechnical data in areas of the deposit that may host underground infrastructure or could pose issues with underground mining. |
| 2015 | Collect geotechnical and hydrogeological data to better understand the wall rock characteristics and hydrogeology within the open pit area. |
| 2016 | Complete the 3 drill holes that were deferred/not completed from the 2015 program. |
| 2017 | Collect geotechnical and hydrogeological data for tailings management and waste rock facilities within the entire Sub Arctic Creek valley. |
| 2018 | Collect geotechnical and hydrogeological data for WRF, TMF, and surface infrastructure in the Upper Sub Arctic Creek Valley. |
| 2019 | Provide additional geotechnical and hydrogeological data for pit design for the 2020 FS |
| 2021 | Define talc horizons on east side of pit for pit design. |
| 2022 | Define extent of lower talc horizons on northeast side of pit for pit design. |
| | |
| Arctic Project | Page 102 |
| S-K 1300 Technical Report Summary | November 30, 2022 |
| | |
| Figure 7-12: | Locations of Geotechnical Drilling |
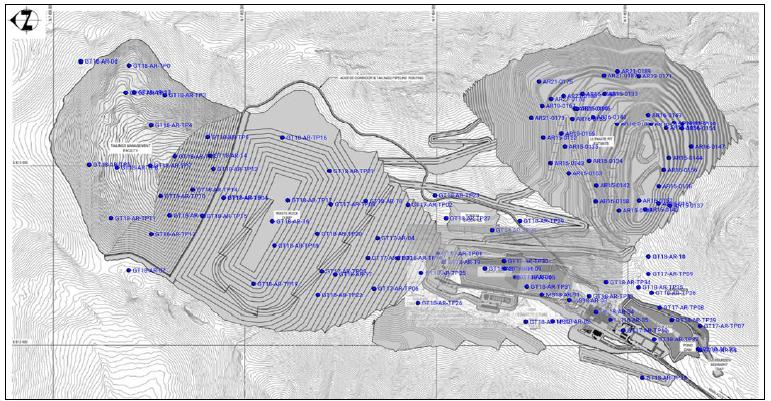
Source: SRK, 2022
| | |
| Arctic Project | Page 103 |
| S-K 1300 Technical Report Summary | November 30, 2022 |
| | |
| Figure 7-13: | Locations of Hydrogeological Drilling |

Source: SRK, 2022
Kennecott provided NovaGold with collar coordinates for all historical holes in UTM coordinates using the NAD27 datum. NovaGold re-surveyed collars of selected historical holes in 2004 and again in 2008. The re-surveys showed little variation compared to the historical surveys.
| 7.2.5.2 | NovaGold/Trilogy (formerly, NovaCopper)/Ambler Metals |
Collar location coordinates were determined for the 2004 to 2016 NovaGold/Trilogy drill campaigns with two Ashtech ProMark 2 GPS units using the Riley Vertical Angle Benchmark (VABM; 611120.442E, 7453467.486N) as the base station for all surveys. Raw GPS data were processed with Ashtech Solutions 2.60 software. All surveyed data were collected in the NAD27 datum and later converted to NAD83.
A 2010 survey by a Registered Land Surveyor from WHPa observed differences between the 2010 and historical coordinates used for the Riley VABM, which were of the same magnitude (0.5 m east, 0.1 m north and 1.0 m down) as other Arctic drill collars that were re-surveyed for the third time. A correction was applied to all Arctic drill holes based upon the newly established coordinates for the Riley VABM, together with converting from NAD27 to NAD83 datums. All post 2010 surveys are completed in NAD83.
| | |
| Arctic Project | Page 104 |
| S-K 1300 Technical Report Summary | November 30, 2022 |
| | |
During Tetra Tech’s 2013 site visit, nine drill collars were located using a Garmin™ Etrex 20 GPS unit. The difference between reported and measured positions ranged between 3.4 and 7.8 m with an average discrepancy of 4.8 m. These differences are within the tolerances expected for GPS verification.
A Registered Land Surveyor, Eric Cousino of Windy Creek Surveys, completed collar coordinate survey locations of the 2019 drilling in August 2019. The Horizontal Datum used on this project for point position determinations was NAD_83(CORS96) (EPOCH 2003), and the Vertical Datum is NAVD88 computed using Geiod09. Data were output into NAD83 Zone 4N (meters) using JAVAD Justin post-processing software.
The 2021 collars were surveyed by Layne Lewis, the Ambler Metals drill coordinator, using a Leica GS18 differential GPS system (cm-scale accuracy). Kuna Engineering surveyed the 2022 collar locations using a Trimble R12 GPS/GNSS receiver.
BCMC did not perform downhole surveys prior to 1971 (drill hole AR-32). In 1971, BCMC began to survey selected (mineralized) drill holes using a Sperry-Sun downhole survey camera usually at 30.5 m (100 ft) intervals. BCMC was able to re-enter and survey a few of the older drill holes. BCMC, and later Kennecott, applied a single azimuth (49°) and uniform dip deviation every 15.24 m (50 ft) that flattens with depth to all holes collared vertically that were not surveyed.
Downhole surveys from 2004 to 2017 were collected using either a Reflex EZ-shot camera or a Ranger single-shot tool with individual survey readings collected at the drill rig on approximately 30 to 60 m intervals. During the 2019 drill program, downhole surveys were collected using a continuous north seeking gyroscope with readings collected at the drill rig on roughly 30m intervals. Downhole surveys in 2021 were taken every 100 feet (30.5 meters) with a Reflex EZ-Trac multi-shot instrument. The magnetic declination correction from 2004 to 2021 were calculated using the NOAA Magnetic Field Calculator website and the longitude and latitude of the Arctic deposit.
The downhole survey data show a pronounced deviation of the drill holes toward an orientation more normal to the foliation.
Incomplete Kennecott data exist with regards to overall core recovery but based on 917 intervals of 3.05 m or less in the historical database, the average recovery was 92%. Kennecott RQD measurements in the 1998 program averaged 87.0%. There has been no systematic evaluation of recovery by rock type.
| 7.2.7.2 | NovaGold/Trilogy (formerly, NovaCopper)/Ambler Metals |
Core recovery during NovaGold/NovaCopper/Trilogy and Ambler Metals drill programs were good to excellent, resulting in quality samples with little to no bias. There are no other known drilling and/or recovery factors that could materially impact accuracy of the samples during this period.
| | |
| Arctic Project | Page 105 |
| S-K 1300 Technical Report Summary | November 30, 2022 |
| | |
Table 7-11 shows recoveries and RQD for each of the NovaGold/NovaCopper/Trilogy and Ambler Metals campaigns exclusive of the geotechnical drill holes in 2011 and 2021.
| Table 7-11: | Recovery and RQD 2004 to 2008 Arctic Drill Campaigns |
| Year | | Metres | | Recovery (%) | | RQD (%) | |
| 2004 | | 2,996 | | 98.0 | | 73.4 | |
| 2005 | | 3,030 | | 96.0 | | 74.4 | |
| 2007 | | 2,606 | | 95.7 | | 73.1 | |
| 2008 | | 3,306 | | 98.0 | | 80.1 | |
| 2011 | | 1,193 | | 96.0 | | 68.8 | |
| 2015 | | 3,055 | | 91.3 | | 69.0 | |
| 2016 | | 3,058 | | 91.5 | | 69.7 | |
| 2017 | | 790 | | 95.5 | | 75.0 | |
| 2019 | | 2,433 | | 96.3 | | 77.1 | |
| 2021 | | 2,282 | | 95.1 | | 70.3 | |
All drill holes at the Arctic deposit are collared on surface and are generally vertically oriented, or steeply inclined in a northeast direction. The majority of drill holes are spaced at 75 m to 100 m intervals, but there are instances where drill holes are located within 10 m of one another. Drill holes typically intersect the generally shallow-dipping mineralized horizon at approximately right angles.
Drilling at the Arctic deposit covers an area measuring roughly 1,000 m east-west by 1,000 m north south with holes that approach 750 m below surface. Significant results of the distribution of copper in drilling is shown in plan and in vertical cross-sectional views in Figure 7-14 to Figure 7-16. Significant results of the distribution of zinc in drilling is shown in plan and in vertical cross-sectional views in Figure 7-17 to Figure 7-19. These results represent a summary of the QPs interpretation of the exploration information.
| | |
| Arctic Project | Page 106 |
| S-K 1300 Technical Report Summary | November 30, 2022 |
| | |
| Figure 7-14: | Drill Plan of Arctic Copper Results |

Source: Wood, 2022
| | |
| Arctic Project | Page 107 |
| S-K 1300 Technical Report Summary | November 30, 2022 |
| | |
| Figure 7-15: | Cross-Section 1 of Arctic Copper Results Looking South |
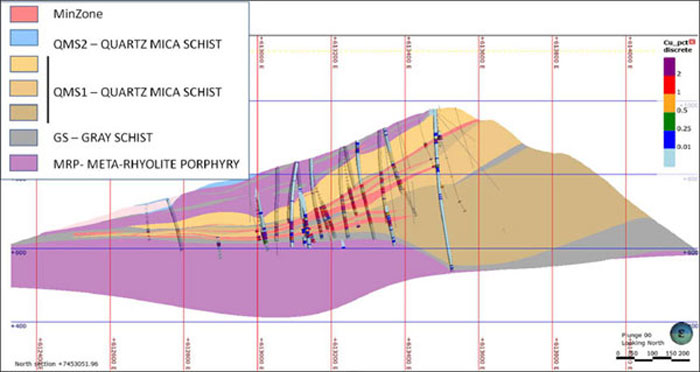
Source: Wood, 2022
| Figure 7-16: | Cross-Section 2 of Arctic Copper Results Looking South |
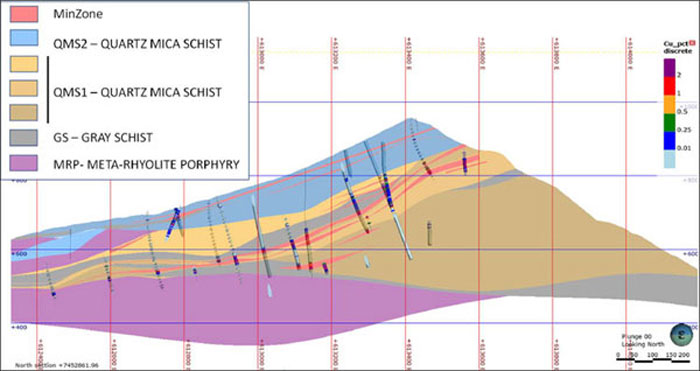
Source: Wood, 2022
| | |
| Arctic Project | Page 108 |
| S-K 1300 Technical Report Summary | November 30, 2022 |
| | |
| Figure 7-17: | Drill Plan of Arctic Zinc Results |
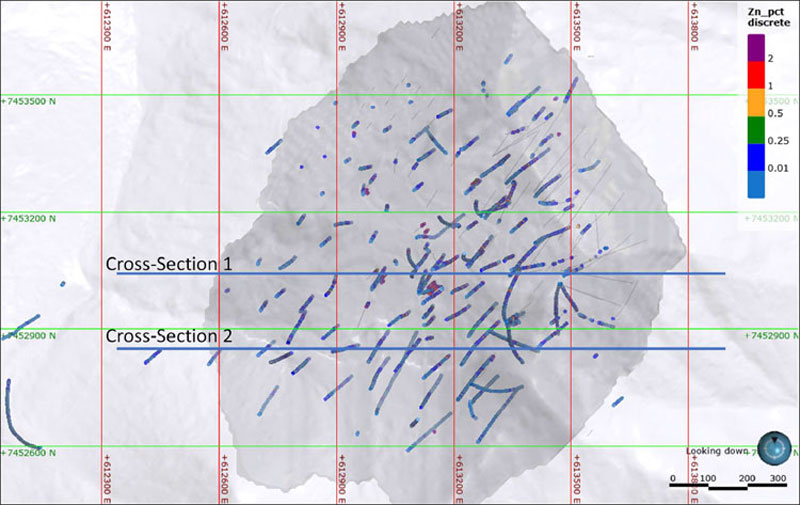
Source: Wood, 2022
| | |
| Arctic Project | Page 109 |
| S-K 1300 Technical Report Summary | November 30, 2022 |
| | |
| Figure 7-18: | Cross-Section 1 of Arctic Zinc Results Looking South |

Source: Wood, 2022
| Figure 7-19: | Cross-Section 2 of Arctic Zinc Results Looking South |

Source: Wood, 2022
| | |
| Arctic Project | Page 110 |
| S-K 1300 Technical Report Summary | November 30, 2022 |
| | |
| 8 | SAMPLE PREPARATION, ANANLYSES AND SECURITY |
The data for the Arctic deposit were generated over three primary drilling campaigns: 1966 to 1986 when BCMC, a subsidiary of Kennecott was the primary operator, 1998 when Kennecott resumed work after a long hiatus, and 2004 to present under NovaGold. Trilogy (formerly, NovaCopper), and Ambler Metals.
| 8.1.1.1 | Kennecott and BCMC |
Sampling of drill core prior to 1998 focused primarily on the mineralized zones; numerous intervals of weak to moderate mineralization were not sampled during this period. During the 1998 campaign, Kennecott did sample some broad zones of alteration and weak mineralization, but much of the unaltered and unmineralized drill core was left unsampled. Little documentation on historic sampling procedures is available.
| 8.1.1.2 | NovaGold/Trilogy (formerly, NovaCopper) |
Between 2004 and 2005, NovaGold conducted a systematic drill core re-logging and re-sampling campaign of Kennecott and BCMC era drill holes AR-09 to AR-74. NovaGold either took 1 to 2 m samples every 10 m or sampled entire lengths of previously unsampled core within a minimum of 1 m and a maximum or 3 m intervals. The objectives of the sampling were to generate a full (ICP) geochemistry dataset for the Arctic deposit and ensure continuous sampling throughout the deposit.
From 2004 to 2019, sample intervals are determined by the geological relationships observed in the core and limited to a 2.5 m maximum length and 1 m minimum length. Sample intervals terminate at lithological and mineralization boundaries. Sampling is generally continuous from the top to the bottom of the drill hole unless otherwise directed by the Exploration Manager. Occasionally, if warranted by the need for better resolution of geology or mineralization, smaller sample intervals may be employed. When the hole is in unmineralized rock, the sample length is generally 2.5 m, whereas in mineralized units, the sample lengths are shortened to 1 to 2 m.
After logging, the core was cut in half using diamond core saws. If core was not competent, it was split by using a spoon to transfer half of the core into the sample bag. One-half of the core was returned to the core box for storage on site and the other half was bagged, labelled, and sent to ALS Minerals Laboratories in Vancouver for analysis, via the (ALS preparation facility in Fairbanks Alaska) and the other half was archived in the core storage facility at the Bornite Camp facilities or at the Ambler Metals warehouse in Fairbanks. For the 2021 metallurgical holes, ¼ core was sampled for analysis at ALS, ¼ retained, and ½ sent for metallurgical testing.
Standard and Blank control samples were inserted at site into the shipments at the approximate rate of one standard reference material (standard), one blank per 17 core samples. At the Exploration Manager direction, ALS also prepared one coarse duplicate per 17 core samples. A sample tag for these duplicates was inserted into an empty sample bag at site.
| | |
| Arctic Project | Page 111 |
| S-K 1300 Technical Report Summary | November 30, 2022 |
| | |
| 8.1.2 | Acid-Base Accounting Sampling |
In 2010, SRK collected 148 samples from drill core based on their position relative to the massive and semi-massive sulphide mineralization (SRK 2011). Samples were targeted within, immediately adjacent to, adjacent to, and between lenses of mineralization; the sampling program focused on characterization for a potential underground development scenario. Samples were shipped to SGS Canada Inc., Burnaby, BC, for sample preparation and analysis. Samples were analysed for acid base accounting (ABA) and metals. ABA tests were conducted using the Sobek method with sulphur speciation and total inorganic carbon (TIC) analysis. Metal concentrations were determined using aqua regia digestion followed by ICP-MS analysis. In addition, barium and fluorine were analysed by X-ray fluorescence (XRF) following a lithium metaborate fusion.
In 2015, Trilogy retained SRK to provide metal leaching (ML) and ARD characterization services for the Arctic deposit. Activities focused on three objectives: 1) construction of on-site barrel tests and parallel humidity cells, 2) expansion of the ABA database to support future evaluation for ARD potential management for open pit mining, and 3) evaluation of the use of proxies for ABA parameters in the exploration database with the purpose of being able to use the exploration database for block modelling of ML/ARD potential, if needed. Barrel test samples were collected during July and August 2015 and eight on-site barrel tests (including two QC tests) were constructed and initiated in late August 2015. Following the set-up of the on-site barrel tests, representative composite rock samples were shipped to Maxxam Analytics of Burnaby, British Columbia and parallel humidity cells were initiated in late October 2015. Trilogy and SRK selected 321 samples to be analysed for a conventional static ABA package with a trace element scan using the same method as the exploration database (four-acid digestion). Samples were analysed by Global ARD Testing Services of Burnaby, British Columbia.
In 2016, Trilogy evaluated the distribution of the existing samples to select additional samples in preparation for block modelling of ML/ARD potential. A drill program was designed, and infill samples were collected from holes drilled in 2015 and 2016. This program was completed with 1004 samples analysed for a conventional static ABA package with a trace element scan using the same method as the exploration database. Samples were analysed by Global ARD Testing Services of Burnaby, British Columbia. The resulting data were combined with the previous datasets.
In 2018 and 2021, the kinetic test program was expanded to further characterize ML/ARD potential. Samples were selected using the exploration geochemistry database, to target drill core with geochemical characteristics representing the range of compositions present in the database for key parameters such as sulphur and selenium. Kinetic testing was initiated in 2019 and 2021 at Bureau Veritas (previously Maxxam Analytics) of Burnaby, BC, and the kinetic samples were also analysed by static methods at Bureau Veritas for ABA and metals by the same methods as the 2015 and 2016 programs, in addition to metal concentrations determined using aqua regia digestion followed by ICP-MS analysis.
As described above, several laboratories were used for acid base accounting studies and associated kinetic testwork as summarized in Table 8-1. Accreditations, where known, are listed below. All the labs are independent of NovaGold, NovaCopper, Trilogy (formerly, NovaCopper), and Ambler Metals.
| | |
| Arctic Project | Page 112 |
| S-K 1300 Technical Report Summary | November 30, 2022 |
| | |
| Table 8-1: | Analytical Laboratories used for Acid Base Accounting and Kinetic Studies for the Arctic Project |
Laboratory
Name | Laboratory
Location | Years
Used | Accreditation | Comment |
| SGS Canada Inc. | Burnaby, BC | 2010 | ISO 90001 and ISO/IEC 17025. | ABA samples |
| Global ARD Testing Services | Burnaby, BC | 2015, 2016 | ISO/IEC 17025 | ABA samples |
| ARS Aleut Analytical | Anchorage and Fairbanks, AK | 2015, 2016, 2017, 2018 | Accreditations are not known. | Barrel test leachate samples |
| Bureau Veritas (previously Maxxam Analytics) | Burnaby, BC | 2015, 2016, 2017, 2018, 2019, 2020, 2021, 2022. | ISO/IEC 17025 | ABA samples (2015 and 2019), HCTs (2015 to 2022), and barrel test leachate samples (2019-2022) |
| 8.1.3 | Density Determinations |
Representative (SG) determinations conducted before 1998 for the Arctic deposit are lacking. Little information regarding sample size, sample distribution and SG analytical methodology are recorded for determinations during this period.
In 1998, Kennecott collected 38 core samples from that year’s drill core, of which 22 were from mineralized zones and 16 from non-mineralized lithologies. Mineralized samples were defined as MS (more than 50% total sulphides), SMS (less than 50% total sulphides) or lithology samples (non-mineralized country rock containing up to 10% sulphides). SG determinations were conducted by ALS Minerals and Golder and Associates and were based on short (6 to 12 cm) whole core samples. SG was determined based on the water displacement method.
In 1999, Kennecott collected 231 samples from pre-1998 drill core for SG analysis. The samples were from NQ- and BQ-sized core and averaged 7.27 cm in length. The samples were shipped to Anchorage but were not forwarded to a laboratory.
In 2004, NovaGold forwarded the 231 samples from the pre-1998 drill campaigns stored in Kennecott’s Anchorage warehouse, as well as 33 new samples from the 2004 drill program to ALS Minerals for SG determination.
Additionally, in 2004 NovaGold collected 127 usable field SG measurements. Samples were collected from HQ-sized core and averaged 9.05 cm in length. An Ohaus Triple Beam Balance was used to determine a weight-in-air value for dried core, followed by a weight-in-water value. The wet-value was determined by suspending the sample by a wire into a water-filled bucket. The SG value was then calculated using the following formula.
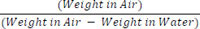
In 2011, NovaGold geologists stopped collecting short interval “point data” (as described above) within the mineralized zone, and instead collected “full-sample-width” determinations from existing 2008 split core and all of the sampled 2011 whole core. The samples averaged 1.69 m in length. Samples were collected continuously within mineralized zones and within a 2 to 3 m buffer adjacent to mineralized zones. A total of 193 measurements were collected. In 2011, 266 sample pulps were also submitted to ALS Minerals for SG determination by pycnometer analysis.
Between 2015 and 2019, Trilogy geologists collected SG data consistent with the 2011 full sample width water immersion campaign. A total of 2,406 specific gravity measurements were collected, with SG values ranging from 2.01 to 4.96. The samples averaged 1.49 m in length. Samples were collected continuously within mineralized zones and within a 2 to 3 m buffer adjacent to mineralized zones.
| | |
| Arctic Project | Page 113 |
| S-K 1300 Technical Report Summary | November 30, 2022 |
| | |
In 2021 Ambler Metals collected 830 SG measurements from half-core intervals ranging from 0.08 to 2.19 m with SG values ranging from 2.01 to 2.88. In 2022, Ambler Metals collected 2,545 SG measurements from half-core intervals ranging from 0.14 m to 2.81 m with SG values ranging from 2.79 to 5.06.
Security measures taken during historical Kennecott and BCMC programs are unknown to NovaGold, Trilogy, or Ambler Metals. Ambler Metals is not aware of any reason to suspect that any of these samples have been tampered with.
The 2004 to 2019 samples were always either in the custody of NovaGold personnel or at the assay laboratories, and the chain of custody of the samples is well documented.
The site has restricted access with only means of access via charter flight. Core is stored in a core storage yard and warehouse with the perimeter surrounded by a chain-link fence and secure locked gates. Shipment of core samples from site occurred on a drill hole by drill hole basis. Rice bags, containing two to four poly-bagged core samples each, were marked and labelled with the ALS Minerals address, project and hole number, bag number, and sample numbers enclosed. Rice bags were secured with a pre-numbered plastic security tie and a twist wire tie and then assembled into standard fish totes for transport by chartered flights on a commercial airline to Fairbanks, where they were met by a contracted expeditor for delivery directly to the ALS Minerals preparation facility in Fairbanks.
At least six laboratories were used during the Kennecott/BCMC time period, but mostly as check laboratories or for special analytical work. Accreditations are not known. The laboratories were independent of Kennecott/BCMC. Bondar Clegg, now ALS Minerals, was used for analyses conducted by Kennecott. During the BCMC work, analyses were conducted primarily by Union Assay Office Inc. of Salt Lake City, Utah.
Since 2004 NovaCopper, NovaGold, Trilogy metals, and Ambler Metals have used ALS Minerals (Fairbanks Alaska for sample preparation and Vancouver British Columbia as the primary laboratory. ALS Minerals is accredited for a number of specific test procedures including fire assay of gold by AA, ICP, or gravimetric finish, multi-element ICP and AA assays for silver, copper, lead and zinc. ALS Minerals is independent of NovaGold, NovaCopper, Trilogy, and Ambler Metals.
The laboratories used during the various exploration, infill, and step-out drill analytical programs completed on the Arctic Project are summarized in Table 8-2.
| | |
| Arctic Project | Page 114 |
| S-K 1300 Technical Report Summary | November 30, 2022 |
| | |
| Table 8-2: | Analytical Laboratories Used by Operators of the Arctic Project |
Laboratory
Name | Laboratory
Location | Years
Used | Accreditation | Comment |
Union Assay
Office, Inc. | Salt Lake City, Utah | 1968 | Accreditations are not known. | Primary Assay laboratory |
Rocky Mountain
Geochemical Corp. | South Midvale, Utah | 1973 | Accreditations are not known. | Primary and secondary assays |
Resource Associates
of Alaska, Inc. | College, Alaska | 1973, 1974 | Accreditations are not known. | Primary and secondary assays |
Georesearch
Laboratories, Inc. | Salt Lake City, Utah | 1975, 1976 | Accreditations are not known. | Primary and secondary assays |
Bondar-Clegg &
Company Ltd. | North Vancouver, BC | 1981, 1982 | Accreditations are not known. | Primary and secondary assays |
| Acme Analytical Laboratories Ltd. (AcmeLabs) | Vancouver, BC | 1998, 2011,
| Accreditations are not known. | 2012 and 2013 secondary check sample lab |
| SGS Canada Inc. | Burnaby, BC | 2010 | ISO 90001 and ISO/IEC 17025. | 2015 to 2019 secondary check lab |
| ALS Analytical Lab | Fairbanks, Alaska (prep) and Vancouver, BC (analytical) | 1998, 2004,
2005, 2006, 2007, 2008, 2011,
2012, 2013 2015, 2016, 2017, 2018, 2019 | In 2004, ALS Minerals held ISO 9002 accreditations but updated to ISO 9001 accreditations in late 2004. ISO/International Electrotechnical Commission (IEC) 17025 accreditation was obtained in 2005. | 2004 - 2019 primary assay laboratory |
| 8.1.6 | Sample Preparation and Analytical Methods |
Samples from the NovaGold/Trilogy/Ambler Metals programs were logged into a tracking system on arrival at ALS Minerals and weighed. Samples were crushed to 70% passing 2 mm, dried, and a 250 g split pulverized to greater than 85% passing 75 μm.
Samples were submitted for multielement analysis of a 0.25 gram sample by ICP MS following a 4-acid digestion, and for gold analysis of a 30 gram sample by FA with an AA finish. Over limit ICP-MS Cu, Pb, and Zn samples were resubmitted for analysis of a 0.4 gram sample by ICP-Atomic Emission Spectroscopy (AES) or AA following a 4 acid digestion. The overlimit value for Cu, Pb, and Zn is 10,000 ppm. Over limit gold results were resubmitted for analysis of a 30 gram sample by FA with a Gravimetric finish. The overlimit value for Au is 10 ppm. The Lower detection limits for Cu, Pb, and Zn by ICP-MS are 0.2 ppm, 0.5 ppm, and 2 ppm respectively. The lower detection limit for Au by FAAA is 0.05 ppm.
| | |
| Arctic Project | Page 115 |
| S-K 1300 Technical Report Summary | November 30, 2022 |
| | |
| 8.2 | Quality Assurance/Quality Control |
| 8.2.1 | Database Verification |
In 1995, Kennecott entered the drill assay data information from the geologic core logs, and the downhole collar survey data into an electronic format. In 2006, NovaGold geologists verified the geologic data from the original paper logs against the Kennecott electronic format, and then merged the data into a Microsoft SQL database.
Between December 11th and January 9th, 2013, NovaCopper and GeoSpark Consulting completed a 100% verification of the collar survey, downhole survey, and sample interval data for the Arctic resource area. 20% of the pre-2004 assay data and ~26% of the 2004 to 2008 assay data were also verified at this time. Trilogy also retained GeoSpark to generate QA/QC reports for the NovaGold era 2004 to 2008 and NovaCopper/Trilogy era 2011, 2015, 2016, 2017, and 2019 drill campaigns. All data for the Arctic resource area is stored in the GeoSpark Core Database System created and managed by GeoSpark Consulting.
| 8.2.2 | NovaGold QA/QC Review of Historical Analytical Results |
The current assay database contains results for 11,429 sample intervals including 3,077 (27%) historical hole sample intervals. Between 2004 and 2005 NovaGold completed a resampling program of historical drill holes. As a result, 85% of the assay intervals now have recent assay results from ALS Minerals. The re-assay program includes 289 re-assays of previously assayed historical hole sample intervals, representing approximately 17% of the original historical sampling program. In the database reviewed by Wood, the original Cu, Pb, and Zn values from the KCC/Utah laboratory results are given priority over ALS laboratory results for the 289 re-assay intervals. The database reviewed does not distinguish between previously sampled and newly sampled historical intervals or original and new assay values. Wood used the presence and absence of multielement analysis values to establish resampling and re-assay frequency. To determine assay priority used, Wood compared reported values to original logs.
Reduced to Major Axis (RMA) charts prepared by Wood (Figure 8-1 and Figure 8-2) which evaluates the paired original historical and re-assay values, indicates there is a 10% high bias in the historical Cu values after exclusion of 15 outliers and a 13% low bias in the historical Pb values after exclusion of 17 outliers. An inflection in the trend of the paired Cu values starting at 1% Cu may indicate the bias is related to an upper detection limit for the original assay procedure and or a change to an overlimit method. The Pb RMA chart shows a cluster of paired data with high biased original results. The low bias indicated by the RMA slope does not change after exclusion of these pairs.
| | |
| Arctic Project | Page 116 |
| S-K 1300 Technical Report Summary | November 30, 2022 |
| | |
| Figure 8-1: | Historical Cu Re-Assay RMA Chart |
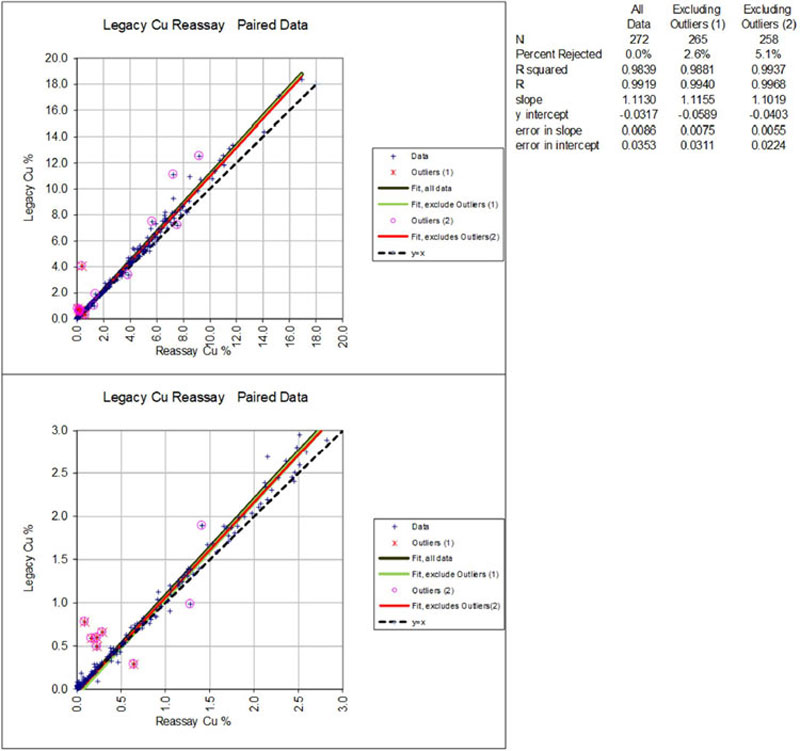
Source: Wood, 2022
| | |
| Arctic Project | Page 117 |
| S-K 1300 Technical Report Summary | November 30, 2022 |
| | |
| Figure 8-2: | Historical Pb Re-Assay RMA Chart |
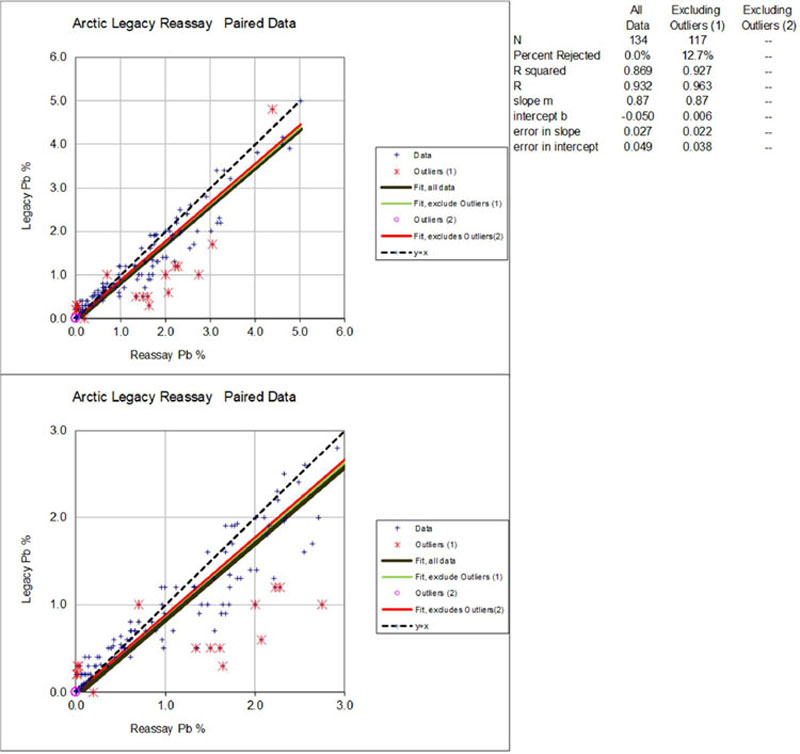
Source: Wood, 2022
The spatial distribution of the historical samples that remain as primary samples in the database is shown in Figure 8-3. These remaining historical assays are evenly distributed through the deposit area and are surrounded by assay intervals analysed since 2004. Spatial availability of QA/QC data is shown in Figure 8-4.
| | |
| Arctic Project | Page 118 |
| S-K 1300 Technical Report Summary | November 30, 2022 |
| | |
Figure 8-3: Distribution of Historical Samples with Original Laboratory Results (Original Historic Assay Intervals are Indicated in Magenta, Recent Assays are Indicated in Green)
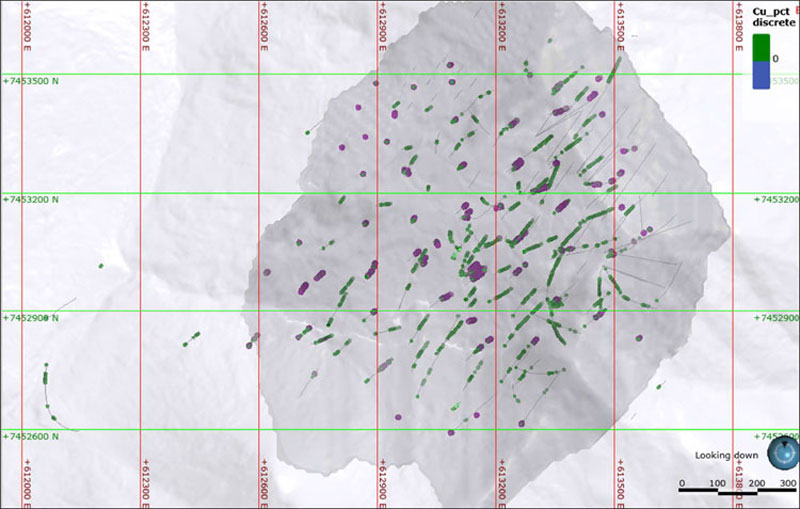
Source: Wood, 2022.
| | |
| Arctic Project | Page 119 |
| S-K 1300 Technical Report Summary | November 30, 2022 |
| | |
| Figure 8-4: | Spatial Availability of QA/QC Data |
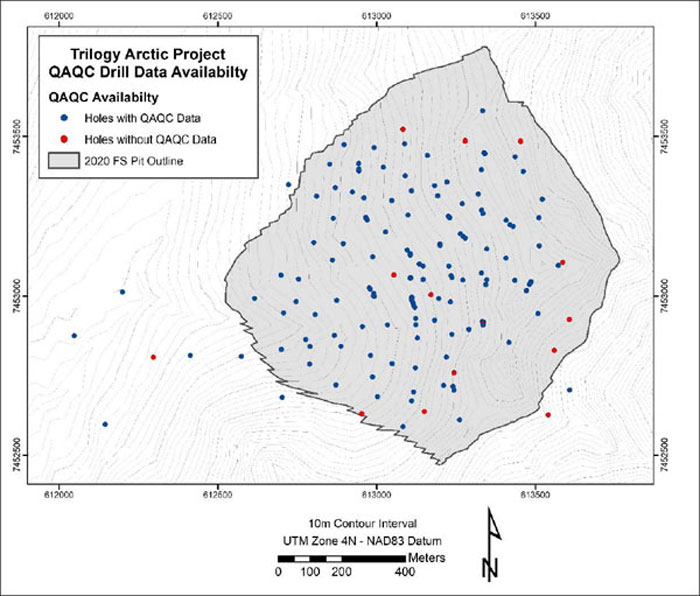
Source: Trilogy Metals, 2019.
| 8.2.3 | NovaGold/Trilogy (2004 to 2019) QA/QC Results Review |
All core and pulp reject samples submitted to the ALS Minerals laboratory since 2004 were accompanied by standard, blank and duplicate control samples. Secondary laboratory check samples were analysed at Acme in Vancouver or SGS Burnaby. The secondary laboratory check samples were selected to represent the data population using a random selection of 5% of the samples within percentile range groups.
GeoSpark has prepared several reports summarizing the control sample results received between 2004 and 2019. The reports include CRM and blank control charts, pulp duplicate absolute difference precision charts and check sample scatter and absolute difference charts. The standard and blank control sample results were defined as failing when results were in excess of plus and minus three standard deviations from the expected mean for the standard. No threshold for check samples was provided in the reports.
| | |
| Arctic Project | Page 120 |
| S-K 1300 Technical Report Summary | November 30, 2022 |
| | |
Failing blanks or standards were re-analysed along with the adjacent samples to address potential accuracy deficiencies and to maintain quality assays in the database. Initial review of the assay certificates as they were reported identified a few instances of failing standards; for any fails the adjacent samples were also rerun.
The following QA/QC sections are based on a review of those reports.
The 2004 exploration program included drilling and sampling of 11 drill holes amounting to 989 primary samples assayed within 61 assay certificates reported by ALS Minerals. The review of pulp duplicates, blanks and standards, and check control samples results showed acceptable levels of precision, accuracy, and between-laboratory bias.
The 2005 exploration program included drilling and sampling of nine drill holes, AR05-0089 through AR05-0097, amounting to 1,228 primary samples assayed within 36 assay certificates reported by ALS Minerals.
The review of pulp duplicates, blanks and standards, and check samples during allowed for inference of a reasonable level of precision, good accuracy, and insignificant levels of bias within the primary sample results reported by ALS Minerals related to the 2005 data.
This detailed QA/QC review on the analytical results reported during 2005 allowed for overall confidence in the analytical result quality.
The 2006 exploration program included drilling and sampling of 12 drill holes, AR06-98 through AR06-109, amounting to 1,175 primary samples analysed at ALS Minerals.
The review of pulp duplicates, blanks and standards, and check samples for the 2006 program allowed for inference of a good level of precision, good accuracy, and insignificant levels of bias within the primary 2006 sample results reported by ALS Minerals.
The 2007 exploration program included drilling and sampling related to four drill holes, AR07-110 through AR07-113, amounting to 950 primary samples analysed at ALS Minerals.
The review of pulp duplicates, blanks and standards, and check samples for the 2007 program allowed for inference of a good level of precision, good accuracy, and insignificant levels of bias within the primary sample results reported by ALS Minerals.
The 2008 exploration program included drilling and sampling related to 14 drill holes, AR08-0114 through AR08-0126 and drill hole AR08-0117w, amounting to 1,406 primary samples assayed within 44 assay certificates reported by ALS Minerals.
| | |
| Arctic Project | Page 121 |
| S-K 1300 Technical Report Summary | November 30, 2022 |
| | |
The review of pulp duplicates, blanks and standards, and check samples for the 2008 program allowed for inference of a reasonable level of precision, good accuracy, and insignificant levels of bias within the primary sample results reported by ALS Minerals.
| 8.2.3.6 | 2011 (analysed in 2013) |
Laboratory assay certificates FA13021131, FA13021132, FA13021133, FA13021134, and FA13021135 included results for six pulp duplicate pairs, six blank instances, and three standards. There were analysed by Geospark.
The duplicates for gold, silver, copper, lead, and zinc were found to correlate well with the primary sample results and it can be inferred that the primary results are of good precision.
Each of the blanks was analytical values within the control limits for the material. There are no issues with sample contamination and instrumentation difficulties. In addition, the accuracy can be inferred to be acceptable.
Each standard returned within the acceptable range for gold, silver, copper, lead, and zinc values; it is inferred that there is strong accuracy within the reported primary sample assay results.
A detailed review of secondary laboratory check sample results reported by ALS Minerals for the 2011 drill holes assayed in 2013 showed that the gold, silver, copper, lead, and zinc results indicated no material bias.
The 2015 exploration program included drilling and sampling related to 14 drill holes, amounting to 1,0971 primary samples primary samples analysed at ALS Minerals. The review of pulp duplicates, blanks and standards, and check control samples results showed acceptable levels of precision, accuracy, and between-laboratory bias.
The 2016 exploration program included drilling and sampling related to 13 drill holes, amounting to 1,181 primary samples primary samples analysed at ALS Minerals. The review of pulp duplicates, blanks and standards, and check control samples results showed acceptable levels of precision, accuracy, and between-laboratory bias.
The 2017 exploration program included drilling and sampling related to 5 drill holes, amounting to 313 primary samples primary samples analysed at ALS Minerals. The review of pulp duplicates, blanks and standards, and check control samples results showed acceptable levels of precision, accuracy, and between-laboratory bias.
The 2017 exploration program included drilling and sampling related to 9 drill holes, amounting to 586 primary samples primary samples analysed at ALS Minerals. The review of pulp duplicates, blanks and standards, and check control samples results showed acceptable levels of precision, accuracy, and between-laboratory bias.
| | |
| Arctic Project | Page 122 |
| S-K 1300 Technical Report Summary | November 30, 2022 |
| | |
| 8.2.4 | Density Determination QA/QC |
| 8.2.4.1 | Laboratory vs. Fields Determinations |
Paired laboratory and field determinations from for mineralized zone SG measurements from 1998 and the 2004 program show very low variation.
In 2010, NovaGold measured 50 unwaxed samples representing a full range of SG values for a variety of lithologies and then submitted the samples to ALS Minerals for wet-dry SG determinations after being sealed in wax. The mean difference between the NovaGold unwaxed and the ALS Minerals waxed SG determinations was 0.01.
In 2011, NovaGold submitted 266 pulps to ALS Minerals for determination of SG by pycnometer (ALS code OA-GRA08b). Figure 8-5 shows the paired pycnometer and whole core water immersion results compare well. The chart shows the pycnometer results display a slight low bias. Generally, intact samples are considered more acceptable for accurate SG determinations since they more closely resemble the in-situ rock mass.
| | |
| Arctic Project | Page 123 |
| S-K 1300 Technical Report Summary | November 30, 2022 |
| | |
| Figure 8-5: | Graph showing Good Agreement between Wet-Dry Measured Specific Gravity and Pycnometer Measured Specific Gravity |
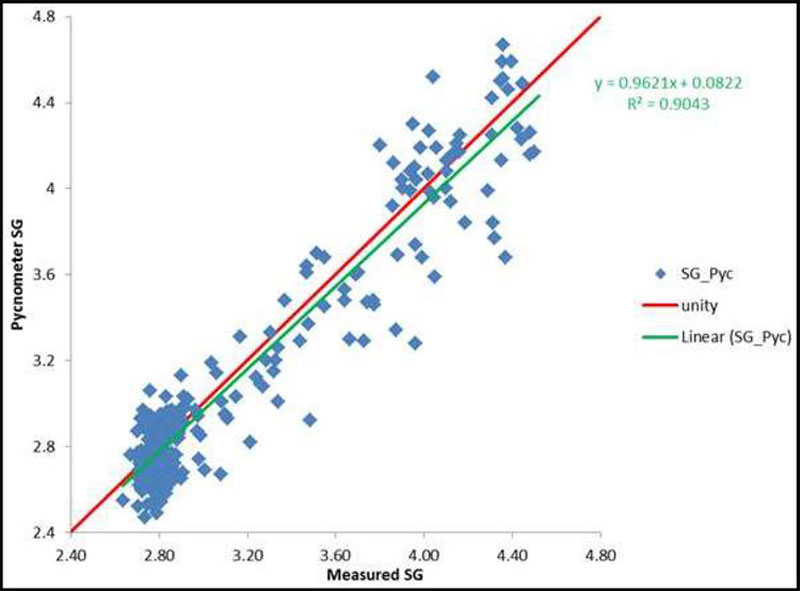
Source: West, A., 2014
| 8.2.4.2 | Stoichiometric Method |
Trilogy compared full sample length water immersion SG determinations with stoichiometric calculated SG values for 279 sample intervals that have copper, zinc, lead, iron, and XRF barium results, the major constituents of the sulphide and sulphate species for the Arctic deposit. Figure 8-6 shows That overall, there is good correlation between the two SG populations although the stoichiometric estimates are slightly lower with increasing SG.
| | |
| Arctic Project | Page 124 |
| S-K 1300 Technical Report Summary | November 30, 2022 |
| | |
| Figure 8-6: | Measured vs. Stoichiometric Specific Gravities |

Source: West, A., 2014.
| 8.2.4.3 | Multiple Regressions Method |
The best fit to the data was achieved by using the multiple regression tool in Microsoft Excel on barium, iron, zinc, and copper for the entire dataset (Figure 8-7). The estimate correlates very well (R2=0.9678) with observed data and has a sinusoidal pattern that fits the low and moderately high SG very well and has high bias for moderate SG values and a low bias for very high SG values. The resultant SG formula is as follows:
SG(Regression)= 2.567 + 0.0048*Cu(wt%) + 0.045*Fe(wt%) + 0.032*Ba(wt%) + 0.023%*Zn(wt%)
| | |
| Arctic Project | Page 125 |
| S-K 1300 Technical Report Summary | November 30, 2022 |
| | |
| Figure 8-7: | Scatter Plot Showing the Measured Specific Gravity vs. Multiple (Copper, Iron, Zinc, Barium) Regression |
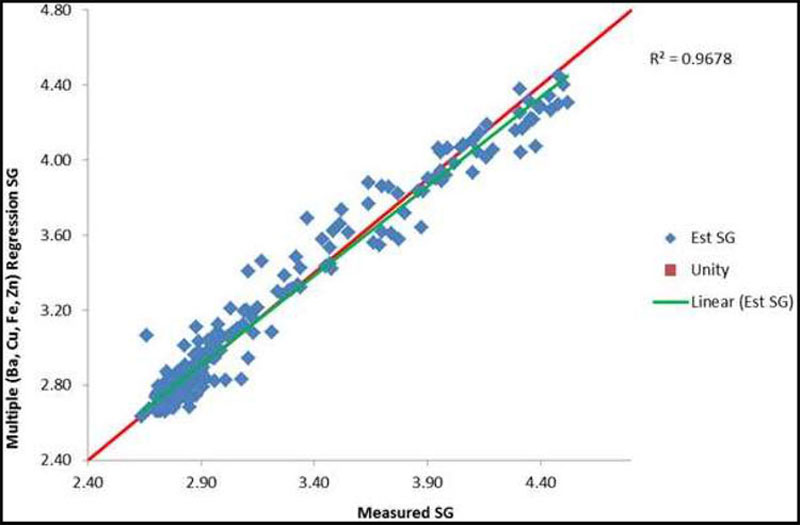
Source: West, A., 2014.
| 8.2.4.4 | Random Forest Machine Learning Method |
A random forest classification method was used to assist prediction of SG values for 12,039 sample intervals. Information regarding the inputs to the random forest method were not available for review. A comparison of 8,542 paired predicted and paired measured values shows a reasonable correlation between measured and random forest assisted prediction values but an obvious low bias low bias for predicted values (Figure 8-8). The bias is unexplained but may be a result of insufficient Ba analyses. The Random Forest predicted SG values were used in the current resource estimate and the impact of the bias is discussed in Section 11.5.1.
| | |
| Arctic Project | Page 126 |
| S-K 1300 Technical Report Summary | November 30, 2022 |
| | |
| Figure 8-8: | Reduced to Major Axis (RMA) Scatter Plot Showing the Predicted and Measured SG Values |
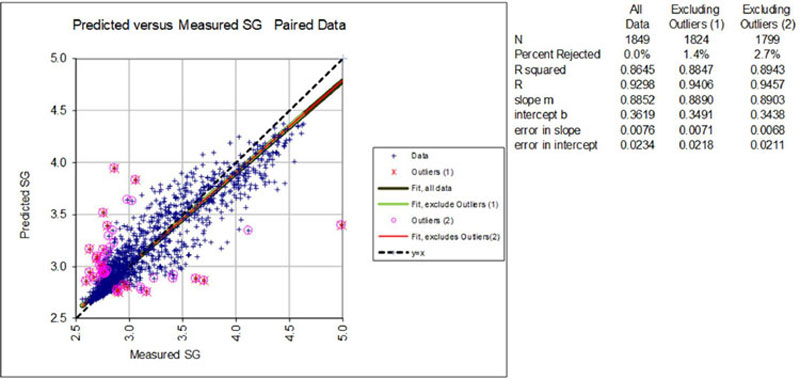
Source: Wood, 2022.
| 8.2.4.5 | Comments on Density Determinations |
Stoichiometric and multiple regression method results generally produce SG values that compare well with measured results. SG values predicted using random forest methods produce biased results. In the opinion of the QP, use of these predicted SG valued for estimation of SG in the block model may introduce a significant low bias for high SG areas.
| 8.2.5 | Acid-Base Accounting Sampling QA/QC |
SRK conducted a QA/QC review of the 2010 ABA dataset for the Arctic Project in July 2011 and concluded that data quality was acceptable.
QA/QC of the ABA dataset generated in 2015 and 2016 was conducted by SRK in November 2016 through January 2017 and data quality was concluded to be acceptable.
SRK conducted a QA/QC review of the ABA dataset from the various kinetic test samples in July 2019, June 2021, and November 2022, concluding that the data quality was acceptable.
SRK conducts monthly QA/QC review of kinetic test leachates for all operating kinetic tests. The kinetic test program also includes duplicate and blank tests. Data are reviewed for ion balance, potential contamination, reproducibility, changes in long-term trends, and anomalous spikes in the data. Where considered necessary by SRK, the laboratory is asked to rerun leachates from kinetic tests to investigate QC concerns.
| | |
| Arctic Project | Page 127 |
| S-K 1300 Technical Report Summary | November 30, 2022 |
| | |
| 8.3 | Comments on Sample Preparation, Analyses and Security |
The drill core sampling procedures at site, the primary laboratory sample preparation and analytical procedures, and the QAQC and security procedures applied by NovaGold and Trilogy for samples collected and analyzed since 2004 are in the QP’s opinion appropriate for the mineralization style observed at Arctic and provide adequate confidence in the reported assay values. Historical copper and lead values (pre 2004) that remain in the primary assay database appear to be biased high and low, respectively. The broad spatial distribution of these original historical samples and density of samples with more recent assay values surrounding these samples in the QP’s opinion reduces the risk associated with these observed biases and are suitable to be used in resource estimation.
| | |
| Arctic Project | Page 128 |
| S-K 1300 Technical Report Summary | November 30, 2022 |
| | |
Wood reviewed database verification and laboratory QA/QC reports and made data entry error spot checks, inspected down hole survey results for anomalous kinks and excessive bends in the drill hole traces, reviewed reports summarizing the results of drill core sampling and assaying completed since 2004, reviewed the assay database for gaps and overlaps, and reviewed the historical re-assay program results. The following two significant issues were observed:
| • | A significant high bias in historic Cu and low bias in historic Pb assay results (see Section 8). |
| • | Apparent low bias in Random Forest assisted specific gravity predictions (see Section 8). |
Excessive between-survey deviation was observed in 30 historical drill holes and transcription errors related to priority of KCC/Utah laboratory assay results were observed in two randomly selected holes. Database adjustments by NovaGold and NovaCopper include resurvey and transformation of historical hole collar coordinates from UTM NAD27 feet to UTM NAD83 metres, historical down hole survey bearings from quadrant to azimuth and down hole survey depth from feet to metres, and gold and silver results from ounces per ton to grams per tonne. A spot comparison comparing original result documents and the database revealed transcription errors and inconsistencies in data selection priority. In the QP’s opinion, these issues are not expected to have a material impact on the grade estimation but should be resolved in the next model.
In the current assay table historical sample interval assay results are given priority over the historic sample interval re-assay results. In the QP’s opinion, this is not expected to have a material impact on the grade estimation but using the re-assay results would further mitigate the risk associated with the observed biases in the historical Cu and Pb values, as discussed in Section 8.
There are no QAQC analysis for the deleterious variables (As, Sb, Cd, Hg, Fe, S).
Overall, the database verification and management and the laboratory QAQC monitoring completed by NovaGold, Trilogy and Ambler Metals has resulted in a reasonably reliable drill hole database suitable for supporting the Mineral Resource estimated for the Arctic deposit. Some deficiencies exist that when rectified will make the drill hole database even more robust.
As referenced in Section 6, the interplay between the complex local stratigraphy, the isoclinal F1 event, the overturned south verging F2 event and the series of post-penetrative deformational events often makes district geological interpretation extremely difficult at a local scale. The current geological model captures the complexity reasonably well, but it is possible there is more variability at the local scale than is modelled. Tight spaced drilling in key areas of the deposit is warranted.
| 9.1 | Comments on Data Verification |
It is the QP’s opinion that the drill database and topographic information for the Arctic deposit are reliable and sufficient to support the current estimate of Mineral Resources.
| | |
| Arctic Project | Page 129 |
| S-K 1300 Technical Report Summary | November 30, 2022 |
| | |
| 10 | MINERAL PROCESSING AND METALLURGICAL TESTING |
Metallurgical studies have spanned over 30 years with metallurgical testwork campaigns undertaken at the Kennecott Research Centre (KRC) in Salt Lake City, Utah; Lakefield Research Ltd., Lakefield Ontario (Lakefield); SGS Mineral Services, Burnaby, BC (SGS); and ALS Metallurgy, Kamloops, B.C. (ALS Metallurgy). Metallurgical testwork laboratories are typically not accredited. The KRC was not independent of Kennecott at the time the testwork was completed; all other laboratories were and are independent of NovaGold, Trilogy and Ambler Metals.
The current accreditation status of the KRC is unknown. Lakefield joined the SGS group in 2002. SGS and ALS Metallurgy conform to the requirements of ISO/IEC 17025 for specific tests as listed on their respective scope of accreditation documents, which can be found at www.scc.ca/en/search/laboratories.
The testwork conducted in 2012 through 2019 was under the technical direction of International Metallurgical and Environmental Inc (IME). Testwork prior to 2012 is considered historical in nature and has provided some guidance to the project development but is not used in any predictive manner or used in the generation of design criteria. The testwork was focused on a conventional process flowsheet employing crushing, grinding, bulk flotation of a copper and lead concentrate, flotation of a zinc concentrate and the subsequent separation of copper and lead values via flotation.
Various metallurgical testwork programs were conducted in 2021 through 2022 at ALS Metallurgy, SGS, and Metso-Outotec Group (Metso Group). ALS Metallurgy completed several testwork programs, including flotation testing with the pre-flotation circuit only to establish talc performance; further flowsheet development testwork to investigate the benefits of sequential flotation versus the original bulk flow sheet; and a variability testwork to support the development of improved metallurgical recovery models.
SGS conducted SAG Power Index (SPI®) tests to investigate the effect of friable ores on the plant throughput.
Metso Group conducted talc circuit modelling using the data obtained from the ALS Metallurgy pre-flotation testwork program to investigate the benefits of talc circuit open and closed-circuit cleaning. The Mesto Group also conducted dewatering and filtration testwork on the pre-flotation concentrate and final tailings generated from the pre-flotation testwork program.
The LOM average metallurgical performance forecasts, based on recent testwork completed and expected mine production grades is shown in Table 10-1. This overall project metallurgical accounting is based on locked cycle testwork, conducted on a distribution of samples from the deposit. Since 2012, testwork has been focused on optimizing the performance of the recommended flowsheet.
| | |
| Arctic Project | Page 130 |
| S-K 1300 Technical Report Summary | November 30, 2022 |
| | |
| Table 10-1: | Summary of Overall Forecast Metal Recovery – Arctic Deposit |
| | | | | | Concentrate Grade | | | Metal Recoveries | |
| Process Stream | | Mass
% | | | Cu
% | | | Pb
% | | | Zn
% | | | Au
g/t | | | Ag
g/t | | | Cu
% | | | Pb
% | | | Zn
% | | | Au
% | | | Ag
% | |
| Process Feed | | | 100.0 | | | | 2.11 | | | | 0.56 | | | | 2.90 | | | | 0.42 | | | | 31.8 | | | | - | | | | - | | | | - | | | | - | | | | - | |
| Copper Conc. | | | 6.3 | | | | 30.3 | | | | 1.7 | | | | 0.7 | | | | 3.4 | | | | 160.5 | | | | 92.1 | | | | 19.4 | | | | 1.6 | | | | 52.2 | | | | 32.4 | |
| Lead Conc. | | | 0.6 | | | | 2.0 | | | | 53.9 | | | | 5.9 | | | | 14.1 | | | | 2425.8 | | | | 0.6 | | | | 61.3 | | | | 1.3 | | | | 21.4 | | | | 48.8 | |
| Zinc Conc. | | | 4.7 | | | | 1.0 | | | | 0.5 | | | | 53.6 | | | | 0.3 | | | | 38.3 | | | | 2.2 | | | | 4.4 | | | | 88.4 | | | | 3.2 | | | | 5.7 | |
| Tailings | | | 88.4 | | | | 0.1 | | | | 0.1 | | | | 0.3 | | | | 0.1 | | | | 4.6 | | | | 5.1 | | | | 14.8 | | | | 8.7 | | | | 23.2 | | | | 13.1 | |
A summary of the testwork programs completed for the Arctic Project, dates of testwork and testwork objectives is shown in Table 10-2.
| Table 10-2: | Summary of Testwork Chronology and Reporting |
| Laboratory | | | Project No. | | | Report Date | | | Testwork Objectives | |
| Historical Testwork |
| KRC | - | 1970-1976 | Preliminary mineralogy and flotation testing |
| Testwork from 2012 to 2019 |
| Lakefield | - | 1999 | Preliminary flotation testwork. |
| SGS Burnaby | 50173-001 | Oct. 4, 2012 | Flotation scoping and locked cycle testing (LCT), Bond work index, (BWi), using 4 large composite samples |
| ALS Metallurgy | KM5000 | Mar. 27, 2017 | Flotation scoping and LC Testing, BWi, using a master composite and 14 variability samples, preliminary copper/lead separation testwork. |
| ALS Metallurgy | KM5372 | July 11, 2017 | Additional copper/lead separation testwork and detailed precious metal mineralogy |
| ALS Metallurgy | KM5567 | Feb. 26, 2018 | Talc optimization testwork and copper/lead separation testwork. |
| JKTech | 18017/P14 | July 2018 | Drop Weight testing of Comp. sample |
| JKTech | 19017/P16 | Sept. 2019 | SMC testing of Variability Samples |
| Inter. Metallurgy | - | April 22, 2019 | Cyanide destruction testwork |
| Pocock Industrial | - | August 2019 | Thickening and filtration testing |
| Testwork from 2021 to 2022 |
| Metso-Outotec Group | - | Nov. 3, 2021 | Talc pre-flotation simulations |
| Metso-Outotec Group | 93730- TQ1-TM001-R0 | Oct 8, 2021 | Dewatering testing for Talc concentrate and final tailings. |
| Metso-Outotec Group | 93720- TQ1-TM001-R1 | Oct 13, 2021 | Filtration testing for Talc concentrate and final tailings. |
| ALS Metallurgy | KM6442 | Dec. 15, 2021 | Talc optimization testwork |
| SGS Burnaby | 19157-01 | June 3, 2022 | SAG Power Index testing on 15 samples |
| ALS Metallurgy | KM6498 | May 24, 2022 | Flotation development testwork |
| ALS Metallurgy | KM6498 | July 14, 2022 | Flotation development and Variability testwork |
Detailed testwork has concluded that the mineralization is well-suited to the production of separate copper, lead and zinc concentrates. There are no significant metallurgical impediments outside of the presence of talc minerals and fluorine levels in the lead concentrates as observed in the various testwork programs. The presence of naturally hydrophobic talc minerals was consistently observed, and talc can be effectively removed from the flotation process prior to base metal flotation. There is little reason to expect concentrates will be impaired by talc contamination as talc can be effectively removed from the base metal flotation process, mitigating the potential of talc diluting the base metal concentrates. Talc and fluorine levels will be managed by optimization of the talc pre-float circuit, effectively removing talc and fluorine to ensure the quality of the lead concentrate.
| | |
| Arctic Project | Page 131 |
| S-K 1300 Technical Report Summary | November 30, 2022 |
| | |
The flotation process uses industry standard flotation processes, with three major rougher flotation stages and re-grinding and flotation cleaning of copper/lead bulk concentrates and zinc concentrates. Copper and lead are separated from a bulk copper and lead concentrate. Testwork was broken into separate phases, with copper/lead separation being a key distinct phase of testing in the later stages of the program. The full-scale metal recovery and upgrading process can be well-managed with modern process control and ensuring that variability of feed grades, including talc content, can be accommodated.
Ancillary testwork including solid-liquid separation and cyanide detoxification testwork was completed.
| 10.2 | Historical Testwork Review |
| 10.2.1 | Metallurgical Testing – Kennecott Research Centre (1968 to 1976) |
Between 1970 and 1976, KRC conducted two initial mineralogical studies to evaluate and identify the potential beneficiation or metallurgical options. This early work was a cornerstone of planning later phases of testwork.
In the 1970 mineralogy investigation, KRC reported that the host rock of the mineralization is generally muscovite, chlorite, or talc schist. Principal economic minerals in the deposit were identified as chalcopyrite, sphalerite, and argentiferous galena.
The grain sizes of sulphide mineral particles ranged from sub-micron to a maximum of several centimetres; most of the sulphide particles were relatively large (coarser than 74 µm). KRC noted that the target sulphide minerals should be liberated from gangue at a primary grind size of 100% passing 100 mesh.
In 1976, KRC conducted preliminary comminution testwork using the standard BWi determination procedure (refer to discussion in Section 10.3.4).
Between 1968 and 1976, KRC carried out initial flotation testing. The focus was on selective flotation to provide separate copper, lead, and zinc concentrates for conventional smelting. In 1968, initial amenability testing was conducted on core composites from eight diamond drill holes (which is not available to review). Other tests were conducted in 1972 on four composites from three additional diamond core holes. The laboratory-scale tests conducted between 1968 and 1976 included the conventional selective flotation approach to produce separate lead, copper, and zinc concentrates.
The major problem encountered for the tests by KRC was the separation between lead and copper minerals, and the reduction of zinc deportment to the copper and lead concentrates. The copper concentrates produced from open circuit tests contained 30 to 32.4% Cu, 0.45 to 3.48% Zn and 0.15% to 1.31% Pb. The copper recoveries were < 80.7%. The lead concentrate grades were low, ranging from 17.1 to 36.5%.
Sphalerite flotation was generally efficient, producing zinc flotation concentrates grading approximately 55% zinc. Because of the low gold content of the test samples, no appraisal was made of gold recoveries.
| | |
| Arctic Project | Page 132 |
| S-K 1300 Technical Report Summary | November 30, 2022 |
| | |
From 1975 and 1976, large diameter cores from 14 drill holes were used for more detailed testing. Two composites labelled as Composite No. 1 (Eastern Zone) and Composite No. 2 (Western Zone), were prepared. The test program included bench-scale testing of various process parameters for sequential flotation, including locked cycle tests. A talc flotation step prior to sulphide flotation was considered to be necessary, as previously established. It was determined that chalcopyrite and sphalerite could be recovered into separate commercial grade copper and zinc concentrates. However, the production of a selective high-grade lead concentrate was not successful.
Using zinc sulphate and sodium bisulphate to suppress galena and sphalerite, 90% of the copper was recovered into a concentrate containing 26% Cu, 1.5% Pb, and 6% Zn. KRC indicated that because of close interlocking of chalcopyrite and sphalerite, the zinc content of the copper concentrate could not be reduced to below 6% without sacrifice of copper recovery.
Only low-grade silver-bearing lead concentrates were obtained. Under the best test conditions, approximately 65% of the silver reported to the low-grade lead concentrate. Some of the silver in the mineralization occurred as tetrahedrite, which was recovered to the copper concentrate. The KRC testwork did not focus on bulk copper and lead flotation and the attempt to focus on a sequential copper-lead-zinc flowsheet is considered a technical error. Subsequent testwork moved to a bulk copper-lead flotation process and subsequent separation of a bulk concentrate into copper and lead concentrates. Metallurgical results have improved with the change to a bulk copper-lead flowsheet in later testwork.
| 10.2.2 | Metallurgical Testwork – Lakefield (1998 to 1999) |
In 1998, Lakefield conducted a metallurgical test program to confirm and improve upon the results from the KRC testwork program. The Lakefield work was carried out on test composites prepared from three separate drill holes. The test composite from the upper portion of AR-72 was identified as being low in talc content; however, composites from the lower portion of AR-72 were high in talc content, as were AR-74 and AR-75. The head analyses for the respective resulting test composites are summarized in Table 10-3.
| Table 10-3: | Head Analysis, Lakefield Research 1999 |
| Composite | | Talc | | | Cu
(%) | | | Zn
(%) | | | Pb
(%) | | | Fe
(%) | | | Au
(g/t) | | | Ag
(g/t) | | | ST
(g/t) | |
| Hole #72 – Upper | | Low | | | | 5.28 | | | | 7.16 | | | | 1.86 | | | | 15.6 | | | | 1.14 | | | | 72.3 | | | | 23.4 | |
| Hole #72 – Lower | | High | | | | 2.68 | | | | 5.85 | | | | 1.34 | | | | 13.0 | | | | 1.60 | | | | 75.9 | | | | 16.9 | |
| Hole #74 | | High | | | | 2.46 | | | | 4.43 | | | | 0.90 | | | | 17.0 | | | | 1.55 | | | | 45.1 | | | | 23.7 | |
| Hole #75 | | High | | | | 2.35 | | | | 8.36 | | | | 1.95 | | | | 15.7 | | | | 1.23 | | | | 77.3 | | | | 21.8 | |
Lakefield conducted a series of five flotation tests using a flowsheet similar to the one adopted in the 2012–2019 testwork and incorporated a bulk copper-lead flotation stage followed by copper and lead separation.
The bulk copper-lead rougher concentrate was reground and subjected to two stages of cleaner flotation and one stage of copper and lead separation, using zinc oxide and sodium cyanide to depress the copper while floating the lead. The resulting lead rougher concentrate was upgraded with two stages of cleaner flotation to produce the final lead concentrate. The lead rougher flotation tailings were the final copper concentrate.
| | |
| Arctic Project | Page 133 |
| S-K 1300 Technical Report Summary | November 30, 2022 |
| | |
The zinc rougher concentrate was reground and upgraded with two stages of cleaner flotation. The results of the best open circuit flotation test for the low talc composite are summarized in Table 10-4. The test results are indicative of the results obtained later in test programs and optimization of the process would improve these results. Of note, is the high recovery of precious metals to the lead concentrates, which was also confirmed in later testwork programs.
| Table 10-4: | Flotation Test on Ambler Low Talc Composite |
| | | | | | Assays | | | Distribution (%) | |
| Item | | Weight
(%) | | | Cu
(%) | | | Pb
(%) | | | Zn
(%) | | | Au
(g/t) | | | Ag
(g/t) | | | Cu | | | Pb | | | Zn | | | Au | | | Ag | |
| Lead Concentrate | | | 2.22 | | | | 6.5 | | | | 58.8 | | | | 3.43 | | | | 38.9 | | | | 1,703 | | | | 2.7 | | | | 68.1 | | | | 1.1 | | | | 48.7 | | | | 47.3 | |
| Copper Concentrate* | | | 15.76 | | | | 29.1 | | | | 1.2 | | | | 2.61 | | | | 1.23 | | | | 73.5 | | | | 86.8 | | | | 9.8 | | | | 5.7 | | | | 10.9 | | | | 14.5 | |
| Zinc Concentrate | | | 9.91 | | | | 0.44 | | | | 0.36 | | | | 59.1 | | | | 0.65 | | | | 14.7 | | | | 0.8 | | | | 1.9 | | | | 81.1 | | | | 3.6 | | | | 1.8 | |
| Zinc Tailings** | | | 61.6 | | | | 0.11 | | | | 0.13 | | | | 0.22 | | | | 0.4 | | | | 3.47 | | | | 1.2 | | | | 4.3 | | | | 1.9 | | | | 13.7 | | | | 2.7 | |
| Head (Calculation) | | | 100.0 | | | | 5.28 | | | | 1.92 | | | | 7.21 | | | | 1.78 | | | | 80.1 | | | | 100.0 | | | | 100.0 | | | | 100.0 | | | | 100.0 | | | | 100.0 | |
Notes:
*Pb Rougher Tailings
**Does not include intermediate cleaner tailings.
Lakefield also conducted flotation tests on each of the high talc composites using a test procedure similar to the one used for the low talc composite, with the exception that carboxymethyl cellulose (CMC) was added as a depressant for talc. The results of these tests showed that the presence of talc had a significant negative impact on the copper and lead mineral recoveries. Lakefield also used talc pre-flotation prior to sulphide flotation in an effort to reduce talc effect on base metal flotation. It appears that the talc pre-flotation improved copper and lead metallurgical performances. However, the test results showed that elevated talc content had a significant effect in copper and lead flotation response.
In the test report, Lakefield also concluded that grind particle size as coarse as approximately 80% passing 74 µm provided good results.
| 10.3 | Mineralogical and Metallurgical Testwork – 2012 to 2019 |
Testwork conducted prior to 2012 is considered relevant to the Arctic Project, but predictive metallurgical performance is best estimated from testwork conducted on sample materials obtained from exploration work under the direction of Trilogy, conducted from 2012 to 2019 (refer to Table 10 2).
| | |
| Arctic Project | Page 134 |
| S-K 1300 Technical Report Summary | November 30, 2022 |
| | |
In 2012, SGS conducted a test program on the samples produced from mineralization zones 1, 2, 3, and 5. Drill core samples were composited from each of the zones into four different samples for the SGS testwork which included process mineralogical examination, grindability and flotation tests.
SGS used quantitative evaluation of materials by scanning electron microscopy QEMSCAN™, to develop grade limiting/recovery relationships for the composites.
Standard Bond grindability tests were also conducted on five selected samples to determine the BWi and abrasion index (Ai).
The flotation testwork investigated the effect of various process conditions on copper, lead and zinc recovery using copper-lead bulk flotation and zinc flotation followed by copper and lead separation. The testwork conducted in 2012 at SGS forms the basis for predicting metallurgical performance of the mineralized zone in terms of recovery of copper and lead to a bulk concentrate as well as predicting zinc recovery to a zinc concentrate.
In 2017, testwork moved to ALS Metallurgy and was focused on predicting the expected performance of the proposed copper and lead separation process, which required the use of larger test samples. A pilot plant was operated to generate approximately 50 kg of copper and lead concentrate, which became test sample material for use in locked cycle testing of the copper and lead separation process. This testwork allows for the accurate prediction of copper and lead deportment in the process as well as provided detailed analysis of the final copper and lead concentrates, expected from the process. Additional metallurgical testwork in the form of variability samples being subject to grindability and baseline flotation tests was also completed.
The 2012 test program used 90 individual drill core sample intervals totalling 1,100 kg. Individual samples were combined into four composites representing different zones and labelled as Composites Zone 1 & 2, Zone 3, Zone 5, and Zone 3 & 5. The sample materials used in the 2012 test program at SGS were specifically obtained for metallurgical test purposes. The drill cores were stored in a freezer to ensure sample degradation and oxidation of sulphide minerals did not occur.
The head grades of the composites from the 2012 SGS testwork program is shown in Table 10-5.
| Table 10-5: | SGS Burnaby Head Grades – Composite Samples – 2012 |
| Sample | | Cu
(%) | | | Pb
(%) | | | Zn
(%) | | | Fe
(%) | | | S
(%) | | | Au
(g/t) | | | Ag
(g/t) | | | MgO
(%) | |
| Zone 1 & 2 | | | 2.63 | | | | 0.95 | | | | 3.43 | | | | 7.73 | | | | 8.36 | | | | 0.79 | | | | 57.6 | | | | 5.78 | |
| Zone 3 | | | 3.56 | | | | 1.73 | | | | 8.58 | | | | 17.5 | | | | 25.8 | | | | 0.67 | | | | 80.4 | | | | 1.94 | |
| Zone 3 & 5 | | | 4.41 | | | | 1.60 | | | | 7.76 | | | | 16.7 | | | | 23.5 | | | | 0.97 | | | | 82.0 | | | | 3.96 | |
| Zone 5 B | | | 2.56 | | | | 1.33 | | | | 5.68 | | | | 15.8 | | | | 21.2 | | | | 1.16 | | | | 63.0 | | | | 0.90 | |
The 2017 test program involved the collection of approximately 4,000 kg of drill core from five drill holes. The core was shipped in its entirety to ALS Metallurgy for use in grinding and flotation testwork. Fifteen separate composites samples were generated by crushing defined intercepts of mineralization. These samples were riffle split to generate 15 individual samples which were separately tested for grindability and flotation response, as well, a large portion of each sample was blended to make a single large composite sample for use in copper-lead separation testwork. The copper-lead separation testwork involved operating a pilot plant for the production of a single sample of copper/lead concentrate which was then used in bench-scale flotation testing, including open circuit flotation tests as well as locked cycle flotation tests.
| | |
| Arctic Project | Page 135 |
| S-K 1300 Technical Report Summary | November 30, 2022 |
| | |
The feed grades of samples used in the 2017 testwork program at ALS Metallurgy are shown in Table 10-6.
| Table 10-6: | ALS Metallurgy Head Grades – Composite Samples – 2017 |
| Sample ID | | Cu
(%) | | | Pb
(%) | | | Zn
(%) | | | Fe
(%) | | | S
(%) | | | Au
(g/t) | | | Ag
(g/t) | | | Mg (%) | |
| Var. Comp 1 | | | 5.05 | | | | 1.53 | | | | 7.40 | | | | 15.0 | | | | 24.4 | | | | 0.68 | | | | 64 | | | | 2.69 | |
| Var. Comp 2 | | | 2.06 | | | | 0.25 | | | | 1.05 | | | | 4.6 | | | | 3.68 | | | | 0.52 | | | | 34 | | | | 11.2 | |
| Var. Comp 3 | | | 1.67 | | | | 0.80 | | | | 2.93 | | | | 6.6 | | | | 4.93 | | | | 0.10 | | | | 43 | | | | 7.51 | |
| Var. Comp 4 | | | 2.25 | | | | 0.24 | | | | 3.15 | | | | 13.1 | | | | 16.2 | | | | 0.20 | | | | 18 | | | | 6.26 | |
| Var. Comp 5 | | | 3.68 | | | | 1.01 | | | | 5.55 | | | | 10.6 | | | | 13.9 | | | | 0.78 | | | | 69 | | | | 7.16 | |
| Var. Comp 6 | | | 1.02 | | | | 0.36 | | | | 1.61 | | | | 8.0 | | | | 9.45 | | | | 0.45 | | | | 24 | | | | 1.92 | |
| Var. Comp 7 | | | 1.75 | | | | 0.58 | | | | 2.71 | | | | 8.9 | | | | 12.9 | | | | 0.21 | | | | 32 | | | | 3.46 | |
| Var. Comp 8 | | | 3.00 | | | | 0.68 | | | | 4.65 | | | | 10.0 | | | | 13.3 | | | | 0.75 | | | | 56 | | | | 9.18 | |
| Var. Comp 9 | | | 5.46 | | | | 1.37 | | | | 6.60 | | | | 9.2 | | | | 14.0 | | | | 0.15 | | | | 50 | | | | 5.65 | |
| Var. Comp 10 | | | 4.16 | | | | 1.24 | | | | 5.63 | | | | 13.4 | | | | 22.1 | | | | 0.06 | | | | 34 | | | | 3.58 | |
| Var. Comp 11 | | | 2.78 | | | | 0.40 | | | | 4.56 | | | | 12.7 | | | | 16.9 | | | | 0.64 | | | | 40 | | | | 6.84 | |
| Var. Comp 12 | | | 1.53 | | | | 0.07 | | | | 0.56 | | | | 4.4 | | | | 3.15 | | | | 0.59 | | | | 16 | | | | 10.6 | |
| Var. Comp 13 | | | 1.98 | | | | 0.30 | | | | 1.48 | | | | 6.2 | | | | 6.25 | | | | 0.26 | | | | 38 | | | | 9.61 | |
| Var. Comp 14 | | | 2.37 | | | | 2.43 | | | | 9.50 | | | | 15.1 | | | | 23.7 | | | | 0.84 | | | | 62 | | | | 0.81 | |
| PP Comp. | | | 2.92 | | | | 0.86 | | | | 4.66 | | | | 10.8 | | | | 13.8 | | | | 0.56 | | | | 41 | | | | 5.93 | |
Shown in Figure 10 1 are the copper and zinc grades of the SGS and ALS Metallurgy testwork samples compared to the designed plant feed grades. The ALS Metallurgy samples are more representative of the expected mine production due to the lower range of copper and zinc grades that are available. There is a strong correlation between copper and zinc grades within the test samples. The metallurgical balance shown in Table 10-1 is based on LOM feed grades and is consistent with the LOM data point shown in Figure 10-1.
Shown in Figure 10 2 are the copper and lead grades of the various test samples used in the ALS Metallurgy and SGS test programs. There is a consistent copper to lead ratio of approximately 3.5–4.5 within the test samples and the LOM grades are shown to be within the distribution of test samples.
| | |
| Arctic Project | Page 136 |
| S-K 1300 Technical Report Summary | November 30, 2022 |
| | |
| Figure 10-1: | Cu and Zn Test Sample Grades for ALS Metallurgy/SGS Burnaby Programs |
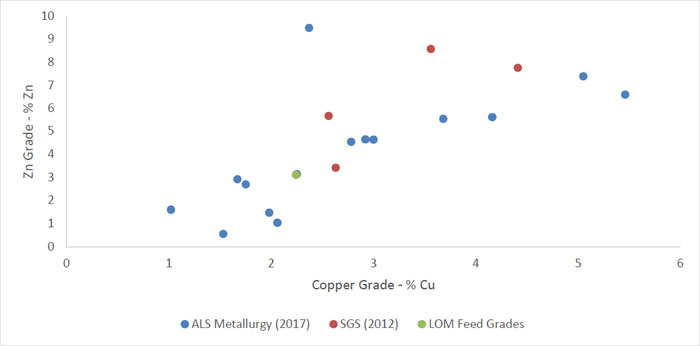
Source: Austin, 2020.
| Figure 10-2: | Cu and Pb Test Sample Grades for ALS Metallurgy/SGS Burnaby Programs |

Source: Austin, 2020.
| | |
| Arctic Project | Page 137 |
| S-K 1300 Technical Report Summary | November 30, 2022 |
| | |
| | |
| | |
The volume of talc observed in the various test samples ranged from a low of zero contained talc to a high of 42% by weight floatable talc. Shown in Figure 10-3 is the distribution of talc within both the SGS and ALS Metallurgy samples. The estimated LOM talc content is estimated at 5.1%. Only one of the SGS test samples exceeded the LOM talc content, while 11 of the 14 ALS Metallurgy samples exceeded the LOM talc content. A composite of the ALS Metallurgy samples was approximately twice the talc content of the expected mine production. Talc, while a significant issue for the flotation process is likely overestimated in terms of its potential negative impact, owing to the large number of high talc samples seen in the ALS Metallurgy sample set. It has also been clearly demonstrated that even high volumes of talc can be effectively removed from the base metal flotation process and remove the impact of talc diluting base metal concentrates.
| Figure 10-3: | Distribution of Talc Content within the 2012 and 2017 Test Samples |
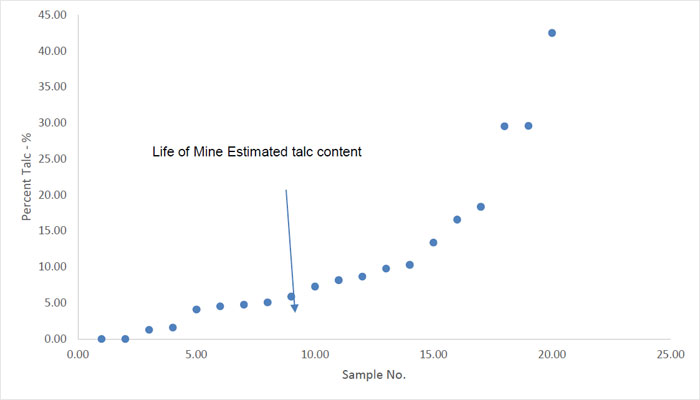
Source: Austin, 2020.
| 10.3.3 | Mineralogical Investigations |
SGS used QEMSCAN™ to complete a detailed mineralogical study on each composite to identify mineral liberations and associations. The mineral modal abundance for the composites is shown in Table 10-7.
The mineralogical results obtained by SGS were typical for the balance of other samples observed in the ALS Metallurgy QEMSCAN analysis and no significant liberation or changes in mineral occurrences were observed in later QEMSCAN work. Metal and talc grades all were observed to be variable in the mineralogical evaluations but did not significantly impact textural relationships.
| | |
| Arctic Project | Page 138 |
| S-K 1300 Technical Report Summary | November 30, 2022 |
| | |
| Table 10-7: | Mineral Modal Abundance for Composite Samples – SGS Burnaby 2012 |
| | | Mass (%) | |
| Mineral | | Zone 1 & 2 | | | Zone 3 | | | Zone 3 & 5 | | | Zone 5 | |
| Chalcopyrite | | | 9.2 | | | | 9.4 | | | | 12.2 | | | | 6.4 | |
| Bornite | | | 0.02 | | | | 0.01 | | | | 0.03 | | | | 0.4 | |
| Tetrahedrite | | | 0.1 | | | | 0.4 | | | | 0.2 | | | | 0.2 | |
| Antimony | | | 0.03 | | | | 0.2 | | | | 0.005 | | | | 0.3 | |
| Galena | | | 1.3 | | | | 2.1 | | | | 2.1 | | | | 2.1 | |
| Sphalerite | | | 7.2 | | | | 14.6 | | | | 14.3 | | | | 11.3 | |
| Pyrite | | | 6.7 | | | | 30.4 | | | | 23.8 | | | | 27.8 | |
| Pyrrhotite | | | 2.2 | | | | 0.2 | | | | 0.2 | | | | 1.4 | |
| Arsenopyrite | | | 0.5 | | | | 0.1 | | | | 0.6 | | | | 2.2 | |
| Other Sulphides | | | 0.1 | | | | 0.1 | | | | 0.2 | | | | 0.1 | |
| Quartz | | | 30.2 | | | | 8.6 | | | | 9.0 | | | | 16.6 | |
| Feldspar | | | 0.9 | | | | 0.2 | | | | 0.4 | | | | 0.3 | |
| Magnesium-Chlorite | | | 11.9 | | | | 3.4 | | | | 2.8 | | | | 1.1 | |
| Talc | | | 2.0 | | | | 0.8 | | | | 6.3 | | | | 0.1 | |
| Micas | | | 14.2 | | | | 1.9 | | | | 7.0 | | | | 9.4 | |
| Cymrite | | | 3.5 | | | | 3.9 | | | | 1.8 | | | | 1.9 | |
| Clays | | | 0.6 | | | | 0.05 | | | | 0.2 | | | | 0.1 | |
| Iron Oxides | | | 0.3 | | | | 0.3 | | | | 0.5 | | | | 0.3 | |
| Carbonates | | | 3.4 | | | | 1.3 | | | | 4.2 | | | | 2.0 | |
| Barite | | | 3.0 | | | | 21.8 | | | | 13.4 | | | | 14.5 | |
| Fluorite | | | 1.7 | | | | 0.1 | | | | 0.4 | | | | 1.2 | |
| Other | | | 1.1 | | | | 0.3 | | | | 0.4 | | | | 0.4 | |
| Total | | | 100.0 | | | | 100.0 | | | | 100.0 | | | | 100.0 | |
The mineralogical study showed that the mineralogy of all four composites was similar, but mineral volumes were highly variable between samples. Each composite was composed mainly of pyrite, quartz, and carbonates. However, Composite Zone 1 & 2 contain approximately 30% quartz, compared to 8.6% for Composite Zone 3, and 16.6% for Composite Zone 5. The study also showed that Composite Zone 1 & 2 had the lowest pyrite content (6.7%) while Composites Zone 3 and Zone 5 contained approximately 30.4% and 27.8% pyrite, respectively.
In all samples, the major floatable gangue minerals were talc and pyrite. Chalcopyrite was the main copper carrier. Combined bornite, tetrahedrite, and other sulphides accounted for less than 5% of the copper contained in the various samples. Galena was the main lead mineral and sphalerite was the main zinc mineral.
All the composites contained a significant amount of talc, which may have the potential to dilute final concentrates. Therefore, SGS recommended that talc removal using flotation be employed prior to base metal flotation and this recommendation was carried throughout all testwork.
| | |
| Arctic Project | Page 139 |
| S-K 1300 Technical Report Summary | November 30, 2022 |
| | |
At a grind size of approximately 80% passing 70 µm, chalcopyrite liberation ranged from approximately 80 to 87% (free and liberated combined) for all composites. The chalcopyrite is mostly free, with 7 to 10% associated with pyrite. For all composites, galena liberation ranged from 54 to 68% (free and liberated combined). Sphalerite liberation varied between 81 to 89%. Sphalerite is mostly free with about 7 to 10% associated with pyrite. Mineral liberation plays a significant role in removing talc during the pre-float stage and finer grinding benefits the removal of talc prior to sulphide flotation and subsequent re-grinding.
| 10.3.4 | Comminution Testwork |
KRC completed BWi tests on seven specific samples from the Arctic project in the 1976 testwork program. SGS conducted comminution tests on five selected samples during their testwork program in 2012. The SGS tests included the BWi tests and Ai tests. ALS Metallurgy also conducted BWi determinations on a number of samples during the 2017 to 2019 testwork program and these results from all three programs are summarized in Table 10-8. The BWi values range from 6.5 to 11 kWh/t for the materials sampled. The data indicates that the samples are relatively soft to ball mill grinding. The Ai ranged from 0.017 to 0.072 g, which indicates that the samples are not abrasive.
Grinding testwork for semi-autogenous grind (SAG) mill characterization was completed in conjunction with the ALS Metallurgy 2017 work. JKTech completed SMC and DWi testing of samples specifically selected for SAG amenability testing. Additional BWi determinations were also completed on the samples selected for SMC testwork; those BWI test results are included in Table 10-9 with the SMC results. Drill core data for the various SMC samples are contained in Table 10-8.
A total of 46 BWi tests were completed.
| Table 10-8: | Bond Ball Mill Work Index and Abrasion Index Test Results |
| Sample | | Mesh of
Grind Size | | | P80
(µm) | | | BWi
(kWh/t) | | | Ai
(g) | |
| | | | | | | | | | | | | |
| 1976 KRC samples |
| Hole – 11B | | | 150 | | | | - | | | | 11.96 | | | | - | |
| Hole – 34B | | | 150 | | | | - | | | | 8.33 | | | | - | |
| Hole – 34B | | | 150 | | | | - | | | | 5.71 | | | | - | |
| Hole – 34B | | | 150 | | | | - | | | | 11.3 | | | | - | |
| Hole – 34C | | | 150 | | | | - | | | | 9.98 | | | | - | |
| Hole – 48A | | | 150 | | | | - | | | | 10.5 | | | | - | |
| Hole – 48B | | | 150 | | | | - | | | | 9.60 | | | | - | |
| 2012 SGS samples |
| MET – 1105341 | | | 150 | | | | 88 | | | | 6.7 | | | | 0.032 | |
| MET – 1106043 | | | 150 | | | | 88 | | | | 6.5 | | | | 0.019 | |
| MET – 1105868 | | | 150 | | | | 85 | | | | 7.4 | | | | 0.030 | |
| MET – 1106033 | | | 150 | | | | 87 | | | | 9.3 | | | | 0.072 | |
| MET – 1105853 | | | 150 | | | | 89 | | | | 11.1 | | | | 0.017 | |
| 2017 ALS Metallurgy samples |
| Composite 1 | | | 106 | | | | 106 | | | | 9.0 | | | | - | |
| Composite 2 | | | 300 | | | | 228 | | | | 8.6 | | | | - | |
| Composite 3 | | | 300 | | | | 232 | | | | 8.1 | | | | - | |
| Composite 4 | | | 300 | | | | 226 | | | | 6.6 | | | | - | |
| Composite 5 | | | 300 | | | | 233 | | | | 7.1 | | | | - | |
| | |
| Arctic Project | Page 140 |
| S-K 1300 Technical Report Summary | November 30, 2022 |
| | |
| Sample | | Mesh of
Grind Size | | | P80
(µm) | | | BWi
(kWh/t) | | | Ai
(g) | |
| Composite 6 | | | 300 | | | | 233 | | | | 6.1 | | | | - | |
| Composite 7 | | | 300 | | | | 223 | | | | 6.2 | | | | - | |
| Composite 8 | | | 300 | | | | 234 | | | | 9.0 | | | | - | |
| Composite 9 | | | 300 | | | | 236 | | | | 6.4 | | | | - | |
| Composite 10 | | | 300 | | | | 237 | | | | 5.3 | | | | - | |
| Composite 11 | | | 300 | | | | 225 | | | | 7.2 | | | | - | |
| Composite 12 | | | 300 | | | | 234 | | | | 10.3 | | | | - | |
| Composite 13 | | | 300 | | | | 229 | | | | 10.1 | | | | - | |
| Composite 14 | | | 300 | | | | 231 | | | | 6.4 | | | | - | |
| PP Composite 1 | | | 300 | | | | 231 | | | | 7.2 | | | | - | |
ALS Metallurgy, in conjunction with the JKTech completed DWi testing and SMC tests on 19 individual samples.
SMC testwork was also completed by JKTech, including breakage parameters a x b, BWi, and autogenous grind/SAG mill specific energy (SCSE). The SMC data show the materials to be soft to very soft in terms of SAG milling characteristics. Test results are provided in Table 10-9.
| Table 10-9: | Summary of SMC Test Results and Additional BMI Data |
| Sample | | a x b | | | SCSE
(kWh/t) | | | BWi
(kWh/t) | |
| SMC - 1 | | | 148.9 | | | | 6.13 | | | | 10.9 | |
| SMC – 2 | | | NA | | | | NA | | | | 11.9 | |
| SMC – 3 | | | 239.9 | | | | 5.31 | | | | 7.1 | |
| SMC – 4 | | | 106.8 | | | | 6.89 | | | | 8.5 | |
| SMC – 5 | | | 203.5 | | | | 5.56 | | | | 6.8 | |
| SMC – 6 | | | 272.7 | | | | 4.71 | | | | 5.4 | |
| SMC – 7 | | | 629.3 | | | | 3.98 | | | | 12.5 | |
| SMC – 8 | | | 301.8 | | | | 5.09 | | | | 11.7 | |
| SMC – 9 | | | 220.5 | | | | 5.11 | | | | 8.2 | |
| SMC – 10 | | | 180.2 | | | | 5.77 | | | | 6.4 | |
| SMC – 11 | | | 143.8 | | | | 6.25 | | | | 10.8 | |
| SMC – 12 | | | 150.7 | | | | 6.15 | | | | 11.4 | |
| SMC – 13 | | | 98.8 | | | | 7.07 | | | | 7.6 | |
| SMC – 14 | | | 115.2 | | | | 6.68 | | | | 9.7 | |
| SMC – 15 | | | 182.5 | | | | 5.77 | | | | 9.0 | |
| SMC - 16 | | | 71.6 | | | | 8.21 | | | | 9.9 | |
| SMC – 17 | | | 86.2 | | | | 7.27 | | | | 10.5 | |
| SMC – 18 | | | 94.2 | | | | 7.26 | | | | 10.3 | |
| SMC – 19 | | | 169.3 | | | | 5.83 | | | | 8.4 | |
| Average Value | | | 189.8 | | | | 6.05 | | | | - | |
| | |
| Arctic Project | Page 141 |
| S-K 1300 Technical Report Summary | November 30, 2022 |
| | |
The predictive metallurgical results for the Arctic Project are based on locked cycle flotation testwork which mirrors the performance of an operational plant and accounts for circulating loads and intermediate products. Each research program consisted of a large number of open circuit flotation tests that provided guidance to the selection of operating conditions to be used in locked cycle tests.
In 2012, SGS conducted bench-scale flotation testwork to investigate the recovery of copper, lead, zinc, and associated precious metals using bulk copper-lead flotation and zinc flotation, followed by copper and lead separation. Four wide-ranging composite samples were tested for rougher flotation kinetics, cleaner efficiency, and copper and lead separation flotation efficiency. All of the testwork used a phased approach to completing testwork, with a preliminary phase of flotation testwork generating a bulk copper-lead concentrate and a final zinc concentrate. The bulk copper-lead concentrate was typically used in a second phase of testing, which was focused on separation of copper and lead minerals into copper and lead concentrates. The second phase of testwork typically also involved open-circuit flotation tests and locked cycle tests.
All flotation testwork either at SGS or ALS Metallurgy had the same froth characteristics.
The froth product is typically light in density and can require extensive flotation time. Very high talc recoveries are required to protect the lead concentrate from contamination as the lead concentrate is the destination for mis-reporting talc. Talc levels in test samples ranged from 0.0 to 40% talc on a weight basis, the LOM average for talc is approximately 5.1%.
The ratio of copper to lead is approximately four in the feed samples tested and within the Mineral Reserve estimates. This copper and lead concentrate is readily upgraded to provide feed to a copper and lead separation circuit. This froth is heavy and flotation rates for copper and lead are considered fast. In all copper and lead flotation, Cytec reagent 3418A was used as a copper and lead collector.
Zinc flotation follows both talc flotation and copper/lead bulk flotation. Zinc is depressed through both stages of talc and copper/lead flotation with the use of zinc sulphate and cyanide. Zinc minerals are activated with the addition of copper sulphate and a xanthate-based collector.
Zinc flotation is relatively fast, and froths are generally heavily laden with mineral.
The separation of copper and lead is completed using a high-grade concentrate of copper and lead minerals. The basis of the copper and lead separation is the depression of copper minerals using cyanide to render the copper minerals hydrophilic.
Locked cycle test results form the basis of metallurgical predictions for the Arctic project and are reported within Table 10-13 for the SGS testwork program and within Table 10-13 for the ALS Metallurgy testwork program.
The SGS testwork produced similar metallurgical performances among the composite samples tested and results were consistent with expectations outlined in the various mineralogical examinations and preliminary testwork results. Further optimization testwork would likely have improved the flotation performance of the composite sample for Zone 1 & 2 (LCT6), sample availability was limited for this composite.
The SGS flotation testwork points to high recoveries of copper and lead to a bulk concentrate of copper and lead which would be subsequently separated. Copper recoveries were in the range of 90 to 92%. Zinc recoveries were typically in the range of 89 to 92%. The majority of misreporting of copper was to the zinc concentrate and the majority of mis-reporting zinc was to the copper-lead concentrate. Ongoing optimization of the flotation process will likely reduce the misreporting of metals, through changes in reagent additions, grind size optimization and concentrate mass recovery.
| | |
| Arctic Project | Page 142 |
| S-K 1300 Technical Report Summary | November 30, 2022 |
| | |
Flotation testwork conducted in 2017 at ALS Metallurgy, was focused on a detailed evaluation of the performance of a copper and lead separation process and included open circuit flotation tests and locked cycle flotation testing of the copper-lead separation process.
A master composite was made from 14 variability samples from the deposit. Locked cycle testing for this composite was completed to provide a comparison with the SGS test results.
A summary of the locked cycle test results for both the SGS and ALS Metallurgy test programs in contained in Table 10-10.
| Table 10-10: | Summary of Locked Cycle Recovery Data for Composite Sample Testing |
| | | Recovery to Bulk Cu/Pb Concentrate or Zinc Concentrate | |
| Sample | | Cu1
(%) | | | Pb1
(%) | | | Zn2
(%) | | | Au1
(g/t) | | | Ag1
(g/t) | |
| | | | | | | | | | | | | | | | |
| SGS Burnaby 2012 |
| Zone 3 | | | 92.5 | | | | 92.6 | | | | 93.0 | | | | 77.6 | | | | 85.9 | |
| Zone 5 | | | 91.3 | | | | 92.0 | | | | 89.3 | | | | 70.9 | | | | 84.2 | |
| Zone 3&5 | | | 91.7 | | | | 92.3 | | | | 91.6 | | | | 75.8 | | | | 85.0 | |
| Zone 1&2 | | | 84.2 | | | | 94.0 | | | | 85.7 | | | | 79.7 | | | | 84.2 | |
| ALS Metallurgy 2017 | |
| Master Comp. | | | 94.1 | | | | 88.7 | | | | 87.8 | | | | 74.4 | | | | 85.4 | |
Notes:
| 1. | Represents recovery to a bulk concentrate prior to Cu/Pb separation. |
| 2. | Represents recovery to a final zinc concentrate. |
Locked cycle test results for the ALS Metallurgy master composite are contained in Table 10-10 and reports results for the production of a bulk copper-lead concentrate and a zinc concentrate. Table 10-11 provides the results for the SGS testwork program and Table 10-12 includes the results for the ALS Metallurgy testwork program.
| | |
| Arctic Project | Page 143 |
| S-K 1300 Technical Report Summary | November 30, 2022 |
| | |
| Table 10-11: | Locked Cycle Metallurgical Test Results – SGS Burnaby 2012 |
| Test No. | | Product | | | Regrind Size 80% Passing | | | Weight
% | | | Assays | | Distribution (%) |
| | Cu
(%) | | Pb
(%) | | Zn
(%) | | Au
(g/t) | | Ag
(g/t) | | S
(%) | | Cu | | Pb | | Zn | | Au | | Ag | | S |
Zone 3 LCT-2 | Talc Concentrate | Cu/Pb Rougher Concentrate: 43 µm;
Zn Rougher Concentrate: 41 µm | 1.6 | | 2.39 | | 2.44 | | 4.05 | | 0.51 | | 105.0 | | 9.97 | | 0.4 | | 0.8 | | 0.3 | | 0.4 | | 0.8 | | 0.2 |
| Cu/Pb Cleaner 2 Conc. | 12.9 | 24.7 | 12.4 | 3.61 | 4.73 | 506 | 30.5 | 92.5 | 92.6 | 5.5 | 77.6 | 85.9 | 15.4 |
| Zn Cleaner 2 Concentrate | 12.9 | 1.02 | 0.38 | 61.4 | 0.40 | 41.7 | 32.9 | 3.8 | 2.8 | 93.0 | 6.5 | 7.1 | 16.5 |
| Zn Cleaner 1 Sc. Tailings | 5.9 | 0.85 | 0.33 | 0.86 | 0.97 | 35.0 | 38.7 | 1.5 | 1.1 | 0.6 | 7.3 | 2.7 | 9.0 |
| Zn Rougher Tailings | 66.7 | 0.10 | 0.07 | 0.09 | 0.10 | 4.01 | 22.5 | 1.9 | 2.7 | 0.7 | 8.3 | 3.5 | 58.9 |
| Feed | 100.0 | 3.42 | 1.71 | 8.43 | 0.78 | 75.3 | 25.4 | 100.0 | 100.0 | 100.0 | 100.0 | 100.0 | 100.0 |
Zone 5 LCT-3 | Talc Concentrate | Cu/Pb Rougher Concentrate: 36 µm;
Zn Rougher Concentrate: 35 µm | 1.3 | 7.15 | 3.71 | 2.46 | 1.22 | 187.0 | 13.7 | 1.2 | 1.2 | 0.2 | 0.3 | 1.4 | 0.3 |
| Cu/Pb Cleaner 2 Conc. | 9.9 | 23.8 | 12.9 | 5.04 | 11.2 | 499 | 31.5 | 91.3 | 92.0 | 9.1 | 70.9 | 84.2 | 14.7 |
| Zn Cleaner 2 Concentrate | 8.3 | 0.91 | 0.56 | 59.1 | 0.55 | 46.4 | 30.5 | 2.9 | 3.4 | 89.3 | 2.9 | 6.6 | 11.9 |
| Zn Cleaner 1 Sc. Tailings | 7.1 | 0.80 | 0.28 | 0.56 | 4.55 | 30.0 | 32.4 | 2.2 | 1.4 | 0.7 | 20.5 | 3.6 | 10.7 |
| Zn Rougher Tailings | 73.4 | 0.09 | 0.04 | 0.05 | 0.11 | 3.38 | 18.1 | 2.4 | 2.0 | 0.7 | 5.3 | 4.2 | 62.4 |
| Feed | 100.0 | 2.56 | 1.37 | 5.47 | 1.55 | 58.2 | 21.1 | 100.0 | 100.0 | 100.0 | 100.0 | 100.0 | 100.0 |
Zone 3 & 5 LCT 4 | Talc Concentrate | Cu/Pb Rougher Concentrate: 45 µm;
Zn Rougher Concentrate: 23 µm | 7.3 | 0.72 | 0.38 | 1.37 | 0.11 | 17.6 | 3.01 | 0.4 | 0.6 | 0.4 | 0.3 | 0.6 | 0.3 |
| Cu/Pb Cleaner 2 Conc. | 16.0 | 25.3 | 9.25 | 3.13 | 4.28 | 408 | 29.4 | 91.7 | 92.3 | 6.4 | 73.8 | 85.0 | 21.3 |
| Zn Cleaner 2 Concentrate | 11.8 | 1.78 | 0.39 | 60.9 | 0.48 | 50.7 | 32.5 | 4.8 | 2.9 | 91.6 | 6.1 | 7.8 | 17.4 |
| Zn Cleaner 1 Sc. Tailings | 4.8 | 1.15 | 0.38 | 1.09 | 2.6 | 39.8 | 27.1 | 1.3 | 1.1 | 0.7 | 13.5 | 2.5 | 5.9 |
| Zn Rougher Tailings | 60.2 | 0.14 | 0.08 | 0.13 | 0.1 | 5.19 | 20.2 | 1.9 | 3.2 | 1 | 6.3 | 4.1 | 55.1 |
| Feed | 100.0 | 4.41 | 1.6 | 7.85 | 0.93 | 76.6 | 22.1 | 100 | 100 | 100 | 100 | 100 | 100 |
Zone 1 & 2 LCT-6 | Talc Concentrate | Cu/Pb Rougher Concentrate: 62 µm;
Zn Rougher Concentrate: 55 µm | 4.8 | 0.67 | 0.34 | 0.90 | 0.40 | 13.9 | 1.88 | 0.4 | 0.6 | 0.4 | 0.8 | 0.4 | 0.3 |
| Cu/Pb Cleaner 2 Conc. | 9.5 | 23.7 | 9.54 | 5.12 | 6.65 | 481 | 30.2 | 84.2 | 94.0 | 14.3 | 79.7 | 84.2 | 32.5 |
| Zn Cleaner 2 Concentrate | 6.4 | 5.84 | 0.49 | 44.5 | 0.91 | 101.5 | 32.8 | 14.0 | 3.2 | 83.7 | 7.4 | 12.0 | 23.9 |
| Zn Cleaner 1 Sc. Tailings | 7.4 | 0.22 | 0.06 | 0.17 | 0.91 | 12.3 | 19.6 | 0.6 | 0.5 | 0.4 | 8.4 | 1.7 | 16.4 |
| Zn Rougher Tailings | 71.8 | 0.03 | 0.02 | 0.06 | 0.04 | 1.34 | 3.30 | 0.8 | 1.7 | 1.2 | 3.7 | 1.8 | 26.8 |
| Feed | 100.0 | 2.69 | 0.97 | 3.42 | 0.80 | 54.6 | 8.8 | 100.0 | 100.0 | 100.0 | 100.0 | 100.0 | 100.0 |
| | | | | | | | | | | | | | | | | | | | | | | | | | | | | | | | | | | | | | | | | | | | | | |
| Table 10-12: | Locked Cycle Metallurgical Test Results – ALS Metallurgy 2017 |
| Test No. | | Product | | | Regrind Size 80% Passing | | | Weight % | | | Assays | | Distribution (%) |
| | Cu
(%) | | | Pb
(%) | | | Zn
(%) | | | Au
(g/t) | | | Ag
(g/t) | | | S
(%) | | | Cu | | | Pb | | | Zn | | | Au | | | Ag | | S |
Zone 3 LCT-2 | Talc Concentrate | Cu/Pb Rougher Concentrate: 43 µm;
Zn Rougher Concentrate: 41 µm | 1.6 | 2.39 | 2.44 | 4.05 | 0.51 | 105.0 | 9.97 | 0.4 | 0.8 | 0.3 | 0.4 | 0.8 | 0.2 |
| Cu/Pb Cleaner 2 Conc. | 12.9 | 24.7 | 12.4 | 3.61 | 4.73 | 506 | 30.5 | 92.5 | 92.6 | 5.5 | 77.6 | 85.9 | 15.4 |
| Zn Cleaner 2 Concentrate | 12.9 | 1.02 | 0.38 | 61.4 | 0.40 | 41.7 | 32.9 | 3.8 | 2.8 | 93.0 | 6.5 | 7.1 | 16.5 |
| Zn Cleaner 1 Sc. Tailings | 5.9 | 0.85 | 0.33 | 0.86 | 0.97 | 35.0 | 38.7 | 1.5 | 1.1 | 0.6 | 7.3 | 2.7 | 9.0 |
| Zn Rougher Tailings | 66.7 | 0.10 | 0.07 | 0.09 | 0.10 | 4.01 | 22.5 | 1.9 | 2.7 | 0.7 | 8.3 | 3.5 | 58.9 |
| Feed | 100.0 | 3.42 | 1.71 | 8.43 | 0.78 | 75.3 | 25.4 | 100.0 | 100.0 | 100.0 | 100.0 | 100.0 | 100.0 |
| | |
| Arctic Project | Page 144 |
| S-K 1300 Technical Report Summary | November 30, 2022 |
| | |
| 10.3.6 | Copper/Lead Separation Testwork |
SGS performed preliminary open-circuit copper and lead separation tests on the bulk copper-lead concentrates produced from the locked cycle tests in open circuit flotation tests. Sodium cyanide was used to suppress copper minerals; 3418A was used as the lead collector and lime was added to adjust the pulp pH to 10. Table 10-13 summarizes the separation test results. These results were obtained using small concentrate samples of approximately 200 g following the production of bulk concentrates in locked cycle testwork. These results also indicated that the separation of copper and lead was feasible using depression of copper and the flotation of lead minerals. Lead concentrate grades as high as 60% lead were obtained in these preliminary open-circuit tests at SGS and rougher flotation recoveries for lead were observed in the range of 88 to 95%.
Additional testwork to provide detailed estimates of the performance of the copper and lead flotation process was conducted at ALS Metallurgy. Approximately 50 kg of bulk copper and lead concentrate was produced in a pilot plant program with the specific objective of completing detailed copper and lead separation testwork. The separation testwork performed very well, however, lower than expected lead concentrate grades were obtained due to talc contamination of the final lead concentrate. This contamination was due to non-optimal talc flotation conditions within the pilot plant.
Results for two locked cycle tests using the pilot plant bulk concentrate are shown in Table 10-14. Recovery of lead to a final concentrate was consistent at 88% of the lead contained in the bulk concentrate. Recovery of copper to a final concentrate was consistent at 97.4% of the copper contained in a bulk concentrate.
| | |
| Arctic Project | Page 145 |
| S-K 1300 Technical Report Summary | November 30, 2022 |
| | |
| Table 10-13: | SGS Burnaby Open Circuit Copper and Lead Separation Test Results |
| Test | | Product | | | Weight
% | | | Assays | | Distribution (%) |
| | Cu
(%) | | | Pb
(%) | | | Zn
(%) | | | Ag
(g/t) | | | Au
(g/t) | | | S
(%) | | | Cu | | | Pb | | | Zn | | | Ag | | | Au | | S |
Zone 3 & 5
Cu/Pb Separation Feed from LCT-4
(Cycle 2) | Pb 2nd Cleaner Concentrate | 8.2 | 5.99 | 41.0 | 2.02 | 2,330 | 18.9 | 13.1 | 1.9 | 37.0 | 6.0 | 44.7 | 35.9 | 3.4 |
| Pb 1st Cleaner Concentrate | 22 | 6.87 | 37.5 | 4.34 | 1,665 | 13.6 | 20.6 | 5.9 | 90.8 | 34.8 | 85.7 | 69.5 | 14.3 |
| Pb Rougher Concentrate | 37.7 | 16.4 | 23.0 | 3.43 | 1,033 | 9.17 | 26.2 | 24.1 | 95.5 | 47.4 | 91.3 | 80.3 | 31.4 |
| Pb Rougher Tailings (Cu Concentrate) | 62.3 | 31.3 | 0.65 | 2.31 | 59 | 1.36 | 34.7 | 75.9 | 4.5 | 52.6 | 8.7 | 19.7 | 68.6 |
| Cu/Pb 2nd Cleaner Concentrate (Head) | - | 25.7 | 9.07 | 2.73 | 4.27 | 4.31 | 31.5 | - | - | - | - | - | - |
Zone 3
Cu/Pb Separation from Open Circuit Test (Test F25) | Pb 2nd Cleaner Concentrate | 2.1 | 2.22 | 58.8 | 5.58 | 1,622 | 0.3 | 20.8 | 1.4 | 74.9 | 1.4 | 44.2 | 1.0 | 1.8 |
| Pb 1st Cleaner Concentrate | 2.9 | 4.51 | 48.3 | 6.94 | 1,369 | 0.5 | 24.1 | 3.8 | 83.8 | 2.4 | 50.9 | 2.0 | 2.8 |
| Pb Rougher Concentrate | 4.3 | 12.4 | 33.6 | 6.54 | 1,026 | 1.05 | 26.9 | 15.3 | 86.0 | 3.3 | 56.3 | 6.6 | 4.6 |
| Pb Rougher Tailings (Cu Concentrate) | 8.3 | 31.5 | 0.29 | 4.33 | 231 | 5.24 | 33.3 | 75.1 | 1.4 | 4.2 | 24.5 | 63.9 | 11.0 |
| Cu/Pb 2nd Cleaner Concentrate (Head) | 12.6 | 25.0 | 11.6 | 5.08 | 502 | 3.81 | 31.1 | 90.4 | 87.4 | 7.5 | 80.8 | 70.5 | 15.5 |
Zone 5
Cu/Pb Separation Feed from LCT-5
(Cycle 2) | Pb 2nd Cleaner Concentrate | 6.6 | 2.42 | 69.0 | 2.68 | 1,230 | 1.27 | 15.8 | 0.6 | 41.1 | 3 | 17.2 | 1.8 | 3.3 |
| Pb 1st Cleaner Concentrate | 15.2 | 3.78 | 57.6 | 4.18 | 993 | 1.92 | 20.5 | 2.3 | 78.8 | 11.5 | 31.9 | 6.1 | 9.8 |
| Pb Rougher Concentrate | 25.5 | 10.3 | 40.3 | 4.82 | 778 | 6.31 | 25.1 | 10.5 | 92.4 | 22.1 | 41.9 | 33.6 | 20.1 |
| Pb Rougher Tailings (Cu Concentrate) | 74.5 | 30.0 | 1.13 | 5.79 | 369 | 4.26 | 34.1 | 89.5 | 7.58 | 77.9 | 58.1 | 66.4 | 79.9 |
| Cu/Pb 2nd Cleaner Concentrate (Head) | - | 25.0 | 11.1 | 5.54 | 473 | 4.78 | 31.8 | 100.0 | 100.0 | 100.0 | 100.0 | 100.0 | 100.0 |
Zone 1 & 2
Cu/Pb Separation Feed from
LCT-6 (Cycle 2) | Pb 2nd Cleaner Concentrate | 7.59 | 2.4 | 57.3 | 5.59 | 0.54 | 1,313 | 15.1 | 0.76 | 47.1 | 8.1 | 0.7 | 20.1 | 3.78 |
| Pb 1st Cleaner Concentrate | 16.4 | 4.38 | 45.3 | 7.96 | 0.77 | 1,038 | 19.9 | 2.98 | 80.5 | 24.9 | 2.2 | 34.4 | 10.8 |
| Pb Rougher Concentrate | 23.6 | 9.6 | 34.3 | 7.19 | 1.13 | 849 | 22.9 | 9.4 | 87.7 | 32.3 | 4.6 | 40.4 | 17.8 |
| Pb Rougher Tailings (Cu Concentrate) | 76.4 | 28.6 | 1.49 | 4.64 | 7.14 | 386 | 32.6 | 90.6 | 12.34 | 67.7 | 95.4 | 59.6 | 82.2 |
| Cu/Pb 2nd Cleaner Concentrate (Head) | - | 24.1 | 9.23 | 5.24 | 5.72 | 495 | 30.3 | 100.0 | 100.0 | 100.0 | 100.0 | 100.0 | 100.0 |
| Table 10-14: | ALS Metallurgy Locked Cycle Testing of Copper-Lead Separation Process |
| Test | | Product | | | Weight
% | | | Assays | | Distribution (%) |
| | Cu
(%) | | | Pb
(%) | | | Zn
(%) | | | Ag
(g/t) | | | Au
(g/t) | | | Cu | | | Pb | | | Zn | | | Ag | | Au |
Test 33
Bulk Conc. From Pilot Plant Operation | Pb 2nd Cleaner Concentrate (Pb Conc.) | 22.1 | 2.68 | 24.2 | 1.35 | 960 | 6.9 | 2.6 | 87.3 | 11.4 | 70.5 | 85.1 |
| Pb 1st Cleaner Tail | 11.3 | 25.8 | 1.64 | 2.08 | 138 | 0.39 | 12.9 | 3.0 | 9.0 | 5.2 | 2.5 |
| Pb Rougher Tail | 66.6 | 28.8 | 0.89 | 3.11 | 110 | 0.33 | 84.5 | 9.7 | 79.5 | 24.3 | 12.5 |
| Combined Tailings (Cu Concentrate) | 77.9 | 28.3 | 1.00 | 2.96 | 144 | 0.34 | 97.4 | 12.7 | 88.6 | 29.5 | 14.9 |
| Bulk Cleaner Concentrate (Feed) | - | 22.7 | 6.13 | 2.61 | 301 | 1.79 | 100.0 | 100.0 | 100.0 | 100.0 | 100.0 |
Test 34
Bulk Conc. From Pilot Plant Operation | Pb 2nd Cleaner Concentrate (Pb Conc.) | 21.9 | 2.75 | 23.3 | 1.29 | 906 | 7.33 | 2.6 | 86.0 | 10.8 | 69.5 | 85.3 |
| Pb 1st Cleaner Tail | 11.2 | 26.8 | 1.76 | 2.02 | 132 | 0.44 | 12.9 | 3.3 | 8.7 | 5.2 | 2.6 |
| Pb Rougher Tail | 66.9 | 29.4 | 0.95 | 3.14 | 106 | 0.34 | 84.5 | 10.7 | 80.5 | 25.3 | 12.1 |
| Combined Tailings (Cu Concentrate) | 78.1 | 29.4 | 1.06 | 2.98 | 111 | 0.35 | 97.4 | 14.0 | 89.2 | 30.5 | 14.7 |
| Bulk Cleaner Concentrate (Feed) | - | 23.3 | 5.93 | 2.61 | 285 | 1.88 | 100.0 | 100.0 | 100.0 | 100.0 | 100.0 |
| | |
| Arctic Project | Page 146 |
| S-K 1300 Technical Report Summary | November 30, 2022 |
| | |
| | |
| | |
In order to further evaluate the issue of talc contamination of the lead concentrate that was observed in some of the ALS Metallurgy testwork, additional lead concentrate production testwork was undertaken using a variety of samples with moderate to very high talc contents. This testwork was completed as open-circuit tests and involved the production of a bulk concentrate and the subsequent separation of the copper and lead minerals from the bulk concentrate. The objective of this testwork was to demonstrate that when talc recovery was optimized or maximized, the lead concentrate grade target could be readily achieved. These test results are summarized in Table 10-15. The open circuit tests included operating the talc flotation process until no visible talc was being recovered in the talc flotation stage. The results of the locked cycle separation testwork where lead concentrate grades were observed to be low are included in the table. Also shown is the value of the lead concentrate carried in the predictive metallurgical balance for the Arctic Project.
| Table 10-15: | Summary of Lead Concentrate Grades for Various Talc Grades in Feed |
| | | Talc Content | | | Lead Conc Grade | | | Copper Conc. Grade | |
| Sample | | % | | | % Pb | | | % Cu | |
| Pilot Plant Comp. | | | 12.7 | | | | 23.5 | | | | 29.4 | |
| 5567-04(test 4) | | | 18.4 | | | | 61.1 | | | | 32.3 | |
| 5567-14(test 5) | | | 0 | | | | 61.5 | | | | 30.2 | |
| 5567-1(test 6) | | | 8.5 | | | | 46.9 | | | | 30.8 | |
| 5567-5(test 7) | | | 30.0 | | | | 47.1 | | | | 32.4 | |
| 5567-7(test 8) | | | 10.5 | | | | 48.2 | | | | 29.2 | |
| 5567-9(test 9) | | | 17.7 | | | | 63.0 | | | | 31.4 | |
| 5567-14(test 10) | | | 0 | | | | 56.3 | | | | 29.1 | |
| 5567-5(test 11) | | | 31.5 | | | | 49.6 | | | | 31.8 | |
| 5567-9(test 12) | | | 19.0 | | | | 60.2 | | | | 31.0 | |
| LOM Prediction | | | 5.1 | | | | 55.0 | | | | 30.3 | |
The lead concentrate grades observed in the testwork summarized in indicates the ability to manage lead concentrate grades by virtue of the efficiency of the talc removal process. This testwork also indicates that lead concentrate quality can be achieved when talc feed grades are several times higher than the LOM estimated talc grade.
Table 10-16 provides descriptions of the key metallurgical parameters for the operation of the proposed recovery and upgrading of base and precious metals. These have been estimated from numerous tests and will be modulated during the operation as feed grades and metal ratios dictate.
| | |
| Arctic Project | Page 147 |
| S-K 1300 Technical Report Summary | November 30, 2022 |
| | |
| Table 10-16: | Summary of Flotation Reagent and Grind Size Objectives |
| Process Stage | Parameter | Comment |
| Flotation Feed | | |
| Primary Grind Size | P80 | 70 µm |
| Zinc Depressant | ZnSO4 | 200/100 g/t |
| Zinc Depressant | NaCN | 100 g/t |
| | | |
| Talc Flotation | | |
| Frothers | MIBC | 10 – 40 g/t |
| | | |
| Bulk Cu/Pb Flotation | | |
| Flotation Collector | 3418A | 25-40 g/t |
| Frother | MIBC | 5 – 10 g/t |
| Re-grind Size | P80 | 40 µm |
| | | |
| Zinc Flotation | | |
| Zinc Activator | CuSO4 | 100-200 g/t |
| Zinc Collector | SIPX | 10 - 50 g/t |
| Re-grind Size | P80 | 40 µm |
| | | |
| Cu/Pb Separation | | |
| Copper Depressant | NaCN | 60 - 120 g/t |
| Lead Collector | 3418A | 10 g/t |
| Note: | Expected Concentrate Quality. |
ICP assays were conducted on the copper and lead concentrates produced from the locked cycle tests at ALS Metallurgy and the zinc concentrate from the locked cycle tests at SGS. The samples are thought to represent the expected concentrate quality. The main impurity elements are shown in Table 10-17.
The results indicated that key penalty elements, as well as precious metals are typically concentrated into a lead concentrate, leaving the copper concentrate of higher-than-expected quality.
| Table 10-17: | Summary of Lead Concentrate Quality |
| | | Pb | | | Zn | | | Cu | | | Au | | | Ag | | | As | | | Sb | | | Bi | | | F | |
| Lead Conc. | | % | | | % | | | % | | | g/t | | | g/t | | | g/t | | | g/t | | | g/t | | | g/t | |
| Average Value | | | 55.0 | * | | | 1.8 | | | | 6.9 | | | | 37.3 | * | | | 2805 | * | | | 2128 | | | | 1375 | | | | 3876 | | | | 3260 | |
| Sample Max | | | - | | | | 2.83 | | | | - | | | | - | | | | - | | | | 4400 | | | | 5370 | | | | 5140 | | | | 5900 | |
| Sample Min | | | - | | | | 0.74 | | | | - | | | | - | | | | - | | | | 125 | | | | 32 | | | | 3270 | | | | 160 | |
* Reported to be consistent with predictive balance.
| | |
| Arctic Project | Page 148 |
| S-K 1300 Technical Report Summary | November 30, 2022 |
| | |
The issue of fluorine in the lead concentrate can be an issue for smelters. The level of fluorine in lead concentrates produced in laboratory tests, has been shown to be the result of small volumes of talc mineral that escape the talc pre-float circuit and will report with the lead concentrates. Talc levels and ultimately fluorine levels will be managed by optimization of the talc pre-float circuit, talc and fluorine will be effectively removed to ensure the quality of the lead concentrate. It is recommended that a value of 1,500 g/t F be used in marketing evaluations of the lead concentrate. Bismuth may also be an element that will be an issue with the lead concentrates.
Precious metal deportment into the lead concentrate is very high and should benefit the payable levels of precious metals at a smelter.
Table 10-18 provides the key features expected in the copper concentrate.
| Table 10-18: | Summary of Copper Concentrate Quality |
| | | Cu | | | Zn | | | Pb | | | Au | | | Ag | | | As | | | Sb | | | Bi | | | F | |
| Copper Conc. | | % | | | % | | | % | | | g/t | | | g/t | | | g/t | | | g/t | | | g/t | | | g/t | |
| Average Value | | | 30.3 | * | | | 1.6 | | | | 0.70 | | | | 0.8 | * | | | 138 | * | | | 1996 | | | | 1163 | | | | 175 | | | | 246 | |
| Sample Max | | | - | | | | 2.98 | | | | 1.52 | | | | - | | | | - | | | | 3350 | | | | 1675 | | | | 324 | | | | 330 | |
| Sample Min | | | - | | | | 0.87 | | | | 0.53 | | | | - | | | | - | | | | 102 | | | | 264 | | | | 115 | | | | 180 | |
* Reported to be consistent with predictive balance.
Copper concentrates are shown to be of high quality with arsenic levels somewhat elevated, but likely below penalty levels. Sulphur levels in copper concentrates are consistent with the mineralization being chalcopyrite at approximately 30–32% sulphur.
Table 10-19 shows the predicted key features of the zinc concentrate.
| Table 10-19: | Summary of Zinc Concentrate Quality |
| | | Zn | | | Cu | | | Pb | | | Au | | | Ag | | | Fe | | | As | | | Sb | | | Cd | | | Bi | | | F | |
| Zinc Conc. | | % | | | % | | | % | | | g/t | | | g/t | | | % | | | g/t | | | g/t | | | g/t | | | g/t | | | g/t | |
| Average Val. | | | 59.2 | * | | | 1.3 | | | | 0.25 | | | | 0.53 | * | | | 24.5 | * | | | 5.47 | | | | 966 | | | | 115 | | | | 3514 | | | | 60 | | | | 100 | |
| Sample Max. | | | - | | | | 2.98 | | | | 0.06 | | | | - | | | | - | | | | 12.4 | | | | 7000 | | | | 570 | | | | 4000 | | | | 351 | | | | - | |
| Sample Min. | | | - | | | | 0.87 | | | | 0.22 | | | | - | | | | - | | | | 1.93 | | | | 100 | | | | 16 | | | | 2900 | | | | 11 | | | | - | |
* Reported to be consistent with predictive balance.
Zinc concentrates are high grade but have elevated levels of cadmium that may incur economic penalties. Average iron content for the zinc concentrate is considered very good and further optimization of the rejection of pyrite may further reduce these reported iron levels.
| | |
| Arctic Project | Page 149 |
| S-K 1300 Technical Report Summary | November 30, 2022 |
| | |
| 10.4 | Mineralogical and Metallurgical Testwork – 2021 to 2022 |
In 2021, ALS Metallurgy conducted a test program on several composites constructed in previous Arctic test programs, followed by testing on composites constructed from the drill core samples generated from the 2021 drill program. The objectives of the test program were the characterization of talc in the composites, and determination of the talc distribution to the flotation flowsheet streams. Most of the flotation testing was completed with the preflotation circuit only to establish talc performance.
The generation of final tails for dewatering testing by the Metso Group was completed using a flowsheet which included pre-flotation, bulk, and zinc circuits. Copper-lead separation tests were also completed using the bulk concentrate produced from the tails generation test.
The Metso group prepared simulations for different talc pre-flotation circuit options using the ALS Metallurgy testwork results. The models were used to simulate different scenarios and to select the best circuit configuration.
In 2022, ALS Metallurgy conducted testwork to investigate bulk and sequential flotation flowsheets with composites formed from two parent composites, and then select a flowsheet for a geometallurgical evaluation through testing with variability samples.
The 2022 metallurgical samples were selected using Cancha geometallurgy software, which has unique geostatistical functions to ensure that samples are representative and combined with visualization of drill logs improved sample selection from the Arctic deposit. This software will be utilized along with a review of the material composition and key properties to select representative samples and analyze the metallurgical test results in future testwork programs.
The flowsheet development testwork investigated the effect of various process conditions on copper, lead and zinc recovery using copper-lead bulk flotation and zinc flotation followed by copper and lead separation. The testwork demonstrated that the mineralization was amenable to either a bulk flowsheet followed by copper-lead separation, or a sequential flowsheet, both following a pre-flotation stage to remove talc. In addition, Jameson cell cleaner flotation tests were conducted on a single parent composite to provide data to support the sizing and selection of the Jameson cell technology.
SGS conducted SAG Power Index (SPI®) testing on 15 samples to expand the comminution dataset and investigate the impact of friable ore types on the plant throughput.
Based on economic analysis comparing the bulk and sequential circuit, the bulk circuit flowsheet was selected for the variability testing. Many of the variability samples measured much higher copper, lead, and/or zinc feed grades than the composites tested in the flowsheet development phase. The variability sample selection were not intended to reflect sequences of the mine plan, but instead to represent discrete lithology types from which the results of the flotation testing would be used as inputs for recovery and grade models for the deposit.
Ore characterization and process mineralogical examination was conducted on all the flowsheet development and variability samples. The talc content was considered during sample selection to avoid mis-representing the talc content of future samples.
| | |
| Arctic Project | Page 150 |
| S-K 1300 Technical Report Summary | November 30, 2022 |
| | |
The pre-flotation flow sheet development test program was carried out on a number of composites constructed in previous Arctic test programs, followed by testing on composites constructed with drill core samples received under this test program.
Table 10-20 summarizes the assay results for the composites constructed in previous Arctic test programs KM5000 and KM5718, as well as the composites formed in this metallurgical test program.
| Table 10-20: | ALS Head Grades – Pre-Flotation Samples – 2021 |
| | | Chemical Content | |
| Composite | | Cu (%) | | | | Pb (%) | | | | Zn (%) | | | | Fe (%) | | | | S (%) | | | | Ag (g/t) | | | | Au (g/t) | | | | Mg (%) | |
| Composite 13 (KM5000) | | | 1.98 | | | | 0.30 | | | | 1.48 | | | | 6.20 | | | | 6.25 | | | | 38 | | | | 0.26 | | | | 9.14 | |
| PP Composite 1 (KM5000) | | | 2.92 | | | | 0.86 | | | | 4.66 | | | | 10.8 | | | | 13.8 | | | | 41 | | | | 0.56 | | | | 5.78 | |
| Zone 5 (KM5718) | | | 2.45 | | | | 1.35 | | | | 5.59 | | | | 15.9 | | | | 22.7 | | | | 67 | | | | 1.24 | | | | 0.61 | |
| Zone 3-5 (KM5718) | | | 4.14 | | | | 1.55 | | | | 7.80 | | | | 16.5 | | | | 24.0 | | | | 86 | | | | 0.99 | | | | 2.58 | |
| Master Composite 1B (KM5718) | | | 3.16 | | | | 1.12 | | | | 5.52 | | | | 14.0 | | | | 16.6 | | | | 48 | | | | 0.58 | | | | 5.22 | |
| Constructed under KM6442 |
| Master Composite 2 | | | 3.67 | | | | 1.30 | | | | 6.50 | | | | 12.9 | | | | 19.1 | | | | 65 | | | | 0.84 | | | | 4.15 | |
| HT 1 | | | 4.40 | | | | 0.80 | | | | 4.79 | | | | 10.2 | | | | 14.0 | | | | 42 | | | | 0.12 | | | | 8.54 | |
| HS 2 | | | 0.91 | | | | 0.07 | | | | 0.38 | | | | 5.0 | | | | 3.51 | | | | 5 | | | | 0.03 | | | | 3.57 | |
| HT 2 | | | 0.25 | | | | 0.04 | | | | 0.39 | | | | 1.8 | | | | 0.67 | | | | 3 | | | | 0.01 | | | | 9.11 | |
| FT 1 | | | 2.11 | | | | 0.60 | | | | 2.72 | | | | 7.3 | | | | 9.19 | | | | 36 | | | | 0.63 | | | | 4.28 | |
Initially, two parent composites were constructed for the flowsheet development testing: the Mineralized Composite and Talc Composite. The Mineralized Composite contained about 1.5% talc, while the Talc Composite contained about 55% talc. From these two composites, a range of blends were constructed to generate samples of various talc grades for testing.
Table 10-21 summarizes the flow sheet development blends and their calculated talc content.
| Table 10-21: | ALS Flowsheet Development Head Composites – 2021 |
| | | Proportion of Composite | | | | |
| Blend Composite | | Mineralized Composite | | | Talc Composite | | | Talc Content (%) | |
| Very Low Talc | | | 97 | | | | 3 | | | | 3.2 | |
| Low Talc | | | 93 | | | | 7 | | | | 5.1 | |
| Average Talc | | | 90 | | | | 10 | | | | 6.9 | |
| High Talc | | | 87 | | | | 13 | | | | 8.7 | |
| | |
| Arctic Project | Page 151 |
| S-K 1300 Technical Report Summary | November 30, 2022 |
| | |
| | | Proportion of Composite | | | | |
| Blend Composite | | Mineralized Composite | | | Talc Composite | | | Talc Content (%) | |
| Very High Talc | | | 83 | | | | 17 | | | | 10.5 | |
| 11% Talc | | | 82 | | | | 18 | | | | 11.4 | |
| 15% Talc | | | 74 | | | | 26 | | | | 15.5 | |
As would be expected, head assays measured for each of the blend composites were relative to the proportions of each of the two parent composites. A summary of key head assays for each blend is shown in Table 10-22.
The Talc Composite contained lower metal contents of Cu, Pb, Zn, Ag and Au, as compared to the mineralized (Pure Min) composite. As a result, samples with increased talc content were also of lower head grade, both of which would be expected to lead to poorer metallurgical response.
Some sulphate minerals, as well as organic carbon, were measured in the Pure Min Composite; both were almost negligible in the Talc Composite. The presence of sulphate minerals indicates that a portion of the total sulphur likely would not be recovered via sulphide flotation. Organic carbon, like talc, is usually naturally hydrophobic, so it would be expected to report to the pre-flotation concentrate with the talc.
| Table 10-22: | ALS Flowsheet Development Composites Head Assays – 2021 |
| | | Chemical Content | |
| Composite | | Cu (%) | | | | Pb (%) | | | | Zn (%) | | | | Fe (%) | | | | S (%) | | | | S(s) (%) | | | S(SO4) (%) | | | | Ag (g/t) | | | | Au (g/t) | | | | C (%) | | | | TOC | | | | Mg (%) | |
| Pure min | | | 2.31 | | | | 0.84 | | | | 3.57 | | | | 8.0 | | | | 10.9 | | | | 9.82 | | | | 1.03 | | | | 39 | | | | 0.47 | | | | 0.59 | | | | 0.14 | | | | 3.12 | |
| V. Low Talc | | | 2.12 | | | | 0.78 | | | | 3.20 | | | | 7.7 | | | | 10.2 | | | | | | | | | | | | 34 | | | | 0.47 | | | | | | | | | | | | 3.61 | |
| Low Talc | | | 2.17 | | | | 0.78 | | | | 3.21 | | | | 7.6 | | | | 10.2 | | | | | | | | | | | | 35 | | | | 0.42 | | | | | | | | | | | | 4.05 | |
| Avg Talc | | | 2.15 | | | | 0.75 | | | | 3.09 | | | | 7.2 | | | | 9.54 | | | | | | | | | | | | 35 | | | | 0.42 | | | | | | | | | | | | 4.52 | |
| High Talc | | | 2.11 | | | | 0.76 | | | | 3.07 | | | | 7.1 | | | | 9.44 | | | | | | | | | | | | 36 | | | | 0.44 | | | | | | | | | | | | 4.91 | |
| V. High Talc | | | 1.97 | | | | 0.67 | | | | 2.78 | | | | 6.6 | | | | 8.49 | | | | | | | | | | | | 32 | | | | 0.42 | | | | | | | | | | | | 5.30 | |
| 11% Talc | | | 1.98 | | | | 0.66 | | | | 2.73 | | | | 6.6 | | | | 8.74 | | | | | | | | | | | | 33 | | | | 0.32 | | | | | | | | | | | | 5.49 | |
| 15% Talc | | | 1.81 | | | | 0.60 | | | | 2.56 | | | | 6.1 | | | | 8.14 | | | | | | | | | | | | 32 | | | | 0.40 | | | | | | | | | | | | 6.16 | |
| Pure Talc | | | 0.93 | | | | 0.09 | | | | 0.55 | | | | 2.0 | | | | 1.51 | | | | 1.49 | | | | 0.03 | | | | 14 | | | | 0.25 | | | | 0.43 | | | | 0.04 | | | | 15.7 | |
The drill holes from the most recent 2021 Arctic exploration drilling program assessed to construct geometallurgical samples. The length of the geometallurgical sample was taken as short as possible to ensure that the mineralogy and lithology rock texture was consistent throughput the sample.
The 2022 variability test program used a total of 34 geometallurgical samples constructed from 11 drill holes and are summarized in Table 10-23. The drill cores were stored in a freezer to ensure sample degradation and oxidation of sulphide minerals did not occur.
| | |
| Arctic Project | Page 152 |
| S-K 1300 Technical Report Summary | November 30, 2022 |
| | |
| Table 10-23: | ALS Variability Sample Details – 2022 |
| Sample ID | | Drill Hole | | From | | | To | | | Length (m) | | | Zone | | | Lithology | |
| ARC-003 | | AR21-0174 | | | 86.9 | | | | 92.1 | | | | 5.2 | | | | Zone 5 | | | | MS | |
| ARC-004 | | AR21-0174 | | | 92.9 | | | | 95.1 | | | | 2.2 | | | | Zone 5 | | | | MS | |
| ARC-005 | | AR21-0176 | | | 128 | | | | 129.4 | | | | 1.4 | | | | Zone 4 | | | | SMS | |
| ARC-006 | | AR21-0176 | | | 129.4 | | | | 134.4 | | | | 5 | | | | Zone 4 | | | | ChTS | |
| ARC-007 | | AR21-0176 | | | 134.4 | | | | 138.3 | | | | 3.9 | | | | Zone 3 | | | | MS | |
| ARC-008 | | AR21-0176 | | | 138.3 | | | | 147.9 | | | | 9.6 | | | | Zone 3 | | | | MS | |
| ARC-010 | | AR21-0176 | | | 165.6 | | | | 168.7 | | | | 3.1 | | | | Zone 1 | | | | QMS | |
| ARC-017 | | AR21-0177 | | | 94.6 | | | | 99.8 | | | | 5.2 | | | | Zone 5 | | | | GS | |
| ARC-024 | | AR21-0182 | | | 126.6 | | | | 127.7 | | | | 1.1 | | | | Zone 5 | | | | MS | |
| ARC-025 | | AR21-0182 | | | 127.7 | | | | 130.9 | | | | 3.2 | | | | Zone 5 | | | | ChTS | |
| ARC-039 | | AR21-0182 | | | 158.6 | | | | 162.4 | | | | 3.8 | | | | Zone 3 | | | | MS | |
| ARC-044 | | AR21-0182 | | | 176.3 | | | | 178.6 | | | | 2.3 | | | | Zone 3 | | | | SMS | |
| ARC-050 | | AR21-0182 | | | 205.1 | | | | 210.2 | | | | 5.1 | | | | Zone 1 | | | | SMS | |
| ARC-051 | | AR21-0185 | | | 123.5 | | | | 125.4 | | | | 1.9 | | | | Zone 5 | | | | MS | |
| ARC-052 | | AR21-0187 | | | 85.2 | | | | 89.7 | | | | 4.5 | | | | Zone 5 | | | | MS | |
| ARC-054 | | AR21-0181 | | | 119.7 | | | | 121.8 | | | | 2.1 | | | | Zone 5 | | | | SMS | |
| ARC-055 | | AR21-0181 | | | 131.7 | | | | 134.6 | | | | 2.9 | | | | Zone 4 | | | | SMS | |
| ARC-056 | | AR21-0181 | | | 134.6 | | | | 136.9 | | | | 2.3 | | | | Zone 4 | | | | MS | |
| ARC-057 | | AR21-0181 | | | 136.9 | | | | 140.4 | | | | 3.5 | | | | Zone 4 | | | | TS | |
| ARC-058 | | AR21-0181 | | | 140.4 | | | | 144.8 | | | | 4.4 | | | | Zone 4 | | | | MS | |
| ARC-059 | | AR21-0181 | | | 147.8 | | | | 149.4 | | | | 1.6 | | | | Zone 4 | | | | SMS | |
| ARC-062 | | AR21-0181 | | | 159.8 | | | | 163.9 | | | | 4.1 | | | | Zone 3 | | | | MS | |
| ARC-063 | | AR21-0181 | | | 168.3 | | | | 169.7 | | | | 1.4 | | | | Zone 3 | | | | SMS | |
| ARC-064 | | AR21-0181 | | | 169.7 | | | | 173.1 | | | | 3.4 | | | | Zone 3 | | | | TS | |
| ARC-068 | | AR21-0181 | | | 177.1 | | | | 180.4 | | | | 3.3 | | | | Zone 3 | | | | SMS | |
| ARC-069 | | AR21-0181 | | | 187.1 | | | | 191.1 | | | | 4 | | | | Zone 2 | | | | MS | |
| ARC-072 | | AR21-0181 | | | 203.3 | | | | 209.1 | | | | 5.8 | | | | Zone 1 | | | | MS | |
| ARC-080 | | AR21-0184 | | | 136.3 | | | | 139.3 | | | | 3 | | | | Zone 5 | | | | QMS | |
| ARC-084 | | AR21-0188 | | | 222 | | | | 224.4 | | | | 2.4 | | | | Zone 2 | | | | MS | |
| ARC-086 | | AR21-0190 | | | 141.9 | | | | 145.1 | | | | 3.2 | | | | Zone 4 | | | | SMS | |
| ARC-087 | | AR21-0190 | | | 145.1 | | | | 148.7 | | | | 3.6 | | | | Zone 4 | | | | MS | |
| ARC-092 | | AR21-0190 | | | 186.8 | | | | 189.1 | | | | 2.3 | | | | Zone 2.5 | | | | MS | |
| | |
| Arctic Project | Page 153 |
| S-K 1300 Technical Report Summary | November 30, 2022 |
| | |
| Sample ID | | Drill Hole | | From | | | To | | | Length (m) | | | Zone | | | Lithology | |
| ARC-098 | | AR21-0190 | | | 217.9 | | | | 221.2 | | | | 3.3 | | | | Zone 1 | | | | CHS | |
| ARC-099 | | AR21-0189 | | | 50.4 | | | | 61.54 | | | | 11.14 | | | | Zone 5 | | | | MS | |
The head grades of the composites from the 2022 ALS variability testwork program are shown in Table 10-24.
Many of the variability samples measured much higher copper, lead, and/or zinc feed grades than the composites tested in the flowsheet development phase. The Variability sample selection were not intended to reflect sequences of the mine plan, but instead to represent discrete lithology types from which the results of the flotation testing would be used as inputs for recovery and grade models for the deposit.
| Table 10-24: | ALS Variability Samples Head Assays – 2022 |
| | | Chemical Content | |
| Sample ID | | | | Cu (%) | | | | Pb (%) | | | | Zn (%) | | | | Fe (%) | | | | S (%) | | | | Ag (g/t) | | | | Au (g/t) | | | | Sb (g/t) | | | | Barite (%) | | | | Talc (%) | |
| ARC-003 | | | | 6.4 | | | | 2.3 | | | | 10.0 | | | | 11.8 | | | | 24.2 | | | | 81 | | | | 1.03 | | | | 309 | | | | 33.4 | | | | 0.1 | |
| ARC-004 | | | | 6.1 | | | | 2.0 | | | | 8.9 | | | | 15.1 | | | | 23.9 | | | | 61 | | | | 0.53 | | | | 85 | | | | 6.1 | | | | 0.1 | |
| ARC-005 | | | | 8.1 | | | | 1.0 | | | | 4.3 | | | | 7.2 | | | | 12.4 | | | | 127 | | | | 0.99 | | | | 315 | | | | 9.0 | | | | 11.9 | |
| ARC-006 | | | | 1.1 | | | | 0.1 | | | | 0.1 | | | | 1.9 | | | | 1.6 | | | | 18 | | | | 0.38 | | | | 149 | | | | 0.1 | | | | 71.3 | |
| ARC-007 | | | | 5.9 | | | | 2.5 | | | | 12.2 | | | | 14.4 | | | | 29.1 | | | | 140 | | | | 1.33 | | | | 450 | | | | 16.0 | | | | 2.7 | |
| ARC-008 | | | | 8.9 | | | | 2.3 | | | | 9.5 | | | | 17.4 | | | | 26.6 | | | | 120 | | | | 1.52 | | | | 445 | | | | 18.4 | | | | 0.1 | |
| ARC-010 | | | | 1.5 | | | | 1.3 | | | | 8.2 | | | | 5.5 | | | | 8.4 | | | | 22 | | | | 0.07 | | | | 13 | | | | 0.1 | | | | 12.6 | |
| ARC-017 | | | | 0.6 | | | | 0.1 | | | | 0.2 | | | | 4.6 | | | | 4.8 | | | | 4 | | | | 0.16 | | | | 44 | | | | 0.1 | | | | 0.1 | |
| ARC-024 | | | | 8.6 | | | | 2.5 | | | | 13.8 | | | | 14.7 | | | | 28.0 | | | | 133 | | | | 1.21 | | | | 57 | | | | 9.4 | | | | 2.6 | |
| ARC-025 | | | | 0.8 | | | | 0.2 | | | | 0.3 | | | | 2.2 | | | | 1.5 | | | | 11 | | | | 0.24 | | | | 114 | | | | 0.1 | | | | 54.0 | |
| ARC-039 | | | | 4.6 | | | | 3.7 | | | | 14.1 | | | | 19.4 | | | | 27.6 | | | | 110 | | | | 1.48 | | | | 648 | | | | 0.1 | | | | 0.1 | |
| ARC-044 | | | | 1.8 | | | | 0.1 | | | | 0.1 | | | | 4.9 | | | | 5.2 | | | | 18 | | | | 0.20 | | | | 82 | | | | 0.1 | | | | 0.2 | |
| ARC-050 | | | | 3.1 | | | | 0.2 | | | | 1.0 | | | | 9.5 | | | | 8.8 | | | | 36 | | | | 0.38 | | | | 54 | | | | 0.1 | | | | 0.5 | |
| ARC-051 | | | | 3.7 | | | | 2.3 | | | | 13.2 | | | | 15.8 | | | | 30.6 | | | | 70 | | | | 0.52 | | | | 31 | | | | 23.8 | | | | 0.5 | |
| ARC-052 | | | | 8.5 | | | | 2.2 | | | | 13.0 | | | | 16.7 | | | | 28.1 | | | | 120 | | | | 1.11 | | | | 227 | | | | 7.6 | | | | 0.8 | |
| ARC-054 | | | | 4.7 | | | | 1.3 | | | | 5.9 | | | | 14.4 | | | | 23.0 | | | | 89 | | | | 0.34 | | | | 129 | | | | 21.2 | | | | 1.1 | |
| ARC-055 | | | | 2.8 | | | | 0.8 | | | | 6.3 | | | | 10.3 | | | | 15.2 | | | | 67 | | | | 0.43 | | | | 23 | | | | 0.1 | | | | 21.4 | |
| ARC-056 | | | | 7.4 | | | | 0.8 | | | | 7.2 | | | | 18.5 | | | | 25.5 | | | | 109 | | | | 0.85 | | | | 198 | | | | 0.1 | | | | 7.9 | |
| ARC-057 | | | | 1.0 | | | | 0.1 | | | | 0.2 | | | | 2.9 | | | | 1.8 | | | | 7 | | | | 0.07 | | | | 4 | | | | 0.1 | | | | 37.2 | |
| ARC-058 | | | | 6.0 | | | | 2.4 | | | | 13.6 | | | | 19.6 | | | | 31.0 | | | | 110 | | | | 1.31 | | | | 412 | | | | 7.9 | | | | 0.5 | |
| ARC-059 | | | | 5.3 | | | | 0.6 | | | | 6.6 | | | | 9.3 | | | | 13.2 | | | | 70 | | | | 0.53 | | | | 14 | | | | 0.1 | | | | 12.6 | |
| | |
| Arctic Project | Page 154 |
| S-K 1300 Technical Report Summary | November 30, 2022 |
| | |
| | | Chemical Content – percent or g/tonne | |
| Sample ID | | | | Cu (%) | | | | Pb (%) | | | | Zn (%) | | | | Fe (%) | | | | S (%) | | | | Ag (g/t) | | | | Au (g/t) | | | | Sb (g/t) | | | | Barite (%) | | | | Talc (%) | |
| ARC-062 | | | | 2.2 | | | | 6.5 | | | | 17.7 | | | | 10.2 | | | | 20.6 | | | | 55 | | | | 0.28 | | | | 95 | | | | 0.4 | | | | 1.1 | |
| ARC-063 | | | | 4.0 | | | | 0.1 | �� | | | 2.1 | | | | 7.3 | | | | 8.3 | | | | 13 | | | | 0.13 | | | | 4 | | | | 0.2 | | | | 38.8 | |
| ARC-064 | | | | 0.7 | | | | 0.0 | | | | 0.4 | | | | 1.7 | | | | 1.3 | | | | 2 | | | | 0.02 | | | | 1 | | | | 0.1 | | | | 67.1 | |
| ARC-068 | | | | 2.3 | | | | 0.1 | | | | 1.2 | | | | 7.1 | | | | 6.4 | | | | 22 | | | | 0.16 | | | | 140 | | | | 0.1 | | | | 0.3 | |
| ARC-069 | | | | 2.9 | | | | 1.3 | | | | 9.2 | | | | 12.6 | | | | 23.2 | | | | 55 | | | | 0.12 | | | | 40 | | | | 19.3 | | | | 7.6 | |
| ARC-072 | | | | 4.8 | | | | 0.5 | | | | 9.0 | | | | 18.2 | | | | 24.8 | | | | 114 | | | | 1.14 | | | | 102 | | | | 0.1 | | | | 1.8 | |
| ARC-080 | | | | 1.2 | | | | 0.1 | | | | 0.2 | | | | 2.6 | | | | 2.7 | | | | 22 | | | | 0.34 | | | | 82 | | | | 0.1 | | | | 3.7 | |
| ARC-084 | | | | 2.4 | | | | 0.4 | | | | 5.3 | | | | 16.1 | | | | 24.3 | | | | 29 | | | | 0.29 | | | | 9 | | | | 0.1 | | | | 1.6 | |
| ARC-086 | | | | 3.8 | | | | 1.0 | | | | 7.0 | | | | 11.1 | | | | 21.4 | | | | 89 | | | | 1.60 | | | | 937 | | | | 51.3 | | | | 0.3 | |
| ARC-087 | | | | 10.3 | | | | 4.2 | | | | 13.7 | | | | 12.5 | | | | 24.3 | | | | 171 | | | | 3.36 | | | | 578 | | | | 6.0 | | | | 0.8 | |
| ARC-092 | | | | 3.9 | | | | 0.1 | | | | 5.1 | | | | 20.2 | | | | 31.0 | | | | 22 | | | | 0.31 | | | | 44 | | | | 0.1 | | | | 3.2 | |
| ARC-098 | | | | 1.0 | | | | 0.0 | | | | 0.1 | | | | 2.9 | | | | 1.5 | | | | 25 | | | | 0.06 | | | | 2 | | | | 0.1 | | | | 0.7 | |
| ARC-099 | | | | 5.8 | | | | 2.3 | | | | 11.4 | | | | 12.6 | | | | 22.3 | | | | 92 | | | | 0.33 | | | | 57 | | | | 11.2 | | | | 0.9 | |
Head characterization was completed by ALS Geochemistry North Vancouver on all 34 variability samples including whole rock analysis by fusion and XRF, and multi-element determinations by ICP, ion chromatography, and Bulk Mineral Analysis with Liberation estimation (BMAL).
A total 29 samples were submitted for open circuit flotation tests and nine samples were used in locked cycle flotation tests. Eight samples produced sufficient bulk concentrate mass to undertake copper-lead separation testing.
Comminution testing was completed only on selected variability samples to extend the historical testwork dataset which included Bond ball mill work index tests and SPI tests. A Bond rod mill work index and Bond Abrasion test was completed with only three of the variability samples.
Shown in Figure 10 4 are the copper and lead grades of the ALS Metallurgy testwork samples compared to the designed plant feed grades. The pre-flotation samples are more representative of the expected mine production due to the lower range of copper and lead grades that are available. There is a strong correlation between copper and zinc grades within the pre-flotation samples. The metallurgical balance shown in Table 10-1 is based on LOM feed grades and is consistent with the LOM data point shown in Figure 10 4.
Shown in Figure 10 5 are the copper and zinc grades of the various test samples used in the ALS Metallurgy test program. There is a consistent copper to zinc ratio of approximately 3.5–4.5 within the test samples and the LOM grades are shown to be within the distribution of test samples.
| | |
| Arctic Project | Page 155 |
| S-K 1300 Technical Report Summary | November 30, 2022 |
| | |
| Figure 10-4: | Cu and Pb Test Sample Grades for ALS Metallurgy Test Program |

Source: Ausenco, 2022
| Figure 10-5: | Cu and Zn Test Sample Grades for ALS Metallurgy Test Program |
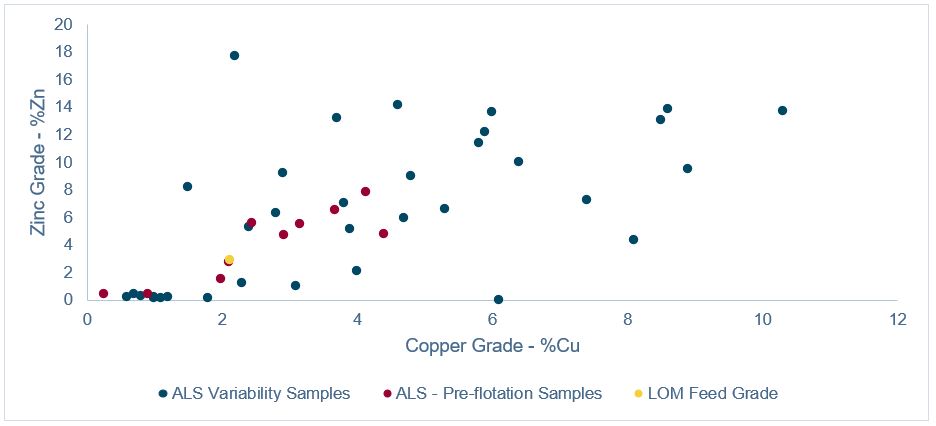
Source: Ausenco, 2022
| | |
| Arctic Project | Page 156 |
| S-K 1300 Technical Report Summary | November 30, 2022 |
| | |
| 10.4.3 | Mineralogical Investigations |
| 10.4.3.1 | Talc Optimization Samples |
The mineral content and elemental deportment of the composites tested in the metallurgical test program were measured by QEMSCAN using Bulk Mineral Analysis (BMA) protocols as well as by semi-quantitative X-Ray Diffraction (XRD). A summary of the mineral content mineral content is presented in Figure 10 6.
The talc content varied widely between the composites. Highest talc content at about 21% was measured for the HT1 (High Talc) sample. A second sample HT2, received with the intention of blending as a high talc sample, measured only about 3% as talc and 47% as chlorite by QEMSCAN and was not utilized for testing in this study. The Master Composite 2, which had been prepared using the KM5718 Master Composite 1B and Zone 3-5 Composite, measured about 8% talc, and the FT1 composite which was utilized to generate a talc pre-flotation concentrates and zinc circuit tails for dewatering testwork measured about 14% talc.
Magnesium was distributed amongst a number of minerals for the Arctic deposit which included primarily talc, micas, chlorite, and calcium carbonate minerals dolomite and ankerite. The distribution of magnesium to these minerals varied widely between the composites, so magnesium assays on flotation test products would not accurately reflect talc recoveries.
To improve the estimate of talc in the deposit a talc predictive algorithm has been developed by South32. The talc algorithm includes aluminium, calcium, potassium, and magnesium to improve the predictability of talc. The predicted talc assay form each of the individual variability composites were compared with the mineralogical analysis of the head sample. The predictive talc algorithm aligned well with the measured talc content. Understanding that the blending of composites reduces the predictability of the talc in the plant feed, the Arctic Project has considered incorporating the predicted talc and metallurgical performance on each of the mine blocks and then weighing the overall metallurgical performance. Future testwork will investigate blends to validate this approach.
Copper was contained primarily as chalcopyrite, although low percentages of bornite, tennantite/enargite, covellite, chalcocite, and bornite were also measured.
| | |
| Arctic Project | Page 157 |
| S-K 1300 Technical Report Summary | November 30, 2022 |
| | |
| Figure 10-6: | Talc Optimization Composites Mineral Content |

Source: ALS Metallurgy, 2021.
| 10.4.3.2 | Flow Sheet Development Samples |
Particle Mineral Analysis (PMA) and XRD were conducted on each the Pure Min and Talc Composites. The semi-qualitative XRD data confirmed non-sulphide gangue mineral contents reported in the Particle Mineral Analyses. A summary of pertinent mineral content data is shown in Figure 10 7.
| | |
| Arctic Project | Page 158 |
| S-K 1300 Technical Report Summary | November 30, 2022 |
| | |
| Figure 10-7: | Parent Composite Mineral Content |
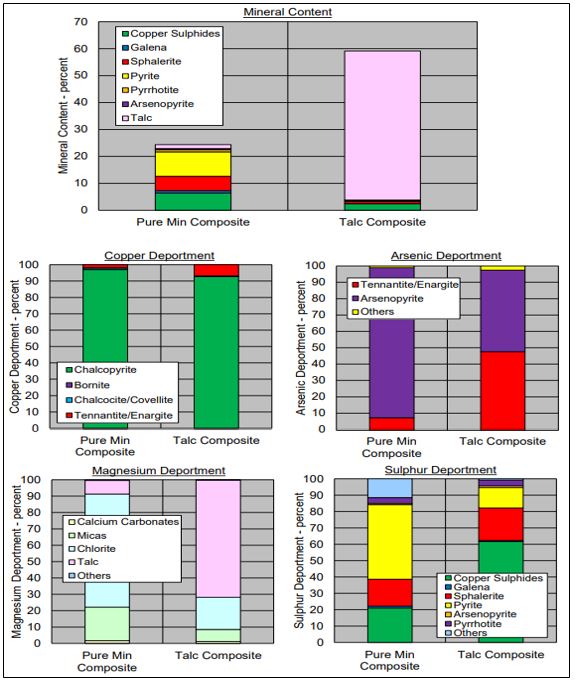
Source: ALS Metallurgy, 2021
As expected, based on the head assays, the sulphide mineral content for the Pure Min Composite was significantly higher than the Talc Composite. Conversely, the Talc Composite contained very high talc content, about 55%, while the Pure Min Composite only measured about 1.5% talc.
Copper was measured mostly in the form of chalcopyrite. However, between around 2 and 8% of the copper was in copper arsenic sulphosalts (enargite/tennantite /tetrahedrite group minerals). These copper arsenic sulphosalts are typically recovered by flotation in a similar manner to other copper sulphide minerals. On this basis, elevated arsenic and/or antimony levels in the copper concentrate would be expected.
| | |
| Arctic Project | Page 159 |
| S-K 1300 Technical Report Summary | November 30, 2022 |
| | |
Only a small portion of the magnesium in the Pure Min Composite was present in talc and most of the magnesium was measured as chlorite. In the Talc Composite, just over 70% of the magnesium was measured within talc, with chlorite being the main other magnesium bearing mineral. Mica minerals also contributed a lesser, but still significant component of the magnesium in both composites (7 to 21%). Given the presence of magnesium in minerals other than talc, magnesium is likely not a useful proxy for quantifying talc content across the deposit.
Sulphur was measured mostly as sulphide minerals in both samples. However, in the Pure Min Composite, around 11% was measured as sulphate minerals (i.e., barite, calcium sulphate, and jarosite).
Spectra collected on the sphalerite in the Pure Min and High Talc parent composites measured between 4 and 5 percent iron within the mineral matrix. The iron content within the zinc concentrates produced from the blend composites would be expected to therefore be at least 4%.
| 10.4.3.3 | Variability Samples |
A Bulk Mineral Analysis with Liberation estimation (BMAL) by QEMSCAN was conducted at ALS Metallurgy on each of the variability samples to provide mineral composition and estimates of liberation for key sulphide minerals. A summary of the mineral content data is presented in Figure 10 8.
Talc content varied widely between the samples, ranging from less than detection limits to as high as about 71% for ARC-006. The average talc content for the variability samples was about 12% which is four times the LOM talc content of 3%. MgO contents, measured by XRF or whole rock analysis, could be used to make a preliminary estimate of talc content, despite magnesium being contained in minerals other than talc. Samples high in MgO but low in talc could be identified based on higher Al2O3 content greater than 10%. Since talc does not contain aluminium, higher Al2O3 content indicates the presence of other potentially magnesium bearing minerals in important concentrations. X-ray spectra collected from talc from the Pure Min and Talc composites did not identify fluorine within the mineral structure. However, based on a trend between fluorine and talc content, it is possible that there is fluorine within talc at low concentrations.
Copper was measured predominantly in the form of chalcopyrite. Copper as copper arsenic sulphosalts enargite/tennantite, and tetrahedrite averaged about 3% and measured as high as 14% for ARC-086. Elevated arsenic and/or antimony levels in the copper concentrate would be expected for feeds with higher percentages of copper in these forms.
Magnesium in the variability samples was measured primarily within talc, chlorite, and micas. For ARC-050, about one half of the magnesium was associated with amphibole/pyroxenes and magnesite/siderite. A summary of the magnesium deportment is shown in Figure 10-8. Sulphur was measured mostly as sulphide minerals chalcopyrite, sphalerite, pyrite, and galena. About 51% of the feed mass was measured as barite for ARC-086, and about 33% as barite for ARC-003. Barite would be unlikely to be recovered via sulphide flotation techniques.
| | |
| Arctic Project | Page 160 |
| S-K 1300 Technical Report Summary | November 30, 2022 |
| | |
| Figure 10-8: | Mineral Modal Abundance for Variability Samples |
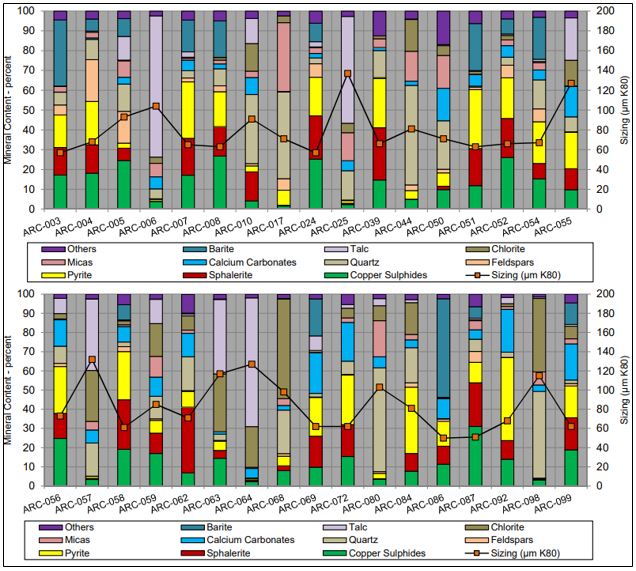
Source: ALS Metallurgy, 2022
Liberations were estimated by QEMSCAN BMAL protocols using sub-samples of grind calibrations for each of the variability samples. The analysis was completed over a wide range of primary grind sizes between 50 and 137µm K80 due to the manner in which the grind calibrations were completed. An initial grind calibration targeting 65µm K80 was completed at 18 minutes for variability samples which measured lower talc content, and at 23 minutes for the samples which measured high talc content. A second grind calibration at 30 or 35 minutes was included for a few samples where sizing’s measured greater than 100µm K80.
Copper sulphide mineral liberations, estimated from the QEMCSAN BMAL, averaged about 68% for the variability samples which would be considered moderate to adequate for expected copper recovery in the bulk roughers. About 8% of the copper sulphide minerals on average were estimated to be in binary form with either sphalerite or pyrite, with about 10% of the copper sulphides in binary form with non-sulphide gangue.
| | |
| Arctic Project | Page 161 |
| S-K 1300 Technical Report Summary | November 30, 2022 |
| | |
An average galena liberation off 55% was estimated, but an additional 11% of the galena was estimated to be in binary form with copper sulphides which would also be recoverable in the bulk roughers, and as such the galena liberation would also be considered acceptable for good lead recovery in the bulk roughers. About 11% of the galena was estimated to be in binary form with sphalerite.
Average sphalerite liberation was estimated to be 72%. This would be expected to lead to high zinc recovery in the zinc roughers. About 9% of the sphalerite, on average, was estimated to be in binary form with copper sulphide minerals which could be potentially recovered in the bulk roughers, but a percentage of this sphalerite could be returned to the zinc roughers after bulk circuit regrinding.
| 10.4.4 | Comminution Testwork |
Comminution testing included Bond ball mill work index tests and SPI tests on several samples; a Bond rod mill work index and Bond Abrasion test was completed with only three of the variability samples.
ALS Metallurgy completed Bond ball mill work index tests (BWi) on one set of variability samples with a 150-mesh Tyler closing screen (106µm), and for a second set of samples with a 48-mesh Tyler screen (300µm). Several the samples selected for the Bond work index tests completed with the coarser closing screen measured high talc content (ARC-006, ARC-025, ARC-057, and ARC-064). All variability samples selected for Bond ball mill work index testing with the 150-mesh Tyler screen measured low talc content of 1% or less, except for the ARC-069 composite which measured about 8% talc.
The highest Bond ball mill work index recorded for those samples tested was about 21 kWh/t, at the coarser screen sizing, for ARC-006 which measured about 71% talc. The high Bond ball mill work index is likely a result of the resistance to breakage of the talc particles which has been observed in previous test programs with Arctic composites. A Bond ball mill work index of less than 12 kWh/t was measured for most of the variability samples tested which would indicate material that was soft in terms of ball milling.
Abrasion test results for the three variability samples submitted for testing ranged between 0.01 and 0.05, which would be considered mildly abrasive.
Table 10-25 summarizes the bond work comminution test results.
| Table 10-25: | Bond Ball Mill Work Index and Abrasion Index Test Results |
| | | Bond Ball Wi | | | |
| Sample ID | | @ 300µm kWh/t | | @ 106µm kWh/t | | @ 1180µm kWh/t | | Bond Abrasion | |
| ARC-006 | | 20.8 | | - | | - | | - | |
| ARC-008 | | - | | 8.2 | | - | | - | |
| ARC-017 | | 9.8 | | - | | 11.3 | | 0.049 | |
| ARC-025 | | 11.4 | | - | | - | | - | |
| ARC-039 | | - | | 8.6 | | - | | - | |
| ARC-044 | | - | | 17.7 | | - | | - | |
| ARC-050 | | - | | 11.8 | | - | | - | |
| ARC-052 | | - | | 9.0 | | - | | - | |
| | |
| Arctic Project | Page 162 |
| S-K 1300 Technical Report Summary | November 30, 2022 |
| | |
| | | Bond Ball Wi | | | |
| Sample ID | | @ 300µm
kWh/t | | @ 106µm
kWh/t | | @ 1180µm
kWh/t | | Bond Abrasion | |
| ARC-057 | | 10.3 | | - | | - | | - | |
| ARC-058 | | - | | 8.1 | | - | | - | |
| ARC-062 | | - | | 13.1 | | - | | - | |
| ARC-064 | | 14.7 | | - | | - | | - | |
| ARC-069 | | - | | 8.2 | | - | | - | |
| ARC-072 | | - | | 9.1 | | 6.4 | | 0.034 | |
| ARC-099 | | 5.9 | | - | | 4.8 | | 0.014 | |
ALS Metallurgy, in conjunction with SGS Lakefield (SGS) conducted SPI tests on 15 selected variability samples during the testwork program in 2022. The SPI test is considered more reliable when estimating specific energy of soft ores.
The SPI data show most materials to be very soft in terms of SAG milling characteristics. Test results are provided in Table 10-26.
| Table 10-26: | Summary of SPI Test Results |
| Sample | | SPI (min) | | Hardness Percentile | | Category | |
| ARC-017 | | 35.2 | | 15 | | Soft | |
| ARC-025 | | 12.8 | | 3 | | Very Soft | |
| ARC-044 | | 25.3 | | 8 | | Very Soft | |
| ARC-050 | | 19.5 | | 5 | | Very Soft | |
| ARC-056 | | 14.0 | | 3 | | Very Soft | |
| ARC-057 | | 13.8 | | 3 | | Very Soft | |
| ARC-058 | | 10.4 | | 2 | | Very Soft | |
| ARC-062 | | 12.5 | | 3 | | Very Soft | |
| ARC-063 | | 13.5 | | 3 | | Very Soft | |
| ARC-064 | | 5.5 | | 1 | | Very Soft | |
| ARC-069 | | 8.2 | | 1 | | Very Soft | |
| ARC-072 | | 12.2 | | 3 | | Very Soft | |
| ARC-086 | | 5.9 | | 1 | | Very Soft | |
| ARC-087 | | 10.7 | | 2 | | Very Soft | |
| ARC-099 | | 9.8 | | 2 | | Very Soft | |
| Minimum Value | | 5.5 | | | | | |
| Maximum Value | | 35.2 | | - | | | |
| Average Value | | 14.0 | | | | | |
| | |
| Arctic Project | Page 163 |
| S-K 1300 Technical Report Summary | November 30, 2022 |
| | |
| 10.4.5.1 | Talc Optimization Testwork |
Initial testing was completed on composites which had been retained in storage from previous Arctic test programs KM5000 and KM5718 with a flowsheet including pre-flotation rougher and cleaner stages. Table 10-27 summaries the baseline pre-flotation test results.
The results of these tests indicated similar pre-flotation circuit performance compared to results from the previous metallurgical test programs. One substantial difference noted was the extremely negative redox potentials measured in the pre-flotation rougher stage recorded for the tests in this program, although this did not appear to affect pre-flotation rougher performance in terms of mass recovery and metals losses to the pre-flotation concentrate.
| Table 10-27: | Summary of Baseline Pre-Flotation Tests |
| Test | | Original Tests Distribution (%) | | Current Tests Distribution (%) | |
| | Cu | | Pb | | Zn | | Au | | Ag | | Cu | | Pb | | Zn | | Au | | Ag | |
| Composite 13 (KM5000) | | 3.3 | | 3.7 | | 3.0 | | 4.3 | | 4.0 | | 2.7 | | 4.4 | | 2.9 | | 1.3 | | 3.4 | |
| PP Composite 1 (KM5000) | | 1.0 | | 1.1 | | 0.3 | | 2.4 | | 0.3 | | 1.3 | | 5.1 | | 1.2 | | 1.3 | | 3.3 | |
| Zone 5 (KM5718) | | 0.4 | | 0.7 | | 0.2 | | 0.3 | | 0.6 | | 0.4 | | 0.7 | | 0.2 | | 0.3 | | 0.6 | |
| Zone 3-5 (KM5718) | | 0.3 | | 0.9 | | 0.3 | | 1.4 | | 0.8 | | 0.4 | | 0.8 | | 0.4 | | 0.6 | | 0.8 | |
| Composite 1B (KM5718) | | 1.4 | | 4.8 | | 1.3 | | 1.0 | | 3.7 | | 1.6 | | 3.4 | | 1.6 | | 3.2 | | 2.4 | |
Notes: Values reflect recoveries to pre-flotation rougher for Composite 13, Zone 5, and PP Comp 1, and to pre-flotation cleaner concentrate for Master Composite 1B and Zone 3-5 composite
The Master Composite 2 was subjected to a series of eight pre-flotation was conducted which included two stages of cleaners was carried out using a variable screening test matrix. In these tests, whole rock and QEMSCAN mineralogical analyses were completed on the test products. High talc recoveries between 95 and 98% were recorded in all tests, but lower metal losses were recorded at a coarser primary grind sizing.
High grade talc concentrates ranging between 88 and 92% talc were measured for all variable screening tests after two cleaner stages. The percentage of the feed talc recovered to the pre-flotation cleaner concentrate varied widely between 61 and 92% and correlated with mass recovery. A total MIBC frother dosage between 55 and 77 g/ton appeared to be required to ensure a stable flotation froth and therefore high mass and talc recoveries. Copper, lead, zinc, and silver recoveries to the pre-flotation cleaner concentrate ranged between 0.5 and 1.0% indicating good rejection from the rougher concentrate by dilution cleaning with potential for recovery in the downstream sulphide flotation circuits Kinetic pre-flotation rougher and cleaner tests were completed with Master Composite 2 to provide flotation kinetic data for modelling by an external laboratory. A high-grade copper concentrate which measured between 22 and 24% copper was recovered to the final pre-flotation rougher concentrate following 8 minutes of initial rougher residence time; these tests were characterized by highly negative redox values in the initial pre-flotation rougher stages which increased to positive values by the final pre-flotation rougher stage.
| | |
| Arctic Project | Page 164 |
| S-K 1300 Technical Report Summary | November 30, 2022 |
| | |
Kinetic pre-flotation rougher and cleaner tests were completed with Master Composite 2 to provide flotation kinetic data for modelling by Metso Group. A high-grade copper concentrate which measured between 22 and 24% copper was recovered to the final pre-flotation rougher concentrate following 8 minutes of initial rougher residence time; these tests were characterized by highly negative redox values in the initial pre-flotation rougher stages which increased to positive values by the final pre-flotation rougher stage.
A 64-kilogram test was carried out in locked-cycle fashion using a bulk flotation flowsheet to generate pre-flotation concentrate and bulk final tails for dewatering and tailing consolidation tests by external laboratories. The bulk concentrate produced from the test was used for copper-lead separation tests using sodium cyanide to depress the copper sulphide minerals.
Test results indicated that on average, 93% of the copper was recovered to the lead rougher tails, and about 86% of the lead was recovered to the lead rougher concentrate. Lead losses were very high to the lead cleaner tails, and the flowsheet was more effective recovering talc to the lead cleaner concentrate. As a reverse flotation flowsheet with combined 3rd and 4th lead cleaner tails, about 56% of the lead and 30% of the silver was recovered to a lead concentrate with a calculated grade of about 58% lead and 0.2% silver.
| 10.4.5.2 | Flowsheet Development Testwork |
The objective of the program was to investigate bulk and sequential flotation flowsheets with composites formed from two parent composites, and then select a flowsheet for a geometallurgical evaluation through testing with variability samples.
The mineralization was amenable to either a bulk flowsheet followed by copper-lead separation, or a sequential flowsheet, both following a pre-flotation stage to remove talc. Table 10-28 shows average performance obtained for the Avg Talc Composite in the Flowsheet Development phase of the testing.
| Table 10-28: | Comparison of Bulk vs. Sequential Locked-Cycle Test Results – ALS 2021 |
| Composite | | Assays | | Distribution (%) | |
| | Cu
(%) | | Pb
(%) | | Zn
(%) | | Ag
(g/t) | | Au
(g/t) | | Mg
(%) | | Cu | | Pb | | Zn | | Ag | | Au | |
| | | | | | | | | | | | | | | | | | | | | | | |
| Avg Talc Bulk | |
| Copper concentrate | | 28.0 | | 0.86 | | 4.27 | | 181 | | 4.17 | | 0.46 | | 87.3 | | 8.3 | | 9.1 | | 36.0 | | 60.9 | |
| Lead concentrate | | 7.90 | | 39.0 | | 6.30 | | 1124 | | 4.75 | | 1.23 | | 5.1 | | 78.1 | | 2.8 | | 46.0 | | 14.3 | |
| Zinc concentrate | | 0.87 | | 0.38 | | 55.9 | | 41 | | 0.35 | | 0.04 | | 1.9 | | 2.6 | | 83.3 | | 5.7 | | 3.5 | |
| Avg Talc - Sequential | |
| Copper concentrate | | 27.6 | | 0.87 | | 2.05 | | 168 | | 3.23 | | 1.96 | | 90.2 | | 8.9 | | 4.7 | | 34.9 | | 48.7 | |
| Lead concentrate | | 2.72 | | 49.3 | | 9.71 | | 1360 | | 5.31 | | 1.40 | | 1.2 | | 69.9 | | 3.1 | | 39.4 | | 11.2 | |
| | |
| Arctic Project | Page 165 |
| S-K 1300 Technical Report Summary | November 30, 2022 |
| | |
| Composite | | Assays | | Distribution (%) | |
| | Cu
(%) | | Pb
(%) | | Zn
(%) | | Ag
(g/t) | | Au
(g/t) | | Mg
(%) | | Cu | | Pb | | Zn | | Ag | | Au | |
| Zinc concentrate | | 0.98 | | 1.09 | | 54.5 | | 47 | | 0.77 | | 0.17 | | 2.1 | | 7.3 | | 83.5 | | 6.5 | | 7.7 | |
Copper recovery to the copper concentrate was slightly higher for the sequential flowsheet; however, gold recovery to the copper concentrate was substantially lower. The lead concentrate grade for the Avg Talc composite could likely be improved over that shown in Table 10-28 with optimization of copper-lead separation conditions given the higher lead concentrate grade measured with other composites.
Zinc circuit performance was similar for the two flowsheets, although higher zinc recovery to the copper concentrate was recorded for the bulk circuit. Magnesium content in the copper concentrate was higher for the sequential circuit, but similar in the lead concentrate for both circuits.
| 10.4.5.3 | Variability Testwork |
Based on economic analysis comparing the bulk and sequential circuit, the bulk circuit flowsheet was selected for the Variability testing. A total of 28 variability samples were selected for flotation testing which included open circuit cleaner tests, and 9 of these variability samples were selected for locked-cycle testing. Table 10-29 shows performance obtained for Variability testwork phase of the testing.
Most of the variability samples responded well to the developed bulk circuit flowsheet, when adjustments to dosages were made to account for variations in head grades. In the cleaner tests with the bulk flowsheet, an average of 88% of the copper and 76% of the lead was recovered to the bulk concentrate. Average zinc recovery was about 78% to a zinc concentrate which averaged 57% zinc. High zinc rougher recoveries were recorded when the copper sulphate addition in the conditioner stage was ratioed to the zinc feed grade at 100 g/t to 1% feed grade. Further optimization of copper sulphate additions might be possible with additional testing.
The variability test phase culminated with locked-cycle testing of 9 variability samples to determine closed-circuit performance. On average, about 93% of the copper and 84% of the lead was recovered to the bulk concentrate which measured 25% copper and 10% lead, on average. Good zinc performance was recorded in these tests with an average zinc recovery of 90% to a zinc concentrate which averaged 55% zinc. Most of the gold and silver was recovered to the bulk concentrate, averaging 74% and 84%, respectively.
| | |
| Arctic Project | Page 166 |
| S-K 1300 Technical Report Summary | November 30, 2022 |
| | |
| Table 10-29: | Summary of Variability Open Circuit Flotation Test Results – ALS 2022 |
| Test | | Product | | Regrind Size
80% Passing | | Weight
(%) | | Assays | | Distribution (%) | |
Cu
(%) | | Pb
(%) | | Zn
(%) | | Au
(g/t) | | Ag
(g/t) | | S
(%) | | Cu | | Pb | | Zn | | Au | | Ag | | S | |
ARC-004 Test 64 | | Talc Concentrate | | Flotation Feed: 68 µm; Cu/Pb Rougher Concentrate: 38 µm;
Zn Rougher Concentrate: 20 µm | | - | | - | | - | | - | | - | | - | | - | | - | | - | | - | | - | | - | | - | |
| Cu/Pb Cleaner 2 Conc. | | 20.3 | | 26.0 | | 8.5 | | 7.6 | | 1.85 | | 224 | | 31.9 | | 89.0 | | 79.7 | | 18.3 | | 80.6 | | 75.9 | | 27.0 | |
| Zn Cleaner 2 Concentrate | | 2.2 | | 1.7 | | 1.0 | | 58.0 | | 0.27 | | 40 | | 32.6 | | 0.6 | | 1.0 | | 15.4 | | 1.3 | | 1.5 | | 3.0 | |
| Zn Cleaner 1 Sc. Tailings | | 0.9 | | 5.0 | | 2.4 | | 14.6 | | 0.51 | | 106 | | 20.4 | | 0.7 | | 1.0 | | 1.5 | | 1.0 | | 1.5 | | 0.7 | |
| Zn Rougher Tailings | | 72.4 | | 0.3 | | 0.3 | | 6.1 | | 0.06 | | 8 | | 21.1 | | 3.5 | | 10.4 | | 52.3 | | 9.3 | | 9.5 | | 63.7 | |
| Feed | | 100.0 | | 5.9 | | 2.2 | | 8.4 | | 0.47 | | 60 | | 24.0 | | 100.0 | | 100.0 | | 100.0 | | 100.0 | | 100.0 | | 100.0 | |
ARC-007
Test 71 | | Talc Concentrate | | Flotation Feed: 64 µm;
Cu/Pb Rougher Concentrate: 47 µm;
Zn Rougher Concentrate: 55 µm | | 4.6 | | 0.3 | | 0.4 | | 0.5 | | 0.07 | | 16 | | 1.2 | | 0.3 | | 0.6 | | 0.2 | | 0.2 | | 0.5 | | 0.2 | |
| Cu/Pb Cleaner 2 Conc. | | 19.0 | | 25.9 | | 12.6 | | 3.2 | | 5.63 | | 506 | | 30.9 | | 85.9 | | 89.1 | | 4.8 | | 76.8 | | 69.3 | | 20.0 | |
| Zn Cleaner 2 Concentrate | | 17.2 | | 0.7 | | 0.2 | | 63.8 | | 0.30 | | 38 | | 33.6 | | 2.0 | | 1.3 | | 85.5 | | 3.7 | | 4.7 | | 19.6 | |
| Zn Cleaner 1 Sc. Tailings | | 14.6 | | 1.4 | | 0.3 | | 1.4 | | 0.66 | | 91 | | 48.9 | | 3.4 | | 1.7 | | 1.6 | | 6.9 | | 9.6 | | 24.2 | |
| Zn Rougher Tailings | | 40.0 | | 0.4 | | 0.2 | | 0.5 | | 0.21 | | 12 | | 22.4 | | 2.5 | | 3.4 | | 1.4 | | 6.0 | | 3.5 | | 30.4 | |
| Feed | | 100.0 | | 5.7 | | 2.7 | | 12.8 | | 1.39 | | 139 | | 29.5 | | 100.0 | | 100.0 | | 100.0 | | 100.0 | | 100.0 | | 100.0 | |
ARC-008
Test 79 | | Talc Concentrate | | Flotation Feed: 64 µm;
Cu/Pb Rougher Concentrate: 41 µm;
Zn Rougher Concentrate: 35 µm | | - | | - | | - | | - | | - | | - | | - | | - | | - | | - | | - | | - | | - | |
| Cu/Pb Cleaner 2 Conc. | | 28.4 | | 29.4 | | 7.4 | | 2.1 | | 4.42 | | 356 | | 32.4 | | 91.3 | | 90.6 | | 6.0 | | 72.7 | | 81.7 | | 34.3 | |
| Zn Cleaner 2 Concentrate | | 12.9 | | 0.9 | | 0.3 | | 60.9 | | 0.44 | | 38 | | 33.1 | | 1.2 | | 1.6 | | 80.4 | | 3.3 | | 4.0 | | 15.9 | |
| Zn Cleaner 1 Sc. Tailings | | 3.0 | | 2.9 | | 0.5 | | 5.6 | | 4.55 | | 121 | | 34.6 | | 1.0 | | 0.6 | | 1.7 | | 7.9 | | 2.9 | | 3.9 | |
| Zn Rougher Tailings | | 51.6 | | 0.5 | | 0.2 | | 0.4 | | 0.33 | | 10 | | 21.4 | | 2.9 | | 3.6 | | 2.0 | | 9.8 | | 4.2 | | 41.1 | |
| Feed | | 100.0 | | 9.2 | | 2.3 | | 9.8 | | 1.73 | | 124 | | 26.9 | | 100.0 | | 100.0 | | 100.0 | | 100.0 | | 100.0 | | 100.0 | |
ARC-024
Test 89 | | Talc Concentrate | | Flotation Feed: 60 µm;
Cu/Pb Rougher Concentrate: 44 µm;
Zn Rougher Concentrate: 45 µm | | 3.3 | | 0.5 | | 0.5 | | 0.6 | | 2.81 | | 24 | | 1.7 | | 0.2 | | 0.5 | | 0.1 | | 7.1 | | 0.6 | | 0.2 | |
| Cu/Pb Cleaner 2 Conc. | | 27.7 | | 27.1 | | 9.3 | | 1.8 | | 3.36 | | 410 | | 32.6 | | 90.1 | | 91.8 | | 3.5 | | 70.6 | | 81.6 | | 31.1 | |
| Zn Cleaner 2 Concentrate | | 20.0 | | 0.7 | | 0.2 | | 61.8 | | 0.29 | | 40 | | 33.7 | | 1.8 | | 1.6 | | 86.6 | | 4.4 | | 5.8 | | 23.3 | |
| Zn Cleaner 1 Sc. Tailings | | 4.5 | | 2.1 | | 0.4 | | 3.3 | | 1.10 | | 49 | | 45.0 | | 1.1 | | 0.7 | | 1.0 | | 3.8 | | 1.6 | | 7.1 | |
| Zn Rougher Tailings | | 39.7 | | 0.6 | | 0.2 | | 0.7 | | 0.27 | | 13 | | 23.6 | | 2.6 | | 2.4 | | 1.9 | | 8.1 | | 3.7 | | 32.4 | |
| Feed | | 100.0 | | 8.3 | | 2.8 | | 14.3 | | 1.32 | | 139 | | 28.9 | | 100.0 | | 100.0 | | 100.0 | | 100.0 | | 100.0 | | 100.0 | |
ARC-039
Test 111 | | Talc Concentrate | | Flotation Feed: 75 µm;
Cu/Pb Rougher Concentrate: 45 µm;
Zn Rougher Concentrate: 48 µm | | - | | - | | - | | - | | - | | - | | - | | - | | - | | - | | - | | - | | - | |
| Cu/Pb Cleaner 2 Conc. | | 21.0 | | 21.3 | | 16.8 | | 6.0 | | 3.44 | | 420 | | 30.3 | | 88.0 | | 87.1 | | 8.3 | | 42.7 | | 83.1 | | 22.6 | |
| Zn Cleaner 2 Concentrate | | 22.8 | | 0.5 | | 0.4 | | 54.4 | | 0.79 | | 22 | | 33.4 | | 2.3 | | 2.5 | | 81.9 | | 10.7 | | 4.7 | | 27.1 | |
| Zn Cleaner 1 Sc. Tailings | | 10.3 | | 0.5 | | 0.4 | | 1.0 | | 2.16 | | 15 | | 49.0 | | 1.1 | | 1.0 | | 0.7 | | 13.2 | | 1.5 | | 18.0 | |
| Zn Rougher Tailings | | 37.0 | | 0.4 | | 0.4 | | 1.1 | | 0.50 | | 11 | | 14.7 | | 3.2 | | 3.6 | | 2.7 | | 11.0 | | 3.8 | | 19.3 | |
| Feed | | 100.0 | | 5.1 | | 4.0 | | 15.1 | | 1.69 | | 106 | | 28.1 | | 100.0 | | 100.0 | | 100.0 | | 100.0 | | 100.0 | | 100.0 | |
ARC-044
Test 81 | | Talc Concentrate | | Flotation Feed: 81 µm;
Cu/Pb Rougher Concentrate: 57 µm | | - | | - | | - | | - | | - | | - | | - | | - | | - | | - | | - | | - | | - | |
| Cu/Pb Cleaner 2 Conc. | | 6.0 | | 31.1 | | 0.2 | | 0.3 | | 3.57 | | 260 | | 33.8 | | 96.0 | | 23.9 | | 23.9 | | 79.2 | | 91.4 | | 38.9 | |
| Zn Cleaner 2 Concentrate | | - | | - | | - | | - | | - | | - | | - | | - | | - | | - | | - | | - | | - | |
| Zn Cleaner 1 Sc. Tailings | | - | | - | | - | | - | | - | | - | | - | | - | | - | | - | | - | | - | | - | |
| Zn Rougher Tailings | | - | | - | | - | | - | | - | | - | | - | | - | | - | | - | | - | | - | | - | |
| Feed | | 100.0 | | 1.9 | | 0.0 | | 0.1 | | 0.27 | | 17 | | 5.2 | | 100.0 | | 100.0 | | 100.0 | | 100.0 | | 100.0 | | 100.0 | |
ARC-050
Test 77 | | Talc Concentrate | | Flotation Feed: 71 µm;
Cu/Pb Rougher Concentrate: 43 µm;
Zn Rougher Concentrate: 46 µm | | - | | - | | - | | - | | - | | - | | - | | - | | - | | - | | - | | - | | - | |
| Cu/Pb Cleaner 2 Conc. | | 10.1 | | 31.1 | | 1.0 | | 1.1 | | 3.06 | | 294 | | 33.0 | | 93.3 | | 67.2 | | 9.8 | | 71.5 | | 79.8 | | 37.8 | |
| Zn Cleaner 2 Concentrate | | 1.8 | | 2.6 | | 0.3 | | 47.1 | | 0.85 | | 92 | | 29.8 | | 1.4 | | 3.7 | | 75.4 | | 3.5 | | 4.4 | | 6.1 | |
| Zn Cleaner 1 Sc. Tailings | | 9.6 | | 0.2 | | 0.1 | | 0.1 | | 0.18 | | 7 | | 6.0 | | 0.4 | | 3.3 | | 1.2 | | 4.0 | | 1.8 | | 6.5 | |
| Zn Rougher Tailings | | 73.9 | | 0.1 | | 0.0 | | 0.0 | | 0.08 | | 3 | | 5.3 | | 1.5 | | 20.6 | | 2.6 | | 13.7 | | 6.0 | | 44.2 | |
| Feed | | 100.0 | | 3.4 | | 0.1 | | 1.1 | | 0.43 | | 37 | | 8.8 | | 100.0 | | 100.0 | | 100.0 | | 100.0 | | 100.0 | | 100.0 | |
ARC-051
Test 110 | | Talc Concentrate | | Flotation Feed: 64 µm;
Cu/Pb Rougher Concentrate: 48 µm;
Zn Rougher Concentrate: 50 µm | | 1.0 | | 0.3 | | 1.6 | | 0.6 | | 0.06 | | 40 | | 1.9 | | 0.1 | | 0.7 | | 0.0 | | 0.2 | | 0.6 | | 0.1 | |
| Cu/Pb Cleaner 2 Conc. | | 14.4 | | 24.4 | | 13.0 | | 3.4 | | 1.67 | | 368 | | 31.7 | | 84.2 | | 84.2 | | 3.8 | | 62.4 | | 82.1 | | 15.1 | |
| Zn Cleaner 2 Concentrate | | 19.5 | | 0.8 | | 0.3 | | 59.0 | | 0.20 | | 10 | | 33.5 | | 3.5 | | 2.7 | | 88.6 | | 10.1 | | 3.0 | | 21.5 | |
| Zn Cleaner 1 Sc. Tailings | | 12.5 | | 0.6 | | 0.3 | | 0.9 | | 0.18 | | 9 | | 50.4 | | 1.6 | | 1.6 | | 0.8 | | 5.8 | | 1.7 | | 20.8 | |
| Zn Rougher Tailings | | 47.3 | | 0.3 | | 0.2 | | 0.6 | | 0.08 | | 8 | | 22.9 | | 3.7 | | 4.9 | | 2.2 | | 9.8 | | 5.8 | | 35.6 | |
| Feed | | 100.0 | | 4.2 | | 2.2 | | 13.0 | | 0.39 | | 65 | | 30.4 | | 100.0 | | 100.0 | | 100.0 | | 100.0 | | 100.0 | | 100.0 | |
ARC-052
Test 110 | | Talc Concentrate | | Flotation Feed: 69 µm;
Cu/Pb Rougher Concentrate: 45 µm;
Zn Rougher Concentrate: 43 µm | | 1.1 | | 0.6 | | 0.2 | | 0.6 | | 0.01 | | 13 | | 1.7 | | 0.1 | | 0.1 | | 0.0 | | 0.0 | | 0.1 | | 0.1 | |
| Cu/Pb Cleaner 2 Conc. | | 26.5 | | 29.7 | | 7.2 | | 2.0 | | 3.67 | | 370 | | 32.2 | | 88.1 | | 88.8 | | 3.9 | | 78.8 | | 77.6 | | 29.9 | |
| Zn Cleaner 2 Concentrate | | 16.2 | | 0.6 | | 0.3 | | 63.8 | | 0.22 | | 24 | | 33.6 | | 1.0 | | 2.0 | | 73.7 | | 2.9 | | 3.1 | | 19.0 | |
| Zn Cleaner 1 Sc. Tailings | | 4.9 | | 2.3 | | 0.4 | | 7.5 | | 0.57 | | 44 | | 38.6 | | 1.3 | | 0.9 | | 2.6 | | 2.3 | | 1.7 | | 6.6 | |
| Zn Rougher Tailings | | 43.8 | | 0.5 | | 0.1 | | 0.4 | | 0.08 | | 9 | | 23.3 | | 2.2 | | 2.6 | | 1.1 | | 2.8 | | 3.1 | | 35.8 | |
| Feed | | 100.0 | | 8.9 | | 2.2 | | 14.0 | | 1.24 | | 126 | | 28.5 | | 100.0 | | 100.0 | | 100.0 | | 100.0 | | 100.0 | | 100.0 | |
ARC-054
Test 60 | | Talc Concentrate | | Flotation Feed: 67 µm;
Cu/Pb Rougher Concentrate: 61 µm;
Zn Rougher Concentrate: 38 µm | | 2.0 | | 3.6 | | 0.3 | | 0.4 | | 0.15 | | 32 | | 4.8 | | 1.4 | | 0.4 | | 0.1 | | 0.6 | | 0.7 | | 0.4 | |
| Cu/Pb Cleaner 2 Conc. | | 16.8 | | 28.3 | | 6.4 | | 1.8 | | 1.69 | | 460 | | 33.0 | | 90.3 | | 89.9 | | 5.2 | | 56.8 | | 83.4 | | 24.6 | |
| Zn Cleaner 2 Concentrate | | 7.3 | | 0.8 | | 0.3 | | 60.2 | | 0.64 | | 38 | | 32.1 | | 1.1 | | 1.9 | | 76.2 | | 9.3 | | 3.0 | | 10.3 | |
| Zn Cleaner 1 Sc. Tailings | | 1.9 | | 1.4 | | 0.3 | | 6.3 | | 0.39 | | 51 | | 20.4 | | 0.5 | | 0.5 | | 2.1 | | 1.5 | | 1.1 | | 1.7 | |
| Zn Rougher Tailings | | 68.4 | | 0.2 | | 0.1 | | 0.2 | | 0.09 | | 6 | | 18.9 | | 2.3 | | 2.9 | | 2.0 | | 12.3 | | 4.1 | | 57.3 | |
| Feed | | 100.0 | | 5.3 | | 1.2 | | 5.7 | | 0.50 | | 93 | | 22.5 | | 100.0 | | 100.0 | | 100.0 | | 100.0 | | 100.0 | | 100.0 | |
ARC-055
Test 92 | | Talc Concentrate | | Flotation Feed: 72 µm;
Cu/Pb Rougher Concentrate: 69 µm;
Zn Rougher Concentrate: 54 µm | | 26.9 | | 0.4 | | 0.2 | | 0.8 | | 0.01 | | 15 | | 1.9 | | 3.7 | | 6.3 | | 3.5 | | 0.7 | | 6.2 | | 3.5 | |
| Cu/Pb Cleaner 2 Conc. | | 9.9 | | 26.3 | | 6.4 | | 1.5 | | 3.08 | | 508 | | 29.9 | | 84.9 | | 78.3 | | 2.4 | | 81.5 | | 77.9 | | 20.0 | |
| Zn Cleaner 2 Concentrate | | 8.9 | | 0.7 | | 0.2 | | 60.0 | | 0.15 | | 18 | | 32.0 | | 2.0 | | 2.1 | | 84.9 | | 3.6 | | 2.5 | | 19.2 | |
| Zn Cleaner 1 Sc. Tailings | | 2.2 | | 1.0 | | 0.3 | | 2.9 | | 0.57 | | 23 | | 13.7 | | 0.7 | | 0.7 | | 1.0 | | 3.3 | | 0.8 | | 2.0 | |
| Zn Rougher Tailings | | 48.4 | | 0.2 | | 0.1 | | 0.3 | | 0.01 | | 8 | | 15.5 | | 2.7 | | 7.7 | | 2.4 | | 1.3 | | 6.0 | | 50.4 | |
| Feed | | 100.0 | | 3.1 | | 0.8 | | 6.3 | | 0.38 | | 65 | | 14.9 | | 100.0 | | 100.0 | | 100.0 | | 100.0 | | 100.0 | | 100.0 | |
ARC-056
Test 82 | | Talc Concentrate | | Flotation Feed: 73 µm;
Cu/Pb Rougher Concentrate: 52 µm;
Zn Rougher Concentrate: 29 µm | | 11.7 | | 0.7 | | 0.1 | | 0.7 | | 0.10 | | 17 | | 2.1 | | 1.0 | | 2.0 | | 1.0 | | 1.2 | | 1.8 | | 0.9 | |
| Cu/Pb Cleaner 2 Conc. | | 23.5 | | 30.6 | | 3.0 | | 1.3 | | 3.03 | | 390 | | 33.3 | | 90.5 | | 84.8 | | 3.9 | | 71.1 | | 82.3 | | 30.2 | |
| Zn Cleaner 2 Concentrate | | 10.7 | | 0.9 | | 0.2 | | 60.4 | | 0.26 | | 20 | | 32.4 | | 1.2 | | 1.9 | | 85.1 | | 2.8 | | 1.9 | | 13.4 | |
| Zn Cleaner 1 Sc. Tailings | | 1.0 | | 4.3 | | 0.5 | | 7.2 | | 1.51 | | 90 | | 27.7 | | 0.6 | | 0.6 | | 1.0 | | 1.6 | | 0.8 | | 1.1 | |
| Zn Rougher Tailings | | 49.7 | | 0.5 | | 0.1 | | 0.4 | | 0.28 | | 14 | | 26.2 | | 2.9 | | 6.5 | | 2.7 | | 13.9 | | 6.2 | | 50.1 | |
| Feed | | 100.0 | | 8.0 | | 0.8 | | 7.6 | | 1.00 | | 112 | | 26.0 | | 100.0 | | 100.0 | | 100.0 | | 100.0 | | 100.0 | | 100.0 | |
ARC-057
Test 83 | | Talc Concentrate | | Flotation Feed:132µm;
Cu/Pb Rougher Concentrate: 87 µm | | 44.1 | | 0.2 | | 0.0 | | 0.1 | | 0.03 | | 2 | | 0.4 | | 9.1 | | 20.4 | | 14.7 | | 12.3 | | 9.5 | | 10.0 | |
| Cu/Pb Cleaner 2 Conc. | | 3.9 | | 21.0 | | 0.9 | | 0.2 | | 1.57 | | 184 | | 21.2 | | 80.1 | | 52.1 | | 2.6 | | 56.8 | | 76.7 | | 45.7 | |
| Zn Cleaner 2 Concentrate | | - | | - | | - | | - | | - | | - | | - | | - | | - | | - | | - | | - | | - | |
| Zn Cleaner 1 Sc. Tailings | | - | | - | | - | | - | | - | | - | | - | | - | | - | | - | | - | | - | | - | |
| Zn Rougher Tailings | | - | | - | | - | | - | | - | | - | | - | | - | | - | | - | | - | | - | | - | |
| Feed | | 100.0 | | 1.0 | | 0.1 | | 0.2 | | 0.11 | | 9 | | 1.8 | | 100.0 | | 100.0 | | 100.0 | | 100.0 | | 100.0 | | 100.0 | |
ARC-058
Test 74 | | Talc Concentrate | | Flotation Feed: 68 µm;
Cu/Pb Rougher Concentrate: 50 µm;
Zn Rougher Concentrate: 44 µm | | 0.7 | | 1.6 | | 1.0 | | 0.9 | | 0.42 | | 47 | | 4.1 | | 0.2 | | 0.3 | | 0.0 | | 0.2 | | 0.3 | | 0.1 | |
| Cu/Pb Cleaner 2 Conc. | | 21.1 | | 26.1 | | 10.2 | | 2.6 | | 4.47 | | 394 | | 32.9 | | 89.5 | | 90.3 | | 3.8 | | 68.0 | | 79.4 | | 22.5 | |
| Zn Cleaner 2 Concentrate | | 21.8 | | 0.6 | | 0.2 | | 58.0 | | 0.35 | | 22 | | 33.7 | | 2.0 | | 1.9 | | 88.1 | | 5.5 | | 4.6 | | 23.8 | |
| Zn Cleaner 1 Sc. Tailings | | 4.7 | | 1.3 | | 0.4 | | 2.6 | | 1.67 | | 27 | | 42.8 | | 1.0 | | 0.7 | | 0.8 | | 5.6 | | 1.2 | | 6.4 | |
| Zn Rougher Tailings | | 46.9 | | 0.3 | | 0.1 | | 0.6 | | 0.21 | | 7 | | 27.4 | | 2.3 | | 2.7 | | 1.9 | | 7.1 | | 3.1 | | 41.5 | |
| Feed | | 100.0 | | 6.2 | | 2.4 | | 14.4 | | 1.39 | | 105 | | 30.9 | | 100.0 | | 100.0 | | 100.0 | | 100.0 | | 100.0 | | 100.0 | |
| | |
| Arctic Project | Page 167 |
| S-K 1300 Technical Report Summary | November 30, 2022 |
| | |
| | |
| | |
| Test | | Product | | Regrind Size
80% Passing | | Weight
(%) | | Assays | | Distribution (%) | |
Cu
(%) | | Pb
(%) | | Zn
(%) | | Au
(g/t) | | Ag
(g/t) | | S
(%) | | Cu | | Pb | | Zn | | Au | | Ag | | S | |
ARC-059
Test 84 | | Talc Concentrate | | Flotation Feed: 85 µm;
Cu/Pb Rougher Concentrate: 71 µm;
Zn Rougher Concentrate: 69 µm | | 16.5 | | 0.9 | | 0.2 | | 0.9 | | 0.96 | | 17 | | 2.1 | | 2.4 | | 4.2 | | 2.2 | | 29.8 | | 3.6 | | 2.6 | |
| Cu/Pb Cleaner 2 Conc. | | 18.1 | | 29.9 | | 2.9 | | 1.4 | | 1.70 | | 366 | | 32.2 | | 91.0 | | 87.8 | | 4.1 | | 57.9 | | 85.3 | | 45.0 | |
| Zn Cleaner 2 Concentrate | | 9.9 | | 0.9 | | 0.1 | | 55.0 | | 0.14 | | 22 | | 32.0 | | 1.5 | | 2.2 | | 85.9 | | 2.6 | | 2.8 | | 24.4 | |
| Zn Cleaner 1 Sc. Tailings | | 2.7 | | 0.7 | | 0.1 | | 1.2 | | 0.56 | | 14 | | 7.4 | | 0.3 | | 0.3 | | 0.5 | | 2.9 | | 0.5 | | 1.6 | |
| Zn Rougher Tailings | | 48.3 | | 0.1 | | 0.0 | | 0.1 | | 0.01 | | 5 | | 5.5 | | 0.8 | | 2.5 | | 1.1 | | 0.9 | | 3.1 | | 20.6 | |
| Feed | | 100.0 | | 5.9 | | 0.6 | | 6.3 | | 0.53 | | 77 | | 12.9 | | 100.0 | | 100.0 | | 100.0 | | 100.0 | | 100.0 | | 100.0 | |
ARC-062
Test 75 | | Talc Concentrate | | Flotation Feed: 71 µm;
Cu/Pb Rougher Concentrate: 42 µm;
Zn Rougher Concentrate: 43 µm | | 1.8 | | 0.8 | | 7.6 | | 1.6 | | 0.14 | | 56 | | 4.3 | | 0.6 | | 2.0 | | 0.1 | | 0.8 | | 1.8 | | 0.4 | |
| Cu/Pb Cleaner 2 Conc. | | 14.6 | | 13.6 | | 41.0 | | 3.6 | | 1.36 | | 326 | | 21.7 | | 88.2 | | 91.8 | | 2.7 | | 63.2 | | 87.8 | | 16.1 | |
| Zn Cleaner 2 Concentrate | | 30.7 | | 0.3 | | 0.4 | | 58.6 | | 0.12 | | 6 | | 32.3 | | 4.2 | | 1.7 | | 92.0 | | 11.7 | | 3.4 | | 50.3 | |
| Zn Cleaner 1 Sc. Tailings | | 4.4 | | 0.7 | | 0.5 | | 3.1 | | 0.61 | | 10 | | 37.1 | | 1.3 | | 0.4 | | 0.7 | | 8.6 | | 0.8 | | 8.4 | |
| Zn Rougher Tailings | | 44.9 | | 0.1 | | 0.2 | | 0.4 | | 0.04 | | 3 | | 8.2 | | 2.0 | | 1.0 | | 1.0 | | 5.7 | | 2.5 | | 18.7 | |
| Feed | | 100.0 | | 2.3 | | 6.5 | | 19.5 | | 0.31 | | 54 | | 19.7 | | 100.0 | | 100.0 | | 100.0 | | 100.0 | | 100.0 | | 100.0 | |
ARC-063
Test 85 | | Talc Concentrate | | Flotation Feed:117µm;
Cu/Pb Rougher Concentrate: 72 µm;
Zn Rougher Concentrate: 69 µm | | 43.1 | | 1.1 | | 0.1 | | 0.7 | | 0.01 | | 6 | | 2.4 | | 11.2 | | 25.3 | | 12.3 | | 6.8 | | 15.2 | | 12.3 | |
| Cu/Pb Cleaner 2 Conc. | | 11.4 | | 29.3 | | 0.4 | | 0.6 | | 0.36 | | 102 | | 30.4 | | 78.6 | | 56.3 | | 3.0 | | 64.7 | | 68.7 | | 41.5 | |
| Zn Cleaner 2 Concentrate | | 3.1 | | 1.7 | | 0.1 | | 55.6 | | 0.17 | | 14 | | 32.7 | | 1.2 | | 2.2 | | 73.0 | | 8.4 | | 2.6 | | 12.2 | |
| Zn Cleaner 1 Sc. Tailings | | 3.2 | | 1.0 | | 0.1 | | 1.4 | | 0.06 | | 7 | | 6.6 | | 0.8 | | 1.9 | | 1.9 | | 3.0 | | 1.3 | | 2.5 | |
| Zn Rougher Tailings | | 35.3 | | 0.2 | | 0.0 | | 0.2 | | 0.01 | | 2 | | 5.9 | | 1.4 | | 8.3 | | 2.5 | | 5.5 | | 4.2 | | 24.9 | |
| Feed | | 100.0 | | 4.3 | | 0.1 | | 2.4 | | 0.06 | | 17 | | 8.4 | | 100.0 | | 100.0 | | 100.0 | | 100.0 | | 100.0 | | 100.0 | |
ARC-068
Test 97 | | Talc Concentrate | | Flotation Feed: 68 µm;
Cu/Pb Rougher Concentrate: 69 µm;
Zn Rougher Concentrate: 59 µm | | - | | - | | - | | - | | - | | - | | - | | - | | - | | - | | - | | - | | - | |
| Cu/Pb Cleaner 2 Conc. | | 8.1 | | 31.4 | | 0.8 | | 0.7 | | 1.36 | | 186 | | 33.7 | | 95.6 | | 71.0 | | 4.4 | | 75.5 | | 72.4 | | 42.9 | |
| Zn Cleaner 2 Concentrate | | 2.2 | | 0.9 | | 0.1 | | 50.5 | | 0.52 | | 34 | | 32.0 | | 0.7 | | 2.8 | | 84.9 | | 7.9 | | 3.6 | | 11.1 | |
| Zn Cleaner 1 Sc. Tailings | | 3.4 | | 0.3 | | 0.1 | | 0.4 | | 0.12 | | 18 | | 21.7 | | 0.4 | | 2.1 | | 1.0 | | 2.8 | | 3.0 | | 11.6 | |
| Zn Rougher Tailings | | 83.3 | | 0.0 | | 0.0 | | 0.1 | | 0.01 | | 4 | | 1.9 | | 0.6 | | 17.4 | | 3.8 | | 5.7 | | 16.0 | | 25.3 | |
| Feed | | 100.0 | | 2.7 | | 0.1 | | 1.3 | | 0.15 | | 21 | | 6.4 | | 100.0 | | 100.0 | | 100.0 | | 100.0 | | 100.0 | | 100.0 | |
ARC-069
Test 106 | | Talc Concentrate | | Flotation Feed: 62 µm;
Cu/Pb Rougher Concentrate: 49 µm;
Zn Rougher Concentrate: 56 µm | | 9.6 | | 0.3 | | 0.3 | | 0.7 | | 0.01 | | 16 | | 1.7 | | 0.8 | | 2.4 | | 0.6 | | 0.7 | | 2.7 | | 0.7 | |
| Cu/Pb Cleaner 2 Conc. | | 10.8 | | 25.7 | | 9.6 | | 2.7 | | 0.58 | | 396 | | 32.8 | | 86.4 | | 83.3 | | 3.0 | | 44.8 | | 74.7 | | 15.0 | |
| Zn Cleaner 2 Concentrate | | 15.3 | | 0.6 | | 0.2 | | 58.4 | | 0.20 | | 24 | | 33.9 | | 3.0 | | 2.7 | | 91.2 | | 22.0 | | 6.4 | | 22.1 | |
| Zn Cleaner 1 Sc. Tailings | | 12.2 | | 0.4 | | 0.2 | | 0.7 | | 0.12 | | 12 | | 50.0 | | 1.5 | | 1.7 | | 0.9 | | 10.5 | | 2.6 | | 25.8 | |
| Zn Rougher Tailings | | 48.5 | | 0.2 | | 0.1 | | 0.3 | | 0.04 | | 9 | | 14.8 | | 3.2 | | 3.9 | | 1.6 | | 13.9 | | 7.6 | | 30.5 | |
| Feed | | 100.0 | | 3.2 | | 1.2 | | 9.8 | | 0.14 | | 57 | | 23.6 | | 100.0 | | 100.0 | | 100.0 | | 100.0 | | 100.0 | | 100.0 | |
ARC-072
Test 78 | | Talc Concentrate | | Flotation Feed: 69 µm;
Cu/Pb Rougher Concentrate: 46 µm;
Zn Rougher Concentrate: 36 µm | | 3.0 | | 0.6 | | 0.4 | | 1.3 | | 0.32 | | 57 | | 3.2 | | 0.4 | | 2.7 | | 0.4 | | 0.8 | | 1.6 | | 0.4 | |
| Cu/Pb Cleaner 2 Conc. | | 16.3 | | 29.3 | | 1.8 | | 3.5 | | 5.38 | | 476 | | 33.6 | | 91.5 | | 70.2 | | 6.1 | | 71.3 | | 71.6 | | 21.9 | |
| Zn Cleaner 2 Concentrate | | 14.2 | | 0.7 | | 0.2 | | 56.2 | | 0.69 | | 48 | | 33.3 | | 1.8 | | 5.0 | | 85.5 | | 8.0 | | 6.3 | | 18.9 | |
| Zn Cleaner 1 Sc. Tailings | | 3.8 | | 0.9 | | 0.2 | | 2.1 | | 0.54 | | 51 | | 27.1 | | 0.6 | | 1.8 | | 0.8 | | 1.7 | | 1.8 | | 4.1 | |
| Zn Rougher Tailings | | 58.8 | | 0.2 | | 0.1 | | 0.2 | | 0.24 | | 19 | | 21.2 | | 2.0 | | 13.9 | | 1.2 | | 11.5 | | 10.3 | | 49.9 | |
| Feed | | 100.0 | | 5.2 | | 0.4 | | 9.3 | | 1.23 | | 108 | | 25.0 | | 100.0 | | 100.0 | | 100.0 | | 100.0 | | 100.0 | | 100.0 | |
ARC-080
Test 113 | | Talc Concentrate | | Flotation Feed: 68 µm;
Cu/Pb Rougher Concentrate: 45 µm | | 6.4 | | 0.2 | | 0.0 | | 0.0 | | 0.15 | | 10 | | 0.4 | | 0.9 | | 4.7 | | 1.7 | | 1.6 | | 2.7 | | 1.0 | |
| Cu/Pb Cleaner 2 Conc. | | 3.6 | | 30.4 | | 1.0 | | 0.4 | | 12.7 | | 426 | | 31.3 | | 88.4 | | 66.5 | | 9.8 | | 77.2 | | 65.0 | | 43.3 | |
| Zn Cleaner 2 Concentrate | | - | | - | | - | | - | | - | | - | | - | | - | | - | | - | | - | | - | | - | |
| Zn Cleaner 1 Sc. Tailings | | - | | - | | - | | - | | - | | - | | - | | - | | - | | - | | - | | - | | - | |
| Zn Rougher Tailings | | - | | - | | - | | - | | - | | - | | - | | - | | - | | - | | - | | - | | - | |
| Feed | | 100.0 | | 1.3 | | 0.1 | | 0.2 | | 0.60 | | 24 | | 2.6 | | 100.0 | | 100.0 | | 100.0 | | 100.0 | | 100.0 | | 100.0 | |
ARC-084
Test 91 | | Talc Concentrate | | Flotation Feed: 78 µm;
Cu/Pb Rougher Concentrate: 46 µm;
Zn Rougher Concentrate: 43 µm | | 2.1 | | 0.5 | | 0.3 | | 0.9 | | 0.04 | | 15 | | 3.9 | | 0.4 | | 1.5 | | 0.3 | | 0.5 | | 1.1 | | 0.3 | |
| Cu/Pb Cleaner 2 Conc. | | 9.0 | | 25.2 | | 3.0 | | 5.5 | | 1.40 | | 180 | | 35.0 | | 85.8 | | 60.1 | | 9.3 | | 71.7 | | 57.6 | | 13.0 | |
| Zn Cleaner 2 Concentrate | | 7.5 | | 0.9 | | 0.3 | | 54.6 | | 0.18 | | 42 | | 33.1 | | 2.7 | | 5.3 | | 77.4 | | 7.7 | | 11.3 | | 10.3 | |
| Zn Cleaner 1 Sc. Tailings | | 2.5 | | 1.3 | | 0.4 | | 3.1 | | 0.18 | | 29 | | 30.2 | | 1.3 | | 2.4 | | 1.5 | | 2.6 | | 2.6 | | 3.2 | |
| Zn Rougher Tailings | | 75.9 | | 0.2 | | 0.1 | | 0.3 | | 0.01 | | 7 | | 21.9 | | 4.3 | | 22.3 | | 4.4 | | 4.3 | | 18.9 | | 68.9 | |
| Feed | | 100.0 | | 2.6 | | 0.4 | | 5.3 | | 0.18 | | 28 | | 24.1 | | 100.0 | | 100.0 | | 100.0 | | 100.0 | | 100.0 | | 100.0 | |
ARC-086
Test 86 | | Talc Concentrate | | Flotation Feed: 59 µm;
Cu/Pb Rougher Concentrate: 45 µm;
Zn Rougher Concentrate: 35 µm | | 0.4 | | 0.3 | | 0.1 | | 0.2 | | 0.81 | | 14 | | 1.7 | | 0.0 | | 0.1 | | 0.0 | | 0.3 | | 0.1 | | 0.0 | |
| Cu/Pb Cleaner 2 Conc. | | 10.7 | | 28.7 | | 7.1 | | 1.2 | | 6.54 | | 430 | | 33.3 | | 75.9 | | 87.3 | | 1.8 | | 63.0 | | 55.4 | | 15.6 | |
| Zn Cleaner 2 Concentrate | | 12.4 | | 5.1 | | 0.2 | | 53.8 | | 0.79 | | 176 | | 32.1 | | 15.7 | | 2.4 | | 92.9 | | 8.9 | | 26.4 | | 17.5 | |
| Zn Cleaner 1 Sc. Tailings | | 3.0 | | 1.8 | | 0.3 | | 2.0 | | 1.53 | | 70 | | 28.2 | | 1.3 | | 0.9 | | 0.8 | | 4.1 | | 2.5 | | 3.7 | |
| Zn Rougher Tailings | | 71.0 | | 0.1 | | 0.1 | | 0.1 | | 0.18 | | 9 | | 19.1 | | 2.3 | | 4.9 | | 1.2 | | 11.5 | | 7.7 | | 59.6 | |
| Feed | | 100.0 | | 4.0 | | 0.9 | | 7.2 | | 1.11 | | 83 | | 22.7 | | 100.0 | | 100.0 | | 100.0 | | 100.0 | | 100.0 | | 100.0 | |
ARC-087
Test 87 | | Talc Concentrate | | Flotation Feed: 67 µm;
Cu/Pb Rougher Concentrate: 36 µm;
Zn Rougher Concentrate: 31 µm | | 1.4 | | 0.9 | | 0.5 | | 0.7 | | 0.21 | | 24 | | 2.0 | | 0.1 | | 0.2 | | 0.1 | | 0.1 | | 0.2 | | 0.1 | |
| Cu/Pb Cleaner 2 Conc. | | 37.1 | | 26.4 | | 10.4 | | 6.6 | | 6.04 | | 394 | | 30.7 | | 91.9 | | 91.9 | | 16.6 | | 66.5 | | 83.9 | | 47.6 | |
| Zn Cleaner 2 Concentrate | | 14.1 | | 0.7 | | 0.4 | | 61.7 | | 0.78 | | 30 | | 32.4 | | 0.9 | | 1.3 | | 59.0 | | 3.3 | | 2.4 | | 19.0 | |
| Zn Cleaner 1 Sc. Tailings | | 2.9 | | 3.3 | | 0.9 | | 13.3 | | 12.2 | | 96 | | 27.1 | | 0.9 | | 0.6 | | 2.6 | | 10.5 | | 1.6 | | 3.3 | |
| Zn Rougher Tailings | | 36.9 | | 0.6 | | 0.2 | | 0.7 | | 0.61 | | 18 | | 13.1 | | 1.9 | | 1.7 | | 1.8 | | 6.7 | | 3.8 | | 20.2 | |
| Feed | | 100.0 | | 10.7 | | 4.2 | | 14.7 | | 3.37 | | 174 | | 23.9 | | 100.0 | | 100.0 | | 100.0 | | 100.0 | | 100.0 | | 100.0 | |
ARC-092
Test 90 | | Talc Concentrate | | Flotation Feed: 68 µm;
Cu/Pb Rougher Concentrate: 46 µm;
Zn Rougher Concentrate: 29 µm | | 5.1 | | 0.5 | | 0.0 | | 0.2 | | 0.03 | | 5 | | 2.6 | | 0.5 | | 1.6 | | 0.2 | | 0.6 | | 1.2 | | 0.4 | |
| Cu/Pb Cleaner 2 Conc. | | 13.7 | | 29.1 | | 0.4 | | 2.5 | | 1.01 | | 108 | | 34.6 | | 87.6 | | 46.6 | | 6.7 | | 54.3 | | 67.0 | | 15.4 | |
| Zn Cleaner 2 Concentrate | | 7.8 | | 1.2 | | 0.2 | | 54.4 | | 0.59 | | 24 | | 33.8 | | 2.0 | | 9.0 | | 83.0 | | 18.0 | | 8.4 | | 8.5 | |
| Zn Cleaner 1 Sc. Tailings | | 1.7 | | 2.6 | | 0.2 | | 3.3 | | 0.06 | | 26 | | 27.0 | | 0.9 | | 2.6 | | 1.1 | | 0.4 | | 1.9 | | 1.5 | |
| Zn Rougher Tailings | | 68.8 | | 0.3 | | 0.1 | | 0.2 | | 0.04 | | 4 | | 31.8 | | 4.4 | | 31.8 | | 2.8 | | 10.8 | | 12.4 | | 71.0 | |
| Feed | | 100.0 | | 4.6 | | 0.1 | | 5.1 | | 0.26 | | 22 | | 30.8 | | 100.0 | | 100.0 | | 100.0 | | 100.0 | | 100.0 | | 100.0 | |
ARC-098
Test 93 | | Talc Concentrate | | Flotation Feed:103µm;
Cu/Pb Rougher Concentrate: 89 µm | | - | | - | | - | | - | | - | | - | | - | | - | | - | | - | | - | | - | | - | |
| Cu/Pb Cleaner 2 Conc. | | 4.0 | | 25.6 | | 0.7 | | 0.8 | | 1.32 | | 578 | | 29.5 | | 97.8 | | 69.9 | | 34.5 | | 75.8 | | 92.6 | | 82.1 | |
| Zn Cleaner 2 Concentrate | | - | | - | | - | | - | | - | | - | | - | | - | | - | | - | | - | | - | | - | |
| Zn Cleaner 1 Sc. Tailings | | - | | - | | - | | - | | - | | - | | - | | - | | - | | - | | - | | - | | - | |
| Zn Rougher Tailings | | - | | - | | - | | - | | - | | - | | - | | - | | - | | - | | - | | - | | - | |
| Feed | | 100.0 | | 1.1 | | 0.0 | | 0.1 | | 0.07 | | 25 | | 1.5 | | 100.0 | | 100.0 | | 100.0 | | 100.0 | | 100.0 | | 100.0 | |
ARC-099
Test 80 | | Talc Concentrate | | Flotation Feed: 69 µm;
Cu/Pb Rougher Concentrate: 48 µm;
Zn Rougher Concentrate: 41 µm | | 2.0 | | 0.9 | | 0.5 | | 0.6 | | 0.04 | | 22 | | 1.8 | | 0.3 | | 0.4 | | 0.1 | | 0.2 | | 0.5 | | 0.2 | |
| Cu/Pb Cleaner 2 Conc. | | 19.9 | | 28.3 | | 9.9 | | 2.8 | | 0.95 | | 404 | | 31.9 | | 90.4 | | 89.6 | | 4.7 | | 55.9 | | 86.6 | | 29.0 | |
| Zn Cleaner 2 Concentrate | | 15.7 | | 0.6 | | 0.3 | | 63.2 | | 0.11 | | 18 | | 32.5 | | 1.4 | | 2.1 | | 83.3 | | 5.1 | | 3.0 | | 23.3 | |
| Zn Cleaner 1 Sc. Tailings | | 4.1 | | 1.8 | | 0.4 | | 7.5 | | 0.71 | | 30 | | 29.1 | | 1.2 | | 0.7 | | 2.6 | | 8.7 | | 1.3 | | 5.5 | |
| Zn Rougher Tailings | | 54.2 | | 0.2 | | 0.1 | | 0.2 | | 0.10 | | 4 | | 14.7 | | 2.1 | | 2.0 | | 0.8 | | 16.1 | | 2.3 | | 36.4 | |
| Feed | | 100.0 | | 6.2 | | 2.2 | | 11.9 | | 0.34 | | 93 | | 21.9 | | 100.0 | | 100.0 | | 100.0 | | 100.0 | | 100.0 | | 100.0 | |
| | |
| Arctic Project | Page 168 |
| S-K 1300 Technical Report Summary | November 30, 2022 |
| | |
| 10.4.5.4 | Copper/Lead Separation Testwork |
A copper-lead separation test was included for the bulk concentrate produced in selected cleaner tests and later cycles of 5 locked-cycle tests. Table 10-30 summarizes the copper/lead separation testwork results.
Reasonable separations were achieved for all but ARC-003. For ARC-003, a low-grade lead concentrate which measured only about 16% lead was produced, even when the test was repeated with a much higher sodium cyanide dosage. It is unclear what caused the poor copper-lead separation for ARC-003. For the other 7 samples tested, lead recoveries from the bulk concentrate ranged between 75 and 95% to a lead concentrate with an average grade of about 56% lead in open circuit.
Copper-lead separation recoveries from tests on the locked cycle test concentrates were applied to bulk circuit recoveries to calculate overall recoveries. Silver recovery to the lead concentrate averaged about 75%, but gold recoveries in the copper separation tests varied widely and might indicate differences in gold deportment and associations between lithology types.
Figure 10 9 summarises the results showing the individual and combined concentrate grades and copper recovery. Figure 10 10 summarises the results showing the individual and combined concentrate grades and lead recovery.
| Figure 10-9: | Variability Composite Copper Recovery vs. Concentrate Grade |
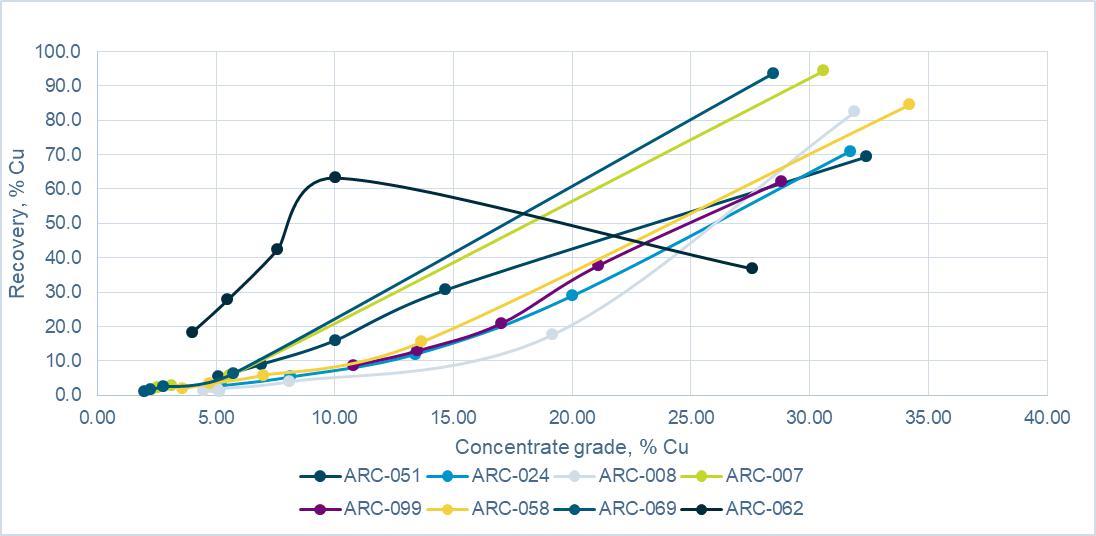
Source: Ausenco, 2022.
| | |
| Arctic Project | Page 169 |
| S-K 1300 Technical Report Summary | November 30, 2022 |
| | |
| Figure 10-10: | Variability Composite Lead Recovery vs. Concentrate Grade |

Source: Ausenco, 2022.
| | |
| Arctic Project | Page 170 |
| S-K 1300 Technical Report Summary | November 30, 2022 |
| | |
| Table 10-30: | ALS Lead Separation Test Results |
| Test | | Product | | Weight
(%) | | Assays | | Distribution (%) | |
Cu
(%) | | Pb
(%) | | Zn
(%) | | Ag
(g/t) | | Au
(g/t) | | S
(%) | | Cu | | Pb | | Zn | | Ag | | Au | | S | |
ARC-051
Cu/Pb Separation Feed from Open Circuit Test (Test 88) | | Pb 3rd Cleaner Concentrate | | 25.5 | | 5.1 | | 48.4 | | 9.3 | | 1242 | | 4.6 | | 21.5 | | 5.5 | | 86.2 | | 68.2 | | 83.9 | | 75.9 | | 17.7 | |
| Pb 2nd Cleaner Concentrate | | 30.9 | | 6.9 | | 43.8 | | 9.11 | | 1098 | | 3.94 | | 23.5 | | 9.0 | | 92.0 | | 81.0 | | 90.0 | | 79.7 | | 23.4 | |
| Pb 1st Cleaner Concentrate | | 37.7 | | 10.0 | | 37.3 | | 8.0 | | 938 | | 3.35 | | 25.3 | | 16 | | 95.8 | | 86.9 | | 93.9 | | 82.8 | | 30.8 | |
| Pb Rougher Concentrate | | 49.4 | | 14.7 | | 29.1 | | 6.41 | | 734 | | 2.68 | | 27.3 | | 30.6 | | 97.8 | | 91.1 | | 96.2 | | 86.4 | | 43.6 | |
| Pb Rougher Tailings (Cu Concentrate) | | 50.6 | | 32.4 | | 0.7 | | 0.6 | | 28 | | 0.41 | | 34.5 | | 69.4 | | 2.2 | | 8.9 | | 3.8 | | 13.6 | | 56.4 | |
| Cu/Pb 2nd Cleaner Concentrate (Head) | | 100.0 | | 23.6 | | 14.7 | | 3.47 | | 377 | | 1.53 | | 31 | | 100 | | 100 | | 100 | | 100 | | 100 | | 100 | |
ARC-024
Cu/Pb Separation Feed from Open Circuit Test (Test 89) | | Pb 3rd Cleaner Concentrate | | 14.4 | | 5.2 | | 58.6 | | 5.9 | | 2230 | | 17 | | 18.6 | | 2.8 | | 87.5 | | 47.3 | | 78.5 | | 72.9 | | 8.2 | |
| Pb 2nd Cleaner Concentrate | | 17.8 | | 8.1 | | 50.5 | | 5.7 | | 1929 | | 14.4 | | 21.0 | | 5.3 | | 93.2 | | 56.4 | | 83.9 | | 76.2 | | 11.5 | |
| Pb 1st Cleaner Concentrate | | 24.2 | | 13.4 | | 38.5 | | 4.8 | | 1481 | | 11.3 | | 24.4 | | 12.0 | | 96.6 | | 64.6 | | 87.5 | | 81.1 | | 18.2 | |
| Pb Rougher Concentrate | | 39.3 | | 20.0 | | 24.2 | | 3.3 | | 949 | | 7.4 | | 28.3 | | 29.0 | | 98.2 | | 72.7 | | 90.8 | | 86.5 | | 34.2 | |
| Pb Rougher Tailings (Cu Concentrate) | | 60.7 | | 31.7 | | 0.3 | | 0.8 | | 62 | | 0.75 | | 35.3 | | 81 | | 1.8 | | 27.3 | | 9.2 | | 13.5 | | 65.8 | |
| Cu/Pb 2nd Cleaner Concentrate (Head) | | 100.0 | | 27.1 | | 9.7 | | 1.8 | | 410 | | 3.4 | | 32.6 | | 100 | | 100 | | 100 | | 100 | | 100 | | 100 | |
ARC-007
Cu/Pb Separation Feed from LCT-96
(Cycle 5) | | Pb 3rd Cleaner Concentrate | | 19.3 | | 2.3 | | 58.6 | | 6.0 | | 1710 | | 0.4 | | 19.9 | | 1.8 | | 93.4 | | 29 | | 57.3 | | 1.7 | | 12.1 | |
| Pb 2nd Cleaner Concentrate | | 20.8 | | 2.5 | | 55.8 | | 6.04 | | 1629 | | 0.5 | | 21.4 | | 2.2 | | 95.8 | | 31.4 | | 58.8 | | 2.2 | | 14.0 | |
| Pb 1st Cleaner Concentrate | | 21.9 | | 3.1 | | 53.8 | | 6.04 | | 1574 | | 0.54 | | 21.8 | | 2.8 | | 96.9 | | 33.0 | | 59.6 | | 2.4 | | 15.1 | |
| Pb Rougher Concentrate | | 24.6 | | 5.6 | | 48.2 | | 5.8 | | 1438 | | 1.05 | | 22.9 | | 5.6 | | 97.9 | | 35.4 | | 61.3 | | 5.4 | | 17.8 | |
| Pb Rougher Tailings (Cu Concentrate) | | 75.4 | | 30.6 | | 0.3 | | 3.4 | | 296 | | 6.03 | | 34.6 | | 94.4 | | 2.1 | | 64.6 | | 38.7 | | 94.6 | | 82.2 | |
| Cu/Pb 2nd Cleaner Concentrate (Head) | | 100.0 | | 24.4 | | 12.1 | | 4 | | 577 | | 4.8 | | 31.7 | | 100 | | 100 | | 100 | | 100 | | 100 | | 100 | |
ARC-099
Cu/Pb Separation Feed from
LCT-100 (Cycle 5) | | Pb 3rd Cleaner Concentrate | | 20.3 | | 10.7 | | 46.5 | | 5 | | 1420 | | 0.98 | | 22.1 | | 8.6 | | 94.7 | | 18.3 | | 81.2 | | 12.4 | | 14.2 | |
| Pb 2nd Cleaner Concentrate | | 23.9 | | 13.1 | | 40.2 | | 4.8 | | 1230 | | 0.94 | | 23.8 | | 12.4 | | 96.3 | | 20.7 | | 82.8 | | 14.0 | | 18.0 | |
| Pb 1st Cleaner Concentrate | | 29.0 | | 15.7 | | 33.6 | | 4.52 | | 1033 | | 0.88 | | 25.5 | | 18.0 | | 97.4 | | 23.6 | | 84.2 | | 15.9 | | 23.4 | |
| Pb Rougher Concentrate | | 37.6 | | 18.9 | | 26.1 | | 4.3 | | 815 | | 0.96 | | 27.4 | | 28.1 | | 98.2 | | 29.2 | | 86.1 | | 22.4 | | 32.5 | |
| Pb Rougher Tailings (Cu Concentrate) | | 62.4 | | 29.2 | | 0.3 | | 6.3 | | 79 | | 2.0 | | 34.2 | | 71.9 | | 1.8 | | 70.8 | | 13.9 | | 77.6 | | 67.5 | |
| Cu/Pb 2nd Cleaner Concentrate (Head) | | 100.0 | | 25.3 | | 10.0 | | 5.5 | | 356 | | 1.6 | | 31.6 | | 100 | | 100 | | 100 | | 100 | | 100 | | 100 | |
ARC-058
Cu/Pb Separation Feed from
LCT-104 (Cycle 5) | | Pb 3rd Cleaner Concentrate | | 14.9 | | 3.6 | | 60.7 | | 5.2 | | 2012 | | 8.75 | | 19.2 | | 1.9 | | 83.1 | | 32.1 | | 68.8 | | 37.6 | | 8.8 | |
| Pb 2nd Cleaner Concentrate | | 19.8 | | 4.7 | | 51.1 | | 5.9 | | 17.1 | | 7.5 | | 22.8 | | 3.4 | | 92.4 | | 47.8 | | 76.9 | | 42.6 | | 13.9 | |
| Pb 1st Cleaner Concentrate | | 23.2 | | 7.0 | | 45.3 | | 5.6 | | 1523 | | 6.8 | | 24.4 | | 5.8 | | 96.2 | | 53.7 | | 80.8 | | 45.1 | | 17.4 | |
| Pb Rougher Concentrate | | 31.5 | | 13.7 | | 34.0 | | 4.6 | | 1166 | | 6.1 | | 27.0 | | 15.5 | | 98.1 | | 59.8 | | 84.0 | | 54.9 | | 26.2 | |
| Pb Rougher Tailings (Cu Concentrate) | | 68.5 | | 34.2 | | 0.3 | | 1.4 | | 102 | | 2.3 | | 35.0 | | 84.5 | | 1.9 | | 40.2 | | 16.0 | | 45.1 | | 73.8 | |
| Cu/Pb 2nd Cleaner Concentrate (Head) | | 100.0 | | 27.7 | | 10.9 | | 2.4 | | 437 | | 3.5 | | 32.5 | | 100 | | 100 | | 100 | | 100 | | 100 | | 100 | |
ARC-062
Cu/Pb Separation Feed from
LCT-105 (Cycle 5) | | Pb 3rd Cleaner Concentrate | | 60.0 | | 4.0 | | 63.4 | | 7.0 | | 482 | | 1.5 | | 17.8 | | 18.3 | | 92.1 | | 74.8 | | 85.6 | | 65.5 | | 45.3 | |
| Pb 2nd Cleaner Concentrate | | 66.2 | | 5.5 | | 59.3 | | 6.9 | | 454 | | 1.5 | | 19.0 | | 27.8 | | 95.0 | | 81.4 | | 89.0 | | 72.1 | | 53.3 | |
| Pb 1st Cleaner Concentrate | | 73.2 | | 7.6 | | 54.6 | | 6.6 | | 424 | | 1.7 | | 20.2 | | 42.4 | | 96.7 | | 85.9 | | 91.8 | | 93.1 | | 62.8 | |
| Pb Rougher Concentrate | | 82.6 | | 10.0 | | 49.1 | | 6.2 | | 389 | | 1.5 | | 21.7 | | 63.2 | | 98.1 | | 90.5 | | 94.9 | | 94.9 | | 75.9 | |
| Pb Rougher Tailings (Cu Concentrate) | | 17.4 | | 27.6 | | 4.6 | | 3.1 | | 98 | | 0.4 | | 32.6 | | 36.8 | | 1.9 | | 9.5 | | 5.1 | | 5.1 | | 24.1 | |
| Cu/Pb 2nd Cleaner Concentrate (Head) | | 100.0 | | 13.1 | | 41.3 | | 5.6 | | 338 | | 1.3 | | 23.6 | | 100 | | 100 | | 100 | | 100 | | 100 | | 100 | |
ARC-069
Cu/Pb Separation Feed from LCT-114 (Cycle 5) | | Pb 3rd Cleaner Concentrate | | 12.0 | | 2.0 | | 60.4 | | 3.2 | | 2168 | | 0.2 | | 16.5 | | 1.1 | | 75.1 | | 11.1 | | 64.0 | | 4.3 | | 6.2 | |
| Pb 2nd Cleaner Concentrate | | 16.5 | | 2.2 | | 51.1 | | 4.6 | | 1848 | | 0.23 | | 20.9 | | 1.6 | | 88.0 | | 2.1 | | 75.6 | | 6.6 | | 10.8 | |
| Pb 1st Cleaner Concentrate | | 20.6 | | 2.8 | | 44.1 | | 5.1 | | 1596 | | 0.25 | | 23.9 | | 2.5 | | 94.6 | | 30.6 | | 81.4 | | 8.7 | | 15.4 | |
| Pb Rougher Concentrate | | 25.2 | | 5.7 | | 37.1 | | 5.1 | | 1355 | | 0.3 | | 25.3 | | 6.4 | | 97.3 | | 37.7 | | 84.5 | | 12.4 | | 19.9 | |
| Pb Rougher Tailings (Cu Concentrate) | | 74.8 | | 28.5 | | 0.4 | | 2.9 | | 84 | | 0.7 | | 34.3 | | 93.6 | | 2.7 | | 62.3 | | 15.5 | | 87.6 | | 80.1 | |
| Cu/Pb 2nd Cleaner Concentrate (Head) | | 100.0 | | 22.7 | | 9.6 | | 3.4 | | 405 | | 0.6 | | 32.0 | | 100 | | 100 | | 100 | | 100 | | 100 | | 100 | |
ARC-008
Cu/Pb Separation Feed from
LCT-116 (Cycle 5) | | Pb 4th Cleaner Concentrate | | 5.4 | | 5.1 | | 64.6 | | 3.1 | | 2540 | | 3.1 | | 16.1 | | 1.0 | | 47.2 | | 6.5 | | 39.0 | | 4.3 | | 2.6 | |
| Pb 3rd Cleaner Concentrate | | 9.3 | | 4.5 | | 62.5 | | 4.0 | | 2298 | | 2.3 | | 17.4 | | 1.5 | | 78.2 | | 14.6 | | 60.5 | | 5.4 | | 4.9 | |
| Pb 2nd Cleaner Concentrate | | 11.1 | | 5.1 | | 59.5 | | 4.5 | | 2176 | | 2.2 | | 18.4 | | 2.0 | | 88.9 | | 19.4 | | 68.4 | | 6.2 | | 6.1 | |
| Pb 1st Cleaner Concentrate | | 13.9 | | 8.1 | | 50.5 | | 4.9 | | 1858 | | 2.5 | | 21.0 | | 3.9 | | 94.9 | | 26.8 | | 73.4 | | 8.9 | | 8.8 | |
| Pb Rougher Concentrate | | 26.2 | | 19.2 | | 27.5 | | 3.5 | | 1060 | | 3.8 | | 27.5 | | 17.6 | | 97.0 | | 36.0 | | 78.7 | | 25.5 | | 21.7 | |
| Pb Rougher Tailings (Cu Concentrate) | | 73.8 | | 31.9 | | 0.3 | | 2.2 | | 102 | | 4.0 | | 35.2 | | 82.4 | | 3.0 | | 64.0 | | 21.3 | | 47.5 | | 78.3 | |
| | | | | | | | | | | | | | | | | | | | | | | | | | | | |
| | |
| Arctic Project | Page 171 |
| S-K 1300 Technical Report Summary | November 30, 2022 |
| | |
| 10.5 | Comment on Mineral Processing and Metallurgical Testwork |
The materials tested in the metallurgical programs as described in this Section are representative of the LOM production.
The bulk flotation flowsheet developed based on the 2012 to 2022 testwork is feasible.
Recent grinding and concentrate dewatering testwork have supported the selected flow sheet. Additional concentrate characterization is also recommended for future metallurgical samples to bolster the confidence in the design of the proposed grinding plant.
The continuation of the geometallurgical program is recommended to further confirm the flowsheet and better understand the continuity of the Arctic deposit with respect to the metallurgical response. This testwork is recommended to take the form of locked cycle tests using a variety of metallurgical samples representing both lithology types and spatial zones within the deposit. A continuation of a phased approach to additional testwork is recommended to ensure that representative testwork is managed properly.
Historical testwork has shown the lead concentrate quality to be impacted by talc flotation efficiency. Recent testwork demonstrated a better understanding of the level of talc in an expected process feed to avoid mis-representing the talc content of future samples. There is little reason to expect concentrates will be impaired by talc contamination as talc can be effectively removed from the base metal flotation process, mitigating the potential of talc diluting the base metal concentrates. Talc and fluorine levels will be managed by optimization of the talc pre-float circuit, effectively removing talc and fluorine to ensure the quality of the lead concentrate.
There are no outstanding metallurgical issues related to the production of a copper or zinc concentrate from all of the materials tested.
In the QP’s opinion, based on the summarized testwork and predictions made from that testwork in terms of mineralogy, plant design considerations, recovery forecasts, and presence of deleterious elements, the predictions of proposed throughput and metallurgical performance are adequate for the purposes used in the Report.
| | |
| Arctic Project | Page 172 |
| S-K 1300 Technical Report Summary | November 30, 2022 |
| | |
| 11 | MINERAL RESOURCE ESTIMATES |
In early 2022, Ambler Metals completed an update of the Arctic Mineral Resource model based on all available drill results through to the end of 2021 drilling campaign. Wood’s QP reviewed the model and visited the Arctic Property and core storage sites.
The current Mineral Resource was prepared by Ambler Metals using the following:
| • | Updated geological models including the talc model using the additional drill hole data collected from 2019 and 2021; |
| • | Updated resource estimation using the additional drill hole data collected from 2019 and 2021 (see Table 11-1, and Section 11.3.3). |
The Wood QP reviewed and validated the Mineral Resource model.
Composites and 3D solid models were constructed using Leapfrog commercial modelling software. The block model is setup in NAD 83 datum and extends a total of 1,910 m in the east-west direction, 1,950 m north-south, and 705 m in the vertical direction. The block model has a parent block size of 10 x 10 x 5 m with a sub-block size of 2 x 2 x 1 m.
The Mineral Resource estimate is accepted by Wood’s QP as being current as of November 30, 2022 and is in accordance with the with the standards and definitions required under S-K 1300.
| Table 11-1: | List of Drill Holes used in 2022 Ambler Metals Resource Model that were Not Included in the 2020 SRK Model |
| Hole ID | Geologic Model | Resource Model | Notes |
| AR19-0164 | Yes | Yes | - |
| AR19-0165 | Yes | Yes | - |
| AR19-0165a | Yes | Yes | - |
| AR19-0166 | Yes | Yes | - |
| AR19-0167 | Yes | Yes | - |
| AR19-0168 | Yes | Yes | - |
| AR19-0168a | Yes | Yes | - |
| AR19-0169 | Yes | Yes | - |
| AR19-0170 | Yes | Yes | - |
| AR19-0171 | Yes | Yes | - |
| AR19-0172 | Yes | Yes | - |
| AR21-0173 | Yes | Yes | - |
| AR21-0174 | Yes | Yes | - |
| | |
| Arctic Project | Page 173 |
| S-K 1300 Technical Report Summary | November 30, 2022 |
| | |
| Hole ID | Geologic Model | Resource Model | Notes |
| AR21-0175 | Yes | Partially missing talc information | Talc samples are not interpreted to be in Minzones |
| AR21-0176 | Yes | Yes | - |
| AR21-0177 | Yes | Yes | - |
| AR21-0178 | Yes | Partially missing talc information | Talc intercepts within Minzone |
| AR21-0179 | Yes | No | - |
| AR21-0180 | Yes | Partially missing talc information | Talc intercepts within Minzone 3 |
| AR21-0181 | Yes | No | - |
| AR21-0182 | Yes | Yes | - |
| AR21-0183 | Yes | No | - |
| AR21-0184 | Yes | No | - |
| AR21-0185 | Yes | Yes | - |
| AR21-0186 | Yes | Partially missing assays | No assay data for Minzone 4, 3, 2.5, 2 and 1 |
| AR21-0187 | Yes | Partially missing talc information | Talc not currently in Minzone, this may change when assays are back |
| AR21-0188 | Yes | Partially missing assay information (only below 202.23 meters) | No assay data for Minzone 3 and 5 |
| AR21-0189 | Yes | No | - |
| AR21-0190 | Yes | No | - |
Ambler Metals uses GeoSpark software for the drill hole logging data entries and management. Core logging data is entered directly to the GeoSpark software by core logging geologists, and the data is synchronized to the local server during the field season. After the field season is over, data validation is performed within the GeoSpark software, and the data is transferred to the master server.
For the current resource model, the cut-off date for the assay drill hole database is November 30, 2021. The assay database consists of collar, survey, assay, lithology, SG, geology, and geotechnical information. The assay database contains 171 drill holes with 3,224 assay samples, totalling 3,539.73 m.
At the assay cut-off date, out of 18 holes drilled in 2021, Ambler Metals had yet to receive assay results for six full holes and six partial holes due to heavy backlog at the assay laboratory.
Sample data for copper, lead, zinc, gold, and silver were extracted from this database for use in the generation of this resource estimate.
Individual sample intervals range from 0.08 m to 5.85 m in length and average 1.10 m. Drill hole sample interval protocol has varied throughout time at Arctic. Typically, shoulder samples were taken outside the mineralized zones up to 20 m.
Table 11-2 shows a summary statistic table of the raw assay.
| | |
| Arctic Project | Page 174 |
| S-K 1300 Technical Report Summary | November 30, 2022 |
| | |
| Table 11-2: | Summary Statistics of Assay Database, Length Weighted |
| Element | | Unit | | Count | | Total Length
(m) | | Minimum | | Maximum | | Mean | | Standard
Deviation | | Coefficient
of Variation | |
| Ag | | g/t | | 2,983 | | 3,298 | | 0.0 | | 1,155.0 | | 46.1 | | 59.77 | | 1.30 | |
| As | | ppm | | 1,891 | | 2,131 | | 0.6 | | 10,000.0 | | 1,028.1 | | 1,837.60 | | 1.79 | |
| Au | | g/t | | 2,841 | | 3,141 | | 0.00 | | 32.80 | | 0.66 | | 1.60 | | 2.43 | |
| Cd | | ppm | | 1,891 | | 2,131 | | 0.08 | | 1,000.00 | | 198.52 | | 247.27 | | 1.25 | |
| Cu | | % | | 3,000 | | 3,324 | | 0.00 | | 31.00 | | 2.92 | | 3.13 | | 1.07 | |
| Fe | | % | | 1,891 | | 2,131 | | 0.37 | | 32.10 | | 9.69 | | 6.69 | | 0.69 | |
| Hg | | ppm | | 1,176 | | 1,068 | | 0.0 | | 43.9 | | 1.9 | | 2.74 | | 1.47 | |
| Pb | | % | | 2,935 | | 3,246 | | 0.00 | | 21.80 | | 0.86 | | 1.59 | | 1.84 | |
| S | | % | | 1,890 | | 2,130 | | 0.01 | | 30.70 | | 6.14 | | 4.50 | | 0.73 | |
| Sb | | ppm | | 1,891 | | 2,131 | | 0.2 | | 5,210.0 | | 192.3 | | 352.31 | | 1.83 | |
| SG | | - | | 3,184 | | 3,540 | | 2.01 | | 4.99 | | 3.29 | | 0.36 | | 0.11 | |
| Zn | | % | | 2,974 | | 3,294 | | 0.00 | | 30.00 | | 3.95 | | 4.96 | | 1.26 | |
The distribution of copper grades in drill holes proximal to the Arctic deposit is shown from two cross section maps in Figure 11-1.
| | |
| Arctic Project | Page 175 |
| S-K 1300 Technical Report Summary | November 30, 2022 |
| | |
| Figure 11-1: | East-West Cross Section for Copper Drill Hole Data, Looking North (Resource pit depicted in red) |
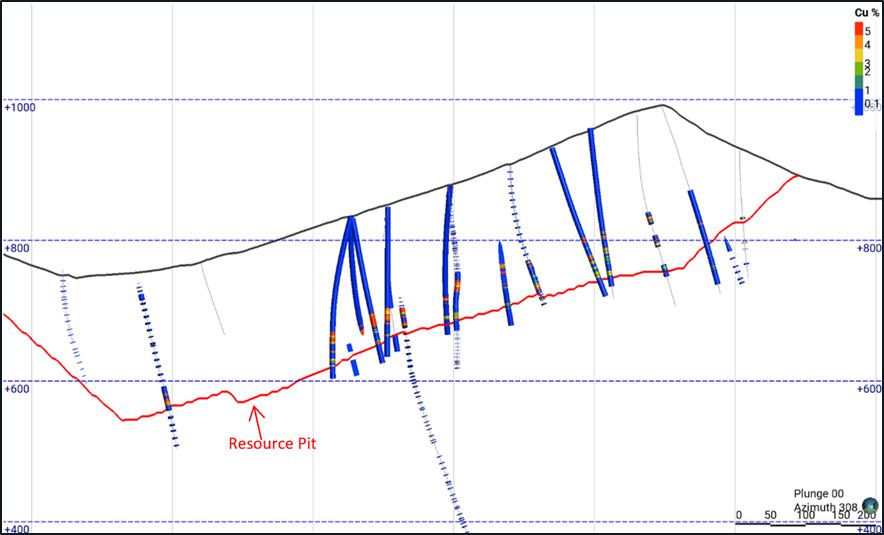
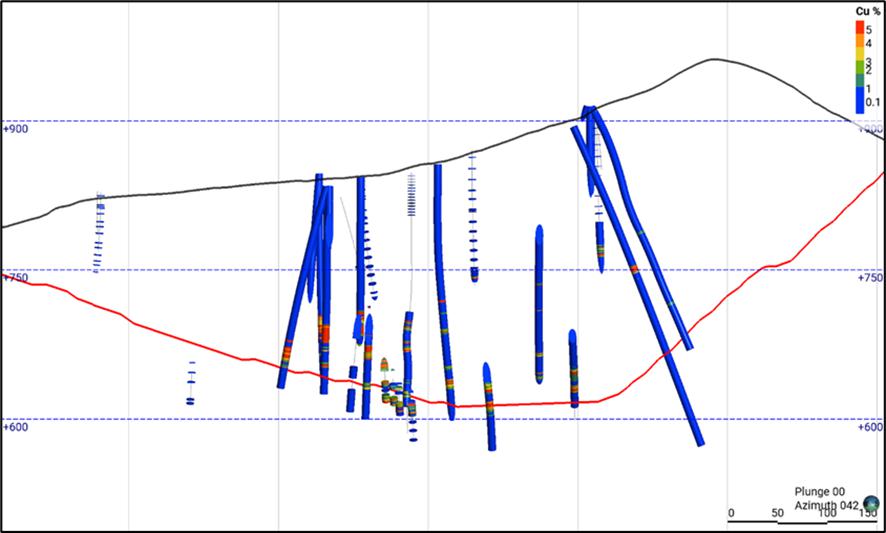
Source: Ambler Metals, 2022.
| | |
| Arctic Project | Page 176 |
| S-K 1300 Technical Report Summary | November 30, 2022 |
| | |
South32 developed and provided Ambler Metals with an algorithm to calculate talc proxy. The algorithm was applied in the database in 2019 and 2021. The algorithm uses the multi element assay results, mainly Mg, Al and K for the data from 1968 to 2017, and the four-acid digest-ICPMS data collected between 2004 to 2017 and generated calculated talc percent proxy values in the database. The algorithm was applied in the 2021 database to create talc model wireframes and estimate talc grades within the model.
| 11.3 | Interpretations and Geological Modelling Procedures |
| 11.3.1 | Lithology Modelling |
In 2019, SRK revised three-dimensional (3D) geological model wireframes generated by Trilogy in 2017. The geological model updates were completed using Leapfrog Geo software. In October of 2021, Ambler further updated the 2019 geological model wireframes using drilling information collected during 2019 and 2021 drilling campaign. Figure 11-2 shows East-West cross-section map of the modelled Arctic geological wireframes including mineralized zones (Minzones). The main lithological units in the Arctic deposit are shown in Table 11-3.
| Figure 11-2: | East-West Cross-Section of the Arctic Geological Model, Looking North |

Source: Ambler Metals, 2022.
| | |
| Arctic Project | Page 177 |
| S-K 1300 Technical Report Summary | November 30, 2022 |
| | |
| Table 11-3: | Arctic Lithological Units |
| Lithological Unit Codes | Lithological Name |
| QMS | Series of felsic quartz mica schists |
| MRP | Meta-rhyolite porphyry |
| GS | Grey schist of the carbonaceous schists |
| AMR | Aphanitic meta-rhyolite |
Three-dimensional talc model wireframes were generated using the updated talc proxy database using the algorithm provided by South32 by capturing high-grade and low-grade talc intervals. Samples that showed talc proxy percentages above 0% were included in the talc zones. Figure 11-3 shows an East-West cross-section map of the modelled Arctic talc wireframes (green).
| Figure 11-3: | East-West Cross-Section of Talc Model Wireframes, Looking North |
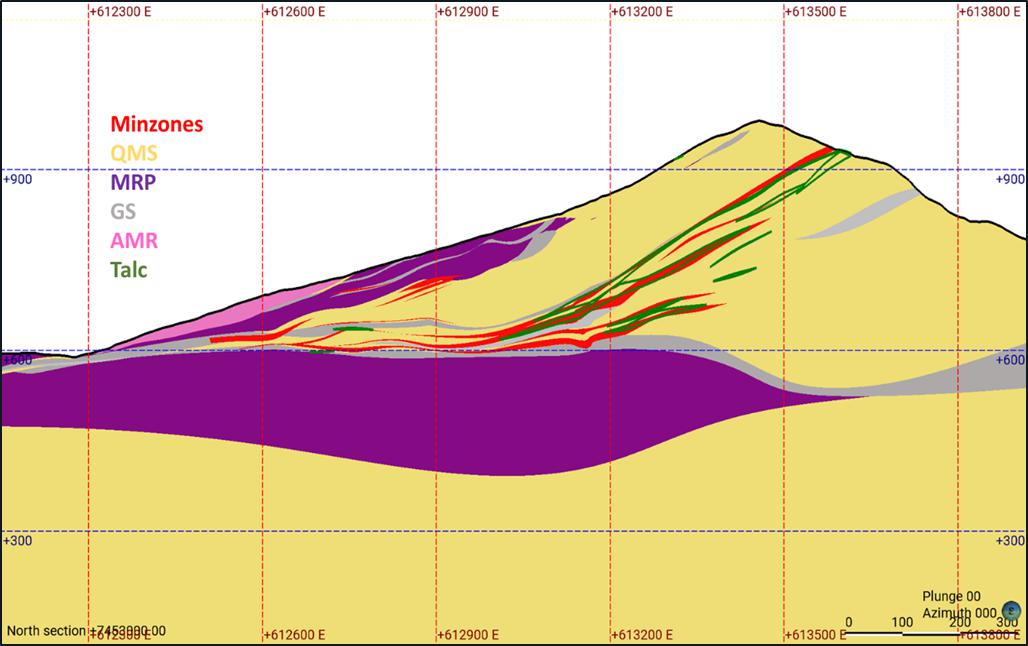
Source: Ambler Metals, 2022.
| | |
| Arctic Project | Page 178 |
| S-K 1300 Technical Report Summary | November 30, 2022 |
| | |
| 11.3.3 | Mineralization Domains |
The mineralized zone (Minzones) wireframes were updated using new assay data, typically using the 0.5% CuEq cut-off grade, as a guide where data is available. Drill holes that did not have assay results received by the assay database cut-off date were used to update the geological model but not used in the resource model. For these holes, the geological model was updated using the geology logging data to update the mineralized zone wireframes. Only minor revisions of the wireframes were made to the main mineralized zones (Zones 1, 1a, 2, 2.5, 3, 3_sub, 4 and 5) compared to the previous model. The main mineralized zones are Zones 1, 3, and 5. A cross section of mineralized zone wireframes, with estimation domain group and individual domain names, are shown in Figure 11-4. Table 11-4 shows mineralized zone domain codes used in the resource model.
| Figure 11-4: | East-West Cross-Section of the Arctic Deposit Showing Mineralized Zones |
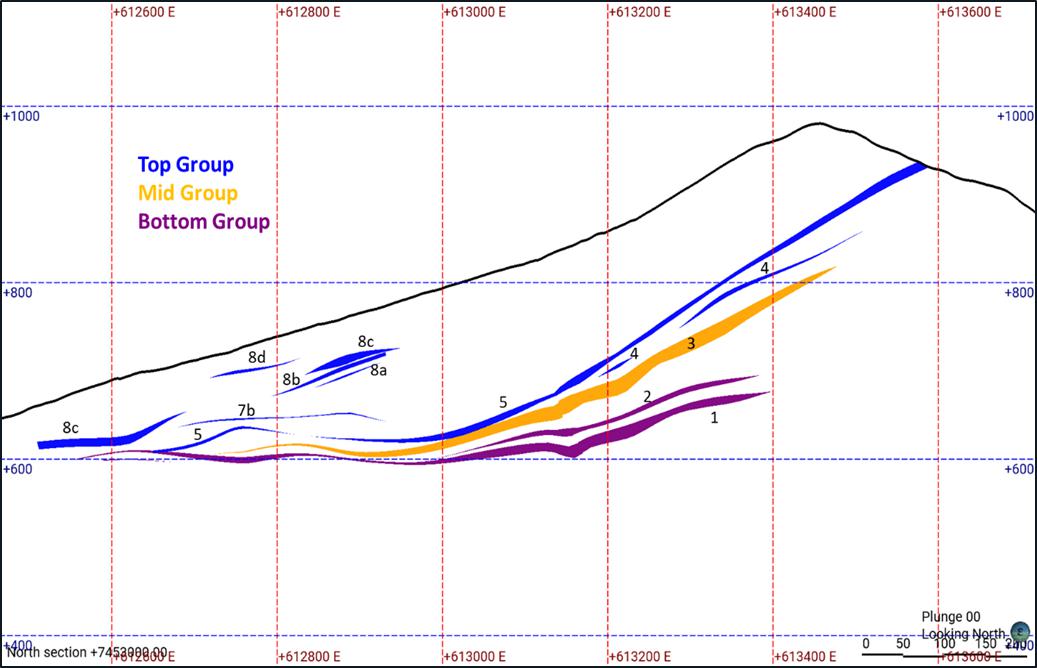
Source: Ambler Metals, 2022.
| | |
| Arctic Project | Page 179 |
| S-K 1300 Technical Report Summary | November 30, 2022 |
| | |
| Table 11-4: | Summary of Mineralized Zone Domains |
| Leapfrog Minzone | Domain | Estimation Domain |
| 1 | Zone 1 | Bottom Group |
| 1cz_sub | Zone 1 a | Bottom Group |
| 2 | Zone 2 | Bottom Group |
| 2.5 | Zone 2.5 | Bottom Group |
| 3b | Zone 3 | Mid Group |
| 3by_sub | Zone 3a | Mid Group |
| 4 | Zone 4 | Top Group |
| 5cx | Zone 5 | Top Group |
| 7 | Zone 7b | Top Group |
| 7a | Zone 7c | Top Group |
| 7a_hw | Zone 7a hw | Top Group |
| 7b_hw | Zone 7b hw | Top Group |
| 7hw | Zone 7c hw | Top Group |
| 7_sub | Zone 7a | Top Group |
| 8 | Zone 8c | Top Group |
| 8a | Zone 8d | Top Group |
| 8_sub | Zone 8b | Top Group |
| 8_subA | Zone 8a | Top Group |
| 11.4 | Exploratory Data Analysis |
SG database includes a total of 12,088 SG values, with 3,497 measured SG values and the rest are predicted and assigned values, ranging from 2.01 to 4.99 with average sample length of 2.33 m.
Prior to 2019, SG measurement at Arctic was inconsistent and the SG database contained many missing SG intervals, especially within the mineralized zones. In 2019, SRK provided a solution to fill the missing SG intervals by using the Random Forest Regressor to predict SG values in the mineralized zones. Outside of the mineralized zones, within non mineralized lithological units where SG data was not available, Ambler assigned an SG value of 2.78.
Since 2019, Ambler Metals collected SG values at a regular interval from both inside and outside of the mineralized zones and it was no longer necessary to use the Random Forest Regressor.
| | |
| Arctic Project | Page 180 |
| S-K 1300 Technical Report Summary | November 30, 2022 |
| | |
From 2019, SG measurements were taken using half cut core and taking dry and water submerged weights to calculate SG value. From 2011 to 2017, SG measurements were taken on whole core prior to cutting. Ambler Metals updated the existing SG database created by SRK with predicted SG values in 2021 with SG measurements collected since 2019.
SG was estimated in all mineralized zones and lithologies.
Table 11-5 shows summary statistics of SG by Minzone.
Wood reviewed 1,850 measured SG values with Random Forest predicted values in the SG database to assess for bias. Table 11-6 shows that there is no significant difference between the means of the measured and predicted SG values, however, the standard deviation of the predicted SG value is slightly smaller. Correlation coefficient of the measured and predicted SG values is 0.930.
Table 11-7 shows average measured and predicted SG values within selected bins of measured SG values. A low bias in the predicted SG values is observed and only exceed 5% bias for SG values below 2.7 and above 3.7. Table 11-5 shows that the proportion of blocks with estimated SG below 2.7 and above 3.7 is less than 1%. Small number of samples and number of blocks affected by this is not expected to have any material impact. A capping strategy was used during estimation process of SG values to control the impact of the extreme SG values. No other corrections in the predicted SG were applied for the current resource estimate.
| Table 11-5: | Summary Statistics for SG by Mineralized Zone |
| Minzone | | Count | | Mean | | Min | | Max | |
| Zone 1 | | 646 | | 3.36 | | 2.70 | | 4.96 | |
| Zone 1a | | 36 | | 3.12 | | 2.75 | | 3.32 | |
| Zone 2 | | 145 | | 3.29 | | 2.74 | | 4.63 | |
| Zone 2.5 | | 89 | | 3.24 | | 2.75 | | 4.39 | |
| Zone 3 | | 762 | | 3.24 | | 2.50 | | 4.46 | |
| Zone 3a | | 4 | | 3.32 | | 3.31 | | 3.32 | |
| Zone 4 | | 222 | | 3.24 | | 2.70 | | 4.43 | |
| Zone 5 | | 849 | | 3.36 | | 2.01 | | 4.99 | |
| Zone 7a | | 12 | | 2.93 | | 2.71 | | 3.32 | |
| Zone 7b | | 32 | | 3.12 | | 2.80 | | 4.00 | |
| Zone 7c | | 8 | | 3.03 | | 2.73 | | 3.32 | |
| Zone 7a HW | | 30 | | 2.99 | | 2.70 | | 3.32 | |
| Zone 7b HW | | 21 | | 2.97 | | 2.72 | | 3.32 | |
| Zone 7c HW | | 33 | | 3.06 | | 2.73 | | 3.32 | |
| Zone 8a | | 4 | | 3.32 | | 3.32 | | 3.32 | |
| Zone 8b | | 5 | | 3.31 | | 3.31 | | 3.32 | |
| Zone 8c | | 44 | | 3.06 | | 2.72 | | 3.32 | |
| Zone 8 HW | | 7 | | 3.32 | | 3.31 | | 3.32 | |
| | |
| Arctic Project | Page 181 |
| S-K 1300 Technical Report Summary | November 30, 2022 |
| | |
| Table 11-6: | Summary Statistics for SG Measured and SG Predicted |
| | | Number of Data | | Mean | | Min | | Max | | Std. Dev | |
| SG Measured | | 1,849 | | 3.05 | | 2.56 | | 4.99 | | 0.20 | |
| SG Predicted | | 1,849 | | 3.06 | | 2.65 | | 4.38 | | 0.16 | |
| Table 11-7: | Mean SG Values for Measured and Predicted by Bins |
| | | | | Mean | | | |
| Number of Data | | Target SG Value | | Measured SG | | Predicted SG | | % Difference | |
| 5 | | 2.5 | | 2.589 | | 2.708 | | 5% | |
| 754 | | 2.7 | | 2.746 | | 2.788 | | 2% | |
| 238 | | 3 | | 2.982 | | 3.045 | | 2% | |
| 118 | | 3.2 | | 3.2 | | 3.249 | | 2% | |
| 97 | | 3.5 | | 3.49 | | 3.446 | | -1% | |
| 80 | | 3.7 | | 3.701 | | 3.614 | | -2% | |
| 64 | | 4 | | 4.01 | | 3.822 | | -5% | |
| 48 | | 4.1 | | 4.305 | | 4.054 | | -6% | |
| 18 | | 4.3 | | 4.472 | | 4.208 | | -6% | |
| 8 | | 4.6 | | 4.574 | | 4.279 | | -6% | |
| | |
| Arctic Project | Page 182 |
| S-K 1300 Technical Report Summary | November 30, 2022 |
| | |
| Figure 11-5: | Cumulative Probability Plot for SG in the Resource Block Model |
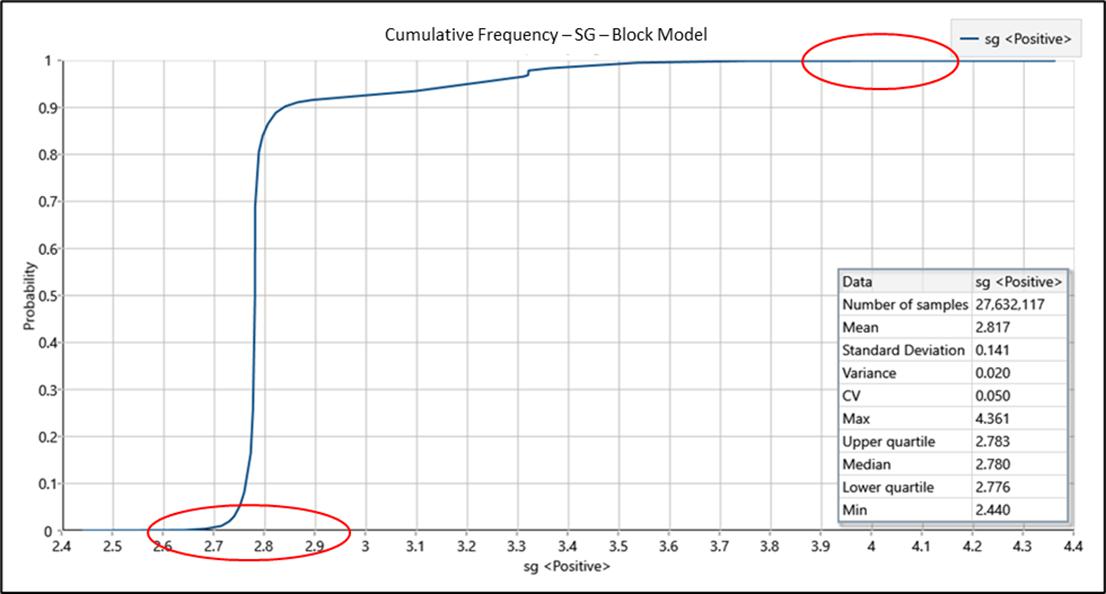
Source: Wood, 2022
The raw assay database was weighted using SG, meaning the weighted sample length equals sample length times SG times grade. Weighting composites by SG accounts for density having a positive correlation to grade in massive sulphide mineralization. The weighted assays were composited into 2-m intervals broken by lithology and mineralized zones. Residual composites that are less than 1 m were distributed equally into composites that are in the same domain.
Figure 11-6 shows a histogram of composite length, with 1.9 m as the average length of the composite.
Table 11-8 shows summary statistics of the composite database by mineralized zone.
| | |
| Arctic Project | Page 183 |
| S-K 1300 Technical Report Summary | November 30, 2022 |
| | |
| Figure 11-6: | Histogram of Composite Lengths |
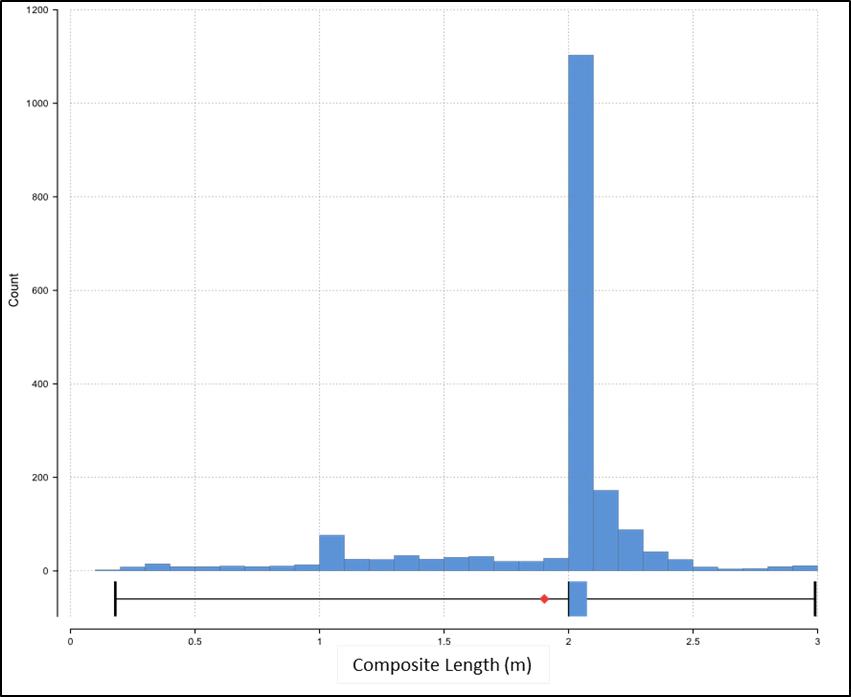
Source: Ambler, 2022.
| Table 11-8: | Summary Statistics of the Composite Database |
| Element | | Unit | | Count | | Total Length
(m) | | Minimum | | Maximum | | Mean | | Standard
Deviation | | Coefficient
of Variation | |
| Ag | | g/t | | 1,747 | | 3,328 | | 0.0 | | 578.9 | | 46.5 | | 47.71 | | 1.03 | |
| As | | ppm | | 1,123 | | 2,152 | | 2.1 | | 10,000.0 | | 1,032.7 | | 1,614.66 | | 1.56 | |
| Au | | g/t | | 1,685 | | 3,219 | | 0.00 | | 28.08 | | 0.66 | | 1.32 | | 1.99 | |
| Cd | | ppm | | 1,123 | | 2,152 | | 0.08 | | 1,000.00 | | 201.58 | | 208.44 | | 1.03 | |
| Cu | | % | | 1,753 | | 3,339 | | 0.00 | | 16.35 | | 2.94 | | 2.61 | | 0.89 | |
| Fe | | % | | 1,123 | | 2,152 | | 0.37 | | 27.77 | | 9.78 | | 5.85 | | 0.60 | |
| | |
| Arctic Project | Page 184 |
| S-K 1300 Technical Report Summary | November 30, 2022 |
| | |
| Element | | Unit | | Count | | Total Length
(m) | | Minimum | | Maximum | | Mean | | Standard
Deviation | | Coefficient
of Variation | |
| Hg | | ppm | | 563 | | 1,077 | | 0.0 | | 13.4 | | 1.9 | | 2.11 | | 1.11 | |
| Pb | | % | | 1,738 | | 3,311 | | 0.00 | | 17.65 | | 0.88 | | 1.35 | | 1.54 | |
| S | | % | | 1,122 | | 2,151 | | 0.01 | | 28.57 | | 6.19 | | 3.94 | | 0.64 | |
| Sb | | ppm | | 1,123 | | 2,152 | | 0.2 | | 2,293.9 | | 192.9 | | 290.37 | | 1.50 | |
| SG | | - | | 1,860 | | 3,540 | | 2.51 | | 4.60 | | 3.30 | | 0.34 | | 0.10 | |
| Zn | | % | | 1,749 | | 3,333 | | 0.00 | | 24.10 | | 3.97 | | 4.14 | | 1.04 | |
Probability plots of declustered data (by polygonal) and sensitivity curves were assessed in determining an appropriate capping value for all economic elements and specific gravity in each of the mineralized zones and lithological domains. The capping values used in the current model are the same as the values determined in the previous SRK model and are shown in Table 11-9. Summary statistics comparing mean values before and after the capping values are applied is shown in Table 11-10 for payable metals, and Table 11-11 for non-payable metals.
Experimental and modelled variograms were generated using 2m capped composites to analyse the spatial continuity of mineralization within all mineralized zones. Mineralized zones define the resource estimation domains. Mineralized zones are combined into three groups (bottom, middle, and top) for the variogram analysis. Non-mineralized lithological units are combined into a single group, and the high-grade talc zones are also merged into a single group for the same purpose.
Table 11-12 summarizes the estimation domains. Figure 11-7 shows a cross-section of grouped estimation domains.
The composites for each combined mineralized zone were unfolded into 2D flattened space for experimental and modelling variograms and final variogram models are reported in GSLib format. Table 11-13 to Table 11-16 show modelled variogram model parameters used in the grade estimations.
| | |
| Arctic Project | Page 185 |
| S-K 1300 Technical Report Summary | November 30, 2022 |
| | |
| Table 11-9: | Capping Values |
| Minzone/Lithology | | Capping Values | |
| | Cu
(%) | | Pb
(%) | | Zn
(%) | | Au
(g/t) | | Ag
(g/t) | | SG | | As
(ppm) | | Sb
(ppm) | | Cd
(ppm) | | Hg
(ppm) | | Fe
(%) | | S
(%) | |
| Zone 1, 1a | | 8.0 | | 3.00 | | 14.00 | | 2.5 | | 150 | | 4.5 | | 7,000 | | 1,000 | | 800 | | 7.0 | | 25.0 | | 10.0 | |
| Zone 2 | | 6.0 | | 2.80 | | 11.00 | | 2.5 | | 110 | | 4.5 | | 4,000 | | 1,000 | | 600 | | 4.0 | | 20.0 | | 10.0 | |
| Zone 2.5 | | 6.0 | | 2.50 | | 8.00 | | 0.6 | | 90 | | 4.0 | | 1,000 | | 700 | | 400 | | 5.0 | | 20.0 | | 10.0 | |
| Zone 3, SubZone 3 | | 10.0 | | 3.50 | | 16.00 | | 1.5 | | 125 | | 5.0 | | 7,000 | | 1,000 | | 800 | | 5.0 | | 22.0 | | 10.0 | |
| Zone 4 | | 10.0 | | 1.75 | | 13.00 | | 1.5 | | 150 | | 5.0 | | 4,000 | | 400 | | 525 | | 3.0 | | 20.0 | | 10.0 | |
| Zone 5 | | 11.0 | | 3.50 | | 14.00 | | 5.0 | | 150 | | 5.0 | | 5,000 | | 1,000 | | 750 | | 6.0 | | 22.0 | | 10.0 | |
| SubZone 7a, 7b, 7c, 7a HW, 7b HW, 7c HW | | 2.0 | | 1.00 | | 3.50 | | 0.7 | | 30 | | 3.5 | | 500 | | 300 | | 400 | | 7.0 | | 8.0 | | 5.0 | |
| SubZone 8a, 8b, 8c, 8d, 8c HW | | 1.2 | | 1.00 | | 4.50 | | 0.8 | | 70 | | 5.0 | | 200 | | 300 | | 200 | | 10.0 | | 8.0 | | 5.0 | |
| Aphanitic Meta-Rhyolite, Meta-Rhyolite Porphyry | | 0.1 | | 0.10 | | 0.20 | | 0.2 | | 9 | | 3.1 | | 200 | | 30 | | 15 | | 0.3 | | 7.5 | | 9.5 | |
| Grey Schist | | 0.5 | | 0.20 | | 0.75 | | 0.5 | | 10 | | 3.1 | | 900 | | 100 | | 30 | | 0.5 | | 7.0 | | 9.5 | |
| Quartz Mica Schist | | 0.8 | | 0.50 | | 0.75 | | 0.5 | | 15 | | 3.1 | | 1,000 | | 100 | | 75 | | 2.0 | | 10.0 | | 9.5 | |
| | |
| Arctic Project | Page 186 |
| S-K 1300 Technical Report Summary | November 30, 2022 |
| | |
| Table 11-10: | Summary Statistics of Uncapped and Capped Values for Payable Metal |
Zone/
Lithology | | Mean | | Mean | | Mean | | Mean | | Mean | |
| | Cu (%) | | Pb (%) | | Zn (%) | | Au (ppm) | | Ag (ppm) | |
| | Uncapped | | Capped | | Uncapped | | Capped | | Uncapped | | Capped | | Uncapped | | Capped | | Uncapped | | Capped | |
| Zone 1 | | 2.80 | | 2.76 | | 0.83 | | 0.74 | | 4.12 | | 4.03 | | 0.76 | | 0.73 | | 53.3 | | 51.1 | |
| Zone 1a | | 0.73 | | 0.73 | | 0.54 | | 0.34 | | 1.96 | | 1.82 | | 0.25 | | 0.25 | | 17.5 | | 17.5 | |
| Zone 2 | | 2.19 | | 2.08 | | 0.63 | | 0.61 | | 3.30 | | 3.19 | | 0.78 | | 0.62 | | 43.3 | | 40.0 | |
| Zone 2.5 | | 1.97 | | 1.90 | | 0.59 | | 0.54 | | 3.20 | | 2.93 | | 0.29 | | 0.26 | | 29.8 | | 29.1 | |
| Zone 3 | | 3.11 | | 3.08 | | 0.86 | | 0.77 | | 3.83 | | 3.81 | | 0.39 | | 0.37 | | 38.1 | | 36.6 | |
| Zone 3a | | 1.38 | | 1.38 | | 1.06 | | 1.06 | | 6.46 | | 6.46 | | 0.00 | | 0.00 | | 24.7 | | 24.7 | |
| zone 4 | | 2.71 | | 2.62 | | 0.90 | | 0.57 | | 3.46 | | 3.29 | | 0.53 | | 0.51 | | 45.2 | | 42.3 | |
| Zone 5 | | 3.67 | | 3.65 | | 1.18 | | 1.03 | | 4.93 | | 4.87 | | 0.95 | | 0.78 | | 58.0 | | 54.7 | |
| Zone 7a | | 0.22 | | 0.22 | | 0.07 | | 0.07 | | 0.20 | | 0.20 | | 0.22 | | 0.20 | | 5.2 | | 5.2 | |
| Zone 7b | | 0.60 | | 0.49 | | 0.52 | | 0.17 | | 2.05 | | 0.84 | | 0.24 | | 0.20 | | 15.9 | | 9.2 | |
| Zone 7c | | 0.62 | | 0.62 | | 0.04 | | 0.04 | | 0.44 | | 0.44 | | 0.20 | | 0.20 | | 5.6 | | 5.6 | |
| Zone 7a HW | | 0.24 | | 0.19 | | 0.02 | | 0.02 | | 0.17 | | 0.17 | | 0.02 | | 0.02 | | 4.9 | | 3.0 | |
| Zone 7b HW | | 0.09 | | 0.09 | | 0.02 | | 0.02 | | 0.21 | | 0.21 | | 0.03 | | 0.03 | | 1.4 | | 1.4 | |
| Zone 7c HW | | 0.10 | | 0.10 | | 0.02 | | 0.02 | | 0.13 | | 0.13 | | 0.03 | | 0.03 | | 1.8 | | 1.8 | |
| Zone 8a | | 0.58 | | 0.58 | | 0.21 | | 0.21 | | 2.90 | | 2.90 | | 0.60 | | 0.60 | | 14.2 | | 14.2 | |
| Zone 8b | | 1.16 | | 0.73 | | 0.85 | | 0.56 | | 3.95 | | 2.31 | | 0.32 | | 0.32 | | 29.4 | | 29.4 | |
| Zone 8c | | 0.36 | | 0.23 | | 0.22 | | 0.20 | | 1.00 | | 0.83 | | 0.26 | | 0.19 | | 7.9 | | 7.9 | |
| Zone 8 HW | | 0.70 | | 0.70 | | 0.89 | | 0.72 | | 2.09 | | 2.09 | | 1.30 | | 0.37 | | 115.0 | | 41.8 | |
| | |
| Arctic Project | Page 187 |
| S-K 1300 Technical Report Summary | November 30, 2022 |
| | |
| Table 11-11: | Summary Statistics of Uncapped and Capped Values for Deleterious Elements |
Zone/
Lithology | | Mean | | Mean | | Mean | | Mean | | Mean | | Mean | |
| | As ppm | | Sb ppm | | Cd ppm | | Hg ppm | | Fe % | | S % | |
| | Uncapped | | Capped | | Uncapped | | Capped | | Uncapped | | Capped | | Uncapped | | Capped | | Uncapped | | Capped | | Uncapped | | Capped | |
| Zone 1 | | 1275.2 | | 1251.7 | | 276.8 | | 264.7 | | 192.91 | | 191.03 | | 2.3 | | 2.2 | | 11.29 | | 11.25 | | 6.58 | | 6.50 | |
| Zone 1a | | 244.5 | | 246.1 | | 96.6 | | 96.6 | | 111.68 | | 102.64 | | 2.0 | | 1.6 | | 5.91 | | 5.91 | | 4.52 | | 4.52 | |
| Zone 2 | | 939.4 | | 810.5 | | 266.6 | | 241.4 | | 160.18 | | 158.07 | | 1.2 | | 1.1 | | 8.70 | | 8.62 | | 5.26 | | 5.17 | |
| Zone 2.5 | | 403.5 | | 325.2 | | 158.1 | | 126.0 | | 169.01 | | 160.17 | | 1.6 | | 1.4 | | 9.95 | | 9.49 | | 6.44 | | 6.38 | |
| Zone 3 | | 1074.6 | | 1048.7 | | 123.7 | | 119.8 | | 212.05 | | 211.35 | | 1.1 | | 1.1 | | 9.27 | | 9.18 | | 5.69 | | 5.54 | |
| Zone 3a | | 0.0 | | 0.0 | | 0.0 | | 0.0 | | 0.00 | | 0.00 | | 0.0 | | 0.0 | | 0.00 | | 0.00 | | 0.00 | | 0.00 | |
| zone 4 | | 1169.2 | | 912.9 | | 103.4 | | 88.1 | | 179.17 | | 173.39 | | 1.4 | | 1.2 | | 8.19 | | 8.16 | | 4.96 | | 4.68 | |
| Zone 5 | | 1101.6 | | 1061.3 | | 222.4 | | 213.6 | | 261.36 | | 258.50 | | 2.5 | | 2.5 | | 10.93 | | 10.82 | | 7.53 | | 6.84 | |
| Zone 7a | | 128.1 | | 128.1 | | 68.8 | | 68.8 | | 13.94 | | 13.94 | | 0.6 | | 0.6 | | 4.71 | | 4.71 | | 3.81 | | 3.81 | |
| Zone 7b | | 214.2 | | 196.1 | | 105.0 | | 70.8 | | 117.17 | | 68.43 | | 3.8 | | 2.6 | | 6.06 | | 5.04 | | 4.54 | | 3.93 | |
| Zone 7c | | 209.2 | | 209.2 | | 75.7 | | 75.7 | | 22.07 | | 22.07 | | 1.4 | | 1.4 | | 3.76 | | 3.76 | | 3.08 | | 3.08 | |
| Zone 7a HW | | 26.6 | | 26.6 | | 11.0 | | 11.0 | | 7.40 | | 7.40 | | 0.9 | | 0.9 | | 2.80 | | 2.77 | | 0.80 | | 0.68 | |
| Zone 7b HW | | 50.8 | | 50.2 | | 1.6 | | 1.6 | | 3.16 | | 3.16 | | 0.3 | | 0.3 | | 2.17 | | 2.17 | | 0.58 | | 0.58 | |
| Zone 7c HW | | 64.9 | | 64.9 | | 20.5 | | 20.5 | | 7.23 | | 7.23 | | 0.8 | | 0.7 | | 2.67 | | 2.67 | | 0.74 | | 0.70 | |
| Zone 8a | | 0.0 | | 0.0 | | 0.0 | | 0.0 | | 0.00 | | 0.00 | | 0.0 | | 0.0 | | 0.00 | | 0.00 | | 0.00 | | 0.00 | |
| Zone 8b | | 42.3 | | 42.3 | | 19.2 | | 19.2 | | 40.00 | | 40.00 | | 2.2 | | 2.2 | | 3.58 | | 3.58 | | 1.22 | | 1.22 | |
| Zone 8c | | 154.5 | | 76.6 | | 106.2 | | 66.9 | | 19.55 | | 19.55 | | 1.4 | | 1.4 | | 4.84 | | 4.23 | | 2.07 | | 1.90 | |
| Zone 8 HW | | 0.0 | | 0.0 | | 0.0 | | 0.0 | | 0.00 | | 0.00 | | 0.0 | | 0.0 | | 0.00 | | 0.00 | | 0.00 | | 0.00 | |
| | |
| Arctic Project | Page 188 |
| S-K 1300 Technical Report Summary | November 30, 2022 |
| | |
| Table 11-12: | Estimation Domains |
| Estimation Domain | Minzones or Lithologies |
| Bottom Group | 1, 1a, 2, and 2.5 |
| Mid Group | 3, and 3a |
| Top Group | 4, 5, 7a, 7b, 8c, 8a, 8b, 8c, 8 hw, 7a hw, 7b hw, 7c hw |
| Talc | All high-grade talc zones |
| Lithology (Outside of Minzone) | All non-mineralized lithologies |
| Figure 11-7: | Cross-Section of Estimation Domains and Talc |
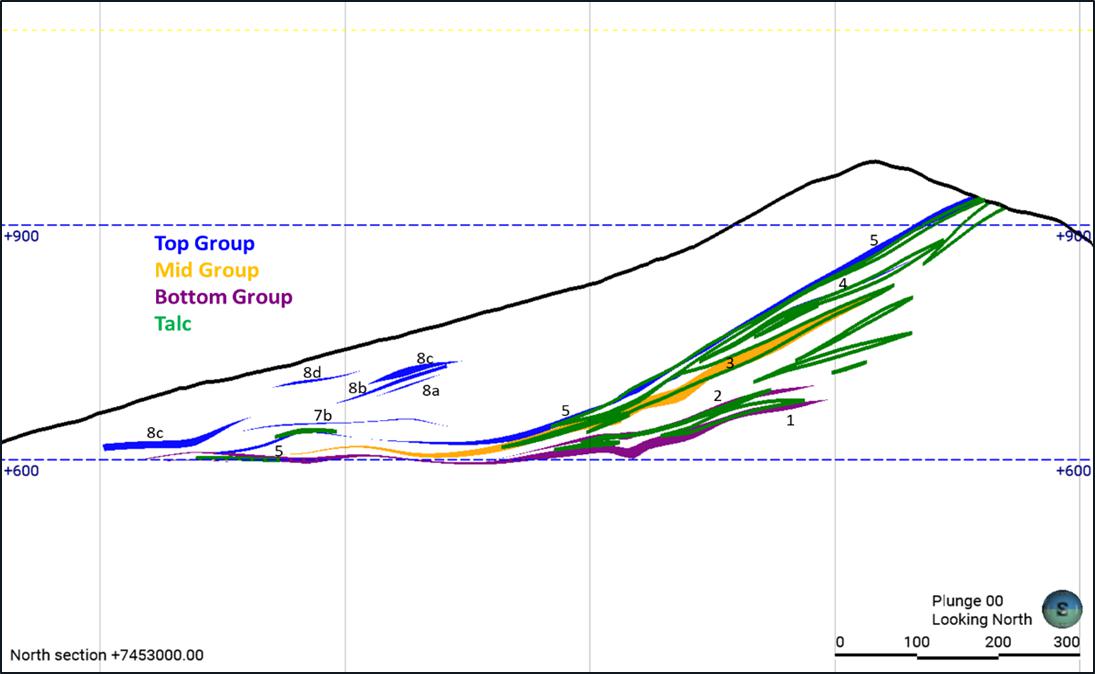
Source: Ambler Metals, 2022.
| | |
| Arctic Project | Page 189 |
| S-K 1300 Technical Report Summary | November 30, 2022 |
| | |
| Table 11-13: | Variogram Models for the Bottom Group |
| Bottom Group Variograms | |
| | | Variogram Model | | GSLIB Angles | |
| Variable | | Nugget | | Str. No. | | Type | | CC | | X Range
(m) | | Y Range
(m) | | Z Range
(m) | | ANG1
(degree) | | ANG2
(degree) | | ANG3
(degree) | |
| Cu | | 0.10 | | 1 | | Exponential | | 0.50 | | 30 | | 70 | | 7.5 | | 30 | | 0 | | 0 | |
| | | 2 | | Spherical | | 0.40 | | 20 | | 200 | | 8.0 | | | | |
| Pb | | 0.15 | | 1 | | Exponential | | 0.50 | | 30 | | 50 | | 7.5 | | 30 | | 0 | | 0 | |
| | | 2 | | Spherical | | 0.35 | | 220 | | 180 | | 10.0 | | | | |
| Zn | | 0.15 | | 1 | | Exponential | | 0.55 | | 40 | | 60 | | 9.0 | | 30 | | 0 | | 0 | |
| | | 2 | | Spherical | | 0.30 | | 240 | | 200 | | 9.0 | | | | |
| Ag | | 0.15 | | 1 | | Exponential | | 0.45 | | 30 | | 75 | | 6.0 | | 30 | | 0 | | 0 | |
| | | 2 | | Spherical | | 0.43 | | 240 | | 180 | | 12.0 | | | | |
| Au | | 0.15 | | 1 | | Exponential | | 0.30 | | 30 | | 40 | | 12.0 | | 30 | | 0 | | 0 | |
| | | 2 | | Spherical | | 0.55 | | 180 | | 140 | | 12.0 | | | | |
| SG | | 0.05 | | 1 | | Exponential | | 0.60 | | 30 | | 60 | | 9.0 | | 30 | | 0 | | 0 | |
| | | 2 | | Spherical | | 0.35 | | 250 | | 20 | | 12.0 | | | | |
| As | | 0.15 | | 1 | | Exponential | | 0.40 | | 40 | | 60 | | 9.0 | | 30 | | 0 | | 0 | |
| | | 2 | | Spherical | | 0.45 | | 26 | | 200 | | 12 | | | | |
| Cd | | 0.20 | | 1 | | Exponential | | 0.65 | | 55 | | 55 | | 9.0 | | 30 | | 0 | | 0 | |
| | | 2 | | Spherical | | 0.15 | | 200 | | 200 | | 9.0 | | | | |
| Fe | | 0.15 | | 1 | | Exponential | | 0.50 | | 40 | | 55 | | 10.5 | | 30 | | 0 | | 0 | |
| | | 2 | | Spherical | | 0.35 | | 250 | | 200 | | 10.5 | | | | |
| Hg | | 0.20 | | 1 | | Exponential | | 0.65 | | 75 | | 75 | | 9.0 | | 30 | | 0 | | 0 | |
| | | 2 | | Spherical | | 0.15 | | 200 | | 200 | | 12.0 | | | | |
| SG | | 0.10 | | 1 | | Exponential | | 0.60 | | 24 | | 51 | | 10.5 | | 30 | | 0 | | 0 | |
| | | 2 | | Spherical | | 0.30 | | 250 | | 200 | | 12.0 | | | | |
| Sb | | 0.15 | | 1 | | Exponential | | 0.48 | | 30 | | 57 | | 12.0 | | 30 | | 0 | | 0 | |
| | | 2 | | Spherical | | 0.37 | | 220 | | 200 | | 15.0 | | | | |
| | |
| Arctic Project | Page 190 |
| S-K 1300 Technical Report Summary | November 30, 2022 |
| | |
| Table 11-14: | Variogram Models for the Middle Group |
| Middle Group Variograms | |
| | | Variogram Model | | GSLIB Angles | |
| Variable | | Nugget | | Str. No. | | Type | | CC | | X Range
(m) | | Y Range
(m) | | Z Range
(m) | | ANG1
(degree) | | ANG2
(degree) | | ANG3
(degree) | |
| Cu | | 0.15 | | 1 | | Exponential | | 0.65 | | 21 | | 21 | | 12.0 | | 60 | | 0 | | 0 | |
| | | 2 | | Spherical | | 0.20 | | 180 | | 140 | | 12.0 | | | | |
| Pb | | 0.15 | | 1 | | Exponential | | 0.62 | | 39 | | 21 | | 12.0 | | 60 | | 0 | | 0 | |
| | | 2 | | Spherical | | 0.23 | | 220 | | 160 | | 15.0 | | | | |
| Zn | | 0.15 | | 1 | | Exponential | | 0.65 | | 60 | | 24 | | 10.5 | | 60 | | 0 | | 0 | |
| | | 2 | | Spherical | | 0.20 | | 220 | | 160 | | 15.0 | | | | |
| Ag | | 0.15 | | 1 | | Exponential | | 0.50 | | 30 | | 21 | | 12.0 | | 60 | | 0 | | 0 | |
| | | 2 | | Spherical | | 0.35 | | 230 | | 150 | | 18.0 | | | | |
| Au | | 0.10 | | 1 | | Exponential | | 0.45 | | 30 | | 21 | | 15.0 | | 60 | | 0 | | 0 | |
| | | 2 | | Spherical | | 0.45 | | 240 | | 160 | | 20.0 | | | | |
| SG | | 0.05 | | 1 | | Exponential | | 0.20 | | 20 | | 20 | | 12.0 | | 60 | | 0 | | 0 | |
| | | 2 | | Spherical | | 0.75 | | 240 | | 160 | | 20.0 | | | | |
| As | | 0.20 | | 1 | | Exponential | | 0.30 | | 75 | | 50 | | 12.0 | | 60 | | 0 | | 0 | |
| | | 2 | | Spherical | | 0.50 | | 240 | | 160 | | 20.0 | | | | |
| Cd | | 0.15 | | 1 | | Exponential | | 0.50 | | 24 | | 49 | | 7.5 | | 60 | | 0 | | 0 | |
| | | 2 | | Spherical | | 0.35 | | 220 | | 140 | | 9.0 | | | | |
| Fe | | 0.10 | | 1 | | Exponential | | 0.30 | | 39 | | 21 | | 9.0 | | 60 | | 0 | | 0 | |
| | | 2 | | Spherical | | 0.60 | | 240 | | 160 | | 20.0 | | | | |
| Hg | | 0.15 | | 1 | | Exponential | | 0.50 | | 39 | | 21 | | 7.5 | | 60 | | 0 | | 0 | |
| | | 2 | | Spherical | | 0.35 | | 240 | | 160 | | 8.0 | | | | |
| SG | | 0.10 | | 1 | | Exponential | | 0.15 | | 39 | | 21 | | 6.0 | | 60 | | 0 | | 0 | |
| | | 2 | | Spherical | | 0.75 | | 22 | | 160 | | 12.0 | | | | |
| Sb | | 0.05 | | 1 | | Exponential | | 0.20 | | 39 | | 21 | | 12.0 | | 60 | | 0 | | 0 | |
| | | 2 | | Spherical | | 0.75 | | 240 | | 180 | | 18.0 | | | | |
| | |
| Arctic Project | Page 191 |
| S-K 1300 Technical Report Summary | November 30, 2022 |
| | |
| Table 11-15: | Variogram Models for the Top Group |
| Top Group Variograms | |
| | | Variogram Model | | GSLIB Angles | |
| Variable | | Nugget | | Str. No. | | Type | | CC | | X Range
(m) | | Y Range
(m) | | Z Range
(m) | | ANG1
(degree) | | ANG2
(degree) | | ANG3
(degree) | |
| Cu | | 0.05 | | 1 | | Exponential | | 0.60 | | 45 | | 33 | | 6.0 | | 60 | | 0 | | 0 | |
| | | 2 | | Spherical | | 0.35 | | 250 | | 160 | | 9.0 | | | | |
| Pb | | 0.05 | | 1 | | Exponential | | 0.55 | | 45 | | 30 | | 4.5 | | 60 | | 0 | | 0 | |
| | | 2 | | Spherical | | 0.40 | | 240 | | 180 | | 9.0 | | | | |
| Zn | | 0.20 | | 1 | | Exponential | | 0.60 | | 45 | | 33 | | 6.0 | | 60 | | 0 | | 0 | |
| | | 2 | | Spherical | | 0.20 | | 250 | | 160 | | 9.0 | | | | |
| Ag | | 0.10 | | 1 | | Exponential | | 0.50 | | 45 | | 33 | | 6.0 | | 60 | | 0 | | 0 | |
| | | 2 | | Spherical | | 0.40 | | 250 | | 180 | | 9.0 | | | | |
| Au | | 0.30 | | 1 | | Exponential | | 0.50 | | 36 | | 36 | | 6.0 | | 60 | | 0 | | 0 | |
| | | 2 | | Spherical | | 0.20 | | 250 | | 200 | | 12.0 | | | | |
| SG | | 0.00 | | 1 | | Exponential | | 0.50 | | 45 | | 45 | | 6.0 | | 60 | | 0 | | 0 | |
| | | 2 | | Spherical | | 0.50 | | 220 | | 160 | | 13.0 | | | | |
| As | | 0.15 | | 1 | | Exponential | | 0.24 | | 45 | | 33 | | 6.0 | | 60 | | 0 | | 0 | |
| | | 2 | | Spherical | | 0.61 | | 250 | | 160 | | 12.0 | | | | |
| Cd | | 0.15 | | 1 | | Exponential | | 0.30 | | 45 | | 33 | | 4.5 | | 60 | | 0 | | 0 | |
| | | 2 | | Spherical | | 0.55 | | 250 | | 160 | | 12.0 | | | | |
| Fe | | 0.20 | | 1 | | Exponential | | 0.15 | | 36 | | 30 | | 6.0 | | 60 | | 0 | | 0 | |
| | | 2 | | Spherical | | 0.65 | | 240 | | 160 | | 12.0 | | | | |
| Hg | | 0.10 | | 1 | | Exponential | | 0.70 | | 105 | | 105 | | 6.0 | | 60 | | 0 | | 0 | |
| | | 2 | | Spherical | | 0.20 | | 250 | | 250 | | 9.0 | | | | |
| SG | | 0.15 | | 1 | | Exponential | | 0.35 | | 45 | | 33 | | 7.5 | | 60 | | 0 | | 0 | |
| | | 2 | | Spherical | | 0.50 | | 250 | | 160 | | 12.0 | | | | |
| Sb | | 0.05 | | 1 | | Exponential | | 0.65 | | 45 | | 33 | | 7.5 | | 60 | | 0 | | 0 | |
| | | 2 | | Spherical | | 0.30 | | 250 | | 160 | | 12.0 | | | | |
| | |
| Arctic Project | Page 192 |
| S-K 1300 Technical Report Summary | November 30, 2022 |
| | |
| Table 11-16: | Variogram Model for Talc |
| Talc Variograms | |
| | | Variogram Model | | GSLIB Angles | |
| Variable | | Nugget | | Str. No. | | Type | | CC | | X Range
(m) | | Y Range
(m) | | Z Range
(m) | | ANG1
(degree) | | ANG2
(degree) | | ANG3
(degree) | |
| Talc | | 0.10 | | 1 | | Exponentia | | 0.55 | | 75 | | 50 | | 10 | | 220 | | -23 | | 0 | |
| | | 2 | | Spherical | | 0.35 | | 150 | | 80 | | 30 | | | | |
The non-rotated block model was set up in UTM coordinate system, Zone 4, NAD 83 datum. The block model has a parent block size of 10 x 10 x 5 m with a sub-block size of 2 x 2 x 1 m. Table 11-17 shows the Arctic block model parameters.
The original sub-block model was regularized to 5 x 5 x 5 m for the Reserve estimation.
| Table 11-17: | Arctic Block Model Parameters |
| Block Size (m) | | Model Origin UTM | | Boundary Size | | | |
| Axis | | Parent | | Sub | | Bottom Left Corner | | (m) | | No. of Parent Blocks | |
| X | | 10 | | 2 | | 612,190 | | 1,910 | | 191 | |
| Y | | 10 | | 2 | | 7,452,095 | | 1,950 | | 195 | |
| Z | | 5 | | 1 | | 345 | | 705 | | 141 | |
| Rotation | | Dip (degree)
Azi. (degree) | | 0 0 | | - | |
| 11.5 | Mineral Resource Estimation |
Inside mineralized zones, payable metals (Cu, Zn, Pb, Ag and Au), deleterious elements, and SG were estimated using ordinary kriging (OK) in three passes with increasing search ellipsoid sizes. Talc was also estimated in the high-grade talc zones using OK with three passes. Outside of mineralized zones, payable metals, deleterious elements, and SG were estimated using inverse distance to the power of two (ID2) with three passes. Sub-blocks receive the estimated grade values of parent blocks. Each mineralized zone is treated as hard boundaries, meaning that the data from one mineralized zone was not used to estimate grades in other zones. Table 11-18 to Table 11-21 show search ellipsoid sizes, and minimum and maximum number of composites used for the block grade estimations.
| | |
| Arctic Project | Page 193 |
| S-K 1300 Technical Report Summary | November 30, 2022 |
| | |
| Table 11-18: | Search Ellipsoid Parameters Used for Payable Metals (Cu, Zn, Ag, and Au) |
| Search Parameters Payable Metals | |
| | | | Search Distances | | Composites | | Octants | |
Minzone/
Lithology | | Method | | Pass | | Y (m) | | X (m) | | Z (m) | | Min | | Max | | Max Per DDH* | | Min | | Min Comps | | Max Comps | |
| Bottom Group | | Ordinary Kriging with LVA** | | 1 | | 125 | | 100 | | 6 | | 3 | | 12 | | 2 | | 2 | | 1 | | 2 | |
| | | 2 | | 250 | | 200 | | 12 | | 3 | | 16 | | 2 | | 2 | | 1 | | 2 | |
| | | 3 | | 750 | | 600 | | 36 | | 1 | | 21 | | 2 | | - | | - | | - | |
| Mid Group | | Ordinary Kriging with LVA | | 1 | | 130 | | 80 | | 9 | | 3 | | 12 | | 2 | | 2 | | 1 | | 2 | |
| | | 2 | | 260 | | 160 | | 18 | | 3 | | 16 | | 2 | | 2 | | 1 | | 2 | |
| | | 3 | | 780 | | 480 | | 54 | | 1 | | 21 | | 2 | | - | | - | | - | |
| Top Group | | Ordinary Kriging with LVA | | 1 | | 130 | | 90 | | 6 | | 3 | | 12 | | 2 | | 2 | | 1 | | 2 | |
| | | 2 | | 260 | | 180 | | 12 | | 3 | | 16 | | 2 | | 2 | | 1 | | 2 | |
| | | 3 | | 780 | | 540 | | 36 | | 1 | | 21 | | 2 | | - | | - | | - | |
| Lithologies | | Inverse Distance squared with LVA | | 1 | | 125 | | 90 | | 7 | | 3 | | 12 | | 2 | | 2 | | 1 | | 2 | |
| | | 2 | | 250 | | 180 | | 14 | | 2 | | 16 | | 2 | | 2 | | 1 | | 2 | |
| | | 3 | | 750 | | 540 | | 42 | | 1 | | 21 | | 2 | | - | | - | | - | |
| Talc | | Ordinary Kriging with LVA | | 1 | | 200 | | 100 | | 35 | | 3 | | 12 | | 2 | | - | | - | | - | |
| | | 2 | | 400 | | 200 | | 70 | | 3 | | 16 | | 2 | | - | | - | | - | |
| | | 3 | | 4,000 | | 2,000 | | 700 | | 1 | | 21 | | 2 | | - | | - | | - | |
| | | | | | | | | | | | | | | | | | | | | | | | | | |
*DDH: Diamond Drill Hole
**LA: Locally Varying Anisotropy
| | |
| Arctic Project | Page 194 |
| S-K 1300 Technical Report Summary | November 30, 2022 |
| | |
| Table 11-19: | Search Ellipsoid Parameters Used for Deleterious Elements |
| Search Parameters Deleterious Elements | |
| | | | | Search Distances | | Composites | | Capped | | Octants | |
Minzone/
Lithology | | Method | | Pass | | Y (m) | | X (m) | | Z (m) | | Min | | Max | | Max Per DDH | | | | Min | | Min Comp | | Max Comp | |
| Bottom Group | | Ordinary Kriging with LVA | | 1 | | 45 | | 60 | | 6 | | 3 | | 12 | | 2 | | No | | - | | - | | - | |
| | | 2 | | 90 | | 120 | | 12 | | 2 | | 16 | | 2 | | No | | - | | - | | - | |
| | | 3 | | 780 | | 600 | | 36 | | 1 | | 21 | | 2 | | Yes | | - | | - | | - | |
| Mid Group | | Ordinary Kriging with LVA | | 1 | | 45 | | 30 | | 9 | | 3 | | 12 | | 2 | | No | | - | | - | | - | |
| | | 2 | | 90 | | 60 | | 18 | | 2 | | 16 | | 2 | | No | | - | | - | | - | |
| | | 3 | | 780 | | 480 | | 54 | | 1 | | 21 | | 2 | | Yes | | - | | - | | - | |
| Top Group | | Ordinary Kriging with LVA | | 1 | | 60 | | 45 | | 6 | | 3 | | 12 | | 2 | | No | | - | | - | | - | |
| | | 2 | | 120 | | 90 | | 12 | | 2 | | 16 | | 2 | | No | | - | | - | | - | |
| | | 3 | | 780 | | 510 | | 36 | | 1 | | 21 | | 2 | | Yes | | - | | - | | - | |
| Lithologies | | Inverse Distance squared with LVA | | 1 | | 60 | | 45 | | 6 | | 3 | | 12 | | 2 | | No | | - | | - | | - | |
| | | 2 | | 120 | | 90 | | 12 | | 2 | | 16 | | 2 | | No | | - | | - | | - | |
| | | 3 | | 780 | | 510 | | 36 | | 1 | | 21 | | 2 | | Yes | | - | | - | | - | |
| Table 11-20: | Search Ellipsoid Parameters Used for Talc |
| Search Parameters Talc | |
| | | | | Search Distances | | Composites | | Octants | |
Minzone/
Lithology | | Method | | Pass | | Y (m) | | X (m) | | Z (m) | | Min | | Max | | Max Per DDH | | Min | | Min Comp | | Max Comp | |
| Talc | | Ordinary Kriging with LVA | | 1 | | 200 | | 100 | | 35 | | 3 | | 12 | | 2 | | - | | - | | - | |
| | | 2 | | 400 | | 200 | | 70 | | 3 | | 16 | | 2 | | - | | - | | - | |
| | | 3 | | 4,000 | | 2,000 | | 700 | | 1 | | 21 | | 2 | | - | | - | | - | |
| | |
| Arctic Project | Page 195 |
| S-K 1300 Technical Report Summary | November 30, 2022 |
| | |
| Table 11-21: | Search Ellipsoid Parameters Used for SG |
| Search Parameters Specific Gravity | |
| | | | | Search Distances | | Composites | | Octants | |
Minzone/
Lithology | | Method | | Pass | | Y (m) | | X (m) | | Z (m) | | Min | | Max | | Max Per DDH | | Min | | Min Comp | | Max Comp | |
| Bottom Group | | Ordinary Kriging with LVA | | 1 | | 130 | | 100 | | 6 | | 2 | | 12 | | - | | - | | - | | - | |
| | | 2 | | 260 | | 200 | | 12 | | 1 | | 15 | | - | | - | | - | | - | |
| | | 3 | | 780 | | 600 | | 36 | | 1 | | 15 | | - | | - | | - | | - | |
| Mid Group | | Ordinary Kriging with LVA | | 1 | | 130 | | 80 | | 9 | | 2 | | 12 | | - | | - | | - | | - | |
| | | 2 | | 260 | | 160 | | 18 | | 1 | | 15 | | - | | - | | - | | - | |
| | | 3 | | 780 | | 480 | | 54 | | 1 | | 15 | | - | | - | | - | | - | |
| Top Group | | Ordinary Kriging with LVA | | 1 | | 115 | | 85 | | 6 | | 2 | | 12 | | - | | - | | - | | - | |
| | | 2 | | 230 | | 170 | | 12 | | 1 | | 15 | | - | | - | | - | | - | |
| | | 3 | | 690 | | 510 | | 36 | | 1 | | 15 | | - | | - | | - | | - | |
| Lithologies | | Inverse Distance squared with LVA | | 1 | | 125 | | 90 | | 7 | | 2 | | 12 | | - | | - | | - | | - | |
| | | 2 | | 250 | | 180 | | 14 | | 1 | | 15 | | - | | - | | - | | - | |
| | | 3 | | 750 | | 540 | | 42 | | 1 | | 15 | | - | | - | | - | | - | |
| | |
| Arctic Project | Page 196 |
| S-K 1300 Technical Report Summary | November 30, 2022 |
| | |
Locally Varying Anisotropy (LVA) was used to orient search ellipsoids at each block centroid location. The LVA parameters were calculated using each mineralized zone top and bottom surfaces. Table 11-10 shows search ellipsoids, at two different block locations, oriented by LVA parameters at each location following the orientation of the mineralized Zone 5 wireframes used for Cu estimation within the mineralized Zone 5.
| Figure 11-8: | LVA Search Ellipsoids Used in Minzone 5 (Red, Top Group) for Cu Estimation |
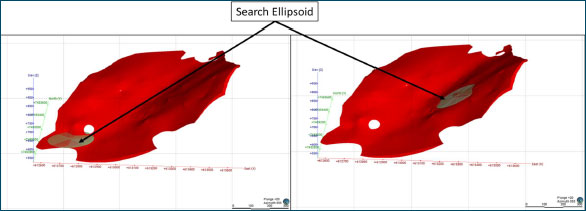
Source: Ambler Metals, 2022.
| 11.5.1.1 | Visual Inspection |
A detailed visual inspection of the block model was conducted in both section and plan to compare estimated grades against underlying sample data. This included confirmation of the proper coding of blocks within the respective domains.
Figure 11-9 to Figure 11-13 show East-West cross-section maps for the payable metals block grade and composite database used for the estimation. In general, globally, block estimates compared well with composites.
| | |
| Arctic Project | Page 197 |
| S-K 1300 Technical Report Summary | November 30, 2022 |
| | |
| Figure 11-9: | East-West Cross-Section for Cu Block Model and Composite Data, Looking North (Resource pit depicted in red) |

Source: Ambler Metals, 2022.
| Figure 11-10: | East-West Cross-Section for Zn Block Model and Composite Data, Looking North (Resource pit depicted in red) |
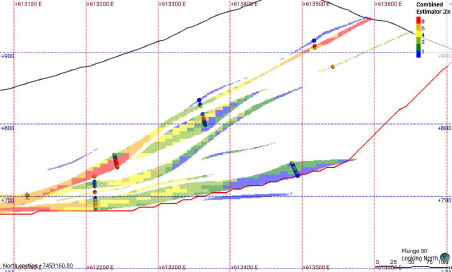
Source: Ambler Metals, 2022.
| | |
| Arctic Project | Page 198 |
| S-K 1300 Technical Report Summary | November 30, 2022 |
| | |
| Figure 11-11: | East-West Cross-Section for Pb Block Model and Composite Data, Looking North (Resource pit depicted in red) |
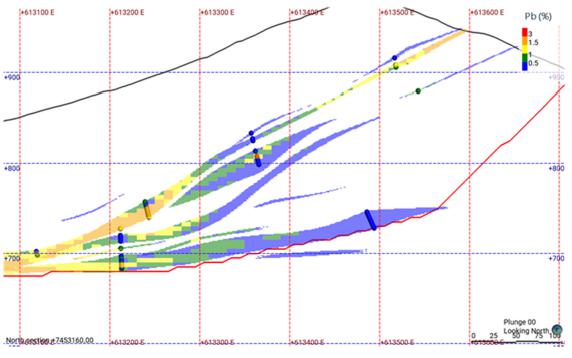
Source: Ambler Metals, 2022.
| Figure 11-12: | East-West Cross-Section for Ag Block Model and Composite Data, Looking North (Resource pit depicted in red) |
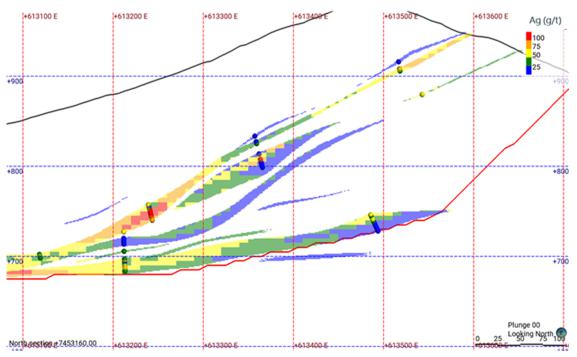
Source: Ambler Metals, 2022.
| | |
| Arctic Project | Page 199 |
| S-K 1300 Technical Report Summary | November 30, 2022 |
| | |
| Figure 11-13: | East-West Cross-Section for Au Block Model and Composite Data, Looking North (Resource pit depicted in red) |
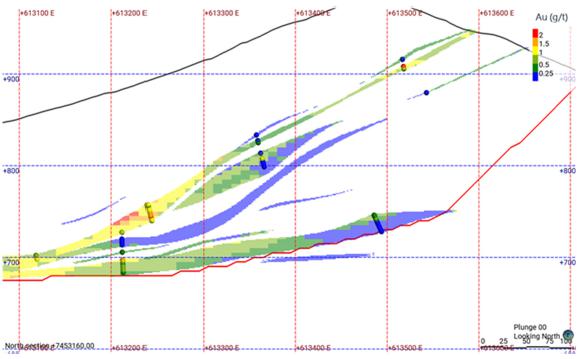
Source: Ambler Metals, 2022.
| 11.5.1.2 | Statistical Validation |
Comparing the basic statistics of the OK block model with the Nearest Neighbour (NN) model help quantify whether the estimate is over or underestimated. In general, Wood considers differences of less than five percent between the two models mean grades is reasonable for validating global grade bias.
Summary statistics of payable metal mean grades for the main mineralized zones (Zones 1, 3, and 5) are shown in Table 11-22. Globally, the models validate well as OK estimated block model mean grades and declustered composites (the nearest neighbours model) means are close except for some smaller domains. These smaller domains were estimated with a small number of samples, which needs further investigation. In other minor mineralized domains, some domains show larger differences due to the lack of supporting drill hole data.
Swath plots are used to detect any spatial-geographical bias in an estimated model. Plots compare average grades of the NN and estimated models over swaths that are typically one block wide in all directions.
The estimated models (ID2 and OK) and NN estimates swaths should follow the same trend with the NN plot typically experiencing higher highs and lower lows than the smoother estimated models. In areas where there are large discrepancies or deviations from each other, the models should be further investigated to determine the reason and modify as required.
| | |
| Arctic Project | Page 200 |
| S-K 1300 Technical Report Summary | November 30, 2022 |
| | |
There is good correspondence between the models in most areas. The validation results indicate that the OK model is a reasonable reflection of the underlying sample data.
Figure 11-14 to Figure 11-18 show swath plots for the payable metals for the main mineralized zones (zone 1, 3 and 5).
| | |
| Arctic Project | Page 201 |
| S-K 1300 Technical Report Summary | November 30, 2022 |
| | |
| Table 11-22: | Statistics of OK and NN for Payable Metals for the Main Mineralized Zones |
| | | | | Mean Cu
(%) | | Mean Pb
(%) | | Mean Zn
(%) | | Mean Au
(g/t) | | Mean Ag
(g/t) | |
| Minzone | | No. of Blocks | | OK | | NN | | % Diff | | OK | | NN | | % Diff | | OK | | NN | | % Diff | | OK | | NN | | % Diff | | OK | | NN | | % Diff | |
| Zone 1 | | 693,631 | | 2.587 | | 2.448 | | -5 | | 0.736 | | 0.694 | | -6 | | 3.860 | | 3.636 | | -6 | | 0.706 | | 0.661 | | -6 | | 50.022 | | 47.206 | | -6 | |
| Zone 3 | | 870,408 | | 2.801 | | 2.759 | | -2 | | 0.684 | | 0.657 | | -4 | | 3.565 | | 3.494 | | -2 | | 0.314 | | 0.323 | | 3 | | 33.120 | | 33.283 | | 0 | |
| Zone 5 | | 930,886 | | 3.451 | | 3.287 | | -5 | | 1.016 | | 0.982 | | -3 | | 4.808 | | 4.394 | | -9 | | 0.723 | | 0.709 | | -2 | | 51.867 | | 50.029 | | -4 | |
| | |
| Arctic Project | Page 202 |
| S-K 1300 Technical Report Summary | November 30, 2022 |
| | |
| Figure 11-14: | Cu Swath Plot, OK (Red), NN (Green) and Composite (Black), North-South Direction |
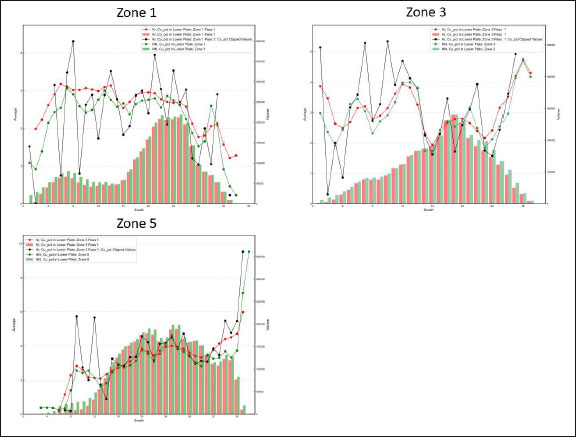
Source: Ambler Metals, 2022.
| | |
| Arctic Project | Page 203 |
| S-K 1300 Technical Report Summary | November 30, 2022 |
| | |
| Figure 11-15: | Pb Swath Plot, OK (Red), NN (Green) and Composite (Black), North-South Direction |
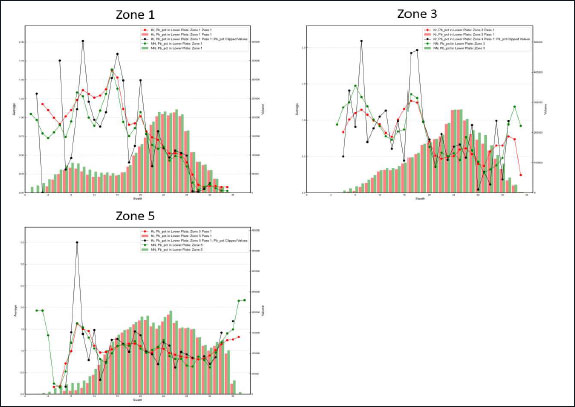
Source: Ambler Metals, 2022.
| | |
| Arctic Project | Page 204 |
| S-K 1300 Technical Report Summary | November 30, 2022 |
| | |
| Figure 11-16: | Zn Swath Plot, OK (Red), NN (Green) and Composite (Black), North-South Direction |
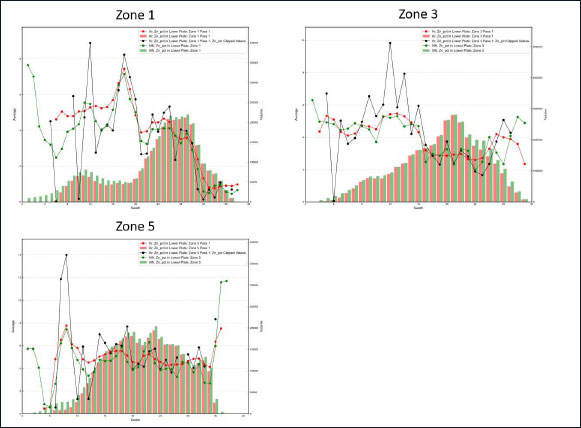
Source: Ambler Metals, 2022.
| | |
| Arctic Project | Page 205 |
| S-K 1300 Technical Report Summary | November 30, 2022 |
| | |
| Figure 11-17: | Ag Swath Plot, OK (Red), NN (Green) and Composite (Black), North-South Direction |
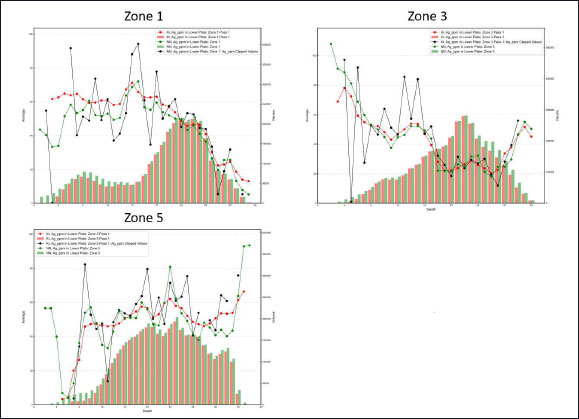
Source: Ambler Metals, 2022.
| | |
| Arctic Project | Page 206 |
| S-K 1300 Technical Report Summary | November 30, 2022 |
| | |
| Figure 11-18: | Au Swath Plot, OK (Red), NN (Green) and Composite (Black), North-South Direction |
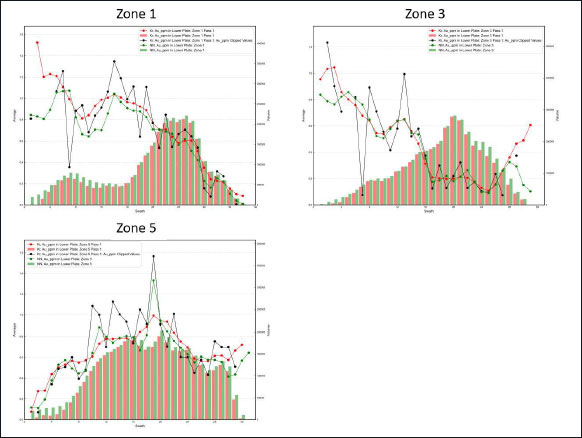
Source: Ambler Metals, 2022.
| 11.5.1.4 | Validation of Block Model with the New Drill Holes |
Wood reviewed the new drilling data collected after the closing of the database for the current mineral resource model by displaying copper grades for both the drill holes and the current block model in East-West cross sections.
Copper grades in the new drill holes match well with the current block model copper grades visually and confirm mineralization zones defined.
| | |
| Arctic Project | Page 207 |
| S-K 1300 Technical Report Summary | November 30, 2022 |
| | |
| 11.5.2 | Mineral Resource Classification |
The Mineral Resources were classified in accordance with the standards and definitions of S-K 1300. The classification parameters are defined relative to the distance between sample data and are intended to encompass zones of reasonably continuous mineralization that exhibit the desired degree of confidence in the estimate.
Classification parameters are generally linked to the scale of a deposit: a relatively narrow, high-grade deposit would likely be mined using selective mining methods, at a much lower daily rate than a large, low-grade, bulk mineable deposit. The scale and selectivity of these two examples differs significantly and is reflected in the drill-hole spacing required to achieve the desired level of confidence to define a volume of material that represents, for example, a year of production. Based on engineering studies completed to date, the Arctic deposit is amenable to open pit extraction methods at a production rate of approximately 10,000 t/d. A drill hole spacing study, which tests the reliability of estimates for a given volume of material at varying drill hole spacing, suggests that drilling on a nominal 100 m grid pattern would provide annual estimates of sufficient confidence to classify them in the Indicated category. These results were combined with grade and indicator variograms and other visual observations of the nature of the deposit in defining the criteria for mineral resource classification as described below. At this stage of the Project, there is insufficient density of drilling information to support the definition of Mineral Resources in the Measured category. Manual “smoothing” of the Resource Classification was not performed.
The Wood QP expects the majority of Inferred Mineral could be upgraded to Indicated Mineral Resources with additional exploration.
Table 11-23 shows the Mineral Resource classification criteria used in the resource model. Figure 11-19 and Figure 11-20 show plan view and cross-section map of the Mineral Resource Classification model.
| Table 11-23: | Mineral Resource Classification and Criteria |
| Resource Classification | Criteria |
| Measured | Not used |
| Indicated | Mineralized zones parent block centroid estimated with composites within 100 m of three drill holes. |
| Inferred | Mineralized zones parent block centroid estimated with composites within 150 m of one drill holes. |
| | |
| Arctic Project | Page 208 |
| S-K 1300 Technical Report Summary | November 30, 2022 |
| | |
| Figure 11-19: | Oblique View of Mineral Resource Classification Model |
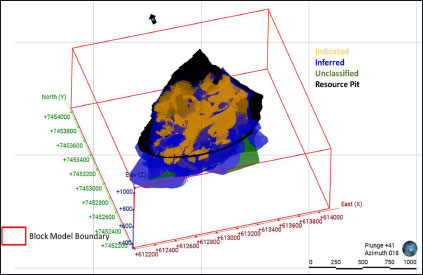
Source: Ambler Metals, 2022.
| Figure 11-20: | Cross-Section of Mineral Resource Classification Model, Looking North |
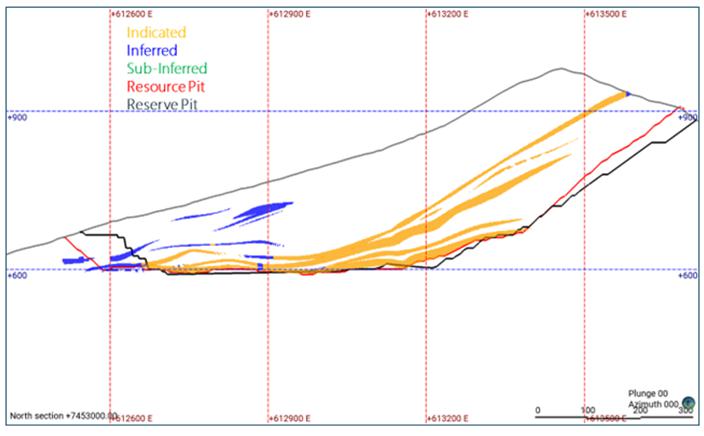
Source: Ambler, 2022.
| | |
| Arctic Project | Page 209 |
| S-K 1300 Technical Report Summary | November 30, 2022 |
| | |
| 11.5.3 | Uncertainties Affecting Mineral Resource Confidence Classification |
Factors that may affect the mineral resource estimate are listed below:
| · | Uncertainties in sampling and drilling methods, data processing and handling |
| · | Metal price assumptions. |
| · | Uncertainties in the assumptions used to generate the cut-off grade. |
| · | Uncertainties in the geological and mineralization shapes, and geological and grade continuity assumptions. |
| · | Uncertainties in the historically predicted (estimated) SG values determined by Random Forest Regressor. |
| · | Uncertainties in the geotechnical, mining, and metallurgical recovery assumptions. |
| · | Uncertainties represented by historical assay values for payable metals. |
| · | Uncertainties in the resource estimation process including parameters such as capping values, search ellipsoids, variogram models, number of composites. |
| · | Uncertainties to the input and design parameter assumptions that pertain to the conceptual pit constraining the estimates. |
| · | Uncertainties in the assumptions made to the concentrate marketability, payability and penalty terms. |
| · | Uncertainties in the assumptions regarding the continued ability to access the site, retain mineral and obtain surface rights titles, obtain environment and other regulatory permits, and maintain the social license to operate. |
The above uncertainties were considered in Mineral Resource classification criteria and in the opinion of the QP all issues relating to all relevant technical and economic factors likely to influence the prospect of economic extraction can be resolved with further work.
| 11.5.4 | Reasonable Prospects for Economic Extraction |
The Arctic deposit comprises several zones of relatively continuous moderate to high-grade polymetallic mineralization that extends from surface to depths of over 250 m below surface. The deposit is potentially amenable to open pit extraction methods. The “reasonable prospects for economic extraction” was tested using a floating cone pit shell derived based on a series of technical and economic assumptions considered appropriate for a deposit of this type, scale, and location. These parameters are summarized in Table 11-24.
Using these parameters, copper equivalent grades that incorporate contributions of the five different metals present in the deposit were calculated using the following equation:
CuEq%= (Cu% x 0.92) +(Zn% x 0.290) + (Pb% x 0.231) + (Au g/t x 0.398) + (Ag g/t x 0.005)
Using these parameters and the copper equivalent formula, an open pit marginal cut-off grade of 0.5% CuEq was determined.
| Table 11-24: | Parameters Used to Generate a Resource Constraining Pit Shell |
| Optimization Parameters | | | | | |
| Item | | Unit | | Value | |
| Open Pit Mining Cost | | $/t | | 3 | |
| Process Cost + G&A | | $/t | | 35 | |
| Pit Slope | | degree | | 43 | |
| Copper Price | | $/lb | | 3.00 | |
| Lead Price | | $/lb | | 0.90 | |
| Zinc Price | | $/lb | | 1.00 | |
| Gold Price | | $/oz | | 1,300 | |
| Silver Price | | $/oz | | 18 | |
| Metallurgical Recovery: Copper | | % | | 92 | |
| Lead | | % | | 77 | |
| Zinc | | % | | 88 | |
| Gold | | % | | 63 | |
| Silver | | % | | 56 | |
11.5.4.1 Basis of Commodity Prices and Cost Assumptions
Copper, lead, zinc, gold and silver are exchange-traded contracts on all of the world’s major commodity exchanges.
The input costs, recoveries and metal prices used to determine the metal cut-off for the Mineral Resources are based on the Arctic 2020 pre-feasibility study and are within the range of the long-term metal price forecast by mining analysts and investment banks at that time. These metal prices and cost inputs presented in Table 11-24 were fixed over the LOM of 13 years.
| | |
| Arctic Project | Page 210 |
| S-K 1300 Technical Report Summary | November 30, 2022 |
| | |
| 11.5.5 | Mineral Resource Statement |
The Mineral Resource estimate inclusive of Mineral Reserves is stated in Table 11-25. The Mineral Resource estimate exclusive of Mineral Reserves is stated in Table 11-26. All Indicated Mineral Resources have been converted to Mineral Reserves. Mineral Resources are reported in place (point of reference) and on a 100% basis; however, Trilogy’s attributable interest is 50% of the tonnes and metal content.
Figure 11-21 shows the isometric view of the Arctic resource model.
| Table 11-25: | Mineral Resource Summary Table, Inclusive of Mineral Reserves |
| | | | | Average Grade | | Contained Metal Content | |
| Confidence | | Tonnage | | Cu | | Pb | | Zn | | Au | | Ag | | Cu | | Pb | | Zn | | Au | | Ag | |
| Category | | (Mt) | | (%) | | (%) | | (%) | | (g/t) | | (g/t) | | (Mlb) | | (Mlb) | | (Mlb) | | (koz) | | (Moz) | |
| Indicated | | 35.7 | | 2.98 | | 0.79 | | 4.09 | | 0.59 | | 45.2 | | 2,347 | | 621 | | 3,216 | | 675 | | 52 | |
| Inferred | | 4.5 | | 1.92 | | 0.70 | | 2.93 | | 0.43 | | 35.6 | | 189 | | 69 | | 288 | | 62 | | 5 | |
Notes:
| 1. | Mineral Resources are current as of November 30, 2022 and were verified by a Wood QP. |
| 2. | Mineral Resources were prepared in accordance with the standards and definitions of S-K 1300. |
| 3. | Mineral Resources stated are contained within a conceptual pit shell developed using metal prices of $3.00/lb Cu, $0.90/lb Pb, $1.00/lb Zn, $1300/oz Au and $18/oz Ag and metallurgical recoveries of 92% Cu, 77% Pb, 88% Zn, 63% Au and 56% Ag and operating costs of $3/t mining and $35/t process and G&A. The assumed average pit slope angle is 43°. |
| 4. | The cut-off grade is 0.5% copper equivalent. CuEq = (Cu%x0.92) + (Zn%x0.290) + (Pb%x0.231) + (Au g/tx0.398) + (Ag g/tx0.005). |
| 5. | As a result of flattening the north end of the reserve pit to stabilize the pit wall due to the presence of talc, a portion of the reserve pit extended beyond the resource constraining pit shell. Approximately 568kt of 1.72% Cu, 0.77% Pb, 0.23 g/t Au and 21.3 g/t Ag in the Indicated category, and approximately 319 kt of 2.01% Cu, 0.87% Pb, 2.53% Zn, 0.50 g/t Au and 37.5 g/t Ag in the Inferred category were added to the Mineral Resource tabulation. |
| 6. | The Mineral Resource estimate is reported inclusive of those Mineral Resource that were converted to Mineral Reserves. |
| 7. | Trilogy’s attributable interest is 50% of the tonnage and contained metal stated in the table. |
| 8. | Figures may not sum due to rounding. |
| Table 11-26: | Mineral Resource Summary Table, Exclusive of Mineral Reserves |
| | | | | Average Grade | | Contained Metal Content | |
| Confidence | | Tonnage | | Cu | | Pb | | Zn | | Au | | Ag | | Cu | | Pb | | Zn | | Au | | Ag | |
| Category | | (Mt) | | (%) | | (%) | | (%) | | (g/t) | | (g/t) | | (Mlb) | | (Mlb) | | (Mlb) | | (koz) | | (Moz) | |
| Inferred | | 4.5 | | 1.92 | | 0.70 | | 2.93 | | 0.43 | | 35.6 | | 189 | | 69 | | 288 | | 62 | | 5 | |
Notes:
| 1. | Mineral Resources are current as of November 30, 2022 and were verified by a Wood QP. |
| 2. | Mineral Resources were prepared in accordance with the standards and definitions of S-K 1300. |
| 3. | Mineral Resources stated are contained within a conceptual pit shell developed using metal prices of $3.00/lb Cu, $0.90/lb Pb, $1.00/lb Zn, $1,300/oz Au and $18/oz Ag and metallurgical recoveries of 92% Cu, 77% Pb, 88% Zn, 63% Au and 56% Ag and operating costs of $3/t mining and $35/t process and G&A. The assumed average pit slope angle is 43°. |
| | |
| Arctic Project | Page 211 |
| S-K 1300 Technical Report Summary | November 30, 2022 |
| | |
| 4. | As a result of flattening the north end of the reserve pit to stabilize the pit wall due to the presence of talc, a portion of the reserve pit extended beyond the resource constraining pit shell and approximately 319 kt of 2.01% Cu, 0.87% Pb, 2.53% Zn, 0.50 g/t Au and 37.5 g/t Ag in the Inferred category were added to the Mineral Resource tabulation. |
| 5. | The cut-off grade is 0.5% copper equivalent. CuEq = (Cu%x0.92) + (Zn%x0.290) + (Pb%x0.231) + (Au g/tx0.398) + (Ag g/tx0.005). |
| 6. | The Mineral Resource estimate is reported exclusive of those Mineral Resources that were converted to Mineral Reserves. |
| 7. | Trilogy’s attributable interest is 50% of the tonnage and contained metal stated in the table. |
| 8. | Figures may not sum due to rounding. |
| Figure 11-21: | Isometric View of Arctic Mineral Resource |
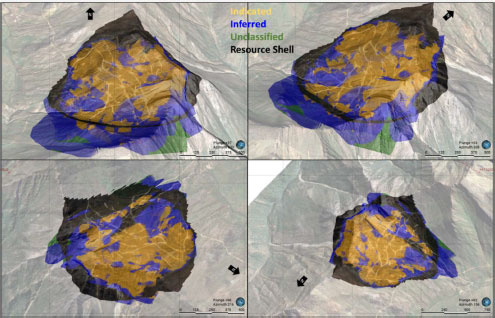
Source: Ambler Metals, 2022.
| | |
| Arctic Project | Page 212 |
| S-K 1300 Technical Report Summary | November 30, 2022 |
| | |
| 12 | MINERAL RESERVE ESTIMATES |
Mineral Reserves is classified in accordance with standards and definitions of S-K 1300. Modifying factors were applied to the Indicated Mineral Resources to convert them to Probable Mineral Reserves. Mineral Reserves for the Arctic deposit incorporate appropriate mining dilution and mining recovery estimations for the open pit mining method.
The Mineral Reserve estimate for the Arctic deposit is based on the resource block model provided by Ambler Metals, as well as other information provided by Ambler Metals, and information generated by Wood based on the preceding 2020 Feasibility Study.
The following sections outlines the procedures used to estimate the Mineral Reserves. The mine plan is based on the detailed mine design derived from the optimal pit shell produced by applying the Pseudoflow algorithm.
| 12.2 | Basis of Commodity Prices and Cost Assumptions Used in Pit Optimization and Cut-Off Determination |
To establish the long-term metal price forecast the Wood QP used a combination of information derived from 22 financial institutions, from pricing used in technical reports filed with Canadian regulatory authorities over the previous 12-month period, from pricing reported by major mining companies in public filings such as annual reports in the previous 12-month period, spot pricing, and three-year trailing average pricing. From this assessment the Wood QP considers industry consensus on a long-term price forecast on Mineral Reserves as stated in Table 12-1.
The costs stated in Table 12-1 are based on the 2020 Feasibility study and are fixed over the 13-year LOM production.
The pit shell that defines the ultimate pit limit, was derived in Whittle using the Pseudoflow pit optimization algorithm. The optimization procedure uses the block value and pit slopes to determine a group of blocks representing pits of valid slopes that yield the maximum profit. The block value is calculated using information stored in the geological block model, commodity prices, mining and processing costs, process recovery, and the sales cost for the metals produced. The pit slopes are used as constraints for removal precedence of the blocks (Xiaoyu Bai, et al., 2017). Table 12-1 provides a summary of the primary optimization inputs.
| Table 12-1: | Optimization Inputs |
| Parameter | | Unit | | Value | | Cu Conc. | | Pb Conc. | | Zn Conc. | |
| | | | | | | | | | | | |
| Metal Prices | |
| Copper | | $/lb | | 3.46 | | - | | - | | - | |
| Lead | | $/lb | | 0.91 | | - | | - | | - | |
| | |
| Arctic Project | Page 213 |
| S-K 1300 Technical Report Summary | November 30, 2022 |
| | |
| Parameter | | Unit | | Value | | Cu Conc. | | Pb Conc. | | Zn Conc. | |
| Zinc | | $/lb | | 1.12 | | - | | - | | - | |
| Gold | | $/oz | | 1,615 | | - | | - | | - | |
| Silver | | $/oz | | 21.17 | | - | | - | | - | |
| Discount Rate | | % | | 8 | | - | | - | | - | |
| Dilution and Mine Losses | | % | | Estimated in a block-by-block basis, adding up 30% to 40%. | |
| Mining Cost | |
| Reference Bench Elevation | | m | | 790 | | - | | - | | - | |
| Base Cost | | $/t | | 2.52 | | - | | - | | - | |
| Incremental Mining Cost | | | | | | - | | - | | - | |
| Uphill (below 790m) | | $/t/5m | | 0.02 | | - | | - | | - | |
| Downhill (above 790m) | | $/t/5m | | 0.012 | | - | | - | | - | |
| Process Costs | |
| Operating Cost | | $/t milled | | 18.31 | | - | | - | | - | |
| G&A | | $/t milled | | 5.83 | | - | | - | | - | |
| Sustaining Capital | | $/t milled | | 2.37 | | - | | - | | - | |
| Road Toll Cost | | $/t milled | | 8.04 | | - | | - | | - | |
| Closure | | $/t milled | | 4.27 | | - | | - | | - | |
| Processing Rate | | kt/d | | 10 | | - | | - | | - | |
| Process Recovery | |
| Copper | | % | | - | | 89.9 | | 2.4 | | 2.7 | |
| Lead | | % | | - | | 8.1 | | 79 | | 2.2 | |
| Zinc | | % | | - | | 3.4 | | 0.4 | | 90.6 | |
| Gold | | % | | - | | 10.9 | | 62.1 | | 5.4 | |
| Silver | | % | | - | | 26.4 | | 63.1 | | 3.4 | |
| Payable – Main Element | | % | | - | | 96.5 | | 95 | | 85 | |
| Treatment Cost | | $/dmt | | - | | 80 | | 160 | | 215 | |
| Refining Cost | |
| Copper | | $/lb | | - | | 0.08 | | - | | - | |
| Gold | | $/oz | | - | | 5 | | 10 | | - | |
| Silver | | $/oz | | - | | 0.5 | | 1.25 | | - | |
| | |
| Arctic Project | Page 214 |
| S-K 1300 Technical Report Summary | November 30, 2022 |
| | |
| Parameter | | Unit | | Value | | Cu Conc. | | Pb Conc. | | Zn Conc. | |
| Transport Cost | | $/dmt | | 271 | | - | | - | | - | |
| Concentrate Losses | | % weight | | 0.42 | | - | | - | | - | |
| Insurance Cost | | % | | 0.15 | | - | | - | | - | |
| Representation/Marketing | | $/wmt | | 2.5 | | - | | - | | - | |
| Slope Angles | |
| Geotechnical Sector 1 (2L-E) | | degrees | | Variable based on slope dip direction. IRA ranging from 26 to 56. | |
| Geotechnical Sector 2 (2L-W) | | degrees | | Variable based on slope dip direction IRA ranging from 38 to 56. | |
| Geotechnical Sector 3 (2U) | | degrees | | Variable based on slope dip direction IRA ranging from 29 to 56. | |
| Geotechnical Sector 4 (3) | | degrees | | Variable based on slope dip direction IRA ranging from 30 to 56. | |
| Geotechnical Sector 5 (4L) | | degrees | | Variable based on slope dip direction IRA ranging from 34 to 56. | |
| Geotechnical Sector 6 (4U) | | degrees | | Variable based on slope dip direction IRA ranging from 37 to 56. | |
| Royalties | |
| NANA Surface Use | | %NSR | | 1 | | - | | - | | - | |
Wood converted the resource model provided by Ambler Metals from a sub-blocked to a regularized percentage model. The model was imported into the optimization software containing grades, block percentages, material density, slope sectors, rock types, and net smelter return. The optimization run was carried out only using Indicated Mineral Resources to define the optimal mining limits.
The optimization run included 46 pit shells defined according to different revenue factors, ranging from a revenue factor of 0.3 to 1.2, where a revenue factor of 1 is the base case. To select the optimal pit shell that defines the ultimate pit limit, Wood conducted a pit-by-pit analysis to evaluate the contribution of each incremental shell to the discounted cash flow (DCF), assuming a processing plant capacity of 10 kt/d and a yearly discount rate of 8% (Figure 12-1). Following this analysis, pit shell 17 (revenue factor of 0.62) was selected. Although the DCF for the Selected pit shell is slightly lower in comparison to the Base Case pit shell, the selected pit shell eliminates mining 39.3 Mt of waste while only losing 1.9 Mt of ore. The DCF does not account for initial capital expenditures.
| | |
| Arctic Project | Page 215 |
| S-K 1300 Technical Report Summary | November 30, 2022 |
| | |
| Figure 12-1: | Pit-by-Pit Analysis |
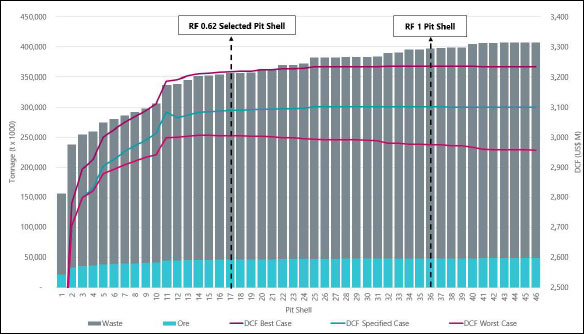
Source: Wood, 2022.
Following the pit-by-pit analysis, a secondary exercise was performed on the selected pit shell to incorporate a higher level of detail to the slope definition and to force the northeast wall to fully mine areas in the pit where talc zones are problematic for slope stability. As a result of this exercise, material contained within the selected pit shell increases by 13 Mt of waste and 0.8 Mt of ore. The final pit shell to be used as the basis for the ultimate pit and mine planning for the Arctic Project is shown in Figure 12-2.
| | |
| Arctic Project | Page 216 |
| S-K 1300 Technical Report Summary | November 30, 2022 |
| | |
| Figure 12-2: | Selected Pit Shell |
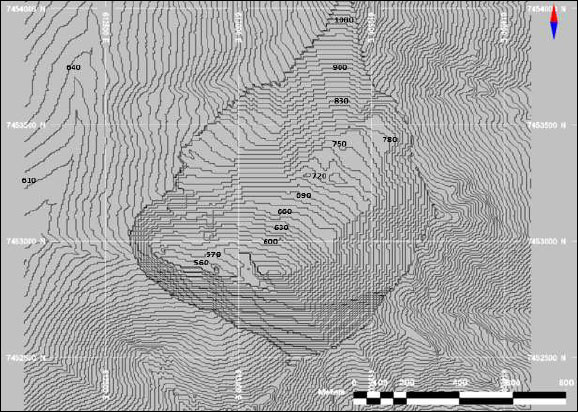
Source: Wood, 2022.
| 12.4 | Dilution and Ore Losses |
The Mineral Resources for the Arctic Project were reported undiluted. In order to determine Mineral Reserves, dilution was applied to the resource model in two steps: internal dilution and contact dilution.
Internal dilution accounts for the waste material entrenched within the deposit at the scale of the selective mining unit (SMU) block size. Contact dilution accounts for the dilution and ore losses caused by a block mixing with its surroundings during the mining process and includes ore losses.
For transition points between ore and waste, ore loss and dilution will take place as shown in Figure 12 3. Blocks with diluted grades that fell below the cut-off grade were treated as waste and removed from the Mineral Reserve as ore losses.
| | |
| Arctic Project | Page 217 |
| S-K 1300 Technical Report Summary | November 30, 2022 |
| | |
| Figure 12-3: | Contact Dilution Concept |
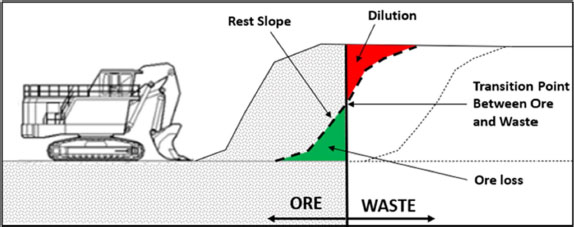
Source: Wood, 2022.
Internal dilution was estimated as follows:
| • | The resource model was regularized to 5x5x5 m to better approximate mining selectivity. The regularized block model contained the volume percentage within the mineralized zone, and grades and densities for the mineralized zone and host rock. |
| • | The grades were diluted per each block using the formula: |
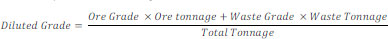
Contact dilution was estimated as follows:
| • | To simulate the concept shown in Figure 12-3, the grade of a given block was diluted by blending it with 20% of the tonnage from each of its four lateral blocks . The tonnage of the diluted block remains unchanged in the block model. |
| • | For lateral blocks classified as Inferred Mineral Resource, grade was set to zero for dilution purposes. |
The procedure is illustrated in Figure 12-4.
| | |
| Arctic Project | Page 218 |
| S-K 1300 Technical Report Summary | November 30, 2022 |
| | |
| Figure 12-4: | Contact Dilution Estimation Procedure |
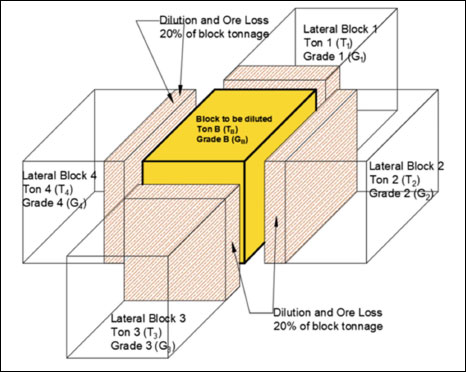
Source: Wood, 2022.
The cut-off was based on the NSR value. The NSR has been calculated according to the following formulas:

Cost, metal pricing and sales costs are listed in Table 12-1. Variable process recoveries used in the NSR calculation are listed in Table 12-2.
The marginal cut-off pays for all the costs except the mining cost and was estimated to be $38.8/t. The economic cut-off pays for all the costs including the mining cost and varies by depth with incremental mining cost between $41.3/t to $ 42.2/t. Ore above the marginal cut-off was included in the Mineral Reserves.
Table 12-2: Variable Process Recoveries Used in the NSR Calculation
| Parameter | | Cu Conc | | | Pb Conc | | | Zn Conc | |
| Copper | | | 92.2 | | | | 0.8 | | | | 2.1 | |
| Lead | | | 16.0 | | | | 62.2 | | | | 4.5 | |
| Zinc | | | 1.9 | | | | 1.3 | | | | 87.6 | |
| Gold | | | 47.2 | | | | 26.1 | | | | 3.3 | |
| Silver | | | 32.7 | | | | 48.7 | | | | 5.8 | |
| | |
| Arctic Project | Page 219 |
| S-K 1300 Technical Report Summary | November 30, 2022 |
| | |
| 12.6 | Mineral Reserves Statement |
Individual blocks captured within the final pit design were identified as either ore or waste by applying the parameters shown in Figure 12 1 with the exception of the metallurgical recoveries which were applied variably on a block-by-block basis. Using the partial block percentages within the final pit design, the ore tonnage and average grades were calculated. The Mineral Reserves statement is shown in Table 12 2. The point of reference for the Mineral Reserves is defined at the point where the ore is delivered to the processing plant. Trilogy’s attributable interest is 50% of the tonnes of the Mineral Reserves.
| Table 12-3: | Mineral Reserve Statement |
| | | Tonnage | | Average Grade | |
| Confidence Category | | Mt | | Cu (%) | | Pb (%) | | Zn (%) | | Au (g/t) | | Ag (g/t) | |
| Probable Mineral Reserves | | 46.7 | | 2.11 | | 0.56 | | 2.90 | | 0.42 | | 31.8 | |
Notes:
| 1. | Mineral Reserves estimates are current as of November 30, 2022 and were prepared by a Wood QP. |
| 2. | Mineral Reserves were estimated assuming open pit mining methods and include a combination of internal and contact dilution. Total dilution is expected to be between 30% and 40%. Pit slopes vary by sector and range from 26° to 56°. A marginal NSR cut-off of $38.8 /t is used. |
| 3. | Mineral Reserves are based on prices of $3.46/lb Cu, $0.91/lb Pb, $1.12/lb Zn, $1,615/oz Au, and $21.17/oz Ag. |
| 4. | Variable process recoveries averaging 92.2% Cu in Cu concentrate, 62.2% Pb in Pb concentrate, 87.6% Zn in Zn concentrate, 16.0% Pb in Cu concentrate, 1.9% Zn in Cu concentrate, 47.2% Au in Cu concentrate, 32.7% Ag in Cu concentrate, 0.8% Cu in Pb concentrate, 1.3% Zn in Pb concentrate, 26.1% Au in Pb concentrate, 48.7% Ag in Pb concentrate, 2.1% Cu in Zn concentrate, 4.5% Pb in Zn concentrate, 3.3% Au in Zn concentrate, 5.8% Ag in Zn concentrate. |
| 5. | Mineral Reserves are based on mining cost of $2.52/t incremented at $0.02/t/5m and $0.012/t/5m below and above 790 m elevation, respectively. |
| 6. | Costs applied to processed material following: process operating cost of $18.31/t, G&A of $5.83/t, sustaining capital cost of $2.37/t, closure cost of $4.27/t, road toll cost of $8.04/t. |
| 7. | Strip ratio (waste:ore) is 7.3:1. |
| 8. | Selling terms following: payables of 96.5% of Cu, 95% of Pb and 85% of Zn, treatment costs of $80/t Cu concentrate, $160/t Pb concentrate and $215/t Zn concentrate; refining costs of $0.08/lb Cu in Cu concentrate, and $10/oz Au, $1.25/oz Ag in Pb concentrate; and transport cost $270.98/t concentrate. |
| 9. | Fixed royalty percentage of 1% NSR. |
| 10. | Trilogy’s attributable interest is 50% of the tonnage stated in the table. |
| 12.7 | Risk Factors that Could Materially Affect the Mineral Reserve Estimates |
In the opinion of the QP, the Mineral Reserves are subject to the types of risks common to open pit polymetallic mining operations that exist in Alaska and may be materially affected by the following risk factors:
| • | Changes in metal prices from what was assumed; |
| • | Changes to the assumptions used to generate the cut-offs; |
| • | Changes in local interpretations of mineralization geometry and continuity of mineralized zones; |
| • | Changes to geological and mineralization shapes, and geological and grade continuity assumptions; |
| • | Changes to density and domain assignments from what was assumed; |
| • | Changes to geotechnical, hydrogeological design assumptions; |
| • | Changes to mining and metallurgical recovery assumptions; |
| • | Change to the input and design parameter assumptions that pertain to the open pit constraining the estimates; |
| | |
| Arctic Project | Page 220 |
| S-K 1300 Technical Report Summary | November 30, 2022 |
| | |
| • | Assumptions as to concentrate marketability, payability and penalty terms; |
| • | Assumptions as to the continued ability to access the site, retain mineral tenure and obtain surface rights titles, obtain environment and other regulatory permits, and maintain the social license to operate. |
More specifically the presence of certain talc layers in the rock have not been included in the current geological model and could affect the metallurgical recoveries and slope stability. Additionally, there is currently no developed surface access to the Arctic Project area and beyond. Access to the Arctic Project is proposed to be via AAP, a road approximately 340 km (211 miles) long, extending west from the Dalton Highway where it would connect with the proposed Arctic Project area. Construction costs of the road are not yet final. The working assumption is that AIDEA would arrange financing in the form of a public-private partnership to construct and arrange for the construction and maintenance of the access road. AIDEA would charge a toll to multiple mining and industrial users (including the Arctic Project) in order to pay back the costs of financing the AAP. The amount paid in tolls by any user would be affected by the cost of the road, its financing structure, and the number of mines and other users of the road which could also include commercial transportation of materials and consumer items that would use the AAP to ship concentrates to the Port of Anchorage in Alaska and possibly provide goods and commercial materials to villages in the region.
The Mineral Reserve estimation assumes toll payments of $5.52/t processed, plus a road maintenance fee of $2.52/t milled processed, resulting in a total road toll and maintenance LOM unit cost of $8.04/t processed. There is a risk that a negotiated road toll agreement may result in higher costs than what has been assumed.
| | |
| Arctic Project | Page 221 |
| S-K 1300 Technical Report Summary | November 30, 2022 |
| | |
The following section outlines the parameters and procedures used for the design of the mine as a conventional open pit, estimates of the Mineral Reserves within the open pit mine plan, and establishes a practical mining schedule for this Report. The mine plan is based on the Probable Mineral Reserves presented in Section 12.
The Arctic Project is designed as a conventional truck-shovel operation with 144 t trucks and 15 m3 shovels. The pit design includes four nested phases to balance stripping requirements while satisfying the concentrator requirements.
The design parameters include a ramp width of 30 m, road grades of 10%, bench height of 5 m, targeted mining width between 70 and 100 m, berm interval of 20 m, variable slope angles by sector and a minimum mining width of 30 m.
Wood performed a review of the pit geotechnical and hydrogeological assessment performed by SRK. Based on the review of the information provided by SRK, Wood agrees with their conclusions. Figure 13-1 shows the geotechnical slope design domains defined by SRK on the 2020 pit design. Table 13-1 shows a summary of the geotechnical design parameters recommended by SRK.
| | |
| Arctic Project | Page 222 |
| S-K 1300 Technical Report Summary | November 30, 2022 |
| | |
| Figure 13-1: | Geotechnical Slope Design Domains |
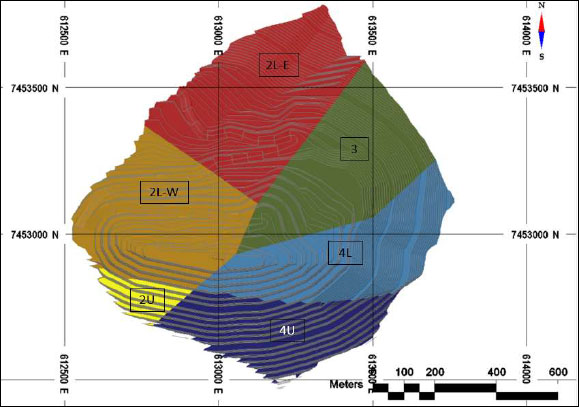
Source: Wood, 2022.
| Table 13-1: | Geotechnical Design Parameters |
| Slope Design Domain | | Face Slope Dip Direction (*) | | Bench Height (m) | | IRA (°) | | Design BFA* (°) | | Design Bench Width (m) | |
| 2L-E | | 330 - 020 | | 10 | | 40 | | 65 | | 7.5 | |
| | | 20 | | | 65 | | 14.5 | |
| | 020 - 050 | | 20 | | 56 | | 80 | | 10.0 | |
| | 050 - 100 | | 20 | | 45 | | 65 | | 10.5 | |
| | 100 - 160 | | 20 | | 38 | | 65 | | 16.0 | |
| | 160 - 250 | | 60 | | 26 | | 27 | | 8.0 | |
| | 250 - 300 | | 20 | | 38 | | 80 | | 22.0 | |
| | 300 - 330 | | 10 | | 50 | | 80 | | 7.5 | |
| | | 20 | | 55 | | 80 | | 10.5 | |
| | |
| Arctic Project | Page 223 |
| S-K 1300 Technical Report Summary | November 30, 2022 |
| | |
| | |
| | |
| Slope Design Domain | | Face Slope Dip Direction (*) | | Bench Height (m) | | IRA (°) | | Design BFA* (°) | | Design Bench Width (m) | |
| 2L-W | | 330 - 020 | | 10 | | 40 | | 65 | | 7.5 | |
| | | 20 | | | 65 | | 14.5 | |
| | 020 - 140 | | 20 | | 56 | | 80 | | 10.0 | |
| | 140 - 170 | | 20 | | 45 | | 65 | | 10.5 | |
| | 170 - 250 | | 60 | | 38 | | 41 | | 8.0 | |
| | 250 - 300 | | 20 | | 40 | | 65 | | 14.5 | |
| | 300 - 330 | | 10 | | 50 | | 80 | | 7.5 | |
| | | 20 | | 55 | | 80 | | 10.5 | |
| 2U | | 330 - 020 | | 20 | | 45 | | 65 | | 10.5 | |
| | 020 - 140 | | 20 | | 56 | | 80 | | 10.0 | |
| | 140 - 170 | | 20 | | 45 | | 65 | | 10.5 | |
| | 170 - 250 | | 60 | | 29 | | 31 | | 8.0 | |
| | 250 - 300 | | 20 | | 40 | | 65 | | 14.5 | |
| | 300 - 330 | | 10 | | 55 | | 80 | | 7.5 | |
| | | 20 | | | 80 | | 10.5 | |
| 3 | | 310 - 020 | | 10 | | 38 | | 65 | | 8.0 | |
| | | 20 | | | 65 | | 16.0 | |
| | 020 - 050 | | 20 | | 56 | | 80 | | 10.0 | |
| | 050 - 100 | | 20 | | 45 | | 65 | | 10.5 | |
| | 100 - 140 | | 20 | | 56 | | 80 | | 10.0 | |
| | 140 - 220 | | 20 | | 38 | | 65 | | 16.0 | |
| | 220 - 310 | | 60 | | 30 | | 32 | | 8.0 | |
| 4L | | 330 - 020 | | 10 | | 40 | | 65 | | 7.5 | |
| | | 20 | | | 65 | | 14.5 | |
| | 020 - 050 | | 20 | | 56 | | 80 | | 10.0 | |
| | 050 - 100 | | 20 | | 45 | | 65 | | 10.5 | |
| | 100 - 140 | | 20 | | 56 | | 80 | | 10.0 | |
| | 140 - 180 | | 20 | | 38 | | 65 | | 16.0 | |
| | 180 - 300 | | 60 | | 34 | | 37 | | 8.0 | |
| | 300 - 330 | | 10 | | 38 | | 65 | | 8.0 | |
| | | 20 | | | 65 | | 16.0 | |
| 4U | | 330 - 020 | | 20 | | 45 | | 65 | | 10.5 | |
| | 020 - 050 | | 20 | | 56 | | 80 | | 10.0 | |
| | 050 - 100 | | 20 | | 45 | | 65 | | 10.5 | |
| | 100 - 140 | | 20 | | 56 | | 80 | | 10.0 | |
| | 140 - 180 | | 20 | | 45 | | 65 | | 10.5 | |
| | 180 - 260 | | 60 | | 37 | | 40 | | 8.0 | |
| | 260 - 300 | | 20 | | 40 | | 65 | | 14.5 | |
| | 300 - 330 | | 10 | | 50 | | 80 | | 7.5 | |
| | | 20 | | 55 | | 80 | | 10.5 | |
*BFA: Bench Face Angle
As mentioned in Section 13.9.10 according to the SRK’s geotechnical recommendations, a large talc zone located in the northeast pit slope must be completely removed. To achieve this, a pit optimization giving dummy values to the talc zone blocks was performed. This pit optimization was used as the basis for the mine design.
The smoothed final pit design contains approximately 46.7 Mt of ore and 340.2 Mt of waste for a resulting stripping ratio of 7.3:1. Within the 46.7 Mt of ore, the average grades are 2.11% Cu, 2.90% Zn, 0.56% Pb, 0.42 g/t Au and 31.8 g/t Ag. Figure 13-2 shows the ultimate pit design. Figure 13-3 and Figure 13-4 show pit sections comparing the mine design to the selected pit shells for each optimization.
| | |
| Arctic Project | Page 224 |
| S-K 1300 Technical Report Summary | November 30, 2022 |
| | |
| Figure 13-2: | Ultimate Pit Design |
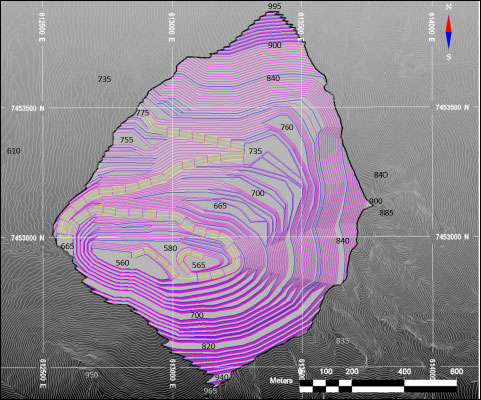
Source: Wood, 2022.
| | |
| Arctic Project | Page 225 |
| S-K 1300 Technical Report Summary | November 30, 2022 |
| | |
| Figure 13-3: | Section 1 Showing Mine Design and Selected Pit Shells (looking NW) |
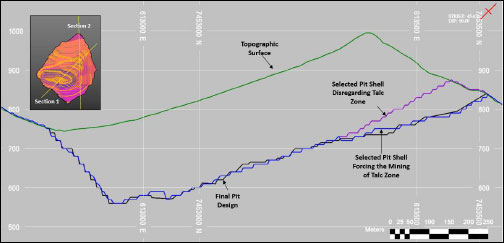
Source: Wood, 2022.
| Figure 13-4: | Section 2 Showing Mine Design and Selected Pit Shells (looking W) |
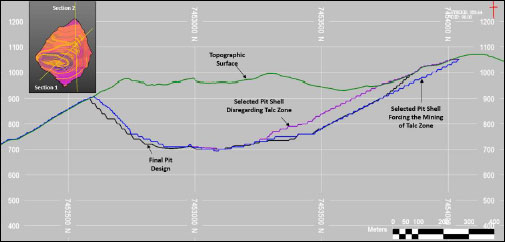
Source: Wood, 2022.
| | |
| Arctic Project | Page 226 |
| S-K 1300 Technical Report Summary | November 30, 2022 |
| | |
The deposit is mined in four nested phases, including the ultimate pit limit. During pre-production, the phasing strategy maximizes waste mining while minimizing the ore tonnage. This is primarily due to the lack of space to build ore stockpiles. In addition, the phasing strategy maintains enough exposed ore to guarantee the continuous operation of the process plant during the production. The phase designs are shown in Figure 13-5 to Figure 13-7.
| Figure 13-5: | Phase 1 Design |
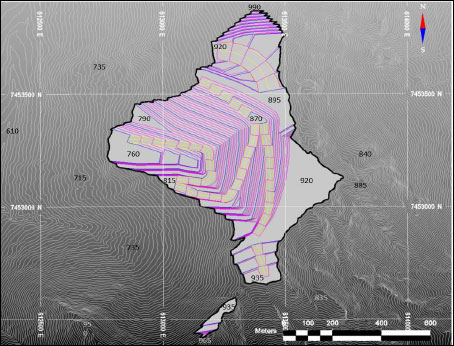
Source: Wood, 2022.
| | |
| Arctic Project | Page 227 |
| S-K 1300 Technical Report Summary | November 30, 2022 |
| | |
| Figure 13-6: | Phase 2 Design |
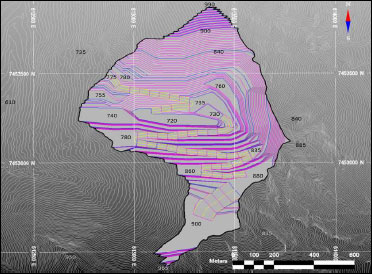
Source: Wood, 2022.
| Figure 13-7: | Phase 3 Design |
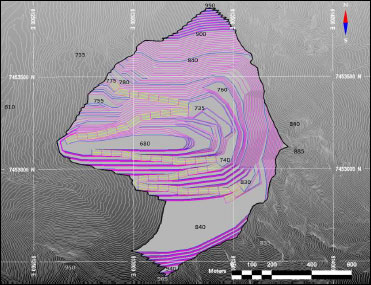
Source: Wood, 2022.
| | |
| Arctic Project | Page 228 |
| S-K 1300 Technical Report Summary | November 30, 2022 |
| | |
| 13.4 | Waste Rock Facilities and Stockpile Designs |
The design and construction of the WRF should ensure physical and chemical stability during and after mining activities. To achieve this, the waste areas and stockpiles are designed to account for benching, drainage, geotechnical stability, and concurrent reclamation.
The WRF design criteria include 23.5-m wide benches every 20 m in elevation with 2.5H:1V overall slopes, lifts from 5-m to 20-m high, and a 33% swell factor for estimating volumes. The overburden mined represents approximately 6% of the total waste and it is considered to be encapsulated within the waste rock. Figure 13-8 shows the WRF design.
| Figure 13-8: | Waste Rock Facility |
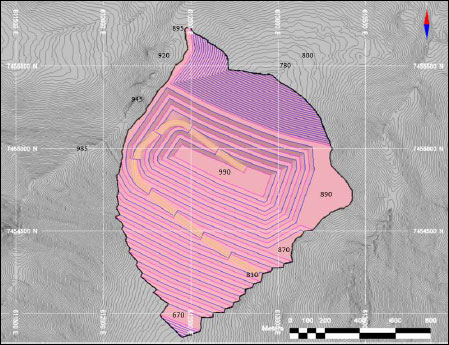
Source: Wood, 2022.
A stockpile is required to store the ore mined during the pre-production period. Because this stockpile is depleted at the beginning of the operation, it is located within the WRF footprint and has a total storage capacity of 223,000 m3. This volume is enough to satisfy the maximum stockpiling capacity of approximately 776 kt. Figure 13-9 shows the stockpile design with respect to the WRF at the end of the pre-production period.
| | |
| Arctic Project | Page 229 |
| S-K 1300 Technical Report Summary | November 30, 2022 |
| | |
| Figure 13-9: | Ore Stockpile |
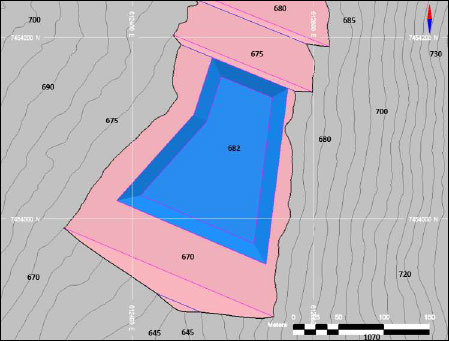
Source: Wood, 2022.
The production schedule includes the processing ramp up. The processing plant ramp-up considers the normal inefficiencies related to the start of operations, and includes the tonnage processed as well as the associated recoveries, which increases the design capacity during the second quarter of operation. The mine requires two years of pre-production before the start of operations in the processing plant.
The deposit is mined in four nested phases, including the ultimate pit limit. The schedule was developed in months for the pre-production period and the first two years of production, in quarters from Year 3 to Year 5 of production, and annually thereafter. The scheduling constraints set the maximum mining capacity at 35 Mt per year and the maximum number of benches mined per year at ten in each phase.
The production schedule based on the Probable Mineral Reserves shows a LOM of 15 years, including two years of pre-production. The amount of rehandled mill feed is 776 kt, which is the ore mined during the pre-production period. The average grades to the mill over the LOM are 2.11% Cu, 2.90% Zn, 0.56% Pb, 0.42 g/t Au, 31.83 g/t Ag and 2.92% Talc. The annual LOM summary schedule is shown in Table 13-2 and Figure 13-10. Figure 13-11 shows the annual tonnage mined by phase.
| | |
| Arctic Project | Page 230 |
| S-K 1300 Technical Report Summary | November 30, 2022 |
| | |
| Table 13-2: | Production Schedule |
| | | Tonnage | | Average Grade | |
| | | To Mill | | Mine to | | Total | | Cu | | Zn | | Pb | | Au | | Ag | | Talc | |
| Period | | Direct
(kt) | | Stockpile
(kt) | | Total
(kt) | | Stockpile
(kt) | | Waste
(kt) | | (%) | | (%) | | (%) | | (g/t) | | (g/t) | | (%) | |
| Year -2 | | - | | - | | - | | 493 | | 26,907 | | - | | - | | - | | - | | - | | - | |
| Year -1 | | - | | - | | - | | 283 | | 34,761 | | - | | - | | - | | - | | - | | - | |
| Year 1 | | 2,235 | | 776 | | 3,012 | | - | | 31,842 | | 2.59 | | 2.87 | | 0.55 | | 0.36 | | 33.07 | | 1.59 | |
| Year 2 | | 3,650 | | - | | 3,650 | | - | | 30,540 | | 2.06 | | 2.48 | | 0.50 | | 0.38 | | 29.03 | | 3.35 | |
| Year 3 | | 3,650 | | - | | 3,650 | | - | | 27,365 | | 1.94 | | 2.61 | | 0.56 | | 0.39 | | 28.42 | | 7.46 | |
| Year 4 | | 3,650 | | - | | 3,650 | | - | | 26,350 | | 1.88 | | 2.82 | | 0.58 | | 0.42 | | 28.03 | | 4.13 | |
| Year 5 | | 3,650 | | - | | 3,650 | | - | | 25,580 | | 1.87 | | 2.86 | | 0.53 | | 0.33 | | 26.36 | | 32.97 | |
| Year 6 | | 3,650 | | - | | 3,650 | | - | | 24,913 | | 1.99 | | 2.51 | | 0.49 | | 0.34 | | 28.66 | | 3.31 | |
| Year 7 | | 3,650 | | - | | 3,650 | | - | | 24,413 | | 2.37 | | 3.11 | | 0.57 | | 0.40 | | 31.75 | | 3.2 | |
| Year 8 | | 3,651 | | - | | 3,651 | | - | | 19,850 | | 2.00 | | 3.107 | | 0.61 | | 0.44 | | 32.44 | | 1.32 | |
| Year 9 | | 3,650 | | - | | 3,650 | | - | | 20,350 | | 2.05 | | 2.51 | | 0.39 | | 0.37 | | 28.50 | | 4.56 | |
| Year 10 | | 3,650 | | - | | 3,650 | | - | | 17,922 | | 2.33 | | 3.09 | | 0.53 | | 0.50 | | 36.80 | | 2.76 | |
| Year 11 | | 3,650 | | - | | 3,650 | | - | | 15,350 | | 2.41 | | 2.41 | | 0.64 | | 0.56 | | 38.68 | | 21.95 | |
| Year 12 | | 3,650 | | - | | 3,650 | | - | | 11,629 | | 1.98 | | 3.15 | | 0.66 | | 0.47 | | 34.08 | | 0.59 | |
| Year 13 | | 3,529 | | - | | 3,529 | | - | | 2,126 | | 2.09 | | 3.20 | | 0.69 | | 0.52 | | 38.39 | | 0.14 | |
| Total | | 45,915 | | 776 | | 46,691 | | 776 | | 338,726 | | 2.06 | | 2.83 | | 0.55 | | 0.41 | | 31.10 | | 2.89 | |
| | |
| Arctic Project | Page 231 |
| S-K 1300 Technical Report Summary | November 30, 2022 |
| | |
| Figure 13-10: | Annual Production Schedule |
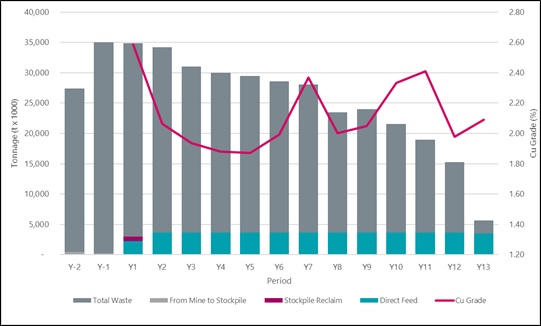
Source: Wood, 2022
| Figure 13-11: | Total Tonnage Mined, Scheduled by Phase |

Source: Wood, 2022
| | |
| Arctic Project | Page 232 |
| S-K 1300 Technical Report Summary | November 30, 2022 |
| | |
| 13.6 | Waste Material Handling |
Waste is hauled to the WRF using 144 t trucks. The construction sequence starts at the bottom of the dump by dumping the material in 5-m lifts, leaving a 23.5-m bench every four lifts. The resulting overall slope angle of the dump face is 2.5H:1V.
The Arctic mine is scheduled to operate 24 hours a day, seven days a week utilizing three rotating crews working 12-hour shifts. There are two 12-hour shifts scheduled, consisting of a day shift and a night shift. A number of duties only require work during the dayshift hours. For these duties, two crews rotate to provide seven day-a-week day-shift coverage.
For the rotating mine operations crews, approximately three hours are lost per day to standby time, inclusive of two hours for breaks, 20 minutes for fuelling 20 minutes for shift change, and 20 minutes for blast delay (Table 13-3).
Over a year, approximately 13 days are lost to poor weather conditions, predominantly in the wintertime. It is assumed that the equipment is manned but delayed during these weather events.
| Table 13-3: | Gross Operating Hours per Year |
| Time Definition | | Hydraulic Shovel | | | Front End
Loaders | | | Trucks | | | Drills | |
| Calendar Time | | | | | | | | | | | | | | | | |
| Calendar Days | | | 365 | | | | 365 | | | | 365 | | | | 365 | |
| Shifts per day | | | 2 | | | | 2 | | | | 2 | | | | 2 | |
| Shift length (h) | | | 12 | | | | 12 | | | | 12 | | | | 12 | |
| Calendar Time (h/a) | | | 8,760 | | | | 8,760 | | | | 8,760 | | | | 8,760 | |
| Available Time | | | | | | | | | | | | | | | | |
| Availability | | | 85 | % | | | 85 | % | | | 85 | % | | | 85 | % |
| Down time (h/a) | | | 1,314 | | | | 1,314 | | | | 1,314 | | | | 1,314 | |
| Available Time (h/a) | | | 7,446 | | | | 7,446 | | | | 7,446 | | | | 7,446 | |
| Gross Operating Time | | | | | | | | | | | | | | | | |
| Operating Standby | | | - | | | | - | | | | - | | | | - | |
| Lunch & breaks (min/day) | | | 120 | | | | 120 | | | | 120 | | | | 120 | |
| Fueling (min/day) | | | 20 | | | | 20 | | | | 20 | | | | 30 | |
| Shift change (min/day) | | | 20 | | | | 20 | | | | 20 | | | | 20 | |
| Meetings (min/day) | | | 20 | | | | 20 | | | | 20 | | | | 20 | |
| Blasting (min/day) | | | - | | | | - | | | | - | | | | 20 | |
| Weather (d/a) | | | 13 | | | | 13 | | | | 13 | | | | 13 | |
| Operating Standby (h/a) | | | 1,196 | | | | 1,196 | | | | 1,196 | | | | 1,351 | |
| Gross Operating Hours (h/a) | | | 6,250 | | | | 6,250 | | | | 6,250 | | | | 6,095 | |
Accounting for standby time and weather delays, equipment accumulates on average 6,250 gross operating hours (GOH) per year in the example above. For productivity calculations, it is assumed that following preproduction, the trucks and shovels are in a productive cycle of approximately 50 minutes each hour, or 83% of the time. For drills, the productive utilization is lower and in the range of 65% based on benchmarking with similar mines.
| | |
| Arctic Project | Page 233 |
| S-K 1300 Technical Report Summary | November 30, 2022 |
| | |
As with mine operations, mine maintenance is scheduled to work a 24/7 schedule to allow for continuous maintenance coverage. However, the majority of planned maintenance work is done during the day shift with a skeleton crew scheduled for the night shift.
Blasting is only scheduled during the day shift. Two blasting crews rotate on a 12-hour day shift, for seven day-a-week coverage.
A conventional owner-operated truck fleet utilizing a combination of hydraulic shovels and front-end loaders (FELs) is planned. The truck fleet consists of large trucks for waste stripping and for mining the ore zones. The trucks are diesel powered with a combined capacity to mine a maximum of 40 Mt/a operating on a combination of 5 m and 10 m benches. The loading fleet is also diesel powered. Blasting is contract performed with explosives manufactured off-site and delivery to site by trucks.
Equipment requirements are estimated annually over the life of the mine. Equipment sizing and numbers are based on the mine plan, the operational factors shown in Table 13-4, and a twenty-four hour per day, seven day a week work schedule.
| Table 13-4: | Equipment Utilization and Efficiency |
| Description | | Average Mechanical Availability (%) | | | Efficiency
(%) | |
| 171 mm Production Drill | | | 83 | % | | | 65 | % |
| 265 t/15 m3 Hydraulic Face Shovel | | | 85 | % | | | 83 | % |
| 124 t/12 m3 Front End Loader | | | 85 | % | | | 83 | % |
| 144 t Haul Truck | | | 85 | % | | | 83 | % |
| 41t Articulated Truck | | | 86 | % | | | 83 | % |
| 26 t/5 m3 Front End Loader | | | 86 | % | | | 83 | % |
| 68 t/4 m3 Hydraulic Excavator | | | 86 | % | | | 83 | % |
| 35 t/1.4 m3 Hydraulic Excavator | | | 85 | % | | | 83 | % |
| 74 t/455 kW Track Dozer | | | 85 | % | | | 83 | % |
| 50 t/419 kW Rubber Tired Dozer | | | 85 | % | | | 83 | % |
| 40 t Articulated Sand Truck | | | 85 | % | | | 83 | % |
| 33 t/217 kW Motor Grader | | | 85 | % | | | 83 | % |
| 35,000-litre water truck | | | 85 | % | | | 83 | % |
| 41t Articulated Fuel/Lube Truck | | | 85 | % | | | 83 | % |
Blasting operations are contracted to a blasting explosives provider who is responsible for the blast design, loading, stemming, and initiation. Bulk emulsion is manufactured off-site. The explosive provider transports explosive material from Fairbanks, Alaska. The explosive is stored in four explosive silos with 80-ton capacity each: two silos for storing Ammonium Nitrate and the other two for storing emulsion produced on site.
| | |
| Arctic Project | Page 234 |
| S-K 1300 Technical Report Summary | November 30, 2022 |
| | |
In performing the explosive services, the blasting contractor is proposing to provide:
| • | Two five person blasting crews providing seven day a week coverage |
| • | Transportation of the explosive from Fairbanks to site |
Additionally, two (2) Mobile Manufacturing Unit (MMU) trucks and one stemming truck are provided by the mine. The MMU explosive trucks delivers a bulk emulsion product when required.
Two types of Heavy ANFO blend (HA) are used: 70% emulsion/30% Ammonium Nitrate Fuel Oil (ANFO) for wet material, and 30% emulsion/70% ANFO for dry material, with specific gravity of 1.25 g/cm3 and 1.23 g/cm3, respectively.
The wall control design patters are based on the 2022 Arctic Drill and Blast Study recommendations There are three main types of geotechnical zones within the pit: one group in the North and East walls, where the slope design is governed by the shallower foliation, with IRA lower than 38° and with geotechnical berms every 60 m, other group with IRA of between 38° and 47°, and other group with IRA greater than 47°. Pre-split blasting only used for the third group with IRA greater than 47°. For other zones, multiple stab trim holes are used for face outlining.
Table 13-5 shows the design parameters for production and wall control blasting.
| Table 13-5: | Blasting Design Input |
| Description | | Units | | Waste | | Ore Dry | | Waste
Wet | | Ore Wet | | Trim 1
(1) | | Trim 2
(2) | | Trim 3
(3) | | Pre-split
(3) | |
| Rock Density | | t/m3 | | 2.76 | | 3.22 | | 2.76 | | 3.22 | | 2.76 | | 2.76 | | 2.76 | | 2.76 | |
| Explosive | | | | HA37 | | HA37 | | HA73 | | HA73 | | HA37 | | HA37 | | HA37 | | HA37 | |
| Explosive Density | | kg/m3 | | 1,230 | | 1,230 | | 1,250 | | 1,250 | | 1,230 | | 1,230 | | 1,230 | | 1,230 | |
| Bench Height | | m | | 10 | | 10 | | 10 | | 10 | | 8.3 | | 10 | | 10 | | 10 | |
| Hole Diameter | | m | | 0.171 | | 0.171 | | 0.171 | | 0.171 | | 0.171 | | 0.171 | | 0.171 | | 0.171 | |
| Burden | | m | | 5.1 | | 4.2 | | 5.1 | | 4.2 | | 6.0 | | 5.3 | | 3.7 | | 1.5 | |
| Spacing | | m | | 5.9 | | 4.8 | | 5.9 | | 4.8 | | 5.5 | | 4.8 | | 3.9 | | 2.5 | |
| Sub drill | | m | | 1.0 | | 1.0 | | 1.0 | | 1.0 | | 0.0 | | 0.1 | | 0.0 | | 0.0 | |
| Stemming | | m | | 3.5 | | 4.0 | | 3.5 | | 4.0 | | 3.8 | | 5.4 | | 5.9 | | 9.6 | |
| Drill length per hole | | m | | 11 | | 11 | | 11 | | 11 | | 8.3 | | 10 | | 10 | | 10 | |
| Rock Volume per hole | | m3 | | 301 | | 202 | | 301 | | 202 | | 273 | | 258 | | 143 | | 38 | |
| Rock Tonnage per hole | | t | | 830 | | 649 | | 830 | | 649 | | 755 | | 712 | | 394 | | 104 | |
| Rock Tonnage | | t/m | | 75 | | 59 | | 75 | | 59 | | 91 | | 70 | | 39 | | 10 | |
| Explosive Column | | m | | 7.5 | | 7.0 | | 7.5 | | 7.0 | | 4.5 | | 4.7 | | 4.1 | | 0.4 | |
| Weight of explosive | | kg | | 212 | | 198 | | 215 | | 201 | | 128 | | 133 | | 116 | | 13 | |
| Powder Factor (by rock volume) | | kg/m3 | | 0.70 | | 0.98 | | 0.72 | | 1.00 | | 0.47 | | 0.52 | | 0.81 | | 0.33 | |
| Powder Factor | | kg/t | | 0.26 | | 0.30 | | 0.26 | | 0.31 | | 0.17 | | 0.19 | | 0.29 | | 0.12 | |
| | |
| Arctic Project | Page 235 |
| S-K 1300 Technical Report Summary | November 30, 2022 |
| | |
| 1. | Geotechnical zones with IRA below 38 degrees and 60 m bench height. Domains 2L-E, 2L-W and 4L. |
| 2. | Geotechnical zones with IRA between 38 and 40 degrees and bench height shorter than 20 m. Domain 3 and 4L. |
| 3. | Geotechnical zones with IRA greater than 47 degrees and bench height shorter than 20 m. Domain 2U and 4U. |
Although material is mined on a combination of 5 and 10 m benches, all material is drilled and blasted on 10 m benches.
The powder factor for ore is 0.3 kg/t and 0.26 kg/t for waste. For trim, variable powder factors were used depending on the characteristics of the geotechnical zone. Table 13-6 provides a summary of the material blasted on an annual basis.
| Table 13-6: | Material Blasted Quantities |
| Period | | Powder Factor (kg/t) | | Waste Blasted (kt) | | Ore Blasted (kt) | | Trim Blasted(1) (kt) | | Total Blasted (kt) | |
| Year -2 | | 0.26 | | 26,157 | | 493 | | 750 | | 27,400 | |
| Year -1 | | 0.25 | | 30,262 | | 283 | | 4,499 | | 35,044 | |
| Year 1 | | 0.25 | | 29,404 | | 2,235 | | 2,438 | | 34,077 | |
| Year 2 | | 0.25 | | 25,754 | | 3,650 | | 4,786 | | 34,190 | |
| Year 3 | | 0.25 | | 21,939 | | 3,650 | | 5,426 | | 31,015 | |
| Year 4 | | 0.25 | | 22,156 | | 3,650 | | 4,194 | | 30,000 | |
| Year 5 | | 0.25 | | 21,181 | | 3,650 | | 4,669 | | 29,500 | |
| Year 6 | | 0.25 | | 19,687 | | 3,650 | | 5,226 | | 28,563 | |
| Year 7 | | 0.25 | | 20,176 | | 3,650 | | 4,237 | | 28,063 | |
| Year 8 | | 0.25 | | 15,976 | | 3,651 | | 3,873 | | 23,500 | |
| Year 9 | | 0.26 | | 16,856 | | 3,650 | | 3,494 | | 24,000 | |
| Year 10 | | 0.26 | | 15,809 | | 3,650 | | 2,113 | | 21,572 | |
| Year 11 | | 0.26 | | 12,217 | | 3,650 | | 3,133 | | 19,000 | |
| Year 12 | | 0.25 | | 7,949 | | 3,650 | | 3,680 | | 15,280 | |
| Year 13 | | 0.27 | | - | | 3,529 | | 2,126 | | 5,655 | |
| Total | | 0.25 | | 285,524 | | 46,691 | | 54,643 | | 386,859 | |
Blasting products consumed on an annual basis are shown in Table 13-7.
| Table 13-7: | Explosives Quantities |
| Period | | ANFO (t) | | Emulsion Bulk (t) | | Detonators Pyrotechnic
(Units) | | Boosters 0.45kg (Units) | |
| Year -2 | | 3,147 | | 3,669 | | 33,301 | | 33,301 | |
| Year -1 | | 3,980 | | 4,416 | | 42,917 | | 42,917 | |
| Year 1 | | 3,932 | | 4,491 | | 42,135 | | 42,135 | |
| Year 2 | | 3,958 | | 4,369 | | 43,090 | | 43,090 | |
| Year 3 | | 3,596 | | 3,895 | | 39,403 | | 39,403 | |
| Year 4 | | 3,493 | | 3,851 | | 38,027 | | 38,027 | |
| | |
| Arctic Project | Page 236 |
| S-K 1300 Technical Report Summary | November 30, 2022 |
| | |
| Period | | ANFO (t) | | Emulsion Bulk (t) | | Detonators Pyrotechnic
(Units) | | Boosters 0.45kg (Units) | |
| Year 5 | | 3,438 | | 3,752 | | 37,537 | | 37,537 | |
| Year 6 | | 3,331 | | 3,587 | | 36,557 | | 36,557 | |
| Year 7 | | 3,285 | | 3,594 | | 35,920 | | 35,920 | |
| Year 8 | | 2,767 | | 3,004 | | 30,543 | | 30,543 | |
| Year 9 | | 2,836 | | 3,105 | | 31,369 | | 31,369 | |
| Year 10 | | 2,568 | | 2,878 | | 28,298 | | 28,298 | |
| Year 11 | | 2,269 | | 2,457 | | 25,538 | | 25,538 | |
| Year 12 | | 1,847 | | 1,917 | | 21,310 | | 21,310 | |
| Year 13 | | 746 | | 722 | | 9,206 | | 9,206 | |
| Total | | 45,193 | | 49,708 | | 495,151 | | 495,161 | |
Throughout the project life, drilling is required for both ore control and production blasting. Rock fragmentation achieved through blasting is the overriding design criteria for the drill hole pattern design. The blast hole drilling design from Section 13.8.1 with the drill penetration rates described below are used to estimate drilling requirements.
Drill penetration is a function of bit size, bit load, drilling method, and rock strength properties. Wood relied on SRK’s 2022 Pre-Feasibility Study Geotechnical and Hydrogeological Assessment report. SRK completed unconfined compressive testing (UCS) and point load testing on Arctic’s primary rock types. The results of the uniaxial compressive tests for the primary ore hosting rocks (lithological units) are shown in Table 13-8. The weighted average UCS value for the ore hosting rocks is 83 MPa and 59 MPa for the waste areas.
| | |
| Arctic Project | Page 237 |
| S-K 1300 Technical Report Summary | November 30, 2022 |
| | |
| Table 13-8: | Rock Type Weight and UCS |
| Lithology | | UCS (MPa) | | Samples (Units) | |
| Ore Hosting | | | | | |
| Black to Grey Schist (GS) | | 97 | | 14 | |
| Massive Sulphide (MS) | | 56 | | 6 | |
| Semi-massive Sulphide (SMS) | | 68 | | 3 | |
| Average Ore | | 83 | | 23 | |
| Waste | | | | | |
| Aphanitic Metarhyolite (AMR) | | 88 | | 5 | |
| Chlorite Schist (CHS) | | 20 | | 2 | |
| DIKE | | 62 | | 2 | |
| Debris Flow (DM) | | 71 | | 3 | |
| Button Schist (MRP) | | 73 | | 9 | |
| Quartz-Felspar-Mica Schist (QFMS) | | 64 | | 5 | |
| Quartz- Mica Schist QMS | | 50 | | 5 | |
| QMSP | | 62 | | 2 | |
| Talc Schist (TS) | | 1 | | 2 | |
| CHTS | | 3 | | 2 | |
| Average Waste | | 59 | | 37 | |
Instantaneous penetration rates (IPR) were calculated based on UCS data, rock factor and the Workman Szumanski (1996, 1997) formula. Using the Workman Szumanski (1996, 1997) formula Penetration Rate shown in Equation 13-1, and the inputs in Table 13-9, the instantaneous penetration rate (P) for waste and ore were estimated at 67 m/h and 45 m/h, respectively.
| Equation 13-1: | Workman, Szumanski (1996,1997) Formula |
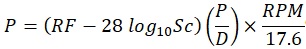
| Table 13-9: | Workman, Szumanski (1996,1997) Inputs |
| Item | | Waste | | Ore | |
| RF - Rock factor | | 148 | | 120 | |
| Sc – UCS (MPa) | | 59 | | 83 | |
| P – pulldown (lb) | | 50,000 | | 50,000 | |
| D - Bit Size (mm) | | 171 | | 171 | |
| P/D - Pulldown (kg/m) | | 133,000 | | 133,000 | |
| RPM – Revolutions per minute | | 90 | | 90 | |
| P - Instantaneous Pen Rate (m/h) | | 67 | | 45 | |
| | |
| Arctic Project | Page 238 |
| S-K 1300 Technical Report Summary | November 30, 2022 |
| | |
The total drilling cycle time accounts for drilling time, tramming time between holes, setup time, and bit change time. Because the CAT MD6250main drill equipment can drill to a 13.6 m depth, no time is required for drill steel addition. The average penetration rate shown in Table 13-10 also assumes 65% productive utilization, or 39 minutes out of 60 minutes that the drill is in the drilling cycle.
| Table 13-10: | Drill Penetration Rates |
| Material | | IPR | | Drill Hole
Length | | Tram
Time | | Setup
Time | | Bit
Change | | Total
Cycle | | NOH Pen
Rate | | GOH Pen
Rate1 | |
| Type | | (m/h) | | (m) | | (min) | | (min) | | (min) | | (min) | | (m/h) | | (m/h) | |
| Waste | | 67 | | 11 | | 0.55 | | 3.00 | | 0.38 | | 13.81 | | 47.79 | | 31.1 | |
| Ore | | 45 | | 11 | | 0.55 | | 3.00 | | 0.38 | | 18.61 | | 35.47 | | 23.1 | |
1Assumes 65% efficiency.
Table 13-11 shows the drill requirements, the meters drilled, the hours operated, and the average penetration rate by period. During Year -2, two production drills are required. From Year -1 to Year 7, mining requires three production drills. Following Year 7, drill requirements drop to two and after Year 12, drill requirements drop to one along with a drop in of total tonnes mined. Penetration rates average 29.8 m/h over the LOM.
| Table 13-11: | Drill Requirements and Performance |
| Period | | Drills Required (Units | | Meters Drilled (m) | | Gross Operating Hours
(GOH) | | Average Penetration Rate
(m/h) | |
| Year -2 | | 2 | | 375,812 | | 12,795 | | 29.4 | |
| Year -1 | | 3 | | 470,586 | | 15,783 | | 29.8 | |
| Year 1 | | 3 | | 469,235 | | 15,811 | | 29.7 | |
| Year 2 | | 3 | | 472,384 | | 16,299 | | 29.0 | |
| Year 3 | | 3 | | 429,789 | | 14,661 | | 29.3 | |
| Year 4 | | 3 | | 418,968 | | 14,089 | | 29.7 | |
| Year 5 | | 3 | | 413,125 | | 13,742 | | 30.1 | |
| Year 6 | | 3 | | 400,873 | | 13,206 | | 30.4 | |
| Year 7 | | 3 | | 396,514 | | 13,008 | | 30.5 | |
| Year 8 | | 2 | | 335,237 | | 11,659 | | 28.8 | |
| Year 9 | | 2 | | 344,926 | | 11,616 | | 29.7 | |
| Year 10 | | 2 | | 313,880 | | 11,616 | | 27.0 | |
| Year 11 | | 2 | | 278,087 | | 9,218 | | 30.2 | |
| Year 12 | | 2 | | 228,627 | | 7,708 | | 29.7 | |
| Year 13 | | 1 | | 97,266 | | 3,007 | | 32.3 | |
| Total | | | | 5,445,309 | | 184,219 | | 29.6 | |
| | |
| Arctic Project | Page 239 |
| S-K 1300 Technical Report Summary | November 30, 2022 |
| | |
The 2022 Arctic Drill and Blast study (Floyd, 2022) recommends 90° presplit for zones with inter-ramp angle greater than 47°, with the same drill hole diameter than the production drill holes. Therefore, only rotary drills are considered at this point. The study also suggests that in case the 90° presplit is not suitable according to field testing, smaller diameters, inclined holes, and a top head hammer (THH) drill with a 121 mm bit will be needed.
Wood completed an equipment trade-off study based in quantitative and qualitative characteristic of the equipment and vendor’s quotations received. From the trade-off study, the primary loading units selected are two 15 m3 hydraulic shovels. After Year 11 only one hydraulic shovel is required. To assist the hydraulic shovels, two 12 m3 front end loaders (FEL) are scheduled until Year 7 of production, dropping to one until the end of the LOM. The FEL is also used for stockpile rehandling, all of which is scheduled in Year 1. Loading requirements are shown in Table 13-12.
| Table 13-12: | Loading Requirements and Performance |
| | | 15 m3 shovel | | 12 m3 FEL | |
| | | | | Productivity | | | | Productivity | |
| | | Number | | (t/GOH) | | Number | | (t/GOH) | |
| Year -2 | | 2 | | 1,241 | | 2 | | 829 | |
| Year -1 | | 2 | | 1,698 | | 2 | | 995 | |
| Year 1 | | 2 | | 1,718 | | 2 | | 1,006 | |
| Year 2 | | 2 | | 1,673 | | 2 | | 1,003 | |
| Year 3 | | 2 | | 1,690 | | 2 | | 750 | |
| Year 4 | | 2 | | 1,643 | | 2 | | 738 | |
| Year 5 | | 2 | | 1,630 | | 2 | | 729 | |
| Year 6 | | 2 | | 1,606 | | 2 | | 714 | |
| Year 7 | | 2 | | 1,576 | | 2 | | 698 | |
| Year 8 | | 2 | | 1,501 | | 1 | | 813 | |
| Year 9 | | 2 | | 1,531 | | 1 | | 834 | |
| Year 10 | | 2 | | 1,384 | | 1 | | 734 | |
| Year 11 | | 2 | | 1,224 | | 1 | | 615 | |
| Year 12 | | 1 | | 1,532 | | 1 | | 311 | |
| Year 13 | | 1 | | 675 | | 1 | | 233 | |
| Average | | | | 1,488 | | | | 733 | |
The 15 m3 shovel five-pass loads the 144 t truck in approximately three minutes. The LOM production rate averages 1,488 dry t/GOH, compared to the maximum productivity of 1,923 dry t/GOH shown in Table 13-13. The peak productivity scheduled for the shovel occurs in Years 1, when it is scheduled at 1,718 dry t/GOH.
| | |
| Arctic Project | Page 240 |
| S-K 1300 Technical Report Summary | November 30, 2022 |
| | |
| Table 13-13: | Hydraulic Shovel Productivity |
| Loader | | | | 15 m3 Shovel | |
| Truck | | Unit | | 144 t Truck | |
| Bucket Capacity | | m3 | | 15 | |
| Bucket Capacity | | t | | 30 | |
| Truck Capacity | | m3 | | 94 | |
| Truck Capacity | | t | | 144 | |
| Insitu Bulk Density | | t/m3 | | 2.8 | |
| Bulk Factor | | | | 1.3 | |
| Loose Density | | t/m3 | | 2.15 | |
| Moisture | | % | | 3 | % |
| Fill Factor | | | | 0.86 | |
| Effective Bucket Capacity | | m3 | | 12.97 | |
| Wet/Loose Density | | t/m3 | | 2.22 | |
| Tonnes/Pass | | t | | 28.80 | |
| Theoretical Passes (Volume) | | | | 7.25 | |
| Theoretical Passes (Weight) | | | | 5.00 | |
| Actual Passes | | | | 5 | |
| Truck Load | | m3 | | 64.85 | |
| Truck Load | | t | | 144.0 | |
| Truck Fill % (Volume) | | | | 69 | % |
| Truck Fill % (Weight) | | | | 100 | % |
| Loader Cycle Time | | seconds | | 35 | |
| Loader Spot Time | | seconds | | 30 | |
| Load Time per Truck | | seconds | | 170 | |
| Maximum Truck Loads per hour | | | | 21.18 | |
| Maximum Productivity | | (wet t/adj. NOH) | | 3,049 | |
| Maximum Productivity | | (wet t/NOH) | | 2,379 | |
| Maximum Productivity | | (wet t/GOH) | | 1,982 | |
| Maximum Productivity | | (dry t/GOH) | | 1,923Sh | |
| Maximum Productivity | | (wet t/d) | | 34,460 | |
| Maximum Productivity | | (dry t/a) | | 12,200,469 | |
| Maximum Productivity | | (dry t/d) | | 33,426 | |
The FEL seven-pass loads the 144 t truck in approximately three and a half minutes. The LOM production rate averages 797 dry t/GOH, compared to the maximum productivity of 1,139 dry t/GOH shown in Table 13-14. The peak productivity scheduled for the FELs occurs in Year 1, when the FEL is scheduled at 1,008 dry t/GOH.
| | |
| Arctic Project | Page 241 |
| S-K 1300 Technical Report Summary | November 30, 2022 |
| | |
| Table 13-14: | Front End Loader Productivity |
| Loader | | | | 12 m3 FEL | |
| Truck | | Unit | | 144 t Truck | |
| Bucket Capacity | | m3 | | 11.7 | |
| Bucket Capacity | | t | | 21.0 | |
| Truck Capacity | | m3 | | 94.0 | |
| Truck Capacity | | t | | 144.0 | |
| Insitu Bulk Density | | t/m3 | | 2.8 | |
| Bulk Factor | | | | 1.3 | |
| Loose Density | | t/m3 | | 2.15 | |
| Moisture | | % | | 3.0 | % |
| Fill Factor | | | | 0.79 | |
| Effective Bucket Capacity | | m3 | | 9.26 | |
| Wet/Loose Density | | t/m3 | | 2.22 | |
| Tonnes/Pass | | t | | 20.57 | |
| Theoretical Passes (Volume) | | | | 10.15 | |
| Theoretical Passes (Weight) | | | | 7.00 | |
| Actual Passes | | | | 7.00 | |
| Truck Load | | m3 | | 64.85 | |
| Truck Load | | t | | 144.0 | |
| Truck Fill % (Volume) | | | | 69 | % |
| Truck Fill % (Weight) | | | | 100 | % |
| Loader Cycle Time | | seconds | | 42 | |
| Loader Spot Time | | seconds | | 35 | |
| Load Time per Truck | | seconds | | 287 | |
| Maximum Truck Loads per hour | | | | 12.54 | |
| Maximum Productivity | | (wet t/adj. NOH) | | 1,806 | |
| Maximum Productivity | | (wet t/NOH) | | 1,409 | |
| Maximum Productivity | | (wet t/GOH) | | 1,174 | |
| Maximum Productivity | | (dry t/GOH) | | 1,139 | |
| Maximum Productivity | | (wet t/d) | | 20,246 | |
| Maximum Productivity | | (dry t/a) | | 7,168,141 | |
| Maximum Productivity | | (dry t/d) | | 19,639 | |
In addition to the primary loading units, a 5 m3 FEL is paired with two 41 t articulated trucks throughout the mine life for bench development/pioneering work and winter snow removal. A 3.8 m3 excavator is also used to maintain haul roads and scale the pit walls as needed.
| | |
| Arctic Project | Page 242 |
| S-K 1300 Technical Report Summary | November 30, 2022 |
| | |
From the TCO analysis, the primary hauling unit selected for ore and waste mining is a mechanical drive truck with a payload capacity of 144 t wet, assuming a standard body with a full set of liners. The dry capacity is estimated at 140 t, assuming 3% moisture and carry back.
Wood estimated truck requirements on a period-by-period basis using travel distances from a road network developed within Minesight®. Haul segment distances were reported for each material type from their location on a mining bench to their final destination. Assuming 2% rolling resistance for haul roads, travel speeds were estimated from the manufacture’s performance curves, and applied to each haul segment to estimate travel time. To better reflect actual speeds in an operating environment, the truck speeds were speed-limited according to Table 13-15.
| Table 13-15: | Truck Speed Limits |
| Segment | | Loaded
(kph) | | Empty
(kph) | |
| Maximum Overall Speed | | 45 | | 45 | |
| Maximum Speed within 100 m of dump face and shovel | | 25 | | 25 | |
| Maximum Speed on a 10% downhill grade | | 30 | | 30 | |
Table 13-16 provides the adjusted speeds and fuel burns by haul grade used to estimate truck requirements and diesel fuel usage for the 144 t trucks.
| Table 13-16: | Truck Speed Limits |
Actual
Grade
(%) | | Haul
Loaded
(kph) | | Return
Empty
(kph) | | Fuel
Loaded
(l/h) | | Return
Empty
(l/h) | |
| -10% | | 30 | | 30.0 | | 19.1 | | 19.1 | |
| 10% | | 11.5 | | 27 | | 190.8 | | 190.8 | |
| Flat Ex-pit | | 45 | | 45 | | 124.9 | | 72.8 | |
| Flat In-pit | | 25 | | 25 | | 162.0 | | 72.7 | |
| Idle | | - | | - | | 19.1 | |
Truck requirements by period are shown in Table 13-17 for 144 t trucks, together with the average one-way haul distance, average fuel consumption, and average truck productivity. Fourteen trucks are commissioned during pre-production. During Year 1 the fleet is ramped up to 15, reaching its peak. After Year 9, truck requirements drop to 14. Following Year 10, the 144 t truck requirements decline with declining mining rates.
| | |
| Arctic Project | Page 243 |
| S-K 1300 Technical Report Summary | November 30, 2022 |
| | |
| Table 13-17: | Truck Requirements and Performance |
| | | Trucks Required | | Average one-way Haul
Distance | | Average Fuel Burn | | Average Truck
Production | |
| | | # | | (m) | | l/GOH | | t/GOH | |
| Year -2 | | 11 | | 2,693 | | 62 | | 384 | |
| Year -1 | | 14 | | 2,558 | | 63 | | 387 | |
| Year 1 | | 15 | | 3,127 | | 64 | | 362 | |
| Year 2 | | 15 | | 2,953 | | 68 | | 356 | |
| Year 3 | | 15 | | 2,874 | | 69 | | 346 | |
| Year 4 | | 15 | | 3,034 | | 73 | | 318 | |
| Year 5 | | 15 | | 3,117 | | 76 | | 316 | |
| Year 6 | | 15 | | 2,962 | | 77 | | 310 | |
| Year 7 | | 15 | | 3,131 | | 80 | | 305 | |
| Year 8 | | 15 | | 3,353 | | 82 | | 275 | |
| Year 9 | | 15 | | 3,734 | | 85 | | 262 | |
| Year 10 | | 14 | | 3,847 | | 88 | | 252 | |
| Year 11 | | 14 | | 4,039 | | 91 | | 222 | |
| Year 12 | | 12 | | 4,206 | | 92 | | 209 | |
| Year 13 | | 4 | | 3,449 | | 87 | | 232 | |
| Average | | - | | 3,173 | | 75 | | 317 | |
Support equipment includes excavators, track dozers, rubber-tired dozers (RTDs), sand trucks, graders, water trucks, fuel/lube trucks, and water trucks. The major tasks for the support equipment include:
| • | Bench and road maintenance |
| • | Blasting support/clean-up |
| • | Stockpile construction/maintenance |
| • | Road building/maintenance |
| • | Pioneering and clearing work |
| • | Field equipment servicing |
A description of each support equipment fleet follows:
| • | 35 t Excavator – One excavator scheduled throughout the mine life. Its primary functions are to support dewatering, maintain pit drainage, break rocks utilizing the rock breaker attachment, and backup the 5 m3 FEL. |
| | |
| Arctic Project | Page 244 |
| S-K 1300 Technical Report Summary | November 30, 2022 |
| | |
| • | 72t/455 kW track dozers are estimated at 0.5 dozers per production blast hole drill and production loading unit. The dozer fleet peaks at 4 machines in pre-production. Their primary functions are to maintain pit floors, maintain dumps and stockpiles, build pit roads, and clean final pit walls. Due to limited mobility, the 72 t dozers are transported between working areas using a 90 t capacity transport trailer. The transport is also used to transport the 65 t drills and the 35 t excavator. |
| • | 47t/419 kW rubber-tired dozer requirements are estimated at approximately one RTD per hydraulic shovel. Their primary function is to maintain shovel floors, provide drill pattern clean-up, clear rock spillage, and provide backup dump and stockpile maintenance. At peak, two-wheel dozers support two 15 m3 shovels and associated mining areas. |
| • | 41t Articulated Sand Truck – One articulated truck is fitted with a sander and used to support winter operations throughout the LOM. |
| • | 227 kW motor graders are estimated at approximately one grader per 8 trucks. Their primary function is to maintain roads, dump areas, and pit areas. Two graders are scheduled along the life of the mine, dropping to 1 the last year, Y12. |
| • | Two 35,000 litre water trucks are estimated to support the mine operation. During the winter season, from October to April, water trucks are lightly scheduled. They are primarily used for watering the drills and for fire patrol; nonetheless, even during the winter season roads become dusty. During May to September, when dust suppression requirements are at their highest, the water trucks are fully scheduled. |
| • | Fuel/lube truck requirements are estimated at a ratio of one lube truck per 10 pieces of tracked field equipment. They are used to fuel and service shovels and other tracked field equipment. At peak, the mine operates one fuel/lube truck. |
| • | One 1.4 m3 backhoe is scheduled throughout the mine life. Its primary functions are to support dewatering, maintain pit drainage, and break rocks utilizing the rock breaker attachment. |
Support equipment requirements are shown in Table 13-18.
| Table 13-18: | Support Equipment |
| Period | | 35 t
Excavator | | Bulldozer -
455 kW | | Wheel dozer -
419 kW | | Motor grader –
217 kW | | Sand Truck -
41 t | | Water Truck -
35000 l | | Fuel / Lube
Truck | | Backhoe -
1.4 m3 | |
| Year -2 | | 1 | | 4 | | 2 | | 2 | | 1 | | 2 | | 1 | | 1 | |
| Year -1 | | 1 | | 4 | | 2 | | 2 | | 1 | | 2 | | 1 | | 1 | |
| Year 1 | | 1 | | 4 | | 2 | | 2 | | 1 | | 2 | | 1 | | 1 | |
| Year 2 | | 1 | | 4 | | 2 | | 2 | | 1 | | 2 | | 1 | | 1 | |
| Year 3 | | 1 | | 4 | | 2 | | 2 | | 1 | | 2 | | 1 | | 1 | |
| Year 4 | | 1 | | 4 | | 2 | | 2 | | 1 | | 2 | | 1 | | 1 | |
| Year 5 | | 1 | | 4 | | 2 | | 2 | | 1 | | 2 | | 1 | | 1 | |
| Year 6 | | 1 | | 4 | | 2 | | 2 | | 1 | | 2 | | 1 | | 1 | |
| Year 7 | | 1 | | 3 | | 2 | | 2 | | 1 | | 2 | | 1 | | 1 | |
| Year 8 | | 1 | | 3 | | 2 | | 2 | | 1 | | 2 | | 1 | | 1 | |
| Year 9 | | 1 | | 3 | | 2 | | 2 | | 1 | | 2 | | 1 | | 1 | |
| Year 10 | | 1 | | 3 | | 2 | | 2 | | 1 | | 2 | | 1 | | 1 | |
| | |
| Arctic Project | Page 245 |
| S-K 1300 Technical Report Summary | November 30, 2022 |
| | |
| Period | | 35 t
Excavator | | Bulldozer -
455 kW | | Wheel dozer -
419 kW | | Motor grader –
217 kW | | Sand Truck -
41 t | | Water Truck -
35000 l | | Fuel / Lube
Truck | | Backhoe -
1.4 m3 | |
| Year 11 | | 1 | | 2 | | 1 | | 2 | | 1 | | 2 | | 1 | | 1 | |
| Year 12 | | 1 | | 2 | | 1 | | 2 | | 1 | | 2 | | 1 | | 1 | |
| Year 13 | | 1 | | 2 | | 1 | | 2 | | 1 | | 2 | | 1 | | 1 | |
To support mine maintenance and mine operation activities, a fleet of auxiliary equipment is required. The types and numbers of auxiliary equipment are listed in Table 13-19in five-year increments.
| Table 13-19: | Auxiliary Equipment |
| Equipment | | Year 1 | | Year 5 | | Year 13 | |
| Mine Maintenance | | | | | | | |
| Truck Mounted 40 t Crane | | 1 | | 1 | | 1 | |
| 100 t Rough Terrain | | 1 | | 1 | | 1 | |
| 5t Rough Terrain Forklift | | 2 | | 2 | | 2 | |
| 10t Forklift | | 2 | | 2 | | 2 | |
| Mechanic Service Truck | | 3 | | 3 | | 3 | |
| Small Fuel/Lube truck | | 1 | | 1 | | 1 | |
| 55 kW Skid Steer | | 1 | | 1 | | 1 | |
| Flatbed Truck | | 2 | | 2 | | 2 | |
| 45t Telehandler | | 1 | | 1 | | 1 | |
| Mine Operations | | | | | | | |
| Small backhoe/loader | | 1 | | 1 | | 1 | |
| Hydraulic hammer/impactor | | 1 | | 1 | | 1 | |
| 90 t Lowboy | | 1 | | 1 | | 1 | |
| Compactor | | 1 | | 1 | | 1 | |
| Light Plant | | 11 | | 8 | | 5 | |
| Transport Tractor | | 1 | | 1 | | 1 | |
| Tire Handler Truck | | 1 | | 1 | | 1 | |
| 3/4 ton Pickup | | 4 | | 4 | | 4 | |
| 1 ton Pickup | | 5 | | 4 | | 2 | |
| Crew Bus | | 5 | | 4 | | 2 | |
| Fleet Management System | | 1 | | 1 | | 1 | |
| Mine & Geology Software | | 10 | | 10 | | 10 | |
| Heavy ANFO (blend) Truck | | 2 | | 2 | | 2 | |
| Stemming Truck | | 1 | | 1 | | 1 | |
| Laser Scan | | 2 | | 2 | | 2 | |
| Survey Drones | | 2 | | 2 | | 2 | |
| | |
| Arctic Project | Page 246 |
| S-K 1300 Technical Report Summary | November 30, 2022 |
| | |
| Equipment | | Year 1 | | Year 5 | | Year 13 | |
| Total Station System | | 1 | | 1 | | 1 | |
Wood developed the staffing plan based on the primary assumptions that the owner will perform the equipment maintenance and the blasting operations will be subcontracted.
At peak staffing levels in Year 1, the mine department includes 205 employees including 31 salaried and 174 hourly. The blasting contractor estimated that they will have 10 people on site on two crews including one supervisor, two blaster, two MMU operators per crew.
| | |
| Arctic Project | Page 247 |
| S-K 1300 Technical Report Summary | November 30, 2022 |
| | |
The salaried staff is estimated based on level of effort. The hourly staff is estimated on both level of effort and on mobile equipment coverage.
Mine maintenance hourly staffing is estimated by multiplying a ratio of mechanic time required by machine-operated hours. Table 13-20 provides a listing of the ratios by machine. Wood used its historical database to estimate ratios for the mine equipment.
| Table 13-20: | Ratio Maintenance Hours to Equipment Operated Hours |
| Equipment | | Ratio Maintenance Hours to
Equipment Operated Hours | |
| 171 mm Production Drill | | 0.90 | |
| 265 t/15 m3 Hydraulic Face Shovel | | 0.90 | |
| 124 t/12 m3 Front End Loader | | 0.90 | |
| 144 t Haul Truck | | 0.52 | |
| 41t Articulated Truck | | 0.52 | |
| 26 t/5 m3 Front End Loader | | 0.90 | |
| 68 t/4 m3 Hydraulic Excavator | | 0.90 | |
| 35 t/1.4 m3 Hydraulic Excavator | | 0.50 | |
| 74 t/455 kW Track Dozer | | 0.50 | |
| 50 t/419 kW Rubber Tired Dozer | | 0.50 | |
| 40 t Articulated Sand Truck | | 0.50 | |
| 33 t/217 kW Motor Grader | | 0.50 | |
| 13.9 | Geotechnical and Hydrogeological Assessments |
SRK reviewed the previous work and recommendations, identified potential risks and opportunities highlighted in the previous studies and designed the field program and laboratory testing to update the structural, geotechnical and hydrogeological models to support this pre-feasibility study. Detailed slope stability assessments were completed using the previously designed pit shells, dated Nov 2019, and updated slope design recommendations were provided with a focus on the slope stability risk related to potential sliding failure along talc zones in the northeast wall. Wood produced the open pit mine designs that include interim and final phases using these recommendations. SRK completed a geotechnical review of the updated mine designs, which is discussed in Section 13.10. The estimated annual average pit inflow, discussed in Section 13.9.7, has been updated based on the review of the new open pit designs.
| | |
| Arctic Project | Page 248 |
| S-K 1300 Technical Report Summary | November 30, 2022 |
| | |
SRK has conducted geotechnical and hydrogeological drilling programs to collect information to support the Arctic Project. The locations of the drill holes are presented in Section 7.2.4.
| 13.9.2 | Geology and Structure |
The talc alteration occurs as continuous to semi-continuous massive bands that locally host economic mineralization many meters thick to much thinner (2 to 20 cm) bands parallel to the dominant foliation within more competent quartz-mica and quartz-chlorite mica schists. Both occurrences represent potential weak or slip foliation parallel surfaces. Trilogy developed talc wireframes delineating the spatial distribution and extent of the main talc-rich horizons.
These wireframes have been updated by SRK as the talc-rich horizons have been further delineated by additional drilling completed in 2021 (Figure 13-12). The focus of the update was to refine the geometry of talc layers that extend behind the northeast and east walls of the designed open pit. The entire talc model is planned to be updated in next phase of the engineering study with the results of the 2022 drill program. These talc wireframes were used in the geotechnical and hydrogeological assessments.
| Figure 13-12: | Isometric View (looking southeast) of Talc Zone Domain Modelled by SRK (2022) Using Leapfrog on the EoY12 design pit |
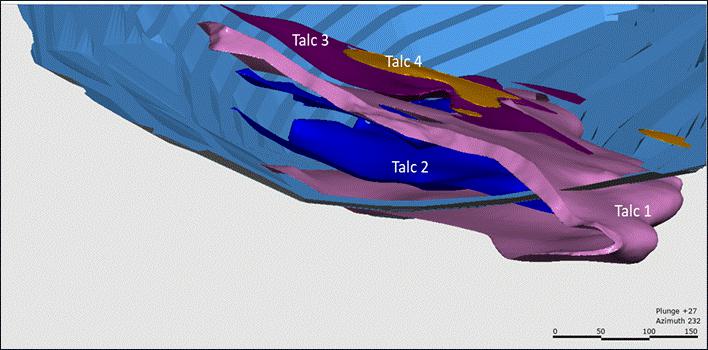
Note: Only talc layers that extend behind the final pit wall are shown. Source: Wood, 2019.
Pervasive weathering is present in the upper levels of the Arctic deposit. SRK has reviewed the geotechnical data and core photographs in order to define a base of weathering isosurface that represented the boundary of the upper, more pervasive weathering.
| | |
| Arctic Project | Page 249 |
| S-K 1300 Technical Report Summary | November 30, 2022 |
| | |
In 2019, SRK updated the 3-D structural model by integrating new structural drill hole data into the model, refining existing structures and modelling additional faults. The “structural matrix”, which provides information on the geometry, physical properties and confidence of major and minor structural features, was also updated. The final structural model is shown in Figure 13-13.
| Figure 13-13: | SRK Structural Model (SRK, 2019) used in the Slope Stability Analysis on the EoY12 Design Pit |

Source: SRK, 2022.
Six structural and geomechanical domains were identified (Figure 13-14). These domains, each containing representative discontinuity sets and major structures, formed the basis of the kinematic assessment.
| | |
| Arctic Project | Page 250 |
| S-K 1300 Technical Report Summary | November 30, 2022 |
| | |
| Figure 13-14: | Location Plan, Structural and Geomechanical Domains |
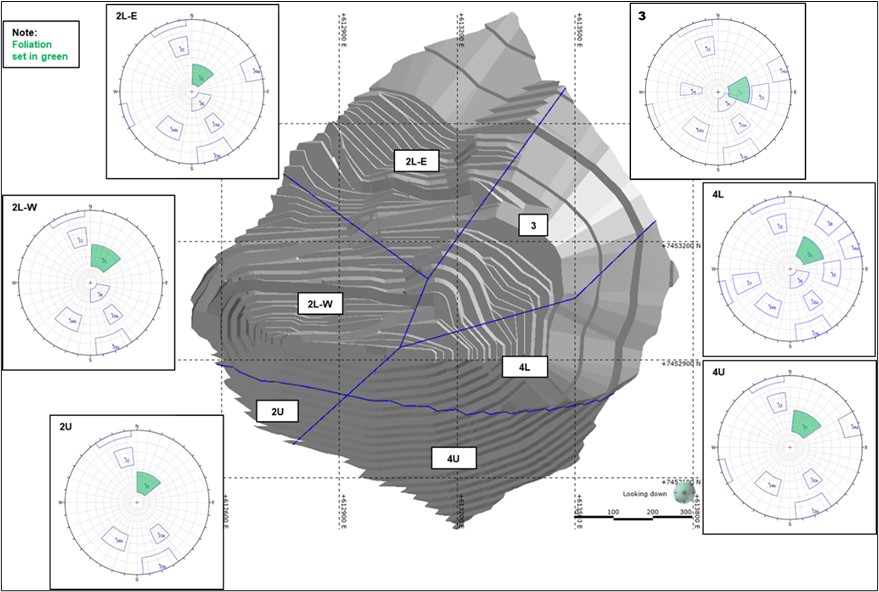
Source: SRK, 2022.
| 13.9.3 | Geotechnical Laboratory Testing |
The historical open pit geotechnical laboratory testing database includes uniaxial compressive strength (UCS) tests, modulus tests for Young’s Modulus and Poisson’s Ratio, triaxial compressive strength (TCS) tests, direct shear (DS) tests, and tilt table tests. The testing programs were directed by SRK (2015, 2016, 2019, 2021), BGC (2012), and URSA (1998) and completed at accredited laboratories in North America that follows industry best practices. SRK reviewed the testing database and utilized reliable and valid test results to derive representative compressive and shear strength values of the intact rock and discontinuities of the Arctic rock mass.
Strength anisotropy is known to exist as a result of foliation fabric through the various lithologies in the Arctic rock mass. UCS and TCS tests that have failed primarily along foliation fabric were rejected to minimize the influence of anisotropy to the intact rock strength. The mean and standard deviation values of UCS test results considered for geotechnical assessments are presented in Table 13-21.
| | |
| Arctic Project | Page 251 |
| S-K 1300 Technical Report Summary | November 30, 2022 |
| | |
The shear strength of discontinuities and the foliation rock fabric were assessed using DS and tilt table tests (Table 13-22). The test results suggest a variation in the friction angle between different lithologies and discontinuity orientations. After examining the laboratory test results, the peak friction angles of foliation fabric and other discontinuities, respectively, were characterized as 24° and 27°. These values represent the Arctic rock mass excluding the Talc Zone domain.
The Talc Zone domain consisting of talc schist (TS) and chlorite-talc schist (ChTS), is the weakest rock type (outside of fault zones) observed at the Arctic deposit. The domain is characterized by low intact rock strength, well developed fabric and low shear strength discontinuity surfaces. The shear strength, extent and persistence of the unit is considered a risk for pit slope stability and was the target of the 2021 and 2022 geotechnical drilling programs.
A geotechnical laboratory testing program dedicated to determining the shear strength of the weakest talc layers within the Talc Zone rock mass domain was completed in 2021. The program included both rock and soil TCS and DS tests. Available historical shear strength tests on talc were reviewed using before and after test photographs, and data points interpreted as invalid, or outliers, were removed from the analysis. The assessment indicates that the talc has an approximate peak friction angle of 11° and cohesion of 30 kPa (Figure 13-15). Additional laboratory tests utilizing core samples from the 2022 drilling program is in progress.
| Table 13-21: | Summary of Unconfined Compressive Strength by Lithological Units |
| | | Unconfined Compressive Strength | |
| | | | | UCS (MPa) | | Young’s Modulus (GPa) | | Poisson’s Ratio | |
| Litho Code | | Valid Results Count | | Average | | Std Dev | | Average | | Std Dev | | Average | | Std Dev | |
| AMR | | 5 | | 88 | | 61 | | 22 | | 9 | | 0.19 | | 0.06 | |
| CHS | | 2 | | 20 | | - | | 4 | | - | | 0.23 | | - | |
| DIKE | | 2 | | 62 | | - | | 19 | | - | | 0.25 | | - | |
| DM | | 3 | | 71 | | - | | 22 | | - | | 0.25 | | - | |
| GS | | 14 | | 97 | | 22 | | 24 | | 11 | | 0.14 | | 0.06 | |
| MRP | | 9 | | 73 | | 19 | | 18 | | - | | 0.21 | | - | |
| MS | | 6 | | 56 | | 20 | | 24 | | 11 | | 0.25 | | 0.04 | |
| QFMS | | 5 | | 64 | | 15 | | 19 | | 6 | | 0.25 | | 0.05 | |
| QMS | | 5 | | 50 | | 7 | | 15 | | 6 | | 0.21 | | 0.03 | |
| QMSp | | 2 | | 62 | | - | | 20 | | - | | 0.23 | | - | |
| SMS | | 3 | | 68 | | - | | 24 | | - | | 0.21 | | - | |
| TS | | 2 | | 1 | * | - | | 0.9 | | - | | - | | - | |
| ChTS | | 2 | | 13 | * | - | | 3 | | - | | - | | - | |
* TS and ChTS average UCS values were derived using triaxial confinement test data
Source: SRK, 2020
| | |
| Arctic Project | Page 252 |
| S-K 1300 Technical Report Summary | November 30, 2022 |
| | |
| Table 13-22: | Shear Strength Laboratory Test Results Excluding Talc Samples |
| Hole ID | | From (m) | | To (m) | | Lithology | | Test Type(1) | | Peak Friction Angle (°)
Natural Surface | | Base Friction
Angle (°) Saw Cut | | Base Friction
Angle (°) Tilt Table | |
| AR15-0139 | | 250.66 | | 250.86 | | CHS | | DS | | 23.7 | | - | | - | |
| AR15-0139 | | 231.43 | | 231.67 | | CHS | | DS | | 17.2 | | - | | - | |
| AR19-0171 | | 103.29 | | 103.52 | | CHS | | DS | | 7.7 | | - | | - | |
| AR11-0128 | | 118.18 | | 118.42 | | GS | | DS | | 22.6 | | - | | - | |
| AR11-0129 | | 177.12 | | 177.52 | | GS | | DS | | 32.5 | | - | | - | |
| AR11-0129 | | 221.67 | | 222.05 | | GS | | DS | | 34.2 | | - | | - | |
| AR11-0130 | | 161.04 | | 161.44 | | GS | | DS | | 23.5 | | - | | - | |
| AR15-0140 | | 115.97 | | 116.19 | | GS | | SC | | - | | - | | 25.3 | |
| AR15-0142 | | 47.20 | | 47.4 | | GS | | SC | | - | | - | | 24.1 | |
| AR19-0165A | | 159.36 | | 159.64 | | MRP | | DS | | 18 | | - | | - | |
| AR15-0142 | | 82.46 | | 82.68 | | MRP | | SC | | - | | 22.1 | | 23.3 | |
| AR15-0140 | | 134.39 | | 134.64 | | MRP | | SC | | - | | - | | 24.1 | |
| AR15-0143 | | 36.72 | | 36.97 | | MRP | | SC | | - | | - | | 24.6 | |
| AR19-0166 | | 286.16 | | 286.39 | | MRP | | SC | | - | | - | | 27.0 | |
| AR16-0149 | | 156.80 | | 157.01 | | MS | | DS | | 24.5 | | - | | - | |
| AR16-0149 | | 159.93 | | 160.13 | | MS | | DS | | 29.9 | | - | | - | |
| AR15-0139 | | 75.30 | | 75.51 | | QFMS | | DS | | 22.1 | | - | | - | |
| AR11-0127 | | 150.63 | | 150.88 | | QFMS | | DS | | 29.1 | | - | | - | |
| AR19-0168 | | 198.68 | | 198.95 | | QFMS | | DS | | 25.6 | | - | | - | |
| AR19-0167 | | 163.03 | | 163.23 | | QFMS | | DS | | 12 | | - | | - | |
| AR19-0164 | | 138.78 | | 138.96 | | QFMS | | SC | | - | | - | | 29.4 | |
| AR19-0165A | | 216.69 | | 216.97 | | QFMS | | SC | | - | | - | | 25.8 | |
| AR19-0168 | | 50.53 | | 50.75 | | QFMS | | SC | | - | | - | | 25.0 | |
| AR19-0168 | | 139.94 | | 140.17 | | QFMS | | SC | | - | | - | | 23.0 | |
| AR19-0171 | | 211.59 | | 211.85 | | QMS | | DS | | 21.8 | | - | | - | |
| AR15-0139 | | 184.65 | | 184.92 | | QMS | | SC | | - | | 24.1 | | 23.3 | |
| AR15-0137 | | 200.45 | | 200.69 | | QMS | | SC | | - | | - | | 26.3 | |
| AR15-0145 | | 219.34 | | 219.57 | | QMS | | SC | | - | | - | | 24.0 | |
| AR19-0165A | | 105.13 | | 105.38 | | QMS | | SC | | - | | - | | 26.7 | |
| AR19-0171 | | 129.77 | | 130.02 | | QMS | | SC | | - | | - | | 28.2 | |
| AR11-0130 | | 141.10 | | 141.65 | | QMSp | | DS | | 21.2 | | - | | - | |
| AR11-0130 | | 149.84 | | 150.29 | | QMSp | | DS | | 31.4 | | - | | - | |
| AR16-0149 | | 154.18 | | 154.48 | | SMS | | DS | | 19.9 | | - | | - | |
Source: SRK, 2020
| | |
| Arctic Project | Page 253 |
| S-K 1300 Technical Report Summary | November 30, 2022 |
| | |
| Figure 13-15: | Talc Geotechnical Laboratory Testing Results |
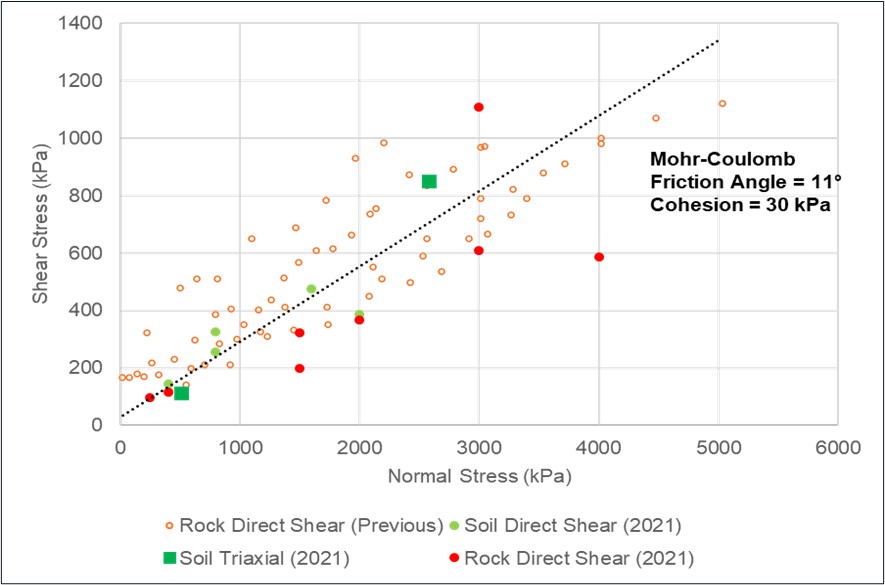
Source: SRK, 2022
| 13.9.4 | Rock Mass Assessment |
Based on similar geotechnical conditions, most lithological units have been grouped together into broad domains represented by the Upper and Lower Plates that are separated by the Warm Springs Fault. The exceptions to these groupings are the weaker talc units, shallow weathered material, and fault zones. The following rock mass domains were defined:
| | |
| Arctic Project | Page 254 |
| S-K 1300 Technical Report Summary | November 30, 2022 |
| | |
Mean rock mass parameter values and ranges were defined for each rock mass domain (e.g., fracture frequency, rock mass rating). Particular attention was paid to the assessment of intact rock strength within the defined rock mass domains. Laboratory strength testing, supported by point load testing and empirical field estimates, suggests that strength within the various lithological groups of the Upper and Lower Plates is reasonably homogeneous (Table 13-23).
| Table 13-23: | Summary of Derived Rock Mass Parameter Values per Rock Mass Domain |
| Domain | | RQD (%) | | FF/m | | UCS
MPa | | RMR89Joint
Condition
(0-30) | | RMR89 | | GSI | | Ei
(GPa) | | | mi | |
| Upper Plate | | 85-95 | | 1-4 | | 50-60 | | 20 | | 60-70 | | 55-65 | | 18 | | | 18 | |
| Lower Plate | | 75-85 | | 2-5 | | 50-60 | | 19 | | 55-65 | | 50-60 | | 18 | | | 18 | |
| Weathered | | 45-55 | | 10-20 | | 40-50 | | 16 | | 40-50 | | 35-45 | | 18 | (1) | | 13 | (1) |
| Talc Zone(2) | | 20-40 | | 25-40 | | 1-10 | | 10 | | 20-30 | | 15-25 | | 4 | | | 6 | |
| Faults | | 0-20 | | > 40 | | 30-40 | | 16 | | 30-40 | | 25-35 | | - | (3) | | - | (3) |
(1) Estimated parameter after BGC (2012)
(2) The rock mass parameters for Talc Zone are representative of the talc rock mass but not the talc layer itself
(3) No data available; estimated for stability assessments
| 13.9.5 | Kinematic Stability Assessment |
A complete assessment of bench and inter-ramp kinematic stability was undertaken. Full descriptions of toppling, planar, and wedge instability risks were developed per structural domain and design sector.
The most significant discontinuity sets, in terms of limiting slope angles, are related to shallow to intermediate dipping S1/S0 (foliation) fabric, which impacts the northeast, east and southeast slopes.
Hydrogeological investigations and assessments were completed for both the open pit and valley bottom water/waste management areas.
Hydrogeological data are available from 39 boreholes (Figure 7-13); 15 in the area of the open pit area and 24 in the valley bottom area, comprising:
| • | Hydrogeologic testing data from 50 packer-based hydraulic tests; 11 slug tests; two pumping tests in valley bottom, each with an observation well; three injection tests in pit area, one of six hours duration and two greater than 24 hours, each with monitoring at nearby vibrating wire piezometers (VWPs) (SRK 2017, SRK 2020, SRK 2022); 122 particle size distributions from test pits in valley floor (SRK 2020). |
| • | Water level data from 25 VWPs in pit area; 3 standpipe piezometers (a fourth piezometer is planned to be installed in 2022) in the pit area;12 water level dataloggers in valley bottom (SRK 2017, SRK 2020, SRK 2022). |
| • | Dedicated ground temperature cables at six locations in valley floor; temperature from all VWP sensors, including those in the open pit area (SRK 2020). |
| • | 22 monitoring wells and two pumping wells in valley bottom; three standpipe piezometers in pit area (SRK 2020). |
| | |
| Arctic Project | Page 255 |
| S-K 1300 Technical Report Summary | November 30, 2022 |
| | |
These data were collected following industry best practices. The data collected using the techniques described above have been used to develop conceptual models for the project area and hydrostratigraphic units:
Overburden is thickest in the valley bottom, typically ranging between 10 m to 20 m with localized areas of 25 m or more. It is comprised of colluvium and glacial till. On the valley sides, and in the area of the pit, overburden thickness is relatively minor, typically around 5 m or less. In the open pit area, the hydraulic conductivity (K) of the overburden ranges between 6x10⁻⁷ and 9x10 5 m/s, with a geomean of 4x10⁻⁶ m/s. In the valley bottom the K varies between 6x10⁻⁷ and 9x10⁻⁵ m/s, with a geomean of 5x10⁻⁶ m/s.
Weathered bedrock, defined as bedrock with enhanced permeability due to weathering or isostatic rebound post-glaciation, typically ranges between 0 m to 60 m thickness based on available drill hole data. Specific testing of weathered bedrock was completed in valley bottom drill holes; presence of weathered bedrock in the pit area was inferred from logging. The K in the weathered bedrock in both the open pit and valley bottom ranges between 6x10 8 m/s and 4x10⁻⁵ m/s, with a geomean of 5x10 7 m/s.
Competent bedrock encompasses all lithologic units, in both the valley bottom and pit areas, with sub-units that include upper and lower fractured bedrock (upper and lower are relative to talc position); talc unit; fault barriers; fault conduits. In the open pit area, the K varies between 2x10⁻⁹ m/s and 5x10⁻⁵ m/s with a geomean of 7x10 8 m/. In the valley bottom area, the K is interpreted to be primarily related to fractures and ranges between 2x10⁻⁹ m/s and 4x10⁻⁵ m/s, with a geomean of 7x10 8 m/s.
The talc unit is present in the pit area, with relatively low hydraulic conductivity and is considered an aquitard, but the aquitard is likely discontinuous based on talc distribution and thickness.
Testing of specific geological structures was completed in the pit area. Results range from similar to surrounding bedrock to higher or lower permeability (K). No continuous, relatively high or relatively low permeability structures were identified.
The hydrogeological conceptual model for valley bottoms is relatively simple. Overall water flow directions are similar to the topography, with the majority of water flow at relatively shallow depth in overburden or weathered bedrock flowing towards valley bottoms. In the valley bottom, overburden heterogeneity exists, with flow occurring within relatively coarser grained, higher hydraulic conductivity units and weathered bedrock. The majority of groundwater flow in the Subarctic Creek watershed is assumed to discharge to Subarctic Creek. Flow within competent bedrock is much lower in magnitude.
In the valley bottom, the outstanding data gap is hydrogeological characterization of overburden and fractured rock in the specific area of the proposed valley bottom groundwater seepage interception system. The characterization program should include completion of monitoring wells down gradient of this system to allow for development of baseline groundwater quality conditions.
Figure 13-16 presents the conceptual hydrogeological model for the pit area. Overall flow directions follow topography, with flow systems all within the competent bedrock hydrostratigraphic unit, with the talc, upper and lower fractured bedrock and structures sub-units present. Hydraulic gradients are downwards from the upper fractured bedrock sub-unit to the lower fractured bedrock unit, separated by the talc aquitard. The lower fractured bedrock unit is confined at lower elevations, with the potentiometric surface above the talc sub-unit. Water levels are assumed to vary seasonally, with highest levels occurring as a result of freshet snow melt and or spring/summer precipitation.
| | |
| Arctic Project | Page 256 |
| S-K 1300 Technical Report Summary | November 30, 2022 |
| | |
| Figure 13-16: | Summarized Hydrogeological Conceptual Model for Pit Area |
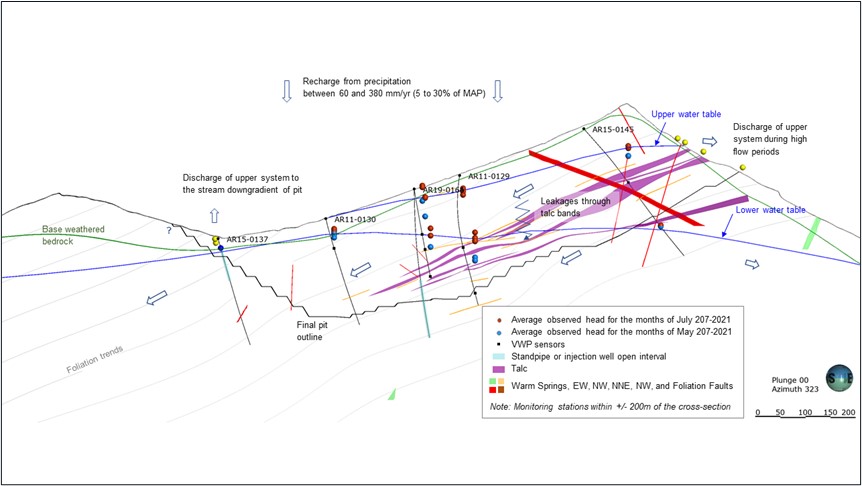
Source: SRK, 2022
Pit inflow and pore pressure conditions for the 2019 mine designs were assessed using numerical and analytical tools. Comparison of the 2019 mine designs with 2022 mine design showed relatively minor differences, focused primarily in the area where the pit floor will be mined below the talc for slope stability purposes.
Considering the relatively minor differences, inflow estimates for the 2022 mine design were scaled from previous estimates using comparisons of the footprints, elevations, and bottom depths for open pit designs at different phases. Table 13-24 summarizes estimated pit inflow for three cases reflecting the range of hydraulic conductivity and groundwater recharge that could be expected based on data and modelling. The “Base Case” estimate reflects groundwater model runs with parameters calibrated to average stream baseflow conditions. “Low Case” and “High Case” estimates reflect model runs with parameters calibrated to minimum and maximum baseflow conditions, respectively. Estimates of pit wall runoff, reflecting direct precipitation on the pit, were obtained from the site wide water balance model, using a runoff coefficient of 0.9. The presented values are annual averages; shorter duration higher peak flows and periods of lower inflow can be expected to occur.
Pit inflows are expected to be low magnitude, relative to many other projects worldwide, and flows of this magnitude can be handled with in-pit sumps. It was assumed that sumps would be positioned at the lowest elevation points in the pit. Perimeter dewatering wells are not considered necessary for this scale of flow. A trend of increasing hydraulic conductivity with depth appears to occur at this site. As the pit advances into later years and gets deeper, in-pit dewatering wells may be beneficial.
| | |
| Arctic Project | Page 257 |
| S-K 1300 Technical Report Summary | November 30, 2022 |
| | |
Detailed design of dewatering capacity needs to consider:
| • | Normal duty pumping capacity based on estimated pit inflow rates. |
| • | Event pumping capacity based on the highest of design hydrological event (e.g., 1 in 20, 24-hour precipitation), annual freshet flow, or 2x normal duty capacity. |
| • | Pit sumps sized based on event pumping capacity/volume. |
It is the QP’s opinion that characterization of and assumptions for aquifer and aquitard parameters (i.e., permeability, recharge) used in groundwater models used to estimate inflows follow industry best practice, have an acceptable water balance and are appropriate for this level of study.
| Table 13-24: | Estimate Pit Inflow |
| | | Average Yearly Pit Groundwater Inflow (m3/d) | | | |
| Mining Year | | Low Case | | Base Case | | High Case | | Pit Wall Runoff
(m3/d) | | Base Case Total Inflow
(m3/d) | |
| 02 | | 130 | | 300 | | 650 | | 1890 | | 2190 | |
| 05 | | 150 | | 350 | | 770 | | 2410 | | 2760 | |
| 07 | | 160 | | 370 | | 830 | | 2830 | | 3200 | |
| 09 | | 160 | | 400 | | 900 | | 3140 | | 3540 | |
| 11 | | 170 | | 420 | | 950 | | 3320 | | 3740 | |
| 13 | | 180 | | 440 | | 990 | | 3320 | | 3760 | |
Pore pressure influences on slope stability analyses were assessed through combinations of hydrogeological modelling and geotechnical stability modelling. Pore pressures were estimated with four 2-D cross-sectional models that represented the four geotechnical sections used to evaluate slope stability. Conservative model assumptions were used considering the risks posed by the low shear strength of the talc, and uncertainties with hydrogeological conditions (i.e., lateral extent of the hydrostratigraphic zones above the talc, vertical leakage rates between units above and below the talc, and presence of geological structures acting as barriers or conduits).
Sensitivity to model assumptions were tested including variations to hydraulic conductivity of the fractured rock, specific storage, specific yield, as well as to anisotropy within the fractured rock and presence of impermeable geological structures. Results suggested highest sensitivity (as measured via changes in water table distribution and hydraulic head) related to anisotropy and the addition of impermeable geological structures.
Based on slope stability assessments, it is the QP’s opinion that pore pressures could pose stability risks under two conditions:
| ● | Stability analyses indicate that slopes along geotechnical section E (SRK, 2022), in the northeast and east walls of the pit are sensitive to potential planar sliding on talc or foliation. Elevated pore pressures in these areas would exacerbate this condition. If pore pressure in these areas does not drain naturally as mining advances, active depressurization should be implemented. |
| | |
| Arctic Project | Page 258 |
| S-K 1300 Technical Report Summary | November 30, 2022 |
| | |
| ● | Compartmentalization by sub-vertical structures could impede natural drainage of the slopes, potentially leading to localized stability issues. Specific areas where this could occur have not been identified in the available data but are possible. |
A conceptual pore pressure monitoring system and mitigation plan for the area of geotechnical section E was developed and is presented in Figure 13-17. Assumptions used for this plan are based on the hydrogeological conceptual model and results of hydrogeological testing. The system must be capable of maintaining pore pressure targets during freshet high flow conditions and operate under winter freezing conditions. The plan is sufficient to support the current level of study but should be reviewed as additional information becomes available, and mitigation efforts adapted as appropriate to achieve pore pressure reduction needs.
| Figure 13-17: | Pore Pressure Management Assumptions for East and Northeast Pit Walls |

Source: SRK, 2022.
| | |
| Arctic Project | Page 259 |
| S-K 1300 Technical Report Summary | November 30, 2022 |
| | |
| 13.9.9 | Stability Modelling |
The minimum acceptable factor of safety (FoS) for the planned Arctic open pit varies depending on the pit slope component. Based upon the current plans, there is no major infrastructure set to be constructed proximal to any pit walls. If this were to change, it would be necessary to examine the selected acceptance criteria.
Table 13-25 summarizes the selected acceptance criteria for the Arctic pit slope design.
| Table 13-25: | Selected Slope Stability Acceptance Criteria |
| | | Acceptance Criteria (1) | |
| | | Static | | | Dynamic | |
Slope
Component | | Minimum
FoS | | | Maximum PoF
Displayed as Probability of
FoS ≤ 1 (%) | | | Minimum
FoS | | | Maximum PoF
Displayed as Probability of
FoS ≤ 1 (%) | |
| Bench | | | 1.1 | | | 50 | % | | NA | | | 50 | % |
| Inter-ramp | | | 1.3 | | | 10 | % | | 1.1 | | | 10 | % |
| Overall | | | 1.3 | | | 5 | % | | 1.1 | | | 5 | % |
(1) FoS = Factor of Safety and PoF = Probability of Failure
Two dimensional (2-D) RS2 modelling, carried out on four sections around the pit, validated the findings from the kinematic assessment and showed that existence of talc layers in the slopes are geotechnical risks. The models suggest that final pit wall slopes are sensitive to the pore pressure when the talc layers are exposed in the pit walls and relatively insensitive to pore pressure in other scenarios. A seismic hazard assessment was incorporated considering the annual exceedance probability of 10% chance of being exceeded in 50 years indicating a peak ground acceleration of 0.26 g for the region of the proposed Artic Pit. The peak ground acceleration used to evaluate the 2-D sections was a conservative 66% of the estimated regional peak ground acceleration for this region, or 0.17 g.
Three dimensional (3-D) RS3 modelling focused on analyzing the stability of the east and northeast walls that are designed to be mined to foliation fabric and contain talc layers. These slope areas did not meet the stability design criteria in 2-D but it was anticipated that confinement in 3D would improve slope performance. The effect of pore pressures was not analyzed in 3-D due to limitations with the software when modelling complex groundwater conditions. As with the results of the 2-D findings, the absence of pore pressure in the 3-D model was assumed to be representative if the pore pressure management plan successfully drains the groundwater above the talc zones.
The 3-D analysis result suggests that the area in the northeast wall above the Cz Talc Zone is, in terms of stability, the most sensitive slope to shear strength reduction. The resulting SRF of 1.3, although meeting the design criteria, represents an optimistic estimation of the factor of safety as the strengths of the talc zone and foliation could be lower.
| | |
| Arctic Project | Page 260 |
| S-K 1300 Technical Report Summary | November 30, 2022 |
| | |
Slope design recommendations were based on the findings of the kinematic evaluation, with additional adjustments from the numerical modelling analyses. Hydrogeological influences were considered in the 2-D numerical stability analyses using the predictions of phreatic surfaces in the interim and final pit phases. The models suggested that stability of the northeast and east wall was dependent on full excavation of the talc domains and successful management of the pore water pressures. Inter-Ramp slope design angles were determined for each slope design domain as seen in Figure 13-18.
| | |
| Arctic Project | Page 261 |
| S-K 1300 Technical Report Summary | November 30, 2022 |
| | |
| Figure 13-18: | Recommended Inter-Ramp Angles by Slope Design Domains Projected on EOY12 Design Pit |
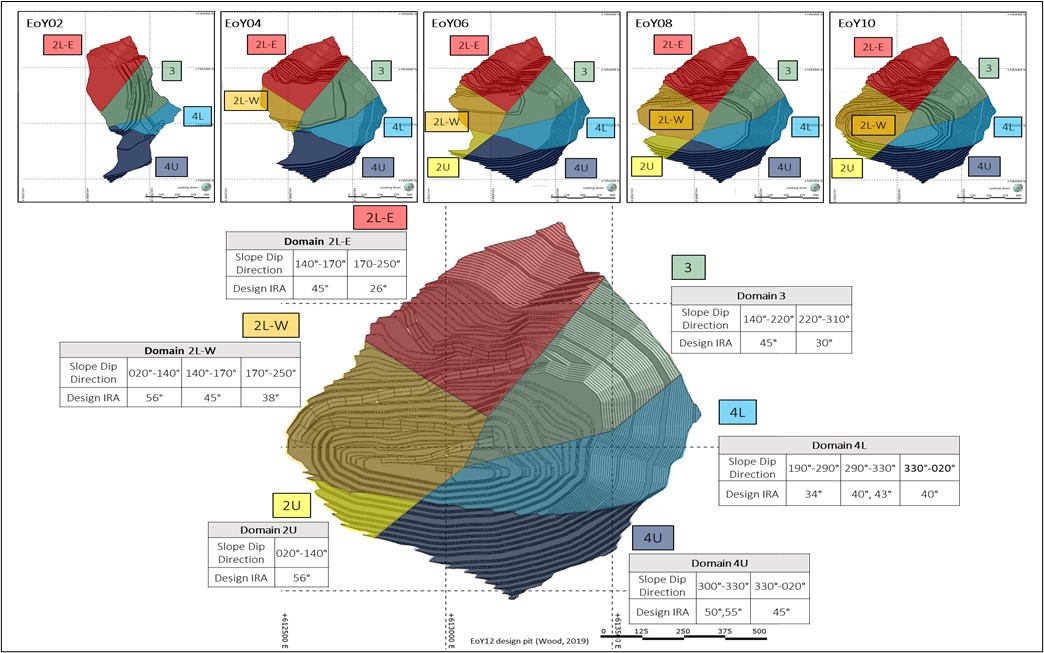
Source: SRK, 2019.
| | |
| Arctic Project | Page 262 |
| S-K 1300 Technical Report Summary | November 30, 2022 |
| | |
| 13.10 | Geotechnical Review of Open Pit Design |
Wood updated the open pit mine designs to support the Report. The updated design includes four nested phases including the ultimate pit. The notable geotechnical recommendations considered for the mine design update include:
| • | Where slopes are oriented sub-parallel to foliation, conventional bench-berm designs have been adjusted to excavate along foliation design |
| • | Slope angle of north wall, above 900 m elevation, has been optimized to account for more favourable orientation of foliation |
| • | The east and northeast walls of the interim mining phases do not expose the talc domain |
| • | Talc domains are fully excavated in the northeast and east walls of final mining phase |
| 13.10.1 | Slope Stability Risks |
Based on a high-level geotechnical review, SRK believes that the updated open pit mine designs have honoured the geotechnical slope design recommendations. The review also identified potential slope stability risks for the various mining phases, shown in Figure 13-19, that were assessed using 3D finite element numerical models with simplified geometries and groundwater conditions. It is recommended that these potential risks are considered in the next stages of the Arctic Project.
| ● | Potential sliding failure along talc domains and fault structures in the northwest and east walls of Phase01 pit. The 3D stability model results suggest that the east wall in the interim mining phase is stable in dry conditions but the factor of safety falls below the design acceptance criteria when the pore pressures become elevated above the talc domains which could occur seasonally during freshet. This highlights the importance of pit water management plan as well as controlling the amount of snow accumulating within the potential areas of risk. Flexibility in mine sequencing may be required to accelerate the excavations above the talc domains if pore pressures can’t be controlled. |
| ● | Interaction of talc domains and discontinuities to form potentially unstable multi-bench wedges in the south walls of Phase02, Phase03 and Final pit designs. 3D numerical model results show that multi-bench scale failure is unlikely but elevated pore pressures could exacerbate the conditions. Localized blocks could fail along the bench crest and rockfall risk should be considered in these areas. |
| ● | Sliding failures along foliation are expected where the slope orientation changes abruptly in the final east wall. Slope design adjustment is recommended to remove any convex slope shapes in the elevated risk areas. |
| | |
| Arctic Project | Page 263 |
| S-K 1300 Technical Report Summary | November 30, 2022 |
| | |
| Figure 13-19: | Potential Areas of Slope Instability Risks in the 2022 Open Pit Designs |
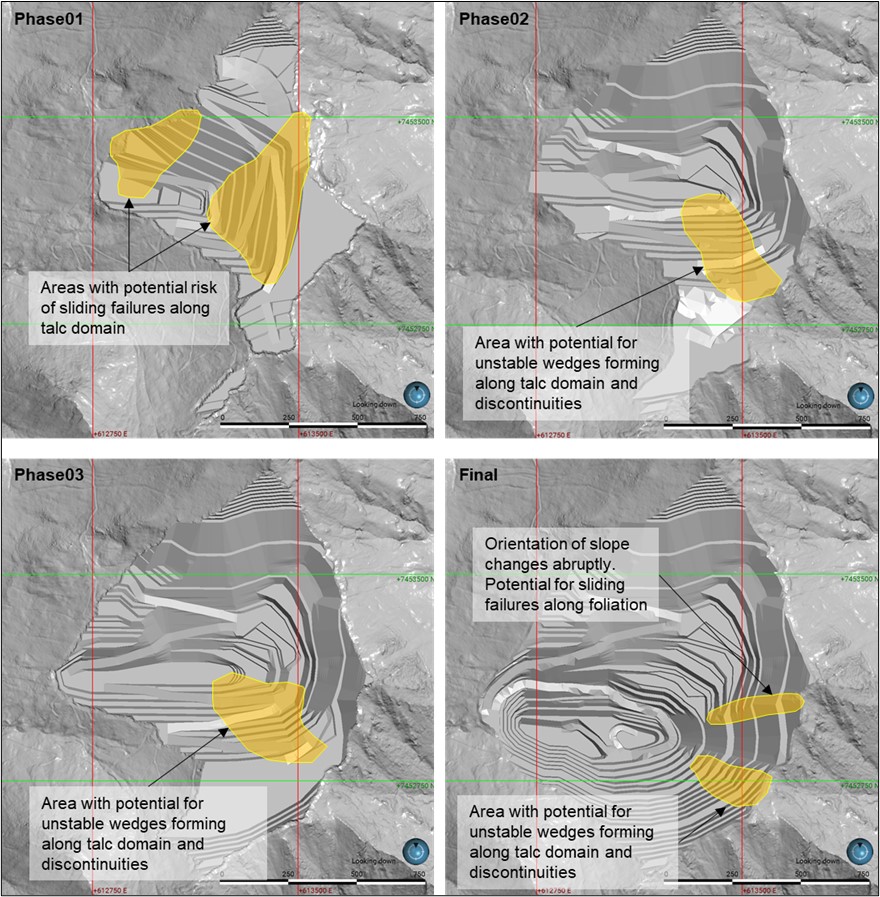
Source: SRK, 2022
| | |
| Arctic Project | Page 264 |
| S-K 1300 Technical Report Summary | November 30, 2022 |
| | |
| 13.11 | Geochemistry Assessment |
| 13.11.1 | Acid Base Accounting Studies |
Five geochemical sampling campaigns in 1998, 2010, 2013, 2015 and 2016 resulted in accumulation of a dataset of 1,557 samples tested using various methods. In January 2017, following a large (1004 sample) infill sampling campaign in 2016, Trilogy consolidated the databases, which enabled SRK to use the geochemical database and mineralogical data to develop site-specific methods for acid potential (AP) and neutralization potential (NP) (SRK 2019).
About 75% of samples were classified as potentially acid generating (PAG), which is defined as total sulphur content >0.1% and NP/AP<2 where NP and AP are calculated using site-specific methods. Acid rock drainage (ARD) potential occurs in all rock types to varying degrees. Ore and the associated Gray Schist have the strongest ARD potential, followed by felsic schists. The rock types with weaker ARD potential are chlorite talc schist and metarhyolite porphyry.
In 2017 2019, and 2022 tailings generated by metallurgical testing were tested for acid-base accounting (ABA) methods and found to have potential for acid generation.
| 13.11.2 | Geochemical Kinetic Studies |
| 13.11.2.1 | Waste Rock Program |
Geochemical kinetic testing using six rock type composites was initiated in 2015. The composites were used to fill seven barrels (including one duplicate) at the site with 240 to 270 kg of waste rock in each test. Leachates from the barrels were collected and tested once in 2015 and three to five times during each summer from 2016 through 2019, and 2021 to 2022. Parallel laboratory humidity cells were also initiated in 2015 and are evaluating the weathering behaviour of the composites. Three of the humidity cells are still operating and had reached 370 weeks as of November 30, 2022, and three of the humidity cells were terminated in 2021/2022 as weathering rates were stable.
An additional 10 waste rock humidity cell tests (HCTs) were initiated in 2019, and a further two were initiated in 2021. While the tests initiated in 2015 generally represented typical compositions of the main waste rock types in terms of sulphur content, the tests initiated in 2019 and 2021 were designed to represent the range of compositions present for key parameters such as selenium and sulphur, including some tests that would represent “worst case” conditions. The humidity cells initiated in 2019 had been operating for 184 weeks as of November 14, 2022, with the exception of three of the tests which were terminated in 2021/2022 as weathering rates were stable. The tests initiated in 2021 had been operating for 92 weeks as of November 14, 2022.
All of the kinetic samples (from the 2015, 2019 and 2021 programs) have the potential to generate acid. To date, ten HCTs have generated acid (pH<5) including samples from all the main rock types. A further four tests had pHs that were most recently between pH 5.0 and 6.5 indicating that carbonate minerals have likely been exhausted and acid generation is buffered by silicate minerals. pH is expected to continue declining in the tests. The remaining four tests had recent pHs around 7.0 and were likely still buffered by carbonate minerals. The testwork has provided data on metal release rates under acidic and non-acidic conditions which have been used to estimate waste rock contact water composition.
| | |
| Arctic Project | Page 265 |
| S-K 1300 Technical Report Summary | November 30, 2022 |
| | |
| 13.11.2.2 | Tailings Program |
Kinetic testing of tailings from the 2017 metallurgical test program was completed late in 2020 (conducted for 193 weeks). Tailings from the 2019 and 2022 metallurgical test programs has been in operation for 172 weeks and 30 weeks respectively (as of November 14, 2022). Testing includes HCTs, and the 2019 and 2022 tailings are also undergoing subaqueous column testing. None of the tests have generated acid and recent pHs are above 7.0. The HCT testwork has provided data on metal release rates under non-acidic conditions which have been used to estimate contact water composition of tailings upon exposure to subaerial weathering. Subaqueous column results are used for predicting tailings water chemistry during operations and upon closure as water is drawn down in the TMF and porewater is released during tailings consolidation.
Kinetic testing of ore composites was initiated in 2019 and 2022. The 2019 HCT was terminated in 2021 after 112 weeks of operation. The test initiated in 2022 had been operating for 30 weeks as of November 14, 2022. The samples had not generated acid and pHs were above 7.0. The testwork has provided data on metal release rates under non-acidic conditions which have been used to estimate the ore contact water composition.
| | |
| Arctic Project | Page 266 |
| S-K 1300 Technical Report Summary | November 30, 2022 |
| | |
| 14 | Processing and Recovery Methods |
The current process plant design is updated from the 2020 Arctic Feasibility Study Technical Report (2020 FS) by considering the verification testwork conducted by ALS in 2022, along with process optimization based on Ausenco’s benchmark database. The process plant will operate two 12-hour shifts per day, 365 day a year, with an overall plant availability of 92%. The process plant will produce three concentrates: 1) copper concentrate, 2) zinc concentrate, and 3) lead concentrate. Gold and silver are expected to be payable at a smelter and are recovered in both the copper and lead concentrates.
The process is developed to treat the MS and SMS ores from the Arctic deposit hosted in the Ambler Sequence within a VMS belt. The deposit mineralisation occurs as stratiform SMS to MS beds within graphitic chlorite schists and quartz mica schists. The mined material will be comminuted via a primary crushing circuit and a grinding circuit configured in semi-autogenous ball (SAB) mode. Due to the significant levels of talc contained in the mined materials (2.92% in the plant feed), a talc flotation is required to remove the mineral. This is then followed by a bulk flotation of a copper and lead concentrate, and the subsequent separation of copper and lead concentrate. At this stage, flotation of a zinc concentrate process takes place to produce the three flotation concentrates. The talc flotation concentrate and the zinc tailings will be combined and thickened before discharged to the tailings storage facility.
The overall circuit consisting of crushing, grinding and flotation to generate the respective metallic concentrates is based on the optimal process route to produce saleable concentrates from the ores in the Arctic deposit. This process flowsheet is shown in Figure 14-1. Figure 14-2 shows a plan of the overall plant area and Figure 14-3 shows a general arrangement of the process plant area.
| 14.2 | Process Flowsheet and Area Plan |
The process plant will consist of the following unit operations:
| • | SAG and ball mill grinding: |
| ○ | primary grinding using an open circuit semi-autogenous grinding (SAG) mill; and |
| ○ | secondary grinding using a closed-circuit ball mill. |
| • | Bulk copper and lead flotation; |
| • | Copper and lead separation flotation; |
| • | Thickening, filtration, and loading of copper, lead, and zinc concentrates; |
| • | Cyanide destruction; and |
| • | Tailings thickening and disposal. |
| | |
| Arctic Project | Page 267 |
| S-K 1300 Technical Report Summary | November 30, 2022 |
| | |
| Figure 14-1: | Process Plant Flowsheet |
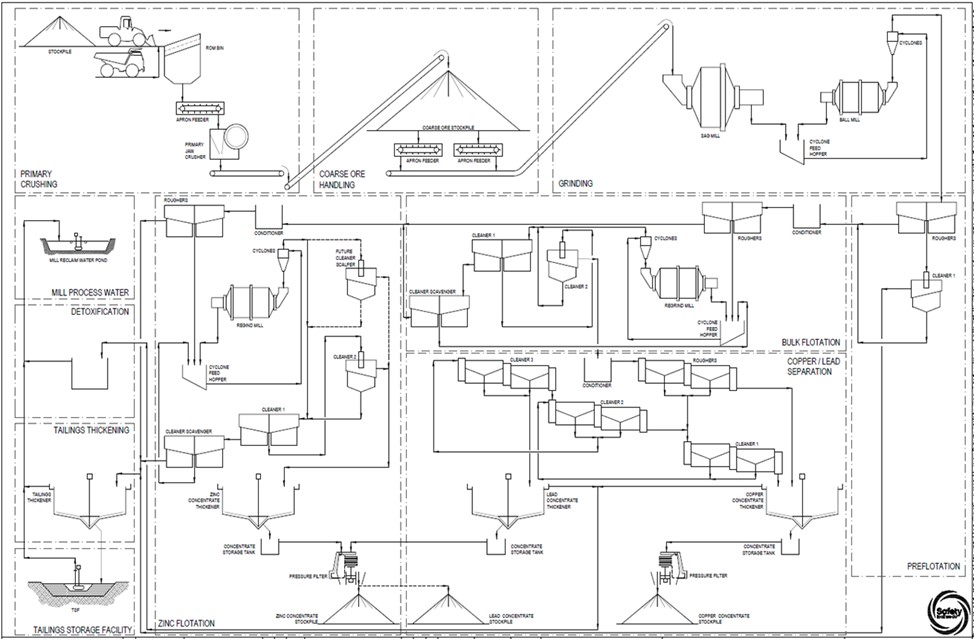
Source: Ausenco, 2022.
| | |
| Arctic Project | Page 268 |
| S-K 1300 Technical Report Summary | November 30, 2022 |
| | |
| Figure 14-2: | Overall Plant Area Plan |
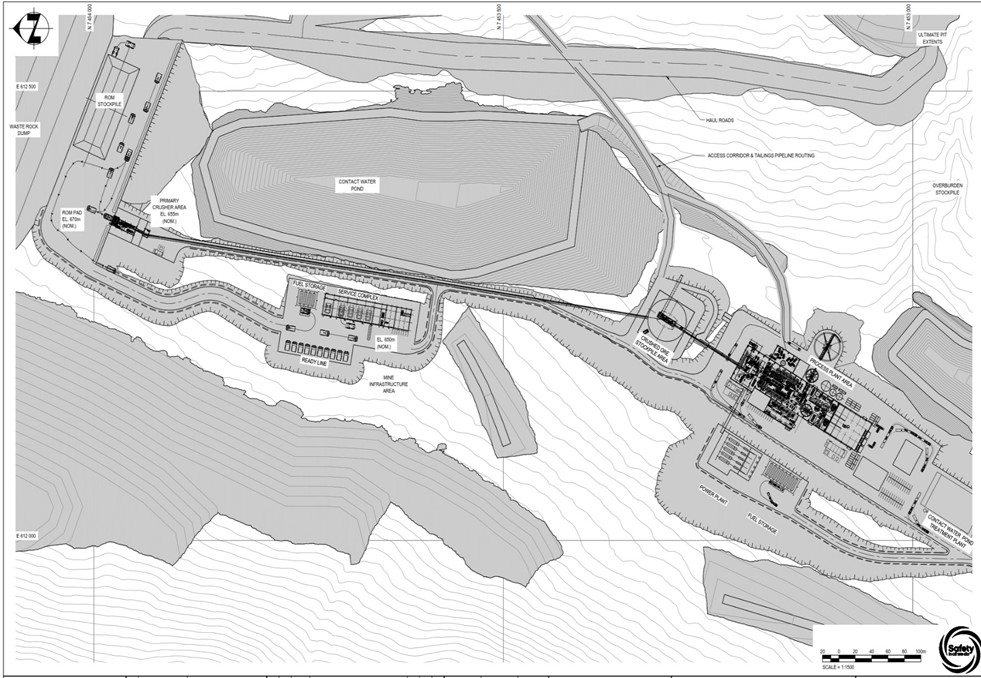
Source: Ausenco, 2022.
| | |
| Arctic Project | Page 269 |
| S-K 1300 Technical Report Summary | November 30, 2022 |
| | |
| Figure 14-3: | Process Plant Plan |

Source: Ausenco, 2022.
| | |
| Arctic Project | Page 270 |
| S-K 1300 Technical Report Summary | November 30, 2022 |
| | |
| 14.3 | Process Design Criteria |
The process plant is designed for a throughput of 10,000 t/d, equivalent to 3,650,000 t/a. The key process design criteria considered for the design and selection of equipment for the processing facilities are listed in Table 14-1 and the comminution parameters are provided in Table 14-2. The process plant design is based on a robust metallurgical flowsheet developed for optimum recovery.
| Table 14-1: | Process Design Criteria - Overview |
| Criteria | | Unit | | Value |
| Plant Design Capacity | | t/a | | 3,650,000 |
| | t/d | | 10,000 |
| Operating Availability - Crushing | | % | | 65 |
| - Grinding and Flotation | | % | | 92 |
| - Concentrate and Tailings Filtration | | % | | 84 |
| Process Plant capacity, nominal @ 92% availability | | t/h | | 453 |
| ROM Specific Gravity | | - | | 3.25 |
| Plant Feed Grades - Copper, Design | | % | | 3.00 |
| - Lead, Design | | % | | 0.74 |
| - Zinc, Design | | % | | 4.20 |
| - Gold, LOM Average | | g/t | | 0.47 |
| - Silver, LOM Average | | g/t | | 35 |
| - Talc, LOM Average | | % | | 8 |
| Table 14-2: | Comminution Design Criteria |
| Criteria | | Unit | | Value |
| Crushing (Single Stage) | | | | |
| Availability | | % | | 65 |
| Primary Crusher | | Type | | Jaw Crusher |
| Crushing Feed Size, 80% Passing | | mm | | 504 |
| Crushing Circuit Product Size, 80% Passing | | mm | | 80 |
| Grinding | | | | |
| Availability | | % | | 92 |
| Circuit Type | | - | | SAG Mill, Ball Mill |
| Bond Ball Mill Work Index, Design | | kWh/t | | 11.6 |
| Bond Abrasion Index, Design | | g | | 0.038 |
| A x b, design | | - | | 109 |
| Feed Particle Size, F80 | | mm | | 80 |
| Product Particle Size, P80 | | µm | | 70 |
| Regrinding Circuit Product Size, 80% Passing - Bulk Rougher Concentrate | | µm | | 40 |
| | |
| Arctic Project | Page 271 |
| S-K 1300 Technical Report Summary | November 30, 2022 |
| | |
Design criteria for the flotation plant were determined from the testwork conducted by ALS Metallurgy (described in Section 13) and is summarized in Table 14-3.
Table 14-3: Flotation Plant Design Criteria
| Criteria | | Unit | | Value |
| Feed Rate | | t/h | | 453 |
| Pre-Flotation | | | | |
| Cell Type | | Type | | Conventional Tank Cells |
| Stage Recovery to concentrate, mass | | % flotation feed | | 21.5-25.7 |
| Stage Recovery, talc | | % | | 88.6 |
| Copper-Lead Bulk Rougher Flotation | | | | |
| Cell Type | | Type | | Jameson Cell |
| Stage Recovery to concentrate, mass | | % flotation feed | | 12.7-15.0 |
| Regrind Mill | | | | |
| Type | | | | Ball Mill |
| Feed Rate, design | | t/h | | 68 |
| Feed Particle Size, F80 | | µm | | 63 |
| Product Particle Size, P80 | | µm | | 40 |
| Specific Grinding Energy (SGE) | | kWh/t | | 9.2 |
| Copper-Lead Cleaners | | | | 3 stages |
| Cell Type | | Type | | Conventional Tank Cell – Stage 1 & 2 Jameson Cell – Stage 3 |
| Stage Recovery to Concentrate, mass | | % Flotation feed | | 16.1-18.6 |
| Stage Recovery, Copper | | % | | 92.1 |
| Stage Recovery, Gold | | % | | 52.0 |
| Stage Recovery, Silver | | % | | 32.5 |
| Lead Rougher Flotation | | | | |
| Cell Type | | | | Conventional Tank Cells |
| Stage Recovery to concentrate, mass | | % flotation feed | | 1.7-2.5 |
| Lead Cleaners | | | | 3 Stages |
| Cell Type | | | | Conventional Tank Cell |
| Stage Recovery to concentrate, mass | | | | 2.6-3.6 |
| Stage Recovery, Lead | | % | | 61.3 |
| Stage Recovery, Gold | | % | | 21.6 |
| Stage Recovery, Silver | | % | | 48.6 |
| Zinc Rougher Flotation | | | | |
| Cell Type | | | | Conventional Tank Cell |
| Stage Recovery to Concentrate, mass | | % flotation feed | | 7.4-8.8 |
| | |
| Arctic Project | Page 272 |
| S-K 1300 Technical Report Summary | November 30, 2022 |
| | |
| | |
| | |
| Criteria | | Unit | | Value |
| Zinc Regrind Mill | | | | |
| Type | | | | Ball Mill |
| Feed Rate, design | | t/h | | 40 |
| Feed Particle Size, F80 | | µm | | 63 |
| Product Particle Size, P80 | | µm | | 40 |
| Specific Grinding Energy (SGE) | | kWh/t | | 9.2 |
| Zinc Cleaners | | | | 3 Stages |
| Cell Type | | | | Conventional Tank Cell – Stage 1 & 2 Jameson Cell – Stage 3 |
| Stage Recovery to concentrate, mass | | | | 11. |
| Stage Recovery, Zinc | | % | | 88.5 |
| Stage Recovery, Gold | | % | | 3.3 |
| Stage Recovery, Silver | | % | | 5.7 |
| Concentrate Handling | | | | |
| Copper Concentrate | | | | |
| Type | | | | Hi-rate |
| Unit Area Thickening rate, design | | t/m2.h | | 0.25 |
| Thickener Underflow Density | | %w/w | | 65 |
| Copper Concentrate Filter | | | | |
| Type | | | | Horizontal plate pressure filter |
| Filtration Rate | | kg/m2/h | | 575 |
| Nominal Filter Cake Moisture | | %w/w | | 6 |
| Lead Concentrate | | | | |
| Type | | | | Hi-rate |
| Unit Area Thickening rate, design | | t/m2.h | | 0.2 |
| Thickener Underflow Density | | %w/w | | 65 |
| Lead Concentrate Filter | | | | |
| Type | | | | Horizontal plate pressure filter |
| Filtration Rate | | kg/m2/h | | 800 |
| Nominal Filter Cake Moisture | | %w/w | | 6 |
| Zinc Concentrate | | | | |
| Type | | | | Hi-rate |
| Unit Area Thickening rate, design | | t/m2.h | | 0.25 |
| Thickener Underflow Density | | %w/w | | 65 |
| Zinc Concentrate Filter | | | | |
| Type | | | | Horizontal plate pressure filter |
| Filtration Rate | | kg/m2/h | | 555 |
| Nominal Filter Cake Moisture | | %w/w | | 6 |
| | |
| Arctic Project | Page 273 |
| S-K 1300 Technical Report Summary | November 30, 2022 |
| | |
Run-of-mine ore will be trucked to the crushing station and dumped into a 200-t receiving bin protected with a 1,000-mm-aperture stationary grizzly. Ore will be reclaimed from the bin with an apron feeder and scalped of fines with a 75-mm-aperture vibrating grizzly. The grizzly oversize will be passed to the primary jaw crusher. The selected conventional jaw crusher will operate with a closed side setting of 100 mm. The crushed material together with the grizzly undersize, with a P80 of 80 mm, will be discharged to the conveyor. A tramp metal magnet will be installed at the head end of the conveyor to remove tramp metal.
Crushed ore will be sent to a single covered conical stockpile via the stockpile feed conveyor.
The major equipment in the crushing circuit will include:
| • | One apron feeder, installed power 30 kW; |
| • | One vibrating grizzly, installed power 30kW; and |
| • | One single toggle jaw crusher, installed power 160 kW. |
The coarse ore stockpile will have a live capacity of 5,000 t, equivalent to approximately 12 h of mill feed at the nominal mill feed rate. The stockpile total capacity will be approximately 20,000 t. The coarse ore stockpile will be a covered facility to mitigate freezing of the stockpiled material, which will be also equipped with a dust collecting system. The coarse ore stockpile building will have sufficient space to allow for the operation of mobile equipment as required. Reclaim of ore from the stockpile will be accomplished using two 1,000-mm-wide by 4,800-mm-long apron feeders at a nominal rate of 226 t/h per feeder. Reclaimed material from the apron feeders will be discharged onto the SAG mill feed conveyor.
The major equipment of the coarse ore storage area will include:
| • | Two apron feeders, unit installed power 11 kW. |
| 14.4.3 | Grinding and Classification |
| 14.4.3.1 | Primary Grinding and Classification |
The grinding circuit will consist of a SAG mill followed by a ball mill arranged in a closed circuit with a hydrocyclone cluster. The nominal feed throughput of the circuit will be approximately 453 t/h. The SAB circuit will reduce the crushed ore particle size from a P80 of 80 mm to 70 µm.
SAB circuit is selected by considering the low competence of the ore materials. The SAG mill will be a grate discharge type with 12 mm apertures and no pebble ports. As required, steel balls will be added to the SAG mill to maintain mill power. The SAG mill product will discharge onto a trommel screen. Trommel screen undersize will report to a hydrocyclone feed pumpbox and the oversize to a scats bunker.
| | |
| Arctic Project | Page 274 |
| S-K 1300 Technical Report Summary | November 30, 2022 |
| | |
The ball mill discharge will report to the hydrocyclone feed pumpbox, where it will be combined with the SAG mill trommel undersize prior to feeding the hydrocyclone cluster. Process water will be added to the SAG mill feed chute and hydrocyclone feed pumpbox to maintain a target slurry density. The hydrocyclone underflow will feed the ball mill by gravity, while the hydrocyclone overflow, with a solids content of 37%, will gravitate to the flotation circuit. The ball mill circulating load will be 350%.
The major equipment of the grinding and classification circuit will include:
| • | One SAG mill, 6.1 m in diameter (20 ft) by 4.9 m (16 ft) EGL, installed power 3,000 kW; |
| • | One ball mill, ;6.1 m diameter (20 ft) by 9.1 m (30 ft) EGL, installed power 6,000 kW; |
| • | Two 55 kW slurry pumps to pump hydrocyclone feed, with one pump in operation and one in standby; and |
| • | One hydrocyclone cluster with fourteen 400 mm hydrocyclones, nine in operation, four in standby and one blank. |
The flotation plant will produce a talc concentrate for disposal, as well as three payable base metal concentrates for shipment to market and sale. The talc concentrate will be produced prior to base metal flotation to minimize dilution of the base metal concentrates. A standard bulk copper and lead concentrate followed by the flotation of a zinc concentrate will be used in the flotation circuit. The copper and lead in the bulk concentrate will be separated by floating the lead from the bulk concentrate to produce individual copper and lead concentrates.
| 14.4.4.1 | Talc Pre-Flotation |
The ball mill hydrocyclone overflow will feed the talc rougher circuit. The talc flotation will be composed of rougher and cleaner flotation stages to float the talc mineral and reject any entrained payable sulphide minerals. The rougher flotation will be performed in the conventional forced-air cells and the cleaner flotation will be performed in a Jameson cell. The talc cleaner concentrate will be pumped to the final tailings.
The major equipment in the talc pre-flotation circuit will include:
| • | Four 120 m3 tank cells, unit installed power 93 kW |
| • | One Jameson cell (B4500/12). |
| 14.4.4.2 | Copper – Lead Bulk Flotation and Regrinding |
The talc pre-flotation tailings will be pumped to the copper/lead bulk flotation conditioning tanks where copper and lead mineral collectors will be added. The conditioned slurry will undergo rougher flotation in conventional tank flotation cells for recovery of a bulk copper and lead concentrate.
The bulk rougher concentrate will be reground in a 600 kW regrind ball mill configured in reverse, closed circuit with hydrocyclones. The bulk rougher concentrate will be reduced to a particle size of 80% passing 40 μm prior to being further upgraded by two stages of cleaner flotation.
The 1st bulk cleaner and cleaner scavenger flotation will be conducted in conventional tank cells. The 1st cleaner flotation tailings will gravitate for scavenging of residual copper and lead minerals. Concentrate from the cleaner-scavenger flotation will be pumped to the regrind hydrocyclone feed pumpbox for further regrinding, while the cleaner-scavenger tailings will join the rougher flotation tailings for pumped transfer to the zinc flotation conditioners. The 2nd bulk cleaner flotation will be performed in a Jameson cell to upgrade the concentrate obtained from the last stage. The 2nd cleaner tailings will be reprocessed in the 1st cleaner flotation stage.
| | |
| Arctic Project | Page 275 |
| S-K 1300 Technical Report Summary | November 30, 2022 |
| | |
Copper-lead bulk cleaner flotation dilution water and launder sprays will be supplied by a dedicated process-water system. The supply for this system will be a combination of copper/lead bulk thickener overflow and main plant process water.
The major equipment in the bulk flotation and regrinding circuit will include:
| • | Five 81 m3 bulk rougher flotation tank cells, unit installed power 75 kW; |
| • | One regrind ball mill, 3.0 m diameter by 5.3 m EGL, installed power 600 kW; |
| • | Four 37 m3 bulk 1st cleaner flotation tank cells, unit installed power 45 kW; |
| • | Three 37 m3 bulk cleaner scavenger flotation tank cells, unit installed power 45 kW; and |
| • | One bulk 2nd cleaner flotation Jameson cell (B4500/12). |
| 14.4.4.3 | Copper and Lead Separation Flotation Circuit |
The bulk 2nd cleaner concentrate will be pumped to the copper-lead separation flotation conditioning tank, where sodium cyanide and lime will be added to supress copper minerals. Lead flotation will be conducted at a pH ranging from 9.0 to 9.5. The conditioned slurry will flow to the conventional lead rougher flotation cells. Frother will be added in the rougher and cleaner flotation cells and lead promoter will be added in the lead rougher concentrate pumpbox to collect lead minerals.
The lead rougher concentrate will be further upgraded in three stages of cleaner flotation to produce the final lead concentrate that will report to the lead concentrate thickener. Tailings from the 2nd and 3rd stages of cleaner flotation will gravity flow to the proceeding flotation cell feed boxes. Tailings from the 1st cleaner flotation will be combined with the tailings from the lead rougher flotation to produce the final copper concentrate, which will report to the copper concentrate thickener.
The major equipment in the lead flotation circuit will include:
| • | Five 6 m3 lead rougher flotation cells, unit installed power 11 kW; |
| • | Five 4 m3 1st cleaner flotation cells, unit installed power 7.5 kW; |
| • | Two 4 m3 2nd cleaner flotation cells, unit installed power 7.5 kW; and |
| • | One 4 m3 3rd cleaner flotation cell, unit installed power 7.5 kW. |
| 14.4.4.4 | Zinc Flotation and Regrind |
The copper-lead bulk rougher tailings will be further floated to recover zinc in the zinc flotation circuit, along with the copper-lead bulk cleaner scavenger tailings. The circuit will consist of feed slurry conditioning, rougher/scavenger flotation, zinc rougher concentrate regrind, and two stages of cleaner flotation. A cleaner scalper stage will be installed when the plant feed zinc grade are expected to be higher.
| | |
| Arctic Project | Page 276 |
| S-K 1300 Technical Report Summary | November 30, 2022 |
| | |
Tailings from the copper-lead bulk flotation circuit will be conditioned with lime (to a pH above 10.5, to depress pyrite) and copper sulphate (to activate zinc minerals), and then sent to the head cell of a bank of zinc rougher flotation cells. Zinc rougher concentrate will report to the regrinding circuit; zinc rougher tailings will be combined with the Talc concentrate and pumped to the tailings thickener. Thickened tails will be pumped to the Tailings Storage Facility (TSF).
The zinc rougher and cleaner scavenger concentrates will be reground in a 355 kW regrind ball mill configured in, closed circuit with hydrocyclones. The zinc concentrates will be reduced to a particle size of 80% passing 40 μm prior to being further processed by the zinc 1st cleaner flotation circuit.
The zinc cleaner circuit will operate at a pH of 11 or above to reject pyrite. The 1st cleaner concentrate will be further upgraded in the 2nd stage of cleaner flotation to produce the final zinc concentrate. The 1st cleaner flotation tailings will be further floated in the cleaner scavenger flotation cells. Concentrate from the cleaner scavenger flotation will return to the zinc regrind circuit. The cleaner scavenger tailings will also report to the final tailings pump box, joined by the zinc rougher tailings and talc flotation cleaner concentrate.
The main equipment used for the zinc flotation circuit will include:
| • | Five 81 m3 zinc rougher flotation tank cells, unit installed power 75 kW; |
| • | One regrind ball mill, 2.7 m diameter by 4.1 m EGL, installed power 355 kW; |
| • | Four 23 m3 1st cleaner flotation tank cells, unit installed power 37 kW; |
| • | Two 23 m3 cleaner scavenger flotation tank cells, unit installed power 37 kW; |
| • | One Jameson flotation cell (E4232/10), Year 1 and Year 7 as 2nd cleaner flotation cell and repurposed to cleaner scalper flotation cell after Year 7; and |
| • | One Jameson flotation cell (E2532/6), future installation on Year 7 as 2nd cleaner flotation cell. |
The copper, lead, and zinc concentrates will report to separate higher-rate thickeners, where flocculant will be added to assist in the settling of the solids. The thickened slurries will be further dewatered by using pressure filters to a design moisture content of 6%. Two identical tower press filters are recommended for the concentrate filtration duties, including one common unit for lead and zinc concentrates dewatering; while another unit is dedicated to dewater the copper concentrate.
| 14.4.5.1 | Copper Concentrate Dewatering |
The copper concentrate will be pumped to a 15 m diameter high-rate thickener which is covered for outdoor application. The thickener overflow water will be reused in the lead flotation circuit, along with overflow from lead concentrate thickener. The excess overflow will be treated by a sulphur dioxide-air procedure to destroy residual cyanide Neutralized overflow will be pumped to the tailings thickener, where the thickener overflow will report to the process pond before recycling back to the plant process water system.
The copper concentrate thickener underflow at approximately 65% solids density by weight will be pumped to an agitated concentrate stock tank with 24 hours storage capacity prior to the filtration process. The final filter cake design moisture is 6% considering the site climate conditions. The copper concentrate will be discharged into a stockpile, from which front end loaders will load concentrate onto containers for shipment. Filtrate will return to the copper concentrate thickener. The stockpile will be capable of storing up to 4 days of copper concentrate production in case of potential truck haulage interruptions.
| | |
| Arctic Project | Page 277 |
| S-K 1300 Technical Report Summary | November 30, 2022 |
| | |
The main equipment in the copper concentrate dewatering circuit will include:
| • | One 15-m-diameter high-rate thickener, installed power 3.7 kW; |
| • | One 84 m2 copper concentrate tower filter press, installed power 105 kW; and |
| • | Two 44 m3 cyanide destruction tanks. |
| 14.4.5.2 | Lead Concentrate Dewatering |
Lead concentrate will be blended with the flocculant solution and discharged to a 6 m diameter high-rate thickener. The thickener underflow containing approximately 65% solids will be pumped to an agitated concentrate stock tank prior to pressure filtration. The concentrate stock tank will have the capacity to contain lead concentrate production for 24 hours. The thickener overflow will be directed to the lead separation circuit for reuse.
Lead concentrate will be filtered in a pressure filter which will be designed to alternate between lead and zinc filtration. Use of a single filter, for 2 products, will require automation to ensure there is no lead-zinc cross contamination. The filter discharge will fall on a reversable conveyor which will send the product to the lead concentrate storage area. The filtrated lead concentrate cake with 6% design moisture will be loaded onto concentrate containers for shipment. The filtrate from the filter will return to the lead concentrate thickener feed well. The in-plant lead concentrate storage facility will be capable of storing at least 4 days of lead concentrate production.
The main equipment in the lead concentrate dewatering circuit will include:
| • | One 6-m-diameter high-rate thickener, installed power 1.5 kW; and |
| • | One 84 m2 tower filter press, shared with zinc concentrate filtration, installed power 105 kW. |
| 14.4.5.3 | Zinc Concentrate Dewatering |
The final zinc concentrate will be pumped to a 14 m diameter high-rate thickener. Flocculant will be added to improve settling of the concentrate. The thickener underflow, with a solid density of 65%, will be stored in an agitated concentrate stock tank prior to pressure filtration. Thickener overflow will be delivered to the zinc rougher feed. The concentrate stock tank is designed to be capable of containing zinc concentrate production for 24 hours.
Zinc concentrate will be filtered in a pressure filter which will be designed to alternate between lead and zinc filtration. Use of a single filter, for 2 products, will require automation to ensure there is no lead-zinc cross contamination. The filter discharge will fall on a reversable conveyor which will send the product to the zinc concentrate storage area. The final filter cake design moisture is 6%. Filtrate from the filtration will return to the zinc concentrate thickener. The zinc concentrate will be loaded onto concentrate containers for shipment. The zinc concentrate storage facility will be capable of storing at least 4 days of zinc concentrate production in case of potential transport interruptions.
The main equipment in the zinc concentrate dewatering circuit will include:
| • | One 14-m-diameter high-rate thickener, installed power 5.5 kW; and |
| • | One 84 m2 tower filter press, shared with lead concentrate filtration, installed power 105 kW. |
| | |
| Arctic Project | Page 278 |
| S-K 1300 Technical Report Summary | November 30, 2022 |
| | |
The final flotation tailings consist of the talc flotation concentrate, zinc rougher flotation tailings and zinc cleaner scavenger flotation tailings. The final flotation tailings will be directed to a 32 m diameter high-rate thickener. Flocculant will be added to improve settling of the tailings. Thickener underflow with a solid density of 47% will be pumped towards the tailings storage facility. Thickener overflow will be delivered to the Process Pond, from where it will be pumped to the process water tank for distribution to the plant.
Water pump barge will be installed to in the tailings pond to reclaim water Tailings water will be pumped to the Process Pond. Water barge pumps will be installed in the Process Pond and will be able to send water to the process water tank or the WTP. Tailings management is discussed further in Section 15.
| 14.4.7 | Reagent Handling and Storage |
Various chemical reagents will be added to the grinding and flotation circuits to modify the mineral particle surfaces and enhance the floatability of the valuable mineral particles into the concentrate products. The reagents will be prepared and stored in a separate, self-contained area inside the process plant and delivered by individual metering pumps or centrifugal pumps to the addition points. All reagents will be prepared using WRCP water via a bulk reagent handling system, mixing and holding tanks.
Estimated annual reagent consumptions are provided in Table 14-4.
| Table 14-4: | Annual Reagent Consumption |
| Reagent | | Unit | | Value | |
| Flocculant | | t/a | | 104 | |
| SIPX | | t/a | | 69 | |
| 3418A | | t/a | | 102 | |
| MIBC | | t/a | | 301 | |
| Lime | | t/a | | 3,424 | |
| Descalant | | t/a | | 36 | |
| Cyanide | | t/a | | 1,324 | |
| ZnSO4 | | t/a | | 529 | |
| CuSO4 | | t/a | | 690 | |
| SMBS | | t/a | | 917 | |
Sodium isopropyl xanthate (SIPX) in pellets form will be shipped to the mine site in bulk-bags. The SIPX will be diluted to 20% w/w solution strength in a mixing tank and stored in a holding tank, before being dosed to the copper-lead bulk flotation circuit and the zinc flotation circuit via metering pumps.
Collector 3418A will be received as a liquid in Intermediate Bulk Containers (IBC) totes. It will be delivered to the copper-lead bulk flotation circuit via metering pumps without dilution.
| | |
| Arctic Project | Page 279 |
| S-K 1300 Technical Report Summary | November 30, 2022 |
| | |
MIBC frother will be received as a liquid in IBC totes. The reagent will be used at the supplied solution strength. Metering pumps will deliver the frother to the talc, copper, lead, and zinc flotation circuits.
Lime will be trucked to the site as unslaked pebbles and stored in a 100-t-capacity bulk lime silo. Lime will be conveyed to the lime slaker and slaked with water. The slaked lime will be stored in an agitated mixing tank and distributed to the addition points via a lime slurry loop, to the zinc flotation circuits and WTP. The slaker will be controlled automatically based on the lime slurry levels in the holding tank.
Solid flocculant will be prepared in a packaged preparation system, including a screw feeder, a flocculant educator, and mixing devices. Flocculant will be diluted to a 0.5% w/v solution strength and added via metering pumps to the copper, lead, zinc and final tailings thickeners’ feed wells where the reagent will be further diluted.
Sodium cyanide, sodium metabisulphite (SMBS), zinc sulphate, and copper sulphate will be supplied in powder/solid form and will be dissolved and diluted by WRCP water. The strength of the reagent solutions will be approximately 15–20%. Cyanide monitoring/alarm systems will be installed at the cyanide preparation areas. Emergency medical stations and emergency cyanide detoxification chemicals will be provided at the areas as well.
Anti-scaling chemicals may be required to minimize scale build-up in the reclaim or recycle water lines. These chemicals will be delivered in liquid form and metered directly into the intake of the reclaim water pumps or process water tank.
Storage tanks will be equipped with level indicators and instrumentation to ensure that spills do not occur during normal operation. Appropriate ventilation, fire and safety protection equipment and devices will be provided at reagent preparation areas.
Plant power will be generated on site, with no utility interconnection using diesel generator sets that will be installed to operate in parallel (four operating and one on standby). Each generator will be rated 13.8 kV, 5.5 MW, and the total power output capacity will be 21.6 MW excluding the redundant unit.
The total connected load for the plant will be 25.9 MW with a normal operating load of 21.0 MW (~167 GWh/a).
There will be three separate water supply systems: a fresh water system, a WRCP water supply system, and a process water supply system. The contact water will originate principally from the Waste-Rock Control Pond. The total water usage for the process plant is 42,240 m3/d.
| | |
| Arctic Project | Page 280 |
| S-K 1300 Technical Report Summary | November 30, 2022 |
| | |
| 14.4.9.1 | Fresh Water Supply System |
Fresh water will be used for fire water and potable water applications that will be supplied from ground water wells. A 350 m3 fresh water/fire water storage tank will hold well water, with a live capacity of 4 hours.
| 14.4.9.2 | WRCP Water Supply System |
WRCP water will be fed to the TMF during winter months and treated and discharged in the summer. Additional process water will be supplied from the WRCP to the TMF through the winter months to meet mill water demands and provide water stored in the TMF as a contingency for dry years. Contact water will also be supplied form the WRCP, which will feed the potable water and gland water tanks.
| 14.4.9.3 | Process Water Supply System |
Process water will mainly come from the Process Pond which is fed by tailings thickener overflow and reclaimed water from TMF. In addition, contact water is also another process water source as makeup water. Process water will be stored in a 14-m-diameter x 14-m-high tank, from where the water will be distributed to the process plant and other service locations. The process water consumption is 40,326 m3/d.
Air service systems will supply air to various applications throughout the plant, as follows:
| • | A separate high-pressure air service system will supply air to the crushing plant by a dedicated air compressor. The air will be provided for dust suppression and equipment services. |
| • | Flotation and Cyanide Destruction: low-pressure air will be provided for flotation tank cells and cyanide destruction tank by air blowers. |
| • | Filtration Circuit: wet high-pressure air will be provided for filtration and drying by air compressors. |
| • | Plant Air Service: wet high-pressure air will be provided for various services by dedicated air compressors. |
| • | Instrumentation Air: dry high-pressure air will come from the plant air compressors; it will be dried and stored in a dedicated air receiver. |
| 14.4.11 | Assay/Metallurgical Laboratory and Quality Control |
The final concentrate and intermediate streams will be monitored by one on-stream sample analyser with three multiplexers to analyse a total of 16 streams for metal contents. The measured data will be fed back to the central control room and used to optimize the process operation. Routine samples of head, intermediate products, tailings, and final products will be collected and assayed in the assay laboratory, where standard assays will be performed. The data obtained will be used for product quality control and routine process optimization.
The site assay laboratory will consist of a sample preparation facility, a metallurgical laboratory and a full set of assay instruments for base metal analysis as well as gold and silver assays. The metallurgical laboratory will perform metallurgical tests for quality control and process flowsheet optimization. The laboratory will be equipped with laboratory crushers, ball mills, particle size analysis devices, laboratory flotation cells, balances, and pH metres. The assay laboratory will be equipped with the following equipment, including:
| | |
| Arctic Project | Page 281 |
| S-K 1300 Technical Report Summary | November 30, 2022 |
| | |
| • | An Atomic Adsorption Spectroscopy (AAS); |
| • | An ICP for the routine assay laboratory; |
| • | An ICP-MS for the environmental laboratory; |
| • | Other determination instruments such as pH and redox potential meters and experimental balances. |
The number of process operations and maintenance personnel is provided in Section 18.2.3.4.
| | |
| Arctic Project | Page 282 |
| S-K 1300 Technical Report Summary | November 30, 2022 |
| | |
The proposed Arctic mine is a greenfield site, remote from existing infrastructure. Infrastructure that will be required for the mining and processing operations will include:
| • | Truck workshop, truck wash, mine offices, mine dry facility and warehouse |
| • | Plant workshop and warehouse |
| • | Primary crushing building |
| • | Fine ore stockpile building |
| • | Process plant and laboratory |
| • | Concentrate loadout building |
| • | Reagent storage and handling building |
| • | Diversion and collection channels, culverts, and containment structures |
| • | Water treatment plants (WTPs) |
Figure 15-1 shows the proposed site layout and Figure 15-2 shows the proposed locations of the processing plant, truck workshop and mine offices (collectively referred to as the mine infrastructure area) and administration buildings.
| | |
| Arctic Project | Page 283 |
| S-K 1300 Technical Report Summary | November 30, 2022 |
| | |
| Figure 15-1: | Proposed Site Layout |

Source: Ausenco, 2022.
| | |
| Arctic Project | Page 284 |
| S-K 1300 Technical Report Summary | November 30, 2022 |
| | |
| Figure 15-2: | Proposed Location of the Processing Plant and Other Buildings |
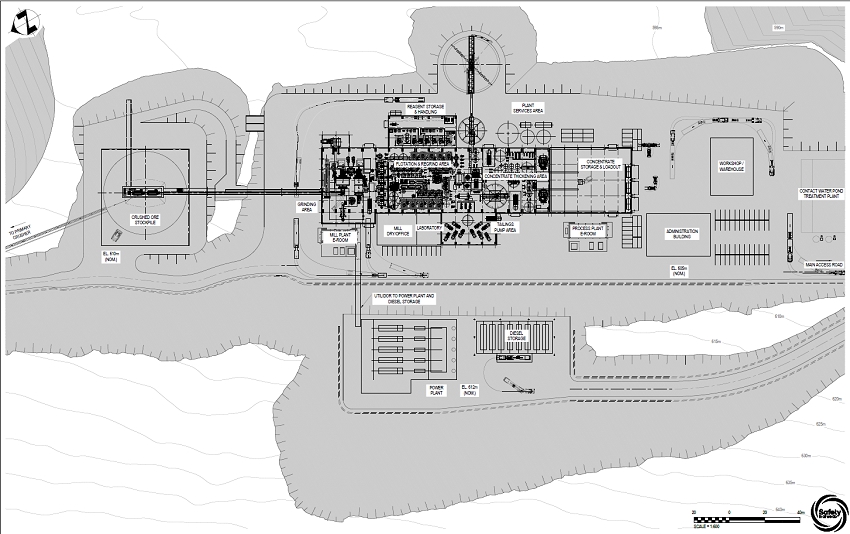
Source: Ausenco, 2022.
| | |
| Arctic Project | Page 285 |
| S-K 1300 Technical Report Summary | November 30, 2022 |
| | |
The Arctic Project site will be accessed through a combination of State of Alaska owned highways, a proposed AIDEA owned private AAP road, and proposed Trilogy-owned access roads.
| 15.2.1 | Ambler Mining District Industrial Access Road |
The Arctic Project assumes that the ADIEA will construct a road connecting the Arctic Project to the rest of Alaska’s transportation infrastructure. The access road is referred to as the AMDIAP or the AAP.
There is currently no road access to the Arctic Project area. Access to the Arctic Project area is proposed to be via the AAP road, which is approximately 340 km (211 miles) long, extending west from the Dalton Highway where it would connect with the proposed Arctic Project area. The AAP road will be permitted as a private road with restricted access for industrial use and received a Federal Record of Decision on July 23, 2020, by the Bureau of Land Management (BLM) and the National Park Service (Joint Record of Decision or JROD). Lawsuits were filed shortly thereafter by a coalition of national and Alaska environmental non-government organizations in response to the BLM’s issuance of the JROD for the AAP.
On January 6, 2021, BLM, the National Park Service and AIDEA signed Right-of-Way agreements giving AIDEA the ability to cross federally owned and managed lands along the route for the AAP approved in the JROD. During the second quarter of 2021, AIDEA signed a land access agreement with Doyon Limited to conduct feasibility and permitting activities to advance the AAP and in September 2021 AIDEA signed a land access agreement with NANA Regional Corporation, Inc. to conduct similar activities.
On February 22, 2022, the United States Department of the Interior (DOI) filed a motion to remand the Final Environmental Impact Statement (EIS) and suspend the right-of-way permits issued to AIDEA for the AAP and in mid-March, the BLM and DOI suspended the right-of-way grant and the right-of-way permit over federal lands.
On September 20, 2022, the BLM published in the Federal Register a Notice of Intent that it will prepare a Supplemental Environmental Impact Statement (SEIS) for the proposed Ambler Mining District Industrial Access Road. The BLM anticipates publishing a draft SEIS during the second quarter of calendar year 2023 and a final SEIS within the fourth quarter of calendar year 2023.
The lawsuits have been temporarily suspended pending the additional work to be performed by the BLM on the EIS.
Figure 15-3 shows the proposed route of the AAP road.
| | |
| Arctic Project | Page 286 |
| S-K 1300 Technical Report Summary | November 30, 2022 |
| | |
| Figure 15-3: | Proposed Route of AAP Road |
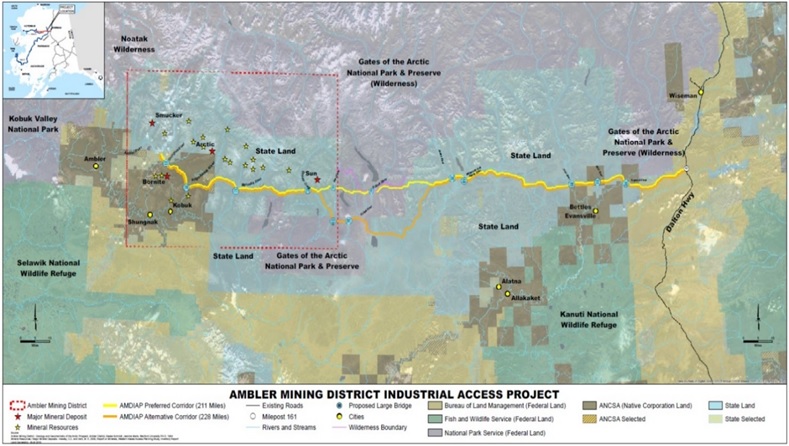
Source: Ambler Access Website, 2018.
| | |
| Arctic Project | Page 287 |
| S-K 1300 Technical Report Summary | November 30, 2022 |
| | |
The Arctic Project envisions the development of two access roads to support the proposed Arctic mine: a southern route that will connect the Dahl Creek airport to the AAP road, and a northern route that will connect the AAP road to the Arctic Mine, as seen in Figure 15-4. Development will include upgrading existing roads and trails and construction of new road segments where they currently do not exist. The roads will be designed to accommodate the types of vehicles expected to serve the intended mine and process plant operations.
The south route will be 21.4 km long and will be used to transport employees and air freight from the Dahl Creek airport to the Arctic mine. The first 17 km will generally follow the alignment of the existing road between the airport and the existing exploration camp. The remaining 4.5 km to the junction with the AAP road will require new construction.
The north route will be 22 km long and will support operations at the Arctic mine by transporting employees, mining equipment, supplies, and ore concentrate to and from the mine site. Approximately the first 8.8 km of the north route will be new construction across the Ambler lowlands. The remaining 13 km will upgrade an existing undeveloped summer/winter trail, including 7.7 km that extend up a narrow and steep valley to the Arctic mine site.
| | |
| Arctic Project | Page 288 |
| S-K 1300 Technical Report Summary | November 30, 2022 |
| | |
| Figure 15-4: | Arctic Access Road |
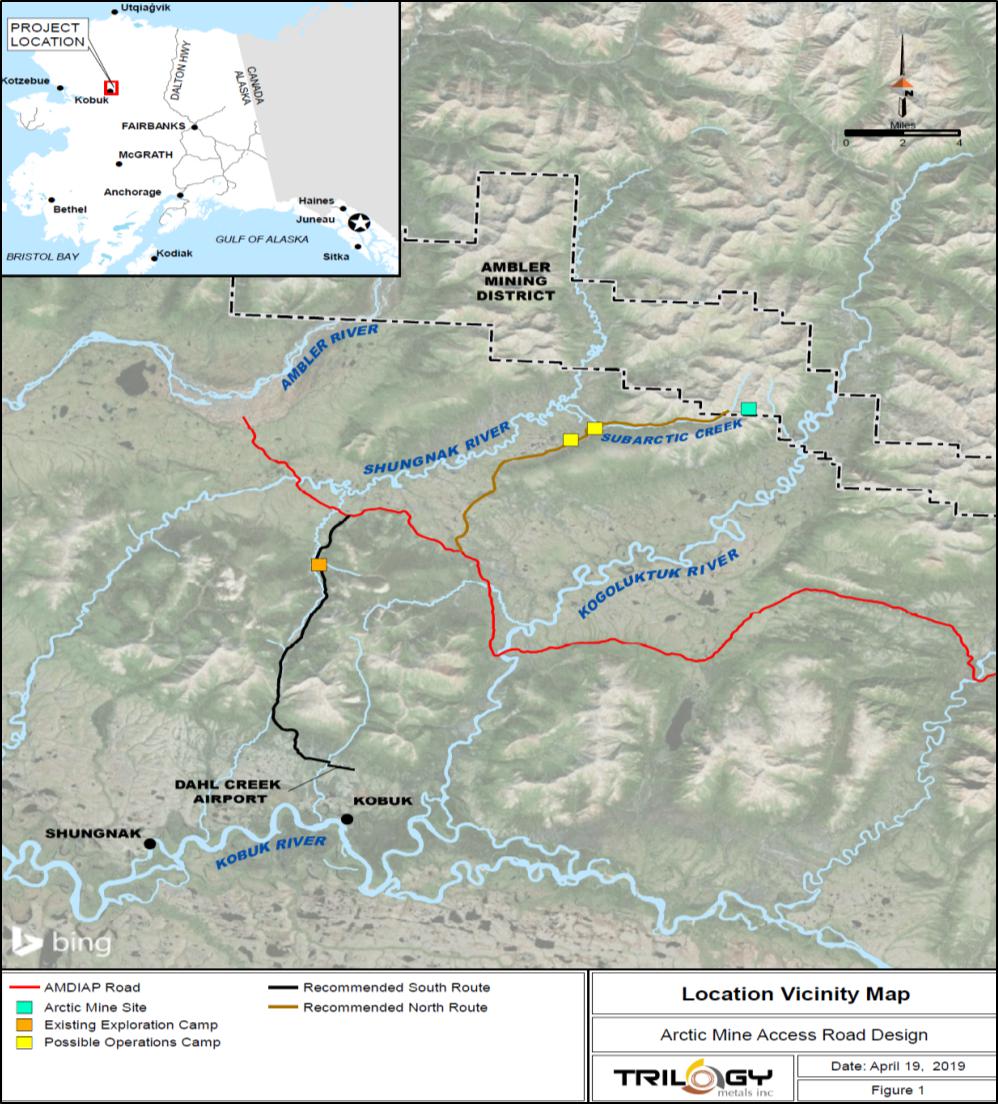
Source: Trilogy Metals, 2019.
| | |
| Arctic Project | Page 289 |
| S-K 1300 Technical Report Summary | November 30, 2022 |
| | |
The Dahl Creek airport is situated approximately 32 km south of the Arctic deposit. The airport would need to be upgraded with a lighting system and an automated weather observation system to be functional for Project purposes. These upgrades would support the use of Dash 8 aircraft for transporting crew to and from the Fairbanks International airport. The Dahl Creek airport is owned by the State of Alaska, and it is assumed that the upgrades would be accepted if funded by the Arctic Project.
New infrastructure that would be associated with the airstrip would include:
| • | Pre-fabricated 90 m2 passenger building to accommodate personnel waiting to depart the site. |
| • | Fabric structure approximately 175 m2 in area to accommodate snow-removal and aircraft service equipment. |
| • | Precision approach pathway indicators on each end of the runway to aid pilots in acquiring and maintaining the correct approach. |
| • | Local utilities such as generator power and water services. |
The Arctic Project will require the use of three different accommodation camps, with one remaining for permanent operations. Each camp will generally be self-contained and have its own power generation and heating capabilities, potable WTP (PWTP), garbage incineration and sewage treatment plant (STP).
| 15.4.1 | Bornite Exploration Camp |
The existing Bornite Camp, which is currently used for exploration, is envisioned to be utilized initially for the Arctic Project. The Bornite Camp can currently hold approximately 90 persons. The Bornite Camp will be used to support the initial construction of the Arctic Access Road, and for the initial construction camp. It is anticipated that the camp will be temporarily expanded with seasonal accommodations to allow for about 30 additional persons during construction. Any improvements or expansion will be based on the same airlift transportation logistics as currently utilized to support the Bornite Camp.
This initial Construction Camp (CC) will be constructed along the Arctic Mine Access Road approximately 8 km from the intersection of the AAP road and Arctic access road, across the road from the Arctic Mine Junction (AMJ) Logistics Yard. The camp will be constructed to provide room and board for 250 persons. The camp will be designed to operate 365 d/a, and of a modular type that can be transported to the site via the Dalton Highway on a semi-prepared AAP road route prior to full truck access being available to the site. The camp will be self-contained and will be integrated and operated as part of the Permanent Accommodations Facility (PAF). It is anticipated that the CC will be demobilized or shuttered upon the commencement of mill operations and the construction phase requirements completed. The transportation and construction of the CC will include the construction of the permanent PWTP, STP, and Garbage Incinerator that will be eventually used to support both the CC and PAF with a combined total occupancy of 650 persons.
| | |
| Arctic Project | Page 290 |
| S-K 1300 Technical Report Summary | November 30, 2022 |
| | |
| 15.4.3 | Permanent Accommodations Facility |
The PAF will be constructed on the same pad as CC. The PAF will be constructed when the AAP road is available for the transport of the modules, and the pad is upgraded for the permanent construction. The PAF will be located approximately 8 km from the intersection of the AAP road and Arctic access road, and 12 km from the process plant area. The PAF will be operating for approximately 2 years prior to the commissioning of the Arctic mill and production of concentrates. During this period, it will be used to accommodate both construction personnel and the initial Ambler Metals Mine Operations and support personnel required for pre-production mining.
An indicative breakdown of personnel onsite during operations is shown in Table 15-1.
| Table 15-1: | Personnel Onsite during Operations |
| Personnel Description | | Number of Personnel Onsite |
| Owner Personnel | | |
| General and Administration | | 30 |
| Mill Operations | | 47 |
| Mill Maintenance | | 101 |
| Mine Operations and Maintenance | | 135 |
| Contractor Personnel | | |
| Concentrate Trucking Contractor | | 21 |
| Camp Contractor | | 29 |
| Other Contractor | | 8 |
| Other Guests and Non-Employees | | 7 |
| Total Personnel | | 378 |
| 15.5 | Fuel Supply, Storage and Distribution |
Diesel will be stored onsite in double-walled steel tanks for use in the power plant at the processing facility and for use in the mine fleet vehicles with a capacity of 30,000 US gallons. A total of 12 horizontal tanks will be used, four tanks within the mine infrastructure area for mine fleet fuel requirements, and eight tanks adjacent to the power plant for generator fuel.
The volume stored at the mine infrastructure area will represent nine days of storage and the volume stored at the power plant will represent seven days of storage.
The plant power supply will be generated on site, with no utility interconnection. A total of five diesel generator sets will be installed to operate in parallel with four operating and one on standby. Each generator will be rated 13.8 kV, 5.5 MW, and the total power output capacity will be 21.6 MW excluding the redundant unit. All five generators will be housed within a shared power plant building; the area adjacent to the building has been left free to allow for addition of a sixth generator in the future if required.
| | |
| Arctic Project | Page 291 |
| S-K 1300 Technical Report Summary | November 30, 2022 |
| | |
The primary power distribution will be at 13.8 kV and will run via above ground cable trays to the area electrical rooms. There will be a total of four major electrical rooms, one of which will be part of the power plant building. The remaining three will be prefabricated modularized type buildings that will be shipped with all equipment pre-installed; these will be placed in the grinding, process and crushing areas. The smaller electrical room for the reclaim water barge will be supplied integral with the barge.
The total connected load for the plant will be 25.9 MW with a normal operating load of 21.0 MW.
| 15.8 | Surface Water Management |
The proposed mine development is in the upper reach of Subarctic Creek valley, a tributary of the Shungnak River. The combination of the climate, terrain, soils and sparse vegetation result in high runoff potential, especially in May and June when soils are still frozen.
The catchment area of Subarctic Creek is approximately 25.8 km2. All mine infrastructure and mine affected water is within the Subarctic Creek valley. A surface water management system will be constructed to segregate contact and non-contact water. Non-contact water will be diverted around mine infrastructure to Sub-Arctic Creek. Contact water will be collected and treated prior to discharge to Subarctic Creek.
The objectives of the water management system are to:
| • | Ensure sufficient water quantity is available to support processing. |
| • | Manage contact and non-contact water separately to minimize volume of contact water collected on site. |
| • | Collect and treat contact and high-sediment water that could otherwise impair the water quality of the receiving streams. |
| • | Protect mine infrastructure from damage of unmanaged run-off. |
| • | Reduce suspended solid loading in surface runoff prior to discharge. |
| • | Store process water to provide for mill water needs |
Water on site will be managed as one of the following:
| • | Non-contact water: non-contact water will be diverted away from mine infrastructure to the extent possible to reduce infiltration into the WRF, TMF inflows, and pit inflows. Non-contact water will be discharged to Subarctic Creek during operations and closure. |
| • | Contact water: Contact water will be generated when precipitation or run-on comes in contact with mine waste rock, tailings or is collected in the pit. Contact water is treated prior to discharge to Subarctic Creek. |
| • | High-sediment water: High-sediment water (i.e., surface flows from pads and topsoil stockpiles) is collected and conveyed to downstream ponds to treat prior to discharge in Subarctic Creek, during operations and closure. |
Figure 15-5 and Figure 15-6 illustrate the water management plan for the initial construction phase and the LOM footprint of the Arctic Project.
| | |
| Arctic Project | Page 292 |
| S-K 1300 Technical Report Summary | November 30, 2022 |
| | |
| Figure 15-5: | Surface Water Management Plan During Operations (Year 2) |
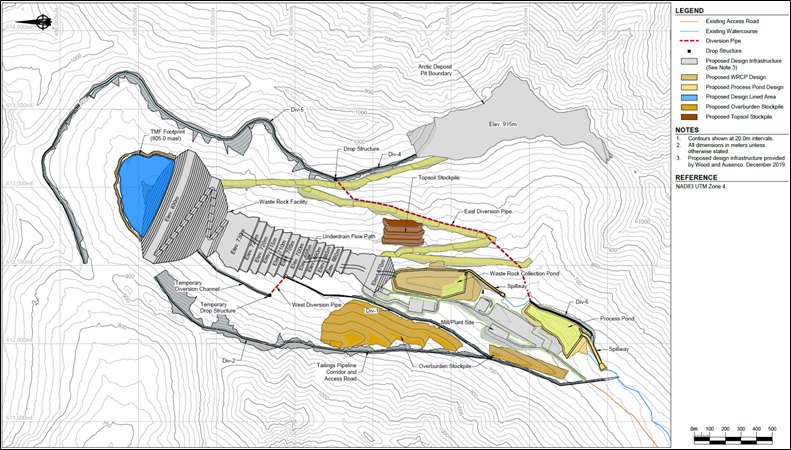
Source: SRK, 2022.
| | |
| Arctic Project | Page 293 |
| S-K 1300 Technical Report Summary | November 30, 2022 |
| | |
| Figure 15-6: | Surface Water Management Plan at the End of LOM (Year 13) |

Source: SRK, 2022.
| | |
| Arctic Project | Page 294 |
| S-K 1300 Technical Report Summary | November 30, 2022 |
| | |
| 15.8.1 | Process Water Supply |
Process water, gland water, and reagent make-up water will be supplied from the Process Pond and TMF reclaim. Additional process water will be supplied from the WRCP to the TMF through the winter months to meet mill water demands and provide water stored in the TMF as a contingency for dry years. Table 15-2 summarizes mill water supply throughout the year. The TMF dam, WRCP, and Process Pond will be constructed prior to the processing of ore. A water volume of 1.6 Mm3 will be collected in the TMF prior to operations to supply the mill during start-up. Water that accumulates in the WRCP during construction may need to be treated for suspended solids by a temporary water treatment system.
| Table 15-2: | Process Water Supply Summary |
| Months | Supply Source | Comments |
| January to April | Process Pond, TMF reclaim water and WRCP | Water from the WRCP is pumped to the TMF from January to April. This water is accumulated from groundwater flows during the winter months. |
| May to December | Process Pond and TMF reclaim water | No WRCP water is pumped to the TMF. From May to December WRCP water is treated and discharged to Sub-Arctic Creek. |
| 15.8.2 | Water Management Infrastructure |
Stormwater will be managed within the Arctic Project boundaries by capturing and conveying contact and high sediment water for treatment and diverting non-contact water away from developed areas. Water conveyance and storage facilities proposed include the following structure types:
| • | Diversion and collection channels. |
| • | Drop structures, diversion pipes and culverts. |
Soils found within the Arctic Project limits consist of alluvial sands and gravels, with limited fines. Runoff from the overburden stockpile and mill site areas should be mitigated by temporarily seeding or using material to create durable less erodible surfaces to prevent or reduce erosion. In addition, water could be recirculated into the TMF or mill flow stream in extreme circumstances. Sediment that accumulates in the Process Pond will be removed periodically to maintain the design capacity.
| 15.8.2.1 | Diversions and Collection Channels |
The steep mountainous terrain and compact development footprint will require additional geotechnical and geochemical studies to confirm soil and bedrock depths along the proposed conveyance alignments and acid rock drainage/metal leaching potential. Bedrock is expected to be relatively shallow creating challenges for construction, however shallow bedrock may increase the collection efficiency of surface and shallow sub-surface water interception. In addition, construction of channels within bedrock may eliminate the need for riprap protection while reducing potential seepage through soils in the channel bottom.
| | |
| Arctic Project | Page 295 |
| S-K 1300 Technical Report Summary | November 30, 2022 |
| | |
Diversion channels will be constructed around the perimeter of the TMF and WRF, above the overburden stockpiles, and above the mill site infrastructure area. The channels will convey non-contact water runoff to Subarctic Creek. Runoff from haul roads is anticipated to be managed within the road footprint via roadside ditches with runoff reporting to the WRCP. The main purpose of the diversion channels is to reduce the amount runoff contacting mined materials. The diversion of non-contact water will reduce water treatment costs, and storage volume requirements. Channel construction will be phased during the construction period, and prior to commencement of mining to maximize non-contact water diversion.
Non-contact and contact water diversions are designed to convey the peak flow from a 100-year 24-hour rain-on-snow event. All channels will have a minimum depth and width of 1.0 m with lining either consisting of bedrock or riprap to provide erosion protection. Riprap will be sized to provide a stable non-erodible conveyance route, with riprap of reasonable size sourced locally on-site (max median particle size, D50 ≤ 300-450 mm). The riprap thickness is specified at two times the D50 and will be placed on geotextile fabric to limit erosion below the armour and reduce sediment loading downstream. Channel depths will include a minimum freeboard of 0.3 m above the design peak flow depth to accommodate potential ice or sediment accumulation, unforeseen climatic events, or other uncertainties.
A 4-m wide access road will be located adjacent to each of the channels to provide access during construction and then for maintenance and cleaning of ice and sediment accumulation during operations and closure.
Localized seeps are anticipated to be encountered along the alignments during construction. A thorough survey prior to development of engineered design is required to identify areas of potential seep locations and accommodate mitigation measures as needed. Seepage collection and management may require widening of channels in the immediate area to allow for ice build-up during the late fall as conditions change from flowing to frozen water, or to intercept and manage subsurface flowing water within talus slopes. Maintenance of these seeps during the winter could prove challenging during freeze-up and prior to freshet. Prior to freshet flows, channel maintenance will be critical to ensure that adequate freeboard is available, and run-off is contained within the channels.
Culverts will be required to manage contact water intercepted on the haul roads, and to pass diverted non-contact water through access and haul road corridors. The haul road corridors will traverse the hillside above the WRCP, between the pit and the WRF. The switch-backing layout of the haul roads will present a challenge to manage contact water for each of the small catchment areas, which will change throughout the project life. However, the location of the WRCP immediately down slope of the haul road corridor will allow for contact water to be collected in roadside channels and discharge downslope towards the WRCP for collection. The location and sizing of the culverts along the haul road should be incorporated into the haul road design. A small allowance has been included in the capital expenditures for culvert construction.
A major pipe structure (the eastern diversion pipe) will be located above the haul road corridors on the eastern edge of the Arctic Project. This pipe will collect and convey non-contact water collected upslope of diversion channels DV-4 and DV-5 and discharge into Subarctic creek via DV-6 through the Process Pond spillway. Concrete inlet or drop structures will be constructed at the terminus of the channels connecting to the diversion pipe.
A temporary diversion channel and pipe (upper reaches of DV-1) will be constructed during the pre-operations period on the western boundary of the WRF. The temporary diversion channel will terminate in an excavated sump, pre-cast manhole or constructed concrete manhole. A pipe will be installed in the sump/manhole conveying water immediately downslope into a receiving channel. The temporary diversion channel pipe, and sump will be buried at the end of the pre-operations period. The temporary channel will be breached periodically at the boundary of the WRF to prevent contact water entering the non-contact water system downstream.
| | |
| Arctic Project | Page 296 |
| S-K 1300 Technical Report Summary | November 30, 2022 |
| | |
All pipe structures are designed to accommodate the 100 year, 24-hour rain-on-snow event. The culverts will be trenched in and backfilled with engineered fill. Diversion pipes located on hillsides will be stabilized by burial or mounding of soils sourced in the immediate area, trenching and backfill, or placed on a prepared bed and secured with concrete thrust block anchors if bedrock depths prevent conventional trenching or burial anchors. All pipes will discharge onto a stabilized rip-rap apron to reduce erosion potential.
| 15.8.2.3 | Collections Ponds |
Contact and high sediment water will be routed to the WRCP. Water collected in the WRCP will be pumped to the WTP or TMF for use as mill make-up water. Water collected in the Process Pond will be used as make-up water to the mill.
| 15.8.3 | Waste Rock Collection Pond |
The WRCP will be located directly below the toe of the WRF. The pond will collect seepage from the WRF, runoff from the WRF and haul road corridor area, runoff from the ore stockpile on the ROM pad, and water pumped from the pit. The pond is sized to store the 100-year, 24-hour rain-on-snow storm volume plus two days of average snow melt runoff and operational volume. The pond capacity will be approximately 700,000 m³ to the spillway invert of 640.5 masl with a crest height of 642 masl.
Water from the WRCP will be pumped to the TMF for reuse as process water or to the treatment plant to be treated and discharged to Sub-Arctic Creek. The WTP operates from May to December during operations but may be operated year-round if needed during extreme water years.
The dam will be constructed using overburden and bedrock material from the WRCP footprint or a suitable borrow source. Excess overburden will be stockpiled for use during closure activities.
Overburden material below the footprint of the dam will be removed and backfilled with well drained soils (as needed) to provide foundation stability. The excavation limit and dam foundation design requires additional geotechnical investigation. The design presented assumes all material upstream of the embankment centreline will be excavated to bedrock and material downstream excavated to suitable soils. The embankment will be constructed in 300 mm lifts, or as determined by the engineer. The downstream face of the dam will be constructed to 3H:1V while the upstream face will be 2.5H:1V. The upstream face of the pond will be lined with a geomembrane liner connected to a concrete plinth (curb) and grouted curtain wall to maximize interception of surface water and shallow groundwater.
A concrete-lined spillway will be constructed to manage flows up to the potential maximum flood (PMF) event. The spillway will include an intake weir and collection throat prior to discharging in the spillway. A stilling basin will be located at the outfall of the spillway, to reduce flows to non-erosive velocities. The spillway length could be reduced by using one of various methods of energy dissipation within the channel; however, energy reduction in the channel generally requires additional depth of flow, resulting in larger concrete requirements. The construction cost would likely be similar. A riprap-lined spillway was investigated; however, steep terrain, lack of geotechnical information, and the channel configuration would likely result in a large costly excavation that could encroach on the haul road located up-slope of the WRCP.
Figure 15-7, Figure 15-8, and Figure 15-9 illustrate the proposed design of the WRCP and process water pond.
| | |
| Arctic Project | Page 297 |
| S-K 1300 Technical Report Summary | November 30, 2022 |
| | |
| Figure 15-7: | WRCP and Process Pond Plan |
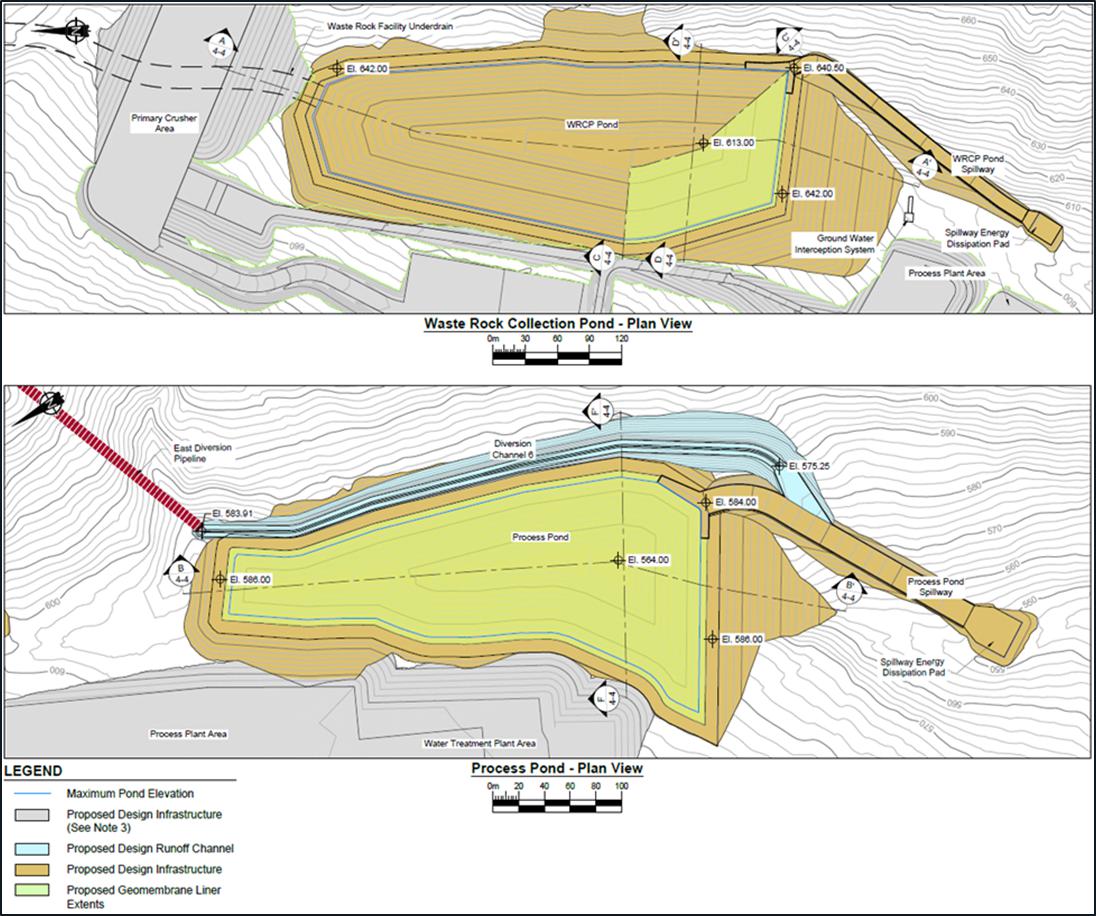
Source: SRK, 2022.
| | |
| Arctic Project | Page 298 |
| S-K 1300 Technical Report Summary | November 30, 2022 |
| | |
| Figure 15-8: | WRCP and Process Pond |
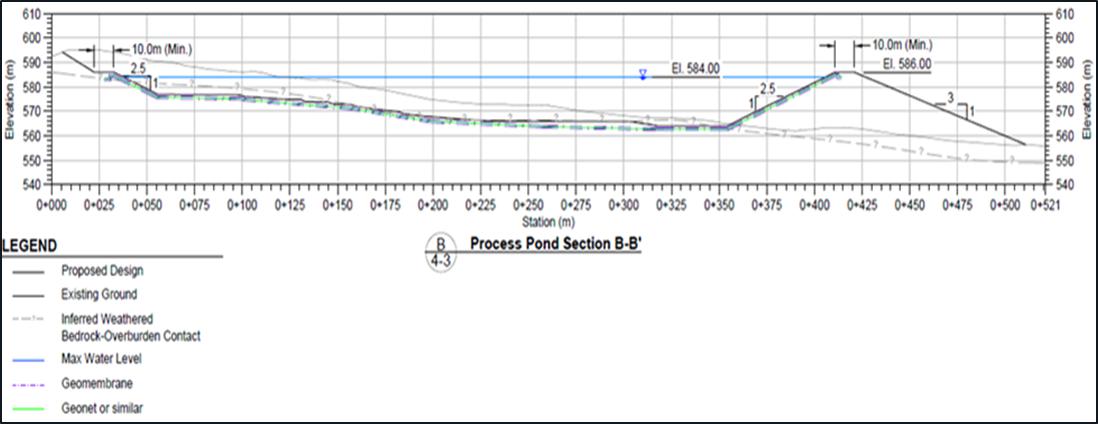
Source: SRK, 2022.
| Figure 15-9: | WRCP and Process Pond |

Source: SRK, 2022.
| | |
| Arctic Project | Page 299 |
| S-K 1300 Technical Report Summary | November 30, 2022 |
| | |
The Process Pond will be located directly below the process plant. The pond will retain water from the tailings thickener overflow for a minimum of 10 days. The pond capacity will be approximately 300,000 m³ to the spillway invert of 584 masl with a crest height of 586 masl.
The dam will be constructed using the overburden and bedrock material stripped from within the Process Pond footprint or a suitable borrow source. Excess overburden will be stockpiled for use during closure activities.
Overburden material below the footprint of the dam will be removed and backfilled with well drained soils (as needed) to provide foundation stability. The excavation limit and dam foundation design requires additional geotechnical investigation. The design presented assumes all material upstream of the embankment centerline will be excavated to bedrock and material downstream excavated to suitable soils. The embankment will be constructed in 300 mm lifts, or as determined by the engineer. The down-stream face of the dam will be constructed to 3H:1V while the upstream face will be 2.5H:1V. The pond will be lined to crest level with 80-mil primary and 60-mil secondary LLDPE geomembrane liners. A geonet or similar drainage layer will be installed above the secondary liner to convey any leak through the primary liner to a leak collection and recovery sump (LCRS). An underdrain will be constructed beneath the process pond to convey any shallow groundwater below the pond and prevent liner uplift.
A concrete-lined spillway will be constructed to manage flows up to the potential maximum flood (PMF) event. The spillway will include an intake weir and collection throat prior to discharging in the spillway. A stilling basin will be located at the outfall of the spillway, to reduce flows to non-erosive velocities. The spillway length could be reduced by using one of various methods of energy dissipation within the channel; however, energy reduction in the channel generally requires additional depth of flow, resulting in larger concrete requirements. The construction cost would likely be similar. A riprap-lined spillway was investigated; however, steep terrain, lack of geotechnical information, and the channel configuration would likely result in a large costly excavation that could encroach on the haul road located up-slope of the WRCP.
| 15.8.5 | Groundwater Management System |
Results from the preliminary water and load balance model suggest that small amounts of groundwater could bypass the WRCP, and a cut-off wall may need to be constructed to prevent degradation of water quality in Subarctic Creek. A groundwater interception system was designed downgradient of the WRCP. This system would include:
| • | Shallow collector trench across the Sub-Arctic valley bottom for overburden water. |
| • | Small diameter collector pumping wells completed in bedrock for deep water bypass. |
| • | Downgradient performance monitoring wells with completions in overburden, weathered bedrock and competent bedrock. |
A second system located downgradient of all site water management infrastructure was included as a contingency for the closure period, when the open pit contains water and leakage from mine components could bypass the primary system. This system includes small diameter collector pumping wells completed in bedrock, and downgradient performance monitoring wells.
Groundwater management system operation would be guided under an adaptive management plan or trigger action response plan.
| | |
| Arctic Project | Page 300 |
| S-K 1300 Technical Report Summary | November 30, 2022 |
| | |
| 15.8.6 | Site Water and Load Balance |
The water balance model is based on the current water management plan and was used to predict water use, surpluses, and deficits for the site and mine water management infrastructure (TMF reclaim pond, Process Pond, and WRCP) over the 13-year mine life through to closure and post-closure. Mine facility footprints vary according to the mine plan over the LOM. The model evaluated the following hydrological conditions:
| • | Average hydrological conditions with mean annual precipitation of 1,219 mm/a over the LOM. |
| • | Consecutive 1-in-25 year wet years with annual precipitation of 1,816 mm/a in years 12 and 13. |
| • | Consecutive 1-in-25 year dry years with annual precipitation of 743 mm/a in years 12 and 13. |
The load balance integrated source terms with the water balance. Source terms define the water chemistry of each water type. For potentially acid generating materials in the WRF and pit, two source terms were developed:
| • | Operations source terms prior to onset of acid generation. |
| • | Closure source terms post-onset of acid generation. |
PAG waste rock was assumed to generate acid at closure. This change in source terms increased the mass leaching from the WRF and pit during closure.
New and existing source terms will need to be updated to incorporate the revised water management plan and updated hydrology assessment. Loading from sources requiring updates are estimated to contribute less than 20% of the total load to the WTP for constituents of concern during operations and Phase 1 of closure but may account for up to 25% to 60% of the total load to the WTP in Phase 2 of closure. This indicates the model may underpredict WTP influent concentrations in Phase 2 of closure. Subsequent revisions of the model will incorporate updated source terms.
Constituent mass loads and flows were mixed to estimate concentrations at various locations on the site and in the receiving environment. Contact water will be treated to the Alaskan Water Quality Standards (WQS; 18 AAC 70), as described in Alaska Water Quality Criteria Manual for Toxic and Other Deleterious Organic and Inorganic Substances (ADEC 2008) prior to being discharged to Subarctic Creek.
The results from the water and load balance indicate that during operations, excess water from the WRCP will need to be treated prior to discharge to the receiving environment. During closure, the WRCP and water from dewatering of the TMF will be pumped to the pit and will also need to be treated for selenium and other constituents prior to discharge to the receiving environment (see description in Section 17.3).
| 15.9 | Water Treatment Plant |
The results from the water and load balance were used to develop a water treatment strategy. The treatment processes were defined based on the approximately 25 parameters predicted in the load balance to be present in WTP influent at peak concentrations above their WQS in the Subarctic Creek or the Shungnak River, including pollutants with a range of treatment mechanisms—cationic metals (such as cadmium and copper), anions (sulphate, fluoride), forms of nitrogen (ammonia, cyanide, and nitrate), selenium, other oxyanions (such as arsenic), and temperature.
| | |
| Arctic Project | Page 301 |
| S-K 1300 Technical Report Summary | November 30, 2022 |
| | |
Key aspects of the selected water management overall approach include:
| • | Assume the site will be assigned water quality-based effluent limits matching the state’s WQS for the nearby Creek or River. Therefore, design the WTP to treat to all parameters to the WQS applicable to Subarctic Creek, so that site is not reliant on receiving a permit allowing a mixing zone for compliance. |
| • | Provide a single WTP, built in stages. |
| o | The WTP will initially consist of a chemical/physical plant with reverse osmosis (RO). In the Operations phase, when the TMF is in use, the RO reject will be sent to the TMF, and only RO permeate will be discharged to the Creek. The plant will include: |
| ■ | Chemical treatment: Includes addition of caustic, soda ash, ferric chloride, and polymer into mixed reactor tanks. Solids formed are then settled out and removed in a clarifier. This step removes a significant portion of cationic metals such as cadmium and zinc. Liquid chemicals will be stored in tanks; soda ash will be stored in silos. |
| ■ | Ultrafilter: Protects the RO system by removing suspended solids carrying over from the chemical treatment system. |
| ■ | RO: Concentrates contaminants into the RO reject stream. Permeate water quality will be within WQS. |
| ■ | Reconstitution: RO permeate is reconstituted prior to discharge to Subarctic Creek. A calcite contactor tank dissolves carbonate into the discharge water to maintain alkalinity greater than 20 mg/L as calcium carbonate. Caustic and hydrochloric acid are provided as needed for pH adjustment. |
| o | When the TMF is closed at the end of the Operations phase, a biological/chemical/physical plant will be added to treat the RO reject. This phased approach provides multiple benefits, including allowing time to gain insight on the site’s true wastewater flow and quality so that the RO reject treatment design can be improved upon. This treatment train will include: |
| ■ | Gypsum clarifier: Reduces sulphate concentration in the reject treatment stream train to the gypsum saturation limit by adding lime stored in silos. The system will also remove cationic metals such as cadmium and zinc. |
| ■ | Anaerobic biological treatment: Biochemically reduces nitrate to nitrogen gas and selenate and selenite to elemental selenium (a solid). Selenium and metal solids removed in the sludge are settled out and removed by the biological ballasted clarifier. |
| ■ | Aerobic biological treatment: Polishes residual organics added in the upstream anaerobic biological treatment. Solids are separated via a membrane filter with iron coprecipitation for polishing selenium. |
| o | During the Closure phase, the WTP will either be run year-round or for partial year based on water storage requirements. During the Operations phase, mill water demands will affect site water flows such that the WTP can be shut down and the discharge eliminated during roughly half of the year (winter). |
| o | During Operations, sludge from the WTP will be disposed of at the TMF. During Closure, sludge from the WTP will be disposed in filter bags on a lined area which will decant solution back to the pit. |
| • | This WTP will operate in perpetuity. |
| | |
| Arctic Project | Page 302 |
| S-K 1300 Technical Report Summary | November 30, 2022 |
| | |
| 15.10 | Tailings Management Facility |
| 15.10.1 | General Description |
The TMF will be located at the headwaters of Subarctic Creek, in the upper-most portion of the creek valley (refer to Figure 15-6). The maximum storage capacity of the facility will be about 40.7 Mm³ (tailings and process water) at an elevation of 889.5 m plus an additional 2.5 m of freeboard. The 59 ha footprint of the TMF will be fully lined with a geomembrane liner.
Tailings containment will be provided by an engineered dam, buttressed by the WRF constructed immediately downstream of the TMF, and the natural topography on the valley sides. A starter dam will be constructed to elevation 805 m two years prior to mine start up and then increased to 830 m by the end of the construction period. Three subsequent raises will bring the final dam crest elevation to 892 m, which is 98 m lower than the final elevation of the WRF. The expected maximum tailings production rate is 8,900 t/d and the TMF is designed to store approximately 37.4 Mm3 (41.2 Mt) of tailings over the 13-year mine life, 3.3 Mm3 of additional pond water, as well as 1.5 times the probable maximum flood (PMF). Instruments installed in the tailings dam are anticipated to include piezometers, settlement monuments, and shape arrays.
Tailings will be deposited as thickened slurry from the dam crest by multiple spigots. In the winter, other deposition methods, such as subaqueous deposition and/or single point discharge, may be needed to minimize ice entrainment in the tailings. At the time of this report, detailed laboratory analysis of thickened tailings is underway. For this report, a dry density of 1.1 t/m3 was used to estimate the storage capacity of the facility. The final consolidated tailings dry density is assumed to be 1.25 t/m3 based on simple 2 D consolidation calculations (SRK 2020). To further reduce the duration of tailings consolidation, a drainage system should be evaluated, that would be installed above the TMF liner, convey seepage from the tailings to a sump at the upstream toe of the TMF dam, and then pump the seepage into the reclaim water system.
The basis of the TMF design is provided in Table 15-3. Values were determined from project-specific information, judgment, and experience with other projects.
The TMF design was performed in accordance with the following guidelines, standards, and regulations:
| • | Guidelines for Cooperation with the Alaska Dam Safety Program, July 2017. |
| • | Alaska Administrative Code Title 11, Chapter 93, Article 3 Dam Safety. |
| • | State of Alaska Mining Laws and Regulations, Alaska Department of Natural Resources Division of Land and Water, 2014. |
| • | Canadian Dam Association, 2019. Technical Bulletin: Application of Dam Safety Guidelines to Mining Dams. |
| • | Global Industry Standard on Tailings Management (GISTM), 2020. |
| | |
| Arctic Project | Page 303 |
| S-K 1300 Technical Report Summary | November 30, 2022 |
| | |
| Table 15-3: | TMF Design Parameters and Design Criteria |
| Design Item | Criteria | Reference |
| Operational life of TMF | 13 years | Wood |
| Total tailings | 41.2 Mt | Wood |
| Annual tailings production (solids) | 3 Mm3/a | Wood |
| Tailings percent solids (in the slurry pipeline) | 47% (Ms/(Ms+Mw)) | Ausenco |
| Tailings solids specific gravity | 3.0 | SRK |
| Tailings settled dry density | 1.1 t/m3 | SRK |
| Expected tailings deposition angles* | 1.0 % | SRK (2020) |
| Tailings deposition | Spigots from dam crest (summer) | SRK |
| Target tailings storage requirement | 37.4 Mm3 | SRK |
| Dam hazard classification | Class I | ADSP (2017) |
| Minimum freeboard above tailings | 2.5 m | SRK |
| Tailings dam crest width | 30 m | SRK |
| Tailings dam max elevation (height) | 892 masl (192 m) | SRK |
| Design earthquake return period and ground motion | 1:10,000 year, PGA = 0.374 | ADSP (2017), GISTM (2020) |
| Stability Factors of Safety (FOS) (minimum) | 1.0 (pseudostatic) to 1.5 (static) | CDA (2019) |
| Maximum allowable seismic displacement | 0.5 m | SRK |
| Dam construction materials | Waste rock compacted in 1 m lifts | SRK |
| Dam downstream and upstream slopes | 2.5H:1V (maximum) | SRK |
| Starter dam storage capacity (elevation) | 1.5 Mm3, Year -1, (805 masl) | SRK |
| End of construction capacity (elevation) | 6.5 Mm3, Year 0, (830 masl) | SRK |
| Dam Raise 1 storage capacity (elevation) | 13.9 Mm3, Year 1, (850 masl) | SRK |
| Dam Raise 2 storage capacity (elevation) | 24.8 Mm3, Year 4, (870 masl) | SRK |
| Dam Raise 3 storage capacity (elevation) | 40.7 Mm3, Year 7, (892 masl) | SRK |
| Storm inflow design flood without overtopping | 1.5 x Probable Maximum Flood (PMF) | SRK, ADSP (2017), GISTM (2020) |
Notes: *Values from 2020 Trilogy Feasibility Study, based on whole slurry tailings.
The design criteria were based on site conditions as of August 2019, on assumptions interpreted from review of available information, and on pre-feasibility-level field investigations and associated reporting. Where data were not available, pre-feasibility-level assumptions were made.
| 15.10.3 | Overburden Geotechnical Investigation |
An overburden geotechnical investigation was carried out in 2017 (SRK, 2017) and 2018 (SRK, 2018) to provide overburden characterization in support of waste facility siting evaluation and geotechnical design of the WRF and TMF.
| | |
| Arctic Project | Page 304 |
| S-K 1300 Technical Report Summary | November 30, 2022 |
| | |
Surficial deposits mapped in the project area include glacial, aeolian, and fluvial deposits, with colluvium-covered slopes. Most morainal deposits at the site are from the late Pleistocene Walker Lake glaciation, and consist of drift deposits characterized by boulders, cobbles, and gravels in a fine-grained matrix, as well as outwash deposits of silty sand. The Subarctic Creek valley mainly consists of well-graded silty sand and gravel colluvium and alluvium, with some zones of large cobbles and boulders. Overburden thickness within the Subarctic Creek valley generally increases down-valley towards the Shungnak River valley.
In the proposed TMF and starter dam footprints, groundwater was encountered during drilling and test pitting at depths between 0.2 and 4.9 m. Groundwater was encountered at depths between 6 and 21 m below ground in the bedrock around the perimeter of the TMF. Based on groundwater elevation records in these areas, the planned facilities will be located in groundwater recharge zones.
In the planned WRF footprint, groundwater was encountered during drilling and test pitting at depths between 0.8 m and 13.5 m. Groundwater levels are generally near the surface on the western and central parts of the footprint and deeper on the eastern side of the footprint. Drill holes on both sides of the valley appear to be located in groundwater recharge zones. The center of the valley may correspond to both recharge and discharge zones.
The groundwater depth within the footprint of each planned infrastructure within the Subarctic Creek valley is relatively shallow. The average groundwater depth is 1.5 m and seems to correspond to the weathered bedrock–overburden contact. The water depth seems to be relatively constant despite varying surface slope angles.
The TMF site was selected in August 2017 during a workshop (Ausenco 2017) to evaluate locations for the TMF and WRF.
A weighting system was applied to four broad categories including environmental concerns, permitting, capital costs, and operating costs.
The site was reviewed again in 2021 during a tailings alternative review and found to be the preferred alternative. This work included a thorough review of the GISTM (2020) and the review found the proposed design to be compliant with GISTM.
Overburden in the TMF starter dam area is characterized as thin well-graded silty sand with gravel or silty gravel with sand (SM or GM). The contact with the underlying fractured weathered bedrock occurs at depths varying between 0.2 and 3.1 m in the TMF and between 1.0 and 9.1 m in the starter dam area. The thicker overburden occurs in the center of the valley, south of the toe of the starter dam. The overburden is interpreted to be colluvial in origin. Bedrock crops out at the north end of the TMF.
The overburden will be excavated underneath the footprint of the starter dam and removed to reduce potential settlement and deformation of the TMF dam; overburden removal will therefore reduce the potential for underperformance of the liner that will be installed on the dam’s upstream face.
The topsoil and overburden material will be stockpiled below the pit and WRF, respectively, for use in future reclamation of the waste facilities.
| | |
| Arctic Project | Page 305 |
| S-K 1300 Technical Report Summary | November 30, 2022 |
| | |
The starter dam will be constructed in two phases to an ultimate lined elevation of 830 m, which will allow for storage of the pre-production water and approximately one year of storage (~1.6 Mm3) to supply the mill during start-up. The upstream and downstream faces of the starter dam will be constructed at 2.5H:1V and constructed entirely of waste rock from the open pit. Waste rock will be placed in 1 m lifts and compacted by the mine fleet haul trucks. Figure 15-10 shows a cross section through the complete TMF and WRF, illustrating the starter dam in relation to the final dam and the downstream WRF.
The TMF footprint and the upstream face of the dam will be lined with a textured geomembrane, placed over geotextile on prepared subgrade. To prepare for liner installation, the TMF area will be cleared, grubbed, and stripped of topsoil prior to grading and placement of the geotextile. The face of the dam will be covered with bedding material to protect the liner against puncture from potential sharp edges in the waste rock.
| | |
| Arctic Project | Page 306 |
| S-K 1300 Technical Report Summary | November 30, 2022 |
| | |
| Figure 15-10: | Cross Section of the TMF & WRF showing Starter Dam to Elevation 805 m |
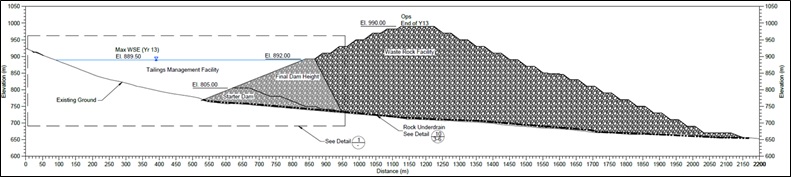
Source: SRK, 2022.
| Figure 15-11: | Cross Section of the TMF and Raises to Final Design Evaluation |

Source: SRK, 2022.
| | |
| Arctic Project | Page 307 |
| S-K 1300 Technical Report Summary | November 30, 2022 |
| | |
| 15.10.6 | Dam Raises and Final Dam |
Three dam raises will be completed to reach the final dam height of 892 m. The construction for these raises will be completed in Years 1, 4, and 7 to elevations 850 m, 870 m and 892 m respectively. Construction will be completed using the downstream method and will connect the structural fill in the tailings dam with the uncompacted WRF. Tailings deposition will be required from the perimeter of the TMF during the construction sequence of the dam crest. The dam crest will be constructed to a width of 30 m at the end of each construction campaign.
An upstream slope of 2.5H:1V will be maintained throughout the construction of the dam to facilitate the placement of the bedding layer and the installation of the liner. The downstream portion of the dam will about the WRF at each stage of dam raising. Construction material for the dam will be waste rock compacted in 1 m lifts.
Additional liner will be placed within the expanded TMF footprint using the same procedures as for the initial starter dam. The TMF area will be cleared, grubbed, and stripped, and bedding material and geotextile placed prior to the geomembrane being laid down and seamed to the existing liner.
Figure 15-11 shows a cross section of the complete TMF and the raises constructed to reach the final design elevation.
| 15.10.7 | TMF Water Pool and Water Return |
Under normal situations, the pool will be maintained deeper towards the north portion of the TMF away from the deposition spigots. Recycle water will be obtained using a floating barge and pipeline system situated on the pool.
Tailings deposition in winter will be managed to limit ice formation in the tailings, for example, by subaqueous deposition and/or single point discharge of the tailings.
Thickened tailings may necessitate modification of pond and deposition management.
| 15.10.8 | Tailings Delivery and Return Systems |
The tailings delivery system will transport slurried tailings from the processing plant to the TMF. This will consist of one three-kilometre pipeline, with two kilometres of this being 500 mm (20 inch) diameter carbon steel rubber lined pipeline and the remaining one kilometre being 600 mm (24 inch) HDPE. This pipeline will transport up to 1,843 m3/h of tailings to the TMF.
The return water delivery system for recycle water from the TMF has been sized on the basis of 1,308 m3/h of water being pumped from the TMF to the process water pond. This system will consist of a barge pump and a 3 km-long pipeline, run adjacent to the tailings pipeline. The pipeline will consist of 2 kms of 450 mm (18 inch) diameter carbon steel pipeline, with the remaining 1 km being 500 mm (20 inch) HDPE.
Both pipelines will be heat-traced to prevent freezing.
| 15.11 | Waste Rock Facility and Overburden Stockpiles |
The WRF will be developed north of the planned Arctic pit in the upper part of the Subarctic valley. The waste rock placed in the northernmost portion of the WRF will be compacted to provide structural fill for the TMF.
| | |
| Arctic Project | Page 308 |
| S-K 1300 Technical Report Summary | November 30, 2022 |
| | |
There will also be three stockpiles to store the stripped topsoil and overburden from the TMF footprint.
| 15.11.1 | Waste Rock Facility |
The overburden in the WRF area is characterized as well-graded silty sand with gravel or silty gravel with sand (SM or GM) and angular cobbles interpreted to be colluvial in origin. Overburden is slightly thicker on the west side of the valley (± 10 m) than on the east side of the valley (± 6 m), and ranges between 3.0 and 5.6 m in the centre of the valley. Based on exposed bedrock, overburden is inferred to thin on the valley sides.
The total volume of waste rock is expected to be 162.6 m3 (340 Mt); however, there is potential for expanded volume in the waste if placement density is < 2.0 t/m³. Most of the waste rock is anticipated to be PAG and there will be no separation of waste based on acid generation potential. Rather, seepage from the WRF will be collected and treated. An underdrain at the base of the WRF will be built to collect and manage the seepage.
The WRF is planned to be constructed in 5 m lifts with benches set back at 23.5 m after every fourth lift, to achieve an overall slope of 2.5H:1V. The final design is expected to have variations in the slope aspect, to best manage overland flow, resulting in a transitioning convex to concave shape of the WRF face.
The maximum stacking height (above existing grade) of the WRF is planned at 340 m to an elevation of 990 masl. The effective normal stress for potential critical failure surfaces at the base could reach values up to 5,000 kPa, which is higher than the weathered bedrock’s unconfined resistance (on the order of 3,000 kPa) and significantly lower that the competent bedrock resistance (± 32,000 kPa). These values were obtained from uniaxial compressive strength (UCS) tests. Considering the potentially mobilized zone under the stress (and potential strains) imposed by the stacked material, crushing of the waste rock should be expected. A sensitivity analysis was performed to assess the effect of finer-grained, granular waste rock on WRF stability.
A rockfill underdrain will be constructed under the WRF in the current Subarctic Creek channel. The underdrain will be excavated into overburden prior to WRF construction and will be capable of handling base flow through the Subarctic Creek valley. Water will be collected in the WRCP at the base of the WRF and held for treatment. The underdrain system will be used to maintain the phreatic water level as low as practicable within the WRF to increase the stability of the facility.
| 15.11.2 | Overburden and Topsoil Stockpiles |
Three stockpiles will be developed to store topsoil and overburden materials for use in final site reclamation. The topsoil stockpile will be placed in between the haul roads west of the planned pit and will store up to 325,000 m³. The overburden stockpiles will be located south of the WRF and will store up to 2,200,000 m³. The overburden stockpile geometries may be modified to act as or integrate with avalanche deflection berms.
| 15.12 | Compressed Air Supply |
High-pressure compressed air will be provided by three duty and one standby screw compressors and a duty plant air receiver. The instrument air will be dried and then stored in a dedicated air receiver. The plant air will be fed directly from the plant air receiver.
High-pressure air for the concentrate filters will come from a dedicated system of two duty and one standby screw compressors and a concentrate filtration area air receiver.
| | |
| Arctic Project | Page 309 |
| S-K 1300 Technical Report Summary | November 30, 2022 |
| | |
Low-pressure air for flotation-cell air requirements will be provided by four duty and one standby centrifugal blower.
External communications, including voice and data, will use a satellite connection with a line-of-sight to an orbiting geostationary satellite. Earth stations are expected to be located at the process plant area, camp area, contractor laydown yard proposed to be located at the road junction between the planned mine access road and the proposed AAP road, and the Dahl Creek airport. There will be separate systems for business operations and personal use.
Radio communications around the operation will be a very high frequency (VHF) Hi-Band system with radios in all mobile equipment and operations offices. There will be multiple frequencies with a frequency assigned to a specific operational group. The Dahl Creek airport will have a UHF radio to communicate with in-bound aircraft.
It is expected that there will be cell phone access for personal use in a limited area. This system will be installed and maintained by a communications service provider.
Communications for truck operators on the AAP road will be with VHF radios utilizing a system that will be installed as part of the AAP road.
The firewater distribution network will be maintained under a constant pressure with a jockey pump and will be looped and sectionalized to minimize loss of fire protection during maintenance. Where run outside buildings, fire water piping will be above ground and be heat traced and insulated.
Yard hydrants will be limited to the fuel storage tank area. Wall hydrants will be used in lieu of yard hydrants, and these will be located on the outside walls of the buildings in heated cabinets.
Fire protection within buildings will include standpipe systems, sprinkler systems and portable fire extinguishers. Standpipe systems will be provided in structures that exceed 14m in height and additionally where required by regulations, local authorities or the insurance underwriter.
Camp modules will be purchased with fire detection; fire rated walls and will use separation as a means of fire protection. Handheld extinguishers will be located throughout the buildings.
Fire protection of the generators will be provided by a water mist system. Gas detection will be provided to detect dangerous levels of diesel gas within the generator building.
| 15.15.1 | Truck Shop and Mine Offices |
The mine truck shop and mine offices area will be 2,400 m2 in area and will be positioned on an upper pad adjacent to the fuel storage area. This building will consist of the truck workshop, truck wash, mine offices, and mine dry. The truck workshop will have lifting and handling activities fulfilled by an overhead gantry crane. This building will be a pre-engineered steel frame and metal-clad building. The building will be heated using a system that will use waste heat produced from the diesel generators.
| | |
| Arctic Project | Page 310 |
| S-K 1300 Technical Report Summary | November 30, 2022 |
| | |
The laboratory will be 300 m2 in area and will be situated adjacent to the process building. The building will house all laboratory equipment for the daily operational process control including the metallurgical and environmental requirements. Any mechanical items associated with the dust collection equipment will be located external to the building. The building will be constructed as a single-storey modular wood-frame building. This building will be heated using an air handler system that using waste heat produced from the diesel generators.
| 15.15.3 | Administration Building |
The administration building will consist of HR, accounting and senior site management. The building will have an approximate area of 850 m2. The building will be constructed as a single-storey modular wood-frame building. This building will be heated using an air handler system that will use waste heat produced from the diesel generators.
The mill dry facility will consist of plant change rooms for the process plant area. The building will be approximately 400 m2 in area. These facilities will have clean and dirty areas and will be complete with showers, basins, toilets, and lockers. The building will be constructed as a single-storey modular wood-frame building. This building will be heated using an air handler system that will use waste heat produced from the diesel generators.
| 15.15.5 | Plant Workshop and Warehouse |
The plant workshop will be used to perform maintenance on process equipment and equipment spares. The plant workshop will be approximately 780 m2 in area. This building will be a pre-engineered steel frame and metal-clad building. This building will be heated using an air handler system that utilizes waste heat produced from the diesel generators.
The primary crushing area will feature a fabric structure approximately 70 m2 in area that will be located above and adjacent to the crusher dump pocket to assist with dust collection measures.
| 15.15.7 | Crushed Ore Stockpile |
A geodesic dome will be used over the crushed ore stockpile to keep the ore dry during the winter. The building will be approximately 2,700 m2 in area.
The process plant building will have an approximate area of 4,800 m2, and will house all of the milling, flotation and concentrate thickening equipment. The building will be divided into two sections. The first section will contain the mill and will have dimensions of 30 x 24 m; the second section will contain the flotation, regrind and thickening equipment and will be 36 x 98 m in size. Both sections will be serviced by overhead cranes.
| | |
| Arctic Project | Page 311 |
| S-K 1300 Technical Report Summary | November 30, 2022 |
| | |
This building will be a pre-engineered steel frame and metal-clad building with internal insulation to reduce heat loss. This building will be heated using an air handler system that utilizes waste heat produced from the diesel generators.
| 15.15.9 | Concentrate Loadout |
The concentrate loadout building will house process equipment and provide a covered area for loading the concentrate on to the trucks. This building will be separated from the process plant building to minimize the building volume that requires process ventilation equipment. The building will be approximately 1,700 m2 in area, will be a fabric structure and will not be heated to assist in drying out the concentrate prior to transport.
| 15.15.10 | Reagent Storage and Handling |
The reagent storage and handling building will be located outside the process plant building. The building will have an approximate area of 680 m2. This building will be pre-engineered steel frame and metal-clad building. This building will be heated using an air handler system that will use waste heat produced from the diesel generators.
The water supply building will be located at the fresh water source and house the pumping equipment. The building will be 36 m2 in area and will be a pre-engineered modular building. It will be heated using electric unit heaters.
| 15.16 | Concentrate Transportation |
Concentrate will be shipped from the Arctic mine site to the Port of Alaska in Anchorage in specialized 20ft intermodal bulk shipping containers for direct loading into bulk carrier vessels for ocean transport to the smelter or refinery. Containers will be trucked to Fairbanks, and then transferred to rail for delivery to the Anchorage port terminal.
A concentrate trucking contractor will be responsible for loading the containers in the concentrate storage building using a wheeled loader. Containers will be loaded with net 28.1 wmt of concentrate, resulting in 31.2 t gross weight per container. Based on a daily production of 1,289 wmt of concentrates (470,586 wmt per year), approximately 46 containers will be loaded per day and shipped from the Arctic site.
The base for the trucking operation will be at the junction where the road to the Arctic Mine would intersect the proposed AAP road, hereafter referred to as the Arctic Mine Junction (AMJ). This would be the primary laydown yard for concentrate containers. The trucking contractor would have a maintenance facility at AMJ, and mobile maintenance trucks along the AAP; however, most major equipment maintenance work is expected to be performed at the concentrate trucking contractor’s Fairbanks operating base.
The trucking of the containers to Fairbanks is planned to be undertaken in three stages:
| • | Load trucking containers at the Arctic mine concentrate storage building and then transport the container to the AMJ. |
| | |
| Arctic Project | Page 312 |
| S-K 1300 Technical Report Summary | November 30, 2022 |
| | |
| • | The containers would be trucked from AMJ using the AAP road to the Dalton Transfer Yard (DTY) facility. The DTY would be located near the intersection of the AAP road with the Dalton Highway and would be operated by the concentrate trucking contractor. A Super B-train configuration will be used on the AAP road, with each truck hauling two containers. At DTY, each truck will offload the two containers and return to the mine with two empty containers. This will require approximately 23 trips per day. Drivers would be based at either the Arctic site or AAP road and will complete one return trip per day from AMJ to DTY. |
| • | The concentrate trucking contractor would use a Fairbanks-based fleet to move the containers using a single trailer configuration from the DTY to a depot in Fairbanks. When the trucks undertake the trip from Fairbanks to DTY, each truck would transport one empty container. |
In Fairbanks, the containers would be loaded on railcars for transport to the Port of Alaska. At the port, the containers would be staged for direct loading into marine vessels using fixed shore cranes and a container rotator attachment. Concentrate would be shipped from Alaska in 10,000 dmt parcels for copper and zinc, and 5,000 dmt parcels for lead.
Table 15-4 provides details of the planned concentrate movement.
Table 15-4: Mode of Transport and Distances for Concentrate Shipping
| Segment | | Mode | | Distance (km) | | Trips/Day | | Trips/Week | |
| 1 | Arctic Site to AMJ | | Truck – Single Trailer | | 16 | | 46 | | 322 | |
| 2 | AMJ to DTY | | Truck – Double Trailer | | 324 | | 23 | | 161 | |
| 3 | DTY to Fairbanks | | Truck – Single Trailer | | 391 | | 46 | | 322 | |
| 4 | Fairbanks to Port of Alaska | | Rail | | 573 | | - | | 3 | |
| 5 | Port of Alaska to Asian Port | | Marine Bulk Carrier | | 9,000 | | - | | - | |
Concentrate shipping containers would be sourced from one of several suppliers and leased. It is expected that a fleet of approximately 1,770 containers would be required.
| | |
| Arctic Project | Page 313 |
| S-K 1300 Technical Report Summary | November 30, 2022 |
| | |
The proposed operations will produce copper, zinc and lead concentrates from the Arctic deposit on site, which will then be transported to be sold in the Asia Pacific area. There are currently no contracts in place with any buyers for the concentrate.
Metal prices are defined daily by several commodity markets via contract trading, some of which include the London Metal Exchange (LME), the Commodity Exchange (COMEX), the New York Mercantile Exchange (NYMEX), the Chicago Mercantile Exchange (CME), and the London Bullion Market Association (LBMA).
Prices are typically set each day, except weekends and holidays. Closing contract values, either based on spot pricing or based on AM/PM demand, are used to define future and expected commodity prices.
Metal price projections for use in the Report are guided by three-year trailing average commodity prices and long-term price forecasts from analysts as published by CIBC and approved by Trilogy Management as of November 30, 2022, as summarized in Table 16-1. The metal price assumptions used in the Technical Report Summary economic analysis are:
Metal price assumptions used for inputs to Mineral Resources are described in Section 11 and for Mineral Reserves in Section 12.
| Table 16-1: | Average Metal Prices (Data from S&P Market Intelligence and CIBC, 2022) |
| Average Price | | Copper ($/lb) | | | Zinc ($/lb) | | | Lead ($/lb) | | | Gold ($/oz) | | | Silver ($/oz) | |
| November 2022 | | | 3.45 | | | 1.24 | | | 0.91 | | | 1,628 | | | 18.92 | |
| 1-year trailing | | | 4.10 | | | 1.60 | | | 0.99 | | | 1,808 | | | 21.93 | |
| 3-year trailing | | | 3.62 | | | 1.31 | | | 0.93 | | | 1,775 | | | 22.19 | |
| 5-year trailing | | | 3.32 | | | 1.29 | | | 0.95 | | | 1,591 | | | 19.67 | |
| CIBC long-term consensus | | | 3.63 | | | 1.14 | | | 0.91 | | | 1,641 | | | 21.35 | |
| Report economic analysis | | | 3.65 | | | 1.15 | | | 1.00 | | | 1,650 | | | 21.00 | |
Figure 16-1 to Figure 16-5 illustrate historical pricing for the commodities above over the last 5 years, supporting the long-term metal price assumptions used in the Report.
| | |
| Arctic Project | Page 314 |
| S-K 1300 Technical Report Summary | November 30, 2022 |
| | |
| Figure 16-1: | 5-year Average Daily Closing Price for Copper |

Source: Data from S&P Market Intelligence, 2022.
| Figure 16-2: | 5-year Average Daily Closing Price for Zinc |

Source: Data from S&P Market Intelligence, 2022.
| | |
| Arctic Project | Page 315 |
| S-K 1300 Technical Report Summary | November 30, 2022 |
| | |
| Figure 16-3: | 5-year Average Daily Closing Price for Lead |
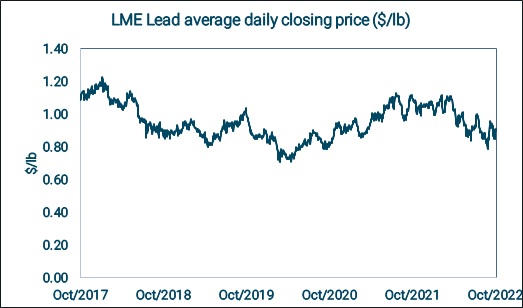
Source: Data from S&P Market Intelligence, 2022.
| Figure 16-4: | 5-year Average Daily Closing Price for Gold |
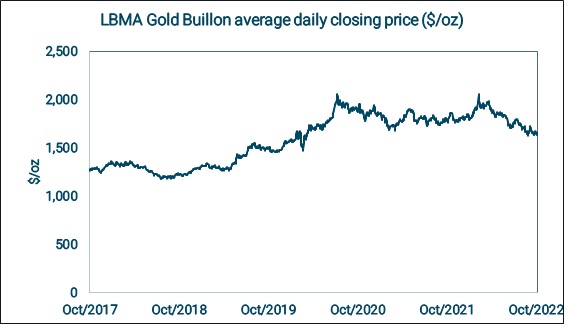
Source: Data from S&P Market Intelligence, 2022.
| | |
| Arctic Project | Page 316 |
| S-K 1300 Technical Report Summary | November 30, 2022 |
| | |
| Figure 16-5: | 5-year Average Daily Closing Price for Silver |
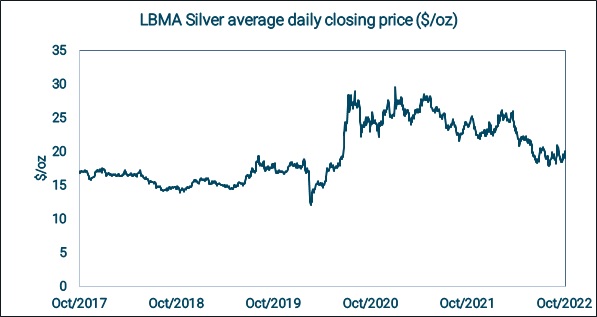
Source: Data from S&P Market Intelligence, 2022.
| 16.3 | Markets and Contracts |
A marketing review for the three Arctic concentrates, dated January 5, 2023, was conducted by StoneHouse Consulting based on the expected concentrate assays as provided by Trilogy.
Assumptions as to concentrate quality are based on the results of inductively coupled plasma (ICP) analysis of copper and lead concentrates produced from locked cycle tests at ALS Metallurgy and the zinc concentrate from locked cycle tests at SGS. The samples are thought to represent the expected concentrate quality. On the basis of this analysis, it has been assumed that the concentrates will be sent to Asian ports for smelting and refining.
No contracts have been entered into as of November 30, 2022 for mining, concentrating, smelting, refining, transportation, handling, sales and hedging, and forward sales contracts or arrangements. It is expected that the sale of concentrate will include a mixture of long-term and spot contracts.
| • | Most concentrate is traded on the basis of term contracts. Generally, a term contract is a frame agreement under which a specified tonnage of material is shipped from mine to smelter, with treatment and other charges negotiated at regular intervals (typically annually). |
| • | Spot contracts are normally a one-off sale of a specific quantity of concentrate to a merchant or smelter. The material is paid for in much the same way as a concentrate shipped under a term contract. Merchant business is a mixture of one-off contracts with smelters and long-term contracts with both miners and smelters. |
Often terms of sale for a term contract between miners and smelters are at “benchmark terms”, which is the consensus annual terms for the sale of concentrate and negotiated annually. Spot sales are made at spot terms, negotiated on a contract-by-contract basis.
| | |
| Arctic Project | Page 317 |
| S-K 1300 Technical Report Summary | November 30, 2022 |
| | |
| 16.3.1 | Chinese Import Restrictions |
The significance of the Chinese market for concentrate cannot be understated. China imports more than 1.5 Mt of zinc contained in concentrate per year, over 5 Mt of copper contained in concentrate, and over 700,000 t of lead contained in concentrates. China represents between 55- 75% of the traded spot concentrate business in the world. Being excluded from the Chinese market would be unfortunate for a new Project.
China is the only country that has national import quality standards for concentrates. Chinese import restrictions can dramatically affect the ability to sell concentrate in that country. For copper, zinc and lead concentrates the current import limits are indicated in Table 16-2 below.
Table 16-2: Chinese Import Restrictions for Copper, Zinc, and Lead Concentrates
| Current Standard - Maximum Allowed (%) | |
| Concentrate | | | Pb | | | | As | | | | F | | | | Cd | | | | Hg | |
| Copper | | | 6.0 | | | | 0.5 | | | | 0.1 | | | | 0.05 | | | | 0.01 | |
| Zinc | | | - | | | | 0.6 | | | | - | | | | 0.3 | | | | 0.06 | |
| Lead | | | - | | | | 0.7 | | | | - | | | | - | | | | 0.05 | |
| Zinc/Lead Bulk | | | - | | | | 0.45 | | | | - | | | | 0.4 | | | | 0.05 | |
Trilogy will have the option of selling some portion of the Arctic copper concentrate under long term contracts directly to smelters in China, Japan, and Korea, with the balance being sold under shorter term or spot contracts to the trade, with the same delivery points. The concentrate production at Arctic is too large to rely on the spot market for all its sales volume, although a portion sold under generally more favourable spot terms is recommended.
Arctic copper concentrate can be sold directly into China in the spot market and, as such, will be subject to better terms (lower TC) and lower penalty items. This material will not have to blended, but instead will be a quality that would be attractive for trading companies that need to blend down impurities in other concentrates.
US origin copper concentrates may be subject to Chinese import duties, which might limit the areas in where Arctic copper concentrate can be sold.
Because of the elevated level of cadmium, China will not be a market for the zinc concentrate. It is unlikely China will officially increase the Cd limit for imported concentrates, and Trilogy should not rely on exemptions at this point in the planning cycle to import Arctic zinc into China.
Even without the Chinese market Arctic zinc concentrate can still be sold to a number of smelters. Many zinc mines that have come onto the market over the past decade contain certain elements that are causing problems for smelters, principally iron, silica, manganese, selenium, and mercury. The most important aspects of Arctic zinc are the medium zinc, low silica, iron and mercury, and good copper levels. Smelters recover copper in zinc concentrates, and the 1.3% content in Arctic will be valued. The low silica, iron and mercury levels will be very attractive to many smelters in Asia and in Canada.
| | |
| Arctic Project | Page 318 |
| S-K 1300 Technical Report Summary | November 30, 2022 |
| | |
With respect to silver recovery, the two zinc plants in Korea, Onsan and Sukpo, several plants in Japan including Dowa’s plant at Akita, Teck’s plant in Trail, the Penoles plant in Torreon, Mexico and the Nyrstar plants in Europe all have good silver recovery and value silver content in zinc concentrates. Other plants have limited silver recovery, or specifically require high-grade, low-impurity zinc concentrate to limit residue production. These plants include Nyrstar facilities at Clarksville (US) and Budel (the Netherlands), and the Valleyfield smelter (Canada).
The balance of the smelters fall somewhere in between, with the desire for silver-bearing materials and the need for high-grade, low-impurity concentrates. With respect to Arctic zinc concentrate, even plants that have good silver recovery have impurity limits that could disqualify a high silver zinc concentrate, and these smelters would value some high zinc, low impurity concentrates like Arctic to blend the typically lower grade silver-bearing zinc concentrates. Smelters take a whole menu of concentrates, and they strive to create a feed blend that matches its technical capabilities. Arctic zinc concentrate would be a good fit in the blending portfolio of essentially every Western zinc plant.
However, given that most Japanese, Korean, and Canadian smelters are relatively well supplied in the current market, spot market opportunities for Arctic zinc will be limited. It is recommended that most Arctic zinc concentrate be sold under long-term contracts to Asian smelters, and perhaps to the Teck Trail smelter in Canada.
It may not be necessary for Arctic to consider shipments to Europe, although larger volume shipments to the Korea Zinc smelter in Australia might be cost effective.
Over the past decade, smelters have become more sensitive to impurity levels for certain elements. For example, most lead plants have restrictions on arsenic, fluorine, selenium, chlorine, mercury, and thallium inputs. The increased vigilance on environmental issues is the primary reason for heightened scrutiny, although processing issues are also a concern with fluorine, chlorine, and selenium.
Selenium, at 0.55%, is 400% higher than the level of the next highest selenium in a lead concentrate (Peñasquito). Many smelters do not recover selenium and find selenium contamination a real problem. Some stand-alone lead smelters recover selenium, but most integrated (Zn/Pb) smelters cannot.
Korea Zinc, in particular, has tightened its internal controls on impurities in incoming feed. This is largely due to increased environmental enforcement in Korea, which has resulted in a forced temporary closure of a related zinc smelter. It is unlikely that Korea Zinc will be interested in this concentrate. Teck’s Trail smelter will not purchase Peñasquito lead concentrate, which contains 0.07 - 0.15% selenium, so it will not be interested in Arctic lead concentrate. The Stolberg lead smelter in Germany, now owned by Trafigura, has a selenium limit that is much lower than the level in Arctic concentrates. These three smelters- Korea Zinc Onsan plant, Trail, and Stolberg- all have significant precious metals treatment capability but will be uninterested or unable to purchase this concentrate.
While high by market standards, fluorine, at 1,500 ppm, can generally be accounted for with a penalty. Fluorine at the high end of the specification, 3,260 ppm, is at a level that would likely require the concentrate to be blended with some low fluorine material to make a saleable concentrate. The cost of blending is borne by the more complex concentrate provider- in this case Arctic. The penalty for fluorine will be significant and will contain a higher per unit penalty above a certain threshold.
| | |
| Arctic Project | Page 319 |
| S-K 1300 Technical Report Summary | November 30, 2022 |
| | |
China remains the best market for this lead concentrate. China produces approximately 75% of the world’s primary lead. Since the production volume of lead concentrate at Arctic will not be high, the concentrate may be a good fit at stand-alone Chinese lead smelters that can handle the selenium.
Assuming that Chinese smelters are interested in purchasing the lead concentrate for the precious metals content, there are other issues with selling the concentrate into China, depending on how it is characterized. As the concentrate does not exceed Chinese quality import limits, it could be sold directly into China as a lead concentrate. The silver content in an imported lead concentrate is charged a 13% VAT tax that is payable by the receiving smelter. The silver level in Arctic lead concentrate is high, but just below the 2,500 g/t threshold when it could be sold as a silver concentrate in China and not subject to this VAT. Ignoring the quality concerns with fluorine and selenium, smelters would be less interested in purchasing Arctic lead concentrate than some other materials with less silver content. This reluctance can generally overcome with a higher TC to compensate for the VAT disadvantage.
The challenge is to find an appropriate smelter that can value the silver and gold content but at the same time handle the fluorine and selenium impurities. As mentioned above, sales of this concentrate into China will have taxation implications based on the value of the silver content.
The copper content in the lead concentrate is good and adds to the value of the concentrate. As this concentrate will likely need to be blended due to the fluorine and selenium, the copper content, when blended, will be a value-added benefit to the smelter.
The current indication is that Arctic lead will also contain between 4 and 6% magnesium, presumably as MgO. As this is such a significant impurity the impact on a lead smelter should be evaluated. The QP’s expectation is that the MgO will harmlessly slag off in the furnace, but each smelter may have different sensitivities, so the impact of the high Mg needs to be further evaluated.
Significant penalties have been assigned to fluorine, selenium and MgO, but penalty payments alone may not incentivize smelters to purchase this material.
At this time, it is felt that the best strategy is to sell the concentrate to trading companies who can blend with other lead concentrate containing low silver and selenium. In this way, the silver gets diluted, reducing the VAT impact, and the selenium gets reduced to an acceptable level.
Alternatively, the concentrate gets sold under a silver tolling licence and neither silver nor gold are subject to VAT. One issue with this strategy is that silver cannot fall under 2,500 g/t or else the concentrate will be improperly classified. For Arctic lead concentrate to be sold in this manner, silver needs to be the highest valued component in the concentrate. Depending on the prices of silver and gold, this might not always be the case.
It is recommended that a study be conducted to confirm marketability of this product. Smelters should be consulted so that Arctic can get some direction as to whether the elevated levels of fluorine and selenium can be managed.
| 16.4 | Smelter Term Assumptions |
Smelter terms were applied for the delivery of copper, zinc and lead concentrate. It was assumed that delivery of all concentrates would be to an East Asian smelter at currently available freight rates. These terms are forecasts and are considered to be in line with current market conditions. No contracts have been entered into at the Report effective date for mining, concentrating, smelting, refining, transportation, handling, sales and hedging, and forward sales contracts or arrangements.
| | |
| Arctic Project | Page 320 |
| S-K 1300 Technical Report Summary | November 30, 2022 |
| | |
The contracts for the copper concentrate will generally include the following payment terms:
| • | Copper: pay 96.5% of the content, subject to a minimum deduction of 1 percentage unit, at the LME price for copper less a refining charge of $0.08 per payable pound. The minimum deduction applies to Cu grades less than 28.5% and is therefore not applicable to Arctic copper concentrate. |
| • | Gold credit: If the gold grade is greater than 1 g/dmt and less than 5 g/dmt, then payment is 90% of the content less a refining charge of $5 per payable ounce at the LBMA gold price. |
| • | Silver credit: If silver content is greater than 30 g/dmt, then the payment is 90% of the content less a refining charge of $0.50 per payable ounce. |
| • | Treatment charge: $80 per dmt of concentrates |
| ○ | $3.00 for each 1% that the zinc plus the lead grade exceeds 3% |
| ○ | $0.50 for each 100 ppm that the antimony grade is above 500 ppm |
| ○ | $2.00 for each 0.1% that the arsenic grade is above 0.1% |
| ○ | $2.00 for each 100 ppm that the selenium level exceeds 300 ppm |
The contracts for the zinc concentrate are assumed to generally include the following payment terms:
| • | Zinc: pay 85% of content, subject to minimum deduction of eight percentage units at the LME price for zinc. The minimum deduction applies to Zn grades less than 53.3% and is therefore not applicable to Arctic zinc concentrate. |
| • | Silver credit: deduct 3 oz/dmt from the silver grade and pay for 70% of the balance at the LBMA price for silver. |
| • | Treatment charge: $215/dmt of concentrate delivered; no price participation. |
| ○ | $2 for each 0.1% that the cadmium content exceeds 0.3% |
The contracts for the lead concentrate are assumed to include the following payment terms:
| • | Lead: pay 95% of the content subject to a minimum deduction of three percentage units at the LME price for lead. The minimum deduction applies to Pb grades less than 60%. |
| • | Gold credit: pay 95% of content, subject to a minimum deduction of 1 g/dmt, less a refining charge of $20/payable oz at the LBMA price for gold. |
| • | Silver credit: pay 95% of content, subject to a minimum deduction of 50 g/t less a refining charge of $1.25/payable oz. The minimum deduction applies to Ag grades less than 1,000 g/dmt and therefore does not apply to Arctic lead concentrate. |
| | |
| Arctic Project | Page 321 |
| S-K 1300 Technical Report Summary | November 30, 2022 |
| | |
| • | Treatment charge: $160/dmt of concentrate delivered. |
| ○ | $5.00 for each 1,000 ppm that the bismuth content exceeds 1,000 ppm |
| ○ | $4.00 for each 100 ppm that the selenium content exceeds 500 ppm |
| ○ | $2.00 for each 100 ppm that the fluorine content exceeds 500 ppm, plus $5.00 for each 100 ppm above 1,000 ppm, plus $10 for each 100 ppm above 2,000 ppm |
| ○ | $2.00 for each 0.1% that the MgO content exceeds 2% |
| 16.5 | Transportation and Logistics |
Transportation cost assumptions for the concentrate are summarized in Table 16-3.
Table 16-3: Concentrate Transport Costs
| Description | | $/dmt | |
| Container cost | | | 7.80 | |
| Arctic Mine to Fairbanks (truck) | | | 215.89 | |
| Fairbanks to Port of Anchorage (rail) | | | 33.92 | |
| Port Terminal & Handling | | | 24.21 | |
| Ocean Freight to Asian Port | | | 42.55 | |
| Total Concentrate Transport Costs | | | 324.37 | |
An assumed insurance rate of 0.15% was applied to the recovered value of the concentrates less refining, smelting, penalties, and treatment charges.
| 16.7 | Representation and Marketing |
An allowance of $2.50/wmt of concentrate was applied as an allowance for marketing and representation.
| 16.8 | Comments on Market Studies and Contracts |
The QP has reviewed the information on marketing, payable and penalty assumptions and metal price assumptions, and considers that they are acceptable for use to support the Mineral Reserve estimates in Section 12 and the economic analysis in Section 19.
| | |
| Arctic Project | Page 322 |
| S-K 1300 Technical Report Summary | November 30, 2022 |
| | |
| 17 | ENVIRONMENTAL STUDIES, PERMITTING, AND Plans, Negotiations, or Agreements with Local Individuals or Groups |
| 17.1 | Environmental Studies |
The Arctic Project area includes the Ambler Lowlands and Subarctic Creek within the Shungnak River drainage. A significant amount of baseline environmental data collection has occurred in the area including surface and ground water quality sampling, surface hydrology monitoring, hydrogeology studies, meteorological monitoring, wetlands mapping, aquatic life surveys, avian and mammal habitat surveys, cultural resource surveys, and metal leaching and acid rock drainage (ML/ARD) studies.
The Arctic Project hydrology studies are ongoing. Shaw Environmental collected water quality samples in 2007, 2008, and 2009 and measured stream flow at 13 stations on the Shungnak River, Subarctic Creek, Arctic Creek, and the Kogoluktuk River as seen in Figure 17-1 (Shaw, 2007, 2008, 2009).
Tetra Tech performed baseline studies in July 2010 to characterize stream flow and water quality that could be potentially impacted by the construction and operation of a proposed access road between the Bornite and Arctic airstrips, and the existing road between the Arctic airstrip and the Arctic deposit. Tetra Tech collected water quality and flow data at 14 sites (Tetra Tech, 2010a).
Two hydrologic gauging stations were installed on the Shungnak River (SRGS site) and Sub-Arctic Creek (SCGS site) respectively by DOWL HKM in July 2012. Each station is powered by dual solar panels and a battery, and continually measures and records water depth, temperature, pH, and conductivity. A third hydrologic gauging station was established at the Lower Ruby Creek Gauging Site (RCDN) by WHPacific in June 2013. The RCDN station was moved upstream in 2017 due to a beaver dam. An additional hydrologic gauge (SCMET) was installed near the proposed waste rock collection pond in July 2021. All four of these stations have remained in operation since their installation. Dave Brailey, a contracted hydrologist, has used the depth data to generate rating curves and daily discharge calculations for the SRGS, SCGS, and RCDN sites.
Ambler Metals staff have measured instantaneous stream flow and other standard field parameters (YSI 556 multi-parameter unit) during seasonal sampling events from 2013 to 2019, 2021, and 2022 to present in Sub-Arctic Creek, Ruby Creek, the Shungnak River, and select tributaries to these drainages. The baseline water quality and hydrology program were expanded in 2016 from seven to over 20 sampling sites, with additional locations in Cabin Creek, Riley Creek, Wesley Creek, and the Kogoluktuk River (Craig, 2016). Additional locations on Camp Creek and Sub-Arctic Creek were added in 2019.
| | |
| Arctic Project | Page 323 |
| S-K 1300 Technical Report Summary | November 30, 2022 |
| | |
| Figure 17-1: | Current Water Quality and Hydrology Stations’ Location Map |

Source: Craig, 2022.
A snow survey was conducted in March 2018 around the site area in the upper reaches of the Sub-Arctic Creek watershed. The survey consisted of 52 locations using a Federal Snow Sampling tube. The purpose of the snow survey was to determine the snow water equivalent of various representative locations in the Subarctic Valley (Craig, 2018).
Additional snow surveys were conducted in March 2021 and April 2022 using similar methodology (Stockert, 2021 & 2022).
SRK (2020) reviewed existing baseline hydrological data for the Arctic Project site and prepared a regional hydrology analysis. SRK conducted an update in 2022 to include the most recent precipitation and hydrologic data (SRK, 2022).
Project and publicly available data were used to estimate mean annual precipitation (MAP) and mean annual runoff (MAR) at the Arctic Project and extend the available record period. The 2020 analysis predicted a MAP of 1,294 mm and a MAR of 1,089 mm for the Sub-Arctic Valley. The increase in estimated MAP from the SRK 2018 investigation is mainly due to incorporating a precipitation undercatch correction developed based on the snow survey data collected in 2018. The 2022 update predicted a MAP of 1,219 mm and a MAR of 1,130 mm for the Sub-Arctic Valley. The Arctic Project’s evaporation estimates were also updated in 2022 using climatic records and an empirical relationship. Evaporation estimates are stable and have not changed since SRK’s 2018 climate and hydrology review (SRK, 2018).
| | |
| Arctic Project | Page 324 |
| S-K 1300 Technical Report Summary | November 30, 2022 |
| | |
Three precipitation gauges were installed in July 2021 by Boreal Services in the Sub-Arctic Valley. The precipitation gauges functioned properly through the winter of 2021/2022 and measured the precipitation from rain and snowfall. In addition, a snow monitoring gauge was installed to measure the weight of the snow at the Sub-Arctic Valley Meteorological Station. The additional sensors will help to improve the MAP and MAR estimates of the Sub-Arctic Valley drainage.
An evaporation pan was installed in July 2021 to measure the actual evaporation during the summer months. Winter evaporation is assumed to be negligible.
Unit measured flows at the nearby USGS Dahl Creek and the Kobuk River at Kiana stations were compared to unit measured flows at the SRGS and SCGS hydrologic gauging stations for a concurrent monitoring period Flows measured in Dahl Creek closely resemble unit flows at the Arctic Project (Brailey 2019 & SRK 2022).
The Arctic Project should add additional transducers to the Geonor precipitation gauges to guard against transducer failure or drift and to provide more certainty regarding the data quality.
Frequent checks and equipment calibration are necessary to maintain quality data collection and ensure correct instrumentation functioning. Annual reporting of instrumentation checks and data quality reviews should be completed.
Water quality monitoring was conducted in the area over the past eleven years. The baseline monitoring data was supplemented with publicly available regional data to evaluate long-term trends.
In July 2010, Tetra Tech performed baseline studies to characterize flow and water quality in several streams that could be potentially impacted by construction and operation of a proposed access road between the Bornite airstrip and the Arctic airstrip, and the existing road between the Arctic airstrip and the Arctic deposit. Tetra Tech collected water quality and flow data at 14 sites. The results of the Tetra Tech sampling program indicate that, in general, the water quality for all sites meets applicable Alaska State water quality standards (WQS) for the parameters analyzed. Water quality sampling was conducted by Trilogy from 2012 to the present. Small sampling programs were performed from 2012-2015 during the summer field season. The water quality sampling program was expanded in 2016 to include more sample locations in the Shungnak River, Subarctic Creek, Ruby Creek, Riley Creek, Wesley Creek, and the Kogoluktuk River and to include sampling throughout the year. Several seeps in the Subarctic Creek drainage near the Arctic Project were sampled.
Samples were analyzed for both total and dissolved metals, mercury, cyanide, chloride, fluoride, nitrates, sulphate, acidity, alkalinity, total suspended solids, conductivity, pH, total dissolved solids, total organic carbon, and total phosphorus. The information will be used in the permitting and facilities design.
| | |
| Arctic Project | Page 325 |
| S-K 1300 Technical Report Summary | November 30, 2022 |
| | |
Tetra Tech performed a program of jurisdictional wetlands identification in a portion of the Arctic Project area in 2010, as part of a study to identify potential road alignment alternatives between the Bornite and Arctic airstrips. The work included data review, vegetation mapping, aerial photographic interpretation (segmentation), and field soil surveys. The work is summarized as follows.
The area between the Bornite and Arctic airstrips consists of a wide valley containing the Ambler lowlands and the Shungnak River. Wetlands are prevalent throughout much of the Ambler lowlands. Most of the wetlands within the area occur within tundra vegetation communities composed primarily of ericaceous shrubs, such as Alpine blueberry (Vaccinium uliginosum) and Northern-Mountain Cranberry (V. vitis-ideae) and graminoids, such as Tussock Cotton-Grass (Eriophorum vaginatum) and sedges such as Two-Color Sedge (Carex bigelowii) and Leafy Tussock Sedge (C. aquatilis). Forests of White Spruce (Picea glauca) and Black Spruce (P. mariana) and shrub birch communities of Swamp Birch (Betula nana) and Resin Birch (B. glandulosa) make up most of the upland communities.
In 2015, Trilogy engaged DOWL to perform additional wetlands mapping and generate two preliminary wetlands determinations for a 5,910-acre study area (DOWL, 2016). The study area included the entire Subarctic Creek drainage and the majority of the areas that could be directly impacted by the proposed Arctic open pit and mine facilities. The broad study area comprises 715 acres of potentially jurisdictional wetlands, 40 acres of Waters of the United States and 5,155 acres of non-jurisdictional uplands. According to DOWL (2016), the field work was performed in accordance with Part IV of the Corps of Engineers 1987 Wetlands Delineation Manual and the Regional Supplement to the Corps of Engineers Wetland Delineation Manual: Alaska Region (Version 2.0, 2007). Wetlands were classified and grouped according to the Class Level and system guidelines outlined in Classification of Wetlands and Deepwater Habitats of the United States (1979). The functional rating of potentially jurisdictional areas was determined using the criteria outlined in the 2009 Alaska Regulatory Guidance Letter, ID No. 09-10, the Cowardin Class, and observed hydrology. Ten ecological attributes were examined to subsequently rank wetland habitats as having low, moderate, or high functional ecological services. Riverine habitats (rivers and streams) perform vastly different functions compared to wetlands. Accordingly, riverine systems were evaluated based on the presence or absence of 17 functions according to the criteria outlined in the U.S. Department of the Interior Bureau of Land Management, Technical Report 1737-15, Riparian Area Management: A User Guide to Assessing Proper Functioning Condition and the Supporting Science for Lotic Areas.
Additional wetlands delineation work was done by DOWL in 2016, 2018 and 2019 to provide wetlands delineation of the entire proposed Arctic Project footprint including access roads, camps, stockpiles, mining, and waste storage facilities.
A biological consultant (Tetra Tech) performed aquatic life studies in 2010 in the area between the Bornite and Arctic airstrips, and along the Arctic deposit road in Subarctic Creek. The purpose of this study was to characterize the aquatic life within the Shungnak River and select tributaries. Opportunistic observations were also collected in the Kogoluktuk River. Fish species documented included Arctic grayling (Thymallus arcticus), round whitefish (Prosopium cylindraceum), slimy sculpin (Cottus cognatus), and Dolly Varden (Salvenlinus malma). Fish and macroinvertebrate data were collected from July 8 to 14, 2010.
In 2016 Trilogy engaged Alaska Department of Fish and Game (ADF&G) to complete aquatic studies as an extension of the work done by consultants in prior years. ADF&G has performed aquatic biomonitoring surveys at several large hardrock mines in Alaska, and has performed aquatic surveys onsite from 2016-Present except in 2020 due to the COVID-19 pandemic. Each year, ADF&G sampled for periphyton, aquatic invertebrates, and fish. Fish were captured using minnow traps and fyke nets. A subset of fish were retained for whole body element analysis. Sample sites have been added and refined over the years, and in 2022 ten sites in the Shungnak River drainage were sampled, including two in Ruby Creek and two in Subarctic Creek. An additional site on Riley Creek in the Kogoluktuk River drainage was also sampled for a total of 11 sites (Figure 17-2).
| | |
| Arctic Project | Page 326 |
| S-K 1300 Technical Report Summary | November 30, 2022 |
| | |
Figure 17-2: 2021 Aquatics Sampling Sites
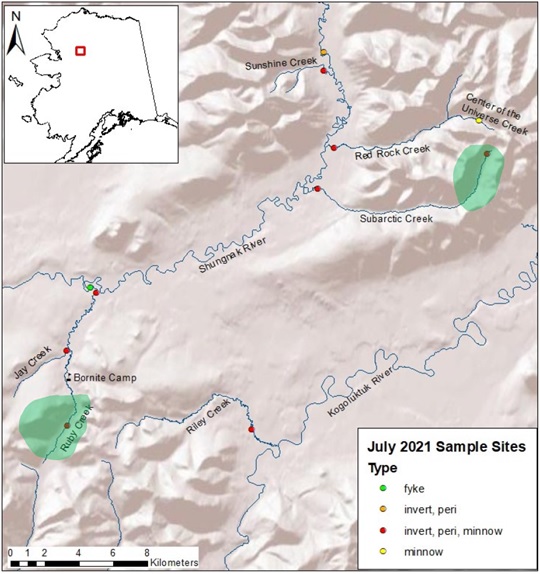
Source: ADF&G, 2021
Some of ADF&G’s results show that Subarctic Creek, which drains the Arctic deposit area contained relatively low background concentrations of zinc and copper, as well as low total dissolved solids (TDS). Upper Subarctic Creek had the highest number of aquatic invertebrates but also had the lowest species richness with a total of 11 taxa identified. Lower Subarctic Creek had a significantly lower average number of aquatic invertebrates but more diversity than upper Subarctic Creek.
| | |
| Arctic Project | Page 327 |
| S-K 1300 Technical Report Summary | November 30, 2022 |
| | |
Periphyton, or attached micro-algae, are sensitive to changes in water quality and are often used as evidence of in-situ productivity. The concentrations of chlorophyll-a are determined to estimate periphyton standing crop. Typically, Upper Ruby Creek has the highest concentrations of chlorophyll-a.
The aquatic invertebrate samples are sorted and identified to the lowest taxonomic level. Because invertebrates belonging to the orders Ephemeroptera (mayflies), Plecoptera (stoneflies), and Tricoptera (caddisflies) (EPT) are more sensitive to water quality, the proportion of EPT at each site was calculated and compared to other groups of aquatic invertebrates. Macroinvertebrate density for each sample was also calculated. In 2021, Upper Ruby Creek and Upper Subarctic Creek had the highest aquatic invertebrate densities. Lower Subarctic Creek and Lower Red Rock Creek had the highest proportion of EPT.
Despite being isolated from the Kobuk River by a large waterfall preventing migrations of anadromous fish, the Shungnak River drainage supports self-sustaining populations of Arctic grayling, Dolly Varden, round whitefish, longnose suckers, Alaska blackfish, and slimy sculpin. Minnow trap catches in Subarctic, Red Rock, and Center of the Universe creeks are dominated by Dolly Varden. Slimy sculpin is the majority of the catch in minnow traps in Ruby Creek (Clawson 2022a). The fyke nets at the mouth of Ruby Creek primarily capture Arctic grayling and round whitefish, although in 2017 large numbers of longnose suckers were also captured.
In 2021 and 2022, winter sampling for fish presence was conducted in March/April. Dolly Varden was captured at Upper Subarctic Creek, Center of the Universe Creek, and middle Subarctic Creek, demonstrating that at least some fish overwinter in these drainages instead of dropping down to the Shungnak River. The groundwater inputs into these streams are a steady temperature all winter and prevent the streams from freezing solid, enabling fish to survive over winter.
Over the six years of baseline data collection, different fish species have been sampled at different locations, therefore comparisons between sample results for fish whole body element concentrations must be evaluated accordingly. Generally, cadmium concentrations are highest in fish from Subarctic and Red Rock creeks and lowest in Ruby Creek fish. Whole body copper, selenium, and zinc concentrations are similar at all sample sites. Mercury concentrations are lowest in fish from the Subarctic and Red Rock creek drainages and highest in fish from Ruby Creek. Element concentrations fall within the range documented in fish from other drainages throughout the.
In total, from all programs over the last 10+ years, hydrogeological data is available from:
| • | monitoring wells including two pumping wells in the valley bottom area; 12 boreholes with single or multiple vibrating wire piezometers (i.e., 25 VWP sensors in total) and seven standpipe piezometers in proposed pit area; |
| • | 39 boreholes; 15 in the area of the proposed open pit and 24 in the valley bottom area; |
| • | Hydrogeologic testing data from 74 packer-based hydraulic tests; 19 slug tests; two pumping tests in valley bottom, each with an observation well; three extended injection tests in planned open pit area, one of six hours duration and two greater than 24 hours, each with monitoring at nearby vibrating wire piezometers (VWPs); 122 particle size distributions from test pits in valley floor; |
| • | Groundwater level series data from 24 VWPs and two standpipe piezometers in pit area; 20 water level dataloggers in valley bottom, and manual observations from the monitoring wells; |
| • | Dedicated ground temperature cables at six locations in valley floor; temperature from all VWP sensors, including those in the planned open pit area; |
| | |
| Arctic Project | Page 328 |
| S-K 1300 Technical Report Summary | November 30, 2022 |
| | |
| • | Groundwater quality data from eleven monitoring wells, collected quarterly to once per year, depending on access and location. Most wells are within the Subarctic Creek valley bottom, upgradient, within and down gradient of the mine footprint. |
Data were compiled into conceptual models for the planned valley bottom WRF and water management areas, as well as for the open pit area. Hydraulic head data indicate that groundwater flow is topographically driven, with recharge in the uplands and discharge in the valley bottom. At the large scale, hydrostratigraphic units include overburden, weathered bedrock and competent bedrock.
In the valley bottom, overburden, where coarse grained, and weathered bedrock are the primary aquifer units. Flow within competent bedrock is restricted to open fractures and generally has a lower hydraulic conductivity. Flow is in a down-valley direction, with groundwater divides generally aligned with the surrounding ridges.
In the planned pit area, the hydrostratigraphy is dominated by competent bedrock, with sub-units including upper and lower fractured rock, talc and geological structures. Talc may represent an aquitard located between the upper and lower fractured rock units. Water levels from the fractured rock units show a downwards gradient across the talc; the talc acts as a confining unit with the potentiometric surface for the lower fractured rock typically above the talc. Geological structures are present and can act as conduits or barriers to flow. There were no structures showing consistent barrier or conduit characteristics over the scale of the proposed pit. Compartmentalization is a possibility.
In the valley bottom, WRF and water management structures are designed to reduce release of contact water towards the down gradient receiving environment. Groundwater bypass of these systems could occur, though would be expected to be of low quantity as it would likely occur through the competent bedrock hydrostratigraphic unit. Groundwater moving down the valley can be assumed to largely discharge to Subarctic Creek before the creek enters the Shungnak River valley.
| 17.1.6 | Cultural Resources Data |
In 2016, Trilogy contracted WHPacific to perform a cultural resource assessment of the project area. WHPacific’s assessment included a literature review, archival research, stakeholder meetings in the communities of Shungnak and Kobuk, and an archaeological field survey of the Arctic Project. WHPacific’s literature and archival review included reviewing confidential Alaska Heritage Resource Survey Site information, which revealed that no archaeologic sites have been recorded in the project area (WHPacific, 2016). Stakeholder meetings with local community members indicated that the areas near the Arctic Project were not used by local residents in the past due to the lack of resources and passages to areas north, west, and east, where other resources and trading opportunities existed.
WHPacific’s field survey was conducted by two archaeologists and included an initial aerial reconnaissance of all 2,327 acres of the survey area, executed through the use of helicopter overflights at low elevation for observation by the archaeologists. As a result of this flyover, WHPacific determined that the majority of the Project area had a low probability of containing cultural resources due to saturated and marshy terrain and dense vegetation. Areas of low to moderate probability included dryer areas of elevated terrain, lower valley slopes, ridges, flat areas overlooking valleys, and terraces along the waterways. Of the total Arctic Project acreage, WHPacific conducted pedestrian survey of 530 acres and excavated a total of 13 shovel probes on NANA-managed lands. No cultural resources were found in the survey area. WHPacific did note that late 20th century mining exploration is in evidence in the project area as seen by roads, abandoned equipment, and the airfield (outside of the direct survey area). These are of an age that is on the cusp of being considered historical period resources (50 years or older) according to the National Historic Preservation Act. However, these resources are not unique within northern Alaska or for 20th century mining materials.
| | |
| Arctic Project | Page 329 |
| S-K 1300 Technical Report Summary | November 30, 2022 |
| | |
WHPacific’s (2016) recommendation based on their literature review, community interviews, and fieldwork was that no further cultural resources work was required, and that Project work associated with the proposed Arctic pit, facilities, tailings, and access road corridor project should proceed as planned.
Subsequent to WHPacific’s investigation, Trilogy has made several minor additions to the Arctic Project, such as road corridors and material sites. To provide complete archaeological coverage for all areas of planned development, Trilogy contracted additional cultural resource fieldwork in 2018 by Kuna Engineering (2018) and in 2019 Walking Dog Archaeology (2020). These efforts included literature reviews and field investigations of the remaining areas potentially impacted by the project footprint including camps, access roads and material sites. Neither of these two investigations resulted in the identification of previously undocumented cultural resources.
Access to the Arctic Project area includes travel over private lands owned by NANA. Subsistence is important to local residents, and as a result, a Subsistence Committee comprised of locally appointed residents from five potentially-affected communities in the region has been formed to review and discuss subsistence issues related to activities within the UKMP, including the Arctic Project and to develop future compliance plans. Representatives from NANA and Ambler Metals facilitate the meetings and report a summary of the discussions and recommendations provided by the Subsistence Committee to the Oversight Committee, as defined by the NANA Agreement. The Subsistence Committee meets twice annually and discusses development plans and potential subsistence issues.
In 2012, Stephen R. Braund & Associates completed a subsistence data-gap memo under contract to the Alaska Department of Transportation and Public Facilities as part of the baseline studies associated with the proposed road to the Ambler Mining District. The purpose of this analysis was to identify what subsistence research had been conducted for the potentially affected communities, determine if subsistence uses and use areas overlap with or may be affected by the access road project, and identify what, if any, additional information (i.e., data gaps) needed to be collected to accurately assess potential effects to subsistence. Among other topics, the report outlined historic subsistence uses including maps and a literature review, and provided a synopsis, by village, including those villages closest to the Arctic Project, and suggested further study.
An ADF&G report titled, “Wild Food Harvests in 3 Upper Kobuk River Communities: Ambler, Shungnak, and Kobuk 2012-2013” (ADF&G 2015) provides a comprehensive analysis of subsistence food sources and their usage by the three Upper Kobuk villages. The report detailed the ethnographic history, contemporary usage, common species harvest methods, and abundance.
Previous sampling efforts established the presence of various salmon species, northern pike and sheefish in the lower Kogoluktuk River. Sampling efforts in the Shungnak River have established the presence of northern pike. The presences of fish are good indicators of the possibility of subsistence use of these rivers, but boat access is limited due to waterfalls and rapids. In comparison, the Kobuk River, a wide and easily navigable river on which the communities of the region exist, supports the bulk of subsistence fishing.
Determining the presence and distribution of caribou is complex because of seasonal and annual variability in migration patterns. The ADF&G and National Parks Service employ a radio collar monitoring program as well as aerial photography to estimate herd size and migration patterns. The ADF&G also estimates mortality rates for cows, calves, and bulls, as well as other biomonitors for health such as body fat and predator populations.
The Northwest Arctic Borough (NWAB), through its Title 9 Conditional Use permit, regulates the Arctic Project with respect to caribou interactions to assure the migration is minimally affected by mining and exploration activities. To this end, Ambler Metals has communicated with the ADF&G wildlife biologists, who monitor caribou herd movements in the spring and fall in proximity to the Arctic Project by using radio-collared caribou. Summary maps of those movements constructed from years of radio collar information indicate three main migration corridors to the west of the Arctic Project area for the Western Arctic caribou herd. The nearest herd is approximately 48 km west of the project area.
| | |
| Arctic Project | Page 330 |
| S-K 1300 Technical Report Summary | November 30, 2022 |
| | |
DOWL (2016) performed a large mammal habitat survey in the project area. Historic maps of caribou migration included in their report show that the project area is outside of main caribou corridor routes and calving areas, but that data from 1988-2007 suggested that the area may be used for wintering habitat.
| 17.1.8 | Endangered Species, Migratory Birds, and Bald and Golden Eagle protection |
In 2016, Trilogy engaged WHPacific, through subcontractor ABR, Inc., to perform aerial surveys of nesting raptors in the project area, including the Bornite area located some 24 km southwest of the project area. ABR (2017) identified a total of 26 nests, of which 18 were in the Bornite area and eight were in the project area. Fifteen of the totals were occupied in the initial occupancy survey; nine were occupied by rough-legged hawks, with three peregrine falcon nests and three raven nests. In the later productivity survey ABR observed that only one rough-legged hawk nest had a (single) nestling, one peregrine falcon nest had two young and an unhatched egg, and two raven nests had young (not counted).
In 2017, Trilogy engaged WHPacific to review requirements that would be necessary to comply with the Endangered Species Act, the Migratory Bird Treaty Act and the Bald and Golden Eagle Protection Act. WHPacific (2017) concluded that there are no endangered species or critical habitat in the project area. Further they reported that nine avian species of conservation concern are expected to occur or could potentially be affected by activities in the project area. They provided the timing guidelines for vegetation clearing that are meant to protect these species during nesting activities and advised that if impacts to migratory species are unavoidable for the Arctic Project that the US Fish and Wildlife Service (USFW) must be consulted. They also recommended that Trilogy request a project review from USFW when the Arctic Project is closer to initiation.
| 17.1.9 | Metal Leaching / Acid Base Accounting Data |
Drill core samples were used to characterize the acid generation potential of the mine waste for the Arctic Project. In 1998, Robertson collected 60 representative core samples from the deposit for their ABA characteristics; these samples provided a broad assessment of ARD potential at the Arctic deposit with a focus on characterization for surface development. In 2010, SRK collected 148 samples and prepared a preliminary analysis of the ML/ARD potential of waste rock at the Arctic deposit (SRK 2011). The SRK report focused on characterization for underground development rather than an open pit scenario; however, it did provide a more refined analysis of ARD potential based on advances that have been made in understanding the importance of sulphide mineralogy in assessing ARD potential. The criteria used for classifying ARD potential also differed slightly from the Robertson era work.
In 2015, Trilogy retained SRK to provide on-going ML/ARD characterization services for the Arctic Project. Activities in 2015 through 2018 focused on three objectives: 1) set up and on-going monitoring of on-site barrel tests (kinetics), 2) initiation and on-going monitoring of parallel laboratory humidity cell tests (kinetics), and 3) expansion of the ABA database (statics). Barrel test leachate samples were routinely collected during 2016 through 2018 and analyzed by ARS Aleut Analytical. Humidity cell tests were monitored on a weekly basis by Maxxam Analytics of Burnaby, British Columbia. Trilogy and SRK selected 1,119 samples to be analyzed for a conventional static ABA package with a multi element scan using the same methods as the exploration database. Samples were analyzed by Global ARD Testing Services of Burnaby, British Columbia.
| | |
| Arctic Project | Page 331 |
| S-K 1300 Technical Report Summary | November 30, 2022 |
| | |
In 2017, tailings humidity cell testing was initiated to investigate the ML potential of unsaturated tailings. Monitoring was as described above for the waste rock humidity cell tests.
Activities in 2019 focused on expanding the kinetic testing program to characterize the metal leaching potential of the range of geochemical compositions present in each of the main waste rock units, in addition to testing ore. New lab kinetic tests were initiated, and monitoring of the lab kinetic tests initiated in 2015 also continued, with all tests operating at Maxxam Analytics of Burnaby, British Columbia. Barrel test leachates were sampled routinely in 2019 and analyzed by Maxxam Analytics, to maintain consistency in detection limits between laboratory and field kinetic tests.
Additional kinetic tests were also started on tailings in 2019, including a further humidity cell, and a subaqueous column to investigate ML in subaqueous conditions. Tests were monitored on a weekly basis by Bureau Veritas Labs (BV; previously Maxxam Analytics) of Burnaby, British Columbia.
Static testing of overburden also occurred in 2019, including static leach tests, to investigate ARD/ML potential of freshly excavated overburden. Samples were collected from previous test pits and drill core used for geotechnical investigations.
In 2020, additional humidity cell tests were initiated on AMR at BV to improve the representivity of kinetic tests on this unit and to investigate the suitability of near-surface AMR for construction use. Monitoring of previous humidity cells and the tailings subaqueous column continued.
In 2021, monitoring of previous kinetic tests at BV labs continued except for three tests which were completed. Barrel test leachates were also sampled routinely in 2021 and analyzed at BV labs.
In 2022, additional humidity cell tests were initiated on ore and tailings and a subaqueous column was initiated on tailings, all at BV labs. Monitoring of previous kinetic tests at BV labs continued with six tests reaching completion in December 2022. Barrel test leachates were sampled routinely in 2022 and analyzed at BV labs.
| 17.2 | Operational Site Monitoring |
Requirements and plans for waste and tailings disposal during operations can be found in Sections 15.8.5 and 15.10.1. Information regarding water management during operations can be found in Section 15.8.
| 17.3 | Mine Reclamation and Closure |
| 17.3.1 | Reclamation and Closure Plan |
Mine reclamation and closure considerations are largely driven by State regulations (11 AAC 86.150, 11 AAC 97.100-910, and 18 AAC 70) and statutes (AS 27.19) that specify that a mine must be reclaimed concurrent with mining operations to the greatest extent possible and then closed in a way that leaves the site stable in terms of erosion and avoids degradation of water quality from acid rock drainage or metal leaching on the site. A detailed reclamation plan will be submitted to the State agencies for review and approval in the future, during the formal mine permitting process. For this report a preliminary reclamation and closure plan was developed by SRK. This is considered adequate for this stage of study as closure is delayed by the operations period and numerous studies will be developed during operations that will further inform the final reclamation and closure plan.
| | |
| Arctic Project | Page 332 |
| S-K 1300 Technical Report Summary | November 30, 2022 |
| | |
The approval process for the plan varies somewhat depending on the land status for any particular mine. Owing to the fact that the Arctic Project is likely to have facilities on a combination of private (patented mining claims and native land) and State land, it is likely that the reclamation plan will be submitted and approved as part of the plan of operations, which is approved by the ADNR. However, since the reclamation plan must meet regulations of both ADNR and the ADEC, both agencies will review and approve the Reclamation Plan. In addition, private landowners must formally concur with the portion of the reclamation plan for their lands so that it is compatible with their intended post-mining land use.
| 17.3.2 | Closure Objectives and Closure Criteria |
The overall closure objective is to establish stable chemical and physical conditions that protect the environment and human health. To the extent practicable, rehabilitation efforts will endeavour to return the site to a condition which generally conforms with the surrounding terrain. The site will be monitored and maintained post-closure in order to demonstrably meet these conditions.
The following general closure objectives were considered:
| • | Demolish and remove all construction, camp and industrial facilities and reclamation of affected footprints. |
| • | Achieve long-term slope stability of the pit, WRF, and TMF. |
| • | Meet water quality criteria for all mine water and seeps prior to discharge to the environment. |
| • | Prevent intrusion and migration of tailings porewater and water from the pit into the regional groundwater. |
| • | Prevent and limit to the greatest extent practical, contact of humans and wildlife with the mine waste (waste rock and tailings). |
| • | Establish adequate vegetation density to ensure erosion protection of the soil slopes. |
| • | Re-establish vegetation or stabilized surface on areas returned to normal land use. |
Closure activities will be undertaken at the end of mine life to bring the mine facilities in a state consistent with the stated closure objectives and compliant with the regulations for closure and reclamation. Major activities planned for the various mine components and facilities are detailed as follows. The closure plan will be conducted in two phases. Phase One (first 15 years) will include reclamation of the majority of the site and time to allow the majority of the tailings consolidation to occur, while Phase Two (16+ years) will include closure of the TMF and long term maintenance of the site. Both phases will include water treatment as discussed in Section 17.3.4. Figure 17-3 and Figure 17-4 illustrate the closure phases.
| | |
| Arctic Project | Page 333 |
| S-K 1300 Technical Report Summary | November 30, 2022 |
| | |
| Figure 17-3: | Phase One Closure |
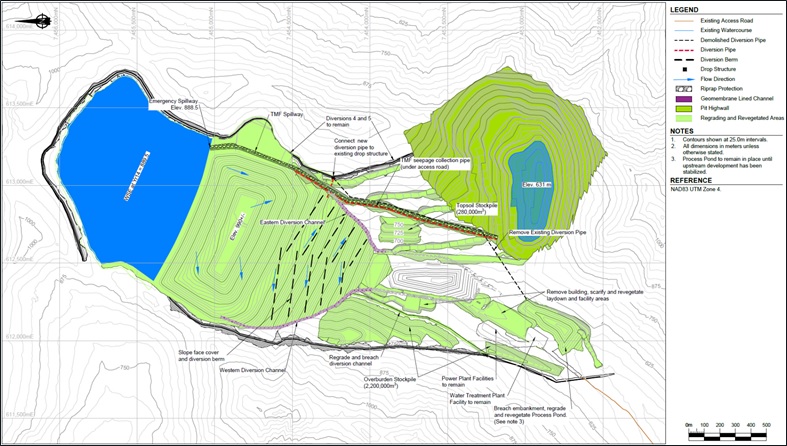
Source: SRK, 2022.
| | |
| Arctic Project | Page 334 |
| S-K 1300 Technical Report Summary | November 30, 2022 |
| | |
| Figure 17-4: | Phase Two Closure |
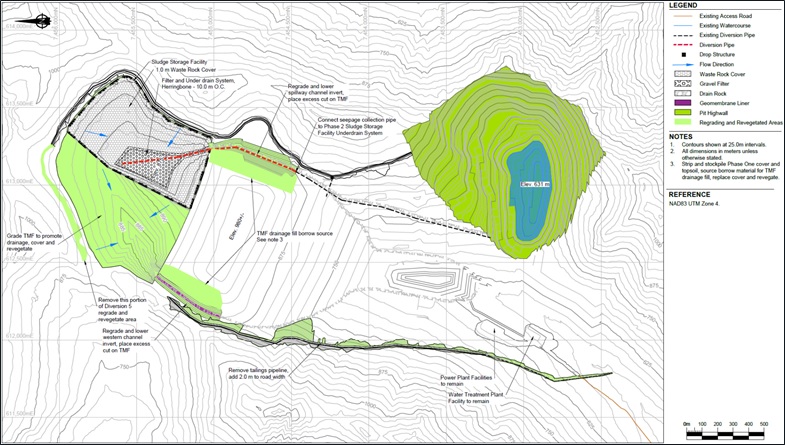
Source: SRK, 2022.
| | |
| Arctic Project | Page 335 |
| S-K 1300 Technical Report Summary | November 30, 2022 |
| | |
| 17.3.3.1 | Open Pit Workings |
The pit wall is expected to be geotechnically stable in the long-term, and therefore no in-pit work is required at closure. The pit perimeter straddles a steep mountainous ridgeline: installation of typical preventative safety measures such as fencing, or warning berms are not practical to install. Clear signage will be installed to warn of existing dangers, such as highwall presence and falling rock in areas which could potentially be accessed by the public.
Once operations are completed, the water in the pit will be allowed to rise and the pit will be used as storage for the WTP. Seepage water from consolidation of the tailings, infiltration through the tailings cover, and seepage from the WRF will report to the open pit for seasonal treatment. Sludge generated from water treatment will be filtered through filter bags on a lined portion of the tailings area and filtrate solution will be returned to the pit to be treated through the WTP.
The pit lake will not be allowed to overflow, and the elevation will be carefully monitored to provide storage of the freshet volume and probable maximum precipitation event. Further hydrological and geotechnical studies are required to determine the maximum elevation to which water could be stored in the pit to prevent seepage through bedrock and into the environment. A conservative approach assumes that the maximum pit lake elevation will be maintained 40 m below the top of competent bedrock surface. An emergency spillway will be constructed.
| 17.3.3.2 | Waste Rock Facility and Tailings Management Facility |
It is anticipated that the WRF will be PAG after closure and into the foreseeable future. The face of the WRF will be regraded at closure for long-term stability at an overall slope of approximately 2.5H:1V. Efforts will be made to create a convex shape on the WRF face, which is the predominant shape of natural slopes in mature landscapes in the area. This shape together with installation of intermittent diversion berms on the face of the WRF slope will reduce rilling and erosion from uncontrolled runoff. The diversion berms on the WRF face will divert water to the perimeter. There, geosynthetic-lined and armoured perimeter channels will be installed at the interface of the existing ground and the WRF. The lined channels will limit infiltration of collected runoff both from the WRF surface and upstream run-on, limiting the volume of seepage reporting to the WRCP which requires treatment. Upon completion of grading, all surface areas of the WRF will be covered with geomembrane overlain by approximately 830 mm of overburden and 170 mm of growth media, for a full cover thickness of approximately one meter. Modelling of the geomembrane cover showed a significant reduction in the amount of water that would need to be treated.
In the later years of operation, water maintained in tailings will be kept at a minimum. The eastern half of tailings will be used as a WTP sludge storage area. The eastern side of the tailings dam will drain into the pit which, in turn, will be used to feed the WTP. An engineered drainage layer will be place on the eastern side of tailings so that equipment can be operate on top while consolidation solution can still drain to the pit. Equipment will be used to place pipes and filter bags. Sludge from the WTP will be pumped into the filter bags. Sludge will be retained in the bags and filtrate solution, along with tailings consolidation solution, will return to the pit. As bags fill, they will be taken off-line and allowed to dry. When the eastern half of tailings has been filled with one layer of bags, they will be covered with engineered drainage material and second layer of filter bags will be filled on top and the process will be repeated. As the level of filter bags and drainage material increases, the western side will be covered with geomembrane overlain by 830 mm of overburden and 170 mm of growth media to reduce the volume of water needing to be treated. Tailings consolidation is expected to continue for up to 100+ years but, the majority of the consolidation is expected to occur in the first 15–20 years post closure.
| | |
| Arctic Project | Page 336 |
| S-K 1300 Technical Report Summary | November 30, 2022 |
| | |
The western side of tailings will not be needed for sludge storage, so waste rock will be relocated the western half of the tailings surface to provide positive drainage towards the western diversion channel. Upon completion of grading and placement of waste rock, the western half of the TMF will be covered with 830 mm of overburden and 170 mm of growth media, for a full cover thickness of approximately one meter.
An engineered spillway will be installed between the east side of the TMF and the pit at the completion of mining. The spillway is designed to safely convey the probable maximum flood event from the TMF to the pit, both during Phase One and Phase Two closure.
Material for covering the WRF and TMF will be relocated from the overburden and topsoil stockpiles. Once all material has been relocated, the footprints will be reclaimed, and the Process Pond will be reclaimed and revegetated.
All disturbed areas will stabilized and seeded with native species of grasses and shrubs to re-establish vegetation. A revegetation and cover study must be conducted to verify plant survival at the elevations proposed of the waste rock dump and reclaimed tailings facility. Efforts to work with the Alaska Plants Material Center should be taken to maximize the potential for sustainable regrowth. The elevation, climate and latitude will likely limit the early growth success and trials should be conducted throughout the LOM to determine the management practices for revegetation and stabilization at this site. Although, revegetation is the preferred method of stabilization for many projects, other methods of stabilization could be implemented such as a non-reactive, durable rock cover.
| 17.3.3.3 | Buildings and Equipment |
The WTP and a modified power generation plant will be left in place, together with all appurtenant facilities and utilities. All other steel frame buildings including the mill, the truck shop, and the conveyors will be demolished selectively by removing the roof and siding and then dismantling the steel frames and trusses. Resulting debris will be disposed of in an approved landfill that will be located on the WRF. Concrete walls, pillars, and beams will be demolished to the ground and concrete foundations will be covered in place. Controlled blasting may be used to help with the demolition. All sumps and cavities will be backfilled to ground level. The rock fill pads underlying all buildings and equipment will be re-graded to prevent permanent ponding.
Non-hazardous and hazardous waste will be segregated. Hazardous waste will be placed in suitable containers and hauled to a licensed disposal facility, while non-hazardous waste will be placed in the landfill.
Any unwanted mobile or stationary equipment will be stripped of electronics and batteries, drained of all fluids (fuels, lubricants, coolants), decontaminated by power washing, and placed in the landfill for final disposal.
| 17.3.3.4 | Mine Infrastructure |
Mine support infrastructure will consist of internal access roads, haul roads, and rock fill pads underlying the site buildings and facilities.
All bridges and culverts associated with the haul roads and internal access roads will be removed and natural drainage will be restored. Swales will be created where needed, to allow continued use of the roads into post-closure water treatment, monitoring, and maintenance. Roads that are not needed in post-closure will be ripped and re-vegetated.
The surface of the rockfill pads underlying some of the buildings and facilities on site will be re-graded and/or crowned as necessary to prevent ponding of water. The pads will be scarified and re-vegetated. Additional overburden up to 300 mm may be applied, as needed, to promote revegetation.
| | |
| Arctic Project | Page 337 |
| S-K 1300 Technical Report Summary | November 30, 2022 |
| | |
The site access road will be maintained as long as water treatment is occurring on site.
An unlined non-hazardous landfill will be located in the WRF. Demolition waste and other non-hazardous waste will be placed in the landfill and consolidated to minimize the occupied volume. The waste will then be covered with at least 1 m of waste rock. The final surface will then be graded to prevent permanent ponding and will be covered similarly to the rest of the WRF cover.
| 17.3.3.6 | Water Management System |
The water management system consisting of the pit lake, Process Pond, diversion channels, and various pipelines will be largely decommissioned. The Process Pond will be breached, regraded and re-vegetated. New diversion channels along the perimeter of the WRF will be created to manage surface runoff on and around the TMF and the WRF, as well as intake and discharge pipelines between the pit and the WRCP. Runoff from the WRF cover is expected to meet water quality standards and will be discharged to the environment. Seepage from the WRF will report to the WRCP and be pumped to the pit for treatment. As the pit fills naturally, water levels will be managed by treating and discharging treated water for the long-term.
The WRCP will collect seepage from the WRF in perpetuity. The expected seepage volume reporting to the WRCP in closure is approximately 800 m³ per day. All contact water will be sent to the pit for storage prior to treatment. Water treatment is expected to occur year-round, beginning in May of the first year of closure.
| 17.3.4 | Closure Water Treatment |
When the TMF is closed at the end of the Operations phase, a biological/chemical/physical plant will be added to treat the RO reject. This phased approach provides multiple benefits, including allowing time to gain insight on the site’s true wastewater flow and quality so that the RO reject treatment design can be improved upon. This treatment train will include:
| • | Gypsum clarifier: Reduces sulphate concentration in the reject treatment stream train to the gypsum saturation limit by adding lime stored in silos. The system will also remove cationic metals such as cadmium and zinc. |
| • | Anaerobic biological treatment: Biochemically reduces nitrate to nitrogen gas and selenate and selenite to elemental selenium (a solid). Selenium and metal solids removed in the sludge are settled out and removed by the biological ballasted clarifier. |
| • | Aerobic biological treatment: Polishes residual organics added in the upstream anaerobic biological treatment. Solids are separated via a membrane filter with iron coprecipitation for polishing selenium. |
During the Closure phase, the WTP will either be run year-round or for partial year based on water storage requirements. During the Operations phase, mill water demands will affect site water flows such that the WTP can be shut down and the discharge eliminated during roughly half of the year (winter).
During Operations, sludge from the WTP will be disposed of at the TMF. During Closure, sludge from the WTP will be disposed in filter bags on a lined area which will decant solution back to the pit.
| | |
| Arctic Project | Page 338 |
| S-K 1300 Technical Report Summary | November 30, 2022 |
| | |
Continued presence at site will be required in the post-closure period for as long as water treatment is necessary. During the post-Closure phase, the WTP will either be run year-round or for part of the year based on water storage requirements. If operated for part of the year, during the winter months, the RO portion of the plant would be shut down and the bacteria in the biologic portion of the plant will be maintained with the feed of a concentrated brine solution from the RO plant. This will eliminate the need to bring large quantities of reagents to site during winter, eliminate winter operational issues, and reduce the cost of winter road maintenance. Generators and mobile equipment will also be required for the WTP operations as well as sampling and monitoring activities.
In the short-term (up to 10 years following closure) monitoring to confirm that the closure objectives are met will be based on the following requirements:
| • | The site should be visually inspected by a qualified Professional Engineer annually for three consecutive years and less frequently thereafter for up to 10 years to ensure that erosion-prone areas have stabilized. |
| • | The cover systems over the WRF and the TMF should be regularly inspected by a qualified inspector to ensure the physical integrity of the cover is maintained. Inspection intervals should be by-annually for the first 10 years after construction. |
| • | The site should be inspected by a vegetation specialist to confirm suitability of the revegetation efforts. Inspections should be completed at the following intervals, unless otherwise recommended by the vegetation expert: Year 1, Year 3, Year 7 and Year 10 post-closure. |
| • | The WRCP and TMF dams will need a Periodic Safety Inspection by a qualified engineer every three years per ADSP (2017) for perpetuity. |
In the long-term, continuous water quality monitoring will be implemented at sampling frequencies prescribed by future discharge permits.
Maintenance will be performed on areas that monitoring identifies as needing repairs. Water treatment in perpetuity will likely require a well-defined set of discharge quality criteria to be determined at the later stages of permitting and design
| 17.3.6 | Closure Cost Estimate |
The estimated closure costs are determined from unit rates based on projects located in Alaska. The indirect costs were included as percentages of the estimated direct costs. Indirect percentages are based on reclamation and closure guidelines for Alaska.
Long-term water treatment and maintenance of certain water management facilities were calculated separately, and an NPV value is provided for the first 100 years of closure, at a discount rate of 4.3%. The discount rate is the mutually agreed upon rate developed by the State of Alaska to be used for all financial assurance closure costs.
A summary of Trilogy’s estimated closure and reclamation costs, for all items except water treatment, are provided in Table 17-1. Closure costs for the water treatment are captured separately in Section 17.3.6.2.
| | |
| Arctic Project | Page 339 |
| S-K 1300 Technical Report Summary | November 30, 2022 |
| | |
| Table 17-1: | Summary of Closure and Reclamation Costs |
| Cost Items | | Subtotals Closure Costs ($M) | |
| DIRECT CLOSURE COSTS | | | | |
| Waste Rock Facility | | $ | 69.9 | |
| Yards and Laydown Areas | | $ | 0.2 | |
| Buildings and Equipment | | $ | 4.0 | |
| TMF Spillway (Phase 1) | | $ | 4.9 | |
| Surface Water Management (Phase 1) | | $ | 7.7 | |
| Ponds and Stockpiles | | $ | 0.2 | |
| Roads and Diversion Channel Regrade | | $ | 0.2 | |
| Hazardous Waste and Solid Waste Disposal | | $ | 0.7 | |
| Camp and Turn-around Costs | | $ | 2.2 | |
| Subtotal Direct Closure Cost | | $ | 90.1 | |
| INDIRECT CLOSURE COSTS | | | | |
| Contingency (25%) | | $ | 22.5 | |
| Engineering Redesign (3%) | | $ | 2.7 | |
| Contract Administration (7%) | | $ | 6.3 | |
| Performance Bond (3%) | | $ | 2.7 | |
| Liability Insurance (0.5%) | | $ | 0.5 | |
| Subtotal Indirect Closure Cost | | $ | 34.6 | |
| Total Closure Cost | | $ | 124.7 | |
| POST-CLOSURE COSTS (100 years) | | | | |
| Water Quality Sampling | | $ | 8.3 | |
| Annual Reporting | | $ | 2.7 | |
| Post-Closure Monitoring and Inspections | | $ | 10.9 | |
| Vegetation and Cover Maintenance | | $ | 5.7 | |
| Camp and Road Maint. | | $ | 21.0 | |
| Mobile Equipment and Operating | | $ | 13.9 | |
| TMF Reclamation & Diversions (Phase 2) | | $ | 48.8 | |
| Sludge Repository Construction | | $ | 5.5 | |
| Sludge Management Crew and Camp Support | | $ | 4.6 | |
| Sludge Filtration | | $ | 10.0 | |
| Subtotal Post-Closure Costs (undiscounted) | | $ | 131.4 | |
| Post-Closure Costs NPV (4.3% Discount) | | $ | 46.1 | |
| Discounted General Closure Cost | | $ | 170.8 | |
| | |
| Arctic Project | Page 340 |
| S-K 1300 Technical Report Summary | November 30, 2022 |
| | |
| 17.3.6.2 | Closure Water Treatment Costs |
Annual undiscounted costs associated with long-term operations of the WTP are estimated to be $11.7 million in Phase 1 closure (15-years post-closure) and $10.8 million in Phase 2 closure (85 years thereafter), amounting to $1,095 million over the 100-year closure period. These costs equate to $258 million when discounted at 4.3% p.a. to the first year of post-production.
| 17.3.7 | Reclamation and Closure Financial Assurance |
In the absence of activities on Federal Land in the mine area and excluding the access road to the district from the Dalton Highway, there would not be any financial assurance requirements from the Federal government for the mine.
There are three State of Alaska agencies that require financial assurance in conjunction with approval and issuance of large mine permits.
The ADNR, under authority of Alaska Statute 27.19, requires a reclamation plan be submitted prior to mine development and requires financial assurance, typically prior to construction, to assure reclamation of the site. The ADNR Dam Safety Unit also requires a financial assurance sufficient to cover the cost of decommissioning dams or the cost for long term maintenance and monitoring of dams that will remain in-place. The ADEC requires financial assurance both during and after operations, and to cover short and long-term water treatment, if necessary, as well as reclamation costs, monitoring, and maintenance needs. The State requires that the financial assurance amount also include the property holding costs for a one-year period.
The final financial assurance amount will be calculated through the process of reviewing and approving the Arctic Project reclamation plan during the formal permitting process. In general, the approach is to combine the reclamation costs, post-closure monitoring costs and the long-term annual water treatment costs into a financial amount that includes deriving the NPV of the long-term costs and combining that with the reclamation cost. The costs assume that a third-party contractor will perform and manage the Arctic Project. The estimate required for bonding is likely to be similar to the estimate provided above. Until actual Owner operating costs are known, the internal closure liability cannot readily be reduced.
Ambler Metals may satisfy the State financial assurance requirement by providing any of the following: (1) a surety bond, (2) a letter of credit, (3) a certificate of deposit, (4) a corporate guarantee that meets the financial tests set in regulation by the ADNR commissioner, (5) payments and deposits into the trust fund established in AS 37.14.800, or (6) for the dam-or ADEC-related obligation - any other form of financial assurance that meets the financial test or other conditions set in regulation by the ADNR or ADEC commissioners.
The adequacy of the reclamation plan, and the amount of the financial assurance, are reviewed by the State agencies at a minimum of every five years and must be updated whenever there is a significant change to the mine plan of operations, or other costs that could affect the reclamation plan costs.
| | |
| Arctic Project | Page 341 |
| S-K 1300 Technical Report Summary | November 30, 2022 |
| | |
| 17.4 | Permitting Considerations |
| 17.4.1 | Exploration Permits |
Current mineral exploration activities are conducted at the Arctic deposit under State of Alaska and Northwest Arctic Borough (NWAB) permits. The State of Alaska Miscellaneous Land Use Permit (MLUP) and the NWAB Permit both expires at the end of 2022 and will be renewed.
Cumulative surface disturbance for exploration activities on the Arctic Project remains less than 5 acres (excluding historic disturbance that includes roads and camp disturbances) and therefore there are currently no State requirements for reclamation bonding for the Arctic Project.
Ambler Metals also has NWAB Title 9 Conditional Use Permits authorizing exploration and bulk fuel storage, use of airstrips, operation of a landfill and gravel extraction expires on December 31, 2022. No bonding is required for the borough permits.
Ambler Metals obtained several other permits for camp-support operations. These permits include a drinking water permit, a domestic wastewater discharge permit, camp establishment permits, and construction and operation of a Class III Camp Municipal Landfill, all of which are issued by the Alaska Department of Environmental Conservation (ADEC). Temporary water-use authorizations were issued by the ADNR, a Title 16 Fish Habitat permit, and a wildlife hazing permit were issued by the ADF&G.
The following discussion identifies the major permits and approvals that will likely be required for development of the Arctic deposit.
Permits would be required from Federal, State, and Regional agencies, including: the US Army Corps of Engineers (USACE), ADEC, ADF&G, ADNR, and the NWAB. The State of Alaska permit for exploration on the Arctic Project, the Annual Hardrock Exploration Activity (AHEA) Permit, is obtained and renewed every five years through the ADNR – Division of Mining, Land and Water.
The types of major mine permits required by the Arctic Project are largely driven by the underlying land ownership; regulatory authorities vary depending on land ownership. The Arctic Project area includes patented mining claims (private land under separate ownership by Ambler Metals and NANA), State of Alaska land, and NANA land (private land). The mine pit would situated mostly on patented land while the mill, TMF and WRF would be largely on State land. Other facilities, such as the camp, would be on NANA land. Federal land would likely underlie portions of an access road between the Dalton Highway and the project area. However, permits associated with such an access road are being investigated in a separate action by the State of Alaska and are not addressed in this report. A list of likely major mine permits is included in Table 17-2.
Because the infrastructure for the Arctic Project is situated to a large extent on State land, it will likely be necessary to obtain a Plan of Operation Approval (which includes the Reclamation Plan) from the ADNR. The Arctic Project will also require certificates to construct and then operate a dam(s) (tailings and water storage) from the ADNR (Dam Safety Unit) as well as water use authorizations, an upland mining lease and a mill site lease, as well as several minor permits including those that authorize access to construction material sites from ADNR.
| | |
| Arctic Project | Page 342 |
| S-K 1300 Technical Report Summary | November 30, 2022 |
| | |
The ADEC would authorize waste management under an integrated waste management permit, air emissions during construction and then operations under an air permit, and require an Alaska Pollution Discharge Elimination System (APDES) permit for any wastewater discharges to surface waters, and a Multi-Sector General Permit for stormwater discharges. The ADEC would also be required to review the USACE Section 404 permit to certify that it complies with Section 401 of the Clean Water Act (CWA).
The ADF&G would have to authorize any culverts or bridges that are required to cross fish-bearing streams or other impacts to fish-bearing streams that result in the loss of fish habitat.
The USACE would require a CWA Section 404 permit for dredging and filling activities in Waters of the United States, including jurisdictional wetlands. The USACE Section 404 permitting action would require the USACE to comply with National Environmental Policy Act (NEPA ) and, for a project of this magnitude, the development of an Environmental Impact Statement (EIS) is anticipated. The USACE would likely be the lead federal agency for the NEPA process. The NEPA process will require an assessment of direct, indirect and cumulative impacts of the Arctic Project and the identification of project alternatives, and include consultation and coordination with additional federal agencies, such as the US Fish and Wildlife Service (if endangered or threatened species are present) and National Marine Fisheries Service (if essential fish habitat is present), and with the State Historic Preservation Office and Tribal Governments under Section 106 of the Historical and Cultural Resources Protection Act.
As part of the Section 404 permitting process, the Arctic Project will have to meet USACE wetlands guidelines to avoid, minimize and mitigate impacts to wetlands. The USACE may require Ambler Metals to develop a compensatory wetlands mitigation plan for mitigating unavoidable wetlands impacts.
The Arctic Project will also have to obtain approval for a Master Plan from the NWAB. In addition, actions will have to be taken to change the borough zoning for the Arctic Project area from Subsistence Conservation and General Conservation to Resource Development.
The overall timeline required for permitting would be largely driven by the time required for the NEPA process, which is triggered by the submission of the Sec. 404 permit application to the USACE. The timeline includes the development and publication of a draft and final EIS and ends with a Record of Decision (ROD), and 404-permit issuance. In Alaska, the EIS and other State and Federal permitting processes are generally coordinated so that permitting and environmental review occurs in parallel. The NEPA process could require between two to three years to complete and could potentially take longer.
| Table 17-2: | Major Mine Permits Required for the Arctic Project |
| Agency | Authorization |
| State of Alaska |
| ADNR | Plan of Operations Approval (including Reclamation Plan) |
| Upland Mining Lease |
| Mill Site Lease |
| Reclamation Bond |
| Certificate of Approval to Construct a Dam |
| Certificate of Approval to Operate a Dam |
| Water Rights Permit to Appropriate Water |
| | |
| Arctic Project | Page 343 |
| S-K 1300 Technical Report Summary | November 30, 2022 |
| | |
| Agency | Authorization |
| ADF&G | Title 16 Permits for Fish Passage (authorize stream crossings) |
| ADEC | APDES Water Discharge Permit |
| Alaska Multi-Sector General Permit (MSGP) for Stormwater |
| Stormwater Discharge Pollution Prevention Plan (part of MSGP) |
| Section 401 Water Quality Certification of the CWA Section 404 Permit |
| Integrated Waste Management Permit |
| Air Quality Control – Construction Permit |
| Air Quality Control – Title V Operating Permit |
| Reclamation Bond |
| Federal Government |
| EPA | Spill Prevention, Control, and Countermeasure (SPCC) Plan (fuel transport and storage) |
| USACE | CWA Section 404 Dredge and Fill Permit |
| NWAB |
| NWAB | Master Plan Approval and rezoning lands from Subsistence Conservation to Resource Extraction |
Note: “Major” permits generally define critical permitting path. Additional “minor” permits are also required.
| 17.5 | Social or Community Considerations |
The Arctic Project is located approximately 40 km northeast of the villages of Shungnak and Kobuk, and 65 km east-northeast of the community of Ambler. The population in these villages are 151 in Kobuk (2020 Census), 210 in Shungnak (2020 Census), and 275 in Ambler (2020 Census). Residents largely live a subsistence lifestyle with incomes supplemented by guiding, local development projects, employment through tribal and city councils, government aid, and employment both in and outside of their home villages.
The Arctic Project has the potential to significantly improve work opportunities for residents during the exploration phase, construction, and during full operation. Trilogy’s joint venture, Ambler Metals works directly with the Upper Kobuk villages and communities throughout the region to employ residents as mechanics, geotechnicians, core cutters, administrative staff, camp services, heavy equipment operators, drill helpers, and environmental technicians.
Stakeholder outreach and community meetings in the region by the Arctic Project’s owners over many years have provided the opportunity to engage with residents, provide updated information on the Arctic Project and future plans for the UKMP, hear concerns, answer questions, and build relationships.
This engagement has also identified various hurdles residents have faced when applying for employment. Opportunities have been created for NANA shareholders to apply and receive educational scholarships, participate in job shadowing at Bornite, driver’s license courses, and heavy equipment operator training sponsored by the Arctic Project’s owners.
It is the company’s goal to continue and grow these efforts throughout the permitting process and the life of the Arctic Project – encouraging and supporting education, job training, employment, and economic growth.
| | |
| Arctic Project | Page 344 |
| S-K 1300 Technical Report Summary | November 30, 2022 |
| | |
| 17.6 | Comment on Environmental Studies, Permitting, and Plans, Negotiations, or Agreements with Local Individuals or Groups |
In the QP’s opinion, the current plans are adequate to address any issues related to environmental compliance, permitting, and local individuals or groups.
| | |
| Arctic Project | Page 345 |
| S-K 1300 Technical Report Summary | November 30, 2022 |
| | |
| 18 | CAPITAL AND OPERATING COSTS |
The capital cost estimate for the Artic Project was developed at PFS-level study under S-K 1300 standards with an accuracy of +/-15% using the Association for the Advancement of Cost Engineering (AACE) Class 3 estimate standards with a contingency ≤15%. The estimate included the cost to complete the design, procurement, construction, and commissioning, of all the identified facilities.
The breakdown of the responsibilities for the capex by facility is as follows:
| ○ | Reverse Osmosis Water Treatment Plant |
| ○ | Tailings Storage Facilities |
This estimate collectively presents the entire costs for the Arctic Project.
| 18.1.2 | Arctic Project Execution |
The estimate was based on the traditional engineering, procurement, and construction management (EPCM) approach where the EPCM contractor will oversee the delivery of the completed project from detailed engineering and procurement to handover of working facility. The EPCM contractor would engage and coordinate several subcontractors to complete all work within the given scopes. Typical vertical and/or horizontal contract packages were identified and aligned with different pricing models such as, but not limited to:
| | |
| Arctic Project | Page 346 |
| S-K 1300 Technical Report Summary | November 30, 2022 |
| | |
| • | Schedule of rates (unit price) |
| ○ | This contract pricing model is based on estimated quantities of items included in the scope and their unit prices. The final contract price is dependent on the quantities needed to complete the work under the contract. |
| ○ | Time and materials (T&M) fixes rates for labour and material expenditures, with the contractor paid on the basis of actual labour hours (time), usually at specified hourly rates, actual cost of materials and equipment usage, and an agreed upon fixed add-on to cover the contractor’s overheads and profit. |
| ○ | With this option one entity will provide design and construction services for an awarded scope of work. A higher degree of price certainty can be achieved when a lump sum arrangement is used; this method also provides a single point of accountability and an improved integration of the design with construction. |
| 18.1.3 | Work Breakdown Structure |
The estimate was arranged by major area, area, major facility, and facility. Each sub-area was further broken down into disciplines such as earthworks, concrete etc. Each discipline line item was defined into resources such as labour, materials, equipment, etc., so that each line comprises all the elements required to complete each task.
The work breakdown structure (WBS) was developed in sufficient detail to provide the required level of confidence and accuracy and also to provide the basis for further development as the Arctic Project moves into execution phase.
The estimate is derived from a number of fundamental assumptions as shown on the PFDs, 3D model, mechanical equipment list, electrical equipment list, material take offs, scope definition and WBS, it includes all associated infrastructure as defined within the scope of works.
The Capital Cost Estimate has been summarized at the levels indicated with a base date of Q3/Q4-2022 with no provision for forward escalation. A summary of the capital costs estimate by Major Facilities and Major Disciplines are defined in Table 18-1 and Table 18-2 respectively.
| Table 18-1: | Estimate Summary Level 1 Major Facility |
WBS
Level 1 | | | WBS Level 1 Description | | | Initial
Capex
($ M) | | | Sustaining
Capex
($ M) | | | Total
Capex
($ M) | |
| 1000 | | | Mining | | | 296.7 | | | 17.5 | | | 314.2 | |
| 2000 | | | Crushing | | | 42.5 | | | 0 | | | 42.5 | |
| 3000 | | | Process Plant | | | 158.0 | | | 1.3 | | | 159.3 | |
| 4000 | | | Tailings | | | 88.3 | | | 32.4 | | | 120.7 | |
| 5000 | | | On-site Infrastructure | | | 172.8 | | | 35.1 | | | 207.9 | |
| 6000 | | | Off-site Infrastructure | | | 75.8 | | | 0 | | | 75.8 | |
| Sub-total Direct Costs | | | 834.1 | | | 86.3 | | | 920.4 | |
| 7000 | | | Indirects | | | 177.4 | | | 15.1 | | | 192.5 | |
| 8000 | | | Contingency (~12% of total project cost) | | | 138.5 | | | 13.0 | | | 151.5 | |
| 9000 | | | Owner Costs | | | 26.8 | | | 0 | | | 26.8 | |
| Sub-total Indirect Costs | | | 342.7 | | | 28.1 | | | 370.8 | |
| Arctic Project Total | | | 1,176.8 | | | 114.4 | | | 1,291.2 | |
| | |
| Arctic Project | Page 347 |
| S-K 1300 Technical Report Summary | November 30, 2022 |
| | |
| Table 18-2: | Initial Estimate by Major Discipline |
Discipline
Code | | | Discipline Description | | | Initial
Capex
($ M) | | | Sustaining
Capex
($ M) | | | Total
Capex
($ M) | |
| A | | | Architectural - Buildings | | | 61.4 | | | 9.8 | | | 71.2 | |
| A | | | Architectural – Permanent Camp Facility | | | 45.4 | | | 0 | | | 45.4 | |
| B | | | Earthworks | | | 28.6 | | | 0.9 | | | 29.5 | |
| C | | | Concrete | | | 42.1 | | | 4.6 | | | 46.7 | |
| S | | | Structural Steel | | | 20.1 | | | 0 | | | 20.1 | |
| F | | | Platework | | | 6.6 | | | 0 | | | 6.6 | |
| M | | | Mechanical Equipment | | | 102.2 | | | 1.8 | | | 104.0 | |
| P | | | Piping & Fittings | | | 51.3 | | | 0 | | | 51.3 | |
| L | | | Electrical Bulks | | | 16.8 | | | 0 | | | 16.8 | |
| E | | | Electrical Equipment | | | 42.6 | | | 0 | | | 42.6 | |
| I | | | Instrumentation | | | 4.8 | | | 0 | | | 4.8 | |
| N | | | Mobile Equipment | | | 7.6 | | | 0 | | | 7.6 | |
| R | | | Third Party | | | 404.6 | | | 69.2 | | | 473.8 | |
| Sub-total Direct Costs | | | 834.1 | | | 86.3 | | | 920.4 | |
| O | | | Owners Costs | | | 26.8 | | | 0 | | | 26.8 | |
| T | | | Project Delivery | | | 90.0 | | | 14.3 | | | 104.3 | |
| | |
| Arctic Project | Page 348 |
| S-K 1300 Technical Report Summary | November 30, 2022 |
| | |
Discipline
Code | | | Discipline Description | | | Initial
Capex
($ M) | | | Sustaining
Capex
($ M) | | | Total
Capex
($ M) | |
| U | | | Filed Indirects | | | 76.9 | | | 0.9 | | | 77.8 | |
| V | | | Spares/ First Fills / Vendor Reps | | | 10.4 | | | 0 | | | 10.4 | |
| Y | | | Contingency (~12% of total project cost) | | | 138.5 | | | 13.0 | | | 151.5 | |
| Sub-total Indirect Costs | | | 342.7 | | | 28.1 | | | 370.8 | |
| Arctic Project Total | | | | | | 1,176.8 | | | 114.4 | | | 1,291.2 | |
| 18.1.5.1 | Definition of Costs |
The estimate is broken out into direct and indirect capital costs.
Initial capital is the capital expenditure required to start up a business to a standard where it is ready for initial production.
Sustaining capital is the capital cost associated with the periodic addition of new plant, equipment or services that are required to maintain production and operations at their existing levels.
Direct costs are those costs that pertain to the permanent equipment, materials and labour associated with the physical construction of the process facility, infrastructure, utilities, buildings, etc. Contractor’s indirect costs are contained within each discipline’s all-in rates.
Indirect costs include all costs associated with implementation of the plant and incurred by the owner, engineer or consultants in the design, procurement, construction, and commissioning of the Arctic Project.
| 18.1.5.2 | General Methodology |
The estimate is developed based on a mix of detailed material take-offs and factored quantities and costs, detailed unit costs supported by contractor bids and budgetary quotations for major equipment supply as outlined in Ausenco’s requirements.
The structure of the estimate is a build-up of the direct & indirect cost of the current quantities; this includes the installation/construction hours, unit labour rates and contractor distributable costs, bulk and miscellaneous material and equipment costs, any subcontractor costs, freight and growth.
The methodology applied and source data used to develop the estimate included:
| • | Define the scope of work. |
| • | Quantify the work in accordance with standard commodities. |
| • | Organize the estimate structure in accordance with an agreed WBS. |
| | |
| Arctic Project | Page 349 |
| S-K 1300 Technical Report Summary | November 30, 2022 |
| | |
| • | Calculate “all in” labour rates for construction work. |
| • | Determine the purchase cost of equipment and bulk materials. |
| • | Determine the installation cost for equipment and bulks. |
| • | Establish requirements for freight. |
| • | Determine the costs to carry out detailed engineering design and project management. |
| • | Determine foreign exchange content and exchange rates. |
| • | Determine growth allowances for each estimate line item. |
| • | Determine the estimate contingency value by probabilistic method (if required). |
| • | Undertake internal peer review, finalize the estimate, estimate basis and obtain sign off by the Project Manager and Qualified Professional. |
| 18.1.5.3 | Basic Information |
The following basic information pertains to the estimate:
| • | The estimate base date is Q3/Q4-2022. |
| • | The estimate is expressed in United States Dollars ($). |
The exchange rates in Table 18-3 were obtained from the XE.com website as of November 8, 2022 and confirmed for use the capital cost estimate by Trilogy.
| Table 18-3: | Estimate Exchange Rates |
| Exchange Rate | | | $ | |
| AUD 1.430 | | | 1.000 | |
| EUR 0.940 | | | 1.000 | |
| CAD 1.300 | | | 1.000 | |
Notes: AUD = Australian Dollar, EUR = Euro, CAD = Canadian Dollar
| 18.1.5.5 | Market Availability |
The pricing and delivery information for quoted equipment, material and services was provided by suppliers based on the market conditions and expectations applicable at the time of developing the estimate.
The market conditions are susceptible to the impact of demand and availability at the time of purchase and could result in variations in the supply conditions. The estimate in this Report was based on information provided by suppliers and assumes there are no problems associated with the supply and availability of equipment and services during the execution phase.
| | |
| Arctic Project | Page 350 |
| S-K 1300 Technical Report Summary | November 30, 2022 |
| | |
The total mine capital cost estimated to develop the Arctic Project is $294.9 M (Table 18-4). The initial capital costs add a total of $277 M, including $150 M in capitalized preproduction mining operating costs for a two-year preproduction period, $90 M in initial capital expenditures for mobile equipment, $7 M in initial equipment spares, $1 M for the explosive storage and transfer site, and $29 M for haul roads construction. Following preproduction, a sustaining capital cost of $18 M is required primarily for additions to truck mining fleet, and to replace equipment beyond its manufacturer’s recommended service life. An additional $40 M are estimated as a contingency for the initial capital cost. Equipment purchase payment has been estimated to be done in the period before it is required to account for the following payment schedule: 10% at order placement, 70% at shipping from ex-work, and 20% at site arrival.
| Table 18-4: | Mining Initial and Sustaining Capital Cost |
| Cost Area | | | Initial
Capex
($ M) | | Sustaining
Capex
($ M) | | Total Capex
($ M) |
| Pre-Production Mining | | | 149.9 | | 0.0 | | 149.9 |
| Engineering and Management | | | 4.0 | | 1.1 | | 5.1 |
| Drilling | | | 7.6 | | 0.0 | | 7.6 |
| Blasting | | | 2.0 | | 0.0 | | 2.0 |
| Loading | | | 16.3 | | 0.6 | | 16.9 |
| Hauling | | | 43.8 | | 1.8 | | 45.6 |
| Support | | | 18.9 | | 9.3 | | 28.2 |
| Maintenance | | | 6.0 | | 4.7 | | 10.7 |
| Road Construction | | | 28.8 | | 0.0 | | 28.8 |
| Sub-total Mining Cost | | | 277.4 | | 17.5 | | 294.9 |
Table 18-5 provides an overview of the annual sustaining capital expenditures. Approximately $0.05/t mined is spent as sustaining capital. Capital expenditures are restricted during the last two years of mining.
| | |
| Arctic Project | Page 351 |
| S-K 1300 Technical Report Summary | November 30, 2022 |
| | |
| Table 18-5: | Sustaining Capital Cost Distribution |
| Period | | | $ M | |
| Year 1 | | | 0.05 | |
| Year 2 | | | - | |
| Year 3 | | | - | |
| Year 4 | | | 1.46 | |
| Year 5 | | | - | |
| Year 6 | | | 0.75 | |
| Year 7 | | | 0.85 | |
| Year 8 | | | 0.20 | |
| Year 9 | | | 8.91 | |
| Year 10 | | | 1.93 | |
| Year 11 | | | 0.32 | |
| Year 12 | | | 3.05 | |
| Year 13 | | | - | |
| Total Sustaining Capital | | | 17.5 | |
Figure 18-1 provides a distribution of initial mining capital expenditures by cost area.
| | |
| Arctic Project | Page 352 |
| S-K 1300 Technical Report Summary | November 30, 2022 |
| | |
| Figure 18-1: | Initial Mining Capital Cost Distribution by Cost Centre |
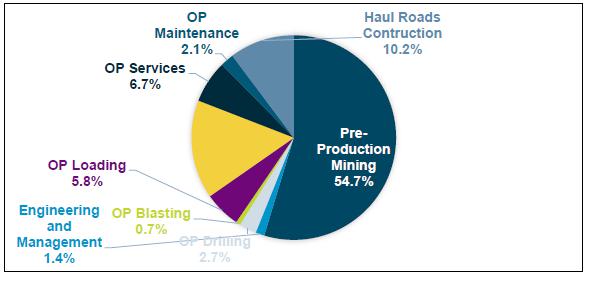
Source: Wood, 2022.
| 18.1.6.1 | Mining Capital Cost Basis of Estimate |
The basis of estimate for the mining equipment, ancillary equipment, capital spares, and other capital costs are provided in the following sub-sections.
The equipment capital costs were provided by multiple suppliers as part of a budgetary request for quotation process. The capital costs are inclusive of transport to Fairbanks, Alaska, assembly, training, tires, and options for cold weather operations. For example, Table 18-6 provides a capital cost buildup for the 141 t trucks.
| | |
| Arctic Project | Page 353 |
| S-K 1300 Technical Report Summary | November 30, 2022 |
| | |
| Table 18-6: | 141t Truck Capital Pricing |
| Capital Pricing 141t Truck | | | $ M | |
| Base Price | | | 2.1 | |
| Tires | | | 0.1 | |
| Freight and Duty to Fairbanks, AK | | | 0.1 | |
| Assembly | | | 0.2 | |
| Total Purchase Price | | | 2.5 | |
In addition to capital pricing, equipment suppliers provided machine operational lives and mechanical availability, which were adjusted by Wood based on experience with similar type of equipment at other operating mines. Table 18-7 provides the basic inputs used to estimate mine equipment capital cost.
| Table 18-7: | Mine Equipment Capital Cost Inputs |
| Equipment | | Capital Cost
($ M) | | | Machine Life
(GOH) | | | Mechanical Availability (%) | |
| 171 mm Production Drill | | 2.36 | | | 100,000 | | | 83 | % |
| 265 t/15 m3 Hydraulic Face Shovel | | 4.40 | | | 100,000 | | | 85 | % |
| 124 t/12 m3 Front End Loader | | 2.08 | | | 80,000 | | | 85 | % |
| 144 t Haul Truck | | 2.52 | | | 100,000 | | | 85 | % |
| 41t Articulated Truck | | 0.88 | | | 42,000 | | | 86 | % |
| 26 t/5 m3 Front End Loader | | 0.55 | | | 60,000 | | | 86 | % |
| 68 t/4 m3 Hydraulic Excavator | | 1.08 | | | 60,000 | | | 86 | % |
| 35 t/1.4 m3 Hydraulic Excavator | | 0.59 | | | 48,000 | | | 85 | % |
| 74 t/455 kW Track Dozer | | 1.38 | | | 60,000 | | | 85 | % |
| 50 t/419 kW Rubber Tired Dozer | | 1.46 | | | 60,000 | | | 85 | % |
| 40 t Articulated Sand Truck | | 0.88 | | | 42,000 | | | 85 | % |
| 33 t/217 kW Motor Grader | | 1.39 | | | 60,000 | | | 85 | % |
| 35,000-litre water truck | | 1.34 | | | 42,000 | | | 85 | % |
| 41t Articulated Fuel/Lube Truck | | 1.05 | | | 42,000 | | | 85 | % |
| | |
| Arctic Project | Page 354 |
| S-K 1300 Technical Report Summary | November 30, 2022 |
| | |
| 18.1.6.3 | Ancillary Equipment |
Ancillary equipment capital costs are estimated from a variety of sources including equipment supplier budgetary quotes, Wood’s data base, and CostMine® costing service. Table 18-8 shows the ancillary equipment pricing and sourcing.
| Table 18-8: | Ancillary Equipment Capital Cost Inputs |
| Equipment | | | Source | | | Cost Each ($ M) | |
| Truck Mounted 40 t Crane | | | Vendor | | | 0.5 | |
| 100t Rough Terrain | | | CostMine | | | 1.4 | |
| 5t Forklift | | | Vendor | | | 0.1 | |
| 10t Forklift | | | Vendor | | | 0.4 | |
| Mechanic Service Truck | | | CostMine | | | 0.2 | |
| Small Fuel/Lube truck | | | CostMine | | | 0.2 | |
| 55kW Skid Steer | | | Vendor | | | 0.1 | |
| Flatbed Truck | | | CostMine | | | 0.1 | |
| 45t Telehandler | | | Vendor | | | 0.8 | |
| Small backhoe/loader | | | Vendor | | | 0.2 | |
| Hydraulic Hammer | | | Vendor | | | 0.2 | |
| 90t Lowboy | | | CostMine | | | 0.3 | |
| Compactor | | | CostMine | | | 0.2 | |
| Light Plant | | | Vendor | | | 0.3 | |
| Transport Tractor | | | Wood | | | 0.2 | |
| Tire Handler Truck | | | Vendor | | | 0.4 | |
| 3/4-ton Pickup | | | CostMine | | | 0.5 | |
| 1 ton Pickup | | | CostMine | | | 0.6 | |
| Crew Bus | | | CostMine | | | 0.6 | |
| Fleet Management System | | | Vendor | | | 0.7 | |
| Mine & Geology Software | | | Vendor | | | 0.5 | |
| MMU - Heavy ANFO (blend) truck | | | CostMine | | | 0.3 | |
| Stemming Truck | | | CostMine | | | 0.1 | |
| Laser Scan | | | Wood | | | 0.02 | |
| Survey Drones | | | Wood | | | 0.01 | |
| Total Station | | | Wood | | | 0.03 | |
| | |
| Arctic Project | Page 355 |
| S-K 1300 Technical Report Summary | November 30, 2022 |
| | |
Capital spares are listed in Table 18-9. The capital spares are purchased during pre-production to minimize down time due to waiting for long lead time repair parts and wear items. Included in the capital spares are buckets, tires, and major and minor components. The capital spare costs for buckets and tires are supplier-provided. For minor and major components, an allowance of 5% of the initial purchase price was applied for each equipment fleet.
| Table 18-9: | Capital Spares |
| Description | | | $ M | |
| Spare Bed - 144 t Haul Truck | | | 0.2 | |
| Start Up Spares - 144 t Haul Truck | | | 0.1 | |
| Spare Tires (2) - 144 t Haul Truck | | | 0.04 | |
| FMS - 144 t Haul Truck | | | 0.2 | |
| Spare Tires (2) - 41t Articulated Truck | | | 0.01 | |
| Start Up Spares - 41t Articulated Truck | | | 0.04 | |
| Spare Bucket- 265 t/15 m3 Hydraulic Face Shovel | | | 0.3 | |
| Startup Spares- 265 t/15 m3 Hydraulic Face Shovel | | | 0.2 | |
| FMS - Komatsu 265 t/15 m3 Hydraulic Face Shovel | | | 0.04 | |
| Spare Bucket- 68 t/4 m3 Hydraulic Excavator | | | 0.1 | |
| Startup Spares- 68 t/4 m3 Hydraulic Excavator | | | 0.05 | |
| FMS - 68 t/4 m3 Hydraulic Excavator | | | 0.01 | |
| Spare Bucket- 124 t/12 m3 Front End Loader | | | 0.1 | |
| Startup Spares- 124 t/12 m3 Front End Loader | | | 0.1 | |
| FMS - 124 t/12 m3 Front End Loader | | | 0.04 | |
| Spare Bucket- 26 t/5 m3 Front End Loader | | | 0.2 | |
| Startup Spares- 26 t/5 m3 Front End Loader | | | 0.03 | |
| FMS - 26 t/5 m3 Front End Loader | | | 0.01 | |
| Startup Spares- 171 mm Production Drill | | | 0.1 | |
| FMS - 171 mm Production Drill | | | 0.07 | |
| Startup Spares- 35 t/1.4 m3 Hydraulic Excavator | | | 0.03 | |
| Startup Spares- 74 t/455 kW Track Dozer | | | 0.07 | |
| Startup Spares- 50 t/419 kW Rubber Tired Dozer | | | 0.07 | |
| Startup Spares- 41 t Articulated Sand Truck | | | 0.04 | |
| Startup Spares- 33 t/217 kW Motor Grader | | | 0.07 | |
| Startup Spares- 35,000-litre water truck | | | 0.07 | |
| Startup Spares- 41t Articulated Fuel/Lube Truck | | | 0.05 | |
| FMS - Service Equipment | | | 0.03 | |
| | |
| Arctic Project | Page 356 |
| S-K 1300 Technical Report Summary | November 30, 2022 |
| | |
| 18.1.6.5 | Other Capital Costs |
Other capital cost includes haul roads construction, equipment shipment from Fairbanks to site, and explosive storage facilities and transfer site.
Haul roads were estimated by Wood. The additional freight cost from Fairbanks, Alaska to site was estimated at $9,395/load during the preproduction period, $8,541/load during the production period, for loads less than 10’6” wide and 60,000 lbs. Heavier and wider loads, like trucks and shovels, were quoted separately. All freight costs were based on an in-state logistics quote. Explosive silos and transfer site cost was provided by the explosive supplier and an additional covered area of 10mx10m for blasting storage was estimated and costed using a unit rate of 3,500 $/m2 provided by Ausenco.
Table 18-10 shows the summary of the capital cost mentioned above.
| Table 18-10: | Other Capital Costs |
| Description | | | $ M | |
| Haul Roads Construction | | | 28.8 | |
| Equipment Freight Fairbanks to Site | | | 3.23 | |
| Explosive Silos and Transfer Site* | | | 1.03 | |
| Blasting Explosive Storage Building | | | 0.35 | |
| Equipment Rental for Assembly | | | 0.44 | |
*Note: Does not include earthworks, only infrastructure.
| 18.1.7 | Crushing and Process Plant (WBS 2000 & 3000) |
A summary of the crushing and process plant (WBS 2000 & 3000) capital cost estimate is presented in Table 18-11.
| Table 18-11: | Crushing and Process Plant Capital Costs |
WBS
Level 1 | | | WBS Level 1 Description | | | Initial
Capex
($ M) | | | Sustaining
Capex
($ M) | | | Total
Capex
($ M) | |
| 2100 | | | Primary Crushing | | | 13.3 | | | 0.0 | | | 13.3 | |
| 2200 | | | Ore Stockpile and Reclaim | | | 24.6 | | | 0.0 | | | 24.6 | |
| 2900 | | | Crushing General | | | 4.6 | | | 0.0 | | | 4.6 | |
| 3100 | | | Process Plant Building | | | 31.2 | | | 0.0 | | | 31.2 | |
| 3200 | | | Grinding and Screening | | | 29.0 | | | 0.0 | | | 29.0 | |
| | |
| Arctic Project | Page 357 |
| S-K 1300 Technical Report Summary | November 30, 2022 |
| | |
WBS
Level 1 | | | WBS Level 1 Description | | | Initial
Capex
($ M) | | | Sustaining
Capex
($ M) | | | Total
Capex
($ M) | |
| 3300 | | | Flotation and Regrind | | | 44.9 | | | 0.0 | | | 44.9 | |
| 3400 | | | Concentrate Thickening | | | 9.4 | | | 0.0 | | | 9.4 | |
| 3500 | | | Concentrate Filtration, Storage, Loadout | | | 13.7 | | | 0.0 | | | 13.7 | |
| 3600 | | | Reagents | | | 7.8 | | | 0.0 | | | 7.8 | |
| 3700 | | | Process Services | | | 9.4 | | | 0.0 | | | 9.4 | |
| 3800 | | | Process Control System | | | 1.6 | | | 0.0 | | | 1.6 | |
| 3900 | | | Process Plant General | | | 11.0 | | | 1.3 | | | 12.3 | |
| Sub-total Crushing and Process Plant Costs | | | 200.5 | | | 1.3 | | | 201.8 | |
The capital cost estimate for the process plant included provision for all mechanical and electrical equipment, mobile equipment, buildings as well as quantities for bulks such as earthworks, concrete, steel, piping, electrical and instrumentation.
All major processing equipment were sized based on the process design criteria. Once the mechanical equipment list was outlined, mechanical scopes of work were derived and sent to the market for firm and budgetary pricing by local and international equipment suppliers. Once the price quotations were reviewed and integrated, majority of the major mechanical and electrical equipment packages were sourced from firm and budgetary quotations, with the remainder of the minor process equipment pricing sourced from other recent reference projects and studies.
Additional indirect costs were included to cover field indirects, process capital spares, process vendor representatives, process commissioning support, process first fills, EPCM, construction camps, camp catering & maintenance, personnel transportation, fuel, heavy craneage and other miscellaneous construction services and temporary support costs.
| 18.1.8 | Tailings Management Facility (WBS 4000) |
The capital cost estimate for the TMF included provision for constructing the initial starter dam of the TMF to an elevation of 830 m, which is sufficient to store the first year of tailings production. The TMF would be constructed using waste rock material for the adjacent WRF and compacted in 1 m lifts. As the rock is already being delivered to the WRF, no allowance was provided for spreading and compacting the material as it is assumed that the dozers already on the WRF will handle that activity and the 1 m lifts would be compacted by haul truck traffic.
An allowance was made for excavating the overburden encountered beneath the starter dam footprint and portions of the WRF. This material will be stockpiled and used in reclamation activities at the end of mine life. Costs were estimated for the general foundation preparation within the footprint of the tailings impoundment in advance of the liner placement. Supply and installation of the geotextile and geomembrane was only considered in the capital cost estimate for placement up to the starter dam elevation of 830 m.
| | |
| Arctic Project | Page 358 |
| S-K 1300 Technical Report Summary | November 30, 2022 |
| | |
The storage capacity of the TMF will be increased through three additional raises of the dam in Years 1, 4 and 7 to an ultimate elevation of 892 m. Sustaining capital has been estimated for each of these raises to accommodate construction of access roads around the TMF, placement of underliner material, and installation of geosynthetics.
A summary of TMF capital costs is provided in Table 18-12.
Table 18-12: TMF Capital Costs
WBS
Level | | | WBS Description | | Initial Capex
($ M) | | | Sustaining Capex
($ M) | | | Total Capex
($ M) | |
| 4110 | | | Site Civil Infrastructure | | | 13.3 | | | | 0.0 | | | | 13.3 | |
| 4120 | | | Water Systems | | | 4.9 | | | | 0.0 | | | | 4.9 | |
| 4130 | | | Sewage, Waste and Water Systems | | | 4.9 | | | | 0.0 | | | | 4.9 | |
| 4140 | | | Electrical Services | | | 9.3 | | | | 0.0 | | | | 9.3 | |
| 4910 | | | IT & Communications | | | 56.0 | | | | 32.4 | | | | 88.4 | |
| Sub-total TMF Costs | | | 75.8 | | | | 88.3 | | | | 32.4 | |
| 18.1.9 | Onsite Infrastructure (WBS 5000) |
| 18.1.9.1 | Water Treatment Plant |
Costs for major equipment items were based on vendor budgetary quotations solicited specifically for the Arctic Project, minor equipment costs sourced from similar recent projects.
A factor-based methodology was then used to estimate the total capital investment for the WTP. The factors used to convert the delivered equipment costs to total fixed capital investment are based on estimating norms established using experience from past projects. The cost estimate includes a total of 5,600 m2 of heated buildings, built in phases as the elements of the WTP are built. A line item, to account for costs not itemized in other cost categories and contingency, of 30% was applied. B&C estimated the cost of the treatment system (equipment, piping, electrical systems, control systems, structural, yard improvements and freight); and Ausenco estimated the cost of the building, building foundation and civil works, and pipelines and utilities outside the building.
| 18.1.9.2 | Other Onsite Infrastructure Costs |
Other onsite infrastructure costs included provisions for civil infrastructure, electrical services, IT and communications, ancillary buildings, fuel storage and mobile equipment. A summary of onsite infrastructure costs is provided in Table 18-13.
Table 18-13: Onsite Infrastructure Costs
WBS
Level 1 | | | WBS Level 1 Description | | Initial Capex
($ M) | | | Sustaining Capex
($ M) | | | Total Capex
($ M) | |
| 5100 | | | Site Civil Infrastructure | | | 12.8 | | | | 0.0 | | | | 12.8 | |
| 5200 | | | Water Systems | | | 25.3 | | | | 0.0 | | | | 25.3 | |
| 5300 | | | Sewage, Waste and Water Systems | | | 55.8 | | | | 35.1 | | | | 90.8 | |
| 5400 | | | Electrical Services | | | 47.7 | | | | 0.0 | | | | 47.7 | |
| 5500 | | | IT & Communications | | | 0.1 | | | | 0.0 | | | | 0.1 | |
| 5600 | | | Ancillary Buildings | | | 12.4 | | | | 0.0 | | | | 12.4 | |
| 5700 | | | Diesel Storage and Distribution | | | 2.1 | | | | 0.0 | | | | 2.1 | |
| 5800 | | | Plant Mobile Equipment | | | 7.6 | | | | 0.0 | | | | 7.6 | |
| 5900 | | | Onsite Infrastructure General | | | 9.1 | | | | 0.0 | | | | 9.1 | |
| Sub-total Onsite Infrastructure Costs | | | 75.8 | | | | 172.8 | | | | 35.1 | |
| | |
| Arctic Project | Page 359 |
| S-K 1300 Technical Report Summary | November 30, 2022 |
| | |
| 18.1.10 | Offsite Infrastructure (WBS 6000) |
| 18.1.10.1 | Main Access Road |
The total estimate for the main site access road is $20M. The access road includes approximately 8 km of road between the Bornite Camp and the Arctic intersection. The estimate included the access road design and construction package, stream crossings and drainage structures, road surfacing, project delivery costs, and contingency.
| 18.1.10.2 | Other Offsite Infrastructure Costs |
Other offsite infrastructure costs included provisions for an airstrip, logistics compound and PAF. A summary of offsite infrastructure costs is provided in Table 18-14.
Table 18-14: Offsite Infrastructure Costs
WBS
Level 1 | | | WBS Level 1 Description | | Initial Capex
($ M) | | | Sustaining Capex
($ M) | | | Total Capex
($ M) | |
| 7100 | | | Site Access Road | | | 20.0 | | | | 0.0 | | | | 20.0 | |
| 7200 | | | Airstrip | | | 4.6 | | | | 0.0 | | | | 4.6 | |
| 7300 | | | Logistics Compound | | | 2.1 | | | | 0.0 | | | | 2.1 | |
| 7400 | | | PAF | | | 48.6 | | | | 0.0 | | | | 48.6 | |
| 7900 | | | General Offsite Infrastructure | | | 0.4 | | | | 0.0 | | | | 0.4 | |
| Sub-total Offsite Infrastructure Costs | | | 75.8 | | | | 0.0 | | | | 75.8 | |
| 18.1.11 | Indirects (WBS 7000) |
Indirect costs were estimated to include:
| · | Project preliminaries (field indirects) such as temporary construction facilities, temporary utilities, construction support, construction equipment, material storage and site office costs |
| · | Construction camp and catering costs |
| · | EPCM costs to cover such items as engineering and procurement services, construction management services, project office facilities, IT, staff transfer expenses, secondary consultants, field inspection and expediting, corporate overhead and fees |
| · | Spares (operational, capital, commissioning) and first fills |
| · | Costs for vendor representatives |
| · | Contractor support for commissioning activities to make minor modifications or provide labour assistance during commissioning |
Table 18-15 summarizes the indirect capital costs for the Arctic Project.
Table 18-15: Indirect Capital Costs
WBS
Level 1 | | | WBS Level 1 Description | | Initial Capex
($ M) | | | Sustaining Capex
($ M) | | | Total Capex
($ M) | |
| 7100 | | | Project Preliminaries | | | 18.7 | | | | 0.0 | | | | 18.7 | |
| 7200 | | | Temporary Facilities | | | 4.3 | | | | 0.0 | | | | 4.3 | |
| 7300 | | | Temporary Services | | | 11.8 | | | | 0.8 | | | | 12.6 | |
| 7400 | | | Camps | | | 39.4 | | | | 0.0 | | | | 39.4 | |
| 7500 | | | Cranage | | | 2.6 | | | | 0.0 | | | | 2.6 | |
| 7600 | | | EPCM Costs | | | 89.8 | | | | 14.3 | | | | 104.1 | |
| 7700 | | | Commissioning Support | | | 1.1 | | | | 0.0 | | | | 1.1 | |
| 7800 | | | First fills/spares | | | 7.5 | | | | 0.0 | | | | 7.5 | |
| 7900 | | | Vendors | | | 2.1 | | | | 0.0 | | | | 2.1 | |
| Sub-total Indirect Costs | | | 177.4 | | | | 15.1 | | | | 192.5 | |
| | |
| Arctic Project | Page 360 |
| S-K 1300 Technical Report Summary | November 30, 2022 |
| | |
| 18.1.12 | Provisions / Contingency (WBS 8000) |
Provisions are included in the cost estimate to account for growth allowances based on the level of definition of the study and estimate contingency. Estimate contingency is included to address anticipated variances between the specific items contained in the estimate and the final actual project cost.
The estimate contingency does not allow for the following:
| · | Abnormal weather conditions |
| · | Changes to market conditions affecting the cost of labour or materials |
| · | Changes of scope withing the general production and operating parameters |
| · | Effects of industrial disputes |
A summary of the estimate contingency is provided in Table 18-16, broken down by scope owner, totaling $138.5 M of initial capital costs, or ~12% of the total Arctic Project initial capital cost.
Table 18-16: Estimate Contingency
| WBS Area | | Initial Capex
($ M) | | | Sustaining Capex
($ M) | | | Total Capex
($ M) | |
| Crushing, Process Plant, Off-site Infrastructure | | | 68.7 | | | | 13.0 | | | | 81.7 | |
| Mining | | | 39.6 | | | | 0.0 | | | | 39.6 | |
| Tailings Management Facility | | | 12.4 | | | | 0.0 | | | | 12.4 | |
| On-site Infrastructure | | | 16.3 | | | | 0.0 | | | | 16.3 | |
| Owner’s Cost | | | 1.6 | | | | 0.0 | | | | 1.6 | |
| Sub-total Contingency | | | 138.5 | | | | 13.0 | | | | 151.5 | |
| | |
| Arctic Project | Page 361 |
| S-K 1300 Technical Report Summary | November 30, 2022 |
| | |
| 18.1.13 | Owner’s Costs (WBS 9000) |
A breakdown of owner’s costs is shown in Table 18-17.
Table 18-17: Owner’s Costs
| Description | | Initial Capex
($ M) | | | Sustaining Capex
($ M) | | | Total Capex
($ M) | |
| Owner’s Project Management | | | 11.3 | | | | 0.0 | | | | 11.3 | |
| Health & Safety | | | 3.3 | | | | 0.0 | | | | 3.3 | |
| Start-up | | | 12.2 | | | | 0.0 | | | | 12.2 | |
| Sub-total Owner’s Costs | | | 26.8 | | | | 0.0 | | | | 26.8 | |
| | |
| Arctic Project | Page 362 |
| S-K 1300 Technical Report Summary | November 30, 2022 |
| | |
| 18.1.14 | Sustaining Capital and Closure Costs |
Sustaining capital costs include expenditure related to additions to the truck mining fleet, to replace equipment beyond its manufacturer’s recommended service life, processing plant equipment, onsite infrastructure (largely comprising the cost of the Reverse Osmosis Reject WTP towards the end of the mine life) and miscellaneous indirect costs. In addition, sustaining costs are carried for the three TMF dam raises. However, costs associated with placement and compaction of the material for dam raises, being achieved through building up of the WRF, are captured as mining operating costs.
Table 18-18 summarizes the sustaining capital and closure costs. The total closure cost of $428 million includes $124.7 million in closure costs, $46.1 million in post-closure costs and $258 million in post-closure water treatment costs. Further details related to the closure cost total are provided in Section 17.3.6.
| Table 18-18: | Sustaining Capital and Closure Costs |
| WBS Level 1 | | | WBS Description | | | Sustaining
Capex
($ M) | |
| 1000 | | | Mining | | | 17.5 | |
| 2000 | | | Crushing | | | 0 | |
| | |
| Arctic Project | Page 363 |
| S-K 1300 Technical Report Summary | November 30, 2022 |
| | |
| WBS Level 1 | | | WBS Description | | | Sustaining
Capex
($ M) | |
| 3000 | | | Process Plant | | | 1.3 | |
| 4000 | | | Tailings | | | 32.4 | |
| 5000 | | | On-Site Infrastructure | | | 35.1 | |
| 6000 | | | Off-Site Infrastructure | | | 0 | |
| | | | Sub-Total Direct Costs | | | 86.3 | |
| 7000 | | | Indirects | | | 15.1 | |
| 8000 | | | Provisions (Contingency) | | | 13.0 | |
| 9000 | | | Owners Costs | | | 0 | |
| Sub-Total Indirect Costs | | | 28.1 | |
| Arctic Project Total – Sustaining Capital | | | 114.4 | |
| Arctic Project Total – Closure Costs | | | 428.4 | |
| 18.2 | Operating Cost Estimate |
The operating cost estimate is within the ± 25% cost accuracy for a PFS-level study under S-K 1300 standards.
| 18.2.1 | Operating Cost Summary |
An average operating cost was estimated for the Arctic Project based on the proposed mining schedule. These costs included, mining, processing, G&A, surface services, and road toll costs. The average LOM operating cost for the Arctic Project is estimated to be $59.83/t milled.
The processing plant throughput is designed to operate at approximately 10,000 t/d, or 3,650,000 t/a. The proposed mining schedule ramps up in Year 1 and ramps down in Year 13 resulting in a LOM average of approximately 3,592,000 t/a processed. Total throughput is estimated to be 46,691,000 t over the 13-year LOM. The breakdown of costs in Table 18-19 is based on the 3,650,000 t/a mill feed rate.
| | |
| Arctic Project | Page 364 |
| S-K 1300 Technical Report Summary | November 30, 2022 |
| | |
Table 18-19: Overall Operating Cost Estimate
| Description | | LOM Average Unit Operating Cost
($/ t milled) | | LOM Average
Annual
Cost ($ M/a) | | Percentage of Total Annual
Operating Costs | |
| Mining* | | 22.49 | | 82.1 | | 37.6 | % |
| Processing | | 22.60 | | 82.5 | | 37.8 | % |
| G&A | | 5.85 | | 21.3 | | 9.8 | % |
| Road Toll and Maintenance | | 7.72 | | 28.2 | | 12.9 | % |
| Water Treatment | | 1.17 | | 4.3 | | 2.0 | % |
| Total Operating Cost | | 59.83 | | 218.4 | | 100 | % |
* Excludes pre-production costs.
| 18.2.2 | Mining Operating Cost Estimate |
The mining operating cost averages $2.40/t (moved) during preproduction and $3.24/t (moved) during production. The total tonnage moved includes 0.78 Mt of stockpile rehandle and 386.9 Mt of primary production. Figure 18-2 presents the operating cost distribution, where mine haulage accounts for 36% of the mine operating costs, open pit blasting accounts for 19% of the mine costs, followed by loading, services, and drilling each at 16%, 15%, and 6%, respectively. The Others category in the figure includes costs for engineering, geology, operations, and management overheads. The stockpile rehandling cost is minor due to the small amount of material rehandled along the life of the mine. Table 18-21 shows the operating cost break down by cost centre.
| Figure 18-2: | Costs by Cost Centre |
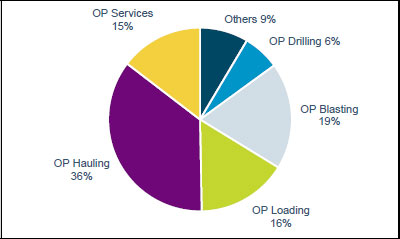
Source: Wood, 2022.
| | |
| Arctic Project | Page 365 |
| S-K 1300 Technical Report Summary | November 30, 2022 |
| | |
Personnel costs are the largest cost items for the mine, followed by maintenance and repair supplies, fuel, and blasting explosives. The study diesel price is $1.04/l. The Others category shown in Figure 18-3 includes costs for: drilling supplies, auxiliary equipment, contract services, ground engaging tools, blasting accessories and lubricants.
| Figure 18-3: | Costs by Cost Item |
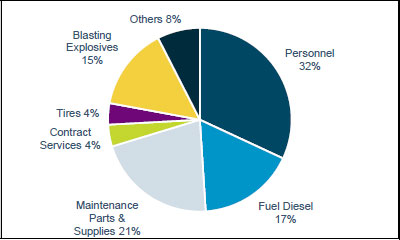
Source: Wood, 2022.
Figure 18-4 provides an overview of the tonnage mined and the mine operating costs per tonne mined. During Year -2 and Year -1, the mining costs are at the lowest due to the short haul distances and high mining rates. From Year 1 to Year 4, the mining costs increase as the haul cycles increase with the deepening of the Phase 1 and Phase 2 lay backs and the mining of the upper zones of Phase 3. Mining costs then decrease in Year 5 as a new exit of the pit is used, decreasing the haulage distances. An increase in the following years can be noticed as Phase 2 and Phase 3 start deepening. After Year 9, only Phase 4 (final phase) is mined and the cost increases with the deepening of the pit and a reduction in the total tonnage mined.
| | |
| Arctic Project | Page 366 |
| S-K 1300 Technical Report Summary | November 30, 2022 |
| | |
Table 18-20 summarizes the average mining operating cost over the LOM.
Table 18-20: Mining Operating Cost Summary by Cost Centre
| Cost Centre | | LOM Average Annual
Cost
($ M/a) | | | LOM Average Unit
Operating Cost
($/t milled) | |
| OP Management | | | 0.4 | | | | 0.12 | |
| OP Operations O/H | | | 2.9 | | | | 0.79 | |
| OP Engineering | | | 2.0 | | | | 0.55 | |
| OP Geology | | | 1.5 | | | | 0.41 | |
| OP Drilling | | | 5.2 | | | | 1.42 | |
| OP Blasting | | | 14.9 | | | | 4.08 | |
| OP Loading | | | 13.0 | | | | 3.56 | |
| OP Hauling | | | 30.1 | | | | 8.25 | |
| OP Stockpile Rehandle | | | 0.1 | | | | 0.02 | |
| OP Services | | | 12.0 | | | | 3.29 | |
| Total Operating Cost | | | 82.1 | | | | 22.49 | |
Note: Figures may not add up due to rounding. OP – open pit
Average annual LOM mining costs are summarized in Table 18-21.
| Table 18-21: | Operating Cost Summary by Cost Centre |
| | | Preproduction | | Production | | Total Mining Cost | |
| Cost Centre | | ($M) | | ($/t mined) | | ($/t moved) | | ($M) | | ($/t mined) | | ($/t moved) | | ($M) | | ($/t mined) | | ($/t moved) | |
| OP Management | | 0.85 | | 0.01 | | 0.01 | | 5.42 | | 0.02 | | 0.02 | | 6.27 | | 0.02 | | 0.02 | |
| OP Operations O/H | | 5.77 | | 0.09 | | 0.09 | | 37.04 | | 0.11 | | 0.11 | | 42.81 | | 0.11 | | 0.11 | |
| OP Engineering | | 4.43 | | 0.07 | | 0.07 | | 25.79 | | 0.08 | | 0.08 | | 30.22 | | 0.08 | | 0.08 | |
| OP Geology | | 3.27 | | 0.05 | | 0.05 | | 19.22 | | 0.06 | | 0.06 | | 22.49 | | 0.06 | | 0.06 | |
| OP Drilling | | 11.15 | | 0.18 | | 0.18 | | 66.21 | | 0.20 | | 0.20 | | 77.36 | | 0.20 | | 0.20 | |
| OP Blasting | | 34.82 | | 0.56 | | 0.56 | | 190.32 | | 0.59 | | 0.59 | | 225.14 | | 0.58 | | 0.58 | |
| OP Loading | | 25.07 | | 0.40 | | 0.40 | | 166.22 | | 0.51 | | 0.51 | | 191.29 | | 0.49 | | 0.49 | |
| OP Hauling | | 43.14 | | 0.69 | | 0.69 | | 385.42 | | 1.19 | | 1.19 | | 428.56 | | 1.11 | | 1.11 | |
| OP Stockpile Rehandle | | - | | - | | - | | 0.74 | | 0.00 | | 0.00 | | 0.74 | | 0.00 | | 0.00 | |
| OP Services | | 21.40 | | 0.34 | | 0.34 | | 153.62 | | 0.47 | | 0.47 | | 175.02 | | 0.45 | | 0.45 | |
| Operating Cost | | 149.9 | | 2.40 | | 2.40 | | 1,050.0 | | 3.24 | | 3.23 | | 1,199.90 | | 3.10 | | 3.10 | |
| Tonnes Mined | | 62.4 Mt | | 324.4 Mt | | 386.9 Mt | |
| Tonnes Rehandled | | - | | 0.8 Mt | | 0.8 Mt | |
| Tonnes Total | | 62.4 Mt | | 325.2 Mt | | 387.7 Mt | |
Note: Figures may not sum due to rounding. OP – open pit.
| | |
| Arctic Project | Page 367 |
| S-K 1300 Technical Report Summary | November 30, 2022 |
| | |
| Figure 18-4: | Total Material Mined and Mine Operating Cost |
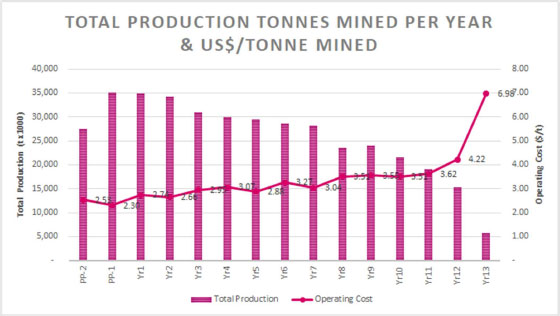
Source: Wood, 2022.
Table 18-22 provides a summary of the annual mining costs and unit mining costs for both primary production and total material mined.
| Table 18-22: | Annual Mine Expenditure |
| | | Mining Cost | | Primary Production | | Total Material Moved* | |
| Period | | ($ M) | | (kt) | | ($/t) | | (kt) | | ($/t) | |
| Year -2 | | 0.07 | | 27,400 | | 2.53 | | 27,400 | | 2.53 | |
| Year -1 | | 0.08 | | 35,044 | | 2.30 | | 35,044 | | 2.30 | |
| Year 1 | | 0.10 | | 34,077 | | 2.80 | | 34,853 | | 2.74 | |
| Year 2 | | 0.09 | | 34,190 | | 2.66 | | 34,190 | | 2.66 | |
| Year 3 | | 0.09 | | 31,015 | | 2.95 | | 31,015 | | 2.95 | |
| Year 4 | | 0.09 | | 30,000 | | 3.07 | | 30,000 | | 3.07 | |
| Year 5 | | 0.09 | | 29,500 | | 2.88 | | 29,500 | | 2.88 | |
| Year 6 | | 0.09 | | 28,563 | | 3.27 | | 28,563 | | 3.27 | |
| | |
| Arctic Project | Page 368 |
| S-K 1300 Technical Report Summary | November 30, 2022 |
| | |
| | | Mining Cost | | Primary Production | | Total Material Moved* | |
| Period | | ($ M) | | (kt) | | ($/t) | | (kt) | | ($/t) | |
| Year 7 | | 0.09 | | 28,063 | | 3.04 | | 28,063 | | 3.04 | |
| Year 8 | | 0.08 | | 23,500 | | 3.51 | | 23,500 | | 3.51 | |
| Year 9 | | 0.09 | | 24,000 | | 3.55 | | 24,000 | | 3.55 | |
| Year 10 | | 0.07 | | 21,572 | | 3.51 | | 21,572 | | 3.51 | |
| Year 11 | | 0.07 | | 19,000 | | 3.62 | | 19,000 | | 3.62 | |
| Year 12 | | 0.06 | | 15,280 | | 4.22 | | 15,280 | | 4.22 | |
| Year 13 | | 0.04 | | 5,655 | | 6.98 | | 5,655 | | 6.98 | |
| Total | | 1.20 | | 386,859 | | 3.10 | | 387,635 | | 3.10 | |
Note: Total Material Moved is inclusive of rehandle
| 18.2.2.1 | Mining Operating Cost Basis of Estimate |
The basis for the study unit costs and the consumption estimates are detailed in the following sub-sections.
Salaries were based on Wood’s database for similar projects, and benchmarking with publicly available salary ranges for mining job positions in Alaska. For hourly labour, Wood relied on local labour costs provided by Trilogy detailing expected hourly and salaried annual rates. Labour rates are inclusive of a 38% burden. Wood applied the labour rates to the staffing plan to estimate total labour costs.
| | |
| Arctic Project | Page 369 |
| S-K 1300 Technical Report Summary | November 30, 2022 |
| | |
| 18.2.2.3 | Maintenance and Repair Cost |
Equipment suppliers provided equipment maintenance and repair cost estimates in quotations obtained in 2022. Table 18-23 provides a listing of the average maintenance and repair costs for each major machine-type. Within the cost model a variable maintenance and repair cost was assigned every 6,000-hour increments.
The maintenance and repair costs provided by the equipment suppliers assume owner performed maintenance and include costs for:
| • | Planned maintenance, i.e., routine service and lubrication. |
| • | Major repair and rebuilds including parts and rebuild bench labour. |
Table 18-23: Maintenance and Repair Cost
| Equipment | | Cost
($/h) | |
| 171 mm Production Drill | | 106 | |
| 265 t/15 m3 Hydraulic Face Shovel | | 125 | |
| 124 t/12 m3 Front End Loader | | 66 | |
| 144 t Haul Truck | | 81 | |
| 41t Articulated Truck | | 21 | |
| 26 t/5 m3 Front End Loader | | 36 | |
| 68 t/4 m3 Hydraulic Excavator | | 29 | |
| 35 t/1.4 m3 Hydraulic Excavator | | 21 | |
| 74 t/455 kW Track Dozer | | 72 | |
| 50 t/419 kW Rubber Tired Dozer | | 63 | |
| 40 t Articulated Sand Truck | | 21 | |
| 33 t/217 kW Motor Grader | | 31 | |
| 35,000-litre water truck | | 21 | |
| | |
| Arctic Project | Page 370 |
| S-K 1300 Technical Report Summary | November 30, 2022 |
| | |
| Equipment | | Cost
($/h) | |
| 40t Articulated Fuel/Lube Truck | | 21 | |
| 18.2.2.4 | Diesel and Fuel Consumption |
Wood relied on a diesel fuel price of $1.04/L ($3.92/gal) provided by Ausenco - based on the 3-year trailing average weekly U.S. No 2 diesel ultra low sulphur retail price, adjusted for delivery to the project site. Diesel consumption for the haul trucks is estimated based on duty cycles. For all other machines, Wood used either the diesel consumption rates provided by equipment suppliers, or a consumption rate from the CAT Handbook Version 49 (Caterpillar, 2019). Consumption per operated hour for each machine is provided in Table 18-24.
Table 18-25 provides the annual diesel fuel requirements. Diesel fuel consumption peaks in Year 7 at 14.6 ML consumed.
Table 18-24: Equipment Fuel Burn Rates
| Equipment | | liters/op hour | |
| 171 mm Production Drill | | 83 | |
| 265 t/15 m3 Hydraulic Face Shovel | | 172 | |
| 124 t/12 m3 Front End Loader | | 90 | |
| 144 t Haul Truck | | 76 | |
| 41t Articulated Truck | | 22 | |
| 26 t/5 m3 Front End Loader | | 21 | |
| 68 t/4 m3 Hydraulic Excavator | | 40 | |
| 35 t/1.4 m3 Hydraulic Excavator | | 18 | |
| 74 t/455 kW Track Dozer | | 63 | |
| 50 t/419 kW Rubber Tired Dozer | | 45 | |
| 40 t Articulated Sand Truck | | 35 | |
| 33 t/217 kW Motor Grader | | 30 | |
| 35,000-litre water truck | | 35 | |
| 40t Articulated Fuel/Lube Truck | | 35 | |
| | |
| Arctic Project | Page 371 |
| S-K 1300 Technical Report Summary | November 30, 2022 |
| | |
| Table 18-25: | Annual Diesel Consumption |
| Period | | Hauling
(ML) | | Loading
(ML) | | Support
(ML) | | Drilling
(ML) | | Blasting
(ML) | | Total
(ML) | |
| Year -2 | | 4.6 | | 3.7 | | 2.3 | | 1.1 | | 0.2 | | 11.9 | |
| Year -1 | | 5.8 | | 3.7 | | 2.3 | | 1.3 | | 0.3 | | 13.4 | |
| Year 1 | | 6.3 | | 3.6 | | 2.3 | | 1.3 | | 0.3 | | 13.8 | |
| Year 2 | | 6.7 | | 3.6 | | 2.3 | | 1.3 | | 0.3 | | 14.2 | |
| Year 3 | | 6.4 | | 3.6 | | 2.3 | | 1.2 | | 0.3 | | 13.7 | |
| Year 4 | | 7.0 | | 3.5 | | 2.3 | | 1.2 | | 0.3 | | 14.3 | |
| Year 5 | | 7.3 | | 3.5 | | 2.3 | | 1.1 | | 0.3 | | 14.5 | |
| Year 6 | | 7.2 | | 3.5 | | 2.3 | | 1.1 | | 0.3 | | 14.3 | |
| Year 7 | | 7.5 | | 3.5 | | 2.3 | | 1.1 | | 0.2 | | 14.6 | |
| Year 8 | | 7.2 | | 2.9 | | 2.0 | | 1.0 | | 0.2 | | 13.3 | |
| Year 9 | | 7.9 | | 2.9 | | 2.0 | | 1.0 | | 0.2 | | 14.1 | |
| Year 10 | | 7.6 | | 2.9 | | 2.0 | | 1.0 | | 0.2 | | 13.7 | |
| Year 11 | | 7.9 | | 2.9 | | 2.0 | | 0.8 | | 0.2 | | 13.8 | |
| Year 12 | | 6.9 | | 3.0 | | 1.6 | | 0.6 | | 0.1 | | 12.2 | |
| Year 13 | | 2.3 | | 1.9 | | 1.6 | | 0.2 | | 0.1 | | 6.0 | |
| Total | | 98.5 | | 48.7 | | 31.8 | | 15.2 | | 3.4 | | 197.6 | |
A multinational explosives service company provided explosives product costs as part of the RFQ process. Costs for explosive products and the monthly service cost is shown in Table 18-26. Operating fee includes $228k/month for personnel and $2.5k/month for forklift equipment costs rental. Other blasting equipment such as mobile mixing units (MMU) and stemming trucks were incorporated as part of the mine auxiliary equipment. Transfer site cost was included as part of the mine capital cost.
| | |
| Arctic Project | Page 372 |
| S-K 1300 Technical Report Summary | November 30, 2022 |
| | |
| Table 18-26: | Blasting Explosives and Accessories Cost and Service Fee |
| Item | | Unit | | Value | |
| Blasting Product | | | | | |
| ANFO (Ammonium Nitrate – Fuel Oil) | | $/t | | 1,282 | |
| Bulk Emulsion | | $/t | | 2,042 | |
| Blasting Accessories | | | | | |
| Non-electric detonator | | $/ea | | 14.00 | |
| Surface delays | | $/ea | | 8.50 | |
| Booster 450 gram | | $/ea | | 8.45 | |
| Booster 900 gram | | $/ea | | 16.14 | |
| Monthly Service Fee | | | | | |
| Operating Fee | | $/month | | 230,625 | |
Tire pricing was provided by equipment vendors as part of the RFQ process. Tire pricing is shown in Table 18-27 along with tire lives used for estimating tire costs during operations.
Table 18-27: Tire Sizes, Pricing, and Life
| Machine | | Tires/machine | | Size | | Price each ($) | | Life (operating h) | |
| 124 t/12 m3 Front End Loader | | 4.00 | | 45/65R45 | | 43,750 | | 5,000 | |
| 144 t Haul Truck | | 6.00 | | 33.00R51 | | 20,214 | | 5,000 | |
| 41t Articulated Truck | | 6.00 | | 29.5R25 | | 5,560 | | 5,000 | |
| 26 t/5 m3 Front End Loader | | 4.00 | | 26.5R25 | | 18,559 | | 5,000 | |
| 50 t/419 kW Rubber Tired Dozer | | 4.00 | | 35/56-33 | | 12,787 | | 4,000 | |
| 40 t Articulated Sand Truck | | 6.00 | | 29.5R25 | | 5,560 | | 4,500 | |
| 33 t/217 kW Motor Grader | | 6.00 | | 23.5R25 | | 3,495 | | 4,000 | |
| 35,000-litre water truck | | 6.00 | | 29.5R25 | | 5,560 | | 4,500 | |
| 40t Articulated Fuel/Lube Truck | | 6.00 | | 29.5R25 | | 5,560 | | 4,500 | |
| | |
| Arctic Project | Page 373 |
| S-K 1300 Technical Report Summary | November 30, 2022 |
| | |
During the preproduction period, the 144-t truck tire lives were derated to 3,000 hours in Year -2 and 4,000 hours in Year-1 to account for poor road, pit, and dump conditions anticipated in the early years of the operation.
| 18.2.2.7 | Other Operating Costs |
Other operating costs account for 7.57% of the total operating costs. The other cost items are listed in Table 18-28.
| Table 18-28: | Other Operating Costs |
| Cost Item | | Percentage of Total
(%) | | | LOM Cost
($ M) | | | $/t Mined | |
| Drilling Supplies | | 1.14 | % | | 14.13 | | | 0.04 | |
| Auxiliary Equipment | | 2.65 | % | | 32.8 | | | 0.08 | |
| Ground Engaging Tools | | 1.26 | % | | 15.8 | | | 0.04 | |
| Equipment, Supplies, Materials | | 0.03 | % | | 0.39 | | | 0.00 | |
| Lubricants | | 2.33 | % | | 28.86 | | | 0.07 | |
| Other Miscellaneous Costs | | 0.16 | % | | 1.97 | | | 0.01 | |
| Total Cost | | 7.57 | % | | 93.74 | | | 0.24 | |
| 18.2.3 | Processing Operating Cost Estimate |
The LOM average process operating cost is $22.60/t milled. This estimated unit cost was based on the designed 10,000 t/d throughput rate. Table 18-29 summarizes the processing operating cost estimates. Labour costs based on a detailed staffing plan and local rates.
Operating costs include all regular, recurring costs of production, such as:
| • | General and administration (G&A) |
The operating cost estimates were calculated based on the following assumptions:
| • | Plant capacity per day of 10,000 t/d over LOM. |
| • | Crushing and mill plant availabilities at 65% and 92%, respectively. |
| • | Cost estimates were based on the third quarter (Q3) of 2022 pricing without allowances for inflation. |
| • | Relevant exchange rates were used to convert to the base currency of US dollars ($) |
| | |
| Arctic Project | Page 374 |
| S-K 1300 Technical Report Summary | November 30, 2022 |
| | |
| • | A diesel cost of $3.92/gal was based on the 3-year trailing average weekly U.S. No 2 diesel ultra low sulphur retail price, adjusted for delivery to the project site. |
| • | The power consumption cost was derived from the diesel cost at $0.289/kWh. |
| • | Labour will mainly be sourced from Alaska. |
| • | Operating and maintenance consumables were provided by different vendors such as Univar, Molycop, Metso-Outotec, etc. |
| • | Processing costs were determined based on labour, light vehicles and mobile equipment, operating and maintenance consumables and processing power requirements. |
| • | Road maintenance and road toll costs were provided by Trilogy. |
Table 18-29: Summary of Processing Operating Cost Estimates
| Description | | Average Annual LOM
Operating Cost
($ M) | | | Average Annual LOM
Operating Cost
($/t milled) | |
| Plant Operations Labour | | 7.0 | | | 2.86 | |
| Plant Maintenance Labour | | 7.5 | | | 3.06 | |
| Power Supply (Mill and Tailings) | | 25.2 | | | 10.24 | |
| Processing Consumables | | 12.7 | | | 5.16 | |
| Maintenance Consumables | | 2.9 | | | 1.18 | |
| Light Vehicles & Mobile Equipment | | 0.3 | | | 0.10 | |
| Total (Processing) | | 55.5 | | | 22.60 | |
Power costs were calculated from an estimate of annual power consumption and using a unit cost of $0.289/kWh.
The processing power draw was based on the average power utilisation of each motor on the electrical load list for the process plant and services. Diesel generators along with the fuel will be transported to the site to service the facilities at the site.
Annual energy consumption is estimated at 129,546 MWh/a, costing an annual average of $25.2 M/a over LOM.
Processing reagent and consumable costs were estimated based on the throughput. All costs include freight charges to site.
The operating consumables costs were developed with the following basis:
| • | Liner consumptions for the jaw crusher, SAG mill, Ball mill and regrind mill were determined based on the comminution and breakage data and Ausenco’s calculations and in-house database. |
| | |
| Arctic Project | Page 375 |
| S-K 1300 Technical Report Summary | November 30, 2022 |
| | |
| • | Grinding media consumption were based on the internal Ausenco calculations. |
| • | Reagent consumption was estimated from metallurgical testwork. |
| • | Filter cloth consumption were established by benchmarking different Ausenco projects. |
All costs associated with operating consumables not stated above were determined using quotations and commercial proposals provided by vendors
| 18.2.3.3 | Maintenance Consumables |
Annual maintenance consumable costs were calculated based on a total installed mechanical capital cost by area using a weighted average factor from 3% to 4%. The factor was applied to mechanical equipment, platework and piping. The total maintenance consumables operating costs is $1.18/t of feed.
Labour includes all processing and maintenance labour costs.
Processing production labour was provided by Trilogy and includes operation departments such as metallurgy, mill operations, maintenance, and the assay lab.
Each position was defined and classified as Salary and Wages. Costs included taxes and benefits. The annual cost is $10.3 M/a for process operations labour and $11.0 M/a for process maintenance labour. The estimated labour force for plant operations and plant maintenance was estimated at 69 and 74 people respectively. The estimate was based on providing a labour force to support continuous operations at 24 hr/d, 365 d/a.
Annual maintenance supplies costs were estimated as a percentage of major capital equipment costs plus an allowance for freight charges.
| 18.2.4 | General and Administrative and Surface Services Cost Estimates |
The LOM average G&A costs were estimated to be $5.85/t milled. These estimated costs were developed by Trilogy and Ausenco and include:
| • | Labour cost for the 57 administrative staff (27 hourly, and 30 salaried), with approximately 42 of these administrative staff onsite. These numbers included the 16 personnel (15 hourly and 1 salaried) surface operations crew. |
| • | Service cost for safety, training, medical and first aid expenditure, computer supplies and software, human resources services, and entertainment/membership. |
| • | Asset operations costs including operating vehicles, and warehouse costs. |
| • | Contract services expenditures, including insurance, consulting, relocation expenses, recruitment, auditing and legal services. |
| • | Camp costs and personnel transport. |
| • | Operation and maintenance of the airport. |
| | |
| Arctic Project | Page 376 |
| S-K 1300 Technical Report Summary | November 30, 2022 |
| | |
| • | Asset operations including heating, site services for general maintenance, general road maintenance, and ground transportation. |
| • | Other expenses including road dust suppression. |
| • | Other costs, including liaisons to local communities, sustainability costs, and an allowance for regional taxes and licenses. |
Table 18-30 shows a summary of the G&A cost estimate.
Table 18-30: G&A Cost Estimates
| Cost Description | | Annual Costs
($ M) | |
| Labour Costs – Salaried Staff | | 4.67 | |
| Labour Costs – Hourly Staff | | 3.92 | |
| Airport Operation | | 0.15 | |
| General Office Expense | | 0.11 | |
| Medical and First Aid | | 0.11 | |
| Environment | | 0.16 | |
| Travel | | 0.11 | |
| Training and Safety | | 0.16 | |
| Computer Supplies Including Software | | 0.11 | |
| Entertainment/Membership | | 0.06 | |
| Vehicles | | 0.31 | |
| Warehouse | | 0.22 | |
| Communications | | 0.44 | |
| Insurance | | 2.20 | |
| Consulting/External Assays | | 0.06 | |
| Relocation Expense | | 0.02 | |
| Recruitment | | 0.02 | |
| Audit | | 0.11 | |
| Legal Services | | 0.06 | |
| Rotational Travel and Camp | | 7.19 | |
| Surface Operations G&A | | 0.58 | |
| Surface Equipment | | 0.38 | |
| Liaison Committee/Sustainability | | 0.11 | |
| Other | | 0.11 | |
| Total (G&A) | | 21.3 | |
| | |
| Arctic Project | Page 377 |
| S-K 1300 Technical Report Summary | November 30, 2022 |
| | |
| 18.2.5 | Road Toll Cost Estimate |
Trilogy will pay road toll costs to use the AAP that is proposed to be built by AIDEA. AIDEA anticipates that there will be multiple users of the access road for multiple purposes with significantly different levels of use. These variables make it difficult to accurately project, at this time, what the estimated road toll will be for the Arctic Project. Trilogy provided Ausenco with the company’s view of the likely costs.
There is currently no road access to the project area. Access to the project area is proposed to be via the AAP road, which is approximately 340 km (211 miles) long, extending west from the Dalton Highway where it would connect with the proposed project area.
The working assumption for the 2020 FS report was that AIDEA would arrange financing in the form of a public-private partnership to arrange for the construction and maintenance of the access road. AIDEA would charge a toll to multiple mining and industrial users (including the Arctic Project) to pay back the costs of financing the AAP. This model is very similar to what AIDEA undertook when the DeLong Mountain Transportation System (also known as the Red Dog Mine Road and Port facilities) was constructed in the 1980s. The amount paid in tolls by any user would be affected by the cost of the road, its financing structure, and the number of mines and other users of the road which could also include commercial transportation of materials and consumer items that would use the AAP to ship concentrates to the Port of Anchorage in Alaska and possibly provide goods and commercial materials to villages in the region. This model has not changed in this Report.
For the purposes of this Report the $22M/a cost of the AAP toll is escalated from the 2020 FS, with an annual maintenance cost of an additional $9.1M/a. The final toll payments will be negotiated with AIDEA and the public-private partnership owners of the access road at some point in the future. A credit of $44M is applied towards road tolls payable in the first 2 years of operation to account for a pre-existing $35M investment, with an 8.0% annual interest rate, from Trilogy to AIDEA during the project development phase.
This equates to an average road toll and maintenance cost of $28.2 M annually over the LOM, or $7.72/t milled over the LOM.
| 18.2.6 | Water Treatment Costs |
Water treatment costs during the production period average $1.17/t milled over the LOM, or $4.2 M annually. These costs include Operation (labour, reagents, power) and maintenance costs for the RO WTP during plant operation. Reagents and chemical prices used are developed on a constant Q3/Q4 2022 basis, delivered to the project site. Operating costs for post-closure water treatment are captured under closure costs in Section 17.3.6.
| | |
| Arctic Project | Page 378 |
| S-K 1300 Technical Report Summary | November 30, 2022 |
| | |
| 19.1 | Forward-Looking Information Cautionary Statements |
Trilogy is subject to the reporting requirements of the Exchange Act and this filing and other U.S. reporting requirements are governed by Subpart 1300 of Regulation S-K promulgated by the SEC. The results of the economic analyses discussed in this section represent forward-looking statements within the meaning of applicable securities laws relating to Trilogy Metals. These statements by their nature involve substantial risks and uncertainties. Statements involving the foregoing results of economic analysis are forward-looking statements. Without limiting the generality of the foregoing, words such as “may”, “anticipate”, “intend”, “could”, “estimate”, or “continue” or the negative or other comparable terminology are intended to identify forward-looking statements. Should one or more of these risks or uncertainties materialize or should the underlying assumptions prove incorrect, actual outcomes and results could differ materially from those indicated in the forward-looking statements. Information that is forward-looking includes the following:
| • | Probable Mineral Reserves that have been modified from Indicated Mineral Resource estimates. |
| • | Assumed commodity prices and exchange rates. |
| • | Proposed mine and process production plan. |
| • | Projected mining and process recovery rates. |
| • | Ability to market the three types of concentrate on favourable terms. |
| • | Ability to control the levels of deleterious elements in some of the concentrate batches. |
| • | Sustaining costs and proposed operating costs. |
| • | Assumptions as to closure costs and closure requirements, including WTP requirements. |
| • | Assumptions as to development of the AMDIAP, timeframe of such development and assumed toll charges. |
| • | Assumptions as to ability to permit the project. |
| • | Assumptions about environmental, permitting and social risks. |
Additional risks to the forward-looking information include:
| • | Unrecognized environmental risks. |
| • | Unanticipated reclamation expenses. |
| • | Unexpected variations in quantity of mineralization, grade or recovery rates. |
| • | Geotechnical or hydrogeological considerations during operations being different from what was assumed |
| • | Failure of mining methods to operate as anticipated. |
| • | Failure of plant, equipment or processes to operate as anticipated. |
| | |
| Arctic Project | Page 379 |
| S-K 1300 Technical Report Summary | November 30, 2022 |
| | |
| • | Changes to assumptions as to the generation of electrical power, and the power rates used in the operating cost estimates and financial analysis. |
| • | Ability to maintain the social licence to operate. |
| • | Accidents, labour disputes and other risks of the mining industry. |
| • | Changes to interest rates. |
| • | Changes to applicable laws. |
| • | Receipt of all required permits. |
| • | An economic model was developed to estimate annual pre-tax and post-tax cash flows and sensitivities of the Arctic Project based on an 8% discount rate. |
| • | Years shown in the economic analysis are provided for conceptual purposes only. Permits still must be obtained in support of operations; and approval to proceed is still required from the Arctic Project’s owners. |
| 19.3 | Financial Model Parameters |
The Arctic Project will consist of a three-year pre-production construction period, followed by 13 years of production. Year -3 represents construction of a pioneer road and early purchases of equipment in preparation for site activities that occur in Year -2 and Year -1. The NPV and IRR were calculated at the beginning of the construction period in Year -3.
The cost and revenue estimates were assembled using real dollars, treating Year-3 as the base year. No escalation was applied to any of the estimates beyond this date.
The long-term consensus metal price assumptions were included in Section 16.2.
The LOM material tonnages and payable metal production used in the cash flow model are included in Table 19-1.
Table 19-1: Mine and Payable Metal Production for the Arctic Mine
| Description | | Units | | Value | |
| Total Tonnes Mined | | kt | | 390,189 | |
| Mill Feed | | kt | | 46,691 | |
| Concentrate | |
| Cu Concentrate | | kt | | 2,995 | |
| Zn Concentrate | | kt | | 2,228 | |
| | |
| Arctic Project | Page 380 |
| S-K 1300 Technical Report Summary | November 30, 2022 |
| | |
| Description | | Units | | Value | |
| Pb Concentrate | | kt | | 298 | |
| Payable Metal | |
| Payable Cu | | '000'lb | | 1,932,882 | |
| Payable Zn | | '000'lb | | 2,243,771 | |
| Payable Pb | | '000'lb | | 334,785 | |
| Payable Au | | '000'oz | | 423 | |
| Payable Ag | | '000'oz | | 36,047 | |
| 19.4.1 | Pre-Tax Financial Analysis |
| 19.4.1.1 | Basis of Pre-Tax Financial Evaluation |
The pre-tax financial model incorporated the production schedule and smelter term assumptions to produce annual recovered payable metal, or gross revenue, in each concentrate stream by year. Off-site costs, including the applicable refining and treatment costs, penalties, concentrate transportation charges, and marketing and representation fees, and royalties were then deducted from gross revenue to determine the NSR. Further details of the smelter terms used to calculate the recovered metal value and off-site operating costs can be found in Section 16. Royalties are discussed in Section 3.
The operating cash flow was produced by deducting annual mining, processing, G&A, surface services, and road toll & maintenance charges (Section 18.2) from the NSR.
Initial and sustaining capital (Section 18.1) was deducted from the operating cash flow in the years they occur, to determine the net cash flow before taxes.
Initial capital cost included all estimated expenditures in the construction period, from Year -3 to Year -1 inclusive. First production would occur at the beginning of Year 1. Sustaining capital expenditure includes all capital expenditures purchased after first production, including mine closure and rehabilitation.
Under the NANA Agreement, NANA has the right, following a construction decision, to elect to purchase a 16% to 25% direct interest in the Arctic Project or, alternatively, to receive a 15% Net Proceeds Royalty (refer to Section 3). This financial analysis was carried out on a 100% ownership basis and does not include any future potential impact on the Arctic Project interest if NANA elects to purchase an interest of between 16% and 25% in the Arctic Project under the NANA Agreement or, alternatively, the impact on the Arctic Project interest if the 15% net proceeds royalty becomes applicable. The financial analysis does include the 1.0% NSR to be granted to NANA under the NANA Agreement in exchange for a surface use agreement.
| | |
| Arctic Project | Page 381 |
| S-K 1300 Technical Report Summary | November 30, 2022 |
| | |
The financial analysis was carried out on a 100% Arctic Project ownership basis, of which Trilogy’s share is currently 50%.
| 19.4.1.2 | Pre-Tax Financial Results |
A summary of the pre-tax financial results is provided in Table 19-2. The presentation is on a 100% project ownership basis of which Trilogy currently holds a 50% interest.
| Table 19-2: | Summary of Pre-Tax Financial Results |
| Description | | Unit | | LOM Value | |
| Recovered Metal Value | | | | | |
| Copper | | $ million | | 7,055.0 | |
| Lead | | $ million | | 334.8 | |
| Zinc | | $ million | | 2,580.3 | |
| Gold | | $ million | | 697.8 | |
| Silver | | $ million | | 757.0 | |
| Total Recovered Metal Value | | $ million | | 11,424.9 | |
| Off-Site Operating Costs | | | | | |
| Royalties, Refining and Treatment Charges, Penalties, Insurance, Marketing and Representation & Concentrate Transportation | | $ million | | 2,969.1 | |
| On-Site Operating Costs | | | | | |
| Mining | | $/t milled | | 22.49 | |
| Processing | | $/t milled | | 22.60 | |
| G&A | | $/t milled | | 5.85 | |
| Water Treatment | | $/t milled | | 1.17 | |
| Road Toll | | $/t milled | | 7.72 | |
| Total Operating Cost over LOM | | $/t milled | | 59.83 | |
| Total Operating Cost | | $ million | | 2,793.6 | |
| Capital Expenditure | | | | | |
| Initial Capital | | $ million | | 1,176.8 | |
| | |
| Arctic Project | Page 382 |
| S-K 1300 Technical Report Summary | November 30, 2022 |
| | |
| Description | | Unit | | LOM Value | |
| Sustaining Capital | | $ million | | 114.4 | |
| Mine Closure & Reclamation | | $ million | | 428.4 | |
| Total Capital Expenditure | | $ million | | 1,719.6 | |
| Financial Summary | | | | | |
| Pre-tax Undiscounted Cash Flow | | $ million | | 3,942.6 | |
| Pre-Tax NPV at 8% | | $ million | | 1,500.3 | |
| Cash Costs, Net of By-product Credits | | $/lb Cu payable | | 0.72 | |
| All-in Cost*, Net of By-product Credits | | $/lb Cu payable | | 1.61 | |
| Pre-Tax IRR | | % | | 25.8 | |
| Pre-Tax Payback Period | | years | | 2.9 | |
Note: *All-in cost includes all operating and sustaining capital costs
| 19.4.2 | Post-Tax Financial Analysis |
The following tax regimes were incorporated in the post-tax analysis as provided by EY: US Federal Income Tax, Alaska State Income Tax (AST), and Alaska Mining License Tax (AMLT). Taxes were calculated based on currently enacted United States and State of Alaska tax laws and regulations, including the US Federal enactment of the Tax Cuts & Jobs Act (TCJA) on December 22, 2017, and the Coronavirus Aid, Relief and Economic Security Act (CARES Act) on March 27, 2020.
The Alaska Production Royalty tax of 3% is not applicable to the Arctic Project as the Arctic Project’s claims are all federal mining patented claims.
For tax years beginning on or after January 01, 2018, the US Federal income tax corporate rate is 21% of taxable income, as opposed to a 35% rate which was applicable to prior tax years. Taxable income is calculated as revenues less allowable costs. In addition to other allowable costs, Alaska State Income Tax, AMLT, tax depreciation and the greater of the cost depletion or percentage depletion can be deducted. Cost depletion is the ratable recovery of cost basis as units are produced and sold, however, as noted, cost depletion is not calculated in the model because the initial cost basis of the mineral property has not been provided. IRC §613(a) governs percentage depletion and provides that the deduction for depletion shall be a statutorily prescribed percentage of the taxpayer’s gross income from the mineral property during the taxable year. Such allowance shall not exceed 50% of the taxpayer’s taxable income from the property that is mining related. Relevant statutorily prescribed percentages are 15% for gold, silver and copper, and 22% for lead and zinc. As a result of the TCJA, losses incurred for tax years beginning on or after January 01, 2018, are not eligible to be carried back to prior tax years but may be carried forward indefinitely. However, losses generated under the TCJA are only eligible to offset 80% of taxable income in future years.
| | |
| Arctic Project | Page 383 |
| S-K 1300 Technical Report Summary | November 30, 2022 |
| | |
For the purposes of this Report, as a stand-alone project, it was assumed that the initial adjusted cost base of the depletable and depreciable property was zero and that the initial loss carry-forwards were zero.
Alaska State Taxes (AST) are determined on a basis similar to US federal tax. AST is calculated using a graduated rate table times taxable income with 9.4% being the highest applicable rate, where taxable income is calculated on the same basis as US federal tax (except that State tax is not deductible). The Alaskan Alternative Minimum Tax (“AMT”) statutes are tied to the federal AMT statutes; therefore, the repeal of federal corporate AMT has effectively repealed Alaskan State AMT for tax years beginning on or after January 1, 2018.
| 19.4.2.3 | Alaska Mining License Tax |
The Alaska Mining Licence Tax (AMLT) is an income-based tax imposed on the mining income calculated for AST purposes, before any deduction of AMLT, except the percentage depletion is the lower of 15% of net metal revenues and 50% of net income before depletion. No loss carry-forwards or carry-backs are applied when calculating income subject to AMLT. No AMLT tax is charged for the first 3.5 years following commencement of production. In each year, AMLT can be reduced by up to 50% through the application of “Exploration Incentive Credits” (EICs); however, the credits may not exceed $20m in the aggregate for a mining operation and the credits must be utilized within 15 years. Note the EICs can be utilized against AST as well.
For the purposes of this Report, as a stand-alone project evaluated at the project level, it was assumed that the initial EIC balance is zero even though the Trilogy has a history of exploration at the Arctic Project. It was also assumed that no EICs would be earned over the life of the Arctic Project.
| 19.4.2.4 | Post-Tax Financial Results |
At the base case metal prices used for the Report, the total estimated taxes payable on the Arctic Project profits are $922.7 million over the 13-year mine life.
The post-tax financial results are summarized in Table 19-3.
| Table 19-3: | Summary of Post-Tax Financial Results |
| Description | | Unit | | LOM Value | |
| Financial Summary | | | | | |
| Income Tax | | $ million | | 922.7 | |
| Post-Tax Undiscounted Cash Flow | | $ million | | 3,019.9 | |
| Post-tax NPV at 8% | | $ million | | 1,108.1 | |
| Post-Tax IRR | | % | | 22.8 | |
| Post-Tax Payback Period | | years | | 3.1 | |
The annual production schedule and estimated cash flow forecast for the Arctic Project can be found in Table 19-4. The presentation is on a 100% Arctic Project ownership basis. Trilogy holds 50% interest in Ambler Metals.
| | |
| Arctic Project | Page 384 |
| S-K 1300 Technical Report Summary | November 30, 2022 |
| | |
| Table 19-4: | Pre and Post-Tax Arctic Project Production and Cashflow Forecast |
| Arctic Project | | Units | | LOM | | | Year
-3 | | | Year
-2 | | | Year
-1 | | | Year
1 | | | Year
2 | | | Year
3 | | | Year
4 | | | Year
5 | | | Year
6 | | | Year
7 | | | Year
8 | | | Year
9 | | | Year
10 | | | Year
11 | | | Year
12 | | | Year
13 | | | Year
14 | |
| Mill Feed | | ktonnes | | 46,691 | | | | - | | | - | | | - | | | 3,012 | | | 3,650 | | | 3,650 | | | 3,650 | | | 3,650 | | | 3,650 | | | 3,650 | | | 3,651 | | | 3,650 | | | 3,650 | | | 3,650 | | | 3,650 | | | 3,529 | | | - | |
| Cu | | % | | 2.11 | | | | - | | | - | | | - | | | 3.32 | | | 2.18 | | | 1.94 | | | 1.88 | | | 1.87 | | | 1.99 | | | 2.37 | | | 2.00 | | | 2.05 | | | 2.33 | | | 2.41 | | | 1.98 | | | 2.09 | | | - | |
| Zn | | % | | 2.90 | | | | - | | | - | | | - | | | 3.62 | | | 2.59 | | | 2.61 | | | 2.82 | | | 2.86 | | | 2.51 | | | 3.11 | | | 3.07 | | | 2.51 | | | 3.09 | | | 3.41 | | | 3.15 | | | 3.20 | | | - | |
| Pb | | % | | 0.56 | | | | - | | | - | | | - | | | 0.75 | | | 0.46 | | | 0.56 | | | 0.58 | | | 0.53 | | | 0.49 | | | 0.57 | | | 0.61 | | | 0.39 | | | 0.53 | | | 0.64 | | | 0.66 | | | 0.69 | | | - | |
| Au | | % | | 0.42 | | | | - | | | - | | | - | | | 0.43 | | | 0.31 | | | 0.39 | | | 0.42 | | | 0.33 | | | 0.34 | | | 0.40 | | | 0.44 | | | 0.37 | | | 0.50 | | | 0.56 | | | 0.47 | | | 0.52 | | | - | |
| Ag | | % | | 31.83 | | | | - | | | - | | | - | | | 39.30 | | | 29.44 | | | 28.42 | | | 28.03 | | | 26.36 | | | 28.66 | | | 31.75 | | | 32.44 | | | 28.50 | | | 36.80 | | | 38.68 | | | 34.08 | | | 38.39 | | | - | |
| Concentrate | | | | | | | | | | | | | | | | | | | | | | | | | | | | | | | | | | | | | | | | | | | | | | | |
| Cu Concentrate | | ktonnes | | 2,995 | | | | - | | | - | | | - | | | 232.4 | | | 227.7 | | | 223.4 | | | 213.4 | | | 210.7 | | | 221.9 | | | 258.0 | | | 219.9 | | | 226.8 | | | 252.4 | | | 265.3 | | | 221.9 | | | 221.2 | | | - | |
| Cu Recovery | | % | | 92.1 | | | | - | | | - | | | - | | | 92.1 | | | 92.1 | | | 92.1 | | | 92.1 | | | 92.1 | | | 92.1 | | | 92.1 | | | 92.1 | | | 92.1 | | | 92.1 | | | 92.1 | | | 92.1 | | | 92.1 | | | - | |
| Cu Concentrate Grade | | % | | 30.3 | | | | - | | | - | | | - | | | 30.3 | | | 30.3 | | | 30.3 | | | 30.3 | | | 30.3 | | | 30.3 | | | 30.3 | | | 30.3 | | | 30.3 | | | 30.3 | | | 30.3 | | | 30.3 | | | 30.3 | | | - | |
| Cu Payable | | % | | 96.5 | | | | - | | | - | | | - | | | 96.5 | | | 96.5 | | | 96.5 | | | 96.5 | | | 96.5 | | | 96.5 | | | 96.5 | | | 96.5 | | | 96.5 | | | 96.5 | | | 96.5 | | | 96.5 | | | 96.5 | | | - | |
| Ag Concentrate Grade | | g/t | | 161 | | | | - | | | - | | | - | | | 161.3 | | | 161.3 | | | 161.3 | | | 161.3 | | | 161.3 | | | 161.3 | | | 161.3 | | | 161.3 | | | 161.3 | | | 161.3 | | | 161.3 | | | 161.3 | | | 161.3 | | | - | |
| Ag Payable | | % | | 90.0 | | | | - | | | - | | | - | | | 90.0 | | | 90.0 | | | 90.0 | | | 90.0 | | | 90.0 | | | 90.0 | | | 90.0 | | | 90.0 | | | 90.0 | | | 90.0 | | | 90.0 | | | 90.0 | | | 90.0 | | | - | |
| Zn Concentrate | | ktonnes | | 2,228 | | | | - | | | - | | | - | | | 142.2 | | | 149.8 | | | 156.6 | | | 169.7 | | | 172.6 | | | 152.1 | | | 186.0 | | | 184.9 | | | 151.3 | | | 184.8 | | | 203.3 | | | 189.4 | | | 185.7 | | | - | |
| Zn Recovery | | % | | 88.5 | | | | - | | | - | | | - | | | 88.5 | | | 88.5 | | | 88.5 | | | 88.5 | | | 88.5 | | | 88.5 | | | 88.5 | | | 88.5 | | | 88.5 | | | 88.5 | | | 88.5 | | | 88.5 | | | 88.5 | | | - | |
| Zn Concentrate Grade | | % | | 53.7 | | | | - | | | - | | | - | | | 53.7 | | | 53.7 | | | 53.7 | | | 53.7 | | | 53.7 | | | 53.7 | | | 53.7 | | | 53.7 | | | 53.7 | | | 53.7 | | | 53.7 | | | 53.7 | | | 53.7 | | | - | |
| Zn Payable in Concentrate | | % | | 85.0 | | | | - | | | - | | | - | | | 85.0 | | | 85.0 | | | 85.0 | | | 85.0 | | | 85.0 | | | 85.0 | | | 85.0 | | | 85.0 | | | 85.0 | | | 85.0 | | | 85.0 | | | 85.0 | | | 85.0 | | | - | |
| Pb Concentrate | | ktonnes | | 298 | | | | - | | | - | | | - | | | 19.7 | | | 21.3 | | | 23.3 | | | 23.5 | | | 21.7 | | | 20.8 | | | 24.1 | | | 24.4 | | | 17.7 | | | 22.7 | | | 26.4 | | | 26.2 | | | 26.4 | | | - | |
| Pb Recovery | | % | | 61.3 | | | | - | | | - | | | - | | | 61.3 | | | 61.3 | | | 61.3 | | | 61.3 | | | 61.3 | | | 61.3 | | | 61.3 | | | 61.3 | | | 61.3 | | | 61.3 | | | 61.3 | | | 61.3 | | | 61.3 | | | - | |
| Pb Concentrate Grade | | % | | 53.9 | | | | - | | | - | | | - | | | 53.9 | | | 53.9 | | | 53.9 | | | 53.9 | | | 53.9 | | | 53.9 | | | 53.9 | | | 53.9 | | | 53.9 | | | 53.9 | | | 53.9 | | | 53.9 | | | 53.9 | | | - | |
| Pb Payable | | % | | 95.0 | | | | - | | | - | | | - | | | 95.0 | | | 95.0 | | | 95.0 | | | 95.0 | | | 95.0 | | | 95.0 | | | 95.0 | | | 95.0 | | | 95.0 | | | 95.0 | | | 95.0 | | | 95.0 | | | 95.0 | | | - | |
| Ag Concentrate Grade | | g/t | | 2,424 | | | | - | | | - | | | - | | | 2,424 | | | 2,424 | | | 2,424 | | | 2,424 | | | 2,424 | | | 2,424 | | | 2,424 | | | 2,424 | | | 2,424 | | | 2,424 | | | 2,424 | | | 2,424 | | | 2,424 | | | - | |
| Ag Payable | | % | �� | 95.0 | | | | - | | | - | | | - | | | 95.00 | | | 95.00 | | | 95.00 | | | 95.00 | | | 95.00 | | | 95.00 | | | 95.00 | | | 95.00 | | | 95.00 | | | 95.00 | | | 95.00 | | | 95.00 | | | 95.00 | | | - | |
| Au Concentrate Grade | | g/t | | 14 | | | | - | | | - | | | - | | | 14.2 | | | 14.2 | | | 14.2 | | | 14.2 | | | 14.2 | | | 14.2 | | | 14.2 | | | 14.2 | | | 14.2 | | | 14.2 | | | 14.2 | | | 14.2 | | | 14.2 | | | | |
| Au Payable | | % | | 95.0 | | | | - | | | - | | | - | | | 95.00 | | | 95.00 | | | 95.00 | | | 95.00 | | | 95.00 | | | 95.00 | | | 95.00 | | | 95.00 | | | 95.00 | | | 95.00 | | | 95.00 | | | 95.00 | | | 95.00 | | | - | |
| Payable Metal | | | | | | | | | | | | | | | | | | | | | | | | | | | | | | | | | | | | | | | | | | | | | | | |
| Payable Cu | | (‘000’lb) | | 1,932,882 | | | | - | | | - | | | - | | | 151,175 | | | 146,013 | | | 142,583 | | | 137,387 | | | 134,852 | | | 141,803 | | | 167,411 | | | 142,499 | | | 143,517 | | | 163,112 | | | 173,249 | | | 144,427 | | | 144,855 | | | - | |
| Payable Zn | | (‘000’lb) | | 2,243,771 | | | | - | | | - | | | - | | | 143,256 | | | 149,381 | | | 156,519 | | | 170,411 | | | 173,700 | | | 151,480 | | | 188,011 | | | 186,782 | | | 150,724 | | | 186,729 | | | 206,931 | | | 191,688 | | | 188,157 | | | - | |
| Payable Pb | | (‘000’lb) | | 334,785 | | | | - | | | - | | | - | | | 21,068 | | | 23,396 | | | 26,443 | | | 27,266 | | | 24,590 | | | 22,721 | | | 26,400 | | | 28,209 | | | 18,325 | | | 24,684 | | | 29,618 | | | 30,845 | | | 31,220 | | | - | |
| | |
| Arctic Project | Page 385 |
| S-K 1300 Technical Report Summary | November 30, 2022 |
| | |
| | |
| | |
Arctic
Project | | Units | | LOM | | | Year
-3 | | | Year
-2 | | | Year
-1 | | | Year
1 | | | Year
2 | | | Year
3 | | | Year
4 | | | Year
5 | | | Year
6 | | | Year
7 | | | Year
8 | | | Year
9 | | | Year
10 | | | Year
11 | | | Year
12 | | | Year
13 | | | Year
14 | |
| Payable Au | | (‘000’oz) | | 423 | | | | - | | | - | | | - | | | 22 | | | 29 | | | 31 | | | 34 | | | 26 | | | 26 | | | 30 | | | 34 | | | 28 | | | 38 | | | 45 | | | 38 | | | 40 | | | - | |
| Payable Ag | | (‘000’oz) | | 36,047 | | | | - | | | - | | | - | | | 2,362 | | | 2,530 | | | 2,593 | | | 2,541 | | | 2,355 | | | 2,512 | | | 2,755 | | | 2,877 | | | 2,446 | | | 3,179 | | | 3,449 | | | 3,112 | | | 3,336 | | | - | |
| Recovered Metal Value | | | | | | | | | | | | | | | | | | | | | | | | | | | | | | | | | | | | | | | | | | | | | | | | | | | | | | | | | |
| Recovered Metal Value | | $ M | | 11,424.9 | | | | - | | | - | | | - | | | 824.2 | | | 828.9 | | | 833.0 | | | 833.8 | | | 809.4 | | | 810.3 | | | 961.8 | | | 880.4 | | | 813.4 | | | 964.6 | | | 1,046.7 | | | 906.2 | | | 912.2 | | | - | |
| Off-Site Charges | | | | - | | | | | | | | | | | | | | | | | | | | | | | | | | | | | | | | | | | | | | | | | | | | | | | | | | | | | |
| Royalties, Insurance, Marketing and Representation Fees, Refining, Treatment, Concentrate Transport, and Penalties | | $ M | | 2,969.1 | | | | - | | | - | | | - | | | 210.2 | | | 213.4 | | | 216.9 | | | 219.4 | | | 217.8 | | | 211.4 | | | 250.8 | | | 232.1 | | | 210.8 | | | 246.8 | | | 266.8 | | | 237.3 | | | 235.4 | | | - | |
| Capital Costs | | | | | | | | | | | | | | | | | | | | | | | | | | | | | | | | | | | | | | | | | | | | | | | | | | | | | | | | | |
| Mining | | $ M | | 314.2 | | | | 97.0 | | | 111.5 | | | 88.2 | | | 0.1 | | | - | | | - | | | 1.5 | | | - | | | 0.8 | | | 0.8 | | | 0.2 | | | 8.9 | | | 1.9 | | | 0.3 | | | 3.0 | | | - | | | - | |
| Crushing | | $ M | | 42.5 | | | | - | | | 14.2 | | | 28.4 | | | - | | | - | | | - | | | - | | | - | | | - | | | - | | | - | | | - | | | - | | | - | | | - | | | - | | | - | |
| Processing | | $ M | | 159.3 | | | | - | | | 79.5 | | | 78.5 | | | - | | | - | | | 0.2 | | | 0.2 | | | 0.2 | | | 0.2 | | | 0.2 | | | 0.2 | | | 0.2 | | | - | | | - | | | - | | | - | | | - | |
| Tailings | | $ M | | 120.7 | | | | - | | | 38.4 | | | 49.9 | | | 7.9 | | | - | | | 2.7 | | | 8.2 | | | - | | | 1.2 | | | 12.4 | | | - | | | - | | | - | | | - | | | - | | | - | | | - | |
| On-Site Infrastructure | | $ M | | 207.9 | | | | 19.0 | | | 61.7 | | | 92.1 | | | - | | | - | | | - | | | - | | | - | | | - | | | - | | | - | | | - | | | 17.5 | | | 17.5 | | | - | | | - | | | - | |
| Off-Site Infrastructure | | $ M | | 75.8 | | | | 20.1 | | | 31.1 | | | 24.6 | | | - | | | - | | | - | | | - | | | - | | | - | | | - | | | - | | | - | | | - | | | - | | | - | | | - | | | - | |
| Indirects | | $ M | | 192.5 | | | | 60.9 | | | 62.9 | | | 53.5 | | | - | | | - | | | - | | | - | | | - | | | - | | | - | | | - | | | - | | | 7.6 | | | 7.6 | | | - | | | - | | | - | |
| Owner’s Cost | | $ M | | 26.8 | | | | 7.9 | | | 9.4 | | | 9.4 | | | - | | | - | | | - | | | - | | | - | | | - | | | - | | | - | | | - | | | - | | | - | | | - | | | - | | | - | |
| Mine Closure | | $ M | | 428.4 | | | | - | | | - | | | - | | | - | | | - | | | - | | | - | | | - | | | - | | | - | | | - | | | - | | | - | | | - | | | - | | | - | | | 428.4 | |
| Contingency | | $ M | | 151.5 | | | | 23.5 | | | 69.1 | | | 46.0 | | | - | | | - | | | - | | | - | | | - | | | - | | | - | | | - | | | - | | | 6.5 | | | 6.5 | | | - | | | - | | | - | |
| Total Capital Costs | | $ M | | 1,719.6 | | | | 234.4 | | | 473.2 | | | 469.2 | | | 8.0 | | | - | | | 2.8 | | | 9.9 | | | 0.2 | | | 2.1 | | | 13.4 | | | 0.4 | | | 9.1 | | | 33.5 | | | 31.9 | | | 3.0 | | | - | | | 428.4 | |
| Operating Costs | | | | | | | | | | | | | | | | | | | | | | | | | | | | | | | | | | | | | | | | | | | | | | | | | | | | | | | | | |
| Mining | | LOM - $/t mined | | 22.49 | | | | - | | | - | | | - | | | 31.71 | | | 24.92 | | | 25.08 | | | 25.20 | | | 23.30 | | | 25.59 | | | 23.36 | | | 22.62 | | | 23.36 | | | 20.75 | | | 18.84 | | | 17.67 | | | 11.19 | | | - | |
| | $ M | | 1,050.0 | | | | - | | | - | | | - | | | 95.5 | | | 91.0 | | | 91.5 | | | 92.0 | | | 85.1 | | | 93.4 | | | 85.2 | | | 82.6 | | | 85.3 | | | 75.7 | | | 68.8 | | | 64.5 | | | 39.5 | | | - | | |
| Processing | | LOM - $/t milled | | 22.60 | | | | - | | | - | | | - | | | 23.91 | | | 22.33 | | | 22.50 | | | 22.50 | | | 22.50 | | | 22.50 | | | 22.50 | | | 22.50 | | | 22.50 | | | 22.50 | | | 22.50 | | | 22.50 | | | 22.77 | | | - | |
| | $ M | | 1,055.2 | | | | - | | | - | | | - | | | 72.0 | | | 81.5 | | | 82.1 | | | 82.1 | | | 82.1 | | | 82.1 | | | 82.1 | | | 82.1 | | | 82.1 | | | 82.1 | | | 82.1 | | | 82.1 | | | 80.3 | | | - | |
| Water Treatment | | LOM - $/t milled | | 1.17 | | | | - | | | - | | | - | | | 1.40 | | | 1.15 | | | 1.15 | | | 1.15 | | | 1.15 | | | 1.15 | | | 1.15 | | | 1.15 | | | 1.15 | | | 1.15 | | | 1.15 | | | 1.15 | | | 1.19 | | | - | |
| | $ M | | 54.7 | | | | - | | | - | | | - | | | 4.2 | | | 4.2 | | | 4.2 | | | 4.2 | | | 4.2 | | | 4.2 | | | 4.2 | | | 4.2 | | | 4.2 | | | 4.2 | | | 4.2 | | | 4.2 | | | 4.2 | | | - | |
| G&A | | LOM - $/t milled | | 5.85 | | | | - | | | - | | | - | | | 6.97 | | | 5.75 | | | 5.75 | | | 5.75 | | | 5.75 | | | 5.75 | | | 5.75 | | | 5.75 | | | 5.75 | | | 5.75 | | | 5.75 | | | 5.75 | | | 5.95 | | | - | |
| | $ M | | 273.0 | | | | - | | | - | | | - | | | 21.0 | | | 21.0 | | | 21.0 | | | 21.0 | | | 21.0 | | | 21.0 | | | 21.0 | | | 21.0 | | | 21.0 | | | 21.0 | | | 21.0 | | | 21.0 | | | 21.0 | | | - | |
| Road Toll | | LOM - $/t milled | | 7.72 | | | | - | | | - | | | - | | | 3.03 | | | 2.50 | | | 8.53 | | | 8.53 | | | 8.53 | | | 8.53 | | | 8.53 | | | 8.53 | | | 8.53 | | | 8.53 | | | 8.53 | | | 8.53 | | | 8.82 | | | - | |
| | | $ M | | 360.6 | | | | - | | | - | | | - | | | 9.1 | | | 9.1 | | | 31.1 | | | 31.1 | | | 31.1 | | | 31.1 | | | 31.1 | | | 31.1 | | | 31.1 | | | 31.1 | | | 31.1 | | | 31.1 | | | 31.1 | | | - | |
| | |
| Arctic Project | Page 386 |
| S-K 1300 Technical Report Summary | November 30, 2022 |
| | |
| | |
| | |
| Arctic Project | | Units | | LOM | | | Year
-3 | | | Year
-2 | | | Year
-1 | | | Year
1 | | | Year
2 | | | Year
3 | | | Year
4 | | | Year
5 | | | Year
6 | | | Year
7 | | | Year
8 | | | Year
9 | | | Year
10 | | | Year
11 | | | Year
12 | | | Year
13 | | | Year
14 | |
| Total Operating Costs | | LOM - $/t milled | | 59.83 | | | - | | | - | | | - | | | 67.02 | | | 56.65 | | | 63.02 | | | 63.14 | | | 61.24 | | | 63.52 | | | 61.29 | | | 60.56 | | | 61.30 | | | 58.69 | | | 56.78 | | | 55.61 | | | 49.92 | | | - | |
| | $ M | | 2,793.6 | | | - | | | - | | | - | | | 201.8 | | | 206.8 | | | 230.0 | | | 230.5 | | | 223.5 | | | 231.9 | | | 223.7 | | | 221.1 | | | 223.7 | | | 214.2 | | | 207.3 | | | 203.0 | | | 176.1 | | | - | |
| Undiscounted Pre-Tax Cash Flow | | $ M | | 3,942.6 | | | (234.4 | ) | | (473.2 | ) | | (469.2 | ) | | 404.3 | | | 408.7 | | | 383.3 | | | 374.1 | | | 367.9 | | | 364.9 | | | 473.8 | | | 426.9 | | | 369.7 | | | 470.1 | | | 540.7 | | | 462.9 | | | 500.6 | | | (428.4 | ) |
| Discounted Pre-Tax Cash Flow at 8% Discount Rate | | $ M | | 1,500.3 | | | (217.0 | ) | | (405.7 | ) | | (372.4 | ) | | 297.1 | | | 278.1 | | | 241.5 | | | 218.3 | | | 198.8 | | | 182.5 | | | 219.5 | | | 183.1 | | | 146.8 | | | 172.8 | | | 184.1 | | | 145.9 | | | 146.1 | | | (115.8 | ) |
| Income Tax | | $ M | | -922.7 | | | - | | | - | | | - | | | -10.4 | | | -11.3 | | | -30.0 | | | -61.2 | | | -64.6 | | | -67.7 | | | -106.4 | | | -90.5 | | | -76.6 | | | -112.6 | | | -132.3 | | | -101.2 | | | -57.9 | | | - | |
| Undiscounted Post-Tax Cash Flow | | $ M | | 3,019.9 | | | -234.4 | | | -473.2 | | | -469.2 | | | 393.8 | | | 397.3 | | | 353.3 | | | 312.9 | | | 303.3 | | | 297.2 | | | 367.5 | | | 336.5 | | | 293.0 | | | 357.5 | | | 408.4 | | | 361.7 | | | 442.7 | | | -428.4 | |
| Discounted Post-Tax Cash Flow at 8% Discount Rate | | $ M | | 1,108.1 | | | -217.0 | | | -405.7 | | | -372.4 | | | 289.5 | | | 270.4 | | | 222.6 | | | 182.6 | | | 163.9 | | | 148.6 | | | 170.2 | | | 144.3 | | | 116.4 | | | 131.5 | | | 139.0 | | | 114.0 | | | 129.2 | | | -115.8 | |
| | |
| Arctic Project | Page 387 |
| S-K 1300 Technical Report Summary | November 30, 2022 |
| | |
Ausenco investigated the sensitivity of the Arctic Project’s pre-tax NPV, and IRR to several project variables. The following variables were elected for this analysis:
| • | Off-site operating costs (royalties, refining and treatment charges, penalties, insurance, marketing, and representation fees, and concentrate transportation). |
Each variable was changed in increments of 10% between -20% to +20% while holding all other variables constant. Figure 19-1, Figure 19-2 and Table 19-5 show the results of the pre-tax sensitivity analysis.
The metal grade is not presented in these sensitivity graphs because the impacts of changes to metal grade mirror those of metal prices.
| | |
| Arctic Project | Page 388 |
| S-K 1300 Technical Report Summary | November 30, 2022 |
| | |
Table 19-5: Pre-Tax Sensitivity Summary
| Pre-Tax Sensitivity Tables | |
| Pre-Tax NPV Sensitivity To On-Site Opex | | | | Pre-Tax IRR Sensitivity To On-Site Opex | |
| | On-Site Opex | | | | Commodity Price | | | | On-Site Opex | | | | Commodity Price | |
| $ | 1,500 | | | | (20.0 | )% | | | (10.0 | )% | | | -- | | | | 10.0 | % | | | 20.0 | % | | | 26 | % | | | (20.0 | )% | | | (10.0 | )% | | | -- | | | | 10.0 | % | | | 20.0 | % |
| | (20.0 | )% | | $ | 693 | | | $ | 1,233 | | | $ | 1,773 | | | $ | 2,314 | | | $ | 2,854 | | | | (20.0 | )% | | | 17.4 | % | | | 23.2 | % | | | 28.4 | % | | | 33.1 | % | | | 37.5 | % |
| | (10.0 | )% | | $ | 556 | | | $ | 1,097 | | | $ | 1,637 | | | $ | 2,177 | | | $ | 2,717 | | | | (10.0 | )% | | | 15.8 | % | | | 21.8 | % | | | 27.1 | % | | | 31.9 | % | | | 36.4 | % |
| | -- | | | $ | 420 | | | $ | 960 | | | $ | 1,500 | | | $ | 2,041 | | | $ | 2,581 | | | | -- | | | | 14.1 | % | | | 20.4 | % | | | 25.8 | % | | | 30.7 | % | | | 35.2 | % |
| | 10.0 | % | | $ | 283 | | | $ | 824 | | | $ | 1,364 | | | $ | 1,904 | | | $ | 2,444 | | | | 10.0 | % | | | 12.2 | % | | | 18.8 | % | | | 24.4 | % | | | 29.5 | % | | | 34.1 | % |
| | 20.0 | % | | $ | 147 | | | $ | 687 | | | $ | 1,227 | | | $ | 1,767 | | | $ | 2,308 | | | | 20.0 | % | | | 10.3 | % | | | 17.3 | % | | | 23.1 | % | | | 28.2 | % | | | 32.9 | % |
| Pre-Tax NPV Sensitivity To Off-Site Opex | | | | Pre-Tax IRR Sensitivity To Off-Site Opex | |
| | Off-Site Opex | | | | Commodity Price | | | | Off-Site Opex | | | | Commodity Price | |
| $ | 1,500 | | | | (20.0 | )% | | | (10.0 | )% | | | -- | | | | 10.0 | % | | | 20.0 | % | | | 26 | % | | | (20.0 | )% | | | (10.0 | )% | | | -- | | | | 10.0 | % | | | 20.0 | % |
| | (20.0 | )% | | $ | 702 | | | $ | 1,243 | | | $ | 1,784 | | | $ | 2,326 | | | $ | 2,867 | | | | (20.0 | )% | | | 17.5 | % | | | 23.3 | % | | | 28.4 | % | | | 33.1 | % | | | 37.5 | % |
| | (10.0 | )% | | $ | 561 | | | $ | 1,102 | | | $ | 1,642 | | | $ | 2,183 | | | $ | 2,724 | | | | (10.0 | )% | | | 15.8 | % | | | 21.8 | % | | | 27.1 | % | | | 31.9 | % | | | 36.4 | % |
| | -- | | | $ | 420 | | | $ | 960 | | | $ | 1,500 | | | $ | 2,041 | | | $ | 2,581 | | | | -- | | | | 14.1 | % | | | 20.4 | % | | | 25.8 | % | | | 30.7 | % | | | 35.2 | % |
| | 10.0 | % | | $ | 279 | | | $ | 819 | | | $ | 1,358 | | | $ | 1,898 | | | $ | 2,437 | | | | 10.0 | % | | | 12.2 | % | | | 18.8 | % | | | 24.4 | % | | | 29.4 | % | | | 34.1 | % |
| | 20.0 | % | | $ | 138 | | | $ | 677 | | | $ | 1,216 | | | $ | 1,755 | | | $ | 2,294 | | | | 20.0 | % | | | 10.2 | % | | | 17.2 | % | | | 23.0 | % | | | 28.2 | % | | | 32.9 | % |
| Pre-Tax NPV Sensitivity To Initial Capex | | | | Pre-Tax IRR Sensitivity To Initial Capex | |
| | Initial Capex | | | | Commodity Price | | | | Initial Capex | | | | Commodity Price | |
| $ | 1,500 | | | | (20.0 | )% | | | (10.0 | )% | | | -- | | | | 10.0 | % | | | 20.0 | % | | | 26 | % | | | (20.0 | )% | | | (10.0 | )% | | | -- | | | | 10.0 | % | | | 20.0 | % |
| | (20.0 | )% | | $ | 623 | | | $ | 1,163 | | | $ | 1,703 | | | $ | 2,243 | | | $ | 2,784 | | | | (20.0 | )% | | | 18.5 | % | | | 25.5 | % | | | 31.6 | % | | | 37.2 | % | | | 42.3 | % |
| | (10.0 | )% | | $ | 521 | | | $ | 1,062 | | | $ | 1,602 | | | $ | 2,142 | | | $ | 2,682 | | | | (10.0 | )% | | | 16.1 | % | | | 22.7 | % | | | 28.5 | % | | | 33.6 | % | | | 38.5 | % |
| | -- | | | $ | 420 | | | $ | 960 | | | $ | 1,500 | | | $ | 2,041 | | | $ | 2,581 | | | | -- | | | | 14.1 | % | | | 20.4 | % | | | 25.8 | % | | | 30.7 | % | | | 35.2 | % |
| | 10.0 | % | | $ | 318 | | | $ | 859 | | | $ | 1,399 | | | $ | 1,939 | | | $ | 2,479 | | | | 10.0 | % | | | 12.3 | % | | | 18.3 | % | | | 23.5 | % | | | 28.2 | % | | | 32.5 | % |
| | 20.0 | % | | $ | 217 | | | $ | 757 | | | $ | 1,297 | | | $ | 1,838 | | | $ | 2,378 | | | | 20.0 | % | | | 10.8 | % | | | 16.6 | % | | | 21.5 | % | | | 26.0 | % | | | 30.1 | % |
Source: Ausenco, 2022.
| | |
| Arctic Project | Page 389 |
| S-K 1300 Technical Report Summary | November 30, 2022 |
| | |
| Figure 19-1: | Pre-Tax NPV Sensitivity Analysis |
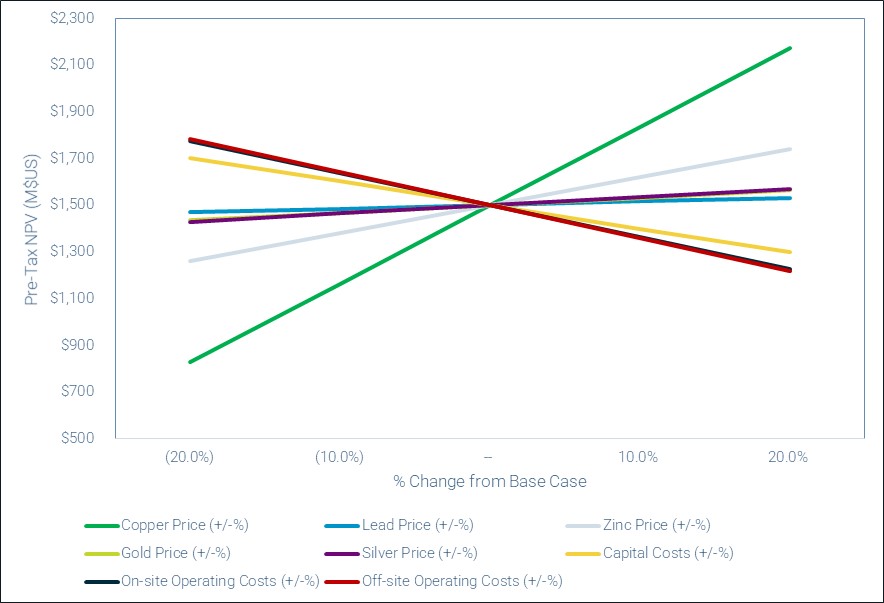
Source: Ausenco, 2022.
As shown in Figure 19-1, the Arctic Project’s NPV at 8% discount rate is most sensitive to changes in copper price, followed by off-site operating costs, on-site operating costs, zinc price, capital costs, silver price, gold price and lead price. On-site operating costs follow closely the off-site operating costs.
| | |
| Arctic Project | Page 390 |
| S-K 1300 Technical Report Summary | November 30, 2022 |
| | |
| Figure 19-2: | Pre-Tax IRR Sensitivity Analysis |
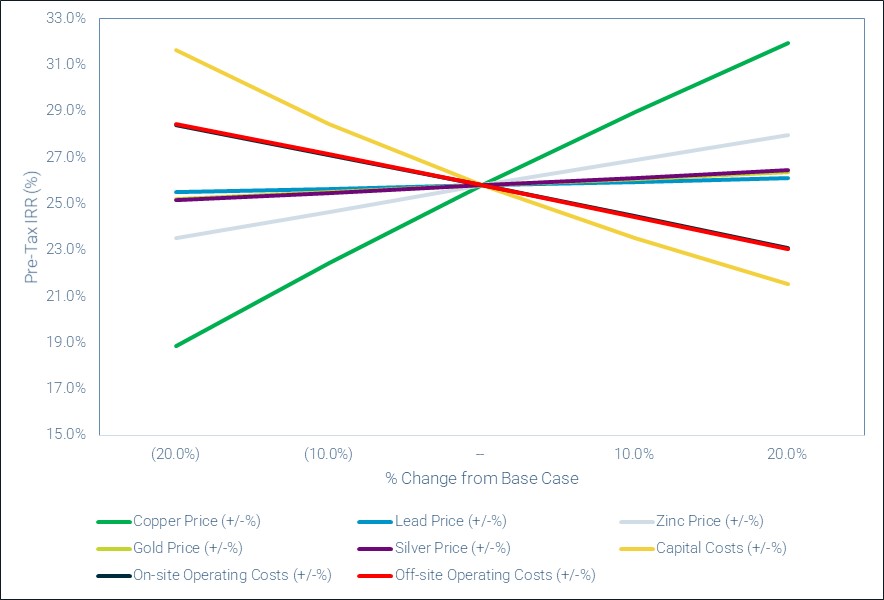
Source: Ausenco, 2022.
As shown in Figure 19-2 the Arctic Project’s IRR is most sensitive to changes in copper price and capital cost, followed by off-site operating costs and on-site operating costs, and in then decreasing order, zinc price, silver price, gold price, and lead price. On-site operating costs follow closely the off-site operating costs.
| | |
| Arctic Project | Page 391 |
| S-K 1300 Technical Report Summary | November 30, 2022 |
| | |
Table 19-6 shows the results of the post-tax sensitivity analysis.
Table 19-6: Post-Tax Sensitivity Summary
Post-Tax Sensitivity Tables
| Post-Tax NPV Sensitivity To On-Site Opex | | | Post-Tax IRR Sensitivity To On-Site Opex | |
| On-Site Opex | | | Commodity Price | | | On-Site Opex | | | Commodity Price | |
| $ | 1,108 | | | | (20.0 | )% | | | (10.0 | )% | | | -- | | | | 10.0 | % | | | 20.0 | % | | | 23 | % | | | (20.0 | )% | | | (10.0 | )% | | | -- | | | | 10.0 | % | | | 20.0 | % |
| | (20.0 | )% | | $ | 481 | | | $ | 897 | | | $ | 1,297 | | | $ | 1,690 | | | $ | 2,082 | | | | (20.0 | )% | | | 15.3 | % | | | 20.5 | % | | | 24.9 | % | | | 29.0 | % | | | 32.7 | % |
| | (10.0 | )% | | $ | 376 | | | $ | 797 | | | $ | 1,204 | | | $ | 1,598 | | | $ | 1,990 | | | | (10.0 | )% | | | 13.8 | % | | | 19.3 | % | | | 23.9 | % | | | 28.0 | % | | | 31.8 | % |
| | -- | | | $ | 269 | | | $ | 695 | | | $ | 1,108 | | | $ | 1,506 | | | $ | 1,899 | | | | -- | | | | 12.3 | % | | | 18.0 | % | | | 22.8 | % | | | 27.1 | % | | | 30.9 | % |
| | 10.0 | % | | $ | 161 | | | $ | 591 | | | $ | 1,009 | | | $ | 1,413 | | | $ | 1,807 | | | | 10.0 | % | | | 10.6 | % | | | 16.6 | % | | | 21.7 | % | | | 26.1 | % | | | 30.0 | % |
| | 20.0 | % | | $ | 51 | | | $ | 485 | | | $ | 907 | | | $ | 1,318 | | | $ | 1,714 | | | | 20.0 | % | | | 8.9 | % | | | 15.2 | % | | | 20.5 | % | | | 25.1 | % | | | 29.1 | % |
| Post-Tax NPV Sensitivity To Off-Site Opex | | | | Post-Tax IRR Sensitivity To Off-Site Opex | |
| Off-Site Opex | | | Commodity Price | | | | Off-Site Opex | | | | Commodity Price | |
| $ | 1,108 | | | | (20.0 | )% | | | (10.0 | )% | | | -- | | | | 10.0 | % | | | 20.0 | % | | | 23 | % | | | (20.0 | )% | | | (10.0 | )% | | | -- | | | | 10.0 | % | | | 20.0 | % |
| | (20.0 | )% | | $ | 496 | | | $ | 916 | | | $ | 1,318 | | | $ | 1,713 | | | $ | 2,107 | | | | (20.0 | )% | | | 15.4 | % | | | 20.6 | % | | | 25.1 | % | | | 29.1 | % | | | 32.9 | % |
| | (10.0 | )% | | $ | 383 | | | $ | 805 | | | $ | 1,214 | | | $ | 1,609 | | | $ | 2,003 | | | | (10.0 | )% | | | 13.9 | % | | | 19.3 | % | | | 24.0 | % | | | 28.1 | % | | | 31.9 | % |
| | -- | | | $ | 269 | | | $ | 695 | | | $ | 1,108 | | | $ | 1,506 | | | $ | 1,899 | | | | -- | | | | 12.3 | % | | | 18.0 | % | | | 22.8 | % | | | 27.1 | % | | | 30.9 | % |
| | 10.0 | % | | $ | 155 | | | $ | 583 | | | $ | 999 | | | $ | 1,402 | | | $ | 1,795 | | | | 10.0 | % | | | 10.5 | % | | | 16.6 | % | | | 21.6 | % | | | 26.0 | % | | | 29.9 | % |
| | 20.0 | % | | $ | 40 | | | $ | 470 | | | $ | 889 | | | $ | 1,297 | | | $ | 1,691 | | | | 20.0 | % | | | 8.7 | % | | | 15.1 | % | | | 20.3 | % | | | 24.9 | % | | | 28.9 | % |
| Post-Tax NPV Sensitivity To Initial Capex | | | | Post-Tax IRR Sensitivity To Initial Capex | | |
| Initial Capex | | | Commodity Price | | | | Initial Capex | | | Commodity Price | |
| $ | 1,108 | | | | (20.0 | )% | | | (10.0 | )% | | | -- | | | | 10.0 | % | | | 20.0 | % | | | 23 | % | | | (20.0 | )% | | | (10.0 | )% | | | -- | | | | 10.0 | % | | | 20.0 | % |
| | (20.0 | )% | | $ | 448 | | | $ | 869 | | | $ | 1,278 | | | $ | 1,672 | | | $ | 2,064 | | | | (20.0 | )% | | | 16.4 | % | | | 22.7 | % | | | 28.1 | % | | | 32.9 | % | | | 37.3 | % |
| | (10.0 | )% | | $ | 359 | | | $ | 782 | | | $ | 1,193 | | | $ | 1,589 | | | $ | 1,981 | | | | (10.0 | )% | | | 14.2 | % | | | 20.1 | % | | | 25.3 | % | | | 29.7 | % | | | 33.8 | % |
| | -- | | | $ | 269 | | | $ | 695 | | | $ | 1,108 | | | $ | 1,506 | | | $ | 1,899 | | | | -- | | | | 12.3 | % | | | 18.0 | % | | | 22.8 | % | | | 27.1 | % | | | 30.9 | % |
| | 10.0 | % | | $ | 179 | | | $ | 607 | | | $ | 1,022 | | | $ | 1,422 | | | $ | 1,816 | | | | 10.0 | % | | | 10.6 | % | | | 16.1 | % | | | 20.8 | % | | | 24.8 | % | | | 28.5 | % |
| | 20.0 | % | | $ | 88 | | | $ | 518 | | | $ | 936 | | | $ | 1,338 | | | $ | 1,733 | | | | 20.0 | % | | | 9.2 | % | | | 14.5 | % | | | 18.9 | % | | | 22.8 | % | | | 26.3 | % |
Source: Ausenco, 2022.
| | |
| Arctic Project | Page 392 |
| S-K 1300 Technical Report Summary | November 30, 2022 |
| | |
This section is not relevant to this report.
| | |
| Arctic Project | Page 393 |
| S-K 1300 Technical Report Summary | November 30, 2022 |
| | |
| 21 | OTHER RELEVANT DATA AND INFORMATION |
| 21.1 | Project Execution Plan |
Key considerations for the execution of the Arctic Project are as noted below.
| 21.1.1 | Constraints and Interfaces |
The Arctic Project will be an integrated development with several consultants contributing to the overall design process. Specialist contractors will most likely be engaged for specific packages, such as the Arctic access road, and the construction camps, generally on a “design and construct” basis.
It is essential that these parties work together to ensure data being used is both current and meaningful. Data transfer between parties shall be strictly controlled and in accordance with Document Control protocols.
The early design interfaces for the Arctic Project will include at least:
| • | Waste Rock placement and Tails Dam |
| • | Water management and treatment |
| • | Arctic Access Road design and construction, in particular the pioneer road necessary to allow earliest possible access to the Mine pre-assembly construction site |
| • | Bornite, Construction and Permanent Camps. |
The Interface Management procedures will be developed to ensure services at the battery limits are clearly defined and understood by all parties affected.
| 21.1.2 | Key Project Milestones |
Key project milestones will be developed once the Arctic Project is committed to construction and the required permits are in hand.
The mine requires nominally two years of pre-strip operations, tailings pond starter dam development and water accumulation before actual production mining operations can commence.
For that pre-strip work to start, the Arctic access road from the AAP intersection to the mine site will have to be constructed to at least a pioneer road condition that will allow the mine fleet and the support facilities to be delivered, built and made operational.
Tailings pond construction must be to a height to allow natural collection of water in quantities that will allow plant operations to commence.
| | |
| Arctic Project | Page 394 |
| S-K 1300 Technical Report Summary | November 30, 2022 |
| | |
Figure 21-1 shows a project execution schedule that covers key milestones and activities in the 3-year construction period.
Figure 21-1: Project Execution Schedule
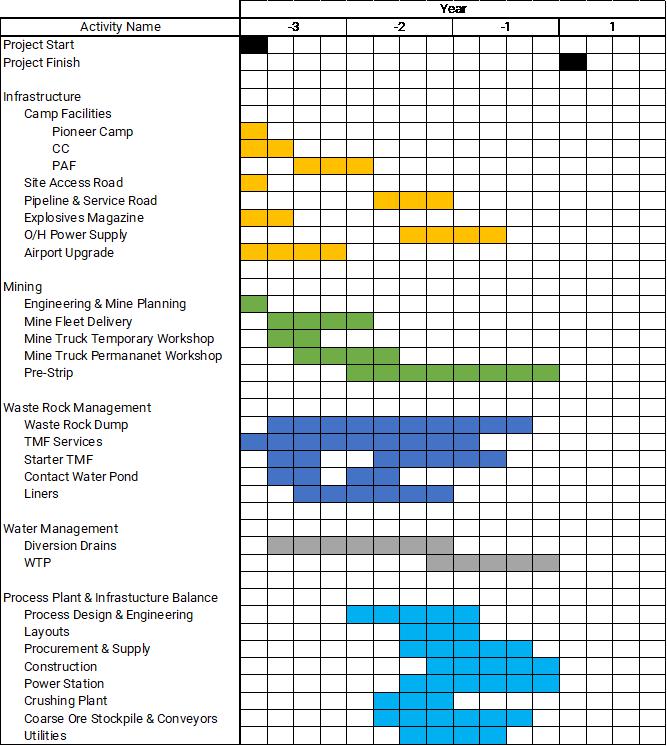
Source: Ausenco, 2022.
| | |
| Arctic Project | Page 395 |
| S-K 1300 Technical Report Summary | November 30, 2022 |
| | |
The Arctic Project will utilize proven technology and equipment that can be built, operated and maintained under adverse weather conditions.
The Design Criteria, Technical Specifications and Data sheets shall reflect the location, the environmental and initial logistics constraints that may affect the procurement and construction effort.
| 21.1.4 | Engineering, Procurement and Construction Management Approach |
Two EPCM strategies have been identified that are structured to account for the abnormally long pre-strip mining operation. The first option is the basis for the capital and operating cost estimate.
| 21.1.4.1 | Early Engineering Only with 2-Stage Procurement |
There is a need to establish the mine facilities and assemble the Mine Fleet in time to allow the pre-strip operation to start some two years before the Process Plant receives its first ore. This means that there will be a significant amount of detailed engineering requiring completion well in advance of the time required for conventional engineering, procurement, and construction of just the process plant and supporting infrastructure. This has been assessed as requiring detailed engineering to start some four years before the process plant starts production.
In particular, the pioneer access road design and contracts and civil design for the Mine Support facilities will be required early in the schedule. By default, the rest of the civil design would need to attach to that early works for simple plant layout and construction coordination purposes. For that to occur the plant layout will be required to be established at an early stage. That in turn is dependent on sizing and selection of the major process equipment items and the receipt of vendor data to complete the plant layout.
Effectively, the detailed design phase will need to follow the conventional approach and run its course but started at a time that meets the early works schedule requirements. Everything other than the mine support facilities will be designed some two years in advance of when it is needed.
With the early equipment order placement, the supply phase could become inordinately long, extending over three years in most cases, when in fact the equipment is not likely to be needed until the last eighteen months prior to plant start-up.
An unorthodox but proven option to this extended design, supply and construction schedule is to have the EPCM Contractor procure the major equipment in two steps:
| • | Step 1: Procure only the vendor certified engineering data to allow detailed engineering to continue to completion but hold the manufacturing functions until later in the overall schedule, effectively a delay of around twelve to fifteen months. |
| • | Step 2: Based on agreed vendor manufacturing durations, apply a “late” release of the equipment for manufacture with deliveries effectively becoming a “Just-in Time” logistics operation. |
This strategy provides the following advantages:
| • | Engineering can start and continue to completion using critical vendor data without the need for an extended “standby” involvement. |
| | |
| Arctic Project | Page 396 |
| S-K 1300 Technical Report Summary | November 30, 2022 |
| | |
| • | Procurement functions can work in parallel with the engineering group with no disconnect between the two disciplines. |
| • | The procurement team can generally disband early in the schedule with just key personnel retained to provide continuity of support. |
| • | The expediting team can mobilise later in the schedule to drive manufacture and delivery in a concerted campaign. |
| • | Equipment deliveries can be orchestrated to suit the conditions at the time with everything consolidated into a transit compound for coordinated shipping to site. |
| • | Reduced cashflow demands. |
| • | Potential issues to be mitigated with this approach are: |
| • | The vendors need to be clearly briefed as to their manufacturing and delivery schedule. |
| • | A payments formula needs to be in place to account for a delayed delivery strategy. |
| • | Some vendors have difficulty in determining just what their actual engineering costs are. |
| 21.1.4.2 | Early EPCM Leading to Plant Care and Maintenance |
Under this approach, the EPCM would work to conventional design and construction schedule, starting to suit the Mine access requirements but following on to completion without interruption. That would bring the total process plant and supporting infrastructure to a mechanical completion condition nominally twelve to fifteen months before it is able to start work.
The plant could not be commissioned through lack of ore and would have to be placed into care and maintenance mode until ore became available. This has an inherent advantage in that if the pre-strip operation was completed earlier than scheduled, and sufficient water is accumulated, the plant operations would be able to take advantage of the fact the plant was already mechanically complete. The care and maintenance requirements in that environment for that duration will require close assessment.
| | |
| Arctic Project | Page 397 |
| S-K 1300 Technical Report Summary | November 30, 2022 |
| | |
| 22 | INTERPRETATIONS AND CONCLUSIONS |
The QPs note the following interpretations and conclusions in their respective areas of expertise, based on the review of data available for this Report. The level of study was completed to a minimum of a PFS under the standards and definitions of S-K 1300.
| 22.2 | Mineral Tenure, Surface Rights, Royalties and Agreements |
Information from legal experts supports that the mining tenure held is valid and is sufficient to support declaration of Mineral Resources and Mineral Reserves.
Kennecott holds a 1% NSR royalty that is purchasable at any time for a one-time payment of $10 million. This royalty covers the patented federal mining claims and many, but not all, of the State mining claims.
The NANA Agreement between NovaCopper US and NANA, assigned to Ambler Metals in 2020, granted certain rights, for consideration, which include an exclusive right to explore for minerals and a nonexclusive right to enter upon and use certain NANA lands for various purposes including access to NovaCopper’s Ambler mining properties. The NANA Agreement further provides that if NovaCopper completes a Feasibility Study and a Draft Environmental Impact Statement for a project to develop the Ambler properties, NANA will become entitled elect to purchase an interest in the Arctic Project by exercising a back-in right to acquire an undivided interest of between 16% and 25% (at NANA’s option) of the mining project. If this back-in right were to be exercised by NANA the two parties would form a Joint Venture to proceed with the Arctic Project. The Joint Venture would lease the mining properties from NovaCopper US Inc. in exchange for a 1% NSR royalty and NANA would enter into a surface use agreement with the Joint Venture in exchange for a 1% NSR royalty. In the alternative, should NANA elect not to exercise this back-in right, the Joint Venture would not be formed, and NANA would instead become entitled to a 15% net proceeds royalty. As noted above, this agreement has been assigned to Ambler Metals.
The owner of a State mining claim or lease will be obligated to pay a production royalty to the State of Alaska in the amount of 3% of net income received from minerals produced from the State mining claims. The Arctic Project is not on State lands; thus, the State of Alaska production royalty is not applicable.
| 22.3 | Geology and Mineralization |
The Arctic deposit is considered to be an example of a VMS system.
Knowledge of the deposit settings, lithologies, mineralization style and setting, and structural and alteration controls on mineralization is sufficient to support Mineral Resource and Mineral Reserve estimation.
| 22.4 | Exploration, Drilling and Analytical Data Collection in Support of Mineral Resource Estimation |
The quantity and quality of the lithological, geotechnical, collar and downhole survey data collected in the exploration and infill drill programs conducted is sufficient to support Mineral Resource and Mineral Reserve estimation.
| | |
| Arctic Project | Page 398 |
| S-K 1300 Technical Report Summary | November 30, 2022 |
| | |
Analytical and density data are suitable to support Mineral Resource and Mineral Reserve estimation.
NovaGold, Trilogy and Ambler Metals sample security procedures met industry standards. Current sample storage procedures and storage areas are consistent with industry standards.
Data collected have been sufficiently verified that they can support Mineral Resource and Mineral Reserve estimation and be used for mine planning purposes.
| 22.5 | Metallurgical Testwork |
Metallurgical studies have spanned over 30 years.
Testwork conducted prior to 2012 is considered relevant to the Arctic Project, but predictive metallurgical results are considered to be best estimated from testwork conducted on sample materials obtained from exploration work under the direction of Trilogy conducted in 2012 and 2017 and Ambler Metals conducted in 2021.
To the extent known, the metallurgical samples are representative of the styles and types of mineralization and the mineral deposit as a whole.
Concentrate quality test results indicated that key penalty elements, as well as precious metals are typically concentrated into a lead concentrate, leaving the copper concentrate of higher-than-expected quality given the levels of impurities seen in the test samples. The lead concentrate may have penalties for the high arsenic and antimony concentrations seen in the results of this testwork. Precious metal deportment into a lead concentrate is very high and should benefit the payable levels of precious metals at a smelter. Silicon dioxide and fluoride assays should be conducted on the concentrates to determine whether or not they are higher than the penalty thresholds.
Talc will be managed through a pre-flotation step to minimize reporting to the metal concentrates.
In general, the flowsheet developed in the 2012 test program and further tested in the 2017 and 2021 testwork programs at ALS Metallurgy is feasible for the Arctic deposit mineralization. Further geometallurgical testwork is recommended to confirm and optimize the flowsheet. There are no outstanding metallurgical issues related to the production of a copper or zinc concentrate from all of the materials tested.
| 22.6 | Mineral Resource Estimates |
Mineral Resources have been prepared using industry-standard methods and software.
Mineral Resources have had reasonable prospects of economic extraction considerations applied and assume an open pit mining method.
Mineral Resources were prepared in accordance with the standards and definitions of S-K 1300.
Factors that may affect the Mineral Resource estimate include: metal price assumptions; changes to the assumptions used to generate the CuEq cut-off grade that constrains the estimate; changes in local interpretations of mineralization geometry and continuity of mineralized zones; changes to geological and mineralization shapes and volumes; geological and grade continuity assumptions; geological and structural complexity assumptions; density and domain assignments; changes to the predicted SG values; changes to the Mineral Resource estimation parameters for the payable and deleterious metals; changes to geotechnical, mining, and metallurgical recovery assumptions; changes to the input and design parameter assumptions that pertain to the conceptual pit constraining the estimates; assumptions as to concentrate marketability, payability and penalty terms; assumptions as to the continued ability to access the site, retain mineral tenure and obtain surface rights titles, obtain environment and other regulatory permits, and maintain the social license to operate; assumptions as to future site access.
| | |
| Arctic Project | Page 399 |
| S-K 1300 Technical Report Summary | November 30, 2022 |
| | |
Wood’s QP recommends the followings tasks completed for the next model update:
| • | Review identified issues in the current database and update the database |
| • | Review identified issues in the current geology model wireframes and update using the 2021 and 2022 drilling results. |
| • | Review identified issues in the current talc model wireframes and update using the 2021 and 2022 drilling results. |
| • | Investigate the predicted SG values in the current SG database that were generated by the Random Forest Regressor machine learning method. This is to mitigate the apparent bias identified in the predicted SG values. Use all available measured SG data collected to update the SG model. |
| • | Investigate and update the historical assay values that shows apparent bias. |
| • | Update variogram models for the payable and deleterious metals, and SG used in the current models by using all the available data including the 2021 and 2022 drilling results. |
| • | Review and update the resource estimation parameters for the payable and deleterious metals, and SG. |
| • | Plan for a tight drilling within the first 5-year pit production area to better understand the complexity of the deposit geology and provide higher confidence during the payback period. |
| 22.7 | Mineral Reserve Estimates |
The 2022 mine plan is based on Probable Mineral Reserves resulting from modifying factors being applied to a subset of the Indicated Mineral Resource estimates.
Mineral Reserves were prepared in accordance with the standards and definitions of S-K 1300.
Risks that may affect the Mineral Reserve estimates include: metal price assumptions; changes to the assumptions used to generate the NSR cut-offs that constrains the estimate; changes in local interpretations of mineralization geometry and continuity of mineralized zones; changes to geological and mineralization shapes, and geological and grade continuity assumptions; density and domain assignments; changes to geotechnical and hydrological assumptions, changes to mining and metallurgical recovery assumptions; changes to the input and design parameter assumptions that pertain to the conceptual pit constraining the estimates; assumptions as to concentrate marketability, payability and penalty terms; assumptions as to the continued ability to access the site, retain mineral tenure and obtain surface rights titles, obtain environment and other regulatory permits, and maintain the social license to operate.
There is a risk to the estimate if the AMDIAP road is not constructed, or in the time frame envisaged, or that the toll charges assumed in this Report are not the final charges levied.
The northeast wall has been forced to fully mine the talc zones, which has pushed the wall, increased the footprint of the pit, and added waste material to mine plan. Any change to the talc shapes can modify the pit design, and therefore, the amount of material mined. Talc horizons that may not have been included in the geological model could affect slope stability and recoveries in the process plant and therefore could be a risk to the Mineral Reserves.
| | |
| Arctic Project | Page 400 |
| S-K 1300 Technical Report Summary | November 30, 2022 |
| | |
Wood selected conventional open-pit mining because of the deposit’s geometry and proximity to surface. The deposit will be mined in four nested phases, including the ultimate pit limit.
An Owner-operated and maintained conventional truck–shovel operation was specified, with outside service providers supporting mine operations.
The planned open pit will operate for 13 years, and an additional two years of pre-production.
Proper management of groundwater will be important to maintaining pit slope stability; the east wall is highly sensitive to several geotechnical parameters, and talc horizons that may not have been included in the geological model might also affect its stability.
Recovery is planned using a conventional crushing, grinding and flotation circuit to produce metal concentrates. A 10,000 t/d throughput rate is envisaged, with an overall plant availability of 92%.
The process plant will produce three concentrates: 1) copper concentrate, 2) zinc concentrate, and 3) lead concentrate. Gold and silver are expected to be payable at a smelter; silver is expected to be payable in the copper and lead concentrates, with gold expected to be payable in the lead concentrate only.
While there are deleterious elements reporting to the concentrates at levels which would incur penalties, such as talc at 2.92% in the feed to the plant, special processing provisions have been included in the flowsheet to make a readily saleable concentrate.
The planned mine will be a greenfield site and require construction of camp, mine and process-related infrastructure. Access roads in and around the project site will be required.
Site access assumes that the AAP road will be constructed.
Power generation will be provided by four diesel generators.
Process water will be supplied from the Process Pond, TMF reclaim, and WRCP. TMF dewatering must start towards the end of operations to prevent the TMF from exceeding the maximum storage capacity. Stormwater will be managed within the Arctic Project boundaries by capturing and conveying contact and impacted water for treatment and diverting non-contact water away from developed areas. Well water will be used for potable purposes.
| | |
| Arctic Project | Page 401 |
| S-K 1300 Technical Report Summary | November 30, 2022 |
| | |
A single WTP, built in stages, will be used. During the operations phase, the WTP will treat effluent from the WRCP, and during Closure phase effluent from the pit. The WTP will initially consist of chemical/physical treatment with RO. In the Operations phase, when the TMF is in use, the RO reject will be sent to the TMF, and only RO permeate will be discharged to the Creek. When the TMF is closed at the end of the Operations phase, a biological/chemical/physical plant will be added to treat the RO reject so that it can be mixed with the RO permeate and discharged.
The TMF will be a thickened tailings facility. The maximum storage capacity of the facility will be approximately 40.7 Mm³ (tailings and process water) plus an additional 2.5 m of freeboard. The 59 ha footprint of the TMF will be fully lined with a geomembrane liner. Three dam raises will be completed.
| 22.11 | Environmental, Permitting and Social |
To date, a moderate amount of baseline environmental data collection has occurred in the area including surface water quality sampling, surface hydrology monitoring, wetlands mapping, stream flow monitoring, aquatic life surveys, avian and mammal habitat surveys, cultural resource surveys, hydrogeology studies, meteorological monitoring, and ML/ARD studies.
The Arctic Project will be subject to a mine permitting process typical for a mine of its size in Alaska. In order to support this process, Trilogy will have to broaden their existing baseline environmental program and complete a number of studies that will support the permit applications.
The Arctic Project is dependent on obtaining an APDES permit to discharge water that meets Alaska Water Quality Standards..
Ambler Metals has formally started engaging the Arctic Project stakeholders and recognizes the need to earn their trust and support by making the Arctic Project directly beneficial to them throughout the Arctic Project life and closure/post-closure periods.
Trilogy will be required to develop a Mine Reclamation and Closure Plan that is protective of the environment during mining operations as well as reclamation and closure.
Closure activities will be undertaken at the end of mine life to bring the mine facilities in a state consistent with the stated closure and post-closure objectives and compliant with the regulations for closure and abandonment.
| 22.12 | Market Studies and Contracts |
Metal pricing was provided by Trilogy, guided by long-term price forecasts from analysts as published by CIBC.
The long-term consensus metal price assumptions selected for the economic analysis in this Report were:
| | |
| Arctic Project | Page 402 |
| S-K 1300 Technical Report Summary | November 30, 2022 |
| | |
A marketing review for the three Arctic concentrates was conducted by StoneHouse Consulting in January 2023 based on the expected concentrate assays as provided by Trilogy.
The three Arctic concentrates – copper, zinc and lead – will need to be marketed differently but will likely be sold within the Asia Pacific area.
The copper concentrate is relatively high grade with low penalty impurities. The quality can be sold directly into China, Japan or Korea, and therefore will have the advantage of the most competitive terms. There is payable silver content, and potential penalties for zinc, lead and antimony will be low. The copper concentrate contains arsenic and selenium levels that are close to the threshold for allowable import into China. Overall, this is a good quality concentrate with few elements for which a penalty can be applied.
The zinc concentrate has a cadmium content that is above the current import limit set by the Chinese government so at this time cannot be sold into China. The obvious markets for this quality would be to smelters in Korea, Japan, Australia and Canada. The concentrate contains high grade zinc with relatively low iron. As the market is currently long in high silica and high manganese concentrates, this quality will be a welcome feed to blend down those impurities. Not all smelters will fully value a high zinc grade material as it is expensive per unit of zinc, so sales will need to be spread among several smelters.
The lead concentrate contains most of the payable gold and silver from the Arctic deposit. Unfortunately, the impurities, in particular fluorine and selenium, will limit the number of smelters interested in this concentrate, regardless of the smelter’s capacity to recover precious metals. The best strategy is to sell the concentrate to trading companies who can blend with other lead concentrate containing low silver and selenium. In this way, the silver gets diluted and the selenium gets reduced to an acceptable level. It is recommended that a study be conducted to confirm marketability of this product. Smelters should be consulted so that Trilogy can get some direction as to whether the elevated levels of fluorine and selenium can be managed.
Total capital costs are estimated at $1,291 million with initial capital of $1,177 million and sustaining capital costs of $114 million. Closure costs are estimated at an additional $428 million. The estimate accuracy is ±15% and developed at a Q3/Q4-2022 US dollars basis with a contingency less than 15%.
The average LOM operating cost for the Arctic Project is estimated to be $59.83/t milled.
There is a risk to the capital and operating cost estimates if the toll road is not built in the time frame required for the Arctic Project, the design basis for the road cost estimate changes (for example from a single lane roadway as assumed in this Report to a dual lane), or if the annual toll charges that will be levied are significantly different from what was assumed.
| | |
| Arctic Project | Page 403 |
| S-K 1300 Technical Report Summary | November 30, 2022 |
| | |
Based on $1,177 million of initial capital costs, sustaining capital costs of $114 million, closure costs of $428 million, $2,969 million in LOM off-site operating costs and $2,794 million in LOM on-site operating costs, pre-tax financial results show an IRR of 25.8% and an NPV of $1,500 million at an 8% discount rate and a 2.9-year payback period. Post-tax financial results show an IRR of 22.8% and an NPV of $1,108 million at an 8% discount rate and a 3.1-year payback period.
The Arctic deposit will be mined at a maximum annual rate of 35 Mt/a with an overall stripping ratio of 7.3. Ore will be processed by conventional methods to annually produce 234 kt of copper, 23 kt of lead, and 174 kt of zinc, all in concentrates for provision to third party refiners. Waste and tailings materials will be stored in surface facilities, which will be closed and reclaimed at the end of the mine; contact water will be treated and discharged to the environment throughout the LOM. Precious metals attendant with the concentrates will be largely payable. While there are deleterious elements reporting to the concentrates at levels that could incur penalties, special processing provisions have been included in the flowsheet to make a readily saleable concentrate.
In terms of project execution, the mine requires nominally two years of pre-strip operations, tailings pond starter dam development and water accumulation before actual production mining operations can commence.
For that pre-strip work to start, the Arctic access road from the AMDIAP intersection to the mine site will have to be constructed to at least a pioneer road condition that will allow the mine fleet and the support facilities to be delivered, built, and made operational.
Positive financial results support the declaration of Mineral Reserves.
| 22.17 | Risks and Opportunities |
Mine development permitting will be largely driven by the underlying land ownership; regulatory authorities vary depending on land ownership. The Arctic Project is situated to a large extent on State land, it will be necessary to obtain a Plan of Operation Approval (which includes the Reclamation Plan) from the ADNR. The overall timeline required for permitting would be largely driven by the time required for the NEPA process.
There is a risk to the capital and operating cost estimates, the financial analysis, and the Mineral Reserves if the NEPA process, Plan of Operation Approval and ancillary permits to support operations cannot be obtained in the timeframe envisioned for project start-up.
Mining through voids during open pit operations is a generally manageable risk where such voids are known to exist. However, unidentified voids may exist, and present a risk to mine and production plans if alternate schedules have to be derived, or new safety measures implemented.
Further data collection and interpretation tasks are recommended to fill in geotechnical data gaps to support future stages of design. A numerical groundwater flow model should be calibrated and developed under transient conditions to inform subsequent geotechnical evaluations and depressurization assumptions.
Grade control and mining near the ore contacts present a risk of potentially mining too much dilution material or losing high-grade material. Performance of grade control methods and mining techniques should be continually evaluated to manage this risk.
The support equipment fleet will be responsible for the usual road, pit and WRF maintenance requirements, but due to the climate conditions expected, will have a larger role in snow removal and water management. This is considered an important, but manageable operating risk to meet production targets.
The Talc Zone domain represents the weakest geotechnical domain observed at the Arctic deposit. The extent and persistence of the unit is of concern to the pit slope stability. This extent has been further investigated during the 2022 investigation program. The 3D talc model should be updated to include all available drilling and laboratory testing data. Based on the updated geometries, a geotechnical review should be completed to update the slope designs.
| | |
| Arctic Project | Page 404 |
| S-K 1300 Technical Report Summary | November 30, 2022 |
| | |
Potential slope instability risks have been identified in the interim and final mining phases of the pre-feasibility open pit design. The risks include potential sliding failure along talc domains and fault structures in the east wall of Phase01 pit, localized wedge failures in the south wall of the Phase02, Phase03 and Final pits, and sliding failures along foliation in the final pit design. These risks, discussed in detail in Section 9.7.1.8, should be considered in the next stages of the Arctic Project.
The seismic impact on the slope design should be re-evaluated using the site-specific assessment of the potential seismicity.
Once mining begins, regular pit wall mapping is recommended as the new rock faces are exposed to enable a reconciliation against the geotechnical information used in the slope design. Foliation mapping will be critical for the short-term planning in the NE, E and SE slope sectors. The foliation model should be constantly updated as pit wall mapping is being undertaken and be utilized for making ongoing adjustments to the short-term slope design and mining plan.
The geotechnical evaluations identified that existence of talc layers in the slopes are significant geotechnical risks. Constant delineation of talc will be important to maintain stability of the pit slopes. As additional information, such as drilling and mapping, become available the talc model should be updated and incorporated into the mining plan.
The pore pressure monitoring system and mitigation plan would be critical in managing the slope stability risks during the interim mining phases. The open pit water management plan should include vertical in-pit monitoring piezometers, vertical in-pit pumping wells, and horizontal drain holes. This plan should be reviewed as additional data becomes available and mitigation efforts should be adopted as appropriate to achieve pore pressure reduction needs. This will be particularly important during the earlier phases of the open pit mining when the areas above the talc layers have not been excavated and the compartmentalized water system above the talc layers may exacerbate the geotechnical risks related to the foliation and talc.
Ongoing structural geology mapping should be undertaken so that these can be reconciled against the model used in the slope design to identify any potential risks or opportunities. It is the QP’s opinion this structural model should be updated on a regular basis during operation, the risks assessed, and the designs and mining approaches adapted to manage these risks.
The hydrogeological conceptual model for the pit and valley areas should be updated over time as more data becomes available and designs are revised. For the pit, the potential effects of seasonal or rapid and high amplitude recharge events (i.e. freshet) on pore pressures and sump sizing need to be considered and opportunities for pit sump locations that could promote drainage from below talc layers should be identified. Where feasible, runoff into the pit should be reduced by drainage ditches around and set back from the pit perimeter, and internal ditching that directs water to pit sumps or out of the pit. Snow removal or clearing off of high elevation portions of the pit may need to be considered to reduce seasonal freshet increases in groundwater recharge and pore pressures.
For the valley bottom groundwater seepage interception system (SIS), data should be collected to characterize overburden and fractured rock properties in the specific area of the system and the conceptual model updated. Estimates of potential groundwater bypass of the WRCP should be updated and the groundwater SIS design updated as appropriate. Baseline monitoring of groundwater quality in this area should be initiated as soon as possible to provide a dataset for environmental permitting and to support performance monitoring of the groundwater SIS once in operation.
| | |
| Arctic Project | Page 405 |
| S-K 1300 Technical Report Summary | November 30, 2022 |
| | |
It is the QP’s opinion the pit Groundwater Management Plan should be updated as mine design advances and implemented at the start of mining. Continued water level monitoring, updated interpretations of seasonal variation and development of baseline for comparison with slope monitoring are needed to assess drainage performance. Provisions should be included in the next level of study for groundwater monitoring and drainage works on the east/northeast slope and to install general pit perimeter groundwater monitoring on the north, south and west sides of the pit.
| 22.17.5 | Tailings Management, Waste Rock and Water Management Facilities |
The following are risks and opportunities to be evaluated:
| • | The increase in tailings volume decreases the volume available for water storage toward the end of operations. |
| • | The current TMF capacity does not account for entrainment of ice in excess of tailings porosity – ice entrainment needs to be minimized through operational practices and/or accounted for in TMF capacity. |
| • | To reduce the duration of tailings consolidation, a drainage system installed above the TMF liner should be evaluated. |
| • | A TMF underdrain system may be needed to convey shallow groundwater below the TMF liner to the WRF rock drain. |
| • | An underdrain system may be needed below the Process Pond to convey natural groundwater seepage into Subarctic Creek. |
| • | A protective layer may be needed to prevent ice damage to the geomembrane liner in the tailings pool area. |
| • | Waste rock placement in the WRF during operation should be optimized to minimize cuts for the western and eastern channels, which provide surface drainage from the TMF after closure. |
| • | The capture and storage of non-acid-generating waste rock from the pit and overburden in the Subarctic Creek valley bottom in the early stages of construction may be optimized to maximize quantities of non-reactive material for closure and other construction needs. In addition, boulders that may need to be removed from liner subgrade and dam abutments for the TMF, WRCP, and Process Pond may be considered for use as rip-rap and/or sources for crushed aggregate. |
| • | Geometries for the WRCP and Process Pond dams may be optimized to reduce earthwork costs. In particular, adjusting the WRCP dam crest so that the alignment is straight would reduce material quantities and complexity. |
| • | Alternative channel linings or profiles may be evaluated to seek reduction in WRCP and Process Pond spillway costs. |
| • | Continuing the East Diversion Pipe along the east bank of the Process Pond may reduce the cross-sectional area of and armouring requirements for the Div-6 diversion channel. |
| • | The overburden stockpiles may be integrated with avalanche mitigation structures. |
It is the QP’s opinion that further geotechnical and hydrogeological investigations should be completed in the foundations of the TMF, WRF, WRCP, and Process Pond including borehole drilling and laboratory testing to support design objectives, including the following:
| • | Improve accuracy of overburden thickness and excavation volume estimates. |
| | |
| Arctic Project | Page 406 |
| S-K 1300 Technical Report Summary | November 30, 2022 |
| | |
| • | Characterize construction materials, including underliner and pond embankment materials. |
| • | Assess liquefaction susceptibility of overburden. |
| • | Characterize the rock mass below the facilities to a depth equivalent to embankment height. |
| • | Evaluate strength properties of pond cut slope materials. |
| • | Assess suspected slope movements near waste or pond facilities. |
| • | Characterize ground water regimes under the waste facilities, ponds, and seepage collection system. |
| • | Characterize geotechnical properties of waste rock, including effect of talc content and physical/chemical degradation. |
In addition, further engineering studies on the WRF and TMF design should include:
| • | Finite element consolidation and seepage modelling of the TMF to better understand drainage, long-term settlement, and effects on capacity and closure. |
| • | Tailings deposition planning and water balance update to account for additional tailings volume, thickened tailings, plan for pool management and winter deposition, and timing of tailings dewatering towards end of mine life. |
| • | Update WRF, TMF, WRCP, and Process Pond stability analyses (including liquefaction assessment) based on additional field investigation results and lab testing. |
| • | Evaluate whether heat or gas generation during oxidation of waste rock may adversely affect the closure cover. |
| • | Hydrology parameters are based on the rating curve development and resulting discharge timeseries conducted by Brailey Hydrologic Consultants LLC (Brailey 2022). They are assumed to have undergone exhaustive review. |
| • | The climate parameters presented by SRK are measured at discrete stations but are assumed to represent the general catchment area (SRK, 2022). |
| • | Regional stations of assumed reasonable representativeness and gridded reanalysis were used to derive long-term records to calculate statistics such as extreme precipitation because of the limited site-specific record availability. |
| • | SRK used gap-filling methods to fill missing records in the site-specific hydrometric records. Pairing methods are limited, assuming the frequency distribution developed is based on a concurrent record and consistent throughout the long-term record. |
It is the QP’s opinion that additional baseline studies and environmental permitting activities should be undertaken, including:
| • | Low flow measurements should be collected at the SRGS, SCGS, and RCDN hydrologic gauging stations to improve low flow and baseflow estimates. |
| • | Snow course surveys should continue to be conducted annually to progress the understanding of freshet and peak flow timing. |
| • | A monitoring gauging station was installed closer to headwaters of Sub-Arctic Creek. Once sufficient data has been collected, predicted Sub-Arctic Creek flows should be calibrated in the water and load balance. |
| | |
| Arctic Project | Page 407 |
| S-K 1300 Technical Report Summary | November 30, 2022 |
| | |
| 22.17.7 | Water and Load Balance |
It is the QP’s opinion that the water and load balance be updated as the project design is advanced in order to refine the understanding of the effluents to be treated during operations and at closure, and to refine the water treatment design and closure cost estimates.
Other items that require evaluation are:
| · | Surface run-off from cuts for roads is assumed to be non-contact water, however geochemical characterization of road cuts should be conducted to confirm this. |
| · | Water quality predictions for the construction phase (Year -3 to -1) were not evaluated. Source terms for waste rock and pit wall run-off for the construction phase have not yet been incorporated in the water and load balance. |
| · | There are 17 new source terms that have been developed (including those for the construction phase referenced in the previous point) but have not been incorporated into the model. New and existing source terms do not account for the most recent changes to the mine plan and water management plan, such as an additional year of operations, updated hydrology, and the inclusion of geomembrane covers. |
| · | The new source terms (referenced in the above point) were developed to include annual values that account for differences in the geometry and volume of each facility over the mine life, include rock type specific mine scheduling information, and covering the full timeline over which all rock types will turn acidic. As above, these do not incorporate the most recent changes to the mine plan and have not been incorporated into the model. |
| · | Based on kinetic data available to date, there is uncertainty with prediction of when waste rock and pit wall will transition from neutral pH to acidic conditions, and how long the transition will take. |
| · | The impact of geomembranes on source terms for the WRF and TMF in closure have not been evaluated. As closure planning is refined, the water and load balance model will need to be updated based on revised waste management plans. |
| · | Source terms should be updated to include the most recent changes to the mine plan and water management plan, refinement of source terms for road cuts and construction materials, and should incorporate all available data from on-going kinetic tests on waste rock, ore, and tailings. |
| · | Baseline water quality source terms for Subarctic Creek and the Shungnak River should be updated to include data collected since 2019 and evaluated for seasonal variability. |
| · | Inherent risk associated with assuming the groundwater interception system needs to be 100% efficient in order to prevent any seepage from impacting Subarctic Creek (and the Shungnak River). |
| · | Uncertainty remains in predicted groundwater and seepage flows as these are a function of hydraulic conductivity and bedrock thickness which is only known at specific coordinates. It is the QP’s opinion that these uncertainties can be reduced by the investigations described in this document (Section 22.17.3 and Section 23.5). |
| · | Uncertainty in estimated tailings porewater release rate during closure phase of the Arctic Project. Further consolidation testwork should be carried out. Testwork should be done to confirm residence time required for the mill reagents to degrade. Water in the Process Pond has a residence time of 10 to 12 days. If this is insufficient, the pond design will need to be revised with additional capacity. |
| · | The volume of water that accumulates prior to operations in the TMF for use during mill startup may exceed the TMF liner elevation as designed. If the liner raise cannot happen sooner than proposed, this surplus of water may be directed to the Process Pond. Any additional volume not required for mill startup will either be sent to the WRCP for treatment or directly to Subarctic Creek if it is non-contact runoff. |
| | |
| Arctic Project | Page 408 |
| S-K 1300 Technical Report Summary | November 30, 2022 |
| | |
| · | The model was not evaluated for the hydrological condition where the site experiences a 1 in 25 dry year in the early years of operations. This scenario may result in the inability to meet mill water demands for part of the year if the dry year occurs prior to a sufficient reserve volume of water accumulates in the TMF. There is the potential to install groundwater wells to supplement mill water and mitigate this risk. |
| · | For the model scenario involving two consecutive 1 in 25 wet years in Years 12 and 13 of operations, the WRCP alone does not have sufficient capacity in peak runoff months. The TMF and WTP operating year-round have sufficient capacity to manage this water surplus, but modelled pond volumes require further optimization. Cryo-concentration may impact WTP influent chemistry when the plant is operated year-round in operations. |
| · | Climate change impacts should be incorporated into model and results should be assessed. |
| 22.17.8 | Metallurgical Testwork |
Flowsheet development, locked cycle and variability testwork has shown the process flowsheet to be robust and stable at the study level under laboratory conditions. The ability to produce saleable metallic concentrates has been confirmed.
The process design assumed for this report has some risks identified that could impact delivery or economics and these need to be managed and mitigated by additional testwork and studies. The key aspects of the Arctic Project presenting most execution risk are:
| · | Performance of the flotation circuits at less than proven testwork results, which can be mitigated by further pilot level testing |
| · | Metal recoveries not achieving proven testwork levels, which can be mitigated by further geometallurgical testwork, e.g: perform additional metallurgical testwork on the bulk Cu-Pb concentrate to determine if the Pb recovery can be increased and to better define the Au-Ag recovery |
| · | Areas of low recovery in the pit, which can be mitigated by variability testing in several areas of the put to better define these zones based on updated recovery formulas |
| | |
| Arctic Project | Page 409 |
| S-K 1300 Technical Report Summary | November 30, 2022 |
| | |
A work program is recommended to continue developing the Arctic Project through engineering and de-risking, and into construction at a total cost of $14.4 million.
Table 23-1 and the following sections summarize the key recommendations arising from a review of each major area of investigation completed as part of this study to improve the base case design. and described below.
| Table 23-1: | Summary of Recommended Work Packages |
| Description | | Cost ($) | |
| Mining | | | 1,073,000 | |
| Geology and Resource Models | | | 10,190,000 | |
| Open Pit Geotechnical Work | | | 150,000 | |
| Hydrogeology | | | 490,000 | |
| Tailings Management Facility | | | 1,420,000 | |
| Closure | | | 250,000 | |
| Water Treatment | | | 170,000 | |
| Metallurgical Testing | | | 175,000 | |
| Recovery Methods | | | 350,000 | |
| Operational Readiness Plan | | | 120,000 | |
| Total | | | 14,388,000 | |
| · | Perform a SMU study to define an optimal block size that can support the envisioned production rate while minimizing dilution. Estimated cost of $50,000. |
| · | Requote explosives in the future. Ammonium nitrate prices are currently in record highs due to the conflict Ukraine-Russia. Since ammonium nitrate is the main raw material used to produce blasting explosives such as ANFO and emulsion, it has a significant impact on the blasting cost of the operation. Estimated cost of $5,000. |
| · | Assess the use of alternate fuel sources for the mine mobile equipment including LNG. Estimated cost of $18,000. |
| | |
| Arctic Project | Page 410 |
| S-K 1300 Technical Report Summary | November 30, 2022 |
| | |
| · | Confirm the location, thickness, and continuity of the talc layers near to the northeast wall of the final pit. The northeast wall has been forced to fully mine the talc zones, which has pushed the wall, increased the footprint of the pit, and added waste material to mine plan. Any change to the talc shapes can modify the pit design, and therefore, the amount of material mined. Estimated cost $1,000,000. |
| 23.3 | Geology and Resource Models |
No issues were identified that are expected to have a material impact of the current Mineral Resource estimate. The following recommendations are made to confirm assumptions that non-material issues identified are not likely to materially impact the outcome of the resource estimate, but if addressed, they are expected to reduce potential risk associated with these minor issues and assist in more efficient and timely due diligence reviews in the future.
| · | Bias in historical copper and lead assays - Compare the current Mineral Resource estimate with an estimate prepared using a correction factor applied to the historic Cu and Pb assay values that remain in the assay database or an estimate that does not use these historical intervals. This work is expected to cost $5,000. If this work identifies a significant difference, then a continuation of the re-assay program may be warranted. The re-assay program is expected to cost $80,000. |
| · | Bias in predicted SG values – A review of the methodology and dataset used to generate the predicted SG values is recommended and investigate to minimize or mitigate the apparent bias. Total estimated cost is $5,000. |
| · | Mineral Resource Classification confidence related to geological complexity – To mitigate the risk of complex geology within the first 5 years of production area, consider putting additional in-fill holes around 25 m or less in drill grids. This is recommended to classify Measured Resources which can then be converted to Proven Mineral Reserves and provide high confidence in the production plan at project start and payback period. Estimated cost $10,000,000. |
| · | Update the geological and resource model using all available data including the data collected during the 2022 drilling program. Total estimated cost is $80,000. |
| ○ | Review and update variogram models for all metals and SG, using all available data, especially for the payable metals. |
| ○ | Review and update the resource model estimation parameters for all metals and SG, especially for the minimum and maximum number of composites and number of composites used per drill hole. |
| ○ | Review the current compositing length of 1m that is more in agreement with the average sample length. |
| ○ | Update the geological model wireframes including talc wireframes with all available data. |
| · | Address the following minor database issues. Total estimated cost is $25,000. |
| ○ | Complete and document a quantified transcription error check of collar, down hole survey, logging data and assays, especially for pre-2004 data. |
| ○ | Remove the few downhole survey measurements that are causing excessive deviation. |
| ○ | Prepare a document supporting applied detection limit decisions confirming high detection limits for legacy assays that remain in the database are not inadvertently adding economic value. |
| ○ | Include fields in the sample interval table indicating sample interval year, assay value year, and a flag to indicate if the value is supported by QC. |
| | |
| Arctic Project | Page 411 |
| S-K 1300 Technical Report Summary | November 30, 2022 |
| | |
| 23.4 | Open Pit Geotechnical work |
It is the QP’s recommendation that the following open pit geotechnical work be undertaken:
| · | The Talc Zone domain represents the weakest geotechnical domain observed at the Arctic deposit. The extent and persistence of the unit is of concern to the pit slope stability. The 3D talc model should be updated to include all available drilling and laboratory testing data. Based on the updated geometries, a geotechnical review should be completed to update the slope designs. |
| · | Potential slope instability risks have been identified in the interim and final mining phases of the open pit design. The risks include potential sliding failure along talc domains and fault structures in the east wall of Phase01 pit, localized wedge failures in the south wall of the Phase02, Phase03 and Final pits, and sliding failures along foliation in the final pit design. These risks should be considered in the next stages of the Arctic Project. |
| · | The seismic impact on the slope design should be re-evaluated using the site-specific assessment of the potential seismicity. |
| · | The pore pressure monitoring system and mitigation plan would be critical in managing the slope stability risks during the interim mining phases. This plan should be reviewed as additional data becomes available and mitigation efforts should be adopted as appropriate to achieve pore pressure reduction needs. |
Estimated total cost of $150,000.
It is the QP’s recommendation that the following hydrogeology work be undertaken:
| · | In general, update the hydrogeological conceptual model for the pit and valley areas over time as more data becomes available and designs are revised. |
| ○ | Continue water level monitoring |
| ○ | Assess the potential effects of seasonal or rapid and high amplitude recharge events (i.e., freshet) on pore pressure and on sump sizing needs. |
| ○ | Assess pit sump locations that could promote drainage from below talc layers. |
| ○ | Where feasible, assess drainage ditches around and set back from the pit perimeter to reduce runoff inflow, and internal ditching that directs water to pit sumps or out of the pit. |
| ○ | Consider snow removal or clearing off high elevation portions of the pit to reduce seasonal freshet increases in groundwater recharge and pore pressures. |
| ○ | Update the pit Groundwater Management Plan as mine design advances and plan to implement at the start of mining. |
| ○ | Estimated cost for points above of $40,000. |
| ○ | Install general pit perimeter groundwater monitoring on the north, south and west sides of the pit. Estimated cost $300,000 |
| | |
| Arctic Project | Page 412 |
| S-K 1300 Technical Report Summary | November 30, 2022 |
| | |
| ○ | Conduct hydrogeological drilling at location of the groundwater seepage interception system (SIS) to characterize overburden and fractured rock properties in the specific area of the system |
| ○ | Update estimates of potential groundwater bypass of the WRCP and the groundwater SIS design as appropriate. |
| ○ | Initiate baseline monitoring of groundwater quality around groundwater SIS as soon as possible to provide a dataset for environmental permitting and to support performance monitoring of the groundwater SIS once in operation. |
| ○ | Estimated cost of $150,000. |
| 23.6 | Tailings Management Facility |
It is the opinion of the QP, further engineering studies required for the TMF design include:
| · | Geotechnical and hydrogeological investigations to be completed in the foundations of the TMF, WRF, WRCP, and Process Pond including borehole drilling and laboratory testing to support design objectives, including the following. Estimated Cost $1,000,000. |
| · | Dam Breach Assessment, based on site specific hazard assessment, for the TMF, the WRCP and Process pond. Estimated cost of $85,000. |
| · | Finite element consolidation and seepage modelling of the TMF to better understand drainage, long-term settlement, and effects on capacity and closure. Estimated cost $75,000. |
| · | Tailings deposition planning and water balance update to account for additional tailings volume, thickened tailings, plan for pool management and winter deposition, and timing of tailings dewatering towards end of mine life. Estimated cost $50,000. |
| · | Evaluation of Tailings consolidation and requirement for an underdrain system. Estimated cost $25,000. |
| · | Update WRF, TMF, WRCP, and Process Pond stability analyses (including liquefaction assessment) based on additional field investigation results and lab testing. Estimated Cost $150,000. |
| · | Evaluate whether heat or gas generation during oxidation of waste rock may adversely affect the closure cover. Estimated cost $35,000. |
It is the QP’s opinion that a revegetation and cover study should be conducted to verify plant survival at the elevations proposed of the waste rock dump and reclaimed tailings facility. Trials should be conducted during operations to develop a revegetation program to meet 11 AAC 97.200 – Land Reclamation and Performance Standards. Alaska Statute AS 27.19.020 requires that the site be left in a stable condition. Generally, revegetation is the preferred method of stabilization, however other methods of stabilization could be implemented such as a non-reactive, durable rock cover.
Thriving plant communities at the proposed elevations are limited to localized areas with deeper growth media, and water availability. Much of the surrounding area is talus rock with minimal plant cover. The study should include climactic variables such as persistence of snow, limited rainfall, soil erosion or low temperature at altitude which may (or many not) limit plant survival. The proponent should consult with the Alaska Plant Materials Center to develop a revegetation program utilizing native species to determine the optimal growth media depth, amendments, and soil cover to optimize plant survival.
| | |
| Arctic Project | Page 413 |
| S-K 1300 Technical Report Summary | November 30, 2022 |
| | |
Estimated cost of $250,000.
The following actions are recommended to further define the water treatment strategy. The cost of the first four items are already included in the estimated cost for the WTP:
| · | As the discharge permitting advances and the actual permitted discharge criteria become more defined, review and adjust the WTP design accordingly to target compliance with the criteria. |
| · | Continue to track and address identified project risks and opportunities. |
| · | Implement technology confirmation testing such as bench-scale and pilot-scale treatment tests to confirm the high treatment rates required to meet the WQS will be achieved and to right-size treatment equipment. Based on the outcome of influent water quality projections and these treatability studies, the system design can be refined. The RO reject treatment train can be evaluated once real mine-impacted water is generated during the operation phase. |
| · | Refine the acids and bases used in the WTP to reduce the risk of TDS WQS compliance issues. This refinement can be done in later design phases. |
| · | Continue to refine the WTP influent water quality predictions, which will include advancing the source term predictions. Estimated cost $170,000. |
| 23.9 | Metallurgical testing |
Additional testwork is proposed to further refine metallurgical performance and recovery estimates for the selected flowsheet, including the following at an estimated cost of $175,000:
| · | Variability testing on samples with characteristics that match the LOM feed material to improve the recovery and concentrate grade models |
| · | Investigate circuit flowsheet modifications to improve concentrate quality and reduce deleterious elements |
| · | Comminution testing on new samples to increase the database of results to optimize comminution power |
Further process plant activities to be considered for the next phase include capital cost optimization and a thorough review of equipment sizing/selection based on the geometallurgy outcomes. Estimated cost of $350,000.
| 23.11 | Operational Readiness Plan |
A robust OR plan would benefit the Arctic Project given the inherent risks and challenges associated with operating at a remote site. Estimated cost $120,000.
| | |
| Arctic Project | Page 414 |
| S-K 1300 Technical Report Summary | November 30, 2022 |
| | |
| · | Review project and operating assumptions to take into consideration the impacts of labour availability, logistical challenges with availability of equipment and associated goods/services and long lead times. |
| · | Create a start-up/operational risk register to highlight issues for decisions taken during detailed design and for items related to the pre-operations/commissioning phase. |
| · | Take into account specific development and implementation considerations in the OR plan for the remote cold-weather project site with limited access. |
| · | Identify contingencies and challenge assumptions regarding supply, transportation and logistics for reagents, concentrate, and any other goods to develop potentially better alternatives. |
| · | Identify strategies to track environment and operations-related permits to avoid other costly alternatives. |
| · | Explore opportunities in the region to develop synergies with existing businesses and to understand what is available, as well as what needs to be developed to build the “industrial base” required to sustain mining and processing operations. |
| · | Identify vendors and develop strategies to support contracts, parts, warehousing, training and first fills that will result in savings and positively impact human resource (HR) planning. |
| · | Consider strategic HR staffing decisions such as innovative labour scheduling and local sourcing. |
| · | Identify HSEC policies and procedures for a remote site to leverage local resources and other tie-ins where possible. |
| · | Mobilize key technical functions early, such as an assay lab and asset management functions to support mining and operations. |
| | |
| Arctic Project | Page 415 |
| S-K 1300 Technical Report Summary | November 30, 2022 |
| | |
[ADEC] Alaska Department of Environment and Conservation. 2008. Alaska Water Quality Criteria Manual for Toxic and Other Deleterious Organic and Inorganic Substances.
[ADEC] Alaska Department of Environment and Conservation. 2018. Alaska Water Quality Standards: 18 AAC 80.
ABR, 2017, Aerial Surveys of Nesting Raptors in the Upper Kobuk Mineral Project Area, Alaska, 2016, Consultant Report for WHPacific and Ambler Metals, Inc., January.
ABR, 2018, Aerial Surveys of Nesting Raptors in the Upper Kobuk Mineral Project Area, Alaska, 2017, Consultant Report for WHPacific and Ambler Metals, Inc., January.
ADFG, 2011, Caribou Management Report - Species Management Report, Alaska Department of Fish and Game, Division of Wildlife Conservation, Patricia Harper Editor, 2011.
ADFG, 2015, Caribou Management Report - Species Management Report, Alaska Department of Fish and Game, Division of Wildlife Conservation, ADFG Report 2015-4.
Alaska Industrial Development and Export Authority, AIDEA, and Alaska Energy Authority, 2013, Interior Energy Project Feasibility Report. Proposed Project – North Slope LNG Plant, July.
Albers, D.A., 2004, Arctic Project Status Report: NovaGold Internal report.
Aleinikoff, J. N., Moore, T. E., Walter, M., and Nokleberg, W. J., 1993, U-Pb ages of zircon, monazite, and sphene from Devonian Metagranites and Metafelsites, Central Brooks Range, Alaska: U.S. Geological Survey Bulletin, v. B 2068, p. 59-70.
Ambler Metals Inc., 2020: Arctic Feasibility Study – AMDIAP Road Toll Costs: memorandum prepared for Ausenco, dated September 23, 2020.
Austin, J., 2019, Memorandum on the Cyanide Destruction Testwork and Tailings Solutions Production.
BGC Engineering, 2012, Ambler Project, Arctic Deposit, Sub-Arctic Creek, Alaska, Rock Mechanics and Hydrogeology Study, Consultant Report for NovaCopper U.S. Inc., October.
Broadbent, C.D. 1981, Evaluation of Arctic and Ruby Creek Deposits: Kennecott Exploration Internal report
Broman, B.N., 2014, Metamorphism and Element Redistribution: Investigations of Ag-bearing and associated minerals in the Arctic Volcanogenic Massive Sulphide Deposit, SW Brooks Range, NW Alaska, University of Alaska Fairbanks.
Brown, W.J., 1985, Pre-AFD Report.
Chutas, N., 2006, Preliminary report on the Button Schist: NovaGold Internal report.
CIBC Global Mining Group, Analyst Consensus Commodity Price Forecasts, Consensus Forecast Summary, November 1, 2022.
| | |
| Arctic Project | Page 416 |
| S-K 1300 Technical Report Summary | November 30, 2022 |
| | |
Clark, L.A. and Sweeney, M.J., 1976, Volcanic Stratigraphy, Petrology, and Trace Metal Geochemistry, Arctic Deposit: Kennecott Exploration Internal report.
Clark, L.A., 1972, Petrographic Problem Studies Report, Arctic Deposit: Kennecott Exploration Internal report.
Craig, C., 2012, 2012 UKMP Water Quality Report, Internal Report by NovaCopper US Inc., January.
Craig, C., 2013, 2013 UKMP Water Quality Report, Third Quarter, Internal Report by NovaCopper US Inc., October.
Craig, C., 2014, 2014 UKMP Water Quality Report, Third Quarter, Internal Report by NovaCopper US Inc., October.
Craig, C., 2015, 2015 UKMP Water Quality Report, Third Quarter, Internal Report by NovaCopper US Inc., October.
Craig, C., 2016, 2016 UKMP Water Quality Report, Fourth Quarter, Internal Report by Ambler Metals Inc., January 2017.
Craig, C., 2016, 2016 UKMP Water Quality Report, Third Quarter, Internal Report by Ambler Metals Inc., July 2017.
Craig, C., 2017, 2017 UKMP Water Quality Report, April 21st – 24th, Internal Report by Ambler Metals Inc., June.
Craig, C., 2017, 2017 UKMP Water Quality Report, May 17th, Internal Report by Ambler Metals Inc., June.
Dillon, J. T., Pessel, G. H., Chen, J. H., and Veach, N. C., 1980, . Middle Paleozoicmagmatism and Orogenesis in the Brooks Range, Alaska: Geology, v. 8, p. 338-343.
Dillon, J. T., Tilton, G. R., Decker, J., and Kelley, M. J., 1987, Resource Implications of Magmatic and Metamorphic Ages for Devonian Igneous Rocks in the Brooks Range, in Tailleur, I. L., and Weimer, P., Alaskan North Slope Geology, Pacific Section, Society of Economic Paleontologists and Mineralogists, p. 713-723.
Dimock, R.R., 1984, Arctic Evaluation Update: Kennecott Exploration Internal report.
Dodd, S. P., Lindberg, P. A., Albers, D. F., Robinson, J. D., Prevost, R., 2004, Ambler Project, 2004 Summary Report, Unpublished Internal Report, Alaska Gold Company.
DOWL HKM, 2013, NovaCopper Final Year-End Report 2012, Consultant Report prepared for NovaCopper under Work Order 60816, March.
DOWL, 2016, Large Mammal Survey, Consultant Report for Ambler Metals, Inc. December.
DOWL, 2016, Ambler Metals Upper Kobuk Mining Project, Preliminary Wetlands Determination, Consultant Report for Ambler Metals Inc., November.
DOWL, 2020, Dahl Creek Airstrip Feasibility Study, February 2020.
Earnshaw, J., 1999, Interim Report Conceptual Level Economic Evaluations of the Arctic Resource: Kennecott Exploration Internal report.
| | |
| Arctic Project | Page 417 |
| S-K 1300 Technical Report Summary | November 30, 2022 |
| | |
Ellis, W.T., 1978, Geologic Evaluation and Assessment of the “North Belt” Claims Ambler District: Sunshine Mining Company Internal report.
Ernst & Young LLP, 2023: Tax Module Build Arctic Project, January 20, 2023.
Exploration Agreement and Option to Lease between NovaCopper US Inc. and NANA Regional Corporation, Inc. dated October 19, 2011, as amended.
Franklin, J.M., Gibson, H.L., Jonasson, I.R., and Galley, A.G., 2005, Volcanogenic Massive Sulphide Deposits, in Hedenquist, J.W., Thompson, J.F.H., Goldfarb, R.J., and Richards, J.P., eds., Economic Geology 100th Anniversary Volume: The Economic Geology Publishing Company, p. 523-560.
Fueg, J., Arctic/Ambler District Geophysical Work Plan, Kennecott Exploration Internal memorandum.
Gottschalk, R. R., and Oldow, J. S., 1988, Low-angle Normal Faults in the South-central Brooks Range Fold and Thrust Belt, Alaska, Geology, 16, p. 395-399.
Grinnell, J.G., 1901, Gold Hunting in Alaska (E. Grinnell, Ed.), David C. Cook Publishing Company.
Gustin, M. M. and Ronning, P., 2013, NI 43-101 Technical Report on the Sun Project, prepared by Mine Development Associates of Reno, Nevada for Andover Mining Corp.
Hale, C., 1996, 1995 Annual Ambler District Report: Kennecott Exploration Internal report.
Halls, J.L. 1974, Ambler District Evaluation: Kennecott Exploration Internal report.
Halls, J.L. 1976, Arctic Deposit Order of Magnitude Evaluation: Kennecott Exploration Internal report.
Halls, J.L. 1978, Arctic Deposit: Kennecott Exploration Internal report.
Hammitt, J.W., 1985, 1985 Annual Progress Report – Ambler District: Kennecott Corporation Internal Report.
Hitzman, M. W., Proffett, J. M., Schmidt, J. M., and Smith, T. E., 1986, Geology and Mineralization of the Ambler District, Northwestern Alaska: Economic Geology v. 81, p. 1592-1618.
Hitzman, M. W., Smith, T. E., and Proffett, J. M., 1982, Bedrock Geology of the Ambler District, Southwestern Brooks Range, Alaska: Alaska Division of Geological and Geophysical Surveys Geologic Report 75, scale 1:250,000.
Hunt, G.A., 1999, PIMA alteration mapping and structural interpretation of drill core from the Arctic Deposit, Alaska, a report prepared for Rio Tinto Mining and Exploration Ltd, 10 p.
Jacobsen, W.L., 1997, Arctic Project Mining Potential: Kennecott Exploration Internal report
Journel A., Huijbregts, C. J., 1978, Mining Geostatics. London: Academic Press.
Kennecott Research Center, August 1972, Amenability Testing of Samples from Bear Creek Mining Company’s Arctic Deposit, TR 72-12.
Kennecott Research Center, January 1997, Process Selection for Arctic Deposit, Technical Report RTR 77-4.
| | |
| Arctic Project | Page 418 |
| S-K 1300 Technical Report Summary | November 30, 2022 |
| | |
Kennecott Research Center, September 1968, Amenability Testing of Diamond Drill Core Samples from Arctic, Alaska Project, TR 68-20.
Kennecott Research Center, September 1976, Recovery of Mineral Values Arctic Prospect, RTR 76¬22.
Kennecott, 1977, Annual Report Arctic Deposit: Unpublished in-house report.
Kennecott, 1995, Re-Evaluation of the Arctic Deposit, Ambler District, Alaska: Unpublished in-house report.
Kennecott, 1998, Arctic Deposit and Ambler District Field Report: Unpublished in-house report (R. Presnell & J. Fueg).
Kobuk Valley National Park, 2007, www.kobuk.valley.national-park.com/info.htm#env.
Lakefield Research Limited, January 7, 1999, An Investigation of the Recovery of Lead, Zinc & Precious Metals from Samples of the Arctic Project Ore submitted by Kennecott Minerals, Progress Report No.1.
Lindberg, P. A., 2004, Structural Geology of the Arctic Cu-Zn-Pb-Ag Sulphide Deposit: Alaska Gold Company Unpublished Report.
Lindberg, P. A., 2005, A Preliminary Attempt to Unfold the Arctic Volcanogenic Ore Deposit and Determine it’s Original Metal Zonation: Alaska Gold Company Unpublished Report.
Marten, B.E., 1999, Structure of the Arctic Polymetallic VHMS Deposit, Ambler District, Alaska: Report on Fieldwork, Rio Tinto Mining and Exploration Internal Report.
Mathers, N., 2017, Site Infrastructure Location Workshop 1 August 2017.Metz, P.A., 1978, Arctic Prospect Summary File Report, prepared for US Bureau of Mines by Mineral Research Laboratory, University of Alaska – Fairbanks.
McClelland, W.C., Schmidt, J.M., and Till, A.B., 2006, New U-Pb SHRIMP ages from Devonian felsic volcanic and Proterozoic plutonic rocks of the southern Brooks Range, AK: Geologic Society of America Abstracts with Programs, v. 38, n. 5, p. 12.
Modroo, E.R., 1980, Ambler River Project Project Memorandum Field Investigations: Sunshine Mining Company Internal report.
Modroo, E.R., 1982, Ambler River Project Project Memorandum Field Investigations: Bear Creek Mining Company Internal report.
Modroo, E.R., 1983, Ambler River Project Project Memorandum Field Investigations: Sunshine Mining Company Internal report.
Moore, T. E., Wallace, W. K., Bird, K. J., Karl, S. M., Mull, C. G., and Dillon, J. T., 1994, Geology of Northern Alaska, in Plafker, G., and Berg, H. C., eds., The Geology of Alaska: Boulder, Colorado, Geological Society of America, The Geology of North America, v. G1, p. 49-140.
Moore, T.E., 1992, The Arctic Alaska Superterrane, p. 238-244, in Bradley, D.C., and Dusel-Bacon, C., eds., Geologic Studies in Alaska by the U.S. Geological Survey, 1991: U.S. Geological Survey Bulletin 2041.
| | |
| Arctic Project | Page 419 |
| S-K 1300 Technical Report Summary | November 30, 2022 |
| | |
Moore, T.E., Wallace, W.K, Bird, K.J., Karl, S.M., Mull, C.G., and Dillon, J.T., 1994, Geology of northern Alaska, in Plafker, G., and Berg, H.C., eds., The Geology of Alaska: Boulder, Colorado, Geologic Society of America, The Geology of North America, v. G-1.
Mull, C. G., 1982, Tectonic Evolution and Structural Style of the Brooks Range, Alaska; an Illustrated Summary, in Geologic Studies of the Cordilleran Thrust Belt, Rocky Mt. Assoc. Geol., Denver, CO, United States, USA, p. 1-45.
Mull, C. G., 1985, Cretaceous Tectonics, Depositional Cycles, and the Nanushuk Group, Brooks Range and Arctic Slope, Alaska, U.S. Geol. Soc. Bull., 1614, p. 7-36.
Newberry, R.J., Crafford, T.C., Newkirk, S.R., Young, L.E., Nelson, S.W., and Duke, N.A., 1997, Volcanogenic massive sulphide deposits of Alaska, in Goldfarb, R.J., and Miller, L.D., eds., Mineral deposits of Alaska: Economic Geology Monograph 9, p. 120-150.
Oldow, J. S., Seidensticker, C. M., Phelps, J. C., Julian, F. E., Gottschalk, R. R., Boler, K. W., Handschy, J. W., and Ave Lallemant, H. G., 1987, Balanced Cross Sections Through the Central Brooks Range and North Slope, Arctic Alaska, AAPG, p. 19, 8 plates.
Otto, B. R., 2006, Personal Communication.
Otto,B., 2006, Arctic Progress Report: NovaGold Internal Report.
Parker, Bradley, 2017, Aquatic Biomonitoring at the Arctic-Bornite Prospect, 2016, Alaska Department of Fish and Game
Plafker, G., Jones, D.L., and Pessagno, E.A., Jr., 1977, A Cretaceous accretionary flysch and mélange terrane along the Gulf of Alaska margin in Blean, K.M. ed., The USGS in Alaska Accomplishments during 1976: USGS Survey Circ 751-B, p. B52-B54.
Piercey, S.J., Report on August 2022 Field Visit Study of the Arctic VMS Deposit and Other Targets within the Ambler Belt, Alaska, unpublished report prepared by SJPGeoConsulting and Department of Earth Sciences, Memorial University of Newfoundland for Ambler Metals.
Proffett, J. M., 1999, Summary of Conclusions on Geology of the Arctic Deposit, AK: Kennecott Minerals Company Unpublished Report.
Randolph, M. P., August 29, 1990, Internal Kennecott Memo to T. J. Stephenson, Arctic Deposit.
Rubin, C.M.,1982, Ambler Project Annual Report: Anaconda Metals Company Internal report.
Russell, R. H., 1977, Annual Report, Arctic Deposit: Bear Creek Mining Company Unpublished Report.
Russell, R. H., 1995, Arctic Project 1995 Evaluation Report, Geologic Report: Kennecott Corporation Unpublished Report.
Schmandt, D., 2009, Mineralogy and Origin of Zn-rich horizons within the Arctic Volcanogenic Massive Sulphide deposit, Ambler District, Alaska. Undergraduate Thesis, Smith College, 59 p.
Schmidt, J. M., 1983, Geology and Geochemistry of the Arctic Prospect, Ambler District, Alaska: Unpublished Ph.D. dissertation, Stanford University.
| | |
| Arctic Project | Page 420 |
| S-K 1300 Technical Report Summary | November 30, 2022 |
| | |
Schmidt, J. M., 1986, Stratigraphic Setting and Mineralogy of the Arctic Volcanogenic Massive Sulphide Prospect, Ambler District, Alaska: Economic Geology v. 81. p. 1619-1643.
Schmidt, J. M., 1988, Mineral and Whole Rock Compositions of Seawater-Dominated Hydrothermal Alteration at the Arctic Volcanogenic Massive Sulphide Prospect, Alaska: Economic Geology v.83, p. 822-842.
Shaw Alaska Inc., 2008, Hydraulics Data Report July 2008 Event Final, Shaw Environmental, Inc.
Shaw Environmental Inc., 2007, Ambler Project, 2007 Environmental Baseline Sampling, Shaw Environmental, Inc.
Shaw Environmental Inc., 2008, Water Quality Report July 2008 Event Final, Shaw Environmental, Inc.
Shaw Environmental Inc., 2009, Hydraulics Data Report July 2009 Event Draft, Shaw Environmental, Inc.
Shaw Environmental Inc., 2009, Water Quality Report July 2009 Event Final, Shaw Alaska, Inc.
Silberling, N.J., et al., 1992, Lithotectonic terrange map of the North American Cordillera, USGS.
SRK Consulting (Canada) Inc. (2017). Pre-Feasibility Slope Geotechnical and Hydrogeological Report for the Arctic Deposit (2016), Report prepared for Trilogy Metals Inc., SRK Project 2CN032.001, February 2017.
SRK Consulting (Canada) Inc. (2020). Geotechnical and Hydrogeological Feasibility Report for the Arctic Deposit, Report prepared for Trilogy Metals Inc., SRK Project 2CT031.000, September 2020.
SRK Consulting (Canada) Inc. (2022). Ambler Prefeasibility Study Geotechnical and Hydrogeological Assessments, Report prepared for Ambler Metals LLC, SRK Project CAPR000764 , January 2022.
SRK Consulting (Canada) Inc. (2018). Technical Report on the Arctic Project for PFS level Waste Management, Water Management & Closure Design, report prepared for Ambler Metals Inc., SRK Project Number 1CT030.001, February.
SRK Consulting (Canada) Inc. (2019). Arctic Project: Plan for Further Characterization of Acid Rock Drainage and Metal Leaching Potential; Project 1CN024.004. Report prepared for Ambler Metals Inc. May 2019.
SRK Consulting (Canada) Inc. (2020). Technical Report on the Arctic Project for FS level Waste Management, Water Management & Closure Design, report prepared for Ambler Metals Inc., SRK Project Number 1CT030.003, (Draft).
SRK Consulting (Canada) Inc.. 2017 Arctic Project Pre-feasibility Study: Overburden Site Investigation, report prepared for Ambler Metals Inc., SRK Project Number 1CT030.001, Report Date October, 2017.
SRK Consulting (Canada) Inc.. 2018 Technical Report on the Arctic Project for PFS level Waste Management, Water Management & Closure Design, report prepared for Ambler Metals Inc., SRK Project Number 1CT030.001, Report Date March 2018.
SRK, 1998, Arctic Project Preliminary Scoping Study. Prepared by SRK Consulting, U.S., Inc. for NovaCopper. Report Date March 9, 2012. 276 pages.
SRK, 2012, NI 43-101 Preliminary Economic Assessment Ambler Project Kobuk, AK, SRK Consulting (U.S.), Inc., March.
| | |
| Arctic Project | Page 421 |
| S-K 1300 Technical Report Summary | November 30, 2022 |
| | |
SRK, 2012, NI 43-101 Preliminary Economic Assessment, Ambler Project, Kobuk, AK. Prepared by SRK Consulting Inc. for Kennecott Minerals Company. Report Date November, 1998. 69 pages.
SRK, 2016, Pre-Feasibility Slope Geotechnical and Hydrogeological Report for the Arctic Deposit (2016), SRK Consulting (Canada), Inc., February 2017.
Stephen R. Braund & Associates, 2012, Ambler Mining District Access Road Subsistence Data Gap Memo, Prepared for the Alaska Department of Transportation and Public Facilities, May.
Stephens, J.D., and Cameron, J.W., 1970, Arctic Alaska Project – Mineralogic Study of Diamond Drill Core Samples: Technical Report 70-01. Kennecott Research Center – Metal Mining Division, 21 p.
Stevens, M.G., 1982, Ambler District Generalized District Petrology: Bear Creek Mining Company Internal report.
StoneHouse Consulting Inc.: Arctic Concentrate Marketing, prepared for Trilogy Metals Inc., dated January 5, 2023.
Tetra Tech, 2010a, Arctic Deposit Access Environmental Baseline Data Collection - Hydrology, Ambler Mining District, Alaska, December.
Tetra Tech, 2010b, Arctic Deposit Access Environmental Baseline Data Collection - Wetlands & Vegetation, Ambler Mining District, Alaska, November.
Tetra Tech, 2011, Arctic Deposit Access Environmental Baseline Data Collection – Aquatics, Ambler Mining District, Alaska, January 20.
Tetra Tech, 2013, Preliminary Economic Assessment Report on the Arctic Project, Ambler Mining District, Northwest Alaska, September.
Till, A. B., Schmidt, J. M., and Nelson, S. W., 1988, Thrust Involvement of Metamorphic Rocks, Southwestern Brooks Range, Alaska: Geology, v. 16, p. 930-933.
Twelker, E., 2008, Progress Report: Immobile element lithogeochem work at Arctic: NovaGold Internal Report
URSA Engineering, 1998, Arctic Project Rock Mass Characterization, Prepared for: Kennecott Minerals, Co., Unpublished Report, p. 49.
Vallat, C., 2013a, Memo to NovaCopper Inc. “Historic Pre-NovaGold, 2004, Arctic Assay Validations and Updates Within NovaCopper Database”: GeoSpark Consulting Inc. April 22, 2013.
Vallat, C., 2013b, “Quality Assurance and Quality Control Review on Analytical Results Related to the NovaCopper Inc. Arctic Project, pre-NovaGold, pre-2004, ”: GeoSpark Consulting Inc. unpublished report for NovaCopper Inc. April 22, 2013.
Vallat, C., 2013c, “Quality Assurance and Quality Control Review on Analytical Results Related to the NovaCopper Inc. 2004 Arctic Project”: GeoSpark Consulting Inc. unpublished report for NovaCopper Inc. June 6, 2013.
Vallat, C., 2013d, “Quality Assurance and Quality Control Review on Analytical Results Related to the NovaCopper Inc. 2005 Arctic Project”: GeoSpark Consulting Inc. unpublished report for NovaCopper Inc. June 6, 2013.
| | |
| Arctic Project | Page 422 |
| S-K 1300 Technical Report Summary | November 30, 2022 |
| | |
Vallat, C., 2013e, “Quality Assurance and Quality Control Review on Analytical Results Related to the NovaCopper Inc. 2006 Arctic Project”: GeoSpark Consulting Inc. unpublished report for NovaCopper Inc. June 6, 2013.
Vallat, C., 2013f, “Quality Assurance and Quality Control Review on Analytical Results Related to the NovaCopper Inc. 2007 Arctic Project”: GeoSpark Consulting Inc. unpublished report for NovaCopper Inc. June 6, 2013.
Vallat, C., 2013g, “Quality Assurance and Quality Control Review on Analytical Results Related to the NovaCopper Inc. 2008 Arctic Project”: GeoSpark Consulting Inc. unpublished report for NovaCopper Inc. June 6, 2013.
Vallat, C., 2013h, Memo to NovaCopper Inc. “Arctic Projects 2011 Drill Program Assays Reported in 2013 – QAQC” GeoSpark Consulting Inc. May 31, 2013.
Vallat, C., 2015, Quality Assurance and Quality Control Review on Analytical Results on the Arctic Project, unpublished report prepared for NovaCopper Inc.
Vallat, C., 2016, Quality Assurance and Quality Control Review on Analytical Results on the Arctic Project, unpublished report prepared for NovaCopper Inc.
Stonehouse Consulting, 2020, Reliance Letter for Metal Pricing Content of the 2020 Ambler NI 43-101 Technical Report, dated September 14 2020.
Vogl, J. J., Calvert, A. J., Gans, P. B., 2003, Mechanisms and Timing of Exhumation of Collision-Related Metamorphic Rocks, Southern Brooks Range, Alaska: Insights from Ar, 40, / Ar, 39, Thermochronology, Tectonics, v 21, No 3, p. 1-18.
Website: http://alaskamininghalloffame.org/inductees/berg.php, February 14, 2012.
West, A., 2013, Memo to E. Workman & GeoSpark Consulting Inc. “NovaCopper Arctic Project Database Verification”: Internal NovaCopper Inc. Memo, January 8, 2013.
West, A., 2014, Identified 2013 Erroneous SG Measurements, internal memo prepared for NovaCopper.
West, A., 2020, Metallurgical Test materials used in the 2020 Ambler Feasibility Study.
WHPacific, 2016, Cultural Resources Assessment of the Proposed Arctic Pit and Support Facilities Project in Northwest Arctic Borough, Alaska, Consultant Report for Ambler Metals Inc., December 19.
XE.com. Currency Exchange Rates, Accessed November 30, 2022. [Online: https://www.xe.com/]
Zieg, G. A., et al., 2005, Ambler Project 2005 Progress Report, Unpublished Internal Report, Alaska Gold Company.
| | |
| Arctic Project | Page 423 |
| S-K 1300 Technical Report Summary | November 30, 2022 |
| | |
| 25 | RELIANCE ON INFORMATION PROVIDED BY THE REGISTRANT |
The QPs have relied on information provided by Trilogy Metals (the registrant) including expert reports, in preparing its findings and conclusions regarding the following modifying factors: macroeconomic information, marketing information, legal matters, environmental matters, accommodations the registrant commits or plans to provide to local individuals or groups in connection with its mine plans, and governmental factors.
The QPs consider it reasonable to rely on Trilogy Metals for this information since they have obtained opinion from appropriate experts.
The QPs have not independently reviewed ownership of the Project area and any underlying property agreements, mineral tenure, surface rights, or royalties. The QPs have fully relied upon, and disclaim responsibility for, information derived from Trilogy Metals and legal experts retained by Trilogy Metals for this information through the following documents:
| · | Kennecott Exploration Company, Kennecott Arctic Company, Alaska Gold Company and NovaGold Resources Inc., 2010: Net Smelter Returns Royalty Agreement dated effective January 7, 2010: 51 p. |
| · | NovaCopper US Inc. and NANA Regional Corporation Inc., 2011: Exploration Agreement and Option to Lease, dated effective October 19, 2011: 144 p. |
| · | NovaCopper US Inc. and NANA Regional Corporation Inc., 2012: Amending Agreement, dated effective May 10, 2012: 7 p. |
| · | Reeves, J.N., 2018: Arctic Project: legal opinion prepared by Holmes Weddell & Barcott for Trilogy Metals Inc., 4 April 2018, 58 p. |
| · | NovaCopper US Inc, Trilogy Metals Inc. and Ambler Metals LLC, 2020: Contribution Agreement, effective as of February 11, 2020: 39 p. |
This information is used in Section 3 of the Report. The information is also used in support of the Mineral Resource estimate in Section 11, the Mineral Reserve estimate in Section 12 and the economic analysis in Section 19.
The QPs have not independently reviewed the Arctic Project taxation position. The QPs have fully relied upon, and disclaim responsibility for, taxation information supplied by Ernst & Young LLP who was retained for this information. Arctic Project taxation information has been provided through:
| · | Ernst & Young LLP, 2023: Tax Module Build Arctic Project, January 20, 2023. |
This information is used in the economic analysis in Section 19 of the Report.
| | |
| Arctic Project | Page 424 |
| S-K 1300 Technical Report Summary | November 30, 2022 |
| | |
| 25.4 | Environmental Matters and Community Accommodations |
The QPs have fully relied upon, and disclaim responsibility for, information supplied by Trilogy Metals and experts retained by Trilogy Metals for information related to environmental (including tailings and water management) permitting, permitting, closure planning and related cost estimation, and social and community impacts as follows:
| · | Alaska Department of Environment and Conservation. 2008. Alaska Water Quality Criteria Manual for Toxic and Other Deleterious Organic and Inorganic Substances. |
| · | Craig, C., 2012, 2012 UKMP Water Quality Report, Internal Report by NovaCopper US Inc., January. |
| · | DOWL, 2016, Ambler Metals Upper Kobuk Mining Project, Preliminary Wetlands Determination, Consultant Report for Ambler Metals Inc., November. |
| · | Shaw Environmental Inc., 2007, Ambler Project, 2007 Environmental Baseline Sampling, Shaw Environmental, Inc. |
| · | Shaw Environmental Inc., 2008, Water Quality Report July 2008 Event Final, Shaw Environmental, Inc. |
| · | Shaw Environmental Inc., 2009, Hydraulics Data Report July 2009 Event Draft, Shaw Environmental, Inc. |
| · | Shaw Environmental Inc., 2009, Water Quality Report July 2009 Event Final, Shaw Alaska, Inc. |
This information is used in Section 17 of the Report. The information is also used in support of the Mineral Resource estimate in Section 11, the Mineral Reserve estimate in Section 12, capital and operating costs in Section 18 and the economic analysis in Section 19.
| 25.5 | Marketing Information |
The QPs have not independently reviewed the market studies, pricing or contract information. The QPs have fully relied upon, and disclaim responsibility for, information derived from Trilogy Metals and experts retained by Trilogy Metals for this information through the following documents:
| · | CIBC Global Mining Group, Analyst Consensus Commodity Price Forecasts, Consensus Forecast Summary, November 1, 2022. |
| · | StoneHouse Consulting Inc.: Arctic Concentrate Marketing, prepared for Trilogy Metals Inc., dated January 5, 2023. |
Metals price forecasting is a specialized business requiring knowledge of supply and demand, economic activity and other factors that are highly specialized and requires an extensive global database that is outside of the purview of a QP. The QPs consider it reasonable to rely upon Trilogy Metals to provide metal price forecasts and marketing information on the base metal concentrates as they sought expert input for this information.
This information is used in Section 16 of the Report. The information is also used in support of the Mineral Resource estimate in Section 11, the Mineral Reserve estimate in Section 12, and economic analysis in Section 19.
| | |
| Arctic Project | Page 425 |
| S-K 1300 Technical Report Summary | November 30, 2022 |
| | |
Appendix A – Mineral Claims
To Affidavit of Annual Labor for Labor Year Ending September 1, 2022
Ambler Metals LLC
State of Alaska Mining Claims
Kateel River Meridian, Kotzebue Recording District
| | ADL | Claim Name | Township | Range | Section | 1/4 Section |
| 1 | 540543 | Arctic 40A | 21N | 11E | 35 | SW |
| 2 | 540544 | Arctic 496A | 21N | 11E | 34 | SE |
| 3 | 540545 | Arctic 1001 | 21N | 11E | 34 | SE |
| 4 | 540546 | Arctic 1002 | 21N | 11E | 34 | SE & SW |
| 5 | 540549 | Arctic 1005 | 21N | 11E | 35 | SW |
| 6 | 546144 | SC 24 | 21N | 10E | 16 | SW & SE |
| 7 | 546145 | SC 25 | 21N | 10E | 16 | SW, SE, NW & NE |
| 8 | 546146 | SC 26 | 21N | 10E | 16 | NW & NE |
| 9 | 546147 | SC 34 | 21N | 10E | 16 | SE |
| 10 | 546148 | SC 35 | 21N | 10E | 16 | SE & NE |
| 11 | 546149 | SC 36 | 21N | 10E | 16 | NE |
| 12 | 546150 | SC 44 | 21N | 10E | 15; 16 | SW; SE |
| 13 | 546151 | SC 45 | 21N | 10E | 15; 16 | SW & NW; SE & NE |
| 14 | 546152 | SC 46 | 21N | 10E | 15; 16 | NW; NE |
| 15 | 546153 | SC 54 | 21N | 10E | 15 | SW |
| 16 | 546154 | SC 55 | 21N | 10E | 15 | SW & NW |
| 17 | 546155 | SC 56 | 21N | 10E | 15 | NW |
| 18 | 546156 | SC 64 | 21N | 10E | 15 | SW & SE |
| 19 | 546157 | SC 65 | 21N | 10E | 15 | SW, SE, NW & NE |
| 20 | 546158 | SC 66 | 21N | 10E | 15 | NW & NE |
| 21 | 590853 | AM 63-165 | 21N | 9E | 14 | NW |
| 22 | 590854 | AM 63-166 | 21N | 9E | 14 | NW |
| 23 | 590855 | AM 63-167 | 21N | 9E | 14 | NE |
| 24 | 590856 | AM 63-168 | 21N | 9E | 14 | NE |
| 25 | 590857 | AM 63-169 | 21N | 9E | 13 | NW |
| 26 | 590858 | AM 63-170 | 21N | 9E | 13 | NW |
| 27 | 590859 | AM 63-171 | 21N | 9E | 13 | NE |
| 28 | 590860 | AM 63-172 | 21N | 9E | 13 | NE |
| 29 | 590874 | AM 64-165 | 21N | 9E | 14 | NW |
| | |
| Arctic Project | Page 426 |
| S-K 1300 Technical Report Summary | November 30, 2022 |
| | |
| | |
| | |
| 30 | 590875 | AM 64-166 | 21N | 9E | 14 | NW |
| 31 | 590876 | AM 64-167 | 21N | 9E | 14 | NE |
| 32 | 590877 | AM 64-168 | 21N | 9E | 14 | NE |
| 33 | 590878 | AM 64-169 | 21N | 9E | 13 | NW |
| 34 | 590879 | AM 64-170 | 21N | 9E | 13 | NW |
| 35 | 590880 | AM 64-171 | 21N | 9E | 13 | NE |
| 36 | 590881 | AM 64-172 | 21N | 9E | 13 | NE |
| 37 | 590895 | AM 65-165 | 21N | 9E | 11 | SW |
| 38 | 590896 | AM 65-166 | 21N | 9E | 11 | SW |
| 39 | 590897 | AM 65-167 | 21N | 9E | 11 | SE |
| 40 | 590898 | AM 65-168 | 21N | 9E | 11 | SE |
| 41 | 590899 | AM 65-169 | 21N | 9E | 12 | SW |
| 42 | 590900 | AM 65-170 | 21N | 9E | 12 | SW |
| 43 | 590901 | AM 65-171 | 21N | 9E | 12 | SE |
| 44 | 590902 | AM 65-172 | 21N | 9E | 12 | SE |
| 45 | 590916 | AM 66-165 | 21N | 9E | 11 | SW |
| 46 | 590917 | AM 66-166 | 21N | 9E | 11 | SW |
| 47 | 590918 | AM 66-167 | 21N | 9E | 11 | SE |
| 48 | 590919 | AM 66-168 | 21N | 9E | 11 | SE |
| 49 | 590920 | AM 66-169 | 21N | 9E | 12 | SW |
| 50 | 590921 | AM 66-170 | 21N | 9E | 12 | SW |
| 51 | 590922 | AM 66-171 | 21N | 9E | 12 | SE |
| 52 | 590923 | AM 66-172 | 21N | 9E | 12 | SE |
| 53 | 590940 | AM 67-165 | 21N | 9E | 11 | NW |
| 54 | 590941 | AM 67-166 | 21N | 9E | 11 | NW |
| 55 | 590942 | AM 67-167 | 21N | 9E | 11 | NE |
| 56 | 590943 | AM 67-168 | 21N | 9E | 11 | NE |
| 57 | 590944 | AM 67-169 | 21N | 9E | 12 | NW |
| 58 | 590945 | AM 67-170 | 21N | 9E | 12 | NW |
| 59 | 590946 | AM 67-171 | 21N | 9E | 12 | NE |
| 60 | 590947 | AM 67-172 | 21N | 9E | 12 | NE |
| 61 | 590998 | AM 56-186 | 21N | 10E | 27 | NW |
| 62 | 590999 | AM 56-187 | 21N | 10E | 27 | NE |
| 63 | 591000 | AM 56-188 | 21N | 10E | 27 | NE |
| 64 | 591001 | AM 56-189 | 21N | 10E | 26 | NW |
| 65 | 591002 | AM 56-190 | 21N | 10E | 26 | NW |
| 66 | 591003 | AM 56-191 | 21N | 10E | 26 | NE |
| 67 | 591004 | AM 56-192 | 21N | 10E | 26 | NE |
| 68 | 591005 | AM 56-193 | 21N | 10E | 25 | NW |
| 69 | 591006 | AM 56-194 | 21N | 10E | 25 | NW |
| 70 | 591007 | AM 56-195 | 21N | 10E | 25 | NE |
| 71 | 591008 | AM 57-176 | 21N | 10E | 19 | SE |
| 72 | 591009 | AM 57-177 | 21N | 10E | 20 | SW |
| 73 | 591010 | AM 57-178 | 21N | 10E | 20 | SW |
| | |
| Arctic Project | Page 427 |
| S-K 1300 Technical Report Summary | November 30, 2022 |
| | |
| | |
| | |
| 74 | 591011 | AM 57-179 | 21N | 10E | 20 | SE |
| 75 | 591012 | AM 57-180 | 21N | 10E | 20 | SE |
| 76 | 591013 | AM 57-181 | 21N | 10E | 21 | SW |
| 77 | 591014 | AM 57-182 | 21N | 10E | 21 | SW |
| 78 | 591015 | AM 57-183 | 21N | 10E | 21 | SE |
| 79 | 591016 | AM 57-184 | 21N | 10E | 21 | SE |
| 80 | 591017 | AM 57-185 | 21N | 10E | 22 | SW |
| 81 | 591018 | AM 57-186 | 21N | 10E | 22 | SW |
| 82 | 591019 | AM 57-187 | 21N | 10E | 22 | SE |
| 83 | 591020 | AM 57-188 | 21N | 10E | 22 | SE |
| 84 | 591021 | AM 57-189 | 21N | 10E | 23 | SW |
| 85 | 591022 | AM 57-190 | 21N | 10E | 23 | SW |
| 86 | 591023 | AM 57-191 | 21N | 10E | 23 | SE |
| 87 | 591024 | AM 57-192 | 21N | 10E | 23 | SE |
| 88 | 591025 | AM 57-193 | 21N | 10E | 24 | SW |
| 89 | 591026 | AM 57-194 | 21N | 10E | 24 | SW |
| 90 | 591027 | AM 57-195 | 21N | 10E | 24 | SE |
| 91 | 591028 | AM 58-176 | 21N | 10E | 19 | SE |
| 92 | 591029 | AM 58-177 | 21N | 10E | 20 | SW |
| 93 | 591030 | AM 58-178 | 21N | 10E | 20 | SW |
| 94 | 591031 | AM 58-179 | 21N | 10E | 20 | SE |
| 95 | 591032 | AM 58-180 | 21N | 10E | 20 | SE |
| 96 | 591033 | AM 58-181 | 21N | 10E | 21 | SW |
| 97 | 591034 | AM 58-182 | 21N | 10E | 21 | SW |
| 98 | 591035 | AM 58-183 | 21N | 10E | 21 | SE |
| 99 | 591036 | AM 58-184 | 21N | 10E | 21 | SE |
| 100 | 591037 | AM 58-185 | 21N | 10E | 22 | SW |
| 101 | 591038 | AM 58-186 | 21N | 10E | 22 | SW |
| 102 | 591039 | AM 58-187 | 21N | 10E | 22 | SE |
| 103 | 591040 | AM 58-188 | 21N | 10E | 22 | SE |
| 104 | 591041 | AM 58-189 | 21N | 10E | 23 | SW |
| 105 | 591042 | AM 58-190 | 21N | 10E | 23 | SW |
| 106 | 591043 | AM 58-191 | 21N | 10E | 23 | SE |
| 107 | 591044 | AM 58-192 | 21N | 10E | 23 | SE |
| 108 | 591045 | AM 58-193 | 21N | 10E | 24 | SW |
| 109 | 591046 | AM 58-194 | 21N | 10E | 24 | SW |
| 110 | 591047 | AM 59-176 | 21N | 10E | 19 | NE |
| 111 | 591048 | AM 59-177 | 21N | 10E | 20 | NW |
| 112 | 591049 | AM 59-178 | 21N | 10E | 20 | NW |
| 113 | 591050 | AM 59-179 | 21N | 10E | 20 | NE |
| 114 | 591051 | AM 59-180 | 21N | 10E | 20 | NE |
| 115 | 591052 | AM 59-181 | 21N | 10E | 21 | NW |
| 116 | 591053 | AM 59-182 | 21N | 10E | 21 | NW |
| 117 | 591054 | AM 59-183 | 21N | 10E | 21 | NE |
| | |
| Arctic Project | Page 428 |
| S-K 1300 Technical Report Summary | November 30, 2022 |
| | |
| | |
| | |
| 118 | 591055 | AM 59-184 | 21N | 10E | 21 | NE |
| 119 | 591056 | AM 59-185 | 21N | 10E | 22 | NW |
| 120 | 591057 | AM 59-186 | 21N | 10E | 22 | NW |
| 121 | 591058 | AM 59-187 | 21N | 10E | 22 | NE |
| 122 | 591059 | AM 59-188 | 21N | 10E | 22 | NE |
| 123 | 591060 | AM 59-189 | 21N | 10E | 23 | NW |
| 124 | 591061 | AM 59-190 | 21N | 10E | 23 | NW |
| 125 | 591062 | AM 59-191 | 21N | 10E | 23 | NE |
| 126 | 591063 | AM 59-192 | 21N | 10E | 23 | NE |
| 127 | 591064 | AM 59-193 | 21N | 10E | 24 | NW |
| 128 | 591065 | AM 60-176 | 21N | 10E | 19 | NE |
| 129 | 591066 | AM 60-177 | 21N | 10E | 20 | NW |
| 130 | 591067 | AM 60-178 | 21N | 10E | 20 | NW |
| 131 | 591068 | AM 60-179 | 21N | 10E | 20 | NE |
| 132 | 591069 | AM 60-180 | 21N | 10E | 20 | NE |
| 133 | 591070 | AM 60-181 | 21N | 10E | 21 | NW |
| 134 | 591071 | AM 60-182 | 21N | 10E | 21 | NW |
| 135 | 591072 | AM 60-183 | 21N | 10E | 21 | NE |
| 136 | 591073 | AM 60-184 | 21N | 10E | 21 | NE |
| 137 | 591074 | AM 60-185 | 21N | 10E | 22 | NW |
| 138 | 591075 | AM 60-186 | 21N | 10E | 22 | NW |
| 139 | 591076 | AM 60-187 | 21N | 10E | 22 | NE |
| 140 | 591077 | AM 60-188 | 21N | 10E | 22 | NE |
| 141 | 591078 | AM 60-189 | 21N | 10E | 23 | NW |
| 142 | 591079 | AM 60-190 | 21N | 10E | 23 | NW |
| 143 | 591080 | AM 60-191 | 21N | 10E | 23 | NE |
| 144 | 591081 | AM 60-192 | 21N | 10E | 23 | NE |
| 145 | 591082 | AM 60-193 | 21N | 10E | 24 | NW |
| 146 | 591083 | AM 61-176 | 21N | 10E | 18 | SE |
| 147 | 591084 | AM 61-177 | 21N | 10E | 17 | SW |
| 148 | 591085 | AM 61-178 | 21N | 10E | 17 | SW |
| 149 | 591086 | AM 61-179 | 21N | 10E | 17 | SE |
| 150 | 591087 | AM 61-180 | 21N | 10E | 17 | SE |
| 151 | 591088 | AM 61-181 | 21N | 10E | 16 | SW |
| 152 | 591089 | AM 61-182 | 21N | 10E | 16 | SW |
| 153 | 591090 | AM 61-183 | 21N | 10E | 16 | SE |
| 154 | 591091 | AM 61-184 | 21N | 10E | 16 | SE |
| 155 | 591092 | AM 61-185 | 21N | 10E | 15 | SW |
| 156 | 591093 | AM 61-186 | 21N | 10E | 15 | SW |
| 157 | 591094 | AM 61-187 | 21N | 10E | 15 | SE |
| 158 | 591095 | AM 61-188 | 21N | 10E | 15 | SE |
| 159 | 591096 | AM 61-189 | 21N | 10E | 14 | SW |
| 160 | 591097 | AM 61-190 | 21N | 10E | 14 | SW |
| 161 | 591098 | AM 61-191 | 21N | 10E | 14 | SE |
| | |
| Arctic Project | Page 429 |
| S-K 1300 Technical Report Summary | November 30, 2022 |
| | |
| | |
| | |
| 162 | 591099 | AM 61-192 | 21N | 10E | 14 | SE |
| 163 | 591100 | AM 61-193 | 21N | 10E | 13 | SW |
| 164 | 591101 | AM 62-176 | 21N | 10E | 18 | SE |
| 165 | 591102 | AM 62-177 | 21N | 10E | 17 | SW |
| 166 | 591103 | AM 62-178 | 21N | 10E | 17 | SW |
| 167 | 591104 | AM 62-179 | 21N | 10E | 17 | SE |
| 168 | 591105 | AM 62-180 | 21N | 10E | 17 | SE |
| 169 | 591106 | AM 62-181 | 21N | 10E | 16 | SW |
| 170 | 591107 | AM 62-182 | 21N | 10E | 16 | SW |
| 171 | 591108 | AM 62-187 | 21N | 10E | 15 | SE |
| 172 | 591109 | AM 62-188 | 21N | 10E | 15 | SE |
| 173 | 591110 | AM 62-189 | 21N | 10E | 14 | SW |
| 174 | 591111 | AM 62-190 | 21N | 10E | 14 | SW |
| 175 | 591112 | AM 62-191 | 21N | 10E | 14 | SE |
| 176 | 591113 | AM 62-192 | 21N | 10E | 14 | SE |
| 177 | 591114 | AM 62-193 | 21N | 10E | 13 | SW |
| 178 | 591115 | AM 63-173 | 21N | 10E | 18 | NW |
| 179 | 591116 | AM 63-174 | 21N | 10E | 18 | NW |
| 180 | 591117 | AM 63-175 | 21N | 10E | 18 | NE |
| 181 | 591118 | AM 63-176 | 21N | 10E | 18 | NE |
| 182 | 591119 | AM 63-177 | 21N | 10E | 17 | NW |
| 183 | 591120 | AM 63-178 | 21N | 10E | 17 | NW |
| 184 | 591121 | AM 63-179 | 21N | 10E | 17 | NE |
| 185 | 591122 | AM 63-180 | 21N | 10E | 17 | NE |
| 186 | 591123 | AM 63-181 | 21N | 10E | 16 | NW |
| 187 | 591124 | AM 63-182 | 21N | 10E | 16 | NW |
| 188 | 591125 | AM 63-187 | 21N | 10E | 15 | NE |
| 189 | 591126 | AM 63-188 | 21N | 10E | 15 | NE |
| 190 | 591127 | AM 63-189 | 21N | 10E | 14 | NW |
| 191 | 591128 | AM 63-190 | 21N | 10E | 14 | NW |
| 192 | 591129 | AM 63-191 | 21N | 10E | 14 | NE |
| 193 | 591130 | AM 63-192 | 21N | 10E | 14 | NE |
| 194 | 591131 | AM 63-193 | 21N | 10E | 13 | NW |
| 195 | 591132 | AM 64-173 | 21N | 10E | 18 | NW |
| 196 | 591133 | AM 64-174 | 21N | 10E | 18 | NW |
| 197 | 591134 | AM 64-175 | 21N | 10E | 18 | NE |
| 198 | 591135 | AM 64-176 | 21N | 10E | 18 | NE |
| 199 | 591136 | AM 64-177 | 21N | 10E | 17 | NW |
| 200 | 591137 | AM 64-178 | 21N | 10E | 17 | NW |
| 201 | 591138 | AM 64-179 | 21N | 10E | 17 | NE |
| 202 | 591139 | AM 64-180 | 21N | 10E | 17 | NE |
| 203 | 591140 | AM 64-181 | 21N | 10E | 16 | NW |
| 204 | 591141 | AM 64-182 | 21N | 10E | 16 | NW |
| 205 | 591142 | AM 64-183 | 21N | 10E | 16 | NE |
| | |
| Arctic Project | Page 430 |
| S-K 1300 Technical Report Summary | November 30, 2022 |
| | |
| | |
| | |
| 206 | 591143 | AM 64-184 | 21N | 10E | 16 | NE |
| 207 | 591144 | AM 64-185 | 21N | 10E | 15 | NW |
| 208 | 591145 | AM 64-186 | 21N | 10E | 15 | NW |
| 209 | 591146 | AM 64-187 | 21N | 10E | 15 | NE |
| 210 | 591147 | AM 64-188 | 21N | 10E | 15 | NE |
| 211 | 591148 | AM 64-189 | 21N | 10E | 14 | NW |
| 212 | 591149 | AM 64-190 | 21N | 10E | 14 | NW |
| 213 | 591150 | AM 64-191 | 21N | 10E | 14 | NE |
| 214 | 591151 | AM 64-192 | 21N | 10E | 14 | NE |
| 215 | 591152 | AM 64-193 | 21N | 10E | 13 | NW |
| 216 | 591153 | AM 65-173 | 21N | 10E | 7 | SW |
| 217 | 591154 | AM 65-174 | 21N | 10E | 7 | SW |
| 218 | 591155 | AM 65-175 | 21N | 10E | 7 | SE |
| 219 | 591156 | AM 65-176 | 21N | 10E | 7 | SE |
| 220 | 591157 | AM 65-177 | 21N | 10E | 8 | SW |
| 221 | 591158 | AM 65-178 | 21N | 10E | 8 | SW |
| 222 | 591159 | AM 65-179 | 21N | 10E | 8 | SE |
| 223 | 591160 | AM 65-180 | 21N | 10E | 8 | SE |
| 224 | 591161 | AM 65-181 | 21N | 10E | 9 | SW |
| 225 | 591162 | AM 65-182 | 21N | 10E | 9 | SW |
| 226 | 591163 | AM 65-183 | 21N | 10E | 9 | SE |
| 227 | 591164 | AM 65-184 | 21N | 10E | 9 | SE |
| 228 | 591165 | AM 65-185 | 21N | 10E | 10 | SW |
| 229 | 591166 | AM 65-186 | 21N | 10E | 10 | SW |
| 230 | 591167 | AM 65-187 | 21N | 10E | 10 | SE |
| 231 | 591168 | AM 65-188 | 21N | 10E | 10 | SE |
| 232 | 591169 | AM 65-189 | 21N | 10E | 11 | SW |
| 233 | 591170 | AM 65-190 | 21N | 10E | 11 | SW |
| 234 | 591171 | AM 65-191 | 21N | 10E | 11 | SE |
| 235 | 591172 | AM 65-192 | 21N | 10E | 11 | SE |
| 236 | 591173 | AM 65-193 | 21N | 10E | 12 | SW |
| 237 | 591174 | AM 66-173 | 21N | 10E | 7 | SW |
| 238 | 591175 | AM 66-174 | 21N | 10E | 7 | SW |
| 239 | 591176 | AM 66-175 | 21N | 10E | 7 | SE |
| 240 | 591177 | AM 66-176 | 21N | 10E | 7 | SE |
| 241 | 591178 | AM 66-177 | 21N | 10E | 8 | SW |
| 242 | 591179 | AM 66-178 | 21N | 10E | 8 | SW |
| 243 | 591180 | AM 66-179 | 21N | 10E | 8 | SE |
| 244 | 591181 | AM 66-180 | 21N | 10E | 8 | SE |
| 245 | 591182 | AM 66-181 | 21N | 10E | 9 | SW |
| 246 | 591183 | AM 66-182 | 21N | 10E | 9 | SW |
| 247 | 591184 | AM 66-183 | 21N | 10E | 9 | SE |
| 248 | 591185 | AM 66-184 | 21N | 10E | 9 | SE |
| 249 | 591186 | AM 66-185 | 21N | 10E | 10 | SW |
| | |
| Arctic Project | Page 431 |
| S-K 1300 Technical Report Summary | November 30, 2022 |
| | |
| | |
| | |
| 250 | 591187 | AM 66-186 | 21N | 10E | 10 | SW |
| 251 | 591188 | AM 66-187 | 21N | 10E | 10 | SE |
| 252 | 591189 | AM 66-188 | 21N | 10E | 10 | SE |
| 253 | 591190 | AM 66-189 | 21N | 10E | 11 | SW |
| 254 | 591191 | AM 66-190 | 21N | 10E | 11 | SW |
| 255 | 591192 | AM 66-191 | 21N | 10E | 11 | SE |
| 256 | 591193 | AM 66-192 | 21N | 10E | 11 | SE |
| 257 | 591194 | AM 66-193 | 21N | 10E | 12 | SW |
| 258 | 591195 | AM 67-173 | 21N | 10E | 7 | NW |
| 259 | 591196 | AM 67-174 | 21N | 10E | 7 | NW |
| 260 | 591197 | AM 67-175 | 21N | 10E | 7 | NE |
| 261 | 591198 | AM 67-176 | 21N | 10E | 7 | NE |
| 262 | 591199 | AM 67-177 | 21N | 10E | 8 | NW |
| 263 | 591200 | AM 67-178 | 21N | 10E | 8 | NW |
| 264 | 591201 | AM 67-179 | 21N | 10E | 8 | NE |
| 265 | 591202 | AM 67-180 | 21N | 10E | 8 | NE |
| 266 | 591203 | AM 67-181 | 21N | 10E | 9 | NW |
| 267 | 591204 | AM 67-182 | 21N | 10E | 9 | NW |
| 268 | 591205 | AM 67-183 | 21N | 10E | 9 | NE |
| 269 | 591206 | AM 67-184 | 21N | 10E | 9 | NE |
| 270 | 591207 | AM 67-185 | 21N | 10E | 10 | NW |
| 271 | 591208 | AM 67-186 | 21N | 10E | 10 | NW |
| 272 | 591209 | AM 67-187 | 21N | 10E | 10 | NE |
| 273 | 591210 | AM 67-188 | 21N | 10E | 10 | NE |
| 274 | 591211 | AM 67-189 | 21N | 10E | 11 | NW |
| 275 | 591212 | AM 67-190 | 21N | 10E | 11 | NW |
| 276 | 591213 | AM 67-191 | 21N | 10E | 11 | NE |
| 277 | 591214 | AM 67-192 | 21N | 10E | 11 | NE |
| 278 | 591215 | AM 67-193 | 21N | 10E | 12 | NW |
| 279 | 591216 | AM 67-194 | 21N | 10E | 12 | NW |
| 280 | 591217 | AM 67-195 | 21N | 10E | 12 | NE |
| 281 | 591218 | AM 67-196 | 21N | 10E | 12 | NE |
| 282 | 591219 | AM 49-206 | 21N | 11E | 33 | SW |
| 283 | 591220 | AM 49-207 | 21N | 11E | 33 | SE |
| 284 | 591221 | AM 49-208 | 21N | 11E | 33 | SE |
| 285 | 591222 | AM 49-209 | 21N | 11E | 34 | SW |
| 286 | 591223 | AM 49-210 | 21N | 11E | 34 | SW |
| 287 | 591224 | AM 49-214 | 21N | 11E | 35 | SW |
| 288 | 591225 | AM 49-215 | 21N | 11E | 35 | SE |
| 289 | 591226 | AM 49-216 | 21N | 11E | 35 | SE |
| 290 | 591227 | AM 49-217 | 21N | 11E | 36 | SW |
| 291 | 591228 | AM 49-218 | 21N | 11E | 36 | SW |
| 292 | 591229 | AM 49-219 | 21N | 11E | 36 | SE |
| 293 | 591230 | AM 49-220 | 21N | 11E | 36 | SE |
| | |
| Arctic Project | Page 432 |
| S-K 1300 Technical Report Summary | November 30, 2022 |
| | |
| | |
| | |
| 294 | 591231 | AM 50-206 | 21N | 11E | 33 | SW |
| 295 | 591232 | AM 50-207 | 21N | 11E | 33 | SE |
| 296 | 591233 | AM 50-208 | 21N | 11E | 33 | SE |
| 297 | 591234 | AM 50-209 | 21N | 11E | 34 | SW |
| 298 | 591235 | AM 50-210 | 21N | 11E | 34 | SW |
| 299 | 591236 | AM 50-211 | 21N | 11E | 34 | SE |
| 300 | 591237 | AM 50-213 | 21N | 11E | 35 | SW |
| 301 | 591238 | AM 50-214 | 21N | 11E | 35 | SW |
| 302 | 591239 | AM 50-215 | 21N | 11E | 35 | SE |
| 303 | 591240 | AM 50-216 | 21N | 11E | 35 | SE |
| 304 | 591241 | AM 50-217 | 21N | 11E | 36 | SW |
| 305 | 591242 | AM 50-218 | 21N | 11E | 36 | SW |
| 306 | 591243 | AM 50-219 | 21N | 11E | 36 | SE |
| 307 | 591244 | AM 50-220 | 21N | 11E | 36 | SE |
| 308 | 591245 | AM 51-206 | 21N | 11E | 33 | NW |
| 309 | 591246 | AM 51-207 | 21N | 11E | 33 | NE |
| 310 | 591247 | AM 51-208 | 21N | 11E | 33 | NE |
| 311 | 591248 | AM 51-209 | 21N | 11E | 34 | NW |
| 312 | 591249 | AM 51-210 | 21N | 11E | 34 | NW |
| 313 | 591250 | AM 51-211 | 21N | 11E | 34 | NE |
| 314 | 591251 | AM 51-212 | 21N | 11E | 34 | NE |
| 315 | 591252 | AM 51-213 | 21N | 11E | 35 | NW |
| 316 | 591253 | AM 51-214 | 21N | 11E | 35 | NW |
| 317 | 591254 | AM 51-215 | 21N | 11E | 35 | NE |
| 318 | 591255 | AM 51-216 | 21N | 11E | 35 | NE |
| 319 | 591256 | AM 51-217 | 21N | 11E | 36 | NW |
| 320 | 591257 | AM 51-218 | 21N | 11E | 36 | NW |
| 321 | 591258 | AM 51-219 | 21N | 11E | 36 | NE |
| 322 | 591259 | AM 51-220 | 21N | 11E | 36 | NE |
| 323 | 591260 | AM 52-206 | 21N | 11E | 33 | NW |
| 324 | 591261 | AM 52-207 | 21N | 11E | 33 | NE |
| 325 | 591262 | AM 52-208 | 21N | 11E | 33 | NE |
| 326 | 591263 | AM 52-209 | 21N | 11E | 34 | NW |
| 327 | 591264 | AM 52-210 | 21N | 11E | 34 | NW |
| 328 | 591265 | AM 52-211 | 21N | 11E | 34 | NE |
| 329 | 591266 | AM 52-212 | 21N | 11E | 34 | NE |
| 330 | 591267 | AM 52-213 | 21N | 11E | 35 | NW |
| 331 | 591268 | AM 52-214 | 21N | 11E | 35 | NW |
| 332 | 591269 | AM 52-215 | 21N | 11E | 35 | NE |
| 333 | 591270 | AM 52-216 | 21N | 11E | 35 | NE |
| 334 | 591271 | AM 52-217 | 21N | 11E | 36 | NW |
| 335 | 591272 | AM 52-218 | 21N | 11E | 36 | NW |
| 336 | 591273 | AM 52-219 | 21N | 11E | 36 | NE |
| 337 | 591274 | AM 52-220 | 21N | 11E | 36 | NE |
| | |
| Arctic Project | Page 433 |
| S-K 1300 Technical Report Summary | November 30, 2022 |
| | |
| | |
| | |
| 338 | 591275 | AM 53-206 | 21N | 11E | 28 | SW |
| 339 | 591276 | AM 53-207 | 21N | 11E | 28 | SE |
| 340 | 591277 | AM 53-208 | 21N | 11E | 28 | SE |
| 341 | 591278 | AM 53-209 | 21N | 11E | 27 | SW |
| 342 | 591279 | AM 53-210 | 21N | 11E | 27 | SW |
| 343 | 591280 | AM 53-211 | 21N | 11E | 27 | SE |
| 344 | 591281 | AM 53-212 | 21N | 11E | 27 | SE |
| 345 | 591282 | AM 53-213 | 21N | 11E | 26 | SW |
| 346 | 591283 | AM 53-214 | 21N | 11E | 26 | SW |
| 347 | 591284 | AM 53-215 | 21N | 11E | 26 | SE |
| 348 | 591285 | AM 53-216 | 21N | 11E | 26 | SE |
| 349 | 591286 | AM 53-217 | 21N | 11E | 25 | SW |
| 350 | 591287 | AM 53-218 | 21N | 11E | 25 | SW |
| 351 | 591288 | AM 53-219 | 21N | 11E | 25 | SE |
| 352 | 591289 | AM 53-220 | 21N | 11E | 25 | SE |
| 353 | 591290 | AM 54-206 | 21N | 11E | 28 | SW |
| 354 | 591291 | AM 54-207 | 21N | 11E | 28 | SE |
| 355 | 591292 | AM 54-208 | 21N | 11E | 28 | SE |
| 356 | 591293 | AM 54-209 | 21N | 11E | 27 | SW |
| 357 | 591294 | AM 54-210 | 21N | 11E | 27 | SW |
| 358 | 591295 | AM 54-211 | 21N | 11E | 27 | SE |
| 359 | 591296 | AM 54-212 | 21N | 11E | 27 | SE |
| 360 | 591297 | AM 54-213 | 21N | 11E | 26 | SW |
| 361 | 591298 | AM 54-214 | 21N | 11E | 26 | SW |
| 362 | 591299 | AM 54-215 | 21N | 11E | 26 | SE |
| 363 | 591300 | AM 54-216 | 21N | 11E | 26 | SE |
| 364 | 591301 | AM 54-217 | 21N | 11E | 25 | SW |
| 365 | 591302 | AM 54-218 | 21N | 11E | 25 | SW |
| 366 | 591303 | AM 54-219 | 21N | 11E | 25 | SE |
| 367 | 591304 | AM 54-220 | 21N | 11E | 25 | SE |
| 368 | 591305 | AM 55-206 | 21N | 11E | 28 | NW |
| 369 | 591306 | AM 55-207 | 21N | 11E | 28 | NE |
| 370 | 591307 | AM 55-208 | 21N | 11E | 28 | NE |
| 371 | 591308 | AM 55-209 | 21N | 11E | 27 | NW |
| 372 | 591309 | AM 55-210 | 21N | 11E | 27 | NW |
| 373 | 591310 | AM 55-211 | 21N | 11E | 27 | NE |
| 374 | 591311 | AM 55-212 | 21N | 11E | 27 | NE |
| 375 | 591312 | AM 55-213 | 21N | 11E | 26 | NW |
| 376 | 591313 | AM 55-214 | 21N | 11E | 26 | NW |
| 377 | 591314 | AM 55-215 | 21N | 11E | 26 | NE |
| 378 | 591315 | AM 55-216 | 21N | 11E | 26 | NE |
| 379 | 591316 | AM 55-217 | 21N | 11E | 25 | NW |
| 380 | 591317 | AM 55-218 | 21N | 11E | 25 | NW |
| 381 | 591318 | AM 55-219 | 21N | 11E | 25 | NE |
| | |
| Arctic Project | Page 434 |
| S-K 1300 Technical Report Summary | November 30, 2022 |
| | |
| | |
| | |
| 382 | 591319 | AM 55-220 | 21N | 11E | 25 | NE |
| 383 | 591320 | AM 56-206 | 21N | 11E | 28 | NW |
| 384 | 591321 | AM 56-207 | 21N | 11E | 28 | NE |
| 385 | 591322 | AM 56-208 | 21N | 11E | 28 | NE |
| 386 | 591323 | AM 56-209 | 21N | 11E | 27 | NW |
| 387 | 591324 | AM 56-210 | 21N | 11E | 27 | NW |
| 388 | 591325 | AM 56-211 | 21N | 11E | 27 | NE |
| 389 | 591326 | AM 56-212 | 21N | 11E | 27 | NE |
| 390 | 591327 | AM 56-213 | 21N | 11E | 26 | NW |
| 391 | 591328 | AM 56-214 | 21N | 11E | 26 | NW |
| 392 | 591329 | AM 56-215 | 21N | 11E | 26 | NE |
| 393 | 591330 | AM 56-216 | 21N | 11E | 26 | NE |
| 394 | 591331 | AM 56-217 | 21N | 11E | 25 | NW |
| 395 | 591332 | AM 56-218 | 21N | 11E | 25 | NW |
| 396 | 591333 | AM 56-219 | 21N | 11E | 25 | NE |
| 397 | 591334 | AM 56-220 | 21N | 11E | 25 | NE |
| 398 | 591335 | AM 57-206 | 21N | 11E | 21 | SW |
| 399 | 591336 | AM 57-207 | 21N | 11E | 21 | SE |
| 400 | 591337 | AM 57-208 | 21N | 11E | 21 | SE |
| 401 | 591338 | AM 57-209 | 21N | 11E | 22 | SW |
| 402 | 591339 | AM 57-210 | 21N | 11E | 22 | SW |
| 403 | 591340 | AM 57-211 | 21N | 11E | 22 | SE |
| 404 | 591341 | AM 57-212 | 21N | 11E | 22 | SE |
| 405 | 591342 | AM 57-213 | 21N | 11E | 23 | SW |
| 406 | 591343 | AM 57-214 | 21N | 11E | 23 | SW |
| 407 | 591344 | AM 57-215 | 21N | 11E | 23 | SE |
| 408 | 591345 | AM 57-216 | 21N | 11E | 23 | SE |
| 409 | 591346 | AM 57-217 | 21N | 11E | 24 | SW |
| 410 | 591347 | AM 57-218 | 21N | 11E | 24 | SW |
| 411 | 591348 | AM 57-219 | 21N | 11E | 24 | SE |
| 412 | 591349 | AM 57-220 | 21N | 11E | 24 | SE |
| 413 | 591350 | AM 58-206 | 21N | 11E | 21 | SW |
| 414 | 591351 | AM 58-207 | 21N | 11E | 21 | SE |
| 415 | 591352 | AM 58-208 | 21N | 11E | 21 | SE |
| 416 | 591353 | AM 58-209 | 21N | 11E | 22 | SW |
| 417 | 591354 | AM 58-210 | 21N | 11E | 22 | SW |
| 418 | 591355 | AM 58-211 | 21N | 11E | 22 | SE |
| 419 | 591356 | AM 58-212 | 21N | 11E | 22 | SE |
| 420 | 591357 | AM 58-213 | 21N | 11E | 23 | SW |
| 421 | 591358 | AM 58-214 | 21N | 11E | 23 | SW |
| 422 | 591359 | AM 58-215 | 21N | 11E | 23 | SE |
| 423 | 591360 | AM 58-216 | 21N | 11E | 23 | SE |
| 424 | 591361 | AM 58-217 | 21N | 11E | 24 | SW |
| 425 | 591362 | AM 58-218 | 21N | 11E | 24 | SW |
| | |
| Arctic Project | Page 435 |
| S-K 1300 Technical Report Summary | November 30, 2022 |
| | |
| | |
| | |
| 426 | 591363 | AM 58-219 | 21N | 11E | 24 | SE |
| 427 | 591364 | AM 58-220 | 21N | 11E | 24 | SE |
| 428 | 591365 | AM 59-202 | 21N | 11E | 20 | NW |
| 429 | 591366 | AM 59-203 | 21N | 11E | 20 | NE |
| 430 | 591367 | AM 59-204 | 21N | 11E | 20 | NE |
| 431 | 591368 | AM 59-205 | 21N | 11E | 21 | NW |
| 432 | 591369 | AM 59-206 | 21N | 11E | 21 | NW |
| 433 | 591370 | AM 59-207 | 21N | 11E | 21 | NE |
| 434 | 591371 | AM 59-208 | 21N | 11E | 21 | NE |
| 435 | 591372 | AM 59-209 | 21N | 11E | 22 | NW |
| 436 | 591373 | AM 59-210 | 21N | 11E | 22 | NW |
| 437 | 591374 | AM 59-211 | 21N | 11E | 22 | NE |
| 438 | 591375 | AM 59-212 | 21N | 11E | 22 | NE |
| 439 | 591376 | AM 59-213 | 21N | 11E | 23 | NW |
| 440 | 591377 | AM 59-214 | 21N | 11E | 23 | NW |
| 441 | 591378 | AM 59-215 | 21N | 11E | 23 | NE |
| 442 | 591379 | AM 59-216 | 21N | 11E | 23 | NE |
| 443 | 591380 | AM 59-217 | 21N | 11E | 24 | NW |
| 444 | 591381 | AM 59-218 | 21N | 11E | 24 | NW |
| 445 | 591382 | AM 60-202 | 21N | 11E | 20 | NW |
| 446 | 591383 | AM 60-203 | 21N | 11E | 20 | NE |
| 447 | 591384 | AM 60-204 | 21N | 11E | 20 | NE |
| 448 | 591385 | AM 60-205 | 21N | 11E | 21 | NW |
| 449 | 591386 | AM 60-206 | 21N | 11E | 21 | NW |
| 450 | 591387 | AM 60-207 | 21N | 11E | 21 | NE |
| 451 | 591388 | AM 60-208 | 21N | 11E | 21 | NE |
| 452 | 591389 | AM 60-209 | 21N | 11E | 22 | NW |
| 453 | 591390 | AM 60-210 | 21N | 11E | 22 | NW |
| 454 | 591391 | AM 60-211 | 21N | 11E | 22 | NE |
| 455 | 591392 | AM 60-212 | 21N | 11E | 22 | NE |
| 456 | 591393 | AM 60-213 | 21N | 11E | 23 | NW |
| 457 | 591394 | AM 60-214 | 21N | 11E | 23 | NW |
| 458 | 591395 | AM 60-215 | 21N | 11E | 23 | NE |
| 459 | 591396 | AM 60-216 | 21N | 11E | 23 | NE |
| 460 | 591397 | AM 60-217 | 21N | 11E | 24 | NW |
| 461 | 591398 | AM 60-218 | 21N | 11E | 24 | NW |
| 462 | 591399 | AM 61-202 | 21N | 11E | 17 | SW |
| 463 | 591400 | AM 61-203 | 21N | 11E | 17 | SE |
| 464 | 591401 | AM 61-204 | 21N | 11E | 17 | SE |
| 465 | 591402 | AM 61-205 | 21N | 11E | 16 | SW |
| 466 | 591403 | AM 61-206 | 21N | 11E | 16 | SW |
| 467 | 591404 | AM 61-207 | 21N | 11E | 16 | SE |
| 468 | 591405 | AM 61-208 | 21N | 11E | 16 | SE |
| 469 | 591406 | AM 61-209 | 21N | 11E | 15 | SW |
| | |
| Arctic Project | Page 436 |
| S-K 1300 Technical Report Summary | November 30, 2022 |
| | |
| | |
| | |
| 470 | 591407 | AM 61-210 | 21N | 11E | 15 | SW |
| 471 | 591408 | AM 61-211 | 21N | 11E | 15 | SE |
| 472 | 591409 | AM 61-212 | 21N | 11E | 15 | SE |
| 473 | 591410 | AM 61-213 | 21N | 11E | 14 | SW |
| 474 | 591411 | AM 61-214 | 21N | 11E | 14 | SW |
| 475 | 591412 | AM 61-215 | 21N | 11E | 14 | SE |
| 476 | 591413 | AM 61-216 | 21N | 11E | 14 | SE |
| 477 | 591414 | AM 61-217 | 21N | 11E | 13 | SW |
| 478 | 591415 | AM 61-218 | 21N | 11E | 13 | SW |
| 479 | 591416 | AM 62-202 | 21N | 11E | 17 | SW |
| 480 | 591417 | AM 62-203 | 21N | 11E | 17 | SE |
| 481 | 591418 | AM 62-204 | 21N | 11E | 17 | SE |
| 482 | 591419 | AM 62-205 | 21N | 11E | 16 | SW |
| 483 | 591420 | AM 62-206 | 21N | 11E | 16 | SW |
| 484 | 591421 | AM 62-207 | 21N | 11E | 16 | SE |
| 485 | 591422 | AM 62-208 | 21N | 11E | 16 | SE |
| 486 | 591423 | AM 62-209 | 21N | 11E | 15 | SW |
| 487 | 591424 | AM 62-210 | 21N | 11E | 15 | SW |
| 488 | 591425 | AM 62-211 | 21N | 11E | 15 | SE |
| 489 | 591426 | AM 62-212 | 21N | 11E | 15 | SE |
| 490 | 591427 | AM 62-213 | 21N | 11E | 14 | SW |
| 491 | 591428 | AM 62-214 | 21N | 11E | 14 | SW |
| 492 | 591429 | AM 62-215 | 21N | 11E | 14 | SE |
| 493 | 591430 | AM 62-216 | 21N | 11E | 14 | SE |
| 494 | 591431 | AM 62-217 | 21N | 11E | 13 | SW |
| 495 | 591432 | AM 62-218 | 21N | 11E | 13 | SW |
| 496 | 591433 | AM 63-202 | 21N | 11E | 17 | NW |
| 497 | 591434 | AM 63-203 | 21N | 11E | 17 | NE |
| 498 | 591435 | AM 63-204 | 21N | 11E | 17 | NE |
| 499 | 591436 | AM 63-205 | 21N | 11E | 16 | NW |
| 500 | 591437 | AM 63-206 | 21N | 11E | 16 | NW |
| 501 | 591438 | AM 63-207 | 21N | 11E | 16 | NE |
| 502 | 591439 | AM 63-208 | 21N | 11E | 16 | NE |
| 503 | 591440 | AM 63-209 | 21N | 11E | 15 | NW |
| 504 | 591441 | AM 63-210 | 21N | 11E | 15 | NW |
| 505 | 591442 | AM 63-211 | 21N | 11E | 15 | NE |
| 506 | 591443 | AM 63-212 | 21N | 11E | 15 | NE |
| 507 | 591444 | AM 64-202 | 21N | 11E | 17 | NW |
| 508 | 591445 | AM 64-203 | 21N | 11E | 17 | NE |
| 509 | 591446 | AM 64-204 | 21N | 11E | 17 | NE |
| 510 | 591447 | AM 64-205 | 21N | 11E | 16 | NW |
| 511 | 591448 | AM 64-206 | 21N | 11E | 16 | NW |
| 512 | 591449 | AM 64-207 | 21N | 11E | 16 | NE |
| 513 | 591450 | AM 64-208 | 21N | 11E | 16 | NE |
| | |
| Arctic Project | Page 437 |
| S-K 1300 Technical Report Summary | November 30, 2022 |
| | |
| | |
| | |
| 514 | 591451 | AM 64-209 | 21N | 11E | 15 | NW |
| 515 | 591452 | AM 64-210 | 21N | 11E | 15 | NW |
| 516 | 591453 | AM 64-211 | 21N | 11E | 15 | NE |
| 517 | 591454 | AM 64-212 | 21N | 11E | 15 | NE |
| 518 | 591455 | AM 65-202 | 21N | 11E | 8 | SW |
| 519 | 591456 | AM 65-203 | 21N | 11E | 8 | SE |
| 520 | 591457 | AM 65-204 | 21N | 11E | 8 | SE |
| 521 | 591458 | AM 65-205 | 21N | 11E | 9 | SW |
| 522 | 591459 | AM 65-206 | 21N | 11E | 9 | SW |
| 523 | 591460 | AM 65-207 | 21N | 11E | 9 | SE |
| 524 | 591461 | AM 65-208 | 21N | 11E | 9 | SE |
| 525 | 591462 | AM 65-209 | 21N | 11E | 10 | SW |
| 526 | 591463 | AM 65-210 | 21N | 11E | 10 | SW |
| 527 | 591464 | AM 65-211 | 21N | 11E | 10 | SE |
| 528 | 591465 | AM 65-212 | 21N | 11E | 10 | SE |
| 529 | 591466 | AM 66-202 | 21N | 11E | 8 | SW |
| 530 | 591467 | AM 66-203 | 21N | 11E | 8 | SE |
| 531 | 591468 | AM 66-204 | 21N | 11E | 8 | SE |
| 532 | 591469 | AM 66-205 | 21N | 11E | 9 | SW |
| 533 | 591470 | AM 66-206 | 21N | 11E | 9 | SW |
| 534 | 591471 | AM 66-207 | 21N | 11E | 9 | SE |
| 535 | 591472 | AM 66-208 | 21N | 11E | 9 | SE |
| 536 | 591473 | AM 66-209 | 21N | 11E | 10 | SW |
| 537 | 591474 | AM 66-210 | 21N | 11E | 10 | SW |
| 538 | 591475 | AM 66-211 | 21N | 11E | 10 | SE |
| 539 | 591476 | AM 66-212 | 21N | 11E | 10 | SE |
| 540 | 591477 | AM 67-197 | 21N | 11E | 7 | NW |
| 541 | 591478 | AM 67-198 | 21N | 11E | 7 | NW |
| 542 | 591479 | AM 67-199 | 21N | 11E | 7 | NE |
| 543 | 591480 | AM 67-200 | 21N | 11E | 7 | NE |
| 544 | 591481 | AM 67-201 | 21N | 11E | 8 | NW |
| 545 | 591482 | AM 67-202 | 21N | 11E | 8 | NW |
| 546 | 591483 | AM 67-203 | 21N | 11E | 8 | NE |
| 547 | 591484 | AM 67-204 | 21N | 11E | 8 | NE |
| 548 | 591485 | AM 67-205 | 21N | 11E | 9 | NW |
| 549 | 591486 | AM 67-206 | 21N | 11E | 9 | NW |
| 550 | 591487 | AM 67-207 | 21N | 11E | 9 | NE |
| 551 | 591488 | AM 67-208 | 21N | 11E | 9 | NE |
| 552 | 591489 | AM 67-209 | 21N | 11E | 10 | NW |
| 553 | 591490 | AM 67-210 | 21N | 11E | 10 | NW |
| 554 | 591491 | AM 67-211 | 21N | 11E | 10 | NE |
| 555 | 591492 | AM 67-212 | 21N | 11E | 10 | NE |
| 556 | 591493 | AM 68-208 | 21N | 11E | 9 | NE |
| 557 | 591494 | AM 68-209 | 21N | 11E | 10 | NW |
| | |
| Arctic Project | Page 438 |
| S-K 1300 Technical Report Summary | November 30, 2022 |
| | |
| | |
| | |
| 558 | 591495 | AM 68-210 | 21N | 11E | 10 | NW |
| 559 | 591496 | AM 68-211 | 21N | 11E | 10 | NE |
| 560 | 591497 | AM 68-212 | 21N | 11E | 10 | NE |
| 561 | 591498 | AM 69-208 | 21N | 11E | 4 | SE |
| 562 | 591499 | AM 69-209 | 21N | 11E | 3 | SW |
| 563 | 591500 | AM 69-210 | 21N | 11E | 3 | SW |
| 564 | 591501 | AM 69-211 | 21N | 11E | 3 | SE |
| 565 | 591502 | AM 69-212 | 21N | 11E | 3 | SE |
| 566 | 591503 | AM 49-221 | 21N | 12E | 31 | SW |
| 567 | 591504 | AM 49-222 | 21N | 12E | 31 | SW |
| 568 | 591505 | AM 49-223 | 21N | 12E | 31 | SE |
| 569 | 591506 | AM 49-224 | 21N | 12E | 31 | SE |
| 570 | 591507 | AM 49-225 | 21N | 12E | 32 | SW |
| 571 | 591508 | AM 49-226 | 21N | 12E | 32 | SW |
| 572 | 591509 | AM 49-227 | 21N | 12E | 32 | SE |
| 573 | 591510 | AM 49-228 | 21N | 12E | 32 | SE |
| 574 | 591511 | AM 49-229 | 21N | 12E | 33 | SW |
| 575 | 591512 | AM 49-230 | 21N | 12E | 33 | SW |
| 576 | 591513 | AM 50-221 | 21N | 12E | 31 | SW |
| 577 | 591514 | AM 50-222 | 21N | 12E | 31 | SW |
| 578 | 591515 | AM 50-223 | 21N | 12E | 31 | SE |
| 579 | 591516 | AM 50-224 | 21N | 12E | 31 | SE |
| 580 | 591517 | AM 50-225 | 21N | 12E | 32 | SW |
| 581 | 591518 | AM 50-226 | 21N | 12E | 32 | SW |
| 582 | 591519 | AM 50-227 | 21N | 12E | 32 | SE |
| 583 | 591520 | AM 50-228 | 21N | 12E | 32 | SE |
| 584 | 591521 | AM 50-229 | 21N | 12E | 33 | SW |
| 585 | 591522 | AM 50-230 | 21N | 12E | 33 | SW |
| 586 | 591523 | AM 51-221 | 21N | 12E | 31 | NW |
| 587 | 591524 | AM 51-222 | 21N | 12E | 31 | NW |
| 588 | 591525 | AM 51-223 | 21N | 12E | 31 | NE |
| 589 | 591526 | AM 51-224 | 21N | 12E | 31 | NE |
| 590 | 591527 | AM 51-225 | 21N | 12E | 32 | NW |
| 591 | 591528 | AM 51-226 | 21N | 12E | 32 | NW |
| 592 | 591529 | AM 51-227 | 21N | 12E | 32 | NE |
| 593 | 591530 | AM 51-228 | 21N | 12E | 32 | NE |
| 594 | 591531 | AM 51-229 | 21N | 12E | 33 | NW |
| 595 | 591532 | AM 51-230 | 21N | 12E | 33 | NW |
| 596 | 591533 | AM 52-221 | 21N | 12E | 31 | NW |
| 597 | 591534 | AM 52-222 | 21N | 12E | 31 | NW |
| 598 | 591535 | AM 52-223 | 21N | 12E | 31 | NE |
| 599 | 591536 | AM 52-224 | 21N | 12E | 31 | NE |
| 600 | 591537 | AM 52-225 | 21N | 12E | 32 | NW |
| 601 | 591538 | AM 52-226 | 21N | 12E | 32 | NW |
| | |
| Arctic Project | Page 439 |
| S-K 1300 Technical Report Summary | November 30, 2022 |
| | |
| | |
| | |
| 602 | 591539 | AM 52-227 | 21N | 12E | 32 | NE |
| 603 | 591540 | AM 52-228 | 21N | 12E | 32 | NE |
| 604 | 591541 | AM 52-229 | 21N | 12E | 33 | NW |
| 605 | 591542 | AM 52-230 | 21N | 12E | 33 | NW |
| 606 | 591543 | AM 53-221 | 21N | 12E | 30 | SW |
| 607 | 591544 | AM 53-222 | 21N | 12E | 30 | SW |
| 608 | 591545 | AM 53-223 | 21N | 12E | 30 | SE |
| 609 | 591546 | AM 53-224 | 21N | 12E | 30 | SE |
| 610 | 591547 | AM 54-221 | 21N | 12E | 30 | SW |
| 611 | 591548 | AM 54-222 | 21N | 12E | 30 | SW |
| 612 | 591549 | AM 54-223 | 21N | 12E | 30 | SE |
| 613 | 591550 | AM 54-224 | 21N | 12E | 30 | SE |
| 614 | 591551 | AM 55-221 | 21N | 12E | 30 | NW |
| 615 | 591552 | AM 55-222 | 21N | 12E | 30 | NW |
| 616 | 591553 | AM 55-223 | 21N | 12E | 30 | NE |
| 617 | 591554 | AM 55-224 | 21N | 12E | 30 | NE |
| 618 | 591555 | AM 56-221 | 21N | 12E | 30 | NW |
| 619 | 591556 | AM 56-222 | 21N | 12E | 30 | NW |
| 620 | 591557 | AM 56-223 | 21N | 12E | 30 | NE |
| 621 | 591558 | AM 56-224 | 21N | 12E | 30 | NE |
| 622 | 591575 | AM 37-226 | 20N | 12E | 16 | SW |
| 623 | 591576 | AM 37-227 | 20N | 12E | 16 | SE |
| 624 | 591577 | AM 37-228 | 20N | 12E | 16 | SE |
| 625 | 591578 | AM 37-229 | 20N | 12E | 15 | SW |
| 626 | 591579 | AM 37-230 | 20N | 12E | 15 | SW |
| 627 | 591590 | AM 38-226 | 20N | 12E | 16 | SW |
| 628 | 591591 | AM 38-227 | 20N | 12E | 16 | SE |
| 629 | 591592 | AM 38-228 | 20N | 12E | 16 | SE |
| 630 | 591593 | AM 38-229 | 20N | 12E | 15 | SW |
| 631 | 591594 | AM 38-230 | 20N | 12E | 15 | SW |
| 632 | 591605 | AM 39-226 | 20N | 12E | 16 | NW |
| 633 | 591606 | AM 39-227 | 20N | 12E | 16 | NE |
| 634 | 591607 | AM 39-228 | 20N | 12E | 16 | NE |
| 635 | 591608 | AM 39-229 | 20N | 12E | 15 | NW |
| 636 | 591609 | AM 39-230 | 20N | 12E | 15 | NW |
| 637 | 591620 | AM 40-226 | 20N | 12E | 16 | NW |
| 638 | 591621 | AM 40-227 | 20N | 12E | 16 | NE |
| 639 | 591622 | AM 40-228 | 20N | 12E | 16 | NE |
| 640 | 591623 | AM 40-229 | 20N | 12E | 15 | NW |
| 641 | 591624 | AM 40-230 | 20N | 12E | 15 | NW |
| 642 | 591635 | AM 41-225 | 20N | 12E | 9 | SW |
| 643 | 591636 | AM 41-226 | 20N | 12E | 9 | SW |
| 644 | 591637 | AM 41-227 | 20N | 12E | 9 | SE |
| 645 | 591638 | AM 41-228 | 20N | 12E | 9 | SE |
| | |
| Arctic Project | Page 440 |
| S-K 1300 Technical Report Summary | November 30, 2022 |
| | |
| | |
| | |
| 646 | 591639 | AM 41-229 | 20N | 12E | 10 | SW |
| 647 | 591640 | AM 41-230 | 20N | 12E | 10 | SW |
| 648 | 591648 | AM 42-223 | 20N | 12E | 8 | SE |
| 649 | 591649 | AM 42-224 | 20N | 12E | 8 | SE |
| 650 | 591650 | AM 42-225 | 20N | 12E | 9 | SW |
| 651 | 591651 | AM 42-226 | 20N | 12E | 9 | SW |
| 652 | 591652 | AM 42-227 | 20N | 12E | 9 | SE |
| 653 | 591653 | AM 42-228 | 20N | 12E | 9 | SE |
| 654 | 591654 | AM 42-229 | 20N | 12E | 10 | SW |
| 655 | 591655 | AM 42-230 | 20N | 12E | 10 | SW |
| 656 | 591661 | AM 43-221 | 20N | 12E | 8 | NW |
| 657 | 591662 | AM 43-222 | 20N | 12E | 8 | NW |
| 658 | 591663 | AM 43-223 | 20N | 12E | 8 | NE |
| 659 | 591664 | AM 43-224 | 20N | 12E | 8 | NE |
| 660 | 591665 | AM 43-225 | 20N | 12E | 9 | NW |
| 661 | 591666 | AM 43-226 | 20N | 12E | 9 | NW |
| 662 | 591667 | AM 43-227 | 20N | 12E | 9 | NE |
| 663 | 591668 | AM 43-228 | 20N | 12E | 9 | NE |
| 664 | 591669 | AM 43-229 | 20N | 12E | 10 | NW |
| 665 | 591670 | AM 43-230 | 20N | 12E | 10 | NW |
| 666 | 591676 | AM 44-219 | 20N | 12E | 7 | NE |
| 667 | 591677 | AM 44-220 | 20N | 12E | 7 | NE |
| 668 | 591678 | AM 44-221 | 20N | 12E | 8 | NW |
| 669 | 591679 | AM 44-222 | 20N | 12E | 8 | NW |
| 670 | 591680 | AM 44-223 | 20N | 12E | 8 | NE |
| 671 | 591681 | AM 44-224 | 20N | 12E | 8 | NE |
| 672 | 591682 | AM 44-225 | 20N | 12E | 9 | NW |
| 673 | 591683 | AM 44-226 | 20N | 12E | 9 | NW |
| 674 | 591684 | AM 44-227 | 20N | 12E | 9 | NE |
| 675 | 591685 | AM 44-228 | 20N | 12E | 9 | NE |
| 676 | 591686 | AM 44-229 | 20N | 12E | 10 | NW |
| 677 | 591687 | AM 44-230 | 20N | 12E | 10 | NW |
| 678 | 591693 | AM 45-217 | 20N | 12E | 6 | SW |
| 679 | 591694 | AM 45-218 | 20N | 12E | 6 | SW |
| 680 | 591695 | AM 45-219 | 20N | 12E | 6 | SE |
| 681 | 591696 | AM 45-220 | 20N | 12E | 6 | SE |
| 682 | 591697 | AM 45-221 | 20N | 12E | 5 | SW |
| 683 | 591698 | AM 45-222 | 20N | 12E | 5 | SW |
| 684 | 591699 | AM 45-223 | 20N | 12E | 5 | SE |
| 685 | 591700 | AM 45-224 | 20N | 12E | 5 | SE |
| 686 | 591701 | AM 45-225 | 20N | 12E | 4 | SW |
| 687 | 591702 | AM 45-226 | 20N | 12E | 4 | SW |
| 688 | 591703 | AM 45-227 | 20N | 12E | 4 | SE |
| 689 | 591704 | AM 45-228 | 20N | 12E | 4 | SE |
| | |
| Arctic Project | Page 441 |
| S-K 1300 Technical Report Summary | November 30, 2022 |
| | |
| | |
| | |
| 690 | 591705 | AM 45-229 | 20N | 12E | 3 | SW |
| 691 | 591706 | AM 45-230 | 20N | 12E | 3 | SW |
| 692 | 591712 | AM 46-217 | 20N | 12E | 6 | SW |
| 693 | 591713 | AM 46-218 | 20N | 12E | 6 | SW |
| 694 | 591714 | AM 46-219 | 20N | 12E | 6 | SE |
| 695 | 591715 | AM 46-220 | 20N | 12E | 6 | SE |
| 696 | 591716 | AM 46-221 | 20N | 12E | 5 | SW |
| 697 | 591717 | AM 46-222 | 20N | 12E | 5 | SW |
| 698 | 591718 | AM 46-223 | 20N | 12E | 5 | SE |
| 699 | 591719 | AM 46-224 | 20N | 12E | 5 | SE |
| 700 | 591720 | AM 46-225 | 20N | 12E | 4 | SW |
| 701 | 591721 | AM 46-226 | 20N | 12E | 4 | SW |
| 702 | 591722 | AM 46-227 | 20N | 12E | 4 | SE |
| 703 | 591723 | AM 46-228 | 20N | 12E | 4 | SE |
| 704 | 591724 | AM 46-229 | 20N | 12E | 3 | SW |
| 705 | 591725 | AM 46-230 | 20N | 12E | 3 | SW |
| 706 | 591731 | AM 47-217 | 20N | 12E | 6 | NW |
| 707 | 591732 | AM 47-218 | 20N | 12E | 6 | NW |
| 708 | 591733 | AM 47-219 | 20N | 12E | 6 | NE |
| 709 | 591734 | AM 47-220 | 20N | 12E | 6 | NE |
| 710 | 591735 | AM 47-221 | 20N | 12E | 5 | NW |
| 711 | 591736 | AM 47-222 | 20N | 12E | 5 | NW |
| 712 | 591737 | AM 47-223 | 20N | 12E | 5 | NE |
| 713 | 591738 | AM 47-224 | 20N | 12E | 5 | NE |
| 714 | 591739 | AM 47-225 | 20N | 12E | 4 | NW |
| 715 | 591740 | AM 47-226 | 20N | 12E | 4 | NW |
| 716 | 591741 | AM 47-227 | 20N | 12E | 4 | NE |
| 717 | 591742 | AM 47-228 | 20N | 12E | 4 | NE |
| 718 | 591743 | AM 47-229 | 20N | 12E | 3 | NW |
| 719 | 591744 | AM 47-230 | 20N | 12E | 3 | NW |
| 720 | 591745 | AM 48-217 | 20N | 12E | 6 | NW |
| 721 | 591746 | AM 48-218 | 20N | 12E | 6 | NW |
| 722 | 591747 | AM 48-219 | 20N | 12E | 6 | NE |
| 723 | 591748 | AM 48-220 | 20N | 12E | 6 | NE |
| 724 | 591749 | AM 48-221 | 20N | 12E | 5 | NW |
| 725 | 591750 | AM 48-222 | 20N | 12E | 5 | NW |
| 726 | 591751 | AM 48-223 | 20N | 12E | 5 | NE |
| 727 | 591752 | AM 48-224 | 20N | 12E | 5 | NE |
| 728 | 591753 | AM 48-225 | 20N | 12E | 4 | NW |
| 729 | 591754 | AM 48-226 | 20N | 12E | 4 | NW |
| 730 | 591755 | AM 48-227 | 20N | 12E | 4 | NE |
| 731 | 591756 | AM 48-228 | 20N | 12E | 4 | NE |
| 732 | 591757 | AM 48-229 | 20N | 12E | 3 | NW |
| 733 | 591758 | AM 48-230 | 20N | 12E | 3 | NW |
| | |
| Arctic Project | Page 442 |
| S-K 1300 Technical Report Summary | November 30, 2022 |
| | |
| | |
| | |
| 734 | 622359 | Eggplant 1 | 21N | 10E | 26 | NW |
| 735 | 622360 | Eggplant 2 | 21N | 10E | 26 | NW |
| 736 | 622361 | Eggplant 3 | 21N | 10E | 26 | NE |
| 737 | 622362 | Eggplant 4 | 21N | 10E | 26 | NE |
| 738 | 622363 | Eggplant 5 | 21N | 10E | 25 | NW |
| 739 | 622364 | Eggplant 6 | 21N | 10E | 25 | NW |
| 740 | 622365 | Eggplant 7 | 21N | 10E | 26 | SW |
| 741 | 622366 | Eggplant 8 | 21N | 10E | 26 | SE |
| 742 | 622367 | Eggplant 9 | 21N | 10E | 25 | SW |
| 743 | 622368 | Eggplant 10 | 21N | 10E | 34 | NW |
| 744 | 622369 | Eggplant 11 | 21N | 10E | 34 | NE |
| 745 | 622370 | Eggplant 12 | 21N | 10E | 35 | NW |
| 746 | 622371 | Eggplant 13 | 21N | 10E | 35 | NE |
| 747 | 622372 | Eggplant 14 | 21N | 10E | 36 | NW |
| 748 | 622373 | Eggplant 15 | 21N | 10E | 36 | NE |
| 749 | 622374 | Eggplant 16 | 21N | 11E | 31 | NW |
| 750 | 622375 | Eggplant 17 | 21N | 11E | 31 | NE |
| 751 | 622376 | Eggplant 18 | 21N | 11E | 32 | NW |
| 752 | 622377 | Eggplant 19 | 21N | 10E | 34 | SW |
| 753 | 622378 | Eggplant 20 | 21N | 10E | 34 | SE |
| 754 | 622379 | Eggplant 21 | 21N | 10E | 35 | SW |
| 755 | 622380 | Eggplant 22 | 21N | 10E | 35 | SE |
| 756 | 622381 | Eggplant 23 | 21N | 10E | 36 | SW |
| 757 | 622382 | Eggplant 24 | 21N | 10E | 36 | SE |
| 758 | 622383 | Eggplant 25 | 21N | 11E | 31 | SW |
| 759 | 622384 | Eggplant 26 | 21N | 11E | 31 | SE |
| 760 | 622385 | Eggplant 27 | 21N | 11E | 32 | SW |
| 761 | 622386 | Eggplant 28 | 21N | 11E | 32 | SE |
| 762 | 622387 | Eggplant 29 | 21N | 11E | 33 | SW |
| 763 | 622388 | Eggplant 30 | 21N | 11E | 33 | SW |
| 764 | 626222 | LUK 1 | 22N | 10E | 8 | NW |
| 765 | 626223 | LUK 2 | 22N | 10E | 8 | NE |
| 766 | 626224 | LUK 3 | 22N | 10E | 9 | NW |
| 767 | 626225 | LUK 4 | 22N | 10E | 9 | NE |
| 768 | 626226 | LUK 5 | 22N | 10E | 10 | NW |
| 769 | 626227 | LUK 6 | 22N | 10E | 10 | NE |
| 770 | 626228 | LUK 7 | 22N | 10E | 11 | NW |
| 771 | 626229 | LUK 8 | 22N | 10E | 11 | NE |
| 772 | 626230 | LUK 9 | 22N | 10E | 8 | SE |
| 773 | 626231 | LUK 10 | 22N | 10E | 9 | SW |
| 774 | 626232 | LUK 11 | 22N | 10E | 9 | SE |
| 775 | 626233 | LUK 12 | 22N | 10E | 10 | SW |
| 776 | 626234 | LUK 13 | 22N | 10E | 10 | SE |
| 777 | 626235 | LUK 14 | 22N | 10E | 11 | SW |
| | |
| Arctic Project | Page 443 |
| S-K 1300 Technical Report Summary | November 30, 2022 |
| | |
| | |
| | |
| 778 | 626236 | LUK 15 | 22N | 10E | 11 | SE |
| 779 | 626237 | LUK 16 | 22N | 10E | 15 | NE |
| 780 | 626238 | LUK 17 | 22N | 10E | 14 | NW |
| 781 | 626239 | LUK 18 | 22N | 10E | 14 | NE |
| 782 | 626240 | LUK 19 | 22N | 10E | 13 | NW |
| 783 | 626241 | LUK 20 | 22N | 10E | 13 | NE |
| 784 | 626242 | LUK 21 | 22N | 10E | 14 | SW |
| 785 | 626243 | LUK 22 | 22N | 10E | 14 | SE |
| 786 | 626244 | LUK 23 | 22N | 10E | 13 | SW |
| 787 | 626245 | LUK 24 | 22N | 10E | 13 | SE |
| 788 | 626246 | LUK 25 | 22N | 10E | 23 | NE |
| 789 | 626247 | LUK 26 | 22N | 10E | 24 | NW |
| 790 | 626248 | LUK 27 | 22N | 10E | 24 | NE |
| 791 | 626249 | LUK 28 | 22N | 11E | 19 | NW |
| 792 | 626250 | LUK 29 | 22N | 11E | 19 | NE |
| 793 | 626251 | LUK 30 | 22N | 10E | 23 | SE |
| 794 | 626252 | LUK 31 | 22N | 10E | 24 | SW |
| 795 | 626253 | LUK 32 | 22N | 10E | 24 | SE |
| 796 | 626254 | LUK 33 | 22N | 11E | 19 | SW |
| 797 | 626255 | LUK 34 | 22N | 11E | 19 | SE |
| 798 | 626256 | LUK 35 | 22N | 10E | 27 | NE |
| 799 | 626257 | LUK 36 | 22N | 10E | 26 | NW |
| 800 | 626258 | LUK 37 | 22N | 10E | 26 | NE |
| 801 | 626259 | LUK 38 | 22N | 10E | 25 | NW |
| 802 | 626260 | LUK 39 | 22N | 10E | 25 | NE |
| 803 | 626261 | LUK 40 | 22N | 11E | 30 | NW |
| 804 | 626262 | LUK 41 | 22N | 11E | 30 | NE |
| 805 | 626263 | LUK 42 | 22N | 11E | 29 | NW |
| 806 | 626264 | LUK 43 | 22N | 11E | 29 | NE |
| 807 | 626265 | LUK 44 | 22N | 11E | 28 | NW |
| 808 | 626266 | LUK 45 | 22N | 11E | 28 | NE |
| 809 | 626267 | LUK 46 | 22N | 10E | 27 | SE |
| 810 | 626268 | LUK 47 | 22N | 10E | 26 | SW |
| 811 | 626269 | LUK 48 | 22N | 10E | 26 | SE |
| 812 | 626270 | LUK 49 | 22N | 10E | 25 | SW |
| 813 | 626271 | LUK 50 | 22N | 10E | 25 | SE |
| 814 | 626272 | LUK 51 | 22N | 11E | 30 | SW |
| 815 | 626273 | LUK 52 | 22N | 11E | 30 | SE |
| 816 | 626274 | LUK 53 | 22N | 11E | 29 | SW |
| 817 | 626275 | LUK 54 | 22N | 11E | 29 | SE |
| 818 | 626276 | LUK 55 | 22N | 11E | 28 | SW |
| 819 | 626277 | LUK 56 | 22N | 11E | 28 | SE |
| 820 | 626278 | LUK 57 | 22N | 10E | 34 | NE |
| 821 | 626279 | LUK 58 | 22N | 10E | 35 | NW |
| | |
| Arctic Project | Page 444 |
| S-K 1300 Technical Report Summary | November 30, 2022 |
| | |
| | |
| | |
| 822 | 626280 | LUK 59 | 22N | 10E | 35 | NE |
| 823 | 626281 | LUK 60 | 22N | 10E | 36 | NW |
| 824 | 626282 | LUK 61 | 22N | 10E | 36 | NE |
| 825 | 626283 | LUK 62 | 22N | 11E | 31 | NW |
| 826 | 626284 | LUK 63 | 22N | 11E | 31 | NE |
| 827 | 626285 | LUK 64 | 22N | 11E | 32 | NW |
| 828 | 626286 | LUK 65 | 22N | 11E | 32 | NE |
| 829 | 626287 | LUK 66 | 22N | 11E | 33 | NW |
| 830 | 626288 | LUK 67 | 22N | 11E | 33 | NE |
| 831 | 626289 | LUK 68 | 22N | 11E | 34 | NW |
| 832 | 626290 | LUK 69 | 22N | 11E | 34 | NE |
| 833 | 626291 | LUK 70 | 22N | 11E | 35 | NW |
| 834 | 626292 | LUK 71 | 22N | 11E | 35 | NE |
| 835 | 626293 | LUK 72 | 22N | 11E | 36 | NW |
| 836 | 626294 | LUK 73 | 22N | 11E | 36 | NE |
| 837 | 626295 | LUK 74 | 22N | 10E | 34 | SE |
| 838 | 626296 | LUK 75 | 22N | 10E | 35 | SW |
| 839 | 626297 | LUK 76 | 22N | 10E | 35 | SE |
| 840 | 626298 | LUK 77 | 22N | 10E | 36 | SW |
| 841 | 626299 | LUK 78 | 22N | 10E | 36 | SE |
| 842 | 626300 | LUK 79 | 22N | 11E | 31 | SW |
| 843 | 626301 | LUK 80 | 22N | 11E | 31 | SE |
| 844 | 626302 | LUK 81 | 22N | 11E | 32 | SW |
| 845 | 626303 | LUK 82 | 22N | 11E | 32 | SE |
| 846 | 626304 | LUK 83 | 22N | 11E | 33 | SW |
| 847 | 626305 | LUK 84 | 22N | 11E | 33 | SE |
| 848 | 626306 | LUK 85 | 22N | 11E | 34 | SW |
| 849 | 626307 | LUK 86 | 22N | 11E | 34 | SE |
| 850 | 626308 | LUK 87 | 22N | 11E | 35 | SW |
| 851 | 626309 | LUK 88 | 22N | 11E | 35 | SE |
| 852 | 626310 | LUK 89 | 22N | 11E | 36 | SW |
| 853 | 626311 | LUK 90 | 22N | 11E | 36 | SE |
| 854 | 626312 | LUK 91 | 21N | 10E | 3 | NE |
| 855 | 626313 | LUK 92 | 21N | 10E | 2 | NW |
| 856 | 626314 | LUK 93 | 21N | 10E | 2 | NE |
| 857 | 626315 | LUK 94 | 21N | 10E | 1 | NW |
| 858 | 626316 | LUK 95 | 21N | 10E | 1 | NE |
| 859 | 626317 | LUK 96 | 21N | 11E | 6 | NW |
| 860 | 626318 | LUK 97 | 21N | 11E | 6 | NE |
| 861 | 626319 | LUK 98 | 21N | 11E | 5 | NW |
| 862 | 626320 | LUK 99 | 21N | 11E | 5 | NE |
| 863 | 626321 | LUK 100 | 21N | 11E | 4 | NW |
| 864 | 626322 | LUK 101 | 21N | 11E | 4 | NE |
| 865 | 626323 | LUK 102 | 21N | 11E | 3 | NW |
| | |
| Arctic Project | Page 445 |
| S-K 1300 Technical Report Summary | November 30, 2022 |
| | |
| | |
| | |
| 866 | 626324 | LUK 103 | 21N | 11E | 3 | NE |
| 867 | 626325 | LUK 104 | 21N | 11E | 2 | NW |
| 868 | 626326 | LUK 105 | 21N | 11E | 2 | NE |
| 869 | 626327 | LUK 106 | 21N | 11E | 1 | NW |
| 870 | 626328 | LUK 107 | 21N | 11E | 1 | NE |
| 871 | 626329 | LUK 108 | 21N | 12E | 6 | NW |
| 872 | 626330 | LUK 109 | 21N | 12E | 6 | NE |
| 873 | 626331 | LUK 110 | 21N | 10E | 1 | SW |
| 874 | 626332 | LUK 111 | 21N | 10E | 1 | SE |
| 875 | 626333 | LUK 112 | 21N | 11E | 6 | SW |
| 876 | 626334 | LUK 113 | 21N | 11E | 6 | SE |
| 877 | 626335 | LUK 114 | 21N | 11E | 5 | SW |
| 878 | 626336 | LUK 115 | 21N | 11E | 5 | SE |
| 879 | 626337 | LUK 116 | 21N | 11E | 4 | SW |
| 880 | 626338 | LUK 117 | 21N | 11E | 4 | NW of SE |
| 881 | 626339 | LUK 118 | 21N | 11E | 4 | SW of SE |
| 882 | 626340 | LUK 119 | 21N | 11E | 4 | NE of SE |
| 883 | 626341 | LUK 120 | 21N | 11E | 3 | NW of SW |
| 884 | 626342 | LUK 121 | 21N | 11E | 3 | NE of SW |
| 885 | 626343 | LUK 122 | 21N | 11E | 3 | NW of SE |
| 886 | 626344 | LUK 123 | 21N | 11E | 3 | NE of SE |
| 887 | 626345 | LUK 124 | 21N | 11E | 2 | SW |
| 888 | 626346 | LUK 125 | 21N | 11E | 2 | SE |
| 889 | 626347 | LUK 126 | 21N | 11E | 1 | SW |
| 890 | 626348 | LUK 127 | 21N | 11E | 1 | SE |
| 891 | 626349 | LUK 128 | 21N | 12E | 6 | SW |
| 892 | 626350 | LUK 129 | 21N | 12E | 6 | SE |
| 893 | 626351 | LUK 130 | 21N | 10E | 12 | NW of NW |
| 894 | 626352 | LUK 131 | 21N | 10E | 12 | NE of NW |
| 895 | 626353 | LUK 132 | 21N | 10E | 12 | NW of NE |
| 896 | 626354 | LUK 133 | 21N | 10E | 12 | NE of NE |
| 897 | 626355 | LUK 134 | 21N | 11E | 7 | NW of NW |
| 898 | 626356 | LUK 135 | 21N | 11E | 7 | NE of NW |
| 899 | 626357 | LUK 136 | 21N | 11E | 7 | NW of NE |
| 900 | 626358 | LUK 137 | 21N | 11E | 7 | NE of NE |
| 901 | 626359 | LUK 138 | 21N | 11E | 8 | NW of NW |
| 902 | 626360 | LUK 139 | 21N | 11E | 8 | NE of NW |
| 903 | 626361 | LUK 140 | 21N | 11E | 8 | NW of NE |
| 904 | 626362 | LUK 141 | 21N | 11E | 8 | NE of NE |
| 905 | 626363 | LUK 142 | 21N | 11E | 9 | NW of NW |
| 906 | 626364 | LUK 143 | 21N | 11E | 9 | NE of NW |
| 907 | 626365 | LUK 144 | 21N | 11E | 9 | NW of NE |
| 908 | 626366 | LUK 145 | 21N | 11E | 11 | NW |
| 909 | 626367 | LUK 146 | 21N | 11E | 11 | NE |
| | |
| Arctic Project | Page 446 |
| S-K 1300 Technical Report Summary | November 30, 2022 |
| | |
| | |
| | |
| 910 | 626368 | LUK 147 | 21N | 11E | 12 | NW |
| 911 | 626369 | LUK 148 | 21N | 11E | 12 | NE |
| 912 | 626370 | LUK 149 | 21N | 12E | 7 | NW |
| 913 | 626371 | LUK 150 | 21N | 12E | 7 | NE |
| 914 | 626372 | LUK 151 | 21N | 11E | 12 | SW |
| 915 | 626373 | LUK 152 | 21N | 11E | 12 | SE |
| 916 | 626374 | LUK 153 | 21N | 12E | 7 | SW |
| 917 | 626375 | LUK 154 | 21N | 12E | 7 | SE |
| 918 | 626376 | LUK 155 | 21N | 12E | 18 | NW |
| 919 | 626377 | LUK 156 | 21N | 12E | 18 | NE |
| 920 | 626378 | LUK 157 | 21N | 12E | 17 | NW |
| 921 | 626379 | LUK 158 | 21N | 12E | 17 | NE |
| 922 | 626380 | LUK 159 | 21N | 12E | 16 | NW |
| 923 | 626381 | LUK 160 | 21N | 12E | 16 | NE |
| 924 | 626382 | LUK 161 | 21N | 12E | 15 | NW |
| 925 | 626383 | LUK 162 | 21N | 12E | 15 | NE |
| 926 | 626384 | LUK 163 | 21N | 12E | 14 | NW |
| 927 | 626385 | LUK 164 | 21N | 12E | 14 | NE |
| 928 | 626386 | LUK 165 | 21N | 12E | 18 | SW |
| 929 | 626387 | LUK 166 | 21N | 12E | 18 | SE |
| 930 | 626388 | LUK 167 | 21N | 12E | 17 | SW |
| 931 | 626389 | LUK 168 | 21N | 12E | 17 | SE |
| 932 | 626390 | LUK 169 | 21N | 12E | 16 | SW |
| 933 | 626391 | LUK 170 | 21N | 12E | 16 | SE |
| 934 | 626392 | LUK 171 | 21N | 12E | 15 | SW |
| 935 | 626393 | LUK 172 | 21N | 12E | 15 | SE |
| 936 | 626394 | LUK 173 | 21N | 12E | 14 | SW |
| 937 | 626395 | LUK 174 | 21N | 12E | 14 | SE |
| 938 | 626396 | LUK 175 | 21N | 12E | 20 | NW |
| 939 | 626397 | LUK 176 | 21N | 12E | 20 | NE |
| 940 | 626398 | LUK 177 | 21N | 12E | 21 | NW |
| 941 | 626399 | LUK 178 | 21N | 12E | 21 | NE |
| 942 | 626400 | LUK 179 | 21N | 12E | 22 | NW |
| 943 | 626401 | LUK 180 | 21N | 12E | 22 | NE |
| 944 | 626402 | LUK 181 | 21N | 12E | 23 | NW |
| 945 | 626403 | LUK 182 | 21N | 12E | 23 | NE |
| 946 | 626404 | LUK 183 | 21N | 12E | 24 | NW |
| 947 | 626405 | LUK 184 | 21N | 12E | 24 | NE |
| 948 | 626406 | LUK 185 | 21N | 13E | 19 | NW |
| 949 | 626407 | LUK 186 | 21N | 13E | 19 | NE |
| 950 | 626408 | LUK 187 | 21N | 12E | 20 | SW |
| 951 | 626409 | LUK 188 | 21N | 12E | 20 | SE |
| 952 | 626410 | LUK 189 | 21N | 12E | 21 | SW |
| 953 | 626411 | LUK 190 | 21N | 12E | 21 | SE |
| | |
| Arctic Project | Page 447 |
| S-K 1300 Technical Report Summary | November 30, 2022 |
| | |
| | |
| | |
| 954 | 626412 | LUK 191 | 21N | 12E | 22 | SW |
| 955 | 626413 | LUK 192 | 21N | 12E | 22 | SE |
| 956 | 626414 | LUK 193 | 21N | 12E | 23 | SW |
| 957 | 626415 | LUK 194 | 21N | 12E | 23 | SE |
| 958 | 626416 | LUK 195 | 21N | 12E | 24 | SW |
| 959 | 626417 | LUK 196 | 21N | 12E | 24 | SE |
| 960 | 626418 | LUK 197 | 21N | 13E | 19 | SW |
| 961 | 626419 | LUK 198 | 21N | 13E | 19 | SE |
| 962 | 626420 | LUK 199 | 21N | 12E | 29 | NW |
| 963 | 626421 | LUK 200 | 21N | 12E | 29 | NE |
| 964 | 626422 | LUK 201 | 21N | 12E | 28 | NW |
| 965 | 626423 | LUK 202 | 21N | 12E | 28 | NE |
| 966 | 626424 | LUK 203 | 21N | 12E | 27 | NW |
| 967 | 626425 | LUK 204 | 21N | 12E | 27 | NE |
| 968 | 626426 | LUK 205 | 21N | 12E | 26 | NW |
| 969 | 626427 | LUK 206 | 21N | 12E | 26 | NE |
| 970 | 626428 | LUK 207 | 21N | 12E | 25 | NW |
| 971 | 626429 | LUK 208 | 21N | 12E | 25 | NE |
| 972 | 626430 | LUK 209 | 21N | 13E | 30 | NW |
| 973 | 626431 | LUK 210 | 21N | 13E | 30 | NE |
| 974 | 626432 | LUK 211 | 21N | 13E | 29 | NW |
| 975 | 626433 | LUK 212 | 21N | 13E | 29 | NE |
| 976 | 626434 | LUK 213 | 21N | 13E | 28 | NW |
| 977 | 626435 | LUK 214 | 21N | 13E | 28 | NE |
| 978 | 626436 | LUK 215 | 21N | 12E | 29 | SW |
| 979 | 626437 | LUK 216 | 21N | 12E | 29 | SE |
| 980 | 626438 | LUK 217 | 21N | 12E | 28 | SW |
| 981 | 626439 | LUK 218 | 21N | 12E | 28 | SE |
| 982 | 626440 | LUK 219 | 21N | 12E | 27 | SW |
| 983 | 626441 | LUK 220 | 21N | 12E | 27 | SE |
| 984 | 626442 | LUK 221 | 21N | 12E | 26 | SW |
| 985 | 626443 | LUK 222 | 21N | 12E | 26 | SE |
| 986 | 626444 | LUK 223 | 21N | 12E | 25 | SW |
| 987 | 626445 | LUK 224 | 21N | 12E | 25 | SE |
| 988 | 626446 | LUK 225 | 21N | 13E | 30 | SW |
| 989 | 626447 | LUK 226 | 21N | 13E | 30 | SE |
| 990 | 626448 | LUK 227 | 21N | 13E | 29 | SW |
| 991 | 626449 | LUK 228 | 21N | 13E | 29 | SE |
| 992 | 626450 | LUK 229 | 21N | 13E | 28 | SW |
| 993 | 626451 | LUK 230 | 21N | 13E | 28 | SE |
| 994 | 626452 | LUK 231 | 21N | 12E | 33 | NE |
| 995 | 626453 | LUK 232 | 21N | 12E | 34 | NW |
| 996 | 626454 | LUK 233 | 21N | 12E | 34 | NE |
| 997 | 626455 | LUK 234 | 21N | 12E | 35 | NW |
| | |
| Arctic Project | Page 448 |
| S-K 1300 Technical Report Summary | November 30, 2022 |
| | |
| | |
| | |
| 998 | 626456 | LUK 235 | 21N | 12E | 35 | NE |
| 999 | 626457 | LUK 236 | 21N | 12E | 36 | NW |
| 1000 | 626458 | LUK 237 | 21N | 12E | 36 | NE |
| 1001 | 626459 | LUK 238 | 21N | 13E | 31 | NW |
| 1002 | 626460 | LUK 239 | 21N | 13E | 31 | NE |
| 1003 | 626461 | LUK 240 | 21N | 13E | 32 | NW |
| 1004 | 626462 | LUK 241 | 21N | 13E | 32 | NE |
| 1005 | 626463 | LUK 242 | 21N | 13E | 33 | NW |
| 1006 | 626464 | LUK 243 | 21N | 13E | 33 | NE |
| 1007 | 626465 | LUK 244 | 21N | 13E | 34 | NW |
| 1008 | 626466 | LUK 245 | 21N | 13E | 34 | NE |
| 1009 | 626467 | LUK 246 | 21N | 13E | 35 | NW |
| 1010 | 626468 | LUK 247 | 21N | 13E | 35 | NE |
| 1011 | 626469 | LUK 248 | 21N | 12E | 33 | SE |
| 1012 | 626470 | LUK 249 | 21N | 12E | 34 | SW |
| 1013 | 626471 | LUK 250 | 21N | 12E | 34 | SE |
| 1014 | 626472 | LUK 251 | 21N | 12E | 35 | SW |
| 1015 | 626473 | LUK 252 | 21N | 12E | 35 | SE |
| 1016 | 626474 | LUK 253 | 21N | 12E | 36 | SW |
| 1017 | 626475 | LUK 254 | 21N | 12E | 36 | SE |
| 1018 | 626476 | LUK 255 | 21N | 13E | 31 | SW |
| 1019 | 626477 | LUK 256 | 21N | 13E | 31 | SE |
| 1020 | 626478 | LUK 257 | 21N | 13E | 32 | SW |
| 1021 | 626479 | LUK 258 | 21N | 13E | 32 | SE |
| 1022 | 626480 | LUK 259 | 21N | 13E | 33 | SW |
| 1023 | 626481 | LUK 260 | 21N | 13E | 33 | SE |
| 1024 | 626482 | LUK 261 | 21N | 13E | 34 | SW |
| 1025 | 626483 | LUK 262 | 21N | 13E | 34 | SE |
| 1026 | 626484 | LUK 263 | 21N | 13E | 35 | SW |
| 1027 | 626485 | LUK 264 | 21N | 13E | 35 | SE |
| 1028 | 626486 | LUK 265 | 20N | 12E | 3 | NE |
| 1029 | 626487 | LUK 266 | 20N | 12E | 2 | NW |
| 1030 | 626488 | LUK 267 | 20N | 12E | 2 | NE |
| 1031 | 626489 | LUK 268 | 20N | 12E | 1 | NW |
| 1032 | 626490 | LUK 269 | 20N | 12E | 1 | NE |
| 1033 | 626491 | LUK 270 | 20N | 13E | 6 | NW |
| 1034 | 626492 | LUK 271 | 20N | 13E | 6 | NE |
| 1035 | 626493 | LUK 272 | 20N | 13E | 5 | NW |
| 1036 | 626494 | LUK 273 | 20N | 13E | 5 | NE |
| 1037 | 626495 | LUK 274 | 20N | 13E | 4 | NW |
| 1038 | 626496 | LUK 275 | 20N | 13E | 4 | NE |
| 1039 | 626497 | LUK 276 | 20N | 13E | 3 | NW |
| 1040 | 626498 | LUK 277 | 20N | 13E | 3 | NE |
| 1041 | 626499 | LUK 278 | 20N | 13E | 2 | NW |
| | |
| Arctic Project | Page 449 |
| S-K 1300 Technical Report Summary | November 30, 2022 |
| | |
| | |
| | |
| 1042 | 626500 | LUK 279 | 20N | 13E | 2 | NE |
| 1043 | 626501 | LUK 280 | 20N | 13E | 1 | NW |
| 1044 | 626502 | LUK 281 | 20N | 13E | 1 | NE |
| 1045 | 626503 | LUK 282 | 20N | 14E | 6 | NW |
| 1046 | 626504 | LUK 283 | 20N | 14E | 6 | NE |
| 1047 | 626505 | LUK 284 | 20N | 14E | 5 | NW |
| 1048 | 626506 | LUK 285 | 20N | 14E | 5 | NE |
| 1049 | 626507 | LUK 286 | 20N | 12E | 3 | SE |
| 1050 | 626508 | LUK 287 | 20N | 12E | 2 | SW |
| 1051 | 626509 | LUK 288 | 20N | 12E | 2 | SE |
| 1052 | 626510 | LUK 289 | 20N | 12E | 1 | SW |
| 1053 | 626511 | LUK 290 | 20N | 12E | 1 | SE |
| 1054 | 626512 | LUK 291 | 20N | 13E | 6 | SW |
| 1055 | 626513 | LUK 292 | 20N | 13E | 6 | SE |
| 1056 | 626514 | LUK 293 | 20N | 13E | 5 | SW |
| 1057 | 626515 | LUK 294 | 20N | 13E | 5 | SE |
| 1058 | 626516 | LUK 295 | 20N | 13E | 4 | SW |
| 1059 | 626517 | LUK 296 | 20N | 13E | 4 | SE |
| 1060 | 626518 | LUK 297 | 20N | 13E | 3 | SW |
| 1061 | 626519 | LUK 298 | 20N | 13E | 3 | SE |
| 1062 | 626520 | LUK 299 | 20N | 13E | 2 | SW |
| 1063 | 626521 | LUK 300 | 20N | 13E | 2 | SE |
| 1064 | 626522 | LUK 301 | 20N | 13E | 1 | SW |
| 1065 | 626523 | LUK 302 | 20N | 13E | 1 | SE |
| 1066 | 626524 | LUK 303 | 20N | 14E | 6 | SW |
| 1067 | 626525 | LUK 304 | 20N | 14E | 6 | SE |
| 1068 | 626526 | LUK 305 | 20N | 14E | 5 | SW |
| 1069 | 626527 | LUK 306 | 20N | 14E | 5 | SE |
| 1070 | 626528 | LUK 307 | 20N | 13E | 7 | NE |
| 1071 | 626529 | LUK 308 | 20N | 13E | 8 | NW |
| 1072 | 626530 | LUK 309 | 20N | 13E | 8 | NE |
| 1073 | 626531 | LUK 310 | 20N | 13E | 9 | NW |
| 1074 | 626532 | LUK 311 | 20N | 13E | 9 | NE |
| 1075 | 626533 | LUK 312 | 20N | 13E | 10 | NW |
| 1076 | 626534 | LUK 313 | 20N | 13E | 10 | NE |
| 1077 | 626535 | LUK 314 | 20N | 13E | 11 | NW |
| 1078 | 626536 | LUK 315 | 20N | 13E | 11 | NE |
| 1079 | 626537 | LUK 316 | 20N | 13E | 12 | NW |
| 1080 | 626538 | LUK 317 | 20N | 13E | 12 | NE |
| 1081 | 626539 | LUK 318 | 20N | 14E | 7 | NW |
| 1082 | 626540 | LUK 319 | 20N | 14E | 7 | NE |
| 1083 | 626541 | LUK 320 | 20N | 14E | 8 | NW |
| 1084 | 626542 | LUK 321 | 20N | 14E | 8 | NE |
| 1085 | 626543 | LUK 322 | 20N | 14E | 9 | NW |
| | |
| Arctic Project | Page 450 |
| S-K 1300 Technical Report Summary | November 30, 2022 |
| | |
| | |
| | |
| 1086 | 626544 | LUK 323 | 20N | 14E | 9 | NE |
| 1087 | 626545 | LUK 324 | 20N | 14E | 10 | NW |
| 1088 | 626546 | LUK 325 | 20N | 14E | 10 | NE |
| 1089 | 626547 | LUK 326 | 20N | 14E | 11 | NW |
| 1090 | 626548 | LUK 327 | 20N | 14E | 11 | NE |
| 1091 | 626549 | LUK 328 | 20N | 14E | 12 | NW |
| 1092 | 626550 | LUK 329 | 20N | 14E | 12 | NE |
| 1093 | 626551 | LUK 330 | 20N | 15E | 7 | NW |
| 1094 | 626552 | LUK 331 | 20N | 13E | 9 | SW |
| 1095 | 626553 | LUK 332 | 20N | 13E | 9 | SE |
| 1096 | 626554 | LUK 333 | 20N | 13E | 10 | SW |
| 1097 | 626555 | LUK 334 | 20N | 13E | 10 | SE |
| 1098 | 626556 | LUK 335 | 20N | 13E | 11 | SW |
| 1099 | 626557 | LUK 336 | 20N | 13E | 11 | SE |
| 1100 | 626558 | LUK 337 | 20N | 13E | 12 | SW |
| 1101 | 626559 | LUK 338 | 20N | 13E | 12 | SE |
| 1102 | 626560 | LUK 339 | 20N | 14E | 7 | SW |
| 1103 | 626561 | LUK 340 | 20N | 14E | 7 | SE |
| 1104 | 626562 | LUK 341 | 20N | 14E | 8 | SW |
| 1105 | 626563 | LUK 342 | 20N | 14E | 8 | SE |
| 1106 | 626564 | LUK 343 | 20N | 14E | 9 | SW |
| 1107 | 626565 | LUK 344 | 20N | 14E | 9 | SE |
| 1108 | 626566 | LUK 345 | 20N | 14E | 10 | SW |
| 1109 | 626567 | LUK 346 | 20N | 14E | 10 | SE |
| 1110 | 626568 | LUK 347 | 20N | 14E | 11 | SW |
| 1111 | 626569 | LUK 348 | 20N | 14E | 11 | SE |
| 1112 | 626570 | LUK 349 | 20N | 14E | 12 | SW |
| 1113 | 626571 | LUK 350 | 20N | 14E | 12 | SE |
| 1114 | 626572 | LUK 351 | 20N | 15E | 7 | SW |
| 1115 | 626573 | LUK 352 | 20N | 13E | 14 | NW |
| 1116 | 626574 | LUK 353 | 20N | 13E | 14 | NE |
| 1117 | 626575 | LUK 354 | 20N | 13E | 13 | NW |
| 1118 | 626576 | LUK 355 | 20N | 13E | 13 | NE |
| 1119 | 626577 | LUK 356 | 20N | 14E | 18 | NW |
| 1120 | 626578 | LUK 357 | 20N | 14E | 18 | NE |
| 1121 | 626579 | LUK 358 | 20N | 14E | 17 | NW |
| 1122 | 626580 | LUK 359 | 20N | 14E | 17 | NE |
| 1123 | 626581 | LUK 360 | 20N | 14E | 16 | NW |
| 1124 | 626582 | LUK 361 | 20N | 14E | 16 | NE |
| 1125 | 626583 | LUK 362 | 20N | 14E | 15 | NW |
| 1126 | 626584 | LUK 363 | 20N | 14E | 15 | NE |
| 1127 | 626585 | LUK 364 | 20N | 14E | 14 | NW |
| 1128 | 626586 | LUK 365 | 20N | 14E | 14 | NE |
| 1129 | 626587 | LUK 366 | 20N | 14E | 13 | NW |
| | |
| Arctic Project | Page 451 |
| S-K 1300 Technical Report Summary | November 30, 2022 |
| | |
| | |
| | |
| 1130 | 626588 | LUK 367 | 20N | 14E | 13 | NE |
| 1131 | 626589 | LUK 368 | 20N | 15E | 18 | NW |
| 1132 | 626590 | LUK 369 | 20N | 13E | 14 | SW |
| 1133 | 626591 | LUK 370 | 20N | 13E | 14 | SE |
| 1134 | 626592 | LUK 371 | 20N | 13E | 13 | SW |
| 1135 | 626593 | LUK 372 | 20N | 13E | 13 | SE |
| 1136 | 626594 | LUK 373 | 20N | 14E | 18 | SW |
| 1137 | 626595 | LUK 374 | 20N | 14E | 18 | SE |
| 1138 | 626596 | LUK 375 | 20N | 14E | 17 | SW |
| 1139 | 626597 | LUK 376 | 20N | 14E | 17 | SE |
| 1140 | 626598 | LUK 377 | 20N | 14E | 16 | SW |
| 1141 | 626599 | LUK 378 | 20N | 14E | 16 | SE |
| 1142 | 626600 | LUK 379 | 20N | 14E | 15 | SW |
| 1143 | 626601 | LUK 380 | 20N | 14E | 15 | SE |
| 1144 | 626602 | LUK 381 | 20N | 14E | 14 | SW |
| 1145 | 626603 | LUK 382 | 20N | 14E | 14 | SE |
| 1146 | 626604 | LUK 383 | 20N | 14E | 13 | SW |
| 1147 | 626605 | LUK 384 | 20N | 14E | 13 | SE |
| 1148 | 626606 | LUK 385 | 20N | 15E | 18 | SW |
| 1149 | 626607 | NORA 1 | 20N | 12E | 19 | NW |
| 1150 | 626608 | NORA 2 | 20N | 12E | 19 | NE |
| 1151 | 626609 | NORA 3 | 20N | 12E | 20 | NW |
| 1152 | 626610 | NORA 4 | 20N | 12E | 20 | NE |
| 1153 | 626611 | NORA 5 | 20N | 12E | 21 | NW |
| 1154 | 626612 | NORA 6 | 20N | 12E | 21 | NE |
| 1155 | 626613 | NORA 7 | 20N | 12E | 22 | NW |
| 1156 | 626614 | NORA 8 | 20N | 12E | 22 | NE |
| 1157 | 626615 | NORA 9 | 20N | 12E | 23 | NW |
| 1158 | 626616 | NORA 10 | 20N | 12E | 23 | NE |
| 1159 | 626617 | NORA 11 | 20N | 12E | 24 | NW |
| 1160 | 626618 | NORA 12 | 20N | 12E | 19 | SW |
| 1161 | 626619 | NORA 13 | 20N | 12E | 19 | SE |
| 1162 | 626620 | NORA 14 | 20N | 12E | 20 | SW |
| 1163 | 626621 | NORA 15 | 20N | 12E | 20 | SE |
| 1164 | 626622 | NORA 16 | 20N | 12E | 21 | SW |
| 1165 | 626623 | NORA 17 | 20N | 12E | 21 | SE |
| 1166 | 626624 | NORA 18 | 20N | 12E | 22 | SW |
| 1167 | 626625 | NORA 19 | 20N | 12E | 22 | SE |
| 1168 | 626626 | NORA 20 | 20N | 12E | 23 | SW |
| 1169 | 626627 | NORA 21 | 20N | 12E | 23 | SE |
| 1170 | 626628 | NORA 22 | 20N | 12E | 24 | SW |
| 1171 | 626629 | NORA 23 | 20N | 12E | 24 | SE |
| 1172 | 626630 | NORA 24 | 20N | 13E | 19 | SW |
| 1173 | 626631 | NORA 25 | 20N | 12E | 28 | NW |
| | |
| Arctic Project | Page 452 |
| S-K 1300 Technical Report Summary | November 30, 2022 |
| | |
| | |
| | |
| 1174 | 626632 | NORA 26 | 20N | 12E | 28 | NE |
| 1175 | 626633 | NORA 27 | 20N | 12E | 27 | NW |
| 1176 | 626634 | NORA 28 | 20N | 12E | 27 | NE |
| 1177 | 626635 | NORA 29 | 20N | 12E | 26 | NW |
| 1178 | 626636 | NORA 30 | 20N | 12E | 26 | NE |
| 1179 | 626637 | NORA 31 | 20N | 12E | 25 | NW |
| 1180 | 626638 | NORA 32 | 20N | 12E | 25 | NE |
| 1181 | 626639 | NORA 33 | 20N | 13E | 30 | NW |
| 1182 | 626640 | NORA 34 | 20N | 13E | 30 | NE |
| 1183 | 626641 | NORA 35 | 20N | 13E | 29 | NW |
| 1184 | 626642 | NORA 36 | 20N | 13E | 29 | NE |
| 1185 | 626643 | NORA 37 | 20N | 13E | 28 | NW |
| 1186 | 626644 | NORA 38 | 20N | 13E | 28 | NE |
| 1187 | 626645 | NORA 39 | 20N | 13E | 27 | NW |
| 1188 | 626646 | NORA 40 | 20N | 13E | 27 | NE |
| 1189 | 626647 | NORA 41 | 20N | 12E | 28 | SW |
| 1190 | 626648 | NORA 42 | 20N | 12E | 28 | SE |
| 1191 | 626649 | NORA 43 | 20N | 12E | 27 | SW |
| 1192 | 626650 | NORA 44 | 20N | 12E | 27 | SE |
| 1193 | 626651 | NORA 45 | 20N | 12E | 26 | SW |
| 1194 | 626652 | NORA 46 | 20N | 12E | 26 | SE |
| 1195 | 626653 | NORA 47 | 20N | 12E | 25 | SW |
| 1196 | 626654 | NORA 48 | 20N | 12E | 25 | SE |
| 1197 | 626655 | NORA 49 | 20N | 13E | 30 | SW |
| 1198 | 626656 | NORA 50 | 20N | 13E | 30 | SE |
| 1199 | 626657 | NORA 51 | 20N | 13E | 29 | SW |
| 1200 | 626658 | NORA 52 | 20N | 13E | 29 | SE |
| 1201 | 626659 | NORA 53 | 20N | 13E | 28 | SW |
| 1202 | 626660 | NORA 54 | 20N | 13E | 28 | SE |
| 1203 | 626661 | NORA 55 | 20N | 13E | 27 | SW |
| 1204 | 626662 | NORA 56 | 20N | 13E | 27 | SE |
| 1205 | 626663 | NORA 57 | 20N | 12E | 35 | NW |
| 1206 | 626664 | NORA 58 | 20N | 12E | 35 | NE |
| 1207 | 626665 | NORA 59 | 20N | 12E | 36 | NW |
| 1208 | 626666 | NORA 60 | 20N | 12E | 36 | NE |
| 1209 | 626667 | NORA 61 | 20N | 13E | 31 | NW |
| 1210 | 626668 | NORA 62 | 20N | 13E | 31 | NE |
| 1211 | 626669 | NORA 63 | 20N | 13E | 32 | NW |
| 1212 | 626670 | NORA 64 | 20N | 13E | 32 | NE |
| 1213 | 626671 | NORA 65 | 20N | 13E | 33 | NW |
| 1214 | 626672 | NORA 66 | 20N | 13E | 33 | NE |
| 1215 | 626673 | NORA 67 | 20N | 13E | 34 | NW |
| 1216 | 626674 | NORA 68 | 20N | 13E | 34 | NE |
| 1217 | 626675 | NORA 69 | 20N | 12E | 35 | SW |
| | |
| Arctic Project | Page 453 |
| S-K 1300 Technical Report Summary | November 30, 2022 |
| | |
| | |
| | |
| 1218 | 626676 | NORA 70 | 20N | 12E | 35 | SE |
| 1219 | 626677 | NORA 71 | 20N | 12E | 36 | SW |
| 1220 | 626678 | NORA 72 | 20N | 12E | 36 | SE |
| 1221 | 626679 | NORA 73 | 20N | 13E | 31 | SW |
| 1222 | 626680 | NORA 74 | 20N | 13E | 31 | SE |
| 1223 | 626681 | NORA 75 | 20N | 13E | 32 | SW |
| 1224 | 626682 | NORA 76 | 20N | 13E | 32 | SE |
| 1225 | 626683 | NORA 77 | 20N | 13E | 33 | SW |
| 1226 | 626684 | NORA 78 | 20N | 13E | 33 | SE |
| 1227 | 626685 | NORA 79 | 20N | 13E | 34 | SW |
| 1228 | 626686 | NORA 80 | 20N | 13E | 34 | SE |
| 1229 | 629003 | Mo 1 | 20N | 15E | 7 | SE |
| 1230 | 629004 | Mo 2 | 20N | 15E | 8 | SW |
| 1231 | 629005 | Mo 3 | 20N | 15E | 8 | SE |
| 1232 | 629006 | Mo 4 | 20N | 15E | 9 | SW |
| 1233 | 629007 | Mo 5 | 20N | 15E | 9 | SE |
| 1234 | 629008 | Mo 6 | 20N | 15E | 10 | SW |
| 1235 | 629009 | Mo 7 | 20N | 15E | 10 | SE |
| 1236 | 629010 | Mo 8 | 20N | 15E | 11 | SW |
| 1237 | 629011 | Mo 9 | 20N | 15E | 11 | SE |
| 1238 | 629012 | Mo 10 | 20N | 15E | 12 | SW |
| 1239 | 629013 | Mo 11 | 20N | 15E | 12 | SE |
| 1240 | 629014 | Mo 12 | 20N | 16E | 7 | SW |
| 1241 | 629015 | Mo 13 | 20N | 16E | 7 | SE |
| 1242 | 629016 | Mo 14 | 20N | 16E | 8 | SW |
| 1243 | 629017 | Mo 15 | 20N | 16E | 8 | SE |
| 1244 | 629018 | Mo 16 | 20N | 15E | 18 | NE |
| 1245 | 629019 | Mo 17 | 20N | 15E | 18 | NW |
| 1246 | 629020 | Mo 18 | 20N | 15E | 17 | NE |
| 1247 | 629021 | Mo 19 | 20N | 15E | 16 | NW |
| 1248 | 629022 | Mo 20 | 20N | 15E | 16 | NE |
| 1249 | 629023 | Mo 21 | 20N | 15E | 15 | NW |
| 1250 | 629024 | Mo 22 | 20N | 15E | 15 | NE |
| 1251 | 629025 | Mo 23 | 20N | 15E | 14 | NW |
| 1252 | 629026 | Mo 24 | 20N | 15E | 14 | NE |
| 1253 | 629027 | Mo 25 | 20N | 15E | 13 | NW |
| 1254 | 629028 | Mo 26 | 20N | 15E | 13 | NE |
| 1255 | 629029 | Mo 27 | 20N | 16E | 18 | NW |
| 1256 | 629030 | Mo 28 | 20N | 16E | 18 | NE |
| 1257 | 629031 | Mo 29 | 20N | 16E | 17 | NW |
| 1258 | 629032 | Mo 30 | 20N | 16E | 17 | NE |
| 1259 | 629033 | Mo 31 | 20N | 15E | 18 | SE |
| 1260 | 629034 | Mo 32 | 20N | 15E | 17 | SW |
| 1261 | 629035 | Mo 33 | 20N | 15E | 17 | SE |
| | |
| Arctic Project | Page 454 |
| S-K 1300 Technical Report Summary | November 30, 2022 |
| | |
| | |
| | |
| 1262 | 629036 | Mo 34 | 20N | 15E | 16 | SW |
| 1263 | 629037 | Mo 35 | 20N | 15E | 16 | SE |
| 1264 | 629038 | Mo 36 | 20N | 15E | 15 | SW |
| 1265 | 629039 | Mo 37 | 20N | 15E | 15 | SE |
| 1266 | 629040 | Mo 38 | 20N | 15E | 14 | SW |
| 1267 | 629041 | Mo 39 | 20N | 15E | 14 | SE |
| 1268 | 629042 | Mo 40 | 20N | 15E | 13 | SW |
| 1269 | 629043 | Mo 41 | 20N | 15E | 13 | SE |
| 1270 | 629044 | Mo 42 | 20N | 16E | 18 | SW |
| 1271 | 629045 | Mo 43 | 20N | 16E | 18 | SE |
| 1272 | 629046 | Mo 44 | 20N | 16E | 17 | SW |
| 1273 | 629047 | Mo 45 | 20N | 16E | 17 | SE |
| 1274 | 629048 | Mo 46 | 20N | 15E | 19 | NE |
| 1275 | 629049 | Mo 47 | 20N | 15E | 20 | NW |
| 1276 | 629050 | Mo 48 | 20N | 15E | 20 | NE |
| 1277 | 629051 | Mo 49 | 20N | 15E | 21 | NW |
| 1278 | 629052 | Mo 50 | 20N | 15E | 21 | NE |
| 1279 | 629053 | Mo 51 | 20N | 15E | 22 | NW |
| 1280 | 629054 | Mo 52 | 20N | 15E | 22 | NE |
| 1281 | 629055 | Mo 53 | 20N | 15E | 23 | NW |
| 1282 | 629056 | Mo 54 | 20N | 15E | 23 | NE |
| 1283 | 629057 | Mo 55 | 20N | 15E | 24 | NW |
| 1284 | 629058 | Mo 56 | 20N | 15E | 24 | NE |
| 1285 | 629059 | Mo 57 | 20N | 16E | 19 | NW |
| 1286 | 629060 | Mo 58 | 20N | 16E | 19 | NE |
| 1287 | 629061 | Mo 59 | 20N | 16E | 20 | NW |
| 1288 | 629062 | Mo 60 | 20N | 16E | 20 | NE |
| 1289 | 629063 | Mo 61 | 20N | 16E | 21 | NW |
| 1290 | 629064 | Mo 62 | 20N | 16E | 21 | NE |
| 1291 | 629065 | Mo 63 | 20N | 16E | 19 | SE |
| 1292 | 629066 | Mo 64 | 20N | 15E | 20 | SW |
| 1293 | 629067 | Mo 65 | 20N | 15E | 20 | SE |
| 1294 | 629068 | Mo 66 | 20N | 15E | 21 | SW |
| 1295 | 629069 | Mo 67 | 20N | 15E | 21 | SE |
| 1296 | 629070 | Mo 68 | 20N | 15E | 22 | SW |
| 1297 | 629071 | Mo 69 | 20N | 15E | 22 | SE |
| 1298 | 629072 | Mo 70 | 20N | 15E | 23 | SW |
| 1299 | 629073 | Mo 71 | 20N | 15E | 23 | SE |
| 1300 | 629074 | Mo 72 | 20N | 15E | 24 | SW |
| 1301 | 629075 | Mo 73 | 20N | 15E | 24 | SE |
| 1302 | 629076 | Mo 74 | 20N | 16E | 19 | SW |
| 1303 | 629077 | Mo 75 | 20N | 16E | 19 | SE |
| 1304 | 629078 | Mo 76 | 20N | 16E | 20 | SW |
| 1305 | 629079 | Mo 77 | 20N | 16E | 20 | SE |
| | |
| Arctic Project | Page 455 |
| S-K 1300 Technical Report Summary | November 30, 2022 |
| | |
| | |
| | |
| 1306 | 629080 | Mo 78 | 20N | 16E | 21 | SW |
| 1307 | 629081 | Mo 79 | 20N | 16E | 21 | SE |
| 1308 | 629082 | Mo 80 | 20N | 15E | 30 | NE |
| 1309 | 629083 | Mo 81 | 20N | 15E | 29 | NW |
| 1310 | 629084 | Mo 82 | 20N | 15E | 29 | NE |
| 1311 | 629085 | Mo 83 | 20N | 15E | 28 | NW |
| 1312 | 629086 | Mo 84 | 20N | 15E | 28 | NE |
| 1313 | 629087 | Mo 85 | 20N | 15E | 27 | NW |
| 1314 | 629088 | Mo 86 | 20N | 15E | 27 | NE |
| 1315 | 629089 | Mo 87 | 20N | 15E | 26 | NW |
| 1316 | 629090 | Mo 88 | 20N | 15E | 26 | NE |
| 1317 | 629091 | Mo 89 | 20N | 15E | 25 | NW |
| 1318 | 629092 | Mo 90 | 20N | 15E | 25 | NE |
| 1319 | 629093 | Mo 91 | 20N | 16E | 30 | NW |
| 1320 | 629094 | Mo 92 | 20N | 16E | 30 | NE |
| 1321 | 629095 | Mo 93 | 20N | 16E | 29 | NW |
| 1322 | 629096 | Mo 94 | 20N | 16E | 29 | NE |
| 1323 | 629097 | Mo 95 | 20N | 16E | 28 | NW |
| 1324 | 629098 | Mo 96 | 20N | 16E | 28 | NE |
| 1325 | 629099 | Mo 97 | 20N | 16E | 27 | NW |
| 1326 | 629100 | Mo 98 | 20N | 16E | 27 | NE |
| 1327 | 629101 | Mo 99 | 20N | 16E | 26 | NW |
| 1328 | 629102 | Mo 100 | 20N | 16E | 26 | NE |
| 1329 | 629103 | Mo 101 | 20N | 15E | 30 | SE |
| 1330 | 629104 | Mo 102 | 20N | 15E | 29 | SW |
| 1331 | 629105 | Mo 103 | 20N | 15E | 29 | SE |
| 1332 | 629106 | Mo 104 | 20N | 15E | 28 | SW |
| 1333 | 629107 | Mo 105 | 20N | 15E | 28 | SE |
| 1334 | 629108 | Mo 106 | 20N | 15E | 27 | SW |
| 1335 | 629109 | Mo 107 | 20N | 15E | 27 | SE |
| 1336 | 629110 | Mo 108 | 20N | 15E | 26 | SW |
| 1337 | 629111 | Mo 109 | 20N | 15E | 26 | SE |
| 1338 | 629112 | Mo 110 | 20N | 15E | 25 | SW |
| 1339 | 629113 | Mo 111 | 20N | 15E | 25 | SE |
| 1340 | 629114 | Mo 112 | 20N | 16E | 30 | SW |
| 1341 | 629115 | Mo 113 | 20N | 16E | 30 | SE |
| 1342 | 629116 | Mo 114 | 20N | 16E | 29 | SW |
| 1343 | 629117 | Mo 115 | 20N | 16E | 29 | SE |
| 1344 | 629118 | Mo 116 | 20N | 16E | 28 | SW |
| 1345 | 629119 | Mo 117 | 20N | 16E | 28 | SE |
| 1346 | 629120 | Mo 118 | 20N | 16E | 27 | SW |
| 1347 | 629121 | Mo 119 | 20N | 16E | 27 | SE |
| 1348 | 629122 | Mo 120 | 20N | 16E | 26 | SW |
| 1349 | 629123 | Mo 121 | 20N | 16E | 26 | SE |
| | |
| Arctic Project | Page 456 |
| S-K 1300 Technical Report Summary | November 30, 2022 |
| | |
| | |
| | |
| 1350 | 629124 | Mo 122 | 20N | 14E | 36 | NW |
| 1351 | 629125 | Mo 123 | 20N | 14E | 36 | NE |
| 1352 | 629126 | Mo 124 | 20N | 15E | 31 | NW |
| 1353 | 629127 | Mo 125 | 20N | 15E | 31 | NE |
| 1354 | 629128 | Mo 126 | 20N | 15E | 32 | NW |
| 1355 | 629129 | Mo 127 | 20N | 15E | 32 | NE |
| 1356 | 629130 | Mo 128 | 20N | 16E | 34 | NW |
| 1357 | 629131 | Mo 129 | 20N | 16E | 34 | NE |
| 1358 | 629132 | Mo 130 | 20N | 16E | 35 | NW |
| 1359 | 629133 | Mo 131 | 20N | 16E | 35 | NE |
| 1360 | 629134 | Mo 132 | 20N | 14E | 36 | SW |
| 1361 | 629135 | Mo 133 | 20N | 14E | 36 | NE |
| 1362 | 629136 | Mo 134 | 20N | 15E | 31 | SW |
| 1363 | 629137 | Mo 135 | 20N | 15E | 31 | SE |
| 1364 | 629138 | Mo 136 | 20N | 15E | 32 | SW |
| 1365 | 629139 | Mo 137 | 20N | 15E | 32 | SE |
| 1366 | 629189 | WK112 | 23N | 06E | 29 | NW |
| 1367 | 629190 | WK113 | 23N | 06E | 29 | NE |
| 1368 | 629191 | WK114 | 23N | 06E | 28 | NW |
| 1369 | 629192 | WK115 | 23N | 06E | 28 | NE |
| 1370 | 629193 | WK116 | 23N | 06E | 27 | NW |
| 1371 | 629194 | WK117 | 23N | 06E | 27 | NE |
| 1372 | 629195 | WK137 | 23N | 05E | 27 | SW |
| 1373 | 629196 | WK138 | 23N | 05E | 27 | SE |
| 1374 | 629197 | WK139 | 23N | 05E | 26 | SW |
| 1375 | 629198 | WK140 | 23N | 05E | 26 | SE |
| 1376 | 629199 | WK141 | 23N | 05E | 25 | SW |
| 1377 | 629200 | WK142 | 23N | 05E | 25 | SE |
| 1378 | 629201 | WK143 | 23N | 06E | 30 | SW |
| 1379 | 629202 | WK144 | 23N | 06E | 30 | SE |
| 1380 | 629203 | WK145 | 23N | 06E | 29 | SW |
| 1381 | 629204 | WK146 | 23N | 06E | 29 | SE |
| 1382 | 629205 | WK147 | 23N | 06E | 28 | SW |
| 1383 | 629206 | WK148 | 23N | 06E | 28 | SE |
| 1384 | 629207 | WK149 | 23N | 06E | 27 | SW |
| 1385 | 629208 | WK150 | 23N | 06E | 27 | SE |
| 1386 | 629209 | WK151 | 23N | 06E | 26 | SW |
| 1387 | 629210 | WK152 | 23N | 06E | 26 | SE |
| 1388 | 629211 | WK153 | 23N | 06E | 25 | SW |
| 1389 | 629212 | WK154 | 23N | 06E | 25 | SE |
| 1390 | 629213 | WK155 | 23N | 07E | 30 | SW |
| 1391 | 629214 | WK156 | 23N | 07E | 30 | SE |
| 1392 | 629215 | WK157 | 23N | 07E | 29 | SW |
| 1393 | 629216 | WK158 | 23N | 07E | 29 | SE |
| | |
| Arctic Project | Page 457 |
| S-K 1300 Technical Report Summary | November 30, 2022 |
| | |
| | |
| | |
| 1394 | 629217 | WK159 | 23N | 07E | 28 | SW |
| 1395 | 629218 | WK160 | 23N | 07E | 28 | SE |
| 1396 | 629219 | WK161 | 23N | 07E | 27 | SW |
| 1397 | 629220 | WK162 | 23N | 07E | 27 | SE |
| 1398 | 629221 | WK163 | 23N | 07E | 26 | SW |
| 1399 | 629222 | WK172 | 23N | 05E | 34 | NW |
| 1400 | 629223 | WK173 | 23N | 05E | 34 | NE |
| 1401 | 629224 | WK174 | 23N | 05E | 35 | NW |
| 1402 | 629225 | WK175 | 23N | 05E | 35 | NE |
| 1403 | 629226 | WK176 | 23N | 05E | 36 | NW |
| 1404 | 629227 | WK177 | 23N | 05E | 36 | NE |
| 1405 | 629228 | WK178 | 23N | 06E | 31 | NW |
| 1406 | 629229 | WK179 | 23N | 06E | 31 | NE |
| 1407 | 629230 | WK180 | 23N | 06E | 32 | NW |
| 1408 | 629231 | WK181 | 23N | 06E | 32 | NE |
| 1409 | 629232 | WK182 | 23N | 06E | 33 | NW |
| 1410 | 629233 | WK183 | 23N | 06E | 33 | NE |
| 1411 | 629234 | WK184 | 23N | 06E | 34 | NW |
| 1412 | 629235 | WK185 | 23N | 06E | 34 | NE |
| 1413 | 629236 | WK186 | 23N | 06E | 35 | NW |
| 1414 | 629237 | WK187 | 23N | 06E | 35 | NE |
| 1415 | 629238 | WK188 | 23N | 06E | 36 | NW |
| 1416 | 629239 | WK189 | 23N | 06E | 36 | NE |
| 1417 | 629240 | WK190 | 23N | 07E | 31 | NW |
| 1418 | 629241 | WK191 | 23N | 07E | 31 | NE |
| 1419 | 629242 | WK192 | 23N | 07E | 32 | NW |
| 1420 | 629243 | WK193 | 23N | 07E | 32 | NE |
| 1421 | 629244 | WK194 | 23N | 07E | 33 | NW |
| 1422 | 629245 | WK195 | 23N | 07E | 33 | NE |
| 1423 | 629246 | WK196 | 23N | 07E | 34 | NW |
| 1424 | 629247 | WK197 | 23N | 07E | 34 | NE |
| 1425 | 629248 | WK198 | 23N | 07E | 35 | NW |
| 1426 | 629249 | WK199 | 23N | 07E | 35 | NE |
| 1427 | 629250 | WK208 | 23N | 05E | 34 | SW |
| 1428 | 629251 | WK209 | 23N | 05E | 34 | SE |
| 1429 | 629252 | WK210 | 23N | 05E | 35 | SW |
| 1430 | 629253 | WK211 | 23N | 05E | 35 | SE |
| 1431 | 629254 | WK212 | 23N | 05E | 36 | SW |
| 1432 | 629255 | WK213 | 23N | 05E | 36 | SE |
| 1433 | 629256 | WK214 | 23N | 06E | 31 | SW |
| 1434 | 629257 | WK215 | 23N | 06E | 31 | SE |
| 1435 | 629258 | WK216 | 23N | 06E | 32 | SW |
| 1436 | 629259 | WK217 | 23N | 06E | 32 | SE |
| 1437 | 629260 | WK218 | 23N | 06E | 33 | SW |
| | |
| Arctic Project | Page 458 |
| S-K 1300 Technical Report Summary | November 30, 2022 |
| | |
| | |
| | |
| 1438 | 629261 | WK219 | 23N | 06E | 33 | SE |
| 1439 | 629262 | WK220 | 23N | 06E | 34 | SW |
| 1440 | 629263 | WK221 | 23N | 06E | 34 | SE |
| 1441 | 629264 | WK222 | 23N | 06E | 35 | SW |
| 1442 | 629265 | WK223 | 23N | 06E | 35 | SE |
| 1443 | 629266 | WK224 | 23N | 06E | 36 | SW |
| 1444 | 629267 | WK225 | 23N | 06E | 36 | SE |
| 1445 | 629268 | WK226 | 23N | 07E | 31 | SW |
| 1446 | 629269 | WK227 | 23N | 07E | 31 | SE |
| 1447 | 629270 | WK228 | 23N | 07E | 32 | SW |
| 1448 | 629271 | WK229 | 23N | 07E | 32 | SE |
| 1449 | 629272 | WK230 | 23N | 07E | 33 | SW |
| 1450 | 629273 | WK231 | 23N | 07E | 33 | SE |
| 1451 | 629274 | WK232 | 23N | 07E | 34 | SW |
| 1452 | 629275 | WK233 | 23N | 07E | 34 | SE |
| 1453 | 629276 | WK234 | 23N | 07E | 35 | SW |
| 1454 | 629277 | WK235 | 23N | 07E | 35 | SE |
| 1455 | 629278 | WK236 | 23N | 07E | 36 | SW |
| 1456 | 629279 | WK237 | 23N | 07E | 36 | SE |
| 1457 | 629280 | WK238 | 23N | 08E | 31 | SW |
| 1458 | 629281 | WK239 | 22N | 05E | 03 | NW |
| 1459 | 629282 | WK240 | 22N | 05E | 03 | NE |
| 1460 | 629283 | WK241 | 22N | 05E | 02 | NW |
| 1461 | 629284 | WK242 | 22N | 05E | 02 | NE |
| 1462 | 629285 | WK243 | 22N | 05E | 01 | NW |
| 1463 | 629286 | WK244 | 22N | 05E | 01 | NE |
| 1464 | 629287 | WK245 | 22N | 05E | 03 | SW |
| 1465 | 629288 | WK246 | 22N | 05E | 03 | SE |
| 1466 | 629289 | WK247 | 22N | 05E | 02 | SW |
| 1467 | 629290 | WK248 | 22N | 05E | 02 | SE |
| 1468 | 629291 | WK249 | 22N | 05E | 01 | SW |
| 1469 | 629292 | WK250 | 22N | 05E | 01 | SE |
| 1470 | 629293 | WK251 | 22N | 05E | 10 | NW |
| 1471 | 629294 | WK252 | 22N | 05E | 10 | NE |
| 1472 | 629295 | WK253 | 22N | 05E | 11 | NW |
| 1473 | 629296 | WK254 | 22N | 05E | 11 | NE |
| 1474 | 629297 | WK255 | 22N | 05E | 12 | NW |
| 1475 | 629298 | WK256 | 22N | 05E | 12 | NE |
| 1476 | 629299 | WK257 | 22N | 05E | 10 | SW |
| 1477 | 629300 | WK258 | 22N | 05E | 10 | SE |
| 1478 | 629301 | WK259 | 22N | 05E | 11 | SW |
| 1479 | 629302 | WK260 | 22N | 05E | 11 | SE |
| 1480 | 629303 | WK261 | 22N | 05E | 12 | SW |
| 1481 | 629304 | WK262 | 22N | 05E | 12 | SE |
| | |
| Arctic Project | Page 459 |
| S-K 1300 Technical Report Summary | November 30, 2022 |
| | |
| | |
| | |
| 1482 | 629305 | WK263 | 22N | 05E | 15 | NW |
| 1483 | 629306 | WK264 | 22N | 05E | 15 | NE |
| 1484 | 629307 | WK265 | 22N | 05E | 14 | NW |
| 1485 | 629308 | WK266 | 22N | 05E | 14 | NE |
| 1486 | 629309 | WK267 | 22N | 05E | 13 | NW |
| 1487 | 629310 | WK268 | 22N | 05E | 13 | NE |
| 1488 | 629311 | WK269 | 22N | 05E | 15 | SW |
| 1489 | 629312 | WK270 | 22N | 05E | 15 | SE |
| 1490 | 629313 | WK271 | 22N | 05E | 14 | SW |
| 1491 | 629314 | WK272 | 22N | 05E | 14 | SE |
| 1492 | 629315 | WK273 | 22N | 05E | 13 | SW |
| 1493 | 629316 | WK274 | 22N | 05E | 13 | SE |
| 1494 | 629317 | WK275 | 22N | 05E | 22 | NW |
| 1495 | 629318 | WK276 | 22N | 05E | 22 | NE |
| 1496 | 629319 | WK277 | 22N | 05E | 23 | NW |
| 1497 | 629320 | WK278 | 22N | 05E | 23 | NE |
| 1498 | 629321 | WK279 | 22N | 05E | 24 | NW |
| 1499 | 629322 | WK280 | 22N | 05E | 24 | NE |
| 1500 | 629323 | WK281 | 22N | 05E | 22 | SW |
| 1501 | 629324 | WK282 | 22N | 05E | 22 | SE |
| 1502 | 629325 | WK283 | 22N | 05E | 23 | SW |
| 1503 | 629326 | WK284 | 22N | 05E | 23 | SE |
| 1504 | 629327 | WK285 | 22N | 05E | 24 | SW |
| 1505 | 629328 | WK286 | 22N | 05E | 24 | SE |
| 1506 | 629329 | WK287 | 22N | 05E | 27 | NW |
| 1507 | 629330 | WK288 | 22N | 05E | 27 | NE |
| 1508 | 629331 | WK289 | 22N | 05E | 27 | SW |
| 1509 | 629332 | WK290 | 22N | 05E | 27 | SE |
| 1510 | 629333 | WK291 | 22N | 05E | 34 | NW |
| 1511 | 629334 | WK292 | 22N | 05E | 34 | NE |
| 1512 | 629335 | WK293 | 22N | 05E | 34 | SW |
| 1513 | 629336 | WK294 | 22N | 05E | 34 | SE |
| 1514 | 634110 | EDC 1 | 21N | 10E | 12 | SW |
| 1515 | 634111 | EDC 2 | 21N | 10E | 12 | SE |
| 1516 | 634112 | EDC 3 | 21N | 10E | 12 | SE |
| 1517 | 634113 | EDC 4 | 21N | 11E | 7 | SW |
| 1518 | 634114 | EDC 5 | 21N | 11E | 7 | SW |
| 1519 | 634115 | EDC 6 | 21N | 11E | 7 | SE |
| 1520 | 634116 | EDC 7 | 21N | 11E | 7 | SE |
| 1521 | 634117 | EDC 8 | 21N | 11E | 8 | SW |
| 1522 | 634118 | EDC 9 | 21N | 10E | 12 | SW |
| 1523 | 634119 | EDC 10 | 21N | 10E | 12 | SE |
| 1524 | 634120 | EDC 11 | 21N | 10E | 12 | SE |
| 1525 | 634121 | EDC 12 | 21N | 11E | 7 | SW |
| | |
| Arctic Project | Page 460 |
| S-K 1300 Technical Report Summary | November 30, 2022 |
| | |
| | |
| | |
| 1526 | 634122 | EDC 13 | 21N | 11E | 7 | SW |
| 1527 | 634123 | EDC 14 | 21N | 11E | 7 | SE |
| 1528 | 634124 | EDC 15 | 21N | 11E | 7 | SE |
| 1529 | 634125 | EDC 16 | 21N | 11E | 8 | SW |
| 1530 | 634126 | EDC 17 | 21N | 10E | 13 | NW |
| 1531 | 634127 | EDC 18 | 21N | 10E | 13 | NE |
| 1532 | 634128 | EDC 19 | 21N | 10E | 13 | NE |
| 1533 | 634129 | EDC 20 | 21N | 11E | 18 | NW |
| 1534 | 634130 | EDC 21 | 21N | 11E | 18 | NW |
| 1535 | 634131 | EDC 22 | 21N | 11E | 18 | NE |
| 1536 | 634132 | EDC 23 | 21N | 11E | 18 | NE |
| 1537 | 634133 | EDC 24 | 21N | 11E | 17 | NW |
| 1538 | 634134 | EDC 25 | 21N | 10E | 13 | NW |
| 1539 | 634135 | EDC 26 | 21N | 10E | 13 | NE |
| 1540 | 634136 | EDC 27 | 21N | 10E | 13 | NE |
| 1541 | 634137 | EDC 28 | 21N | 11E | 18 | NW |
| 1542 | 634138 | EDC 29 | 21N | 11E | 18 | NW |
| 1543 | 634139 | EDC 30 | 21N | 11E | 18 | NE |
| 1544 | 634140 | EDC 31 | 21N | 11E | 18 | NE |
| 1545 | 634141 | EDC 32 | 21N | 11E | 17 | NW |
| 1546 | 634142 | EDC 33 | 21N | 10E | 13 | SW |
| 1547 | 634143 | EDC 34 | 21N | 10E | 13 | SE |
| 1548 | 634144 | EDC 35 | 21N | 10E | 13 | SE |
| 1549 | 634145 | EDC 36 | 21N | 11E | 18 | SW |
| 1550 | 634146 | EDC 37 | 21N | 11E | 18 | SW |
| 1551 | 634147 | EDC 38 | 21N | 11E | 18 | SE |
| 1552 | 634148 | EDC 39 | 21N | 11E | 18 | SE |
| 1553 | 634149 | EDC 40 | 21N | 11E | 17 | SW |
| 1554 | 634150 | EDC 41 | 21N | 10E | 13 | SW |
| 1555 | 634151 | EDC 42 | 21N | 10E | 13 | SE |
| 1556 | 634152 | EDC 43 | 21N | 10E | 13 | SE |
| 1557 | 634153 | EDC 44 | 21N | 11E | 18 | SW |
| 1558 | 634154 | EDC 45 | 21N | 11E | 18 | SW |
| 1559 | 634155 | EDC 46 | 21N | 11E | 18 | SE |
| 1560 | 634156 | EDC 47 | 21N | 11E | 18 | SE |
| 1561 | 634157 | EDC 48 | 21N | 11E | 17 | SW |
| 1562 | 634158 | EDC 49 | 21N | 10E | 24 | NW |
| 1563 | 634159 | EDC 50 | 21N | 10E | 24 | NE |
| 1564 | 634160 | EDC 51 | 21N | 10E | 24 | NE |
| 1565 | 634161 | EDC 52 | 21N | 11E | 19 | NW |
| 1566 | 634162 | EDC 53 | 21N | 11E | 19 | NW |
| 1567 | 634163 | EDC 54 | 21N | 11E | 19 | NE |
| 1568 | 634164 | EDC 55 | 21N | 11E | 19 | NE |
| 1569 | 634165 | EDC 56 | 21N | 11E | 20 | NW |
| | |
| Arctic Project | Page 461 |
| S-K 1300 Technical Report Summary | November 30, 2022 |
| | |
| | |
| | |
| 1570 | 634166 | EDC 57 | 21N | 10E | 24 | NW |
| 1571 | 634167 | EDC 58 | 21N | 10E | 24 | NE |
| 1572 | 634168 | EDC 59 | 21N | 10E | 24 | NE |
| 1573 | 634169 | EDC 60 | 21N | 11E | 19 | NW |
| 1574 | 634170 | EDC 61 | 21N | 11E | 19 | NW |
| 1575 | 634171 | EDC 62 | 21N | 11E | 19 | NE |
| 1576 | 634172 | EDC 63 | 21N | 11E | 19 | NE |
| 1577 | 634173 | EDC 64 | 21N | 11E | 20 | NW |
| 1578 | 634174 | EDC 65 | 21N | 10E | 24 | SE |
| 1579 | 634175 | EDC 66 | 21N | 10E | 24 | SE |
| 1580 | 634176 | EDC 67 | 21N | 11E | 19 | SW |
| 1581 | 634177 | EDC 68 | 21N | 11E | 19 | SW |
| 1582 | 634178 | EDC 69 | 21N | 11E | 19 | SE |
| 1583 | 634179 | EDC 70 | 21N | 11E | 19 | SE |
| 1584 | 634180 | EDC 71 | 21N | 11E | 20 | SW |
| 1585 | 634181 | EDC 72 | 21N | 11E | 20 | SW |
| 1586 | 634182 | EDC 73 | 21N | 11E | 20 | SE |
| 1587 | 634183 | EDC 74 | 21N | 11E | 20 | SE |
| 1588 | 634184 | EDC 75 | 21N | 11E | 21 | SW |
| 1589 | 634185 | EDC 76 | 21N | 10E | 24 | SE |
| 1590 | 634186 | EDC 77 | 21N | 11E | 19 | SW |
| 1591 | 634187 | EDC 78 | 21N | 11E | 19 | SW |
| 1592 | 634188 | EDC 79 | 21N | 11E | 19 | SE |
| 1593 | 634189 | EDC 80 | 21N | 11E | 19 | SE |
| 1594 | 634190 | EDC 81 | 21N | 11E | 20 | SW |
| 1595 | 634191 | EDC 82 | 21N | 11E | 20 | SW |
| 1596 | 634192 | EDC 83 | 21N | 11E | 20 | SE |
| 1597 | 634193 | EDC 84 | 21N | 11E | 20 | SE |
| 1598 | 634194 | EDC 85 | 21N | 11E | 21 | SW |
| 1599 | 634195 | EDC 86 | 21N | 10E | 25 | NE |
| 1600 | 634196 | EDC 87 | 21N | 11E | 30 | NW |
| 1601 | 634197 | EDC 88 | 21N | 11E | 30 | NW |
| 1602 | 634198 | EDC 89 | 21N | 11E | 30 | NE |
| 1603 | 634199 | EDC 90 | 21N | 11E | 30 | NE |
| 1604 | 634200 | EDC 91 | 21N | 11E | 29 | NW |
| 1605 | 634201 | EDC 92 | 21N | 11E | 29 | NW |
| 1606 | 634202 | EDC 93 | 21N | 11E | 29 | NE |
| 1607 | 634203 | EDC 94 | 21N | 11E | 29 | NE |
| 1608 | 634204 | EDC 95 | 21N | 11E | 28 | NW |
| 1609 | 650291 | HOSS 01 | 22N | 10E | 18 | NW |
| 1610 | 650292 | HOSS 02 | 22N | 10E | 18 | NE |
| 1611 | 650293 | HOSS 03 | 22N | 10E | 17 | NW |
| 1612 | 650294 | HOSS 04 | 22N | 10E | 17 | NE |
| 1613 | 650295 | HOSS 05 | 22N | 10E | 16 | NW |
| | |
| Arctic Project | Page 462 |
| S-K 1300 Technical Report Summary | November 30, 2022 |
| | |
| | |
| | |
| 1614 | 650296 | HOSS 06 | 22N | 10E | 16 | NE |
| 1615 | 650297 | HOSS 07 | 22N | 10E | 15 | NW |
| 1616 | 650298 | HOSS 08 | 22N | 10E | 18 | SW |
| 1617 | 650299 | HOSS 09 | 22N | 10E | 18 | SE |
| 1618 | 650300 | HOSS 10 | 22N | 10E | 17 | SW |
| 1619 | 650301 | HOSS 11 | 22N | 10E | 17 | SE |
| 1620 | 650302 | HOSS 12 | 22N | 10E | 16 | SW |
| 1621 | 650303 | HOSS 13 | 22N | 10E | 16 | SE |
| 1622 | 650304 | HOSS 14 | 22N | 10E | 15 | SW |
| 1623 | 650305 | HOSS 15 | 22N | 10E | 19 | NW |
| 1624 | 650306 | HOSS 16 | 22N | 10E | 19 | NE |
| 1625 | 650307 | HOSS 17 | 22N | 10E | 20 | NW |
| 1626 | 650308 | HOSS 18 | 22N | 10E | 20 | NE |
| 1627 | 650309 | HOSS 19 | 22N | 10E | 21 | NW |
| 1628 | 650310 | HOSS 20 | 22N | 10E | 21 | NE |
| 1629 | 650311 | HOSS 21 | 22N | 10E | 22 | NW |
| 1630 | 650312 | HOSS 22 | 22N | 10E | 19 | SW |
| 1631 | 650313 | HOSS 23 | 22N | 10E | 19 | SE |
| 1632 | 650314 | HOSS 24 | 22N | 10E | 20 | SW |
| 1633 | 650315 | HOSS 25 | 22N | 10E | 20 | SE |
| 1634 | 650316 | HOSS 26 | 22N | 10E | 21 | SW |
| 1635 | 650317 | HOSS 27 | 22N | 10E | 21 | SE |
| 1636 | 650318 | HOSS 28 | 22N | 10E | 22 | SW |
| 1637 | 650319 | HOSS 29 | 22N | 10E | 30 | NW |
| 1638 | 650320 | HOSS 30 | 22N | 10E | 30 | NE |
| 1639 | 650321 | HOSS 31 | 22N | 10E | 29 | NW |
| 1640 | 650322 | HOSS 32 | 22N | 10E | 29 | NE |
| 1641 | 650323 | HOSS 33 | 22N | 10E | 28 | NW |
| 1642 | 650324 | HOSS 34 | 22N | 10E | 28 | NE |
| 1643 | 650325 | HOSS 35 | 22N | 10E | 27 | NW |
| 1644 | 651152 | ZED 1 | 20N | 12E | 10 | NE |
| 1645 | 651153 | ZED 2 | 20N | 12E | 11 | NW |
| 1646 | 651154 | ZED 3 | 20N | 12E | 11 | NE |
| 1647 | 651155 | ZED 4 | 20N | 12E | 10 | SE |
| 1648 | 651156 | ZED 5 | 20N | 12E | 11 | SW |
| 1649 | 651157 | ZED 6 | 20N | 12E | 11 | SE |
| 1650 | 651158 | ZED 7 | 20N | 12E | 12 | SW |
| 1651 | 651159 | ZED 8 | 20N | 12E | 12 | SE |
| 1652 | 651160 | ZED 9 | 20N | 12E | 15 | NE |
| 1653 | 651161 | ZED 10 | 20N | 12E | 14 | NW |
| 1654 | 651162 | ZED 11 | 20N | 12E | 14 | NE |
| 1655 | 651163 | ZED 12 | 20N | 12E | 13 | NW |
| 1656 | 651164 | ZED 13 | 20N | 12E | 13 | NE |
| 1657 | 651165 | ZED 14 | 20N | 13E | 18 | NW |
| | |
| Arctic Project | Page 463 |
| S-K 1300 Technical Report Summary | November 30, 2022 |
| | |
| | |
| | |
| 1658 | 651166 | ZED 15 | 20N | 13E | 18 | NE |
| 1659 | 651167 | ZED 16 | 20N | 13E | 17 | NW |
| 1660 | 651168 | ZED 17 | 20N | 13E | 17 | NE |
| 1661 | 651169 | ZED 18 | 20N | 13E | 16 | NW |
| 1662 | 651170 | ZED 19 | 20N | 13E | 16 | NE |
| 1663 | 651171 | ZED 20 | 20N | 13E | 15 | NW |
| 1664 | 651172 | ZED 21 | 20N | 13E | 15 | NE |
| 1665 | 651173 | ZED 22 | 20N | 12E | 15 | SE |
| 1666 | 651174 | ZED 23 | 20N | 12E | 14 | SW |
| 1667 | 651175 | ZED 24 | 20N | 12E | 14 | SE |
| 1668 | 651176 | ZED 25 | 20N | 12E | 13 | SW |
| 1669 | 651177 | ZED 26 | 20N | 12E | 13 | SE |
| 1670 | 651178 | ZED 27 | 20N | 13E | 18 | SW |
| 1671 | 651179 | ZED 28 | 20N | 13E | 18 | SE |
| 1672 | 651180 | ZED 29 | 20N | 13E | 17 | SW |
| 1673 | 651181 | ZED 30 | 20N | 13E | 17 | SE |
| 1674 | 651182 | ZED 31 | 20N | 13E | 16 | SW |
| 1675 | 651183 | ZED 32 | 20N | 13E | 16 | SE |
| 1676 | 651184 | ZED 33 | 20N | 13E | 15 | SW |
| 1677 | 651185 | ZED 34 | 20N | 13E | 15 | SE |
| 1678 | 651186 | ZED 35 | 20N | 12E | 24 | NE |
| 1679 | 651187 | ZED 36 | 20N | 13E | 19 | NW |
| 1680 | 651188 | ZED 37 | 20N | 13E | 19 | NE |
| 1681 | 651189 | ZED 38 | 20N | 13E | 20 | NW |
| 1682 | 651190 | ZED 39 | 20N | 13E | 20 | NE |
| 1683 | 651191 | ZED 40 | 20N | 13E | 21 | NW |
| 1684 | 651192 | ZED 41 | 20N | 13E | 21 | NE |
| 1685 | 651193 | ZED 42 | 20N | 13E | 22 | NW |
| 1686 | 651194 | ZED 43 | 20N | 13E | 22 | NE |
| 1687 | 651195 | ZED 44 | 20N | 13E | 19 | SE |
| 1688 | 651196 | ZED 45 | 20N | 13E | 20 | SW |
| 1689 | 651197 | ZED 46 | 20N | 13E | 20 | SE |
| 1690 | 651198 | ZED 47 | 20N | 13E | 21 | SW |
| 1691 | 651199 | ZED 48 | 20N | 13E | 21 | SE |
| 1692 | 651200 | ZED 49 | 20N | 13E | 22 | SW |
| 1693 | 651201 | ZED 50 | 20N | 13E | 22 | SE |
| 1694 | 651202 | ZED 51 | 20N | 13E | 23 | NW |
| 1695 | 651203 | ZED 52 | 20N | 13E | 23 | NE |
| 1696 | 651204 | ZED 53 | 20N | 13E | 24 | NW |
| 1697 | 651205 | ZED 54 | 20N | 13E | 24 | NE |
| 1698 | 651206 | ZED 55 | 20N | 14E | 19 | NW |
| 1699 | 651207 | ZED 56 | 20N | 14E | 19 | NE |
| 1700 | 651208 | ZED 57 | 20N | 14E | 20 | NW |
| 1701 | 651209 | ZED 58 | 20N | 14E | 20 | NE |
| | |
| Arctic Project | Page 464 |
| S-K 1300 Technical Report Summary | November 30, 2022 |
| | |
| | |
| | |
| 1702 | 651210 | ZED 59 | 20N | 14E | 21 | NW |
| 1703 | 651211 | ZED 60 | 20N | 14E | 21 | NE |
| 1704 | 651212 | ZED 61 | 20N | 14E | 22 | NW |
| 1705 | 651213 | ZED 62 | 20N | 14E | 22 | NE |
| 1706 | 651214 | ZED 63 | 20N | 14E | 23 | NW |
| 1707 | 651215 | ZED 64 | 20N | 14E | 23 | NE |
| 1708 | 651216 | ZED 65 | 20N | 14E | 24 | NW |
| 1709 | 651217 | ZED 66 | 20N | 14E | 24 | NE |
| 1710 | 651218 | ZED 67 | 20N | 15E | 19 | NW |
| 1711 | 651219 | ZED 68 | 20N | 13E | 23 | SW |
| 1712 | 651220 | ZED 69 | 20N | 13E | 23 | SE |
| 1713 | 651221 | ZED 70 | 20N | 13E | 24 | SW |
| 1714 | 651222 | ZED 71 | 20N | 13E | 24 | SE |
| 1715 | 651223 | ZED 72 | 20N | 14E | 19 | SW |
| 1716 | 651224 | ZED 73 | 20N | 14E | 19 | SE |
| 1717 | 651225 | ZED 74 | 20N | 14E | 20 | SW |
| 1718 | 651226 | ZED 75 | 20N | 14E | 20 | SE |
| 1719 | 651227 | ZED 76 | 20N | 14E | 21 | SW |
| 1720 | 651228 | ZED 77 | 20N | 14E | 21 | SE |
| 1721 | 651229 | ZED 78 | 20N | 14E | 22 | SW |
| 1722 | 651230 | ZED 79 | 20N | 14E | 22 | SE |
| 1723 | 651231 | ZED 80 | 20N | 14E | 23 | SW |
| 1724 | 651232 | ZED 81 | 20N | 14E | 23 | SE |
| 1725 | 651233 | ZED 82 | 20N | 14E | 24 | SW |
| 1726 | 651234 | ZED 83 | 20N | 14E | 24 | SE |
| 1727 | 651235 | ZED 84 | 20N | 15E | 19 | SW |
| 1728 | 651236 | ZED 85 | 20N | 13E | 26 | NW |
| 1729 | 651237 | ZED 86 | 20N | 13E | 26 | NE |
| 1730 | 651238 | ZED 87 | 20N | 13E | 25 | NW |
| 1731 | 651239 | ZED 88 | 20N | 13E | 25 | NE |
| 1732 | 651240 | ZED 89 | 20N | 14E | 30 | NW |
| 1733 | 651241 | ZED 90 | 20N | 14E | 30 | NE |
| 1734 | 651242 | ZED 91 | 20N | 14E | 29 | NW |
| 1735 | 651243 | ZED 92 | 20N | 14E | 29 | NE |
| 1736 | 651244 | ZED 93 | 20N | 14E | 28 | NW |
| 1737 | 651245 | ZED 94 | 20N | 14E | 28 | NE |
| 1738 | 651246 | ZED 95 | 20N | 14E | 27 | NW |
| 1739 | 651247 | ZED 96 | 20N | 14E | 27 | NE |
| 1740 | 651248 | ZED 97 | 20N | 14E | 26 | NW |
| 1741 | 651249 | ZED 98 | 20N | 14E | 26 | NE |
| 1742 | 651250 | ZED 99 | 20N | 14E | 25 | NW |
| 1743 | 651251 | ZED 100 | 20N | 14E | 25 | NE |
| 1744 | 651252 | ZED 101 | 20N | 15E | 30 | NW |
| 1745 | 651253 | ZED 102 | 20N | 13E | 26 | SW |
| | |
| Arctic Project | Page 465 |
| S-K 1300 Technical Report Summary | November 30, 2022 |
| | |
| | |
| | |
| 1746 | 651254 | ZED 103 | 20N | 13E | 26 | SE |
| 1747 | 651255 | ZED 104 | 20N | 13E | 25 | SW |
| 1748 | 651256 | ZED 105 | 20N | 13E | 25 | SE |
| 1749 | 651257 | ZED 106 | 20N | 14E | 30 | SW |
| 1750 | 651258 | ZED 107 | 20N | 14E | 30 | SE |
| 1751 | 651259 | ZED 108 | 20N | 14E | 29 | SW |
| 1752 | 651260 | ZED 109 | 20N | 14E | 29 | SE |
| 1753 | 651261 | ZED 110 | 20N | 14E | 28 | SW |
| 1754 | 651262 | ZED 111 | 20N | 14E | 28 | SE |
| 1755 | 651263 | ZED 112 | 20N | 14E | 27 | SW |
| 1756 | 651264 | ZED 113 | 20N | 14E | 27 | SE |
| 1757 | 651265 | ZED 114 | 20N | 14E | 26 | SW |
| 1758 | 651266 | ZED 115 | 20N | 14E | 26 | SE |
| 1759 | 651267 | ZED 116 | 20N | 14E | 25 | SW |
| 1760 | 651268 | ZED 117 | 20N | 14E | 25 | SE |
| 1761 | 651269 | ZED 118 | 20N | 15E | 30 | SW |
| 1762 | 651270 | PAL 1 | 21N | 10E | 25 | NE |
| 1763 | 651271 | PAL 2 | 21N | 10E | 25 | NE |
| 1764 | 651272 | PAL 3 | 21N | 11E | 30 | NW |
| 1765 | 651273 | PAL 4 | 21N | 11E | 30 | NW |
| 1766 | 651274 | PAL 5 | 21N | 11E | 30 | NE |
| 1767 | 651275 | PAL 6 | 21N | 11E | 30 | NE |
| 1768 | 651276 | PAL 7 | 21N | 11E | 29 | NW |
| 1769 | 651277 | PAL 8 | 21N | 11E | 29 | NW |
| 1770 | 651278 | PAL 9 | 21N | 11E | 29 | NE |
| 1771 | 651279 | PAL 10 | 21N | 11E | 29 | NE |
| 1772 | 651280 | PAL 11 | 21N | 11E | 28 | NW |
| 1773 | 651289 | PAL 20 | 21N | 10E | 25 | SE |
| 1774 | 651290 | PAL 21 | 21N | 11E | 30 | SW |
| 1775 | 651291 | PAL 22 | 21N | 11E | 30 | SE |
| 1776 | 651292 | PAL 23 | 21N | 11E | 29 | SW |
| 1777 | 651293 | PAL 24 | 21N | 11E | 29 | SE |
| 1778 | 651294 | PAL 25 | 21N | 11E | 28 | SW |
| 1779 | 651296 | PAL 27 | 21N | 11E | 32 | NE |
| 1780 | 651297 | PAL 28 | 21N | 11E | 33 | NW |
| 1781 | 651299 | GAP 1 | 22N | 8E | 28 | NW |
| 1782 | 651300 | GAP 2 | 22N | 8E | 28 | NE |
| 1783 | 651301 | GAP 3 | 22N | 8E | 27 | NW |
| 1784 | 651302 | GAP 4 | 22N | 8E | 27 | NE |
| 1785 | 651303 | GAP 5 | 22N | 8E | 26 | NW |
| 1786 | 651304 | GAP 6 | 22N | 8E | 26 | NE |
| 1787 | 651305 | GAP 7 | 22N | 8E | 25 | NW |
| 1788 | 651306 | GAP 8 | 22N | 8E | 25 | NE |
| 1789 | 651307 | GAP 9 | 22N | 9E | 30 | NW |
| | |
| Arctic Project | Page 466 |
| S-K 1300 Technical Report Summary | November 30, 2022 |
| | |
| | |
| | |
| 1790 | 651308 | GAP 10 | 22N | 9E | 30 | NE |
| 1791 | 651309 | GAP 11 | 22N | 9E | 29 | NW |
| 1792 | 651310 | GAP 12 | 22N | 8E | 28 | SW |
| 1793 | 651311 | GAP 13 | 22N | 8E | 28 | SE |
| 1794 | 651312 | GAP 14 | 22N | 8E | 27 | SW |
| 1795 | 651313 | GAP 15 | 22N | 8E | 27 | SE |
| 1796 | 651314 | GAP 16 | 22N | 8E | 26 | SW |
| 1797 | 651315 | GAP 17 | 22N | 8E | 26 | SE |
| 1798 | 651316 | GAP 18 | 22N | 8E | 25 | SW |
| 1799 | 651317 | GAP 19 | 22N | 8E | 25 | SE |
| 1800 | 651318 | GAP 20 | 22N | 9E | 30 | SW |
| 1801 | 651319 | GAP 21 | 22N | 9E | 30 | SE |
| 1802 | 651320 | GAP 22 | 22N | 9E | 29 | SW |
| 1803 | 651321 | GAP 23 | 22N | 9E | 29 | SE |
| 1804 | 651322 | GAP 24 | 22N | 9E | 28 | SW |
| 1805 | 651323 | GAP 25 | 22N | 9E | 28 | SE |
| 1806 | 651324 | GAP 26 | 22N | 9E | 27 | SW |
| 1807 | 651325 | GAP 27 | 22N | 8E | 34 | NE |
| 1808 | 651326 | GAP 28 | 22N | 8E | 35 | NW |
| 1809 | 651327 | GAP 29 | 22N | 8E | 35 | NE |
| 1810 | 651328 | GAP 30 | 22N | 8E | 36 | NW |
| 1811 | 651329 | GAP 31 | 22N | 8E | 36 | NE |
| 1812 | 651330 | GAP 32 | 22N | 9E | 31 | NW |
| 1813 | 651331 | GAP 33 | 22N | 9E | 31 | NE |
| 1814 | 651332 | GAP 34 | 22N | 9E | 32 | NW |
| 1815 | 651333 | GAP 35 | 22N | 9E | 32 | NE |
| 1816 | 651334 | GAP 36 | 22N | 9E | 33 | NW |
| 1817 | 651335 | GAP 37 | 22N | 9E | 33 | NE |
| 1818 | 651336 | GAP 38 | 22N | 9E | 34 | NW |
| 1819 | 651337 | GAP 39 | 22N | 9E | 34 | NE |
| 1820 | 651338 | GAP 40 | 22N | 9E | 35 | NW |
| 1821 | 651339 | GAP 41 | 22N | 9E | 35 | NE |
| 1822 | 651340 | GAP 42 | 22N | 9E | 36 | NW |
| 1823 | 651341 | GAP 43 | 22N | 9E | 36 | NE |
| 1824 | 651342 | GAP 44 | 22N | 10E | 31 | NW |
| 1825 | 651343 | GAP 45 | 22N | 10E | 31 | NE |
| 1826 | 651344 | GAP 46 | 22N | 10E | 32 | NW |
| 1827 | 651345 | GAP 47 | 22N | 10E | 32 | NE |
| 1828 | 651346 | GAP 48 | 22N | 10E | 33 | NW |
| 1829 | 651347 | GAP 49 | 22N | 10E | 33 | NE |
| 1830 | 651348 | GAP 50 | 22N | 10E | 34 | NW |
| 1831 | 651349 | GAP 51 | 22N | 10E | 30 | SW |
| 1832 | 651350 | GAP 52 | 22N | 10E | 30 | SE |
| 1833 | 651351 | GAP 53 | 22N | 10E | 29 | SW |
| | |
| Arctic Project | Page 467 |
| S-K 1300 Technical Report Summary | November 30, 2022 |
| | |
| | |
| | |
| 1834 | 651352 | GAP 54 | 22N | 10E | 29 | SE |
| 1835 | 651353 | GAP 55 | 22N | 10E | 28 | SW |
| 1836 | 651354 | GAP 56 | 22N | 10E | 28 | SE |
| 1837 | 651355 | GAP 57 | 22N | 10E | 27 | SW |
| 1838 | 651356 | GAP 58 | 22N | 8E | 34 | SE |
| 1839 | 651357 | GAP 59 | 22N | 8E | 35 | SW |
| 1840 | 651358 | GAP 60 | 22N | 8E | 35 | SE |
| 1841 | 651359 | GAP 61 | 22N | 8E | 36 | SW |
| 1842 | 651360 | GAP 62 | 22N | 8E | 36 | SE |
| 1843 | 651361 | GAP 63 | 22N | 9E | 31 | SW |
| 1844 | 651362 | GAP 64 | 22N | 9E | 31 | SE |
| 1845 | 651363 | GAP 65 | 22N | 9E | 32 | SW |
| 1846 | 651364 | GAP 66 | 22N | 9E | 32 | SE |
| 1847 | 651365 | GAP 67 | 22N | 9E | 33 | SW |
| 1848 | 651366 | GAP 68 | 22N | 9E | 33 | SE |
| 1849 | 651367 | GAP 69 | 22N | 9E | 34 | SW |
| 1850 | 651368 | GAP 70 | 22N | 9E | 34 | SE |
| 1851 | 651369 | GAP 71 | 22N | 9E | 35 | SW |
| 1852 | 651370 | GAP 72 | 22N | 9E | 35 | SE |
| 1853 | 651371 | GAP 73 | 22N | 9E | 36 | SW |
| 1854 | 651372 | GAP 74 | 22N | 9E | 36 | SE |
| 1855 | 651373 | GAP 75 | 22N | 10E | 31 | SW |
| 1856 | 651374 | GAP 76 | 22N | 10E | 31 | SE |
| 1857 | 651375 | GAP 77 | 22N | 10E | 32 | SW |
| 1858 | 651376 | GAP 78 | 22N | 10E | 32 | SE |
| 1859 | 651377 | GAP 79 | 22N | 10E | 33 | SW |
| 1860 | 651378 | GAP 80 | 22N | 10E | 33 | SE |
| 1861 | 651379 | GAP 81 | 22N | 10E | 34 | SW |
| 1862 | 651380 | GAP 82 | 21N | 8E | 3 | NE |
| 1863 | 651381 | GAP 83 | 21N | 8E | 2 | NW |
| 1864 | 651382 | GAP 84 | 21N | 8E | 2 | NE |
| 1865 | 651383 | GAP 85 | 21N | 8E | 1 | NW |
| 1866 | 651384 | GAP 86 | 21N | 8E | 1 | NE |
| 1867 | 651385 | GAP 87 | 21N | 9E | 6 | NW |
| 1868 | 651386 | GAP 88 | 21N | 9E | 6 | NE |
| 1869 | 651387 | GAP 89 | 21N | 9E | 2 | NW |
| 1870 | 651388 | GAP 90 | 21N | 9E | 2 | NE |
| 1871 | 651389 | GAP 91 | 21N | 9E | 1 | NW |
| 1872 | 651390 | GAP 92 | 21N | 9E | 1 | NE |
| 1873 | 651391 | GAP 93 | 21N | 10E | 6 | NW |
| 1874 | 651392 | GAP 94 | 21N | 10E | 6 | NE |
| 1875 | 651393 | GAP 95 | 21N | 10E | 5 | NW |
| 1876 | 651394 | GAP 96 | 21N | 10E | 5 | NE |
| 1877 | 651395 | GAP 97 | 21N | 10E | 4 | NW |
| | |
| Arctic Project | Page 468 |
| S-K 1300 Technical Report Summary | November 30, 2022 |
| | |
| | |
| | |
| 1878 | 651396 | GAP 98 | 21N | 10E | 4 | NE |
| 1879 | 651397 | GAP 99 | 21N | 10E | 3 | NW |
| 1880 | 651398 | GAP 100 | 21N | 9E | 2 | SW |
| 1881 | 651399 | GAP 101 | 21N | 9E | 2 | SE |
| 1882 | 651400 | GAP 102 | 21N | 9E | 1 | SW |
| 1883 | 651401 | GAP 103 | 21N | 9E | 1 | SE |
| 1884 | 651402 | GAP 104 | 21N | 10E | 6 | SW |
| 1885 | 651403 | GAP 105 | 21N | 10E | 6 | SE |
| 1886 | 651404 | GAP 106 | 21N | 10E | 5 | SW |
| 1887 | 651405 | GAP 107 | 21N | 10E | 5 | SE |
| 1888 | 651406 | GAP 108 | 21N | 10E | 4 | SW |
| 1889 | 651407 | GAP 109 | 21N | 10E | 4 | SE |
| 1890 | 651408 | GAP 110 | 21N | 10E | 3 | SW |
| 1891 | 651409 | GAP 111 | 21N | 10E | 3 | SE |
| 1892 | 651410 | GAP 112 | 21N | 10E | 2 | SW |
| 1893 | 651411 | GAP 113 | 21N | 10E | 2 | SE |
| 1894 | 651412 | GAP 114 | 21N | 9E | 11 | NW |
| 1895 | 651413 | GAP 115 | 21N | 9E | 11 | NW |
| 1896 | 651414 | GAP 116 | 21N | 9E | 11 | NE |
| 1897 | 651415 | GAP 117 | 21N | 9E | 11 | NE |
| 1898 | 651416 | GAP 118 | 21N | 9E | 12 | NW |
| 1899 | 651417 | GAP 119 | 21N | 9E | 12 | NW |
| 1900 | 651418 | GAP 120 | 21N | 9E | 12 | NE |
| 1901 | 651419 | GAP 121 | 21N | 9E | 12 | NE |
| 1902 | 651420 | GAP 122 | 21N | 10E | 7 | NW |
| 1903 | 651421 | GAP 123 | 21N | 10E | 7 | NW |
| 1904 | 651422 | GAP 124 | 21N | 10E | 7 | NE |
| 1905 | 651423 | GAP 125 | 21N | 10E | 7 | NE |
| 1906 | 651424 | GAP 126 | 21N | 10E | 8 | NW |
| 1907 | 651425 | GAP 127 | 21N | 10E | 8 | NW |
| 1908 | 651426 | GAP 128 | 21N | 10E | 8 | NE |
| 1909 | 651427 | GAP 129 | 21N | 10E | 8 | NE |
| 1910 | 651428 | GAP 130 | 21N | 10E | 9 | NW |
| 1911 | 651429 | GAP 131 | 21N | 10E | 9 | NW |
| 1912 | 651430 | GAP 132 | 21N | 10E | 9 | NE |
| 1913 | 651431 | GAP 133 | 21N | 10E | 9 | NE |
| 1914 | 651432 | GAP 134 | 21N | 10E | 10 | NW |
| 1915 | 651433 | GAP 135 | 21N | 10E | 10 | NW |
| 1916 | 651434 | GAP 136 | 21N | 10E | 10 | NE |
| 1917 | 651435 | GAP 137 | 21N | 10E | 10 | NE |
| 1918 | 651436 | GAP 138 | 21N | 10E | 11 | NW |
| 1919 | 651437 | GAP 139 | 21N | 10E | 11 | NW |
| 1920 | 651438 | GAP 140 | 21N | 10E | 11 | NE |
| 1921 | 651439 | GAP 141 | 21N | 10E | 11 | NE |
| | |
| Arctic Project | Page 469 |
| S-K 1300 Technical Report Summary | November 30, 2022 |
| | |
| | |
| | |
| 1922 | 651440 | GAP 142 | 21N | 9E | 5 | NW |
| 1923 | 651441 | GAP 143 | 21N | 9E | 5 | NE |
| 1924 | 651442 | GAP 144 | 21N | 9E | 4 | NW |
| 1925 | 651443 | GAP 145 | 21N | 9E | 4 | NE |
| 1926 | 651444 | GAP 146 | 21N | 9E | 3 | NW |
| 1927 | 651445 | GAP 147 | 21N | 9E | 3 | NE |
| 1928 | 651446 | GAP 148 | 21N | 8E | 3 | SE |
| 1929 | 651447 | GAP 149 | 21N | 8E | 2 | SW |
| 1930 | 651448 | GAP 150 | 21N | 8E | 2 | SE |
| 1931 | 651449 | GAP 151 | 21N | 8E | 1 | SW |
| 1932 | 651450 | GAP 152 | 21N | 8E | 1 | SE |
| 1933 | 651451 | GAP 153 | 21N | 9E | 6 | SW |
| 1934 | 651452 | GAP 154 | 21N | 9E | 6 | SE |
| 1935 | 651453 | GAP 155 | 21N | 9E | 5 | SW |
| 1936 | 651454 | GAP 156 | 21N | 9E | 5 | SE |
| 1937 | 651455 | GAP 157 | 21N | 9E | 4 | SW |
| 1938 | 651456 | GAP 158 | 21N | 9E | 4 | SE |
| 1939 | 651457 | GAP 159 | 21N | 9E | 3 | SW |
| 1940 | 651458 | GAP 160 | 21N | 9E | 3 | SE |
| 1941 | 651459 | GAP 161 | 21N | 8E | 10 | NE |
| 1942 | 651460 | GAP 162 | 21N | 8E | 11 | NW |
| 1943 | 651461 | GAP 163 | 21N | 8E | 11 | NE |
| 1944 | 651462 | GAP 164 | 21N | 8E | 12 | NW |
| 1945 | 651463 | GAP 165 | 21N | 8E | 12 | NE |
| 1946 | 651464 | GAP 166 | 21N | 9E | 7 | NW |
| 1947 | 651465 | GAP 167 | 21N | 9E | 7 | NE |
| 1948 | 651466 | GAP 168 | 21N | 9E | 8 | NW |
| 1949 | 651467 | GAP 169 | 21N | 9E | 8 | NE |
| 1950 | 651468 | GAP 170 | 21N | 9E | 9 | NW |
| 1951 | 651469 | GAP 171 | 21N | 9E | 9 | NE |
| 1952 | 651470 | GAP 172 | 21N | 9E | 10 | NW |
| 1953 | 651471 | GAP 173 | 21N | 9E | 10 | NE |
| 1954 | 651472 | GAP 174 | 21N | 8E | 10 | SE |
| 1955 | 651473 | GAP 175 | 21N | 8E | 11 | SW |
| 1956 | 651474 | GAP 176 | 21N | 8E | 11 | SE |
| 1957 | 651475 | GAP 177 | 21N | 8E | 12 | SW |
| 1958 | 651476 | GAP 178 | 21N | 8E | 12 | SE |
| 1959 | 651477 | GAP 179 | 21N | 9E | 7 | SW |
| 1960 | 651478 | GAP 180 | 21N | 9E | 7 | SE |
| 1961 | 651479 | GAP 181 | 21N | 9E | 8 | SW |
| 1962 | 651480 | GAP 182 | 21N | 9E | 8 | SE |
| 1963 | 651481 | GAP 183 | 21N | 9E | 9 | SW |
| 1964 | 651482 | GAP 184 | 21N | 9E | 9 | SE |
| 1965 | 651483 | GAP 185 | 21N | 9E | 10 | SW |
| | |
| Arctic Project | Page 470 |
| S-K 1300 Technical Report Summary | November 30, 2022 |
| | |
| | |
| | |
| 1966 | 651484 | GAP 186 | 21N | 9E | 10 | SE |
| 1967 | 651485 | GAP 187 | 21N | 8E | 15 | NE |
| 1968 | 651486 | GAP 188 | 21N | 8E | 14 | NW |
| 1969 | 651487 | GAP 189 | 21N | 8E | 14 | NE |
| 1970 | 651488 | GAP 190 | 21N | 8E | 13 | NW |
| 1971 | 651489 | GAP 191 | 21N | 8E | 13 | NE |
| 1972 | 651490 | GAP 192 | 21N | 9E | 18 | NW |
| 1973 | 651491 | GAP 193 | 21N | 9E | 18 | NE |
| 1974 | 651492 | GAP 194 | 21N | 9E | 17 | NW |
| 1975 | 651493 | GAP 195 | 21N | 9E | 17 | NE |
| 1976 | 651494 | GAP 196 | 21N | 9E | 16 | NW |
| 1977 | 651495 | GAP 197 | 21N | 9E | 16 | NE |
| 1978 | 651496 | GAP 198 | 21N | 9E | 15 | NW |
| 1979 | 651497 | GAP 199 | 21N | 9E | 15 | NE |
| 1980 | 655537 | ZED 119 | 20N | 12E | 12 | NW |
| 1981 | 655538 | ZED 120 | 20N | 12E | 12 | NE |
| 1982 | 655539 | ZED 121 | 20N | 13E | 7 | NW |
| 1983 | 655540 | ZED 122 | 20N | 13E | 7 | SW |
| 1984 | 655541 | ZED 123 | 20N | 13E | 7 | SE |
| 1985 | 655542 | ZED 124 | 20N | 13E | 8 | SW |
| 1986 | 655543 | ZED 125 | 20N | 13E | 8 | SE |
| 1987 | 655648 | KG 1 | 21N | 11E | 11 | SW |
| 1988 | 655649 | KG 2 | 21N | 11E | 11 | SE |
| 1989 | 655650 | KG 3 | 21N | 11E | 14 | NW |
| 1990 | 655651 | KG 4 | 21N | 11E | 14 | NE |
| 1991 | 655652 | KG 5 | 21N | 11E | 13 | NW |
| 1992 | 655653 | KG 6 | 21N | 11E | 13 | NE |
| 1993 | 655654 | KG 7 | 21N | 11E | 13 | SE |
| 1994 | 655655 | KG 8 | 21N | 11E | 24 | NE |
| 1995 | 714584 | East DH 1 | 22N | 10E | 15 | SE |
| 1996 | 714585 | East DH 2 | 22N | 10E | 22 | NE |
| 1997 | 714586 | East DH 3 | 22N | 10E | 23 | NW |
| 1998 | 714587 | East DH 4 | 22N | 10E | 22 | SE |
| 1999 | 714588 | East DH 5 | 22N | 10E | 23 | SW |
| 2000 | 714589 | COBRE 1 | 22N | 7E | 2 | NW |
| 2001 | 714590 | COBRE 2 | 22N | 7E | 2 | NE |
| 2002 | 714591 | COBRE 3 | 22N | 7E | 1 | NW |
| 2003 | 714592 | COBRE 4 | 22N | 7E | 1 | NE |
| 2004 | 714593 | COBRE 5 | 22N | 8E | 6 | NW |
| 2005 | 714594 | COBRE 6 | 22N | 8E | 6 | NE |
| 2006 | 714595 | COBRE 7 | 22N | 8E | 5 | NW |
| 2007 | 714596 | COBRE 8 | 22N | 8E | 5 | NE |
| 2008 | 714597 | COBRE 9 | 22N | 7E | 2 | SW |
| 2009 | 714598 | COBRE 10 | 22N | 7E | 2 | SE |
| | |
| Arctic Project | Page 471 |
| S-K 1300 Technical Report Summary | November 30, 2022 |
| | |
| | |
| | |
| 2010 | 714599 | COBRE 11 | 22N | 7E | 1 | SW |
| 2011 | 714600 | COBRE 12 | 22N | 7E | 1 | SE |
| 2012 | 714601 | COBRE 13 | 22N | 8E | 6 | SW |
| 2013 | 714602 | COBRE 14 | 22N | 8E | 6 | SE |
| 2014 | 714603 | COBRE 15 | 22N | 8E | 5 | SW |
| 2015 | 714604 | COBRE 16 | 22N | 8E | 5 | SE |
| 2016 | 714605 | COBRE 17 | 22N | 7E | 11 | NW |
| 2017 | 714606 | COBRE 18 | 22N | 7E | 11 | NE |
| 2018 | 714607 | COBRE 19 | 22N | 7E | 12 | NW |
| 2019 | 714608 | COBRE 20 | 22N | 7E | 12 | NE |
| 2020 | 714609 | COBRE 21 | 22N | 8E | 7 | NW |
| 2021 | 714610 | COBRE 22 | 22N | 8E | 7 | NE |
| 2022 | 714611 | COBRE 23 | 22N | 8E | 8 | NW |
| 2023 | 714612 | COBRE 24 | 22N | 8E | 8 | NE |
| 2024 | 714613 | COBRE 25 | 22N | 8E | 9 | NW |
| 2025 | 714614 | COBRE 26 | 22N | 8E | 9 | NE |
| 2026 | 714615 | COBRE 27 | 22N | 8E | 7 | SE |
| 2027 | 714616 | COBRE 28 | 22N | 8E | 8 | SW |
| 2028 | 714617 | COBRE 29 | 22N | 8E | 8 | SE |
| 2029 | 714618 | COBRE 30 | 22N | 8E | 9 | SW |
| 2030 | 714619 | COBRE 31 | 22N | 8E | 9 | SE |
| 2031 | 714620 | COBRE 32 | 22N | 8E | 17 | NW |
| 2032 | 714621 | COBRE 33 | 22N | 8E | 17 | NE |
| 2033 | 714622 | COBRE 34 | 22N | 8E | 16 | NW |
| 2034 | 714623 | COBRE 35 | 22N | 8E | 16 | NE |
| 2035 | 714624 | COBRE 36 | 22N | 8E | 15 | NW |
| 2036 | 714625 | COBRE 37 | 22N | 8E | 15 | NE |
| 2037 | 714626 | COBRE 38 | 22N | 8E | 17 | SE |
| 2038 | 714627 | COBRE 39 | 22N | 8E | 16 | SW |
| 2039 | 714628 | COBRE 40 | 22N | 8E | 16 | SE |
| 2040 | 714629 | COBRE 41 | 22N | 8E | 15 | SW |
| 2041 | 714630 | COBRE 42 | 22N | 8E | 15 | SE |
| 2042 | 714631 | COBRE 43 | 22N | 8E | 21 | NW |
| 2043 | 714632 | COBRE 44 | 22N | 8E | 21 | NE |
| 2044 | 714633 | COBRE 45 | 22N | 8E | 22 | NW |
| 2045 | 714634 | COBRE 46 | 22N | 8E | 22 | NE |
| 2046 | 714635 | COBRE 47 | 22N | 8E | 23 | NW |
| 2047 | 714636 | COBRE 48 | 22N | 8E | 23 | NE |
| 2048 | 714637 | COBRE 49 | 22N | 8E | 21 | SW |
| 2049 | 714638 | COBRE 50 | 22N | 8E | 21 | SE |
| 2050 | 714639 | COBRE 51 | 22N | 8E | 22 | SW |
| 2051 | 714640 | COBRE 52 | 22N | 8E | 22 | SE |
| 2052 | 714641 | COBRE 53 | 22N | 8E | 23 | SW |
| 2053 | 714642 | COBRE 54 | 22N | 8E | 23 | SE |
| | |
| Arctic Project | Page 472 |
| S-K 1300 Technical Report Summary | November 30, 2022 |
| | |
| | |
| | |
| 2054 | 714643 | West Horse 1 | 22N | 9E | 12 | SW |
| 2055 | 714644 | West Horse 2 | 22N | 9E | 12 | SE |
| 2056 | 714645 | West Horse 3 | 22N | 10E | 7 | SW |
| 2057 | 714646 | West Horse 4 | 22N | 10E | 7 | SE |
| 2058 | 714647 | West Horse 5 | 22N | 10E | 8 | SW |
| 2059 | 714648 | West Horse 6 | 22N | 9E | 13 | NW |
| 2060 | 714649 | West Horse 7 | 22N | 9E | 13 | NE |
| 2061 | 714650 | West Horse 8 | 22N | 9E | 13 | SW |
| 2062 | 714651 | West Horse 9 | 22N | 9E | 13 | SE |
| 2063 | 714652 | West Horse 10 | 22N | 9E | 24 | NW |
| 2064 | 714653 | West Horse 11 | 22N | 9E | 24 | NE |
| 2065 | 714654 | West Horse 12 | 22N | 9E | 24 | SW |
| 2066 | 714655 | West Horse 13 | 22N | 9E | 24 | SE |
| 2067 | 714656 | West Horse 14 | 22N | 9E | 27 | NE |
| 2068 | 714657 | West Horse 15 | 22N | 9E | 26 | NW |
| 2069 | 714658 | West Horse 16 | 22N | 9E | 26 | NE |
| 2070 | 714659 | West Horse 17 | 22N | 9E | 25 | NW |
| 2071 | 714660 | West Horse 18 | 22N | 9E | 25 | NE |
| 2072 | 714661 | West Horse 19 | 22N | 9E | 27 | SE |
| 2073 | 714662 | West Horse 20 | 22N | 9E | 26 | SW |
| 2074 | 714663 | West Horse 21 | 22N | 9E | 26 | SE |
| 2075 | 714664 | West Horse 22 | 22N | 9E | 25 | SW |
| 2076 | 714665 | West Horse 23 | 22N | 9E | 25 | SE |
| 2077 | 714748 | AM 37-225 | 20N | 12E | 16 | SW |
| 2078 | 714749 | AM 38-225 | 20N | 12E | 16 | SW |
| 2079 | 714750 | AM 39-225 | 20N | 12E | 16 | NW |
| 2080 | 714751 | AM 40-225 | 20N | 12E | 16 | NW |
| 2081 | 714752 | AM 41-223 | 20N | 12E | 8 | SE |
| 2082 | 714753 | AM 41-224 | 20N | 12E | 8 | SE |
| 2083 | 714754 | AM 43-219 | 20N | 12E | 7 | NE |
| 2084 | 714755 | AM 43-220 | 20N | 12E | 7 | NE |
| 2085 | 714756 | AM 38-217 | 20N | 12E | 18 | SW |
| | |
| Arctic Project | Page 473 |
| S-K 1300 Technical Report Summary | November 30, 2022 |
| | |
| | |
| | |
| 2086 | 714757 | AM 38-219 | 20N | 12E | 18 | SE |
| 2087 | 714758 | AM 38-221 | 20N | 12E | 17 | SW |
| 2088 | 714759 | AM 38-223 | 20N | 12E | 17 | SE |
| 2089 | 714760 | AM 42-219 | 20N | 12E | 7 | SE |
| 2090 | 714761 | AM 42-221 | 20N | 12E | 8 | SW |
| 2091 | 714762 | AM 44-217 | 20N | 12E | 7 | NW |
| 2092 | 714763 | AM 40-217 | 20N | 12E | 18 | NW |
| 2093 | 714764 | AM 40-219 | 20N | 12E | 18 | NE |
| 2094 | 714765 | AM 40-221 | 20N | 12E | 17 | NW |
| 2095 | 714766 | AM 40-223 | 20N | 12E | 17 | NE |
| 2096 | 714767 | AM 42-217 | 20N | 12E | 7 | SW |
| 2097 | 714768 | KG 9 | 21N | 12E | 19 | NW |
| 2098 | 714769 | KG 10 | 21N | 12E | 19 | NE |
| 2099 | 714770 | KG 11 | 21N | 12E | 19 | SW |
| 2100 | 714771 | KG 12 | 21N | 12E | 19 | SE |
| 2101 | 715147 | Cobre 55 | 23N | 7E | 14 | SW |
| 2102 | 715148 | Cobre 56 | 23N | 7E | 14 | SE |
| 2103 | 715149 | Cobre 57 | 23N | 7E | 13 | SW |
| 2104 | 715150 | Cobre 58 | 23N | 7E | 23 | NW |
| 2105 | 715151 | Cobre 59 | 23N | 7E | 23 | NE |
| 2106 | 715152 | Cobre 60 | 23N | 7E | 24 | NW |
| 2107 | 715153 | Cobre 61 | 23N | 7E | 24 | NE |
| 2108 | 715154 | Cobre 62 | 23N | 8E | 19 | NW |
| 2109 | 715155 | Cobre 63 | 23N | 7E | 23 | SE |
| 2110 | 715156 | Cobre 64 | 23N | 7E | 24 | SW |
| 2111 | 715157 | Cobre 65 | 23N | 7E | 24 | SE |
| 2112 | 715158 | Cobre 66 | 23N | 8E | 19 | SW |
| 2113 | 715159 | Cobre 67 | 23N | 8E | 19 | SE |
| 2114 | 715160 | Cobre 68 | 23N | 7E | 26 | NE |
| 2115 | 715161 | Cobre 69 | 23N | 7E | 25 | NW |
| 2116 | 715162 | Cobre 70 | 23N | 7E | 25 | NE |
| 2117 | 715163 | Cobre 71 | 23N | 8E | 30 | NW |
| 2118 | 715164 | Cobre 72 | 23N | 8E | 30 | NE |
| 2119 | 715165 | Cobre 73 | 23N | 8E | 29 | NW |
| 2120 | 715166 | Cobre 74 | 23N | 8E | 29 | NE |
| 2121 | 715167 | Cobre 75 | 23N | 7E | 26 | SE |
| 2122 | 715168 | Cobre 76 | 23N | 7E | 25 | SW |
| 2123 | 715169 | Cobre 77 | 23N | 7E | 25 | SE |
| 2124 | 715170 | Cobre 78 | 23N | 8E | 30 | SW |
| 2125 | 715171 | Cobre 79 | 23N | 8E | 30 | SE |
| 2126 | 715172 | Cobre 80 | 23N | 8E | 29 | SW |
| 2127 | 715173 | Cobre 81 | 23N | 8E | 29 | SE |
| 2128 | 715174 | Cobre 82 | 23N | 7E | 36 | NW |
| 2129 | 715175 | Cobre 83 | 23N | 7E | 36 | NE |
| | |
| Arctic Project | Page 474 |
| S-K 1300 Technical Report Summary | November 30, 2022 |
| | |
| 2130 | 715176 | Cobre 84 | 23N | 8E | 31 | NW |
| 2131 | 715177 | Cobre 85 | 23N | 8E | 31 | NE |
| 2132 | 715178 | Cobre 86 | 23N | 8E | 32 | NW |
| 2133 | 715179 | Cobre 87 | 23N | 8E | 32 | NE |
| 2134 | 715180 | Cobre 88 | 23N | 8E | 31 | SE |
| 2135 | 715181 | Cobre 89 | 23N | 8E | 32 | SW |
| 2136 | 715182 | Cobre 90 | 23N | 8E | 32 | SE |
| | |
| Arctic Project | Page 475 |
| S-K 1300 Technical Report Summary | November 30, 2022 |
| | |
Date and Signature Page
This technical report summary (the TRS), entitled “Technical Report Summary on the Arctic Project, Ambler Mining District, Alaska” is current as at November 30, 2022 and has been prepared by:
Qualified Person or
Consulting Firm | Responsible for the following
sections | Signature | Date |
| Ausenco Engineering Canada Ltd | 1.1, 1.3, 1.4, 1.9, 1.13, 1.14.1, 1.14.2, 1.14.3, 1.14.4, 1.15, 1.17, 1.18, 1.19, 1.20.8, 1.20.9, 1.20.10, 2, 3.1, 3.2, 3.10, 4, 5.3.8, 10, 14, 15.1, 15.2, 15.3, 15.4, 15.5, 15.6, 15.7, 15.10.8, 15.12, 15.13, 15.14, 15.15, 15.16, 16, 18.1.1, 18.1.2, 18.1.3, 18.1.4, 18.1.5, 18.1.7, 18.1.9, 18.1.10, 18.1.11, 18.1.12, 18.1.13, 18.1.14, 18.2.1, 18.2.3, 18.2.4, 18.2.5, 18.2.6, 19, 21, 22.1, 22.2, 22.5, 22.9, 22.10, 22.12, 22.13, 22.14, 22.15, 22.16, 22.17.8, 22.17.9, 23.1, 23.9, 23.10, 23.11, 24, 25.1, 25.3, 25.5 | “signed” | Feb 13, 2023 |
| Brown & Caldwell | 1.14.9, 1.20.7, 2.3, 15.9, 17.3.4, 17.3.6.2, 18.1.9.1, 18.2.6, 23.8, 25.2 | “signed” | Feb 13, 2023 |
| SRK Consulting (Canada) Inc. | 1.14.6, 1.14.7, 1.14.8, 1.16.3, 1.20.3, 1.20.4, 1.20.5, 1.20.6, 2.3, 2.4, 3.7, 3.8, 3.9, 3.10, 5.3.7, 7.2.4, 8.1.2, 8.2.5, 13.9, 13.10.1, 13.11, 15.8, 15.10.1, 15.10.2, 15.10.3, 15.10.4, 15.10.5, 15.10.6, 15.10.7, 15.11, 17.3.1, 17.3.2, 17.3.3, 17.3.5, 17.6, 22.17.3, 22.17.4, 22.17.5, 22.17.6, 22.17.7, 23.4, 23.5, 23.6, 23.7, 25.2, 25.4 | “signed” | Feb 13, 2023 |
| Wood Canada Limited | 1.2.1, 1.5, 1.6, 1.7, 1.8, 1.10, 1.11, 1.12, 1.14.5, 1.20.1, 1.20.2, 2.3, 2.4, 2.5, 2.6, 3.3, 3.4, 3.5, 3.6, 3.10, 6, 7.1, 7.2.1, 7.2.2, 7.2.3, 7.2.5, 7.2.6, 7.2.7, 7.2.8, 8.1.1, 8.1.3, 8.1.4, 8.1.5, 8.1.6, 8.2.1, 8.2.2, 8.2.3, 8.2.4, 8.3, 9, 11, 12, 13.1, 13.2, 13.3, 13.4, 13.5, 13.6, 13.7, 13.8, 13.10, 17.1, 17.2, 18.1.6, 18.2.2, 22.2, 22.3, 22.4, 22.6, 22.7, 22.8, 22.17.1, 22.17.2, 23.2, 23.3, 25.2, 25.4, 25.5 | “signed” | Feb 13, 2023 |
| | |
| Arctic Project | Page 476 |
| S-K 1300 Technical Report Summary | November 30, 2022 |
| | |