Exhibit 99.1

TRILOGY METALS INC.
NI 43-101 Technical Report
on the Arctic Project,
Northwest Alaska, USA
| Report Prepared For: | | Trilogy Metals Inc. 609 Granville Street, Suite 1150, Vancouver, BC V7Y 1G5 Canada Tel: 604-638-8088 Fax: 604-638-0644 www.trilogymetals.com |
| | | |
| Report Prepared By: | | BD Resource Consulting, Inc. 4253 Cheyenne Drive, Larkspur, CO 80118 USA Tel: 303-694-6546, Email: bdavis@simgeological.com |
| | | |
| | | SIM Geological Inc. 508 – 1950 Robson St., Vancouver, BC V6G 1E8 Canada Tel: 604-979-8254, Email: rsim@simgeological.com |
| | | |
| | | International Metallurgical & Environmental Inc. 906 Fairway Crescent, Kelowna, BC V1Y 4S7 Canada Tel: 250-317-3739, Email: austin@internationalmet.com |
| | | |
| Signed by Qualified Persons: | | Bruce Davis, FAusIMM, BD Resource Consulting, Inc. |
| | | Robert Sim, P.Geo., SIM Geological Inc. |
| | | Jeff Austin, P.Eng., International Metallurgical & Environmental Inc. |
| | | |
| Effective Date: | | April 25, 2017 |
| Release Date: | | November 9, 2017 |
Trilogy Metals Inc.NI 43-101 Technical Report on the Arctic Project,
Northwest Alaska

| 1.0 | Summary | 1-1 |
| | 1.1 | Introduction | 1-1 |
| | 1.2 | Property Description and Location | 1-2 |
| | 1.3 | Geology and Mineralization | 1-2 |
| | 1.4 | Mineral Processing and Metallurgical Testing | 1-3 |
| | 1.5 | Resource Estimate | 1-5 |
| | 1.6 | Interpretations and Conclusions | 1-6 |
| | 1.7 | Opportunities and Recommendations | 1-6 |
| 2.0 | Introduction | 2-1 |
| | 2.1 | Terms of Reference | 2-1 |
| | 2.2 | Units of Measurement | 2-1 |
| | 2.3 | Qualified Persons | 2-1 |
| | 2.4 | Site Visit | 2-2 |
| | 2.5 | Information Sources | 2-2 |
| 3.0 | Reliance on Other Experts | 3-1 |
| 4.0 | Property Description and Location | 4-1 |
| | 4.1 | Location | 4-1 |
| | 4.2 | Mineral Tenure | 4-1 |
| | 4.3 | Royalties, Agreements and Encumbrances | 4-4 |
| | | 4.3.1 | Kennecott Agreements | 4-4 |
| | | 4.3.2 | NANA Agreement | 4-4 |
| | 4.4 | Environmental Liabilities | 4-6 |
| | 4.5 | Permits | 4-6 |
| 5.0 | Accessibility, Climate, Local Resources, Infrastructure and Physiography | 5-1 |
| | 5.1 | Accessibility | 5-1 |
| | | 5.1.1 | Air | 5-1 |
| | | 5.1.2 | Water | 5-1 |
| | | 5.1.3 | Road | 5-1 |
| | 5.2 | Climate | 5-1 |
| | 5.3 | Local Resources | 5-2 |
| | 5.4 | Infrastructure | 5-3 |
| | 5.5 | Physiography | 5-5 |
| 6.0 | History | 6-1 |
| | 6.1 | Prior Ownership and Ownership Changes – Arctic Deposit and the Ambler Lands | 6-2 |
| | 6.2 | Previous Exploration and Development Results – Arctic Deposit | 6-3 |
| | | 6.2.1 | Introduction | 6-3 |
| | | 6.2.2 | Geochemistry | 6-9 |
| | | 6.2.3 | Geophysics | 6-9 |
| | | 6.2.4 | Drilling | 6-10 |
| | | 6.2.5 | Specific Gravity | 6-10 |
| | | 6.2.6 | Petrology, Mineralogy, and Research Studies | 6-10 |
| | | 6.2.7 | Geotechnical, Hydrological and Acid-Base Accounting Studies | 6-11 |
| | | 6.2.8 | Metallurgical Studies | 6-12 |
| | 6.3 | Historical Mineral Resource Estimates | 6-12 |
| | | 6.3.1 | Russell – Kennecott (1975/1976) Resource Estimate | 6-12 |
Trilogy Metals Inc. NI 43-101 Technical Report on the Arctic Project,
Northwest Alaska | i | |
| | | 6.3.2 | Brown – Kennecott (1985) Resource Estimate | 6-13 |
| | | 6.3.3 | Randolph – Kennecott (1990) Resource Estimate | 6-13 |
| | | 6.3.4 | Kennecott (1996) Resource Estimate | 6-13 |
| | | 6.3.5 | SRK (2008) Resource Estimation | 6-14 |
| | | 6.3.6 | SRK (2011) Resource Estimation Update | 6-16 |
| | | 6.3.7 | SRK (2012) Resource Estimation Update | 6-17 |
| | | 6.3.8 | Tetra Tech (2013) RESOURCE ESTIMATION UPDATE | 6-18 |
| | | 6.3.9 | Dead Creek, Sunshine and Horse Cliff Historical Resources | 6-19 |
| | 6.4 | Development Studies | 6-20 |
| | | 6.4.1 | Kennecott Tenure | 6-20 |
| | | 6.4.2 | NovaCopper Tenure | 6-20 |
| 7.0 | Geological setting and mineralization | 7-1 |
| | 7.1 | | Regional Geology – Southern Brooks Range | 7-1 |
| | | 7.1.1 | Terrane Descriptions | 7-1 |
| | | 7.1.2 | Regional Tectonic Setting | 7-3 |
| | 7.2 | Ambler Sequence Geology | 7-4 |
| | | 7.2.1 | General Stratigraphy of the Ambler Sequence | 7-5 |
| | | 7.2.2 | Structural Framework of the Ambler District | 7-9 |
| | 7.3 | Arctic Deposit Geology | 7-10 |
| | | 7.3.1 | Lithologies and Lithologic Domain Descriptions | 7-11 |
| | | 7.3.2 | Structure | 7-13 |
| | | 7.3.3 | Alteration | 7-14 |
| | 7.4 | Arctic Deposit Mineralization | 7-15 |
| | 7.5 | Genesis | 7-16 |
| | 7.6 | Deposits and Prospects | 7-17 |
| 8.0 | Deposit Types | 8-1 |
| 9.0 | Exploration | 9-1 |
| | 9.1 | Grids and Surveys | 9-3 |
| | 9.2 | Geological Mapping | 9-3 |
| | 9.3 | Geochemistry | 9-6 |
| | 9.4 | Geophysics | 9-10 |
| | 9.5 | Bulk Density | 9-11 |
| | 9.6 | Petrology, Mineralogy and Research Studies | 9-11 |
| | 9.7 | Geotechnical, Hydrogeological and Acid Base Accounting Studies | 9-11 |
| | | 9.7.1 | Geotechnical and Hydrogeological Assessments | 9-11 |
| | | 9.7.2 | Acid-Base Accounting Studies | 9-17 |
| | | 9.7.3 | Metallurgical Studies | 9-18 |
| 10.0 | Drilling | 10-1 |
| | 10.1 | Drill Companies | 10-3 |
| | 10.2 | Drill Core Procedures | 10-5 |
| | | 10.2.1 | Kennecott Tenure | 10-5 |
| | | 10.2.2 | NovaGold/Trilogy Metals Tenure | 10-5 |
| | 10.3 | Geotechnical Drill Hole Procedures | 10-6 |
| | 10.4 | Metallurgical Drill Hole Procedures | 10-7 |
| | 10.5 | Collar Surveys | 10-8 |
| | | 10.5.1 | Kennecott Tenure | 10-8 |
| | | 10.5.2 | NovaGold/Trilogy Metals Tenure | 10-8 |
| | 10.6 | Downhole Surveys | 10-9 |
| | 10.7 | Recovery | 10-9 |
| | 10.8 | Drill Intercepts | 10-10 |
| | 10.9 | Drilling at Other Prospects | 10-11 |
Trilogy Metals Inc. NI 43-101 Technical Report on the Arctic Project,
Northwest Alaska | ii | |
| 11.0 | Sample Preparation, Analyses, and Security | 11-1 |
| | 11.1 | Sample Preparation | 11-1 |
| | | 11.1.1 | Core Drilling Sampling | 11-1 |
| | | 11.1.2 | Acid-Base Accounting Sampling | 11-3 |
| | | 11.1.3 | Density Determinations | 11-3 |
| | 11.2 | Security | 11-4 |
| | 11.3 | Assaying and Analytical Procedures | 11-5 |
| | 11.4 | Quality Assurance/Quality Control | 11-6 |
| | | 11.4.1 | Core Drilling Sampling QA/QC | 11-6 |
| | | 11.4.2 | Acid-Base Accounting Sampling QA/QC | 11-16 |
| | | 11.4.3 | Density Determinations QA/QC | 11-16 |
| | 11.5 | Author’s Opinion | 11-19 |
| 12.0 | Data Verification | 12-1 |
| | 12.1 | Drill Hole Collar Verification | 12-1 |
| | 12.2 | Topography Verification | 12-1 |
| | 12.3 | Core Logging Verification | 12-2 |
| | 12.4 | Database Verification | 12-2 |
| | 12.5 | QA/QC Review | 12-2 |
| | 12.6 | QP Opinion | 12-3 |
| 13.0 | Mineral Processing and Metallurgical Testing | 13-1 |
| | 13.1 | Metallurgical Test Work Review | 13-1 |
| | | 13.1.1 | Introduction | 13-1 |
| | | 13.1.2 | Historical Test Work Review | 13-3 |
| | | 13.1.3 | Mineralogical and Metallurgical Test Work – 2012 to 2017 | 13-8 |
| | 13.2 | Recommended Test Work | 13-25 |
| 14.0 | Mineral Resource Estimate | 14-1 |
| | 14.1 | Introduction | 14-1 |
| | 14.2 | Sample Database and Other Available Data | 14-1 |
| | 14.3 | Geologic Model | 14-6 |
| | | 14.3.1 | Summary of Geologic Domains | 14-9 |
| | 14.4 | Compositing | 14-11 |
| | 14.5 | Exploratory Data Analysis | 14-12 |
| | | 14.5.1 | As Logged Geology and Domain Statistics | 14-12 |
| | | 14.5.2 | Interpreted Lithology and MinZone Domain Statistics | 14-14 |
| | | 14.5.3 | Contact Profiles | 14-20 |
| | | 14.5.4 | Modeling Implications | 14-22 |
| | 14.6 | Treatment of Outlier Grades | 14-23 |
| | 14.7 | Specific Gravity Data | 14-24 |
| | 14.8 | Variography | 14-25 |
| | 14.9 | Model Setup and Limits | 14-30 |
| | 14.10 | Interpolation Parameters | 14-31 |
| | 14.11 | Block Model Validation | 14-35 |
| | | 14.11.1 | Visual Inspection | 14-35 |
| | | 14.11.2 | Model Checks for Change of Support | 14-36 |
| | | 14.11.3 | Comparison of Interpolation Methods | 14-38 |
| | | 14.11.4 | Swath Plots (Drift Analysis) | 14-41 |
| | 14.12 | Resource Classification | 14-45 |
| | 14.13 | Mineral Resource Estimate | 14-46 |
| | 14.14 | Grade Sensitivity Analysis | 14-49 |
| | 14.15 | Comparison with the Previous Estimate of Mineral Resources | 14-50 |
Trilogy Metals Inc. NI 43-101 Technical Report on the Arctic Project,
Northwest Alaska | iii | |
| 15.0 | Mineral Reserve Estimates | 15-1 |
| 16.0 | Mining Methods | 16-1 |
| 17.0 | Recovery methods | 17-1 |
| 18.0 | Project InfrastrUcture | 18-1 |
| | 18.1 | Road | 18-1 |
| | 18.2 | Power | 18-2 |
| 19.0 | Market Studies and Contracts | 19-1 |
| 20.0 | Environmental Studies, permitting and social or community Impact | 20-1 |
| | 20.1 | Environmental Studies | 20-1 |
| | | 20.1.1 | Hydrology and Water Quality Data | 20-1 |
| | | 20.1.2 | Wetlands Data | 20-2 |
| | | 20.1.3 | Aquatic Life Data | 20-3 |
| | | 20.1.4 | Subsistence Data | 20-4 |
| | | 20.1.5 | Acid Base Accounting Data | 20-5 |
| | | 20.1.6 | Archaeology | 20-6 |
| | | 20.1.7 | Meteorology | 20-6 |
| | | 20.1.8 | Avian Survey | 20-6 |
| | | 20.1.9 | Additional Baseline Data Requirements | 20-6 |
| | 20.2 | Permitting | 20-7 |
| | | 20.2.1 | Exploration Permits | 20-7 |
| | 20.3 | Social or Community Considerations | 20-8 |
| 21.0 | Capital and Operating Costs | 21-1 |
| 22.0 | Economic Analysis | 22-1 |
| 23.0 | Adjacent Properties | 23-1 |
| | 23.1 | Sun Deposit | 23-2 |
| | 23.2 | Smucker Deposit | 23-3 |
| 24.0 | Other Relevant Data and Information | 24-1 |
| 25.0 | Interpretation and Conclusions | 25-1 |
| | 25.1 | Geotechnical | 25-1 |
| | 25.2 | Hydrogeological | 25-2 |
| | 25.3 | Acid Base Accounting | 25-2 |
| | 25.4 | Mineral Processing and Metallurgical Testing | 25-2 |
| | 25.5 | Resource Estimation | 25-3 |
| | 25.6 | Environmental | 25-4 |
| 26.0 | Recommendations | 26-1 |
| 27.0 | References | 27-1 |
| 28.0 | Certificates of Qualified Persons | 28-1 |
| | 28.1 | Bruce M. Davis, FAusIMM | 28-1 |
| | 28.2 | Robert Sim, P.Geo | 28-3 |
| | 28.3 | Jeff Austin, P.Eng. | 28-5 |
Trilogy Metals Inc. NI 43-101 Technical Report on the Arctic Project,
Northwest Alaska | iv | |
| List of Appendices |
| | |
| Appendix A | List of Claims |
| | |
| Appendix B | Block Model Descriptors |
| List of Tables | |
| | | |
| Table 1-1 | Summary of Overall Metal Recovery – Arctic Project | 1-5 |
| Table 1-2 | Mineral Resource Estimate for the Arctic Project | 1-6 |
| Table 6-1 | Known Mapping, Geochemical, and Geophysical Programs Targeting VMS Prospects in the Ambler Mining District | 6-4 |
| Table 6-2 | Russell 1976 Resource Estimation | 6-12 |
| Table 6-3 | Brown 1985 Resource Estimation | 6-13 |
| Table 6-4 | Historical Resource Estimate | 6-13 |
| Table 6-5 | Kennecott 1996 Resource Estimation | 6-14 |
| Table 6-6 | Drill Hole Assay Statistics – 2008 SRK Resource Estimation | 6-14 |
| Table 6-7 | Historical SG Data Statistics – Arctic Deposit: 1998–2004 | 6-14 |
| Table 6-8 | SG Measurements Categorized by Rock Type | 6-15 |
| Table 6-9 | Arctic Deposit Resources at $100 GMV Cut-off – 2008 SRK | 6-16 |
| Table 6-10 | Arctic Deposit Resources at $75 NSR Cut-off – 2011 SRK | 6-17 |
| Table 6-11 | Arctic Deposit Resources at $75 NSR Cut-off – 2012 SRK | 6-18 |
| Table 6-12 | Indicated Mineral Resource Table Restated by Mineralization Zone, Arctic Project, Alaska, Tetra Tech (July 30, 2013) | 6-19 |
| Table 6-13 | Inferred Mineral Resource Table Restated by Mineralization Zone, Arctic Project, Alaska, Tetra Tech (July 30, 2013) | 6-19 |
| Table 6-14 | Historical Resources for the Dead Creek, Sunshine and Horse Cliff Prospects | 6-20 |
| Table 9-1 | Summary of Trilogy/NovaGold Exploration Activities Targeting VMS-style Mineralization in the Ambler Sequence Stratigraphy and the Arctic Deposit | 9-2 |
| Table 9-2 | TDEM Loops and Locations | 9-9 |
| Table 10-1 | Companies, Campaigns, Drill Holes and Metres Drilled at the Arctic Deposit | 10-1 |
| Table 10-2 | Summary of Trilogy/NovaGold Drilling | 10-2 |
| Table 10-3 | Drill Contractors, Drill Holes, Meterage and Core Sizes by Drill Campaign at the Arctic Deposit | 10-4 |
| Table 10-4 | Geotechnical Holes and Instrumentation | 10-7 |
| Table 10-5 | Recovery and RQD 2004 to 2008 Arctic Drill Campaigns | 10-9 |
| Table 10-6 | Drill Intercept Summary Table | 10-10 |
| Table 10-7 | Drill, Meterage and Average Drill Depth for Trilogy Ambler Sequence VMS Targets | 10-12 |
| Table 10-8 | Significant Drill Intercepts – Trilogy Ambler Sequence Prospects | 10-12 |
| Table 10-9 | Trilogy’s Exploration Drilling – Ambler Schist Belt | 10-15 |
| Table 11-1 | Analytical Laboratories Used by Operators of the Arctic Project | 11-5 |
| Table 13-1 | Metallurgical Test Work Programs | 13-1 |
| Table 13-2 | Metallic Mineral Identified in Arctic Project Samples | 13-3 |
Trilogy Metals Inc. NI 43-101 Technical Report on the Arctic Project,
Northwest Alaska | v | |
| Table 13-3 | Bond Ball Mill Work Index | 13-5 |
| Table 13-4 | Head Analyses | 13-6 |
| Table 13-5 | Flotation Test on Ambler Low Talc Composite | 13-7 |
| Table 13-6 | Head Grades – Composite Samples – 2012 | 13-9 |
| Table 13-7 | Head Grade 2017 Variability Samples and Pilot Plant Composite | 13-10 |
| Table 13-8 | Mineral Modal Abundance for Composite Samples – 2012 | 13-11 |
| Table 13-9 | Bond Ball Mill Grindability and Abrasion Index Test Results | 13-13 |
| Table 13-10 | Locked Cycle Metallurgical Test Results | 13-17 |
| Table 13-11 | SGS Open Circuit Copper and Lead Separation Test Results | 13-20 |
| Table 13-12 | ALS Metallurgy Locked Cycle Copper-Lead Separation Test Results | 13-22 |
| Table 13-13 | Summary of Overall Metal Recovery – Arctic Project | 13-23 |
| Table 13-14 | Multi-element Assay Results –Lead Concentrate and Copper Concentrate | 13-24 |
| Table 13-15 | Multi-element Assay Results – Zinc Concentrate | 13-25 |
| Table 14-1 | Summary of Sample Data Used to Develop the Resource Block Model | 14-6 |
| Table 14-2 | Summary of Lithology Domains | 14-10 |
| Table 14-3 | Summary of Mineralized Zone (MinZone) Domains | 14-10 |
| Table 14-4 | Summary of Geotech, Alteration, Talc and Weathering Domains | 14-11 |
| Table 14-5 | Summary of Estimation Domains | 14-23 |
| Table 14-6 | Summary of Treatment of Outlier Sample Data | 14-24 |
| Table 14-7 | Copper Correlogram Parameters | 14-26 |
| Table 14-8 | Lead Correlogram Parameters | 14-27 |
| Table 14-9 | Zinc Correlogram Parameters | 14-27 |
| Table 14-10 | Gold Correlogram Parameters | 14-28 |
| Table 14-11 | Silver Correlogram Parameters | 14-28 |
| Table 14-12 | Sulphur Correlogram Parameters | 14-29 |
| Table 14-13 | AP Correlogram Parameters | 14-29 |
| Table 14-14 | NP Correlogram Parameters | 14-30 |
| Table 14-15 | Block Model Limits | 14-31 |
| Table 14-16 | Interpolation Parameters for Copper | 14-32 |
| Table 14-17 | Interpolation Parameters for Lead | 14-32 |
| Table 14-18 | Interpolation Parameters for Zinc | 14-32 |
| Table 14-19 | Interpolation Parameters for Gold | 14-33 |
| Table 14-20 | Interpolation Parameters for Silver | 14-33 |
| Table 14-21 | Interpolation Parameters for Sulphur | 14-33 |
| Table 14-22 | Interpolation Parameters for AP | 14-34 |
| Table 14-23 | Interpolation Parameters for NP | 14-34 |
| Table 14-24 | Interpolation Parameters for Specific Gravity (SG) | 14-34 |
| Table 14-25 | Parameters Used to Generate a Resource-Limiting Pit Shell | 14-47 |
| Table 14-26 | Mineral Resource Estimate for the Arctic Project | 14-48 |
| Table 14-27 | Sensitivity of Mineral Resource to Cut-off Grade | 14-50 |
| Table 14-28 | Comparison with the Previous Estimate of Mineral Resources | 14-50 |
| Table 20-1 | Additional Recommended Environmental Baseline Studies | 20-7 |
| Table 23-1 | Mineral Resource Estimate for the Sun Project (November 2012) | 23-2 |
| Figure 1-1 | Property Location Map | 1-1 |
| Figure 2-1 | Trilogy Metals Exploration Camp | 2-2 |
Trilogy Metals Inc. NI 43-101 Technical Report on the Arctic Project,
Northwest Alaska | vi | |
| Figure 4-1 | Upper Kobuk Mineral Projects Lands (Trilogy Metals, 2017) | 4-2 |
| Figure 4-2 | Arctic Project Mineral Tenure Plan (Trilogy Metals, 2017) | 4-3 |
| Figure 7-1 | Geologic Terranes of the Southern Brooks Range (Trilogy Metals, 2017) | 7-2 |
| Figure 7-2 | Geology of the Ambler Mining District (Trilogy Metals, 2017) | 7-5 |
| Figure 7-3 | Ambler Sequence Stratigraphy in the Arctic Deposit Area (Trilogy Metals, 2017) | 7-7 |
| Figure 7-4 | Generalized Geology of the Central Ambler District (Trilogy Metals, 2017) | 7-8 |
| Figure 7-5 | Typical F1 Isoclinal Folds Developed in Calcareous Gnurgle Gneiss | 7-9 |
| Figure 7-6 | Generalized Geologic Map of the Arctic Deposit (Trilogy Metals, 2017) | 7-11 |
| Figure 7-7 | Typical Massive Sulphide Mineralization at the Arctic Deposit | 7-16 |
| Figure 7-8 | Major Prospects of the Ambler Mining District (Trilogy Metals, 2017) | 7-17 |
| Figure 9-1 | Mapping Campaigns in and around the Arctic Deposit (Trilogy Metals, 2017) | 9-4 |
| Figure 9-2 | Arctic Deposit Area Geology (Trilogy Metals, 2017) | 9-5 |
| Figure 9-3 | 2016 Updated Arctic Surface Geology Map (Trilogy Metals, 2017) | 9-6 |
| Figure 9-4 | Copper Distribution in Silt and Soil Samples in the Dead Creek Area | 9-7 |
| Figure 9-5 | Zinc Distribution in Silt and Soil Samples in the Dead Creek Deposit Area | 9-8 |
| Figure 9-6 | TDEM Loops and Contoured Resistivity – Dead Creek Prospect | 9-10 |
| Figure 9-7 | SRK Design Sectors based on Kinematic Analysis | 9-14 |
| Figure 9-8 | SRK Preliminary Hydrology Model – Perched Water Table | 9-16 |
| Figure 10-1 | Plan Map of Drill Holes Utilized in the Mineral Resource Estimation (Trilogy Metals, 2017) | 10-3 |
| Figure 10-2 | Known Collar Locations and Principal Target Areas – Ambler District (Trilogy Metals, 2017) | 10-14 |
| Figure 10-3 | Sunshine Prospect and Drill Hole Locations (Trilogy Metals, 2017) | 10-15 |
| Figure 11-1 | Spatial Availability of QA/QC Data (Trilogy Metals, 2017) | 11-7 |
| Figure 11-2 | Graph Showing Good Agreement between Wet-dry Measured Specific Gravity and Pycnometer Measured Specific Gravity | 11-17 |
| Figure 11-3 | Measured versus Stoichiometric Specific Gravities | 11-18 |
| Figure 11-4 | Scatter Plot Showing the Measured Specific Gravity versus Multiple (Copper, Iron, Zinc, Barium) Regression Estimate | 11-19 |
| Figure 12-1 | Distribution of the Differences Between GPS Elevations and the DTM | 12-1 |
| Figure 13-1 | Traditional copper-lead-zinc flowsheet showing talc pre-float | 13-2 |
| Figure 14-1 | Isometric View of Copper Grades in Drill Holes | 14-3 |
| Figure 14-2 | Isometric View of Copper Grades in Drill Holes | 14-4 |
| Figure 14-3 | Isometric Views of Available AP and NP Data | 14-5 |
| Figure 14-4 | Isometric View of Available Sulphur Data | 14-5 |
| Figure 14-5 | Cross Section 613250E Showing Lithology Domains at Arctic | 14-7 |
| Figure 14-6 | Cross Section 7453000N Showing Lithology Domains at Arctic | 14-8 |
| Figure 14-7 | Isometric View of Geotechnical Domains | 14-8 |
| Figure 14-8 | Isometric Views of Talc Domains | 14-9 |
| Figure 14-9 | Isometric Views of Alteration Domains | 14-9 |
| Figure 14-10 | Boxplots of Copper by Logged Lithology Type | 14-13 |
| Figure 14-11 | Boxplots of Copper by Lithology Domain | 14-14 |
| Figure 14-12 | Boxplots of Gold by Lithology Domain | 14-15 |
| Figure 14-13 | Boxplots of Copper by MinZone Domain | 14-16 |
| Figure 14-14 | Boxplots of AP, NP and Sulphur by Lithology Domain | 14-18 |
| Figure 14-15 | Boxplots of AP, NP and Sulphur by Talc Domain | 14-19 |
| Figure 14-16 | Boxplots of AP, NP and Sulphur by Weathered Domain | 14-19 |
| Figure 14-17 | Boxplots of SG by MinZone and Lithology Group Domains | 14-20 |
Trilogy Metals Inc. NI 43-101 Technical Report on the Arctic Project,
Northwest Alaska | vii | |
| Figure 14-18 | Contact Profiles of Copper Between MinZone and other Lithology Domain Groups | 14-21 |
| Figure 14-19 | Contact Profile of AP, NP and Sulphur Between Weathered and Fresh Rocks | 14-21 |
| Figure 14-20 | Contact Profile of AP, NP and Sulphur Inside / Outside of the Talc Domains | 14-22 |
| Figure 14-21 | North-South Vertical Section of Copper Estimates in the Block Model (Section 613250E) | 14-35 |
| Figure 14-22 | West-East Vertical Section of Copper Estimates in the Block Model (Section 7453000N) | 14-36 |
| Figure 14-23 | Herco and Model Grade / Tonnage Plots for Copper in MinZone Domains 1, 3 and 5 | 14-37 |
| Figure 14-24 | Herco and Model Grade / Tonnage Plots for Lead in MinZone Domains 1, 3 and 5 | 14-37 |
| Figure 14-25 | Herco and Model Grade / Tonnage Plots for Zinc in MinZone Domains 1, 3 and 5 | 14-37 |
| Figure 14-26 | Herco and Model Grade / Tonnage Plots for Gold in MinZone Domains 1, 3 and 5 | 14-38 |
| Figure 14-27 | Herco and Model Grade / Tonnage Plots for Silver in MinZone Domains 1, 3 and 5 | 14-38 |
| Figure 14-28 | Comparison of Copper Model Types in MinZone Domains 1, 3 and 5 | 14-39 |
| Figure 14-29 | Comparison of Lead Model Types in MinZone Domains 1, 3 and 5 | 14-39 |
| Figure 14-30 | Comparison of Zinc Model Types in MinZone Domains 1, 3 and 5 | 14-40 |
| Figure 14-31 | Comparison of Gold Model Types in MinZone Domains 1, 3 and 5 | 14-40 |
| Figure 14-32 | Comparison of Silver Model Types in MinZone Domains 1, 3 and 5 | 14-41 |
| Figure 14-33 | Swath Plot of Copper in MinZone Domains 1, 3 and 5 | 14-42 |
| Figure 14-34 | Swath Plot of Lead in MinZone Domains 1, 3 and 5 | 14-42 |
| Figure 14-35 | Swath Plot of Zinc in MinZone Domains 1, 3 and 5 | 14-43 |
| Figure 14-36 | Swath Plot of Gold in MinZone Domains 1, 3 and 5 | 14-43 |
| Figure 14-37 | Swath Plot of Silver in MinZone Domains 1, 3 and 5 | 14-44 |
| Figure 14-38 | Swath Plot of AP in Rocks Outside of the MinZone Domains | 14-44 |
| Figure 14-39 | Swath Plot of NP in Rocks Outside of the MinZone Domains | 14-45 |
| Figure 14-40 | Swath Plot of Sulphur Rocks Outside of the MinZone Domains | 14-45 |
| Figure 14-41 | Isometric Views of Arctic Mineral Resource | 14-49 |
| Figure 18-1 | Brooks East Route Access to the Ambler Mining District and Location of North Slope LNG (Trilogy Metals, 2017) | 18-2 |
| Figure 18-2 | Brooks East Route Access to the Ambler Mining District – Preferred Route (Trilogy Metals, 2017) | 18-3 |
| Figure 20-1 | Wetlands delineation completed in 2015 and 2016 by DOWL | 20-3 |
| Figure 23-1 | Adjacent Properties and Land Status (Trilogy Metals, 2017) | 23-1 |
| Glossary |
| | |
| Acme Analytical Laboratories Ltd. | AcmeLabs |
| Alaska Department of Environmental Conservation | ADEC |
| Alaska Department of Fish and Game | ADF&G |
| Alaska Department of Natural Resources | ADNR |
| Alaska Department of Transportation | ADOT |
Trilogy Metals Inc. NI 43-101 Technical Report on the Arctic Project,
Northwest Alaska | viii | |
| Alaska Industrial Development and Export Authority | AIDEA |
| Alaska Native Claims Settlement Act | ANCSA |
| Alaska Native Regional Corporations | ANCSA Corporations |
| Andover Mining Corp. | Andover |
| Annual Hardrock Exploration Activity | AHEA |
| atomic absorption | AA |
| atomic absorption spectroscopy | AAS |
| atomic emission spectroscopy | ICP_AES |
| Audio-Frequency Magneto-Telluric | AMT |
| BD Resource Consulting, Inc. | BDRC |
| Bear Creek Mining Corporation | BCMC |
| Arctic Property | the Property |
| Canadian Institute of Mining, Metallurgy, and Petroleum | CIM |
| complex resistivity induced polarization | CRIP |
| Controlled Source Audio-frequency Magneto-Telluric | CSAMT |
| Electromagnetic | EM |
| Environmental Impact Statement | EIS |
| Environmental Protection Agency | EPA |
| Exploration Agreement and Option to Lease | NANA Agreement |
| Fugro Airborne Surveys | Fugro |
| GeoSpark Consulting Inc. | GeoSpark |
| inductively coupled plasma | ICP |
| inductively coupled plasma-mass | ICP-MS |
| International Organization for Standardization | ISO |
| Kennecott Exploration Company and Kennecott Arctic Company | Kennecott |
| Kennecott Research Centre | KRC |
| liquefied natural gas | LNG |
| Mine Development Associates | MDA |
| meters above sea level | MASL |
| NANA Regional Corporation, Inc. | NANA |
| National Environmental Policy Act | NEPA |
| National Instrument 43-101 | NI 43-101 |
| natural source audio-magnetotelluric | NSAMT |
| naturally occurring asbestos | NOA |
| net smelter return | NSR |
| North American Datum | NAD |
| Northern Land Use Research Inc. | NLUR Inc. |
| Northwest Arctic Borough | NWAB |
| Trilogy Metals Inc. | Trilogy Metals |
| NovaGold Resources Inc. | NovaGold |
| Polarized Light Microscopy | PLM |
| Quality Assurance/Quality Control | QA/QC |
| SIM Geological Inc. | SGI |
| single point | SP |
| Teck Resources Ltd. | Teck |
| Universal Transverse Mercator | UTM |
| US Army Corps of Engineers | USACE |
Trilogy Metals Inc. NI 43-101 Technical Report on the Arctic Project,
Northwest Alaska | ix | |
| US Geological Survey | USGS |
| volcanogenic massive sulphide | VMS |
| WH Pacific, Inc. | WHPacific |
| Zonge International Inc. | Zonge |
Trilogy Metals Inc. NI 43-101 Technical Report on the Arctic Project,
Northwest Alaska | x | |
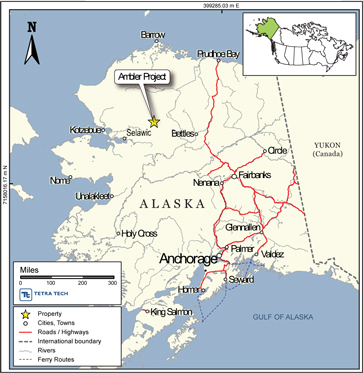
Trilogy Metals Inc. (“Trilogy” “Trilogy Metals” or the “Company”) formerly known as NovaCopper Inc. retained BD Resource Consulting, Inc. (“BDRC”) to prepare an updated mineral resource estimate for the Arctic Project and disclose it in a technical report prepared in accordance with National Instrument 43-101 and Form 43-101F1 (collectively “NI 43-101”). The Arctic Property (the “Property”) is located in the Ambler Mining District of the southern Brooks Range, in the Northwest Arctic Borough (NWAB) of Alaska. The Property is located 270 km east of the town of Kotzebue, 37 km northeast of the village of Kobuk, and 260 km west of the Dalton Highway, an all-weather state maintained highway. Figure 1-1 shows the location of the Property.
This updated mineral resource estimate and NI 43-101 Technical Report includes assays from an additional 6,113 m of drill core completed during the 2015 and 2016 infill drilling programs.
The effective date of this report is April 25, 2017.
Figure 1-1 Property Location Map (Tetra Tech, 2013)
Trilogy Metals Inc. NI 43-101 Technical Report on the Arctic Project,
Northwest Alaska | 1-1 | |
| 1.2 | Property Description and Location |
The Arctic Project is located in the Ambler mining district (“Ambler District”) of the southern Brooks Range, in the NWAB of Alaska. The Property is geographically isolated with no current road access or nearby power infrastructure. The Property is located 270 km east of the town of Kotzebue, 36 km north of the village of Kobuk, and 260 km west of the Dalton Highway, an all-weather state maintained highway.
The Property comprises approximately 46,226 ha of State of Alaska mining claims and US Federal patented mining claims in the Kotzebue Recording District. The Arctic Project land tenure consists of 1,386 contiguous claims, including 883 40-acre State claims, 503 160-acre State claims, and eighteen Federal patented claims comprising 272 acres (110 ha) held in the name of NovaCopper US Inc., a wholly owned subsidiary of Trilogy Metals. These claims are shown in Figure 4-1 and listed in Appendix A List of Claims. The Arctic Project is located near the southern edge of the centre of the claim block. The Federal patented claim corners were located by the US Geological Survey (USGS). There is no expiration date or labour requirement on the Federal patented claims. Rent for each State claim is paid annually to the Alaska Department of Natural Resources (ADNR). An Annual Labour Statement must be submitted annually to maintain the State claims in good standing.
| 1.3 | Geology and Mineralization |
The Ambler mining district is located on the southern margin of the Brooks Range and hosts: 1) a belt of Devonian volcanogenic massive sulphide (“VMS”) deposits, that includes the Property which contains the Arctic Deposit; and 2) a belt of Devonian epigenetic carbonate-hosted copper deposits including the Bornite Deposit, in which the Company also has an interest.
The district encompasses an east-west trending zone of Devonian to Jurassic age submarine volcanic and sedimentary rocks occurring as structurally bound, imbricate allochthons (Hitzman et al. 1986) and further characterized by increasing metamorphic grade to the north. The district shows isoclinal folding in the northern portion and thrust faulting to south (Schmidt 1983).
Within the VMS belt, several deposits and prospects (including the Arctic Deposit) are hosted in the Ambler Sequence, a group of Middle Devonian to Early Mississippian, metamorphosed, bimodal volcanic rocks with interbedded tuffaceous, graphitic, and calcareous volcaniclastic metasediments. The Ambler sequence occurs in the upper part of the regional Anirak Schist. VMS-style mineralization is found along the entire 110 km strike length of the district.
The Ambler Sequence has undergone two periods of intense, penetrative deformation. The first deformation period is characterised by upper greenschist-facies metamorphism and formation of a penetrative schistosity. Folding varies from isoclinal folding with local transposition of bedding units, to pervasive upright or slightly overturned folds verging north on all scales. This fold event deforms the transposed bedding and schistosity, and defines the subsequent event.
Trilogy Metals Inc. NI 43-101 Technical Report on the Arctic Project,
Northwest Alaska | 1-2 | |
Stratigraphically, the Ambler Sequence consists of variably metamorphosed calc-turbidites, overlain by calcareous schists with irregularly distributed mafic sills and pillow lavas. These are overlain by the Arctic-sulphide host section which consists mainly of fine-grained, carbonaceous siliciclastic rocks which are in turn overlain by reworked silicic volcanic rocks, including meta-rhyolite porphyries and most notably the regionally extensive Button Schist with its characteristically large relic phenocrysts. Greywacke sandstones, interpreted to be turbidites, occur throughout the section but are concentrated higher in the stratigraphy. Several rock units within the stratigraphy show substantial variation in local thickness as a consequence of basin morphology at the time of deposition.
Alteration at the Arctic Deposit is characterized by magnesium alteration, primarily as talc, chlorite, and phengite alteration products associated with the sulphide-bearing horizons and continuing in the footwall. Stratigraphically above the sulphide-bearing horizons, significant muscovite as paragonite is developed and results in a marked shift in Na/Mg (sodium/magnesium) ratios across the sulphide bearing horizons.
Mineralization occurs as stratiform semi-massive sulphide (SMS) to massive sulphide (MS) beds within primarily graphitic chlorite schists and fine-grained quartz sandstones. The sulphide beds average 4 m in thickness but vary from less than 1 m up to as much as 18 m in thickness.
The bulk of the mineralization occurs within eight modelled SMS and MS zones lying along the upper and lower limbs of the Arctic isoclinal anticline. Wireframes of the mineralized horizons have been modeled based on MS defined by more than 50% sulphide minerals and SMS defined by 35 to 50% sulphide minerals. All of the zones are within an area of roughly 1 km2 with mineralization extending to a depth of approximately 250 m below the surface. Mineralization is predominately coarse-grained sulphides consisting mainly of chalcopyrite, sphalerite, galena, tetrahedrite-tennantite, pyrite, arsenopyrite, and pyrrhotite. Trace amounts of electrum are also present.
| 1.4 | Mineral Processing and Metallurgical Testing |
Since 1970, metallurgical test work has been conducted to determine the flotation response of various samples extracted from the Arctic Deposit. In general, the samples tested produced similar metallurgical performances. In 2012, SGS Mineral Services (SGS) conducted a metallurgical test program to further study metallurgical responses of the samples produced from Zones 1, 2, 3, and 5 of the Arctic Deposit. The flotation test procedures used talc pre-flotation, conventional copper-lead bulk flotation and zinc flotation, followed by copper and lead separation. In general, the 2012 test results indicated that the samples responded well to the flowsheet tested. The average results of the locked cycle tests (without copper and lead separation) were as follows:
Trilogy Metals Inc. NI 43-101 Technical Report on the Arctic Project,
Northwest Alaska | 1-3 | |
| · | The copper recoveries to the bulk copper-lead concentrates ranged from 89 to 93% excluding the Zone 1 & 2 composite which produced a copper recovery of approximately 84%; the copper grades of the bulk concentrates were 24 to 28%. |
| · | Approximately 92 to 94% of the lead was recovered to the bulk copper-lead concentrates containing 9 to 13% lead. |
| · | The zinc recovery was 84.2% from Composite Zone 1 & 2, 93.0% from Composite Zone 3 and 90.5% from Composite Zone 5. On average, the zinc grades of the concentrates produced were higher than 55%, excluding the concentrate generated from Composite Zone 1 & 2, which contained only 44.5% zinc. |
| · | Gold and silver were predominantly recovered into the bulk copper-lead concentrates. Gold recoveries to this concentrate ranged from 65 to 80%, and silver recoveries ranged from 80 to 86%. |
Using an open circuit procedure, the copper and lead separation tests on the bulk copper-lead concentrate produced from the locked cycle tests generated reasonable copper and lead separation. The copper concentrates produced contained approximately 28 to 31% copper, while the grades of the lead concentrates were in the range of 41% to 67% lead. Also, it appears that most of the gold reported to the copper concentrate and on average the silver was equally recovered into the copper and lead concentrates.
The 2012 grindability test results showed that the Bond ball millwork index (BWi) tests ranged from 6.5 to 11 kWh/t and abrasion index (Ai) tests fluctuated from 0.017 to 0.072 g for the mineralized samples. The data indicate that the samples are neither resistant nor abrasive to ball mill grinding. The materials are considered to be soft or very soft in terms of grinding requirements.
In 2017, ALS Metallurgy conducted detailed copper and lead separation flotation test work using a bulk sample of copper-lead concentrate produced from the operation of a pilot plant. This detailed work is contained in the report entitled, “KM5000 - Flotation and Variability Test work with Samples from the Arctic Deposit”, dated March 27, 2017.
The conclusions of test work conducted both in 2012 and 2017 indicate that the Arctic materials are well-suited to the production of high-quality copper and zinc concentrates using flotation techniques which are industry standard. Copper and zinc recovery data is reported in the range of 91 to 89% respectively, which reflects the high grade nature of the deposit as well as the coarse grained nature of these minerals. Lead concentrates have the potential to be of high quality and can also be impacted by zones of very high talc contents which has the potential to dilute lead concentrate grades. The lead concentrate is also shown to be rich in precious metals, which has some advantages in terms of marketability of this material.
An overall metallurgical balance for the project is summarized in Table 1-1. This table of metal recoveries is based on an expected average recovery over the entire resource based on grades and detailed results of metallurgical test work conducted in 2012 and 2017.
Trilogy Metals Inc. NI 43-101 Technical Report on the Arctic Project,
Northwest Alaska | 1-4 | |
| Table 1-1 | Summary of Overall Metal Recovery – Arctic Project |
| | | Concentrate Grade | Metal Recoveries |
| | | | | | | | | | | | |
| Process stream | Mass % | Cu | Pb | Zn | Au | Ag | Cu | Pb | Zn | Au | Ag |
| | | % | % | % | g/t | g/t | % | % | % | % | % |
| | | | | | | | | | | | |
| Process Feed | 100.0 | 2.31 | 0.59 | 3.22 | 0.49 | 38 | | | | | |
| | | | | | | | | | | | |
| Copper Conc | 7.15 | 29.5 | 0.3 | 3.0 | 0.35 | 240 | 91.2 | 3.6 | 6.7 | 5.2 | 45.1 |
| | | | | | | | | | | | |
| Lead Conc | 1.02 | 1.7 | 50.0 | 0.9 | 28.0 | 1300 | 0.7 | 85.1 | 0.3 | 58.9 | 34.9 |
| | | | | | | | | | | | |
| Zinc Conc | 4.85 | 1.7 | 0.5 | 59.2 | 0.55 | 49.6 | 3.6 | 4.0 | 89.0 | 5.5 | 6.3 |
| | | | | | | | | | | | |
| Process Tailings | 86.98 | 0.12 | 0.05 | 0.15 | 0.17 | 6 | 4.5 | 7.3 | 4.0 | 30.5 | 13.7 |
| | | | | | | | | | | | |
An updated mineral resource estimate has been prepared by Bruce M. Davis, FAusIMM, BD Resource Consulting, Inc. (BDRC), and Robert Sim, P.Geo., SIM Geological Inc. (SGI), both “Independent Qualified Persons” as defined in section 1.5 of NI 43-101. The mineral resource estimate is listed in Table 1-2.
Trilogy Metals Inc. NI 43-101 Technical Report on the Arctic Project,
Northwest Alaska | 1-5 | |
| Table 1-2 | Mineral Resource Estimate for the Arctic Project |
| | | Average Grade: | Contained metal: |
| Class | M tonnes | Cu % | Pb% | Zn% | Au g/t | Ag g/t | Cu Mlbs | Pb Mlbs | Zn Mlbs | Au koz | Ag Moz |
| Indicated | 36.0 | 3.07 | 0.73 | 4.23 | 0.63 | 47.6 | 2441 | 581 | 3356 | 728 | 55 |
| Inferred | 3.5 | 1.71 | 0.60 | 2.72 | 0.36 | 28.7 | 131 | 47 | 210 | 40 | 3 |
| (1) | (1)Resources stated as contained within a pit shell developed using metal prices of US$3.00/lb Cu, $0.90/lb Pb, $1.00/lb Zn, $1300/oz Au and $18/oz Ag and metallurgical recoveries of 92% Cu, 77% Pb, 88% Zn, 63% Au and 56% Ag and operating costs of $3/t mining and $35/t process and G&A. The average pit slope is 43 degrees. |
| (2) | The base case cut-off grade is 0.5% copper equivalent. CuEq = (Cu%x0.92)+(Zn%x0.290)+(Pb%x0.231)+(Augptx0.398)+(Aggptx0.005).. |
| (3) | Mineral Resources are not Mineral Reserves and do not have demonstrated economic viability. There is no certainty that all or any part of the Mineral Resources will be converted into Mineral Reserves. |
| (4) | Inferred resources have a great amount of uncertainty as to whether they can be mined legally or economically. It is reasonably expected that a majority of Inferred resources will be converted to Indicated resources with continued exploration. |
| 1.6 | Interpretations and Conclusions |
Based on the resource estimate, this study should be followed by further technical and economic studies leading to a prefeasibility study.
| 1.7 | Opportunities and Recommendations |
The following actions are recommended to proceed with a prefeasibility study. They are also outlined in Section 26.0.
| · | geotechnical studies, including geotechnical investigations of the pit area, plant site, TSF site, airstrip and other project related locations ($1,000,000) |
| · | engineering studies, including power supply and optimization of the layout of the process and service related facilities ($1,200,000) |
| · | metallurgical studies focused on grinding test work and additional floatation test work ($1,000,000) |
| · | additional baseline studies and environmental permitting activities ($30,000) |
Trilogy Metals Inc. NI 43-101 Technical Report on the Arctic Project,
Northwest Alaska | 1-6 | |
Trilogy Metals, a company involved in the exploration and development of projects in northwest Alaska, retained BDRC to prepare an updated mineral resource estimate for the Arctic Project and disclose it in a technical report prepared in accordance with National Instrument 43-101 and Form 43-101F1 (collectively “NI 43-101”).
This amended report replaces and supersedes any previous resource estimate for the Arctic Project in its entirety.
Bruce Davis of BDRC, Robert Sim of SIM Geological Inc., and Jeff Austin of International Metallurgical & Environmental Inc. are the Qualified Persons (QPs) responsible for the current technical report.
All units of measurement in this technical report are metric, unless otherwise stated. Specifically, in the section describing historic resource estimates, and when reporting contained copper, imperial units are used.
The monetary units are in US dollars, unless otherwise stated.
Bruce Davis, FAusIMM, the president of BDRC, is the principle author of this Technical Report. Robert Sim, P.Geo., the president of SGI and Jeff Austin, P.Eng., the president of International Metallurgical & Environmental Inc., are co-authors of this Technical Report. Bruce Davis, Robert Sim, and Jeff Austin are QPs as defined in NI 43-101,Standards of Disclosure for Mineral Projects, and in compliance with Form 43-101F1.
Neither Bruce Davis of BDRC, nor Robert Sim of SGI, nor Jeff Austin of International Metallurgical & Environmental Inc., nor any associates employed in the preparation of this report (Consultants), has any beneficial interest in Trilogy Metals. These Consultants are not insiders, associates, or affiliates of Trilogy Metals. The results of this Technical Report are not dependent on any prior agreements concerning the conclusions of this report, and there are no undisclosed understandings concerning future business dealings between Trilogy Metals and the Consultants. The Consultants are paid a fee for their work in accordance with normal professional consulting practices.
Trilogy Metals Inc. NI 43-101 Technical Report on the Arctic Project,
Northwest Alaska | 2-1 | |
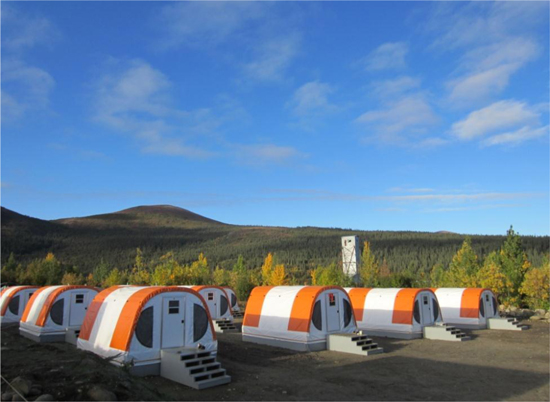
Bruce Davis conducted a site visit to the Project on July 26-27, 2011, on September 25, 2012, and again on August 10-12, 2015. Figure 2-1 shows the Trilogy Metals exploration camp. The site visit included a review of: drilling procedures, site facilities, historic and recent drill core, logging procedures, data capture, and sample handling. During the 2015 Arctic site visit, Mr. Davis undertook a helicopter traverse along proposed access corridors and potential site layouts.
| Figure 2-1 | Trilogy Metals Exploration Camp |
Reports and documents listed in Section 27.0 were used to support the preparation of the technical report. Additional information was sought from Trilogy Metals personnel where required.
Trilogy Metals Inc. NI 43-101 Technical Report on the Arctic Project,
Northwest Alaska | 2-2 | |
| 3.0 | Reliance on other experts |
BDRC has relied entirely on discussions with and information provided by Trilogy Metals’ management team, Rick Van Nieuwenhuyse, CEO and Erin Workman, the Company’s Director of Technical Services at the time of the discussions, between May, 2013 and December, 2013 for matters relating to mineral tenure and mining rights permits, surface rights, agreements and encumbrances relevant to this report in Section 4.0, including the Exploration Agreement and Option to Lease dated October 19, 2011 between the Company and NANA Regional Corporation, Inc. (“NANA”) (the “NANA Agreement”). BDRC has not researched the property title or mineral rights for the Arctic Project and express no legal opinion as to the ownership status of the property.
BDRC believes the data and information provided by Trilogy Metals is complete and correct to the best of their knowledge and that no information was intentionally withheld that would affect the conclusions made herein.
Trilogy Metals Inc. NI 43-101 Technical Report on the Arctic Project,
Northwest Alaska | 3-1 | |
| 4.0 | Property Description and Location |
The Property is located in the Ambler mining district of the southern Brooks Range, in the NWAB of Alaska. The Property is located in Ambler River A-2 quadrangle, Kateel River Meridian T 20N, R 11E, section 2 and T 21N, R 11E, sections 34 and 35.
The Arctic Project is located 270 km east of the town of Kotzebue, 37 km northeast of the village of Kobuk, and 260 km west of the Dalton Highway, an all-weather state maintained public road, at geographic coordinates N67.17° latitude and W156.39° longitude (Universal Transverse Mercator (UTM) North American Datum (NAD) 83, Zone 4 coordinates 7453080N, 613110E).
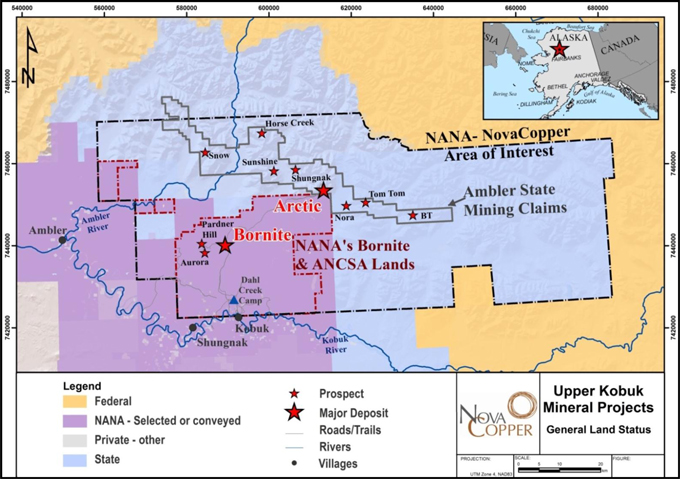
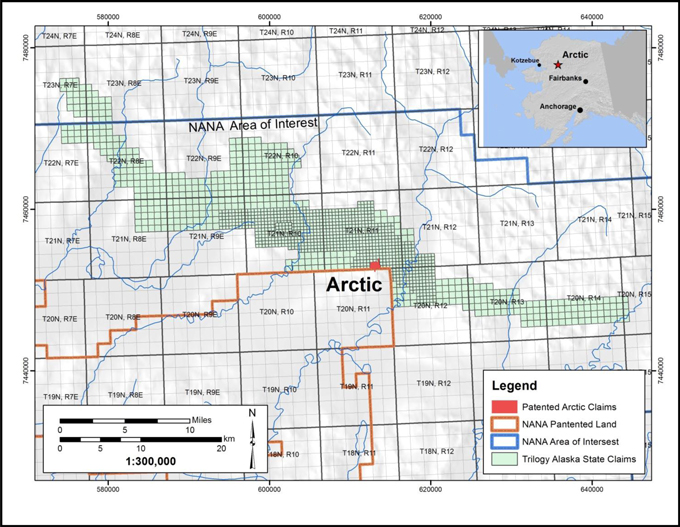
The Property comprises approximately 46,226 ha of State of Alaska mining claims and US Federal patented mining claims in the Kotzebue Recording District. The Arctic Project land tenure consists of 1,386 contiguous claims, including 883 40-acre State claims, 503 160-acre State claims, and eighteen Federal patented claims comprising 272 acres (110 ha) held in the name of NovaCopper US Inc., a wholly owned subsidiary of Trilogy Metals. These claims are shown in Figure 4-1 and listed in Appendix A List of Claims. The Arctic Project is located near the southern edge of the centre of the claim block. The Federal patented claim corners were located by the US Geological Survey (USGS). There is no expiration date or labour requirement on the Federal patented claims. Rent for each State claim is paid annually to the Alaska Department of Natural Resources (ADNR). An Annual Labour Statement must be submitted annually to maintain the State claims in good standing.
| Trilogy Metals Inc. | 4-1 | |
| NI 43-101 Technical Report on the Arctic Project, | | |
| Northwest Alaska | | |
Figure 4-1 Upper Kobuk Mineral Projects Lands (Trilogy Metals, 2017)
| Trilogy Metals Inc. | 4-2 | |
| NI 43-101 Technical Report on the Arctic Project, | | |
| Northwest Alaska | | |
Figure 4-2 Arctic Project Mineral Tenure Plan (Trilogy Metals, 2017)
| Trilogy Metals Inc. | 4-3 | |
| NI 43-101 Technical Report on the Arctic Project, | | |
| Northwest Alaska | | |
| 4.3 | Royalties, Agreements and Encumbrances |
| 4.3.1 | Kennecott Agreements |
On March 22, 2004, Alaska Gold Company, a wholly-owned subsidiary of NovaGold Resources Inc. (“NovaGold”) completed an Exploration and Option to Earn an Interest Agreement with Kennecott Exploration Company and Kennecott Arctic Company (collectively, Kennecott) on the Ambler land holdings.
On December 18, 2009, a Purchase and Termination Agreement was entered into between Alaska Gold Company and Kennecott whereby NovaGold agreed to pay Kennecott a total purchase price of $29 million for a 100% interest in the Ambler land holdings, which included the Arctic Project, to be paid as: $5 million by issuing 931,098 NovaGold shares, and two installments of $12 million each, due 12 months and 24 months from the closing date of January 7, 2010. The NovaGold shares were issued in January 2010, the first $12 million payment was made on January 7, 2011, and the second $12 million payment was made in advance on August 5, 2011; this terminated the March 22, 2004 exploration agreement between NovaGold and Kennecott. Under the Purchase and Termination Agreement, the seller retained a 1% net smelter return (NSR) royalty that is purchasable at any time by the land owner for a one-time payment of $10 million.
During 2011, NovaGold incorporated the NovaCopper US Inc. and transferred its Ambler land holdings, including the Arctic Project, from Alaska Gold Company to NovaCopper US Inc. In April 2012, NovaGold completed a spin-out of NovaCopper Inc., a publicly traded company listed on the TSX and NYSE-MKT stock exchanges and owned by the same shareholders as NovaGold. In September of 2016, NovaCopper Inc. changed its name to Trilogy Metals Inc.
In 1971, the US Congress passed the Alaska Native Claims Settlement Act (ANCSA) which settled land and financial claims made by the Alaska Natives and provided for the establishment of 13 regional corporations to administer those claims. These 13 corporations are known as the Alaska Native Regional Corporations (ANCSA Corporations). One of these 13 regional corporations is the Northwest Alaska Native Association (NANA) Regional Corporation, Inc. ANCSA Lands controlled by NANA bound the southern border of the Property claim block. National Park lands are within 25 km of the northern property border.
On October 19, 2011, Trilogy Metals and NANA Regional Corporation, Inc. entered into an Exploration Agreement and Option to Lease (the “NANA Agreement”) for the cooperative development of their respective resource interests in the Ambler mining district. The NANA Agreement consolidates Trilogy Metals’ and NANA’s land holdings into an approximately 142,831 ha land package and provides a framework for the exploration and development of the area. The NANA Agreement provides that NANA will grant Trilogy Metals the nonexclusive right to enter on, and the exclusive right to explore, the Bornite Lands and the ANCSA Lands (each as defined in the NANA Agreement) and in connection therewith, to construct and utilize temporary access roads, camps, airstrips and other incidental works. The NANA Agreement has a term of 20 years, with an option in favour of Trilogy Metals to extend the term for an additional 10 years. The NANA Agreement may be terminated by mutual agreement of the parties or by NANA if Trilogy Metals does not meet certain expenditure requirements on NANA’s lands.
| Trilogy Metals Inc. | 4-4 | |
| NI 43-101 Technical Report on the Arctic Project, | | |
| Northwest Alaska | | |
If, following receipt of a feasibility study and the release for public comment of a related draft environmental impact statement, Trilogy Metals decides to proceed with construction of a mine on the lands subject to the NANA Agreement, Trilogy Metals will notify NANA in writing and NANA will have 120 days to elect to either (a) exercise a non-transferrable back-in-right to acquire between 16% and 25% (as specified by NANA) of that specific project; or (b) not exercise its back-in-right, and instead receive a net proceeds royalty equal to 15% of the net proceeds realized by Trilogy Metals from such project. The cost to exercise such back-in-right is equal to the percentage interest in the Project multiplied by the difference between (i) all costs incurred by Trilogy Metals or its affiliates on the project, including historical costs incurred prior to the date of the NANA Agreement together with interest on the historical costs; and (ii) $40 million (subject to exceptions). This amount will be payable by NANA to Trilogy Metals in cash at the time the parties enter into a joint venture agreement and in no event will the amount be less than zero.
In the event that NANA elects to exercise its back-in-right, the parties will, as soon as reasonably practicable, form a joint venture with NANA electing to participate between 16% to 25%, and Trilogy Metals owning the balance of the interest in the joint venture. Upon formation of the joint venture, the joint venture will assume all of the obligations of Trilogy Metals and be entitled to all the benefits of Trilogy Metals under the NANA Agreement in connection with the mine to be developed and the related lands. A party’s failure to pay its proportionate share of costs in connection with the joint venture will result in dilution of its interest. Each party will have a right of first refusal over any proposed transfer of the other party’s interest in the joint venture other than to an affiliate or for the purposes of granting security. A transfer by either party of a net smelter royalty return on the project or any net proceeds royalty interest in a project other than for financing purposes will also be subject to a first right of refusal.
In connection with possible development on the Bornite Lands or ANCSA Lands, Trilogy Metals and NANA will execute a mining lease to allow Trilogy Metals or the joint venture to construct and operate a mine on the Bornite Lands or ANCSA Lands (the “Mining Lease”). These leases will provide NANA a 2% net smelter royalty as to production from the Bornite Lands and a 2.5% net smelter royalty as to production from the ANCSA Lands.
If Trilogy Metals decides to proceed with construction of a mine on its own lands subject to the NANA Agreement, NANA will enter into a surface use agreement with Trilogy Metals which will afford Trilogy Metals access to the project along routes approved by NANA (the “Surface Use Agreement”). In consideration for the grant of such surface use rights, Trilogy Metals will grant NANA a 1% net smelter royalty on production and an annual payment of $755 per acre (as adjusted for inflation each year beginning with the second anniversary of the effective date of the NANA Agreement and for each of the first 400 acres (and $100 for each additional acre) of the lands owned by NANA and used for access which are disturbed and not reclaimed.
| Trilogy Metals Inc. | 4-5 | |
| NI 43-101 Technical Report on the Arctic Project, | | |
| Northwest Alaska | | |
| 4.4 | Environmental Liabilities |
There is no known environmental impairment due to previous operators or ongoing exploration activities by Trilogy Metals at the Property. There has been no mine development or production on the Property.
Multiple permits are required during the exploration phase of the Property. Permits are issued from Federal, State, and Regional agencies, including: the Environmental Protection Agency (EPA), the US Army Corps of Engineers (USACE), the Alaska Department of Environmental Conservation (ADEC), the Alaska Department of Fish and Game (ADF&G), the Alaska Department of Natural Resources (ADNR), and the Northwest Arctic Borough (NWAB). The State of Alaska permit for exploration on the Property, the Annual Hardrock Exploration Activity (AHEA) Permit, is obtained and renewed every five years through the ADNR – Division of Mining, Land and Water. Trilogy Metals holds an AHEA exploration permit in good standing with the Alaska DNR, and has done so each year since 2004 under Alaska Gold Company, a wholly owned subsidiary of NovaGold and now Trilogy Metals. The Property is within the NWAB thus requiring a Title 9 Miscellaneous Land Use permit for mineral exploration, fuel storage, gravel extraction, and the operation of a landfill. NovaGold held these permits in good standing during the 2004 to 2008 seasons and renewed the permits for the 2010 exploration season to 2015. The permit was renewed again in 2016 for 2016 thru 2020. The Bornite Camp and the Bornite Landfill are permitted by the ADEC.
A number of statutory reports and payments are required to maintain the claims in good standing on an annual basis. As the Arctic Project progresses, additional permits for environmental baseline and detailed engineering studies will be necessary at federal, state, and local levels. A detailed outline of permitting requirements is discussed in Section 20.0.
| Trilogy Metals Inc. | 4-6 | |
| NI 43-101 Technical Report on the Arctic Project, | | |
| Northwest Alaska | | |
| 5.0 | Accessibility, Climate, Local Resources, Infrastructure and Physiography |
Primary access to the Property is by air, using both fixed wing aircraft and helicopters.
There are four well maintained, approximately 1,500 m-long gravel airstrips located near the Property, capable of accommodating charter fixed wing aircraft. These airstrips are located 64 km west at Ambler, 46 km southwest at Shungnak, 37 km southwest at Kobuk, and 34 km southwest at Dahl Creek. There is daily commercial air service from Kotzebue to the village of Kobuk, the closest community to the Property. During the summer months, the Dahl Creek Camp airstrip is suitable for larger aircraft, such as a C-130 and DC-6.
In addition to the four 1,500 m airstrips, there is a 700 m airstrip located at the Bornite Camp. The airstrip at Bornite is suited to smaller aircraft, which support the Bornite Camp with personnel and supplies. There is also a 450m airstrip (Arctic airstrip) located at the base of Arctic ridge that is suited to support smaller aircraft.
There is no direct water access to the Property. During spring runoff, river access is possible by barge from Kotzebue Sound to Ambler, Shungnak, and Kobuk via the Kobuk River.
A winter trail and a one-lane dirt track suitable for high-clearance vehicles or construction equipment links the Arctic Project’s main camp located at Bornite to the 1525m Dahl Creek airstrip southwest of the Arctic Deposit. An unimproved gravel track connects the Arctic airstrip with the Arctic Deposit.
The climate in the region is typical of a sub-arctic environment. Exploration is generally conducted from late May until late September. Weather conditions on the Property can vary significantly from year to year and can change suddenly. During the summer exploration season, average maximum temperatures range from 10°C to 20°C, while average lows range from -2°C to 7°C (Alaska Climate Summaries: Kobuk 1971 to 2000). By early October, unpredictable weather limits safe helicopter travel to the Property. During winter months, the Property can be accessed by snow machine, track vehicle, or fixed wing aircraft. Winter temperatures are routinely below -25°C and can exceed -50°C. Annual precipitation in the region averages at 395 mm with the most rainfall occurring from June through September, and the most snowfall occurring from November through January.
| Trilogy Metals Inc. | 5-1 | |
| NI 43-101 Technical Report on the Arctic Project, | | |
| Northwest Alaska | | |
The Property is approximately 270 km east of the town of Kotzebue, on the edge of Kotzebue Sound, 37 km northeast of the village of Kobuk, 260 km west of the Dalton Highway, and 470 km northwest of Fairbanks. Kobuk (population 151; 2010 US Census) is a potential workforce source for the Arctic Project, and is the location of one of the airstrips near the Property. Several other villages are also near the Property, including Shungnak located 46 km to the southwest with a population of 262 (2010 US Census) and Ambler, 64 km to the west with a population of 258 (2010 US Census). Kotzebue has a population of 3,201 (2010 US Census) and is the largest population centre in the Northwest Arctic Borough. Kotzebue is a potential source of limited mining-related supplies and labourers, and is the nearest centre serviced by regularly scheduled, large commercial aircraft (via Nome or Anchorage). In addition, there are seven other villages in the region that will be a potential source of some of the workforce for the Property. Fairbanks (population 31,036; 2010 US Census) has a long mining history and can provide most mining-related supplies and support that cannot be sourced closer to the Property.
Drilling and mapping programs are seasonal and have been supported out of the Bornite Camp and Dahl Creek Camp. The Bornite Camp facilities are located on Ruby Creek on the northern edge of the Cosmos Hills. The camp provides office space and accommodations for the geologists, drillers, pilots, and support staff. There are four 2-person cabins installed by NANA prior to Trilogy Metals’ tenure.
In 2011, the Bornite Camp was expanded to 20 sleeping tents, 3 administrative tents, 2 shower/bathroom tents, 1 medical tent, and 1 dining/cooking tent. With these additions, the camp capacity was increased to 49 beds. A 30 m by 9 m core logging facility was also built in summer of 2011. An incinerator was installed near the Bornite airstrip to manage waste created by the Bornite Camp. Power for the Bornite Camp is supplied by a 175 kW Caterpillar diesel generator. Water is provided by a permitted artesian well located 250 m from the Bornite Camp.
In 2012, the camp was further expanded with the addition of a laundry tent, a women's shower/washroom tent, a recreation tent, several additional sleeping tents, and a 2 x enlargement of the kitchen tent. Camp capacity increased to 76 beds. The septic field was upgraded to accommodate the increase in camp population. One of the two-person cabins was winterized for use by the winter caretaker. A permitted landfill was established to allow for the continued cleanup and rehabilitation of the historic shop facilities and surroundings.
| Trilogy Metals Inc. | 5-2 | |
| NI 43-101 Technical Report on the Arctic Project, | | |
| Northwest Alaska | | |
In 2017, the camp was further expanded with the addition of 3 sleeping tents. Camp capacity increased to 81 beds. Power is now being supplied by two Caterpillar diesel generators – one 300kW and one 225 kW. Water was supplied by the permitted artesian well located 250m from camp; however a water well was drilled in camp during the 2017 field season that will be permitted by Spring 2018 to provide all potable water for Bornite Camp.
Proposed infrastructure is discussed in more detail in Section 18.0. Currently, the Arctic Project does not have access to Alaska power and transportation infrastructure.
Beginning in 2009, the Property has been the focus of an access corridor study. The State of Alaska has spent approximately $10 million to identify proposed access routes to the Ambler mining district, and to initiate environmental baseline studies. The working group for this study consists of the Alaska Department of Transportation (“ADOT”), the ADNR, the Governor’s Office, the Alaska Industrial Development and Export Authority (“AIDEA”), NANA, and Trilogy Metals.
Based on this work the Brooks East route has been selected as the preferred alternative. It is an approximately 340 km road running east from the Property to the Dalton Highway and is now referred to as the Ambler Mining District Industrial Access Project or AMDIAP.
On October 21, 2015 the Governor of the State of Alaska authorized AIDEA to begin the Environmental Impact Statement (“EIS”) process and shortly thereafter AIDEA submitted draft documents (a Consolidated Transportation and Utility System Right of Way Application – Form SF-299) to the relevant federal agencies, including the Bureau of Land Management (BLM), the Army Corp of Engineers (ACE) and the National Park Service (NPS) as prescribed under the National Environmental Policy Act (NEPA) process to obtain construction permits for AMDIAP. The application has been reviewed for completeness and a lead federal agency was identified to be the Bureau of Land Management (“BLM”).
The BLM as the lead Federal Agency for permitting the AMDIAP, issued a Notice of Intent on February 28, 2017 to formally begin the EIS process under the National Environmental Policy Act (“NEPA”). The first step will be project scoping, which is expected to be completed by the end of January 2018. A schedule is currently being agreed upon between all relevant State and Federal Agencies and the Proponent (AIDEA) to complete the next steps in permitting which include: preparation of a Draft Environmental Impact Statement (DEIS); public review and comment on the DEIS; preparation of the Final EIS; Public Review of Final EIS; and Record of Decision (ROD).
| Trilogy Metals Inc. | 5-3 | |
| NI 43-101 Technical Report on the Arctic Project, | | |
| Northwest Alaska | | |
The Arctic Project is located along the south slope of the Brooks Range, which separates the Arctic region from the interior of Alaska. Nearby surface water includes Subarctic Creek, the Shungnak and Kogoluktuk Rivers, the Kobuk River, and numerous small lakes. The Arctic Project is located at the eastern end of Subarctic Creek, a tributary of the Shungnak River to the west, along a ridge between Subarctic Creek and the Kogoluktuk River Valley. The Property area is marked by steep and rugged terrain with high topographic relief. Elevations range from 30 metres above sea level (“MASL”) along the Kobuk River to 1,180 MASL on a peak immediately north of the Arctic Project area. The divide between the Shungnak and Kogoluktuk Rivers in the Ambler Lowlands is approximately 220 MASL.
The Kobuk Valley is located at the transition between boreal forest and Arctic tundra. Spruce, birch, and poplar are found in portions of the valley, with a ground cover of lichens (reindeer moss). Willow and alder thickets and isolated cottonwoods follow drainages, and alpine tundra is found at higher elevations. Tussock tundra and low, heath-type vegetation covers most of the valley floor. Intermittent permafrost exists on the Property.
Permafrost is a layer of soil at variable depths beneath the surface where the temperature has been below freezing continuously from a few to several thousands of years (Climate of Alaska 2007). Permafrost exists where summer heating fails to penetrate to the base of the layer of frozen ground and occurs in most of the northern third of Alaska as well as in discontinuous or isolated patches in the central portion of the State.
Wildlife in the Property area is typical of Arctic and Subarctic fauna (Kobuk Valley National Park 2007). Larger animals include caribou, moose, Dall sheep, bears (grizzly and black), wolves, wolverines, coyotes, and foxes. There are no anadromous fish species in the upper reaches of the Shungnak and Kogoluktuk Rivers due to natural fish barriers. Other fish species such as trout, sculpin, and grayling are common. The caribou seen on the Property belong to the Western Arctic herd that migrate once a year heading south in late August through October from their summer range north of the Brooks Range. The caribou migrate north in March from their winter range along the Buckland River to the north slope of the Brooks Range, but take a more westerly route and do not cross the Property.
| Trilogy Metals Inc. | 5-4 | |
| NI 43-101 Technical Report on the Arctic Project, | | |
| Northwest Alaska | | |
Prospectors first arrived in the Ambler District around 1900, shortly after the discovery of the Nome and Fairbanks gold districts. Several small gold placer deposits were located in the southern Cosmos Hills south of the Arctic Deposit and worked intermittently over the next few years. During this time copper mineralization was observed at Ruby Creek in the northern Cosmos Hills; however, no exploration was undertaken until 1947 when local prospector Rhinehart “Rhiny” Berg located outcropping mineralization along Ruby Creek. Berg subsequently staked claims over the Ruby Creek showings and constructed an airstrip for access (alaskamininghalloffame.org 2012).
Bear Creek Mining Company (BCMC), an exploration subsidiary of Kennecott, optioned the property from Berg in 1957. The prospect became known as Bornite and Kennecott conducted extensive exploration over the next decade, culminating in the discovery of the high-grade No. 1 orebody and the sinking of an exploration shaft to conduct underground drilling.
In conjunction with the discovery of the Bornite Deposit, BCMC greatly expanded their regional reconnaissance exploration in the Cosmos Hills and the southern Brooks Range. Stream silt sampling in 1966 revealed a significant copper anomaly in Arctic Creek roughly 27 km northeast of Bornite. The area was subsequently staked and, in 1967, eight core holes were drilled at the Arctic Deposit yielding impressive massive sulphide intercepts over an almost 500-m strike length.
BCMC conducted intensive exploration on the property until 1977 and then intermittently through 1998. No drilling or additional exploration was conducted on the Arctic Project between 1998 and 2004.
In addition to drilling and exploration at the Arctic Deposit, BCMC also conducted exploration at numerous other prospects in the Ambler District (most notably Dead Creek, Sunshine, Cliff, and Horse). The abundance of VMS prospects in the district resulted in a series of competing companies, including Sunshine Mining Company, Anaconda, Noranda, Teck Cominco, Resource Associates of Alaska (RAA), Watts, Griffis and McOuat Ltd. (WGM), and Houston Oil and Minerals Company, culminating into a claim staking war in the district in 1973.
District exploration by Sunshine Mining Company and Anaconda resulted in two additional significant discoveries in the district; the Sun Deposit located 60 km east of the Arctic Deposit, and the Smucker Deposit located 36 km west of the Arctic Deposit.
District exploration continued until the early 1980s on the four larger deposits in the district (Arctic, Bornite, Smucker and Sun) when the district fell into a hiatus due to depressed metal prices.
| Trilogy Metals Inc. | 6-1 | |
| NI 43-101 Technical Report on the Arctic Project, | | |
| Northwest Alaska | | |
In 1987, Cominco acquired the claims covering the Sun and Smucker deposits from Anaconda. Teck, as Cominco’s successor company, continues to hold the Smucker Deposit. In 2007, Andover Mining Corporation purchased a 100% interest in the Sun Deposit for US$13 million.
In 1981 and 1983, Kennecott received three US Mineral Survey patents (MS2245 totalling 240 acres over the Arctic Deposit – later amended to include another 32 acres; and MS2233 and MS2234 for 25 claims totalling 516.5 acres at Bornite). The Bornite patented claims and surface development were subsequently sold to NANA Regional Corporation, Inc. in 1986.
No production has occurred at the Arctic Deposit or at any of the other deposits within the Ambler District.
| 6.1 | Prior Ownership and Ownership Changes – Arctic Deposit and the Ambler Lands |
BCMC initially staked federal mining claims covering the Arctic Deposit area beginning in 1965. The success of the 1960’s drill programs defined a significant high-grade polymetallic resource at the Arctic Deposit and, in the early 1970s, Kennecott began the patent process to obtain complete legal title to the Arctic Deposit. In 1981, Kennecott received US Mineral Survey patent M2245 covering 16 mining claims totalling 240.018 acres. In 1983, US Mineral Survey patent M2245 was amended to include two additional claims totalling 31.91 acres.
With the passage of theAlaska National Interest Lands Conservation Act (ANILCA) in 1980, which expedited native land claims outlined in the ANSCA and state lands claims under theAlaska Statehood Act, both the state of Alaska and NANA selected significant areas of land within the Ambler District. State selections covered much of the Ambler schist belt, host to the VMS deposits including the Arctic Deposit, while NANA selected significant portions of the Ambler Lowlands to the immediate south of the Arctic Deposit as well as much of the Cosmos Hills including the area immediately around Bornite.
In 1995, Kennecott renewed exploration in the Ambler schist belt containing the Arctic Deposit patented claims by staking an additional 48 state claims at Nora and 15 state claims at Sunshine Creek. In the fall of 1997, Kennecott staked 2,035 state claims in the belt consolidating their entire land position and acquiring the majority of the remaining prospective terrain in the VMS belt. Five more claims were subsequently added in 1998. After a short period of exploration which focused on geophysics and geochemistry combined with limited drilling, exploration work on the Arctic Project again entered a hiatus.
On March 22, 2004, Alaska Gold Company, a wholly-owned subsidiary of NovaGold completed an Exploration and Option Agreement with Kennecott to earn an interest in the Ambler land holdings. A description of the current mineral tenure, as well as recent royalties, agreements and encumbrances is provided in Section 4.0.
| Trilogy Metals Inc. | 6-2 | |
| NI 43-101 Technical Report on the Arctic Project, | | |
| Northwest Alaska | | |
| 6.2 | Previous Exploration and Development Results – Arctic Deposit |
Kennecott’s tenure at the Arctic Project saw two periods of intensive work from 1965 to 1985 and from 1993 to 1998, before optioning the property to NovaGold in 2004.
Though abundant reports, memos, and files exist in Kennecott’s Salt Lake City office, only limited digital compilation of the data exists for the earliest generation of exploration at the Arctic Deposit and within the VMS belt. Beginning in 1993, Kennecott initiated a re-evaluation of the Arctic Deposit and assembled a computer database of previous work at the Arctic Deposit and in the district. A new computer-generated block model was constructed in 1995 and an updated resource of the deposit was calculated from the block model. Subsequently, Kennecott staked a total of 2,035 State of Alaska claims in 1997 and, in 1998 undertook the first field program since 1985.
Due to the plethora of companies and the patchwork exploration that occurred as a result of the 1973 staking war, much of the earliest exploration work on what now constitutes the Ambler Schist belt was lost during the post-1980 hiatus in district exploration. The following subsections outline the best documented data at the Arctic Deposit as summarized in the 1998 Kennecott exploration report, including the assembled computer database; however, this outline is not considered to be either exhaustive or in-depth.
In 1982, geologists with Kennecott, Anaconda and the State of Alaska published the definitive geologic map of the Ambler schist belt (Hitzman et al. 1982).
Table 6-1 lists known exploration mapping, geochemical, and geophysical programs conducted for VMS targets in the Ambler District.
| Trilogy Metals Inc. | 6-3 | |
| NI 43-101 Technical Report on the Arctic Project, | | |
| Northwest Alaska | | |
| Table 6-1 | Known Mapping, Geochemical, and Geophysical Programs Targeting VMS Prospects in the Ambler Mining District |
| Area | Prospects | Company | Mineralization | Mapping | Soil Geochem | Geophysics | Reports |
| Arctic Center of the Universe (COU) Back Door | Arctic | BCMC-KEX | Two (or more) sulfide bands with thickness up to ~40 m with Zn, Cu, Pb, Ag, Au, ±Ba mineralization. | Proffett 1998; Lindberg and others 2004, 2005; NG personnel 2008 at 1:2,000 scale | Extensive 2006 NG program (>670 samples) | Numerous surveys including the 1998 Dighem EM and Mag aerial surveys, 1998 CSAMT survey, TEM downhole and surface surveys in 2005, TDEM ground survey in 2006 | Numerous |
| COU Back Door, 4th of July Creek | NG-Anaconda | No exposed or drilled mineralization, target is the projection of the Arctic horizon | NG 1:2,000 mapping in 2006 | Extensive 2006 NG program | 4 TDEM ground surveys in 2005 and 2006 | 2005 and 2006 NG Progress Reports; Lindberg's 2005 report |
| Sunshine Bud CS | Sunshine Creek | BCMC and BCMC-Noranda | Disseminated to semi-massive lens up to 18 m thick. Upper mineralized limb is Ba-rich | BCMC 1983; Paul Lindberg 2006; NG 2011 | Numerous eras of soil sampling, most recent 1998 by Kennecott (Have data) and 2006 by NG | BCMC completed Recon IP survey and Crone vertical shoot back EM in 1977, 2 TDEM surveys to the NW | Various BCMC reports; Lindberg's 2006 Sunshine progress report; 2006 NG Progress report |
| Bud-CS | SMC and TAC | Au-rich gossan and 3+ m intercept of 1.7% Cu, 0.4% Pb, 1.5% Zn, 2 oz/ton Ag, 0.017 oz/ton Au | Anaconda (TAC) and Sunshine (SMC) | SMC soil sampling | Anaconda completed downhole resistivity survey in 1981 on Bud 7 | 1981 through 1983 Anaconda Progress reports |
| Trilogy Metals Inc. | 6-4 | |
| NI 43-101 Technical Report on the Arctic Project, | | |
| Northwest Alaska | | |
| Area | Prospects | Company | Mineralization | Mapping | Soil Geochem | Geophysics | Reports |
| Dead Creek Shungnak SK | Shungnak (Dead Creek) | BCMC, Cominco | Thin (0.1 to 3 m) disseminated to semi-massive lenses of Cu, Zn, Pb, Ag mineralization | Bruce Otto and others 2006; Proffett 1998 | NG in 2006 (355 samples); KEX in 1998 (~240 samples) | At lE 2 CEM surveys by BCMC at DH with no anomalous responses (do not have data) | 2006 NG report; 1982 and 1983 Anaconda Ambler Progress reports |
| SK | GCO and BCMC/GCO-HOMEX JV | Mineralized float up to 0.4% Cu, 4.8% Pb, 8.7% Zn, 5 oz/ton Ag | BCMC | BCMC 1982 soil grid | CEM and Max-min completed by BCMC (do not have data) | 1982 Annual Progress Report, BCMC; Bruce Otto 2006 Memo |
| Horse Cliff DH | Horse-Cliff DH | Horse - BCMC, Cliff SMC, DH - BCMC and BCMC/GCO-HOMEX | Disseminate to semi-massive with local massive lens, thicknesses up to tens of feet. | KEX 1983 1:1000 prospect map | SMC soil surveys 1976-1978 and 1980 | No known ground based survey; occurrences within a large resistivity high | 1985 Progress Report BCMC-GCO-Homex J; 1980 Summary of Ambler Field Investigations - Sunshine Mining, Horse Creek Memo - Robinson 1981; 1978 Ellis Geologic Evaluation and Assessment of the Northern Belt Claims |
| Snow Ambler RB Nani Frost | Snow | Cominco | Ag-Pb-Zn mineralization as massive and semi-massive bands hosted within thin bands of graphitic schist (GS). | Noranda-Cominco scanned map with no georeference; Prospect scale | KEX Soil gird in 1997 or 1998 | No known ground based survey; Anaconda completed downhole resistivity survey in 1981 on Ambler-4 | “Snow Prospect Miscellaneous Notes and Maps.pdf” is only known report |
| Trilogy Metals Inc. | 6-5 | |
| NI 43-101 Technical Report on the Arctic Project, | | |
| Northwest Alaska | | |
| Area | Prospects | Company | Mineralization | Mapping | Soil Geochem | Geophysics | Reports |
| | Ambler | Anaconda TAC | Massive disseminated chalcopyrite and pyrite associated with chert | Numerous Anaconda geologists; no digitized maps | Only scattered soils in database | Max-min surveys, no data is available | 1983 Ambler River Memo (Sunshine Progress Report); 1982 Anaconda Progress Report |
| Nani-Frost | BCMC and BCMC-Noranda | Outcrops of 2-3 m of 0.8% Cu, 0.4% Pb, 1.2% Zn, 0.05 oz/ton Ag within felsic schist | BCMC (do not have data) | BCMC identified numerous weak soil anomalies (do not have data) | CEM, Max-min, and PEM completed by BCMC (do not have data) | 1982 Annual Progress Report, BCMC |
| Red Nora | Nora | BCMC/GCO-HOMEX | Disseminated chalcopyrite within chlorite altered volcanics in two zones (Sulphide Gulch and Northern Horizon) | Generalized geologic map created by WGM for BCMC-GCO-HOMEX | No known data | Two PEM over the Sulphide Gulch horizon | 1984 and 1985 Progress Report BCMC-GCO-Homex JV |
| Red | BCMC | Thin discordant bands of sphalerite, chalcopyrite, galena, and pyrrhotite with calcite and fluorite cutting 'siltites' and metacarbonates | None | KEX soil lines 1998 | KEX identified EM anomalies 1998, follow-up gravity and Max-min EM; TDEM survey in 2006; DIGHEM helicopter EM and radiometric survey in 2006 | Kennecott's final 1998 field report; 2006 NG Progress Report |
| Other | BT, Jerri Creek | Anaconda, AMC | Massive sulphide bands up to 1.5 m thick extend nearly 2.3 km along an E-W strike | Hitzman and others | Historic soils at Jerri Creek | No known surveys. | Hitzman thesis and Anaconda (BT) and Bear Creek (Jerri) Assessment reports; 1982 and 1983 Anaconda Ambler Progress reports |
| Trilogy Metals Inc. | 6-6 | |
| NI 43-101 Technical Report on the Arctic Project, | | |
| Northwest Alaska | | |
| Area | Prospects | Company | Mineralization | Mapping | Soil Geochem | Geophysics | Reports |
| | Kogo-White Creek | Bud - SMC or AMC | Discovered by hydrochemistry of high Cu ions in White Creek. | SMC? | Soil geochem surveys by SMC in 1978 and KEX in 1998 | Recon IP survey in 1977; Max-Min Mag survey in 1980; Follow-up Max-Min and gravity by KEX in 1998; TDEM by NG in 2006. | 1980 Summary of Ambler Field Investigations, SMC; Kennecott's Final 1998 Field Report |
| Pipe | BCMC and SMC | Podiform zones of sulphide mineralization within calc-schists and QMS | Schmidt in 1978, SMC in 1982 | Kennecott soil grid in 1997-1998 | Not known | Schmidt's 1978 report (Part IV) for Anaconda's (?) annual report |
| | Tom Tom | Anaconda and SMC | 1982 'Discovery' trench by SMC uncovered massive sulphide boulders with up to 6 oz/ton Ag, 5.4% Pb, 6.3% Zn, only 0.2% Cu | Sunshine in 1982 (?) | SMC soils in 1982 | Gamma mag survey by SMC in 1982; TDEM by NG in 2006. | 1982 Sunshine Mining Company Memo by E.R. Modroo; Schmidt's 1978 report (Part IV) for Anaconda's (?) annual report |
| Sun | Sun-Picnic Creek | Anaconda - AMC-Cominco; Andover is current owner | Three (?) zones of sulphide mineralization varying from 1 to 10 m; Upper zone is Zn-Pb-Ag rich while the two lower zones are Cu rich | Various Anaconda geologists | Not known, but most likely extensive | Not known, but most likely extensive | 1981 Anaconda progress report; Anaconda 1977 prefeasibility study (not in NG possession) |
| Trilogy Metals Inc. | 6-7 | |
| NI 43-101 Technical Report on the Arctic Project, | | |
| Northwest Alaska | | |
| Area | Prospects | Company | Mineralization | Mapping | Soil Geochem | Geophysics | Reports |
| Smucker | Smucker-Charlie-Puzzle-4B-Patti | Anaconda, Cominco, and Bear Creek; now owned by Teck | A single mineralized Ag-Zn-Pb-Cu horizon varying from 1 to 8 m in thickness | Detailed mapping by Anaconda and GCMC geologists | Strong soil geochem anomalies in lowlands SE of Smucker horizon; Kennecott soil grid in 1997 or 1998 | Not known | 1985 Progress Report BCMC-GCO-Homex JV |
Note: EM = electromagnetic; TDEM = time domain electromagnetic; CSAMT = Controlled Source Audio Magnetotelluric
| Trilogy Metals Inc. | 6-8 | |
| NI 43-101 Technical Report on the Arctic Project, | | |
| Northwest Alaska | | |
Historic geochemistry for the district, compiled in the 1998 Kennecott database, includes 2,255 soil samples, 922 stream silt samples, 363 rock samples, and 37 panned concentrate samples. Data has been sourced from several companies including Kennecott, Sunshine Mining, RAA, and NANA. Sourcing of much of the data had been poorly documented in the database.
During 1998, Kennecott renewed its effort in the district, and, as a follow-up to the 1998 EM survey, undertook soil and rock chip sampling in and around EM anomalies generated in the geophysical targeting effort. During this period Kennecott collected 962 soils and 107 rocks and for the first time used extensive multi-element inductively coupled plasma (ICP) analysis.
Prior to 1998, Kennecott conducted a series of geophysical surveys which are poorly documented or are unavailable to Trilogy Metals. With the renewed interest in the belt, Kennecott mounted a largely geophysically driven program to assess the district for Arctic-sized targets. Based on an initial review of earlier geophysical techniques employed at the Arctic Deposit, Kennecott initiated an extensive helicopter-supported airborne EM and magnetic survey covering the entire VMS belt in March 1998. The survey was conducted on 400 m line spacing with selective 200 m line spacing at the Arctic Deposit and covered 2,509 total line kilometres. The Arctic Deposit presented a strong 900 Hz EM conductive signature.
Forty-six additional discrete EM conductors were identified, of which, 17 were further evaluated in the field. Eight of the EM anomalies were coincident with anomalous geochemistry and prospective geology, and were deemed to have significant potential for mineralization. As a follow-up, each anomaly was located on the ground using a Maxmin 2 horizontal loop EM system. Gravity lines were subsequently completed utilizing a LaCoste and Romberg Model G gravimeter over each of the eight anomalies.
In addition to the EM and gravity surveys in 1998, five lines of CSAMT data were collected in the Arctic Valley. The Arctic Deposit showed an equally strong conductive response in the CSAMT data as was seen in the EM data. As a result of the survey, Kennecott recommended additional CSAMT for the deposit area.
Field targeting work in 1998 prompted Kennecott to drill two exploration holes on anomaly 98-3, located approximately 6 km northwest of the Arctic Deposit and 2 km east-northeast of the Dead Creek prospect. Hole 98-03-01 was drilled to test the sub-cropping gossan and was roughly coincident with the centre of the geophysical anomaly as defined by airborne and ground EM data. Scattered mineralization was encountered throughout the hole with intervals of chalcopyrite and sphalerite.
Based on the results of the 1998 geophysical program, Kennecott made the following recommendations:
| · | anomaly 98-3 requires further drilling; |
| Trilogy Metals Inc. | 6-9 | |
| NI 43-101 Technical Report on the Arctic Project, | | |
| Northwest Alaska | | |
| · | anomalies 98-7 and 98-22 are drill ready; and |
| · | anomalies 98-8, -9, -14, -35, and -38 require additional ground targeting. |
Kennecott conducted no further field exploration in the district after 1998 and subsequently optioned the property to NovaGold in 2004.
Between 1967 and July 1985, Kennecott (BCMC) completed 86 holes (including 14 large diameter metallurgical test holes) totalling 16,080 m. In 1998, Kennecott drilled an additional 6 core holes totalling 1,492 m to test for:
| · | extensions of the known Arctic resource; |
| · | grade and thickness continuity; and |
Drilling for all BCMC/Kennecott campaigns in the Arctic Deposit area (1966 to 1998) totals 92 core holes for a combined 17,572 m. A complete and comprehensive discussion of the all the drilling undertaken at the Arctic Deposit is contained in Section 10.0 of this report.
Prior to 1998, no specific gravity (SG) measurements were available for the Arctic Deposit rocks. A “factored” average bulk density was used to calculate a tonnage factor for resource estimations. A total of 38 samples from the 1998 drilling at the Arctic Deposit were measured for SG determinations. This included six samples of unaltered metavolcanics, ten samples of graphitic schist and talc schist lithology, seven samples of SMS, and fifteen samples of MS.
A complete and comprehensive discussion of SG determinations captured during both the Kennecott and Trilogy Metals/NovaGold tenures are discussed in Section 11.0 of this report.
| 6.2.6 | Petrology, Mineralogy, and Research Studies |
There have been numerous internal studies done by Kennecott on the petrology and mineralogy of the Arctic Deposit that exist as internal memos, file notes, and reports from as early as 1967. Most notable are Clark et al. 1972; Clark et al. 1976; Hunt 1999; Stephens et al. 1970; and Stevens 1982.
In addition, Jeanine Schmidt completed a doctoral dissertation for Stanford University in 1983 entitled “The Geology and Geochemistry of the Arctic Prospect, Ambler District, Alaska”; and Bonnie Broman completed a master’s thesis for University of Alaska, Fairbanks in 2014 entitled “Metamorphism and Element Redistribution: Investigations of Ag-bearing and associated minerals in the Arctic Volcanogenic Massive Sulfide Deposit, SW Brooks Range, NW Alaska”.
| Trilogy Metals Inc. | 6-10 | |
| NI 43-101 Technical Report on the Arctic Project, | | |
| Northwest Alaska | | |
| 6.2.7 | Geotechnical, Hydrological and Acid-Base Accounting Studies |
A series of geotechnical, hydrological and acid-base accounting (ABA) studies were conducted by Kennecott before their divestiture of the Arctic Project to NovaGold.
Geotechnical Studies
In December 1998, URSA Engineering prepared a geotechnical study for Kennecott titled “Arctic Project – 1998 Rock Mass Characterization”. Though general in scope, the report summarized some of the basic rock characteristics as follows:
| · | Compressive strengths average 6,500 psi for the quartz mica schists, 14,500 psi for the graphitic schists, and 4,000 psi for talc schists. |
| · | Rock mass quality can be described as average to good quality, massive with continuous jointing except the talc schist, which was characterized as poor quality. The rock mass rating (RMR) averages 40 to 50 for most units except the talc schist which averages 30. |
Hydrological Studies
In 1998, Robertson Geoconsultants Inc. (Robertson) of Vancouver prepared a report for Kennecott titled “Initial Assessment of Geochemical and Hydrological Conditions at Kennecott’s Arctic Project”. The report presented the results of the acid generation potential of mine waste and wall rock for the Arctic Project in the context of a hydrological assessment of the climate, hydrology and water balance analyses at the Arctic Deposit. Climatic studies at the time were limited to regional analyses as no climatic data had been collected at the Arctic Project site prior to the review. Regional data, most specifically a government installed gauging station about 20 miles to the southwest at Dahl Creek, provided information in assessing the hydrology of the Arctic Project at the time. A total of nine regional gauges were utilized to evaluate the overall potential runoff in the area.
Acid-Base Accounting Studies
The 1998 Robertson study documented acid-base accounting results based on the selection of 60 representative core samples from the deposit. Results of the study are summarized as follows:
| · | Roughly 70% of the waste rock material was deemed to be potentially acid generating. |
| · | Mitigation of the acid generating capacity could be affected by submersion of the waste rock. Mitigation of the high wall and pit geometries would make potential pit flooding unlikely and could present a long term mitigation issue. |
| · | Characteristics of the mine tailings were not assessed. |
| · | Based on the study, Robertson recommended underground mining scenarios, or aggressive study including site water balance. |
| Trilogy Metals Inc. | 6-11 | |
NI 43-101 Technical Report on the Arctic Project,
Northwest Alaska | | |
| 6.2.8 | Metallurgical Studies |
During Kennecott’s tenure on the Property, they undertook an extensive series of studies regarding the metallurgy and processing of the Arctic mineralization. An extensive discussion of the historic and current metallurgical studies is presented in Section 13.0 of this report.
| 6.3 | Historical Mineral Resource Estimates |
A series of historic mineral resources have been estimated for the Arctic Deposit, including Russell (1975), Brown (1985), Randolph (1990), Kennecott (1995).
All of the historical mineral resource estimates presented below were made prior to the implementation of NI 43-101. They do not conform to NI 43-101 reporting standards and should not be relied upon or interpreted as such. A QP has not done sufficient work to classify the historical estimates as the current mineral resources and Trilogy Metals is not treating the historical estimates as current mineral resources. They are presented here for informational purposes only.
Differences between the previously reported mineral resource estimate (Tetra Tech 2013) and the current resource estimate are primarily related to additional drilling and an updated geological interpretation. The current resource estimate and the most recently reported resource estimate completed by Tetra Tech (2013) are intended to support an open pit mining concept.
Previous resource estimates for the Arctic Deposit, which includes work completed by Randolph (1990), and SRK (2008, 2011, and 2012), were intended to support an underground mining concept. Consequently the resource estimates focused on the high grade portions of the zones, and did not consider the potential amenability of the mineral resources to open pit mining methods.
| 6.3.1 | Russell – Kennecott (1975/1976) Resource Estimate |
The oldest documented estimate is a mineral resource estimated by R.H. Russell in 1975 for Kennecott. This estimate employed a polygonal estimation method. The estimate was updated in 1976 after additional drilling, and constrained within an open-pit mining scenario, with minimum 5 ft blocks with greater than 1% copper cut-off. Equivalencies for cut-off calculations include 5.56% zinc equalling 1% copper, and 2.21 oz/ton silver equalling 1% copper. The estimation utilized a tonnage factor of 8.81 ft3 per ton. Table 6-2 summarizes the results of the Russell estimation. This historical estimate is not categorized, and it is not known what the equivalent CIM category would be.
| Table 6-2 | Russell 1976 Resource Estimation |
Million
Tons | Copper
(%) | Zinc
(%) | Lead
(%) | Silver
(oz/ton) | Gold
(oz/ton) | Basis |
| 36.8 | 3.97 | 5.49 | 0.78 | 1.60 | 0.019 | Tonnage Factor = 8.81
Cut-off 5 ft of >1% CuEq |
| Note: | CuEq = copper equivalent |
| Trilogy Metals Inc. | 6-12 | |
NI 43-101 Technical Report on the Arctic Project,
Northwest Alaska | | |
| 6.3.2 | Brown – Kennecott (1985) Resource Estimate |
In a 1985 economic study, Brown reports resources based on a polygonal method at 4%, 6%, 8%, and 10% polymetallic cut-offs (copper + zinc + 1/2 lead), using 8 ft minimum mining heights, elevations above 2,300 ft, and 10 to 14% dilution factors. In addition, the resource reports additional resources below 2,300 ft elevation at 6% and 8% cut-offs. The resource is based on zones of mineralization ranging from 8 to 40 ft thick covering an area of 2,400 by 2,800 ft. Table 6-3 summarizes results of the Brown estimation.
This historical estimate is not categorized, and it is not known what the equivalent CIM category would be.
| Table 6-3 | Brown 1985 Resource Estimation |
Million
Tons | Copper
(%) | Zinc
(%) | Lead
(%) | Silver
(oz/ton) | Gold
(oz/ton) | Basis |
| 8.8 | 4.70 | 8.30 | 1.15 | 2.00 | 0.026 | 8% cut-off (Cu+Zn+1/2Pb) + 12.7% dilution |
| 3.9 | 4.04 | 6.82 | 1.17 | 1.90 | 0.023 | Additional tonnage below 2300 ft elevation |
| 5.2 | 3.00 | 2.35 | 0.35 | - | - | Additional tonnage 4 to 8% cut-off |
| 6.3.3 | Randolph – Kennecott (1990) Resource Estimate |
In 1990, Kennecott completed a resource estimate for the Arctic Deposit based on 70 core holes. This resource estimate is summarized in Table 6-4 and considered to be an Inferred resource. This historical resource estimate pre-dates the development of NI 43-101 reporting guidelines and was not estimated in compliance with NI 43-101 procedures and should not be relied upon.
| Table 6-4 | Historical Resource Estimate |
| Classification | Tonnes
(kt) | Cu
(%) | Zn
(%) | Pb
(%) | Ag
(ppm) | Au
(ppm) |
| Inferred | 36,300 | 4.0 | 5.5 | 0.8 | 54.9 | 0.7 |
Source: Randolph(1990)
| 6.3.4 | Kennecott (1996) Resource Estimate |
A previous historic mineral resource number was produced in conjunction with the construction of the digital database for the Arctic Project. No supporting data or discussion of the basis of the resource estimation is presented. Table 6-5 summarizes the results of the 1996 estimate. This historical estimate is not categorized, and it is not known what the equivalent CIM category would be.
| Trilogy Metals Inc. | 6-13 | |
NI 43-101 Technical Report on the Arctic Project,
Northwest Alaska | | |
| Table 6-5 | Kennecott 1996 Resource Estimation |
Million
Tons | Copper
(%) | Zinc
(%) | Silver
(oz/ton) | Gold
(oz/ton) | Basis |
| 26.6 | 3.79 | 5.8 | 1.64 | 0.033 | Unknown |
| 6.3.5 | SRK (2008) Resource Estimation |
In February 2008, NovaGold filed an NI 43-101 compliant resource authored by SRK for the Arctic Deposit. The estimation utilized 119 core holes, of which, 4,808 intervals were sampled representing 9,128 m of sampled drilling. Sample lengths varied from 0.1 to 12 m, and averaged about 1.9 m. Each interval contained assays for copper, zinc, lead, gold and silver, as well as codes for lithology and mineralized zone. Assays were capped based on the drill hole assay statistics presented in Table 6-6.
| Table 6-6 | Drill Hole Assay Statistics – 2008 SRK Resource Estimation |
| Category | Length (m) | Cu (%) | Zn (%) | Pb (%) | Au (ppm) | Ag (ppm) |
| Uncut | Cap 15 | Uncut | Cap 18 | Uncut | Cap 4 | Uncut | Cap 7 | Uncut | Cap 190 |
| Host | 19,703.45 | 0.07 | 0.07 | 0.06 | 0.06 | 0.01 | 0.01 | 0.01 | 0.01 | 1.09 | 1.09 |
| Sulphide | 1,077.11 | 3.77 | 3.76 | 6.05 | 6.04 | 0.94 | 0.93 | 0.83 | 0.75 | 56.86 | 55.81 |
| Total | 20,780.56 | 0.26 | 0.26 | 0.37 | 0.37 | 0.06 | 0.06 | 0.06 | 0.05 | 3.98 | 3.93 |
| Number Capped | | 4 | | 8 | | 9 | | 3 | | 5 |
Downhole surveys were recorded at 15 to 45 m intervals for the majority of the drill holes. A standard “typical deviation” was applied to 40 holes, which were unsurveyed. Due to the large discrepancy between previous Kennecott SG measurements, a more extensive field SG program was implemented by NovaGold in 2004, the results of which are tabulated along with the 1998 Kennecott data in Table 6-7.
| Table 6-7 | Historical SG Data Statistics – Arctic Deposit: 1998–2004 |
| Program | MS >50%
Sulphide
(Average
g/cm3) | No. of
Samples | SMS <50%
Sulphide
(Average
g/cm3) | No. of
Samples | Lithologies
(Average
g/cm3) | No. of
Samples |
| 1998 Lab (Chemex, Golder) | 4.37 | 15 | 4.02 | 7 | 2.84 | 16 |
| 2004 Field | 4.40 | 35 | 3.84 | 19 | 2.83 | 73 |
| 2004 Lab (Chemex) | 4.06 | 121 | 3.36 | 77 | 2.85 | 66 |
| All Programs | 4.16 | 171 | 3.49 | 103 | 2.84 | 155 |
Note: MS = massive sulphide; SMS = semi-massive sulphide
For the purpose of the 2008 resource estimate, accepted SG measurements were categorized by rock type and vary from 2.62 to 4.87 with an average of 4.2 for massive sulphide (MS) and semi-massive sulphide (SMS). Actual values within each zone were used to interpolate SG into the block model using inverse distance squared (ID2) but, where SG sample density was too sparse, a default value of 4.2 was used in the mineralized zones. A default of 2.9 was used for all host rock, which was the average SG of non-rejected quartz mica schist samples. SG measurements are shown by rock type in Table 6-8.
| Trilogy Metals Inc. | 6-14 | |
NI 43-101 Technical Report on the Arctic Project,
Northwest Alaska | | |
| Table 6-8 | SG Measurements Categorized by Rock Type |
| Rock Category | Count | Average | Max | Min |
| MS+SMS | 77 | 4.2 | 4.87 | 2.84 |
| Non-MS/SMS | 93 | 2.9 | 4.26 | 2.62 |
Five zones representing MS lenses were modelled and composites were created at 1 m down hole intervals, broken at changes in zone codes. General directional variograms were generated for each element and, due to the drill spacing and orientation, the best variograms are in the orientation of azimuth 150°, plunge 30°, with ranges of 40 to 50 m in all elements except gold, which had a range of 25 m.
Grades were estimated using ordinary kriging (OK) and a spherical search restricted within the zones. Multiple passes were used (50, 100, and 150 m) to fill as many blocks as possible within the zones. The first search pass used a minimum of two samples, with no more than three from any one drill hole; the second two passes did not have a number per drill hole restriction.
After the metal grades were estimated, a simplified Gross Metal Value (GMV) was calculated based on metal prices applied to each individual grade. The GMV was equal to the sum of each grade multiplied by the value of the metal unit. A $100 GMV cut-off was selected for the resource cut-off grade based on the assumption of underground mining methods.
Resources in the mineral zones, which were estimated by the first (50 m) search, were classified as Indicated resources, roughly based on a distance that was twice the variogram range and within one cross section distance inside a modelled shape. All blocks outside of the mineral zones, and all other estimated blocks too distant from the samples for the first pass, were classified as Inferred resources. The resource statement is shown in Table 6-9 at $100 GMV cut-off.
| Trilogy Metals Inc. | 6-15 | |
NI 43-101 Technical Report on the Arctic Project,
Northwest Alaska | | |
| Table 6-9 | Arctic Deposit Resources at $100 GMV Cut-off – 2008 SRK |
| Resource | Grade | Contained Metal |
| Zone | kt | Cu
(%) | Zn
(%) | Pb
(%) | Ag
(g/t) | Au
(g/t) | Cu
(Mlb) | Zn
(Mlb) | Pb
(Mlb) | Ag
(koz) | Au
(koz) |
| Indicated |
| Zone 1 | 5,294 | 4.56 | 6.45 | 1.05 | 62.8 | 0.956 | 533 | 752 | 122 | 10,684 | 163 |
| Zone 2 | 2,982 | 4.36 | 5.82 | 0.80 | 45.8 | 0.521 | 287 | 383 | 53 | 4,387 | 50 |
| Zone 3 | 1,957 | 3.66 | 6.00 | 0.93 | 51.2 | 0.522 | 158 | 259 | 40 | 3,220 | 33 |
| Zone 4 | 6,092 | 3.82 | 6.00 | 0.98 | 68.7 | 1.008 | 513 | 805 | 131 | 13,451 | 197 |
| Zone 11 | 517 | 4.16 | 3.32 | 0.34 | 32.9 | 0.254 | 47 | 38 | 4 | 546 | 4 |
| Total Indicated | 16,841 | 4.14 | 6.03 | 0.94 | 59.6 | 0.826 | 1,538 | 2,237 | 350 | 32,289 | 447 |
| Inferred |
| Zone 0 | 1,162 | 2.21 | 2.27 | 0.69 | 4.2 | 0.333 | 57 | 58 | 18 | 156 | 12 |
| Zone 1 | 3,163 | 3.92 | 5.75 | 0.93 | 55.0 | 0.760 | 273 | 401 | 65 | 5,596 | 77 |
| Zone 2 | 1,559 | 4.06 | 5.60 | 0.74 | 43.4 | 0.433 | 139 | 193 | 25 | 2,176 | 22 |
| Zone 3 | 1,307 | 3.83 | 5.13 | 0.63 | 48.1 | 0.438 | 110 | 148 | 18 | 2,021 | 18 |
| Zone 4 | 4,382 | 3.34 | 5.03 | 0.84 | 58.4 | 0.891 | 323 | 486 | 81 | 8,224 | 126 |
| Zone 11 | 370 | 4.27 | 3.32 | 0.36 | 33.8 | 0.293 | 35 | 27 | 3 | 402 | 3 |
| Total Inferred | 11,944 | 3.56 | 4.99 | 0.80 | 48.4 | 0.674 | 937 | 1,313 | 210 | 18,575 | 259 |
| 2. | The effective date of this mineral resource estimate is January 31, 2008. |
| 3. | Inferred resources have a great amount of uncertainty as to whether they can be mined legally or economically. It is reasonably expected that a majority of Inferred resources will be converted to Indicated resources with continued exploration. |
| 4. | Mineral resources that are not mineral reserves do not have demonstrated economic viability. |
| 5. | This mineral resource estimate assumes metal prices of $2.25/lb copper, $525/oz gold, $9.50/oz silver, $0.55/lb lead and $1.05/lb zinc. |
| 6.3.6 | SRK (2011) Resource Estimation Update |
In 2011, as part of a preliminary economic assessment (“PEA”) of the Arctic Project as a potential underground mining operation, SRK re-stated the 2008 resource for NovaGold using slightly different classification criteria based on a NSR calculation utilizing updated operating costs and then current metal pricing. Though the block model estimation did not change, reported resources were updated. Table 6-10 shows the mineral resource estimate as reported May 9, 2011.
| Trilogy Metals Inc. | 6-16 | |
NI 43-101 Technical Report on the Arctic Project,
Northwest Alaska | | |
| Table 6-10 | Arctic Deposit Resources at $75 NSR Cut-off – 2011 SRK |
| Resource | Grade | Contained Metal |
| Zone | kt | Cu
(%) | Zn
(%) | Pb
(%) | Ag
(g/t) | Au
(g/t) | Cu
(Mlb) | Zn
(Mlb) | Pb
(Mlb) | Ag
(koz) | Au
(koz) |
| Indicated |
| Zone 1 | 5,293 | 4.56 | 6.45 | 1.05 | 62.77 | 0.96 | 533 | 752 | 122 | 10,683 | 163 |
| Zone 2 | 2,982 | 4.36 | 5.82 | 0.80 | 45.76 | 0.52 | 287 | 384 | 53 | 4,387 | 50 |
| Zone 3 | 1,964 | 3.66 | 5.98 | 0.93 | 51.02 | 0.52 | 158 | 259 | 40 | 3,222 | 33 |
| Zone 4 | 6,089 | 3.82 | 6.00 | 0.98 | 68.71 | 1.01 | 513 | 805 | 131 | 13,451 | 197 |
| Zone 11 | 517 | 4.16 | 3.32 | 0.34 | 32.86 | 0.25 | 47 | 38 | 4 | 546 | 4 |
| Total Indicated | 16,845 | 4.14 | 6.02 | 0.94 | 59.62 | 0.83 | 1,538 | 2,237 | 350 | 32,289 | 447 |
| Inferred |
| Zone 0 | 1,191 | 2.18 | 2.24 | 0.70 | 4.17 | 0.34 | 57 | 59 | 18 | 159 | 13 |
| Zone 1 | 3,166 | 3.91 | 5.74 | 0.93 | 54.98 | 0.76 | 273 | 401 | 65 | 5,596 | 77 |
| Zone 2 | 1,559 | 4.06 | 5.60 | 0.74 | 43.40 | 0.43 | 139 | 193 | 25 | 2,175 | 22 |
| Zone 3 | 1,307 | 3.83 | 5.13 | 0.63 | 48.08 | 0.44 | 110 | 148 | 18 | 2,020 | 18 |
| Zone 4 | 4,492 | 3.28 | 4.95 | 0.83 | 57.56 | 0.87 | 325 | 490 | 82 | 8,312 | 126 |
| Zone 11 | 373 | 4.25 | 3.30 | 0.35 | 33.65 | 0.29 | 35 | 27 | 3 | 404 | 3 |
| Total Inferred | 12,087 | 3.56 | 4.94 | 0.79 | 48.04 | 0.67 | 940 | 1,317 | 212 | 18,667 | 260 |
| 2. | Mineral Resources are not Mineral Reserves and do not have demonstrated economic viability. There is no certainty that all or any part of the Mineral Resources will be converted to Mineral Reserves. |
| 3. | Resources stated as contained within potentially economically minable underground shapes above a US$75.00/t NSR cut-off. |
| 4. | NSR calculation is based on assumed metal prices of $2.50/lb for copper, $1,000/oz for gold, $16.00/oz for silver, $1.00/lb for zinc and $1.00/lb for lead. A mining cost of $45.00/t and combined processing and G&A costs of $31.00 were assumed to form the basis for the resource NSR cut-off determination. |
| 5. | Mineral resource tonnage and contained metal have been rounded to reflect the accuracy of the estimate, and numbers may not add due to rounding. |
| 6.3.7 | SRK (2012) Resource Estimation Update |
In 2012, as a result of the spinoff of NovaCopper from NovaGold, NovaCopper commissioned SRK to further update the 2011 Arctic Project PEA.
The 2012 mineral resource was developed from a drill hole database consisting of 131 core holes, 108 of which intercepted significant mineralization. Of the 28,350 m drilled within the Arctic Deposit, 6,220 intervals were sampled, representing 12,434 m of sampled drilling. No other changes were made to the 2008 SRK estimation methodology and criteria as previously outlined. There were no changes made to the classification criteria, and no adjustments were made to metal pricing or operating costs related to the 2011 PEA. Table 6-11 shows the mineral resource estimate as reported March 9, 2012.
| Trilogy Metals Inc. | 6-17 | |
NI 43-101 Technical Report on the Arctic Project,
Northwest Alaska | | |
| Table 6-11 | Arctic Deposit Resources at $75 NSR Cut-off – 2012 SRK |
| Resource | Grade | Contained Metal |
| Zone | kt | Cu
(%) | Zn
(%) | Pb
(%) | Ag
(g/t) | Au
(g/t) | Cu
(Mlb) | Zn
(Mlb) | Pb
(Mlb) | Ag
(koz) | Au
(koz) |
| Indicated |
| Zone 1 | 5,667 | 4.50 | 6.15 | 1.06 | 63.39 | 0.91 | 562 | 768 | 132 | 11,549 | 165 |
| Zone 2 | 3,792 | 4.55 | 6.05 | 0.97 | 50.79 | 0.52 | 380 | 505 | 81 | 6,193 | 63 |
| Zone 3 | 2,448 | 3.56 | 5.56 | 0.91 | 53.69 | 0.67 | 192 | 300 | 49 | 4,226 | 53 |
| Zone 4 | 7,020 | 3.57 | 65.68 | 0.96 | 65.18 | 0.96 | 553 | 880 | 149 | 14,711 | 216 |
| Zone 11 | 517 | 4.16 | 3.32 | 0.34 | 32.86 | 0.25 | 47 | 38 | 4 | 546 | 4 |
| Total Indicated | 19,445 | 4.05 | 5.81 | 0.97 | 59.55 | 0.80 | 1,735 | 2,491 | 415 | 37,226 | 501 |
| Inferred |
| Zone 0 | 1,242 | 2.16 | 2.19 | 0.70 | 4.14 | 0.35 | 59 | 60 | 19 | 165 | 14 |
| Zone 1 | 2,918 | 3.82 | 5.53 | 0.92 | 53.83 | 0.70 | 246 | 356 | 59 | 5,050 | 66 |
| Zone 2 | 1,386 | 4.16 | 5.90 | 0.79 | 45.43 | 0.39 | 127 | 180 | 24 | 2,025 | 18 |
| Zone 3 | 1,177 | 3.99 | 5.04 | 0.61 | 48.45 | 0.47 | 104 | 131 | 16 | 1,833 | 18 |
| Zone 4 | 4,313 | 3.18 | 4.88 | 0.83 | 55.33 | 0.84 | 302 | 464 | 79 | 7,672 | 116 |
| Zone 11 | 373 | 4.25 | 3.30 | 0.35 | 33.66 | 0.29 | 35 | 27 | 3 | 404 | 3 |
| Total Inferred | 11,409 | 3.47 | 4.84 | 0.80 | 46.75 | 0.64 | 873 | 1,217 | 201 | 17,149 | 235 |
| 2. | Mineral Resources are not Mineral Reserves and do not have demonstrated economic viability. There is no certainty that all or any part of the Mineral Resources will be converted to Mineral Reserves. |
| 3. | Resources stated as contained within potentially economically minable underground shapes above a US$75.00/t NSR cut-off. |
| 4. | NSR calculation is based on assumed metal prices of $2.50/lb for copper, $1,000/oz for gold, $16.00/oz for silver, $1.00/lb for zinc and $1.00/lb for lead. A mining cost of $45.00/t and combined processing and G&A costs of $31.00 were assumed to form the basis for the resource NSR cut-off determination. |
| 5. | Mineral resource tonnage and contained metal have been rounded to reflect the accuracy of the estimate, and numbers may not add due to rounding. |
| 6.3.8 | Tetra Tech (2013) RESOURCE ESTIMATION UPDATE |
The 2013 mineral resource was supported by 10,323 samples from 135 drill holes; 43 core holes (approximately 13,500 m) drilled by NovaGold and 92 core holes (approximately 17,600 m) drilled by previous owners Kennecott, and/or a Kennecott subsidiary. Differences between the previously reported mineral resource estimate (SRK 2012) and the Tetra Tech estimate (2013) are primarily related to additional drilling, updated geological interpretation, additional specific gravity determinations, and reporting of grades and tonnes within an open pit designed to support the requirements for reasonable prospects for economic extraction. Table 6-12 and Table 6-13 show the mineral resource estimate as reported July 30, 2013.
| Trilogy Metals Inc. | 6-18 | |
NI 43-101 Technical Report on the Arctic Project,
Northwest Alaska | | |
| Table 6-12 | Indicated Mineral Resource Table Restated by Mineralization Zone, Arctic Project, Alaska, Tetra Tech (July 30, 2013) |
| Indicated | Mt | Cu
(%) | Zn
(%) | Pb
(%) | Au
(g/t) | Ag
(g/t) | Cu
(Blb) | Zn
(Blb) | Pb
(Blb) | Au
(Moz) | Ag
(Moz) |
| amb1 | 8.053 | 2.53 | 3.04 | 0.49 | 0.68 | 50.3 | 450 | 540 | 87.1 | 0.18 | 13.0 |
| amb2 | 0.930 | 3.20 | 7.17 | 1.30 | 0.77 | 68.3 | 66 | 147 | 26.7 | 0.02 | 2.0 |
| amb3 | 5.955 | 3.21 | 3.82 | 0.64 | 0.42 | 38.1 | 449 | 501 | 84.4 | 0.08 | 7.3 |
| amb4 | 1.393 | 4.42 | 9.12 | 1.58 | 0.79 | 89.8 | 136 | 280 | 48.6 | 0.04 | 4.0 |
| amb5 | 7.517 | 3.70 | 5.25 | 0.93 | 0.95 | 59.5 | 613 | 870 | 153.9 | 0.23 | 14.4 |
| Total | 23.848 | 3.26 | 4.45 | 0.76 | 0.71 | 53.2 | 1,713 | 2,338 | 400.9 | 0.55 | 40.8 |
| Table 6-13 | Inferred Mineral Resource Table Restated by Mineralization Zone, Arctic Project, Alaska, Tetra Tech (July 30, 2013) |
| Inferred | Mt | Cu
(%) | Zn
(%) | Pb
(%) | Au
(g/t) | Ag
(g/t) | Cu
(Blb) | Zn
(Blb) | Pb
(Blb) | Au
(Moz) | Ag
(Moz) |
| amb1 | 1.120 | 3.07 | 4.25 | 0.69 | 0.85 | 57.2 | 76 | 105 | 17.1 | 0.03 | 2.1 |
| amb2 | 0.038 | 3.19 | 5.50 | 0.92 | 1.06 | 66.4 | 3 | 5 | 0.8 | 0.00 | 0.1 |
| amb3 | 1.354 | 3.18 | 3.27 | 0.41 | 0.31 | 27.5 | 95 | 98 | 12.4 | 0.01 | 1.2 |
| amb4 | 0.000 | 0.00 | 0.00 | 0.00 | 0.00 | 0.0 | 0 | 0 | 0.0 | 0.00 | 0.0 |
| amb5 | 0.851 | 3.48 | 4.03 | 0.67 | 0.68 | 41.7 | 65 | 76 | 12.6 | 0.02 | 1.1 |
| Total | 3.363 | 3.22 | 3.84 | 0.58 | 0.59 | 41.5 | 239 | 285 | 43.2 | 0.06 | 4.5 |
The following notes apply to Table 6-12 and Table 6-13:
| 1. | These resource estimates have been prepared in accordance with NI 43-101 and the CIM Definition Standards. Mineral resources that are not mineral reserves do not have demonstrated economic viability. Inferred resources have a great amount of uncertainty as to whether they can be mined legally or economically. It is reasonably expected that a majority of Inferred resources will be converted to Indicated resources with continued exploration. |
| 2. | Mineral Resources are reported within mineralization wireframes, contained within an Indicated and Inferred pit design using an assumed copper price of $2.90/lb, zinc price of $0.85/lb, lead price of $0.90/lb, silver price of $22.70/oz, and gold price of $1,300/oz. |
| 3. | Appropriate mining costs, processing costs, metal recoveries and inter ramp pit slope angles were used to generate the pit design. |
| 4. | The $35.01/t milled cut-off is calculated based on a process operating cost of $19.03/t, G&A of $7.22/t and site services of $8.76/t. NSR equals payable metal values, based on the metal prices outlined in Note 2 above, less applicable treatment, smelting, refining costs, penalties, concentrate transportation costs, insurance and losses and royalties. |
| 5. | The LOM strip ratio is 8.39. |
| 6. | Rounding as required by reporting guidelines may result in apparent summation differences between tonnes, grade and contained metal content. |
| 7. | Tonnage and grade measurements are in metric units. Contained copper, zinc and lead pounds are reported as imperial pounds, contained silver and gold ounces as troy ounces. |
| 6.3.9 | Dead Creek, Sunshine and Horse Cliff Historical Resources |
There are a number of other prospects within the Arctic Project boundary, covering the permissive Ambler Sequence. Three of the prospects (Dead Creek, Sunshine and Horse Cliff) have historical resources, as listed in Table 6-14.
The historical economic studies presented below were made prior to the implementation of NI 43-101. They do not conform to NI 43-101 reporting standards and should not be relied upon or interpreted as such. A QP has not done sufficient work to classify the historical estimates as current and Trilogy Metals is not treating the historical estimates as compliant with 43-101 guidelines. They are presented here for informational purposes only.
| Trilogy Metals Inc. | 6-19 | |
NI 43-101 Technical Report on the Arctic Project,
Northwest Alaska | | |
| Table 6-14 | Historical Resources for the Dead Creek, Sunshine and Horse Cliff Prospects |
| Area | Resource
(Mt) | Status | Cu
(%) | Zn
(%) | Pb
(%) | Ag
(g/t) |
| Dead Creek | 1.0 | Historical | 3.0 | 3.0 | 2.0 | 46.6 |
| Sunshine | 20.0 | Historical | 1.4 | 2.5 | 0.5 | 24.8 |
| Horse Cliff | 10.0 | Historical | 1.5 | 4.5 | 1.5 | 31.3 |
All of the historical economic studies presented below were made prior to the implementation of NI 43-101. They do not conform to NI 43-101 reporting standards and should not be relied upon or interpreted as such. A QP has not done sufficient work to classify the historical estimates as current and Trilogy Metals is not treating the historical estimates as compliant with 43-101 guidelines. They are presented here for informational purposes only.
During Kennecott’s tenure on the Arctic property, no less than 10 different economic studies were completed internally. These studies include: J.L. Halls, 1974, “Ambler District Evaluation”; J.L. Halls, 1976, “Arctic Deposit Order of Magnitude Evaluation”; P.A. Metz, 1978, “Arctic Prospect Summary File Report”; J.L. Halls, 1978, “Arctic Deposit”; C.D. Broadbent, 1981, “Evaluation of the Arctic and Ruby Creek Deposits”; R.R. Dimock, 1984, “Evaluation Update”; W.J. Brown, 1985, “Pre-AFD Report”; M.P. Randolph, 1990, “Re-Evaluation”; W.L. Jacobsen, 1997, “Arctic Project Mining Potential”; and J. Earnshaw, 1999, “Interim Report Conceptual Level Economic Evaluations of the Arctic Resource”. In addition to the internal studies, SRK completed a “Preliminary Arctic Scoping Study” in 1998 at the request of Kennecott.
The internal studies contemplated both open pit and underground mining scenarios at a variety of the production rates with prevailing metals pricing, capital and operating costs. The studies also targeted a variety of transportation options including roads to both Cape Krusenstern (north of Kotzebue) and Cape Darby on the Seward Peninsula, as well as railroad options to Cape Krusenstern and Whittier. Two studies also evaluated the air transport of concentrate and supplies. The SRK external study only contemplated various underground mining scenarios and did not address high-level economics.
NovaCopper completed and filed a Preliminary Economic Assessments (PEA) in 2011 and in 2013, on the Arctic Deposit that investigated both underground and open pit potential mining scenarios, respectively. Both are now considered historic documents and should no longer be relied upon. Trilogy Metals is currently in the process of completing a Pre-Feasibility Study (PFS) using Ausenco, AMEC, and SRK as outside consultants.
| Trilogy Metals Inc. | 6-20 | |
NI 43-101 Technical Report on the Arctic Project,
Northwest Alaska | | |
| 7.0 | GEOLOGICAL SETTING AND MINERALIZATION |
| 7.1 | Regional Geology – Southern Brooks Range |
The Ambler District occurs along the southern margin of Brooks Range within an east-west trending zone of Devonian to Jurassic age submarine volcanic and sedimentary rocks (Hitzman et al. 1986). The district covers both: 1) VMS-like deposits and prospects hosted in the Devonian age Ambler Sequence (or Ambler Schist belt), a group of metamorphosed bimodal volcanic rocks with interbedded tuffaceous, graphitic and calcareous volcaniclastic metasediments; and 2) epigenetic carbonate-hosted copper deposits occurring in Devonian age carbonate and phyllitic rocks of the Bornite Carbonate Sequence. The Ambler Sequence occurs in the upper part of the Anirak Schist, the thickest member of the Schist belt or Coldfoot subterrane (Moore et al. 1994). VMS-like stratabound mineralization can be found along the entire 110 km strike length of the district. Immediately south of the Schist belt in the Cosmos Hills, a time equivalent section of the Anirak Schist includes the approximately 1 km thick Bornite Carbonate Sequence. Mineralization of both the VMS-like deposits of the Schist belt and the carbonate-hosted deposits of the Cosmos Hills has been dated at 375 to 387 Ma (Selby et al. 2009; McClelland et al. 2006).
In addition, the Ambler District is characterized by increasing metamorphic grade north perpendicular to the strike of the east-west trending units. The district shows isoclinal folding in the northern portion and thrust faulting to south (Schmidt 1983). The Devonian to Late Jurassic age Angayucham basalt and the Triassic to Jurassic age mafic volcanic rocks are in low-angle over thrust contact with various units of the Ambler Schist belt and Bornite Carbonate Sequence along the northern edge of the Ambler Lowlands.
| 7.1.1 | Terrane Descriptions |
The terminology of terranes in the southern Brooks Range evolved during the 1980s because of the region’s complex juxtaposition of rocks of various composition, age and metamorphic grade. Hitzman et al. (1986) divided the Ambler District into the Ambler and Angayucham terranes. Recent work (Till et al. 1988; Silberling et al. 1992; Moore et al. 1994) includes the rocks of the previously defined Ambler terrane as part of the regionally extensive Schist belt or Coldfoot subterrane along the southern flank of the Arctic Alaska terrane as shown in Figure 7-1 (Moore et al. 1994). In general, the southern Brooks Range is composed of east-west trending structurally bound allochthons of variable metasedimentary and volcanogenic rocks of Paleozoic age.
| Trilogy Metals Inc. | 7-1 | |
NI 43-101 Technical Report on the Arctic Project,
Northwest Alaska | | |
| Figure 7-1 | Geologic Terranes of the Southern Brooks Range (Trilogy Metals, 2017) |
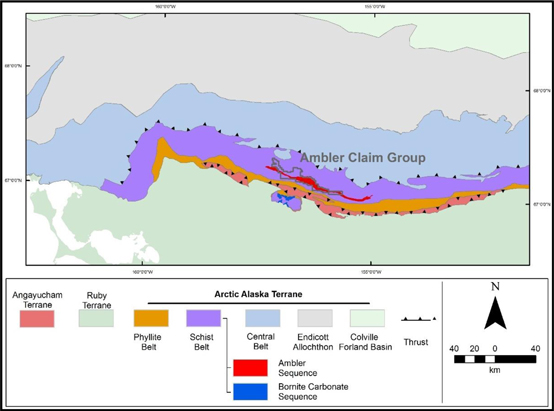
The Angayucham terrane, which lies along southern margin of the Brooks Range, is locally preserved as a klippen within the eastern Cosmos Hills and is composed of weakly metamorphosed to unmetamorphosed massive-to-pillowed basalt rocks with minor radiolarian cherts, marble lenses and isolated ultramafic rocks. This package of Devonian to Late Jurassic age (Plafker et al. 1977) mafic and ultramafic rocks is interpreted to represent portions of an obducted and structurally dismembered ophiolite that formed in an ocean basin south of the present day Brooks Range (Hitzman et al. 1986; Gottschalk and Oldow 1988). Locally, the Angayucham terrane overlies the schist belt to the north along a poorly exposed south-dipping structure.
Gottschalk and Oldow (1988) describe the Schist belt as a composite of structurally bound packages composed of dominantly greenschist facies rocks, including pelitic to semi-pelitic quartz-mica schist with associated mafic schists, metagabbro and marbles. Locally, the Schist belt includes the middle Devonian age Bornite Carbonate Sequence, the lower Paleozoic age Anirak pelitic, variably siliceous and graphic schists, and the mineralized Devonian age Ambler sequence consisting of volcanogenic and siliciclastic rocks variably associated with marbles, calc-schists, metabasites and mafic schists (Hitzman et al. 1982; Hitzman et al. 1986). The lithologic assemblage of the Schist belt is consistent with an extensional, epicontinental tectonic origin.
Structurally overlaying the Schist belt to the north is the Central belt. The Central belt is in unconformable contact with the Schist belt along a north-dipping low-angle structure (Till et al., 1988). The Central belt consists of lower Paleozoic age metaclastic and carbonate rocks, and Proterozoic age schists (Dillon et al. 1980). Both the Central belt and Schist belt are intruded by meta-to-peraluminous orthogneisses, which locally yield a slightly discordant U-Pb thermal ionization mass spectrometry (TIMS) zircon crystallization age of middle to late Devonian (Dillon et al. 1980; Dillon et al. 1987). This igneous protolith age is supported by Devonian orthogneiss ages obtained along the Dalton Highway, 161 km to the east of the Ambler District (Aleinikoff et al. 1993).
| Trilogy Metals Inc. | 7-2 | |
NI 43-101 Technical Report on the Arctic Project,
Northwest Alaska | | |
Overlaying the Schist belt to the south is the Phyllite belt, characterized in the Ambler mining district as phyllitic black carbonaceous schists of the Beaver Creek Phyllite which is assumed to underlie much of the Ambler Lowlands between the Brooks Range and the Arctic Deposit to the north and the Cosmos Hills and the Bornite Deposit to the south. The recessive weathering nature of the Beaver creek phyllite limits the exposure but is assumed to occur as a thrust sheet overlying the main Schist belt rocks.
| 7.1.2 | Regional Tectonic Setting |
Rocks exposed along the southern Brooks Range consist of structurally bound imbricate allochthons that have experienced an intense and complex history of deformation and metamorphism. Shortening in the fold and thrust belt has been estimated by some workers to exceed 500 km (Oldow et al. 1987) based on balanced cross sections across the central Brooks Range. In general, the metamorphic grade and tectonism in the Brooks Range increases to the south and is greatest in the Schist belt. The tectonic character and metamorphic grade decreases south of the Schist belt in the overlaying Angayucham terrane.
In the late Jurassic to early Cretaceous age, the Schist belt experienced penetrative thrust-related deformation accompanied by recrystallization under high-pressure and low-temperature metamorphic conditions (Till et al. 1988). The northward directed compressional tectonics were likely related to crustal thickening caused by obduction of the Angayucham ophiolitic section over a south-facing passive margin. Thermobarometry of schists from the structurally deepest section of the northern Schist belt yield relict metamorphic temperatures of 475°C, ±35°C, and pressures from 7.6 to 9.8 kb (Gottschalk and Oldow 1988). Metamorphism in the schist belt grades from lowest greenschist facies in the southern Cosmos Hills to upper greenschist facies, locally overprinting blueschist mineral assemblages in the northern belt (Hitzman et al. 1986).
Compressional tectonics, which typically place older rocks on younger, do not adequately explain the relationship of young, low-metamorphic-grade over older and higher-grade metamorphic rocks observed in the southern Brooks Range hinterland. Mull (1982) interpreted the Schist belt as a late antiformal uplift of the basement to the fold and thrust belt. More recent models propose that the uplift of the structurally deep Schist belt occurred along duplexed, north-directed, thin-skinned thrust faults, followed by post-compressional south-dipping low angle normal faults along the south flank of the Schist belt, accommodating for an over-steepened imbricate thrust stack (Gottschalk and Oldow 1988; Moore et al. 1994). Rapid cooling and exhumation of the Schist belt began at the end of the early Cretaceous age at 105 to 103 Ma, based on Ar40/Ar39cooling ages of hornblende and white mica near Mount Igikpak, and lasted only a few million years (Vogl et al. 2003). Additional post-extension compressive events during the Paleocene age further complicate the southern Brooks Range (Mull 1985).
| Trilogy Metals Inc. | 7-3 | |
NI 43-101 Technical Report on the Arctic Project,
Northwest Alaska | | |
| 7.2 | Ambler Sequence Geology |
Rocks that form the Ambler Sequence consist of a lithologically diverse sequence of lower Paleozoic Devonian age carbonate and siliciclastic strata with interlayered mafic lava flows and sills. The clastic strata, derived from terrigenous continental and volcanic sources, were deposited primarily by mass-gravity flow into the sub-wavebase environment of an extending marginal basin.
The Ambler Sequence underwent two periods of intense, penetrative deformation. Sustained upper greenschist-facies metamorphism with coincident formation of a penetrative schistosity and isoclinal transposition of bedding marks the first deformation period. Pervasive similar-style folds on all scales deform the transposed bedding and schistosity, defining the subsequent event. At least two later non-penetrative compressional events deform these earlier fabrics. Observations of the structural and metamorphic history of the Ambler District are consistent with current tectonic evolution models for the Schist belt, based on the work of others elsewhere in the southern Brooks Range (Gottschalk and Oldow 1988; Till et al. 1988; Vogl et al. 2002).
Figure 7-2 shows the location and geology of the Ambler mining district and the Schist belt terrane including the Anirak schist, the Kogoluktuk schist and the Ambler Sequence, the contemporaneous Bornite Carbonate Sequence in the Cosmos Hills to the south, and the allochthonous overthrust Cretaceous sedimentary rocks and Devonian Angayucham volcanic rocks.
| Trilogy Metals Inc. | 7-4 | |
NI 43-101 Technical Report on the Arctic Project,
Northwest Alaska | | |
| Figure 7-2 | Geology of the Ambler Mining District (Trilogy Metals, 2017) |
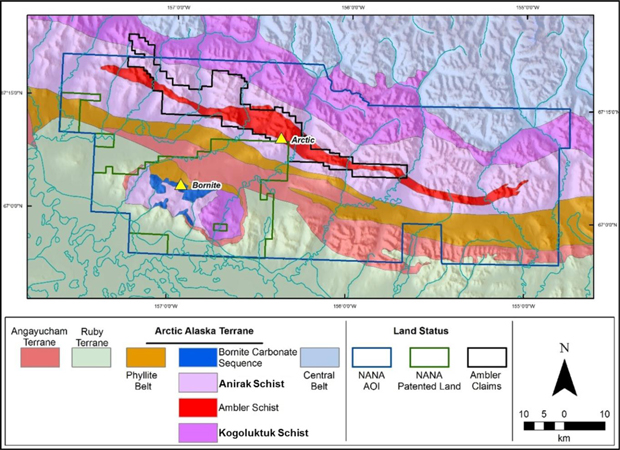
| 7.2.1 | General Stratigraphy of the Ambler Sequence |
Though the Ambler Sequence is exposed over 110 km of strike length, descriptions and comments herein will refer to an area between the Kogoluktuk River on the east and the Shungnak River on the west where Trilogy Metals has focused the majority of its exploration efforts over the last decade.
The local base of the Ambler Sequence consists of variably metamorphosed carbonates historically referred to as the Gnurgle Gneiss. Trilogy Metals interprets these strata as calc-turbidites, perhaps deposited in a sub-wavebase environment adjacent to a carbonate bank. Calcareous schists overlie the Gnurgle Gneiss and host sporadically distributed mafic sills and pillowed lavas. These fine-grained clastic strata indicate a progressively quieter depositional environment up section, and the presence of pillowed lavas indicates a rifting, basinal environment.
Overlying these basal carbonates and pillowed basalts is a section of predominantly fine-grained carbonaceous siliciclastic rocks which host a significant portion of the mineralization in the district including the Arctic Deposit. This quiescent section indicates further isolation from a terrigenous source terrain.
| Trilogy Metals Inc. | 7-5 | |
NI 43-101 Technical Report on the Arctic Project,
Northwest Alaska | | |
The section above the Arctic Deposit host stratigraphy contains voluminous reworked silicic volcanic strata with the Button Schist at its base. The Button Schist is a regionally continuous and distinctive albite porphyroblastic unit that serves as an excellent marker above the main mineralized stratigraphy. The paucity of volcanically derived strata below the Arctic Deposit host section and abundance above indicates that the basin and surrounding hinterlands underwent major tectonic reorganization during deposition of the Arctic Deposit section. Greywacke sands that Trilogy Metals interpret as channeled high-energy turbidites occur throughout the section but concentrate high in the local stratigraphy. Figure 7-3 shows idealized sections for several different areas in and around the Arctic Deposit.
Several rock units show substantial change in thickness and distribution in the vicinity of the Arctic Deposit that may have resulted from the basin architecture existing at the time of deposition. Between the Arctic Ridge, geographically above the Arctic Deposit, and the Riley Ridge to the west several significant differences have been documented including:
| · | The Gnurgle Gneiss is thickest in exposures along the northern extension of Arctic Ridge and appears to thin to the west. |
| · | Mafic lavas and sills thicken from east to west. They show thick occurrences in upper Subarctic Creek and to the west, but are sparsely distributed to the east. |
| · | The quartzite section within and above the Arctic sulphide horizon does not occur in abundance east of Arctic Ridge; it is thicker and occurs voluminously to the west. |
| · | Button Schist thickens dramatically to the west from exposures on Arctic Ridge; exposures to the east are virtually nonexistent. |
| · | Greywacke sands do not exist east of Subarctic Creek but occur in abundance as massive, channeled accumulations to the west, centered on Riley Ridge. |
These data are interpreted by Trilogy Metals to define a generally north-northwest-trending depocentre through the central Ambler District. Volcanic debris flow occurrences described below in concert with these formational changes suggest that the depocentre had a fault-controlled eastern margin. The basin deepened to the west; the Riley Ridge section deposited along a high-energy axis, and the COU section lies to the west-southwest distally from a depositional energy point of view. This original basin architecture appears to have controlled mineralization of the sulphide systems at Arctic and Shungnak (Dead Creek), concentrating fluid flow along structures on the eastern basin margin.
Figure 7-4 is a simplified geologic map of the area between the Kogoluktuk and the Shungnak rivers.
| Trilogy Metals Inc. | 7-6 | |
NI 43-101 Technical Report on the Arctic Project,
Northwest Alaska | | |
| Figure 7-3 | Ambler Sequence Stratigraphy in the Arctic Deposit Area (Trilogy Metals, 2017) |
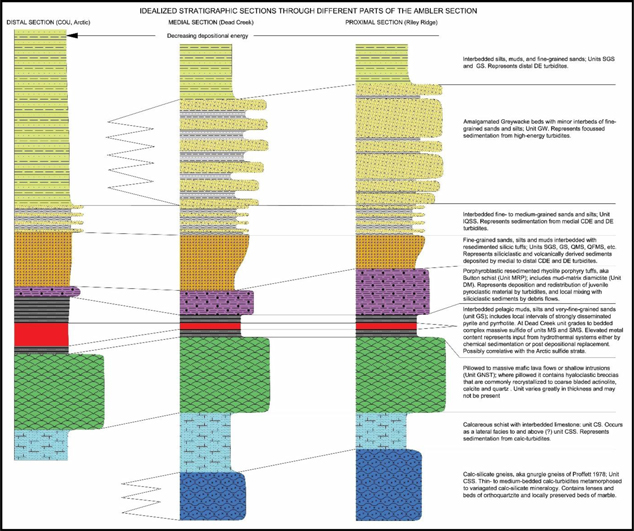
| Trilogy Metals Inc. | 7-7 | |
NI 43-101 Technical Report on the Arctic Project,
Northwest Alaska | | |
| Figure 7-4 | Generalized Geology of the Central Ambler District (Trilogy Metals, 2017) |
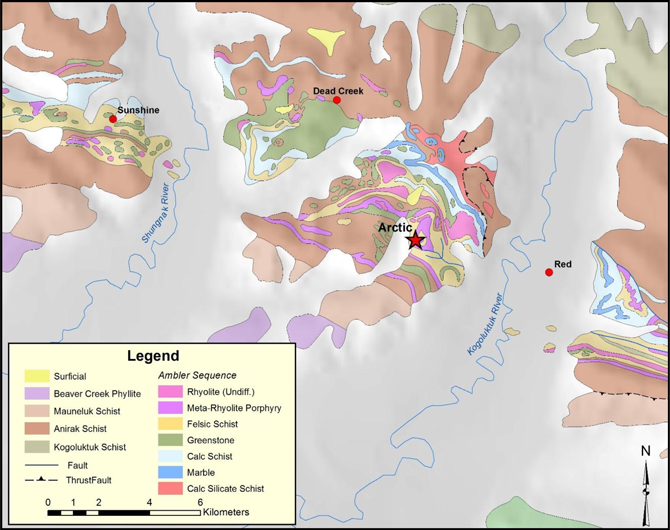
| Trilogy Metals Inc. | 7-8 | |
NI 43-101 Technical Report on the Arctic Project,
Northwest Alaska | | |
| 7.2.2 | Structural Framework of the Ambler District |
In addition to the underlying pre-deformational structural framework of the district suggested by the stratigraphic thickening of various facies around the Arctic Deposit, the Ambler Sequence is deformed by two penetrative deformational events that significantly complicate the distribution and spatial arrangement of the local stratigraphy.
F1 Deformation
The earliest penetrative deformation event is associated with greenschist metamorphism and the development of regional schistosity. True isoclinal folds are developed and fold noses typically are thickened. The most notable F1 fold is the Arctic antiform that defines the upper and lower limbs of the Arctic Deposit. The fold closes along a north-northeast- trending fold axis roughly mimicking the trace of Subarctic Creek and opening to the east. Importantly, the overturned lower limb implies that the permissive stratigraphy should be repeated on a lower synformal isocline beneath the currently explored limbs and would connect with the permissive mineralized stratigraphy to the northwest at Shungnak (Dead Creek). Figure 7-5 shows typical F1 folds developed in calcareous Gnurgle Gneiss.
| Figure 7-5 | Typical F1 Isoclinal Folds Developed in Calcareous Gnurgle Gneiss |

F2 Deformation
The earlier F1 schistosity is in turn deformed by the F2 deformational event that resulted in the local development of an axial planar cleavage. The deformational event is well defined throughout the Schist belt and results in a series of south verging open to moderately overturned folds that define a series of east-west trending folds of similar vergence across the entire Schist belt stratigraphies.
| Trilogy Metals Inc. | 7-9 | |
NI 43-101 Technical Report on the Arctic Project,
Northwest Alaska | | |
This event is likely temporarily related to the emplacement of the Devonian Angayucham volcanics, the obducted Jurassic ophiolites and Cretaceous sediments over the Schist belt stratigraphies.
In addition to the earlier penetrative deformation events, a series of poorly defined non-penetrative deformation likely as a consequence of Cretaceous extension are seen as a series of warps or arches across the district.
The interplay between the complex local stratigraphy, the isoclinal F1 event, the overturned south verging F2 event and the series of post-penetrative deformational events makes district geological interpretation often extremely difficult at a local scale.
| 7.3 | Arctic Deposit Geology |
Previous workers at the Arctic Deposit (Russell 1995 and Schmidt 1983) describe three mineralized horizons at the Arctic Deposit: the Main Sulphide Horizon, the Upper South Horizon and the Warm Springs Horizon. The Main Sulphide Horizon was further subdivided into three zones: the southeast zone, the central zone and the northwest zone. Previous deposit modelling was grade-based resulting in numerous individual mineralized zones representing relatively thin sulphide horizons.
Recent work by Trilogy Metals define the Arctic Deposit as two or more discrete horizons of sulphide mineralization contained in a complexly deformed isoclinal fold with an upright upper limb and an overturned lower limb hosting the main mineral resources. Nearby drilling suggests a third limb, an upright lower limb, likely occurs beneath the currently explored stratigraphy.Figure 7-6 is a generalized geologic map of the immediate Arctic Deposit area.
| Trilogy Metals Inc. | 7-10 | |
NI 43-101 Technical Report on the Arctic Project,
Northwest Alaska | | |
| Figure 7-6 | Generalized Geologic Map of the Arctic Deposit (Trilogy Metals, 2017) |
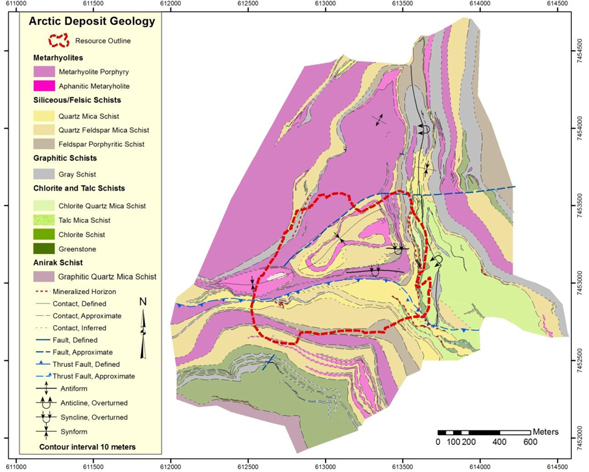
| 7.3.1 | Lithologies and Lithologic Domain Descriptions |
Historically, five lithologic groupings have been utilized by Kennecott (URSA Engineering 1998 and Russell 1995) to describe the local stratigraphy of the deposit. These groupings include: 1) metarhyolite (Button Schist) or porphyroblastic quartz feldspar porphyry and rhyolitic volcaniclastic and tuffaceous rocks; 2) quartz mica schists composed of tuffaceous and volcaniclastic sediments; 3) graphitic schists composed of carbonaceous sedimentary rocks; 4) base metal sulphide bearing schists; and 5) talc schists composed of talc altered volcanic and sedimentary rocks.
The principal lithologic units captured in logging and mapping by Trilogy Metals are summarized and described in the following subsections, in broadly chronologically order from oldest to youngest.
Greenstone (GNST)
Greenstones are typically massive dark-green amphibole- and garnet-bearing rocks, differentiated by their low quartz content and dark green color. Textural and colour similarities along with similar garnet components and textures often cause confusion with some sedimentary greywackes within the Ambler Sequence stratigraphy. Intervals of greenstone range up to 80 m in thickness and are identified as pillowed flows, sills and dikes. Multiple ages of deposition are implied as both basal pillowed units are present as well as intrusive sill and dike-like bodies higher in the local stratigraphy.
| Trilogy Metals Inc. | 7-11 | |
NI 43-101 Technical Report on the Arctic Project,
Northwest Alaska | | |
Chlorite Schist (ChS)
This unit is likely alteration-related but has been used for rocks where more than half of the sheet silicates are composed of chlorite. In the field, some samples of chlorite schist showed a distinctive dark green to blue-green colour, but in drill core the chlorite schists commonly have lighter green colour. Some intervals of chlorite schist are associated with talc-rich units.
Talc Schist (TS)
Talc-bearing schists are often in contact with chlorite-rich units and reflect units which contain trace to as much as 10% talc often occurring on partings. Like the chlorite schist this unit is likely alteration related.
Black to Grey Schist (GS)
Black or grey schists appear in many stratigraphic locations particularly higher in the stratigraphy but principally constitute the mineralized permissive stratigraphy of the Arctic Deposit lying immediately below the Button Schist (MRP). The unit is typically composed of muscovite, quartz, feldspar, graphite, and sometimes chlorite, biotite or sulphides. The texture is phyllitic, variably crenulated, well-foliated and suggests a pelitic protolith, likely deposited in a basin progressively filled with terrigenous fine sediment. This unit is host to the MS and SMS horizons that constitute the Arctic Deposit.
Button Schist (MRP)
This rock type consists of quartz-muscovite-feldspar schists with abundant distinctive 1 to 3 cm albite porphyroblasts of metamorphic origin and occasional 0.5 to 2 cm blue quartz phenocrysts of likely igneous origin. The unit shows a commonly massive to weakly foliated texture, although locally the rocks have a well-developed foliation with elongate feldspars.
Quartz-Mica-(Feldspar) Schist (QMS/QFMS)
This schistose rock contains variable proportions of quartz, muscovite, and sometimes feldspar. Most contain high amounts of interstitial silica, and some have feldspar or quartz porphyroblasts. The texture of the unit shows significant variability and likely represents both altered and texturally distinct felsic tuffs and volcaniclastic lithologies.
Volcanic Debris FLOW (Dm)
This unit contains a range of unsorted, matrix supported polylithic clasts including Button Schist occurring in black to dark grey, very fine-grained graphitic schist. The unit occurs as lenses with other stratigraphies and likely represents local derived debris flows or slumps.
| Trilogy Metals Inc. | 7-12 | |
NI 43-101 Technical Report on the Arctic Project,
Northwest Alaska | | |
Greywacke (GW)
This unit consists of massive green rocks with quartz, chlorite, probably amphibole, feldspar, muscovite, and accessory garnet, biotite, and calcite/carbonate. Voluminous accumulations of medium-grained greywacke occur within, but generally above, the quartz mica schist and are differentiated from texturally similar greenstones by the presence of detrital quartz, fine-grained interbeds, graded bedding and flute casts.
Lithogeochemistry of Immobile Trace Elements
In 2007, work by NovaGold suggested that many of the nondescript felsic metavolcanic lithologies were simply alteration and textural variants of the felsic rock units and not adequately capturing true compositional lithological differences between units. Twelker (2008) demonstrated that the use of lithogeochemistry utilizing immobile trace elements specifically Al2O3:TiO2 (aluminium oxide:titanium dioxide) ratios could be used to effectively differentiate between different felsic volcanic and sedimentary suites of rocks at the Arctic Deposit.
Lithogeochemistry shows three major felsic rock suites in the Arctic Deposit area: a rhyolite suite; and intermediate volcanic suite and a volcaniclastic suite. These suites are partially in agreement with the logged lithology but in some instances show that alteration in texture and composition masked actual lithologic differences.
Results of the lithogeochemistry have led to a better understanding of the stratigraphic continuity of the various units and have been utilized to more accurately model the lithologic domains of the Arctic Deposit.
Lithologic Domains
Though a variety of detailed lithologies are logged during data capture, Trilogy Metals models the deposit area as two distinct units –an Upper Plate and Lower Plate separated by the Warm Springs Fault. The Upper and Lower plates contain similar lithologic domains which are primarily defined by lithogeochemical characteristics, but are also consistent with their respective acid-generating capacities and spatial distribution around the fold axes, and include the following units: the Button Schist (a meta-rhyolite porphyry - MRP), aphanitic meta-rhyolite (AMR), a series of felsic quartz mica schists (QMS), and carbonaceous schists of the Grey Schist unit (GS). An alteration model has been built to adequately characterize the chlorite and talc schists found within the deposit (ChS, ChTS, and TS). The mineralization is modelled as eight distinct zones (Zones 1 – 8) found both in the Upper and Lower plates and range from massive sulfide to semi-massive sulfide layers (MS and SMS).
Earlier studies (Russell 1977, 1995; Schmidt 1983) concluded mineralization at the Arctic deposit was part of a normal stratigraphic sequence striking northeast and dipping gently southwest. Subsequent reinterpretation by Kennecott in 1998 and 1999 suggested the entire Ambler Sequence at Arctic could be overturned. Proffett (1999) reviewed the Arctic geology and suggested that a folded model with mineralization as part of an isoclinal anticline opening east and closing west could account for the mapped and logged geology. His interpretation called for an F2 fold superimposed on a north-trending F1 fabric.
| Trilogy Metals Inc. | 7-13 | |
NI 43-101 Technical Report on the Arctic Project,
Northwest Alaska | | |
Lindberg (2004) supported a folded model similar to Proffett, though he felt the main fold at Arctic is northwest closing and southeast opening. Lindberg named this feature the Arctic Antiform, and interpreted this structure to be an F1 fold.
Lindberg believes the majority of folding within the mineralized horizons occurs in the central part of the deposit within a southwest plunging “cascade zone.” The increased thicknesses of mineralized intervals in this part of the property can in part be explained by the multiple folding of two main mineralized horizons as opposed to numerous individual mineralized beds as shown in the 1995 geologic model. The cascade zone appears to be confined to the upper sulphide limbs of the Arctic Antiform.
Continuity drilling on closer spacing in 2008 across the “cascade” zone confirms the continuity of the two mineralized horizons but does not support the complexity proposed by Lindberg. Dodd et al. (2004) suggested that some of the complexity might be related to minor thrusting. Results of 2006 mapping at Arctic supported the interpretation that an F2 fold event may fold the lower Button Schist back to the north under the deposit in this area (Otto 2006). Deep drilling in 2007 just to the north of the deposit to test the concept drilled the appropriate upright stratigraphy at depth. Though the target horizon was not reached due to the drill rig limitations the hole did encountered significant mineralization below the Button Schist immediately above the sulphide-bearing permissive stratigraphy. That hole (AR07-110) intersected roughly 35 m of anomalous mineralization including 0.45 m of 1.17% copper, 0.8% lead, 5.8% zinc, 49.7 g/t silver and 0.7 g/t gold.
Schmidt (1988) defined three main zones of hydrothermal alteration occurring at the Arctic Deposit:
| · | A main chloritic zone occurring within the footwall of the deposit consisting of phengite and magnesium-chlorite. |
| · | A mixed alteration zone occurring below and lateral to sulphide mineralization consisting of phengite and phlogopite along with talc, calcite, dolomite and quartz. |
| · | A pyritic zone overlying the sulphide mineralization. |
Field observations conducted by Trilogy Metals in 2004 and 2005 supported by logging and short wave infrared (SWIR) spectrometry only partially support Schmidt’s observations.
Talc and magnesium chlorite are the dominant alteration products associated with the sulphide-bearing horizons. Talc alteration grades downward and outward to mixed talc-magnesium chlorite with minor phlogopite, into zones of dominantly magnesium chlorite, then into mixed magnesium chlorite-phengite with outer phengite-albite zones of alteration. Thickness of alteration zones vary with stratigraphic interpretation, but tens of metres for the outer zones is likely, as seen in phengite-albite exposures on the east side of Arctic Ridge.
| Trilogy Metals Inc. | 7-14 | |
NI 43-101 Technical Report on the Arctic Project,
Northwest Alaska | | |
Stratigraphically above the sulphide-bearing horizons significant muscovite as paragonite is developed and results in a marked shift in sodium/magnesium (Na/Mg) ratios across the sulphide bearing horizons.
Visual and quantitative determination of many of the alteration products is difficult at best due to their light colours and the well-developed micaceous habit of many of the alteration species. Logging in general has poorly captured the alteration products and the SWIR methodology though far more effective in capturing the presence or absence of various alteration minerals adds little in any quantitative assessment.
Of particular note are the barium species including barite, cymrite (a high-pressure Ba phyllosilicate), and Ba-bearing muscovite, phlogopite and biotite. These mineral species are associated with both alteration and mineralization and demonstrate local remobilization during metamorphism (Schmandt 2009). Though little has been done to document their distribution, they do have a significant impact on bulk density measurements.
Additional discussion of the potential impacts of barite is discussed in the SG section (Section 11.0 and 1.0) of this report.
Talc is of particular importance at the Arctic Deposit due to its potential negative impact on flotation characteristics during metallurgical processing as well as for geotechnical pit slope stability. A great deal of effort has gone into modeling the distribution of talc and talc-chlorite units throughout the deposit area; even zones as small as 10cm have been logged and mapped. The majority of the talc zones occur between the upper, stratigraphically up-right zones and the lower, overturned zones. Significant metallurgical test work has demonstrated that a talc pre-float eliminates talc from interfering with subsequent extraction and concentration of the base and precious metals (See Section 13.0 for further details). As for the geotechnical stabilities, SRK has completed detailed studies and these will be included in future pit slope stability studies (SRK: Pre-feasibility Slope Geotechnical and Hydrogeological Report for the Arctic Deposit).
| 7.4 | Arctic Deposit Mineralization |
Mineralization occurs as stratiform SMS to MS beds within primarily graphitic schists and fine-grained quartz mica schists. The sulphide beds average 4 m in thickness but vary from less than 1 m up to as much as 32 m in thickness. The sulfide mineralization occurs within eight modelled zones lying along the upper and lower limbs of the Arctic isoclinal anticline. All of the zones are within an area of roughly 1 km2with mineralization extending to a depth of approximately 250 m below the surface. There are five zones of MS and SMS that occur at specific pseudo-stratigraphic levels which make up the bulk of the mineral resources. The other three zones also occur at specific pseudo-stratigraphic levels, but are too discontinuous to confidently model as resources.
| Trilogy Metals Inc. | 7-15 | |
NI 43-101 Technical Report on the Arctic Project,
Northwest Alaska | | |
Unlike more typical VMS deposits, mineralization is not characterized by steep metal zonation or massive pyritic zones. Mineralization is dominantly sheet-like zones of base metal sulphides with variable pyrite and only minor zonation usually on an extremely small scale.
Mineralization is predominately coarse-grained sulphides consisting mainly of chalcopyrite, sphalerite, galena, tetrahedrite-tennantite, pyrite, arsenopyrite, and pyrrhotite. Trace amounts of electrum are also present. Gangue minerals associated with the mineralized horizons include quartz, barite, white mica, chlorite, stilpnomelane, talc, calcite, dolomite and cymrite. Figure 7-7 shows a typical massive sulphide interval. The 2 m interval grades 8.2% copper, 11.6% zinc, 1.6% lead, 103.2 g/t silver and 0.82 g/t gold.
| Figure 7-7 | Typical Massive Sulphide Mineralization at the Arctic Deposit |
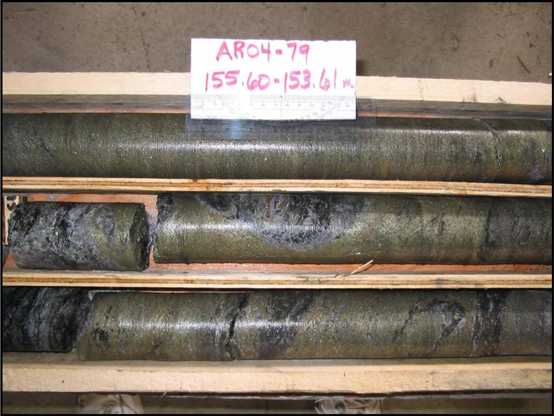
Historic interpretation of the genesis of the Ambler Schist belt deposits have called for a syngenetic VMS origin with steep thermal gradients in and around seafloor hydrothermal vents resulting in metal deposition due to the rapid cooling of chloride-complexed base metals. A variety of VMS types have been well documented in the literature (Franklin et al. 2005) with the Ambler Schist belt deposits most similar to deposits associated with bimodal felsic dominant volcanism related to incipient rifting.
| Trilogy Metals Inc. | 7-16 | |
NI 43-101 Technical Report on the Arctic Project,
Northwest Alaska | | |
The majority of field observations broadly support such a scenario at the Arctic Deposit and include: 1) the tectonic setting with Devonian volcanism in an evolving continental rift; 2) the geologic setting with bimodal volcanics including pillow basalts and felsic volcanic tuffs; 3) an alteration assemblage with well-defined magnesium-rich footwall alteration and sodium-rich hanging wall alteration; and 4) typical polymetallic base-metal mineralization with massive and semi-massive sulphides.
| 7.6 | Deposits and Prospects |
In addition to the Arctic Deposit, numerous other VMS-like occurrences are present on the Trilogy Metals land package. The most notable of these occurrences are the Dead Creek (also known as Shungnak), Sunshine, Cliff, Horse, Cobre and the Snow prospects to the west of the Arctic Deposit and the Red, Nora, Tom-Tom and BT prospects to the east. Figure 7-7 shows the Trilogy Metals land package and the mineral prospects. Figure 7-7 also shows: 1) the Smucker deposit on the far west end of the Ambler Sequence which is currently controlled by Teck Inc.; 2) the Sun deposit at the eastern end of the Ambler Sequence and controlled by Lead-FX., and 3) carbonate-hosted deposits and prospects in the Bornite Carbonate Sequence controlled by Trilogy Metals/NANA.
| Figure 7-8 | Major Prospects of the Ambler Mining District (Trilogy Metals, 2017) |
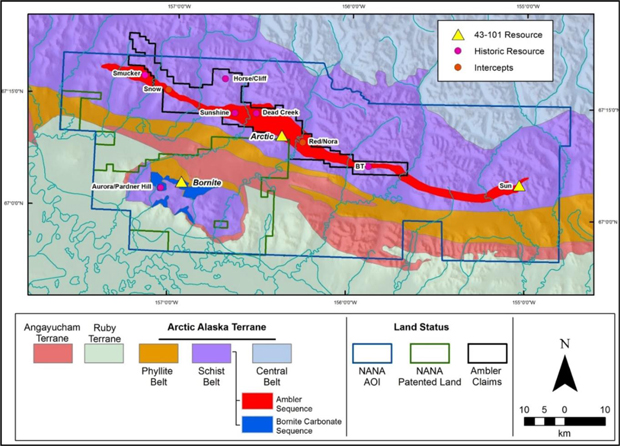
| Trilogy Metals Inc. | 7-17 | |
NI 43-101 Technical Report on the Arctic Project,
Northwest Alaska | | |
The mineralization at the Arctic Deposit and at several other known occurrences within the Ambler Sequence stratigraphy of the Ambler District consists of Devonian age, polymetallic (zinc-copper-lead-silver-gold) VMS-like occurrences. VMS deposits are formed by and associated with sub-marine volcanic-related hydrothermal events. These events are related to spreading centres such as fore arc, back arc or mid-ocean ridges. VMS deposits are often stratiform accumulations of sulphide minerals that precipitate from hydrothermal fluids on or below the seafloor. These deposits are found in association with volcanic, volcaniclastic and/or siliciclastic rocks. They are classified by their depositional environment and associated proportions of mafic and/or felsic igneous rocks to sedimentary rocks. There are five general classifications (Franklin et al. 2005) based on rock type and depositional environment:
| · | Mafic rock dominated often with ophiolite sequences, often called Cyprus type. |
| · | Bimodal-mafic type with up to 25% felsic volcanic rocks. |
| · | Mafic-siliciclastic type with approximately equal parts mafic and siliciclastic rocks, which can have minor felsic rocks and are often called Besshi type. |
| · | Felsic-siliciclastic type with abundant felsic rocks, less than 10% mafic rocks and shale rich. |
| · | Bimodal-felsic type where felsic rocks are more abundant than mafic rocks with minor sedimentary rocks also referred to as Kuroko type. |
Prior to any subsequent deformation and/or metamorphism, these deposits are often bowl- or mound-shaped with stockworks and stringers of sulfide minerals found near vent zones. These types of deposit exhibit an idealized zoning pattern as follows:
| · | Pyrite and chalcopyrite near vents. |
| · | A halo around the vents consisting of chalcopyrite, sphalerite and pyrite. |
| · | A more distal zone of sphalerite and galena and metals such as manganese. |
| · | Increasing manganese with oxides such as hematite and chert more distal to the vent. |
Alteration halos associated with VMS deposits often contain sericite, ankerite, chlorite, hematite and magnetite close to the VMS with weak sericite, carbonate, zeolite, prehnite and chert more distal. These alteration assemblages and relationships are dependent on degree of post deposition deformation and metamorphism. A modern analog of this type of deposit is found around fumaroles or black smokers in association with rift zones.
| Trilogy Metals Inc. | 8-1 | |
NI 43-101 Technical Report on the Arctic Project,
Northwest Alaska | | |
In the Ambler District, VMS-like mineralization occurs in the Ambler Sequence schists over a strike length of approximately 110 km. These deposits are hosted in volcaniclastic, siliciclastic and calcareous metasedimentary rocks interlayered with mafic and felsic metavolcanic rocks. Sulphide mineralization occurs above the mafic metavolcanic rocks but below the Button schist, a distinctive district wide felsic unit characterized by large K-feldspar porphyroblasts after relic phenocrysts. The presence of the mafic and felsic metavolcanic units is used as evidence to suggest formation in a rift-related environment, possibly proximal to a continental margin.
A sulphide-smoker occurrence has been tentatively identified near Dead Creek, northwest of the Arctic Deposit and suggests local hydrothermal venting during deposition. However, the lack of stockworks and stringer-type mineralization at the Arctic Deposit suggest that the deposit may not be a proximal vent type VMS. Although the deposit is stratiform in nature, it exhibits characteristics and textures common to replacement-style mineralization. At least some of the mineralization may have formed as a diagenetic replacement.
At Arctic, sulphides occur as disseminated (<30%), semi-massive (30 to 50% sulphide) to massive (greater than 50% sulphide) layers, typically dominated by pyrite with substantial disseminated sphalerite and chalcopyrite and trace amounts of galena and tetrahedrite-tennantite. The Arctic Deposit sulphide accumulation is thought to be stratigraphically correlative to those seen at the Dead Creek and Sunshine deposits up to 12 km to the west.
There is also an occurrence of epithermal discordant vein and fracture hosted base metal (lead-zinc-copper) mineralization with significant fluorite mineralization identified at the Red prospect in the Kogoluktuk Valley, east of the Arctic Deposit. Although not yet fully understood, the genesis of this occurrence is considered to be related to the regional system that formed the VMS deposits in the Ambler District.
| Trilogy Metals Inc. | 8-2 | |
NI 43-101 Technical Report on the Arctic Project,
Northwest Alaska | | |
The following section summarizes and highlights work completed by Trilogy Metals and its predecessor company NovaGold. NovaGold began exploration of the Arctic Deposit and surrounding lands of the Schist belt in 2004 after optioning the Property from Kennecott. Previous exploration on the Property during Kennecott’s tenure is summarized in Section 6.0.
Table 9-1 summarizes the exploration work conducted by NovaGold and Trilogy Metals during their tenure from 2004 to the present. Field exploration was largely conducted during the period between 2004 to 2007 with associated engineering and characterization studies between 2008 and the present. Drilling related to exploration is discussed in Section 10.0.
| Trilogy Metals Inc. | 9-1 | |
NI 43-101 Technical Report on the Arctic Project,
Northwest Alaska | | |
| Table 9-1 | Summary of Trilogy/NovaGold Exploration Activities Targeting VMS-style Mineralization in the Ambler Sequence Stratigraphy and the Arctic Deposit |
| Work Completed | Year | Details | Focus |
| Geological Mapping |
| - | 2004 | - | Arctic Deposit surface geology |
| - | 2005 | - | Ambler Sequence west of the Arctic Deposit |
| - | 2006 | - | COU, Dead Creek, Sunshine, Red |
| - | 2015, 2016 | SRK | Geotechnical Structural Mapping |
| - | 2016 | - | Arctic Deposit surface geology |
| Geophysical Surveys |
| SWIR Spectrometry | 2004 | 2004 drill holes | Alteration characterization |
| TDEM | 2005 | 2 loops | Follow-up of Kennecott DIGHEM EM survey |
| 2006 | 13 loops | District targets |
| 2007 | 6 loops | Arctic extensions |
| Downhole EM | 2007 | 4 drill holes | Arctic Deposit |
| Geochemistry |
| - | 2005 | - | Stream silts – core area prospects |
| - | 2006 | - | Soils – core area prospects |
| - | - | Stream silts – core area prospects |
| - | 2007 | - | Soils – Arctic Deposit area |
| Survey |
| Collar | 2004 to 2011 | GPS | All 2004 to 2011 NovaCopper drill holes |
| 2004, 2008 | Resurveys | Historical Kennecott drill holes |
| Photography/Topography | 2010 | - | Photography/topography |
| LiDAR Survey | 2015, 2016 | - | LiDAR over Arctic Deposit |
| Technical Studies |
| Geotechnical | 2010 | BGC | Preliminary geotechnical and hazards |
| ML/ARD | 2011 | SRK | Preliminary ML and ARD |
| Metallurgy | 2012 | SGS | Preliminary mineralogy and metallurgy |
| Geotechnical and Hydrology | 2012 | BGC | Preliminary rock mechanics and hydrology |
| Geotechnical and Hydrology | 2015, 2016 | SRK | Arctic PFS Slope Design |
| ML/ARD | 2015, 2016, 2017 | SRK | Static Kinetic Tests and ABA Update - ongoing |
| Metallurgy | 2015, 2016, 2017 | SGS, ALS | Cu-Pb Separation Test Work; Flotation and Variability Test Work |
| Project Evaluation |
| Resource Estimation | 2008 | SRK | Resource estimation |
| PEA | 2011 | SRK | PEA - Underground |
| 2012 | Tetra Tech | PEA – Open Pit |
| Note: | SWIR = short wave infrared; ML = metal leaching; BGC = BGC Engineering Inc.; SRK = SRK Consulting; SGS = SGS Canada; ALS = ALS Metallurgy |
| Trilogy Metals Inc. | 9-2 | |
NI 43-101 Technical Report on the Arctic Project,
Northwest Alaska | | |
Survey and data capture during Kennecott’s tenure on the Property was in the UTM coordinates system Zone 4, NAD27 datum. In 2010, NovaGold converted all historical geology and topographic data for the Arctic Deposit into the NAD83 datum for consistency. At that time NovaGold contracted WH Pacific, Inc. (“WHPacific”) to re-establish project-wide survey control and benchmarks for the Arctic Deposit. Current mineral resource and geologic models, including the updated Tetra Tech mineral resource model discussed herein, use topography completed in 2010 by PhotoSat Inc. The resolution of the satellite imagery utilized was at 0.5 m and a 1 m contour map and digital elevation model (DEM) were generated.
Trilogy Metals retained WHPacific (and sub-consultant Quantum Spatial, Inc.) to conduct an aerial LiDAR survey over the Upper Kobuk Mineral Projects area during 2015. Due to scheduling difficulties and poor weather conditions only 70% of the survey was completed in 2015. The remaining 30% of the aerial survey, as well as the final post-processing work, was completed between June and October 2016. The LiDAR survey was completed to support pre-feasibility level resource estimation, engineering design, environmental studies, and infrastructure layout evaluations. Final deliverables include flight breaklines, classified LAS (native files), tiled 1-meter digital elevation models and contours for the full project area, 5-meter contours for the full project area, high-resolution files for the Arctic and Bornite deposit areas, ground ascii point files and other supporting documentation.
NovaGold has focused its exploration mapping efforts on an area covering approximately 18 km of strike length of the permissive Ambler Sequence rocks of the Schist belt stratigraphy. This area is centered on the Arctic Deposit and covers the thickest portion of the Ambler Sequence rocks. The area covers many of the most notable mineralized occurrences including the Red Prospect east of the Kogoluktuk River, the Arctic Deposit, and the nearby occurrences at the West Dead Creek and Dead Creek prospects, and the CS, Bud and Sunshine prospects west of the Shungnak River.
In 2004, mapping focused on the surface geology in and around the Arctic Deposit while exploration in 2005 extended the Ambler Sequence stratigraphy to the west. In 2006 with expansion of the exploration focus to encompass the immediate district and to support a major TDEM geophysical program, mapping was extended to include the area between the Sunshine prospect on the west and the Red prospect on the east. Figure 9-1 shows areas mapped by successive campaigns.
| Trilogy Metals Inc. | 9-3 | |
NI 43-101 Technical Report on the Arctic Project,
Northwest Alaska | | |
| Figure 9-1 | Mapping Campaigns in and around the Arctic Deposit (Trilogy Metals, 2017) |
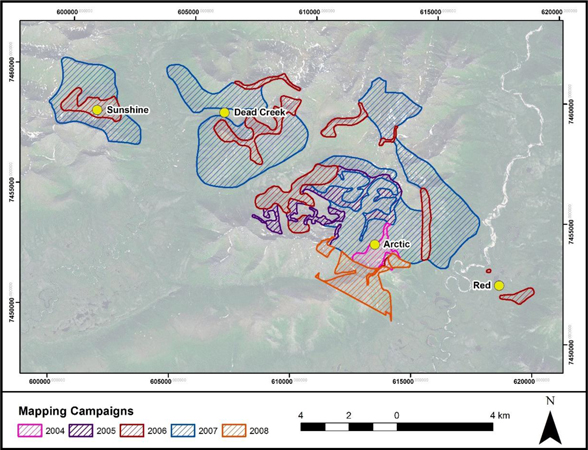
The following geologists made significant contributions during the following mapping campaigns:
| · | Paul Lindberg (2004, 2005, and 2006) |
| · | Doyle Albers (2004 and 2005) |
| · | Andy West (2011, 2012, and 2016). |
Figure 9-2 shows a compilation of the mapping and the geology of the Arctic Deposit area highlighting stratigraphy within the Ambler Sequence.
| Trilogy Metals Inc. | 9-4 | |
NI 43-101 Technical Report on the Arctic Project,
Northwest Alaska | | |
| Figure 9-2 | Arctic Deposit Area Geology (Trilogy Metals, 2017) |
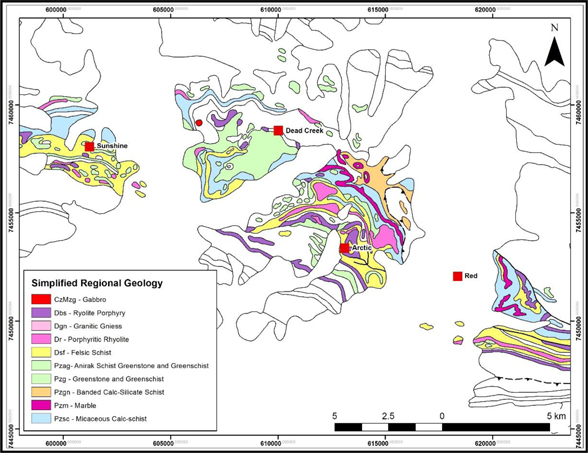
SRK was contracted in 2015 to create a structural geology model primarily based on brittle structures of the Arctic deposit for pit design and mine scheduling. The majority of the structural mapping took place along the north-south trending Arctic Ridge, and along the northwest trending ridge above the cirque to the south of the deposit, both of which provides the greatest exposure.
Geologic and structural mapping were completed by Trilogy Metals geologists in the Arctic area during the 2016 field season. The objectives of the mapping project were threefold; 1) to ground-truth the northeast and north-south trending fault structures identified by SRK in 2015 and to otherwise support SRK’s 2016 geotechnical mapping efforts, 2) field check the outcrops mapped in 2006 and 2008 recorded in the current GIS database, and 3) determine the nature of the Warm Springs Fault by mapping in the immediate hangingwall of this apparent structural feature. The first objective was successfully accomplished and the pending SRK geotechnical structural model is robust. The two other objectives were partly met during the short field season and the geologic knowledge of the Arctic area was advanced due to the work. All the surface work completed during the field season contributed to the updated Arctic surface geology map Figure 9-4.
| Trilogy Metals Inc. | 9-5 | |
NI 43-101 Technical Report on the Arctic Project,
Northwest Alaska | | |
| Figure 9-3 | 2016 Updated Arctic Surface Geology Map (Trilogy Metals, 2017) |

During NovaGold and Trilogy Metals collective tenure in the Ambler District, significant soil and silt geochemical sampling was utilized to target many of the VMS prospects in the Ambler Sequence particularly in the core area around the Arctic Deposit. Between 2005 and 2007, NovaGold collected 2,272 soils and 278 silt samples. Much of the reconnaissance soil sampling has used gridding layouts of 200 m lines and 50 m sample intervals oriented perpendicular to stratigraphy.
Soil and silt samples were submitted directly to either ALS Minerals in Fairbanks (a division of ALS Global, formerly ALS Chemex) or Alaska Assay Labs in Fairbanks for sample preparation. The samples were dried and sieved to 80 mesh and forwarded to ALS Minerals for analysis. The samples were analyzed using the ME-ICP61 method and a four acid near total digestion with 27 elements measured (silver, aluminum, arsenic, barium, beryllium, bismuth, calcium, cadmium, cobalt, copper, chromium, iron, potassium, magnesium, manganese, molybdenum, sodium, nickel, phosphorus, lead, sulphur, antimony, strontium, titanium, vanadium, tungsten, and zinc).
Figure 9-4 and Figure 9-5 illustrate typical soil sampling campaigns and sample density and shows copper and zinc distribution, respectively in silt and soil samples in the Dead Creek prospect area. Section 10.0 discusses the geochemistry and sampling of the drill core.
| Trilogy Metals Inc. | 9-6 | |
NI 43-101 Technical Report on the Arctic Project,
Northwest Alaska | | |
| Figure 9-4 | Copper Distribution in Silt and Soil Samples in the Dead Creek Area |
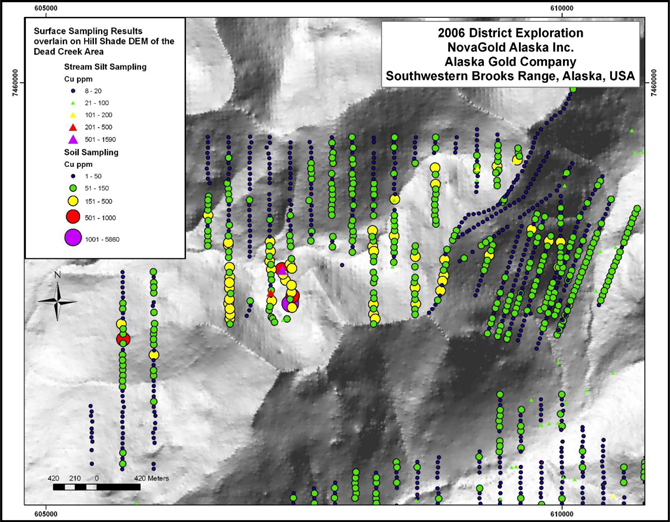
| Trilogy Metals Inc. | 9-7 | |
NI 43-101 Technical Report on the Arctic Project,
Northwest Alaska | | |
| Figure 9-5 | Zinc Distribution in Silt and Soil Samples in the Dead Creek Deposit Area |

| Trilogy Metals Inc. | 9-8 | |
NI 43-101 Technical Report on the Arctic Project,
Northwest Alaska | | |
A number of different geophysical survey methods have been utilized at the Arctic Deposit during Kennecott’s tenure on the Property and are summarized in Section 6.0. During NovaCopper’s tenure, the geophysical methodology was largely focused on ground and downhole EM methods to follow-up on the 1998 DIGHEM airborne EM survey conducted by Kennecott.
From 2005 to 2007, NovaCopper conducted ongoing TDEM surveys and completed 21 different loops targeting the Arctic Deposit, extensions to the Arctic Deposit and a series of DIGHEM airborne anomalies in and around known prospects and permissive stratigraphy. Table 9-2 summarizes the TDEM loops and locations. Figure 9-6 illustrates typical TDEM loops and contoured resistivity at the Dead Creek prospect.
Frontier Geosciences of Vancouver, BC completed all of the geophysical programs using a Geonics PROTEM 37 transmitter, a TEM-57 receiver and either a single channel surface coil or a three component BH43-3D downhole probe.
| Table 9-2 | TDEM Loops and Locations |
| Area | 2005 | 2006 | 2007 |
| Arctic | 1 | - | 6 |
| COU | 1 | 3 | - |
| Dead Creek | - | 4 | - |
| Sunshine | - | 2 | - |
| Red | - | 1 | - |
| Tom Tom | - | 1 | - |
| Kogo/Pipe | - | 2 | - |
| Total | 2 | 13 | 6 |
In addition to the TDEM surveys, Frontier Geosciences surveyed four drill holes (AR05-89, AR07-110, AR07-111, and AR07-112). All of the holes produced off-hole anomalies, notably AR07-111, which showed evidence of a strong EM conductor north of the hole. Follow-up is warranted.
| Trilogy Metals Inc. | 9-9 | |
NI 43-101 Technical Report on the Arctic Project,
Northwest Alaska | | |
Figure 9-6 TDEM Loops and Contoured Resistivity – Dead Creek Prospect
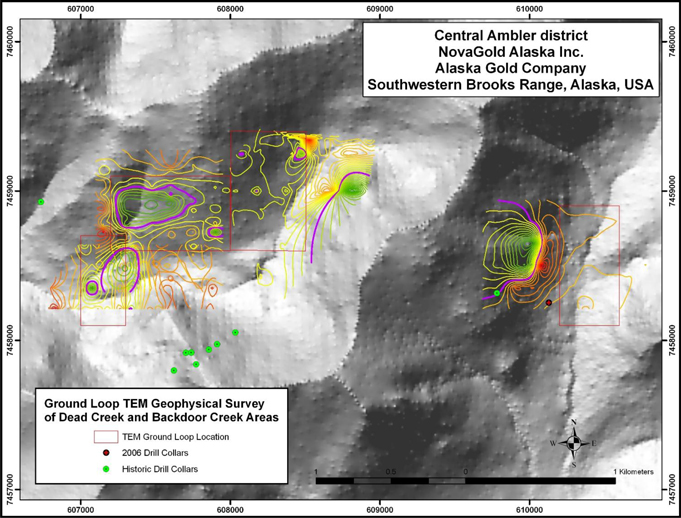
| Trilogy Metals Inc. | 9-10 | |
NI 43-101 Technical Report on the Arctic Project,
Northwest Alaska | | |
Bulk density determinations are discussed in Section 11.0.
| 9.6 | Petrology, Mineralogy and Research Studies |
During 2004, NovaGold completed and extensive study of the 2004 drilling utilizing an Analytical Spectral Device (ASD) shortwave infrared spectrometer to better identify alteration species within the Arctic Deposit. The results are discussed in Section 7.0.
Trilogy Metals supported a series of academic studies of the Arctic Deposit. In 2009, Danielle Schmandt completed an undergrad thesis entitled “Mineralogy and Origin of Zn-rich Horizons within the Arctic Volcanogenic Massive Sulfide Deposit, Ambler District, Alaska” for Smith College. The Schmandt thesis focused on a structural and depositional reconstruction of the Arctic Deposit with the goal of locating the hydrothermal vents to aid in exploration vectoring.
Bonnie Broman, a Trilogy Metals geologist, completed a Master of Science thesis for the University of Alaska- Fairbanks, focusing on the nature and distribution of the silver-bearing mineral species within the Arctic Deposit.
| 9.7 | Geotechnical, Hydrogeological and Acid Base Accounting Studies |
Trilogy Metals undertook a series of geotechnical, hydrological and ABA studies which are summarized in Table 9-1. For a review of historical geotechnical, hydrological and ABA studies undertaken by Kennecott, refer to Section 6.0.
| 9.7.1 | Geotechnical and Hydrogeological Assessments |
In November 2010, BGC completed a preliminary geotechnical study for NovaGold. The report focused on geotechnical aspects and hazards (avalanche mitigation) associated with the construction and maintenance of road infrastructure between the Bornite and the Arctic Deposits and accessing the Arctic Deposit by developing adit access.
In 2016, Trilogy Metals retained SRK Consulting to provide professional engineering services to support pre-feasibility level engineering studies at the Arctic project – this work was a continuation of the work package that was initiated in 2015. The work package was divided into four phases. Phase 1 included LiDAR processing and Quality Assurance/Quality Control (“QA/QC”) to ensure data is of suitable quality to support future engineering planning and design. Phase 2 included a structural desktop study and field investigation plan. Phase 3 included structural and hydrogeological field investigations as well as supervision of targeted drilling to improve understanding of the structural, geotechnical and hydrogeological regime across the proposed open pit terrain, hydrogeological installations, rock laboratory test work, and QA/QC of collected data. Phase 4 included geotechnical and hydrogeological analysis, modeling, pit slope design, final reporting and is summarized below (refer to SRK: Pre-feasibility Slope Geotechnical and Hydrogeological Report for the Arctic Deposit for further details).
| Trilogy Metals Inc. | 9-11 | |
NI 43-101 Technical Report on the Arctic Project,
Northwest Alaska | | |
The following conclusions were issued for the Pre-feasibility Slope Geotechnical and Hydrogeological Report for the Arctic Deposit.
Data Sources
Following the compilation of previous work and information collected during 2015 and 2016 field season, a robust geotechnical, structural and hydrogeological dataset has been developed for use in the ongoing Arctic slope design studies.
Five (5) dedicated geotechnical-hydrogeological drill holes were completed at Arctic during the 2015 and 2016 field season. Geotechnical logging was completed on a further fifteen (15) resource drill holes. This work was complemented by structural mapping, acoustic televiewer surveys, and hydrogeological installations. Laboratory strength testing has been completed on resource and geotechnical-hydrogeological drill holes.
With the completion of the 2016 work, SRK believes that the Arctic open pit program satisfies full pre-feasibility level study requirements.
Geology and Structure
As a framework for the Arctic rock mass assessment, SRK has considered the existing Trilogy lithology model in conjunction with interval data from the geological drilling database.
The talc alteration occurs as continuous to semi-continuous massive bands that may host economic mineralization many meters thick, to much thinner (2 to 20 cm) bands parallel to the dominant foliation within more competent quartz mica and quartz chlorite mica schists. Both occurrences represent potential weak or slip foliation surface. Trilogy has developed talc wireframes delineating the spatial distribution and extent of the main talc-rich horizons at the Arctic Project. Nine (9) stratabound layers of talc within four major stratigraphic packages have been defined.
Pervasive weathering is present in the upper levels of the Arctic deposit. SRK has reviewed the geotechnical data and core photographs in order to define a base of weathering isosurface that represent the boundary of upper, more pervasive weathering.
SRK completed a detailed update of the 3-D structural model. The model includes refinement of existing major structures and generation of new structures. A “structural matrix” was created which provides information on the physical properties and confidence of major and minor structural features. The structural model is considered adequate for pre-feasibility level.
Six (6) structural and geomechanical domains have been identified. These domains, each containing discontinuity sets and major structures, have formed the basis of the kinematic assessment.
| Trilogy Metals Inc. | 9-12 | |
NI 43-101 Technical Report on the Arctic Project,
Northwest Alaska | | |
Rock Mass Assessment
Based on similar geotechnical conditions, the majority of lithological units have been grouped together into broad domains represented by the Upper and Lower Plates (separated by the Warm Springs Fault). The exceptions to these groupings are the weaker talc units, shallow weathered material and fault zones. The following rock mass domains are defined:
Mean rock mass parameter values and ranges have been defined for each rock mass domain (e.g., fracture frequency, rock mass rating). Particular attention was paid to the assessment of intact rock strength within the defined rock mass domains. Laboratory strength testing supported by point load testing and empirical field estimates, suggests that strength within the various lithological groups of the Upper and Lower Plates is reasonably homogeneous.
The Talc Zone domain comprised of talc schist (TS) and chlorite talc schist (ChTS), represents the weakest rock type (outside of fault zones) observed at the Arctic deposit. The domain is characterized by low intact rock strength, well developed S1/S0 fabric and low shear strength discontinuity surfaces. The extent and persistence of the unit is of concern to the pit slope stability. Future updates to the talc model should be re-evaluated by the geotechnical team to assess how they could impact the pit walls.
Kinematic Stability Assessment
A complete assessment of bench and inter-ramp kinematic stability has been undertaken. Full descriptions of toppling, planar, and wedge instability risks are provided per geomechanical domain and design sector, see Figure 9-6.
The most significant discontinuity sets, in terms of limiting slope angles, are related to shallow to intermediate dipping S1/S0 fabric which impacts the NE, E and SE slopes.
| Trilogy Metals Inc. | 9-13 | |
NI 43-101 Technical Report on the Arctic Project,
Northwest Alaska | | |
Figure 9-7 SRK Design Sectors based on Kinematic Analysis
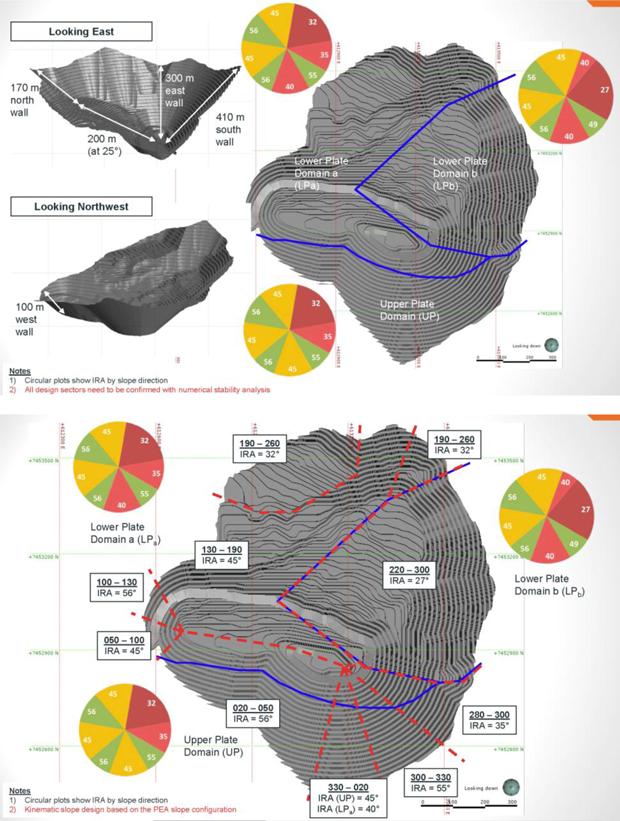
| Trilogy Metals Inc. | 9-14 | |
NI 43-101 Technical Report on the Arctic Project,
Northwest Alaska | | |
Hydrogeology
The 2016 field program was completed successfully and the hydrogeology database was updated. The hydrogeological database is sufficient for the pre-feasibility study.
| · | There are now 22 hydraulic conductivity measurements available from ten drill holes, including results from a 12-hour airlift test. Bulk hydraulic conductivity ranges between 3x10⁻⁹ and 3x10⁻⁶ m/s. The previous interpretation of increasing K with depth is still possible but not as consistent as previously believed. |
| · | Water level measurements are available from 18 locations, including 8 locations with just less than one full year of continuous record each. Water level data show variable elevations and different responses to recharge events suggesting the presence of multiple water systems. Seasonal variations in water levels are up to 120 m. |
The hydrogeological conceptual model for the Arctic deposit has been updated with results gained from the 2015/2016 field programs. Data indicate a system generally characterized by low hydraulic conductivity and average recharge, but also multiple water systems. Two alternative conceptual models should be considered going forward, either of which can explain the observed data:
| · | Multiple water system model: this model includes two distinct groundwater systems: 1) at least 1 (regional) shallow perched water table in the northeast areas of the pit, and 2) a deeper water table existing over most of the pit footprint Figure 9-6. |
| · | Compartmentalized water system model: The observed spatial distribution in water levels is the results of compartmentalization by features such as faults and/or talc surfaces and/or permafrost. Compartments may be hydraulically isolated. This model is not as clearly defined as the multiple water system model, but is considered possible. At this stage, the talc surfaces are considered to be the most likely cause of compartmentalization. Groundwater pressures could be confined below the talc bedding. |
| Trilogy Metals Inc. | 9-15 | |
NI 43-101 Technical Report on the Arctic Project,
Northwest Alaska | | |
Figure 9-8 SRK Preliminary Hydrology Model – Perched Water Table
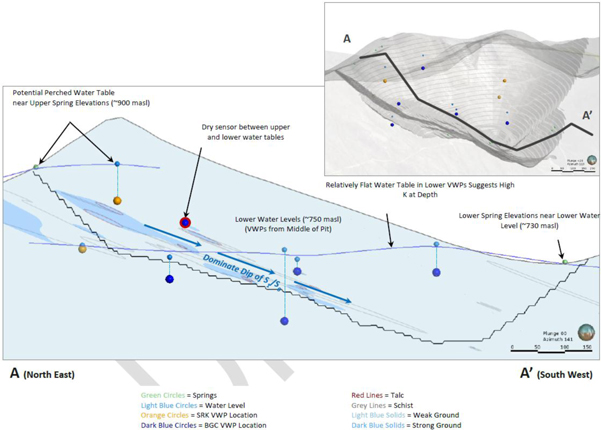
Pore pressure conditions were estimated for use in slope stability modelling. Models were constructed in 2-D, using the sections selected for slope stability analyses, and calibrated to observed water level data. Predictive models were completed for conservative pore pressure conditions and sensitivities completed by varying hydraulic conductivity in different lithologic units and damage zones, and by varying recharge. Slope stability models were stable under all conditions suggesting final slopes are relatively insensitive to pore pressure conditions.
The two sources of water to the pit will be surface runoff or precipitation, and groundwater inflow. Estimates of groundwater inflows to the pit were completed using analytical solutions. Ranges of hydraulic conductivity and recharge were assessed to determine sensitivity to inputs. Groundwater inflow is estimated to be about 2,100 m3/d, with a range of ± 1,100 m3/d. Inflow rates of this magnitude can be managed by in-pit sumps.
Stability Modelling
Phase2 modelling result validated the findings from the kinematic assessment
Slope stability models suggest final pit wall slopes are relatively insensitive to pore pressure conditions.
| Trilogy Metals Inc. | 9-16 | |
NI 43-101 Technical Report on the Arctic Project,
Northwest Alaska | | |
A seismic hazard assessment has not been completed on the pit but could be a potential risk to ongoing stability.
Slope Design
Arctic slope design criteria are issued based on bench and inter-ramp scale kinematics and select 2-D stability modelling. Inter-ramp design recommendations range from 30 to 56°.
East Wall: Slopes subparallel to the main foliation (J1, S1/S0) should be stripped along the dip of the feature. The majority of the east wall will be mined with stacks consisting of 2 benches (height of 60 m) carrying a geotechnical berm or ramp every 120 m vertical spacing.
| · | The slope is within the acceptance criteria at friction angles as low as 22°, however if there is more talc than currently modelled (i.e. friction angle ~ 17°) then the slope will not meet the requirements. |
| · | Slopes subparallel to the main foliation (J1, S1/S0) should be stripped along the dip of the feature. However, where the dip of J1 increases beyond 35°, the slope should be converted to a standard bench/berm configuration. |
North Wall: The current pit design includes a segment of convex slope along the north wall. Although 2-D modelling and kinematic analyses suggest such a design is stable, potentially complex failure modes may impact this area (possibly including J1 and other minor/major structure).
A complete investigation of early pit phase slopes has not been completed as part of this phase of study, but initial findings show that there is a potential risk if the slopes are left with thick bands of talc in the toe.
| 9.7.2 | Acid-Base Accounting Studies |
In July 2011, SRK completed a preliminary ML and ARD study of the Arctic Deposit for the Company.
The ARD potential varies with rock type and sulphur content. Based on the current sampling, the rock types with the highest potential for ARD are mineralized material, gray schist and felsic schist with more than 0.5% total sulphur. Felsic schist with less than 0.5% total sulphur and talc/chlorite schist with less than 1% total sulphur are predominantly potentially non-acid generating (NAG) with a few samples having uncertain ARD potential.
The study recommended humidity cells and initial leach tests to evaluate sulphide reactivity and ML. Mineralogical determinations were also recommended due to the complex sulphur and carbonate mineralogy.
| Trilogy Metals Inc. | 9-17 | |
NI 43-101 Technical Report on the Arctic Project,
Northwest Alaska | | |
Trilogy Metals retained Steven Day of SRK Consulting to provide on-going metal leaching and acid rock drainage (ML/ARD) characterization services for the Arctic project. Activities in 2016 focused on three objectives: 1) on-going monitoring of on-site barrel tests (kinetics), 2) on-going monitoring of parallel laboratory humidity cell tests (kinetics), and 3) expansion of the current acid-base-accounting (ABA) database (statics). Barrel test samples were collected during June, September and October of 2016 and analyzed by ARS Aleut Analytical of Port Allen, Louisiana. Humidity cell tests, initiated in 2015, were monitored on a monthly basis by Maxxam Analytics of Burnaby, British Columbia. Both the barrel test work and humidity cell test work are on-going. Trilogy Metals and SRK selected 1,119 samples to be analyzed for a conventional static ABA package with a trace element scan using the same methods as the exploration database. Samples were analyzed by Global ARD Testing Services of Burnaby, British Columbia. Upon completion of the laboratory test work, SRK began evaluating the use of proxies to support next steps in regards to the block modelling of ML/ARD potential. This work is on-going.
| 9.7.3 | Metallurgical Studies |
The Arctic deposit contains copper, lead and zinc minerals which are amenable to recovery and upgrading using flotation technology. Test work on the Arctic materials dates back to the earliest exploration efforts with good results.
In October 2012, Trilogy Metals (then NovaCopper), contracted SGS Laboratories of Vancouver, to complete an in-depth metallurgical study of the Arctic Deposit to support this study and on-going development of the project. The flotation process employed during this test work involved the production of a combined copper and lead concentrate, which is subsequently separated into distinct copper and lead concentrates. A zinc concentrate is produced from the tailings of the copper and lead circuit, also using flotation techniques. The Arctic deposit is characterized by the presence of talc being prevalent in some of the mineralized zones and removal of this naturally hydrophobic mineral is required prior to traditional flotation processes being used to recover the base metal sulphides. Four large composite samples, representing unique mineralized zones were used in this test work program and these results form the basis of metal recovery data carried forward in the project evaluation.
During the summer 2016, five drill holes were completed at the Arctic project to provide sample materials, to evaluate in detail, the separation of copper and lead minerals from a combined concentrate. Trilogy Metals contracted ALS Metallurgy of Kamloops, British Columbia to complete this test work. The study included confirmation testing of previous metallurgical results using these new materials, assessment of a number of individual samples(variability testing), and completion of detailed process simulation of the proposed copper-lead separation process. Work was completed and reported in the first quarter of 2017.
The conclusions of test work conducted both in 2012 and 2017 indicate that the Arctic materials are well-suited to the production of high-quality copper and zinc concentrates using flotation techniques which are industry standard. Copper and zinc recovery data is reported in the range of 91 to 89% respectively, which reflects the high grade nature of the deposit as well as the coarse grained nature of these minerals. Lead concentrates have the potential to be of high quality and can also be impacted by zones of very high talc contents which have the potential to dilute lead concentrate grades. The lead concentrate is also shown to be rich in precious metals, which has some advantages in terms of marketability of this material.
| Trilogy Metals Inc. | 9-18 | |
NI 43-101 Technical Report on the Arctic Project,
Northwest Alaska | | |
Detailed test results completed by Trilogy Metals in 2012 and 2017 are further discussed in section 13.0 of this document. Historic metallurgical test results are also presented in Section 13.0.
Trilogy Metals has retained Jeffrey B. Austin, P.Eng., of International Metallurgical and Environmental Inc. since 2012 to support the metallurgical development of the Arctic project.
| Trilogy Metals Inc. | 9-19 | |
NI 43-101 Technical Report on the Arctic Project,
Northwest Alaska | | |
Drilling at the Arctic Deposit and within the Ambler District has been ongoing since its initial discovery in 1967. Approximately 56,480 m of drilling has been completed within the Ambler District, including 39,320m of drilling in 163 drill holes at the Arctic deposit or on potential extensions in 27 campaigns spanning 50 years. All of the drill campaigns at Arctic have been run under the auspices of either: 1) Kennecott and its subsidiaries (BCMC), 2) Anaconda, or 3) Trilogy Metals and its predecessor companies, NovaGold and NovaCopper. Table 10-1 summarizes operators, campaigns, holes and metres drilled on the deposit. All drill holes, excluding drilling from the 2017 campaign (which were holes used for future metallurgical testing), listed in this table have been used in the estimation of the new resource disclosed in Section 1.0.
Table 10-1 Companies, Campaigns, Drill Holes and Metres Drilled at the Arctic Deposit
| Year | Company | No. of
Holes | Metres |
| 1967 | BCMC | 7 | 752 |
| 1968 | BCMC | 18 | 3836 |
| 1969 | BCMC | 3 | 712 |
| 1970 | BCMC | 3 | 831 |
| 1971 | BCMC | 1 | 257 |
| 1972 | BCMC | 1 | 407 |
| 1973 | BCMC | 2 | 557 |
| 1974 | BCMC | 3 | 900 |
| 1975 | BCMC | 26 | 4942 |
| 1976 | BCMC, Anaconda | 10 | 805 |
| 1977 | BCMC, Anaconda | 4 | 645 |
| 1979 | BCMC, Anaconda | 3 | 586 |
| 1980 | Anaconda | 1 | 183 |
| 1981 | BCMC, Anaconda | 2 | 632 |
| 1982 | BCMC, Anaconda | 5 | 677 |
| 1983 | BCMC | 1 | 153 |
| 1984 | BCMC | 2 | 253 |
| 1986 | BCMC | 1 | 184 |
| 1998 | Kennecott | 6 | 1523 |
| 2004 | NovaGold | 11 | 2996 |
| 2005 | NovaGold | 9 | 3393 |
| 2007 | NovaGold | 4 | 2606 |
| 2008 | NovaGold | 14 | 3306 |
| 2011 | NovaGold | 5 | 1193 |
| 2015 | NovaCopper | 14 | 3055 |
| 2016 | Trilogy Metals | 13 | 3058 |
| 2017 | Trilogy Metals | 5 | 790 |
| Total | - | 174 | 39,230 |
| Trilogy Metals Inc. | 10-1 | |
NI 43-101 Technical Report on the Arctic Project,
Northwest Alaska | | |
Additional historical exploration drilling by operators other than Bear Creek/Kennecott exists in the VMS belt; however a portion is unavailable or has been lost over the years. Figure 10-1 shows drill locations of the all resource and exploration holes utilized in the Mineral Resource estimation of this report.
Trilogy Metals and its predecessor company NovaGold drilled 22,144 m in 79 different drill holes targeting the Arctic Deposit and several other prospects of the Ambler Schist belt. Table 10-2 summarizes all of the Trilogy Metals/NovaGold tenure drilling on the Property.
Table 10-2 Summary of Trilogy/NovaGold Drilling
| Year | Metres | No. of
Drill Holes | Sequence | Purpose of Drilling |
| 2004 | 2,996 | 11 | AR04-78 to 88 | Deposit scoping and verification |
| 2005 | 3,030 | 9 | AR05-89 to 97 | Extensions to the Arctic Deposit |
| 2006*** | 3,100 | 12 | AR06-98 to 109 | Property-wide exploration drilling |
| 2007 | 2,606 | 4 | AR07-110 to 113 | Deep extensions of the Arctic Deposit |
| 2008* | 3,306 | 14 | AR08-114 to 126 | Grade continuity and metallurgy |
| 2011 | 1,193 | 5 | AR11-127 to 131 | Geotechnical studies |
| 2012*** | 1,752 | 4 | SC12-014 to 017 | Exploration drilling – Sunshine |
| 2015 | 3,055 | 14 | AR15-132 to 145 | Geotechnical-hydrogeological studies, resource infill |
| 2016 | 3,058 | 13 | AR16-146 to 158 | Geotechnical-hydrogeological studies, resource infill |
| 2017** | 790 | 5 | AR17-159 to 163 | Ore sorting studies |
| Notes: | *A total of 12 of the 14 holes drilled in 2008 were utilized in the 2012 SRK resource update. Two holes were maintained in sealed frozen storage to provide additional metallurgical samples if required. |
**Holes drilled in 2017 are not included in the current resource estimation contained herein.
***Drilling in 2006 and 2012 targeted exploration targets elsewhere in the VMS belt.
| Trilogy Metals Inc. | 10-2 | |
NI 43-101 Technical Report on the Arctic Project,
Northwest Alaska | | |
Figure 10-1 Plan Map of Drill Holes Utilized in the Mineral Resource Estimation (Trilogy Metals, 2017)

Over the Arctic Project’s history, a relatively limited number of drill companies have been used by both Kennecott and Trilogy/NovaGold at the Arctic Deposit. During Kennecott’s tenure on the Property, Sprague and Henwood, a Pennsylvania-based drilling company was the principal contractor. Tonto Drilling provided services to Kennecott during Kennecott’s short return to the district in the late 1990s. NovaCopper and NovaGold have utilized Boart Longyear as their only contractor. Table 10-3 summarizes drill companies and core sizes utilized.
| Trilogy Metals Inc. | 10-3 | |
NI 43-101 Technical Report on the Arctic Project,
Northwest Alaska | | |
Table 10-3 Drill Contractors, Drill Holes, Meterage and Core Sizes by Drill Campaign at the Arctic Deposit
| Year | Company | No. of
Drill Holes | Metres | Core Size | Drill Contractor |
| 1966 | Bear Creek | 1 | 32 | BX | Sprague and Henwood |
| 1967 | Bear Creek | 7 | 774 | BX | Sprague and Henwood |
| 1968 | Bear Creek | 17 | 3,782 | BX | Sprague and Henwood |
| 1969 | Bear Creek | 3 | 712 | BX | Sprague and Henwood |
| 1970 | Bear Creek | 3 | 831 | BX | Sprague and Henwood |
| 1971 | Bear Creek | 2 | 663 | BX? | Sprague and Henwood |
| 1973 | Bear Creek | 2 | 557 | BX? | Sprague and Henwood |
| 1974 | Bear Creek | 3 | 900 | NX and BX | Sprague and Henwood |
| 1975 | Bear Creek | 26 | 4,942 | NX and BX | Sprague and Henwood |
| 1976 | Bear Creek | 8 | 479 | NXWL and BXWL | Sprague and Henwood |
| 1977 | Bear Creek | 3 | 497 | NXWL and BXWL? | Sprague and Henwood |
| 1979 | Bear Creek | 2 | 371 | NXWL and BXWL? | Sprague and Henwood |
| 1981 | Bear Creek | 1 | 458 | NXWL and BXWL? | Sprague and Henwood |
| 1982 | Bear Creek | 4 | 494 | NXWL and BXWL? | Sprague and Henwood |
| 1983 | Bear Creek | 1 | 153 | NXWL and BXWL? | Sprague and Henwood |
| 1984 | Bear Creek | 2 | 253 | NXWL and BXWL? | Sprague and Henwood |
| 1986 | Bear Creek | 1 | 184 | NXWL and BXWL? | Sprague and Henwood |
| 1998 | Kennecott | 6 | 1,523 | HQ | Tonto |
| 2004 | NovaGold | 11 | 2,996 | NQ and HQ | Boart Longyear |
| 2005 | NovaGold | 9 | 3,393 | NQ and HQ | Boart Longyear |
| 2007 | NovaGold | 4 | 2,606 | NQ and HQ | Boart Longyear |
| 2008 | NovaGold | 14 | 3,306 | NQ and HQ | Boart Longyear |
| 2011 | NovaGold | 5 | 1,193 | NQ and HQ | Boart Longyear |
| 2015 | Trilogy Metals | 14 | 3,055 | NQ and HQ | Boart Longyear |
| 2016 | Trilogy Metals | 13 | 3,058 | NQ and HQ | Boart Longyear |
| 2017 | Trilogy Metals | 5 | 790 | PQ | Major Drilling/Tuuq Drilling |
Sprague and Henwood utilized company manufactured drill rigs during their tenure on the Property. Many of their rigs remain at the Bornite Deposit and constitute a historical inventory of 1950s and 1960s exploration artifacts. The 2004 to 2011 Trilogy Metals/NovaGold drill programs used a single skid-mounted LF-70 core rig, drilling HQ or NQ core. The drill was transported by skid to the various drill pads using a D-8 bulldozer located on site. The D-8 was also used in road and site preparation. Fuel, supplies and personnel were transported by helicopter. The 2015 and 2016 NovaCopper/Trilogy Metals drill programs used two helicopter portable LF-70 core rigs, drilling HQ or NQ core. The drill was transported by helicopter to various drill pads. The 2017 Trilogy Metals drill program used a helicopter portable LF-90 core rig, drilling PQ core to be used in future metallurgical test work. The drill was transported by helicopter to various drill pads.
| Trilogy Metals Inc. | 10-4 | |
NI 43-101 Technical Report on the Arctic Project,
Northwest Alaska | | |
| 10.2 | Drill Core Procedures |
There is only partial knowledge of specific drill core handling procedures used by Kennecott during their tenure at the Arctic Deposit. All of the drill data collected during the Kennecott drilling programs (1965 to 1998) was logged on paper drill logs, copies of which are stored in the Kennecott office in Salt Lake City, Utah. Electronic scanned copies of the paper logs, in PDF format, are held by Trilogy Metals. Drill core was cut with half core submitted to various assay labs and the remainder stored in Kennecott core storage facility at the Bornite Camp. In 1995, Kennecott entered the drill assay data, the geologic core logs, and the downhole collar survey data into an electronic format. In 2009, NovaGold geologists verified the geologic data from the original paper logs against the Kennecott electronic format and then merged the data into a Microsoft SQL database.
Sampling of drill core prior to 2004 by Kennecott and BCMC focused primarily on the mineralized zones. During the 1998 campaign, Kennecott did sample some broad zones of alteration and weak mineralization, but much of the unaltered and unmineralized rock remains unsampled. ALS Minerals was used for analyses conducted by Kennecott. Earlier BCMC sampling was even more restricted to mineralized zones of core. Intervals of visible sulphide mineralization were selected for sampling and analyses were conducted primarily by Union Assay Office Inc. of Salt Lake City, Utah. At least six other labs were used during that time period, but mostly as check labs or for special analytical work. Numerous intervals of weak to moderate mineralization remain unsampled in the historic drill core.
| 10.2.2 | NovaGold/Trilogy Metals Tenure |
Throughout Trilogy’s tenure on the Property, the following standardized core handling procedures have been implemented. Core is slung by helicopter to either the Dahl Creek (2004 to 2008) or Bornite (2011 to 2017) camps, where core-logging facilities have been established. Upon receiving a basket of core, geologists and geotechs first mark the location of each drilling block on the core box, and then convert footages on the blocks into metres. All further data capture is then based on metric measurements. Geotechs or geologists measure the intervals (or “from/to”) for each box of core using the drilling blocks and written measurements on the boxes.
Geotechs fill out metal tags with the hole ID, box number and “from/to”, and staple them to each core box. Geotechs then measure the core to calculate percent recovery and RQD. RQD is the sum of the total length of all pieces of core over 12 cm in a run. The total length of core in each run is measured and compared to the corresponding run length to determine percent recovery.
| Trilogy Metals Inc. | 10-5 | |
NI 43-101 Technical Report on the Arctic Project,
Northwest Alaska | | |
Geologists then mark sample intervals to capture each lithology or other geologically appropriate intervals. Sample intervals of core are typically between 1 and 3 m in length but are not to exceed 3 m in length. Occasionally if warranted by the need for better resolution of geology or mineralization, smaller sample intervals were employed. Geologists staple sample tags on the core boxes at the start of each sample interval, and mark the core itself with a wax pencil to designate sample intervals. Sample intervals used are well within the width of the average mineralized zones in the resource area. This sampling approach is considered sound and appropriate for this style of mineralization and alteration.
Core is then logged with lithology and visual alteration features captured on observed interval breaks. Mineralization data, including total sulfide (recorded as percent), sulfide type (recorded as an absolute amount), gangue and vein mineralogy are collected for each sample interval with an average interval of approximately 2 m. Structural data is collected as point data. Geotechnical data (core recovery, RQD) were collected along drill run intervals.
After logging, the core is digitally photographed and cut in half using diamond core saws. Specific attention to core orientation is maintained during core sawing to ensure the best representative sampling. One-half of the core is returned to the core box for storage on site and the other half was bagged and labeled for sample processing and analysis. Select specific gravity measurements are also taken and are further discussed in Sections 11.0 and 1.0 of this report. The remaining half core is stored on site or at Trilogy Metals Fairbanks warehouse.
| 10.3 | Geotechnical Drill Hole Procedures |
Five HQ3 diameter diamond drill holes were completed during NovaCopper’s 2011 geotechnical site investigation program at the Arctic Deposit. The drill holes were drilled using an LF 70 Boart-Longyear drill and were supervised by BGC on a 24-hour basis. Oriented core measurements were obtained using the ACT II tool. Constant rate injection and falling head packer tests were completed and vibrating wire piezometers (VWPs) equipped with single channel dataloggers (RST Instruments Ltd. DT2011 model) were installed. The ACT II core orientation system was used to orient discontinuities. Geotechnical logging was completed at the drill site by BGC. Point load testing was completed by NovaCopper once the core had been flown by helicopter back to the Bornite exploration camp. Core sampling for laboratory testing was completed by both BGC and NovaCopper.
All holes received either a single or a nest of two VWPs with single channel dataloggers. The VWPs were lowered to a pre-selected depth attached to a string of polyvinyl chloride pipes, which was then used as a tremie tube to backfill the hole with cement-bentonite grout. Data from each VWP was recorded by a single channel datalogger with a storage capacity and battery life exceeding one year. Knowledge of the barometric pressure was required for accurate conversion of the vibrating wire piezometer data. A Solinst barologger was installed at AR11-0128 for this purpose. The barologger was recorded continuously and downloaded at the same time as the VWP dataloggers. A thermistor was installed at AR11-0129 to monitor ground temperatures. A datalogger was not attached to this instrument, and therefore manual reading was required.
| Trilogy Metals Inc. | 10-6 | |
NI 43-101 Technical Report on the Arctic Project,
Northwest Alaska | | |
Five (5) dedicated geotechnical-hydrogeological drill holes were completed at Arctic during the 2015 and 2016 field season. Geotechnical logging was completed on a further fifteen (15) resource drill holes. This work was complemented by structural mapping, acoustic televiewer surveys and hydrogeological installations. Laboratory strength testing has been completed on resource and geotechnical-hydrogeological drill holes.
There are now 22 hydraulic conductivity measurements available from ten drill holes, including results from a 12-hour airlift test. Table 10-4 lists the geotechnical holes and outlines geotechnical instrumentation installed.
A detailed discussion and review of the geotechnical and hydrogeological results can be found in Section 9.0.
Table 10-4 Geotechnical Holes and Instrumentation
| | Collar Location | | | | | |
| Hole ID | Easting | Northing | Elev. (masl) | Azi(˚) | Dip(˚) | Number of K tests | Instruments | Status |
| AR11-0127 | 613435 | 7453049 | 964.6 | 045 | 75 | 2 | Single VWP | Temperature sensor is malfunctioning |
| AR11-0128 | 613047 | 7453300 | 857.2 | 360 | 75 | 5 | Single VWP | Damaged |
| AR11-0129 | 613146 | 7453094 | 851.9 | 170 | 71 | 2 | Nested VWPs and a shallow thermistor string | Functional |
| AR11-0130 | 612955 | 7452904 | 765.6 | 017 | 75 | 4 | Single VWP | Functional |
| AR11-0131 | 613192 | 7453315 | 913.5 | 030 | 72 | 1 | Nested VWPs | Functional. |
| AR15-0137 | 612779 | 7452781 | 725.7 | 051 | 75 | 0 | 1* standpipe piezometer | Functional |
| AR15-0139 | 613247 | 7452760 | 900.0 | 110 | 60 | 2 | Nested VWPs | Functional |
| AR15-0141 | 612751 | 7453047 | 734.4 | 064 | 65 | 0 | 1* standpipe piezometer | Functional |
| AR15-0143 | 613018 | 7453404 | 848.0 | 055 | 82 | 0 | 1* standpipe piezometer | Functional |
| AR15-0145 | 613326 | 7543267 | 945.0 | 045 | 60 | 2 | Nested VWPs | Functional |
| AR16-0147 | 613110 | 7452670 | 834.1 | 225 | 88 | 2 | Nested VWPs | Functional |
| AR16-0149 | 613291 | 7452895 | 895.4 | 120 | 65 | 2 | Nested VWPs | Functional |
Point load testing was also completed on select intervals of core approximately every 5 m. Both axial and diametral tests were completed to investigate variation with respect to loading direction and foliation orientation.
| 10.4 | Metallurgical Drill Hole Procedures |
A preliminary metallurgical test program was completed on four composite samples (Zone 1 & 2, Zone 3, Zone 5 and Zone 3 & 5) assembled from core in drill holes (AR08-115, 117w, and 119) representing material from the Arctic Deposit. The scope of the work included mineralogy, comminution and flotation test work.
Limited grindability tests were conducted on five selected samples. Standard Bond grindability test (BWi) for ball mill grinding and abrasion index test were conducted.
| Trilogy Metals Inc. | 10-7 | |
NI 43-101 Technical Report on the Arctic Project,
Northwest Alaska | | |
A conventional flowsheet which produced a bulk copper/lead and zinc concentrates was developed using the four composite samples through flotation testing. The flowsheet development primarily evaluated various primary grind size, depressant dosages and the effect of reagent dosage for copper/lead and zinc circuits. Regrinding of both the copper/lead and zinc concentrates was included in the flowsheet.
A metallurgical test program was completed in 2017 on a single master composite and 14 Variability composites sourced from five 2017 drill holes (AR16-0146, 148, 150, 152, and 153). The test work was carried out to further develop the flowsheet from previous test work, and included flotation test work to produce separate copper and lead concentrates from a bulk concentrate, as well as a zinc concentrate.
The process flowsheet included a pre-float circuit preceding sulphide flotation to remove hydrophobic talc. Copper and lead were recovered to a bulk concentrate, and zinc was recovered to a zinc concentrate which followed the bulk circuit.
A detailed discussion and review of the metallurgical results can be found in Section 13.0.
Kennecott provided NovaGold with collar coordinates for all historical holes in UTM coordinates using the NAD27 datum. NovaGold re-surveyed selected historical holes in 2004 and again in 2008. The re-surveys showed little variation compared to the historical surveys.
| 10.5.2 | NovaGold/Trilogy Metals Tenure |
Collar location coordinates have been determined in all NovaGold/Trilogy drill campaigns with two Ashtech ProMark 2 GPS units using the Riley Vertical Angle Bench Mark (611120.442E, 7453467.486N) as the base station for all surveys. Data collection times varied from 30 minutes to 2 hours. Afternoon hours provided poor satellite constellations, so all surveying was completed during the morning hours. Raw GPS data was processed with Ashtech Solutions 2.60. All surveyed data was collected in the NAD27 datum.
A 2010 survey by a WHPacific Registered Land Surveyor observed differences between the 2010 and historical coordinates used for the Riley VABM, which were of the same magnitude (0.5 m east, 0.1 m north and 1.0 m down) as other Arctic drill collars that were re-surveyed for the third time. A correction was applied to all Arctic drill holes based upon the newly established coordinates for the Riley VABM, along with converting from NAD27 to NAD83 datums. All post 2010 surveys are completed in NAD83.
| Trilogy Metals Inc. | 10-8 | |
NI 43-101 Technical Report on the Arctic Project,
Northwest Alaska | | |
During a site visit by Michael F. O’Brien, M.Sc., Pr.Sci.Nat, FGSSA, FAusIMM, FSAIMM on June 20 and 21, 2013, nine collars were located using a Garmin™ Etrex 20 GPS unit. The difference between reported and measured positions ranged between 3.4 and 7.8 m with an average discrepancy of 4.8 m. These differences are within the tolerances expected for GPS verification. The collar location surveys at the Arctic Deposit are considered to be sufficiently accurate for this study.
BCMC did not perform downhole surveys prior to 1971 (AR-32). In 1971, BCMC began to survey selected (mineralized) holes using a Sperry-Sun downhole survey camera usually at 30.5 m (100 ft) intervals. They were able to re-enter and survey a few of the older holes. BCMC and later Kennecott, applied a single azimuth (49°) and uniform dip deviation every 15.24 m (50 ft) that flattens with depth to all holes collared vertically that were not surveyed.
During Trilogy’s tenure on the Property, downhole surveys from 2004 to 2017 were collected utilizing either a Reflex EZ-shot camera or a Ranger single-shot tool with individual survey readings collected at the drill rig on roughly 30 to 60 m intervals. The downhole survey data shows a pronounced deviation of the drill holes toward an orientation more normal to the foliation.
Core recovery during NovaGold/Trilogy Metals tenure has been good to excellent, resulting in quality samples with little to no bias. There are no other known drilling and/or recovery factors that could materially impact accuracy of the samples during this period. Table 10-5 shows recoveries and RQD for each of the NovaGold/Trilogy Metals campaigns exclusive of the geotechnical drill holes in 2011. BGC (2012) reports a detailed and exhaustive discussion of the recoveries and RQDs of the 2011 drilling.
Table 10-5 Recovery and RQD 2004 to 2008 Arctic Drill Campaigns
| Year | Metres | Recovery
(%) | RQD
(%) |
| 2004 | 2,996 | 98.0 | 73.4 |
| 2005 | 3,030 | 96.0 | 74.4 |
| 2007 | 2,606 | 95.7 | 73.1 |
| 2008 | 3,306 | 98.0 | 80.1 |
| 2011 | 1,193 | 96.0 | 68.8 |
| 2015 | 3,055 | 91.3 | 69.0 |
| 2016 | 3,058 | 91.5 | 69.7 |
| 2017 | 790 | 95.5 | 75.0 |
Incomplete Kennecott data exists with regards to overall core recovery but based on 917 intervals of 10 m or less in the historical database, the average recovery was 92%. Kennecott RQD measurements in the 1998 program averaged 87.0. There has been no systematic evaluation of recovery by rock type.
| Trilogy Metals Inc. | 10-9 | |
NI 43-101 Technical Report on the Arctic Project,
Northwest Alaska | | |
The updated resource herein contains additional drilling not included in the previous 2013 Tetra Tech Preliminary Economic Assessment (Tetra Tech 2013 PEA). Table 10-6 presents significant drill intercepts that have been returned since the previous Arctic Deposit mineral resource estimate (PEA 2013). Notably, all results from the 2015 and 2016 drill campaigns are included in the new resource.
Table 10-6 Drill Intercept Summary Table
| Hole ID | From (m) | To (m) | AI1(m) | Cu % | Au g/t | Ag g/t | Pb % | Zn % | CuEq2% |
| AR15-0132 | 84.54 | 86.96 | 2.42 | 3.64 | 0.65 | 32.3 | 0.70 | 3.46 | 5.67 |
| AR15-0133 | 97.66 | 101.12 | 3.46 | 5.33 | 0.45 | 59.7 | 1.04 | 6.91 | 8.65 |
| AR15-0133 | 136.71 | 140.76 | 4.05 | 2.21 | 0.07 | 11.3 | 0.05 | 0.15 | 2.44 |
| AR15-0133 | 227.50 | 247.56 | 20.06 | 3.12 | 0.29 | 34.3 | 0.14 | 1.20 | 4.09 |
| AR15-0134 | 113.50 | 114.75 | 1.25 | 5.75 | 0.91 | 103.4 | 1.98 | 7.57 | 10.36 |
| AR15-0134 | 131.16 | 133.45 | 2.29 | 2.56 | 0.60 | 35.4 | 0.43 | 1.22 | 3.85 |
| AR15-0134 | 139.10 | 140.45 | 1.35 | 2.80 | 0.52 | 73.5 | 2.42 | 8.80 | 7.31 |
| AR15-0135 | 101.10 | 102.48 | 1.38 | 6.66 | 0.19 | 49.4 | 1.34 | 4.84 | 9.18 |
| AR15-0136 | 184.55 | 193.64 | 9.09 | 7.36 | 2.34 | 219.3 | 0.77 | 5.00 | 13.09 |
| AR15-0136 | 247.60 | 279.72 | 32.12 | 3.08 | 1.56 | 45.9 | 0.18 | 2.72 | 5.47 |
| AR15-0137 | 189.00 | 194.85 | 5.85 | 0.77 | 0.19 | 33.5 | 0.58 | 1.92 | 2.01 |
| AR15-0138 | 170.58 | 188.54 | 17.96 | 4.93 | 0.74 | 102.0 | 0.94 | 5.11 | 8.37 |
| AR15-0139 | 258.25 | 259.95 | 1.70 | 1.14 | 0.02 | 2.6 | 0.01 | 0.05 | 1.20 |
| AR15-0140 | 147.14 | 155.43 | 8.29 | 4.39 | 1.35 | 93.7 | 4.07 | 11.68 | 11.03 |
| AR15-0141 | 94.73 | 99.06 | 4.33 | 4.64 | 1.05 | 82.1 | 1.65 | 8.68 | 9.32 |
| AR15-0142 | 85.88 | 89.30 | 3.42 | 3.76 | 0.72 | 131.9 | 5.43 | 21.83 | 13.81 |
| AR15-0143 | 45.80 | 50.12 | 4.32 | 3.95 | 1.43 | 65.0 | 1.59 | 7.97 | 8.45 |
| AR15-0144 | 187.60 | 198.65 | 11.05 | 7.10 | 0.70 | 80.4 | 1.09 | 9.04 | 11.46 |
| AR15-0144 | 205.25 | 206.25 | 1.00 | 4.37 | 0.05 | 44.5 | 1.71 | 5.99 | 7.20 |
| AR15-0144 | 254.90 | 263.91 | 9.01 | 4.22 | 0.75 | 76.7 | 0.82 | 3.46 | 6.85 |
| AR15-0145 | 124.10 | 145.75 | 21.65 | 3.86 | 0.86 | 71.0 | 1.15 | 5.36 | 7.16 |
| AR15-0145 | 150.90 | 156.00 | 5.10 | 3.82 | 0.68 | 74.7 | 1.60 | 7.21 | 7.72 |
| AR15-0145 | 175.10 | 176.23 | 1.13 | 1.71 | 0.13 | 24.3 | 0.53 | 6.72 | 4.21 |
| AR15-0145 | 184.05 | 190.60 | 6.55 | 6.67 | 0.52 | 31.4 | 0.20 | 3.38 | 8.42 |
| Trilogy Metals Inc. | 10-10 | |
NI 43-101 Technical Report on the Arctic Project,
Northwest Alaska | | |
| AR16-0146 | 113.15 | 118.80 | 5.65 | 5.77 | 0.89 | 73.7 | 1.58 | 8.68 | 10.23 |
| AR16-0146 | 140.40 | 143.25 | 2.85 | 3.19 | 0.88 | 51.5 | 0.33 | 1.66 | 4.94 |
| AR16-0146 | 153.65 | 160.35 | 6.70 | 1.33 | 0.10 | 28.4 | 0.52 | 2.01 | 2.47 |
| AR16-0146 | 200.75 | 212.10 | 11.35 | 2.19 | 0.18 | 15.6 | 0.20 | 3.08 | 3.45 |
| AR16-0146 | 218.50 | 219.65 | 1.15 | 0.98 | 0.14 | 25.2 | 0.66 | 4.14 | 2.78 |
| AR16-0148 | 120.00 | 141.22 | 21.22 | 3.79 | 0.85 | 69.1 | 0.99 | 5.78 | 7.14 |
| AR16-0148 | 148.60 | 150.65 | 2.05 | 3.34 | 0.67 | 77.1 | 1.76 | 7.23 | 7.33 |
| AR16-0148 | 161.58 | 169.77 | 8.19 | 1.03 | 0.06 | 9.5 | 0.20 | 1.34 | 1.63 |
| AR16-0148 | 188.05 | 198.34 | 10.29 | 1.42 | 0.63 | 33.9 | 0.46 | 2.37 | 3.06 |
| AR16-0149 | 153.70 | 162.15 | 8.45 | 5.70 | 1.66 | 63.3 | 0.88 | 8.23 | 10.19 |
| AR16-0149 | 184.00 | 186.08 | 2.08 | 0.91 | 0.12 | 7.7 | 0.03 | 0.52 | 1.24 |
| AR16-0150 | 121.15 | 130.71 | 9.56 | 2.34 | 0.33 | 41.0 | 0.63 | 3.10 | 4.13 |
| AR16-0150 | 138.34 | 151.64 | 13.30 | 2.89 | 0.62 | 48.0 | 0.61 | 4.37 | 5.31 |
| AR16-0150 | 163.00 | 179.60 | 16.60 | 5.40 | 0.20 | 46.0 | 1.23 | 6.69 | 8.40 |
| AR16-0150 | 187.30 | 193.00 | 5.70 | 4.53 | 0.12 | 33.8 | 1.22 | 6.14 | 7.17 |
| AR16-0150 | 204.45 | 219.60 | 15.15 | 1.67 | 0.37 | 24.4 | 0.25 | 2.53 | 3.01 |
| AR16-0151 | 38.84 | 42.13 | 3.29 | 2.82 | 0.20 | 29.6 | 0.07 | 1.80 | 3.83 |
| AR16-0151 | 53.05 | 59.85 | 6.80 | 0.81 | 0.11 | 6.3 | 0.03 | 0.31 | 1.05 |
| AR16-0152 | 143.55 | 146.30 | 2.75 | 2.80 | 0.40 | 31.6 | 0.67 | 3.17 | 4.56 |
| AR16-0152 | 173.10 | 179.88 | 6.78 | 0.90 | 0.04 | 11.1 | 0.16 | 1.84 | 1.64 |
| AR16-0152 | 220.02 | 224.38 | 4.36 | 3.20 | 2.38 | 35.1 | 0.06 | 1.23 | 5.54 |
| AR16-0152 | 241.75 | 249.59 | 7.84 | 2.70 | 0.48 | 50.5 | 0.40 | 2.04 | 4.31 |
| AR16-0153 | 52.02 | 64.61 | 12.59 | 2.49 | 0.86 | 56.6 | 2.17 | 9.64 | 7.20 |
| AR16-0154 | 237.30 | 239.10 | 1.80 | 1.69 | 0.07 | 11.0 | 0.14 | 1.10 | 2.22 |
| AR16-0155 | 138.42 | 146.90 | 8.48 | 6.14 | 1.32 | 96.6 | 1.93 | 8.27 | 11.12 |
| AR16-0155 | 153.45 | 155.41 | 1.96 | 1.62 | 0.24 | 26.2 | 0.64 | 2.52 | 3.01 |
| AR16-0155 | 163.18 | 199.54 | 36.36 | 2.27 | 0.27 | 25.3 | 0.36 | 2.54 | 3.59 |
| AR16-0156 | 180.86 | 189.47 | 8.61 | 5.05 | 0.42 | 76.3 | 1.01 | 5.66 | 8.17 |
| AR16-0157 | 120.28 | 122.18 | 1.90 | 3.15 | 1.65 | 79.8 | 2.09 | 6.37 | 7.65 |
| AR16-0158 | 52.85 | 56.93 | 4.08 | 0.85 | 0.08 | 18.0 | 0.64 | 3.05 | 2.20 |
| AR16-0158 | 65.45 | 67.60 | 2.15 | 8.76 | 1.58 | 108.0 | 1.42 | 6.38 | 13.33 |
Footnotes to Drill Interval Table:
| 1. | AI - Continuous Assayed Interval (meters). |
| 2. | Copper equivalent (CuEq) calculations use metal prices Assumptions of $2 90/lb for copper. $1.300/ox for gold. $22.70/oz for silver. $0.90/lb for ted and $0.85/fc for tine Copper equivalent calculation reflect grass metal content and have not been adjusted for metallurgical recoveries |
| 3. | Results are core intervals and not true thickness; true widths have not been determined for the above Intercepts but are believed to be representative of actual drill thicknesses. |
| 4. | Significant interval defined as a minimum of 1.0 meter Cu interval with average grade >0.7% Cu. |
| 5. | Cutoff grade of 0.7% Cu. |
| 6. | Internal dilution up to five meters of <1.0% Cu. |
| 7. | Intervals of < 1.0 meter not reported |
| 8. | Some rounding errors may occur. |
| 10.9 | Drilling at Other Prospects |
In addition to the drilling focused at the Arctic Deposit, significant exploration drilling has been carried out elsewhere on the property targeting numerous occurrences along the Ambler Schist belt. Much of this exploration is historical in nature and is summarized herein.
Drill results from many of the major prospects are tabulated in Table 10-7 and Table 10-8 and show the limited amount of drilling within the main prospect areas. Figure 10-2 shows the locations of known major prospects and drill collar locations for the Ambler District including Trilogy Metals-controlled Ambler and Bornite sequence targets.
| Trilogy Metals Inc. | 10-11 | |
NI 43-101 Technical Report on the Arctic Project,
Northwest Alaska | | |
Table 10-7 Drill, Meterage and Average Drill Depth for Trilogy Ambler Sequence VMS Targets
| Area | Drill
Holes | Metres | Average
Depth |
| Arctic Deposit | 174 | 39,230 | 225.5 |
| Dead Creek/West Dead Creek | 21 | 3,470 | 165 |
| Sunshine/Bud | 36 | 7,111 | 198 |
| Snow | 11 | 1,527 | 139 |
| Horse/Cliff/DH | 22 | 2,277 | 104 |
| Red/Nora/BT | 18 | 2,399 | 133 |
| Total | 252 | 47,964 | 190 |
Table 10-8 Significant Drill Intercepts – Trilogy Ambler Sequence Prospects
| Prospect | Drill Hole | Length
(m) | Au
(ppm) | Ag
(ppm) | Cu
(%) | Pb
(%) | Zn
(%) |
| BT | BT-4* | 2.56 | N/A | 33.4 | 1.86 | 0.91 | 2.23 |
| BT-6* | 1.98 | N/A | 41.9 | 1.18 | 0.77 | 2.57 |
| BT-7* | 3.2 | N/A | 52.3 | 2.92 | 1.56 | 4.39 |
| Bud | BUD-03 | 2.87 | 0.58 | 67.8 | 1.69 | 0.41 | 1.45 |
| BUD-04 | 1.47 | 0.60 | 51.9 | 1.08 | 0.60 | 1.44 |
| Cliff | CLF-01* | 18.74 | 0.03 | 108.4 | 0.32 | 0.84 | 2.79 |
| CLF-02 | 7.32 | 0.04 | 23.7 | 0.44 | 1.15 | 3.50 |
| CLF-03 | 3.41 | 0.15 | 64.5 | 1.43 | 1.48 | 5.00 |
| CLF-04* | 19.81 | N/A | N.A. | 0.39 | 0.67 | 2.46 |
| CLF-05 | 10.97 | N/A | N.A. | 0.23 | 0.64 | 2.50 |
| CLF-06 | 3.11 | N/A | 38.6 | 0.29 | 1.29 | 2.39 |
| CLF-07 | 5.88 | N/A | 31.5 | 0.36 | 0.79 | 1.63 |
| CLF-08* | 9.67 | N/A | 50.7 | 0.55 | 1.44 | 2.91 |
| CLF-10 | 3.96 | N/A | 61.5 | 0.66 | 1.49 | 2.64 |
| CLF-11 | 8.05 | N/A | 18.3 | 0.68 | 0.70 | 1.54 |
| Dead Creek | AR9803-01 | 2.71 | 0.10 | 22.4 | 0.52 | 0.23 | 1.27 |
| DC-01 | 2.28 | N/A | 37.7 | 4.47 | N.A. | 1.77 |
| DC-02* | 2.59 | N/A | 51.7 | 1.66 | N.A. | 2.01 |
| DC-03* | 4.26 | 0.12 | 40.6 | 3.13 | 0.07 | 1.05 |
| DC-04* | 3.22 | N/A | 67.5 | 1.39 | 0.27 | 1.13 |
| DC-05 | 4.27 | 0.36 | 95.6 | 2.82 | 0.23 | 3.67 |
| DC-06 | 4.57 | 0.06 | 15 | 0.96 | N.A | 0.31 |
| DC-07* | 3.97 | N/A | 87.7 | 0.70 | N.A. | 2.71 |
| DC-08 | 2.41 | N/A | 73.6 | 0.12 | N.A> | 3.68 |
| DC-11 | 1.34 | 0.06 | 64.3 | 0.14 | 1.26 | 3.78 |
| Trilogy Metals Inc. | 10-12 | |
NI 43-101 Technical Report on the Arctic Project,
Northwest Alaska | | |
| Prospect | Drill Hole | Length
(m) | Au
(ppm) | Ag
(ppm) | Cu
(%) | Pb
(%) | Zn
(%) |
| DH | DH-02* | 20.12 | 0.20 | 35.0 | 0.54 | 1.90 | 4.71 |
| DH-03 | 4.57 | 0.08 | 20.1 | 0.13 | 0.45 | 1.01 |
| DH-05 | 9.14 | N/A | 29.3 | 0.33 | 1.3 | 2.01 |
| Horse | HC-02 | 4.72 | N/A | 14.1 | 1.41 | 0.47 | 3.57 |
| Nora | NORA-01 | 1.68 | 0.14 | 17.5 | 1 | 0.58 | 2.94 |
| NORA-07 | 3.44 | 0.04 | 6.9 | 2.81 | 0.01 | 0.01 |
| NORA-08 | 2.9 | 0.07 | 0.9 | 1.21 | 0.01 | 0.01 |
| Red | AR06-101 | 1.05 | 0.06 | 8.3 | 0.04 | 0.37 | 2.02 |
| Snow | SNO-21 | 4.73 | 3.26 | 430.2 | 0.32 | 3.56 | 6.26 |
| SNO-23 | 1.22 | 0.07 | 10.3 | 0.02 | 1.70 | 0.97 |
| SNO-24 | 2.44 | 1.04 | 210.9 | 0.63 | 3.50 | 4.69 |
| Sunshine | SC-01* | 19.65 | 0.04 | 19.3 | 1.41 | 0.28 | 2.01 |
| SC-02* | 18.04 | 0.07 | 19.8 | 1.14 | 0.38 | 3.06 |
| SC-03* | 13.91 | 0.09 | 28.5 | 1.29 | 0.51 | 2.18 |
| SC-04* | 14.17 | 0.87 | 33.9 | 0.94 | 0.77 | 3.17 |
| SC-05* | 19.51 | 0.05 | 37.9 | 1.27 | 0.51 | 2.51 |
| SC-06* | 10.67 | 0.06 | 35.1 | 2.16 | 0.68 | 3.46 |
| SC-08* | 14.49 | 0.11 | 33.6 | 1.78 | 0.99 | 2.59 |
| SC-11* | 6.03 | 0.04 | 8.4 | 0.83 | 0.28 | 1.33 |
| West Dead Creek | WDC-04 | 3.81 | N/A | 21.9 | 0.44 | 0.48 | 1.21 |
| WDC-05* | 5.64 | 0.12 | 81.8 | 0.19 | 0.39 | 1.78 |
| WDC-07 | 6.09 | N/A | 47.6 | 0.23 | 0.74 | 1.94 |
| WDC-10 | 2.16 | 0.138 | 43.2 | 0.37 | 0.76 | 2.11 |
| Notes: | *Weighted sum or more than one interval. |
Composites based on 1.0% copper-equivalent cut-off grade, 1 m minimum composite, and up to 2 m.
| Trilogy Metals Inc. | 10-13 | |
NI 43-101 Technical Report on the Arctic Project,
Northwest Alaska | | |
Figure 10-2 Known Collar Locations and Principal Target Areas – Ambler District (Trilogy Metals, 2017)

Trilogy Metals Tenure
There have been only two drill campaigns (2006 and 2012) as shown in Table 10-2 by Trilogy during their tenure targeting additional prospects beyond Arctic in the Ambler Schist belt. Exploration in 2006 targeted a series of geophysical anomalies in the central portion of the Ambler Schist belt near to Arctic. Twelve holes totalling 3,100 m were drilled. In 2012, Trilogy drilled an additional 4 holes totalling 1,752 m to explore the down dip extension of the Sunshine deposit. Both programs are summarized in Table 10-9 and Figure 10-3 shows the Sunshine Prospect and drill hole locations.
| Trilogy Metals Inc. | 10-14 | |
NI 43-101 Technical Report on the Arctic Project,
Northwest Alaska | | |
Table 10-9 Trilogy’s Exploration Drilling – Ambler Schist Belt
Hole
ID | Area | Target | UTM
East | UTM
North | Azimuth
(°) | Dip
(°) | Depth
(m) |
| AR06-98 | COU | EM Anomaly | 609490 | 7454374 | 0 | -90 | 712.6 |
| AR06-99 | 98-3 | EM Anomaly | 610111 | 7458248 | 0 | -90 | 420.0 |
| AR06-100 | 98-3 | EM Anomaly | 609989 | 7458633 | 0 | -90 | 225.6 |
| AR06-101 | Red | EM Anomaly | 618083 | 7451673 | 0 | -90 | 141.7 |
| AR06-102 | Sunshine | West Extension | 601176 | 7457834 | 30 | -65 | 97.8 |
| AR06-103 | Red | EM Anomaly | 618073 | 7451806 | 0 | -90 | 209.7 |
| AR06-104 | Red | EM Anomaly | 617926 | 7451693 | 0 | -90 | 183.2 |
| AR06-105 | Red | EM Anomaly | 618074 | 7451537 | 0 | -90 | 136.6 |
| AR06-106 | Red | EM Anomaly | 618083 | 7451677 | 310 | -60 | 185.0 |
| AR06-107 | Sunshine | West Extension | 601018 | 7458119 | 30 | -60 | 294.4 |
| AR06-108 | Dead Creek | Downdip Extension | 607618 | 7458406 | 0 | -90 | 289.0 |
| SC12-014 | Sunshine | Sunshine Extension | 601948 | 7457759 | 20 | -57 | 537.8 |
| SC12-015 | Sunshine | Sunshine Extension | 601860 | 7457637 | 20 | -65 | 477.0 |
| SC12-016 | Sunshine | Sunshine Extension | 601649 | 7457637 | 45 | -77 | 386.2 |
| SC12-017 | Sunshine | Sunshine Extension | 602063 | 7457701 | 20 | -60 | 351.1 |
Figure 10-3 Sunshine Prospect and Drill Hole Locations (Trilogy Metals, 2017)
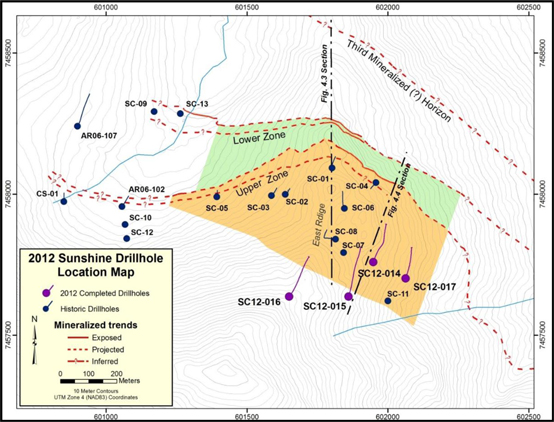
| Trilogy Metals Inc. | 10-15 | |
NI 43-101 Technical Report on the Arctic Project,
Northwest Alaska | | |
| 11.0 | Sample Preparation, Analyses, and Security |
| 11.1.1 | Core Drilling Sampling |
The data for the Arctic Deposit resource was generated over three primary drilling campaigns: 1966 to 1986 when BCMC, a subsidiary of Kennecott Copper Corporation was the primary operator, 1998 when Kennecott Minerals resumed work after a long hiatus, and 2004 to present with NovaGold Resources Inc. and now Trilogy Metals Inc. as the operators.
Kennecott and BCMC
Sampling of drill core prior to 1998 by BCMC focused primarily on the mineralized zones; numerous intervals of weak to moderate mineralization were not sampled during this period. During the 1998 campaign, Kennecott did sample some broad zones of alteration and weak mineralization, but much of the unaltered and unmineralized drill core was left unsampled. Little documentation on historic sampling procedures is available.
NovaGold And Trilogy Tenure
Between 2004 and 2006, NovaGold conducted a systematic drill core re-logging and re-sampling campaign of Kennecott and BCMC era drill holes AR-09 to AR-74. NovaGold either took 1 to 2 m samples every 10 m, or sampled entire lengths of previously unsampled core within a minimum of 1 m and a maximum or 3 m intervals. The objective of the sampling was to generate a full ICP geochemistry dataset for the Arctic Deposit and ensure continuous sampling throughout the deposit. Sample preparation procedures for NovaGold era work are described in the following subsection. Quality assurance/quality control (QA/QC) review of historic sampling is described in Section 11.4.
All drill core was transported by helicopter in secure core “baskets” to either the Dahl Creek camp or the Bornite camp for logging and sampling. Sample intervals were determined by the geologist during the geological logging process. Sample intervals were labelled with white paper tags and butter (aluminum) tags which were stapled to the core box. Each tag had a unique number which corresponded to that sample interval.
Sample intervals were determined by the geological relationships observed in the core and limited to a 3 m maximum length and 1 m minimum length. An attempt was made to terminate sample intervals at lithological and mineralization boundaries. Sampling was generally continuous from the top to the bottom of the drill hole. When the hole was in unmineralized rock, the sample length was generally 3 m, whereas in mineralized units, the sample length was shortened to 1 to 2 m.
| Trilogy Metals Inc. | 11-1 | |
NI 43-101 Technical Report on the Arctic Project,
Northwest Alaska | | |
Geological and geotechnical parameters were recorded based on defined sample intervals and/or drill run intervals (defined by the placement of a wooden block at the end of a core run). Logged parameters were reviewed annually and slight modifications have been made between campaigns, but generally include rock type, mineral abundance, major structures, SG, point load testing, recovery and rock quality designation measurements. Drill logs were converted to a digital format and forwarded to the Database Manager, who imported them into the master database.
Core was photographed and then brought into the saw shack where it was split in half by the rock saw, divided into sample intervals, and bagged by the core cutters. Not all core was oriented; however, core that had been oriented was identified to samplers by a line drawn down the core stick. If core was not competent, it was split by using a spoon to transfer half of the core into the sample bag.
Once the core was sawed, half was sent to ALS Minerals Laboratories (formerly ALS Chemex) in Vancouver for analysis and the other half was initially stored at the Dahl Creek camp but has been consolidated at the storage facility at the Bornite camp facilities or at Trilogy Metals warehouse in Fairbanks.
Shipment of core samples from the Dahl Creek camp occurred on a drill hole by drill hole basis. Rice bags, containing two to four poly-bagged core samples each, were marked and labelled with the ALS Minerals address, project and hole number, bag number, and sample numbers enclosed. Rice bags were secured with a pre-numbered plastic security tie and a twist wire tie and then assembled into standard fish totes for transport by chartered flights on a commercial airline to Fairbanks, where they were met by a contracted expeditor for deliver directly to the ALS Minerals preparation facility in Fairbanks. In addition to the core, control samples were inserted into the shipments at the approximate rate of one standard, one blank and one duplicate per 20 core samples:
| · | Standards: four standards were used at the Arctic Deposit. The core cutter inserted a sachet of the appropriate standard, as well as the sample tag, into the sample bag. |
| · | Blanks: were composed of an unmineralized landscape aggregate. The core cutter inserted about 150 g of blank, as well as the sample tag, into the sample bag. |
| · | Duplicates: the assay laboratory split the sample and ran both splits. The core cutter inserted a sample tag into an empty sample bag. |
Samples were logged into a tracking system on arrival at ALS Minerals, and weighed. Samples were then crushed, dried, and a 250 g split pulverized to greater than 85% passing 75 μm.
Gold assays were determined using fire analysis followed by an atomic absorption spectroscopy (AAS) finish. The lower detection limit was 0.005 ppm gold; the upper limit was 1,000 ppm gold. An additional 49-element suite was assayed by inductively coupled plasma-mass spectroscopy (ICP-MS) methodology, following nitric acid aqua regia digestion. The copper, zinc, lead, and silver analyses were completed by atomic absorption (AA), following a triple acid digest, when overlimits.
| Trilogy Metals Inc. | 11-2 | |
NI 43-101 Technical Report on the Arctic Project,
Northwest Alaska | | |
| 11.1.2 | Acid-Base Accounting Sampling |
In 1998, a broad assessment of ARD at the Arctic Deposit (Robertson 1998) was conducted with a focus on characterization for surface development. Criteria used for assessing and classifying ARD potential have since been modified.
In 2010, SRK collected 148 samples from drill core based on their position relative to the massive and semi-massive sulphide mineralization (SRK 2011). Samples were targeted within, immediately adjacent to, adjacent to, and between lenses of mineralization; the sampling program focused on characterization for underground development. Samples were shipped to SGS Canada Inc., Burnaby, BC, for sample preparation and analysis. Samples were analyzed for ABA and metals. ABA tests were conducted using the Sobek method with sulphur speciation and total inorganic carbon (TIC) analysis. Metal concentrations were determined using aqua regia digestion followed by ICP-MS analysis. In addition barium and fluorine were analyzed by x-ray fluorescence (XRF) following a lithium metaborate fusion.
In 2015, Trilogy Metals retained SRK to provide metal leaching and acid rock drainage (ML/ARD) characterization services for the Arctic project. Activities focused on three objectives: 1) construction of on-site barrel tests and parallel humidity cells, 2) expansion of the current acid-base-accounting (ABA) database to support future evaluation for ARD potential management for open pit mining, and 3) evaluation of the use of proxies for ABA parameters in the exploration database with the purpose of being able to use the exploration database for block modelling of ML/ARD potential, if needed. Barrel test samples were collected during July and August 2015 and eight on-site barrel tests were constructed and initiated in late August 2015. Following the set-up of the on-site barrel tests, representative composite samples were shipped to Maxxam Analytics of Burnaby, British Columbia and parallel humidity cells were initiated in late October 2015. Trilogy Metals and SRK selected 321 samples to be analyzed for a conventional static ABA package with a trace element scan using the same method as the exploration database. Samples are currently being analysed at ALS Minerals (Vancouver). Upon completion of the laboratory test work, SRK evaluated the use of proxies and worked with Trilogy Metals regarding next steps in regards to the block modelling of ML/ARD potential. This work is on-going.
| 11.1.3 | Density Determinations |
Representative SG determinations conducted before 1998 for the Arctic Project are lacking. Little information regarding sample size, sample distribution and SG analytical methodology are recorded for determinations during this period.
| Trilogy Metals Inc. | 11-3 | |
NI 43-101 Technical Report on the Arctic Project,
Northwest Alaska | | |
In 1998, Kennecott collected 38 core samples from that year’s drill core, of which 22 were from mineralized zones and 16 from non-mineralized lithologies. Mineralized samples were defined as MS (more than 50% total sulphides), SMS (less than 50% total sulphides) or lithology samples (non-mineralized country rock containing up to 10% sulphides). SG determinations were conducted by ALS Minerals and Golder and Associates and were based on short (6 to 12 cm) whole core samples and determined based on the water displacement method.
In 1999, Kennecott collected 231 samples from pre-1998 drill core for SG analysis. The samples were from NQ- and BQ-sized core and averaged 7.27 cm in length. The samples were shipped to Anchorage but were not forwarded to a lab for further analysis.
In 2004, NovaGold forwarded the 231 samples from the pre-1998 drill campaigns, stored in Kennecott’s Anchorage warehouse, as well as 33 new samples from the 2004 drill program, to ALS Minerals Laboratories for SG analysis.
Additionally, in 2004 NovaGold collected 127 usable field SG measurements. Samples were collected from HQ-sized core and averaged 9.05 cm in length. An Ohaus Triple Beam Balance was utilized to determine a weight-in-air value for dried core, followed by a weight-in-water value. The wet-value was determined by suspending the sample by a wire into a water-filled bucket. The SG value was then calculated using the following formula:
Weight in air
[Weight in air – Weight in water]
In 2011, NovaGold geologists stopped collecting short interval “point data” (as described above) within the mineralized zone, and instead collected “full-sample-width” determinations from existing 2008 split core and all of the sampled 2011 whole core. The samples averaged 1.69 m in length. Samples were collected continuously within mineralized zones and within a 2 to 3 m buffer adjacent to mineralized zones. Two hundred sixty-six sample pulps were also submitted to ALS Minerals for SG determination by pycnometer analysis. In total, 459 valid SG determinations were collected, ranging from 2.64 to 4.99.
Between 2015 and 2016, Trilogy Metal geologists collected SG data consistent with the 2011 campaign. The samples averaged 2.19m in length. Samples were collected continuously within mineralized zones and within a 2 to 3m buffer adjacent to mineralized zones.
Security measures taken during historical Kennecott and BCMC programs are unknown to NovaGold or Trilogy. Trilogy is not aware of any reason to suspect that any of these samples have been tampered with. The 2004 to 2016 samples were either in the custody of NovaGold personnel or the assay laboratories at all times, and the chain of custody of the samples is well documented.
| Trilogy Metals Inc. | 11-4 | |
NI 43-101 Technical Report on the Arctic Project,
Northwest Alaska | | |
| 11.3 | Assaying and Analytical Procedures |
The laboratories used during the various exploration, infill, and step-out drill analytical programs completed on the Arctic Project are summarized in Table 11-1.
ALS Minerals has attained International Organization for Standardization (ISO) 9001:2000 registration. In addition, the ALS Minerals laboratory in Vancouver is accredited to ISO 17025 by Standards Council of Canada for a number of specific test procedures including fire assay of gold by AA, ICP and gravimetric finish, multi-element ICP and AA assays for silver, copper, lead and zinc.
Table 11-1 Analytical Laboratories Used by Operators of the Arctic Project
Laboratory
Name | Laboratory
Location | Years
Used | Accreditation | Comment |
Union Assay
Office, Inc. | Salt Lake City, Utah | 1968 | Accreditations are not known. | Primary Assay Lab |
Rocky Mountain
Geochemical Corp. | South Midvale, Utah | 1973 | Accreditations are not known. | Primary and Secondary Assays |
Resource Associates
of Alaska, Inc. | College, Alaska | 1973, 1974 | Accreditations are not known. | Primary and Secondary Assays |
Georesearch
Laboratories, Inc. | Salt Lake City, Utah | 1975, 1976 | Accreditations are not known. | Primary and Secondary Assays |
Bondar-Clegg &
Company Ltd. | North Vancouver BC | 1981, 1982 | Accreditations are not known. | Primary and Secondary Assays |
| Acme Analytical Laboratories Ltd. (AcmeLabs) | Vancouver, BC | 1998, 2012,
2013 | Accreditations are not known. | 2012 and 2013 Secondary Check Sample Lab |
| ALS Analytical Lab | Fairbanks, Alaska (prep) and Vancouver, BC (analytical) | 1998, 2004,
2005, 2006,
2012, 2013, 2015, 2016 | In 2004, ALS Minerals held ISO 9002 accreditations but changed to ISO 9001 accreditations in late 2004. ISO/International Electrotechnical Commission (IEC) 17025 accreditation was obtained in 2005. | 2012 - 2016 Primary Assay Lab |
| Trilogy Metals Inc. | 11-5 | |
NI 43-101 Technical Report on the Arctic Project,
Northwest Alaska | | |
| 11.4 | Quality Assurance/Quality Control |
| 11.4.1 | Core Drilling Sampling QA/QC |
Previous data verification campaigns were limited in scope and documentation and are described by SRK (2012).
During 2013, Trilogy conducted a 26% audit of the NovaGold era assay database fields: sample interval, Au, Ag, Cu, Zn, and Pb. This audit is documented in a series of memos (West 2013). Trilogy Metals staff did not identify and/or correct any transcription and/or coding errors in the database prior to resource estimation. Trilogy Metals also retained independent consultant Caroline Vallat, P.Geo. of GeoSpark Consulting Inc. (GeoSpark) to: 1) re-load 100% of the historical assay certificates, 2) conduct a QA/QC review of paired historical assays and NovaGold era re-assays; 3) monitor an independent check assay program for the 2004 to 2008 and 2011 drill campaigns; and 4) generate QA/QC reports for the NovaGold era 2004 to 2008 and NovaCopper/Trilogy Metals era 2011, 2015, and 2016 drill campaigns. Below is a summary of the results and conclusions of the GeoSpark QA/QC review.
NovaGold QA/QC Review on Historical Analytical Results
During 2004, NovaGold conducted a large rerun program and check sampling campaign on pre-NovaGold (pre-2004) drill core. The 2004 and 2005 ALS Minerals Laboratories primary sample results have been assigned as the primary assay results for the Arctic Project in the database, amounting to 1,287 of the total 3,186 primary samples related to pre-NovaGold drill holes.
During 2013, GeoSpark conducted a QA/QC review of available QA/QC data (20130422 – QAQC on Pre-NovaGold Arctic Assays); including sample pair data amounting to 422 data pairs which is 11% relative to the primary sample quantity. The sample pairs included original duplicates, original repeat assays, 2004 rerun assays on original sample pulps analyzed secondarily at ALS Minerals, and check samples from 2004 on original samples re-analyzed at ALS Minerals.
The review found that the available QA/QC data is related to drill holes that are spatially well distributed over the historic drill hole locations.
| Trilogy Metals Inc. | 11-6 | |
NI 43-101 Technical Report on the Arctic Project,
Northwest Alaska | | |
Figure 11-1 Spatial Availability of QA/QC Data (Trilogy Metals, 2017)
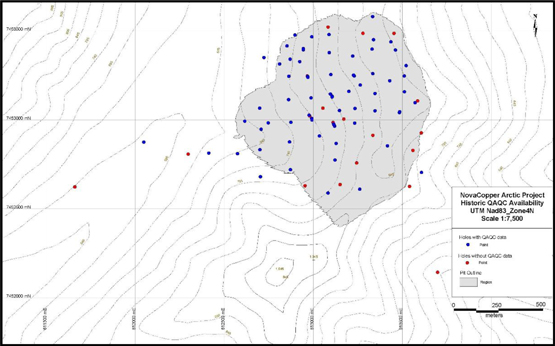
Review of Precision
A comparison of the original analytical results with the secondary results serves to infer the level of precision within the original results. Also, the 2004 rerun sample results and the check sample pair results from 2004 and 2005 were compared to the original assays to infer the level of repeatability or precision within the original results.
The result of the average relative difference (AD) review on sample pairs found satisfactory to good inferred precision levels for all of the sample pairs and elements except for the 2004 rerun sample lead results. For the lead 2004 rerun sample pairs there were 66.85% of the pairs less than the 1 AD limit, inferring poor precision in the original results. Overall, the lead values were found to pass the AD criteria for the original duplicates, original repeats, and check sample reviews. More insight was made regarding the lead precision upon review of the data pairs graphically within scatter plots and Thompson-Howarth Precision Versus Concentration (THPVC) plots. The 2004 rerun sample lead values were found to infer a poor-to-moderate level of precision and an indication that the original results might be of negative bias where the original results may have been reported on average 0.2% less than their true values for grades of 0.5% lead and higher. However, the original duplicate, original repeats, and check samples inferred that there was a moderate or satisfactory level of correlation within the lead values. Furthermore, the overall inference of precision in the lead values has been defined as moderate.
The detailed review of the gold pairs inferred an overall moderate level of precision within the original analytical results.
| Trilogy Metals Inc. | 11-7 | |
NI 43-101 Technical Report on the Arctic Project,
Northwest Alaska | | |
The silver, copper, and zinc analytical pair review found overall inferred strong precision in the original analytical results.
It is GeoSpark's opinion that the detailed review of analytical pair values reported for gold, silver, copper, lead and zinc has inferred an overall acceptable level of precision within the original sample analytical results for the pre-NovaGold Arctic Project.
Review of Accuracy
The rerun sample program of 2004 included analysis of 53 QA/QC materials comprising 20 standards and 33 blanks. These standards and blanks were reviewed in order to indirectly infer the accuracy within the original sample data.
The 2004 rerun samples on original pulps also included analysis of standards and blanks with the primary samples. These results have been reviewed using control charts for review of the inferred accuracy within the 2004 rerun sample results; in addition, the inferred rerun sample accuracy is related to the accuracy of the original results in that comparison of the original results to the 2004 reruns and has been shown to be acceptable overall.
The blank results were reviewed for gold, silver, copper, lead, and zinc and it has been inferred that there is good accuracy within the results and that there was no significant issue with sample contamination or instrument calibration during the analysis.
The standard results were reviewed for gold, silver, copper, lead, and zinc. The reported control limits were available for silver, copper, lead, and zinc. The gold control limits were calculated for the review.
In addition upon initial review, the zinc control limits were also calculated from the available data to provide a more realistic range of control values for the results. The gold, silver, and copper results were inferred to be of strong accuracy. The lead and zinc results were inferred to be of moderate accuracy overall.
It was GeoSpark’s opinion that the review for accuracy has found an acceptable level of inferred accuracy within the gold, silver, copper, lead, and zinc results reported for the 2004 rerun samples and indirectly within the original results.
Review of Bias
There were 35 check samples on original samples re-assayed at ALS Minerals during 2004. These were reviewed for an indication of bias in the original results. Additionally, the 2004 rerun sample results have been reviewed for inference of bias in the original results.
Overall, the detailed review of the check sample pair gold concentrations has found minor positive bias in the 2004 pairs and minor positive bias in the 2005 pairs. The level of bias is inferred to be at very near zero with the original being reported approximately 0.005 greater than the 2004 results reported by ALS Minerals. The 2004 rerun samples compared to the originals has inferred negligible bias in the original gold results. It is GeoSpark's opinion that these levels of inferred bias are not significant to merit concern with the overall quality of gold values reported for the pre-NovaGold Arctic Project.
| Trilogy Metals Inc. | 11-8 | |
NI 43-101 Technical Report on the Arctic Project,
Northwest Alaska | | |
The detailed review of the check sample silver pairs has found minor negative bias implied by the 2004 check sample pairs. The 2004 rerun samples have shown a negligible amount of bias in the original results. It is GeoSpark’s opinion that overall the bias in original silver concentrations is inferred to be negligible to minor negative but not significant to merit concern of the overall quality of the silver results.
The copper check samples reported in 2004 were found to have a few anomalous results that were implying significant positive bias. However, a more detailed review found that the exclusion of the anomalous pairs resulted in a minor positive bias overall. The 2004 rerun sample copper results have shown that there is a possibility for positive bias in the original copper grades at concentrations greater than 5%. Overall, it is GeoSpark’s opinion that the bias inferred within the original copper results is not significant to merit concern with the original assay quality.
The 2004 check sample review inferred overall small negative bias in the original lead results. The 2004 rerun sample data also inferred that there was a small negative bias in the original results for grades over 0.5%. Overall, it is GeoSpark’s opinion that this detailed review has inferred that the levels of inferred bias within the lead concentrations are not significant enough to merit concern over the original result quality.
The original zinc results have been inferred to be of very minor positive bias when the 2004 check sample pairs (excluding three anomalous pairs) are reviewed. The 2004 rerun sample zinc values have been shown to be very comparable with the originals and a negligible amount of bias can be inferred in the original zinc concentrations. Furthermore, this detailed bias review has inferred that there is no significant bias in the original zinc results for the pre-NovaGold Arctic Project.
Conclusion
The pre-NovaGold Arctic Project database analytical results have been verified and updated to provide a good level of confidence in the database records.
It is GeoSpark’s opinion that with consideration of the historic nature of the Arctic Project, a sufficient amount of QA/QC data and information has been reviewed to make a statement of the overall pre-NovaGold Arctic Project analytical result quality.
It is GeoSpark’s opinion that this detailed review has inferred that the pre-NovaGold Arctic Project analytical results are of overall acceptable quality.
QA/QC Review on NovaGold (2004 to 2013) Analytical Results
During 2013, GeoSpark conducted a series of QA/QC reviews on Trilogy Metals 2004 to 2013 analytical results. These QA/QC reviews serve to infer the precision of the Trilogy Metals Arctic Project analytical results through a detailed analytical and statistical review of field duplicate samples; serve to infer the accuracy of the analytical results through a review of the standards and blanks inserted throughout the Trilogy Metals programs; and serve to define any bias in the primary sample results through a review of secondary lab checks at AcmeLabs in Vancouver, BC.
| Trilogy Metals Inc. | 11-9 | |
NI 43-101 Technical Report on the Arctic Project,
Northwest Alaska | | |
The QA/QC reviews are documented in a series of memos (Vallat 2013c, 2013d, 2013e, 2013f, 2013g, 2013h). The reviews are summarized in the following subsections by year of campaign.
2004
The 2004 exploration program at the Arctic Project included drilling and sampling related to 11 drill holes AR04-0078 through AR04-0088, amounting to 989 primary samples assayed within 61 assay certificates reported by ALS Minerals in Fairbanks, Alaska.
The field duplicate pairs were reviewed analytically using an AD guideline to gauge the inferred level of precision within the results. This review found that the gold, silver, copper, lead and zinc grades were reported with less than 0.3 AD for at least 75% of the sample pairs. This shows strong repeatability or precision throughout.
In addition, scatter plots and THPVC plots were reviewed. The scatter plots showed moderate to strong precision within the gold grades, and strong precision within the silver, copper, lead, and zinc grades reported by ALS Minerals for the 2004 Arctic Project. The THPVC review found an inferred poor level of repeatability within the gold results, but further review showed that the precision percent was exaggerated due to the low gold grades reported for the samples. It is GeoSpark’s opinion that the THPVC review of the gold is an unreliable measure of the precision due to the low grades and that the earlier analytical tests and scatter plot results are more representative of the inferred precision for the gold results.
The THPVC review found very strong repeatability of precision within the silver, copper, lead, and zinc concentrations reported by ALS Minerals for the 2004 Arctic Project.
Overall, the precision has been inferred to be strong for the gold, silver, copper, lead, and zinc concentrations reported by ALS Minerals for the 2004 Arctic Project.
Overall, the analytical results of analysis for gold reported by ALS Minerals for the 2004 Arctic Project have been inferred to be of strong accuracy. The silver, copper, lead, and zinc values have been inferred to have moderate or satisfactory accuracy. In addition, the review has shown no significant ongoing issues with sample contamination or instrument calibration.
The check sample review has found no bias inferred within the gold and silver grades reported for the 2004 Arctic Project. A small level of positive bias was inferred within the copper, lead, and zinc results reported on high-grade samples. The copper and lead bias may be attributable to specific details of the assay methodology. The zinc bias is more likely a reflection of a lack of repeatability at high grades. It is GeoSpark’s opinion that overall the levels of bias are not significant enough to merit concern with the sample result quality.
| Trilogy Metals Inc. | 11-10 | |
NI 43-101 Technical Report on the Arctic Project,
Northwest Alaska | | |
2005
The 2005 exploration program at the Arctic Project included drilling and sampling related to nine drill holes labelled AR05-0089 through AR05-0097, amounting to 1,228 primary samples assayed within 36 assay certificates reported by ALS Minerals in Fairbanks, Alaska.
The review of field duplicates, blanks and standards, and check samples has allowed for inference of a reasonable level of precision, good accuracy, and insignificant levels of bias within the primary sample results reported by ALS Minerals related to the 2005 Arctic Project.
This detailed QA/QC review on the analytical results reported for the 2005 Arctic Project has allowed for overall confidence in the analytical result quality.
The analytical results can be inferred to be of sufficient quality to represent the Arctic Project.
2006
The 2006 exploration program at the Arctic Project included drilling and sampling related to 12 drill holes labelled AR06-98 through AR06-109, amounting to 1,175 primary samples analyzed at ALS Minerals.
The review of field duplicates, blanks and standards, and check samples for the 2006 Arctic Project has allowed for inference of a good level of precision, good accuracy, and insignificant levels of bias within the primary sample results reported by ALS Minerals related to drill holes AR06-98 through AR06-109.
The analytical results can be inferred to be of sufficient quality to represent the Arctic Project.
2007
The 2007 exploration program at the Arctic Project included drilling and sampling related to four drill holes labelled AR07-110 through AR07-113, amounting to 950 primary samples analyzed at ALS Minerals.
The review of field duplicates, blanks and standards, and check samples for the 2007 Arctic Project has allowed for inference of a good level of precision, good accuracy, and insignificant levels of bias within the primary sample results reported by ALS Minerals related to drill holes AR07-110 through AR07-113.
The analytical results can be inferred to be of sufficient quality to represent the Arctic Project.
2008
The 2008 exploration program at the Arctic Project included drilling and sampling related to 14 drill holes labelled AR08-0114 through AR08-0126 and also drill hole AR08-0117w, amounting to 1,406 primary samples assayed within 44 assay certificates reported by ALS Minerals in Fairbanks, Alaska.
Trilogy Metals Inc. NI 43-101 Technical Report on the Arctic Project,
Northwest Alaska | 11-11 | |
The review of field duplicates, blanks and standards, and check samples for the 2008 Arctic Project has allowed for inference of a reasonable level of precision, good accuracy, and insignificant levels of bias within the primary sample results reported by ALS Minerals related to drill holes AR08-0114 through AR08-0126.
The analytical results can be inferred to be of sufficient quality to represent the Arctic Project.
2011 (Analyzed in 2013)
For the assay certificates FA13021131, FA13021132, FA13021133, FA13021134, and FA13021135 there were six field duplicate pairs, six blank instances, and three standard instances available for review of the QA/QC of the reported results.
The duplicates for gold, silver, copper, lead, and zinc were found to correlate well with the primary sample results and it can be inferred that the primary results are of good precision.
Each of the blank instances of analysis was returned within the control limits for the material. Issues with sample contamination and instrumentation difficulties can be ruled out. In addition the accuracy can be inferred to be strong.
The standard instances of analysis were each retuned within the acceptable range for gold, silver, copper, lead, and zinc; it is inferred that there is strong accuracy within the reported primary sample assay results.
The detailed review of secondary lab check sample results reported by ALS Minerals or the 2011 drill holes assayed in 2013 and reported within the defined analytical certificates has shown that for the gold, silver, copper, lead, and zinc results there is no need to be concerned with the overall quality of the results and any indication of bias in the results is not significant to the result quality.
The assays within the certificates reviewed by GeoSpark can be inferred to be of good quality to represent the Arctic Project.
2015
Twenty nine analytical certificates from ALS in Fairbanks, Alaska were added to the NovaCopper Inc. database. Each of the certificates was reviewed for inferred precision and inferred accuracy through detailed review of field duplicate, blank, and standard assays reported within the sample batches. The analysis of the drill core sample copper, silver, lead, and zinc was performed using four acid digest ICPMS analytical methodology. Gold assays were performed using fire assay with an atomic absorption finish.
Trilogy Metals Inc. NI 43-101 Technical Report on the Arctic Project,
Northwest Alaska | 11-12 | |
The field duplicate sample pairs were reviewed statistically and using an average relative difference comparison. The field duplicate pairs were also reviewed within scatter plots displaying the correlation within the sample pairs. The strength of the correlation is a measure of the inferred precision within the results. Any significant differences within the duplicate pairs resulted in detailed review of the sample assays and any issues were fixed where possible.
This review has found that the duplicate pairs are well correlated overall and it is inferred that there is strong precision within the reported copper, silver, gold, lead, and zinc assay results reported by ALS.
Standards and blanks are a measure of the analytical results accuracy and the blanks also serve to indicate any issues with sample contamination or instrument calibration deficiencies.
The field standard and blank instances were reviewed and defined as failing when results were in excess of plus and minus three standard deviations from the expected mean for the standard material. Failing blanks or standards were re-analyzed along with the nearby samples in order to clear up potential accuracy deficiencies and to maintain top quality assays in the database.
Detailed review of the 67 reported blank issues has inferred that with an overall passing rate of 92.5% there is overall strong accuracy within the reported low grade copper, silver, gold, lead, and zinc results. In addition the review has shown that there were no significant or unresolved issues with sample contamination or instrument calibration deficiencies.
The standards review found that overall with 95.65% of the results within the control limits, it is the author's opinion that strong accuracy can be inferred within the reported copper, silver, gold, lead, and zinc assays.
Secondary lab check samples were analyzed at SGS Canada Inc. located in Burnaby, British Columbia, Canada. These secondary lab check samples were carefully selected to represent the data population using a random selection of five percent of the samples within percentile range groups. These check sample assays have been compared to the primary lab assays in order to review the results for bias.
Statistics of the check samples compared to the primary samples has shown strong correlation within the data pairs.
The average differences were also calculated for the check sample pairs and it was inferred that the copper grades reported by ALS were reported with a negative bias with results reported on average 0.02356% less than the SGS results; the detailed review of the difference plot shows that the inferred bias begins at the high copper grade of 4.42 Cu %. It appears that the SGS methodology is reporting minimally higher copper grades at the ore grade level and specifically above this 4.42 Cu % mark. However, the author can see that the statistics and scatter plot show strong repeatability even at the high grades and ultimately it is the author's opinion that there is no need for concern with the ALS copper result quality.
Trilogy Metals Inc. NI 43-101 Technical Report on the Arctic Project,
Northwest Alaska | 11-13 | |
The zinc results reported at higher grade (1.07 pct and higher) were also inferred to have bias; the average difference shows a bias level of 0.06819 % zinc at these grade levels. The scatter plot also shows this bias, but the correlation within the results is shown to be quite strong even at the high grades. The difference chart shows that the samples with zinc reported below 1.07 % have negligible bias. Ultimately it appears that the ore grade level methodology used by SGS produces slightly lower zinc grades compared to that of ALS, it is difficult to say which lab is correct without further testing. However, the author does not feel that further testing is necessary. Overall it is the author's opinion that the zinc results reported by ALS are not significantly biased and the ALS zinc results are of overall good quality; this opinion is strongly influenced by the strong correlation shown within the data statistics and the scatter plot.
The silver, gold, and lead check sample assays were found to show insignificant bias levels as per this review.
This QAQC review by GeoSpark has found overall good quality within the copper, silver, gold, lead, and zinc results reported by ALS for NovaCopper Inc.'s 2015 Arctic project exploration program.
2016
Thirty analytical certificates were added to the Arctic database, these were analyzed at ALS in Vancouver, BC following sample preparation by ALS in Fairbanks, Alaska. The analysis of the drill core samples for copper, silver, lead, and zinc was performed using four acid digest ICP-MS analytical methodology. Gold assays were performed using fire assay with an atomic absorption finish.
The certificates were reviewed for inferred precision and inferred accuracy through detailed review of field duplicate, blank, and standard assays reported within the sample batches.
One of the assay certificates (VA16159436) was specific to whole Metallurgical samples (MET_WCORE). This certificate was reviewed using the internal lab QAQC data. The author found that the internal lab QAQC had all passing duplicates showing good precision within the assays and also the review found all blank and standard instances passed the labs control tests inferring that the assays were with strong accuracy.
The field duplicate sample pairs were reviewed statistically and using an average relative difference comparison. The field duplicate pairs were also reviewed within scatter plots displaying the correlation within the sample pairs. The strength of the correlation is a measure of the inferred precision within the results. Any significant differences within the duplicate pairs resulted in detailed review of the sample assays and any issues were fixed where possible.
This review has found that the duplicate pairs are well correlated overall and it is inferred that there is strong precision within the reported copper, silver, gold, lead, and zinc assay results reported by ALS.
Trilogy Metals Inc. NI 43-101 Technical Report on the Arctic Project,
Northwest Alaska | 11-14 | |
Standards and blanks are a measure of the analytical results accuracy and the blanks also serve to indicate any issues with sample contamination or instrument calibration deficiencies.
The field standard and blank instances were reviewed and defined as failing when results were in excess of plus and minus three standard deviations from the expected mean for the standard material. Failing blanks or standards were re-analyzed along with the nearby samples in order to clear up potential accuracy deficiencies and to maintain top quality assays in the database. Initial review of the assay certificates as they were reported found a few cases of standard instances failing; for any failed instances the nearby samples were also rerun in order to potentially improve the local accuracy statement.
Detailed review of the 58 reported blank instances has inferred that with all instances passing control tests percent there is overall strong accuracy within the reported low grade copper, silver, gold, lead, and zinc results. In addition the review has shown that there were no significant or unresolved issues with sample contamination or instrument calibration deficiencies.
The standards review found that for all assay certificates where the internal lab standards were reviewed the indication is that the copper, silver, gold, lead, and zinc results are of strong accuracy. The internal standards also have shown strong accuracy overall within the copper, silver, gold, lead, and zinc primary sample assay results.
Secondary lab check samples were analyzed at SGS Canada Inc. located in Burnaby, British Columbia, Canada. These secondary lab check samples were carefully selected to represent the data population using a random selection of five percent of the samples within percentile range groups. These check sample assays have been compared to the primary lab assays in order to review the results for bias.
Statistics of the check samples compared to the primary samples has shown strong correlation within the data pairs. The average differences were also calculated for the check sample pairs and these do not indicate significant bias.
It is the author's opinion that the copper assays on check sample pairs do not infer any bias.
Considering the complete review of check sample pair silver grades, it is the author's opinion that there is a small level of implied bias (approximately 3.38 ppm lower silver in ALS results) for higher grade (greater than 12.85 Ag ppm) silver results, but this is not to an extent where concern is merited.
The gold assays on check sample pairs show overall strong correlation and in the author's opinion there is no indication of bias in the results.
It is the author's opinion that the review of lead results for the check sample pairs shows no indication of bias in the results.
Trilogy Metals Inc. NI 43-101 Technical Report on the Arctic Project,
Northwest Alaska | 11-15 | |
Considering the entire review of check sample zinc results, it is the author's opinion that the level of inferred bias (average of 0.12 Zn % greater in ALS results when the over limit analysis methodology was used) does not show any need for concern with the overall primary lab zinc assay result quality.
This QAQC review by GeoSpark has found overall very good quality within the copper, silver, gold, lead, and zinc results reported by ALS for Trilogy Metals Inc.'s 2016 Arctic project exploration program.
| 11.4.2 | Acid-Base Accounting Sampling QA/QC |
SRK conducted a QA/QC review of the 2010 ABA dataset for the Arctic Project in March 2011. The memo entitled “Preliminary ML/ARD Analysis Ambler District Arctic Deposit, Alaska”, located in NovaCopper’s Document Management System (DMS), discusses the results of the ABA review and documents the 33 duplicate ABA analyses on the lab certificates.
| 11.4.3 | Density Determinations QA/QC |
A QA/QC review of the SG dataset for the Arctic Project was conducted by NovaCopper staff in March 2013. The memo entitled “Arctic_Specific Gravity Review_A.West_20130326”, located in NovaCopper’s DMS, discusses the results of the QA/QC review and is summarized in the following subsections.
Lab versus Field Determinations
SG lab determinations conducted during 2004 produced significantly lower average SG results for the mineralized zone than the 1998 and 2004 average field determinations. In the same test, lithology samples outside the mineralized zone produced comparable values. The difference between the averaged 1998 and 2004 lab results and those from field studies may be the result of selection bias, limited population size, and sample length. Paired lab and field determinations from the 2004 program show very low variation.
In 2010, to check the validity of the wet-dry measurements on the Arctic Deposit core with respect to possible permeability of the core samples, NovaGold measured 50 unwaxed samples representing a full range of SG values for a variety of lithologies and then submitted the samples to ALS Minerals for wet-dry SG determinations after being sealed in wax. The mean difference between the NovaGold unwaxed and the ALS Minerals waxed SG determinations was 0.01.
In 2011, to check the accuracy of the wet-dry measurements, the SG for 266 pulps was determined by pycnometer by ALS Minerals (ALS code OA-GRA08b). Figure 11-2 shows that the two methods compare favourably, with the wet-dry measurements displaying a very slight low bias. Generally, wet-dry measurements are considered the more acceptable method for accurate SG determinations since they are performed on whole (or split) core that more closely resembles the in-situ rock mass.
Trilogy Metals Inc. NI 43-101 Technical Report on the Arctic Project,
Northwest Alaska | 11-16 | |
| Figure 11-2 | Graph Showing Good Agreement between Wet-dry Measured Specific Gravity and Pycnometer Measured Specific Gravity |
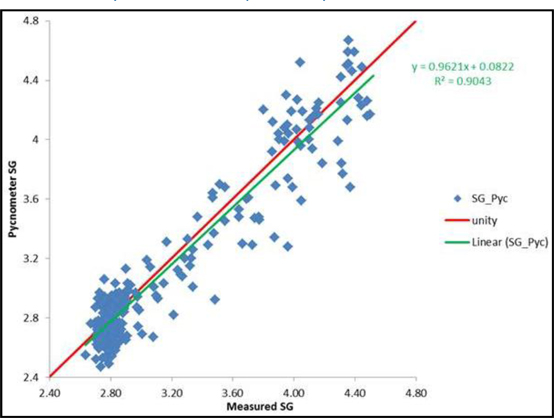
Stoichiometric Method
Full sample length determinations can be directly compared to the assay results for copper, zinc, lead, iron, and barium that are the major constituents of the sulphide and sulphate species for the Arctic Deposit. This allows NovaCopper to check the wet-dry measurements by estimating the SG for an ideal stoichiometric distribution of the elements into sulphide and sulphate species.
Stoichiometric SG values were estimated for 279 sample intervals from 2008 drill core that had both measured SG values and total digestion XRF barium values. Figure 11-3 compares the estimated stoichiometric SGs to the measured SGs. Overall, there is a very good correlation between the two SG populations (R2 of 0.9671), though stoichiometric estimates are slightly lower with increasing SG. Using slightly different compositional values for the assorted sulphide and sulphate species, and assuming a 1:1 ratio of weight percent iron to weight percent copper in chalcopyrite (the molar value is 1:1), the stoichiometric equation yields SGs that have an even better correlation (R2=0.9726), due to partitioning more iron into less dense chalcopyrite which leaves less iron available for more dense pyrite, essentially correcting the bias for the lack of estimated iron-bearing silicates.
Trilogy Metals Inc. NI 43-101 Technical Report on the Arctic Project,
Northwest Alaska | 11-17 | |
| Figure 11-3 | Measured versus Stoichiometric Specific Gravities |
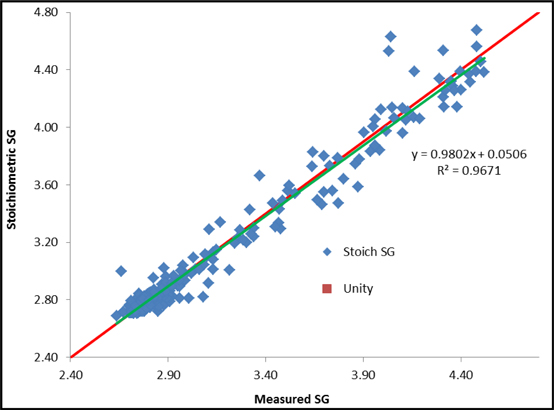
Multiple Regressions Method
The positive comparisons/correlations of our measured SG values to the laboratory determined values and to the stoichiometric estimated values gives us high confidence in our wet-dry measurements. As a result, a multiple regression analysis can be performed using the assay data to get a best fit to the measured SGs. This may correct for the varying residencies of Fe and Ba (and also for the varying density within sphalerite due to the Zn:Fe ratio).
The best fit to the data was achieved by using the multiple regression tool in Microsoft Excel on Ba, Fe, Zn and Cu for the entire dataset (Figure 11-4). The estimate correlates very well (R2=0.9678) with observed data and has a sinusoidal pattern that fits the low and moderately high SG very well and has high bias for moderate SG values and a low bias for very high SG values. The resultant SG formula is as follows:
SG(Regression)= 2.567 + 0.0048*Cu(wt%)+ 0.045*Fe(wt%) + 0.032*Ba(wt%) + 0.023%*Zn(wt%)
Trilogy Metals Inc. NI 43-101 Technical Report on the Arctic Project,
Northwest Alaska | 11-18 | |
| Figure 11-4 | Scatter Plot Showing the Measured Specific Gravity versus Multiple (Copper, Iron, Zinc, Barium) Regression Estimate |

Density Determinations Performance
The SG of a field sample interval can be reproduced in the lab or estimated from assay values using either a stoichiometric method which assumes a fixed metal residency in certain sulphide and sulphates or by a multiple regression method that empirically fits measured data. Overall, what this QA/QC analysis suggests is that the measured SG values can be replicated by various methods, thus supporting the quality of the measured SG data.
BDRC believes the database meets or exceeds industry standards of data quality and integrity. BDRC further believes the sample preparation, security and analytical procedures are adequate to support resource estimation.
Trilogy Metals Inc. NI 43-101 Technical Report on the Arctic Project,
Northwest Alaska | 11-19 | |
| 12.1 | Drill Hole Collar Verification |
Nine drill hole collars (AR-03, AR-04, AR-10, AR-44, AR-47, AR-64, AR05-0094, AR05-0097 and AR-40) were located by Tetra Tech using a Garmin Etrex 20 GPS unit. The offset distances between the collar coordinates reflected in the drill hole database provided by Trilogy Metals and the measured positions range from 3.4 to 7.8 m with an average offset of 4.8 m. This range is within the tolerance to be expected from GPS measurements and the collar positions are adequately located to form the basis of resource estimation work.
BDRC checked the locations of holes drilled to infill the PEA drill pattern. Infill holes were correctly located relative to the prior drilling. All holes were compared to the LIDAR survey of the topographic surface and found to be in the correct locations. All holes are adequately located to support resource estimation.
| 12.2 | Topography Verification |
Tetra Tech conducted two foot traverses over representative areas of the Arctic Deposit. Continuous GPS measurements were compiled during these traverses. The averages of these 724 spot height measurements within 10 m2 by 10 m2 areas were compared to the corresponding digital terrain model (DTM) survey points (Figure 12-1).
| Figure 12-1 | Distribution of the Differences Between GPS Elevations and the DTM |
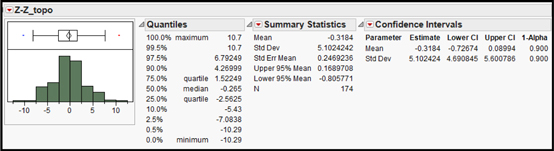
For the traverse data, 90% confidence limits are -0.73 m and +0.09 m.
Agreement between surveyed drill hole collar elevations and the LIDAR topographic surface verifies the correctness of the digital topography.
Trilogy Metals Inc. NI 43-101 Technical Report on the Arctic Project,
Northwest Alaska | 12-1 | |
| 12.3 | Core Logging Verification |
Tetra Tech visited the Trilogy Metals core storage facility in Fairbanks in 2013 and reviewed three drill holes for lithology, mineralization and the quality of storage.
Core boxes were found to be in good condition and intervals were easily retrieved for the following drill holes:
| · | AR05-0092 (129 to 147 m) |
| · | AR08-0117 (128 to 216 m) |
| · | AR08-0126 (144 to 211 m). |
Logged descriptions of massive and semi-massive sulphide mineralization and general sampling results corresponded to the appearance of the core for selected intervals.
BDRC made similar observations of the core logging and geology data collection. The core logging information is acceptable for resource estimation purposes.
| 12.4 | Database Verification |
The Trilogy Metals drill database has been reviewed, and no significant concerns were noted. Nine holes were randomly selected from the Arctic database representing six percent of the data. The assay grades from these holes were dumped from MineSight™ and compared to the values listed in certified assay certificates. No errors were found.
The results of previous data verifications by an external QPs (SRK 2012, Tetra Tech 2013), completed for Trilogy Metals, were also reviewed. The previous data verification exercises included extensive reviews of all NovaGold drilling as well as drilling completed by previous operators. Based on the current review, BDRC believes that the data verification completed on the Trilogy Metals dataset is sufficiently robust to support resource estimation.
Standards, blanks, duplicates and check samples have been regularly submitted at a combined level of 20% of sampling submissions for all NovaGold/NovaCopper/Trilogy Metals era campaigns. GeoSpark conducted QA/QC reviews of all sampling campaigns which included review for accuracy, precision and bias (see Section 11.0). In addition to the QA/QC review, GeoSpark has been retained to provide ongoing database maintenance and QA/QC support.
BDRC has reviewed the QA/QC dataset and reports and found the sample insertion rate and the timeliness of results analysis meets or exceeds industry best practices. The QA/QC results indicate that the assay results collected by Trilogy Metals, and previously by NovaGold and NovaCopper, are reliable and suitable for the purpose of this study.
Trilogy Metals Inc. NI 43-101 Technical Report on the Arctic Project,
Northwest Alaska | 12-2 | |
It is BDRC’s opinion that the drill database and topographic surface for the Arctic Deposit is reliable and sufficient to support the purpose of this technical report and a current mineral resource estimate.
Trilogy Metals Inc. NI 43-101 Technical Report on the Arctic Project,
Northwest Alaska | 12-3 | |
| 13.0 | Mineral Processing and Metallurgical Testing |
| 13.1 | Metallurgical Test Work Review |
The Arctic Deposit is a stratiform polymetallic VMS deposit comprised of semi-massive and massive sulphides deposited in a highly variable metasedimentary and metavolcanic stratigraphy. Hydrothermal alteration has resulted in the development of footwall magnesium-rich alteration characterized by abundant chlorite and talc and hanging wall sodium-rich alteration characterized by paragonite. In the mineralized zone, the principal economic minerals are chalcopyrite, sphalerite, galena, and minor tetrahedrite and bornite. Metallurgical studies have spanned over 30 years with metallurgical test work campaigns undertaken at the Kennecott Research Center (KRC), Lakefield Research Ltd. (Lakefield), SGS Vancouver and ALS Metallurgy Kamloops, B.C.
The test work conducted in 2012 and 2017 has been under the technical direction of International Metallurgical and Environmental Inc. The basis of test work has been focused on a traditional process flowsheet employing crushing, grinding, bulk flotation of a copper and lead concentrate, flotation of a zinc concentrate and the subsequent separation of copper and lead values via flotation. A process flowsheet of the proposed process is shown in Figure 13-1, A summary of the test work programs, dates of test work and test work objectives is shown in Table 13-1.
| Table 13-1 | Metallurgical Test Work Programs |
| Year | Laboratory | Mineralogy | Grindability | Flotation |
| 2017 | ALS Met. | | Ö | Variability testing, grindability, Cu/Pb separation |
| 2012 | SGS | Ö | Ö | Cu/Pb and Zn batch rougher and cleaner, Cu/Pb separation and locked cycle tests |
| 1999 | Lakefield | - | - | Cu/Pb and Zn batch rougher and cleaner, Cu/Pb separation |
| 1976 | KRC | - | Ö | Cu, Pb, Zn and Ag batch rougher flotation (selective flotation procedure) |
| 1975 | KRC | Ö | - | - |
| 1972 | KRC | - | - | Cu/Pb and Zn batch rougher and cleaner, Cu/Pb separation |
| 1970 | KRC | Ö | - | - |
Trilogy Metals Inc. NI 43-101 Technical Report on the Arctic Project,
Northwest Alaska | 13-1 | |
| Figure 13-1 | Traditional copper-lead-zinc flowsheet showing talc pre-float |
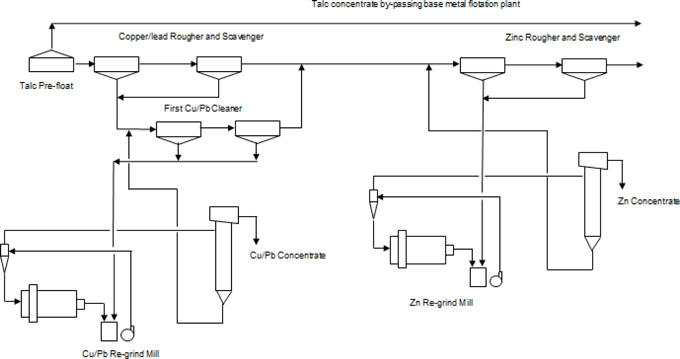
Trilogy Metals Inc. NI 43-101 Technical Report on the Arctic Project,
Northwest Alaska | 13-2 | |
| 13.1.2 | Historical Test Work Review |
Metallurgical Testing (1968 to 1976)
Mineralogy
Between 1970 and 1976, Kennecott Research Center (KRC) conducted two initial mineralogical studies to evaluate and identify the potential beneficiation or metallurgical treatment of concentrates of the samples from the deposit.
Kennecott Research Center – 1970
In the 1970 mineralogy investigation, KRC reported that the host rock of the mineralization is generally muscovite, chlorite, or talc schist. Principal economic minerals in the deposit were identified as chalcopyrite, sphalerite, and argentiferous galena. Table 13-2 presents a complete list of metallic minerals identified in the Arctic Project samples.
Table 13-2 Metallic Mineral Identified in Arctic Project Samples
| Mineral | Mineral
Abundance | | Mineral | Mineral
Abundance |
| |
| Chalcopyrite | Very Abundant | | Tennantite | Minor |
| Sphalerite | Very Abundant | | Digenite | Minor |
| Galena | Common | | Bornite | Minor |
| Pyrite | Common | | Covellite | Trace |
| Sphene | Common | | Carrollite | Trace |
| Rutile | Common | | Glaucodot | Trace |
| Pyrrhotite | Minor | | Stromeyerite | Trace |
| Marcasite | Minor | | Electrum | Trace |
| Arsenopyrite | Minor | | Unidentified | Trace |
Source: KRC 1976
The sizes of sulphide mineral particles in the mineralization sample ranged from submicron to a maximum of several centimetres; most of the sulfide particles were relatively large (coarser than 74 µm). KRC noted that the target sulphide minerals should be liberated from gangue at a primary grind size of 100% passing 100 mesh.
It should be possible to obtain a zinc concentrate that is low in iron and contains most of the cadmium that occurs in the mineralization. There was a close association between chalcopyrite and sphalerite, including some chalcopyrite exsolution particles within the sphalerite grains. Because of this association, some copper was expected to report to the zinc concentrate.
The copper-lead concentrate would contain most of the silver, gold, nickel, and cobalt that is recovered from the mineralization. A major portion of the silver in the mineralization occurs in galena. In addition, some silver minerals were physically attached to galena particles. Because of these associations, the silver will tend to go with the lead in any further concentration of lead from the copper-lead concentrate. Nickel and cobalt recovered in the flotation concentrates were expected to follow the copper minerals.
Trilogy Metals Inc. NI 43-101 Technical Report on the Arctic Project,
Northwest Alaska | 13-3 | |
Kennecott Research Center – 1975
The objective of the 1975 test program was to identify potential problems that might influence beneficiation of the mineralization.
A detailed mineralogical examination was conducted on 88 drill core samples. The mineralogical observations are summarized as follows:
| · | Large variations in mineralogy occur both vertically and laterally within the deposit. |
| · | A significant portion of the chalcopyrite is severely interlocked with either sphalerite or galena. |
| · | Pyrite contains abundant base metal sulphide inclusions. |
| · | Silver is present in galena and in tetrahedrite. |
| · | Arsenic and antimony can be expected in the concentrates due to the presence of arsenopyrite and tetrahedrite/tennantite. |
| · | Trace quantities of nickel and bismuth sulphides were observed. |
The important sulphide minerals are pyrite, sphalerite, chalcopyrite, galena, pyrrhotite and arsenopyrite.
The following potential problems were identified:
| · | It may be difficult to liberate chalcopyrite from sphalerite. |
| · | Abundant base metal sulphide inclusions in pyrite may make it difficult to reject this mineral by flotation. |
| · | It may be difficult to liberate galena from chalcopyrite. |
| · | Silver values are present in both tetrahedrite and galena. |
| · | Flotation of arsenopyrite and tetrahedrite-tennantite may cause elevated arsenic and antimony in the concentrates. |
| · | Trace quantities of nickel and bismuth minerals were observed in the mineralization. |
Comminution Test Work
In 1976, KRC conducted preliminary comminution test work using the standard Bond Work Index determination procedure.
Table 13-3 shows the results of the BWi tests. Mineralization from the Arctic Deposit is relatively soft, with a Bond Work Index in the range of 5.7 to 12.0 kWh/t.
Trilogy Metals Inc. NI 43-101 Technical Report on the Arctic Project,
Northwest Alaska | 13-4 | |
| Table 13-3 | Bond Ball Mill Work Index |
| Hole No. | Work Index
(kWh/t) | Talc
(%) |
| 11B | 11.96 | 90 |
| 34B | 8.33 | 50 |
| 34B | 5.71 | 5 |
| 34B | 11.3 | Mainly Talc |
| 34C | 9.98 | Nil |
| 48A | 10.5 | Mainly Sulphide |
| 48B | 9.60 | 20 |
Various observations from the grindability tests conducted during the KRC 1976 test program are summarized as follows:
| · | Wet bulk material is expected to be quite sticky and would require special consideration with regard to screen blinding and clogging conveyor belts and chutes. |
| · | Arctic samples that contain talc may cause some difficulty during grinding because the talc may flatten into flakes rather than breaking, which may cause grinding and classification problems. |
| · | The sample that contained mainly talc did not respond in the normal manner to the standard Bond Work Index laboratory determination. |
Flotation Test Work
Between 1968 and 1976, KRC carried out initial amenability testing. The focus was on selective flotation to provide separate copper, lead, and zinc concentrates for conventional smelting. In 1968, initial amenability testing was conducted on core composites from eight diamond drill holes (which is not available to review). Other tests were conducted in 1972 on four composites from three additional diamond core holes. The laboratory-scale tests conducted between 1968 and 1976 included the conventional selective flotation approach to produce separate lead, copper and zinc concentrates.
The major problem encountered for the tests by KRC was the separation between lead and copper minerals, and the reduction of zinc deportment to the copper and lead concentrates. The copper concentrates produced from open circuit tests contained 30 to 32.4% copper, 0.45 to 3.48% zinc and 0.15% to 1.31% lead. The copper recoveries were less than 80.7%. The lead concentrate grades were low, ranging from 17.1 to 36.5%.
Sphalerite flotation was generally efficient, producing zinc flotation concentrates grading approximately 55% zinc. Because of the low gold content of the test samples, no appraisal was made of gold recoveries.
From 1975 and 1976, large diameter cores from 14 drill holes were used for more detailed testing. Two composites labelled as Composite No. 1 (Eastern Zone) and Composite No. 2 (Western Zone), were prepared. The test program included bench-scale testing of various process parameters for sequential flotation, including locked cycle tests. A talc flotation step prior to sulfide flotation was considered to be necessary, as previously established. It was determined that chalcopyrite and sphalerite could be recovered into separate commercial grade copper and zinc concentrates. However, the production of a selective high grade lead concentrate was not successful.
Trilogy Metals Inc. NI 43-101 Technical Report on the Arctic Project,
Northwest Alaska | 13-5 | |
Using zinc sulphate and sodium bisulphate to suppress galena and sphalerite, 90% of the copper was recovered into a concentrate containing 26% copper, 1.5% lead, and 6% zinc. KRC indicated that because of close interlocking of chalcopyrite and sphalerite, the zinc content of the copper concentrate could not be reduced to below 6% without sacrifice of copper recovery.
Only low-grade silver-bearing lead concentrates were obtained. Under the best test conditions, approximately 65% of the silver reported to the low-grade lead concentrate. Some of the silver in the mineralization occurred as tetrahedrite, which was recovered to the copper concentrate.
It appeared that zinc minerals responded well to the test procedure.
Metallurgical Test Work (1998 to 1999)
In 1999, Lakefield conducted a metallurgical test program to confirm and improve upon the results from the 1970’s KRC test work program. The Lakefield work was carried out on test composites from the Arctic Deposit prepared from three separate drill holes. The test composite from the upper portion of AR-72 was identified as being low in talc content; however, composites from the lower portion of AR-72 were high in talc content, as were AR-74 and AR-75. The head analyses for the respective resulting test composites are summarized in Table 13-4.
| Composite | Talc | Cu
(%) | Zn
(%) | Pb
(%) | Fe
(%) | Au
(g/t) | Ag
(g/t) | ST
(g/t) |
| Hole #72 – Upper | Low | 5.28 | 7.16 | 1.86 | 15.6 | 1.14 | 72.3 | 23.4 |
| Hole #72 – Lower | High | 2.68 | 5.85 | 1.34 | 13.0 | 1.60 | 75.9 | 16.9 |
| Hole #74 | High | 2.46 | 4.43 | 0.90 | 17.0 | 1.55 | 45.1 | 23.7 |
| Hole #75 | High | 2.35 | 8.36 | 1.95 | 15.7 | 1.23 | 77.3 | 21.8 |
Low Talc Composite Flotation
Lakefield conducted a series of five tests on the low talc mineralized composite. The following parameters were used for all tests:
| · | MIBC was used in the talc pre-float. |
| · | Sulphur dioxide was used in the copper-lead flotation circuit. |
| · | A grind size of approximately 80% passing 53 µm was used. |
Trilogy Metals Inc. NI 43-101 Technical Report on the Arctic Project,
Northwest Alaska | 13-6 | |
| · | Bulk copper-lead flotation was included, followed by zinc flotation. |
The bulk copper-lead rougher concentrate was reground and subjected to two stages of cleaner flotation and one stage of copper and lead separation, using zinc oxide and sodium cyanide to depress the copper while floating the lead. The resulting lead rougher concentrate was upgraded with two stages of cleaner flotation to produce the final lead concentrate. The lead rougher flotation tailings were the final copper concentrate.
The zinc rougher concentrate was reground and upgraded with two stages of cleaner flotation. The results of the best open circuit flotation test for the low talc composite are summarized in Table 13-5. The test results showed that:
| · | Copper concentrate produced contained 29% copper. 86.8% of the copper was recovered to the concentrate. |
| · | The lead concentrate recovered 68% of the lead. |
The zinc concentrate that was produced from the open circuit test contained 59.1% zinc.
| Table 13-5 | Flotation Test on Ambler Low Talc Composite |
| Item | Weight
(%) | Assays | Distribution (%) |
Cu
(%) | Pb
(%) | Zn
(%) | Au
(g/t) | Ag
(g/t) | Cu | Pb | Zn | Au | Ag |
| Lead Concentrate | 2.22 | 6.5 | 58.8 | 3.43 | 38.9 | 1,703 | 2.7 | 68.1 | 1.1 | 48.7 | 47.3 |
| Copper Concentrate* | 15.76 | 29.1 | 1.2 | 2.61 | 1.23 | 73.5 | 86.8 | 9.8 | 5.7 | 10.9 | 14.5 |
| Zinc Concentrate | 9.91 | 0.44 | 0.36 | 59.1 | 0.65 | 14.7 | 0.8 | 1.9 | 81.1 | 3.6 | 1.8 |
| Zinc Tailings** | 61.6 | 0.11 | 0.13 | 0.22 | 0.4 | 3.47 | 1.2 | 4.3 | 1.9 | 13.7 | 2.7 |
| Head (Calculation) | 100.0 | 5.28 | 1.92 | 7.21 | 1.78 | 80.1 | 100.0 | 100.0 | 100.0 | 100.0 | 100.0 |
| Notes: | *Pb Rougher Tailings
**Does not include intermediate cleaner tailings |
High Talc Composite Flotation
Lakefield also conducted flotation tests on each of the high talc composites using a test procedure similar to the one used for the low talc composite, with the exception that carboxymethyl cellulose (CMC) was added as a depressant for talc. The results of these tests showed that the presence of talc had a significant negative impact on the copper and lead mineral recoveries. Lakefield also used talc pre-flotation prior to sulphide flotation in an effort to reduce talc effect on base metal flotation. It appears that the talc pre-flotation improved copper and lead metallurgical performances. However, the test results showed that elevated talc content had a significant effect in copper and lead flotation response.
In the test report, Lakefield also concluded that:
| · | A grind particle size as coarse as approximately 80% passing 74 µm provided good results. |
Trilogy Metals Inc. NI 43-101 Technical Report on the Arctic Project,
Northwest Alaska | 13-7 | |
| · | Copper-lead separation was difficult using a cyanide compound with the talc mineralization due to the talc and perhaps soluble copper as well. |
| 13.1.3 | Mineralogical and Metallurgical Test Work – 2012 to 2017 |
Introduction
Test work conducted prior to 2012 is considered relevant to the project, but predictive metallurgical results are considered to be best estimated from test work conducted on sample materials obtained from exploration work under the direction of Trilogy Metals Inc., conducted in 2012 and 2017.
In 2012, SGS conducted a test program on the samples produced from mineralization zones 1, 2, 3, and 5 of the Arctic Deposit (Section 1.0). To the extent known, the samples are representative of the styles and types of mineralization and the mineral deposit as a whole. Drill core samples were composited from each of the zones into four different samples for the SGS test work which included process mineralogical examination, grindability parameter determination, and flotation tests.
SGS used QEMSCAN™, a quantitative mineralogical technique utilizing scanning electron microscopy to determine mineral species, species liberation and mineral associations in order to develop grade limiting/recovery relationships for the composites.
Standard Bond grindability tests were also conducted on five selected samples to determine the BWi and Ai.
The flotation test work investigated the effect of various process conditions on copper, lead and zinc recovery using copper-lead bulk flotation and zinc flotation followed by copper and lead separation. The test work conducted in 2012 at SGS forms the bases for predicting metallurgical performance of the mineralized zone in terms of recovery of copper and lead to a bulk concentrate as well as predicting zinc recovery to a zinc concentrate.
In 2017, test work at ALS Metallurgy was focused on predicting the expected performance of the proposed copper and lead separation process, which required the use of larger test samples. A pilot plant was operated to generate approximately 50 kilograms of copper and lead concentrate, which became test sample material in locked cycle testing of the copper and lead separation process. This test work allows for the accurate prediction of copper and lead deportment in the process as well as provided detailed analysis of the final copper and lead concentrates, expected from the process. Additional metallurgical test work in the form of variability samples being subject to grindability and baseline flotation tests was also completed.
Test Samples
The 2012 test program used 90 individual drill core sample intervals totaling 1,100 kg from the Arctic Deposit. Individual samples were combined into four composites representing different zones and labelled as Composites Zone 1 & 2, Zone 3, Zone 5, and Zone 3 & 5. The sample materials used in the 2012 test program at SGS were specifically obtained for metallurgical test purposes. The drill cores were stored in a freezer to ensure sample degradation and oxidation of sulphide minerals did not occur.
Trilogy Metals Inc. NI 43-101 Technical Report on the Arctic Project,
Northwest Alaska | 13-8 | |
The 2017 test program involved the collection of approximately 4000 kg of drill core from five drill holes within the Arctic deposit. The core was shipped in its entirety to ALS Metallurgy of Kamloops, B.C. for use in grinding and flotation test work. 15 separate composites samples were generated by crushing defined intercepts of mineralization. These samples were riffle split to generate 15 individual samples which were separately tested for grindability and flotation response, as well, a large portion of each sample was blended to make a single large composite sample for use in copper-lead separation test work. The copper-lead separation test work involved operating a pilot plant for the production of a single sample of copper/lead concentrate which was then used in bench-scale flotation testing, including open circuit flotation tests as well as locked cycle flotation tests.
The head grades of the composites from the 2012 test work are shown in Table 13-6.
| Table 13-6 | Head Grades – Composite Samples – 2012 |
| Sample ID | Cu
(%) | Pb
(%) | Zn
(%) | Fe
(%) | S
(%) | Au
(g/t) | Ag
(g/t) | MgO
(%) |
| Zone 1 & 2 A | 2.66 | 0.93 | 3.48 | 7.92 | 8.53 | 0.79 | 57.1 | 5.77 |
| Zone 1 & 2 B | 2.60 | 0.96 | 3.38 | 7.54 | 8.18 | 0.78 | 58.0 | 5.79 |
| Average | 2.63 | 0.95 | 3.43 | 7.73 | 8.36 | 0.79 | 57.6 | 5.78 |
| Zone 3 A | 3.55 | 1.73 | 8.47 | 17.4 | 25.4 | 0.72 | 80.4 | 1.95 |
| Zone 3 B | 3.57 | 1.72 | 8.69 | 17.6 | 26.1 | 0.62 | 80.3 | 1.93 |
| Average | 3.56 | 1.73 | 8.58 | 17.5 | 25.8 | 0.67 | 80.4 | 1.94 |
| Zone 3 & 5 A | 4.45 | 1.64 | 7.81 | 16.8 | 23.6 | 1.01 | 81.7 | 3.86 |
| Zone 3 & 5 B | 4.37 | 1.55 | 7.7 | 16.5 | 23.4 | 0.93 | 82.2 | 4.05 |
| Average | 4.41 | 1.60 | 7.76 | 16.7 | 23.5 | 0.97 | 82.0 | 3.96 |
| Zone 5 A | 2.56 | 1.34 | 5.64 | 15.5 | 21.5 | 1.54 | 65.1 | 0.92 |
| Zone 5 B | 2.55 | 1.32 | 5.72 | 16.1 | 20.9 | 0.77 | 60.8 | 0.88 |
| Average | 2.56 | 1.33 | 5.68 | 15.8 | 21.2 | 1.16 | 63.0 | 0.90 |
The feed grades of samples used in the 2017 test work program at ALS Metallurgy are shown in Table 13-7.
Trilogy Metals Inc. NI 43-101 Technical Report on the Arctic Project,
Northwest Alaska | 13-9 | |
| Table 13-7 | Head Grade 2017 Variability Samples and Pilot Plant Composite |
| Assay | Composite | Composite | Composite | Composite | Composite | Composite |
| Element | Symbol | Unit | 1 | 2 | 3 | 4 | 5 | 6 |
| Copper | Cu | % | 5.05 | 2.06 | 1.67 | 2.25 | 3.68 | 1.02 |
| Lead | Pb | % | 1.53 | 0.25 | 0.80 | 0.24 | 1.01 | 0.36 |
| Zinc | Zn | % | 7.40 | 1.05 | 2.93 | 3.15 | 5.55 | 1.61 |
| Iron | Fe | % | 15.0 | 4.6 | 6.6 | 13.1 | 10.6 | 8.0 |
| Sulphur | S | % | 24.4 | 3.68 | 4.93 | 16.2 | 13.9 | 9.45 |
| Silver | Ag | g/t | 64 | 34 | 43 | 18 | 69 | 24 |
| Cold | Au | g/t | 0.68 | 052 | 0.10 | 0.20 | 078 | 0.45 |
| Arsenic | As | g/t | 4350 | 218 | 525 | 265 | 3490 | 1755 |
| Magnesium | Mg | % | 2.69 | 11.2 | 7.51 | 6.26 | 7.16 | 1.92 |
| | | | | | | | | |
| Assay | Composite | Composite | Composite | Composite | Composite | Composite |
| Element | Symbol | Unit | 7 | 8 | 9 | 10 | 11 | 12 |
| Copper | Cu | % | 1.75 | 3.00 | 5.46 | 4.16 | 2.78 | 1.53 |
| Lead | Pb | % | 0.58 | 0.68 | 1.37 | 1.24 | 0.40 | 0.07 |
| Zinc | Zn | % | 2.71 | 4.65 | 6.60 | 5.63 | 4.56 | 0.56 |
| Iron | Fe | % | 8.9 | 10.0 | 9.2 | 13.4 | 12.7 | 4.4 |
| Sulphur | S | % | 12.9 | 13.3 | 14.0 | 22.1 | 16.9 | 3.15 |
| Silver | Ag | g/t | 32 | 56 | 50 | 34 | 40 | 16 |
| Gold | Au | g/t | 0.21 | 0.75 | 0.15 | 0.06 | 0.64 | 0.59 |
| Arsenic | As | g/t | 497 | 1350 | 205 | 296 | 983 | 611 |
| Magnesium | Mg | % | 3.46 | 9.18 | 5.65 | 3.58 | 6.84 | 10.6 |
| | | | | | | | | |
| Assay | Composite | Composite | PP | | | |
| Element | Symbol | Unit | 13 | 14 | Composite 1 | | | |
| Copper | Cu | % | 1.98 | 2.37 | 2.92 | | | |
| Lead | Pb | % | 0.30 | 2.43 | 0.86 | | | |
| Zinc | Zn | % | 1.48 | 9.50 | 4.66 | | | |
| Iron | Fe | % | 6.2 | 15.1 | 10.8 | | | |
| Sulphur | S | % | 6.25 | 23.7 | 13.8 | | | |
| Silver | Ag | g/t | 38 | 62 | 41 | | | |
| Cold | Au | g/t | 0.26 | 0.84 | 0.56 | | | |
| Arsenic | As | g/t | 143 | 1390 | 1315 | | | |
| Magnesium | Mg | % | 9.61 | 0.81 | 5.93 | | | |
Mineralogical Investigation
SGS used QEMSCAN™ to complete a detailed mineralogical study on each composite to identify mineral liberations and associations, and to develop grade/recovery limiting relationships for the samples. Head assays indicate that all four composite samples contain a considerable amount of magnesium oxide, implying the potential for significant talc which could impact flotation.
The mineral modal abundance for the composites is shown in Table 13-8.
Trilogy Metals Inc. NI 43-101 Technical Report on the Arctic Project,
Northwest Alaska | 13-10 | |
| Table 13-8 | Mineral Modal Abundance for Composite Samples – 2012 |
| Mineral | Mass (%) |
| Zone 1 & 2 | Zone 3 | Zone 3 & 5 | Zone 5 |
| Chalcopyrite | 9.2 | 9.4 | 12.2 | 6.4 |
| Bornite | 0.02 | 0.01 | 0.03 | 0.4 |
| Tetrahedrite | 0.1 | 0.4 | 0.2 | 0.2 |
| Antimony | 0.03 | 0.2 | 0.005 | 0.3 |
| Galena | 1.3 | 2.1 | 2.1 | 2.1 |
| Sphalerite | 7.2 | 14.6 | 14.3 | 11.3 |
| Pyrite | 6.7 | 30.4 | 23.8 | 27.8 |
| Pyrrhotite | 2.2 | 0.2 | 0.2 | 1.4 |
| Arsenopyrite | 0.5 | 0.1 | 0.6 | 2.2 |
| Other Sulphides | 0.1 | 0.1 | 0.2 | 0.1 |
| Quartz | 30.2 | 8.6 | 9.0 | 16.6 |
| Feldspar | 0.9 | 0.2 | 0.4 | 0.3 |
| Magnesium-Chlorite | 11.9 | 3.4 | 2.8 | 1.1 |
| Talc | 2.0 | 0.8 | 6.3 | 0.1 |
| Micas | 14.2 | 1.9 | 7.0 | 9.4 |
| Cymrite | 3.5 | 3.9 | 1.8 | 1.9 |
| Clays | 0.6 | 0.05 | 0.2 | 0.1 |
| Iron Oxides | 0.3 | 0.3 | 0.5 | 0.3 |
| Carbonates | 3.4 | 1.3 | 4.2 | 2.0 |
| Barite | 3.0 | 21.8 | 13.4 | 14.5 |
| Fluorite | 1.7 | 0.1 | 0.4 | 1.2 |
| Other | 1.1 | 0.3 | 0.4 | 0.4 |
| Total | 100.0 | 100.0 | 100.0 | 100.0 |
The mineralogical study showed that the mineralogy of all four composites was similar. Each composite was composed mainly of pyrite, quartz, and carbonates. However, Composite Zone 1 & 2 contains approximately 30% quartz, compared to 8.6% for Composite Zone 3, and 16.6% for Composite Zone 5. The study also showed that Composite Zone 1 & 2 had the lowest pyrite content (6.7%) while Composites Zone 3 and Zone 5 contained approximately 30.4% and 27.8% pyrite, respectively.
In all four samples, the major floatable gangue minerals were talc and pyrite. Chalcopyrite was the main copper carrier. Combined bornite, tetrahedrite, and other sulphides accounted for less than 5% of the copper minerals in the Zone 1 & 2, Zone 3, and Zone 3 & 5 composites. In the Zone 5 sample, a slightly higher amount of bornite accounted for approximately 9% of the copper minerals. Galena was the main lead mineral (1.3% in the Zone 1 & 2 composite, and 2.1% in the other three composites) and sphalerite was the main zinc mineral (7.2% in Zone 1 & 2 composite and 11 to 14% in the other three composites).
Trilogy Metals Inc. NI 43-101 Technical Report on the Arctic Project,
Northwest Alaska | 13-11 | |
All the composites contained a significant amount of talc, which may have the potential to consume reagents and dilute final concentrates. Therefore, SGS recommended that talc removal using flotation be employed prior to base metal flotation.
At a grind size of approximately 90% passing 150 µm (ranging from 94.5 to 89% passing 150 µm), chalcopyrite liberation ranged from approximately 80 to 87% (free and liberated combined) for all composites. The chalcopyrite is mostly free, with 7 to 10% associated with pyrite. For all composites, galena liberation ranged from 54 to 68% (free and liberated combined). Sphalerite liberation varied between 81 to 89%. Sphalerite is mostly free with about 7 to 10% associated with pyrite.
In general, SGS indicated that the liberation of galena and chalcopyrite was adequate, and acceptable copper and lead metallurgical performance was expected within the rougher circuit. Sphalerite was well liberated at the grind size.
Comminution Test Work
SGS conducted a comminution study on five selected samples during the test program. The tests included the standard BWi test and Ai test.
Table 13-9 shows the results of the grindability tests. The BWi values range from 6.5 to 11 kWh/t for the materials sampled. The data indicates that the samples are not resistant to ball mill grinding. The Ai ranged from 0.017 to 0.072 g, which indicates that the samples are not abrasive.
Trilogy Metals Inc. NI 43-101 Technical Report on the Arctic Project,
Northwest Alaska | 13-12 | |
| Table 13-9 | Bond Ball Mill Grindability and Abrasion Index Test Results |
| Sample | Mesh of
Grind Size | P80
(µm) | BWi
(kWh/t) | Ai
(g) |
| 2012 SGS samples | | | | |
| MET – 1105341 | 150 | 88 | 6.7 | 0.032 |
| MET – 1106043 | 150 | 88 | 6.5 | 0.019 |
| MET – 1105868 | 150 | 85 | 7.4 | 0.030 |
| MET – 1106033 | 150 | 87 | 9.3 | 0.072 |
| MET – 1105853 | 150 | 89 | 11.1 | 0.017 |
| 2017 ALS samples | | | | |
| Composite 1 | 106 | 106 | 9.0 | - |
| Composite 2 | 300 | 228 | 8.6 | - |
| Composite 3 | 300 | 232 | 8.1 | - |
| Composite 4 | 300 | 226 | 6.6 | - |
| Composite 5 | 300 | 233 | 7.1 | - |
| Composite 6 | 300 | 233 | 6.1 | - |
| Composite 7 | 300 | 223 | 6.2 | - |
| Composite 8 | 300 | 234 | 9.0 | - |
| Composite 9 | 300 | 236 | 6.4 | - |
| Composite 10 | 300 | 237 | 5.3 | - |
| Composite 11 | 300 | 225 | 7.2 | - |
| Composite 12 | 300 | 234 | 10.3 | - |
| Composite 13 | 300 | 229 | 10.1 | - |
| Composite 14 | 300 | 231 | 6.4 | - |
| PP Composite 1 | 300 | 231 | 7.2 | - |
Flotation Test Work
In 2012, SGS of Vancouver, B.C. conducted bench-scale flotation test work to investigate the recovery of copper, lead, zinc, and associated precious metals using bulk copper-lead flotation and zinc flotation, followed by copper and lead separation. The four composite samples were tested for rougher flotation kinetics, cleaner efficiency, and copper and lead separation flotation efficiency. SGS also conducted locked cycle flotation tests on each composite and these test results for the basis for predicting copper and zinc recovery to a bulk concentrate as well as predicting zinc recovery to a zinc concentrate.
The tests produced similar metallurgical performances among the samples tested, although the Zone 1 & 2 composite showed slightly inferior performance compared to the Zone 3 composite and Zone 5 composite.
Flotation test work conducted in 2017 conducted at ALS Metallurgy in Kamloops B.C., was focused on a detailed evaluation of the performance of a copper and lead separation process including open circuit flotation tests and locked cycle flotation tests.
Trilogy Metals Inc. NI 43-101 Technical Report on the Arctic Project,
Northwest Alaska | 13-13 | |
Open Circuit Flotation Test Work
The initial flotation tests at SGS evaluated rougher flotation kinetics by investigating the effect of various reagent regimes on the flotation kinetics of copper, lead, and zinc minerals.
Cytec 3418A promoter and sodium isopropyl xanthate (SIPX) were used as collectors in the copper and lead flotation circuits. Methyl isobutyl carbinol (MIBC) was used as the frother to maintain a stable froth in the flotation stages. Hydrated lime was used as the pH regulator. Zinc cyanide, a mixture of zinc sulphate and sodium cyanide, or zinc sulphate alone, was used to suppress zinc minerals that might report to the copper and lead bulk concentrate.
Zinc was floated after the copper-lead bulk flotation using the traditional reagent regime, including SIPX as the collector and copper sulphate as the sphalerite activator at an elevated pH.
The feed material was ground to 80% passing 70 µm prior to talc pre-flotation. The talc flotation tailings were sent for copper-lead bulk flotation. The bulk copper-lead flotation tailings were conditioned with copper sulphate to activate sphalerite prior to zinc rougher flotation.
Regrinding was included in the flowsheet for both the copper-lead bulk concentrate and the zinc concentrate. The target regrind sizes were 80% passing 24 µm for the copper-lead bulk concentrate and 40 µm for the zinc concentrate.
The reground bulk copper-lead concentrate was cleaned to further reject sphalerite, pyrite, and other gangues. The reground zinc rougher concentrate was cleaned to produce the final zinc concentrate.
The testing indicated that a primary grind size of 80% passing 70 µm was adequate for the optimum copper-lead bulk rougher flotation and zinc rougher flotation. Copper grade and recovery to the bulk copper/lead rougher concentrate ranged from 16 to 21% and from 86 to 94%, respectively. The bulk concentrate also recovered between 89 and 94% lead, grading at 6.8 to 8.4%.
Gold and silver reported preferentially to the bulk copper-lead rougher concentrate. Gold recovery ranged from 54 to 80% to the bulk copper and lead cleaner concentrate, while silver recovery to the concentrate was in the range of between 68 and 84%.
Approximately 250 g/t of zinc cyanide was required to effectively depress the zinc minerals during flotation of the copper and lead minerals. Although zinc sulphate could be used as an alternative for zinc cyanide, approximately 1,500 g/t of zinc sulphate would be required, which is much higher than the zinc cyanide dosage. SGS recommended further tests to optimize the reagent regimes for zinc mineral suppression.
The cleaner flotation tests showed that regrinding was required to upgrade the bulk concentrates prior to separation of copper and lead minerals. The regrind size had not been optimized. It appeared that a regrind size of 80% passing approximately 30 µm would provide sufficient liberation for the bulk concentrate upgrading and copper-lead separation. Concentrate regrinding was incorporated into all locked cycle tests and open circuit cleaning tests.
| Trilogy Metals Inc. | 13-14 | |
NI 43-101 Technical Report on the Arctic Project,
Northwest Alaska | | |
In the batch cleaner tests, lead was separated from the bulk copper and lead concentrate using a procedure to float lead minerals and suppress copper minerals. With one stage of lead rougher flotation and two stages of cleaner flotation, approximately 50 to 75% of the lead was recovered to the lead concentrate containing 41 to 60% lead. A high-grade copper concentrate was produced, ranging between 29 and 31% copper. The concentrate recovered between 75% and 91% of the copper from the bulk concentrates produced from the four composites.
Locked Cycle Test
SGS conducted six locked cycle tests to simulate bulk copper-lead flotation and zinc flotation in closed circuit. The bulk copper and lead concentrates produced were tested for copper and lead separation in an open circuit. The average locked cycle test results are shown in Table 13-10.
The copper recoveries to the bulk copper-lead concentrates produced from the locked cycle tests were as follows:
| · | 89 to 92% for the Zone 3 & 5 composite |
| · | 93% for the Zone 3 composite |
| · | 86 to 91% for the Zone 5 composite |
| · | 84% for the Zone 1 & 2 composite. |
The Zone 1 & 2 composite produced a lower copper recovery. This result is likely due to insufficient sample for developing optimized flotation conditions for this sample. Additional work would likely bring this result in line with other sample test results.
The copper grades of the copper concentrate produced ranged from 24 to 28%.
Approximately 88 to 94% of the lead was recovered to the bulk copper-lead concentrates, which contained 9 to 13% lead.
Three of the four composites demonstrated good zinc recovery in the locked cycle tests, excluding the Zone 1 & 2 composite sample.
The zinc recoveries to the final zinc concentrates produced from the locked cycle tests were as follows:
| · | 92% for the Zone 3 & 5 composite |
| · | 93% for the Zone 3 composite |
| · | 91% for the Zone 5 composite |
| · | 84% for the Zone 1 & 2 composite. |
| Trilogy Metals Inc. | 13-15 | |
NI 43-101 Technical Report on the Arctic Project,
Northwest Alaska | | |
On average, the zinc grades of the concentrates produced were higher than 55%, excluding the concentrate generated from Composite Zone 1 & 2, which contained only 44.5% zinc. Once again, it is expected that the results of zone 1 & 2 will improve with additional test work, if sample were available.
Gold and silver were predominantly recovered into the bulk copper-lead concentrates. Gold recoveries to this concentrate ranged from 65 to 80%, and silver recoveries ranged from 80 to 86%.
| Trilogy Metals Inc. | 13-16 | |
NI 43-101 Technical Report on the Arctic Project,
Northwest Alaska | | |
| Table 13-10 | Locked Cycle Metallurgical Test Results |
| Test No. | Product | Regrind Size
80% Passing | Weight
% | Assays | Distribution (%) |
Cu
(%) | Pb
(%) | Zn
(%) | Au
(g/t) | Ag
(g/t) | S
(%) | Cu | Pb | Zn | Au | Ag | S |
Zone 3 & 5 LCT-1 | Talc Concentrate | Cu/Pb Rougher Concentrate: 52 µm;
Zn Rougher Concentrate: 53 µm | 7.3 | 0.66 | 0.35 | 1.25 | 0.09 | 15.7 | 2.56 | 0.4 | 0.5 | 0.5 | 0.3 | 0.5 | 0.3 |
| Cu/Pb Cleaner 2 Concentrate | 14.8 | 27.6 | 10.2 | 1.96 | 4.05 | 405 | 30.0 | 89.4 | 91.7 | 4.6 | 70.3 | 84.0 | 20.0 |
| Zn Cleaner 2 Concentrate | 10.3 | 3.11 | 0.62 | 57.2 | 0.67 | 60.9 | 32.8 | 7.0 | 3.9 | 92.8 | 8.1 | 8.8 | 15.3 |
| Zn Cleaner 1 Scavenger Tailings | 3.9 | 1.24 | 0.42 | 1.46 | 2.85 | 41.7 | 28.9 | 1.1 | 1.0 | 0.9 | 13.1 | 2.3 | 5.1 |
| Zn Rougher Tailings | 63.6 | 0.15 | 0.07 | 0.13 | 0.11 | 4.90 | 20.8 | 2.1 | 2.9 | 1.3 | 8.2 | 4.4 | 59.4 |
| Feed | 100.0 | 4.42 | 1.59 | 6.17 | 0.83 | 69.1 | 21.5 | 100.0 | 100.0 | 100.0 | 100.0 | 100.0 | 100.0 |
Zone 3 LCT-2 | Talc Concentrate | Cu/Pb Rougher Concentrate: 43 µm;
Zn Rougher Concentrate: 41 µm | 1.6 | 2.39 | 2.44 | 4.05 | 0.51 | 105.0 | 9.97 | 0.4 | 0.8 | 0.3 | 0.4 | 0.8 | 0.2 |
| Cu/Pb Cleaner 2 Concentrate | 12.9 | 24.7 | 12.4 | 3.61 | 4.73 | 506 | 30.5 | 92.5 | 92.6 | 5.5 | 77.6 | 85.9 | 15.4 |
| Zn Cleaner 2 Concentrate | 12.9 | 1.02 | 0.38 | 61.4 | 0.40 | 41.7 | 32.9 | 3.8 | 2.8 | 93.0 | 6.5 | 7.1 | 16.5 |
| Zn Cleaner 1 Scavenger Tailings | 5.9 | 0.85 | 0.33 | 0.86 | 0.97 | 35.0 | 38.7 | 1.5 | 1.1 | 0.6 | 7.3 | 2.7 | 9.0 |
| Zn Rougher Tailings | 66.7 | 0.10 | 0.07 | 0.09 | 0.10 | 4.01 | 22.5 | 1.9 | 2.7 | 0.7 | 8.3 | 3.5 | 58.9 |
| Feed | 100.0 | 3.42 | 1.71 | 8.43 | 0.78 | 75.3 | 25.4 | 100.0 | 100.0 | 100.0 | 100.0 | 100.0 | 100.0 |
Zone 5 LCT-3 | Talc Concentrate | Cu/Pb Rougher Concentrate: 36 µm;
Zn Rougher Concentrate: 35 µm | 1.3 | 7.15 | 3.71 | 2.46 | 1.22 | 187.0 | 13.7 | 1.2 | 1.2 | 0.2 | 0.3 | 1.4 | 0.3 |
| Cu/Pb Cleaner 2 Concentrate | 9.9 | 23.8 | 12.9 | 5.04 | 11.2 | 499 | 31.5 | 91.3 | 92.0 | 9.1 | 70.9 | 84.2 | 14.7 |
| Zn Cleaner 2 Concentrate | 8.3 | 0.91 | 0.56 | 59.1 | 0.55 | 46.4 | 30.5 | 2.9 | 3.4 | 89.3 | 2.9 | 6.6 | 11.9 |
| Zn Cleaner 1 Scavenger Tailings | 7.1 | 0.80 | 0.28 | 0.56 | 4.55 | 30.0 | 32.4 | 2.2 | 1.4 | 0.7 | 20.5 | 3.6 | 10.7 |
| Zn Rougher Tailings | 73.4 | 0.09 | 0.04 | 0.05 | 0.11 | 3.38 | 18.1 | 2.4 | 2.0 | 0.7 | 5.3 | 4.2 | 62.4 |
| Feed | 100.0 | 2.56 | 1.37 | 5.47 | 1.55 | 58.2 | 21.1 | 100.0 | 100.0 | 100.0 | 100.0 | 100.0 | 100.0 |
| Trilogy Metals Inc. | 13-17 | |
NI 43-101 Technical Report on the Arctic Project,
Northwest Alaska | | |
| Test No. | Product | Regrind Size
80% Passing | Weight
% | Assays | Distribution (%) |
Cu
(%) | Pb
(%) | Zn
(%) | Au
(g/t) | Ag
(g/t) | S
(%) | Cu | Pb | Zn | Au | Ag | S |
Zone 3 & 5 LCT 4 | Talc Concentrate | Cu/Pb Rougher Concentrate: 45 µm;
Zn Rougher Concentrate: 23 µm | 7.3 | 0.72 | 0.38 | 1.37 | 0.11 | 17.6 | 3.01 | 0.4 | 0.6 | 0.4 | 0.3 | 0.6 | 0.3 |
| Cu/Pb Cleaner 2 Concentrate | 16.0 | 25.3 | 9.25 | 3.13 | 4.28 | 408 | 29.4 | 91.7 | 92.3 | 6.4 | 73.8 | 85.0 | 21.3 |
| Zn Cleaner 2 Concentrate | 11.8 | 1.78 | 0.39 | 60.9 | 0.48 | 50.7 | 32.5 | 4.8 | 2.9 | 91.6 | 6.1 | 7.8 | 17.4 |
| Zn Cleaner 1 Scavenger Tailings | 4.8 | 1.15 | 0.38 | 1.09 | 2.6 | 39.8 | 27.1 | 1.3 | 1.1 | 0.7 | 13.5 | 2.5 | 5.9 |
| Zn Rougher Tailings | 60.2 | 0.14 | 0.08 | 0.13 | 0.1 | 5.19 | 20.2 | 1.9 | 3.2 | 1 | 6.3 | 4.1 | 55.1 |
| Feed | 100.0 | 4.41 | 1.6 | 7.85 | 0.93 | 76.6 | 22.1 | 100 | 100 | 100 | 100 | 100 | 100 |
Zone 5 LCT-5 | Talc Concentrate | Cu/Pb Rougher Concentrate: 32 µm;
Zn Rougher Concentrate: 24 µm | 1.1 | 8.29 | 3.33 | 2.21 | 1.31 | 229 | 12.5 | 1.2 | 0.9 | 0.1 | 0.4 | 1.4 | 0.2 |
| Cu/Pb Cleaner 2 Concentrate | 8.9 | 24.3 | 13.2 | 4.09 | 8.93 | 507 | 29.7 | 85.7 | 88.3 | 6.4 | 62.5 | 76.3 | 12.5 |
| Zn Cleaner 2 Concentrate | 9.6 | 2.01 | 0.83 | 54.7 | 0.64 | 75.5 | 32.9 | 7.6 | 5.9 | 91.8 | 4.8 | 12.2 | 14.8 |
| Zn Cleaner 1 Scavenger Tailings | 11.4 | 0.55 | 0.23 | 0.31 | 2.76 | 22.9 | 38.8 | 2.5 | 2.0 | 0.6 | 24.8 | 4.4 | 20.9 |
| Zn Rougher Tailings | 69 | 0.11 | 0.06 | 0.09 | 0.14 | 4.97 | 15.8 | 3.1 | 3.0 | 1.0 | 7.5 | 5.8 | 51.5 |
| Feed | 100.0 | 2.54 | 1.34 | 5.69 | 1.28 | 59.4 | 21.2 | 100 | 100 | 100 | 100 | 100 | 100 |
Zone 1 & 2 LCT-6 | Talc Concentrate | Cu/Pb Rougher Concentrate: 62 µm;
Zn Rougher Concentrate: 55 µm | 4.8 | 0.67 | 0.34 | 0.90 | 0.40 | 13.9 | 1.88 | 0.4 | 0.6 | 0.4 | 0.8 | 0.4 | 0.3 |
| Cu/Pb Cleaner 2 Concentrate | 9.5 | 23.7 | 9.54 | 5.12 | 6.65 | 481 | 30.2 | 84.2 | 94.0 | 14.3 | 79.7 | 84.2 | 32.5 |
| Zn Cleaner 2 Concentrate | 6.4 | 5.84 | 0.49 | 44.5 | 0.91 | 101.5 | 32.8 | 14.0 | 3.2 | 83.7 | 7.4 | 12.0 | 23.9 |
| Zn Cleaner 1 Scavenger Tailings | 7.4 | 0.22 | 0.06 | 0.17 | 0.91 | 12.3 | 19.6 | 0.6 | 0.5 | 0.4 | 8.4 | 1.7 | 16.4 |
| Zn Rougher Tailings | 71.8 | 0.03 | 0.02 | 0.06 | 0.04 | 1.34 | 3.30 | 0.8 | 1.7 | 1.2 | 3.7 | 1.8 | 26.8 |
| Feed | 100.0 | 2.69 | 0.97 | 3.42 | 0.80 | 54.6 | 8.8 | 100.0 | 100.0 | 100.0 | 100.0 | 100.0 | 100.0 |
| Note: | LCT = locked cycle test |
| Trilogy Metals Inc. | 13-18 | |
NI 43-101 Technical Report on the Arctic Project,
Northwest Alaska | | |
Copper/Lead Separation Test Work
SGS performed preliminary open-circuit copper and lead separation tests on the bulk copper-lead concentrates produced from the locked cycle tests in open circuit flotation tests. Sodium cyanide was used to suppress copper minerals; 3418A was used as the lead collector and lime added to adjust the pulp pH to 10. Table 13-11 summarizes the separation test results.
The copper concentrates that were produced assayed at:
| · | 31% copper from Composite Zone 3 & 5 |
| · | 31% copper from Composite Zone 3 |
| · | 30% copper from Composite Zone 5 |
| · | 28 to 29% copper from Composite Zone 1 & 2. |
The lead second cleaner concentrates that were produced contained:
| · | 41% lead from Composite Zone 3 & 5 |
| · | 59% lead from Composite Zone 3 |
| · | 67% lead from Composite Zone 5 |
| · | 55% lead from Composite Zone 1 & 2. |
On average, the lead concentrates that were produced from the Zone 1 & 2, Zone 3, and Zone 5 composites contained approximately 2.2% copper while the copper content of the concentrate from the Zone 3 & 5 composite was higher, grading at 5%. There is a substantial reduction in lead recovery when the lead first cleaner concentrate was further upgraded.
| Trilogy Metals Inc. | 13-19 | |
NI 43-101 Technical Report on the Arctic Project,
Northwest Alaska | | |
| Table 13-11 | SGS Open Circuit Copper and Lead Separation Test Results |
| Test | Product | Weight
% | Assays | Distribution (%) |
Cu
(%) | Pb
(%) | Zn
(%) | Ag
(g/t) | Au
(g/t) | S
(%) | Cu | Pb | Zn | Ag | Au | S |
Zone 3 & 5
Cu/Pb Separation Feed from LCT-4
(Cycle 2) | Pb 2nd Cleaner Concentrate | 8.2 | 5.99 | 41.0 | 2.02 | 2,330 | 18.9 | 13.1 | 1.9 | 37.0 | 6.0 | 44.7 | 35.9 | 3.4 |
| Pb 1st Cleaner Concentrate | 22 | 6.87 | 37.5 | 4.34 | 1,665 | 13.6 | 20.6 | 5.9 | 90.8 | 34.8 | 85.7 | 69.5 | 14.3 |
| Pb Rougher Concentrate | 37.7 | 16.4 | 23.0 | 3.43 | 1,033 | 9.17 | 26.2 | 24.1 | 95.5 | 47.4 | 91.3 | 80.3 | 31.4 |
| Pb Rougher Tailings (Cu Concentrate) | 62.3 | 31.3 | 0.65 | 2.31 | 59 | 1.36 | 34.7 | 75.9 | 4.5 | 52.6 | 8.7 | 19.7 | 68.6 |
| Cu/Pb 2nd Cleaner Concentrate (Head) | - | 25.7 | 9.07 | 2.73 | 4.27 | 4.31 | 31.5 | - | - | - | - | - | - |
Zone 3 & 5
Cu/Pb Separation Feed from LCT-4
(Cycle 3) | Pb 2nd Cleaner Concentrate | 10.8 | 4.09 | 41.2 | 2.75 | 1,970 | 1.87 | 12.3 | 1.7 | 49.7 | 8.9 | 53.4 | 4.9 | 4.2 |
| Pb 1st Cleaner Concentrate | 20.3 | 5.47 | 38.1 | 4.76 | 1,618 | 1.38 | 19.3 | 4.3 | 86.6 | 28.9 | 82.6 | 6.8 | 12.5 |
| Pb Rougher Concentrate | 28.9 | 11.6 | 28.4 | 4.16 | 1,206 | 1.19 | 23.4 | 13 | 92.0 | 36.0 | 87.6 | 8.4 | 21.6 |
| Pb Rougher Tailings (Cu Concentrate) | 71.1 | 31.6 | 1.0 | 3.01 | 69 | 5.29 | 34.7 | 87 | 8.0 | 64.0 | 12.4 | 91.6 | 78.4 |
| Cu/Pb 2nd Cleaner Concentrate(Head) | - | 25.8 | 8.93 | 3.34 | 398 | 4.11 | 31.4 | 100.0 | 100.0 | 100.0 | 100.0 | 100.0 | 100.0 |
Zone 3
Cu/Pb Separation from Open Circuit Test (Test F25) | Pb 2nd Cleaner Concentrate | 2.1 | 2.22 | 58.8 | 5.58 | 1,622 | 0.3 | 20.8 | 1.4 | 74.9 | 1.4 | 44.2 | 1.0 | 1.8 |
| Pb 1st Cleaner Concentrate | 2.9 | 4.51 | 48.3 | 6.94 | 1,369 | 0.5 | 24.1 | 3.8 | 83.8 | 2.4 | 50.9 | 2.0 | 2.8 |
| Pb Rougher Concentrate | 4.3 | 12.4 | 33.6 | 6.54 | 1,026 | 1.05 | 26.9 | 15.3 | 86.0 | 3.3 | 56.3 | 6.6 | 4.6 |
| Pb Rougher Tailings (Cu Concentrate) | 8.3 | 31.5 | 0.29 | 4.33 | 231 | 5.24 | 33.3 | 75.1 | 1.4 | 4.2 | 24.5 | 63.9 | 11.0 |
| Cu/Pb 2nd Cleaner Concentrate (Head) | 12.6 | 25.0 | 11.6 | 5.08 | 502 | 3.81 | 31.1 | 90.4 | 87.4 | 7.5 | 80.8 | 70.5 | 15.5 |
Zone 5
Cu/Pb Separation Feed from LCT-5
(Cycle 2) | Pb 2nd Cleaner Concentrate | 6.6 | 2.42 | 69.0 | 2.68 | 1,230 | 1.27 | 15.8 | 0.6 | 41.1 | 3 | 17.2 | 1.8 | 3.3 |
| Pb 1st Cleaner Concentrate | 15.2 | 3.78 | 57.6 | 4.18 | 993 | 1.92 | 20.5 | 2.3 | 78.8 | 11.5 | 31.9 | 6.1 | 9.8 |
| Pb Rougher Concentrate | 25.5 | 10.3 | 40.3 | 4.82 | 778 | 6.31 | 25.1 | 10.5 | 92.4 | 22.1 | 41.9 | 33.6 | 20.1 |
| Pb Rougher Tailings (Cu Concentrate) | 74.5 | 30.0 | 1.13 | 5.79 | 369 | 4.26 | 34.1 | 89.5 | 7.58 | 77.9 | 58.1 | 66.4 | 79.9 |
| Cu/Pb 2nd Cleaner Concentrate (Head) | - | 25.0 | 11.1 | 5.54 | 473 | 4.78 | 31.8 | 100.0 | 100.0 | 100.0 | 100.0 | 100.0 | 100.0 |
Zone 5
Cu/Pb Separation Feed from LCT 5
(Cycle 3) | Pb 2nd Cleaner Concentrate | 5.2 | 2.09 | 65.4 | 3.72 | 1,180 | 1.98 | 17.8 | 0.4 | 28.0 | 4.7 | 12.5 | 1.6 | 2.9 |
| Pb 1st Cleaner Concentrate | 17.5 | 3.54 | 54 | 4.09 | 900 | 1.24 | 21.9 | 2.5 | 77.9 | 17.5 | 32.2 | 3.4 | 12.1 |
| Pb Rougher Concentrate | 27.3 | 8.5 | 40 | 4.27 | 760 | 7.83 | 25.9 | 9.5 | 90 | 28.5 | 42.4 | 33 | 22.2 |
| Pb Rougher Tailings (Cu Concentrate) | 72.7 | 30.4 | 1.67 | 4.01 | 388 | 5.97 | 34 | 90.5 | 10 | 71.5 | 57.6 | 67 | 77.8 |
| Cu/Pb 2nd Cleaner Concentrate (Head) | - | 24.4 | 12.1 | 4.08 | 489 | 6.48 | 31.8 | 100.0 | 100.0 | 100.0 | 100.0 | 100.0 | 100.0 |
| Trilogy Metals Inc. | 13-20 | |
NI 43-101 Technical Report on the Arctic Project,
Northwest Alaska | | |
| Test | Product | Weight
% | Assays | Distribution (%) |
Cu
(%) | Pb
(%) | Zn
(%) | Ag
(g/t) | Au
(g/t) | S
(%) | Cu | Pb | Zn | Ag | Au | S |
Zone 1 & 2
Cu/Pb Separation Feed from
LCT-6 (Cycle 2) | Pb 2nd Cleaner Concentrate | 7.59 | 2.4 | 57.3 | 5.59 | 0.54 | 1,313 | 15.1 | 0.76 | 47.1 | 8.1 | 0.7 | 20.1 | 3.78 |
| Pb 1st Cleaner Concentrate | 16.4 | 4.38 | 45.3 | 7.96 | 0.77 | 1,038 | 19.9 | 2.98 | 80.5 | 24.9 | 2.2 | 34.4 | 10.8 |
| Pb Rougher Concentrate | 23.6 | 9.6 | 34.3 | 7.19 | 1.13 | 849 | 22.9 | 9.4 | 87.7 | 32.3 | 4.6 | 40.4 | 17.8 |
| Pb Rougher Tailings (Cu Concentrate) | 76.4 | 28.6 | 1.49 | 4.64 | 7.14 | 386 | 32.6 | 90.6 | 12.34 | 67.7 | 95.4 | 59.6 | 82.2 |
| Cu/Pb 2nd Cleaner Concentrate (Head) | - | 24.1 | 9.23 | 5.24 | 5.72 | 495 | 30.3 | 100.0 | 100.0 | 100.0 | 100.0 | 100.0 | 100.0 |
Zone 1 & 2
Cu/Pb Separation Feed from LCT-6
(Cycle 3) | Pb 2nd Cleaner Concentrate | 4.74 | 1.8 | 53.2 | 3.86 | 0.77 | 1,373 | 11.8 | 0.36 | 28.4 | 4.07 | 0.7 | 14.1 | 1.87 |
| Pb 1st Cleaner Concentrate | 13.2 | 3.31 | 48.3 | 6.37 | 0.74 | 1,155 | 16.6 | 1.84 | 72.2 | 18.8 | 1.8 | 33.2 | 7.3 |
| Pb Rougher Concentrate | 22 | 8.7 | 34.6 | 6.24 | 1.13 | 874 | 20.9 | 7.99 | 85.7 | 30.5 | 4.5 | 41.7 | 15.3 |
| Pb Rougher Tailings (Cu Concentrate) | 78 | 28.1 | 1.62 | 4.01 | 6.72 | 344 | 32.4 | 92 | 14.3 | 69.5 | 95.5 | 58.3 | 84.7 |
| Cu/Pb 2nd Cleaner Concentrate (Head) | - | 23.8 | 8.9 | 4.5 | 5.49 | 461 | 29.9 | 100.0 | 100.0 | 100.0 | 100.0 | 100.0 | 100.0 |
| Trilogy Metals Inc. | 13-21 | |
NI 43-101 Technical Report on the Arctic Project,
Northwest Alaska | | |
2017 ALS Metallurgy
ALS Metallurgy conducted detailed copper and lead separation flotation test work using a bulk sample of copper-lead concentrate produced from the operation of a pilot plant. This detailed work is contained in the report entitled, “KM5000 - Flotation and Variability Test work with Samples from the Arctic Deposit”, dated March 27, 2017.
The summary results of the copper and lead separation work are shown in Table 13-12 and indicate the effectiveness of the copper and lead separation process. Two locked cycle tests are shown in Table 13-10 and copper recovery to a saleable copper concentrate is consistently shown to be 97.4% of the available copper in the bulk concentrate. As well, approximately 86% of the lead is recovered to a lead concentrate.
Table 13-12 ALS Metallurgy Locked Cycle Copper-Lead Separation Test Results
| Product | Weight
% | Assay - percent or g/tonne | Distribution - percent |
| Cu | Pb | Zn | Ag | Au | Cu | Pb | Zn | Ag | Au |
| Test 33 (with respect to the Bulk Concentrate) | | | | | | | | |
| Flotation Feed | 100 | 22.7 | 6.13 | 2.61 | 301 | 1.79 | 100 | 100 | 100 | 100 | 100 |
| Lead Concentrate | 22.1 | 2.68 | 24.2 | 1.35 | 960 | 6.90 | 2.6 | 87.3 | 11.4 | 70.5 | 85.1 |
| Lead 1st Cleaner Tail | 11.3 | 25.8 | 1.64 | 2.08 | 138 | 0.39 | 12.9 | 3.0 | 9.0 | 5.2 | 2.5 |
| Lead Rougher Tail | 66.6 | 28.8 | 0.89 | 3.11 | 110 | 0.33 | 84.5 | 9.7 | 79.5 | 24.3 | 12.5 |
| Copper Concentrate | 77.9 | 28.3 | 1.00 | 2.96 | 114 | 0.34 | 97.4 | 12.7 | 88.6 | 29.5 | 14.9 |
| Test 34 (with respect to the Bulk Concentrate) | | | | | | | | |
| Flotation Feed | 100 | 23.3 | 5.93 | 2.61 | 285 | 1.88 | 100 | 100 | 100 | 100 | 100 |
| Lead Concentrate | 21.9 | 2.75 | 23.3 | 1.29 | 906 | 7.33 | 2.6 | 86.0 | 10.8 | 69.5 | 85.3 |
| Lead 1st Cleaner Tail | 11.2 | 26.8 | 1.76 | 2.02 | 132 | 0.44 | 12.9 | 3.3 | 8.7 | 5.2 | 2.6 |
| Lead Rougher Tail | 66.9 | 29.4 | 0.95 | 3.14 | 108 | 0.34 | 84.5 | 10.7 | 80.5 | 25.3 | 12.1 |
| Copper Concentrate | 78.1 | 29.0 | 1.06 | 2.98 | 111 | 0.35 | 97.4 | 14.0 | 89.2 | 30.5 | 14.7 |
The lead concentrate produced from the locked cycle work at ALS Metallurgy contained only about 24% lead, due to contamination of the concentrate with talc minerals. This contamination is due to the high levels of talc in the sample provided for this specific test work. Lead concentrate grades produced during the 2012 test work ranged from 41 to 59% lead using samples that had substantially lower levels of talc in the process feed.
An overall metallurgical balance for the project is summarized in Table 13-13. This table of metal recoveries is based on an expected average recovery over the entire resource based on grades and detailed results of metallurgical test work conducted in 2012 and 2017.
| Trilogy Metals Inc. | 13-22 | |
NI 43-101 Technical Report on the Arctic Project,
Northwest Alaska | | |
Table 13-13 Summary of Overall Metal Recovery – Arctic Project
| | | Concentrate Grade | Metal Recoveries |
| | | | | | | | | | | | |
| Process stream | Mass % | Cu | Pb | Zn | Au | Ag | Cu | Pb | Zn | Au | Ag |
| | | % | % | % | g/t | g/t | % | % | % | % | % |
| | | | | | | | | | | | |
| Process Feed | 100.0 | 2.31 | 0.59 | 3.22 | 0.49 | 38 | | | | | |
| | | | | | | | | | | | |
| Copper Conc | 7.15 | 29.5 | 0.3 | 3.0 | 0.35 | 240 | 91.2 | 3.6 | 6.7 | 5.2 | 45.1 |
| | | | | | | | | | | | |
| Lead Conc | 1.02 | 1.7 | 50.0 | 0.9 | 28.0 | 1300 | 0.7 | 85.1 | 0.3 | 58.9 | 34.9 |
| | | | | | | | | | | | |
| Zinc Conc | 4.85 | 1.7 | 0.5 | 59.2 | 0.55 | 49.6 | 3.6 | 4.0 | 89.0 | 5.5 | 6.3 |
| | | | | | | | | | | | |
| Process Tailings | 86.98 | 0.12 | 0.05 | 0.15 | 0.17 | 6 | 4.5 | 7.3 | 4.0 | 30.5 | 13.7 |
| | | | | | | | | | | | |
Expected Concentrate Quality
ICP assays were conducted on the copper and lead concentrates produced from the locked cycle tests at ALS Metallurgy and the zinc concentrate from the locked cycle tests at SGS. The samples are thought to represent the expected concentrate quality. The main impurity elements are shown in Table 13-14.
The results indicated that key penalty elements, as well as precious metals are typically concentrated into a lead concentrate, leaving the copper concentrate of higher than expected quality given the levels of impurities seen in the test samples.
The lead concentrate may have penalties for the high arsenic and antimony concentrations seen in the results of this test work.
Precious metal deportment into a lead concentrate is very high and should benefit the payable levels of precious metals at a smelter.
Silicon dioxide and fluoride assays should be conducted on the concentrates to determine whether or not they are higher than the penalty thresholds.
| Trilogy Metals Inc. | 13-23 | |
NI 43-101 Technical Report on the Arctic Project,
Northwest Alaska | | |
Table 13-14 Multi-element Assay Results –Lead Concentrate and Copper Concentrate
| Element | Unit | Content | Distribution - percent |
| Lead | Copper | Lead Con | Copper Con |
| Antimony | Sb | g/tonne | 3470 | 39 | 96.1 | 3.9 |
| Arsenic | As | g/tonne | 3750 | 769 | 57.8 | 42.2 |
| Bismuth | Bi | g/tonne | 1920 | 130 | 80.6 | 19.4 |
| Cadmium | Cd | g/tonne | 105 | 200 | 12.8 | 87.2 |
| Chlorine | Cl | g/tonne | 60 | 70 | 19.4 | 80.6 |
| Copper | Cu | % | 2.75 | 29.0 | 2.6 | 97.4 |
| Fluorine | F | g/tonne | 7780 | 750 | 74.4 | 25.6 |
| Gold | Au | g/tonne | 7.33 | 0.35 | 14.7 | 85.3 |
| Lead | Pb | % | 23.3 | 1.06 | 86.0 | 14.0 |
| Magnesium | Mg | % | 9.82 | 0.74 | 78.8 | 21.2 |
| Mercury | Hg | g/tonne | 2 | 1 | 35.9 | 64.1 |
| Selenium | Se | g/tonne | 2980 | 370 | 69.3 | 30.7 |
| Silver | Ag | g/tonne | 906 | 111 | 69.6 | 30.4 |
| Sulphur | s | % | 7.54 | 33.2 | 6.0 | 94.0 |
| Tellurium | Te | g/tonne | 54.7 | 6.4 | 70.6 | 29.4 |
| Zinc | Zn | % | 1.29 | 2.98 | 10.8 | 89.2 |
Within the zinc concentrates produced at SGS in 2012 from the locked cycle tests, the cadmium content generally ranges from 2,100 to 3,400 ppm, which will likely be higher than the penalty thresholds outlined by most zinc concentrate smelters, Table 13-15. The arsenic content may be higher than the penalty mark in the concentrate produced from Composite Zone 5. However, the mineralization from Zone 5 is not expected to be mined separately, on average; therefore, the arsenic in the zinc concentrate should not attract a penalty.
| Trilogy Metals Inc. | 13-24 | |
NI 43-101 Technical Report on the Arctic Project,
Northwest Alaska | | |
Table 13-15 Multi-element Assay Results – Zinc Concentrate
| Test | LCT 1 | LCT 2 | LCT 3 | LCT 4 | LCT 5 | LCT 6 |
| Composite | Zone 3 & 5 | Zone 3 | Zone 5 | Zone 3 & 5 | Zone 5 | Zone 1 & 2 |
| Mercury (ppm) | No Data | No Data | No Data | No Data | No Data | No Data |
| Arsenic (ppm) | 688 | 89 | 1310 | 706 | 1,020 | 754 |
| Antimony (ppm) | 436 | 184 | 418 | 211 | 584 | 550 |
| Cadmium | 3,010 | 3,390 | 3,290 | 3,440 | 2,910 | 2,110 |
| Copper | 3.1 | 1.0 | 0.9 | 1.8 | 2.0 | 5.8 |
| Lead | 0.6 | 0.4 | 0.6 | 0.4 | 0.8 | 0.5 |
| 13.2 | Recommended Test Work |
In general, the flowsheet developed in the 2012 test program and further tested in the 2017 test work program at ALS Metallurgy, is feasible for the Arctic mineralization (see Figure 13-1). Further metallurgical test work is recommended on representative samples to optimize the flowsheet and better understand the impact of talc levels in the process feed samples. Lead concentrate quality is impacted by the level of talc in the process feed and a better understanding of the level of talc in an expected process feed is critical in maximizing the value of a lead concentrate. There are no outstanding metallurgical issues related to the production of a copper or zinc concentrate from all of the materials tested.
On-going grinding test work is recommended at some time in the future, including SAG mill characterization test work.
| Trilogy Metals Inc. | 13-25 | |
NI 43-101 Technical Report on the Arctic Project,
Northwest Alaska | | |
| 14.0 | MINERAL RESOURCE ESTIMATE |
This section describes the generation of an updated mineral resource estimate for the Arctic Project. The mineral resource estimate has been prepared by Bruce M. Davis, FAusIMM, BD Resource Consulting, Inc. (BDRC) and Robert Sim, P.Geo., SIM Geological Inc. (SGI). Both are “Independent Qualified Persons (QPs)” as defined in NI 43-101. Trilogy Metals Inc. has filed several technical reports on the Arctic deposit as described in Section 6.0 of this report, the most recent one was a PEA authored by Tetra Tech with an effective date of September 12, 2013. During the summers of 2015 and 2016, Trilogy conducted drilling programs designed to upgrade previous in-pit Inferred Mineral Resources to the Indicated category. During the fall of 2016, following the completion of the final drilling program, Trilogy geologists reinterpreted the geologic units present in the vicinity of the Arctic deposit. This section incorporates the new geologic model and all available sample data as of April 25, 2017.
This section describes the resource estimation methodology and summarizes the key assumptions considered by the QPs. In the opinion of the QPs, the resource evaluation reported herein is a sound representation of the mineral resources for the Arctic Project at the current level of sampling. The mineral resources have been estimated in conformity with generally accepted CIM Estimation of Mineral Resources and Mineral Reserves Best Practice Guidelines and are reported in accordance with the Canadian Securities Administrators’ NI 43-101. Mineral resources are not mineral reserves and do not have demonstrated economic viability. There is no certainty that all or any part of the mineral resource will be converted into mineral reserves.
The database used to estimate the Arctic Project mineral resource was audited by the QPs. The QPs are of the opinion that the current drilling information is sufficiently reliable to confidently interpret the boundaries of the mineralization and the assay data are sufficiently reliable to support mineral resource estimation.
The resource estimate was generated using MineSight® v11.60-2. Some non-commercial software, including the Geostatistical Library (GSLib) family of software, was used for geostatistical analyses. For a complete list of all block model codes, see Appendix B Block Model Descriptors.
| 14.2 | Sample Database and Other Available Data |
Trilogy provided the Arctic database in Microsoft™ Excel format, exported from the master database (GeoSpark Core Database System). The files contain collar, survey, assay, lithology, acid-base accounting and specific gravity data, and other geological, geotechnical and acid-base accounting information.
| Trilogy Metals Inc. | 14-1 | |
| NI 43-101 Technical Report on the Arctic Project, | | |
| Northwest Alaska | | |
The Project database comprises 322 diamond drill (core) holes totalling 64,260 m, this includes exploration holes that test for satellite deposits for distances up to 40 km from Arctic. There are 152 drill holes (32,699 m) in the immediate vicinity of the Arctic deposit that have been used to develop the estimate of mineral resources described in this report.
The database contains a total of 12,594 samples, most of which have been analyzed for a variety of elements through a combination of ICP and XRF multi-element packages. Sample data for copper, lead, zinc, gold and silver have been extracted from this database for use in the generation of this resource estimate. Note: The number and total length of drill holes described here represents the database used to generate the estimate of mineral resources. These values may differ from those described in previous Trilogy reports.
Individual sample intervals range from 5 cm to 35.5 m in length and average 2.14 m. The few very long sample intervals represent samples taken in talus and overburden. Sample selection in the majority of drill holes has been guided by the visual presence of appreciable amounts of sulphide mineralization. As a result, most core intervals where samples have not been taken are assigned default zero grade values. There are exceptions where samples were purposely not taken, such as wedge holes or holes that were drilled to provide metallurgical test material. In these cases, the un-sampled intervals remain as “missing”.
All drill holes at Arctic are collared on surface and are generally vertically oriented, or steeply inclined in a northeast direction. The majority of holes are spaced at 75 m to 100 m intervals but there are rare instances where holes are located within 10 m of one another.
Specific gravity (SG) measurements have been conducted on 3,024 samples in the database and range from a minimum of 2.43 to a maximum of 4.99 and average 3.08 . The distribution of SG data is considered sufficient to support block model estimation.
Drill core recovery data is available for 107 holes with an overall average value of 94%. Samples in the interpreted mineralized domains average >95% recovery. There are no apparent relationships between drill core recovery and sample grade. There are no adjustments to the sample database to account for core recovery.
The database also contains lithology information derived during core logging. There are 33 different rock types in this data.
Trilogy provided a topographic digital terrain surface, produced from LiDAR data in 2016, measuring approximately 2 km east-west by 2 km north-south that is centred over the Arctic deposit. Drill hole collar locations, surveyed using a differential GPS, correlate very well with the local digital terrain (topographic) surface.
The distribution of copper grades in drill holes proximal to the Arctic deposit is shown from two isometric viewpoints in Figure 14-1 and Figure 14-2.
| Trilogy Metals Inc. | 14-2 | |
| NI 43-101 Technical Report on the Arctic Project, | | |
| Northwest Alaska | | |
Figure 14-1 Isometric View of Copper Grades in Drill Holes
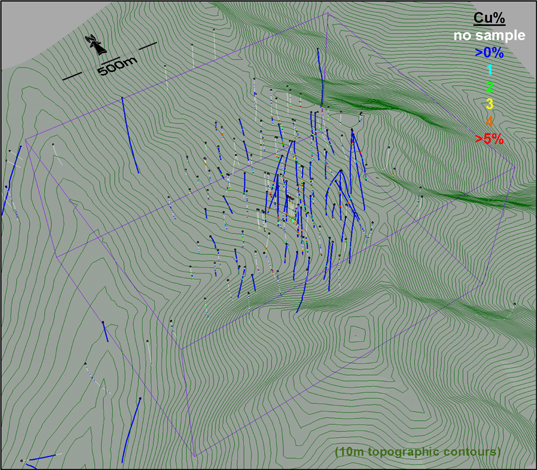
| Trilogy Metals Inc. | 14-3 | |
| NI 43-101 Technical Report on the Arctic Project, | | |
| Northwest Alaska | | |
Figure 14-2 Isometric View of Copper Grades in Drill Holes

ABA Data
Also included in the resource model are items used to evaluate the acid generating and neutralizing potential of the rocks in the vicinity of the deposit. This includes 1,557 samples that have been analyzed for acid generating potential (AP) and neutralizing potential (NP). The distribution of AP and NP data, shown in Figure 14-3, is somewhat limited due to a lack of available drill core. The majority of the available AP and NP samples are located around the perimeter of the deposit and from rocks in the hanging-wall to the mineralized zones. Although the distribution of these data is not ideal, it is felt there is sufficient information available to provide reasonable estimates of the acid and neutralizing potential of the waste rocks at Arctic. There have been no adjustments to account for missing AP and NP data.
In addition to estimates of AP and NP in the model, estimates of total sulphur content are also generated. There are a total of 9,316 samples that have been analyzed for total sulphur content. Approximately one half of drill holes have sulphur analysis throughout the entire length of the hole and the remainder of the holes have sulphur analyses taken on 10m intervals down the hole. This provides a consistent and extensive distribution of samples that is sufficient to provide reasonable estimates of sulphur content in the block model.
| Trilogy Metals Inc. | 14-4 | |
| NI 43-101 Technical Report on the Arctic Project, | | |
| Northwest Alaska | | |
Figure 14-3 Isometric Views of Available AP and NP Data
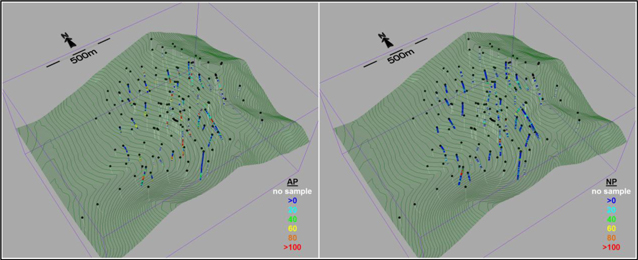
Figure 14-4 Isometric View of Available Sulphur Data
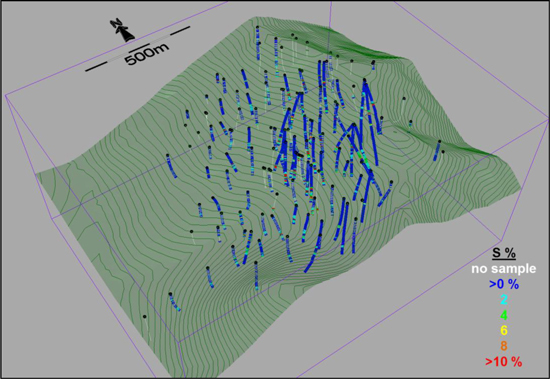
Table 14-1 contains a summary of the sample data used in the development of the Arctic resource block model. Note that the primary and adjusted values for copper, lead, zinc, gold and silver are included in the table (value #1 is initial data and #2 includes zero grade values assigned to select un-sampled intervals).
| Trilogy Metals Inc. | 14-5 | |
| NI 43-101 Technical Report on the Arctic Project, | | |
| Northwest Alaska | | |
Table 14-1 Summary of Sample Data Used to Develop the Resource Block Model
| Element | Number | Total
Length (m) | Minimum | Maximum | Mean | Std. Dev. | Co. Of
Variation |
| Copper1 (%) | 12,252 | 17,551 | 0.00 | 31.00 | 0.50 | 1.67 | 3.3 |
| Copper2 (%) | 15,662 | 31,392 | 0.00 | 31.00 | 0.28 | 1.28 | 4.5 |
| Lead1 (%) | 12,041 | 17,361 | 0.00 | 8.15 | 0.12 | 0.50 | 4.0 |
| Lead2 (%) | 15,451 | 31,202 | 0.00 | 8.15 | 0.07 | 0.38 | 5.4 |
| Zinc1 (%) | 12,151 | 17,458 | 0.00 | 27.60 | 0.72 | 2.56 | 3.6 |
| Zinc2 (%) | 15,561 | 31,299 | 0.00 | 27.60 | 0.40 | 1.95 | 4.8 |
| Gold1 (g/t) | 10,986 | 14,604 | 0.00 | 32.800 | 0.138 | 0.783 | 5.7 |
| Gold2 (g/t) | 14,396 | 28,446 | 0.00 | 32.800 | 0.071 | 0.565 | 8.0 |
| Silver1 (g/t) | 12,154 | 17,459 | 0.00 | 1,155.00 | 8.20 | 30.58 | 3.7 |
| Silver2 (g/t) | 15,564 | 31,300 | 0.00 | 1,155.00 | 4.57 | 23.20 | 5.1 |
| Sulphur (%) | 8,937 | 15,450 | 0.01 | 10.00 | 1.37 | 2.18 | 1.6 |
| AP | 2,261 | 5,018 | 0.31 | 1,307.50 | 68.19 | 148.50 | 2.2 |
| NP | 2,261 | 5,018 | 0.08 | 972.75 | 18.34 | 50.54 | 2.8 |
| SG | 3,100 | na | 2.43 | 4.99 | 3.09 | 0.53 | 0.2 |
Notes: Value#1 is initial sample data. Value#2 includes zero grades assigned to select unsampled intervals.
The total core length of drilling is 32,699m.
The geologic model interpreted for the Arctic deposit consists primarily of a series of inter-bedded volcano-sedimentary rocks that dip gently to the southwest. Most of these units have been folded in a wide syncline, the axis of which plunges down the centre of the Arctic deposit in a southwest direction at about 25 degrees. Sulphide mineralization occurs in a series of distinct beds or horizons that likely reflect syn-sedimentary/volcanic and/or replacement-type mineralization of distinct receptive layers of the original stratigraphy. The stratigraphy is described in more detail in Section 7.0 of this report.
Trilogy geologists have interpreted three dimensional domains representing the distributions of various lithologic units, mineral domains, alteration facies, geotechnical domains, talc-rich zones and an area of near surface weathering. All of these domains were evaluated to determine if they should be utilized to control the estimation of the various elements included in the resource block model.
In order to replicate the stratiform nature of the mineralization in the resource model, a dynamic anisotropy approach relative to the overall trends of sulphide mineralization has been applied. Three-dimensional planes are interpreted that represent the trends of the sulphide mineralization, with separate planes interpreted for each of the eight main mineralized domains. These “trend planes” generally represent the centre of each interpreted mineralized domain. These trend planes are used to control search orientations during subsequent interpolations in the model. Variograms are generated using distances relative to the trend planes rather than the true sample elevations. This approach essentially flattens out the zone during interpolation relative to the defined trend plane.
| Trilogy Metals Inc. | 14-6 | |
| NI 43-101 Technical Report on the Arctic Project, | | |
| Northwest Alaska | | |
The interpretation of most of the geology domains are derived from a combination of information recorded during surface geologic mapping and the visual logging of drill core as well as properties exhibited by various elements in the ICP database. A series of mineralized zones (MinZone domains) have been interpreted by Trilogy that represents zones that exceed a grade of 0.75% CuEq. Of these, there are four or five primary domains and twelve sub-domains. The sub-domains are much smaller and often are interpreted about only one or two drill holes. Essentially all of the mineral resource is located within the larger, primary, MinZone domains. Several examples of the interpreted lithologic model are shown in Figure 14-5 and Figure 14-6.
Figure 14-5 Cross Section 613250E Showing Lithology Domains at Arctic
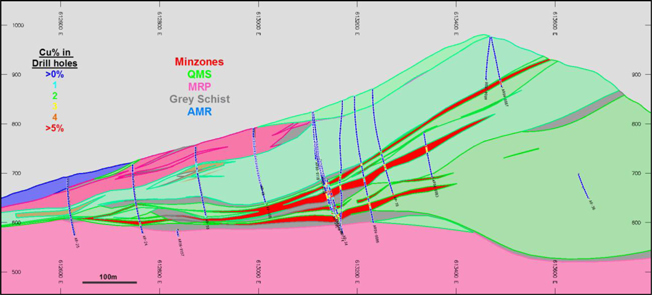
| Trilogy Metals Inc. | 14-7 | |
| NI 43-101 Technical Report on the Arctic Project, | | |
| Northwest Alaska | | |
Figure 14-6 Cross Section 7453000N Showing Lithology Domains at Arctic
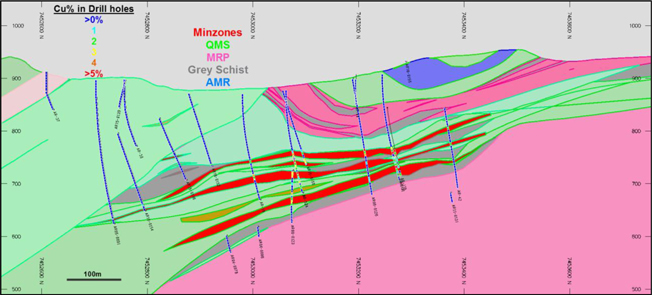
Six separate Geotechnical domains have been interpreted by SRK Consulting (Canada) Inc. based on a review of the local geology, alteration, weathering, overburden, major structures, minor structures (discontinuity sets), a rock mass assessment, a kinematic stability assessment and a hydrogeological assessment. These domains define differing slope sectors used in the generation of open pit designs. The distribution of these domains is shown in Figure 14-7.
Figure 14-7 Isometric View of Geotechnical Domains
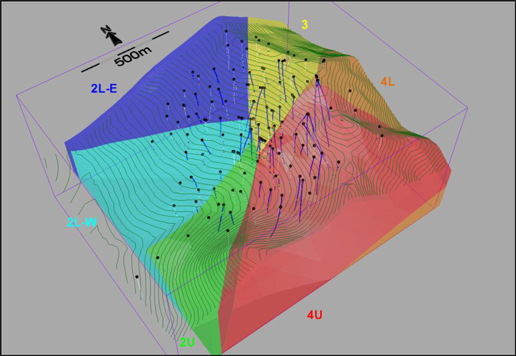
| Trilogy Metals Inc. | 14-8 | |
| NI 43-101 Technical Report on the Arctic Project, | | |
| Northwest Alaska | | |
A series of nine separate domains have been interpreted that encompass zones where the presence of talc has been of observed. The shape and distribution of the Talc domains is shown in Figure 14-8. These domains tend to mimic the trends of mineralization in the deposit. Some talc domains are comprised of small and discontinuous patches.
Figure 14-8 Isometric Views of Talc Domains

Four alteration domains have been interpreted as shown in Figure 14-9. These tend to mimic the general trends of mineralization in the deposit. These domains are locally patchy and discontinuous, reflecting a lack of continuity in the presence of these alteration assemblages.
Figure 14-9 Isometric Views of Alteration Domains
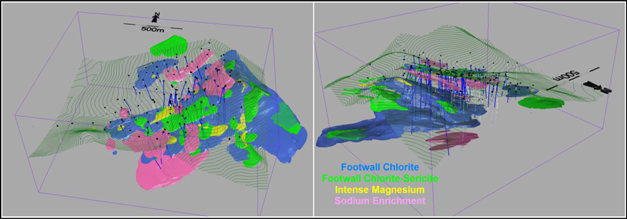
| 14.3.1 | Summary of Geologic Domains |
The interpreted lithology domains are summarized in Table 14-2. The lithology domains have been segregated into five general groups as follows:
LTHDM 1-8: Somewhat generalized representation of the mineralized domains (MinZone domains) that host the majority of the mineralization at Arctic.
| Trilogy Metals Inc. | 14-9 | |
| NI 43-101 Technical Report on the Arctic Project, | | |
| Northwest Alaska | | |
LTHDM 100-series: Meta-Rhyolite Porphyry (MRP)
LTHDM 200-series: Grey Schist (GS)
LTHDM 300-series: Quartz Mica Schist (QMS)
LTHDM 400-series: Aphanitic Meta-Rhyolite (AMR)
Table 14-2 Summary of Lithology Domains
Lithology
Unit | LTHDM | Lithology
Unit | LTHDM | Lithology
Unit | LTHDM | MinZone
Domain | LTHDM |
| AMR 2A | 401 | GS WS | 209 | MRP WS | 104 | 1 | 1 |
| QMS 2WS | 309 | GS 2C | 208 | MRP WSsub | 103 | 2, 2.5 | 2 |
| QMS WS | 308 | GS 2B | 207 | MRP 2A | 102 | 3, 3sub | 3 |
| QMS 2B | 307 | GS 2A | 206 | MRP 1A | 101 | 4 | 4 |
| QMS 2A | 306 | GS 2 | 205 | | | 5 | 5 |
| QMS 1A | 305 | GS WX | 204 | | | 7a, b, bHW, c | 7 |
| QMS 1CX | 304 | GS X | 203 | | | 8a, b, c, cHW, d | 8 |
| QMS 1BY | 303 | GS Y | 202 | | | | |
QMS 1CZ,
1C | 302 | GS Z | 201 | | | | |
In order to retain the detail between the various MinZone domains, distinct codes have been assigned using the individual interpreted MinZone domains as listed in Table 14-3.
| Table 14-3 | Summary of Mineralized Zone (MinZone) Domains |
MinZone
Domain | MNZNE
code | MinZone
Domain | MNZNE
code |
| 1 | 10 | 7b | 73 |
| 2 | 20 | 7bHW | 74 |
| 2.5 | 25 | 7c | 75 |
| 3 | 30 | 7cHW | 76 |
| 3sub | 35 | 8a | 81 |
| 4 | 40 | 8b | 82 |
| 5 | 50 | 8c | 83 |
| 7a | 71 | 8cHW | 84 |
| 7aHW | 72 | 8d | 85 |
| Trilogy Metals Inc. | 14-10 | |
| NI 43-101 Technical Report on the Arctic Project, | | |
| Northwest Alaska | | |
The remaining interpreted Geotech, Alteration, Talc and Weathered domains are summarized in Table 14-4.
| Table 14-4 | Summary of Geotech, Alteration, Talc and Weathering Domains |
Geotech
Domain | GTECH
Code | Alteration
Domain | ALTDM
Code | Talc
Domain | TALC
Code | Weathered
Domain | Weathered
Code |
| 2L-E | 1 | FW Chlorite | 701 | Talc | 1 | Weathered | 1 |
| 2L-W | 2 | FW Chlorite-Sericite | 702 | No Talc | 2 | Fresh | 2 |
| 2U | 3 | Intense Magnesium | 703 | | | | |
| 3 | 4 | Sodium Enrichment | 704 | | | | |
| 4L | 5 | Sodium Enrichment HW | 705 | | | | |
| 4U | 6 | Other | 706 | | | | |
Compositing drill hole samples standardizes the database for further statistical evaluation. This step eliminates any effect the sample length may have on the data. To retain the original characteristics of the underlying data, a composite length that reflects the average, original sample length is selected: a composite that is too long can sometimes result in a degree of smoothing that can mask certain features of the data.
At Arctic, the average sample length of all samples is 1.45 m but inside the MinZone domains samples tend to be much shorter, with an average of 0.68 m. A composite length of 1 m has been selected for use in the estimate of mineral resources.
Drill hole composites are length-weighted and are generated down-the-hole, meaning composites begin at the top of each drill hole and are generated at constant intervals down the length of the hole. The drill hole composites honour the MinZone domain boundaries, meaning individual composites are broken at the boundary between the MinZone domain and the surrounding rocks.
| Trilogy Metals Inc. | 14-11 | |
| NI 43-101 Technical Report on the Arctic Project, | | |
| Northwest Alaska | | |
| 14.5 | Exploratory Data Analysis |
Exploratory data analysis (EDA) involves the statistical summarization of the database to better understand the characteristics of the data that may control grade. One of the main purposes of this exercise is to determine if there is any evidence of spatial distinctions in grade which may require the separation and isolation of domains during interpolation. The application of separate domains prevents unwanted mixing of data during grade interpolation so that the resulting grade model will better reflect the unique properties of the deposit. However, applying domain boundaries in areas where the data are not statistically unique may impose a bias in the distribution of grades in the model.
A domain boundary, which segregates the data during interpolation, is typically applied if the average grade in one domain is significantly different from that of another domain. A boundary may also be applied where there is evidence that a significant change in the grade distribution exists across a geologic contact.
Composited samples were captured in the various interpreted domains including the lithology domains (including the Minzones), alteration domains, talc domains and the near-surface weathered domain.
| 14.5.1 | As Logged Geology and Domain Statistics |
This section examines the relationship between metal content and the as-logged lithology units in the database. The drill core was examined and logged for lithology type and geo-technical characteristics. The geotechnical groups were not related to grade and are, therefore, not included in this discussion.
Twenty-seven lithology designations with associated grades occur in the database. The frequency distributions for the grades of each metal by as-logged lithology are compared by a series of boxplots. An example for copper appears in Figure 14-10. The boxplots show that significantly high grades occur, as expected, in massive and semi-massive sulphides but it also shows that high grades may occur in almost any lithology. These results suggest that individual lithology type is not a strong controlling factor in the distribution of metal in the deposit.
| Trilogy Metals Inc. | 14-12 | |
| NI 43-101 Technical Report on the Arctic Project, | | |
| Northwest Alaska | | |
| Figure 14-10 | Boxplots of Copper by Logged Lithology Type |

A matrix was constructed listing the individual logged lithology types within each of the interpreted MinZone domains. This matrix indicated that between 32% and 44 % of the mineral domains consisted of massive or semi-massive sulphides. The remainder consisted of as many as 15 other rock types. After all, the Minzone domains encompass rocks which, in general, contain greater than 0.75%CuEq and, as shown in the boxplot in Figure 14-10, mineralization of this tenor occurs in the majority of rock types.
| Trilogy Metals Inc. | 14-13 | |
| NI 43-101 Technical Report on the Arctic Project, | | |
| Northwest Alaska | | |
Similarly, Trilogy grouped the twenty-seven individual lithology types into four groups (QMS, GS, MRP and AMR). Each of these four groups contains a mix of logged rock types. The matrix of individual lithology by group showed the interpreted MRP group contained 54.7 % individually logged MRP rocks with the remainder from 24 other logged rock types; the interpreted GS group had 76.2 % logged GS and 16 other logged rock types; the interpreted QMS group had 79.5 % logged QMS and 26 other rock types; the interpreted AMR group had 86.4 % logged AMR and 5 other rock types. This type of simplification of rock types resulting from the interpretation of lithology domains is not uncommon.
| 14.5.2 | Interpreted Lithology and MinZone Domain Statistics |
The composited sample data were assigned distinct lithology domain codes, as listed in Table 14-2, using the domains interpreted by Trilogy. Boxplots describing the distributions of each element by lithology domain were generated. The distributions for copper, zinc, lead, gold, and silver are similar relative to the Minzone domains; the interpreted MinZone domains (lithology domain codes 1-8) host the majority of the mineralization where the other lithology domains (100, 200, 300 and 400 series codes) only exhibit a few rare significant grade values of which there is no apparent continuity. Domains 7 and 8 show elevated metal grades compared to the other lithology groups, but the important grade distributions occur in domains 1 - 5. The distributions of copper and gold by lithology domain are shown in Figure 14-11 and Figure 14-12.
Figure 14-11 Boxplots of Copper by Lithology Domain
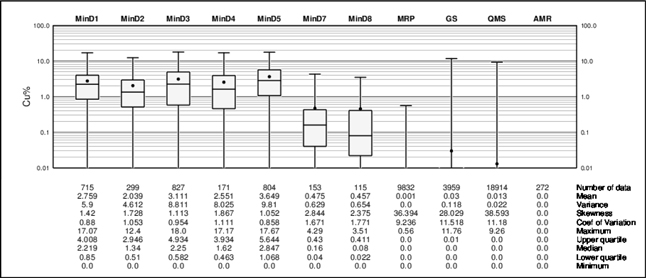
| Trilogy Metals Inc. | 14-14 | |
| NI 43-101 Technical Report on the Arctic Project, | | |
| Northwest Alaska | | |
Figure 14-12 Boxplots of Gold by Lithology Domain
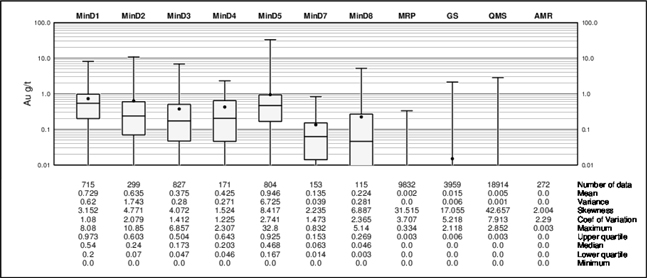
The MinZone domains interpreted by Trilogy were used to assign MinZone domain codes, as listed in Table 14-3, to the composited drill hole samples. A series of boxplots were generated for each of the five metals included in the resource model. There are similar relative distributions exhibited by each of these five metals among or across the Minzone domains. An example showing the distribution of copper by MinZone domain is shown in Figure 14-13. The primary domains are those enclosing appreciable volumes of sample data (domains 1, 2, 2.5, 3, 4 and 5). There are limited numbers of data, and much lower average grades, in the sub-domains (3sub, 7’s and 8’s). For statistical and estimation purposes, the data in MinZone domain 2.5 is combined with domain 2, and the data in domain 3sub has been combined with domain 3. Since the frequency distributions are fairly similar in the 7-series, and there are relatively few samples in each sub-domain in the 8-series, the smaller domain samples were grouped into two domains labeled 7 and 8 for statistical and estimation purposes.
| Trilogy Metals Inc. | 14-15 | |
| NI 43-101 Technical Report on the Arctic Project, | | |
| Northwest Alaska | | |
Figure 14-13 Boxplots of Copper by MinZone Domain

| Trilogy Metals Inc. | 14-16 | |
| NI 43-101 Technical Report on the Arctic Project, | | |
| Northwest Alaska | | |
Evaluations were also made comparing the five main metals relative to the geotech, alteration, talc and weathering domains. There are no indications that these domains control the distribution of copper, lead, zinc, gold or silver in the deposit.
A series of boxplots was produced comparing the AP, NP and sulphur sample data in relation to the interpreted MinZone, lithology, alteration, talc and weathered domains. As expected, higher AP and S% values occur in the MinZone domains. Higher NP values in the vicinity of the MinZone domains are likely the result of the talc alteration from a carbonate-rich protolith typically seen in these areas. Outside of the mineralized domains, most lithology groups tend to have similar distributions of AP, NP, and S%. The grey schist has elevated values of AP and S% compared to other domains. The boxplots in Figure 14-14 show the distributions of AP, NP and S% by lithology type.
| Trilogy Metals Inc. | 14-17 | |
| NI 43-101 Technical Report on the Arctic Project, | | |
| Northwest Alaska | | |
Figure 14-14 Boxplots of AP, NP and Sulphur by Lithology Domain
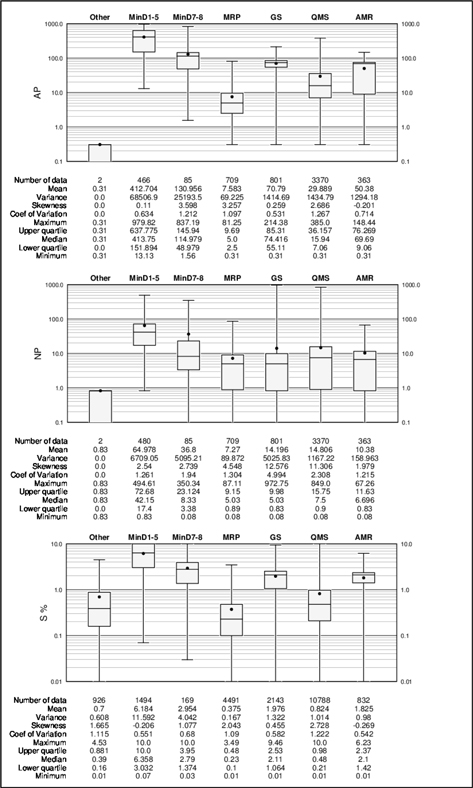
| Trilogy Metals Inc. | 14-18 | |
| NI 43-101 Technical Report on the Arctic Project, | | |
| Northwest Alaska | | |
The alteration domains show only minor differences between domains. The sodium depletion domain has lower sulphur and AP values, and there are higher NP values in the FW Chlorite and Magnesium enrichment domains but there is significant overlap in the boxplot results between domains suggesting these are not distinct distributions.
There are differences evident in AP, NP, and S% between both talc and the weathered domains as shown in Figure 14-15 and Figure 14-16.
Figure 14-15 Boxplots of AP, NP and Sulphur by Talc Domain

Figure 14-16 Boxplots of AP, NP and Sulphur by Weathered Domain
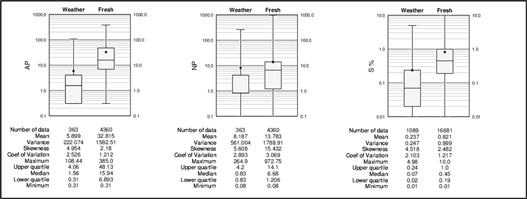
SG samples were evaluated between the various interpreted domains. Only the MinZone domains contain samples that significantly differ from SG samples in the surrounding rocks. The boxplot in Figure 14-17 shows the distribution of SG data between the various MinZone domains and the lithology groups. There is weak correlation evident between SG and copper and zinc grade in some MinZone domains but there is scatter due to the variable presence of chalcopyrite, sphalerite, barite, and galena as well as arsenopyrite, pyrite and pyrrhotite.
| Trilogy Metals Inc. | 14-19 | |
| NI 43-101 Technical Report on the Arctic Project, | | |
| Northwest Alaska | | |
Figure 14-17 Boxplots of SG by MinZone and Lithology Group Domains

Contact profiles evaluate the nature of grade trends between two domains: they graphically display the average grades at increasing distances from the contact boundary. Those contact profiles that show a marked difference in grade across a domain boundary indicate that the two datasets should be isolated during interpolation. Conversely, if a more gradual change in grade occurs across a contact, the introduction of a hard boundary (e.g., segregation during interpolation) may result in a much different trend in the grade model; in this case, the change in grade between domains in the model is often more abrupt than the trends seen in the raw data. Finally, a flat contact profile indicates no grade changes across the boundary; in this case, hard or soft domain boundaries will produce similar results in the model.
Contact profiles were generated to evaluate the change in grades across prominent lithologic group and mineralized (MinZone) domain boundaries. The results for all metals are similar; a marked change in grade between the MinZone domains and the surrounding host rocks. An example showing the change in copper grade between the (combined) MinZone domains and the three main lithology groups is presented in Figure 14-18.
| Trilogy Metals Inc. | 14-20 | |
| NI 43-101 Technical Report on the Arctic Project, | | |
| Northwest Alaska | | |
Figure 14-18 Contact Profiles of Copper Between MinZone and other Lithology Domain Groups
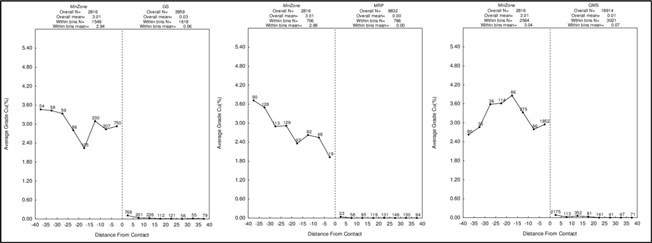
Contact profiles were generated to evaluate the change in AP, NP, and S% across prominent domain boundaries.
Even though the talc and weathering surface show the frequency distributions of AP, NP, and S% are different inside and outside of the domains, contact profiles show these variables tend to be similar or transition at the boundary. The contact profiles for AP, NP and sulphur for the weathering surface are shown in Figure 14-19 and similar profiles at the talc boundary appear in Figure 14-20.
Figure 14-19 Contact Profile of AP, NP and Sulphur Between Weathered and Fresh Rocks
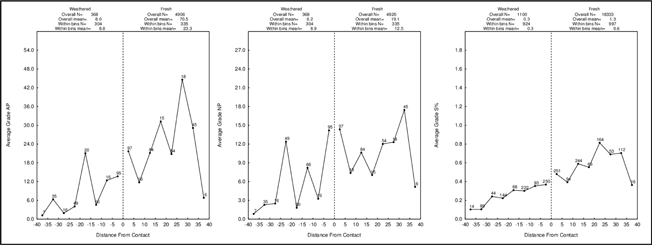
| Trilogy Metals Inc. | 14-21 | |
| NI 43-101 Technical Report on the Arctic Project, | | |
| Northwest Alaska | | |
Figure 14-20 Contact Profile of AP, NP and Sulphur Inside / Outside of the Talc Domains
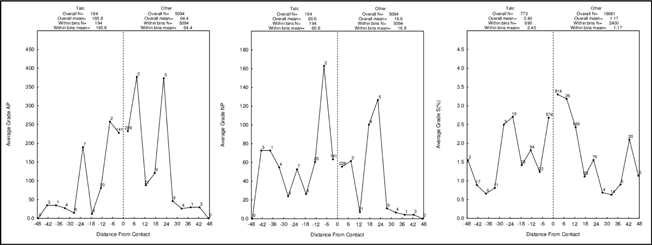
| 14.5.4 | Modeling Implications |
The results of the EDA indicate that all metal, ABA and density samples located inside the MinZone domains distinctly differ from samples outside and these data should not be mixed during estimations in the block model.
The most consistently important metal grades occur in MinZone domains 1 – 5. MinZones 1 – 5 tend to host higher-grades and are continuous over relatively large areas (several hundred metres). MinZones 7 and 8 contain lower grades and there tends to be far less continuity of mineralization.
Although the nature of mineralization may be similar between most of the MinZone domains, they each represent distinct stratigraphic mineralized horizons and, as a result, the contained sample data in each mineralized horizon should remain segregated during the interpolation of block grades in the model. Therefore, “hard” boundary conditions are applied to all MinZone domains for grade estimation purposes (even the individual small domains that comprise MinZones 7 and 8).
The rocks surrounding the MinZone domains are essentially void of appreciable mineralization and, as a result, grade estimates in the model for copper, lead, zinc, gold and silver are restricted only to the MinZone domains. It is assumed that all areas outside of the MinZone domains have zero grade values for these five metals.
The results of the EDA indicate that Grey Schist (GS) contains AP and sulphur data that differs from samples in the surrounding rock types and, as a result, this lithology type has been segregated during the estimation of these items in the block model. NP does not differ across the GS domain and, as a result, it is not honoured during the estimation of NP in the model.
There are no indications that the talc domains or the weathered zone contain any distinct properties in the distribution of metals, ABA samples or density. These domains are ignored during the development of the block model.
| Trilogy Metals Inc. | 14-22 | |
| NI 43-101 Technical Report on the Arctic Project, | | |
| Northwest Alaska | | |
There are no distinct differences in the density of rocks, other than the MinZone domains, between lithologies, alteration types, talc domains or in the weathered zone. Model blocks in the overburden domain are assigned a default SG value of 2.1.
Table 14-5 lists the domains used to estimate the various items in the in the resource block model.
| Table 14-5 | Summary of Estimation Domains |
| Item | MinZone
Domain | Lithology
Domain |
| Copper | Hard | na |
| Lead | Hard | na |
| Zinc | Hard | na |
| Gold | Hard | na |
| Silver | Hard | na |
| AP | Hard | Hard GS
Only |
| NP | Hard | None |
| Sulphur | Hard | Hard GS
Only |
| SG | Hard | None |
Note: There are no estimates of Cu, Pb, Zn, Au or Ag outside of the MinZone domains.
In order to retain the banded nature of the distributions of items outside of the MinZone domains, the estimations of AP, NP, Sulphur and SG are made using the dynamic search orientations relative to the more prominent zones of mineralization. The areas outside of the MinZone domains have been combined into four separate trend groups; a lower group parallel MinZone 1, a middle group parallel to MinZone 3, an upper group parallel to MinZone 5 and a fourth group located above the Warm Springs fault.
| 14.6 | Treatment of Outlier Grades |
Measures have been taken to control the effects of potential outlier sample data for copper, lead, zinc, gold and silver. There is no need for changes in sulphur data, as several maximum values of 10% S in the database are a reflection of the upper detection limit of the ICP technique. There are no modifications to the AP, NP or SG data prior to estimation in the block model.
Histograms and probability plots were generated from 1 m composited sample data to show the distribution of metal in each estimation domain. These were used to identify the existence of anomalous outlier grades in the composite database. The physical locations of these potential outlier samples were reviewed in relation to the surrounding data and it was decided that their effects could be controlled through the use of outlier limitations. An outlier limitation approach limits samples above a defined threshold to a maximum distance of influence during grade estimates. With the majority of the drill holes at Arctic piercing the mineralization at 75 m spacing, samples above the outlier thresholds are limited to a maximum distance of influence of 40 m during block grade interpolation (approximately ½ the distance between drill holes). During the estimation of SG in areas outside of the MinZone domains, samples greater than 3.80 t/m3 are limited to a maximum distance of influence of 40 m.
| Trilogy Metals Inc. | 14-23 | |
| NI 43-101 Technical Report on the Arctic Project, | | |
| Northwest Alaska | | |
Table 14-6 summarizes the treatment of outlier sample data.
| Table 14-6 | Summary of Treatment of Outlier Sample Data |
| | Copper
% | Lead
% | Zinc
% | Gold
g/t | Silver
g/t |
MnZone
Domain | Max. | Outlier
Limit | Max. | Outlier
Limit | Max. | Outlier
Limit | Max. | Outlier
Limit | Max. | Outlier
Limit |
| 1 | 17.07 | 10 | 7.84 | 5 | 25.60 | 20 | 8.080 | 3 | 501.0 | 300 |
| 2 | 9.10 | 6 | 3.27 | 2 | 15.10 | 10 | 10.850 | 5 | 141.0 | 100 |
| 2.5 | 12.40 | 8 | 5.65 | 4 | 20.30 | 14 | 6.960 | 3.5 | 285.0 | 200 |
| 3 | 18.00 | 12 | 5.84 | 4 | 20.80 | 17 | 6.857 | 3 | 542.1 | 200 |
| 4 | 17.17 | 8 | 4.56 | 3 | 17.89 | 16 | 2.307 | 2 | 467.9 | 150 |
| 5 | 17.67 | 15 | 5.00 | 3.8 | 20.90 | 17 | 32.800 | 15 | 967.5 | 350 |
| 7 | 4.29 | 1.5 | 6.65 | 5 | 25.84 | 10 | 0.832 | 0.7 | 159.0 | 100 |
| 8 | 3.66 | 2.5 | 2.47 | 1.5 | 15.00 | 7 | 5.140 | 0.8 | 341.8 | 100 |
Samples above the Outlier Limit are restricted to maximum range of 40m during block grade interpolation.
The proportion of metal lost, calculated in model blocks in the combined Indicated and Inferred categories, is 3% copper, 5% lead, 4% zinc, 9% gold and 6% silver. The proportion of lost metal is a function of drill hole spacing and the nature of the underlying sample data – the more skewed distributions show higher losses, as seen in the gold model. The proportions of metal lost due to the treatment of outlier sample data are considered appropriate for a project with this level of delineation drilling.
| 14.7 | Specific Gravity Data |
Specific gravity (SG) measurements have been conducted on 3,023 samples in the database and range from a minimum of 2.43 to a maximum of 4.99 and average 3.08. Approximately 45% of the available SG data occurs inside the interpreted MinZone domains ranging from a minimum of 2.55 to a maximum of 4.99 and average 3.46. Outside of the MinZone domains, SG values range from a minimum of 2.43 to a maximum of 4.56 and average 2.78.
The base metal content and SG are moderately correlated. There is little variation in the SG values in the MinZone domains with coefficient-of-variation values that are typically less than 0.2. Outside of the MinZone domains, the coefficient of variation is 0.05.
| Trilogy Metals Inc. | 14-24 | |
| NI 43-101 Technical Report on the Arctic Project, | | |
| Northwest Alaska | | |
SG data is available in approximately 2/3 of the drill holes in the vicinity of the Arctic deposit. The distribution of SG samples varies between drill holes; about 1/3 of the holes have SG measurements for either every sample interval or on 10 m spaced intervals down the hole. The other 1/3 of the holes have SG measurements that are primarily restricted to the mineralized intervals.
The distribution of SG data is considered sufficient to support estimation in the resource model. The relatively low variability in the sample data indicates that SG values can be estimated into model blocks using inverse distance-squared moving averages. The MinZone domains are used as hard boundaries during the estimation of densities in the model and the trends planes are used to control the dynamic anisotropy during the estimation of SG values in the block model.
The degree of spatial variability and continuity in a mineral deposit depends on both the distance and direction between points of comparison. Typically, the variability between samples is proportionate to the distance between samples. If the variability is related to the direction of comparison, then the deposit is said to exhibit anisotropic tendencies which can be summarized by an ellipse fitted to the ranges in the different directions. The semi-variogram is a common function used to measure the spatial variability within a deposit.
The components of the variogram include the nugget, the sill, and the range. Often samples compared over very short distances (including samples from the same location) show some degree of variability. As a result, the curve of the variogram often begins at a point on the y-axis above the origin; this point is called the nugget. The nugget is a measure of not only the natural variability of the data over very short distances, but also a measure of the variability which can be introduced due to errors during sample collection, preparation, and assay.
Typically, the amount of variability between samples increases as the distance between the samples increase. Eventually, the degree of variability between samples reaches a constant or maximum value; this is called the sill, and the distance between samples at which this occurs is called the range.
The spatial evaluation of the data was conducted using a correlogram instead of the traditional variogram. The correlogram is normalized to the variance of the data and is less sensitive to outlier values; this generally gives cleaner results.
Many of the individual estimation domains do not contain sufficient sample data from which to generate reasonable correlograms. As a result, separate correlograms have been generated for samples inside MinZone domains 1, 3 and 5. The remaining MinZone domains (2, 2.5, 4, 7 and 8) utilize correlograms that have been generated using combined data from those five zones. Correlograms have been generated using 1 m composited drill hole data that has been top-cut to reduce the effects of rare anomalous high-grade composites.
| Trilogy Metals Inc. | 14-25 | |
| NI 43-101 Technical Report on the Arctic Project, | | |
| Northwest Alaska | | |
Correlograms were generated using the commercial software package SAGE2001 developed by Isaaks & Co. Correlograms were generated using elevations relative to the trend planes described in Section 14.3 of this report. This ensures that the local undulations of the typically banded mineralization are replicated in the block model. The correlograms are summarized in the tables below.
| Table 14-7 | Copper Correlogram Parameters |
MinZone
Domain | Nugget | S1 | S2 | 1st Structure | 2nd Structure |
Range
(m) | AZ | Dip | Range
(m) | AZ | Dip |
| 1 | 0.121 | 0.686 | 0.193 | 17 | 62 | 0 | 361 | 133 | 0 |
| Spherical | 4 | 332 | 0 | 220 | 43 | 0 |
| 4 | 90 | 90 | 8 | 90 | 90 |
| 3 | 0.300 | 0.504 | 0.196 | 20 | 22 | 0 | 3316 | 272 | 0 |
| Spherical | 8 | 112 | 0 | 135 | 2 | 0 |
| 6 | 90 | 90 | 6 | 90 | 90 |
| 5 | 0.140 | 0.352 | 0.509 | 272 | 50 | 0 | 97 | 67 | 0 |
| Spherical | 16 | 320 | 0 | 6 | 90 | 90 |
| 3 | 90 | 90 | 3 | 157 | 0 |
| 2, 2.5, 4, 7 & 8 | 0.033 | 0.800 | 0.167 | 30 | 67 | 0 | 449 | 85 | 0 |
| Spherical | 5 | 157 | 0 | 180 | 355 | 0 |
| 5 | 90 | 90 | 5 | 90 | 90 |
Note: Correlograms generated from 1 m composited sample data using elevations relative to trend plane of mineralization.
| Trilogy Metals Inc. | 14-26 | |
| NI 43-101 Technical Report on the Arctic Project, | | |
| Northwest Alaska | | |
| Table 14-8 | Lead Correlogram Parameters |
MinZone
Domain | Nugget | S1 | S2 | 1st Structure | 2nd Structure |
Range
(m) | AZ | Dip | Range
(m) | AZ | Dip |
| 1 | 0.141 | 0.737 | 0.121 | 96 | 26 | 0 | 2589 | 356 | 0 |
| Spherical | 16 | 116 | 0 | 138 | 86 | 0 |
| 5 | 90 | 90 | 6 | 90 | 90 |
| 3 | 0.275 | 0.393 | 0.332 | 10 | 90 | 90 | 405 | 66 | 0 |
| Spherical | 10 | 43 | 0 | 112 | 336 | 0 |
| 7 | 133 | 0 | 10 | 90 | 90 |
| 5 | 0.300 | 0.551 | 0.149 | 6 | 60 | 0 | 4159 | 44 | 0 |
| Spherical | 5 | 90 | 90 | 136 | 314 | 0 |
| 5 | 330 | 0 | 8 | 90 | 90 |
| 2, 2.5, 4, 7 & 8 | 0.107 | 0.597 | 0.296 | 11 | 67 | 0 | 803 | 54 | 0 |
| Spherical | 10 | 90 | 90 | 153 | 324 | 0 |
| 5 | 157 | 0 | 4 | 90 | 90 |
Note: Correlograms generated from 1 m composited sample data using elevations relative to trend plane of mineralization.
| Table 14-9 | Zinc Correlogram Parameters |
MinZone
Domain | Nugget | S1 | S2 | 1st Structure | 2nd Structure |
Range
(m) | AZ | Dip | Range
(m) | AZ | Dip |
| 1 | 0.102 | 0.737 | 0.162 | 40 | 346 | 0 | 461 | 339 | 0 |
| Spherical | 16 | 76 | 0 | 185 | 69 | 0 |
| 5 | 90 | 90 | 5 | 90 | 90 |
| 3 | 0.108 | 0.583 | 0.309 | 53 | 37 | 0 | 330 | 91 | 0 |
| Spherical | 8 | 127 | 0 | 195 | 1 | 0 |
| 5 | 90 | 90 | 10 | 90 | 90 |
| 5 | 0.020 | 0.869 | 0.111 | 14 | 62 | 0 | 5151 | 173 | 0 |
| Spherical | 8 | 332 | 0 | 246 | 83 | 0 |
| 3 | 90 | 90 | 8 | 90 | 90 |
| 2, 2.5, 4, 7 & 8 | 0.203 | 0.530 | 0.267 | 11 | 71 | 0 | 313 | 55 | 0 |
| Spherical | 11 | 90 | 90 | 225 | 145 | 0 |
| 5 | 341 | 0 | 3 | 90 | 90 |
Note: Correlograms generated from 1 m composited sample data using elevations relative to trend plane of mineralization.
| Trilogy Metals Inc. | 14-27 | |
| NI 43-101 Technical Report on the Arctic Project, | | |
| Northwest Alaska | | |
| Table 14-10 | Gold Correlogram Parameters |
MinZone
Domain | Nugget | S1 | S2 | 1st Structure | 2nd Structure |
Range
(m) | AZ | Dip | Range
(m) | AZ | Dip |
| 1 | 0.065 | 0.804 | 0.131 | 31 | 122 | 0 | 754 | 17 | 0 |
| Spherical | 7 | 32 | 0 | 116 | 107 | 0 |
| 5 | 90 | 90 | 8 | 90 | 90 |
| 3 | 0.072 | 0.502 | 0.426 | 58 | 47 | 0 | 348 | 26 | 0 |
| Spherical | 6 | 90 | 90 | 268 | 296 | 0 |
| 5 | 137 | 0 | 6 | 90 | 90 |
| 5 | 0.275 | 0.602 | 0.123 | 117 | 49 | 0 | 279 | 103 | 0 |
| Spherical | 5 | 90 | 90 | 58 | 13 | 0 |
| 3 | 319 | 0 | 5 | 90 | 90 |
| 2, 2.5, 4, 7 & 8 | 0.016 | 0.764 | 0.220 | 23 | 78 | 0 | 392 | 14 | 0 |
| Spherical | 4 | 90 | 90 | 279 | 104 | 0 |
| 3 | 168 | 0 | 5 | 90 | 90 |
Note: Correlograms generated from 1 m composited sample data using elevations relative to trend plane of mineralization.
| Table 14-11 | Silver Correlogram Parameters |
MinZone
Domain | Nugget | S1 | S2 | 1st Structure | 2nd Structure |
Range
(m) | AZ | Dip | Range
(m) | AZ | Dip |
| 1 | 0.194 | 0.647 | 0.159 | 65 | 358 | 0 | 364 | 122 | 0 |
| Spherical | 4 | 88 | 0 | 150 | 32 | 0 |
| 4 | 90 | 90 | 5 | 90 | 90 |
| 3 | 0.228 | 0.400 | 0.372 | 29 | 58 | 0 | 373 | 87 | 0 |
| Spherical | 12 | 90 | 90 | 183 | 357 | 0 |
| 5 | 148 | 0 | 10 | 90 | 90 |
| 5 | 0.176 | 0.468 | 0.356 | 155 | 46 | 0 | 120 | 79 | 0 |
| Spherical | 4 | 316 | 0 | 9 | 90 | 90 |
| 3 | 90 | 90 | 4 | 169 | 0 |
| 2, 2.5, 4, 7 & 8 | 0.011 | 0.774 | 0.214 | 31 | 76 | 0 | 338 | 67 | 0 |
| Spherical | 4 | 90 | 90 | 204 | 337 | 0 |
| 3 | 166 | 0 | 5 | 90 | 90 |
Note: Correlograms generated from 1 m composited sample data using elevations relative to trend plane of mineralization.
| Trilogy Metals Inc. | 14-28 | |
| NI 43-101 Technical Report on the Arctic Project, | | |
| Northwest Alaska | | |
Table 14-12 Sulphur Correlogram Parameters
Domain | Nugget | S1 | S2 | 1st Structure | 2nd Structure |
| Range (m) | AZ | Dip | Range (m) | AZ | Dip |
| MinZones | 0.200 | 0.689 | 0.111 | 177 | 13 | 0 | 6956 | 48 | 0 |
| Spherical | 19 | 103 | 0 | 808 | 318 | 0 |
| 15 | 90 | 90 | 15 | 90 | 90 |
| Grey Schist | 0.050 | 0.690 | 0.260 | 50 | 96 | 0 | 1360 | 62 | 0 |
| Spherical | 12 | 90 | 90 | 607 | 152 | 0 |
| 11 | 6 | 0 | 13 | 90 | 90 |
| LithGroup1 | 0.170 | 0.468 | 0.363 | 273 | 34 | 0 | 1060 | 41 | 0 |
| Spherical | 63 | 124 | 0 | 204 | 311 | 0 |
| 25 | 90 | 90 | 24 | 90 | 90 |
| LithGroup2 | 0.078 | 0.390 | 0.531 | 169 | 61 | 0 | 469 | 8 | 0 |
| Spherical | 60 | 151 | 0 | 347 | 98 | 0 |
| 10 | 90 | 90 | 12 | 90 | 90 |
| LithGroup3 | 0.082 | 0.627 | 0.291 | 68 | 58 | 0 | 7136 | 73 | 0 |
| Spherical | 22 | 90 | 90 | 694 | 343 | 0 |
| 17 | 328 | 0 | 22 | 90 | 90 |
| LithGroup4 | 0.154 | 0.539 | 0.308 | 135 | 38 | 0 | 561 | 115 | 0 |
| Spherical | 41 | 308 | 0 | 209 | 25 | 0 |
| 28 | 90 | 90 | 30 | 90 | 90 |
Note: Correlograms generated from 1 m composited sample data using elevations relative to trend plane of mineralization.
Table 14-13 AP Correlogram Parameters
Domain | Nugget | S1 | S2 | 1st Structure | 2nd Structure |
| Range (m) | AZ | Dip | Range (m) | AZ | Dip |
| MinZones | 0.083 | 0.210 | 0.706 | 168 | 81 | 0 | 182 | 78 | 0 |
| Spherical | 75 | 171 | 0 | 72 | 348 | 0 |
| 12 | 90 | 90 | 12 | 90 | 90 |
| Grey Schist | 0.045 | 0.591 | 0.363 | 66 | 320 | 0 | 13704 | 106 | 0 |
| Spherical | 21 | 90 | 90 | 640 | 16 | 0 |
| 19 | 50 | 0 | 20 | 90 | 90 |
| LithGroup1 | 0.079 | 0.387 | 0.535 | 57 | 66 | 0 | 3322 | 56 | 0 |
| Spherical | 14 | 156 | 0 | 169 | 326 | 0 |
| 9 | 90 | 90 | 11 | 90 | 90 |
| LithGroup2 | 0.027 | 0.592 | 0.381 | 61 | 325 | 0 | 546 | 52 | 0 |
| Spherical | 13 | 90 | 90 | 333 | 322 | 0 |
| 6 | 55 | 0 | 14 | 90 | 90 |
| LithGroup3 | 0.109 | 0.462 | 0.429 | 175 | 85 | 0 | 11311 | 95 | 0 |
| Spherical | 26 | 355 | 0 | 674 | 5 | 0 |
| 20 | 90 | 90 | 20 | 90 | 90 |
| LithGroup4 | 0.034 | 0.188 | 0.778 | 26 | 74 | 0 | 203 | 31 | 0 |
| Spherical | 26 | 90 | 90 | 53 | 121 | 0 |
| 6 | 344 | 0 | 26 | 90 | 90 |
Note: Correlograms generated from 1 m composited sample data using elevations relative to trend plane of mineralization.
| Trilogy Metals Inc. | 14-29 | |
| NI 43-101 Technical Report on the Arctic Project, | | |
| Northwest Alaska | | |
Table 14-14 NP Correlogram Parameters
Domain | Nugget | S1 | S2 | 1st Structure | 2nd Structure |
| Range (m) | AZ | Dip | Range (m) | AZ | Dip |
| MinZones | 0.123 | 0.074 | 0.802 | 44 | 340 | 0 | 231 | 46 | 0 |
| Spherical | 16 | 70 | 0 | 10 | 90 | 90 |
| 10 | 90 | 90 | 7 | 136 | 0 |
| LithGroup1 | 0.079 | 0.072 | 0.848 | 157 | 80 | 0 | 164 | 13 | 0 |
| Spherical | 26 | 350 | 0 | 31 | 103 | 0 |
| 12 | 90 | 90 | 12 | 90 | 90 |
| LithGroup2 | 0.036 | 0.562 | 0.402 | 136 | 86 | 0 | 93 | 354 | 0 |
| Spherical | 18 | 356 | 0 | 12 | 84 | 0 |
| 3 | 90 | 90 | 6 | 90 | 90 |
| LithGroup3 | 0.071 | 0.799 | 0.131 | 143 | 339 | 0 | 3630 | 43 | 0 |
| Spherical | 51 | 69 | 0 | 347 | 133 | 0 |
| 6 | 90 | 90 | 7 | 90 | 90 |
| LithGroup4 | 0.153 | 0.716 | 0.131 | 263 | 116 | 0 | 105 | 323 | 0 |
| Spherical | 37 | 26 | 0 | 30 | 53 | 0 |
| 14 | 90 | 90 | 15 | 90 | 90 |
Note: Correlograms generated from 1 m composited sample data using elevations relative to trend plane of mineralization.
| 14.9 | Model Setup and Limits |
A block model was initialized with the dimensions shown in Table 14-15. A nominal block size of 10 x 10 x 5 m is considered appropriate based on current drill hole spacing and relative to the planned scale of open pit extraction of this deposit. The limits of the block model are represented by the purple rectangles shown in the previous isometric views in Figure 14-1 and Figure 14-2.
| Trilogy Metals Inc. | 14-30 | |
| NI 43-101 Technical Report on the Arctic Project, | | |
| Northwest Alaska | | |
Table 14-15 Block Model Limits
| Direction | Minimum (m) | Maximum (m) | Block size (m) | Number of Blocks | |
| |
| X-axis (W-E) | 612190 | 614100 | 10 | 191 | |
| Y-axis (N-S) | 7452095 | 7454045 | 10 | 195 | |
| Elevation | 345 | 1250 | 5 | 181 | |
Using the domain wireframes, blocks in the model are assigned MinZone domain code values and the percentage of the block inside the MinZone domain is also stored – this is used to determine the proportion of in-situ resources. Blocks are defined as “overburden” if a majority (>50%) of the block occurs within the overburden domain. Similarly, blocks are defined in the Grey Schist domain on a majority basis.
| 14.10 | Interpolation Parameters |
Grade estimates are made in model blocks using ordinary kriging (OK). The OK models were evaluated using a series of validation approaches as described in Section 10.0 of this report. The interpolation parameters have been adjusted until the appropriate results were achieved. In general, the OK models have been generated using a relatively limited number of composited sample data. This approach reduces the amount of smoothing (also known as averaging) in the model and, while there may be some uncertainty on a localized scale, this approach produces reliable estimates of the potentially recoverable grade and tonnage for the overall deposit.
Interpolation parameters for the various items included in the resource block model are summarized in Table 14-16 through Table 14-23. Estimates for copper, lead, zinc, gold and silver are made only inside the MinZone domains as there is essentially no metals present (zero grade) in the surrounding rocks. All estimates are made using length weighted composites and model blocks are discretized into 4x4x2 points (LxWxH). Estimations for all items in the model utilize a dynamic search strategy where search orientations are designed to follow mineralization trend surfaces.
| Trilogy Metals Inc. | 14-31 | |
| NI 43-101 Technical Report on the Arctic Project, | | |
| Northwest Alaska | | |
Table 14-16 Interpolation Parameters for Copper
MinZone Domain | Search Ellipse Range (m) | Number of Composites (1 m) | Other |
| X | Y | Z(1) | Min/block | Max/block | Max/hole |
| 1, 2, 2.5, 3, 4, 5 | 200 | 200 | 4 | 3 | 21 | 7 | 1DH per Octant |
| 7 & 8 | 200 | 200 | 10 | 2 | 21 | 7 | 1DH per Octant |
(1) Vertical range relative to distances from trend plane of mineralization.
Table 14-17 Interpolation Parameters for Lead
MinZone Domain | Search Ellipse Range (m) | Number of Composites (1 m) | Other |
| X | Y | Z(1) | Min/block | Max/block | Max/hole |
| 1 | 200 | 200 | 4 | 3 | 18 | 6 | 1DH per Octant |
| 2, 2.5, 4 | 200 | 200 | 4 | 3 | 21 | 7 | 1DH per Octant |
| 3 | 200 | 200 | 4 | 3 | 28 | 7 | 1DH per Octant |
| 5 | 200 | 200 | 4 | 3 | 24 | 8 | 1DH per Octant |
| 7 & 8 | 200 | 200 | 10 | 2 | 21 | 7 | 1DH per Octant |
(1) Vertical range relative to distances from trend plane of mineralization.
Table 14-18 Interpolation Parameters for Zinc
MinZone Domain | Search Ellipse Range (m) | Number of Composites (1 m) | Other |
| X | Y | Z(1) | Min/block | Max/block | Max/hole |
| 1, 2, 2.5, 3, 4, 5 | 200 | 200 | 4 | 3 | 21 | 7 | 1DH per Octant |
| 7 & 8 | 200 | 200 | 10 | 2 | 21 | 7 | 1DH per Octant |
(1) Vertical range relative to distances from trend plane of mineralization.
| Trilogy Metals Inc. | 14-32 | |
| NI 43-101 Technical Report on the Arctic Project, | | |
| Northwest Alaska | | |
Table 14-19 Interpolation Parameters for Gold
MinZone Domain | Search Ellipse Range (m) | Number of Composites (1 m) | Other |
| X | Y | Z(1) | Min/block | Max/block | Max/hole |
| 1, 2, 2.5, 4, 5 | 200 | 200 | 4 | 3 | 21 | 7 | 1DH per Octant |
| 3 | 200 | 200 | 4 | 3 | 28 | 7 | 1DH per Octant |
| 7 & 8 | 200 | 200 | 10 | 2 | 21 | 7 | 1DH per Octant |
(1) Vertical range relative to distances from trend plane of mineralization.
Table 14-20 Interpolation Parameters for Silver
MinZone Domain | Search Ellipse Range (m) | Number of Composites (1 m) | Other |
| X | Y | Z(1) | Min/block | Max/block | Max/hole |
| 1, 2.5, 5 | 200 | 200 | 4 | 3 | 21 | 7 | 1DH per Octant |
| 2, 3, 4 | 200 | 200 | 4 | 3 | 24 | 7 | 1DH per Octant |
| 7 & 8 | 200 | 200 | 10 | 2 | 21 | 7 | 1DH per Octant |
(1) Vertical range relative to distances from trend plane of mineralization.
Separate estimates for sulphur, AP, NP and SG are made for model blocks that are wholly or partially inside the MinZone domains and for blocks that are outside of the MinZone domains. Following estimation, final “whole block” values are calculated using the two estimated values and the proportion of the block inside and outside of the MinZone domains.
Table 14-21 Interpolation Parameters for Sulphur
| Domain | Search Ellipse Range (m) | Number of Composites (1 m) | Other |
| X | Y | Z(1) | Min/block | Max/block | Max/hole |
| MinZones | 300 | 300 | 4 | 1 | 15 | 5 | 1DH per Octant |
| Grey Schist | 500 | 500 | 7 | 1 | 15 | 5 | 1DH per Octant |
| LithGroup1-4 | 500 | 500 | 7 | 1 | 15 | 5 | 1DH per Octant |
(1) Vertical range relative to distances from trend plane of mineralization.
| Trilogy Metals Inc. | 14-33 | |
| NI 43-101 Technical Report on the Arctic Project, | | |
| Northwest Alaska | | |
Table 14-22 Interpolation Parameters for AP
| Domain | Search Ellipse Range (m) | Number of Composites (1 m) | Other |
| X | Y | Z(1) | Min/block | Max/block | Max/hole |
| MinZones | 500 | 500 | 5 | 1 | 15 | 5 | 1DH per Octant |
| Grey Schist | 500 | 500 | 7 | 1 | 15 | 5 | 1DH per Octant |
| LithGroup1-4 | 500 | 500 | 7 | 1 | 15 | 5 | 1DH per Octant |
(1) Vertical range relative to distances from trend plane of mineralization.
Table 14-23 Interpolation Parameters for NP
| Domain | Search Ellipse Range (m) | Number of Composites (1 m) | Other |
| X | Y | Z(1) | Min/block | Max/block | Max/hole |
| MinZones | 500 | 500 | 5 | 1 | 15 | 5 | 1DH per Octant |
| LithGroup1-4 | 500 | 500 | 7 | 1 | 15 | 5 | 1DH per Octant |
(1) Vertical range relative to distances from trend plane of mineralization.
Block estimates of specific gravity are done using the inverse distance (ID2) interpolation method. The parameters are listed in Table 14-24. During interpolation outside of the MinZone domains, anomalous high SG values exceeding 3.80 are restricted to a maximum distance of influence of 40 m. As stated previously, separate SG estimates are made representing areas inside the MinZone domains and for the surrounding unmineralized rocks. The final “whole block” densities are calculated using the two SG estimates and the proportion of blocks inside vs. outside of the MinZone domains.
Table 14-24 Interpolation Parameters for Specific Gravity (SG)
| Domain | Search Ellipse Range (m) | Number of Composites (1 m) | Other |
| X | Y | Z(1) | Min/block | Max/block | Max/hole |
| MinZones | 300 | 300 | 5 | 2 | 15 | 5 | |
| LithGroup1-4 | 500 | 500 | 5 | 2 | 15 | 5 | |
| LithGroup1-4 | 500 | 500 | 7 | 1 | 15 | 5 | 1DH per Octant |
(1) Vertical range relative to distances from trend plane of mineralization.
| Trilogy Metals Inc. | 14-34 | |
| NI 43-101 Technical Report on the Arctic Project, | | |
| Northwest Alaska | | |
| 14.11 | Block Model Validation |
The block models were validated using several methods: a thorough visual review of the model grades in relation to the underlying drill hole sample grades; comparisons with the change of support model; comparisons with other estimation methods; and, grade distribution comparisons using swath plots.
A detailed visual inspection of the block model was conducted in both section and plan to compare estimated grades against underlying sample data. This included confirmation of the proper coding of blocks within the respective domains. Examples of the distribution of copper grades in the block model are shown in cross section in Figure 14-21 and Figure 14-22.
Figure 14-21 North-South Vertical Section of Copper Estimates in the Block Model (Section 613250E)

| Trilogy Metals Inc. | 14-35 | |
| NI 43-101 Technical Report on the Arctic Project, | | |
| Northwest Alaska | | |
Figure 14-22 West-East Vertical Section of Copper Estimates in the Block Model (Section 7453000N)
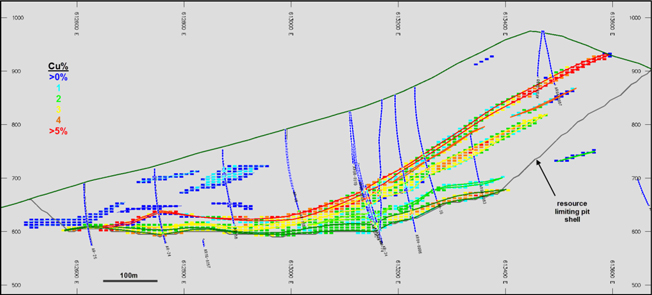
| 14.11.2 | Model Checks for Change of Support |
The relative degree of smoothing in the block estimates was evaluated using the Hermitian Polynomial Change of Support (Herco) method, also known as the Discrete Gaussian Correction (Journel and Huijbregts, 1978). With this method, the distribution of the hypothetical block grades can be directly compared to the estimated ordinary kriging model through the use of pseudo-grade/tonnage curves. Adjustments are made to the block model interpolation parameters until an acceptable match is made with the Herco distribution. In general, the estimated model should be slightly higher in tonnage and slightly lower in grade when compared to the Herco distribution at the projected cut-off grade. These differences account for selectivity and other potential ore-handling issues which commonly occur during mining.
The Herco distribution is derived from the declustered composite grades which have been adjusted to account for the change in support moving from smaller drill hole composite samples to the larger blocks in the model. The transformation results in a less skewed distribution, but with the same mean as the original declustered samples.
Examples of Herco plots calculated for the distributions of metal in the three main MinZone domains, 1, 3 and 5, are shown in the figures below. Note that these Change of Support calculations have been made for individual metals. Ore-waste selection will likely be made based on the net smelter return (NSR) using all five metals. Therefore, the change of support calculations for the individual metals only serve as approximations for the distribution of NSR values above cut-off values.
| Trilogy Metals Inc. | 14-36 | |
| NI 43-101 Technical Report on the Arctic Project, | | |
| Northwest Alaska | | |
Figure 14-23 Herco and Model Grade / Tonnage Plots for Copper in MinZone Domains 1, 3 and 5

Figure 14-24 Herco and Model Grade / Tonnage Plots for Lead in MinZone Domains 1, 3 and 5

Figure 14-25 Herco and Model Grade / Tonnage Plots for Zinc in MinZone Domains 1, 3 and 5
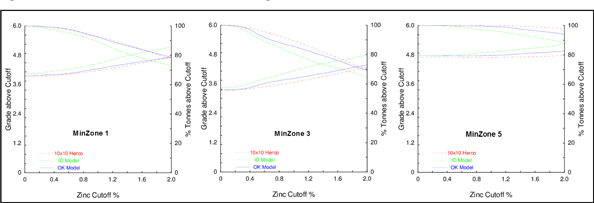
| Trilogy Metals Inc. | 14-37 | |
| NI 43-101 Technical Report on the Arctic Project, | | |
| Northwest Alaska | | |
Figure 14-26 Herco and Model Grade / Tonnage Plots for Gold in MinZone Domains 1, 3 and 5
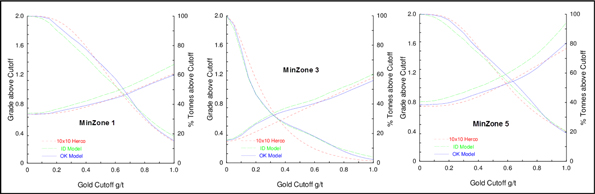
Figure 14-27 Herco and Model Grade / Tonnage Plots for Silver in MinZone Domains 1, 3 and 5
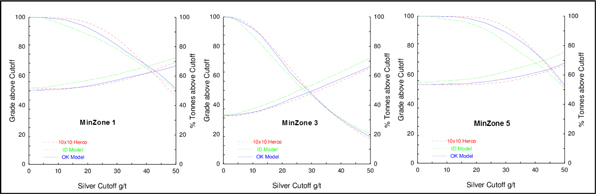
Overall, the desired degree of correspondence between estimation models and change of support models has been achieved. It should be noted that the change of support model is a theoretical tool intended to direct model estimation. There is uncertainty associated with the change of support model, and its results should not be viewed as a final or correct value.
| 14.11.3 | Comparison of Interpolation Methods |
For comparison purposes, additional grade models were generated using the inverse distance weighted (ID) and nearest neighbour (NN) interpolation methods. The NN model was created using data composited to 5 m lengths to ensure all sample data are used in the model. The results of these models are compared to the ordinary kriging (OK) models at various cut-off grades using a grade/tonnage graph. The examples below show comparison of models in the three main MinZone domains (combined 1, 3 and 5).
There is good correlation between model types. The correspondence among the grade tonnage curves is typical for the interpolation methods being compared. The NN interpolation always has the higher grade and lower tonnage. It is an estimate that should produce a value close to the correct global mean at a zero cut-off grade. The NN grades and tonnages above cut-off are correct under the assumption that perfect selection of material above and below the cut-off can be executed at the scale of the composite samples. It is included to show the results of the averaging that takes place in the other two methods. The ordinary kriging curves show the lowest grades and highest tonnages. The correct amount of averaging for the chosen block size is ensured for the ordinary kriging by the change of support calculation described in the preceding section.
| Trilogy Metals Inc. | 14-38 | |
| NI 43-101 Technical Report on the Arctic Project, | | |
| Northwest Alaska | | |
Figure 14-28 Comparison of Copper Model Types in MinZone Domains 1, 3 and 5

Figure 14-29 Comparison of Lead Model Types in MinZone Domains 1, 3 and 5
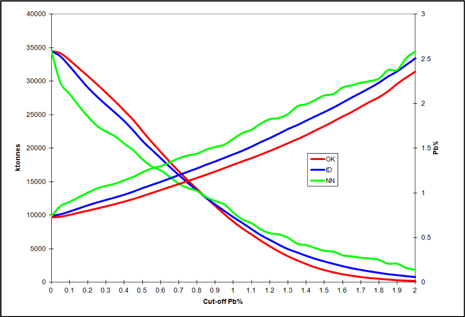
| Trilogy Metals Inc. | 14-39 | |
| NI 43-101 Technical Report on the Arctic Project, | | |
| Northwest Alaska | | |
Figure 14-30 Comparison of Zinc Model Types in MinZone Domains 1, 3 and 5
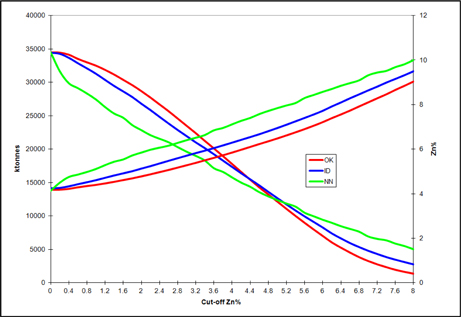
Figure 14-31 Comparison of Gold Model Types in MinZone Domains 1, 3 and 5
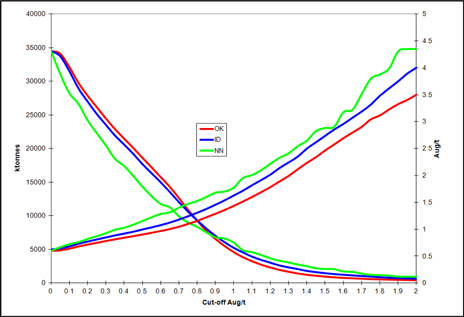
| Trilogy Metals Inc. | 14-40 | |
| NI 43-101 Technical Report on the Arctic Project, | | |
| Northwest Alaska | | |
Figure 14-32 Comparison of Silver Model Types in MinZone Domains 1, 3 and 5

| 14.11.4 | Swath Plots (Drift Analysis) |
A swath plot is a graphical display of the grade distribution derived from a series of bands, or swaths, generated in several directions throughout the deposit. Using the swath plot, grade variations from the ordinary kriging model are compared to the distribution derived from the declustered nearest neighbour grade model.
On a local scale, the nearest neighbour model does not provide reliable estimations of grade, but, on a much larger scale, it represents an unbiased estimation of the grade distribution based on the underlying data. Therefore, if the ordinary kriging model is unbiased, the grade trends may show local fluctuations on a swath plot, but the overall trend should be similar to the nearest neighbour distribution of grade.
Swath plots were generated in three orthogonal directions that compare the ordinary kriging and nearest neighbour estimates for all items included in the resource block model.
For validation of the five metals in the model, swath plots have been made for each individual MinZone domain and also a series of swaths from the three main domains (combined 1+3+5), as these contain the vast majority of the resources at Arctic. Examples for the five metals in the deposit are shown in Figure 14-33 through Figure 14-37.
There is good correspondence between the models in most areas. The degree of smoothing in the OK model is evident in the peaks and valleys shown in the swath plots. Areas where there are large differences between the models tend to be the result of “edge” effects, where there is less available data to support a comparison. Note that the majority of the resource occurs between 7452750N and 7453450N. The validation results indicate that the OK model is a reasonable reflection of the underlying sample data.
| Trilogy Metals Inc. | 14-41 | |
| NI 43-101 Technical Report on the Arctic Project, | | |
| Northwest Alaska | | |
Figure 14-33 Swath Plot of Copper in MinZone Domains 1, 3 and 5

Figure 14-34 Swath Plot of Lead in MinZone Domains 1, 3 and 5
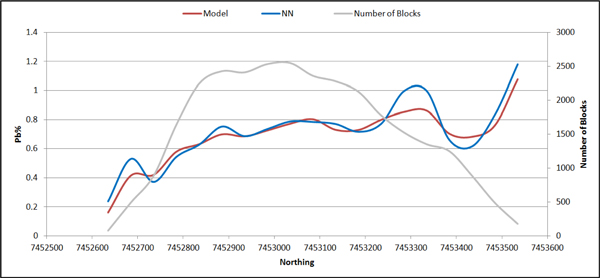
| Trilogy Metals Inc. | 14-42 | |
| NI 43-101 Technical Report on the Arctic Project, | | |
| Northwest Alaska | | |
Figure 14-35 Swath Plot of Zinc in MinZone Domains 1, 3 and 5
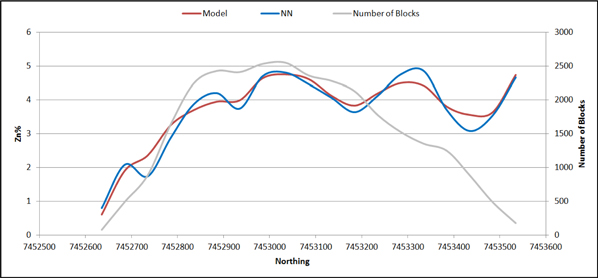
Figure 14-36 Swath Plot of Gold in MinZone Domains 1, 3 and 5
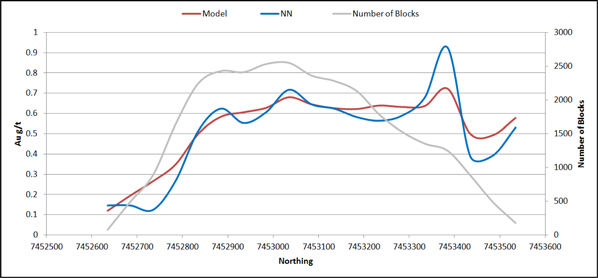
| Trilogy Metals Inc. | 14-43 | |
| NI 43-101 Technical Report on the Arctic Project, | | |
| Northwest Alaska | | |
Figure 14-37 Swath Plot of Silver in MinZone Domains 1, 3 and 5
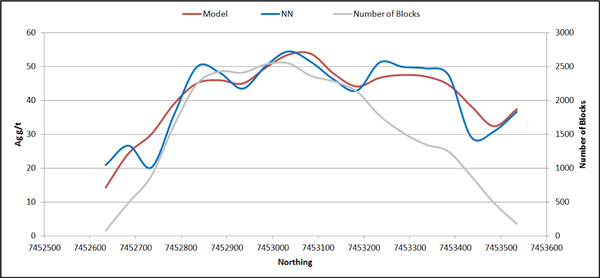
The swaths plots presented in Figure 14-38 through Figure 14-40 show the ABA items in the rocks that surround the MinZone domains.
Figure 14-38 Swath Plot of AP in Rocks Outside of the MinZone Domains
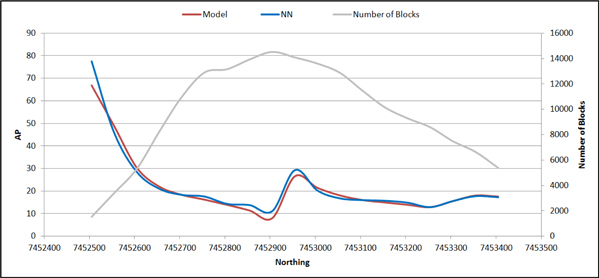
| Trilogy Metals Inc. | 14-44 | |
| NI 43-101 Technical Report on the Arctic Project, | | |
| Northwest Alaska | | |
Figure 14-39 Swath Plot of NP in Rocks Outside of the MinZone Domains

Figure 14-40 Swath Plot of Sulphur Rocks Outside of the MinZone Domains
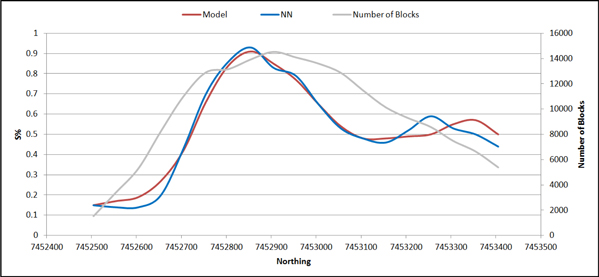
| 14.12 | Resource Classification |
The mineral resources were classified in accordance with the CIM Definition Standards for Mineral Resources and Mineral Reserves (May 2014). The classification parameters are defined relative to the distance between sample data and are intended to encompass zones of reasonably continuous mineralization that exhibit the desired degree of confidence in the estimate.
| Trilogy Metals Inc. | 14-45 | |
| NI 43-101 Technical Report on the Arctic Project, | | |
| Northwest Alaska | | |
Classification parameters are generally linked to the scale of a deposit: a large and relatively low-grade porphyry-type deposit would likely be mined at a much higher daily rate than a narrow, high-grade deposit. The scale of selectivity of these two examples differs significantly and this is reflected in the drill-hole spacing required to achieve the desired level of confidence to define a volume of material that represents, for example, a year of production. Based on engineering studies completed to date, the Arctic deposit would likely be amenable to open pit extraction methods at a production rate of approximately 10,000 tonnes per day. A drill hole spacing study, which tests the reliability of estimates for a given volume of material at varying drill hole spacing, suggests that drilling on a nominal 100 m grid pattern would provide annual estimates of volume (tonnage) and grade within ±15% accuracy, 90% of the time. These results were combined with grade and indicator variograms and other visual observations of the nature of the deposit in defining the criteria for mineral resource classification as described below. At this stage of exploration, there is insufficient density of drilling information to support the definition of mineral resources in the Measured category.
The following classification criteria are defined for the Arctic deposit:
| · | Indicated Mineral Resources includes blocks in the model with grades estimated by three or more drill holes spaced at a maximum distance of 100 m, and exhibit a relatively high degree of confidence in the grade and continuity of mineralization. |
| · | Inferred Mineral Resources require a minimum of one drill hole within a maximum distance of 150 m and exhibit reasonable confidence in the grade and continuity of mineralization. |
Some manual “smoothing” of the criteria for Indicated resources was conducted that includes areas where the drill hole spacing locally exceeds the desired grid spacing, but still retains continuity of mineralization or, conversely, excludes areas where the mineralization does not exhibit the required degree of confidence.
| 14.13 | Mineral Resource Estimate |
CIM Definition Standards for Mineral Resources and Mineral Reserves (May 2014) defines a mineral resource as:
“A mineral resource is a concentration or occurrence of solid material of economic interest in or on the Earth’s crust in such form, grade or quality and quantity that there are reasonable prospects for eventual economic extraction. The location, quantity, grade or quality, continuity and other geological characteristics of a mineral resource are known, estimated or interpreted from specific geological evidence and knowledge, including sampling”.
The “reasonable prospects for eventual economic extraction” requirement generally implies that quantity and grade estimates meet certain economic thresholds and that mineral resources are reported at an appropriate cut-off grade which takes into account the extraction scenarios and the processing recovery.
| Trilogy Metals Inc. | 14-46 | |
| NI 43-101 Technical Report on the Arctic Project, | | |
| Northwest Alaska | | |
The Arctic deposit comprises several zones of relatively continuous moderate- to high-grade polymetallic mineralization that extends from surface to depths of over 250 m below surface. The deposit is potentially amenable to open pit extraction methods. The “reasonable prospects for eventual economic extraction” was tested using a floating cone pit shell derived based on a series of technical and economic assumptions considered appropriate for a deposit of this type, scale and location. These parameters are summarized in Table 14-25.
Table 14-25 Parameters Used to Generate a Resource-Limiting Pit Shell
| Optimization Parameters |
| Open Pit Mining Cost | US$3/tonne |
| Milling Cost + G&A | US$35/tonne |
| Pit Slope | 43 degrees |
| Copper Price | US$3.00/lb |
| Lead Price | US$0.90/lb |
| Zinc Price | US$1.00/lb |
| Gold Price | US$1300/oz |
| Silver Price | US$18/oz |
| Metallurgical Recovery: Copper | 92% |
| Lead | 77% |
| Zinc | 88% |
| Gold | 63% |
| Silver | 56% |
Note: No adjustments for mining recovery or dilution.
The pit shell has been generated about copper equivalent grades that incorporate contributions of the five different metals present in the deposit. The formula used to calculate copper equivalent grades is listed as follows:
CuEq%= (Cu% x 0.92) +(Zn% x 0.290)+(Pb% x 0.231)+(Augpt x 0.398)+(Aggpt x 0.005)
It is important to recognize that discussions regarding these surface mining parameters are used solely for the purpose of testing the “reasonable prospects for eventual economic extraction,” and do not represent an attempt to estimate mineral reserves. These preliminary evaluations are used to assist with the preparation of a Mineral Resource Statement and to select appropriate reporting assumptions.
Using the parameters defined above, a pit shell was generated about the Arctic deposit that extends to depths approaching 300 m below surface. Table 14-26 lists the estimate of mineral resources contained within the pit shell. Based on the technical and economic factors listed in Table 14-25, a base case cut-off grade of 0.50% CuEq is considered appropriate for this deposit. The distribution of mineral resources is shown in Figure 14-41 in a series of isometric views.
| Trilogy Metals Inc. | 14-47 | |
| NI 43-101 Technical Report on the Arctic Project, | | |
| Northwest Alaska | | |
There are no known factors related to environmental, permitting, legal, title, taxation, socio-economic, marketing, or political issues which could materially affect the mineral resource. It is expected that a majority of Inferred resources will be converted to Indicated or Measured resources with additional exploration.
Table 14-26 Mineral Resource Estimate for the Arctic Project
| | | Average Grade: | Contained metal: |
| Class | M tonnes | Cu % | Pb% | Zn% | Au g/t | Ag g/t | Cu Mlbs | Pb Mlbs | Zn Mlbs | Au koz | Ag Moz |
| Indicated | 36.0 | 3.07 | 0.73 | 4.23 | 0.63 | 47.6 | 2441 | 581 | 3356 | 728 | 55 |
| Inferred | 3.5 | 1.71 | 0.60 | 2.72 | 0.36 | 28.7 | 131 | 47 | 210 | 40 | 3 |
| (1) | (1)Resources stated as contained within a pit shell developed using metal prices of US$3.00/lb Cu, $0.90/lb Pb, $1.00/lb Zn, $1300/oz Au and $18/oz Ag and metallurgical recoveries of 92% Cu, 77% Pb, 88% Zn, 63% Au and 56% Ag and operating costs of $3/t mining and $35/t process and G&A. The average pit slope is 43 degrees. |
| (2) | The base case cut-off grade is 0.5% copper equivalent. CuEq = (Cu%x0.92)+(Zn%x0.290)+(Pb%x0.231)+(Augptx0.398)+(Aggptx0.005).. |
| (3) | Mineral Resources are not Mineral Reserves and do not have demonstrated economic viability. There is no certainty that all or any part of the Mineral Resources will be converted into Mineral Reserves. |
| (4) | Inferred resources have a great amount of uncertainty as to whether they can be mined legally or economically. It is reasonably expected that a majority of Inferred resources will be converted to Indicated resources with additional exploration. |
| Trilogy Metals Inc. | 14-48 | |
| NI 43-101 Technical Report on the Arctic Project, | | |
| Northwest Alaska | | |
Figure 14-41 Isometric Views of Arctic Mineral Resource
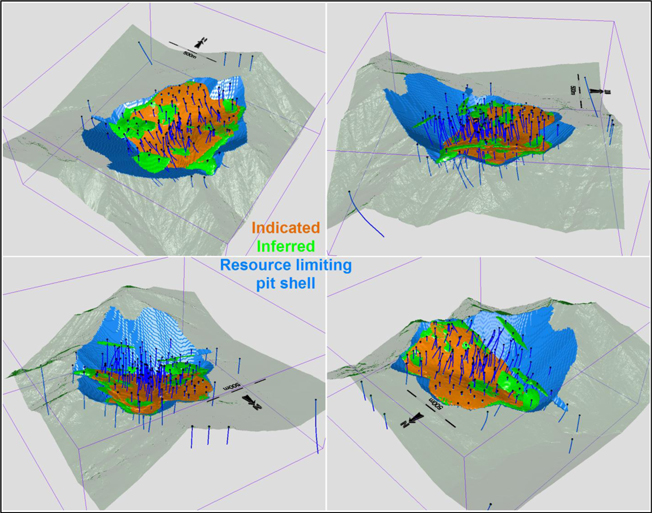
| 14.14 | Grade Sensitivity Analysis |
The sensitivity of mineral resources, contained within the resource limiting pit shell, is demonstrated by listing resources at a series of cut-off thresholds as shown in Table 14-27. The base case cut-off grade of 0.5%CuEq is highlighted in the table.
| Trilogy Metals Inc. | 14-49 | |
| NI 43-101 Technical Report on the Arctic Project, | | |
| Northwest Alaska | | |
Table 14-27 Sensitivity of Mineral Resource to Cut-off Grade
| | | Average Grade: | Contained metal: |
Cut-off CuEq% | M tonnes | Cu % | Pb% | Zn% | Au g/t | Ag g/t | Cu Mlbs | Pb Mlbs | Zn Mlbs | Au koz | Ag Moz |
| Indicated |
| 0.25 | 36.0 | 3.07 | 0.73 | 4.22 | 0.63 | 47.61 | 2,441 | 582 | 3,356 | 729 | 55 |
| 0.5 | 36.0 | 3.07 | 0.73 | 4.23 | 0.63 | 47.62 | 2,441 | 581 | 3,356 | 728 | 55 |
| 0.75 | 35.9 | 3.08 | 0.73 | 4.23 | 0.63 | 47.72 | 2,440 | 582 | 3,355 | 728 | 55 |
| 1 | 35.7 | 3.09 | 0.74 | 4.26 | 0.63 | 47.97 | 2,436 | 581 | 3,353 | 728 | 55 |
| 1.5 | 35.5 | 3.11 | 0.74 | 4.28 | 0.64 | 48.22 | 2,432 | 580 | 3,349 | 727 | 55 |
| Inferred |
| 0.25 | 3.8 | 1.58 | 0.56 | 2.52 | 0.34 | 26.76 | 133 | 47 | 212 | 42 | 3 |
| 0.5 | 3.5 | 1.71 | 0.60 | 2.72 | 0.36 | 28.69 | 131 | 47 | 210 | 40 | 3 |
| 0.75 | 3.0 | 1.93 | 0.65 | 3.04 | 0.36 | 31.99 | 129 | 44 | 203 | 35 | 3 |
| 1 | 2.5 | 2.29 | 0.73 | 3.52 | 0.37 | 37.04 | 124 | 39 | 192 | 29 | 3 |
| 1.5 | 2.3 | 2.46 | 0.76 | 3.71 | 0.39 | 39.32 | 122 | 38 | 184 | 28 | 3 |
| 14.15 | Comparison with the Previous Estimate of Mineral Resources |
The previous estimate of mineral resources for the Arctic deposit was produced by Tetra Tech with an effective date of September 12, 2013. Comparison between the new and previous estimates is presented in Table 14-28.
Table 14-28 Comparison with the Previous Estimate of Mineral Resources
| | | Average Grade: | Contained metal: |
| Resource | M tonnes | Cu % | Pb% | Zn% | Au g/t | Ag g/t | Cu Mlbs | Pb Mlbs | Zn Mlbs | Au koz | Ag Moz |
| Indicated |
| April2017 | 36.0 | 3.07 | 0.73 | 4.23 | 0.63 | 47.6 | 2,441 | 581 | 3,356 | 728 | 55 |
| September2013 | 23.8 | 3.26 | 0.76 | 4.45 | 0.71 | 53.2 | 1,713 | 401 | 2,338 | 550 | 41 |
| Inferred |
| April2017 | 3.5 | 1.71 | 0.60 | 2.72 | 0.36 | 28.69 | 131 | 47 | 210 | 40 | 3 |
| September2013 | 3.4 | 3.22 | 0.58 | 3.84 | 0.59 | 41.5 | 239 | 43 | 285 | 60 | 5 |
| Trilogy Metals Inc. | 14-50 | |
| NI 43-101 Technical Report on the Arctic Project, | | |
| Northwest Alaska | | |
Compared to the previous estimate, there is a 51% increase in Indicated tonnes with a corresponding decrease in average grade for most metals resulting in a 42% increase in contained copper metal. The differences between the estimates are summarized below:
| · | New drilling data added since 2013 has upgraded the majority of previous Inferred to Indicated within the pit shell. |
| · | New drilling has identified additional resources by providing a better understanding of the shape and location of mineralization in the deposit. |
| · | Interpretation of mineralized domains; In 2013, these domains were based on the interpretation of massive sulphide (MS: >50% sulphides) and semi-massive sulphide (SMS: 30-50% sulphides) domains. The 2017 interpretation of Minzone domains is based on grade zones >0.75%CuEq. The 2017 approach captures more (and essentially all) of the mineralization present in the deposit in the MinZone domains. The 2013 approach excludes some lower grade mineralization from the interpreted domains (<30% sulphides remains outside of interpreted domains). These changes result in higher tonnage but lower overall average grade of resources. |
| · | More stringent criteria are used to classify resources in the new resource. In 2013, Tetra Tech used 150 m spaced drilling for Indicated resources and a maximum distance of 200 m from drilling for Inferred class resources. In the QP’s opinion, these distances are not supported by the underlying sample data and, as a result, the ranges are reduced to 100 m spaced drilling for Indicated resources and a maximum distance of 150 m from drilling for Inferred class resources. |
| · | The generation of the 2017 resource limiting pit shell excludes deductions for off-site process costs such as smelting, transport, insurance, losses, etc. (these are presently unknown and should not be applied to resource estimates). The projected operating costs and metal prices used to generate the resource limiting pit shell have been updated for 2017 but these are not that different from 2013. |
| · | 2017 interpolation uses dynamic anisotropy that retains better continuity of mineralization within the MinZone domains. The resulting variograms show better continuity and longer ranges compared to those produced in 2013. |
| · | Resources are tabulated based on CuEq cut-off in 2017 vs. NSR in 2013. There is likely little overall difference between these two approaches. However, this change was made because it is felt that the previous NSR approach is considered too detailed for the estimation of mineral resources. |
| Trilogy Metals Inc. | 14-51 | |
| NI 43-101 Technical Report on the Arctic Project, | | |
| Northwest Alaska | | |
| 15.0 | Mineral Reserve Estimates |
There are presently no mineral reserves at the Arctic Project.
| Trilogy Metals Inc. | 15-1 | |
| NI 43-101 Technical Report on the Arctic Project, | | |
| Northwest Alaska | | |
There are no current mining methods for the Arctic Project.
| Trilogy Metals Inc. | 16-1 | |
| NI 43-101 Technical Report on the Arctic Project, | | |
| Northwest Alaska | | |
There are no current recovery methods for the Arctic Project.
| Trilogy Metals Inc. | 17-1 | |
| NI 43-101 Technical Report on the Arctic Project, | | |
| Northwest Alaska | | |
| 18.0 | Project InfrastrUcture |
Although all projects in the Ambler mining district are at the exploration or early development stage, including Trilogy Metals’ Arctic Project, Trilogy Metals and NANA are supporting the State of Alaska's efforts to develop infrastructure into the region, specifically AMDIAP, under the ‘Alaska Roads to Resources’ program. Between 2009 and 2012, the State of Alaska funded over $10 million to study access to the Ambler mining district. During that period, a working group consisting of ADOT, the Governor’s office, AIDEA, NANA, and Trilogy Metals was developed to advance what was previously called the Ambler Mining District Industrial Access Road or AMDIAR. An additional $8.5 million was funded by the Alaskan government for permitting activities during the 2013/2014 fiscal year.
Efforts from 2009 to 2011 focused on identifying optimal access routes and, after input from local communities and a review of a series of options, the Brooks East Access Route was chosen for further assessment. In 2012, the Alaska State Legislature approved an additional $4 million to allow the ADOT to initiate environmental baseline studies on the Brooks East Access Route connecting the Ambler mining district with the Dalton Highway 322 km to the east. In mid-2012 Governor Parnell transferred authority and responsibility for AMDIAR to the Alaska Industrial Development Export Authority (AIDEA) as it was felt to better fit a Public-Private-Partnership model similar to what AIDEA had financed the Red Dog Road and Port (Delong Mountain Transportation System). During 2012 through 215 AIDEA engaged DOWL Engineering to conduct field studies and environmental baseline studies to support development of a project description document for AMDIAR (later changed to AMDIAP; where “Project” replaced “Route” in the acronym). AIDEA, the project proponent, finalized the proposed action and identified the relevant key federal agency for impact analysis and determine the state and federal cooperating agencies to assure permit coordination. In addition, initial meetings between all of the permitting and licensing agencies and initial community engagement meetings were held throughout time period. On October 21, 2015 the Governor of the State of Alaska authorized AIDEA to begin the EIS process. In 2015 AIDEA completed a Consolidated Right-of-Way Application (form SF-299) to the relevant federal permitting agencies, including: The National Park Service (NPS); the US Army Corps of Engineers (ACE) the Bureau of Land Management (BLM). The Consolidated Right-of-Way Application (SF-299) application was reviewed and deemed Complete and Compliant by the National Park Service, the Army Corps of Engineers and the BLM in August 2016. In Feb, 2017 the BLM as Lead Federal Agency issued the Notice of Intent (NOI) and thereby initiated an Environmental Impact Study. The current timeline calls for Scoping to be completed by the end of January, 2018, the Draft EIS by late 2018, and the EIS and Record of Decision to be completed by late 2019.
Figure 18-1 shows the Brooks East Access Route in orange in relationship to the existing Dalton Highway in black and the Alaska Railroad in blue. Figure 18-2 shows the preferred access option (Brooks East Access Route) in dark orange, and a variation of the route in light orange.
| Trilogy Metals Inc. | 18-1 | |
| NI 43-101 Technical Report on the Arctic Project, | | |
| Northwest Alaska | | |
Remote projects typically use diesel fuel for power generation. Trilogy Metals is investigating the viability of using liquefied natural gas (LNG) as a potential power source for the Arctic Project. In July 2013, AIDEA published a feasibility study to investigate the viability of trucking LNG to Fairbanks so as to supply local utilities which would use the LNG to fuel their power generation plants. The feasibility study estimated that the use of LNG could significantly lower electrical power generation costs in Fairbanks. In January, 2014 AIDEA selected a commercial participant to develop a North Slope LNG liquefaction plant that will produce LNG for delivery to the Fairbanks North Star Borough via trucking. Several other potential sources of LNG are also being investigated.
| Figure 18-1 | Brooks East Route Access to the Ambler Mining District and Location of North Slope LNG (Trilogy Metals, 2017) |

| Trilogy Metals Inc. | 18-2 | |
| NI 43-101 Technical Report on the Arctic Project, | | |
| Northwest Alaska | | |
| Figure 18-2 | Brooks East Route Access to the Ambler Mining District – Preferred Route (Trilogy Metals, 2017) |
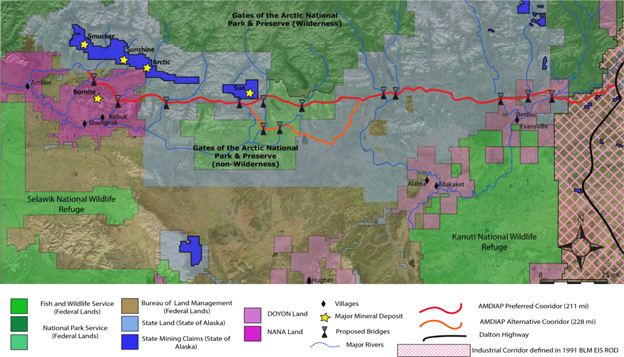
| Trilogy Metals Inc. | 18-3 | |
| NI 43-101 Technical Report on the Arctic Project, | | |
| Northwest Alaska | | |
| 19.0 | Market Studies and Contracts |
There are no current market studies or contracts for the Arctic Project.
| Trilogy Metals Inc. | 19-1 | |
| NI 43-101 Technical Report on the Arctic Project, | | |
| Northwest Alaska | | |
| 20.0 | Environmental Studies, permitting and social or community Impact |
This section characterizes the existing environmental baseline data for the Arctic Project area, makes suggestions for additional studies that would provide a basis for the mine permitting efforts, describes the major environmental permits that will likely be required for the Arctic Project, and identifies potential significant social or community impacts.
| 20.1 | Environmental Studies |
The Arctic Project area includes the Ambler Lowlands and the Subarctic Creek drainage and would be sited within the Shungnak River drainage. To date, an extensive amount of baseline environmental data collection has occurred in the area including surface water quality sampling, groundwater quality sampling, wetlands mapping, hydrologic monitoring, aquatic life surveys, avian surveys, habitat surveys, meteorological monitoring, and acid base accounting data. The existing data are summarized in Sections 20.1.1 to 20.1.5.
| 20.1.1 | Hydrology and Water Quality Data |
A number of sampling efforts have been used to characterize the hydrology in the Arctic Project area. In 2007, 2008 and 2009, Shaw Environmental collected water quality samples and measured stream flow at over 40 stations on the Shungnak River, Subarctic Creek, Arctic Creek, and the Kogoluktuk River (Shaw 2007 to 2009).
Two hydrologic gauging stations were installed on the Shungnak River (SRGS) and Subarctic Creek (SCGS) respectively by DOWL HKM in July, 2012. Each station is powered by dual solar panels and a battery and continually measures and records water temperature, pH, conductivity, and water depth. A third hydrologic gauging station was established at the Lower Ruby Creek Gauging Site (RCDN) by WHPacific in June, 2013. The RCDN station was moved upstream in 2017 due to a beaver dam,
In July 2010, Tetra Tech performed baseline studies to characterize flow and water quality in several streams that could be potentially impacted by construction and operation of a proposed access road between the Bornite airstrip and the Arctic airstrip, and the existing road between the Arctic airstrip and the Arctic Deposit. Tetra Tech collected water quality and flow data at 14 sites. The results of the Tetra Tech sampling program indicate that, in general, the water quality for all meets applicable Alaska State water quality standards (WQS) for the parameters analyzed. These data can be used to characterize baseline water quality conditions prior to any site disturbance.
| Trilogy Metals Inc. | 20-1 | |
| NI 43-101 Technical Report on the Arctic Project, | | |
| Northwest Alaska | | |
Instantaneous flow discharge and water samples have been collected since 2007. Water quality sampling was conducted by Trilogy from 2012 to the present. Small sampling programs were performed from 2012-2015 during the summer field season. The sampling program was expanded in 2016 and water quality samples to include more sample locations on the Shungnak River, Subarctic Creek, Ruby Creek, Riley Creek, Wesley Creek, and the Kogoluktuk River and sampling in the throughout the year. Several seeps in the Subarctic drainage near the Arctic Project have also been sampled. Samples were analyzed for metals, mercury, cyanide, chloride, fluoride, nitrates, sulfate, acidity, alkalinity, total suspended solids, conductivity, pH, total dissolved solids, total organic carbon, and total phosphorus. The information will be used in the permitting and design of facilities related to exploration and potential mining at the Arctic Project.
In 2017, four groundwater monitoring wells were installed in the Subarctic Creek drainage areas near the site of, and down gradient of, the proposed tailings and waste rock storage facilities and in alternative sites for tailings and waste rock disposal. Data collection is on-going.
Tetra Tech also performed a program of jurisdictional wetlands identification in a portion of the Arctic Project area in 2010 as part of a study to identify potential road alignment alternatives between the Bornite and Arctic airstrips. The work included data review, vegetation mapping, aerial photographic interpretation (segmentation), and field soil surveys.
The area between the Bornite airstrip and the Arctic airstrip consists of a wide valley containing the Ambler Lowlands and the Shungnak River. Wetlands are prevalent throughout much of the Ambler Lowlands. The majority of the wetlands within the area occur within tundra communities.
Wetlands delineation in the Subarctic Creek drainage was performed in 2015 and 2016 by DOWL, as shown in Figure 20-1, following a high-resolution LiDAR survey. Approximately 35,000 acres were delineated. This field work included onsite investigation of the plants and soils present.
| Trilogy Metals Inc. | 20-2 | |
| NI 43-101 Technical Report on the Arctic Project, | | |
| Northwest Alaska | | |
Figure 20-1 Wetlands delineation completed in 2015 and 2016 by DOWL
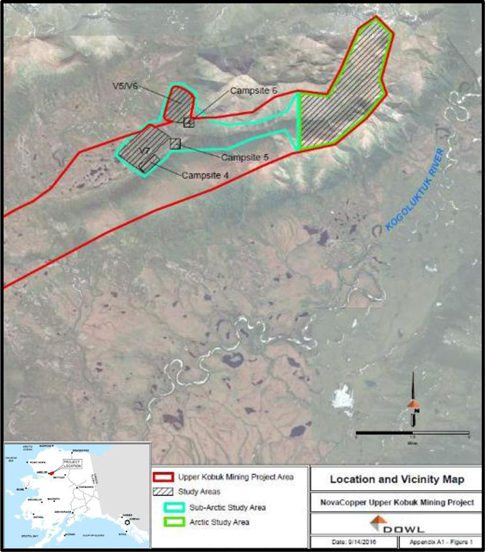
A habitat survey was conducted by DOWL in conjunction with the wetlands vegetation work that they performed. The survey covered Arctic, Bornite, and the Ambler Lowlands for a total of 35,900 acres.
Additionally, the various habitat types were ranked based on ecological value. Lastly, DOWL conducted a review of existing wildlife surveys and identified data gaps and recommendations for future studies.
Tetra Tech Inc.’s (“Tetra Tech”) sampling efforts in 2010 included baseline aquatic life surveys in the area along the proposed road alternatives between the Bornite airstrip and Arctic airstrip, and along the Arctic airstrip to Arctic Deposit road in Subarctic Creek. The purpose of this study was to characterize the aquatic life within the Shungnak River, Subarctic Creek and other potentially impacted tributaries. Opportunistic observations were also collected in the Kogoluktuk River. Fish and macroinvertebrate data were collected from July 8 to 14, 2010.
| Trilogy Metals Inc. | 20-3 | |
| NI 43-101 Technical Report on the Arctic Project, | | |
| Northwest Alaska | | |
Tetra Tech employed active fish capture methods to assess the local fishery population, and backpack electrofishing gear to sample reaches of smaller streams. Tetra Tech also employed passive fish capture techniques, including gill netting, minnow traps, hoop nets and visual observation. Six different fish species were captured or observed in the study. The lack of large anadromous fish in sampled sections of the Shungnak River is likely the result of the presence of a waterfall, estimated to be 4.5 to 9 m tall, situated downstream of the Arctic Project area.
Macroinvertebrates were also collected during the July 2010 survey period from nine monitoring sites. The goal of this assessment was to describe baseline conditions as they existed at that time as there were no known previous data that could be used for comparison. Applying indices of water quality and overall stream health, to the results of the macroinvertebrate sampling, showed that most of the sampled streams in the Arctic Project area are in good ecological condition. They generally demonstrate relatively high levels of species diversity and species richness although results varied from stream to stream.
The Alaska Department of Fish and Game (ADF&G) was contracted in 2016 and 2017 to conduct a survey of aquatic resources in the project area including Ruby Creek, Riley Creek, the Shungnak River, the Kogoluktuk River, Jay Creek, and Subarctic Creek. The survey included minnow traps, fyke nets, macroinvertebrate and periphyton sampling. Additionally, fish were collected and sent to ACZ Labs for tissue metals testing.
The results of the survey include identification of a waterfall that prevents fish passage located on the lower reaches of the Shungnak River. As a result, “no anadromous fish occur near the sites” (Bradley, 2017). Upper Subarctic has the highest concentration of macroinvertebrates, followed by Riley Creek. Macroinvertebrates are an important food source for fish.
Access to the Arctic Project requires access through private lands owned by NANA. Trilogy acknowledges the importance of subsistence, as such, a Subsistence Subcommittee comprised of locally appointed residents from five potentially affected communities in the region has been formed to review and discuss subsistence issues related to the project and to develop future compliance plans. A representative from NANA and Trilogy facilitate the meetings and report a summary of the discussions and recommendations provided by the Subsistence Subcommittee to the Oversight Committee.
| Trilogy Metals Inc. | 20-4 | |
| NI 43-101 Technical Report on the Arctic Project, | | |
| Northwest Alaska | | |
A formal subsistence survey has not been performed in the immediate vicinity; however, Trilogy has established a workforce “Wildlife Log” to document potential subsistence resources, species diversity and human/wildlife encounters. In 2012, Stephen R. Braund & Associates completed a subsistence data gap memo under contract to the Alaska Department of Transportation and Public Facilities as part of the baseline studies associated with a proposed road to the Ambler mining district. The purpose of this analysis was to identify what subsistence research had been conducted for the potentially affected communities, determine if subsistence uses and use areas overlap with or may be affected by the project, and identify what, if any, additional information (i.e., data gaps) needed to be collected in order to accurately assess potential effects to subsistence (Braund 2012). Among other topics the report outlined historic subsistence uses including maps and a literature review, and also provided a synopsis by village including those villages closest to the Arctic Project, and suggested further study.
Previous sampling efforts have established the presence of various subsistence resources such as salmon species, northern pike and sheefish in the Kogoluktuk River. Sampling efforts in the Shungnak River have established the presence of northern pike. The presences of fish are good indicators of the possibility of subsistence use of these rivers, but boat access is limited due to waterfalls and rapids. In comparison, the Kobuk River, a wide and easily navigable river on which the communities of the region exist, supports the bulk of subsistence fishing.
| 20.1.5 | Acid Base Accounting Data |
Sampling efforts have been used to characterize the acid generation potential of the mine waste for the Arctic Project. In 1998, Robertson collected 60 representative core samples from the deposit for their acid/base characteristics; these samples provided a broad assessment of acid rock drainage (ARD) at the Arctic Deposit with a focus on characterization for surface development. In 2010, SRK collected 148 samples and prepared a preliminary metals leaching (ML) and ARD analysis of the ML/ARD potential of waste rock at the Arctic Deposit (SRK 2011). The SRK report focuses on characterization for underground development rather than an open pit scenario; however, it does provide a more refined analysis of ARD potential based on advances that have been made in understanding the importance of sulfide mineralogy in assessing ARD. The criteria used for classifying ARD potential also differs slightly from the Robertson era work.
Based on recommendations from SRK, Tetra Tech used total Sulphur percent as a proxy for acid potential (AP) and calcium percent as a proxy for neutralization potential (NP) to better characterize acid base accounting (ABA) in an open pit mine plan scenario.
Trilogy Metals retained Steven Day of SRK Consulting to provide on-going metal leaching and acid rock drainage (ML/ARD) characterization services for the Arctic project. Activities in 2016 focused on three objectives: 1) on-going monitoring of on-site barrel tests (kinetics), 2) on-going monitoring of parallel laboratory humidity cell tests (kinetics), and 3) expansion of the current acid-base-accounting (ABA) database (statics). Barrel test samples were routinely collected during 2016 and 2017 and analyzed by ARS Aleut Analytical. Humidity cell tests, initiated in 2015, were monitored on a monthly basis by Maxxam Analytics of Burnaby, British Columbia. Both the barrel test work and humidity cell test work is on-going. Trilogy Metals and SRK selected 1,119 samples to be analyzed for a conventional static ABA package with a trace element scan using the same methods as the exploration database. Samples were analyzed by Global ARD Testing Services of Burnaby, British Columbia. Upon completion of the laboratory test work, SRK began evaluating the use of proxies to support next steps in regards to the block modelling of ML/ARD potential. This work is on-going.
| Trilogy Metals Inc. | 20-5 | |
| NI 43-101 Technical Report on the Arctic Project, | | |
| Northwest Alaska | | |
WHPacific was hired to conduct a desktop and onsite archaeological survey of selected portions of the Subarctic drainage. The Alaska State Historical Preservation Office (SHPO) was contacted to determine if any known sites are within the project area. No sites were identified. Next, informational meetings were held in Kobuk and Shungnak to inform the village residents of the proposed activities and to see if anyone was aware of any sites in the project area or nearby. The final stage of the survey was an onsite field investigation that involved traversing the project area in transects and digging test pits. No cultural or archaeological sites were identified during the field survey.
A meteorological monitoring (MET) station was installed at the Arctic Airstrip (67.138940°N, 156.674013°W) in September, 2011 by DOWL HKM. The MET station is powered by dual solar panels and a battery bank and continually measures and records meteorological data including wind speed and direction, temperature, pressure, humidity, solar radiation, and precipitation. Annual maintenance and calibration is performed on the MET station and has been done so annually since installation by James Dryden of Dryden Instrumentation.
WHPacific conducted an avian survey in 2016 and 2017 of the entire project area, including Arctic, Bornite, and the Ambler Lowlands. John Shook, an avian biologist with ABR Inc. was subcontracted to do the field investigation. The survey consisted of an aerial survey in the spring to determine the occupancy and location of nests followed by a summer survey to determine the fledging success rate conducted.
| 20.1.9 | Additional Baseline Data Requirements |
Additional baseline environmental data in the Ambler Lowlands, the Subarctic Creek drainage, the Shungnak River drainage and downstream receiving environments will be required to support future mine design, development of an EIS, permitting, construction and operations. The status of ongoing and additional baseline studies are included Table 20-1.
| Trilogy Metals Inc. | 20-6 | |
| NI 43-101 Technical Report on the Arctic Project, | | |
| Northwest Alaska | | |
Table 20-1 Additional Recommended Environmental Baseline Studies
| Discipline/Status | Recommended Studies |
| Acid-Base AccountingON-GOING TESTING | Additional static test work of waste lithogeochemical domains within and adjacent to the proposed open pit and borrow sources and tailings followed by kinetic test work. |
Archaeology Mostly COMPLETE, some infill likely need | Assessment of cultural resources, cultural site clearance |
Aquatic Life ONGOING | Expanded aquatic surveys (invertebrates) |
Ecosystem and Soils COMPLETE | Wetlands delineation mapping; vegetation surveys |
Hydrogeology ON-GOING TESTING | Installation and monitoring of groundwater wells in the Subarctic Creek drainage areas near the site of, and down gradient of, the proposed tailings and waste rock storage facilities and in alternative sites for tailings and waste rock disposal |
Hydrology Ongoing | Hydrologic gauging stations, flow measurements. |
Meteorology, Air Quality, and Noise Ongoing | Expansion of the meteorological program to additional locations to be determined; air quality monitoring |
Wildlife Complete | Avian survey, large mammal survey. |
All of the data are important to the development of an accurate environmental baseline and water balance model for the Arctic Project area. These studies would need to be completed in sufficient depth to cover all reasonably foreseeable baseline work that may be requested by the regulatory agencies. The risks that come with insufficient baseline data include delays in the permitting process, poorly constrained pre-mining characterizations, inappropriate trigger levels in permits and inaccurate water balance models that can negatively affect operations and otherwise result in unforeseen and potentially costly circumstances during permitting or mine operations and closure.
| 20.2.1 | Exploration Permits |
Trilogy performs mineral exploration at the Arctic Deposit under State of Alaska and NWAB permits.
The Company has a multi-year hardrock exploration permit issued by the ADNR. Cumulative surface disturbance for exploration activities on the Arctic Project remains less than 5 acres and is mostly located on patented land, therefore there are currently no State of Alaska requirements for reclamation bonding for the Arctic Project.
| Trilogy Metals Inc. | 20-7 | |
| NI 43-101 Technical Report on the Arctic Project, | | |
| Northwest Alaska | | |
Trilogy has obtained several other permits for camp support operations. These permits include a drinking water permit, a wastewater discharge permit, camp establishment permits, and construction and operation of a Class III Camp Municipal Landfill, all of which are issued by the ADEC. Temporary water use authorization issued by the ADNR, a Title 16 Fish Habitat permit and a wildlife hazing permit issued by the ADF&G.
| 20.3 | Social or Community Considerations |
The Arctic Project is located approximately 25 miles northeast of the native villages of Shungnak and Kobuk, and 40 miles east-northeast of the native village of Ambler. The population in these villages are 151 in Kobuk (2010 Census), 262 in Shungnak (2010 Census) and 258 in Ambler (2010 US Census). Residents live a largely subsistence lifestyle with incomes supplemented by trapping, guiding, local development projects, government aid and other work in, and outside of, the villages.
The Arctic Project has the potential to significantly improve work opportunities for village residents. Trilogy Metals is working directly with the villages to employ residents in the ongoing exploration program as geotechnicians, drill helpers, and environmental technicians. Trilogy Metals and NANA have established a Workforce Development Subcommittee of the Oversight Committee, described below, to assist with developing a local workforce. In addition, Trilogy Metals has existing contracts with native-affiliated companies (such as NANA Camp Services (NMS) and WHPacific Inc.) that are providing camp catering and environmental services for the project, respectively.
In October 2011, Trilogy Metals signed an agreement with NANA. In addition to consolidating landholdings in the Ambler District, the agreement has language establishing native hiring preferences and preferential use of NANA subsidiaries for contract work. Furthermore, the agreement formalized an Oversight Committee, with equal representation from Trilogy Metals and NANA, to regularly review project plans and activities. In addition, a Subsistence Subcommittee has been formed to protect subsistence and the Iñupiaq way of life and a Workforce Development Subcommittee is also in place to address current and future employment needs on the project through the development of training and educational programs that build skill sets for local residents interested in exploration and mining careers. The agreement also includes a scholarship funded annually by Trilogy that promotes education for youth in the region. Trilogy Metals has developed a good working relationship with the villages closest to the Property and the NWAB government.
In general terms, rural Alaska residents are often concerned about potential mining impacts to wildlife and fish for those projects within their traditional use areas. Trilogy appears to have acknowledged these views and concerns and is taking substantive steps to address them during the current exploration stage of the Arctic Project.
Local community concerns will also be formally recognized during the scoping stage at the beginning of the NEPA process. At that time, the lead federal agency (likely the USACE) will hold scoping meetings in rural villages to hear and record the concerns of the local communities so that the more significant of these can be addressed during the development of the EIS. In addition, the USACE would have government-to-government consultations with the Tribal Councils in each of the villages, as part of the NEPA process, to discuss the project and discuss Council concerns.
| Trilogy Metals Inc. | 20-8 | |
| NI 43-101 Technical Report on the Arctic Project, | | |
| Northwest Alaska | | |
Characterizing the level of support or opposition to the Arctic Project would be speculative at this time. Regional engagement by Trilogy has encountered a strong desire for the economic benefits that come with mining projects.
| Trilogy Metals Inc. | 20-9 | |
| NI 43-101 Technical Report on the Arctic Project, | | |
| Northwest Alaska | | |
| 21.0 | Capital and Operating Costs |
There are no current capital and operating costs for the Arctic Project.
| Trilogy Metals Inc. | 21-1 | |
| NI 43-101 Technical Report on the Arctic Project, | | |
| Northwest Alaska | | |
There is no current economic analysis for the Arctic Project.
| Trilogy Metals Inc. | 22-1 | |
| NI 43-101 Technical Report on the Arctic Project, | | |
| Northwest Alaska | | |
There is no data from any adjacent properties that has been used in the estimation of mineral resources for the Arctic Project.
Adjacent to Trilogy Metals’ land holdings, which encompass the Arctic Deposit, are two VMS deposits: the Sun Deposit owned by Enirgi Group Corporation (Enirgi) and the Smucker Deposit owned by Teck Resources Ltd. (Teck). Both prospects are located in the Ambler Schist Belt (Figure 23-1). Sun is the only adjacent property which contains a current mineral resource estimate. These two properties are briefly described in the following sections.
A qualified person has been unable to verify the information in this Section 23.0 and such information is not necessarily indicative of the mineralization at the Arctic Project. (Item 23(c) of Form 43-101F1)
Figure 23-1 Adjacent Properties and Land Status (Trilogy Metals, 2017)
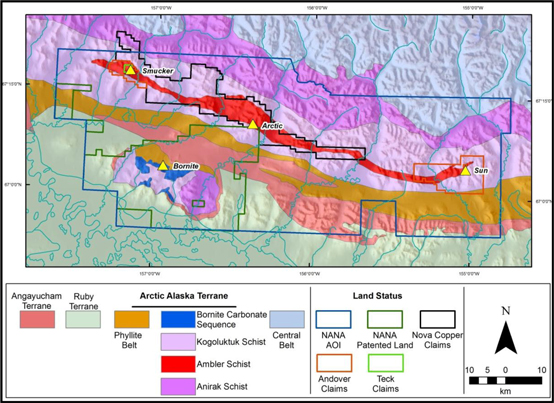
| Trilogy Metals Inc. | 23-1 | |
| NI 43-101 Technical Report on the Arctic Project, | | |
| Northwest Alaska | | |
Andover Mining Corp. (Andover) announced in 2013 that it had filed a Notice of Intention to make a proposal for its reorganization under the Bankruptcy and Insolvency Act (Canada), and was deemed bankrupt on February 12, 2014. In 2015, the Trustee in the bankruptcy completed the sale of Andover’s material assets to Enirgi (Lead-FX), as described in Andover’s most recent press release dated March 16, 2015.
The following information was derived from an Andover Technical Report dated September 30, 2013 (Gustin and Ronning). The Sun property is located in the Ambler Schist Belt, roughly 79 km east of Trilogy Metals’ Bornite deposit. The Sun Property, also referred to as the “Hot prospect”, consists of 230 contiguous State of Alaska mining claims, representing a land position of 36,800 acres. Andover recently added an additional 9,120 acres to its land position through the staking of claims adjacent to Teck’s Smucker deposit. With the addition of the 9,120 acres, Andover now has an aggregate land position of 45,920 acres in the Ambler Schist Belt.
Andover maintains a 20 person camp at the Sun project along with a 457 m airstrip built in 2007. The camp consists of living quarters, core-logging facilities, geological office, mess facility, showers, laundry facilities, generator and tool storage, and indoor and outdoor core storage.
The Sun Property includes copper-zinc-silver-lead-gold mineralization on the Main Sun Deposit, S.W. Sun Deposit, and a number of other prospects. In total, 97 drill holes totaling 19,123 m have been completed on the Sun Property. Andover completed 48 holes during 2007, 2011 and 2012, with 49 drill holes completed by previous operators Anaconda, Noranda, Cominco and Bear Creek.
The current mineral resource estimate for the Sun Deposit is listed in Table 23-1. The QP has not reviewed this estimate of mineral resources.
Table 23-1 Mineral Resource Estimate for the Sun Project (November 2012)
| Classification | Tonnes
(millions) | Zn
% | Cu
% | Pb
% | Ag
g/t | Au
g/t | Mlbs
Zn | Mlbs
Cu | Mlbs
Pb | Moz
Ag | Koz
Au |
| Indicated | 2.165 | 4.1 | 1.4 | 1.1 | 57.6 | 0.21 | 196 | 68 | 51 | 4.0 | 14 |
| Inferred | 11.648 | 3.9 | 1.1 | 1.4 | 76.8 | 0.24 | 1,005 | 293 | 351 | 28.8 | 89 |
Notes:
| 1) | Using cutoff of $75/Tonne “in-ground value” |
| 2) | Metal prices at Cu = $3.00/lb, Pb = $0.95/lb, Zn = $0.95/lb, Ag = $25/oz, Au = $1,300/oz |
| Trilogy Metals Inc. | 23-2 | |
| NI 43-101 Technical Report on the Arctic Project, | | |
| Northwest Alaska | | |
Teck owns a 100% interest in the Smucker Property, located 26 km west-northwest of the Bornite Deposit in the same terrane and lithological sequence as the Arctic and Sun Deposits. Like the Arctic and Sun Deposits, the Smucker Deposit is described as a polymetallic copper-lead-zinc-gold-silver VMS prospect. Currently in target delineation stage, the Smucker Property does not have a current NI 43-101 compliant resource estimate.
Significant drilling by Anaconda in the 1970s intersected precious metal-rich VMS mineralization analogous to the other prospects of the Ambler Sequence (Ambler Schist Belt). An unclassified historical “resource estimate” for the Smucker Deposit totals 7.2M tonnes at 0.5% Cu, 4.9% Zn, 1.7% Pb, 156g/t Ag and 1.1g/t Au (Newberry and others, 1997). There is no defined cut-off threshold for this figure.
This historic resource estimate is considered relevant but not reliable. The QP has not done any work to validate or verify this historical estimate and it should not be considered to be a mineral resource estimate as defined under NI 43-101.
| Trilogy Metals Inc. | 23-3 | |
| NI 43-101 Technical Report on the Arctic Project, | | |
| Northwest Alaska | | |
| 24.0 | Other Relevant Data and Information |
No additional information or explanation is necessary to make the technical report understandable and not misleading.
| Trilogy Metals Inc. | 24-1 | |
| NI 43-101 Technical Report on the Arctic Project, | | |
| Northwest Alaska | | |
| 25.0 | Interpretation and Conclusions |
A report was issued for the Pre-feasibility Slope Geotechnical and Hydrogeological Report for the Arctic Deposit by SRK in 2017. A complete assessment of bench and inter-ramp kinematic stability, slope design, structural data, and hydrogeological characteristics has been undertaken and each section is summarized below:
Kinematic Stability Assessment
| · | Six (6) structural and geomechanical domains have been identified. These domains, each containing discontinuity sets and major structures, have formed the basis of the kinematic assessment. |
| · | Full descriptions of toppling, planar, and wedge instability risks are provided per geomechanical domain and design sector. |
| · | The most significant discontinuity sets, in terms of limiting slope angles, are related to shallow to intermediate dipping S1/S0 fabric which impacts the NE, E and SE slopes. |
| · | Phase2 modelling result validated the findings from the kinematic assessment. |
| · | Slope stability models suggest final pit wall slopes are relatively insensitive to pore pressure conditions. |
| · | A seismic hazard assessment has not been completed on the pit but could be a potential risk to ongoing stability. |
Slope Design
| · | Arctic slope design criteria are issued based on bench and inter-ramp scale kinematics and select 2-D stability modelling. Inter-ramp design recommendations range from 30 to 56°. |
| · | East Wall: Slopes subparallel to the main foliation (J1, S1/S0) should be stripped along the dip of the feature. The majority of the east wall will be mined with stacks consisting of 2 benches (height of 60 m) carrying a geotechnical berm or ramp every 120 m vertical spacing. |
| · | North Wall: The current pit design includes a segment of convex slope along the north wall. Although 2-D modelling and kinematic analyses suggest such a design is stable, potentially complex failure modes may impact this area (possibly including J1 and other minor/major structure). |
| Trilogy Metals Inc. | 25-1 | |
| NI 43-101 Technical Report on the Arctic Project, | | |
| Northwest Alaska | | |
| · | A complete investigation of early pit phase slopes has not been completed as part of this phase of study, but initial findings show that there is a potential risk if the slopes are left with thick bands of talc in the toe. |
The hydrogeological database is sufficient for a pre-feasibility study. There are now 22 hydraulic conductivity measurements available from ten drill-holes, including results from a 12-hour airlift test. Bulk hydraulic conductivity ranges between 3x10⁻⁹ and 3x10⁻⁶ m/s. The previous interpretation of increasing K with depth is still possible but not as consistent as previously believed. Water level measurements are available from 18 locations, including 8 locations with less than one full year of continuous record each. Water level data show variable elevations and different responses to recharge events suggesting the presence of multiple water systems. Seasonal variations in water levels are up to 120 m.
The hydrogeological conceptual model for the Arctic deposit has been updated with results gained from the 2015/2016 field programs. Data indicate a system generally characterized by low hydraulic conductivity and average recharge, but also multiple water systems.
Trilogy Metals retained Steven Day of SRK Consulting to provide on-going metal leaching and acid rock drainage (ML/ARD) characterization services for the Arctic project. On-going activities include: 1) monitoring of on-site barrel tests (kinetics), and 2) monitoring of parallel laboratory humidity cell tests (kinetics. Barrel test samples were collected during June, September and October of 2016 and analyzed by ARS Aleut Analytical of Port Allen, Louisiana. Humidity cell tests, initiated in 2015, were monitored on a monthly basis by Maxxam Analytics of Burnaby, British Columbia. Both the barrel test work and humidity cell test work is on-going. Trilogy Metals and SRK selected 1,119 samples to be analyzed for a conventional static ABA package with a trace element scan using the same methods as the exploration database. Samples were analyzed by Global ARD Testing Services of Burnaby, British Columbia. Upon completion of the laboratory test work SRK began evaluating the use of proxies to support next steps in regards to the block modelling of ML/ARD potential. This work is on-going.
| 25.4 | Mineral Processing and Metallurgical Testing |
In general, the flowsheet developed in the 2012 test program and further tested in the 2017 test work program at ALS Metallurgy is feasible for the Arctic mineralization. Further metallurgical test work is recommended on representative samples to optimize the flowsheet and better understand the impact of talc levels in the process feed samples. Lead concentrate quality is impacted by the level of talc in the process feed and a better understanding of the level of talc in an expected process feed is critical in maximizing the value of a lead concentrate. There are no outstanding metallurgical issues related to the production of a copper or zinc concentrate from all of the materials tested.
| Trilogy Metals Inc. | 25-2 | |
| NI 43-101 Technical Report on the Arctic Project, | | |
| Northwest Alaska | | |
On-going grinding test work is recommended at some time in the future, including SAG mill characterization test work.
Compared to the previous estimate, there is a 51% increase in Indicated tonnes with a corresponding decrease in average grade for most metals resulting in a 42% increase in contained copper metal. The differences between the estimates are summarized below:
| · | New drilling data added since 2013 has upgraded the majority of previous Inferred to Indicated within the pit shell. |
| · | New drilling has identified additional resources by providing a better understanding of the shape and location of mineralization in the deposit. |
| · | Interpretation of mineralized domains; In 2013, these domains were based on the interpretation of massive sulphide (MS: >50% sulphides) and semi-massive sulphide (SMS: 30-50% sulphides) domains. The 2017 interpretation of Minzone domains is based on grade zones >0.75%CuEq. The 2017 approach captures more (and essentially all) of the mineralization present in the deposit in the MinZone domains. The 2013 approach excludes some lower grade mineralization from the interpreted domains (<30% sulphides remains outside of interpreted domains). These changes result in higher tonnage but lower overall average grade of resources. |
| · | More stringent criteria are used to classify resources in the new resource. In 2013, Tetra Tech used 150 m spaced drilling for Indicated resources and a maximum distance of 200 m from drilling for Inferred class resources. In the QP’s opinion, these distances are not supported by the underlying sample data and, as a result, the ranges are reduced to 100 m spaced drilling for Indicated resources and a maximum distance of 150 m from drilling for Inferred class resources. |
| · | The generation of the 2017 resource limiting pit shell excludes deductions for off-site process costs such as smelting, transport, insurance, losses, etc. (these are presently unknown and should not be applied to resource estimates). The projected operating costs and metal prices used to generate the resource limiting pit shell have been updated for 2017 but these are not that different from 2013. |
| · | 2017 interpolation uses dynamic anisotropy that retains better continuity of mineralization within the MinZone domains. The resulting variograms show better continuity and longer ranges compared to those produced in 2013. |
| · | Resources are tabulated based on CuEq cut-off in 2017 vs. NSR in 2013. There is likely little overall difference between these two approaches. However, this change was made because it is felt that the previous NSR approach is considered too detailed for the estimation of mineral resources. |
| Trilogy Metals Inc. | 25-3 | |
| NI 43-101 Technical Report on the Arctic Project, | | |
| Northwest Alaska | | |
The Arctic Project will be subject to a mine permitting process typical for a mine of its size in Alaska. In order to support this process, Trilogy Metals will have to broaden their existing baseline environmental program and complete a number of studies that will support the permit applications. Trilogy Metals has formally started engaging the Arctic Project stakeholders and recognizes the need to earn their trust and support by making the Arctic Project directly beneficial to them throughout the life of the Arctic Project. Trilogy Metals will be required to develop a mine plan that is protective of the environment during mining operations as well as reclamation and closure plan that ensures the environment is protected after mine closure.
| Trilogy Metals Inc. | 25-4 | |
| NI 43-101 Technical Report on the Arctic Project, | | |
| Northwest Alaska | | |
BDRC make the following recommendations for the next phase of work on the Arctic Project along with estimated costs:
| · | geotechnical studies, including geotechnical investigations of the pit area, plant site, TSF site, airstrip and other project related locations ($1,000,000); |
| · | engineering studies, including power supply and optimization of the layout of the process and service related facilities ($1,200,000); |
| · | metallurgical studies focused on grinding test work and additional floatation test work ($1,000,000); and |
| · | additional baseline studies and environmental permitting activities ($30,000). |
| Trilogy Metals Inc. | 26-1 | |
| NI 43-101 Technical Report on the Arctic Project, | | |
| Northwest Alaska | | |
ADF&G , 2011, . Caribou Management Report- Alaska Department of Fish and Game, Division of Wildlife Conservation, Patricia Harper Editor, 2011.
Alaska Climate Summaries: Kobuk, 1971-2000, http://www.wrcc.dri.edu/cgi-bin/cliMAIN.pl?akkobu.
Albers, D.A., 2004, Arctic Project Status Report: NovaGold Internal report.
Aleinikoff, J. N., Moore, T. E., Walter, M., and Nokleberg, W. J. , 1993,. U-Pb ages of zircon, monazite, and sphene from Devonian Metagranites and Metafelsites, Central Brooks Range, Alaska: U.S. Geological Survey Bulletin, v. B 2068, p. 59-70.
ALS Metallurgy, 2017, Additional Flotation and Mineralogical Testing for the Arctic Deposit, an unpublished report prepared for Trilogy Metals, 34p.
ALS Metallurgy, 2017, Flotation and Variability Testwork with samples from the Arctic Deposit, an unpublished report prepared for Trilogy Metals, 336p.
BGC Engineering Inc. , 2012, .. Rock Mechanics and Hydrogeology Study, Ambler project, Arctic Deposit, SubArctic Creek, Alaska draft report. October 2012.
Braund, S.R., et al, 2012, Ambler Mining District Access Project, Subsistence Data Gap Memo, prepared for Alaska Department of Transportation and Public Facilities.
Broadbent, C.D. 1981, Evaluation of Arctic and Ruby Creek Deposits: Kennecott Exploration Internal report
Broman, B.N., 2014, Metamorphism and Element Redistribution: Investigations of Ag-bearing and associated minerals in the Arctic Volcanogenic Massive Sulfide Deposit, SW Brooks Range, NW Alaska.
Brown, W.J., 1985, Pre-AFD Report
Chutas, N., 2006, Preliminary report on the Button Schist: NovaGold Internal report.
CIM, May 2014, . CIM Definition Standards - For Mineral Resources and Mineral Reserves.http://web.cim.org/UserFiles/File/CIM_DEFINITION_STANDARDS_MayNov_20140.pdf.
Clark, L.A. and Sweeney, M.J., 1976, Volcanic Stratigraphy, Petrology, and Trace Metal Geochemistry, Arctic Deposit: Kennecott Exploration Internal report.
Clark, L.A., 1972, Petrographic Problem Studies Report, Arctic Deposit: Kennecott Exploration Internal report.
| Trilogy Metals Inc. | 27-1 | |
| NI 43-101 Technical Report on the Arctic Project, | | |
| Northwest Alaska | | |
Crupi, Steven R., 2007, Ambler Project 2007 Environmental Baseline Sampling Alaska Gold Co., Shaw Alaska, Inc.
Crupi, Steven R., 2008, Shaw Hydraulics Data Report July 2008 Event Final, Shaw Environmental, Inc.
Crupi, Steven R., 2008, Water Quality Report July 2008 Event Final, Shaw Environmental, Inc.
Crupi, Steven R., 2009, Hydraulics Data Report July 2009 Event Draft, Shaw Environmental, Inc.
Crupi, Steven R., 2009, Water Quality Report July 2009 Event Final, Shaw Alaska, Inc.
Dillon, J. T., Pessel, G. H., Chen, J. H., and Veach, N. C. , 1980, . Middle Paleozoicmagmatism and Orogenesis in the Brooks Range, Alaska: Geology, v. 8, p. 338-343.
Dillon, J. T., Tilton, G. R., Decker, J., and Kelley, M. J. , 1987, . Resource Implications of Magmatic and Metamorphic Ages for Devonian Igneous Rocks in the Brooks Range, in Tailleur, I. L., and Weimer, P., Alaskan North Slope Geology, Pacific Section, Society of Economic Paleontologists and Mineralogists, p. 713-723.
Dimock, R.R., 1984, Arctic Evaluation Update: Kennecott Exploration Internal report
Dodd, S. P., Lindberg, P. A., Albers, D. F., Robinson, J. D., Prevost, R. , 2004, . Ambler Project, 2004 Summary Report, Unpublished Internal Report, Alaska Gold Company.
Dowl HKM , 2013, . NovaCopper Final Year-End Report 2012, Consultant Report prepared for NovaCopper under Work Order 60816, March 2013.
DOWL HKM, 2012, DOWL HKM September 2012 Trip Report, DOWL HKM.
DOWL HKM, 2012, DOWL HKM Stream Gage Install July-August 2012 Trip Report.
DOWL, 2015, NovaCopper Wetlands Assessment, an unpublished report prepared for NovaCopper Inc.
DOWL, 2015, NovaCopper Wetlands Assessment, DOWL
Dryden, James, 2012, Dryden Stream Gage Install Aug 2012 Trip Report.
Earnshaw, J., 1999, Interim Report Conceptual Level Economic Evaluations of the Arctic Resource: Kennecott Exploration Internal report
| Trilogy Metals Inc. | 27-2 | |
| NI 43-101 Technical Report on the Arctic Project, | | |
| Northwest Alaska | | |
Ellis, W.T., 1978, Geologic Evaluation and Assessment of the “North Belt” Claims Ambler District: Sunshine Mining Company Internal report.
Exploration Agreement and Option to Lease between NovaCopper US Inc. and NANA Regional Corporation, Inc. dated October 19, 2011, as amended.
Franklin, J.M., Gibson, H.L., Jonasson, I.R., and Galley, A.G., 2005, Volcanogenic Massive Sulfide Deposits, in Hedenquist, J.W., Thompson, J.F.H., Goldfarb, R.J., and Richards, J.P., eds., Economic Geology 100th Anniversary Volume: The Economic Geology Publishing Company, p. 523-560.
Gottschalk, R. R., and Oldow, J. S. , 1988, . Low-angle Normal Faults in the South-central Brooks Range Fold and Thrust Belt, Alaska, Geology, 16, p. 395-399.
Gustin, M. M. and Ronning, P., 2013, NI 43-101 Technical Report on the Sun Project, prepared by Mine Development Associates of Reno, Nevada for Andover Mining Corp.
Hale, C., 1996, 1995 Annual Ambler District Report: Kennecott Exploration Internal report.
Halls, J.L. 1974, Ambler District Evaluation: Kennecott Exploration Internal report
Halls, J.L. 1976, Arctic Deposit Order of Magnitude Evaluation: Kennecott Exploration Internal report
Halls, J.L. 1978, Arctic Deposit: Kennecott Exploration Internal report
Hammitt, J.W., 1985, 1985 Annual Progress Report – Ambler District: Kennecott Corporation Internal Report.
Hitzman, M. W., Proffett, J. M., Schmidt, J. M., and Smith, T. E. , 1986, . Geology and Mineralization of the Ambler District, Northwestern Alaska: Economic Geology v. 81, p. 1592-1618.
Hitzman, M. W., Smith, T. E., and Proffett, J. M. , 1982, . Bedrock Geology of the Ambler District, Southwestern Brooks Range, Alaska: Alaska Division of Geological and Geophysical Surveys Geologic Report 75, scale 1:250,000.
Hunt, G.A., 1999, PIMA alteration mapping and structural interpretation of drill core from the Arctic Deposit, Alaska, a report prepared for Rio Tinto Mining and Exploration Ltd, 10 p.
Interior Energy Project Feasibility Report. Proposed Project – North Slope LNG Plant July 2013. Report prepared by the Alaska Industrial Development and Export Authority , AIDEA, and Alaska Energy Authority.
Journel A. , Huijbregts, C. J. , 1978, . Mining Geostatics. London: Academic Press.
Kennecott , 1977, . Annual Report Arctic Deposit: Unpublished in-house report.
| Trilogy Metals Inc. | 27-3 | |
| NI 43-101 Technical Report on the Arctic Project, | | |
| Northwest Alaska | | |
Kennecott , 1995, . Re-Evaluation of the Arctic Deposit, Ambler District, Alaska: Unpublished in-house report.
Kennecott , 1998, . Arctic Deposit and Ambler District Field Report: Unpublished in-house report.
Kennecott Research Center , August 1972, . Amenability Testing of Samples from Bear Creek Mining Company’s Arctic Deposit, TR 72-12.
Kennecott Research Center , January 1997, . Process Selection for Arctic Deposit, Technical Report RTR 77-4.
Kennecott Research Center , September 1968, . Amenability Testing of Diamond Drill Core Samples from Arctic, Alaska Project, TR 68-20.
Kennecott Research Center , September 1976, . Recovery of Mineral Values Arctic Prospect, RTR 76¬22.
Kobuk Valley National Park , 2007, . www.kobuk.valley.national-park.com/info.htm#env.
Lakefield Research Limited , January 7, 1999, . An Investigation of the Recovery of Lead, Zinc & Precious Metals from Samples of the Arctic Project Ore submitted by Kennecott Minerals, Progress Report No.1.
Lindberg, P. A. , 2004, . Structural Geology of the Arctic Cu-Zn-Pb-Ag Sulfide Deposit: Alaska Gold Company Unpublished Report.
Lindberg, P. A. , 2005, . A Preliminary Attempt to Unfold the Arctic Volcanogenic Ore Deposit and Determine it’s Original Metal Zonation: Alaska Gold Company Unpublished Report.
McClelland, W.C., Schmidt, J.M., and Till, A.B., 2006, New U-Pb SHRIMP ages from Devonian felsic volcanic and Proterozoic plutonic rocks of the southern Brooks Range, AK: Geologic Society of America Abstracts with Programs, v. 38, n. 5, p. 12.
Metz, P.A., 1978, Arctic Prospect Summary File Report, prepared for US Bureau of Mines by Mineral Research Laboratory, University of Alaska – Fairbanks
Modroo, E.R., 1980, Ambler River Project Project Memorandum Field Investigations: Sunshine Mining Company Internal report.
Modroo, E.R., 1982, Ambler River Project Project Memorandum Field Investigations: Bear Creek Mining Company Internal report.
Modroo, E.R., 1983, Ambler River Project Project Memorandum Field Investigations: Sunshine Mining Company Internal report.
Moore, T. E., Wallace, W. K., Bird, K. J., Karl, S. M., Mull, C. G., and Dillon, J. T. , 1994, . Geology of Northern Alaska, in Plafker, G., and Berg, H. C., eds., The Geology of Alaska: Boulder, Colorado, Geological Society of America, The Geology of North America, v. G1, p. 49-140.
| Trilogy Metals Inc. | 27-4 | |
| NI 43-101 Technical Report on the Arctic Project, | | |
| Northwest Alaska | | |
Moore, T.E., 1992, The Arctic Alaska Superterrane, p. 238-244, in Bradley, D.C., and Dusel-Bacon, C., eds., Geologic Studies in Alaska by the U.S. Geological Survey, 1991: U.S. Geological Survey Bulletin 2041.
Moore, T.E., Wallace, W.K, Bird, K.J., Karl, S.M., Mull, C.G., and Dillon, J.T., 1994, Geology of northern Alaska, in Plafker, G., and Berg, H.C., eds., The Geology of Alaska: Boulder, Colorado, Geologic Society of America, The Geology of North America, v. G-1.
Mull, C. G. , 1982, . Tectonic Evolution and Structural Style of the Brooks Range, Alaska; an Illustrated Summary, in Geologic Studies of the Cordilleran Thrust Belt, Rocky Mt. Assoc. Geol., Denver, CO, United States , USA, , p. 1-45.
Mull, C. G. , 1985, . Cretaceous Tectonics, Depositional Cycles, and the Nanushuk Group, Brooks Range and Arctic Slope, Alaska, U.S. Geol. Soc. Bull., 1614, p. 7-36.
Newberry, R.J., Crafford, T.C., Newkirk, S.R., Young, L.E., Nelson, S.W., and Duke, N.A., 1997, Volcanogenic massive sulfide deposits of Alaska, in Goldfarb, R.J., and Miller, L.D., eds., Mineral deposits of Alaska: Economic Geology Monograph 9, p. 120-150.
Oldow, J. S., Seidensticker, C. M., Phelps, J. C., Julian, F. E., Gottschalk, R. R., Boler, K. W., Handschy, J. W., and Ave Lallemant, H. G. , 1987, . Balanced Cross Sections Through the Central Brooks Range and North Slope, Arctic Alaska, AAPG, p. 19, 8 plates.
Otto, B. R. , 2006, . Personal Communication.
Otto,B., 2006, Arctic Progress Report: NovaGold Internal Report
Plafker, G., Jones, D.L., and Pessagno, E.A., Jr., 1977, A Cretaceous accretionary flysch and mélange terrane along the Gulf of Alaska margin in Blean, K.M. ed., The USGS in Alaska Accomplishments during 1976: USGS Survey Circ 751-B, p. B52-B54.
Proffett, J. M. , 1999, . Summary of Conclusions on Geology of the Arctic Deposit, AK: Kennecott Minerals Company Unpublished Report.
Randolph, M. P. , August 29, 1990, . Internal Kennecott Memo to T. J. Stephenson, Arctic Deposit.
Robertson Geoconsultants Inc. , December 1998, . Initial Assessment of Geochemical and Hydrological Conditions at Kennecott’s Arctic Project.
Rubin, C.M.,1982, Ambler Project Annual Report: Anaconda Metals Company Internal report.
Russell, R. H. , 1977, . Annual Report, Arctic Deposit: Bear Creek Mining Company Unpublished Report.
| Trilogy Metals Inc. | 27-5 | |
| NI 43-101 Technical Report on the Arctic Project, | | |
| Northwest Alaska | | |
Russell, R. H. , 1995, . Arctic Project 1995 Evaluation Report, Geologic Report: Kennecott Corporation Unpublished Report.
Schmandt, D., 2009, Mineralogy and origin of Zn-rich horizons within the ArcticvVolcanogenic Massive Sulfide deposit, Ambler District, Alaska. Undergraduate Thesis, Smith College, 59 p.
Schmidt, J. M. , 1983, . Geology and Geochemistry of the Arctic Prospect, Ambler District, Alaska: Unpublished Ph.D. dissertation, Stanford University.
Schmidt, J. M. , 1986, . Stratigraphic Setting and Mineralogy of the Arctic Volcanogenic Massive Sulfide Prospect, Ambler District, Alaska: Economic Geology v. 81. p. 1619-1643.
Schmidt, J. M. , 1988, . Mineral and Whole Rock Compositions of Seawater-Dominated Hydrothermal Alteration at the Arctic Volcanogenic Massive Sulfide Prospect, Alaska: Economic Geology v.83, p. 822-842.
SGS Metallurgy, 2012, Mineral Processing and Metallurgical Testing for the Arctic Deposit, an unpublished report prepared for Trilogy Metals.
Shaw Alaska Inc. , 2008, . Hydraulics Data Report July 2008 Event Final, Shaw Environmental, Inc.
Shaw Environmental Inc. , 2007, . Ambler Project, 2007 Environmental Baseline Sampling, Alaska Gold, Inc.
Shaw Environmental Inc. , 2008, . Water Quality Report July 2008 Event Final, Shaw Environmental, Inc.
Shaw Environmental Inc. , 2009, . Hydraulics Data Report July 2009 Event Draft, Shaw Environmental, Inc.
Shaw Environmental Inc. , 2009, . Water Quality Report July 2009 Event Final, Shaw Alaska, Inc.
Silberling, N.J., et al., 1992, Lithotectonic terrange map of the North American Cordillera, USGS.
SRK , 1998, . Arctic Project Preliminary Scoping Study. Prepared by SRK Consulting , U.S., Inc. for NovaCopper. Report Date March 9, 2012. 276 pages.
SRK , 2012, . NI 43-101 Preliminary Economic Assessment, Ambler Project, Kobuk, AK. Prepared by SRK Consulting Inc. for Kennecott Minerals Company. Report Date November, 1998. 69 pages.
SRK, 2011, Preliminary ML/ARD Analysis, Ambler District, Arctic Deposit, Alaska, an unpublished report prepared for Alaska Gold Company.
| Trilogy Metals Inc. | 27-6 | |
| NI 43-101 Technical Report on the Arctic Project, | | |
| Northwest Alaska | | |
SRK, 2016, Preliminary Results of ABA Testing for the Arctic Deposit, an unpublished report prepared for NovaCopper Inc.
SRK, 2017, Pre-Feasibility Slope Geotechnical and Hydrogeological Report for the Arctic Deposit (2016), an unpublished report prepared for NovaCopper Inc.
SRK, 2017, Status of Kinetic Tests, Arctic Copper Project, an unpublished report prepared for NovaCopper Inc.
Stephen R. Braund & Associates , 2012, . Ambler Mining District Access Road Subsistence Data Gap Memo, Prepared for the Alaska Department of Transportation and Public Facilities, May 2012.
Stephens, J.D., and Cameron, J.W. , 1970, Arctic Alaska Project – Mineralogic Study of Diamond Drill Core Samples: Technical Report 70-01. Kennecott Research Center – Metal Mining Division, 21 p.
Stevens, M.G., 1982, Ambler District Generalized District Petrology: Bear Creek Mining Company Internal report.
Tetra Tech , 2010a, . Arctic Deposit Access Environmental Baseline Data Collection - Hydrology, Ambler Mining District, Alaska, December 1, 2010.
Tetra Tech , 2010b, . Arctic Deposit Access Environmental Baseline Data Collection - Wetlands & Vegetation, Ambler Mining District, Alaska, November 24, 2010.
Tetra Tech , 2011, . Arctic Deposit Access Environmental Baseline Data Collection – Aquatics, Ambler Mining District, Alaska, January 20, 2011.
TetraTech, 2013, Preliminary Economic Assessment – Open Pit Mining of the Arctic Deposit, a report prepared for Trilogy Metals.
Till, A. B., Schmidt, J. M., and Nelson, S. W. , 1988, . Thrust Involvement of Metamorphic Rocks, Southwestern Brooks Range, Alaska: Geology, v. 16, p. 930-933.
Twelker, E., 2008, Progress Report: Immobile element lithogeochem work at Arctic: NovaGold Internal Report
URSA Engineering , 1998, . Arctic Project Rock Mass Characterization, Prepared for: Kennecott Minerals, Co., Unpublished Report, p. 49.
Vallat, C. , 2013a, . Memo to NovaCopper Inc. “Historic Pre-NovaGold, 2004, Arctic Assay Validations and Updates Within NovaCopper Database”: GeoSpark Consulting Inc. April 22, 2013.
Vallat, C. , 2013b, . “Quality Assurance and Quality Control Review on Analytical Results Related to the NovaCopper Inc. Arctic Project, pre-NovaGold , pre-2004, ”: GeoSpark Consulting Inc. unpublished report for NovaCopper Inc. April 22, 2013.
| Trilogy Metals Inc. | 27-7 | |
| NI 43-101 Technical Report on the Arctic Project, | | |
| Northwest Alaska | | |
Vallat, C. , 2013c, . “Quality Assurance and Quality Control Review on Analytical Results Related to the NovaCopper Inc. 2004 Arctic Project”: GeoSpark Consulting Inc. unpublished report for NovaCopper Inc. June 6, 2013.
Vallat, C. , 2013d, . “Quality Assurance and Quality Control Review on Analytical Results Related to the NovaCopper Inc. 2005 Arctic Project”: GeoSpark Consulting Inc. unpublished report for NovaCopper Inc. June 6, 2013.
Vallat, C. , 2013e, . “Quality Assurance and Quality Control Review on Analytical Results Related to the NovaCopper Inc. 2006 Arctic Project”: GeoSpark Consulting Inc. unpublished report for NovaCopper Inc. June 6, 2013.
Vallat, C. , 2013f, . “Quality Assurance and Quality Control Review on Analytical Results Related to the NovaCopper Inc. 2007 Arctic Project”: GeoSpark Consulting Inc. unpublished report for NovaCopper Inc. June 6, 2013.
Vallat, C. , 2013g, . “Quality Assurance and Quality Control Review on Analytical Results Related to the NovaCopper Inc. 2008 Arctic Project”: GeoSpark Consulting Inc. unpublished report for NovaCopper Inc. June 6, 2013.
Vallat, C. , 2013h, . Memo to NovaCopper Inc. “Arctic Projects 2011 Drill Program Assays Reported in 2013 – QAQC” GeoSpark Consulting Inc. May 31, 2013.
Vallat, C., 2015, Quality Assurance and Quality Control Review on Analytical Results on the Arctic Project, unpublished report prepared for NovaCopper Inc.
Vallat, C., 2016, Quality Assurance and Quality Control Review on Analytical Results on the Arctic Project, unpublished report prepared for NovaCopper Inc.
Vogl, J. J., Calvert, A. J., Gans, P. B. , 2003, . Mechanisms and Timing of Exhumation of Collision-Related Metamorphic Rocks, Southern Brooks Range, Alaska: Insights from Ar , 40, / Ar , 39, Thermochronology, Tectonics, v 21, No 3, p. 1-18.
W.L. Jacobsen, 1997, Arctic Project Mining Potential: Kennecott Exploration Internal report
Website: http://alaskamininghalloffame.org/inductees/berg.php, February 14, 2012.
West, A. , 2013, . Memo to E. Workman & GeoSpark Consulting Inc. “NovaCopper Arctic Project Database Verification”: Internal NovaCopper Inc. Memo, January 8, 2013
West, A., 2014, Identified 2013 Erroneous SG Measurements, internal memo prepared for NovaCopper.
Zieg, G. A., et al. , 2005, .. Ambler Project 2005 Progress Report, Unpublished Internal Report, Alaska Gold Company.
| Trilogy Metals Inc. | 27-8 | |
| NI 43-101 Technical Report on the Arctic Project, | | |
| Northwest Alaska | | |
| 28.0 | Certificates of Qualified Persons |
| 28.1 | Bruce M. Davis, FAusIMM |
CERTIFICATE of QUALIFIED PERSON
Bruce M. Davis, FAusIMM, BD Resource Consulting, Inc.
I, Bruce M. Davis, FAusIMM, do hereby certify that:
| 1. | I am an independent consultant of: |
BD Resource Consulting, Inc.
4253 Cheyenne Drive
Larkspur, Colorado USA 80118
| 2. | I graduated from the University of Wyoming with a Doctor of Philosophy (Geostatistics) in 1978. |
| 3. | I am a Fellow of the Australasian Institute of Mining and Metallurgy, Number 211185. |
| 4. | I have practiced my profession continuously for 39 years and have been involved in mineral resource and reserve estimations and feasibility studies on numerous underground and open pit base metal and gold deposits in Canada, the United States, Central and South America, Europe, Asia, Africa and Australia. |
| 5. | I have read the definition of “qualified person” set out in National Instrument 43-101 (“NI 43-101”) and certify that by reason of my education, affiliation with a professional association (as defined in NI 43-101) and past relevant work experience, I fulfill the requirements to be a “qualified person” for the purposes of NI 43-101. |
| 6. | I am the principle author of the technical report titledNI 43-101 Technical Report on the Arctic Project, Northwest Alaska, USA, dated November 9, 2017, with an effective date of April 25, 2017 (the “Technical Report”) and accept professional responsibility for Sections 1 through 12 and 15 through 26. |
| 7. | I visited the Arctic Property on 26-27 July 2011 and again on 25 September 2012 and again on 10-12 August 2015. |
| 8. | I have not had any prior involvement with the property that is the subject of the Technical Report. |
| Trilogy Metals Inc. | 28-1 | |
| NI 43-101 Technical Report on the Arctic Project, | | |
| Northwest Alaska | | |
| 9. | As of the effective date of the Technical Report, to the best of my knowledge, information and belief, the Technical Report contains all scientific and technical information that is required to be disclosed to make the Technical Report not misleading. |
| 10. | I am independent of Trilogy Metals Inc. applying all of the tests in Section 1.5 of NI 43-101. |
| 11. | I have read NI 43-101 and Form 43-101F1, and the Technical Report has been prepared in compliance with that instrument and form. |
Dated this 9th day of November, 2017
“original signed and sealed”
_____________________________________
Bruce M. Davis, FAusIMM
| Trilogy Metals Inc. | 28-2 | |
| NI 43-101 Technical Report on the Arctic Project, | | |
| Northwest Alaska | | |
CERTIFICATE of QUALIFIED PERSON
Robert Sim, P.Geo, SIM Geological Inc.
I, Robert Sim, P.Geo, do hereby certify that:
| 1. | I am an independent consultant of: |
SIM Geological Inc.
508 – 1950 Robson St., Vancouver
British Columbia, Canada V6G 1E8
| 2. | I graduated from Lakehead University with an Honours Bachelor of Science (Geology) in 1984. |
| 3. | I am a member, in good standing, of the Association of Professional Engineers and Geoscientists of British Columbia, License Number 24076. |
| 4. | I have practiced my profession continuously for 33 years and have been involved in mineral exploration, mine site geology and operations, mineral resource and reserve estimations and feasibility studies on numerous underground and open pit base metal and gold deposits in Canada, the United States, Central and South America, Europe, Asia, Africa and Australia. |
| 5. | I have read the definition of “qualified person” set out in National Instrument 43-101 (“NI 43-101”) and certify that by reason of my education, affiliation with a professional association (as defined in NI 43-101) and past relevant work experience, I fulfill the requirements to be a “qualified person” for the purposes of NI 43-101. |
| 6. | I am a co-author of the technical report titledNI 43-101 Technical Report on the Arctic Project, Northwest Alaska, USA, dated November 9, 2017, with an effective date of April 25, 2017 (the “Technical Report”), and accept professional responsibility for Section 14. |
| 7. | I have not visited the Arctic Property. |
| 8. | I have not had any prior involvement with the property that is the subject of the Technical Report. |
| 9. | As of the effective date of the Technical Report, to the best of my knowledge, information and belief, the Technical Report contains all scientific and technical information that is required to be disclosed to make the Technical Report not misleading. |
| 10. | I am independent of Trilogy Metals Inc. applying all of the tests in Section 1.5 of NI 43-101. |
| Trilogy Metals Inc. | 28-3 | |
| NI 43-101 Technical Report on the Arctic Project, | | |
| Northwest Alaska | | |
| 11. | I have read NI 43-101 and Form 43-101F1, and the Technical Report has been prepared in compliance with that instrument and form. |
Dated this 9th day of November, 2017
“original signed and sealed”
_____________________________________
Robert Sim, P.Geo
| Trilogy Metals Inc. | 28-4 | |
| NI 43-101 Technical Report on the Arctic Project, | | |
| Northwest Alaska | | |
| 28.3 | Jeffrey B. Austin, P.Eng. |
CERTIFICATE of QUALIFIED PERSON
Jeff Austin, P. Eng., International Metallurgical & Environmental Inc.
I, Jeffrey B. Austin, P. Eng., do hereby certify that:
| 1. | I am an independent consultant of International Metallurgical & Environmental Inc., located at 906 Fairway Crescent, Kelowna, B.C., and incorporated in 1995. |
| 2. | I graduated with a B.A.Sc. degree from the University of British Columbia in 1984. |
| 3. | I am a member, in good standing, of the Association of Professional Engineers and Geoscientists of British Columbia, License Number 15708. |
| 4. | I have practiced my profession continuously for 33 years and have been involved in the design, evaluation and operation of mineral processing facilities during that time. A majority of my professional practice has been the completion of test work and test work supervision related to feasibility and pre-feasibility studies of projects involving flotation technologies. |
| 5. | I have read the definition of “qualified person” set out in National Instrument 43-101 (“NI 43-101”) and certify that by reason of my education, affiliation with a professional association (as defined in NI 43-101) and past relevant work experience, I fulfill the requirements to be a “qualified person” for the purposes of NI 43-101. |
| 6. | I am responsible for the preparation of Section 13 of the Technical Report titled “NI 43-101 Technical Report on the Arctic Project, Northwest Alaska, USA” dated November 9, 2017, with an effective date of April 25, 2017 (the “Technical Report”). |
| 7. | I have not visited the Arctic property. |
| 8. | I have not had any prior involvement with the property that is the subject of the Technical Report. |
| 9. | As of the date of this certificate, to the best of my knowledge, information and belief, the Technical Report contains all scientific and technical information that is required to make the Technical Report not misleading. |
| 10. | I am independent of the issuer applying all of the tests in Section 1.5 of National Instrument 43-101. |
| 11. | I have read National Instrument 43-101 and Form 43-101F1, and the Technical Report has been prepared in compliance with that instrument and form. |
| Trilogy Metals Inc. | 28-5 | |
| NI 43-101 Technical Report on the Arctic Project, | | |
| Northwest Alaska | | |
Dated this 9th day of November, 2017
“original signed and sealed”
_____________________________________
Jeff Austin, P. Eng.
| Trilogy Metals Inc. | 28-6 | |
| NI 43-101 Technical Report on the Arctic Project, | | |
| Northwest Alaska | | |
Appendix A – List of Claims
| Lease | Name | Type | Current Area | Area Type | Meridian | Township | Range | Section | 1/4 Section |
| 540543 | Arctic 40A | State Claim | 2 | acres | Kateel River | 21N | 11E | 35 | SW |
| 540544 | Arctic 496A | State Claim | 2 | acres | Kateel River | 21N | 11E | 34 | SE |
| 540545 | Arctic 1001 | State Claim | 3 | acres | Kateel River | 21N | 11E | 34 | SE |
| 540546 | Arctic 1002 | State Claim | 8 | acres | Kateel River | 21N | 11E | 34 | SE & SW |
| 540549 | Arctic 1005 | State Claim | 5 | acres | Kateel River | 21N | 11E | 35 | SW |
| 546144 | SC 24 | State Claim | 40 | acres | Kateel River | 21N | 10E | 16 | SW & SE |
| 546145 | SC 25 | State Claim | 40 | acres | Kateel River | 21N | 10E | 16 | SW, SE, NW & NE |
| 546146 | SC 26 | State Claim | 40 | acres | Kateel River | 21N | 10E | 16 | NW & NE |
| 546147 | SC 34 | State Claim | 40 | acres | Kateel River | 21N | 10E | 16 | SE |
| 546148 | SC 35 | State Claim | 40 | acres | Kateel River | 21N | 10E | 16 | SE & NE |
| 546149 | SC 36 | State Claim | 40 | acres | Kateel River | 21N | 10E | 16 | NE |
| 546150 | SC 44 | State Claim | 40 | acres | Kateel River | 21N | 10E | 15; 16 | SW; SE |
| 546151 | SC 45 | State Claim | 40 | acres | Kateel River | 21N | 10E | 15; 16 | SW & NW; SE & NE |
| 546152 | SC 46 | State Claim | 40 | acres | Kateel River | 21N | 10E | 15; 16 | NW; NE |
| 546153 | SC 54 | State Claim | 40 | acres | Kateel River | 21N | 10E | 15 | SW |
| 546154 | SC 55 | State Claim | 40 | acres | Kateel River | 21N | 10E | 15 | SW & NW |
| 546155 | SC 56 | State Claim | 40 | acres | Kateel River | 21N | 10E | 15 | NW |
| 546156 | SC 64 | State Claim | 40 | acres | Kateel River | 21N | 10E | 15 | SW & SE |
| 546157 | SC 65 | State Claim | 40 | acres | Kateel River | 21N | 10E | 15 | SW, SE, NW & NE |
| 546158 | SC 66 | State Claim | 40 | acres | Kateel River | 21N | 10E | 15 | NW & NE |
| 590853 | AM 63-165 | State Claim | 40 | acres | Kateel River | 21N | 9E | 14 | NW |
| 590854 | AM 63-166 | State Claim | 40 | acres | Kateel River | 21N | 9E | 14 | NW |
| 590855 | AM 63-167 | State Claim | 40 | acres | Kateel River | 21N | 9E | 14 | NE |
| 590856 | AM 63-168 | State Claim | 40 | acres | Kateel River | 21N | 9E | 14 | NE |
| 590857 | AM 63-169 | State Claim | 40 | acres | Kateel River | 21N | 9E | 13 | NW |
| 590858 | AM 63-170 | State Claim | 40 | acres | Kateel River | 21N | 9E | 13 | NW |
| 590859 | AM 63-171 | State Claim | 40 | acres | Kateel River | 21N | 9E | 13 | NE |
| Appendix A - List of Claims | Page 1 of 52 |
| Trilogy Metals Inc. | | |
| NI 43-101 Technical Report on the Arctic Project, | | |
| Northwest Alaska | | |
| Lease | Name | Type | Current Area | Area Type | Meridian | Township | Range | Section | 1/4 Section |
| 590860 | AM 63-172 | State Claim | 40 | acres | Kateel River | 21N | 9E | 13 | NE |
| 590874 | AM 64-165 | State Claim | 40 | acres | Kateel River | 21N | 9E | 14 | NW |
| 590875 | AM 64-166 | State Claim | 40 | acres | Kateel River | 21N | 9E | 14 | NW |
| 590876 | AM 64-167 | State Claim | 40 | acres | Kateel River | 21N | 9E | 14 | NE |
| 590877 | AM 64-168 | State Claim | 40 | acres | Kateel River | 21N | 9E | 14 | NE |
| 590878 | AM 64-169 | State Claim | 40 | acres | Kateel River | 21N | 9E | 13 | NW |
| 590879 | AM 64-170 | State Claim | 40 | acres | Kateel River | 21N | 9E | 13 | NW |
| 590880 | AM 64-171 | State Claim | 40 | acres | Kateel River | 21N | 9E | 13 | NE |
| 590881 | AM 64-172 | State Claim | 40 | acres | Kateel River | 21N | 9E | 13 | NE |
| 590895 | AM 65-165 | State Claim | 40 | acres | Kateel River | 21N | 9E | 11 | SW |
| 590896 | AM 65-166 | State Claim | 40 | acres | Kateel River | 21N | 9E | 11 | SW |
| 590897 | AM 65-167 | State Claim | 40 | acres | Kateel River | 21N | 9E | 11 | SE |
| 590898 | AM 65-168 | State Claim | 40 | acres | Kateel River | 21N | 9E | 11 | SE |
| 590899 | AM 65-169 | State Claim | 40 | acres | Kateel River | 21N | 9E | 12 | SW |
| 590900 | AM 65-170 | State Claim | 40 | acres | Kateel River | 21N | 9E | 12 | SW |
| 590901 | AM 65-171 | State Claim | 40 | acres | Kateel River | 21N | 9E | 12 | SE |
| 590902 | AM 65-172 | State Claim | 40 | acres | Kateel River | 21N | 9E | 12 | SE |
| 590916 | AM 66-165 | State Claim | 40 | acres | Kateel River | 21N | 9E | 11 | SW |
| 590917 | AM 66-166 | State Claim | 40 | acres | Kateel River | 21N | 9E | 11 | SW |
| 590918 | AM 66-167 | State Claim | 40 | acres | Kateel River | 21N | 9E | 11 | SE |
| 590919 | AM 66-168 | State Claim | 40 | acres | Kateel River | 21N | 9E | 11 | SE |
| 590920 | AM 66-169 | State Claim | 40 | acres | Kateel River | 21N | 9E | 12 | SW |
| 590921 | AM 66-170 | State Claim | 40 | acres | Kateel River | 21N | 9E | 12 | SW |
| 590922 | AM 66-171 | State Claim | 40 | acres | Kateel River | 21N | 9E | 12 | SE |
| 590923 | AM 66-172 | State Claim | 40 | acres | Kateel River | 21N | 9E | 12 | SE |
| 590940 | AM 67-165 | State Claim | 40 | acres | Kateel River | 21N | 9E | 11 | NW |
| 590941 | AM 67-166 | State Claim | 40 | acres | Kateel River | 21N | 9E | 11 | NW |
| Appendix A - List of Claims | Page 2 of 52 |
| Trilogy Metals Inc. | | |
| NI 43-101 Technical Report on the Arctic Project, | | |
| Northwest Alaska | | |
| Lease | Name | Type | Current Area | Area Type | Meridian | Township | Range | Section | 1/4 Section |
| 590942 | AM 67-167 | State Claim | 40 | acres | Kateel River | 21N | 9E | 11 | NE |
| 590943 | AM 67-168 | State Claim | 40 | acres | Kateel River | 21N | 9E | 11 | NE |
| 590944 | AM 67-169 | State Claim | 40 | acres | Kateel River | 21N | 9E | 12 | NW |
| 590945 | AM 67-170 | State Claim | 40 | acres | Kateel River | 21N | 9E | 12 | NW |
| 590946 | AM 67-171 | State Claim | 40 | acres | Kateel River | 21N | 9E | 12 | NE |
| 590947 | AM 67-172 | State Claim | 40 | acres | Kateel River | 21N | 9E | 12 | NE |
| 590998 | AM 56-186 | State Claim | 40 | acres | Kateel River | 21N | 10E | 27 | NW |
| 590999 | AM 56-187 | State Claim | 40 | acres | Kateel River | 21N | 10E | 27 | NE |
| 591000 | AM 56-188 | State Claim | 40 | acres | Kateel River | 21N | 10E | 27 | NE |
| 591001 | AM 56-189 | State Claim | 40 | acres | Kateel River | 21N | 10E | 26 | NW |
| 591002 | AM 56-190 | State Claim | 40 | acres | Kateel River | 21N | 10E | 26 | NW |
| 591003 | AM 56-191 | State Claim | 40 | acres | Kateel River | 21N | 10E | 26 | NE |
| 591004 | AM 56-192 | State Claim | 40 | acres | Kateel River | 21N | 10E | 26 | NE |
| 591005 | AM 56-193 | State Claim | 40 | acres | Kateel River | 21N | 10E | 25 | NW |
| 591006 | AM 56-194 | State Claim | 40 | acres | Kateel River | 21N | 10E | 25 | NW |
| 591007 | AM 56-195 | State Claim | 40 | acres | Kateel River | 21N | 10E | 25 | NE |
| 591008 | AM 57-176 | State Claim | 40 | acres | Kateel River | 21N | 10E | 19 | SE |
| 591009 | AM 57-177 | State Claim | 40 | acres | Kateel River | 21N | 10E | 20 | SW |
| 591010 | AM 57-178 | State Claim | 40 | acres | Kateel River | 21N | 10E | 20 | SW |
| 591011 | AM 57-179 | State Claim | 40 | acres | Kateel River | 21N | 10E | 20 | SE |
| 591012 | AM 57-180 | State Claim | 40 | acres | Kateel River | 21N | 10E | 20 | SE |
| 591013 | AM 57-181 | State Claim | 40 | acres | Kateel River | 21N | 10E | 21 | SW |
| 591014 | AM 57-182 | State Claim | 40 | acres | Kateel River | 21N | 10E | 21 | SW |
| 591015 | AM 57-183 | State Claim | 40 | acres | Kateel River | 21N | 10E | 21 | SE |
| 591016 | AM 57-184 | State Claim | 40 | acres | Kateel River | 21N | 10E | 21 | SE |
| 591017 | AM 57-185 | State Claim | 40 | acres | Kateel River | 21N | 10E | 22 | SW |
| 591018 | AM 57-186 | State Claim | 40 | acres | Kateel River | 21N | 10E | 22 | SW |
| Appendix A - List of Claims | Page 3 of 52 |
| Trilogy Metals Inc. | | |
| NI 43-101 Technical Report on the Arctic Project, | | |
| Northwest Alaska | | |
| Lease | Name | Type | Current Area | Area Type | Meridian | Township | Range | Section | 1/4 Section |
| 591019 | AM 57-187 | State Claim | 40 | acres | Kateel River | 21N | 10E | 22 | SE |
| 591020 | AM 57-188 | State Claim | 40 | acres | Kateel River | 21N | 10E | 22 | SE |
| 591021 | AM 57-189 | State Claim | 40 | acres | Kateel River | 21N | 10E | 23 | SW |
| 591022 | AM 57-190 | State Claim | 40 | acres | Kateel River | 21N | 10E | 23 | SW |
| 591023 | AM 57-191 | State Claim | 40 | acres | Kateel River | 21N | 10E | 23 | SE |
| 591024 | AM 57-192 | State Claim | 40 | acres | Kateel River | 21N | 10E | 23 | SE |
| 591025 | AM 57-193 | State Claim | 40 | acres | Kateel River | 21N | 10E | 24 | SW |
| 591026 | AM 57-194 | State Claim | 40 | acres | Kateel River | 21N | 10E | 24 | SW |
| 591027 | AM 57-195 | State Claim | 40 | acres | Kateel River | 21N | 10E | 24 | SE |
| 591028 | AM 58-176 | State Claim | 40 | acres | Kateel River | 21N | 10E | 19 | SE |
| 591029 | AM 58-177 | State Claim | 40 | acres | Kateel River | 21N | 10E | 20 | SW |
| 591030 | AM 58-178 | State Claim | 40 | acres | Kateel River | 21N | 10E | 20 | SW |
| 591031 | AM 58-179 | State Claim | 40 | acres | Kateel River | 21N | 10E | 20 | SE |
| 591032 | AM 58-180 | State Claim | 40 | acres | Kateel River | 21N | 10E | 20 | SE |
| 591033 | AM 58-181 | State Claim | 40 | acres | Kateel River | 21N | 10E | 21 | SW |
| 591034 | AM 58-182 | State Claim | 40 | acres | Kateel River | 21N | 10E | 21 | SW |
| 591035 | AM 58-183 | State Claim | 40 | acres | Kateel River | 21N | 10E | 21 | SE |
| 591036 | AM 58-184 | State Claim | 40 | acres | Kateel River | 21N | 10E | 21 | SE |
| 591037 | AM 58-185 | State Claim | 40 | acres | Kateel River | 21N | 10E | 22 | SW |
| 591038 | AM 58-186 | State Claim | 40 | acres | Kateel River | 21N | 10E | 22 | SW |
| 591039 | AM 58-187 | State Claim | 40 | acres | Kateel River | 21N | 10E | 22 | SE |
| 591040 | AM 58-188 | State Claim | 40 | acres | Kateel River | 21N | 10E | 22 | SE |
| 591041 | AM 58-189 | State Claim | 40 | acres | Kateel River | 21N | 10E | 23 | SW |
| 591042 | AM 58-190 | State Claim | 40 | acres | Kateel River | 21N | 10E | 23 | SW |
| 591043 | AM 58-191 | State Claim | 40 | acres | Kateel River | 21N | 10E | 23 | SE |
| 591044 | AM 58-192 | State Claim | 40 | acres | Kateel River | 21N | 10E | 23 | SE |
| 591045 | AM 58-193 | State Claim | 40 | acres | Kateel River | 21N | 10E | 24 | SW |
| Appendix A - List of Claims | Page 4 of 52 |
| Trilogy Metals Inc. | | |
| NI 43-101 Technical Report on the Arctic Project, | | |
| Northwest Alaska | | |
| Lease | Name | Type | Current Area | Area Type | Meridian | Township | Range | Section | 1/4 Section |
| 591046 | AM 58-194 | State Claim | 40 | acres | Kateel River | 21N | 10E | 24 | SW |
| 591047 | AM 59-176 | State Claim | 40 | acres | Kateel River | 21N | 10E | 19 | NE |
| 591048 | AM 59-177 | State Claim | 40 | acres | Kateel River | 21N | 10E | 20 | NW |
| 591049 | AM 59-178 | State Claim | 40 | acres | Kateel River | 21N | 10E | 20 | NW |
| 591050 | AM 59-179 | State Claim | 40 | acres | Kateel River | 21N | 10E | 20 | NE |
| 591051 | AM 59-180 | State Claim | 40 | acres | Kateel River | 21N | 10E | 20 | NE |
| 591052 | AM 59-181 | State Claim | 40 | acres | Kateel River | 21N | 10E | 21 | NW |
| 591053 | AM 59-182 | State Claim | 40 | acres | Kateel River | 21N | 10E | 21 | NW |
| 591054 | AM 59-183 | State Claim | 40 | acres | Kateel River | 21N | 10E | 21 | NE |
| 591055 | AM 59-184 | State Claim | 40 | acres | Kateel River | 21N | 10E | 21 | NE |
| 591056 | AM 59-185 | State Claim | 40 | acres | Kateel River | 21N | 10E | 22 | NW |
| 591057 | AM 59-186 | State Claim | 40 | acres | Kateel River | 21N | 10E | 22 | NW |
| 591058 | AM 59-187 | State Claim | 40 | acres | Kateel River | 21N | 10E | 22 | NE |
| 591059 | AM 59-188 | State Claim | 40 | acres | Kateel River | 21N | 10E | 22 | NE |
| 591060 | AM 59-189 | State Claim | 40 | acres | Kateel River | 21N | 10E | 23 | NW |
| 591061 | AM 59-190 | State Claim | 40 | acres | Kateel River | 21N | 10E | 23 | NW |
| 591062 | AM 59-191 | State Claim | 40 | acres | Kateel River | 21N | 10E | 23 | NE |
| 591063 | AM 59-192 | State Claim | 40 | acres | Kateel River | 21N | 10E | 23 | NE |
| 591064 | AM 59-193 | State Claim | 40 | acres | Kateel River | 21N | 10E | 24 | NW |
| 591065 | AM 60-176 | State Claim | 40 | acres | Kateel River | 21N | 10E | 19 | NE |
| 591066 | AM 60-177 | State Claim | 40 | acres | Kateel River | 21N | 10E | 20 | NW |
| 591067 | AM 60-178 | State Claim | 40 | acres | Kateel River | 21N | 10E | 20 | NW |
| 591068 | AM 60-179 | State Claim | 40 | acres | Kateel River | 21N | 10E | 20 | NE |
| 591069 | AM 60-180 | State Claim | 40 | acres | Kateel River | 21N | 10E | 20 | NE |
| 591070 | AM 60-181 | State Claim | 40 | acres | Kateel River | 21N | 10E | 21 | NW |
| 591071 | AM 60-182 | State Claim | 40 | acres | Kateel River | 21N | 10E | 21 | NW |
| 591072 | AM 60-183 | State Claim | 40 | acres | Kateel River | 21N | 10E | 21 | NE |
| Appendix A - List of Claims | Page 5 of 52 |
| Trilogy Metals Inc. | | |
| NI 43-101 Technical Report on the Arctic Project, | | |
| Northwest Alaska | | |
| Lease | Name | Type | Current Area | Area Type | Meridian | Township | Range | Section | 1/4 Section |
| 591073 | AM 60-184 | State Claim | 40 | acres | Kateel River | 21N | 10E | 21 | NE |
| 591074 | AM 60-185 | State Claim | 40 | acres | Kateel River | 21N | 10E | 22 | NW |
| 591075 | AM 60-186 | State Claim | 40 | acres | Kateel River | 21N | 10E | 22 | NW |
| 591076 | AM 60-187 | State Claim | 40 | acres | Kateel River | 21N | 10E | 22 | NE |
| 591077 | AM 60-188 | State Claim | 40 | acres | Kateel River | 21N | 10E | 22 | NE |
| 591078 | AM 60-189 | State Claim | 40 | acres | Kateel River | 21N | 10E | 23 | NW |
| 591079 | AM 60-190 | State Claim | 40 | acres | Kateel River | 21N | 10E | 23 | NW |
| 591080 | AM 60-191 | State Claim | 40 | acres | Kateel River | 21N | 10E | 23 | NE |
| 591081 | AM 60-192 | State Claim | 40 | acres | Kateel River | 21N | 10E | 23 | NE |
| 591082 | AM 60-193 | State Claim | 40 | acres | Kateel River | 21N | 10E | 24 | NW |
| 591083 | AM 61-176 | State Claim | 40 | acres | Kateel River | 21N | 10E | 18 | SE |
| 591084 | AM 61-177 | State Claim | 40 | acres | Kateel River | 21N | 10E | 17 | SW |
| 591085 | AM 61-178 | State Claim | 40 | acres | Kateel River | 21N | 10E | 17 | SW |
| 591086 | AM 61-179 | State Claim | 40 | acres | Kateel River | 21N | 10E | 17 | SE |
| 591087 | AM 61-180 | State Claim | 40 | acres | Kateel River | 21N | 10E | 17 | SE |
| 591088 | AM 61-181 | State Claim | 40 | acres | Kateel River | 21N | 10E | 16 | SW |
| 591089 | AM 61-182 | State Claim | 40 | acres | Kateel River | 21N | 10E | 16 | SW |
| 591090 | AM 61-183 | State Claim | 40 | acres | Kateel River | 21N | 10E | 16 | SE |
| 591091 | AM 61-184 | State Claim | 40 | acres | Kateel River | 21N | 10E | 16 | SE |
| 591092 | AM 61-185 | State Claim | 40 | acres | Kateel River | 21N | 10E | 15 | SW |
| 591093 | AM 61-186 | State Claim | 40 | acres | Kateel River | 21N | 10E | 15 | SW |
| 591094 | AM 61-187 | State Claim | 40 | acres | Kateel River | 21N | 10E | 15 | SE |
| 591095 | AM 61-188 | State Claim | 40 | acres | Kateel River | 21N | 10E | 15 | SE |
| 591096 | AM 61-189 | State Claim | 40 | acres | Kateel River | 21N | 10E | 14 | SW |
| 591097 | AM 61-190 | State Claim | 40 | acres | Kateel River | 21N | 10E | 14 | SW |
| 591098 | AM 61-191 | State Claim | 40 | acres | Kateel River | 21N | 10E | 14 | SE |
| 591099 | AM 61-192 | State Claim | 40 | acres | Kateel River | 21N | 10E | 14 | SE |
| Appendix A - List of Claims | Page 6 of 52 |
| Trilogy Metals Inc. | | |
| NI 43-101 Technical Report on the Arctic Project, | | |
| Northwest Alaska | | |
| Lease | Name | Type | Current Area | Area Type | Meridian | Township | Range | Section | 1/4 Section |
| 591100 | AM 61-193 | State Claim | 40 | acres | Kateel River | 21N | 10E | 13 | SW |
| 591101 | AM 62-176 | State Claim | 40 | acres | Kateel River | 21N | 10E | 18 | SE |
| 591102 | AM 62-177 | State Claim | 40 | acres | Kateel River | 21N | 10E | 17 | SW |
| 591103 | AM 62-178 | State Claim | 40 | acres | Kateel River | 21N | 10E | 17 | SW |
| 591104 | AM 62-179 | State Claim | 40 | acres | Kateel River | 21N | 10E | 17 | SE |
| 591105 | AM 62-180 | State Claim | 40 | acres | Kateel River | 21N | 10E | 17 | SE |
| 591106 | AM 62-181 | State Claim | 40 | acres | Kateel River | 21N | 10E | 16 | SW |
| 591107 | AM 62-182 | State Claim | 40 | acres | Kateel River | 21N | 10E | 16 | SW |
| 591108 | AM 62-187 | State Claim | 40 | acres | Kateel River | 21N | 10E | 15 | SE |
| 591109 | AM 62-188 | State Claim | 40 | acres | Kateel River | 21N | 10E | 15 | SE |
| 591110 | AM 62-189 | State Claim | 40 | acres | Kateel River | 21N | 10E | 14 | SW |
| 591111 | AM 62-190 | State Claim | 40 | acres | Kateel River | 21N | 10E | 14 | SW |
| 591112 | AM 62-191 | State Claim | 40 | acres | Kateel River | 21N | 10E | 14 | SE |
| 591113 | AM 62-192 | State Claim | 40 | acres | Kateel River | 21N | 10E | 14 | SE |
| 591114 | AM 62-193 | State Claim | 40 | acres | Kateel River | 21N | 10E | 13 | SW |
| 591115 | AM 63-173 | State Claim | 38 | acres | Kateel River | 21N | 10E | 18 | NW |
| 591116 | AM 63-174 | State Claim | 40 | acres | Kateel River | 21N | 10E | 18 | NW |
| 591117 | AM 63-175 | State Claim | 40 | acres | Kateel River | 21N | 10E | 18 | NE |
| 591118 | AM 63-176 | State Claim | 40 | acres | Kateel River | 21N | 10E | 18 | NE |
| 591119 | AM 63-177 | State Claim | 40 | acres | Kateel River | 21N | 10E | 17 | NW |
| 591120 | AM 63-178 | State Claim | 40 | acres | Kateel River | 21N | 10E | 17 | NW |
| 591121 | AM 63-179 | State Claim | 40 | acres | Kateel River | 21N | 10E | 17 | NE |
| 591122 | AM 63-180 | State Claim | 40 | acres | Kateel River | 21N | 10E | 17 | NE |
| 591123 | AM 63-181 | State Claim | 40 | acres | Kateel River | 21N | 10E | 16 | NW |
| 591124 | AM 63-182 | State Claim | 40 | acres | Kateel River | 21N | 10E | 16 | NW |
| 591125 | AM 63-187 | State Claim | 40 | acres | Kateel River | 21N | 10E | 15 | NE |
| 591126 | AM 63-188 | State Claim | 40 | acres | Kateel River | 21N | 10E | 15 | NE |
| Appendix A - List of Claims | Page 7 of 52 |
| Trilogy Metals Inc. | | |
| NI 43-101 Technical Report on the Arctic Project, | | |
| Northwest Alaska | | |
| Lease | Name | Type | Current Area | Area Type | Meridian | Township | Range | Section | 1/4 Section |
| 591127 | AM 63-189 | State Claim | 40 | acres | Kateel River | 21N | 10E | 14 | NW |
| 591128 | AM 63-190 | State Claim | 40 | acres | Kateel River | 21N | 10E | 14 | NW |
| 591129 | AM 63-191 | State Claim | 40 | acres | Kateel River | 21N | 10E | 14 | NE |
| 591130 | AM 63-192 | State Claim | 40 | acres | Kateel River | 21N | 10E | 14 | NE |
| 591131 | AM 63-193 | State Claim | 40 | acres | Kateel River | 21N | 10E | 13 | NW |
| 591132 | AM 64-173 | State Claim | 38 | acres | Kateel River | 21N | 10E | 18 | NW |
| 591133 | AM 64-174 | State Claim | 40 | acres | Kateel River | 21N | 10E | 18 | NW |
| 591134 | AM 64-175 | State Claim | 40 | acres | Kateel River | 21N | 10E | 18 | NE |
| 591135 | AM 64-176 | State Claim | 40 | acres | Kateel River | 21N | 10E | 18 | NE |
| 591136 | AM 64-177 | State Claim | 40 | acres | Kateel River | 21N | 10E | 17 | NW |
| 591137 | AM 64-178 | State Claim | 40 | acres | Kateel River | 21N | 10E | 17 | NW |
| 591138 | AM 64-179 | State Claim | 40 | acres | Kateel River | 21N | 10E | 17 | NE |
| 591139 | AM 64-180 | State Claim | 40 | acres | Kateel River | 21N | 10E | 17 | NE |
| 591140 | AM 64-181 | State Claim | 40 | acres | Kateel River | 21N | 10E | 16 | NW |
| 591141 | AM 64-182 | State Claim | 40 | acres | Kateel River | 21N | 10E | 16 | NW |
| 591142 | AM 64-183 | State Claim | 40 | acres | Kateel River | 21N | 10E | 16 | NE |
| 591143 | AM 64-184 | State Claim | 40 | acres | Kateel River | 21N | 10E | 16 | NE |
| 591144 | AM 64-185 | State Claim | 40 | acres | Kateel River | 21N | 10E | 15 | NW |
| 591145 | AM 64-186 | State Claim | 40 | acres | Kateel River | 21N | 10E | 15 | NW |
| 591146 | AM 64-187 | State Claim | 40 | acres | Kateel River | 21N | 10E | 15 | NE |
| 591147 | AM 64-188 | State Claim | 40 | acres | Kateel River | 21N | 10E | 15 | NE |
| 591148 | AM 64-189 | State Claim | 40 | acres | Kateel River | 21N | 10E | 14 | NW |
| 591149 | AM 64-190 | State Claim | 40 | acres | Kateel River | 21N | 10E | 14 | NW |
| 591150 | AM 64-191 | State Claim | 40 | acres | Kateel River | 21N | 10E | 14 | NE |
| 591151 | AM 64-192 | State Claim | 40 | acres | Kateel River | 21N | 10E | 14 | NE |
| 591152 | AM 64-193 | State Claim | 40 | acres | Kateel River | 21N | 10E | 13 | NW |
| 591153 | AM 65-173 | State Claim | 38 | acres | Kateel River | 21N | 10E | 7 | SW |
| Appendix A - List of Claims | Page 8 of 52 |
| Trilogy Metals Inc. | | |
| NI 43-101 Technical Report on the Arctic Project, | | |
| Northwest Alaska | | |
| Lease | Name | Type | Current Area | Area Type | Meridian | Township | Range | Section | 1/4 Section |
| 591154 | AM 65-174 | State Claim | 40 | acres | Kateel River | 21N | 10E | 7 | SW |
| 591155 | AM 65-175 | State Claim | 40 | acres | Kateel River | 21N | 10E | 7 | SE |
| 591156 | AM 65-176 | State Claim | 40 | acres | Kateel River | 21N | 10E | 7 | SE |
| 591157 | AM 65-177 | State Claim | 40 | acres | Kateel River | 21N | 10E | 8 | SW |
| 591158 | AM 65-178 | State Claim | 40 | acres | Kateel River | 21N | 10E | 8 | SW |
| 591159 | AM 65-179 | State Claim | 40 | acres | Kateel River | 21N | 10E | 8 | SE |
| 591160 | AM 65-180 | State Claim | 40 | acres | Kateel River | 21N | 10E | 8 | SE |
| 591161 | AM 65-181 | State Claim | 40 | acres | Kateel River | 21N | 10E | 9 | SW |
| 591162 | AM 65-182 | State Claim | 40 | acres | Kateel River | 21N | 10E | 9 | SW |
| 591163 | AM 65-183 | State Claim | 40 | acres | Kateel River | 21N | 10E | 9 | SE |
| 591164 | AM 65-184 | State Claim | 40 | acres | Kateel River | 21N | 10E | 9 | SE |
| 591165 | AM 65-185 | State Claim | 40 | acres | Kateel River | 21N | 10E | 10 | SW |
| 591166 | AM 65-186 | State Claim | 40 | acres | Kateel River | 21N | 10E | 10 | SW |
| 591167 | AM 65-187 | State Claim | 40 | acres | Kateel River | 21N | 10E | 10 | SE |
| 591168 | AM 65-188 | State Claim | 40 | acres | Kateel River | 21N | 10E | 10 | SE |
| 591169 | AM 65-189 | State Claim | 40 | acres | Kateel River | 21N | 10E | 11 | SW |
| 591170 | AM 65-190 | State Claim | 40 | acres | Kateel River | 21N | 10E | 11 | SW |
| 591171 | AM 65-191 | State Claim | 40 | acres | Kateel River | 21N | 10E | 11 | SE |
| 591172 | AM 65-192 | State Claim | 40 | acres | Kateel River | 21N | 10E | 11 | SE |
| 591173 | AM 65-193 | State Claim | 40 | acres | Kateel River | 21N | 10E | 12 | SW |
| 591174 | AM 66-173 | State Claim | 37 | acres | Kateel River | 21N | 10E | 7 | SW |
| 591175 | AM 66-174 | State Claim | 40 | acres | Kateel River | 21N | 10E | 7 | SW |
| 591176 | AM 66-175 | State Claim | 40 | acres | Kateel River | 21N | 10E | 7 | SE |
| 591177 | AM 66-176 | State Claim | 40 | acres | Kateel River | 21N | 10E | 7 | SE |
| 591178 | AM 66-177 | State Claim | 40 | acres | Kateel River | 21N | 10E | 8 | SW |
| 591179 | AM 66-178 | State Claim | 40 | acres | Kateel River | 21N | 10E | 8 | SW |
| 591180 | AM 66-179 | State Claim | 40 | acres | Kateel River | 21N | 10E | 8 | SE |
| Appendix A - List of Claims | Page 9 of 52 |
| Trilogy Metals Inc. | | |
| NI 43-101 Technical Report on the Arctic Project, | | |
| Northwest Alaska | | |
| Lease | Name | Type | Current Area | Area Type | Meridian | Township | Range | Section | 1/4 Section |
| 591181 | AM 66-180 | State Claim | 40 | acres | Kateel River | 21N | 10E | 8 | SE |
| 591182 | AM 66-181 | State Claim | 40 | acres | Kateel River | 21N | 10E | 9 | SW |
| 591183 | AM 66-182 | State Claim | 40 | acres | Kateel River | 21N | 10E | 9 | SW |
| 591184 | AM 66-183 | State Claim | 40 | acres | Kateel River | 21N | 10E | 9 | SE |
| 591185 | AM 66-184 | State Claim | 40 | acres | Kateel River | 21N | 10E | 9 | SE |
| 591186 | AM 66-185 | State Claim | 40 | acres | Kateel River | 21N | 10E | 10 | SW |
| 591187 | AM 66-186 | State Claim | 40 | acres | Kateel River | 21N | 10E | 10 | SW |
| 591188 | AM 66-187 | State Claim | 40 | acres | Kateel River | 21N | 10E | 10 | SE |
| 591189 | AM 66-188 | State Claim | 40 | acres | Kateel River | 21N | 10E | 10 | SE |
| 591190 | AM 66-189 | State Claim | 40 | acres | Kateel River | 21N | 10E | 11 | SW |
| 591191 | AM 66-190 | State Claim | 40 | acres | Kateel River | 21N | 10E | 11 | SW |
| 591192 | AM 66-191 | State Claim | 40 | acres | Kateel River | 21N | 10E | 11 | SE |
| 591193 | AM 66-192 | State Claim | 40 | acres | Kateel River | 21N | 10E | 11 | SE |
| 591194 | AM 66-193 | State Claim | 40 | acres | Kateel River | 21N | 10E | 12 | SW |
| 591195 | AM 67-173 | State Claim | 37 | acres | Kateel River | 21N | 10E | 7 | NW |
| 591196 | AM 67-174 | State Claim | 40 | acres | Kateel River | 21N | 10E | 7 | NW |
| 591197 | AM 67-175 | State Claim | 40 | acres | Kateel River | 21N | 10E | 7 | NE |
| 591198 | AM 67-176 | State Claim | 40 | acres | Kateel River | 21N | 10E | 7 | NE |
| 591199 | AM 67-177 | State Claim | 40 | acres | Kateel River | 21N | 10E | 8 | NW |
| 591200 | AM 67-178 | State Claim | 40 | acres | Kateel River | 21N | 10E | 8 | NW |
| 591201 | AM 67-179 | State Claim | 40 | acres | Kateel River | 21N | 10E | 8 | NE |
| 591202 | AM 67-180 | State Claim | 40 | acres | Kateel River | 21N | 10E | 8 | NE |
| 591203 | AM 67-181 | State Claim | 40 | acres | Kateel River | 21N | 10E | 9 | NW |
| 591204 | AM 67-182 | State Claim | 40 | acres | Kateel River | 21N | 10E | 9 | NW |
| 591205 | AM 67-183 | State Claim | 40 | acres | Kateel River | 21N | 10E | 9 | NE |
| 591206 | AM 67-184 | State Claim | 40 | acres | Kateel River | 21N | 10E | 9 | NE |
| 591207 | AM 67-185 | State Claim | 40 | acres | Kateel River | 21N | 10E | 10 | NW |
| Appendix A - List of Claims | Page 10 of 52 |
| Trilogy Metals Inc. | | |
| NI 43-101 Technical Report on the Arctic Project, | | |
| Northwest Alaska | | |
| Lease | Name | Type | Current Area | Area Type | Meridian | Township | Range | Section | 1/4 Section |
| 591208 | AM 67-186 | State Claim | 40 | acres | Kateel River | 21N | 10E | 10 | NW |
| 591209 | AM 67-187 | State Claim | 40 | acres | Kateel River | 21N | 10E | 10 | NE |
| 591210 | AM 67-188 | State Claim | 40 | acres | Kateel River | 21N | 10E | 10 | NE |
| 591211 | AM 67-189 | State Claim | 40 | acres | Kateel River | 21N | 10E | 11 | NW |
| 591212 | AM 67-190 | State Claim | 40 | acres | Kateel River | 21N | 10E | 11 | NW |
| 591213 | AM 67-191 | State Claim | 40 | acres | Kateel River | 21N | 10E | 11 | NE |
| 591214 | AM 67-192 | State Claim | 40 | acres | Kateel River | 21N | 10E | 11 | NE |
| 591215 | AM 67-193 | State Claim | 40 | acres | Kateel River | 21N | 10E | 12 | NW |
| 591216 | AM 67-194 | State Claim | 40 | acres | Kateel River | 21N | 10E | 12 | NW |
| 591217 | AM 67-195 | State Claim | 40 | acres | Kateel River | 21N | 10E | 12 | NE |
| 591218 | AM 67-196 | State Claim | 40 | acres | Kateel River | 21N | 10E | 12 | NE |
| 591219 | AM 49-206 | State Claim | 40 | acres | Kateel River | 21N | 11E | 33 | SW |
| 591220 | AM 49-207 | State Claim | 40 | acres | Kateel River | 21N | 11E | 33 | SE |
| 591221 | AM 49-208 | State Claim | 40 | acres | Kateel River | 21N | 11E | 33 | SE |
| 591222 | AM 49-209 | State Claim | 40 | acres | Kateel River | 21N | 11E | 34 | SW |
| 591223 | AM 49-210 | State Claim | 31 | acres | Kateel River | 21N | 11E | 34 | SW |
| 591224 | AM 49-214 | State Claim | 33 | acres | Kateel River | 21N | 11E | 35 | SW |
| 591225 | AM 49-215 | State Claim | 40 | acres | Kateel River | 21N | 11E | 35 | SE |
| 591226 | AM 49-216 | State Claim | 40 | acres | Kateel River | 21N | 11E | 35 | SE |
| 591227 | AM 49-217 | State Claim | 40 | acres | Kateel River | 21N | 11E | 36 | SW |
| 591228 | AM 49-218 | State Claim | 40 | acres | Kateel River | 21N | 11E | 36 | SW |
| 591229 | AM 49-219 | State Claim | 40 | acres | Kateel River | 21N | 11E | 36 | SE |
| 591230 | AM 49-220 | State Claim | 40 | acres | Kateel River | 21N | 11E | 36 | SE |
| 591231 | AM 50-206 | State Claim | 40 | acres | Kateel River | 21N | 11E | 33 | SW |
| 591232 | AM 50-207 | State Claim | 40 | acres | Kateel River | 21N | 11E | 33 | SE |
| 591233 | AM 50-208 | State Claim | 40 | acres | Kateel River | 21N | 11E | 33 | SE |
| 591234 | AM 50-209 | State Claim | 40 | acres | Kateel River | 21N | 11E | 34 | SW |
| Appendix A - List of Claims | Page 11 of 52 |
| Trilogy Metals Inc. | | |
| NI 43-101 Technical Report on the Arctic Project, | | |
| Northwest Alaska | | |
| Lease | Name | Type | Current Area | Area Type | Meridian | Township | Range | Section | 1/4 Section |
| 591235 | AM 50-210 | State Claim | 38 | acres | Kateel River | 21N | 11E | 34 | SW |
| 591236 | AM 50-211 | State Claim | 9 | acres | Kateel River | 21N | 11E | 34 | SE |
| 591237 | AM 50-213 | State Claim | 4 | acres | Kateel River | 21N | 11E | 35 | SW |
| 591238 | AM 50-214 | State Claim | 38 | acres | Kateel River | 21N | 11E | 35 | SW |
| 591239 | AM 50-215 | State Claim | 40 | acres | Kateel River | 21N | 11E | 35 | SE |
| 591240 | AM 50-216 | State Claim | 40 | acres | Kateel River | 21N | 11E | 35 | SE |
| 591241 | AM 50-217 | State Claim | 40 | acres | Kateel River | 21N | 11E | 36 | SW |
| 591242 | AM 50-218 | State Claim | 40 | acres | Kateel River | 21N | 11E | 36 | SW |
| 591243 | AM 50-219 | State Claim | 40 | acres | Kateel River | 21N | 11E | 36 | SE |
| 591244 | AM 50-220 | State Claim | 40 | acres | Kateel River | 21N | 11E | 36 | SE |
| 591245 | AM 51-206 | State Claim | 40 | acres | Kateel River | 21N | 11E | 33 | NW |
| 591246 | AM 51-207 | State Claim | 40 | acres | Kateel River | 21N | 11E | 33 | NE |
| 591247 | AM 51-208 | State Claim | 40 | acres | Kateel River | 21N | 11E | 33 | NE |
| 591248 | AM 51-209 | State Claim | 40 | acres | Kateel River | 21N | 11E | 34 | NW |
| 591249 | AM 51-210 | State Claim | 40 | acres | Kateel River | 21N | 11E | 34 | NW |
| 591250 | AM 51-211 | State Claim | 37 | acres | Kateel River | 21N | 11E | 34 | NE |
| 591251 | AM 51-212 | State Claim | 30 | acres | Kateel River | 21N | 11E | 34 | NE |
| 591252 | AM 51-213 | State Claim | 15 | acres | Kateel River | 21N | 11E | 35 | NW |
| 591253 | AM 51-214 | State Claim | 40 | acres | Kateel River | 21N | 11E | 35 | NW |
| 591254 | AM 51-215 | State Claim | 40 | acres | Kateel River | 21N | 11E | 35 | NE |
| 591255 | AM 51-216 | State Claim | 40 | acres | Kateel River | 21N | 11E | 35 | NE |
| 591256 | AM 51-217 | State Claim | 40 | acres | Kateel River | 21N | 11E | 36 | NW |
| 591257 | AM 51-218 | State Claim | 40 | acres | Kateel River | 21N | 11E | 36 | NW |
| 591258 | AM 51-219 | State Claim | 40 | acres | Kateel River | 21N | 11E | 36 | NE |
| 591259 | AM 51-220 | State Claim | 40 | acres | Kateel River | 21N | 11E | 36 | NE |
| 591260 | AM 52-206 | State Claim | 40 | acres | Kateel River | 21N | 11E | 33 | NW |
| 591261 | AM 52-207 | State Claim | 40 | acres | Kateel River | 21N | 11E | 33 | NE |
| Appendix A - List of Claims | Page 12 of 52 |
| Trilogy Metals Inc. | | |
| NI 43-101 Technical Report on the Arctic Project, | | |
| Northwest Alaska | | |
| Lease | Name | Type | Current Area | Area Type | Meridian | Township | Range | Section | 1/4 Section |
| 591262 | AM 52-208 | State Claim | 40 | acres | Kateel River | 21N | 11E | 33 | NE |
| 591263 | AM 52-209 | State Claim | 40 | acres | Kateel River | 21N | 11E | 34 | NW |
| 591264 | AM 52-210 | State Claim | 40 | acres | Kateel River | 21N | 11E | 34 | NW |
| 591265 | AM 52-211 | State Claim | 40 | acres | Kateel River | 21N | 11E | 34 | NE |
| 591266 | AM 52-212 | State Claim | 40 | acres | Kateel River | 21N | 11E | 34 | NE |
| 591267 | AM 52-213 | State Claim | 39 | acres | Kateel River | 21N | 11E | 35 | NW |
| 591268 | AM 52-214 | State Claim | 40 | acres | Kateel River | 21N | 11E | 35 | NW |
| 591269 | AM 52-215 | State Claim | 40 | acres | Kateel River | 21N | 11E | 35 | NE |
| 591270 | AM 52-216 | State Claim | 40 | acres | Kateel River | 21N | 11E | 35 | NE |
| 591271 | AM 52-217 | State Claim | 40 | acres | Kateel River | 21N | 11E | 36 | NW |
| 591272 | AM 52-218 | State Claim | 40 | acres | Kateel River | 21N | 11E | 36 | NW |
| 591273 | AM 52-219 | State Claim | 40 | acres | Kateel River | 21N | 11E | 36 | NE |
| 591274 | AM 52-220 | State Claim | 40 | acres | Kateel River | 21N | 11E | 36 | NE |
| 591275 | AM 53-206 | State Claim | 40 | acres | Kateel River | 21N | 11E | 28 | SW |
| 591276 | AM 53-207 | State Claim | 40 | acres | Kateel River | 21N | 11E | 28 | SE |
| 591277 | AM 53-208 | State Claim | 40 | acres | Kateel River | 21N | 11E | 28 | SE |
| 591278 | AM 53-209 | State Claim | 40 | acres | Kateel River | 21N | 11E | 27 | SW |
| 591279 | AM 53-210 | State Claim | 40 | acres | Kateel River | 21N | 11E | 27 | SW |
| 591280 | AM 53-211 | State Claim | 40 | acres | Kateel River | 21N | 11E | 27 | SE |
| 591281 | AM 53-212 | State Claim | 40 | acres | Kateel River | 21N | 11E | 27 | SE |
| 591282 | AM 53-213 | State Claim | 40 | acres | Kateel River | 21N | 11E | 26 | SW |
| 591283 | AM 53-214 | State Claim | 40 | acres | Kateel River | 21N | 11E | 26 | SW |
| 591284 | AM 53-215 | State Claim | 40 | acres | Kateel River | 21N | 11E | 26 | SE |
| 591285 | AM 53-216 | State Claim | 40 | acres | Kateel River | 21N | 11E | 26 | SE |
| 591286 | AM 53-217 | State Claim | 40 | acres | Kateel River | 21N | 11E | 25 | SW |
| 591287 | AM 53-218 | State Claim | 40 | acres | Kateel River | 21N | 11E | 25 | SW |
| 591288 | AM 53-219 | State Claim | 40 | acres | Kateel River | 21N | 11E | 25 | SE |
| Appendix A - List of Claims | Page 13 of 52 |
| Trilogy Metals Inc. | | |
| NI 43-101 Technical Report on the Arctic Project, | | |
| Northwest Alaska | | |
| Lease | Name | Type | Current Area | Area Type | Meridian | Township | Range | Section | 1/4 Section |
| 591289 | AM 53-220 | State Claim | 40 | acres | Kateel River | 21N | 11E | 25 | SE |
| 591290 | AM 54-206 | State Claim | 40 | acres | Kateel River | 21N | 11E | 28 | SW |
| 591291 | AM 54-207 | State Claim | 40 | acres | Kateel River | 21N | 11E | 28 | SE |
| 591292 | AM 54-208 | State Claim | 40 | acres | Kateel River | 21N | 11E | 28 | SE |
| 591293 | AM 54-209 | State Claim | 40 | acres | Kateel River | 21N | 11E | 27 | SW |
| 591294 | AM 54-210 | State Claim | 40 | acres | Kateel River | 21N | 11E | 27 | SW |
| 591295 | AM 54-211 | State Claim | 40 | acres | Kateel River | 21N | 11E | 27 | SE |
| 591296 | AM 54-212 | State Claim | 40 | acres | Kateel River | 21N | 11E | 27 | SE |
| 591297 | AM 54-213 | State Claim | 40 | acres | Kateel River | 21N | 11E | 26 | SW |
| 591298 | AM 54-214 | State Claim | 40 | acres | Kateel River | 21N | 11E | 26 | SW |
| 591299 | AM 54-215 | State Claim | 40 | acres | Kateel River | 21N | 11E | 26 | SE |
| 591300 | AM 54-216 | State Claim | 40 | acres | Kateel River | 21N | 11E | 26 | SE |
| 591301 | AM 54-217 | State Claim | 40 | acres | Kateel River | 21N | 11E | 25 | SW |
| 591302 | AM 54-218 | State Claim | 40 | acres | Kateel River | 21N | 11E | 25 | SW |
| 591303 | AM 54-219 | State Claim | 40 | acres | Kateel River | 21N | 11E | 25 | SE |
| 591304 | AM 54-220 | State Claim | 40 | acres | Kateel River | 21N | 11E | 25 | SE |
| 591305 | AM 55-206 | State Claim | 40 | acres | Kateel River | 21N | 11E | 28 | NW |
| 591306 | AM 55-207 | State Claim | 40 | acres | Kateel River | 21N | 11E | 28 | NE |
| 591307 | AM 55-208 | State Claim | 40 | acres | Kateel River | 21N | 11E | 28 | NE |
| 591308 | AM 55-209 | State Claim | 40 | acres | Kateel River | 21N | 11E | 27 | NW |
| 591309 | AM 55-210 | State Claim | 40 | acres | Kateel River | 21N | 11E | 27 | NW |
| 591310 | AM 55-211 | State Claim | 40 | acres | Kateel River | 21N | 11E | 27 | NE |
| 591311 | AM 55-212 | State Claim | 40 | acres | Kateel River | 21N | 11E | 27 | NE |
| 591312 | AM 55-213 | State Claim | 40 | acres | Kateel River | 21N | 11E | 26 | NW |
| 591313 | AM 55-214 | State Claim | 40 | acres | Kateel River | 21N | 11E | 26 | NW |
| 591314 | AM 55-215 | State Claim | 40 | acres | Kateel River | 21N | 11E | 26 | NE |
| 591315 | AM 55-216 | State Claim | 40 | acres | Kateel River | 21N | 11E | 26 | NE |
| Appendix A - List of Claims | Page 14 of 52 |
| Trilogy Metals Inc. | | |
| NI 43-101 Technical Report on the Arctic Project, | | |
| Northwest Alaska | | |
| Lease | Name | Type | Current Area | Area Type | Meridian | Township | Range | Section | 1/4 Section |
| 591316 | AM 55-217 | State Claim | 40 | acres | Kateel River | 21N | 11E | 25 | NW |
| 591317 | AM 55-218 | State Claim | 40 | acres | Kateel River | 21N | 11E | 25 | NW |
| 591318 | AM 55-219 | State Claim | 40 | acres | Kateel River | 21N | 11E | 25 | NE |
| 591319 | AM 55-220 | State Claim | 40 | acres | Kateel River | 21N | 11E | 25 | NE |
| 591320 | AM 56-206 | State Claim | 40 | acres | Kateel River | 21N | 11E | 28 | NW |
| 591321 | AM 56-207 | State Claim | 40 | acres | Kateel River | 21N | 11E | 28 | NE |
| 591322 | AM 56-208 | State Claim | 40 | acres | Kateel River | 21N | 11E | 28 | NE |
| 591323 | AM 56-209 | State Claim | 40 | acres | Kateel River | 21N | 11E | 27 | NW |
| 591324 | AM 56-210 | State Claim | 40 | acres | Kateel River | 21N | 11E | 27 | NW |
| 591325 | AM 56-211 | State Claim | 40 | acres | Kateel River | 21N | 11E | 27 | NE |
| 591326 | AM 56-212 | State Claim | 40 | acres | Kateel River | 21N | 11E | 27 | NE |
| 591327 | AM 56-213 | State Claim | 40 | acres | Kateel River | 21N | 11E | 26 | NW |
| 591328 | AM 56-214 | State Claim | 40 | acres | Kateel River | 21N | 11E | 26 | NW |
| 591329 | AM 56-215 | State Claim | 40 | acres | Kateel River | 21N | 11E | 26 | NE |
| 591330 | AM 56-216 | State Claim | 40 | acres | Kateel River | 21N | 11E | 26 | NE |
| 591331 | AM 56-217 | State Claim | 40 | acres | Kateel River | 21N | 11E | 25 | NW |
| 591332 | AM 56-218 | State Claim | 40 | acres | Kateel River | 21N | 11E | 25 | NW |
| 591333 | AM 56-219 | State Claim | 40 | acres | Kateel River | 21N | 11E | 25 | NE |
| 591334 | AM 56-220 | State Claim | 40 | acres | Kateel River | 21N | 11E | 25 | NE |
| 591335 | AM 57-206 | State Claim | 40 | acres | Kateel River | 21N | 11E | 21 | SW |
| 591336 | AM 57-207 | State Claim | 40 | acres | Kateel River | 21N | 11E | 21 | SE |
| 591337 | AM 57-208 | State Claim | 40 | acres | Kateel River | 21N | 11E | 21 | SE |
| 591338 | AM 57-209 | State Claim | 40 | acres | Kateel River | 21N | 11E | 22 | SW |
| 591339 | AM 57-210 | State Claim | 40 | acres | Kateel River | 21N | 11E | 22 | SW |
| 591340 | AM 57-211 | State Claim | 40 | acres | Kateel River | 21N | 11E | 22 | SE |
| 591341 | AM 57-212 | State Claim | 40 | acres | Kateel River | 21N | 11E | 22 | SE |
| 591342 | AM 57-213 | State Claim | 40 | acres | Kateel River | 21N | 11E | 23 | SW |
| Appendix A - List of Claims | Page 15 of 52 |
| Trilogy Metals Inc. | | |
| NI 43-101 Technical Report on the Arctic Project, | | |
| Northwest Alaska | | |
| Lease | Name | Type | Current Area | Area Type | Meridian | Township | Range | Section | 1/4 Section |
| 591343 | AM 57-214 | State Claim | 40 | acres | Kateel River | 21N | 11E | 23 | SW |
| 591344 | AM 57-215 | State Claim | 40 | acres | Kateel River | 21N | 11E | 23 | SE |
| 591345 | AM 57-216 | State Claim | 40 | acres | Kateel River | 21N | 11E | 23 | SE |
| 591346 | AM 57-217 | State Claim | 40 | acres | Kateel River | 21N | 11E | 24 | SW |
| 591347 | AM 57-218 | State Claim | 40 | acres | Kateel River | 21N | 11E | 24 | SW |
| 591348 | AM 57-219 | State Claim | 40 | acres | Kateel River | 21N | 11E | 24 | SE |
| 591349 | AM 57-220 | State Claim | 40 | acres | Kateel River | 21N | 11E | 24 | SE |
| 591350 | AM 58-206 | State Claim | 40 | acres | Kateel River | 21N | 11E | 21 | SW |
| 591351 | AM 58-207 | State Claim | 40 | acres | Kateel River | 21N | 11E | 21 | SE |
| 591352 | AM 58-208 | State Claim | 40 | acres | Kateel River | 21N | 11E | 21 | SE |
| 591353 | AM 58-209 | State Claim | 40 | acres | Kateel River | 21N | 11E | 22 | SW |
| 591354 | AM 58-210 | State Claim | 40 | acres | Kateel River | 21N | 11E | 22 | SW |
| 591355 | AM 58-211 | State Claim | 40 | acres | Kateel River | 21N | 11E | 22 | SE |
| 591356 | AM 58-212 | State Claim | 40 | acres | Kateel River | 21N | 11E | 22 | SE |
| 591357 | AM 58-213 | State Claim | 40 | acres | Kateel River | 21N | 11E | 23 | SW |
| 591358 | AM 58-214 | State Claim | 40 | acres | Kateel River | 21N | 11E | 23 | SW |
| 591359 | AM 58-215 | State Claim | 40 | acres | Kateel River | 21N | 11E | 23 | SE |
| 591360 | AM 58-216 | State Claim | 40 | acres | Kateel River | 21N | 11E | 23 | SE |
| 591361 | AM 58-217 | State Claim | 40 | acres | Kateel River | 21N | 11E | 24 | SW |
| 591362 | AM 58-218 | State Claim | 40 | acres | Kateel River | 21N | 11E | 24 | SW |
| 591363 | AM 58-219 | State Claim | 40 | acres | Kateel River | 21N | 11E | 24 | SE |
| 591364 | AM 58-220 | State Claim | 40 | acres | Kateel River | 21N | 11E | 24 | SE |
| 591365 | AM 59-202 | State Claim | 40 | acres | Kateel River | 21N | 11E | 20 | NW |
| 591366 | AM 59-203 | State Claim | 40 | acres | Kateel River | 21N | 11E | 20 | NE |
| 591367 | AM 59-204 | State Claim | 40 | acres | Kateel River | 21N | 11E | 20 | NE |
| 591368 | AM 59-205 | State Claim | 40 | acres | Kateel River | 21N | 11E | 21 | NW |
| 591369 | AM 59-206 | State Claim | 40 | acres | Kateel River | 21N | 11E | 21 | NW |
| Appendix A - List of Claims | Page 16 of 52 |
| Trilogy Metals Inc. | | |
| NI 43-101 Technical Report on the Arctic Project, | | |
| Northwest Alaska | | |
| Lease | Name | Type | Current Area | Area Type | Meridian | Township | Range | Section | 1/4 Section |
| 591370 | AM 59-207 | State Claim | 40 | acres | Kateel River | 21N | 11E | 21 | NE |
| 591371 | AM 59-208 | State Claim | 40 | acres | Kateel River | 21N | 11E | 21 | NE |
| 591372 | AM 59-209 | State Claim | 40 | acres | Kateel River | 21N | 11E | 22 | NW |
| 591373 | AM 59-210 | State Claim | 40 | acres | Kateel River | 21N | 11E | 22 | NW |
| 591374 | AM 59-211 | State Claim | 40 | acres | Kateel River | 21N | 11E | 22 | NE |
| 591375 | AM 59-212 | State Claim | 40 | acres | Kateel River | 21N | 11E | 22 | NE |
| 591376 | AM 59-213 | State Claim | 40 | acres | Kateel River | 21N | 11E | 23 | NW |
| 591377 | AM 59-214 | State Claim | 40 | acres | Kateel River | 21N | 11E | 23 | NW |
| 591378 | AM 59-215 | State Claim | 40 | acres | Kateel River | 21N | 11E | 23 | NE |
| 591379 | AM 59-216 | State Claim | 40 | acres | Kateel River | 21N | 11E | 23 | NE |
| 591380 | AM 59-217 | State Claim | 40 | acres | Kateel River | 21N | 11E | 24 | NW |
| 591381 | AM 59-218 | State Claim | 40 | acres | Kateel River | 21N | 11E | 24 | NW |
| 591382 | AM 60-202 | State Claim | 40 | acres | Kateel River | 21N | 11E | 20 | NW |
| 591383 | AM 60-203 | State Claim | 40 | acres | Kateel River | 21N | 11E | 20 | NE |
| 591384 | AM 60-204 | State Claim | 40 | acres | Kateel River | 21N | 11E | 20 | NE |
| 591385 | AM 60-205 | State Claim | 40 | acres | Kateel River | 21N | 11E | 21 | NW |
| 591386 | AM 60-206 | State Claim | 40 | acres | Kateel River | 21N | 11E | 21 | NW |
| 591387 | AM 60-207 | State Claim | 40 | acres | Kateel River | 21N | 11E | 21 | NE |
| 591388 | AM 60-208 | State Claim | 40 | acres | Kateel River | 21N | 11E | 21 | NE |
| 591389 | AM 60-209 | State Claim | 40 | acres | Kateel River | 21N | 11E | 22 | NW |
| 591390 | AM 60-210 | State Claim | 40 | acres | Kateel River | 21N | 11E | 22 | NW |
| 591391 | AM 60-211 | State Claim | 40 | acres | Kateel River | 21N | 11E | 22 | NE |
| 591392 | AM 60-212 | State Claim | 40 | acres | Kateel River | 21N | 11E | 22 | NE |
| 591393 | AM 60-213 | State Claim | 40 | acres | Kateel River | 21N | 11E | 23 | NW |
| 591394 | AM 60-214 | State Claim | 40 | acres | Kateel River | 21N | 11E | 23 | NW |
| 591395 | AM 60-215 | State Claim | 40 | acres | Kateel River | 21N | 11E | 23 | NE |
| 591396 | AM 60-216 | State Claim | 40 | acres | Kateel River | 21N | 11E | 23 | NE |
| Appendix A - List of Claims | Page 17 of 52 |
| Trilogy Metals Inc. | | |
| NI 43-101 Technical Report on the Arctic Project, | | |
| Northwest Alaska | | |
| Lease | Name | Type | Current Area | Area Type | Meridian | Township | Range | Section | 1/4 Section |
| 591397 | AM 60-217 | State Claim | 40 | acres | Kateel River | 21N | 11E | 24 | NW |
| 591398 | AM 60-218 | State Claim | 40 | acres | Kateel River | 21N | 11E | 24 | NW |
| 591399 | AM 61-202 | State Claim | 40 | acres | Kateel River | 21N | 11E | 17 | SW |
| 591400 | AM 61-203 | State Claim | 40 | acres | Kateel River | 21N | 11E | 17 | SE |
| 591401 | AM 61-204 | State Claim | 40 | acres | Kateel River | 21N | 11E | 17 | SE |
| 591402 | AM 61-205 | State Claim | 40 | acres | Kateel River | 21N | 11E | 16 | SW |
| 591403 | AM 61-206 | State Claim | 40 | acres | Kateel River | 21N | 11E | 16 | SW |
| 591404 | AM 61-207 | State Claim | 40 | acres | Kateel River | 21N | 11E | 16 | SE |
| 591405 | AM 61-208 | State Claim | 40 | acres | Kateel River | 21N | 11E | 16 | SE |
| 591406 | AM 61-209 | State Claim | 40 | acres | Kateel River | 21N | 11E | 15 | SW |
| 591407 | AM 61-210 | State Claim | 40 | acres | Kateel River | 21N | 11E | 15 | SW |
| 591408 | AM 61-211 | State Claim | 40 | acres | Kateel River | 21N | 11E | 15 | SE |
| 591409 | AM 61-212 | State Claim | 40 | acres | Kateel River | 21N | 11E | 15 | SE |
| 591410 | AM 61-213 | State Claim | 40 | acres | Kateel River | 21N | 11E | 14 | SW |
| 591411 | AM 61-214 | State Claim | 40 | acres | Kateel River | 21N | 11E | 14 | SW |
| 591412 | AM 61-215 | State Claim | 40 | acres | Kateel River | 21N | 11E | 14 | SE |
| 591413 | AM 61-216 | State Claim | 40 | acres | Kateel River | 21N | 11E | 14 | SE |
| 591414 | AM 61-217 | State Claim | 40 | acres | Kateel River | 21N | 11E | 13 | SW |
| 591415 | AM 61-218 | State Claim | 40 | acres | Kateel River | 21N | 11E | 13 | SW |
| 591416 | AM 62-202 | State Claim | 40 | acres | Kateel River | 21N | 11E | 17 | SW |
| 591417 | AM 62-203 | State Claim | 40 | acres | Kateel River | 21N | 11E | 17 | SE |
| 591418 | AM 62-204 | State Claim | 40 | acres | Kateel River | 21N | 11E | 17 | SE |
| 591419 | AM 62-205 | State Claim | 40 | acres | Kateel River | 21N | 11E | 16 | SW |
| 591420 | AM 62-206 | State Claim | 40 | acres | Kateel River | 21N | 11E | 16 | SW |
| 591421 | AM 62-207 | State Claim | 40 | acres | Kateel River | 21N | 11E | 16 | SE |
| 591422 | AM 62-208 | State Claim | 40 | acres | Kateel River | 21N | 11E | 16 | SE |
| 591423 | AM 62-209 | State Claim | 40 | acres | Kateel River | 21N | 11E | 15 | SW |
| Appendix A - List of Claims | Page 18 of 52 |
| Trilogy Metals Inc. | | |
| NI 43-101 Technical Report on the Arctic Project, | | |
| Northwest Alaska | | |
| Lease | Name | Type | Current Area | Area Type | Meridian | Township | Range | Section | 1/4 Section |
| 591424 | AM 62-210 | State Claim | 40 | acres | Kateel River | 21N | 11E | 15 | SW |
| 591425 | AM 62-211 | State Claim | 40 | acres | Kateel River | 21N | 11E | 15 | SE |
| 591426 | AM 62-212 | State Claim | 40 | acres | Kateel River | 21N | 11E | 15 | SE |
| 591427 | AM 62-213 | State Claim | 40 | acres | Kateel River | 21N | 11E | 14 | SW |
| 591428 | AM 62-214 | State Claim | 40 | acres | Kateel River | 21N | 11E | 14 | SW |
| 591429 | AM 62-215 | State Claim | 40 | acres | Kateel River | 21N | 11E | 14 | SE |
| 591430 | AM 62-216 | State Claim | 40 | acres | Kateel River | 21N | 11E | 14 | SE |
| 591431 | AM 62-217 | State Claim | 40 | acres | Kateel River | 21N | 11E | 13 | SW |
| 591432 | AM 62-218 | State Claim | 40 | acres | Kateel River | 21N | 11E | 13 | SW |
| 591433 | AM 63-202 | State Claim | 40 | acres | Kateel River | 21N | 11E | 17 | NW |
| 591434 | AM 63-203 | State Claim | 40 | acres | Kateel River | 21N | 11E | 17 | NE |
| 591435 | AM 63-204 | State Claim | 40 | acres | Kateel River | 21N | 11E | 17 | NE |
| 591436 | AM 63-205 | State Claim | 40 | acres | Kateel River | 21N | 11E | 16 | NW |
| 591437 | AM 63-206 | State Claim | 40 | acres | Kateel River | 21N | 11E | 16 | NW |
| 591438 | AM 63-207 | State Claim | 40 | acres | Kateel River | 21N | 11E | 16 | NE |
| 591439 | AM 63-208 | State Claim | 40 | acres | Kateel River | 21N | 11E | 16 | NE |
| 591440 | AM 63-209 | State Claim | 40 | acres | Kateel River | 21N | 11E | 15 | NW |
| 591441 | AM 63-210 | State Claim | 40 | acres | Kateel River | 21N | 11E | 15 | NW |
| 591442 | AM 63-211 | State Claim | 40 | acres | Kateel River | 21N | 11E | 15 | NE |
| 591443 | AM 63-212 | State Claim | 40 | acres | Kateel River | 21N | 11E | 15 | NE |
| 591444 | AM 64-202 | State Claim | 40 | acres | Kateel River | 21N | 11E | 17 | NW |
| 591445 | AM 64-203 | State Claim | 40 | acres | Kateel River | 21N | 11E | 17 | NE |
| 591446 | AM 64-204 | State Claim | 40 | acres | Kateel River | 21N | 11E | 17 | NE |
| 591447 | AM 64-205 | State Claim | 40 | acres | Kateel River | 21N | 11E | 16 | NW |
| 591448 | AM 64-206 | State Claim | 40 | acres | Kateel River | 21N | 11E | 16 | NW |
| 591449 | AM 64-207 | State Claim | 40 | acres | Kateel River | 21N | 11E | 16 | NE |
| 591450 | AM 64-208 | State Claim | 40 | acres | Kateel River | 21N | 11E | 16 | NE |
| Appendix A - List of Claims | Page 19 of 52 |
| Trilogy Metals Inc. | | |
| NI 43-101 Technical Report on the Arctic Project, | | |
| Northwest Alaska | | |
| Lease | Name | Type | Current Area | Area Type | Meridian | Township | Range | Section | 1/4 Section |
| 591451 | AM 64-209 | State Claim | 40 | acres | Kateel River | 21N | 11E | 15 | NW |
| 591452 | AM 64-210 | State Claim | 40 | acres | Kateel River | 21N | 11E | 15 | NW |
| 591453 | AM 64-211 | State Claim | 40 | acres | Kateel River | 21N | 11E | 15 | NE |
| 591454 | AM 64-212 | State Claim | 40 | acres | Kateel River | 21N | 11E | 15 | NE |
| 591455 | AM 65-202 | State Claim | 40 | acres | Kateel River | 21N | 11E | 8 | SW |
| 591456 | AM 65-203 | State Claim | 40 | acres | Kateel River | 21N | 11E | 8 | SE |
| 591457 | AM 65-204 | State Claim | 40 | acres | Kateel River | 21N | 11E | 8 | SE |
| 591458 | AM 65-205 | State Claim | 40 | acres | Kateel River | 21N | 11E | 9 | SW |
| 591459 | AM 65-206 | State Claim | 40 | acres | Kateel River | 21N | 11E | 9 | SW |
| 591460 | AM 65-207 | State Claim | 40 | acres | Kateel River | 21N | 11E | 9 | SE |
| 591461 | AM 65-208 | State Claim | 40 | acres | Kateel River | 21N | 11E | 9 | SE |
| 591462 | AM 65-209 | State Claim | 40 | acres | Kateel River | 21N | 11E | 10 | SW |
| 591463 | AM 65-210 | State Claim | 40 | acres | Kateel River | 21N | 11E | 10 | SW |
| 591464 | AM 65-211 | State Claim | 40 | acres | Kateel River | 21N | 11E | 10 | SE |
| 591465 | AM 65-212 | State Claim | 40 | acres | Kateel River | 21N | 11E | 10 | SE |
| 591466 | AM 66-202 | State Claim | 40 | acres | Kateel River | 21N | 11E | 8 | SW |
| 591467 | AM 66-203 | State Claim | 40 | acres | Kateel River | 21N | 11E | 8 | SE |
| 591468 | AM 66-204 | State Claim | 40 | acres | Kateel River | 21N | 11E | 8 | SE |
| 591469 | AM 66-205 | State Claim | 40 | acres | Kateel River | 21N | 11E | 9 | SW |
| 591470 | AM 66-206 | State Claim | 40 | acres | Kateel River | 21N | 11E | 9 | SW |
| 591471 | AM 66-207 | State Claim | 40 | acres | Kateel River | 21N | 11E | 9 | SE |
| 591472 | AM 66-208 | State Claim | 40 | acres | Kateel River | 21N | 11E | 9 | SE |
| 591473 | AM 66-209 | State Claim | 40 | acres | Kateel River | 21N | 11E | 10 | SW |
| 591474 | AM 66-210 | State Claim | 40 | acres | Kateel River | 21N | 11E | 10 | SW |
| 591475 | AM 66-211 | State Claim | 40 | acres | Kateel River | 21N | 11E | 10 | SE |
| 591476 | AM 66-212 | State Claim | 40 | acres | Kateel River | 21N | 11E | 10 | SE |
| 591477 | AM 67-197 | State Claim | 37 | acres | Kateel River | 21N | 11E | 7 | NW |
| Appendix A - List of Claims | Page 20 of 52 |
| Trilogy Metals Inc. | | |
| NI 43-101 Technical Report on the Arctic Project, | | |
| Northwest Alaska | | |
| Lease | Name | Type | Current Area | Area Type | Meridian | Township | Range | Section | 1/4 Section |
| 591478 | AM 67-198 | State Claim | 40 | acres | Kateel River | 21N | 11E | 7 | NW |
| 591479 | AM 67-199 | State Claim | 40 | acres | Kateel River | 21N | 11E | 7 | NE |
| 591480 | AM 67-200 | State Claim | 40 | acres | Kateel River | 21N | 11E | 7 | NE |
| 591481 | AM 67-201 | State Claim | 40 | acres | Kateel River | 21N | 11E | 8 | NW |
| 591482 | AM 67-202 | State Claim | 40 | acres | Kateel River | 21N | 11E | 8 | NW |
| 591483 | AM 67-203 | State Claim | 40 | acres | Kateel River | 21N | 11E | 8 | NE |
| 591484 | AM 67-204 | State Claim | 40 | acres | Kateel River | 21N | 11E | 8 | NE |
| 591485 | AM 67-205 | State Claim | 40 | acres | Kateel River | 21N | 11E | 9 | NW |
| 591486 | AM 67-206 | State Claim | 40 | acres | Kateel River | 21N | 11E | 9 | NW |
| 591487 | AM 67-207 | State Claim | 40 | acres | Kateel River | 21N | 11E | 9 | NE |
| 591488 | AM 67-208 | State Claim | 40 | acres | Kateel River | 21N | 11E | 9 | NE |
| 591489 | AM 67-209 | State Claim | 40 | acres | Kateel River | 21N | 11E | 10 | NW |
| 591490 | AM 67-210 | State Claim | 40 | acres | Kateel River | 21N | 11E | 10 | NW |
| 591491 | AM 67-211 | State Claim | 40 | acres | Kateel River | 21N | 11E | 10 | NE |
| 591492 | AM 67-212 | State Claim | 40 | acres | Kateel River | 21N | 11E | 10 | NE |
| 591493 | AM 68-208 | State Claim | 40 | acres | Kateel River | 21N | 11E | 9 | NE |
| 591494 | AM 68-209 | State Claim | 40 | acres | Kateel River | 21N | 11E | 10 | NW |
| 591495 | AM 68-210 | State Claim | 40 | acres | Kateel River | 21N | 11E | 10 | NW |
| 591496 | AM 68-211 | State Claim | 40 | acres | Kateel River | 21N | 11E | 10 | NE |
| 591497 | AM 68-212 | State Claim | 40 | acres | Kateel River | 21N | 11E | 10 | NE |
| 591498 | AM 69-208 | State Claim | 40 | acres | Kateel River | 21N | 11E | 4 | SE |
| 591499 | AM 69-209 | State Claim | 40 | acres | Kateel River | 21N | 11E | 3 | SW |
| 591500 | AM 69-210 | State Claim | 40 | acres | Kateel River | 21N | 11E | 3 | SW |
| 591501 | AM 69-211 | State Claim | 40 | acres | Kateel River | 21N | 11E | 3 | SE |
| 591502 | AM 69-212 | State Claim | 40 | acres | Kateel River | 21N | 11E | 3 | SE |
| 591503 | AM 49-221 | State Claim | 40 | acres | Kateel River | 21N | 12E | 31 | SW |
| 591504 | AM 49-222 | State Claim | 40 | acres | Kateel River | 21N | 12E | 31 | SW |
| Appendix A - List of Claims | Page 21 of 52 |
| Trilogy Metals Inc. | | |
| NI 43-101 Technical Report on the Arctic Project, | | |
| Northwest Alaska | | |
| Lease | Name | Type | Current Area | Area Type | Meridian | Township | Range | Section | 1/4 Section |
| 591505 | AM 49-223 | State Claim | 40 | acres | Kateel River | 21N | 12E | 31 | SE |
| 591506 | AM 49-224 | State Claim | 40 | acres | Kateel River | 21N | 12E | 31 | SE |
| 591507 | AM 49-225 | State Claim | 40 | acres | Kateel River | 21N | 12E | 32 | SW |
| 591508 | AM 49-226 | State Claim | 40 | acres | Kateel River | 21N | 12E | 32 | SW |
| 591509 | AM 49-227 | State Claim | 40 | acres | Kateel River | 21N | 12E | 32 | SE |
| 591510 | AM 49-228 | State Claim | 40 | acres | Kateel River | 21N | 12E | 32 | SE |
| 591511 | AM 49-229 | State Claim | 40 | acres | Kateel River | 21N | 12E | 33 | SW |
| 591512 | AM 49-230 | State Claim | 40 | acres | Kateel River | 21N | 12E | 33 | SW |
| 591513 | AM 50-221 | State Claim | 40 | acres | Kateel River | 21N | 12E | 31 | SW |
| 591514 | AM 50-222 | State Claim | 40 | acres | Kateel River | 21N | 12E | 31 | SW |
| 591515 | AM 50-223 | State Claim | 40 | acres | Kateel River | 21N | 12E | 31 | SE |
| 591516 | AM 50-224 | State Claim | 40 | acres | Kateel River | 21N | 12E | 31 | SE |
| 591517 | AM 50-225 | State Claim | 40 | acres | Kateel River | 21N | 12E | 32 | SW |
| 591518 | AM 50-226 | State Claim | 40 | acres | Kateel River | 21N | 12E | 32 | SW |
| 591519 | AM 50-227 | State Claim | 40 | acres | Kateel River | 21N | 12E | 32 | SE |
| 591520 | AM 50-228 | State Claim | 40 | acres | Kateel River | 21N | 12E | 32 | SE |
| 591521 | AM 50-229 | State Claim | 40 | acres | Kateel River | 21N | 12E | 33 | SW |
| 591522 | AM 50-230 | State Claim | 40 | acres | Kateel River | 21N | 12E | 33 | SW |
| 591523 | AM 51-221 | State Claim | 40 | acres | Kateel River | 21N | 12E | 31 | NW |
| 591524 | AM 51-222 | State Claim | 40 | acres | Kateel River | 21N | 12E | 31 | NW |
| 591525 | AM 51-223 | State Claim | 40 | acres | Kateel River | 21N | 12E | 31 | NE |
| 591526 | AM 51-224 | State Claim | 40 | acres | Kateel River | 21N | 12E | 31 | NE |
| 591527 | AM 51-225 | State Claim | 40 | acres | Kateel River | 21N | 12E | 32 | NW |
| 591528 | AM 51-226 | State Claim | 40 | acres | Kateel River | 21N | 12E | 32 | NW |
| 591529 | AM 51-227 | State Claim | 40 | acres | Kateel River | 21N | 12E | 32 | NE |
| 591530 | AM 51-228 | State Claim | 40 | acres | Kateel River | 21N | 12E | 32 | NE |
| 591531 | AM 51-229 | State Claim | 40 | acres | Kateel River | 21N | 12E | 33 | NW |
| Appendix A - List of Claims | Page 22 of 52 |
| Trilogy Metals Inc. | | |
| NI 43-101 Technical Report on the Arctic Project, | | |
| Northwest Alaska | | |
| Lease | Name | Type | Current Area | Area Type | Meridian | Township | Range | Section | 1/4 Section |
| 591532 | AM 51-230 | State Claim | 40 | acres | Kateel River | 21N | 12E | 33 | NW |
| 591533 | AM 52-221 | State Claim | 39 | acres | Kateel River | 21N | 12E | 31 | NW |
| 591534 | AM 52-222 | State Claim | 40 | acres | Kateel River | 21N | 12E | 31 | NW |
| 591535 | AM 52-223 | State Claim | 40 | acres | Kateel River | 21N | 12E | 31 | NE |
| 591536 | AM 52-224 | State Claim | 40 | acres | Kateel River | 21N | 12E | 31 | NE |
| 591537 | AM 52-225 | State Claim | 40 | acres | Kateel River | 21N | 12E | 32 | NW |
| 591538 | AM 52-226 | State Claim | 40 | acres | Kateel River | 21N | 12E | 32 | NW |
| 591539 | AM 52-227 | State Claim | 40 | acres | Kateel River | 21N | 12E | 32 | NE |
| 591540 | AM 52-228 | State Claim | 40 | acres | Kateel River | 21N | 12E | 32 | NE |
| 591541 | AM 52-229 | State Claim | 40 | acres | Kateel River | 21N | 12E | 33 | NW |
| 591542 | AM 52-230 | State Claim | 40 | acres | Kateel River | 21N | 12E | 33 | NW |
| 591543 | AM 53-221 | State Claim | 39 | acres | Kateel River | 21N | 12E | 30 | SW |
| 591544 | AM 53-222 | State Claim | 40 | acres | Kateel River | 21N | 12E | 30 | SW |
| 591545 | AM 53-223 | State Claim | 40 | acres | Kateel River | 21N | 12E | 30 | SE |
| 591546 | AM 53-224 | State Claim | 40 | acres | Kateel River | 21N | 12E | 30 | SE |
| 591547 | AM 54-221 | State Claim | 39 | acres | Kateel River | 21N | 12E | 30 | SW |
| 591548 | AM 54-222 | State Claim | 40 | acres | Kateel River | 21N | 12E | 30 | SW |
| 591549 | AM 54-223 | State Claim | 40 | acres | Kateel River | 21N | 12E | 30 | SE |
| 591550 | AM 54-224 | State Claim | 40 | acres | Kateel River | 21N | 12E | 30 | SE |
| 591551 | AM 55-221 | State Claim | 39 | acres | Kateel River | 21N | 12E | 30 | NW |
| 591552 | AM 55-222 | State Claim | 40 | acres | Kateel River | 21N | 12E | 30 | NW |
| 591553 | AM 55-223 | State Claim | 40 | acres | Kateel River | 21N | 12E | 30 | NE |
| 591554 | AM 55-224 | State Claim | 40 | acres | Kateel River | 21N | 12E | 30 | NE |
| 591555 | AM 56-221 | State Claim | 39 | acres | Kateel River | 21N | 12E | 30 | NW |
| 591556 | AM 56-222 | State Claim | 40 | acres | Kateel River | 21N | 12E | 30 | NW |
| 591557 | AM 56-223 | State Claim | 40 | acres | Kateel River | 21N | 12E | 30 | NE |
| 591558 | AM 56-224 | State Claim | 40 | acres | Kateel River | 21N | 12E | 30 | NE |
| Appendix A - List of Claims | Page 23 of 52 |
| Trilogy Metals Inc. | | |
| NI 43-101 Technical Report on the Arctic Project, | | |
| Northwest Alaska | | |
| Lease | Name | Type | Current Area | Area Type | Meridian | Township | Range | Section | 1/4 Section |
| 591575 | AM 37-226 | State Claim | 40 | acres | Kateel River | 20N | 12E | 16 | SW |
| 591576 | AM 37-227 | State Claim | 40 | acres | Kateel River | 20N | 12E | 16 | SE |
| 591577 | AM 37-228 | State Claim | 40 | acres | Kateel River | 20N | 12E | 16 | SE |
| 591578 | AM 37-229 | State Claim | 40 | acres | Kateel River | 20N | 12E | 15 | SW |
| 591579 | AM 37-230 | State Claim | 40 | acres | Kateel River | 20N | 12E | 15 | SW |
| 591590 | AM 38-226 | State Claim | 40 | acres | Kateel River | 20N | 12E | 16 | SW |
| 591591 | AM 38-227 | State Claim | 40 | acres | Kateel River | 20N | 12E | 16 | SE |
| 591592 | AM 38-228 | State Claim | 40 | acres | Kateel River | 20N | 12E | 16 | SE |
| 591593 | AM 38-229 | State Claim | 40 | acres | Kateel River | 20N | 12E | 15 | SW |
| 591594 | AM 38-230 | State Claim | 40 | acres | Kateel River | 20N | 12E | 15 | SW |
| 591605 | AM 39-226 | State Claim | 40 | acres | Kateel River | 20N | 12E | 16 | NW |
| 591606 | AM 39-227 | State Claim | 40 | acres | Kateel River | 20N | 12E | 16 | NE |
| 591607 | AM 39-228 | State Claim | 40 | acres | Kateel River | 20N | 12E | 16 | NE |
| 591608 | AM 39-229 | State Claim | 40 | acres | Kateel River | 20N | 12E | 15 | NW |
| 591609 | AM 39-230 | State Claim | 40 | acres | Kateel River | 20N | 12E | 15 | NW |
| 591620 | AM 40-226 | State Claim | 40 | acres | Kateel River | 20N | 12E | 16 | NW |
| 591621 | AM 40-227 | State Claim | 40 | acres | Kateel River | 20N | 12E | 16 | NE |
| 591622 | AM 40-228 | State Claim | 40 | acres | Kateel River | 20N | 12E | 16 | NE |
| 591623 | AM 40-229 | State Claim | 40 | acres | Kateel River | 20N | 12E | 15 | NW |
| 591624 | AM 40-230 | State Claim | 40 | acres | Kateel River | 20N | 12E | 15 | NW |
| 591635 | AM 41-225 | State Claim | 40 | acres | Kateel River | 20N | 12E | 9 | SW |
| 591636 | AM 41-226 | State Claim | 40 | acres | Kateel River | 20N | 12E | 9 | SW |
| 591637 | AM 41-227 | State Claim | 40 | acres | Kateel River | 20N | 12E | 9 | SE |
| 591638 | AM 41-228 | State Claim | 40 | acres | Kateel River | 20N | 12E | 9 | SE |
| 591639 | AM 41-229 | State Claim | 40 | acres | Kateel River | 20N | 12E | 10 | SW |
| 591640 | AM 41-230 | State Claim | 40 | acres | Kateel River | 20N | 12E | 10 | SW |
| 591648 | AM 42-223 | State Claim | 40 | acres | Kateel River | 20N | 12E | 8 | SE |
| Appendix A - List of Claims | Page 24 of 52 |
| Trilogy Metals Inc. | | |
| NI 43-101 Technical Report on the Arctic Project, | | |
| Northwest Alaska | | |
| Lease | Name | Type | Current Area | Area Type | Meridian | Township | Range | Section | 1/4 Section |
| 591649 | AM 42-224 | State Claim | 40 | acres | Kateel River | 20N | 12E | 8 | SE |
| 591650 | AM 42-225 | State Claim | 40 | acres | Kateel River | 20N | 12E | 9 | SW |
| 591651 | AM 42-226 | State Claim | 40 | acres | Kateel River | 20N | 12E | 9 | SW |
| 591652 | AM 42-227 | State Claim | 40 | acres | Kateel River | 20N | 12E | 9 | SE |
| 591653 | AM 42-228 | State Claim | 40 | acres | Kateel River | 20N | 12E | 9 | SE |
| 591654 | AM 42-229 | State Claim | 40 | acres | Kateel River | 20N | 12E | 10 | SW |
| 591655 | AM 42-230 | State Claim | 40 | acres | Kateel River | 20N | 12E | 10 | SW |
| 591661 | AM 43-221 | State Claim | 40 | acres | Kateel River | 20N | 12E | 8 | NW |
| 591662 | AM 43-222 | State Claim | 40 | acres | Kateel River | 20N | 12E | 8 | NW |
| 591663 | AM 43-223 | State Claim | 40 | acres | Kateel River | 20N | 12E | 8 | NE |
| 591664 | AM 43-224 | State Claim | 40 | acres | Kateel River | 20N | 12E | 8 | NE |
| 591665 | AM 43-225 | State Claim | 40 | acres | Kateel River | 20N | 12E | 9 | NW |
| 591666 | AM 43-226 | State Claim | 40 | acres | Kateel River | 20N | 12E | 9 | NW |
| 591667 | AM 43-227 | State Claim | 40 | acres | Kateel River | 20N | 12E | 9 | NE |
| 591668 | AM 43-228 | State Claim | 40 | acres | Kateel River | 20N | 12E | 9 | NE |
| 591669 | AM 43-229 | State Claim | 40 | acres | Kateel River | 20N | 12E | 10 | NW |
| 591670 | AM 43-230 | State Claim | 40 | acres | Kateel River | 20N | 12E | 10 | NW |
| 591676 | AM 44-219 | State Claim | 40 | acres | Kateel River | 20N | 12E | 7 | NE |
| 591677 | AM 44-220 | State Claim | 40 | acres | Kateel River | 20N | 12E | 7 | NE |
| 591678 | AM 44-221 | State Claim | 40 | acres | Kateel River | 20N | 12E | 8 | NW |
| 591679 | AM 44-222 | State Claim | 40 | acres | Kateel River | 20N | 12E | 8 | NW |
| 591680 | AM 44-223 | State Claim | 40 | acres | Kateel River | 20N | 12E | 8 | NE |
| 591681 | AM 44-224 | State Claim | 40 | acres | Kateel River | 20N | 12E | 8 | NE |
| 591682 | AM 44-225 | State Claim | 40 | acres | Kateel River | 20N | 12E | 9 | NW |
| 591683 | AM 44-226 | State Claim | 40 | acres | Kateel River | 20N | 12E | 9 | NW |
| 591684 | AM 44-227 | State Claim | 40 | acres | Kateel River | 20N | 12E | 9 | NE |
| 591685 | AM 44-228 | State Claim | 40 | acres | Kateel River | 20N | 12E | 9 | NE |
| Appendix A - List of Claims | Page 25 of 52 |
| Trilogy Metals Inc. | | |
| NI 43-101 Technical Report on the Arctic Project, | | |
| Northwest Alaska | | |
| Lease | Name | Type | Current Area | Area Type | Meridian | Township | Range | Section | 1/4 Section |
| 591686 | AM 44-229 | State Claim | 40 | acres | Kateel River | 20N | 12E | 10 | NW |
| 591687 | AM 44-230 | State Claim | 40 | acres | Kateel River | 20N | 12E | 10 | NW |
| 591693 | AM 45-217 | State Claim | 27 | acres | Kateel River | 20N | 12E | 6 | SW |
| 591694 | AM 45-218 | State Claim | 40 | acres | Kateel River | 20N | 12E | 6 | SW |
| 591695 | AM 45-219 | State Claim | 40 | acres | Kateel River | 20N | 12E | 6 | SE |
| 591696 | AM 45-220 | State Claim | 40 | acres | Kateel River | 20N | 12E | 6 | SE |
| 591697 | AM 45-221 | State Claim | 40 | acres | Kateel River | 20N | 12E | 5 | SW |
| 591698 | AM 45-222 | State Claim | 40 | acres | Kateel River | 20N | 12E | 5 | SW |
| 591699 | AM 45-223 | State Claim | 40 | acres | Kateel River | 20N | 12E | 5 | SE |
| 591700 | AM 45-224 | State Claim | 40 | acres | Kateel River | 20N | 12E | 5 | SE |
| 591701 | AM 45-225 | State Claim | 40 | acres | Kateel River | 20N | 12E | 4 | SW |
| 591702 | AM 45-226 | State Claim | 40 | acres | Kateel River | 20N | 12E | 4 | SW |
| 591703 | AM 45-227 | State Claim | 40 | acres | Kateel River | 20N | 12E | 4 | SE |
| 591704 | AM 45-228 | State Claim | 40 | acres | Kateel River | 20N | 12E | 4 | SE |
| 591705 | AM 45-229 | State Claim | 40 | acres | Kateel River | 20N | 12E | 3 | SW |
| 591706 | AM 45-230 | State Claim | 40 | acres | Kateel River | 20N | 12E | 3 | SW |
| 591712 | AM 46-217 | State Claim | 27 | acres | Kateel River | 20N | 12E | 6 | SW |
| 591713 | AM 46-218 | State Claim | 40 | acres | Kateel River | 20N | 12E | 6 | SW |
| 591714 | AM 46-219 | State Claim | 40 | acres | Kateel River | 20N | 12E | 6 | SE |
| 591715 | AM 46-220 | State Claim | 40 | acres | Kateel River | 20N | 12E | 6 | SE |
| 591716 | AM 46-221 | State Claim | 40 | acres | Kateel River | 20N | 12E | 5 | SW |
| 591717 | AM 46-222 | State Claim | 40 | acres | Kateel River | 20N | 12E | 5 | SW |
| 591718 | AM 46-223 | State Claim | 40 | acres | Kateel River | 20N | 12E | 5 | SE |
| 591719 | AM 46-224 | State Claim | 40 | acres | Kateel River | 20N | 12E | 5 | SE |
| 591720 | AM 46-225 | State Claim | 40 | acres | Kateel River | 20N | 12E | 4 | SW |
| 591721 | AM 46-226 | State Claim | 40 | acres | Kateel River | 20N | 12E | 4 | SW |
| 591722 | AM 46-227 | State Claim | 40 | acres | Kateel River | 20N | 12E | 4 | SE |
| Appendix A - List of Claims | Page 26 of 52 |
| Trilogy Metals Inc. | | |
| NI 43-101 Technical Report on the Arctic Project, | | |
| Northwest Alaska | | |
| Lease | Name | Type | Current Area | Area Type | Meridian | Township | Range | Section | 1/4 Section |
| 591723 | AM 46-228 | State Claim | 40 | acres | Kateel River | 20N | 12E | 4 | SE |
| 591724 | AM 46-229 | State Claim | 40 | acres | Kateel River | 20N | 12E | 3 | SW |
| 591725 | AM 46-230 | State Claim | 40 | acres | Kateel River | 20N | 12E | 3 | SW |
| 591731 | AM 47-217 | State Claim | 27 | acres | Kateel River | 20N | 12E | 6 | NW |
| 591732 | AM 47-218 | State Claim | 40 | acres | Kateel River | 20N | 12E | 6 | NW |
| 591733 | AM 47-219 | State Claim | 40 | acres | Kateel River | 20N | 12E | 6 | NE |
| 591734 | AM 47-220 | State Claim | 40 | acres | Kateel River | 20N | 12E | 6 | NE |
| 591735 | AM 47-221 | State Claim | 40 | acres | Kateel River | 20N | 12E | 5 | NW |
| 591736 | AM 47-222 | State Claim | 40 | acres | Kateel River | 20N | 12E | 5 | NW |
| 591737 | AM 47-223 | State Claim | 40 | acres | Kateel River | 20N | 12E | 5 | NE |
| 591738 | AM 47-224 | State Claim | 40 | acres | Kateel River | 20N | 12E | 5 | NE |
| 591739 | AM 47-225 | State Claim | 40 | acres | Kateel River | 20N | 12E | 4 | NW |
| 591740 | AM 47-226 | State Claim | 40 | acres | Kateel River | 20N | 12E | 4 | NW |
| 591741 | AM 47-227 | State Claim | 40 | acres | Kateel River | 20N | 12E | 4 | NE |
| 591742 | AM 47-228 | State Claim | 40 | acres | Kateel River | 20N | 12E | 4 | NE |
| 591743 | AM 47-229 | State Claim | 40 | acres | Kateel River | 20N | 12E | 3 | NW |
| 591744 | AM 47-230 | State Claim | 40 | acres | Kateel River | 20N | 12E | 3 | NW |
| 591745 | AM 48-217 | State Claim | 27 | acres | Kateel River | 20N | 12E | 6 | NW |
| 591746 | AM 48-218 | State Claim | 40 | acres | Kateel River | 20N | 12E | 6 | NW |
| 591747 | AM 48-219 | State Claim | 40 | acres | Kateel River | 20N | 12E | 6 | NE |
| 591748 | AM 48-220 | State Claim | 40 | acres | Kateel River | 20N | 12E | 6 | NE |
| 591749 | AM 48-221 | State Claim | 40 | acres | Kateel River | 20N | 12E | 5 | NW |
| 591750 | AM 48-222 | State Claim | 40 | acres | Kateel River | 20N | 12E | 5 | NW |
| 591751 | AM 48-223 | State Claim | 40 | acres | Kateel River | 20N | 12E | 5 | NE |
| 591752 | AM 48-224 | State Claim | 40 | acres | Kateel River | 20N | 12E | 5 | NE |
| 591753 | AM 48-225 | State Claim | 40 | acres | Kateel River | 20N | 12E | 4 | NW |
| 591754 | AM 48-226 | State Claim | 40 | acres | Kateel River | 20N | 12E | 4 | NW |
| Appendix A - List of Claims | Page 27 of 52 |
| Trilogy Metals Inc. | | |
| NI 43-101 Technical Report on the Arctic Project, | | |
| Northwest Alaska | | |
| Lease | Name | Type | Current Area | Area Type | Meridian | Township | Range | Section | 1/4 Section |
| 591755 | AM 48-227 | State Claim | 40 | acres | Kateel River | 20N | 12E | 4 | NE |
| 591756 | AM 48-228 | State Claim | 40 | acres | Kateel River | 20N | 12E | 4 | NE |
| 591757 | AM 48-229 | State Claim | 40 | acres | Kateel River | 20N | 12E | 3 | NW |
| 591758 | AM 48-230 | State Claim | 40 | acres | Kateel River | 20N | 12E | 3 | NW |
| 622359 | Eggplant 1 | State Claim | 41 | acres | Kateel River | 21N | 10E | 26 | NW |
| 622360 | Eggplant 2 | State Claim | 40 | acres | Kateel River | 21N | 10E | 26 | NW |
| 622361 | Eggplant 3 | State Claim | 40 | acres | Kateel River | 21N | 10E | 26 | NE |
| 622362 | Eggplant 4 | State Claim | 40 | acres | Kateel River | 21N | 10E | 26 | NE |
| 622363 | Eggplant 5 | State Claim | 40 | acres | Kateel River | 21N | 10E | 25 | NW |
| 622364 | Eggplant 6 | State Claim | 40 | acres | Kateel River | 21N | 10E | 25 | NW |
| 622365 | Eggplant 7 | State Claim | 160 | acres | Kateel River | 21N | 10E | 26 | SW |
| 622366 | Eggplant 8 | State Claim | 160 | acres | Kateel River | 21N | 10E | 26 | SE |
| 622367 | Eggplant 9 | State Claim | 160 | acres | Kateel River | 21N | 10E | 25 | SW |
| 622368 | Eggplant 10 | State Claim | 160 | acres | Kateel River | 21N | 10E | 34 | NW |
| 622369 | Eggplant 11 | State Claim | 160 | acres | Kateel River | 21N | 10E | 34 | NE |
| 622370 | Eggplant 12 | State Claim | 159 | acres | Kateel River | 21N | 10E | 35 | NW |
| 622371 | Eggplant 13 | State Claim | 160 | acres | Kateel River | 21N | 10E | 35 | NE |
| 622372 | Eggplant 14 | State Claim | 159 | acres | Kateel River | 21N | 10E | 36 | NW |
| 622373 | Eggplant 15 | State Claim | 159 | acres | Kateel River | 21N | 10E | 36 | NE |
| 622374 | Eggplant 16 | State Claim | 158 | acres | Kateel River | 21N | 11E | 31 | NW |
| 622375 | Eggplant 17 | State Claim | 160 | acres | Kateel River | 21N | 11E | 31 | NE |
| 622376 | Eggplant 18 | State Claim | 160 | acres | Kateel River | 21N | 11E | 32 | NW |
| 622377 | Eggplant 19 | State Claim | 160 | acres | Kateel River | 21N | 10E | 34 | SW |
| 622378 | Eggplant 20 | State Claim | 161 | acres | Kateel River | 21N | 10E | 34 | SE |
| 622379 | Eggplant 21 | State Claim | 160 | acres | Kateel River | 21N | 10E | 35 | SW |
| 622380 | Eggplant 22 | State Claim | 161 | acres | Kateel River | 21N | 10E | 35 | SE |
| 622381 | Eggplant 23 | State Claim | 160 | acres | Kateel River | 21N | 10E | 36 | SW |
| Appendix A - List of Claims | Page 28 of 52 |
| Trilogy Metals Inc. | | |
| NI 43-101 Technical Report on the Arctic Project, | | |
| Northwest Alaska | | |
| Lease | Name | Type | Current Area | Area Type | Meridian | Township | Range | Section | 1/4 Section |
| 622382 | Eggplant 24 | State Claim | 160 | acres | Kateel River | 21N | 10E | 36 | SE |
| 622383 | Eggplant 25 | State Claim | 159 | acres | Kateel River | 21N | 11E | 31 | SW |
| 622384 | Eggplant 26 | State Claim | 161 | acres | Kateel River | 21N | 11E | 31 | SE |
| 622385 | Eggplant 27 | State Claim | 160 | acres | Kateel River | 21N | 11E | 32 | SW |
| 622386 | Eggplant 28 | State Claim | 160 | acres | Kateel River | 21N | 11E | 32 | SE |
| 622387 | Eggplant 29 | State Claim | 40 | acres | Kateel River | 21N | 11E | 33 | SW |
| 622388 | Eggplant 30 | State Claim | 40 | acres | Kateel River | 21N | 11E | 33 | SW |
| 634110 | EDC 1 | State Claim | 40 | acres | Kateel River | 21N | 10E | 12 | SW |
| 634111 | EDC 2 | State Claim | 40 | acres | Kateel River | 21N | 10E | 12 | SE |
| 634112 | EDC 3 | State Claim | 40 | acres | Kateel River | 21N | 10E | 12 | SE |
| 634113 | EDC 4 | State Claim | 37 | acres | Kateel River | 21N | 11E | 7 | SW |
| 634114 | EDC 5 | State Claim | 40 | acres | Kateel River | 21N | 11E | 7 | SW |
| 634115 | EDC 6 | State Claim | 40 | acres | Kateel River | 21N | 11E | 7 | SE |
| 634116 | EDC 7 | State Claim | 40 | acres | Kateel River | 21N | 11E | 7 | SE |
| 634117 | EDC 8 | State Claim | 40 | acres | Kateel River | 21N | 11E | 8 | SW |
| 634118 | EDC 9 | State Claim | 40 | acres | Kateel River | 21N | 10E | 12 | SW |
| 634119 | EDC 10 | State Claim | 40 | acres | Kateel River | 21N | 10E | 12 | SE |
| 634120 | EDC 11 | State Claim | 40 | acres | Kateel River | 21N | 10E | 12 | SE |
| 634121 | EDC 12 | State Claim | 38 | acres | Kateel River | 21N | 11E | 7 | SW |
| 634122 | EDC 13 | State Claim | 40 | acres | Kateel River | 21N | 11E | 7 | SW |
| 634123 | EDC 14 | State Claim | 40 | acres | Kateel River | 21N | 11E | 7 | SE |
| 634124 | EDC 15 | State Claim | 40 | acres | Kateel River | 21N | 11E | 7 | SE |
| 634125 | EDC 16 | State Claim | 40 | acres | Kateel River | 21N | 11E | 8 | SW |
| 634126 | EDC 17 | State Claim | 40 | acres | Kateel River | 21N | 10E | 13 | NW |
| 634127 | EDC 18 | State Claim | 40 | acres | Kateel River | 21N | 10E | 13 | NE |
| 634128 | EDC 19 | State Claim | 40 | acres | Kateel River | 21N | 10E | 13 | NE |
| 634129 | EDC 20 | State Claim | 38 | acres | Kateel River | 21N | 11E | 18 | NW |
| Appendix A - List of Claims | Page 29 of 52 |
| Trilogy Metals Inc. | | |
| NI 43-101 Technical Report on the Arctic Project, | | |
| Northwest Alaska | | |
| Lease | Name | Type | Current Area | Area Type | Meridian | Township | Range | Section | 1/4 Section |
| 634130 | EDC 21 | State Claim | 40 | acres | Kateel River | 21N | 11E | 18 | NW |
| 634131 | EDC 22 | State Claim | 40 | acres | Kateel River | 21N | 11E | 18 | NE |
| 634132 | EDC 23 | State Claim | 40 | acres | Kateel River | 21N | 11E | 18 | NE |
| 634133 | EDC 24 | State Claim | 40 | acres | Kateel River | 21N | 11E | 17 | NW |
| 634134 | EDC 25 | State Claim | 40 | acres | Kateel River | 21N | 10E | 13 | NW |
| 634135 | EDC 26 | State Claim | 40 | acres | Kateel River | 21N | 10E | 13 | NE |
| 634136 | EDC 27 | State Claim | 40 | acres | Kateel River | 21N | 10E | 13 | NE |
| 634137 | EDC 28 | State Claim | 38 | acres | Kateel River | 21N | 11E | 18 | NW |
| 634138 | EDC 29 | State Claim | 40 | acres | Kateel River | 21N | 11E | 18 | NW |
| 634139 | EDC 30 | State Claim | 40 | acres | Kateel River | 21N | 11E | 18 | NE |
| 634140 | EDC 31 | State Claim | 40 | acres | Kateel River | 21N | 11E | 18 | NE |
| 634141 | EDC 32 | State Claim | 40 | acres | Kateel River | 21N | 11E | 17 | NW |
| 634142 | EDC 33 | State Claim | 40 | acres | Kateel River | 21N | 10E | 13 | SW |
| 634143 | EDC 34 | State Claim | 40 | acres | Kateel River | 21N | 10E | 13 | SE |
| 634144 | EDC 35 | State Claim | 40 | acres | Kateel River | 21N | 10E | 13 | SE |
| 634145 | EDC 36 | State Claim | 38 | acres | Kateel River | 21N | 11E | 18 | SW |
| 634146 | EDC 37 | State Claim | 40 | acres | Kateel River | 21N | 11E | 18 | SW |
| 634147 | EDC 38 | State Claim | 40 | acres | Kateel River | 21N | 11E | 18 | SE |
| 634148 | EDC 39 | State Claim | 40 | acres | Kateel River | 21N | 11E | 18 | SE |
| 634149 | EDC 40 | State Claim | 40 | acres | Kateel River | 21N | 11E | 17 | SW |
| 634150 | EDC 41 | State Claim | 40 | acres | Kateel River | 21N | 10E | 13 | SW |
| 634151 | EDC 42 | State Claim | 40 | acres | Kateel River | 21N | 10E | 13 | SE |
| 634152 | EDC 43 | State Claim | 40 | acres | Kateel River | 21N | 10E | 13 | SE |
| 634153 | EDC 44 | State Claim | 38 | acres | Kateel River | 21N | 11E | 18 | SW |
| 634154 | EDC 45 | State Claim | 40 | acres | Kateel River | 21N | 11E | 18 | SW |
| 634155 | EDC 46 | State Claim | 40 | acres | Kateel River | 21N | 11E | 18 | SE |
| 634156 | EDC 47 | State Claim | 40 | acres | Kateel River | 21N | 11E | 18 | SE |
| Appendix A - List of Claims | Page 30 of 52 |
| Trilogy Metals Inc. | | |
| NI 43-101 Technical Report on the Arctic Project, | | |
| Northwest Alaska | | |
| Lease | Name | Type | Current Area | Area Type | Meridian | Township | Range | Section | 1/4 Section |
| 634157 | EDC 48 | State Claim | 40 | acres | Kateel River | 21N | 11E | 17 | SW |
| 634158 | EDC 49 | State Claim | 40 | acres | Kateel River | 21N | 10E | 24 | NW |
| 634159 | EDC 50 | State Claim | 40 | acres | Kateel River | 21N | 10E | 24 | NE |
| 634160 | EDC 51 | State Claim | 40 | acres | Kateel River | 21N | 10E | 24 | NE |
| 634161 | EDC 52 | State Claim | 38 | acres | Kateel River | 21N | 11E | 19 | NW |
| 634162 | EDC 53 | State Claim | 40 | acres | Kateel River | 21N | 11E | 19 | NW |
| 634163 | EDC 54 | State Claim | 40 | acres | Kateel River | 21N | 11E | 19 | NE |
| 634164 | EDC 55 | State Claim | 40 | acres | Kateel River | 21N | 11E | 19 | NE |
| 634165 | EDC 56 | State Claim | 40 | acres | Kateel River | 21N | 11E | 20 | NW |
| 634166 | EDC 57 | State Claim | 40 | acres | Kateel River | 21N | 10E | 24 | NW |
| 634167 | EDC 58 | State Claim | 40 | acres | Kateel River | 21N | 10E | 24 | NE |
| 634168 | EDC 59 | State Claim | 40 | acres | Kateel River | 21N | 10E | 24 | NE |
| 634169 | EDC 60 | State Claim | 38 | acres | Kateel River | 21N | 11E | 19 | NW |
| 634170 | EDC 61 | State Claim | 40 | acres | Kateel River | 21N | 11E | 19 | NW |
| 634171 | EDC 62 | State Claim | 40 | acres | Kateel River | 21N | 11E | 19 | NE |
| 634172 | EDC 63 | State Claim | 40 | acres | Kateel River | 21N | 11E | 19 | NE |
| 634173 | EDC 64 | State Claim | 40 | acres | Kateel River | 21N | 11E | 20 | NW |
| 634174 | EDC 65 | State Claim | 40 | acres | Kateel River | 21N | 10E | 24 | SE |
| 634175 | EDC 66 | State Claim | 40 | acres | Kateel River | 21N | 10E | 24 | SE |
| 634176 | EDC 67 | State Claim | 39 | acres | Kateel River | 21N | 11E | 19 | SW |
| 634177 | EDC 68 | State Claim | 40 | acres | Kateel River | 21N | 11E | 19 | SW |
| 634178 | EDC 69 | State Claim | 40 | acres | Kateel River | 21N | 11E | 19 | SE |
| 634179 | EDC 70 | State Claim | 40 | acres | Kateel River | 21N | 11E | 19 | SE |
| 634180 | EDC 71 | State Claim | 40 | acres | Kateel River | 21N | 11E | 20 | SW |
| 634181 | EDC 72 | State Claim | 40 | acres | Kateel River | 21N | 11E | 20 | SW |
| 634182 | EDC 73 | State Claim | 40 | acres | Kateel River | 21N | 11E | 20 | SE |
| 634183 | EDC 74 | State Claim | 40 | acres | Kateel River | 21N | 11E | 20 | SE |
| Appendix A - List of Claims | Page 31 of 52 |
| Trilogy Metals Inc. | | |
| NI 43-101 Technical Report on the Arctic Project, | | |
| Northwest Alaska | | |
| Lease | Name | Type | Current Area | Area Type | Meridian | Township | Range | Section | 1/4 Section |
| 634184 | EDC 75 | State Claim | 40 | acres | Kateel River | 21N | 11E | 21 | SW |
| 634185 | EDC 76 | State Claim | 40 | acres | Kateel River | 21N | 10E | 24 | SE |
| 634186 | EDC 77 | State Claim | 39 | acres | Kateel River | 21N | 11E | 19 | SW |
| 634187 | EDC 78 | State Claim | 40 | acres | Kateel River | 21N | 11E | 19 | SW |
| 634188 | EDC 79 | State Claim | 40 | acres | Kateel River | 21N | 11E | 19 | SE |
| 634189 | EDC 80 | State Claim | 40 | acres | Kateel River | 21N | 11E | 19 | SE |
| 634190 | EDC 81 | State Claim | 40 | acres | Kateel River | 21N | 11E | 20 | SW |
| 634191 | EDC 82 | State Claim | 40 | acres | Kateel River | 21N | 11E | 20 | SW |
| 634192 | EDC 83 | State Claim | 40 | acres | Kateel River | 21N | 11E | 20 | SE |
| 634193 | EDC 84 | State Claim | 40 | acres | Kateel River | 21N | 11E | 20 | SE |
| 634194 | EDC 85 | State Claim | 40 | acres | Kateel River | 21N | 11E | 21 | SW |
| 634195 | EDC 86 | State Claim | 40 | acres | Kateel River | 21N | 10E | 25 | NE |
| 634196 | EDC 87 | State Claim | 39 | acres | Kateel River | 21N | 11E | 30 | NW |
| 634197 | EDC 88 | State Claim | 40 | acres | Kateel River | 21N | 11E | 30 | NW |
| 634198 | EDC 89 | State Claim | 40 | acres | Kateel River | 21N | 11E | 30 | NE |
| 634199 | EDC 90 | State Claim | 40 | acres | Kateel River | 21N | 11E | 30 | NE |
| 634200 | EDC 91 | State Claim | 40 | acres | Kateel River | 21N | 11E | 29 | NW |
| 634201 | EDC 92 | State Claim | 40 | acres | Kateel River | 21N | 11E | 29 | NW |
| 634202 | EDC 93 | State Claim | 40 | acres | Kateel River | 21N | 11E | 29 | NE |
| 634203 | EDC 94 | State Claim | 40 | acres | Kateel River | 21N | 11E | 29 | NE |
| 634204 | EDC 95 | State Claim | 40 | acres | Kateel River | 21N | 11E | 28 | NW |
| 650291 | HOSS 01 | State Claim | 149 | acres | Kateel River | 22N | 10E | 18 | NW |
| 650292 | HOSS 02 | State Claim | 160 | acres | Kateel River | 22N | 10E | 18 | NE |
| 650293 | HOSS 03 | State Claim | 160 | acres | Kateel River | 22N | 10E | 17 | NW |
| 650294 | HOSS 04 | State Claim | 160 | acres | Kateel River | 22N | 10E | 17 | NE |
| 650295 | HOSS 05 | State Claim | 160 | acres | Kateel River | 22N | 10E | 16 | NW |
| 650296 | HOSS 06 | State Claim | 160 | acres | Kateel River | 22N | 10E | 16 | NE |
| Appendix A - List of Claims | Page 32 of 52 |
| Trilogy Metals Inc. | | |
| NI 43-101 Technical Report on the Arctic Project, | | |
| Northwest Alaska | | |
| Lease | Name | Type | Current Area | Area Type | Meridian | Township | Range | Section | 1/4 Section |
| 650297 | HOSS 07 | State Claim | 160 | acres | Kateel River | 22N | 10E | 15 | NW |
| 650298 | HOSS 08 | State Claim | 149 | acres | Kateel River | 22N | 10E | 18 | SW |
| 650299 | HOSS 09 | State Claim | 160 | acres | Kateel River | 22N | 10E | 18 | SE |
| 650300 | HOSS 10 | State Claim | 160 | acres | Kateel River | 22N | 10E | 17 | SW |
| 650301 | HOSS 11 | State Claim | 160 | acres | Kateel River | 22N | 10E | 17 | SE |
| 650302 | HOSS 12 | State Claim | 160 | acres | Kateel River | 22N | 10E | 16 | SW |
| 650303 | HOSS 13 | State Claim | 160 | acres | Kateel River | 22N | 10E | 16 | SE |
| 650304 | HOSS 14 | State Claim | 160 | acres | Kateel River | 22N | 10E | 15 | SW |
| 650305 | HOSS 15 | State Claim | 150 | acres | Kateel River | 22N | 10E | 19 | NW |
| 650306 | HOSS 16 | State Claim | 160 | acres | Kateel River | 22N | 10E | 19 | NE |
| 650307 | HOSS 17 | State Claim | 160 | acres | Kateel River | 22N | 10E | 20 | NW |
| 650308 | HOSS 18 | State Claim | 160 | acres | Kateel River | 22N | 10E | 20 | NE |
| 650309 | HOSS 19 | State Claim | 160 | acres | Kateel River | 22N | 10E | 21 | NW |
| 650310 | HOSS 20 | State Claim | 160 | acres | Kateel River | 22N | 10E | 21 | NE |
| 650311 | HOSS 21 | State Claim | 160 | acres | Kateel River | 22N | 10E | 22 | NW |
| 650312 | HOSS 22 | State Claim | 150 | acres | Kateel River | 22N | 10E | 19 | SW |
| 650313 | HOSS 23 | State Claim | 160 | acres | Kateel River | 22N | 10E | 19 | SE |
| 650314 | HOSS 24 | State Claim | 160 | acres | Kateel River | 22N | 10E | 20 | SW |
| 650315 | HOSS 25 | State Claim | 160 | acres | Kateel River | 22N | 10E | 20 | SE |
| 650316 | HOSS 26 | State Claim | 160 | acres | Kateel River | 22N | 10E | 21 | SW |
| 650317 | HOSS 27 | State Claim | 160 | acres | Kateel River | 22N | 10E | 21 | SE |
| 650318 | HOSS 28 | State Claim | 160 | acres | Kateel River | 22N | 10E | 22 | SW |
| 650319 | HOSS 29 | State Claim | 151 | acres | Kateel River | 22N | 10E | 30 | NW |
| 650320 | HOSS 30 | State Claim | 160 | acres | Kateel River | 22N | 10E | 30 | NE |
| 650321 | HOSS 31 | State Claim | 160 | acres | Kateel River | 22N | 10E | 29 | NW |
| 650322 | HOSS 32 | State Claim | 160 | acres | Kateel River | 22N | 10E | 29 | NE |
| 650323 | HOSS 33 | State Claim | 160 | acres | Kateel River | 22N | 10E | 28 | NW |
| Appendix A - List of Claims | Page 33 of 52 |
| Trilogy Metals Inc. | | |
| NI 43-101 Technical Report on the Arctic Project, | | |
| Northwest Alaska | | |
| Lease | Name | Type | Current Area | Area Type | Meridian | Township | Range | Section | 1/4 Section |
| 650324 | HOSS 34 | State Claim | 160 | acres | Kateel River | 22N | 10E | 28 | NE |
| 650325 | HOSS 35 | State Claim | 160 | acres | Kateel River | 22N | 10E | 27 | NW |
| 651152 | ZED 1 | State Claim | 160 | acres | Kateel River | 20N | 12E | 10 | NE |
| 651153 | ZED 2 | State Claim | 160 | acres | Kateel River | 20N | 12E | 11 | NW |
| 651154 | ZED 3 | State Claim | 160 | acres | Kateel River | 20N | 12E | 11 | NE |
| 651155 | ZED 4 | State Claim | 160 | acres | Kateel River | 20N | 12E | 10 | SE |
| 651156 | ZED 5 | State Claim | 160 | acres | Kateel River | 20N | 12E | 11 | SW |
| 651157 | ZED 6 | State Claim | 160 | acres | Kateel River | 20N | 12E | 11 | SE |
| 651158 | ZED 7 | State Claim | 160 | acres | Kateel River | 20N | 12E | 12 | SW |
| 651159 | ZED 8 | State Claim | 160 | acres | Kateel River | 20N | 12E | 12 | SE |
| 651160 | ZED 9 | State Claim | 160 | acres | Kateel River | 20N | 12E | 15 | NE |
| 651161 | ZED 10 | State Claim | 160 | acres | Kateel River | 20N | 12E | 14 | NW |
| 651162 | ZED 11 | State Claim | 160 | acres | Kateel River | 20N | 12E | 14 | NE |
| 651163 | ZED 12 | State Claim | 160 | acres | Kateel River | 20N | 12E | 13 | NW |
| 651164 | ZED 13 | State Claim | 160 | acres | Kateel River | 20N | 12E | 13 | NE |
| 651165 | ZED 14 | State Claim | 135 | acres | Kateel River | 20N | 13E | 18 | NW |
| 651166 | ZED 15 | State Claim | 160 | acres | Kateel River | 20N | 13E | 18 | NE |
| 651167 | ZED 16 | State Claim | 160 | acres | Kateel River | 20N | 13E | 17 | NW |
| 651168 | ZED 17 | State Claim | 160 | acres | Kateel River | 20N | 13E | 17 | NE |
| 651169 | ZED 18 | State Claim | 160 | acres | Kateel River | 20N | 13E | 16 | NW |
| 651170 | ZED 19 | State Claim | 160 | acres | Kateel River | 20N | 13E | 16 | NE |
| 651171 | ZED 20 | State Claim | 160 | acres | Kateel River | 20N | 13E | 15 | NW |
| 651172 | ZED 21 | State Claim | 160 | acres | Kateel River | 20N | 13E | 15 | NE |
| 651173 | ZED 22 | State Claim | 160 | acres | Kateel River | 20N | 12E | 15 | SE |
| 651174 | ZED 23 | State Claim | 160 | acres | Kateel River | 20N | 12E | 14 | SW |
| 651175 | ZED 24 | State Claim | 160 | acres | Kateel River | 20N | 12E | 14 | SE |
| 651176 | ZED 25 | State Claim | 160 | acres | Kateel River | 20N | 12E | 13 | SW |
| Appendix A - List of Claims | Page 34 of 52 |
| Trilogy Metals Inc. | | |
| NI 43-101 Technical Report on the Arctic Project, | | |
| Northwest Alaska | | |
| Lease | Name | Type | Current Area | Area Type | Meridian | Township | Range | Section | 1/4 Section |
| 651177 | ZED 26 | State Claim | 160 | acres | Kateel River | 20N | 12E | 13 | SE |
| 651178 | ZED 27 | State Claim | 136 | acres | Kateel River | 20N | 13E | 18 | SW |
| 651179 | ZED 28 | State Claim | 160 | acres | Kateel River | 20N | 13E | 18 | SE |
| 651180 | ZED 29 | State Claim | 160 | acres | Kateel River | 20N | 13E | 17 | SW |
| 651181 | ZED 30 | State Claim | 160 | acres | Kateel River | 20N | 13E | 17 | SE |
| 651182 | ZED 31 | State Claim | 160 | acres | Kateel River | 20N | 13E | 16 | SW |
| 651183 | ZED 32 | State Claim | 160 | acres | Kateel River | 20N | 13E | 16 | SE |
| 651184 | ZED 33 | State Claim | 160 | acres | Kateel River | 20N | 13E | 15 | SW |
| 651185 | ZED 34 | State Claim | 160 | acres | Kateel River | 20N | 13E | 15 | SE |
| 651186 | ZED 35 | State Claim | 160 | acres | Kateel River | 20N | 12E | 24 | NE |
| 651187 | ZED 36 | State Claim | 136 | acres | Kateel River | 20N | 13E | 19 | NW |
| 651188 | ZED 37 | State Claim | 160 | acres | Kateel River | 20N | 13E | 19 | NE |
| 651189 | ZED 38 | State Claim | 160 | acres | Kateel River | 20N | 13E | 20 | NW |
| 651190 | ZED 39 | State Claim | 160 | acres | Kateel River | 20N | 13E | 20 | NE |
| 651191 | ZED 40 | State Claim | 160 | acres | Kateel River | 20N | 13E | 21 | NW |
| 651192 | ZED 41 | State Claim | 160 | acres | Kateel River | 20N | 13E | 21 | NE |
| 651193 | ZED 42 | State Claim | 160 | acres | Kateel River | 20N | 13E | 22 | NW |
| 651194 | ZED 43 | State Claim | 160 | acres | Kateel River | 20N | 13E | 22 | NE |
| 651195 | ZED 44 | State Claim | 160 | acres | Kateel River | 20N | 13E | 19 | SE |
| 651196 | ZED 45 | State Claim | 160 | acres | Kateel River | 20N | 13E | 20 | SW |
| 651197 | ZED 46 | State Claim | 160 | acres | Kateel River | 20N | 13E | 20 | SE |
| 651198 | ZED 47 | State Claim | 160 | acres | Kateel River | 20N | 13E | 21 | SW |
| 651199 | ZED 48 | State Claim | 160 | acres | Kateel River | 20N | 13E | 21 | SE |
| 651200 | ZED 49 | State Claim | 160 | acres | Kateel River | 20N | 13E | 22 | SW |
| 651201 | ZED 50 | State Claim | 160 | acres | Kateel River | 20N | 13E | 22 | SE |
| 651202 | ZED 51 | State Claim | 160 | acres | Kateel River | 20N | 13E | 23 | NW |
| 651203 | ZED 52 | State Claim | 160 | acres | Kateel River | 20N | 13E | 23 | NE |
| Appendix A - List of Claims | Page 35 of 52 |
| Trilogy Metals Inc. | | |
| NI 43-101 Technical Report on the Arctic Project, | | |
| Northwest Alaska | | |
| Lease | Name | Type | Current Area | Area Type | Meridian | Township | Range | Section | 1/4 Section |
| 651204 | ZED 53 | State Claim | 160 | acres | Kateel River | 20N | 13E | 24 | NW |
| 651205 | ZED 54 | State Claim | 160 | acres | Kateel River | 20N | 13E | 24 | NE |
| 651206 | ZED 55 | State Claim | 137 | acres | Kateel River | 20N | 14E | 19 | NW |
| 651207 | ZED 56 | State Claim | 160 | acres | Kateel River | 20N | 14E | 19 | NE |
| 651208 | ZED 57 | State Claim | 160 | acres | Kateel River | 20N | 14E | 20 | NW |
| 651209 | ZED 58 | State Claim | 160 | acres | Kateel River | 20N | 14E | 20 | NE |
| 651210 | ZED 59 | State Claim | 160 | acres | Kateel River | 20N | 14E | 21 | NW |
| 651211 | ZED 60 | State Claim | 160 | acres | Kateel River | 20N | 14E | 21 | NE |
| 651212 | ZED 61 | State Claim | 160 | acres | Kateel River | 20N | 14E | 22 | NW |
| 651213 | ZED 62 | State Claim | 160 | acres | Kateel River | 20N | 14E | 22 | NE |
| 651214 | ZED 63 | State Claim | 160 | acres | Kateel River | 20N | 14E | 23 | NW |
| 651215 | ZED 64 | State Claim | 160 | acres | Kateel River | 20N | 14E | 23 | NE |
| 651216 | ZED 65 | State Claim | 160 | acres | Kateel River | 20N | 14E | 24 | NW |
| 651217 | ZED 66 | State Claim | 160 | acres | Kateel River | 20N | 14E | 24 | NE |
| 651218 | ZED 67 | State Claim | 137 | acres | Kateel River | 20N | 15E | 19 | NW |
| 651219 | ZED 68 | State Claim | 160 | acres | Kateel River | 20N | 13E | 23 | SW |
| 651220 | ZED 69 | State Claim | 160 | acres | Kateel River | 20N | 13E | 23 | SE |
| 651221 | ZED 70 | State Claim | 160 | acres | Kateel River | 20N | 13E | 24 | SW |
| 651222 | ZED 71 | State Claim | 160 | acres | Kateel River | 20N | 13E | 24 | SE |
| 651223 | ZED 72 | State Claim | 137 | acres | Kateel River | 20N | 14E | 19 | SW |
| 651224 | ZED 73 | State Claim | 160 | acres | Kateel River | 20N | 14E | 19 | SE |
| 651225 | ZED 74 | State Claim | 160 | acres | Kateel River | 20N | 14E | 20 | SW |
| 651226 | ZED 75 | State Claim | 160 | acres | Kateel River | 20N | 14E | 20 | SE |
| 651227 | ZED 76 | State Claim | 160 | acres | Kateel River | 20N | 14E | 21 | SW |
| 651228 | ZED 77 | State Claim | 160 | acres | Kateel River | 20N | 14E | 21 | SE |
| 651229 | ZED 78 | State Claim | 160 | acres | Kateel River | 20N | 14E | 22 | SW |
| 651230 | ZED 79 | State Claim | 160 | acres | Kateel River | 20N | 14E | 22 | SE |
| Appendix A - List of Claims | Page 36 of 52 |
| Trilogy Metals Inc. | | |
| NI 43-101 Technical Report on the Arctic Project, | | |
| Northwest Alaska | | |
| Lease | Name | Type | Current Area | Area Type | Meridian | Township | Range | Section | 1/4 Section |
| 651231 | ZED 80 | State Claim | 160 | acres | Kateel River | 20N | 14E | 23 | SW |
| 651232 | ZED 81 | State Claim | 160 | acres | Kateel River | 20N | 14E | 23 | SE |
| 651233 | ZED 82 | State Claim | 160 | acres | Kateel River | 20N | 14E | 24 | SW |
| 651234 | ZED 83 | State Claim | 160 | acres | Kateel River | 20N | 14E | 24 | SE |
| 651235 | ZED 84 | State Claim | 137 | acres | Kateel River | 20N | 15E | 19 | SW |
| 651236 | ZED 85 | State Claim | 160 | acres | Kateel River | 20N | 13E | 26 | NW |
| 651237 | ZED 86 | State Claim | 160 | acres | Kateel River | 20N | 13E | 26 | NE |
| 651238 | ZED 87 | State Claim | 160 | acres | Kateel River | 20N | 13E | 25 | NW |
| 651239 | ZED 88 | State Claim | 160 | acres | Kateel River | 20N | 13E | 25 | NE |
| 651240 | ZED 89 | State Claim | 138 | acres | Kateel River | 20N | 14E | 30 | NW |
| 651241 | ZED 90 | State Claim | 160 | acres | Kateel River | 20N | 14E | 30 | NE |
| 651242 | ZED 91 | State Claim | 160 | acres | Kateel River | 20N | 14E | 29 | NW |
| 651243 | ZED 92 | State Claim | 160 | acres | Kateel River | 20N | 14E | 29 | NE |
| 651244 | ZED 93 | State Claim | 160 | acres | Kateel River | 20N | 14E | 28 | NW |
| 651245 | ZED 94 | State Claim | 160 | acres | Kateel River | 20N | 14E | 28 | NE |
| 651246 | ZED 95 | State Claim | 160 | acres | Kateel River | 20N | 14E | 27 | NW |
| 651247 | ZED 96 | State Claim | 160 | acres | Kateel River | 20N | 14E | 27 | NE |
| 651248 | ZED 97 | State Claim | 160 | acres | Kateel River | 20N | 14E | 26 | NW |
| 651249 | ZED 98 | State Claim | 160 | acres | Kateel River | 20N | 14E | 26 | NE |
| 651250 | ZED 99 | State Claim | 160 | acres | Kateel River | 20N | 14E | 25 | NW |
| 651251 | ZED 100 | State Claim | 160 | acres | Kateel River | 20N | 14E | 25 | NE |
| 651252 | ZED 101 | State Claim | 138 | acres | Kateel River | 20N | 15E | 30 | NW |
| 651253 | ZED 102 | State Claim | 160 | acres | Kateel River | 20N | 13E | 26 | SW |
| 651254 | ZED 103 | State Claim | 160 | acres | Kateel River | 20N | 13E | 26 | SE |
| 651255 | ZED 104 | State Claim | 160 | acres | Kateel River | 20N | 13E | 25 | SW |
| 651256 | ZED 105 | State Claim | 160 | acres | Kateel River | 20N | 13E | 25 | SE |
| 651257 | ZED 106 | State Claim | 138 | acres | Kateel River | 20N | 14E | 30 | SW |
| Appendix A - List of Claims | Page 37 of 52 |
| Trilogy Metals Inc. | | |
| NI 43-101 Technical Report on the Arctic Project, | | |
| Northwest Alaska | | |
| Lease | Name | Type | Current Area | Area Type | Meridian | Township | Range | Section | 1/4 Section |
| 651258 | ZED 107 | State Claim | 160 | acres | Kateel River | 20N | 14E | 30 | SE |
| 651259 | ZED 108 | State Claim | 160 | acres | Kateel River | 20N | 14E | 29 | SW |
| 651260 | ZED 109 | State Claim | 160 | acres | Kateel River | 20N | 14E | 29 | SE |
| 651261 | ZED 110 | State Claim | 160 | acres | Kateel River | 20N | 14E | 28 | SW |
| 651262 | ZED 111 | State Claim | 160 | acres | Kateel River | 20N | 14E | 28 | SE |
| 651263 | ZED 112 | State Claim | 160 | acres | Kateel River | 20N | 14E | 27 | SW |
| 651264 | ZED 113 | State Claim | 160 | acres | Kateel River | 20N | 14E | 27 | SE |
| 651265 | ZED 114 | State Claim | 160 | acres | Kateel River | 20N | 14E | 26 | SW |
| 651266 | ZED 115 | State Claim | 160 | acres | Kateel River | 20N | 14E | 26 | SE |
| 651267 | ZED 116 | State Claim | 160 | acres | Kateel River | 20N | 14E | 25 | SW |
| 651268 | ZED 117 | State Claim | 160 | acres | Kateel River | 20N | 14E | 25 | SE |
| 651269 | ZED 118 | State Claim | 138 | acres | Kateel River | 20N | 15E | 30 | SW |
| 651270 | PAL 1 | State Claim | 40 | acres | Kateel River | 21N | 10E | 25 | NE |
| 651271 | PAL 2 | State Claim | 40 | acres | Kateel River | 21N | 10E | 25 | NE |
| 651272 | PAL 3 | State Claim | 39 | acres | Kateel River | 21N | 11E | 30 | NW |
| 651273 | PAL 4 | State Claim | 40 | acres | Kateel River | 21N | 11E | 30 | NW |
| 651274 | PAL 5 | State Claim | 40 | acres | Kateel River | 21N | 11E | 30 | NE |
| 651275 | PAL 6 | State Claim | 40 | acres | Kateel River | 21N | 11E | 30 | NE |
| 651276 | PAL 7 | State Claim | 40 | acres | Kateel River | 21N | 11E | 29 | NW |
| 651277 | PAL 8 | State Claim | 40 | acres | Kateel River | 21N | 11E | 29 | NW |
| 651278 | PAL 9 | State Claim | 40 | acres | Kateel River | 21N | 11E | 29 | NE |
| 651279 | PAL 10 | State Claim | 40 | acres | Kateel River | 21N | 11E | 29 | NE |
| 651280 | PAL 11 | State Claim | 40 | acres | Kateel River | 21N | 11E | 28 | NW |
| 651289 | PAL 20 | State Claim | 160 | acres | Kateel River | 21N | 10E | 25 | SE |
| 651290 | PAL 21 | State Claim | 159 | acres | Kateel River | 21N | 11E | 30 | SW |
| 651291 | PAL 22 | State Claim | 160 | acres | Kateel River | 21N | 11E | 30 | SE |
| 651292 | PAL 23 | State Claim | 160 | acres | Kateel River | 21N | 11E | 29 | SW |
| Appendix A - List of Claims | Page 38 of 52 |
| Trilogy Metals Inc. | | |
| NI 43-101 Technical Report on the Arctic Project, | | |
| Northwest Alaska | | |
| Lease | Name | Type | Current Area | Area Type | Meridian | Township | Range | Section | 1/4 Section |
| 651293 | PAL 24 | State Claim | 160 | acres | Kateel River | 21N | 11E | 29 | SE |
| 651294 | PAL 25 | State Claim | 160 | acres | Kateel River | 21N | 11E | 28 | SW |
| 651296 | PAL 27 | State Claim | 160 | acres | Kateel River | 21N | 11E | 32 | NE |
| 651297 | PAL 28 | State Claim | 160 | acres | Kateel River | 21N | 11E | 33 | NW |
| 651299 | GAP 1 | State Claim | 160 | acres | Kateel River | 22N | 8E | 28 | NW |
| 651300 | GAP 2 | State Claim | 160 | acres | Kateel River | 22N | 8E | 28 | NE |
| 651301 | GAP 3 | State Claim | 160 | acres | Kateel River | 22N | 8E | 27 | NW |
| 651302 | GAP 4 | State Claim | 160 | acres | Kateel River | 22N | 8E | 27 | NE |
| 651303 | GAP 5 | State Claim | 160 | acres | Kateel River | 22N | 8E | 26 | NW |
| 651304 | GAP 6 | State Claim | 160 | acres | Kateel River | 22N | 8E | 26 | NE |
| 651305 | GAP 7 | State Claim | 160 | acres | Kateel River | 22N | 8E | 25 | NW |
| 651306 | GAP 8 | State Claim | 160 | acres | Kateel River | 22N | 8E | 25 | NE |
| 651307 | GAP 9 | State Claim | 151 | acres | Kateel River | 22N | 9E | 30 | NW |
| 651308 | GAP 10 | State Claim | 160 | acres | Kateel River | 22N | 9E | 30 | NE |
| 651309 | GAP 11 | State Claim | 160 | acres | Kateel River | 22N | 9E | 29 | NW |
| 651310 | GAP 12 | State Claim | 160 | acres | Kateel River | 22N | 8E | 28 | SW |
| 651311 | GAP 13 | State Claim | 160 | acres | Kateel River | 22N | 8E | 28 | SE |
| 651312 | GAP 14 | State Claim | 160 | acres | Kateel River | 22N | 8E | 27 | SW |
| 651313 | GAP 15 | State Claim | 160 | acres | Kateel River | 22N | 8E | 27 | SE |
| 651314 | GAP 16 | State Claim | 160 | acres | Kateel River | 22N | 8E | 26 | SW |
| 651315 | GAP 17 | State Claim | 160 | acres | Kateel River | 22N | 8E | 26 | SE |
| 651316 | GAP 18 | State Claim | 160 | acres | Kateel River | 22N | 8E | 25 | SW |
| 651317 | GAP 19 | State Claim | 160 | acres | Kateel River | 22N | 8E | 25 | SE |
| 651318 | GAP 20 | State Claim | 152 | acres | Kateel River | 22N | 9E | 30 | SW |
| 651319 | GAP 21 | State Claim | 160 | acres | Kateel River | 22N | 9E | 30 | SE |
| 651320 | GAP 22 | State Claim | 160 | acres | Kateel River | 22N | 9E | 29 | SW |
| 651321 | GAP 23 | State Claim | 160 | acres | Kateel River | 22N | 9E | 29 | SE |
| Appendix A - List of Claims | Page 39 of 52 |
| Trilogy Metals Inc. | | |
| NI 43-101 Technical Report on the Arctic Project, | | |
| Northwest Alaska | | |
| Lease | Name | Type | Current Area | Area Type | Meridian | Township | Range | Section | 1/4 Section |
| 651322 | GAP 24 | State Claim | 160 | acres | Kateel River | 22N | 9E | 28 | SW |
| 651323 | GAP 25 | State Claim | 160 | acres | Kateel River | 22N | 9E | 28 | SE |
| 651324 | GAP 26 | State Claim | 160 | acres | Kateel River | 22N | 9E | 27 | SW |
| 651325 | GAP 27 | State Claim | 160 | acres | Kateel River | 22N | 8E | 34 | NE |
| 651326 | GAP 28 | State Claim | 160 | acres | Kateel River | 22N | 8E | 35 | NW |
| 651327 | GAP 29 | State Claim | 160 | acres | Kateel River | 22N | 8E | 35 | NE |
| 651328 | GAP 30 | State Claim | 160 | acres | Kateel River | 22N | 8E | 36 | NW |
| 651329 | GAP 31 | State Claim | 160 | acres | Kateel River | 22N | 8E | 36 | NE |
| 651330 | GAP 32 | State Claim | 152 | acres | Kateel River | 22N | 9E | 31 | NW |
| 651331 | GAP 33 | State Claim | 160 | acres | Kateel River | 22N | 9E | 31 | NE |
| 651332 | GAP 34 | State Claim | 160 | acres | Kateel River | 22N | 9E | 32 | NW |
| 651333 | GAP 35 | State Claim | 160 | acres | Kateel River | 22N | 9E | 32 | NE |
| 651334 | GAP 36 | State Claim | 160 | acres | Kateel River | 22N | 9E | 33 | NW |
| 651335 | GAP 37 | State Claim | 160 | acres | Kateel River | 22N | 9E | 33 | NE |
| 651336 | GAP 38 | State Claim | 160 | acres | Kateel River | 22N | 9E | 34 | NW |
| 651337 | GAP 39 | State Claim | 160 | acres | Kateel River | 22N | 9E | 34 | NE |
| 651338 | GAP 40 | State Claim | 160 | acres | Kateel River | 22N | 9E | 35 | NW |
| 651339 | GAP 41 | State Claim | 160 | acres | Kateel River | 22N | 9E | 35 | NE |
| 651340 | GAP 42 | State Claim | 160 | acres | Kateel River | 22N | 9E | 36 | NW |
| 651341 | GAP 43 | State Claim | 160 | acres | Kateel River | 22N | 9E | 36 | NE |
| 651342 | GAP 44 | State Claim | 152 | acres | Kateel River | 22N | 10E | 31 | NW |
| 651343 | GAP 45 | State Claim | 160 | acres | Kateel River | 22N | 10E | 31 | NE |
| 651344 | GAP 46 | State Claim | 160 | acres | Kateel River | 22N | 10E | 32 | NW |
| 651345 | GAP 47 | State Claim | 160 | acres | Kateel River | 22N | 10E | 32 | NE |
| 651346 | GAP 48 | State Claim | 160 | acres | Kateel River | 22N | 10E | 33 | NW |
| 651347 | GAP 49 | State Claim | 160 | acres | Kateel River | 22N | 10E | 33 | NE |
| 651348 | GAP 50 | State Claim | 160 | acres | Kateel River | 22N | 10E | 34 | NW |
| Appendix A - List of Claims | Page 40 of 52 |
| Trilogy Metals Inc. | | |
| NI 43-101 Technical Report on the Arctic Project, | | |
| Northwest Alaska | | |
| Lease | Name | Type | Current Area | Area Type | Meridian | Township | Range | Section | 1/4 Section |
| 651349 | GAP 51 | State Claim | 152 | acres | Kateel River | 22N | 10E | 30 | SW |
| 651350 | GAP 52 | State Claim | 160 | acres | Kateel River | 22N | 10E | 30 | SE |
| 651351 | GAP 53 | State Claim | 160 | acres | Kateel River | 22N | 10E | 29 | SW |
| 651352 | GAP 54 | State Claim | 160 | acres | Kateel River | 22N | 10E | 29 | SE |
| 651353 | GAP 55 | State Claim | 160 | acres | Kateel River | 22N | 10E | 28 | SW |
| 651354 | GAP 56 | State Claim | 160 | acres | Kateel River | 22N | 10E | 28 | SE |
| 651355 | GAP 57 | State Claim | 160 | acres | Kateel River | 22N | 10E | 27 | SW |
| 651356 | GAP 58 | State Claim | 160 | acres | Kateel River | 22N | 8E | 34 | SE |
| 651357 | GAP 59 | State Claim | 160 | acres | Kateel River | 22N | 8E | 35 | SW |
| 651358 | GAP 60 | State Claim | 160 | acres | Kateel River | 22N | 8E | 35 | SE |
| 651359 | GAP 61 | State Claim | 160 | acres | Kateel River | 22N | 8E | 36 | SW |
| 651360 | GAP 62 | State Claim | 160 | acres | Kateel River | 22N | 8E | 36 | SE |
| 651361 | GAP 63 | State Claim | 153 | acres | Kateel River | 22N | 9E | 31 | SW |
| 651362 | GAP 64 | State Claim | 160 | acres | Kateel River | 22N | 9E | 31 | SE |
| 651363 | GAP 65 | State Claim | 160 | acres | Kateel River | 22N | 9E | 32 | SW |
| 651364 | GAP 66 | State Claim | 160 | acres | Kateel River | 22N | 9E | 32 | SE |
| 651365 | GAP 67 | State Claim | 160 | acres | Kateel River | 22N | 9E | 33 | SW |
| 651366 | GAP 68 | State Claim | 160 | acres | Kateel River | 22N | 9E | 33 | SE |
| 651367 | GAP 69 | State Claim | 160 | acres | Kateel River | 22N | 9E | 34 | SW |
| 651368 | GAP 70 | State Claim | 160 | acres | Kateel River | 22N | 9E | 34 | SE |
| 651369 | GAP 71 | State Claim | 160 | acres | Kateel River | 22N | 9E | 35 | SW |
| 651370 | GAP 72 | State Claim | 160 | acres | Kateel River | 22N | 9E | 35 | SE |
| 651371 | GAP 73 | State Claim | 160 | acres | Kateel River | 22N | 9E | 36 | SW |
| 651372 | GAP 74 | State Claim | 160 | acres | Kateel River | 22N | 9E | 36 | SE |
| 651373 | GAP 75 | State Claim | 153 | acres | Kateel River | 22N | 10E | 31 | SW |
| 651374 | GAP 76 | State Claim | 160 | acres | Kateel River | 22N | 10E | 31 | SE |
| 651375 | GAP 77 | State Claim | 160 | acres | Kateel River | 22N | 10E | 32 | SW |
| Appendix A - List of Claims | Page 41 of 52 |
| Trilogy Metals Inc. | | |
| NI 43-101 Technical Report on the Arctic Project, | | |
| Northwest Alaska | | |
| Lease | Name | Type | Current Area | Area Type | Meridian | Township | Range | Section | 1/4 Section |
| 651376 | GAP 78 | State Claim | 160 | acres | Kateel River | 22N | 10E | 32 | SE |
| 651377 | GAP 79 | State Claim | 160 | acres | Kateel River | 22N | 10E | 33 | SW |
| 651378 | GAP 80 | State Claim | 160 | acres | Kateel River | 22N | 10E | 33 | SE |
| 651379 | GAP 81 | State Claim | 160 | acres | Kateel River | 22N | 10E | 34 | SW |
| 651380 | GAP 82 | State Claim | 160 | acres | Kateel River | 21N | 8E | 3 | NE |
| 651381 | GAP 83 | State Claim | 160 | acres | Kateel River | 21N | 8E | 2 | NW |
| 651382 | GAP 84 | State Claim | 160 | acres | Kateel River | 21N | 8E | 2 | NE |
| 651383 | GAP 85 | State Claim | 160 | acres | Kateel River | 21N | 8E | 1 | NW |
| 651384 | GAP 86 | State Claim | 160 | acres | Kateel River | 21N | 8E | 1 | NE |
| 651385 | GAP 87 | State Claim | 153 | acres | Kateel River | 21N | 9E | 6 | NW |
| 651386 | GAP 88 | State Claim | 160 | acres | Kateel River | 21N | 9E | 6 | NE |
| 651387 | GAP 89 | State Claim | 160 | acres | Kateel River | 21N | 9E | 2 | NW |
| 651388 | GAP 90 | State Claim | 160 | acres | Kateel River | 21N | 9E | 2 | NE |
| 651389 | GAP 91 | State Claim | 160 | acres | Kateel River | 21N | 9E | 1 | NW |
| 651390 | GAP 92 | State Claim | 160 | acres | Kateel River | 21N | 9E | 1 | NE |
| 651391 | GAP 93 | State Claim | 153 | acres | Kateel River | 21N | 10E | 6 | NW |
| 651392 | GAP 94 | State Claim | 160 | acres | Kateel River | 21N | 10E | 6 | NE |
| 651393 | GAP 95 | State Claim | 160 | acres | Kateel River | 21N | 10E | 5 | NW |
| 651394 | GAP 96 | State Claim | 160 | acres | Kateel River | 21N | 10E | 5 | NE |
| 651395 | GAP 97 | State Claim | 160 | acres | Kateel River | 21N | 10E | 4 | NW |
| 651396 | GAP 98 | State Claim | 160 | acres | Kateel River | 21N | 10E | 4 | NE |
| 651397 | GAP 99 | State Claim | 160 | acres | Kateel River | 21N | 10E | 3 | NW |
| 651398 | GAP 100 | State Claim | 160 | acres | Kateel River | 21N | 9E | 2 | SW |
| 651399 | GAP 101 | State Claim | 160 | acres | Kateel River | 21N | 9E | 2 | SE |
| 651400 | GAP 102 | State Claim | 160 | acres | Kateel River | 21N | 9E | 1 | SW |
| 651401 | GAP 103 | State Claim | 160 | acres | Kateel River | 21N | 9E | 1 | SE |
| 651402 | GAP 104 | State Claim | 154 | acres | Kateel River | 21N | 10E | 6 | SW |
| Appendix A - List of Claims | Page 42 of 52 |
| Trilogy Metals Inc. | | |
| NI 43-101 Technical Report on the Arctic Project, | | |
| Northwest Alaska | | |
| Lease | Name | Type | Current Area | Area Type | Meridian | Township | Range | Section | 1/4 Section |
| 651403 | GAP 105 | State Claim | 160 | acres | Kateel River | 21N | 10E | 6 | SE |
| 651404 | GAP 106 | State Claim | 160 | acres | Kateel River | 21N | 10E | 5 | SW |
| 651405 | GAP 107 | State Claim | 160 | acres | Kateel River | 21N | 10E | 5 | SE |
| 651406 | GAP 108 | State Claim | 160 | acres | Kateel River | 21N | 10E | 4 | SW |
| 651407 | GAP 109 | State Claim | 160 | acres | Kateel River | 21N | 10E | 4 | SE |
| 651408 | GAP 110 | State Claim | 160 | acres | Kateel River | 21N | 10E | 3 | SW |
| 651409 | GAP 111 | State Claim | 160 | acres | Kateel River | 21N | 10E | 3 | SE |
| 651410 | GAP 112 | State Claim | 160 | acres | Kateel River | 21N | 10E | 2 | SW |
| 651411 | GAP 113 | State Claim | 160 | acres | Kateel River | 21N | 10E | 2 | SE |
| 651412 | GAP 114 | State Claim | 40 | acres | Kateel River | 21N | 9E | 11 | NW |
| 651413 | GAP 115 | State Claim | 40 | acres | Kateel River | 21N | 9E | 11 | NW |
| 651414 | GAP 116 | State Claim | 40 | acres | Kateel River | 21N | 9E | 11 | NE |
| 651415 | GAP 117 | State Claim | 40 | acres | Kateel River | 21N | 9E | 11 | NE |
| 651416 | GAP 118 | State Claim | 40 | acres | Kateel River | 21N | 9E | 12 | NW |
| 651417 | GAP 119 | State Claim | 40 | acres | Kateel River | 21N | 9E | 12 | NW |
| 651418 | GAP 120 | State Claim | 40 | acres | Kateel River | 21N | 9E | 12 | NE |
| 651419 | GAP 121 | State Claim | 40 | acres | Kateel River | 21N | 9E | 12 | NE |
| 651420 | GAP 122 | State Claim | 37 | acres | Kateel River | 21N | 10E | 7 | NW |
| 651421 | GAP 123 | State Claim | 40 | acres | Kateel River | 21N | 10E | 7 | NW |
| 651422 | GAP 124 | State Claim | 40 | acres | Kateel River | 21N | 10E | 7 | NE |
| 651423 | GAP 125 | State Claim | 40 | acres | Kateel River | 21N | 10E | 7 | NE |
| 651424 | GAP 126 | State Claim | 40 | acres | Kateel River | 21N | 10E | 8 | NW |
| 651425 | GAP 127 | State Claim | 40 | acres | Kateel River | 21N | 10E | 8 | NW |
| 651426 | GAP 128 | State Claim | 40 | acres | Kateel River | 21N | 10E | 8 | NE |
| 651427 | GAP 129 | State Claim | 40 | acres | Kateel River | 21N | 10E | 8 | NE |
| 651428 | GAP 130 | State Claim | 40 | acres | Kateel River | 21N | 10E | 9 | NW |
| 651429 | GAP 131 | State Claim | 40 | acres | Kateel River | 21N | 10E | 9 | NW |
| Appendix A - List of Claims | Page 43 of 52 |
| Trilogy Metals Inc. | | |
| NI 43-101 Technical Report on the Arctic Project, | | |
| Northwest Alaska | | |
| Lease | Name | Type | Current Area | Area Type | Meridian | Township | Range | Section | 1/4 Section |
| 651430 | GAP 132 | State Claim | 40 | acres | Kateel River | 21N | 10E | 9 | NE |
| 651431 | GAP 133 | State Claim | 40 | acres | Kateel River | 21N | 10E | 9 | NE |
| 651432 | GAP 134 | State Claim | 40 | acres | Kateel River | 21N | 10E | 10 | NW |
| 651433 | GAP 135 | State Claim | 40 | acres | Kateel River | 21N | 10E | 10 | NW |
| 651434 | GAP 136 | State Claim | 40 | acres | Kateel River | 21N | 10E | 10 | NE |
| 651435 | GAP 137 | State Claim | 40 | acres | Kateel River | 21N | 10E | 10 | NE |
| 651436 | GAP 138 | State Claim | 40 | acres | Kateel River | 21N | 10E | 11 | NW |
| 651437 | GAP 139 | State Claim | 40 | acres | Kateel River | 21N | 10E | 11 | NW |
| 651438 | GAP 140 | State Claim | 40 | acres | Kateel River | 21N | 10E | 11 | NE |
| 651439 | GAP 141 | State Claim | 40 | acres | Kateel River | 21N | 10E | 11 | NE |
| 651440 | GAP 142 | State Claim | 160 | acres | Kateel River | 21N | 9E | 5 | NW |
| 651441 | GAP 143 | State Claim | 160 | acres | Kateel River | 21N | 9E | 5 | NE |
| 651442 | GAP 144 | State Claim | 160 | acres | Kateel River | 21N | 9E | 4 | NW |
| 651443 | GAP 145 | State Claim | 160 | acres | Kateel River | 21N | 9E | 4 | NE |
| 651444 | GAP 146 | State Claim | 160 | acres | Kateel River | 21N | 9E | 3 | NW |
| 651445 | GAP 147 | State Claim | 160 | acres | Kateel River | 21N | 9E | 3 | NE |
| 651446 | GAP 148 | State Claim | 160 | acres | Kateel River | 21N | 8E | 3 | SE |
| 651447 | GAP 149 | State Claim | 160 | acres | Kateel River | 21N | 8E | 2 | SW |
| 651448 | GAP 150 | State Claim | 160 | acres | Kateel River | 21N | 8E | 2 | SE |
| 651449 | GAP 151 | State Claim | 160 | acres | Kateel River | 21N | 8E | 1 | SW |
| 651450 | GAP 152 | State Claim | 160 | acres | Kateel River | 21N | 8E | 1 | SE |
| 651451 | GAP 153 | State Claim | 154 | acres | Kateel River | 21N | 9E | 6 | SW |
| 651452 | GAP 154 | State Claim | 160 | acres | Kateel River | 21N | 9E | 6 | SE |
| 651453 | GAP 155 | State Claim | 160 | acres | Kateel River | 21N | 9E | 5 | SW |
| 651454 | GAP 156 | State Claim | 160 | acres | Kateel River | 21N | 9E | 5 | SE |
| 651455 | GAP 157 | State Claim | 160 | acres | Kateel River | 21N | 9E | 4 | SW |
| 651456 | GAP 158 | State Claim | 160 | acres | Kateel River | 21N | 9E | 4 | SE |
| Appendix A - List of Claims | Page 44 of 52 |
| Trilogy Metals Inc. | | |
| NI 43-101 Technical Report on the Arctic Project, | | |
| Northwest Alaska | | |
| Lease | Name | Type | Current Area | Area Type | Meridian | Township | Range | Section | 1/4 Section |
| 651457 | GAP 159 | State Claim | 160 | acres | Kateel River | 21N | 9E | 3 | SW |
| 651458 | GAP 160 | State Claim | 160 | acres | Kateel River | 21N | 9E | 3 | SE |
| 651459 | GAP 161 | State Claim | 160 | acres | Kateel River | 21N | 8E | 10 | NE |
| 651460 | GAP 162 | State Claim | 160 | acres | Kateel River | 21N | 8E | 11 | NW |
| 651461 | GAP 163 | State Claim | 160 | acres | Kateel River | 21N | 8E | 11 | NE |
| 651462 | GAP 164 | State Claim | 160 | acres | Kateel River | 21N | 8E | 12 | NW |
| 651463 | GAP 165 | State Claim | 160 | acres | Kateel River | 21N | 8E | 12 | NE |
| 651464 | GAP 166 | State Claim | 154 | acres | Kateel River | 21N | 9E | 7 | NW |
| 651465 | GAP 167 | State Claim | 160 | acres | Kateel River | 21N | 9E | 7 | NE |
| 651466 | GAP 168 | State Claim | 160 | acres | Kateel River | 21N | 9E | 8 | NW |
| 651467 | GAP 169 | State Claim | 160 | acres | Kateel River | 21N | 9E | 8 | NE |
| 651468 | GAP 170 | State Claim | 160 | acres | Kateel River | 21N | 9E | 9 | NW |
| 651469 | GAP 171 | State Claim | 160 | acres | Kateel River | 21N | 9E | 9 | NE |
| 651470 | GAP 172 | State Claim | 160 | acres | Kateel River | 21N | 9E | 10 | NW |
| 651471 | GAP 173 | State Claim | 160 | acres | Kateel River | 21N | 9E | 10 | NE |
| 651472 | GAP 174 | State Claim | 160 | acres | Kateel River | 21N | 8E | 10 | SE |
| 651473 | GAP 175 | State Claim | 160 | acres | Kateel River | 21N | 8E | 11 | SW |
| 651474 | GAP 176 | State Claim | 160 | acres | Kateel River | 21N | 8E | 11 | SE |
| 651475 | GAP 177 | State Claim | 160 | acres | Kateel River | 21N | 8E | 12 | SW |
| 651476 | GAP 178 | State Claim | 160 | acres | Kateel River | 21N | 8E | 12 | SE |
| 651477 | GAP 179 | State Claim | 155 | acres | Kateel River | 21N | 9E | 7 | SW |
| 651478 | GAP 180 | State Claim | 160 | acres | Kateel River | 21N | 9E | 7 | SE |
| 651479 | GAP 181 | State Claim | 160 | acres | Kateel River | 21N | 9E | 8 | SW |
| 651480 | GAP 182 | State Claim | 160 | acres | Kateel River | 21N | 9E | 8 | SE |
| 651481 | GAP 183 | State Claim | 160 | acres | Kateel River | 21N | 9E | 9 | SW |
| 651482 | GAP 184 | State Claim | 160 | acres | Kateel River | 21N | 9E | 9 | SE |
| 651483 | GAP 185 | State Claim | 160 | acres | Kateel River | 21N | 9E | 10 | SW |
| Appendix A - List of Claims | Page 45 of 52 |
| Trilogy Metals Inc. | | |
| NI 43-101 Technical Report on the Arctic Project, | | |
| Northwest Alaska | | |
| Lease | Name | Type | Current Area | Area Type | Meridian | Township | Range | Section | 1/4 Section |
| 651484 | GAP 186 | State Claim | 160 | acres | Kateel River | 21N | 9E | 10 | SE |
| 651485 | GAP 187 | State Claim | 160 | acres | Kateel River | 21N | 8E | 15 | NE |
| 651486 | GAP 188 | State Claim | 160 | acres | Kateel River | 21N | 8E | 14 | NW |
| 651487 | GAP 189 | State Claim | 160 | acres | Kateel River | 21N | 8E | 14 | NE |
| 651488 | GAP 190 | State Claim | 160 | acres | Kateel River | 21N | 8E | 13 | NW |
| 651489 | GAP 191 | State Claim | 160 | acres | Kateel River | 21N | 8E | 13 | NE |
| 651490 | GAP 192 | State Claim | 156 | acres | Kateel River | 21N | 9E | 18 | NW |
| 651491 | GAP 193 | State Claim | 160 | acres | Kateel River | 21N | 9E | 18 | NE |
| 651492 | GAP 194 | State Claim | 160 | acres | Kateel River | 21N | 9E | 17 | NW |
| 651493 | GAP 195 | State Claim | 160 | acres | Kateel River | 21N | 9E | 17 | NE |
| 651494 | GAP 196 | State Claim | 160 | acres | Kateel River | 21N | 9E | 16 | NW |
| 651495 | GAP 197 | State Claim | 160 | acres | Kateel River | 21N | 9E | 16 | NE |
| 651496 | GAP 198 | State Claim | 160 | acres | Kateel River | 21N | 9E | 15 | NW |
| 651497 | GAP 199 | State Claim | 160 | acres | Kateel River | 21N | 9E | 15 | NE |
| 655537 | ZED 119 | State Claim | 160 | acres | Kateel River | 20N | 12E | 12 | NW |
| 655538 | ZED 120 | State Claim | 160 | acres | Kateel River | 20N | 12E | 12 | NE |
| 655539 | ZED 121 | State Claim | 134 | acres | Kateel River | 20N | 13E | 7 | NW |
| 655540 | ZED 122 | State Claim | 135 | acres | Kateel River | 20N | 13E | 7 | SW |
| 655541 | ZED 123 | State Claim | 160 | acres | Kateel River | 20N | 13E | 7 | SE |
| 655542 | ZED 124 | State Claim | 160 | acres | Kateel River | 20N | 13E | 8 | SW |
| 655543 | ZED 125 | State Claim | 160 | acres | Kateel River | 20N | 13E | 8 | SE |
| 655648 | KG 1 | State Claim | 160 | acres | Kateel River | 21N | 11E | 11 | SW |
| 655649 | KG 2 | State Claim | 160 | acres | Kateel River | 21N | 11E | 11 | SE |
| 655650 | KG 3 | State Claim | 160 | acres | Kateel River | 21N | 11E | 14 | NW |
| 655651 | KG 4 | State Claim | 160 | acres | Kateel River | 21N | 11E | 14 | NE |
| 655652 | KG 5 | State Claim | 160 | acres | Kateel River | 21N | 11E | 13 | NW |
| 655653 | KG 6 | State Claim | 160 | acres | Kateel River | 21N | 11E | 13 | NE |
| Appendix A - List of Claims | Page 46 of 52 |
| Trilogy Metals Inc. | | |
| NI 43-101 Technical Report on the Arctic Project, | | |
| Northwest Alaska | | |
| Lease | Name | Type | Current Area | Area Type | Meridian | Township | Range | Section | 1/4 Section |
| 655654 | KG 7 | State Claim | 160 | acres | Kateel River | 21N | 11E | 13 | SE |
| 655655 | KG 8 | State Claim | 160 | acres | Kateel River | 21N | 11E | 24 | NE |
| 714584 | East DH 1 | State Claim | 160 | acres | Kateel River | 22N | 10E | 15 | SE |
| 714585 | East DH 2 | State Claim | 160 | acres | Kateel River | 22N | 10E | 22 | NE |
| 714586 | East DH 3 | State Claim | 135 | acres | Kateel River | 22N | 10E | 23 | NW |
| 714587 | East DH 4 | State Claim | 160 | acres | Kateel River | 22N | 10E | 22 | SE |
| 714588 | East DH 5 | State Claim | 160 | acres | Kateel River | 22N | 10E | 23 | SW |
| 714589 | COBRE 1 | State Claim | 160 | acres | Kateel River | 22N | 7E | 2 | NW |
| 714590 | COBRE 2 | State Claim | 160 | acres | Kateel River | 22N | 7E | 2 | NE |
| 714591 | COBRE 3 | State Claim | 160 | acres | Kateel River | 22N | 7E | 1 | NW |
| 714592 | COBRE 4 | State Claim | 160 | acres | Kateel River | 22N | 7E | 1 | NE |
| 714593 | COBRE 5 | State Claim | 146 | acres | Kateel River | 22N | 8E | 6 | NW |
| 714594 | COBRE 6 | State Claim | 160 | acres | Kateel River | 22N | 8E | 6 | NE |
| 714595 | COBRE 7 | State Claim | 160 | acres | Kateel River | 22N | 8E | 5 | NW |
| 714596 | COBRE 8 | State Claim | 160 | acres | Kateel River | 22N | 8E | 5 | NE |
| 714597 | COBRE 9 | State Claim | 160 | acres | Kateel River | 22N | 7E | 2 | SW |
| 714598 | COBRE 10 | State Claim | 160 | acres | Kateel River | 22N | 7E | 2 | SE |
| 714599 | COBRE 11 | State Claim | 160 | acres | Kateel River | 22N | 7E | 1 | SW |
| 714600 | COBRE 12 | State Claim | 160 | acres | Kateel River | 22N | 7E | 1 | SE |
| 714601 | COBRE 13 | State Claim | 147 | acres | Kateel River | 22N | 8E | 6 | SW |
| 714602 | COBRE 14 | State Claim | 160 | acres | Kateel River | 22N | 8E | 6 | SE |
| 714603 | COBRE 15 | State Claim | 160 | acres | Kateel River | 22N | 8E | 5 | SW |
| 714604 | COBRE 16 | State Claim | 160 | acres | Kateel River | 22N | 8E | 5 | SE |
| 714605 | COBRE 17 | State Claim | 160 | acres | Kateel River | 22N | 7E | 11 | NW |
| 714606 | COBRE 18 | State Claim | 160 | acres | Kateel River | 22N | 7E | 11 | NE |
| 714607 | COBRE 19 | State Claim | 160 | acres | Kateel River | 22N | 7E | 12 | NW |
| 714608 | COBRE 20 | State Claim | 160 | acres | Kateel River | 22N | 7E | 12 | NE |
| Appendix A - List of Claims | Page 47 of 52 |
| Trilogy Metals Inc. | | |
| NI 43-101 Technical Report on the Arctic Project, | | |
| Northwest Alaska | | |
| Lease | Name | Type | Current Area | Area Type | Meridian | Township | Range | Section | 1/4 Section |
| 714609 | COBRE 21 | State Claim | 148 | acres | Kateel River | 22N | 8E | 7 | NW |
| 714610 | COBRE 22 | State Claim | 160 | acres | Kateel River | 22N | 8E | 7 | NE |
| 714611 | COBRE 23 | State Claim | 160 | acres | Kateel River | 22N | 8E | 8 | NW |
| 714612 | COBRE 24 | State Claim | 160 | acres | Kateel River | 22N | 8E | 8 | NE |
| 714613 | COBRE 25 | State Claim | 160 | acres | Kateel River | 22N | 8E | 9 | NW |
| 714614 | COBRE 26 | State Claim | 160 | acres | Kateel River | 22N | 8E | 9 | NE |
| 714615 | COBRE 27 | State Claim | 160 | acres | Kateel River | 22N | 8E | 7 | SE |
| 714616 | COBRE 28 | State Claim | 160 | acres | Kateel River | 22N | 8E | 8 | SW |
| 714617 | COBRE 29 | State Claim | 160 | acres | Kateel River | 22N | 8E | 8 | SE |
| 714618 | COBRE 30 | State Claim | 160 | acres | Kateel River | 22N | 8E | 9 | SW |
| 714619 | COBRE 31 | State Claim | 160 | acres | Kateel River | 22N | 8E | 9 | SE |
| 714620 | COBRE 32 | State Claim | 160 | acres | Kateel River | 22N | 8E | 17 | NW |
| 714621 | COBRE 33 | State Claim | 160 | acres | Kateel River | 22N | 8E | 17 | NE |
| 714622 | COBRE 34 | State Claim | 160 | acres | Kateel River | 22N | 8E | 16 | NW |
| 714623 | COBRE 35 | State Claim | 160 | acres | Kateel River | 22N | 8E | 16 | NE |
| 714624 | COBRE 36 | State Claim | 160 | acres | Kateel River | 22N | 8E | 15 | NW |
| 714625 | COBRE 37 | State Claim | 160 | acres | Kateel River | 22N | 8E | 15 | NE |
| 714626 | COBRE 38 | State Claim | 160 | acres | Kateel River | 22N | 8E | 17 | SE |
| 714627 | COBRE 39 | State Claim | 160 | acres | Kateel River | 22N | 8E | 16 | SW |
| 714628 | COBRE 40 | State Claim | 160 | acres | Kateel River | 22N | 8E | 16 | SE |
| 714629 | COBRE 41 | State Claim | 160 | acres | Kateel River | 22N | 8E | 15 | SW |
| 714630 | COBRE 42 | State Claim | 160 | acres | Kateel River | 22N | 8E | 15 | SE |
| 714631 | COBRE 43 | State Claim | 160 | acres | Kateel River | 22N | 8E | 21 | NW |
| 714632 | COBRE 44 | State Claim | 160 | acres | Kateel River | 22N | 8E | 21 | NE |
| 714633 | COBRE 45 | State Claim | 160 | acres | Kateel River | 22N | 8E | 22 | NW |
| 714634 | COBRE 46 | State Claim | 160 | acres | Kateel River | 22N | 8E | 22 | NE |
| 714635 | COBRE 47 | State Claim | 160 | acres | Kateel River | 22N | 8E | 23 | NW |
| Appendix A - List of Claims | Page 48 of 52 |
| Trilogy Metals Inc. | | |
| NI 43-101 Technical Report on the Arctic Project, | | |
| Northwest Alaska | | |
| Lease | Name | Type | Current Area | Area Type | Meridian | Township | Range | Section | 1/4 Section |
| 714636 | COBRE 48 | State Claim | 160 | acres | Kateel River | 22N | 8E | 23 | NE |
| 714637 | COBRE 49 | State Claim | 160 | acres | Kateel River | 22N | 8E | 21 | SW |
| 714638 | COBRE 50 | State Claim | 160 | acres | Kateel River | 22N | 8E | 21 | SE |
| 714639 | COBRE 51 | State Claim | 160 | acres | Kateel River | 22N | 8E | 22 | SW |
| 714640 | COBRE 52 | State Claim | 160 | acres | Kateel River | 22N | 8E | 22 | SE |
| 714641 | COBRE 53 | State Claim | 160 | acres | Kateel River | 22N | 8E | 23 | SW |
| 714642 | COBRE 54 | State Claim | 160 | acres | Kateel River | 22N | 8E | 23 | SE |
| 714643 | West Horse 1 | State Claim | 160 | acres | Kateel River | 22N | 9E | 12 | SW |
| 714644 | West Horse 2 | State Claim | 160 | acres | Kateel River | 22N | 9E | 12 | SE |
| 714645 | West Horse 3 | State Claim | 148 | acres | Kateel River | 22N | 10E | 7 | SW |
| 714646 | West Horse 4 | State Claim | 160 | acres | Kateel River | 22N | 10E | 7 | SE |
| 714647 | West Horse 5 | State Claim | 160 | acres | Kateel River | 22N | 10E | 8 | SW |
| 714648 | West Horse 6 | State Claim | 160 | acres | Kateel River | 22N | 9E | 13 | NW |
| 714649 | West Horse 7 | State Claim | 160 | acres | Kateel River | 22N | 9E | 13 | NE |
| 714650 | West Horse 8 | State Claim | 160 | acres | Kateel River | 22N | 9E | 13 | SW |
| 714651 | West Horse 9 | State Claim | 160 | acres | Kateel River | 22N | 9E | 13 | SE |
| 714652 | West Horse 10 | State Claim | 160 | acres | Kateel River | 22N | 9E | 24 | NW |
| 714653 | West Horse 11 | State Claim | 160 | acres | Kateel River | 22N | 9E | 24 | NE |
| 714654 | West Horse 12 | State Claim | 160 | acres | Kateel River | 22N | 9E | 24 | SW |
| 714655 | West Horse 13 | State Claim | 160 | acres | Kateel River | 22N | 9E | 24 | SE |
| 714656 | West Horse 14 | State Claim | 160 | acres | Kateel River | 22N | 9E | 27 | NE |
| 714657 | West Horse 15 | State Claim | 160 | acres | Kateel River | 22N | 9E | 26 | NW |
| 714658 | West Horse 16 | State Claim | 160 | acres | Kateel River | 22N | 9E | 26 | NE |
| 714659 | West Horse 17 | State Claim | 160 | acres | Kateel River | 22N | 9E | 25 | NW |
| 714660 | West Horse 18 | State Claim | 160 | acres | Kateel River | 22N | 9E | 25 | NE |
| 714661 | West Horse 19 | State Claim | 160 | acres | Kateel River | 22N | 9E | 27 | SE |
| 714662 | West Horse 20 | State Claim | 160 | acres | Kateel River | 22N | 9E | 26 | SW |
| Appendix A - List of Claims | Page 49 of 52 |
| Trilogy Metals Inc. | | |
| NI 43-101 Technical Report on the Arctic Project, | | |
| Northwest Alaska | | |
| Lease | Name | Type | Current Area | Area Type | Meridian | Township | Range | Section | 1/4 Section |
| 714663 | West Horse 21 | State Claim | 160 | acres | Kateel River | 22N | 9E | 26 | SE |
| 714664 | West Horse 22 | State Claim | 160 | acres | Kateel River | 22N | 9E | 25 | SW |
| 714665 | West Horse 23 | State Claim | 160 | acres | Kateel River | 22N | 9E | 25 | SE |
| 714748 | AM 37-225 | State Claim | 40 | acres | Kateel River | 20N | 12E | 16 | SW |
| 714749 | AM 38-225 | State Claim | 40 | acres | Kateel River | 20N | 12E | 16 | SW |
| 714750 | AM 39-225 | State Claim | 40 | acres | Kateel River | 20N | 12E | 16 | NW |
| 714751 | AM 40-225 | State Claim | 40 | acres | Kateel River | 20N | 12E | 16 | NW |
| 714752 | AM 41-223 | State Claim | 40 | acres | Kateel River | 20N | 12E | 8 | SE |
| 714753 | AM 41-224 | State Claim | 40 | acres | Kateel River | 20N | 12E | 8 | SE |
| 714754 | AM 43-219 | State Claim | 40 | acres | Kateel River | 20N | 12E | 7 | NE |
| 714755 | AM 43-220 | State Claim | 40 | acres | Kateel River | 20N | 12E | 7 | NE |
| 714756 | AM 38-217 | State Claim | 136 | acres | Kateel River | 20N | 12E | 18 | SW |
| 714757 | AM 38-219 | State Claim | 160 | acres | Kateel River | 20N | 12E | 18 | SE |
| 714758 | AM 38-221 | State Claim | 160 | acres | Kateel River | 20N | 12E | 17 | SW |
| 714759 | AM 38-223 | State Claim | 160 | acres | Kateel River | 20N | 12E | 17 | SE |
| 714760 | AM 42-219 | State Claim | 160 | acres | Kateel River | 20N | 12E | 7 | SE |
| 714761 | AM 42-221 | State Claim | 160 | acres | Kateel River | 20N | 12E | 8 | SW |
| 714762 | AM 44-217 | State Claim | 134 | acres | Kateel River | 20N | 12E | 7 | NW |
| 714763 | AM 40-217 | State Claim | 135 | acres | Kateel River | 20N | 12E | 18 | NW |
| 714764 | AM 40-219 | State Claim | 160 | acres | Kateel River | 20N | 12E | 18 | NE |
| 714765 | AM 40-221 | State Claim | 160 | acres | Kateel River | 20N | 12E | 17 | NW |
| 714766 | AM 40-223 | State Claim | 160 | acres | Kateel River | 20N | 12E | 17 | NE |
| 714767 | AM 42-217 | State Claim | 135 | acres | Kateel River | 20N | 12E | 7 | SW |
| 714768 | KG 9 | State Claim | 157 | acres | Kateel River | 21N | 12E | 19 | NW |
| 714769 | KG 10 | State Claim | 160 | acres | Kateel River | 21N | 12E | 19 | NE |
| 714770 | KG 11 | State Claim | 157 | acres | Kateel River | 21N | 12E | 19 | SW |
| 714771 | KG 12 | State Claim | 160 | acres | Kateel River | 21N | 12E | 19 | SE |
| Appendix A - List of Claims | Page 50 of 52 |
| Trilogy Metals Inc. | | |
| NI 43-101 Technical Report on the Arctic Project, | | |
| Northwest Alaska | | |
| Lease | Name | Type | Current Area | Area Type | Meridian | Township | Range | Section | 1/4 Section |
| 715147 | Cobre 55 | State Claim | 160 | acres | Kateel River | 23N | 7E | 14 | SW |
| 715148 | Cobre 56 | State Claim | 160 | acres | Kateel River | 23N | 7E | 14 | SE |
| 715149 | Cobre 57 | State Claim | 160 | acres | Kateel River | 23N | 7E | 13 | SW |
| 715150 | Cobre 58 | State Claim | 160 | acres | Kateel River | 23N | 7E | 23 | NW |
| 715151 | Cobre 59 | State Claim | 160 | acres | Kateel River | 23N | 7E | 23 | NE |
| 715152 | Cobre 60 | State Claim | 160 | acres | Kateel River | 23N | 7E | 24 | NW |
| 715153 | Cobre 61 | State Claim | 160 | acres | Kateel River | 23N | 7E | 24 | NE |
| 715154 | Cobre 62 | State Claim | 143 | acres | Kateel River | 23N | 8E | 19 | NW |
| 715155 | Cobre 63 | State Claim | 160 | acres | Kateel River | 23N | 7E | 23 | SE |
| 715156 | Cobre 64 | State Claim | 160 | acres | Kateel River | 23N | 7E | 24 | SW |
| 715157 | Cobre 65 | State Claim | 160 | acres | Kateel River | 23N | 7E | 24 | SE |
| 715158 | Cobre 66 | State Claim | 144 | acres | Kateel River | 23N | 8E | 19 | SW |
| 715159 | Cobre 67 | State Claim | 160 | acres | Kateel River | 23N | 8E | 19 | SE |
| 715160 | Cobre 68 | State Claim | 160 | acres | Kateel River | 23N | 7E | 26 | NE |
| 715161 | Cobre 69 | State Claim | 160 | acres | Kateel River | 23N | 7E | 25 | NW |
| 715162 | Cobre 70 | State Claim | 160 | acres | Kateel River | 23N | 7E | 25 | NE |
| 715163 | Cobre 71 | State Claim | 144 | acres | Kateel River | 23N | 8E | 30 | NW |
| 715164 | Cobre 72 | State Claim | 160 | acres | Kateel River | 23N | 8E | 30 | NE |
| 715165 | Cobre 73 | State Claim | 160 | acres | Kateel River | 23N | 8E | 29 | NW |
| 715166 | Cobre 74 | State Claim | 160 | acres | Kateel River | 23N | 8E | 29 | NE |
| 715167 | Cobre 75 | State Claim | 160 | acres | Kateel River | 23N | 7E | 26 | SE |
| 715168 | Cobre 76 | State Claim | 160 | acres | Kateel River | 23N | 7E | 25 | SW |
| 715169 | Cobre 77 | State Claim | 160 | acres | Kateel River | 23N | 7E | 25 | SE |
| 715170 | Cobre 78 | State Claim | 145 | acres | Kateel River | 23N | 8E | 30 | SW |
| 715171 | Cobre 79 | State Claim | 160 | acres | Kateel River | 23N | 8E | 30 | SE |
| 715172 | Cobre 80 | State Claim | 160 | acres | Kateel River | 23N | 8E | 29 | SW |
| 715173 | Cobre 81 | State Claim | 160 | acres | Kateel River | 23N | 8E | 29 | SE |
| Appendix A - List of Claims | Page 51 of 52 |
| Trilogy Metals Inc. | | |
| NI 43-101 Technical Report on the Arctic Project, | | |
| Northwest Alaska | | |
| Lease | Name | Type | Current Area | Area Type | Meridian | Township | Range | Section | 1/4 Section |
| 715174 | Cobre 82 | State Claim | 160 | acres | Kateel River | 23N | 7E | 36 | NW |
| 715175 | Cobre 83 | State Claim | 160 | acres | Kateel River | 23N | 7E | 36 | NE |
| 715176 | Cobre 84 | State Claim | 145 | acres | Kateel River | 23N | 8E | 31 | NW |
| 715177 | Cobre 85 | State Claim | 160 | acres | Kateel River | 23N | 8E | 31 | NE |
| 715178 | Cobre 86 | State Claim | 160 | acres | Kateel River | 23N | 8E | 32 | NW |
| 715179 | Cobre 87 | State Claim | 160 | acres | Kateel River | 23N | 8E | 32 | NE |
| 715180 | Cobre 88 | State Claim | 160 | acres | Kateel River | 23N | 8E | 31 | SE |
| 715181 | Cobre 89 | State Claim | 160 | acres | Kateel River | 23N | 8E | 32 | SW |
| 715182 | Cobre 90 | State Claim | 160 | acres | Kateel River | 23N | 8E | 32 | SE |
| 50-81-0127 | USMS2245-1 | Patented Claim | 240.018 | acres | Kateel River | 21N | 11E | 34; 35 | |
| 50-83-0174 | USMS2245-2 | Patented Claim | 31.91 | acres | Kateel River | 20N; 21N | 11E | 2; 35 | |
| | | | 114954.928 | | | | | | |
| | | | 114683 | | | | | | |
| Appendix A - List of Claims | Page 52 of 52 |
| Trilogy Metals Inc. | | |
| NI 43-101 Technical Report on the Arctic Project, | | |
| Northwest Alaska | | |
Appendix B – Block Model Descriptors
Block Model Items (to be included in Appendix)
TOPO % blocks below topo surface
CUOK, ZNOK, PBOK, AUOK, AGOK – OK estimates of portion of blocks inside the MinZone domains
CUEQ% - Copper equivalent
CLASS – 2=Indicated, 3=Inferred. Only blocks in MinZones are classified.
MNZNE – MinZone domain codes (see below)
MNZN% - percentage of blocks inside MinZone domains.
SGMZN – SG of portion of blocks in MinZones
SGLTH – SG of portion of blocks outside MinZones.
SGALL – Whole block SG.
GROUP – Lith Groups used to control trends when estimating SG and NP, AP S% values.
CU%, PB%, ZN%, AUGPT, AGGPT – Whole block grades.
ROCK – 1=OVB, 2=Weathered, 3=Fresh rock.
NPLOK, AOLOK, S%LOK – Ordinary kriging estimates of AP, NP and S% in lith outside of MinZones.
NPMOK, APMOK, S%MOK - Ordinary kriging estimates of AP, NP and S% in MinZones.
NPALL, APALL, S%ALL – NP, AP, S% estimates on whole block basis.
NPAPR – Ratio of NPALL/APALL.
| ABACD – 1 | Non-PAG: NP/AP>2 or S% <0.1% |
| 2 | Uncertain: 1<NP/AP<=2 |
| 3 | PAG1: 0.5<NP/AP<=1 |
| 4 | PAG2: NP/AP<=0.5 |
| MinZone domain | MNZNE |
| 1 | 10 |
| 2 | 20 |
| 2.5 | 25 |
| 3 | 30 |
| 3sub | 35 |
| 4 | 40 |
| 5 | 50 |
| 7a | 71 |
| 7aHW | 72 |
| 7b | 73 |
| 7bHW | 74 |
| 7c | 75 |
| 7cHW | 76 |
| 8a | 81 |
| 8b | 82 |
| 8c | 83 |
| 8cHW | 84 |
| 8d | 85 |
Lithology Domains (interpreted, Minzone domains also inserted between these domains)
| LTHDM | | LTHDM | | LTHDM | | LTHDM (Minzone domains) |
| 401 | AMR 2A | 209 | GS WS | 104 | MRP WS | 1 |
| 309 | QMS 2WS | 208 | GS 2C | 103 | MRP WS sub | 2 |
| 308 | QMS WS | 207 | GS 2B | 102 | MRP 2A | 3 |
| 307 | QMS 2B | 206 | GS 2A | 101 | MRP 1A | 4 |
| 306 | QMS 2A | 205 | GS 2 | | | 5 |
| 305 | QMS 1A | 204 | GS WX | | | 6 |
| 304 | QMS 1CX | 203 | GS X | | | 7 |
| 303 | QMS 1BY | 202 | GS Y | | | 8 |
| 302 | QMS 1CZ, C | 201 | GS Z | | | |
| 301 | QMS 1A | | | | | |
| Trilogy Metals Inc. | | |
| NI 43-101 Technical Report on the Arctic Project, | | |
| Northwest Alaska | | |
Groups(used to interpolate SG outside Minzones using Relevs)
| Group 1 | LTHDM 101, 201, 301, 302 | (trend plane TR1) |
| Group 2 | 202, 203, 303 | (trend plane TR 3) |
| Group 3 | 102, 204, 205, 206, 207, 208, 304, 305, 306, 307, 401 (trend plane TR 5) |
| Group 4 | 103, 104, 209, 308, 309 (trend plane TRUP) |
Alteration Domains
| 701 | Footwall Chl Alt | |
| 702 | Footwall Chl-Ser Alt | |
| 703 | Intense Mg Alt | |
| 704 | Na Alt | |
| 705 | Na Alt HW | |
| 706 | other | |
Weathered Domain
| Trilogy Metals Inc. | | |
| NI 43-101 Technical Report on the Arctic Project, | | |
| Northwest Alaska | | |