Filed by PacWest Bancorp pursuant to Rule 425
under the Securities Act of 1933 and deemed
filed pursuant to Rule 14a-12 under the Securities Act of 1934
Subject Company: CU Bancorp
Commission File No.: 001-35683
2017 Third Quarter Results Earnings Release Presentation October 17, 2017
This communication contains certain “forward-looking statements” about PacWest Bancorp (the “Company”) and its subsidiaries within the meaning of the Private Securities Litigation Reform Act of 1995, including certain plans, strategies, goals, and projections and including statements about our expectations regarding our pending acquisition of CU Bancorp (“CUB”), allowance for loan and lease losses, credit trends, deposit growth, profitability, capital management, including reducing excess capital, interest rate risk ,and operating expenses. All statements contained in this communication that are not clearly historical in nature are forward-looking, and the words “anticipate,” “assume,” “intend,” “believe,” “forecast,” “expect,” “estimate,” “plan,” “continue,” “will,” “should,” “look forward” and similar expressions are generally intended to identify forward-looking statements. All forward-looking statements (including statements regarding future financial and operating results and future transactions and their results) involve risks, uncertainties and contingencies, many of which are beyond our control, which may cause actual results, performance, or achievements to differ materially from anticipated results, performance or achievements. Actual results could differ materially from those contained or implied by such forward-looking statements for a variety of factors, including without limitation: higher than anticipated delinquencies, charge-offs and loan and lease losses; reduced demand for our services due to strategic or regulatory reasons; changes in economic or competitive market conditions could negatively impact investment or lending opportunities or product pricing and services; credit quality deterioration or pronounced and sustained reduction in market values or other economic factors which adversely affect our borrowers’ ability to repay loans and leases and/or require an increased provision for loan and lease losses; compression of the net interest margin due to changes in our interest rate environment, loan products, spreads on newly originated loans and leases and/or asset mix; the impact of asset/liability repricing risk and liquidity risk on net interest margin and the value of investments; higher than anticipated increases in operating expenses; increased costs to manage and sell foreclosed assets; the need to retain capital for strategic or regulatory reasons; the financial performance of the Company; increased litigation; increased asset workout or loan servicing expenses; higher compensation costs and professional fees to retain and/or incent employees; our ability to complete the pending CUB acquisition, or any other future acquisition, and to successfully integrate such acquired entities or achieve expected benefits, synergies and/or operating efficiencies within expected timeframes or at all; the reaction to the pending CU Bancorp acquisition of the companies’ customers, employees and counterparties; the impact of the Dodd-Frank Wall Street Reform and Consumer Protection Act on our business and business strategies; and other risk factors described in documents filed by the Company with the U.S. Securities and Exchange Commission (“SEC”). All forward-looking statements included in this communication are based on information available at the time of the communication. Pro forma, projected and estimated numbers are used for illustrative purposes only and are not forecasts, and actual results may differ materially. We are under no obligation to (and expressly disclaim any such obligation to) update or alter our forward-looking statements, whether as a result of new information, future events or otherwise except as required by law. Forward-Looking Statements
Third Quarter Highlights 4 Investment Securities 9 Loans and Leases 11 Credit Quality 17 Deposits 21 Controlled Expenses 24 Non-GAAP Measurements 27 Presentation Index
Third Quarter Highlights
Third Quarter Highlights Robust Earnings Net earnings of $101.5 million EPS of $0.84 ROAA and ROATE of 1.82% and 16.85% (1) Q3 includes a $13.6 million reversal of a valuation allowance for tax credits Industry Leading Net Interest Margin Tax equivalent NIM of 5.08% Yield on average loans and leases of 6.01% Low Efficiency Ratio Efficiency ratio of 40.4% Average branch size of $224 million in deposits Noninterest expense to average assets of 2.15% Profitable Deposit Base Cost of average total deposits of 31 bps $314 million net core deposit growth Core deposits now represent 81% of total deposits Loan and Lease Production and Credit Quality Loan and lease production of $1.0 billion NPAs to total loans and leases and foreclosed assets, excluding PCI loans, of 1.08% compared to 1.20% at June 30, 2017 Non-PCI credit loss allowance of 1.11% Strong Capital Levels Tangible common equity ratio of 12.02% (1) CET1 and total capital ratios of 12.52% and 15.75% Tangible book value per share of $19.84 (1) See “Non-GAAP Measurements” slide on page 27.
Financial Highlights See “Non-GAAP Measurements” slide on page 27. ? ($ in millions, except per share amounts) 3Q17 2Q17 Q / Q Total Assets 22,243 $ 22,247 $ 0% Loans and Leases Held for Investment, net of deferred fees 15,691 $ 15,543 $ 1% Total Deposits 16,773 $ 16,875 $ -1% Core Deposits 13,531 $ 13,218 $ 2% Net Earnings 101.5 $ 93.6 $ 8% Earnings Per Share 0.84 $ 0.77 $ 9% Return on Average Assets ("ROAA") 1.82% 1.71% 0.11 Return on Average Tangible Equity ("ROATE") (1) 16.85% 16.06% 0.79 Tangible Common Equity Ratio (1) 12.02% 11.75% 0.27 Tangible Book Value Per Share (1) 19.84 $ 19.40 $ 2% Net Interest Margin 5.08% 5.21% -0.13 Efficiency Ratio 40.4% 40.3% 0.1
Solid Earnings Track Record ($ in millions, except Diluted EPS) 4Q15 1Q16 2Q16 3Q16 4Q16 1Q17 2Q17 3Q17 Net Earnings 71.8 $ 90.5 $ 82.2 $ 93.9 $ 85.6 $ 78.7 $ 93.6 $ 101.5 $ Diluted EPS 0.60 $ 0.74 $ 0.68 $ 0.77 $ 0.71 $ 0.65 $ 0.77 $ 0.84 $ $- $0.10 $0.20 $0.30 $0.40 $0.50 $0.60 $0.70 $0.80 $0.90 $0 $10 $20 $30 $40 $50 $60 $70 $80 $90 $100 $110 4Q15 1Q16 2Q16 3Q16 4Q16 1Q17 2Q17 3Q17 Diluted EPS Millions Net Earnings Diluted EPS
Source: SNL Financial. Peer data through 2Q17. Solid Capital Position – 3Q17 12.21% 11.38% 11.87% 12.12% 12.19% 11.54% 11.67% 11.75% 12.02% 8.67% 8.54% 8.77% 8.68% 8.79% 8.63% 8.60% 8.75% 3Q15 4Q15 1Q16 2Q16 3Q16 4Q16 1Q17 2Q17 3Q17 TCE / TA PACW Median Banks $15-$25B 12.04% 11.67% 11.51% 11.92% 12.13% 11.91% 11.87% 11.90% 12.02% 9.29% 9.16% 8.99% 9.06% 9.11% 9.21% 9.30% 9.27% 3Q15 4Q15 1Q16 2Q16 3Q16 4Q16 1Q17 2Q17 3Q17 T1 Leverage PACW Median Banks $15-$25B 16.32% 15.65% 15.96% 16.08% 16.18% 15.56% 15.56% 15.56% 15.75% 13.44% 13.20% 13.16% 13.09% 12.99% 13.22% 12.95% 13.17% 3Q15 4Q15 1Q16 2Q16 3Q16 4Q16 1Q17 2Q17 3Q17 Total Capital PACW Median Banks $15-$25B 12.74% 12.58% 12.63% 12.72% 12.83% 12.31% 12.31% 12.28% 12.52% 10.75% 10.68% 10.64% 10.67% 10.48% 11.26% 11.15% 11.00% 3Q15 4Q15 1Q16 2Q16 3Q16 4Q16 1Q17 2Q17 3Q17 CET1 PACW Median Banks $15-$25B
Investment Securities

3.33% overall portfolio tax equivalent yield (2) (1) Fair value (2) Yield is for 3Q17 Investment Portfolio Average Life and Effective Duration Municipal Securities Composition Diversified Investment Portfolio Collateralized Loan Obligations, $19.2mm, 1% SBA Securities, $168.0mm, 5% Agency Residential MBS, $377.5mm, 11% Agency Residential CMOs, $175.9mm, 5% Agency Commercial MBS, $995.9mm, 27% Private CMOs, $134.5mm, 4% Municipal Securities, $1,549.2mm, 44% Other, $111.9mm, 3% $3.5 Billion Total Portfolio (1) S&P Ratings % Total Issue Type % Total AAA 13% G.O. Limited 6% AA 78% G.O. Unlimited 46% A 3% Revenue 48% Not rated 6% 100% 100% Municipal Securities 6.1 6.1 7.0 6.7 6.8 4.7 4.8 5.7 5.7 5.9 3 4 5 6 7 8 3Q16 4Q16 1Q17 2Q17 3Q17 Years Average Life Effective Duration
Loans and Leases
Diversified Loan and Lease Portfolio Lender Finance & Timeshare Equipment Finance Healthcare Asset - Based Other Asset - Based Technology Cash Flow Healthcare Cash Flow Security Cash Flow General Cash Flow Commercial Real Estate Income Producing Residential Construction and Land Healthcare Real Estate Small Business Owner - Occupied Residential Venture Capital Other As of September 30, 2017 ($ in millions) $ Mix $ Mix Lender Finance & Timeshare 1,594 $ 10% 1,655 $ 11% Equipment Finance 595 4% 671 5% Healthcare Asset-Based 118 1% 174 1% Other Asset-Based 865 6% 744 5% Total Asset-Based 3,172 21% 3,244 22% Technology Cash Flow 916 6% 1,097 7% Healthcare Cash Flow 485 2% 752 5% Security Cash Flow 563 4% 417 3% General Cash Flow 549 4% 542 4% Total Cash Flow 2,513 16% 2,808 19% Commercial Real Estate 3,013 19% 2,899 19% Income Producing Residential 1,730 11% 960 7% Construction and Land 1,249 8% 1,071 7% Healthcare Real Estate 841 5% 834 6% Small Business 485 3% 468 3% Owner-Occupied Residential 120 1% 171 1% Total Real Estate 7,438 47% 6,403 43% Venture Capital 1,959 12% 1,767 12% Other 609 4% 521 4% Total Loans HFI (1) 15,691 $ 100% 14,743 $ 100% (1) Net of deferred fees and costs 9/30/2017 9/30/2016
Diversified Loan and Lease Portfolio Healthcare, $841mm, 11% SBA, $485mm, 7% Hospitality, $723mm, 10% Retail, $439mm, 6% Multifamily, $1,626mm, 22% Office, $842mm, 11% Owner - occupied, $749mm, 10% Construction, $1,249mm, 17% Other, $484mm, 6% Real Estate ($7.4B) Technology, $916mm, 37% Healthcare, $485mm, 19% Security, $563mm, 22% General, $549mm, 22% Cash Flow ($2.5B) Lender Finance & Timeshare, $1,594mm, 50% Equipment Finance, $595mm, 19% Healthcare, $118mm, 4% Other, $865mm, 27% Asset - Based ($3.2B) Later Stage, $263mm, 14% Expansion Stage, $891mm, 45% Equity Funds Group, $341mm, 17% Early Stage, $464mm, 24% Venture Capital ($2.0B)
Loan Types Construction- 78% in 4 projects Redevelopment in Chicago’s exclusive Gold Coast luxury retail district A Walmart Supercenter-anchored shopping center in Inland Empire region of Southern California Development in a high density Brooklyn retail neighborhood that includes an Apple Store, Whole Foods, J. Crew, etc. High traffic retail infill on Santa Monica Blvd. in Los Angeles Owner-Occupied Not adversely affected by rental market volatility SBA retail is 100% owner-occupied SBA guaranteed portions retained (75% avg. guarantee) CRE Traditional retail-focused commercial real estate lending including: CapitalSource Division $240mm portfolio of 13 loans across 10 states with $18.5mm average balance focused on lifestyle centers and urban luxury centers Community Bank Division $226mm portfolio almost entirely in California focused on suburban retail/strip centers (1) $5.2mm classified as of September 30, 2017 with related SBA guarantees of $1.9mm. Retail Real Estate Portfolio Overview Outstanding balance: $595mm(1)/3.8% of Loans
��
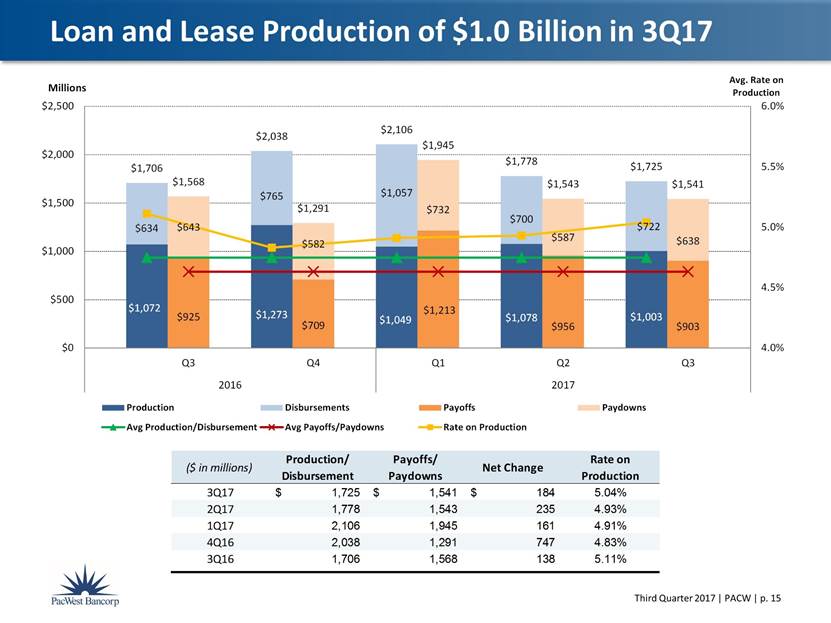
Loan and Lease Production of $1.0 Billion in 3Q17 ($ in millions) Production/ Disbursement Payoffs/ Paydowns Net Change Rate on Production 3Q17 1,725 $ 1,541 $ 184 $ 5.04% 2Q17 1,778 1,543 235 4.93% 1Q17 2,106 1,945 161 4.91% 4Q16 2,038 1,291 747 4.83% 3Q16 1,706 1,568 138 5.11% $1,072 $1,273 $1,049 $1,078 $1,003 $634 $765 $1,057 $700 $722 $925 $709 $1,213 $956 $903 $643 $582 $732 $587 $638 $1,706 $2,038 $2,106 $1,778 $1,725 1,568 1,291 1,945 1,543 1,541 4.0% 4.5% 5.0% 5.5% 6.0% $0 $500 $1,000 $1,500 $2,000 $2,500 Q3 Q4 Q1 Q2 Q3 2016 2017 Avg. Rate on Production Millions Production Disbursements Payoffs Paydowns Avg Production/Disbursement Avg Payoffs/Paydowns Rate on Production
Production by Industry / Loan Type ($ in millions) 3Q17 2Q17 1Q17 4Q16 Net Growth YTD 2017 Lender Finance and Timeshare 152 $ 18 $ 27 $ 146 $ (73) $ Equipment Finance 30 65 21 98 (97) Healthcare Asset-Based - - 1 - (63) Other Asset-Based 119 52 37 39 101 Asset-Based 301 135 86 283 (132) Technology Cash Flow 30 84 109 5 (132) Healthcare Cash Flow 21 46 27 57 (314) Security Cash Flow 63 21 57 14 123 General Cash Flow 44 45 15 62 (15) Cash Flow 158 196 208 138 (338) Commercial Real Estate 106 210 186 238 26 Income Producing and Residential Real Estate 204 239 300 132 536 Construction and Land 56 51 100 50 284 Healthcare Real Estate 17 46 11 88 (114) Small Business 15 25 21 10 31 Real Estate 398 571 618 518 763 Venture Capital 121 128 91 195 (29) Other 25 48 46 139 (30) Total 1,003 $ 1,078 $ 1,049 $ 1,273 $ 234 $
Credit Quality
Classified loans and leases are those with a credit risk rating of substandard or doubtful Allowance for credit losses includes allowance for loan and lease losses and reserve for unfunded commitments Non-PCI Credit Quality ($ in thousands) 3Q17 2Q17 1Q17 4Q16 3Q16 Nonaccrual Loans and Leases HFI $ 157,697 172,576 173,030 170,599 171,085 As a % of Loans and Leases HFI % 1.00% 1.11% 1.11% 1.11% 1.16% Nonperforming Assets $ 169,327 185,854 185,872 183,575 186,198 As a % of Loans and Leases & Foreclosed Assets % 1.08% 1.20% 1.20% 1.19% 1.27% Classified Loans and Leases HFI (1) $ 344,777 339,977 424,399 409,645 417,541 As a % of Loans and Leases HFI % 2.20% 2.19% 2.73% 2.66% 2.84% Credit Loss Provision $ 15,500 12,500 24,500 21,000 8,000 As a % of Average Loans and Leases (annualized) % 0.40% 0.33% 0.64% 0.56% 0.22% Trailing Twelve Months Net Charge-offs $ 53,991 56,802 36,287 21,990 6,480 As a % of Average Loans and Leases % 0.35% 0.37% 0.24% 0.15% 0.04% Allowance for Credit Losses (ACL) (2) $ 173,579 159,142 167,589 161,278 154,070 As a % of Loans and Leases HFI % 1.11% 1.02% 1.08% 1.05% 1.05% ACL / Nonaccrual Loans and Leases HFI % 110.08% 92.22% 96.86% 94.54% 90.06%
Key Credit Trends – Non-PCI Loans HFI 1.05% 1.05% 1.08% 1.02% 1.11% 3Q16 4Q16 1Q17 2Q17 3Q17 ACL / Loans and Leases 2.84% 2.66% 2.73% 2.19% 2.20% 3Q16 4Q16 1Q17 2Q17 3Q17 Classified Loans and Leases/ Average Loans and Leases 1.16% 1.11% 1.11% 1.11% 1.00% 3Q16 4Q16 1Q17 2Q17 3Q17 Nonaccrual Loans and Leases / Loans and Leases 1.27% 1.19% 1.20% 1.20% 1.08% 3Q16 4Q16 1Q17 2Q17 3Q17 NPAs / Loans and Leases and Foreclosed Assets
At September 30, 2017, the Company’s ten largest Non-PCI loan relationships on nonaccrual status had an aggregate book balance of $129 million and represented 82% of total Non-PCI nonaccrual loans and leases. Non-PCI Nonaccrual Loan and Lease Detail (1) Excludes loans held for sale at lower of cost or fair value at June 30, 2017. % of Loan % of Loan 9/30/2017 6/30/2017 ($ in thousands) Balance Category Balance Category Balance Balance Real estate mortgage: Commercial 63,096 $ 1.5% 65,599 $ 1.5% 1,446 $ 3,734 $ Residential 3,186 0.2% 5,229 0.3% 282 46 Total real estate mortgage 66,282 1.1% 70,828 1.2% 1,728 3,780 Real estate construction and land: Commercial - 0.0% - 0.0% - - Residential - 0.0% - 0.0% - - Total R.E. construction and land - 0.0% - 0.0% - - Commercial: Cash flow 33,514 1.2% 43,169 1.5% 72 201 Equipment finance 30,942 5.2% 31,111 5.1% - - Venture capital 22,686 1.2% 25,278 1.3% 2,720 23,171 Asset-based 3,977 0.2% 1,718 0.1% - - Total commercial 91,119 1.2% 101,276 1.3% 2,792 23,372 Consumer 296 0.1% 472 0.1% 286 - Total (1) 157,697 $ 1.0% 172,576 $ 1.1% 4,806 $ 27,152 $ 9/30/2017 Nonaccrual Loans and Leases 6/30/2017 Accruing and 30 -89 Days Past Due
Deposits
Does not include $1.9 billion of client investment funds held at September 30, 2017. Deposit Detail Core: 81% Core: 77% Noninterest - bearing demand deposits Interest checking deposits Money market deposits Savings deposits Non - core non - maturity deposits Time deposits $250,000 and under Time deposits over $250,000 September 30, 2017 Noninterest - bearing demand deposits Interest checking deposits Money market deposits Savings deposits Non - core non - maturity deposits Time deposits $250,000 and under Time deposits over $250,000 September 30, 2016 ($ in millions) Deposit Category Amount % of Total Amount % of Total Noninterest-bearing demand deposits 6,912 $ 41% 6,522 $ 42% Interest checking deposits 1,957 12% 1,185 8% Money market deposits 3,967 24% 3,532 22% Savings deposits 695 4% 772 5% Total core deposits 13,531 81% 12,011 77% Non-core non-maturity deposits 1,119 6% 1,082 7% Total non-maturity deposits 14,650 87% 13,093 84% Time deposits $250,000 and under 1,770 11% 2,092 13% Time deposits over $250,000 353 2% 461 3% Total time deposits 2,123 13% 2,553 16% Total deposits (1) 16,773 $ 100% 15,646 $ 100% September 30, 2017 September 30, 2016
Deposit Portfolio Includes brokered deposits of $710 million with a weighted average maturity of 5 months and a weighted average cost of 1.02%. $15.6 $15.9 $16.3 $16.9 $16.8 0.10% 0.20% 0.30% 0.40% 0.50% 0.60% 0.0 5.0 10.0 15.0 20.0 3Q16 4Q16 1Q17 2Q17 3Q17 Cost Balance ($ in Billions) Core Deposits Non-Core Deposits Cost of Interest-Bearing Deposits Cost of Total Deposits ($ in millions) Time Deposits Time Deposits Total $250,000 Over Time Contractual Time Deposit Maturities and Under $250,000 Deposits Rate Due in three months or less 607 $ 113 $ 720 $ 0.56% Due in over three months through six months 533 173 706 0.76% Due in over six months through twelve months 505 50 555 0.57% Due in over 12 months through 24 months 82 9 91 0.59% Due in over 24 months 43 8 51 0.58% Total 1,770 $ (1) 353 $ 2,123 $ 0.63% September 30, 2017
Controlled Expenses
Source: SNL Financial. Peer data through 2Q17. Efficiency Ratio Trend 36.9% 38.0% 39.6% 39.3% 38.5% 40.6% 40.1% 40.1% 41.4% 40.3% 40.4% 64.2% 63.4% 65.9% 63.2% 64.3% 62.8% 61.8% 63.0% 62.8% 62.9% 35.0% 40.0% 45.0% 50.0% 55.0% 60.0% 65.0% 70.0% 1Q15 2Q15 3Q15 4Q15 1Q16 2Q16 3Q16 4Q16 1Q17 2Q17 3Q17 PACW Efficiency Ratio Median Efficiency Ratio Banks $15-$25B
(1) Source: SNL Financial Focus and Execution Drive Efficiency 57.2% 55.0% 54.0% 56.4% 60.7% 41.6% 38.5% 39.8% 41.4% 40.3% 40.4% 2009 2010 2011 2012 2013 2014 2015 2016 1Q17 2Q17 3Q17 Efficiency Ratio (1) $60 $57 $60 $70 $72 $147 $193 $203 $218 $225 $224 2009 2010 2011 2012 2013 2014 2015 2016 1Q17 2Q17 3Q17 Average Branch Size ($ - M)
The Company uses certain non-GAAP financial measures to provide meaningful supplemental information regarding the Company’s operational performance and to enhance investors’ overall understanding of such financial performance. These non-GAAP financial measures should not be considered a substitute for financial measures presented in accordance with GAAP and may be different from non-GAAP financial measures used by other companies. The table below presents reconciliations of certain GAAP to non-GAAP financial measures: Non-GAAP Measurements ($ in thousands, except per share amounts) September 30, 2017 June 30, 2017 March 31, 2017 December 31, 2016 September 30, 2016 Tangible Common Equity Ratio & Tangible Book Value Per Share Stockholders' equity 4,610,668 $ 4,559,905 $ 4,508,106 $ 4,479,055 $ 4,542,595 $ Less: Intangible assets 2,201,137 2,204,186 2,207,251 2,210,315 2,213,491 Tangible common equity 2,409,531 $ 2,355,719 $ 2,300,855 $ 2,268,740 $ 2,329,104 $ Total assets 22,242,932 $ 22,246,877 $ 21,927,254 $ 21,869,767 $ 21,315,291 $ Less: Intangible assets 2,201,137 2,204,186 2,207,251 2,210,315 2,213,491 Tangible assets 20,041,795 $ 20,042,691 $ 19,720,003 $ 19,659,452 $ 19,101,800 $ Equity to assets ratio 20.73% 20.50% 20.56% 20.48% 21.31% Tangible common equity ratio (1) 12.02% 11.75% 11.67% 11.54% 12.19% Book value per share 37.96 $ 37.55 $ 37.13 $ 36.93 $ 37.29 $ Tangible book value per share (2) 19.84 $ 19.40 $ 18.95 $ 18.71 $ 19.12 $ Shares outstanding 121,449,794 121,448,321 121,408,133 121,283,669 121,817,524 Return on Average Tangible Equity Net earnings 101,466 $ 93,647 $ 78,668 $ 85,647 $ 93,985 $ Average stockholders' equity 4,592,489 $ 4,545,276 $ 4,503,675 $ 4,501,948 $ 4,530,701 $ Less: Average intangible assets 2,202,922 2,205,814 2,209,112 2,212,042 2,217,564 Average tangible common equity 2,389,567 $ 2,339,462 $ 2,294,563 $ 2,289,906 $ 2,313,137 $ Return on average equity 8.77% 8.26% 8.24% 8.05% 7.94% Return on average tangible equity (3) 16.85% 16.06% 13.90% 14.88% 16.15% (1) Tangible common equity divided by tangible assets (2) Tangible common equity divided by shares outstanding (3) Annualized net earnings divided by average tangible common equity. PacWest Bancorp Consolidated