June 4, 2012
VIA EDGAR
Mr. Michael Johnson
Staff Attorney
Division of Corporation Finance
United States Securities and Exchange Commission
100 F. Street, N.E.
Washington, DC 20549
| Re: | CU Bancorp |
Pre-Effective Amendment No. 1 to Registration Statement on Form S-4
Filed June 4, 2012
File No. 333-180739
Dear Mr. Johnson:
CU Bancorp, a California corporation (the “Company”), is submitting this letter in response to your letter to Mr. David I. Rainer, dated May 10, 2012, regarding the Company’s Registration Statement on Form S-4, as filed with the Securities and Exchange Commission (the “Commission”) on April 13, 2012 (the “Registration Statement”). Contemporaneously herewith, the Company has filed a pre-effective amendment to the Registration Statement (the “Amendment No. 1”) which amends the Registration Statement to address the comments contained in your letter.
Amendment No. 1 amends the applicable sections of the Registration Statement to reflect the changes in response to the Staff’s comments, as detailed below. Amendment No. 1 also updates the financial disclosures contained in the Registration Statement to include the unaudited financial statements of CUB and PC Bancorp as of and for the three month period ended March 31, 2012 and 2011 and the corresponding management’s discussion and analysis of operations for this period of CUB and PC Bancorp.
Please note that the following corresponds to the numbered items listed in the Staff’s letter. Capitalized terms not otherwise defined herein shall have the same meanings ascribed to them in the Registration Statement, as amended. The text taken from the Staff’s letter is in bold with our responses following. Capitalized terms used herein and not defined shall have the meaning ascribed to such term in Amendment No. 1.
Mr. Michael Johnson
Staff Attorney
Division of Corporation Finance
United States Securities and Exchange Commission
June 4, 2012
Page 2 of 10
Risk Factors
“The Merger Agreement Does not Require that the Fairness Opinion …,” page 21
| 1. | We note that Hovde’s and Vining Sparks’s opinions were delivered in December. Please disclose whether any material changes in CUB’s or PC Bancorp’s operations, performance, or in any of the projections or assumptions upon which Hovde and Vining Sparks based their opinions, have occurred since the delivery of the opinions or are anticipated to occur before the shareholder meeting. |
As of the date of this letter, there have been no material changes to CUB’s or PC Bancorp’s operations, performance, or in any of the projections or assumptions upon which Hovde and Vining Sparks based their opinions since the delivery of their respective opinions as to the fairness of the merger consideration.
The applicable risk factors have been amended to reflect the above disclosure and appear on pages 23 and 24 of the joint proxy statement/prospectus included in Amendment No. 1.
California United Bank and Premier Commercial Bancorp Joint Proposal No. 2 – The Merger Agreement and the Acquisition, page 48
General
| 2. | Revise your disclosure throughout this section to describe material proposals and counter-proposals among CUB and PC Bancorp so that the description provides insight into the negotiation of significant transaction terms that affected the structure of the transaction and the consideration to be paid. |
We have revised the section entitled “Background of the Transaction and CUB’s Reasons for the Acquisition of PC Bancorp and PCB” to disclose material proposals and counter-proposals among CUB and PC Bancorp. The revised section appears on pages 53 through 56 of the joint proxy statement/prospectus included in Amendment No. 1.
Mr. Michael Johnson
Staff Attorney
Division of Corporation Finance
United States Securities and Exchange Commission
June 4, 2012
Page 3 of 10
Opinion of CUB’s Financial Advisor, page 55
General
| 3. | Please provide us with copies of any materials prepared by Hovde and Vining Sparks in connection with their fairness opinions, including draft opinions, reports or appraisals provided to the board of directors and any summaries of presentations made to the board of directors. |
Copies of materials prepared by Hovde and Vining Sparks in connection with their fairness opinions are attached to this letter asExhibit 1.
| 4. | Please describe any material relationship between CUB and PC Bancorp and Hovde and Vining Sparks and quantify any consideration paid in the preceding two years. See Item 1015(b)(4). We note that Vining Sparks engaged in securities and loan sales and trading activity with CUB and PC Bancorp. |
We have revised the section entitled “Opinion of CUB’s Financial Advisor” to disclose the following:
“Hovde has acted as CUB’s financial advisor in connection with the proposed Acquisition. In addition to the payment of $30,000 for Hovde’s fairness opinion and $6,556 in expense reimbursements in 2011, it is anticipated that Hovde will receive additional fees and consideration approximating $780,000 upon consummation of the proposed Acquisition of PC Bancorp and PCB. The engagement of Hovde and payment of the aforementioned fees were recommended by Management and the Board of Directors and approved by CUB’s Board of Directors.
Hovde also acted as CUB’s financial advisor in connection with the acquisition of California Oaks State Bank (“COSB”) in 2010 for which Hovde was paid $191,503 which amount included a $10,000 retainer fee, $25,000 as compensation for Hovde’s fairness opinion with respect to the COSB merger, a $150,000 success fee paid in connection with the closing of the COSB merger, and $6,504 in expense reimbursements. Hovde Securities LLC, an entity related to Hovde, was engaged by CUB to assist CUB in raising $10.3 million through a private placement of common stock in the 1st quarter of 2011 and was paid $500,626.03 which included a $460,629.56 success fee, $25,000 for a fairness opinion and $14,996.47 in expense reimbursements.”
Mr. Michael Johnson
Staff Attorney
Division of Corporation Finance
United States Securities and Exchange Commission
June 4, 2012
Page 4 of 10
The revised section appears on page 60 of the joint proxy statement/prospectus included in Amendment No. 1.
We have also revised the section entitled “Opinion of PC Bancorp’s Financial Advisor” to disclose the following:
“PC Bancorp’s board of directors retained Vining Sparks IBG, L.P., or Vining Sparks, to render financial advisory and investment banking services. Vining Sparks has also engaged in securities and loan sales and trading activity with CUB and PC Bancorp and/or PC Bancorp’s subsidiary bank, PCB in the past two years, for which Vining Sparks has received brokers’ commissions and/or trading gains or fees. These amounts are embedded in the price quotes for such securities and/or loans and neither CUB, PC Bancorp nor Vining Sparks deems these amounts to be materially significant. In addition, CUB uses Vining Sparks Bond Accounting System to account for its investment securities which has been provided to CUB on a complementary basis. Vining Sparks does not receive compensation from CUB for this service.
Vining Sparks is a nationally recognized investment banking firm with substantial expertise in transactions similar to the proposed transaction and is familiar with PC Bancorp and its business. As part of its investment banking activities, Vining Sparks is regularly engaged in the independent valuation of financial institutions and securities in connection with mergers, acquisitions, underwritings, sales and distributions of listed and unlisted securities, private placements and valuations for estate, corporate and other purposes.
On December 7, 2011, Vining Sparks delivered a written opinion to the PC Bancorp that the terms of the proposed merger of PC Bancorp and CUB were fair, from a financial point of view, to holders of shares of PC Bancorp common stock. The full text of Vining Sparks’ opinion is attached as Appendix D to this proxy statement-prospectus and should be read in its entirety. Vining Sparks received total fees of $26,000 for its fairness opinion. The retention of Vining Sparks was recommended by Gary Steven Findley & Associates, PC Bancorp’s legal counsel. The engagement of Vining Sparks and the payment of the fees for its fairness opinion were approved by PC Bancorp’s Board of Directors.”
The revised section appears on pages 66 through 67 of the joint proxy statement/prospectus included in Amendment No. 1.
Mr. Michael Johnson
Staff Attorney
Division of Corporation Finance
United States Securities and Exchange Commission
June 4, 2012
Page 5 of 10
5. Additionally, revise your proxy to disclose who recommended the consideration to be paid and the aggregate fee currently estimated to be paid to each of Hovde and Vining Sparks. Refer to Item 14(b)(6) of Schedule 14A and Item 1015 of Regulation M-A.
Please refer to our responses to question 4 above and the revised sections of the joint proxy statement/prospectus included in Amendment No. 1 referenced in our responses.
Interests of Directors and Officers in the Transaction, page 71
6. Please disclose the compensation arrangements for the consulting services provided by Mr. Cosgrove and Mr. Patel after the merger.
We have revised the section entitled “Interests of Directors and Officers in the Transaction” in response to this comment to disclose the following:
“Employment and Salary Continuation Agreements. Kenneth Cosgrove and Ashok Patel entered into employment agreements with PC Bancorp and PCB. Under the terms of their respective employment agreements, upon consummation of the Acquisition, Mr. Cosgrove and Mr. Patel will be entitled to change in control benefits approximating $572,200 and $620,600, respectively, payable in a lump sum. In addition, Messrs. Cosgrove and Patel, along with Mr. Viktor Uehlinger and Mr. Stephen Pihl, have entered into salary continuation agreements with PC Bancorp which provide for annual benefit payments upon reaching age 65. Mr. Cosgrove will attain the age of 65 in June 2012, at which time his salary continuation benefits will not be affected by the Acquisition and he will become fully vested and will be entitled to receive $75,000 in salary continuation benefits for 15 years following retirement. Mr. Patel has entered into an agreement providing that he will accept a lump sum payment of $200,000 in consideration for termination of his salary continuation agreement. Absent the amendment, Mr. Patel’s salary continuation benefits would have vested in full as a result of the Acquisition and he would have been entitled to salary continuation benefits of $75,000 per year for fifteen years beginning in July 2026. The salary continuation agreements with Messrs. Uehlinger and Pihl provide that if they are terminated within one (1) year following the consummation of the Acquisition, their salary continuation benefits will accelerate from 80% vested to 100% vested and each will receive approximately $38,000 in salary continuation benefits for 15 years upon reaching age 65. Their salary continuation benefits will not accelerate if they are not terminated within one (1) year following consummation of the Acquisition.”
Mr. Michael Johnson
Staff Attorney
Division of Corporation Finance
United States Securities and Exchange Commission
June 4, 2012
Page 6 of 10
The revised section appears on page 77 of the joint proxy statement/prospectus included in Amendment No. 1.
7. Please quantify the aggregate benefit to each executive officer discussed in this section including the cash payments due to change in control agreements, employment contract terminations, consulting fees, and cancelled options. Also, please include the value of the options that will accelerate and vest upon consummation of the merger.
We have revised the section entitled “Interests of Directors and Officers in the Transaction” in response to this comment to disclose the following:
“Stock Options and Restricted Stock Awards. The following directors and officers of PC Bancorp or PCB hold options to purchase additional shares of PC Bancorp: Kenneth Cosgrove, Ashok Patel, Ronald Thon, Anthony Vitti and Stephen Pihl. Upon consummation of the merger, they will have their options accelerated and cancelled and shall receive a cash payment in an amount equal to the excess of the per share merger consideration over the per share option exercise price of such option. See “CALIFORNIA UNITED BANK AND PREMIER COMMERCIAL BANCORP JOINT PROPOSAL NO. 2—THE MERGER AGREEMENT AND THE ACQUISITION—PC Bancorp Stock Options” herein. Assuming a closing price of $11.17 per share, the approximate cash value of the payment to each of these officers and directors is as follows:
Name | Cash Payment in Cancellation of Stock Options | |||
Kenneth Cosgrove | $ | 113,711 | ||
Ashok Patel | $ | 113,711 | ||
Ronald Thon | $ | 64,975 | ||
Anthony Vitti | $ | 64,975 | ||
Stephen Pihl | $ | 56,852 | ||
|
| |||
Total | $ | 414,224 | ||
|
| |||
Also, each of the directors, Mr. Uehlinger and Mr. Pihl, holds restricted stock awards of PC Bancorp which have not yet vested. These awards will accelerate and completely vest immediately prior to the effective time of the holding company merger. The following table sets forth the number of shares of restricted stock each of these individuals own and the estimated value of the shares of CU Bancorp common stock that each will receive on connection with the Acquisition, assuming no adjustment to the stock consideration and a closing price of CUB common stock of $11.17.
Mr. Michael Johnson
Staff Attorney
Division of Corporation Finance
United States Securities and Exchange Commission
June 4, 2012
Page 7 of 10
Name | Restricted Shares | Merger Consideration (Shares) | Estimated Value ($) | |||||||||
Kenneth J. Cosgrove | 4,578 | 4,543 | $ | 50,745 | ||||||||
Edward E. Hatz | 1,272 | 1,262 | $ | 14,097 | ||||||||
Robert C. Matranga | 1,272 | 1,262 | $ | 14,097 | ||||||||
Ashok R. Patel | 4,578 | 4,543 | $ | 50,745 | ||||||||
Steven Perryman | 1,272 | 1,262 | $ | 14,097 | ||||||||
Melvin W. Smith | 1,272 | 1,262 | $ | 14,097 | ||||||||
Ronald P. Thon | 1,272 | 1,262 | $ | 14,097 | ||||||||
Anthony M. Vitti | 1,272 | 1,262 | $ | 14,097 | ||||||||
Stephen W. Pihl | 1,780 | 1,766 | $ | 19,726 | ||||||||
Viktor R. Uehlinger | 1,780 | 1,766 | $ | 19,726 | ||||||||
|
|
|
|
|
| |||||||
All Directors and Executive Officers as a group (10 persons) | 20,348 | 20,190 | $ | 225,524 | ||||||||
|
|
|
|
|
| |||||||
Mr. Michael Johnson
Staff Attorney
Division of Corporation Finance
United States Securities and Exchange Commission
June 4, 2012
Page 8 of 10
The following table sets forth the aggregate value of cash and stock to be received by each of the directors and executive officers of PC Bancorp as a result of the Acquisition, excluding salary continuation benefits and excluding compensation to be paid in connection with post-Acquisition employment and consulting services, assuming no adjustment to the stock consideration to be paid by CU Bancorp and assuming a closing price of CUB common stock of $11.17:”
Name | Change in Control Payments | Cash Payments for Cancellation of Stock Options | Estimated Cash Value of Stock Consideration to be paid for Restricted Shares ($) | Total | ||||||||||||
Kenneth J. Cosgrove | $ | 572,200 | $ | 113,711 | $ | 50,745 | $ | 736,656 | ||||||||
Edward E. Hatz | — | — | $ | 14,097 | $ | 14,097 | ||||||||||
Robert C. Matranga | — | — | $ | 14,097 | $ | 14,097 | ||||||||||
Ashok R. Patel | $ | 620,600 | $ | 113,711 | $ | 50,745 | $ | 785,056 | ||||||||
Steven Perryman | — | — | $ | 14,097 | $ | 14,097 | ||||||||||
Melvin W. Smith | — | — | $ | 14,097 | $ | 14,097 | ||||||||||
Ronald P. Thon | — | $ | 64,975 | $ | 14,097 | $ | 79,072 | |||||||||
Anthony M. Vitti | — | $ | 64,975 | $ | 14,097 | $ | 79,072 | |||||||||
Stephen W. Pihl | — | $ | 56,852 | $ | 19,726 | $ | 76,578 | |||||||||
Viktor R. Uehlinger | — | — | $ | 19,726 | $ | 19,726 | ||||||||||
|
|
|
|
|
|
|
| |||||||||
All Directors and Executive Officers as a group (10 persons) | $ | 1,192,800 | $ | 414,224 | $ | 225,524 | $ | 1,832,548 | ||||||||
|
|
|
|
|
|
|
| |||||||||
The revised section appears on pages 77 through 79 of the joint proxy statement/prospectus included in Amendment No. 1.
Mr. Michael Johnson
Staff Attorney
Division of Corporation Finance
United States Securities and Exchange Commission
June 4, 2012
Page 9 of 10
Index to Financial Statements, page 208
8. Please revise the index to the financial statements to disclose why the financial statements of the registrant are not presented.
We have revised the s index to the financial statements in response to this comment to include the following footnote explaining why the financial statements of CU Bancorp are not presented:
“CU Bancorp was incorporated on November 16, 2011 at the direction of the board of directors of CUB to serve as bank holding company for CUB and to serve as a merger vehicle in connection with the Acquisition of PC Bancorp. Since the date of its incorporation, CU Bancorp has had no operations. Its activities have been limited to taking such actions as are necessary for the bank holding company reorganization of CUB and CU Bancorp. Accordingly, no financial information for CU Bancorp is presented herein and no financial statements for CU Bancorp are provided herewith.”
Exhibit Index, page II-5
9. Please file the opinion of Buchalter Nemer, and all other unfiled exhibits.
The tax opinions of Buchalter Nemer are filed as Exhibits 8.1 and 8.2 to Amendment No.1. All other unfiled exhibits are now filed as exhibits to Amendment No. 1.
Legality Opinion, Exhibit 5.1
10. Please remove assumption regarding the “authority of the parties” in qualification A; you may not assume the authority of parties unless they are unrelated to the company.
The legality opinion has been revised in accordance with this comment. The revised legality opinion appears as Exhibit 5.1 to Amendment No. 1
11. Please remove the assumption pertaining to corporate action in qualification D; you may verify many of these actions through due diligence and through representations of fact, which should make this assumption obsolete.
The legality opinion has been revised in accordance with this comment. The revised legality opinion appears as Exhibit 5.1 to Amendment No. 1
Mr. Michael Johnson
Staff Attorney
Division of Corporation Finance
United States Securities and Exchange Commission
June 4, 2012
Page 10 of 10
12. Please remove the assumption “there will be no material changes in the Documents” in the paragraph following your qualifications or refile your opinion when you request effectiveness. Your opinion should be valid at the date of effectiveness, regardless of material changes that may occur in pre-effective amendments to your registration statement.
The legality opinion has been revised in accordance with this comment. The revised legality opinion appears as Exhibit 5.1 to Amendment No. 1
Pursuant to Rule 461 promulgated under the Securities Act of 1933, as amended, we hereby request the acceleration of the Company’s Registration Statement on Form S-4, as amended, to 9:00 a.m. Eastern Time on June 5, 2012, or as soon as practicable thereafter.
On behalf of the Company, we acknowledge that:
• should the Commission or the staff, acting pursuant to delegated authority, declare the filing effective, it does not foreclose the Commission from taking any action with respect to the filing;
• the action of the Commission or the staff, acting pursuant to delegated authority, in declaring the filing effective, does not relieve the Company from its full responsibility for the adequacy and accuracy of the disclosure in the filing; and
• the Company may not assert staff comments and the declaration of effectiveness as a defense in any proceeding initiated by the Commission or any person under the federal securities laws of the United States.
We trust the foregoing has been responsive to the Staff’s comments; however, should the Staff have any further comments or questions we are prepared to respond promptly.
| Sincerely, | ||
| /s/Arthur A. Coren | ||
| Arthur A. Coren | ||
| Professional Corporation | ||
Enclosures
Exhibit 1
Fairness Opinion Analysis December 8, 2011 • Chicago • Los Angeles • Palm Beach • Austin • New York
Important Disclosures This Confidential Presentation, and any oral or video presentation that supplements it, have been developed by and are proprietary to Hovde Financial, Inc. (“Hovde Financial”) and were prepared exclusively for the benefit and internal use of the Company only. Neither this presentation nor any oral or video presentation that supplements it, nor any of their contents, may be reproduced, distributed or used for any other purpose without the prior written consent of Hovde Financial. If you are not the intended recipient of this document (or a person responsible for delivering such document to the intended recipient), you are hereby notified that any disclosure, copying, distribution, as the case may be, or the taking of any action in reliance on the contents of the information contained in this document is strictly prohibited. If you have received this document in error or are not the named addressee, please notify Hovde Financial immediately and destroy this document.
The analyses contained herein rely upon information obtained from the Company and/or from public sources, the accuracy of which has not been verified, and cannot be assured, by Hovde Financial. Moreover, many of the projections and financial analyses herein are based on estimated financial performance prepared by or in consultation with the Company and are intended only to suggest reasonable ranges of results and are otherwise incomplete without any oral or video presentation that supplements it. Accordingly, no representation or warranty, expressed or implied, is made to, and no reliance should be placed on, the accuracy, completeness or correctness of the information and opinions and estimates contained in this document. The opinions and estimates expressed herein reflect only the current judgment of Hovde Financial based on the information provided to it by the Company, and as otherwise available to it as of the respective dates contemplated thereby.
The information contained in this Confidential Presentation is based solely upon the information available to us and the economic, market and other circumstances as they exist as of the date thereof. Events occurring and information that becomes available thereafter, could materially affect the assumptions and information used in providing the analyses contained herein. In providing the analyses herein, Hovde Financial has assumed, without independent verification, that the representations and financial and other information provided to it by the Company that form a substantial basis for the valuations and analyses contained herein, are true and complete. In that regard, Hovde Financial has assumed that the financial forecasts and other information, including, without limitation, any projections regarding any assets, liabilities, goodwill, net income, net charge-offs, and/or other financial information, as applicable, have been reasonably prepared by the Company on a basis reflecting the best currently available information and Company’s judgments and estimates. Further, Hovde Financial has assumed that such forecasts would be realized in the amounts and at the times contemplated thereby. Hovde Financial has not performed a loan file review or an appraisal of the Company’s loans, investments and other assets or liabilities and has not opined on the adequacy of the Company’s loan loss reserves, its viability or ability to operate as a going concern in any manner, or the fairness of any transaction or corporate or accounting actions that the Company has consummated, or may be contemplating or pursuing in the future, and nothing in this Confidential Presentation shall be construed as such.
The Company shall not construe any of the information contained in this Confidential Presentation as any tax, legal, regulatory, or accounting advice. The Company should seek and rely on the advice of its own independent tax, legal, regulatory, and/or accounting advisors for such matters.
No representation or warranty is being made hereunder by Hovde Financial that any analyses contained herein complies with any tax or accounting rules, regulations, statements or principles, or other requirements or standards, and Hovde Financial expressly disclaims any and all representations or warranties in connection therewith. Further, nothing contained in this Confidential Presentation is or shall be deemed to be, or construed as any advice or recommendation to the Company or any third party as to whether or not the Company or such third parties should enter into any transaction(s), or take any impairments, charge-offs or any other accounting or corporate action in connection therewith.
The analyses and other information contained in this Confidential Presentation are for internal use by the Company only and are not intended, and may not be referenced or used by the Company in, or as the basis for, any reports or filings to any third parties (including without limitation, any public filings and/or audit reports), without the express written consent of Hovde Financial. Hovde Financial will not undertake to reaffirm or revise any valuations, advice or analyses or otherwise comment upon any events occurring or information that becomes available after the date of the valuation and analyses contemplated hereby. 2
Table of Contents Section Contents I Analysis of the Deal Structure II Valuation Analysis III Copy of Hovde’s Fairness Opinion Letter 3

I. Analysis of the Deal Structure 4
Pricing Analysis of the Offer
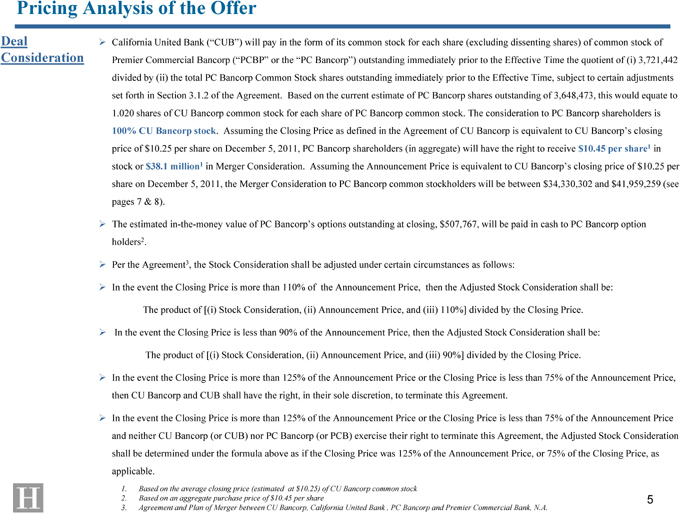
Deal Consideration
??California United Bank (“CUB”) will pay in the form of its common stock for each share (excluding dissenting shares) of common stock of Premier Commercial Bancorp (“PCBP” or the “PC Bancorp”) outstanding immediately prior to the Effective Time the quotient of (i) 3,721,442 divided by (ii) the total PC Bancorp Common Stock shares outstanding immediately prior to the Effective Time, subject to certain adjustments set forth in Section 3.1.2 of the Agreement. Based on the current estimate of PC Bancorp shares outstanding of 3,648,473, this would equate to 1.020 shares of CU Bancorp common stock for each share of PC Bancorp common stock. The consideration to PC Bancorp shareholders is 100% CU Bancorp stock. Assuming the Closing Price as defined in the Agreement of CU Bancorp is equivalent to CU Bancorp’s closing price of $10.25 per share on December 5, 2011, PC Bancorp shareholders (in aggregate) will have the right to receive $10.45 per share1 in stock or $38.1 million1 in Merger Consideration. Assuming the Announcement Price is equivalent to CU Bancorp’s closing price of $10.25 per share on December 5, 2011, the Merger Consideration to PC Bancorp common stockholders will be between $34,330,302 and $41,959,259 (see pages 7 & 8).
??The estimated in-the-money value of PC Bancorp’s options outstanding at closing, $507,767, will be paid in cash to PC Bancorp option holders2.
Per the Agreement3, the Stock Consideration shall be adjusted under certain circumstances as follows:
??In the event the Closing Price is more than 110% of the Announcement Price, then the Adjusted Stock Consideration shall be:
The product of [(i) Stock Consideration, (ii) Announcement Price, and (iii) 110%] divided by the Closing Price.
??In the event the Closing Price is less than 90% of the Announcement Price, then the Adjusted Stock Consideration shall be:
The product of [(i) Stock Consideration, (ii) Announcement Price, and (iii) 90%] divided by the Closing Price.
??In the event the Closing Price is more than 125% of the Announcement Price or the Closing Price is less than 75% of the Announcement Price, then CU Bancorp and CUB shall have the right, in their sole discretion, to terminate this Agreement.
??In the event the Closing Price is more than 125% of the Announcement Price or the Closing Price is less than 75% of the Announcement Price and neither CU Bancorp (or CUB) nor PC Bancorp (or PCB) exercise their right to terminate this Agreement, the Adjusted Stock Consideration shall be determined under the formula above as if the Closing Price was 125% of the Announcement Price, or 75% of the Closing Price, as applicable.
1. Based on the average closing price (estimated at $10.25) of CU Bancorp common stock
2. Based on an aggregate purchase price of $10.45 per share
3. Agreement and Plan of Merger between CU Bancorp, California United Bank , PC Bancorp and Premier Commercial Bank, N.A. 5
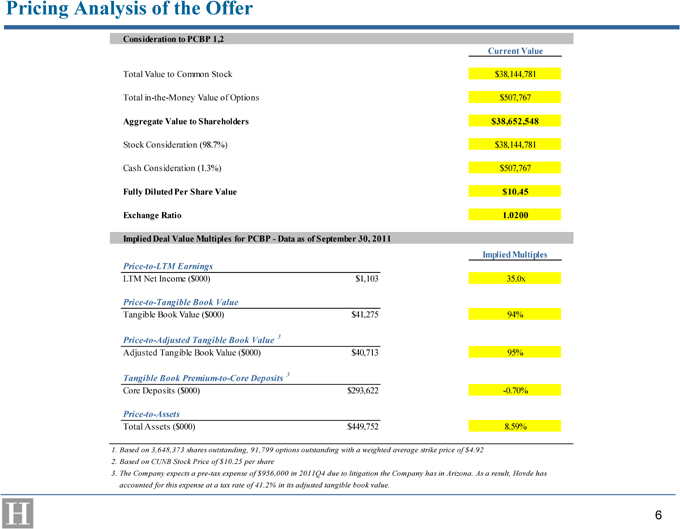
Pricing Analysis of the Offer Consideration to PCBP 1,2 Current Value Total Value to Common Stock $38,144,781 Total in-the-Money Value of Options $507,767 Aggregate Value to Shareholders $38,652,548 Stock Consideration (98.7%) $38,144,781 Cash Consideration (1.3%) $507,767 Fully Diluted Per Share Value $10.45 Exchange Ratio 1.0200 Implied Deal Value Multiples for PCBP—Data as of September 30, 2011 Implied Multiples Price-to-LTM Earnings LTM Net Income ($000) $1,103 35.0x Price-to-Tangible Book Value Tangible Book Value ($000) $41,275 94% Price-to-Adjusted Tangible Book Value 3 Adjusted Tangible Book Value ($000) $40,713 95% Tangible Book Premium-to-Core Deposits 3 Core Deposits ($000) $293,622 -0.70% Price-to-Assets Total Assets ($000) $449,752 8.59% 1. Based on 3,648,373 shares outstanding, 91,799 options outstanding with a weighted average strike price of $4.92 2. Based on CUNB Stock Price of $10.25 per share 3. The Company expects a pre-tax expense of $956,000 in 2011Q4 due to litigation the Company has in Arizona. As a result, Hovde has accounted for this expense at a tax rate of 41.2% in its adjusted tangible book value. 6
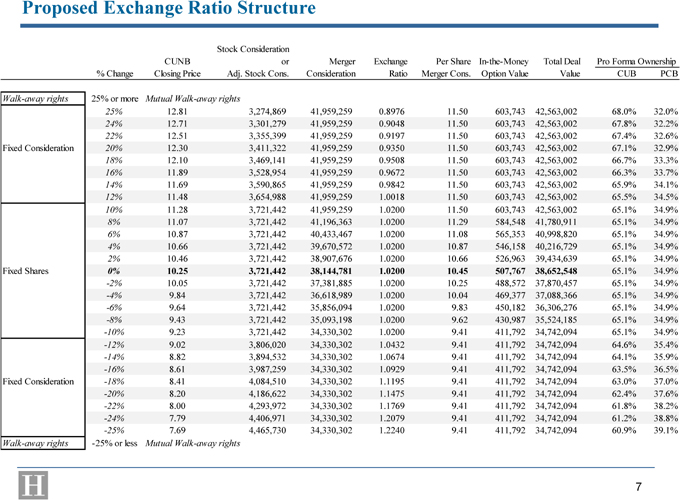
Proposed Exchange Ratio Structure Stock Consideration CUNB or Merger Exchange Per Share In-the-Money Total Deal Pro Forma Ownership % Change Closing Price Adj. Stock Cons. Consideration Ratio Merger Cons. Option Value Value CUB PCB Walk-away rights 25% or more Mutual Walk-away rights 25% 12.81 3,274,869 41,959,259 0.8976 11.50 603,743 42,563,002 68.0% 32.0% 24% 12.71 3,301,279 41,959,259 0.9048 11.50 603,743 42,563,002 67.8% 32.2% 22% 12.51 3,355,399 41,959,259 0.9197 11.50 603,743 42,563,002 67.4% 32.6% Fixed Consideration 20% 12.30 3,411,322 41,959,259 0.9350 11.50 603,743 42,563,002 67.1% 32.9% 18% 12.10 3,469,141 41,959,259 0.9508 11.50 603,743 42,563,002 66.7% 33.3% 16% 11.89 3,528,954 41,959,259 0.9672 11.50 603,743 42,563,002 66.3% 33.7% 14% 11.69 3,590,865 41,959,259 0.9842 11.50 603,743 42,563,002 65.9% 34.1% 12% 11.48 3,654,988 41,959,259 1.0018 11.50 603,743 42,563,002 65.5% 34.5% 10% 11.28 3,721,442 41,959,259 1.0200 11.50 603,743 42,563,002 65.1% 34.9% 8% 11.07 3,721,442 41,196,363 1.0200 11.29 584,548 41,780,911 65.1% 34.9% 6% 10.87 3,721,442 40,433,467 1.0200 11.08 565,353 40,998,820 65.1% 34.9% 4% 10.66 3,721,442 39,670,572 1.0200 10.87 546,158 40,216,729 65.1% 34.9% 2% 10.46 3,721,442 38,907,676 1.0200 10.66 526,963 39,434,639 65.1% 34.9% Fixed Shares 0% 10.25 3,721,442 38,144,781 1.0200 10.45 507,767 38,652,548 65.1% 34.9% -2% 10.05 3,721,442 37,381,885 1.0200 10.25 488,572 37,870,457 65.1% 34.9% -4% 9.84 3,721,442 36,618,989 1.0200 10.04 469,377 37,088,366 65.1% 34.9% -6% 9.64 3,721,442 35,856,094 1.0200 9.83 450,182 36,306,276 65.1% 34.9% -8% 9.43 3,721,442 35,093,198 1.0200 9.62 430,987 35,524,185 65.1% 34.9% -10% 9.23 3,721,442 34,330,302 1.0200 9.41 411,792 34,742,094 65.1% 34.9% -12% 9.02 3,806,020 34,330,302 1.0432 9.41 411,792 34,742,094 64.6% 35.4% -14% 8.82 3,894,532 34,330,302 1.0674 9.41 411,792 34,742,094 64.1% 35.9% -16% 8.61 3,987,259 34,330,302 1.0929 9.41 411,792 34,742,094 63.5% 36.5% Fixed Consideration -18% 8.41 4,084,510 34,330,302 1.1195 9.41 411,792 34,742,094 63.0% 37.0% -20% 8.20 4,186,622 34,330,302 1.1475 9.41 411,792 34,742,094 62.4% 37.6% -22% 8.00 4,293,972 34,330,302 1.1769 9.41 411,792 34,742,094 61.8% 38.2% -24% 7.79 4,406,971 34,330,302 1.2079 9.41 411,792 34,742,094 61.2% 38.8% -25% 7.69 4,465,730 34,330,302 1.2240 9.41 411,792 34,742,094 60.9% 39.1% Walk-away rights -25% or less Mutual Walk-away rights 7
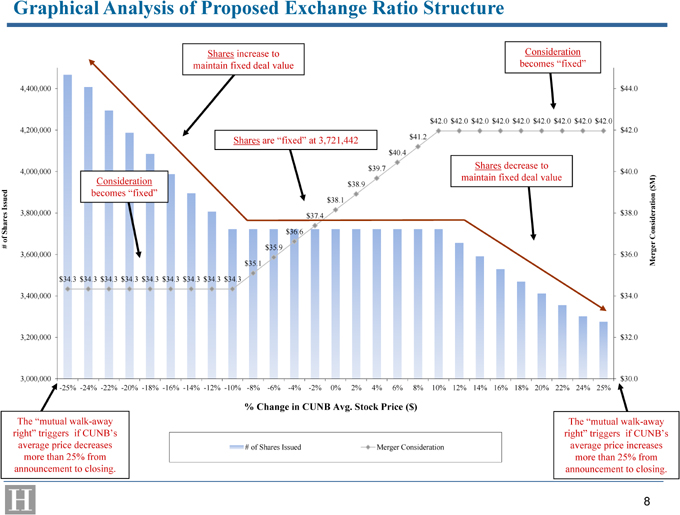
Graphical Analysis of Proposed Exchange Ratio Structure Shares increase to Consideration maintain fixed deal value becomes “fixed” 4,400,000 $44.0 $42.0 $42.0 $42.0 $42.0 $42.0 $42.0 $42.0 $42.0 $42.0 4,200,000 $41.2 $42.0 Shares are “fixed” at 3,721,442 $40.4 $39.7 Shares decrease to 4,000,000 $40.0 Consideration maintain fixed deal value M) $38.9 $ becomes “fixed”( Issued $38.1 ation 3,800,000 $38.0 $37.4 Shares $36.6 Consider of # $35.9 3,600,000 $36.0 $35.1 Merger $34.3 $34.3 $34.3 $34.3 $34.3 $34.3 $34.3 $34.3 $34.3 3,400,000 $34.0 3,200,000 $32.0 3,000,000 $30.0 -25% -24% -22% -20% -18% -16% -14% -12% -10% -8% -6% -4% -2% 0% 2% 4% 6% 8% 10% 12% 14% 16% 18% 20% 22% 24% 25% % Change in CUNB Avg. Stock Price ($) The “mutual walk-away The “mutual walk-away right” triggers if CUNB’s right” triggers if CUNB’s average price decreases # of Shares Issued Merger Consideration average price increases more than 25% from more than 25% from announcement to closing. announcement to closing. 8

II. Valuation Analysis 9
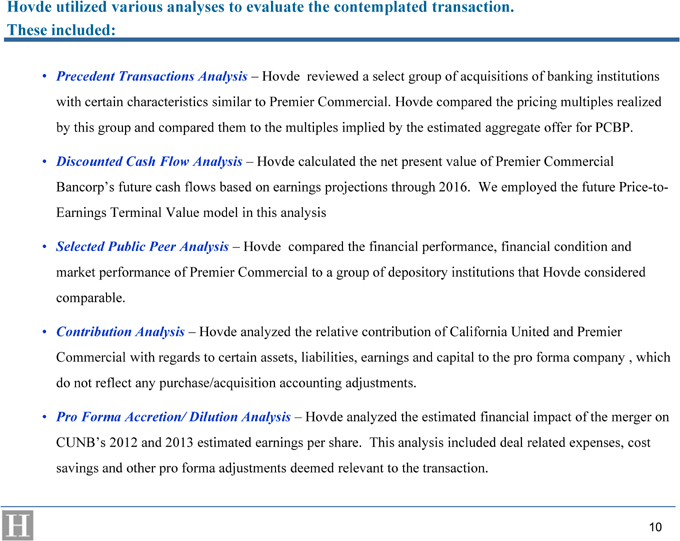
Hovde utilized various analyses to evaluate the contemplated transaction.
These included:
Precedent Transactions Analysis – Hovde reviewed a select group of acquisitions of banking institutions with certain characteristics similar to Premier Commercial. Hovde compared the pricing multiples realized by this group and compared them to the multiples implied by the estimated aggregate offer for PCBP.
Discounted Cash Flow Analysis – Hovde calculated the net present value of Premier Commercial Bancorp’s future cash flows based on earnings projections through 2016. We employed the future Price-to-Earnings Terminal Value model in this analysis
Selected Public Peer Analysis – Hovde compared the financial performance, financial condition and market performance of Premier Commercial to a group of depository institutions that Hovde considered comparable.
Contribution Analysis – Hovde analyzed the relative contribution of California United and Premier Commercial with regards to certain assets, liabilities, earnings and capital to the pro forma company , which do not reflect any purchase/acquisition accounting adjustments.
Pro Forma Accretion/ Dilution Analysis – Hovde analyzed the estimated financial impact of the merger on CUNB’s 2012 and 2013 estimated earnings per share. This analysis included deal related expenses, cost savings and other pro forma adjustments deemed relevant to the transaction. 10

Precedent Transactions 11
Precedent Transactions Peer Group
Nationwide Banks
Total assets between $100 million and $1 billion
MRQ ROAA between -60bps and 60bps
Transactions announced after January 1, 2009
NPAs/Total Assets below 4%
Transactions in which pricing information was disclosed
16 comparable transactions 12
Precedent Transactions Group 13
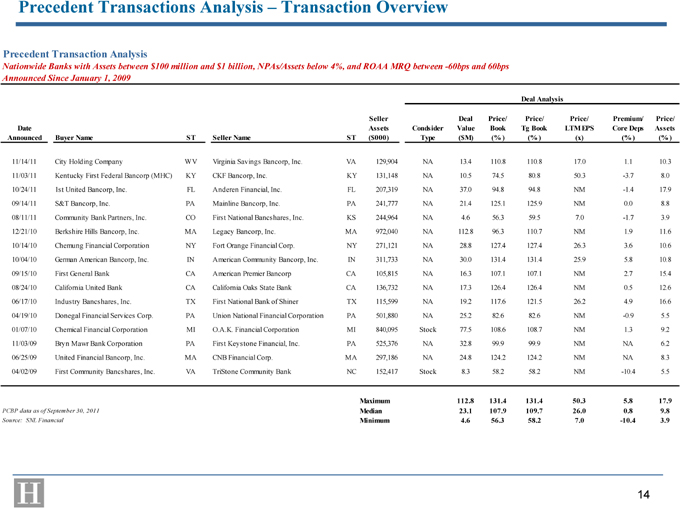
Precedent Transactions Analysis – Transaction Overview Precedent Transaction Analysis Nationwide Banks with Assets between $100 million and $1 billion, NPAs/Assets below 4%, and ROAA MRQ between -60bps and 60bps Announced Since January 1, 2009 Deal Analysis Seller Deal Price/ Price/ Price/ Premium/ Price/ Date Assets Condsider Value Book Tg Book LTM EPS Core Deps Assets Announced Buyer Name ST Seller Name ST ($000) Type ($M) (% ) (% ) (x) (% ) (% ) 11/14/11 City Holding Company WV Virginia Savings Bancorp, Inc. VA 129,904 NA 13.4 110.8 110.8 17.0 1.1 10.3 11/03/11 Kentucky First Federal Bancorp (MHC) KY CKF Bancorp, Inc. KY 131,148 NA 10.5 74.5 80.8 50.3 -3.7 8.0 10/24/11 1st United Bancorp, Inc. FL Anderen Financial, Inc. FL 207,319 NA 37.0 94.8 94.8 NM -1.4 17.9 09/14/11 S&T Bancorp, Inc. PA Mainline Bancorp, Inc. PA 241,777 NA 21.4 125.1 125.9 NM 0.0 8.8 08/11/11 Community Bank Partners, Inc. CO First National Bancshares, Inc. KS 244,964 NA 4.6 56.3 59.5 7.0 -1.7 3.9 12/21/10 Berkshire Hills Bancorp, Inc. MA Legacy Bancorp, Inc. MA 972,040 NA 112.8 96.3 110.7 NM 1.9 11.6 10/14/10 Chemung Financial Corporation NY Fort Orange Financial Corp. NY 271,121 NA 28.8 127.4 127.4 26.3 3.6 10.6 10/04/10 German American Bancorp, Inc. IN American Community Bancorp, Inc. IN 311,733 NA 30.0 131.4 131.4 25.9 5.8 10.8 09/15/10 First General Bank CA American Premier Bancorp CA 105,815 NA 16.3 107.1 107.1 NM 2.7 15.4 08/24/10 California United Bank CA California Oaks State Bank CA 136,732 NA 17.3 126.4 126.4 NM 0.5 12.6 06/17/10 Industry Bancshares, Inc. TX First National Bank of Shiner TX 115,599 NA 19.2 117.6 121.5 26.2 4.9 16.6 04/19/10 Donegal Financial Services Corp. PA Union National Financial Corporation PA 501,880 NA 25.2 82.6 82.6 NM -0.9 5.5 01/07/10 Chemical Financial Corporation MI O.A.K. Financial Corporation MI 840,095 Stock 77.5 108.6 108.7 NM 1.3 9.2 11/03/09 Bryn Mawr Bank Corporation PA First Keystone Financial, Inc. PA 525,376 NA 32.8 99.9 99.9 NM NA 6.2 06/25/09 United Financial Bancorp, Inc. MA CNB Financial Corp. MA 297,186 NA 24.8 124.2 124.2 NM NA 8.3 04/02/09 First Community Bancshares, Inc. VA TriStone Community Bank NC 152,417 Stock 8.3 58.2 58.2 NM -10.4 5.5 Maximum 112.8 131.4 131.4 50.3 5.8 17.9 PCBP data as of September 30, 2011 Median 23.1 107.9 109.7 26.0 0.8 9.8 Source: SNL Financial Minimum 4.6 56.3 58.2 7.0 -10.4 3.9 14
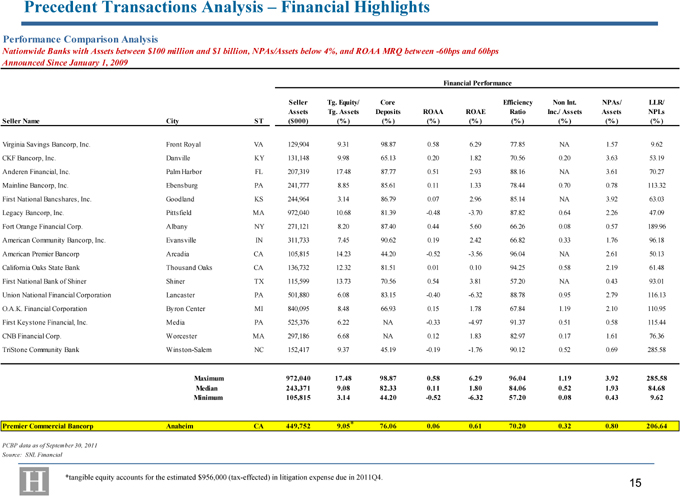
Precedent Transactions Analysis – Financial Highlights Performance Comparison Analysis Nationwide Banks with Assets between $100 million and $1 billion, NPAs/Assets below 4%, and ROAA MRQ between -60bps and 60bps Announced Since January 1, 2009 Financial Performance Seller Tg. Equity/ Core Efficiency Non Int. NPAs/ LLR/ Assets Tg. Assets Deposits ROAA ROAE Ratio Inc./ Assets Assets NPLs Seller Name City ST ($000) (% ) (% ) (% ) (% ) (% ) (% ) (% ) (% ) Virginia Savings Bancorp, Inc. Front Royal VA 129,904 9.31 98.87 0.58 6.29 77.85 NA 1.57 9.62 CKF Bancorp, Inc. Danville KY 131,148 9.98 65.13 0.20 1.82 70.56 0.20 3.63 53.19 Anderen Financial, Inc. Palm Harbor FL 207,319 17.48 87.77 0.51 2.93 88.16 NA 3.61 70.27 Mainline Bancorp, Inc. Ebensburg PA 241,777 8.85 85.61 0.11 1.33 78.44 0.70 0.78 113.32 First National Bancshares, Inc. Goodland KS 244,964 3.14 86.79 0.07 2.96 85.14 NA 3.92 63.03 Legacy Bancorp, Inc. Pittsfield MA 972,040 10.68 81.39 -0.48 -3.70 87.82 0.64 2.26 47.09 Fort Orange Financial Corp. Albany NY 271,121 8.20 87.40 0.44 5.60 66.26 0.08 0.57 189.96 American Community Bancorp, Inc. Evansville IN 311,733 7.45 90.62 0.19 2.42 66.82 0.33 1.76 96.18 American Premier Bancorp Arcadia CA 105,815 14.23 44.20 -0.52 -3.56 96.04 NA 2.61 50.13 California Oaks State Bank Thousand Oaks CA 136,732 12.32 81.51 0.01 0.10 94.25 0.58 2.19 61.48 First National Bank of Shiner Shiner TX 115,599 13.73 70.56 0.54 3.81 57.20 NA 0.43 93.01 Union National Financial Corporation Lancaster PA 501,880 6.08 83.15 -0.40 -6.32 88.78 0.95 2.79 116.13 O.A.K. Financial Corporation Byron Center MI 840,095 8.48 66.93 0.15 1.78 67.84 1.19 2.10 110.95 First Keystone Financial, Inc. Media PA 525,376 6.22 NA -0.33 -4.97 91.37 0.51 0.58 115.44 CNB Financial Corp. Worcester MA 297,186 6.68 NA 0.12 1.83 82.97 0.17 1.61 76.36 TriStone Community Bank Winston-Salem NC 152,417 9.37 45.19 -0.19 -1.76 90.12 0.52 0.69 285.58 Maximum 972,040 17.48 98.87 0.58 6.29 96.04 1.19 3.92 285.58 Median 243,371 9.08 82.33 0.11 1.80 84.06 0.52 1.93 84.68 Minimum 105,815 3.14 44.20 -0.52 -6.32 57.20 0.08 0.43 9.62 Premier Commercial Bancorp Anaheim CA 449,752 9.05* 76.06 0.06 0.61 70.20 0.32 0.80 206.64 PCBP data as of September 30, 2011 Source: SNL Financial *tangible equity accounts for the estimated $956,000 (tax-effected) in litigation expense due in 2011Q4. 15
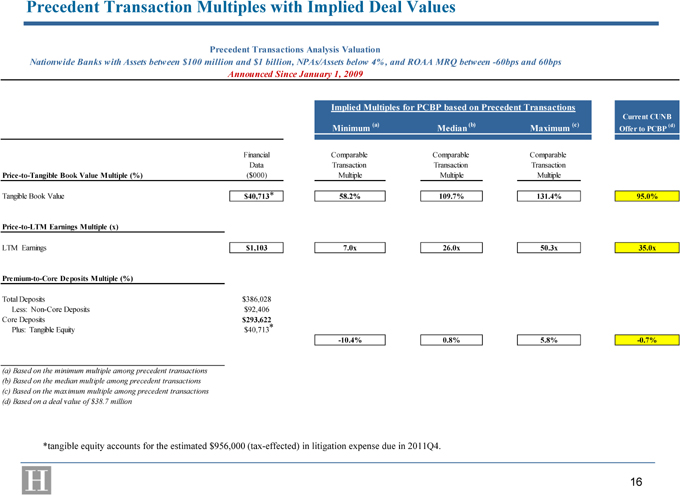
Precedent Transaction Multiples with Implied Deal Values Precedent Transactions Analysis Valuation Nationwide Banks with Assets between $100 million and $1 billion, NPAs/Assets below 4%, and ROAA MRQ between -60bps and 60bps Announced Since January 1, 2009 Implied Multiples for PCBP based on Precedent Transactions Current CUNB Minimum (a) Median (b) Maximum (c) (d) Offer to PCBP Financial Comparable Comparable Comparable Data Transaction Transaction Transaction Price-to-Tangible Book Value Multiple (%) ($000) Multiple Multiple Multiple Tangible Book Value $40,713* 58.2% 109.7% 131.4% 0.00 95.0% $0 $0 $0 Price-to-LTM Earnings Multiple (x) LTM Earnings $1,103 7.0x 26.0x 50.3x 0.00 35.0x $0 $0 $0 Premium-to-Core Deposits Multiple (%) Total Deposits $386,028 #### Less: Non-Core Deposits $92,406 #### Core Deposits $293,622 * $18,504 $18,504 #### Plus: Tangible Equity $40,713 #### -10.4% 0.8% 5.8% -0.7% (a) Based on the minimum multiple among precedent transactions (b) Based on the median multiple among precedent transactions (c) Based on the maximum multiple among precedent transactions (d) Based on a deal value of $38.7 million *tangible equity accounts for the estimated $956,000 (tax-effected) in litigation expense due in 2011Q4. 16

Discounted Cash Flow Analysis 17
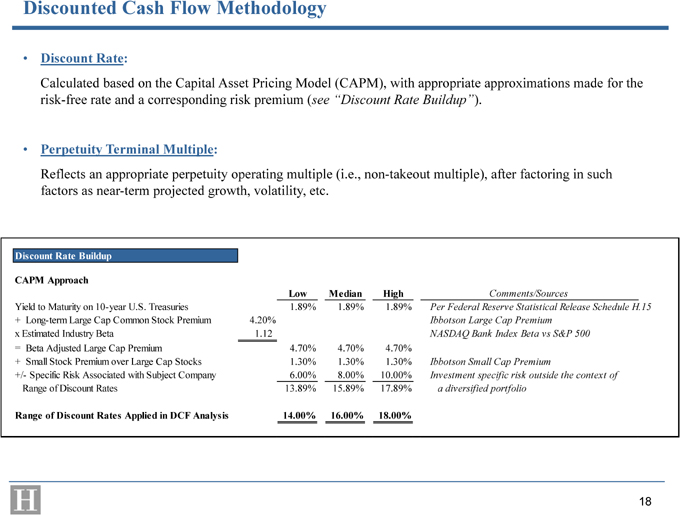
Discounted Cash Flow Methodology • Discount Rate: Calculated based on the Capital Asset Pricing Model (CAPM), with appropriate approximations made for the risk-free rate and a corresponding risk premium (see “Discount Rate Buildup”). • Perpetuity Terminal Multiple: Reflects an appropriate perpetuity operating multiple (i.e., non-takeout multiple), after factoring in such factors as near-term projected growth, volatility, etc. Discount Rate Buildup CAPM Approach Low Median High Comments/Sources Yield to Maturity on 10-year U.S. Treasuries 1.89% 1.89% 1.89% Per Federal Reserve Statistical Release Schedule H.15 + Long-term Large Cap Common Stock Premium 4.20% Ibbotson Large Cap Premium x Estimated Industry Beta 1.12 NASDAQ Bank Index Beta vs S&P 500 = Beta Adjusted Large Cap Premium 4.70% 4.70% 4.70% + Small Stock Premium over Large Cap Stocks 1.30% 1.30% 1.30% Ibbotson Small Cap Premium +/- Specific Risk Associated with Subject Company 6.00% 8.00% 10.00% Investment specific risk outside the context of Range of Discount Rates 13.89% 15.89% 17.89% a diversified portfolio Range of Discount Rates Applied in DCF Analysis 14.00% 16.00% 18.00% 18
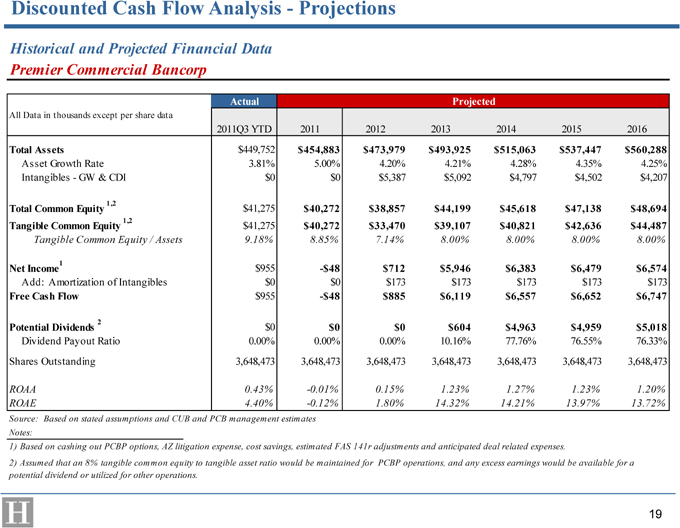
Discounted Cash Flow Analysis—Projections Historical and Projected Financial Data Premier Commercial Bancorp Actual Projected All Data in thousands except per share data 09/30/2011 2011Q3 YTD 2011 2012 2013 2014 2015 2016 Total Assets $449,752 $454,883 $473,979 $493,925 $515,063 $537,447 $560,288 Asset Growth Rate 3.81% 5.00% 4.20% 4.21% 4.28% 4.35% 4.25% Intangibles—GW & CDI $0 $0 $5,387 $5,092 $4,797 $4,502 $4,207 1,2 $41,275 Total Common Equity $40,272 $38,857 $44,199 $45,618 $47,138 $48,694 1,2 $41,275 Tangible Common Equity $40,272 $33,470 $39,107 $40,821 $42,636 $44,487 Tangible Common Equity / Assets 9.18% 8.85% 7.14% 8.00% 8.00% 8.00% 8.00% 1 $955 Net Income -$48 $712 $5,946 $6,383 $6,479 $6,574 Add: Amortization of Intangibles $0 $0 $173 $173 $173 $173 $173 Free Cash Flow $955 -$48 $885 $6,119 $6,557 $6,652 $6,747 2 $0 Potential Dividends $0 $0 $604 $4,963 $4,959 $5,018 Dividend Payout Ratio 0.00% 0.00% 0.00% 10.16% 77.76% 76.55% 76.33% Shares Outstanding 3,648,473 3,648,473 3,648,473 3,648,473 3,648,473 3,648,473 3,648,473 ROAA 0.43% -0.01% 0.15% 1.23% 1.27% 1.23% 1.20% ROAE 4.40% -0.12% 1.80% 14.32% 14.21% 13.97% 13.72% Source: Based on stated assumptions and CUB and PCB management estimates Notes: 1) Based on cashing out PCBP options, AZ litigation expense, cost savings, estimated FAS 141r adjustments and anticipated deal related expenses. 2) Assumed that an 8% tangible common equity to tangible asset ratio would be maintained for PCBP operations, and any excess earnings would be available for a potential dividend or utilized for other operations. 19
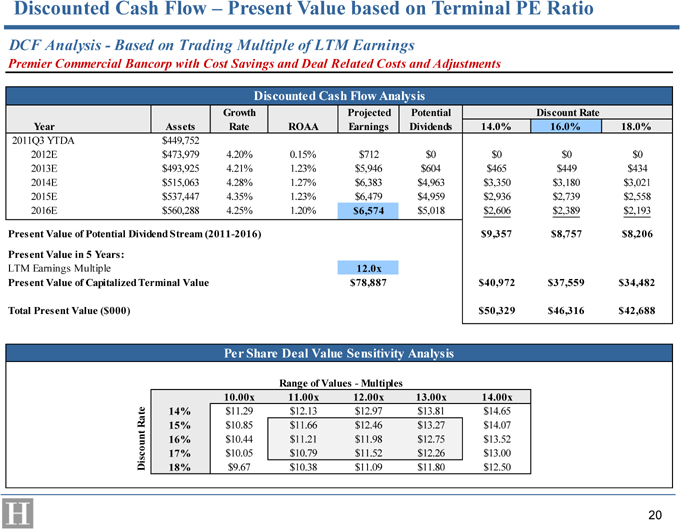
Discounted Cash Flow – Present Value based on Terminal PE Ratio DCF Analysis—Based on Trading Multiple of LTM Earnings Premier Commercial Bancorp with Cost Savings and Deal Related Costs and Adjustments Discounted Cash Flow Analysis Growth Projected Potential Discount Rate Year Assets Rate ROAA Earnings Dividends 14.0% 16.0% 18.0% 2011Q3 YTDA $449,752 2012E $473,979 4.20% 0.15% $712 $0 $0 $0 $0 2013E $493,925 4.21% 1.23% $5,946 $604 $465 $449 $434 2014E $515,063 4.28% 1.27% $6,383 $4,963 $3,350 $3,180 $3,021 2015E $537,447 4.35% 1.23% $6,479 $4,959 $2,936 $2,739 $2,558 2016E $560,288 4.25% 1.20% $6,574 $5,018 $2,606 $2,389 $2,193 Present Value of Potential Dividend Stream (2011-2016) $9,357 $8,757 $8,206 Present Value in 5 Years: LTM Earnings Multiple 12.0x Present Value of Capitalized Terminal Value $78,887 $40,972 $37,559 $34,482 Total Present Value ($000) $50,329 $46,316 $42,688 Per Share Deal Value Sensitivity Analysis Range of Values—Multiples $11.98 10.00x 11.00x 12.00x 13.00x 14.00x Rate 14% $11.29 $12.13 $12.97 $13.81 $14.65 15% $10.85 $11.66 $12.46 $13.27 $14.07 ount 16% $10.44 $11.21 $11.98 $12.75 $13.52 17% $10.05 $10.79 $11.52 $12.26 $13.00 Disc 18% $9.67 $10.38 $11.09 $11.80 $12.50 20

Public Peer Analysis 21
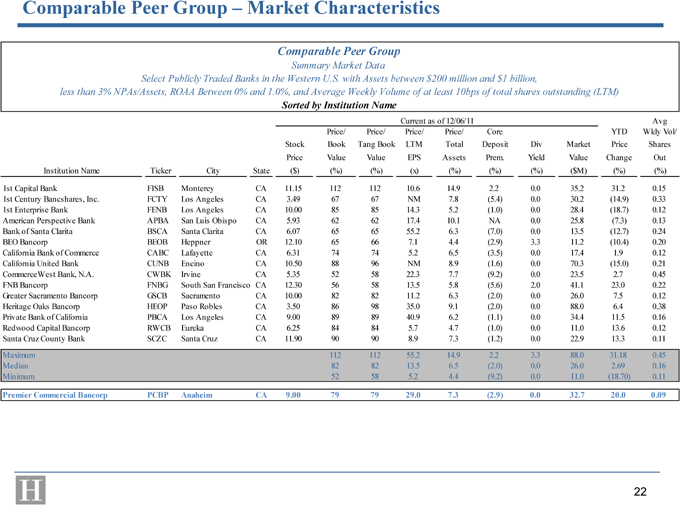
Comparable Peer Group – Market Characteristics Comparable Peer Group Summary Market Data Select Publicly Traded Banks in the Western U.S. with Assets between $200 million and $1 billion, less than 3% NPAs/Assets, ROAA Between 0% and 1.0%, and Average Weekly Volume of at least 10bps of total shares outstanding (LTM) Sorted by Institution Name Current as of 12/06/11 Avg Price/ Price/ Price/ Price/ Core YTD Wkly Vol/ Stock Book Tang Book LTM Total Deposit Div Market Price Shares Price Value Value EPS Assets Prem. Yield Value Change Out Institution Name Ticker City State ($) (%) (%) (x) (%) (%) (%) ($M) (%) (%) 1st Capital Bank FISB Monterey CA 11.15 112 112 10.6 14.9 2.2 0.0 35.2 31.2 0.15 1st Century Bancshares, Inc. FCTY Los Angeles CA 3.49 67 67 NM 7.8 (5.4) 0.0 30.2 (14.9) 0.33 1st Enterprise Bank FENB Los Angeles CA 10.00 85 85 14.3 5.2 (1.0) 0.0 28.4 (18.7) 0.12 American Perspective Bank APBA San Luis Obispo CA 5.93 62 62 17.4 10.1 NA 0.0 25.8 (7.3) 0.13 Bank of Santa Clarita BSCA Santa Clarita CA 6.07 65 65 55.2 6.3 (7.0) 0.0 13.5 (12.7) 0.24 BEO Bancorp BEOB Heppner OR 12.10 65 66 7.1 4.4 (2.9) 3.3 11.2 (10.4) 0.20 California Bank of Commerce CABC Lafayette CA 6.31 74 74 5.2 6.5 (3.5) 0.0 17.4 1.9 0.12 California United Bank CUNB Encino CA 10.50 88 96 NM 8.9 (1.6) 0.0 70.3 (15.0) 0.21 CommerceWest Bank, N.A. CWBK Irvine CA 5.35 52 58 22.3 7.7 (9.2) 0.0 23.5 2.7 0.45 FNB Bancorp FNBG South San Francisco CA 12.30 56 58 13.5 5.8 (5.6) 2.0 41.1 23.0 0.22 Greater Sacramento Bancorp GSCB Sacramento CA 10.00 82 82 11.2 6.3 (2.0) 0.0 26.0 7.5 0.12 Heritage Oaks Bancorp HEOP Paso Robles CA 3.50 86 98 35.0 9.1 (2.0) 0.0 88.0 6.4 0.38 Private Bank of California PBCA Los Angeles CA 9.00 89 89 40.9 6.2 (1.1) 0.0 34.4 11.5 0.16 Redwood Capital Bancorp RWCB Eureka CA 6.25 84 84 5.7 4.7 (1.0) 0.0 11.0 13.6 0.12 Santa Cruz County Bank SCZC Santa Cruz CA 11.90 90 90 8.9 7.3 (1.2) 0.0 22.9 13.3 0.11 Maximum 112 112 55.2 14.9 2.2 3.3 88.0 31.18 0.45 Median 82 82 13.5 6.5 (2.0) 0.0 26.0 2.69 0.16 Minimum 52 58 5.2 4.4 (9.2) 0.0 11.0 (18.70) 0.11 Premier Commercial Bancorp PCBP Anaheim CA 9.00 79 79 29.0 7.3 (2.9) 0.0 32.7 20.0 0.09 22
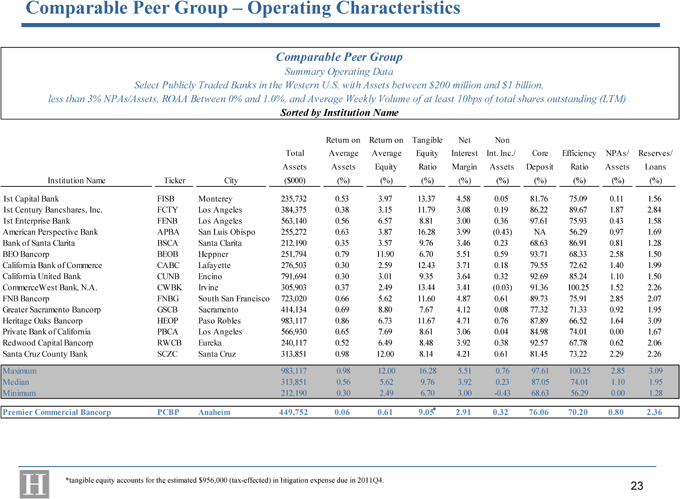
Comparable Peer Group – Operating Characteristics Comparable Peer Group Summary Operating Data Select Publicly Traded Banks in the Western U.S. with Assets between $200 million and $1 billion, less than 3% NPAs/Assets, ROAA Between 0% and 1.0%, and Average Weekly Volume of at least 10bps of total shares outstanding (LTM) Sorted by Institution Name Return on Return on Tangible Net Non Total Average Average Equity Interest Int. Inc./ Core Efficiency NPAs/ Reserves/ Assets Assets Equity Ratio Margin Assets Deposit Ratio Assets Loans Institution Name Ticker City ($000) (%) (%) (%) (%) (%) (%) (%) (%) (%) 1st Capital Bank FISB Monterey 235,732 0.53 3.97 13.37 4.58 0.05 81.76 75.09 0.11 1.56 1st Century Bancshares, Inc. FCTY Los Angeles 384,375 0.38 3.15 11.79 3.08 0.19 86.22 89.67 1.87 2.84 1st Enterprise Bank FENB Los Angeles 563,140 0.56 6.57 8.81 3.00 0.36 97.61 75.93 0.43 1.58 American Perspective Bank APBA San Luis Obispo 255,272 0.63 3.87 16.28 3.99 (0.43) NA 56.29 0.97 1.69 Bank of Santa Clarita BSCA Santa Clarita 212,190 0.35 3.57 9.76 3.46 0.23 68.63 86.91 0.81 1.28 BEO Bancorp BEOB Heppner 251,794 0.79 11.90 6.70 5.51 0.59 93.71 68.33 2.58 1.50 California Bank of Commerce CABC Lafayette 276,503 0.30 2.59 12.43 3.71 0.18 79.55 72.62 1.40 1.99 California United Bank CUNB Encino 791,694 0.30 3.01 9.35 3.64 0.32 92.69 85.24 1.10 1.50 CommerceWest Bank, N.A. CWBK Irvine 305,903 0.37 2.49 13.44 3.41 (0.03) 91.36 100.25 1.52 2.26 FNB Bancorp FNBG South San Francisco 723,020 0.66 5.62 11.60 4.87 0.61 89.73 75.91 2.85 2.07 Greater Sacramento Bancorp GSCB Sacramento 414,134 0.69 8.80 7.67 4.12 0.08 77.32 71.33 0.92 1.95 Heritage Oaks Bancorp HEOP Paso Robles 983,117 0.86 6.73 11.67 4.71 0.76 87.89 66.52 1.64 3.09 Private Bank of California PBCA Los Angeles 566,930 0.65 7.69 8.61 3.06 0.04 84.98 74.01 0.00 1.67 Redwood Capital Bancorp RWCB Eureka 240,117 0.52 6.49 8.48 3.92 0.38 92.57 67.78 0.62 2.06 Santa Cruz County Bank SCZC Santa Cruz 313,851 0.98 12.00 8.14 4.21 0.61 81.45 73.22 2.29 2.26 0.06 0.61 9.05 2.91 76.06 70.20 0.80 2.36 Maximum 983,117 0.98 12.00 16.28 5.51 0.76 97.61 100.25 2.85 3.09 Median 313,851 0.56 5.62 9.76 3.92 0.23 87.05 74.01 1.10 1.95 Minimum 212,190 0.30 2.49 6.70 3.00 -0.43 68.63 56.29 0.00 1.28 Premier Commercial Bancorp PCBP Anaheim 449,752 0.06 0.61 9.05* 2.91 0.32 76.06 70.20 0.80 2.36 *tangible equity accounts for the estimated $956,000 (tax-effected) in litigation expense due in 2011Q4. 23
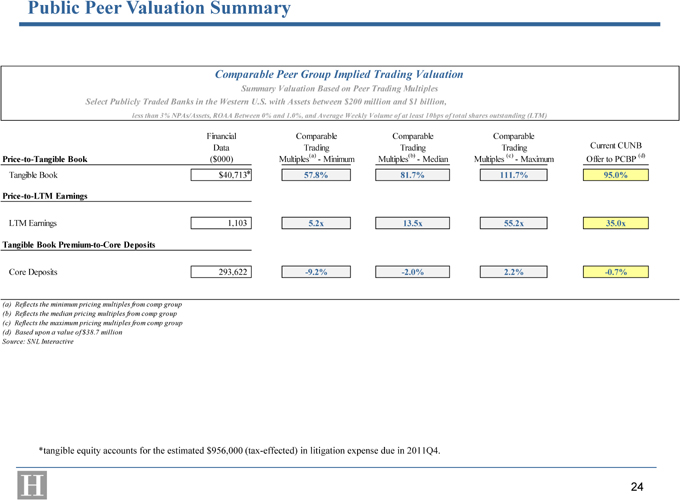
Public Peer Valuation Summary Comparable Peer Group Implied Trading Valuation Summary Valuation Based on Peer Trading Multiples Select Publicly Traded Banks in the Western U.S. with Assets between $200 million and $1 billion, less than 3% NPAs/Assets, ROAA Between 0% and 1.0%, and Average Weekly Volume of at least 10bps of total shares outstanding (LTM) Financial Comparable Comparable Comparable Data Trading Trading Trading Current CUNB Price-to-Tangible Book ($000) Multiples(a)—Minimum Multiples(b)—Median Multiples (c)—Maximum Offer to PCBP (d) Tangible Book $40,713* 57.8% 81.7% 111.7% 95.0% Price-to-LTM Earnings LTM Earnings 1,103 5.2x 13.5x 55.2x 35.0x Tangible Book Premium-to-Core Deposits Core Deposits 293,622 -9.2% -2.0% 2.2% -0.7% (a) Reflects the minimum pricing multiples from comp group (b) Reflects the median pricing multiples from comp group (c) Reflects the maximum pricing multiples from comp group (d) Based upon a value of $38.7 million Source: SNL Interactive *tangible equity accounts for the estimated $956,000 (tax-effected) in litigation expense due in 2011Q4. 24
Contribution Analysis 25
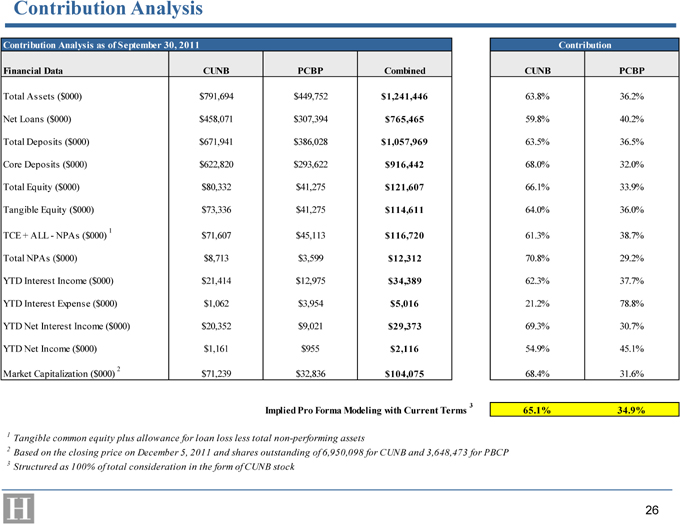
Contribution Analysis Contribution Analysis as of September 30, 2011 Contribution Financial Data CUNB PCBP Combined CUNB PCBP Total Assets ($000) $791,694 $449,752 $1,241,446 63.8% 36.2% Net Loans ($000) $458,071 $307,394 $765,465 59.8% 40.2% Total Deposits ($000) $671,941 $386,028 $1,057,969 63.5% 36.5% Core Deposits ($000) $622,820 $293,622 $916,442 68.0% 32.0% Total Equity ($000) $80,332 $41,275 $121,607 66.1% 33.9% Tangible Equity ($000) $73,336 $41,275 $114,611 64.0% 36.0% 1 TCE + ALL—NPAs ($000) $71,607 $45,113 $116,720 61.3% 38.7% Total NPAs ($000) $8,713 $3,599 $12,312 70.8% 29.2% YTD Interest Income ($000) $21,414 $12,975 $34,389 62.3% 37.7% YTD Interest Expense ($000) $1,062 $3,954 $5,016 21.2% 78.8% YTD Net Interest Income ($000) $20,352 $9,021 $29,373 69.3% 30.7% YTD Net Income ($000) $1,161 $955 $2,116 54.9% 45.1% 2 Market Capitalization ($000) $71,239 $32,836 $104,075 68.4% 31.6% 3 Implied Pro Forma Modeling with Current Terms 65.1% 34.9% 1 Tangible common equity plus allowance for loan loss less total non-performing assets 2 Based on the closing price on December 5, 2011 and shares outstanding of 6,950,098 for CUNB and 3,648,473 for PBCP 3 Structured as 100% of total consideration in the form of CUNB stock 26
Pro Forma Accretion/Dilution Analysis 27
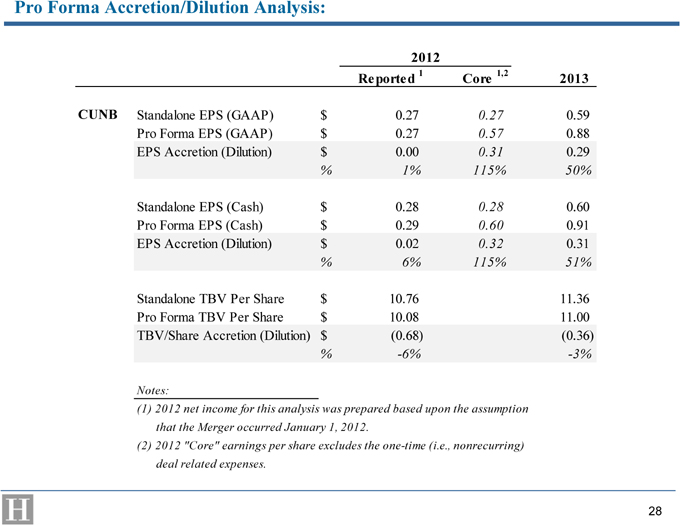
Pro Forma Accretion/Dilution Analysis: 2012 Reported 1 Core 1,2 2013 CUNB Standalone EPS (GAAP) $ 0.27 0.27 0.59 Pro Forma EPS (GAAP) $ 0.27 0.57 0.88 EPS Accretion (Dilution) $ 0.00 0.31 0.29 % 1% 115% 50% Standalone EPS (Cash) $ 0.28 0.28 0.60 Pro Forma EPS (Cash) $ 0.29 0.60 0.91 EPS Accretion (Dilution) $ 0.02 0.32 0.31 % 6% 115% 51% Standalone TBV Per Share $ 10.76 11.36 Pro Forma TBV Per Share $ 10.08 11.00 TBV/Share Accretion (Dilution) $ (0.68) (0.36) % -6% -3% Notes: (1) 2012 net income for this analysis was prepared based upon the assumption that the Merger occurred January 1, 2012. (2) 2012 “Core” earnings per share excludes the one-time (i.e., nonrecurring) deal related expenses. 28
III. Copy of Hovde’s Fairness Opinion Letter 29

DRAFT
December 8, 2011
Board of Directors
California United Bank
15821 Ventura Boulevard, Suite 100
Encino, California 91436
Dear Members of the Board:
We understand that CU Bancorp, a California corporation (“CU Bancorp”), California United Bank, a California state-chartered commercial bank (“CUB”), Premier Commercial Bancorp, a California corporation (“PC Bancorp”), and Premier Commercial Bank, N.A., a national banking association and the wholly-owned subsidiary of PC Bancorp (“PCB”), are about to enter into an Agreement and Plan of Merger, to be dated on or about December 8, 2011 (the “Agreement”), pursuant to which CU Bancorp will acquire all of the issued and outstanding shares of PC Bancorp common stock, no par value (the “PC Bancorp Common Stock”), in exchange for shares of the no par value common stock of CU Bancorp (the “CU Bancorp Common Stock”) through the merger of a wholly-owned subsidiary of CU Bancorp (“CU Merger Sub”) with and into PC Bancorp (the “Merger”), with PC Bancorp surviving the Merger (the “Surviving Corporation”).
We understand from the Agreement that immediately prior to the Merger, CU Bancorp and CUB will reorganize pursuant to which CU Bancorp will become the bank holding company for CUB through the merger of CUB with and into a wholly-owned subsidiary of CU Bancorp formed specifically to facilitate this transaction (the “Bank Holding Company Formation”). Further, after the consummation of the Bank Holding Company Formation and the Merger and subject to the terms and conditions of the Agreement, the Surviving Corporation will merge with and into CU Bancorp (the “Bank Holding Company Merger”) with CU Bancorp surviving the Bank Holding Company Merger (the “Surviving Bank Holding Company”). Additionally, after the consummation of the Bank Holding Company Formation, the Merger and the Bank Holding Company Merger and subject to the terms and conditions of this Agreement, PCB will be merged with and into CUB (the “Bank Merger”) with CUB surviving the Bank Merger and continuing operations under its California banking charter and as the wholly-owned bank subsidiary of the Surviving Bank Holding Company (the “Surviving Bank”).
Pursuant and subject to the terms and conditions of the Agreement, and, except as otherwise set forth therein, at the Effective Time (as defined in the Agreement): (a) CU Bancorp will cause CU Merger Sub to merge with and into PC Bancorp, with PC Bancorp as the Surviving Corporation; and (b) the separate existence of CU Merger Sub shall cease and all of the rights, privileges, powers, franchises, properties, assets, liabilities and obligations of CU Merger Sub shall be vested in and assumed by the Surviving Corporation.
www.thehovdegroup.com | 106 E. 6th Street, Suite 725 Austin, TX 78701 Phone 512.478.7575 Fax 512.628.3226 | 1629 Colonial Pkwy. Inverness, IL 60067 Phone 847.991.6622 Fax 847.991.5928 | 8370 Wilshire Blvd., Suite 340 Beverly Hills, CA 90211 Phone 310.535.9200 Fax 310.535.9203 | 777 S. Flagler Drive, Suite 800 West Palm Beach, FL 33401 Phone 561.279.7199 Fax 561.278.5856 |
Board of Directors
California United Bank
Page 2 of 6
Except as may be adjusted pursuant to the provisions of Section 3.1.2 of the Agreement, the holders of PC Bancorp Common Stock (other than holders of Excluded Shares and Dissenting Shares) shall be entitled to receive as aggregate consideration, in exchange for all shares of PC Bancorp Common Stock outstanding immediately prior to the Effective Time (excluding Excluded Shares and Dissenting Shares but including shares issued upon exercise of PC Bancorp Options as permitted pursuant to Section 3.3 of the Agreement and shares issued in connection with a stock dividend, if any, as permitted by Section 6.1.2(B) of the Agreement), the number of shares of CU Bancorp Common Stock equal to the difference of (i) 3,721,442; minus (ii) the sum of (A) Excluded Shares; and (B) Dissenting Shares (the “Stock Consideration”).
We note that Section 3.1.2 of the Agreement provides for a possible adjustment of the Stock Consideration (the “Adjusted Stock Consideration”) in the event the Closing Price and the Announcement Price (as these terms are defined in Section 3.1.4 of the Agreement) deviate from one another by more than 10% and less than or equal to 25% as follows:
(A)In the event the Closing Price is more than 110% of the Announcement Price, then the Adjusted Stock Consideration shall be:
The product of (i) Stock Consideration, (ii) Announcement Price, and (iii) 110%;
divided by the Closing Price
(B)In the event the Closing Price is less than 90% of the Announcement Price, then the Adjusted Stock Consideration shall be:
The product of (i) Stock Consideration, (ii) Announcement Price, and (iii) 90%;
divided by the Closing Price.
(C)In the event the Closing Price more than 125% of the Announcement Price or the Closing Price is less than 75% of the Announcement Price, then CU Bancorp and CUB shall have the right, in their sole discretion, to terminate the Agreement pursuant to Section 11.1.10 thereof and PC Bancorp and PCB shall have the right, in their sole discretion, to terminate the Agreement pursuant to Section 11.1.11 thereof.
(D)In the event the Closing Price is more than 125% of the Announcement Price or the Closing Price is less than 75% of the Announcement Price and neither CU Bancorp and CUB nor PC Bancorp and PCB exercise their right to terminate the Agreement, the Adjusted Stock Consideration shall be determined under the formula above as if the Closing Price was 125% of the Announcement Price, or 75% of the Closing Price, as applicable.
Board of Directors
California United Bank
Page 3 of 6
Pursuant to the terms of the Agreement, and except as otherwise set forth therein, at the Closing, each share of PC Bancorp Common Stock outstanding immediately prior to the Effective Time (other than Excluded Shares and Dissenting Shares) shall be converted into the right to receive the number of shares of CU Bancorp Common Stock (the “Per Share Stock Consideration”) determined by dividing (i) either the Stock Consideration or the Adjusted Stock Consideration (as such terms are defined in the Agreement), as applicable; by (ii) the shares of PC Bancorp Common Stock outstanding immediately prior to the Effective Time including without limitation, Dissenting Shares (other than Excluded Shares). The Stock Consideration or the Adjusted Stock Consideration, as applicable, multiplied by the Closing Price (as defined in the Agreement) is referred to in the Agreement as the “Merger Consideration.”
As of the date of this opinion, and based on the current estimated PC Bancorp shares outstanding of 3,648,473, the Per Share Stock Consideration, expressed as a ratio, is 1.02 shares of CUB common stock for each share of PC Bancorp.
Assuming the Closing Price is equivalent to CUB’s closing price of $10.25 per share on December 5, 2011, PC Bancorp shareholders (in the aggregate) will have the right to receive 3,721,442 shares of CUB common stock, at $10.25 per share, or an equivalent value of $38.1 million in Merger Consideration (or $10.45 per share of PC Bancorp common stock). We have also assumed for purposes of this opinion that the estimated in-the-money value of PC Bancorp’s options outstanding at closing is $507,767, and will be paid in cash to PC Bancorp option holders.
We note that the changes in the Closing Price within an agreed range around the Announcement Price will cause the aggregate total Merger Consideration to vary from a low of approximately $34,330,302 to a high of approximately $41,959,259 as of the closing date. Since the Closing Price, as described in the Agreement, and related amounts derived from those figures cannot be determined until dates after the date of this opinion, potential future adjustments in the Merger Consideration attributable to adjustments in the Closing Price beyond the given ranges above, if any, have not been accounted for in this fairness opinion. Our opinion assumes that the Closing Price will be equal to or greater than $7.69 per share, and less than or equal to $12.81 per share, and that the Merger Consideration will be not less than $34,330,302 and not more than $41,959,259 as of the closing date.
For purposes of the opinion, we have therefore assumed that CUB will issue 1.020 shares of CUB common stock for each share of PC Bancorp common stock, for total Merger Consideration of not less than $34,330,302 and not more than $41,959,259.
The description of the Merger, Stock Consideration, Adjusted Stock Consideration, Per Share Stock Consideration, Exchange Ratio, Merger Consideration are qualified in their entirety by reference to the Agreement. Capitalized terms used herein that are not otherwise defined shall have the same meaning attributed to them in the Agreement. In connection therewith, you have requested our opinion as to whether the Merger Consideration to be paid in connection with the Merger is fair to the shareholders of the CUB from a financial point of view.
Board of Directors
California United Bank
Page 4 of 6
Hovde Financial, Inc. (“Hovde”), as part of its investment banking business, regularly performs valuations of businesses and their securities in connection with mergers and acquisitions and other corporate transactions. In addition to being retained to render this opinion letter, we were retained by CUB to act as its financial advisor in connection with the Merger.
We will receive compensation from CUB in connection with our services, which may include, without limitation, a fairness opinion fee that is contingent upon the issuance of this opinion letter and a completion fee that is contingent upon the consummation of the Merger. Additionally, we, or our affiliates have received compensation in the past, and may receive compensation from CUB in the future, in connection with certain other advisory services, which may include, without limitation, an initial fee for providing general financial advisory services, a fairness opinion fee that is contingent upon the issuance of other opinion letters and a completion fee that is contingent upon the consummation of other corporate transactions. Further, CUB has agreed to indemnify us and our affiliates for certain liabilities that may arise out of our engagements. Except for the foregoing, during the past two years there have not been, and there are no mutual understandings contemplating in the future, any material relationships between Hovde and its affiliates and CUB.
During the course of our engagement and for the purposes of the opinion set forth herein, we have:
| (i) | reviewed the Agreement; |
| (ii) | reviewed certain historical publicly available business and financial information concerning CUB, PC Bancorp and PCB; |
| (iii) | reviewed certain internal financial statements and other financial and operating data concerning CUB, PC Bancorp and PCB; |
| (iv) | analyzed financial projections prepared by certain members of CUB’s and PC Bancorp’s senior management; |
| (v) | discussed with certain members of CUB’s and PC Bancorp’s senior management, the business, financial condition, results of operations and future prospects of CUB and PC Bancorp; |
| (vi) | evaluated the pro forma ownership of CUB’s Common Stock by the holders of PC Bancorp’s Common Stock relative to thepro forma contribution of PC Bancorp’s assets, liabilities, equity and earnings to the combined company; |
| (vii) | reviewed the terms of recent merger, acquisition and control investment transactions, to the extent publicly available, involving financial institutions and financial institution holding companies that we considered relevant; |
Board of Directors
California United Bank
Page 5 of 6
| (viii) | analyzed the pro forma impact of the Merger on the combined company’s earnings per share, consolidated capitalization and financial ratios; |
| (ix) | assessed the general economic, market and financial conditions; |
| (x) | taken into consideration our experience in other similar transactions and securities valuations as well as our knowledge of the financial services industry; and |
| (xi) | performed such other analyses and considered such other factors as we have deemed appropriate. |
We have assumed, without independent verification, that the representations and financial and other information provided to us by the parties to the Agreement, which has formed a substantial basis for this opinion, are true and complete. In that regard, we have assumed that the financial forecasts, including, without limitation, the projections regarding under-performing and non-performing assets, loan loss reserves and net charge-offs, have been reasonably prepared by CUB and PC Bancorp on a basis reflecting the best currently available information and CUB’s and PC Bancorp’s judgments and estimates. Further, we have assumed that such forecasts would be realized in the amounts and at the times contemplated thereby.
We are not experts in the evaluation of loan and lease portfolios for purposes of assessing the adequacy of the allowances for losses with respect thereto. We have assumed that such allowances for CUB and PC Bancorp are in the aggregate adequate to cover such losses. We were not retained to, and did not conduct, a physical inspection of any of the properties or facilities of CUB or PC Bancorp. In addition, we have not reviewed individual credit files nor have we made an independent evaluation or appraisal of the assets and liabilities of CUB or PC Bancorp.
We have assumed that the Merger will be consummated substantially in accordance with the terms set forth in the Agreement. We have assumed that the Merger is, and will be, in compliance with all laws and regulations that are applicable to the parties to the Agreement.CUB has advised us that there are no factors that would impede any necessary regulatory or governmental approval of the Merger. Further, we have assumed that, in the course of obtaining the necessary regulatory and governmental approvals, no restrictions will be imposed on the parties to the Agreement that would have a material adverse effect on the contemplated benefits of the Merger. We have also assumed that there would be no change in applicable law or regulation that would cause a material adverse change in the prospects or operations of the combined company after the Merger.
Our opinion is based solely upon the information available to us and the economic, market and other circumstances as they exist as of the date hereof. Events occurring and information that becomes available after the date hereof could materially affect the assumptions and analyses used in preparing this opinion. We have not undertaken to reaffirm or revise this opinion or otherwise comment upon any events occurring or information that becomes available after the date hereof, except as otherwise agreed upon in our engagement letter.
Board of Directors
California United Bank
Page 6 of 6
Our opinion does not constitute a recommendation to CUB or PC Bancorp as to whether or not CUB or PC Bancorp should enter into the Agreement or to any shareholder of CUB or PC Bancorp as to how such shareholder should vote at any meeting of shareholders called to consider and vote upon the Agreement. Further, our opinion neither addresses the underlying business decision to proceed with the Merger nor the fairness of the amount or nature of the compensation to be received by any of CUB’s, PC Bancorp’s or PCB’s officers, directors or employees, or class of such persons, relative to the Merger Consideration to be paid with respect to the Merger. Our opinion should not be construed as implying that the Merger Consideration is necessarily the best price that could be obtained in the Merger. Other than as specifically set forth herein, we are not expressing any opinion with respect to the terms and provisions of the Agreement and/or the enforceability of any such terms or provisions. This opinion was approved by Hovde’s fairness committee.
This letter is directed solely to the board of directors of CUB and is not to be used for any other purpose or quoted or referred to, in whole or in part, in any registration statement, prospectus, proxy statement or any other document, except in each case in accordance with our prior written consent; provided, however, that we hereby consent to the inclusion and reference to this letter in any registration statement, proxy statement, information statement or tender offer document to be delivered to the holders of CUB’s common stock in connection with the Merger if and only if this letter is quoted in full or attached as an exhibit to such document and this letter has not been withdrawn prior to the date of such document.
Based upon and subject to the foregoing, we are of the opinion, as of the date hereof, that the Merger Consideration to be paid in connection with the Merger is fair to the shareholders of CUB from a financial point of view.
| Sincerely, | ||
 | ||
| HOVDE FINANCIAL, INC. | ||

December 7, 2011
Board of Directors
Premier Commercial Bancorp
2400 E. Katella Avenue, Suite 200
Anaheim, California 92806
Members of the Board:
You have requested our opinion as to the fairness, from a financial point of view, to the holders of the outstanding shares of common stock of Premier Commercial Bancorp, Anaheim, California (“PC Bancorp”) of the consideration to be received by PC Bancorp in the merger (the “Merger”) of PC Bancorp and CU Bancorp, Encino, California (“CU Bancorp”) the to be formed holding company for California United Bank (“CUB”) pursuant to the Agreement and Plan of Merger by and between CU Bancorp, CUB, PC Bancorp and Premier Commercial Bank, the wholly-owned subsidiary of PC Bancorp (the “Merger Agreement”).
Pursuant to the terms of the Merger Agreement, the holders of PC Bancorp common stock (other than holders of Excluded Shares and Dissenting Shares) shall be entitled to receive as aggregate consideration in the form of shares of CU Bancorp common stock for all shares of PC Bancorp common stock outstanding immediately prior to the Effective Time the difference of (i) 3,721,442; minus (ii) the sum of Excluded Shares; and Dissenting Shares (the “Stock Consideration”). The Stock Consideration shall be adjusted, if at all, in the event the Closing Price and the Announcement Price deviate from one another by more than 10% and less than or equal to 25%, as defined in Section 3.1.2 of the Merger Agreement. All capitalized items used in this paragraph shall have the meanings ascribed to them in the Merger Agreement. The terms of the Merger are more fully set forth in the Merger Agreement.
Based on the issuance of 3,721,442 shares of CU Bancorp common stock and a closing price of $10.25 for CUB common stock, PC Bancorp will receive Merger consideration of $38,144,780.
For purposes of this opinion and in connection with our review of the proposed transaction, we have, among other things:
| 1. | Reviewed the terms of the draft of the Merger Agreement dated December 5, 2011; |
Vining-Sparks Community Bank Advisory Group
1601 W. 38th Street • Suite 207 • Austin, Texas 78731
(512) 495-9890 • Fax (512) 495-9894
Member FINRA/SIPC
Board of Directors
Premier Commercial Bancorp
December 7, 2011
Page 2
| 2. | Reviewed certain publicly available financial statements, both audited (where available) and un-audited, and related financial information of PC Bancorp and CUB, including those included in their respective annual reports for the past three years and their respective quarterly reports for the past two years; |
| 3. | Reviewed certain internal financial information and financial forecasts relating to the business, earnings, cash flows, assets and prospects of each company furnished to us by PC Bancorp and CUB management; |
| 4. | Held discussions with members of executive and senior management of PC Bancorp and CUB concerning the past and current results of operations of PC Bancorp and CUB, their respective current financial condition and managements’ opinion of their respective future prospects; |
| 5. | Reviewed reported market prices and historical trading activity of PC Bancorp and CUB common stock; |
| 6. | Compared the proposed financial terms of the Merger with the financial terms of certain other transactions that we deemed to be relevant; |
| 7. | Reviewed the potential pro forma impact of the Merger; and |
| 8. | Performed such other financial studies, analyses and investigations, as we considered appropriate under the circumstances. |
In giving our opinion, we have assumed and relied, without independent verification, upon the accuracy and completeness of all of the financial and other information that has been provided to us by PC Bancorp and CUB, and their respective representatives, and of the publicly available information that was reviewed by us. We are not experts in the evaluation of allowances for loan losses and have not independently verified such allowances, and have relied on and assumed that the aggregate allowance for loan losses set forth in the balance sheets of PC Bancorp and CUB at September 30, 2011 was adequate to cover such losses and complied fully with applicable law, regulatory policy and sound banking practice as of the date of such financial statements. We were not retained to and we did not conduct a physical inspection of any of the properties or facilities of PC Bancorp or CUB, did not make any independent evaluation or appraisal of the assets, liabilities or prospects of PC Bancorp or CUB, were not furnished with any such evaluation or appraisal, and did not review any individual credit files. Our opinion is necessarily based on economic, market, and other conditions as in effect on, and the information made available to us as of, the date hereof. Accordingly, it is important to understand that although
Board of Directors
Premier Commercial Bancorp
December 7, 2011
Page 3
subsequent developments may affect its opinion, we do not have any obligation to further update, revise, or reaffirm its opinion. We express no opinion on matters of a legal, regulatory, tax or accounting nature or the ability of the Merger, as set forth in the Merger Agreement, to be consummated. No opinion is expressed as to whether any alternative transaction might be more favorable to holders of PC Bancorp’s common stock than the Merger.
Vining Sparks IBG, L.P. (“Vining Sparks”), as part of its investment banking business, is regularly engaged in the valuation of banks and bank holding companies, thrifts and thrift holding companies, and various other financial services companies, in connection with mergers and acquisitions and valuations for other purposes. In rendering this fairness opinion, we have acted on behalf of the Board of Directors of PC Bancorp and will receive a fee for our services, which is payable upon delivery of this opinion.
Vining Sparks’ opinion as expressed herein is limited to the fairness, from a financial point of view, of the Merger Consideration to be received by the holders of PC Bancorp common stock in the Merger and does not address PC Bancorp’s underlying business decision to proceed with the Merger. We have been retained on behalf of the Board of Directors of PC Bancorp, and our opinion does not constitute a recommendation to any director of PC Bancorp as to how such director should vote with respect to the Agreement. In rendering this opinion, we express no opinions with respect to the amount or nature of any compensation to any officers, directors, or employees of PC Bancorp or CUB, or any class of such persons relative to the consideration to be received by the holders of the common stock of PC Bancorp in the transaction or with respect to the fairness of any such compensation.
In the two years prior to the issuance of this opinion, Vining Sparks engaged in securities and loan sales and trading activity with CUB and PC Bancorp and/or its subsidiary bank for which Vining Sparks was paid commissions or other fees, which may include mark-ups on the purchase or sale of loans and securities.
Except as hereinafter provided, this opinion may not be disclosed, communicated, reproduced, disseminated, quoted or referred to at any time, to any third party or in any manner or for any purpose whatsoever without our prior written consent, which consent will not be unreasonably withheld, based upon review by us of the content of any such public reference, which shall be satisfactory to us in our reasonable judgment. This letter is addressed and directed to the Board of Directors of PC Bancorp in your consideration of the Merger and is not intended to be and does not constitute a recommendation to any shareholder as to how such shareholder should vote with respect to the Merger. The opinion herein expressed is intended solely for the benefit of the Board of Directors in connection with the matters addressed herein and may not be relied upon by any other person or entity, or for any other purpose without our written consent. This opinion was approved by the fairness opinion committee of Vining Sparks.
Board of Directors
Premier Commercial Bancorp
December 7, 2011
Page 4
Subject to the foregoing and based on our experience as investment bankers, our activities as described above, and other factors we have deemed relevant, we are of the opinion as of the date hereof that the Merger Consideration to be received by the holders of PC Bancorp common stock is fair to the holders of PC Bancorp common stock, from a financial point of view.
| Sincerely, |
 |
| VINING SPARKS IBG, L.P. |
PREMIER COMMERCIAL BANCORP
ANAHEIM, CALIFORNIA
Documentation Report Relating to the
Fairness of the Proposed Merger of
Premier Commercial Bancorp, Anaheim, California
With and Into
California United Bank, Encino, California
[Graphic Appears Here]
Table of Contents
Section
Discussion
1
Financial Projections – California United Bank
2
Financial Projections – Premier Commercial Bancorp
3
Pro Forma Financial Projections
4
Stock Trading History
5
Historical Financial Analysis
6
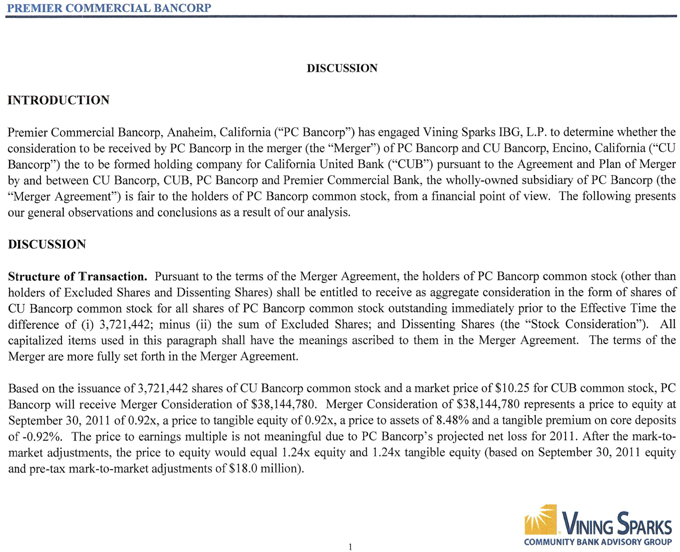
PREMIER COMMERCIAL BANCORP
DISCUSSION
INTRODUCTION
Premier Commercial Bancorp, Anaheim, California (“PC Bancorp”) has engaged Vining Sparks IBG, L.P. to determine whether the consideration to be received by PC Bancorp in the merger (the “Merger”) of PC Bancorp and CU Bancorp, Encino, California (“CU Bancorp”) the to be formed holding company for California United Bank (“CUB”) pursuant to the Agreement and Plan of Merger by and between CU Bancorp, CUB, PC Bancorp and Premier Commercial Bank, the wholly-owned subsidiary of PC Bancorp (the “Merger Agreement”) is fair to the holders of PC Bancorp common stock, from a financial point of view. The following presents our general observations and conclusions as a result of our analysis.
DISCUSSION
Structure of Transaction. Pursuant to the terms of the Merger Agreement, the holders of PC Bancorp common stock (other than holders of Excluded Shares and Dissenting Shares) shall be entitled to receive as aggregate consideration in the form of shares of CU Bancorp common stock for all shares of PC Bancorp common stock outstanding immediately prior to the Effective Time the difference of (i) 3,721,442; minus (ii) the sum of Excluded Shares; and Dissenting Shares (the “Stock Consideration”). All capitalized items used in this paragraph shall have the meanings ascribed to them in the Merger Agreement. The terms of the Merger are more fully set forth in the Merger Agreement.
Based on the issuance of 3,721,442 shares of CU Bancorp common stock and a market price of $10.25 for CUB common stock, PC Bancorp will receive Merger Consideration of $38,144,780. Merger Consideration of $38,144,780 represents a price to equity at September 30, 2011 of 0.92x, a price to tangible equity of 0.92x, a price to assets of 8.48% and a tangible premium on core deposits of -0.92%. The price to earnings multiple is not meaningful due to PC Bancorp’s projected net loss for 2011. After the mark-to- market adjustments, the price to equity would equal 1.24x equity and 1.24x tangible equity (based on September 30, 2011 equity and pre-tax mark-to-market adjustments of $18.0 million).

PREMIER COMMERCIAL BANCORP
Financial Projections. In Sections 2 and 3 of this report, we have provided financial projections for CUB and PC Bancorp based upon input from management of CUB and PC Bancorp and based on a review of each organization’s historical performance, current financial condition, and market area analysis along with our understanding of the future prospects of the banking industry and various other factors pertinent in projecting future performance. In conducting our review and in arriving at our opinion, we have relied upon and assumed the accuracy and completeness of the financial and other information provided to us or publicly available, and we have not assumed any responsibility for independent verification of the same. We have relied upon the management of CUB and PC Bancorp as to the reasonableness of the financial and operating forecasts and projections and estimates of cost savings/revenue enhancements (and the assumptions and bases therefore) provided to us, and we have assumed that such forecasts and projections reflect the best currently available estimates and judgment of the management of CUB and PC Bancorp. We did not make or obtain any evaluations or appraisals of the assets or liabilities of CUB or PC Bancorp. We are not experts in the valuation of allowances for loan losses and did not make an independent evaluation of the adequacy of the allowance for loan losses of either CUB or PC Bancorp, nor did we review any individual loan credit files. We assumed that the aggregate allowance for loan losses set forth in the financial statements of CUB and PC Bancorp is adequate to cover such losses.
Stock Trading History. We reviewed the closing per share market prices and volumes for CUB and PC Bancorp common stock, which are traded in the over-the-counter market on the OTC Bulletin Board (under the symbols “CTJNB” and “PCBP”). A price and volume chart for CUB common stock for the period between June 2, 2011 and December 2, 2011 is contained in Section 5. For the period between June 2, 2011 and December 2, 2011, the price of CUB common stock has ranged from a low of $l0.OOl to a high of $12.40. The average closing price for the period was $11.39 and the closing price on December 2, 2011 was $10.25 per share. The average daily trading volume of CUB common stock for the period analyzed was 2,931 shares. A price and volume chart for PC Bancorp common stock for the period between June 2, 2011 and December 2, 2011 is contained in Section 5. For the period between June 2, 2011 and December 2, 2011, the price of PC Bancorp common stock has ranged from a low of $7.90 to a high of $11.00. The average closing price for the period was $9.15 and the closing price on December 2, 2011 was $9.00 per share. The average daily trading volume of PC Bancorp for the period analyzed was 305 shares, but there were many days with no trades.
Present Value Analysis. We calculated the present value of theoretical future earnings of PC Bancorp and compared the transaction value to the calculated present value of PC Bancorp’s common stock on a stand-alone basis. Based on projected earnings for PC Bancorp for 2012 through 2016 and a discount rate of 12% and including a residual value, the stand-alone present
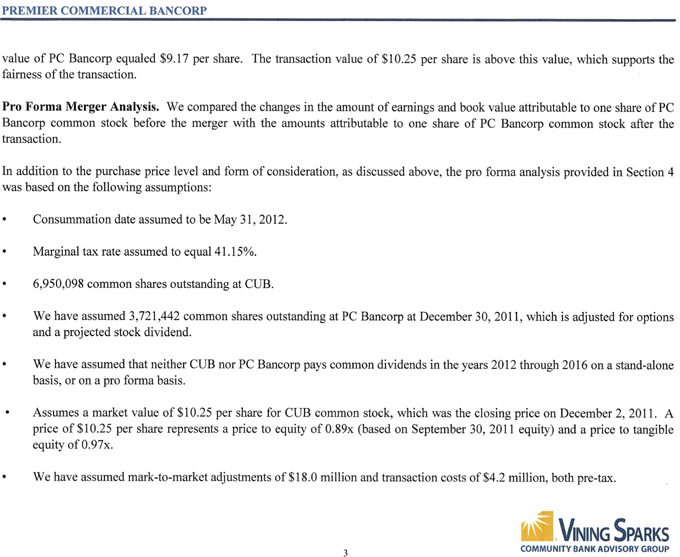
PREMIER COMMERCIAL BANCORP
value of PC Bancorp equaled $9.17 per share. The transaction value of $10.25 per share is above this value, which supports the fairness of the transaction.
Pro Forma Merger Analysis. We compared the changes in the amount of earnings and book value attributable to one share of PC Bancorp common stock before the merger with the amounts attributable to one share of PC Bancorp common stock after the transaction.
In addition to the purchase price level and form of consideration, as discussed above, the pro forma analysis provided in Section 4 was based on the following assumptions:
• Consummation date assumed to be May 31, 2012.
• Marginal tax rate assumed to equal 4 1.15%.
• 6,950,098 common shares outstanding at CUB.
• We have assumed 3,721,442 common shares outstanding at PC Bancorp at December
30, 2011, which is adjusted for options and a projected stock dividend.
• We have assumed that neither CUB nor PC Bancorp pays common dividends in the years 2012 through 2016 on a stand-alone basis, or on a pro forma basis.
• Assumes a market value of $10.25 per share for CUB common stock, which was the closing price on December 2, 2011. A price of $10.25 per share represents a price to equity of 0.89x (based on September 30, 2011 equity) and a price to tangible equity of 0.97x.
• We have assumed mark-to-market adjustments of $18.0 million and transaction costs of $4.2 million, both pre-tax.
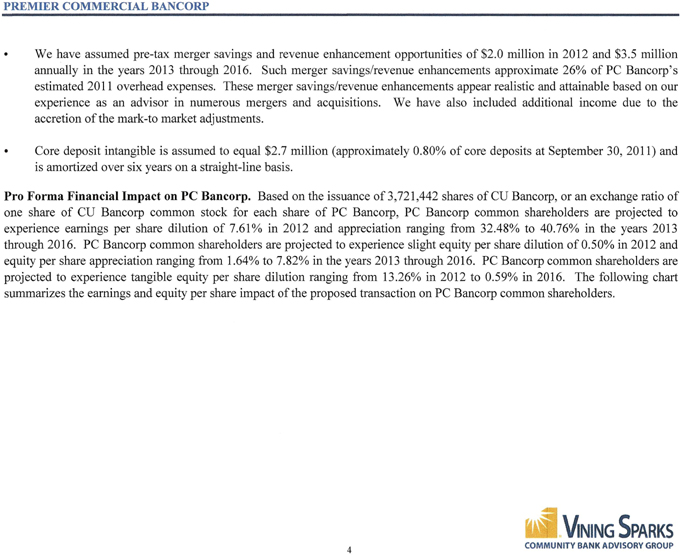
PREMIER COMMERCIAL BANCORP
• We have assumed pre-tax merger savings and revenue enhancement opportunities of $2.0 million in 2012 and $3.5 million annually in the years 2013 through 2016. Such merger savings/revenue enhancements approximate 26% of PC Bancorp’ s estimated 2011 overhead expenses. These merger savings/revenue enhancements appear realistic and attainable based on our experience as an advisor in numerous mergers and acquisitions. We have also included additional income due to the accretion of the mark-to market adjustments.
• Core deposit intangible is assumed to equal $2.7 million (approximately 0.80% of core deposits at September 30, 2011) and is amortized over six years on a straight-line basis.
Pro Forma Financial Impact on PC Bancorp. Based on the issuance of 3,721,442 shares of CU Bancorp, or an exchange ratio of one share of CU Bancorp common stock for each share of PC Bancorp, PC Bancorp common shareholders are projected to experience earnings per share dilution of 7.61% in 2012 and appreciation ranging from 32.48% to 40.76% in the years 2013 through 2016. PC Bancorp common shareholders are projected to experience slight equity per share dilution of 0.50% in 2012 and equity per share appreciation ranging from 1.64% to 7.82% in the years 2013 through 2016. PC Bancorp common shareholders are projected to experience tangible equity per share dilution ranging from 13.26% in 2012 to 0.59% in 2016. The following chart summarizes the earnings and equity per share impact of the proposed transaction on PC Bancorp common shareholders.
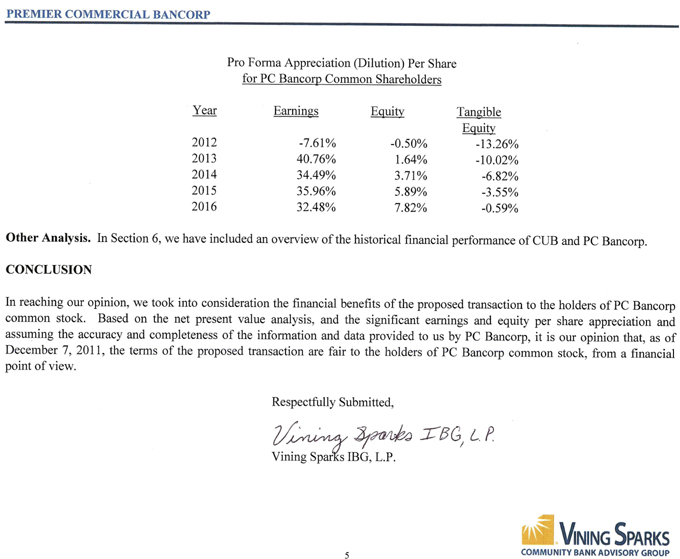
PREMIER COMMERCIAL BANCORP
Pro Forma Appreciation (Dilution) Per Share
for PC Bancorp Common Shareholders
Year
Earnings
Equity
Tangible Equity
2012
-7.61%
-0.50%
-13.26%
2013
40.76%
1.64%
-10.02%
2014
34.49%
3.71%
-6.82%
2015
35.96%
5.89%
-3.55%
2016
32.48%
7.82%
-0.59%
Other Analysis. In Section 6, we have included an overview of the historical financial performance of CUB and PC Bancorp.
CONCLUSION
In reaching our opinion, we took into consideration the financial benefits of the proposed transaction to the holders of PC Bancorp common stock. Based on the net present value analysis, and the significant earnings and equity per share appreciation and assuming the accuracy and completeness of the information and data provided to us by PC Bancorp, it is our opinion that, as of December 7, 2011, the terms of the proposed transaction are fair to the holders of PC Bancorp common stock, from a financial point of view.
Respectfully Submitted,
/s/ Vining Sparks IBG, L.P.
Vining Sparks IBG, L.P.
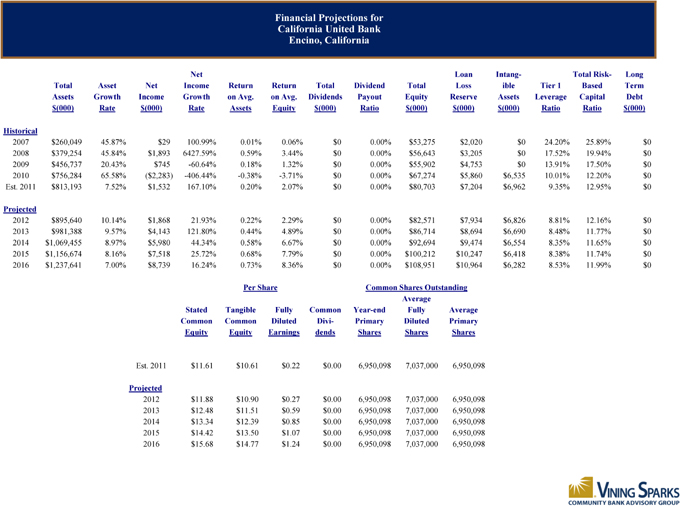
Financial Projections for California United Bank Encino, California
Net Loan Intang- Total Risk- Long Total Asset Net Income Return Return Total Dividend Total Loss ible Tier 1 Based Term Assets Growth Income Growth on Avg. on Avg. Dividends Payout Equity Reserve Assets Leverage Capital Debt $(000) Rate $(000) Rate Assets Equity $(000) Ratio $(000) $(000) $(000) Ratio Ratio $(000)
Historical
2007 $260,049 45.87% $29 100.99% 0.01% 0.06% $0 0.00% $53,275 $2,020 $0 24.20% 25.89% $0 2008 $379,254 45.84% $1,893 6427.59% 0.59% 3.44% $0 0.00% $56,643 $3,205 $0 17.52% 19.94% $0 2009 $456,737 20.43% $745 -60.64% 0.18% 1.32% $0 0.00% $55,902 $4,753 $0 13.91% 17.50% $0 2010 $756,284 65.58% ($2,283) -406.44% -0.38% -3.71% $0 0.00% $67,274 $5,860 $6,535 10.01% 12.20% $0 Est. 2011 $813,193 7.52% $1,532 167.10% 0.20% 2.07% $0 0.00% $80,703 $7,204 $6,962 9.35% 12.95% $0
Projected
2012 $895,640 10.14% $1,868 21.93% 0.22% 2.29% $0 0.00% $82,571 $7,934 $6,826 8.81% 12.16% $0 2013 $981,388 9.57% $4,143 121.80% 0.44% 4.89% $0 0.00% $86,714 $8,694 $6,690 8.48% 11.77% $0 2014 $1,069,455 8.97% $5,980 44.34% 0.58% 6.67% $0 0.00% $92,694 $9,474 $6,554 8.35% 11.65% $0 2015 $1,156,674 8.16% $7,518 25.72% 0.68% 7.79% $0 0.00% $100,212 $10,247 $6,418 8.38% 11.74% $0 2016 $1,237,641 7.00% $8,739 16.24% 0.73% 8.36% $0 0.00% $108,951 $10,964 $6,282 8.53% 11.99% $0
Per Share Common Shares Outstanding Average Stated Tangible Fully Common Year-end Fully Average Common Common Diluted Divi- Primary Diluted Primary Equity Equity Earnings dends Shares Shares Shares
Est. 2011 $11.61 $10.61 $0.22 $0.00 6,950,098 7,037,000 6,950,098
Projected
2012 $11.88 $10.90 $0.27 $0.00 6,950,098 7,037,000 6,950,098 2013 $12.48 $11.51 $0.59 $0.00 6,950,098 7,037,000 6,950,098 2014 $13.34 $12.39 $0.85 $0.00 6,950,098 7,037,000 6,950,098 2015 $14.42 $13.50 $1.07 $0.00 6,950,098 7,037,000 6,950,098 2016 $15.68 $14.77 $1.24 $0.00 6,950,098 7,037,000 6,950,098
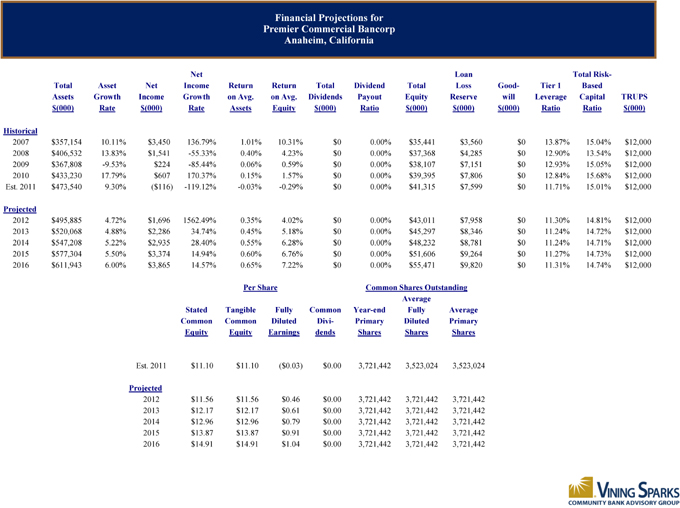
Financial Projections for Premier Commercial Bancorp Anaheim, California
Net Loan Total Risk-Total Asset Net Income Return Return Total Dividend Total Loss Good- Tier 1 Based
Assets Growth Income Growth on Avg. on Avg. Dividends Payout Equity Reserve will Leverage Capital TRUPS $(000) Rate $(000) Rate Assets Equity $(000) Ratio $(000) $(000) $(000) Ratio Ratio $(000)
Historical
2007 $357,154 10.11% $3,450 136.79% 1.01% 10.31% $0 0.00% $35,441 $3,560 $0 13.87% 15.04% $12,000 2008 $406,532 13.83% $1,541 -55.33% 0.40% 4.23% $0 0.00% $37,368 $4,285 $0 12.90% 13.54% $12,000 2009 $367,808 -9.53% $224 -85.44% 0.06% 0.59% $0 0.00% $38,107 $7,151 $0 12.93% 15.05% $12,000 2010 $433,230 17.79% $607 170.37% 0.15% 1.57% $0 0.00% $39,395 $7,806 $0 12.84% 15.68% $12,000 Est. 2011 $473,540 9.30% ($116) -119.12% -0.03% -0.29% $0 0.00% $41,315 $7,599 $0 11.71% 15.01% $12,000
Projected
2012 $495,885 4.72% $1,696 1562.49% 0.35% 4.02% $0 0.00% $43,011 $7,958 $0 11.30% 14.81% $12,000 2013 $520,068 4.88% $2,286 34.74% 0.45% 5.18% $0 0.00% $45,297 $8,346 $0 11.24% 14.72% $12,000 2014 $547,208 5.22% $2,935 28.40% 0.55% 6.28% $0 0.00% $48,232 $8,781 $0 11.24% 14.71% $12,000 2015 $577,304 5.50% $3,374 14.94% 0.60% 6.76% $0 0.00% $51,606 $9,264 $0 11.27% 14.73% $12,000 2016 $611,943 6.00% $3,865 14.57% 0.65% 7.22% $0 0.00% $55,471 $9,820 $0 11.31% 14.74% $12,000
Per Share Common Shares Outstanding Average Stated Tangible Fully Common Year-end Fully Average Common Common Diluted Divi- Primary Diluted Primary Equity Equity Earnings dends Shares Shares Shares
Est. 2011 $11.10 $11.10 ($0.03) $0.00 3,721,442 3,523,024 3,523,024
Projected
2012 $11.56 $11.56 $0.46 $0.00 3,721,442 3,721,442 3,721,442 2013 $12.17 $12.17 $0.61 $0.00 3,721,442 3,721,442 3,721,442 2014 $12.96 $12.96 $0.79 $0.00 3,721,442 3,721,442 3,721,442 2015 $13.87 $13.87 $0.91 $0.00 3,721,442 3,721,442 3,721,442 2016 $14.91 $14.91 $1.04 $0.00 3,721,442 3,721,442 3,721,442
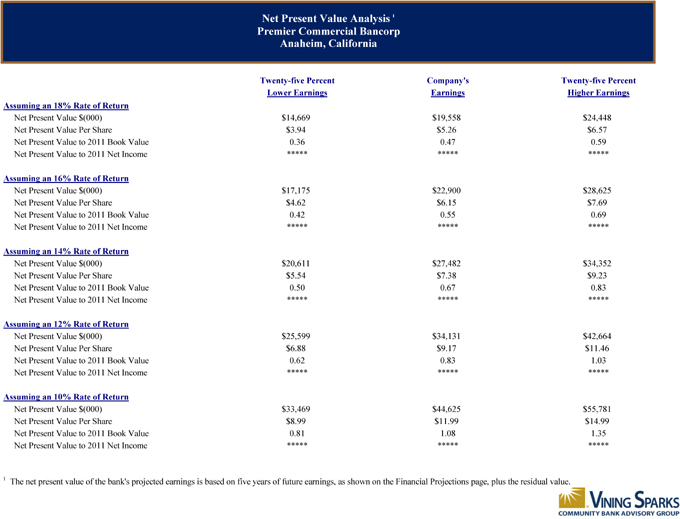
Net Present Value Analysis 1 Premier Commercial Bancorp Anaheim, California
Twenty-five Percent Company’s Twenty-five Percent Lower Earnings Earnings Higher Earnings Assuming an 18% Rate of Return
Net Present Value $(000) $14,669 $19,558 $24,448 Net Present Value Per Share $3.94 $5.26 $6.57 Net Present Value to 2011 Book Value 0.36 0.47 0.59 Net Present Value to 2011 Net Income ***** ***** *****
Assuming an 16% Rate of Return
Net Present Value $(000) $17,175 $22,900 $28,625 Net Present Value Per Share $4.62 $6.15 $7.69 Net Present Value to 2011 Book Value 0.42 0.55 0.69 Net Present Value to 2011 Net Income ***** ***** *****
Assuming an 14% Rate of Return
Net Present Value $(000) $20,611 $27,482 $34,352 Net Present Value Per Share $5.54 $7.38 $9.23 Net Present Value to 2011 Book Value 0.50 0.67 0.83 Net Present Value to 2011 Net Income ***** ***** *****
Assuming an 12% Rate of Return
Net Present Value $(000) $25,599 $34,131 $42,664 Net Present Value Per Share $6.88 $9.17 $11.46 Net Present Value to 2011 Book Value 0.62 0.83 1.03 Net Present Value to 2011 Net Income ***** ***** *****
Assuming an 10% Rate of Return
Net Present Value $(000) $33,469 $44,625 $55,781 Net Present Value Per Share $8.99 $11.99 $14.99 Net Present Value to 2011 Book Value 0.81 1.08 1.35 Net Present Value to 2011 Net Income ***** ***** *****
1 The net present value of the bank’s projected earnings is based on five years of future earnings, as shown on the Financial Projections page, plus the residual value.
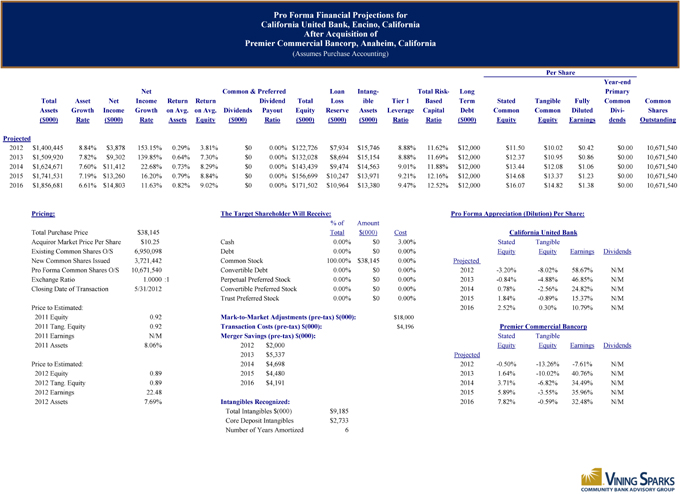
Pro Forma Financial Projections for California United Bank, Encino, California After Acquisition of Premier Commercial Bancorp, Anaheim, California
(Assumes Purchase Accounting)
Per Share
Year-end Net Common & Preferred Loan Intang- Total Risk- Long Primary
Total Asset Net Income Return Return Dividend Total Loss ible Tier 1 Based Term Stated Tangible Fully Common Common Assets Growth Income Growth on Avg. on Avg. Dividends Payout Equity Reserve Assets Leverage Capital Debt Common Common Diluted Divi- Shares
($000) Rate ($000) Rate Assets Equity ($000) Ratio ($000) ($000) ($000) Ratio Ratio ($000) Equity Equity Earnings dends Outstanding
Projected
2012 $1,400,445 8.84% $3,878 153.15% 0.29% 3.81% $0 0.00% $122,726 $7,934 $15,746 8.88% 11.62% $12,000 $11.50 $10.02 $0.42 $0.00 10,671,540 2013 $1,509,920 7.82% $9,302 139.85% 0.64% 7.30% $0 0.00% $132,028 $8,694 $15,154 8.88% 11.69% $12,000 $12.37 $10.95 $0.86 $0.00 10,671,540 2014 $1,624,671 7.60% $11,412 22.68% 0.73% 8.29% $0 0.00% $143,439 $9,474 $14,563 9.01% 11.88% $12,000 $13.44 $12.08 $1.06 $0.00 10,671,540 2015 $1,741,531 7.19% $13,260 16.20% 0.79% 8.84% $0 0.00% $156,699 $10,247 $13,971 9.21% 12.16% $12,000 $14.68 $13.37 $1.23 $0.00 10,671,540 2016 $1,856,681 6.61% $14,803 11.63% 0.82% 9.02% $0 0.00% $171,502 $10,964 $13,380 9.47% 12.52% $12,000 $16.07 $14.82 $1.38 $0.00 10,671,540
Pricing: The Target Shareholder Will Receive: Pro Forma Appreciation (Dilution) Per Share:
% of Amount
Total Purchase Price $38,145 Total $(000) Cost California United Bank Acquiror Market Price Per Share $10.25 Cash 0.00% $0 3.00% Stated Tangible
Existing Common Shares O/S 6,950,098 Debt 0.00% $0 0.00% Equity Equity Earnings Dividends New Common Shares Issued 3,721,442 Common Stock 100.00% $38,145 0.00% Projected Pro Forma Common Shares O/S 10,671,540 Convertible Debt 0.00% $0 0.00% 2012 -3.20% -8.02% 58.67% N/M Exchange Ratio 1.0000 :1 Perpetual Preferred Stock 0.00% $0 0.00% 2013 -0.84% -4.88% 46.85% N/M Closing Date of Transaction 5/31/2012 Convertible Preferred Stock 0.00% $0 0.00% 2014 0.78% -2.56% 24.82% N/M
Trust Preferred Stock 0.00% $0 0.00% 2015 1.84% -0.89% 15.37% N/M Price to Estimated: 2016 2.52% 0.30% 10.79% N/M 2011 Equity 0.92 Mark-to-Market Adjustments (pre-tax) $(000): $18,000 2011 Tang. Equity 0.92 Transaction Costs (pre-tax) $(000): $4,196 Premier Commercial Bancorp
2011 Earnings N/M Merger Savings (pre-tax) $(000): Stated Tangible
2011 Assets 8.06% 2012 $2,000 Equity Equity Earnings Dividends 2013 $5,337 Projected Price to Estimated: 2014 $4,698 2012 -0.50% -13.26% -7.61% N/M 2012 Equity 0.89 2015 $4,480 2013 1.64% -10.02% 40.76% N/M 2012 Tang. Equity 0.89 2016 $4,191 2014 3.71% -6.82% 34.49% N/M 2012 Earnings 22.48 2015 5.89% -3.55% 35.96% N/M 2012 Assets 7.69% Intangibles Recognized: 2016 7.82% -0.59% 32.48% N/M
Total Intangibles $(000) $9,185 Core Deposit Intangibles $2,733 Number of Years Amortized 6
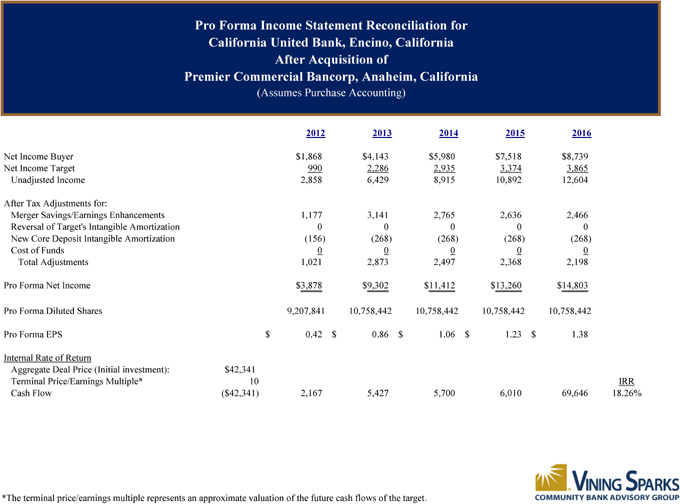
Pro Forma Income Statement Reconciliation for California United Bank, Encino, California After Acquisition of Premier Commercial Bancorp, Anaheim, California
(Assumes Purchase Accounting)
2012 2013 2014 2015 2016
Net Income Buyer $1,868 $4,143 $5,980 $7,518 $8,739 Net Income Target 990 2,286 2,935 3,374 3,865 Unadjusted Income 2,858 6,429 8,915 10,892 12,604
After Tax Adjustments for:
Merger Savings/Earnings Enhancements 1,177 3,141 2,765 2,636 2,466 Reversal of Target’s Intangible Amortization 0 0 0 0 0 New Core Deposit Intangible Amortization (156) (268) (268) (268) (268) Cost of Funds 0 0 0 0 0 Total Adjustments 1,021 2,873 2,497 2,368 2,198
Pro Forma Net Income $3,878 $9,302 $11,412 $13,260 $14,803
Pro Forma Diluted Shares 9,207,841 10,758,442 10,758,442 10,758,442 10,758,442
Pro Forma EPS $ 0.42 $ 0.86 $ 1.06 $ 1.23 $ 1.38
Internal Rate of Return
Aggregate Deal Price (Initial investment): $42,341
Terminal Price/Earnings Multiple* 10 IRR Cash Flow ($42,341) 2,167 5,427 5,700 6,010 69,646 18.26%
*The terminal price/earnings multiple represents an approximate valuation of the future cash flows of the target.
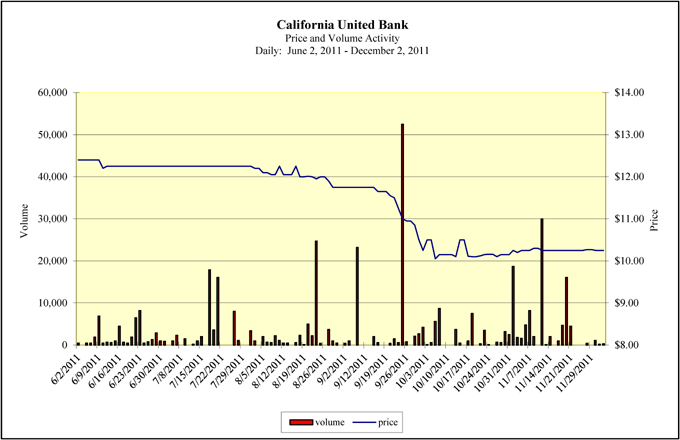
California United Bank
Price and Volume Activity Daily: June 2, 2011—December 2, 2011
60,000 $14.00 50,000 $13.00 40,000 $12.00
Volume 30,000 $11.00 Price 20,000 $10.00
10,000 $9.00
0 $8.00
volume price
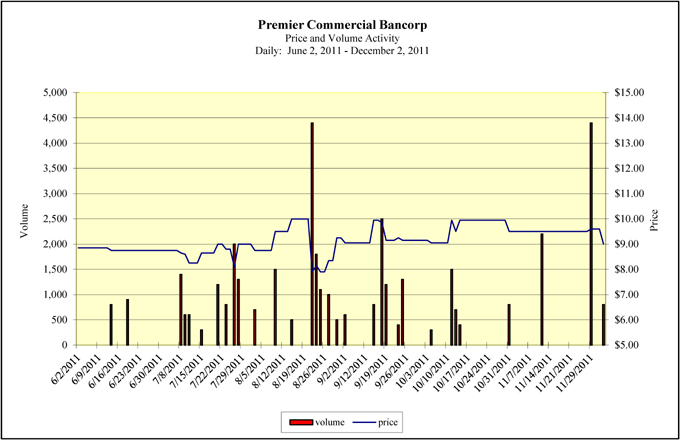
Premier Commercial Bancorp
Price and Volume Activity Daily: June 2, 2011—December 2, 2011
5,000 $15.00 4,500 $14.00 4,000 $13.00 3,500 $12.00
3,000 $11.00 Volume 2,500 $10.00 Price 2,000 $9.00
1,500 $8.00 1,000 $7.00 500 $6.00
0 $5.00
volume price
California United Bank (OTCBB: CUNB)
Financial Highlights
Period Ended Accounting Principle | 2007 FY 12/31/2007 U.S. GAAP | 2008 FY 12/31/2008 U.S. GAAP | 2009 FY 12/31/2009 U.S. GAAP | 2010 FY 12/31/2010 U.S. GAAP | 2011 FQ3 YTD 9/30/2011 U.S. GAAP | |||||||||||||||
Balance Sheet ($000) | ||||||||||||||||||||
Total Assets | 260,049 | 379,254 | 456,737 | 756,284 | 791,694 | |||||||||||||||
Total Net Loans | 159,557 | 228,999 | 258,668 | 415,403 | 458,071 | |||||||||||||||
Total Deposits | 191,032 | 245,678 | 346,291 | 657,967 | 671,941 | |||||||||||||||
Equity Attributable to Parent Company | 53,275 | 56,643 | 55,902 | 67,274 | 80,332 | |||||||||||||||
Total Equity | 53,275 | 56,643 | 55,902 | 67,274 | 80,332 | |||||||||||||||
Profitability (%) | ||||||||||||||||||||
Net Income ($000) | 29 | 1,893 | 745 | (2,283 | ) | 1,161 | ||||||||||||||
Net Income Attributable to Parent ($000) | 29 | 1,893 | 745 | (2,283 | ) | 1,161 | ||||||||||||||
ROAA | 0.01 | 0.61 | 0.18 | (0.42 | ) | 0.20 | ||||||||||||||
Core ROAA | 0.01 | 0.82 | 0.27 | (0.36 | ) | 0.22 | ||||||||||||||
ROAE | 0.06 | 3.45 | 1.32 | (3.86 | ) | 2.05 | ||||||||||||||
ROATCE | 0.06 | 3.45 | 1.32 | (3.92 | ) | 2.39 | ||||||||||||||
Core ROAE | 0.05 | 4.66 | 2.00 | (3.30 | ) | 2.33 | ||||||||||||||
Net Interest Margin | 4.94 | 4.38 | 4.28 | 3.49 | 3.69 | |||||||||||||||
Reported: Net Interest Margin | 4.94 | 4.38 | 4.28 | 3.49 | 3.71 | |||||||||||||||
Efficiency Ratio | 92.85 | 86.68 | 70.74 | 101.89 | 86.30 | |||||||||||||||
Noninterest Inc/ Operating Rev | 3.79 | 4.98 | 5.08 | 6.22 | 8.03 | |||||||||||||||
Balance Sheet Ratios/ Capital (%) | ||||||||||||||||||||
Loans/ Deposits | 84.58 | 94.52 | 76.07 | 64.02 | 69.21 | |||||||||||||||
Securities/ Assets | 17.54 | 29.03 | 25.47 | 13.19 | 13.95 | |||||||||||||||
Total Equity/ Total Assets | 20.49 | 14.94 | 12.24 | 8.90 | 10.15 | |||||||||||||||
Tangible Equity/ Tangible Assets | 20.49 | 14.94 | 12.24 | 8.10 | 9.35 | |||||||||||||||
Tang Common Equity/ Tang Assets | 20.49 | 14.94 | 12.24 | 8.10 | 9.35 | |||||||||||||||
Tier 1 Common Capital Ratio | 24.94 | 18.86 | NA | 10.98 | NA | |||||||||||||||
Tier 1 Ratio | 24.94 | 18.86 | 16.25 | 10.98 | 12.11 | |||||||||||||||
Risk-based Capital Ratio | 25.93 | 19.98 | 17.50 | 12.19 | 13.33 | |||||||||||||||
Leverage Ratio (Bank, BHC Only) | 21.40 | 15.77 | 12.67 | 9.52 | 8.99 | |||||||||||||||
Core Cap/ Tang Assets (OTS Only) | NA | NA | NA | NA | NA | |||||||||||||||
Asset Quality (%) | ||||||||||||||||||||
NPAs/ Assets | 0.00 | 0.00 | 1.12 | 1.42 | 1.10 | |||||||||||||||
NPAs & 90+ PD/ Assets | 0.00 | 0.00 | 1.12 | 1.42 | 1.10 | |||||||||||||||
NPAs/ Loans & REO | 0.00 | 0.00 | 1.95 | 2.54 | 1.86 | |||||||||||||||
Nonaccrual & 90+ & OREO/ Assets | 0.00 | 0.00 | 1.12 | 1.42 | 1.10 | |||||||||||||||
NPAs & 90+ PD/ Loans & REO | 0.00 | 0.00 | 1.95 | 2.54 | 1.86 | |||||||||||||||
NPA & Loans 90+/ Tangible Common Equity + LLR | 0.00 | 0.00 | 8.45 | 16.13 | 10.85 | |||||||||||||||
NCOs/ Avg Loans | 0.00 | 0.00 | 0.80 | 0.49 | (0.14 | ) | ||||||||||||||
Loan Loss Reserves/ Gross Loans | 1.25 | 1.38 | 1.80 | 1.39 | 1.50 | |||||||||||||||
Reserves/ NPAs | NM | NM | 92.69 | 54.55 | 80.16 | |||||||||||||||
Loan Loss Provision/ NCO | NM | NM | 180.92 | 177.14 | NM | |||||||||||||||
Copyright 2011, SNL Financial LC
California United Bank (OTCBB: CUNB)
Financial Highlights
Period Ended Accounting Principle | 2007 FY 12/31/2007 U.S. GAAP | 2008 FY 12/31/2008 U.S. GAAP | 2009 FY 12/31/2009 U.S. GAAP | 2010 FY 12/31/2010 U.S. GAAP | 2011 FQ3 YTD U.S. GAAP | |||||||||||||||
Per Share Information ($) | ||||||||||||||||||||
Common Shares Outstanding (actual) | 4,866,010 | 4,934,939 | 4,962,939 | 5,942,636 | 6,694,448 | |||||||||||||||
Avg Diluted Shares (actual) | 5,128,987 | 5,002,286 | 5,009,019 | 5,110,901 | 6,752,000 | |||||||||||||||
Basic Book Value per Share | 10.95 | 11.48 | 11.26 | 11.32 | 12.00 | |||||||||||||||
Reported: Book Value | 10.95 | 11.48 | 11.26 | 11.32 | NA | |||||||||||||||
Basic Tangible Book Value per Share | 10.95 | 11.48 | 11.26 | 10.22 | 10.95 | |||||||||||||||
Reported: Tangible Book Value | 10.95 | 11.48 | 11.26 | 10.22 | 10.55 | |||||||||||||||
Common Dividends Declared per Share | 0.0000 | 0.0000 | 0.0000 | 0.0000 | 0.0000 | |||||||||||||||
EPS after Extra | 0.01 | 0.37 | 0.15 | (0.45 | ) | 0.17 | ||||||||||||||
EPS after Extra Growth (%) | NM | NM | (59.5 | ) | NM | NM | ||||||||||||||
Core EPS | 0.01 | 0.50 | 0.23 | (0.38 | ) | 0.19 | ||||||||||||||
Core EPS Growth (%) | NM | NM | (54.7 | ) | NM | NM | ||||||||||||||
Diluted EPS before Amortization | 0.01 | 0.37 | 0.15 | (0.45 | ) | 0.19 | ||||||||||||||
Pre-Provision Earnings Per Share | 0.17 | 0.23 | 0.71 | (0.05 | ) | 0.28 | ||||||||||||||
Copyright 2011, SNL Financial LC
California United Bank (OTCBB: CUNB)
Performance Analysis
| 2007 FY | 2008 FY | 2009 FY | 2010 FY | 2011 FQ3 YTD | ||||||||||||||||
| Period Ended | 12/31/2007 | 12/31/2008 | 12/31/2009 | 12/31/2010 | 9/30/2011 | |||||||||||||||
| Accounting Principle | U.S. GAAP | U.S. GAAP | U.S. GAAP | U.S. GAAP | U.S. GAAP | |||||||||||||||
Profitability Ratios (%) | ||||||||||||||||||||
ROAA | 0.01 | 0.61 | 0.18 | (0.42 | ) | 0.20 | ||||||||||||||
ROAE | 0.06 | 3.45 | 1.32 | (3.86 | ) | 2.05 | ||||||||||||||
ROATCE | 0.06 | 3.45 | 1.32 | (3.92 | ) | 2.39 | ||||||||||||||
ROACE | 0.06 | 3.45 | 1.32 | (3.86 | ) | 2.05 | ||||||||||||||
ROATE | 0.06 | 3.45 | 1.32 | (3.92 | ) | 2.39 | ||||||||||||||
Profit Margin | 0.23 | 4.73 | 10.59 | (14.87 | ) | 10.24 | ||||||||||||||
Net Interest Margin | 4.94 | 4.38 | 4.28 | 3.49 | 3.69 | |||||||||||||||
Reported: Net Interest Margin | 4.94 | 4.38 | 4.28 | 3.49 | 3.71 | |||||||||||||||
Yield: Interest Earning Assets | 7.14 | 5.73 | 4.90 | 3.90 | 3.90 | |||||||||||||||
Cost of Interest-bearing Liab | 3.69 | 2.04 | 0.94 | 0.68 | 0.38 | |||||||||||||||
Interest Spread | 3.45 | 3.69 | 3.96 | 3.22 | 3.52 | |||||||||||||||
Net Interest Income/ Avg Assets | 4.71 | 4.20 | 4.16 | 3.35 | 3.47 | |||||||||||||||
Noninterest Income/ Avg Assets | 0.19 | 0.22 | 0.22 | 0.22 | 0.30 | |||||||||||||||
Net Operating Expense/ Avg Assets | 4.36 | 3.61 | 2.88 | 3.42 | 2.95 | |||||||||||||||
Noninterest Inc/ Operating Rev | 3.79 | 4.98 | 5.08 | 6.22 | 8.03 | |||||||||||||||
Overhead Ratio | 92.56 | 85.98 | 69.18 | 102.02 | 85.11 | |||||||||||||||
Efficiency Ratio | 92.85 | 86.68 | 70.74 | 101.89 | 86.30 | |||||||||||||||
Net Nonrecurring Income/ NIBT | 0.00 | NM | (13.51 | ) | NM | (10.58 | ) | |||||||||||||
Yield/ Cost Detail (%) | ||||||||||||||||||||
Yield Earned On: | ||||||||||||||||||||
Yield: Total Loans | 7.99 | 6.13 | 5.31 | 5.38 | 5.73 | |||||||||||||||
Yield: Securities | 5.64 | 5.77 | 5.40 | 4.85 | 2.81 | |||||||||||||||
Yield: Oth Int-earn Assets | 5.14 | 2.61 | 0.34 | 0.26 | 0.34 | |||||||||||||||
Yield: Interest Earning Assets | 7.14 | 5.73 | 4.90 | 3.90 | 3.90 | |||||||||||||||
Cost Incurred By: | ||||||||||||||||||||
Int Cost: CDs | 4.23 | 2.65 | 1.33 | 0.78 | 0.45 | |||||||||||||||
Int Cost: Other Deposits | 3.51 | 1.71 | 0.59 | 0.54 | 0.36 | |||||||||||||||
Int Cost: Int-bearing Deposits | 3.58 | 1.82 | 0.81 | 0.60 | 0.38 | |||||||||||||||
Int Cost: Total Deposits | 2.65 | 1.31 | 0.56 | 0.37 | 0.19 | |||||||||||||||
Int Cost: Debt | 4.65 | 2.74 | 1.39 | 1.15 | 0.40 | |||||||||||||||
Cost of Interest-bearing Liab | 3.69 | 2.04 | 0.94 | 0.68 | 0.38 | |||||||||||||||
Cost of Funds | 2.80 | 1.59 | 0.70 | 0.45 | 0.20 | |||||||||||||||
Core Income | ||||||||||||||||||||
Core Income | 26 | 2,569 | 1,130 | (1,950 | ) | 1,319 | ||||||||||||||
Core EPS ($) | 0.01 | 0.50 | 0.23 | (0.38 | ) | 0.19 | ||||||||||||||
Core EPS before Amortization ($) | 0.01 | 0.50 | 0.23 | (0.38 | ) | 0.20 | ||||||||||||||
Core ROAA (%) | 0.01 | 0.82 | 0.27 | (0.36 | ) | 0.22 | ||||||||||||||
Core ROAE (%) | 0.05 | 4.66 | 2.00 | (3.30 | ) | 2.33 | ||||||||||||||
Copyright 2011, SNL Financial LC
California United Bank (OTCBB: CUNB)
Performance Analysis
| 2007 FY | 2008 FY | 2009 FY | 2010 FY | 2011 FQ3 YTD | ||||||||||||||||
| Period Ended | 12/31/2007 | 12/31/2008 | 12/31/2009 | 12/31/2010 | 9/30/2011 | |||||||||||||||
| Accounting Principle | U.S. GAAP | U.S. GAAP | U.S. GAAP | U.S. GAAP | U.S. GAAP | |||||||||||||||
Share and Per Share Info ($) | ||||||||||||||||||||
Basic EPS before Extra | 0.01 | 0.39 | 0.15 | (0.45 | ) | 0.17 | ||||||||||||||
Basic EPS after Extra | 0.01 | 0.39 | 0.15 | (0.45 | ) | 0.17 | ||||||||||||||
EPS before Extra | 0.01 | 0.37 | 0.15 | (0.45 | ) | 0.17 | ||||||||||||||
EPS after Extra | 0.01 | 0.37 | 0.15 | (0.45 | ) | 0.17 | ||||||||||||||
Diluted EPS before Amortization | 0.01 | 0.37 | 0.15 | (0.45 | ) | 0.19 | ||||||||||||||
Basic Book Value per Share | 10.95 | 11.48 | 11.26 | 11.32 | 12.00 | |||||||||||||||
Basic Tangible Book Value per Share | 10.95 | 11.48 | 11.26 | 10.22 | 10.95 | |||||||||||||||
Common Dividends Declared per Share | 0.0000 | 0.0000 | 0.0000 | 0.0000 | 0.0000 | |||||||||||||||
Dividend Payout Ratio (%) | 0.00 | 0.00 | 0.00 | NM | 0.00 | |||||||||||||||
Avg Diluted Shares Out (actual) | 5,128,987 | 5,002,286 | 5,009,019 | 5,110,901 | 6,752,000 | |||||||||||||||
Common Shares Outstanding (actual) | 4,866,010 | 4,934,939 | 4,962,939 | 5,942,636 | 6,694,448 | |||||||||||||||
Market Info and Historical Pricing | ||||||||||||||||||||
Closing Price ($) | 14.00 | 7.75 | 10.85 | 12.35 | 10.25 | |||||||||||||||
Price/ LTM EPS (x) | NM | 20.9 | NM | NM | NM | |||||||||||||||
Price/ Book (%) | 127.9 | 67.5 | 96.3 | 109.1 | 85.4 | |||||||||||||||
Price/ Tangible Book (%) | 127.9 | 67.5 | 96.3 | 120.8 | 93.6 | |||||||||||||||
Market Capitalization ($M) | 68.1 | 38.2 | 53.8 | 73.4 | 68.6 | |||||||||||||||
SNL U.S. Bank Index at Period End | 492.85 | 268.30 | 260.81 | 290.08 | 198.89 | |||||||||||||||
S&P 500 at Period End | 1,468.36 | 903.25 | 1,115.10 | 1,257.64 | 1,131.42 | |||||||||||||||
DJIA at Period End | 13,264.82 | 8,776.39 | 10,428.05 | 11,577.51 | 10,913.38 | |||||||||||||||
Copyright 2011, SNL Financial LC
California United Bank (OTCBB: CUNB)
Balance Sheet
| 2007 FY | 2008 FY | 2009 FY | 2010 FY | 2011 FQ3 YTD | ||||||||||||||||
| Period Ended | 12/31/2007 | 12/31/2008 | 12/31/2009 | 12/31/2010 | 9/30/2011 | |||||||||||||||
| Accounting Principle | U.S. GAAP | U.S. GAAP | U.S. GAAP | U.S. GAAP | U.S. GAAP | |||||||||||||||
Assets ($000) | ||||||||||||||||||||
Cash and Due from Banks | 4,104 | 4,417 | 8,001 | 10,308 | 15,864 | |||||||||||||||
Fed Funds Sold | 1,610 | 16,305 | 6,065 | 0 | 0 | |||||||||||||||
Deposits at Financial Institutions | 44,642 | 11,492 | 54,565 | 200,338 | 176,316 | |||||||||||||||
Securities Purchased, to Resell | 0 | 0 | 0 | 0 | 0 | |||||||||||||||
Other Cash & Cash Equivalents | 0 | 0 | 0 | 0 | 0 | |||||||||||||||
Cash and Cash Equivalents | 50,356 | 32,214 | 68,631 | 210,646 | 192,180 | |||||||||||||||
Trading Account Securities | 0 | 0 | 0 | 0 | 0 | |||||||||||||||
Available for Sale Securities | 44,930 | 107,369 | 107,246 | 96,174 | 107,268 | |||||||||||||||
Held to Maturity Securities | 0 | 0 | 5,993 | 0 | 0 | |||||||||||||||
Other Securities | 670 | 2,726 | 3,102 | 3,616 | 3,176 | |||||||||||||||
Total Cash & Securities | 95,956 | 142,309 | 184,972 | 310,436 | 302,624 | |||||||||||||||
Gross Loans Held for Investment | 161,577 | 232,204 | 263,421 | 421,263 | 465,055 | |||||||||||||||
Loan Loss Reserve | 2,020 | 3,205 | 4,753 | 5,860 | 6,984 | |||||||||||||||
Loans Held for Sale, before Reserves | 0 | 0 | 0 | 0 | 0 | |||||||||||||||
Total Net Loans | 159,557 | 228,999 | 258,668 | 415,403 | 458,071 | |||||||||||||||
Memo: Covered Loans | 0 | 0 | 0 | 0 | 0 | |||||||||||||||
Memo: Covered OREO | 0 | 0 | 0 | 0 | 0 | |||||||||||||||
Memo: Covered Securities | 0 | 0 | 0 | 0 | 0 | |||||||||||||||
Memo: Covered Assets | 0 | 0 | 0 | 0 | 0 | |||||||||||||||
Real Estate Owned and Held for Investment | 0 | 0 | 0 | 1,167 | 3,344 | |||||||||||||||
Goodwill | 0 | 0 | 0 | 5,437 | 6,001 | |||||||||||||||
Core Deposit Intangibles | 0 | 0 | 0 | 1,098 | 995 | |||||||||||||||
Other Intangibles | 0 | 0 | 0 | 0 | 0 | |||||||||||||||
Intangible Assets other than Goodwill | 0 | 0 | 0 | 1,098 | 995 | |||||||||||||||
Total Intangible Assets | 0 | 0 | 0 | 6,535 | 6,996 | |||||||||||||||
Loan Servicing Rights | 0 | 0 | 0 | 0 | 0 | |||||||||||||||
Credit Card Rights | 0 | 0 | 0 | 0 | 0 | |||||||||||||||
Other Loan Servicing Rights | 0 | 0 | 0 | 0 | 0 | |||||||||||||||
Total Servicing Rights | 0 | 0 | 0 | 0 | 0 | |||||||||||||||
Memo: Consolidated VIE Assets | NA | NA | NA | NA | NA | |||||||||||||||
Fixed Assets | 3,093 | 2,780 | 2,495 | 4,040 | 3,569 | |||||||||||||||
Interest Receivable | 1,082 | 1,565 | 1,435 | 1,770 | 1,802 | |||||||||||||||
Prepaid Expense | 214 | 367 | 1,900 | 2,040 | NA | |||||||||||||||
Bank-owned Life Insurance | NA | NA | NA | 2,545 | NA | |||||||||||||||
Other Assets | 147 | 3,234 | 7,267 | 12,348 | 15,288 | |||||||||||||||
Total Other Assets | 4,536 | 7,946 | 13,097 | 22,743 | 20,659 | |||||||||||||||
Total Assets | 260,049 | 379,254 | 456,737 | 756,284 | 791,694 | |||||||||||||||
Copyright 2011, SNL Financial LC
California United Bank (OTCBB: CUNB)
Balance Sheet
| 2007 FY | 2008 FY | 2009 FY | 2010 FY | 2011 FQ3 YTD | ||||||||||||||||
| Period Ended | 12/31/2007 | 12/31/2008 | 12/31/2009 | 12/31/2010 | 9/30/2011 | |||||||||||||||
| Accounting Principle | U.S. GAAP | U.S. GAAP | U.S. GAAP | U.S. GAAP | U.S. GAAP | |||||||||||||||
Liabilities ($000) | ||||||||||||||||||||
Total Deposits | 191,032 | 245,678 | 346,291 | 657,967 | 671,941 | |||||||||||||||
FHLB Borrowings | 8,000 | 58,000 | 8,000 | 5,545 | 0 | |||||||||||||||
Senior Debt | 14,264 | 74,662 | 53,137 | 28,407 | 37,476 | |||||||||||||||
Trust Preferred (FAS 150) | 0 | 0 | 0 | 0 | 0 | |||||||||||||||
Total Subordinated Debt | 0 | 0 | 0 | 0 | 0 | |||||||||||||||
Redeemable Financial Instruments (FAS 150) | 0 | 0 | 0 | 0 | 0 | |||||||||||||||
Total Debt | 14,264 | 74,662 | 53,137 | 28,407 | 37,476 | |||||||||||||||
Memo: Consolidated VIE Liabilities | NA | NA | NA | NA | NA | |||||||||||||||
Total Other Liabilities | 1,478 | 2,271 | 1,407 | 2,636 | 1,945 | |||||||||||||||
Total Liabilities | 206,774 | 322,611 | 400,835 | 689,010 | 711,362 | |||||||||||||||
Mezzanine ($000) | ||||||||||||||||||||
Redeemable Preferred | 0 | 0 | 0 | 0 | 0 | |||||||||||||||
Trust Preferred Securities | 0 | 0 | 0 | 0 | 0 | |||||||||||||||
Total Minority Interest | 0 | 0 | 0 | 0 | 0 | |||||||||||||||
Other Mezzanine Items | 0 | 0 | 0 | 0 | 0 | |||||||||||||||
Total Mezzanine Level Items | 0 | 0 | 0 | 0 | 0 | |||||||||||||||
Equity ($000) | ||||||||||||||||||||
TARP Preferred Equity | 0 | 0 | 0 | 0 | 0 | |||||||||||||||
Other Preferred Equity | 0 | 0 | 0 | 0 | 0 | |||||||||||||||
Total Preferred Equity | 0 | 0 | 0 | 0 | 0 | |||||||||||||||
Common Equity | 53,275 | 56,643 | 55,902 | 67,274 | 80,332 | |||||||||||||||
Equity Attributable to Parent Company | 53,275 | 56,643 | 55,902 | 67,274 | 80,332 | |||||||||||||||
Noncontrolling Interests | 0 | 0 | 0 | 0 | 0 | |||||||||||||||
Total Equity | 53,275 | 56,643 | 55,902 | 67,274 | 80,332 | |||||||||||||||
Net Unrealized Gain | 232 | 626 | (1,520 | ) | 1,396 | 1,752 | ||||||||||||||
Tot Acc Other Comprehensive Inc | 232 | 626 | (2,233 | ) | 683 | 1,039 | ||||||||||||||
Balance Sheet Analysis (%) | ||||||||||||||||||||
Gross Loans HFI/ Total Assets | 62.13 | 61.23 | 57.67 | 55.70 | 58.74 | |||||||||||||||
Loans/ Deposits | 84.58 | 94.52 | 76.07 | 64.02 | 69.21 | |||||||||||||||
Loan Loss Reserves/ Gross Loans | 1.25 | 1.38 | 1.80 | 1.39 | 1.50 | |||||||||||||||
Reserves/ Loans Held For Investment | 1.25 | 1.38 | �� | 1.80 | 1.39 | 1.50 | ||||||||||||||
One Year Gap/ Assets | 0.72 | (14.10 | ) | (18.36 | ) | 1.73 | NA | |||||||||||||
1-4 Loans Serviced for Others ($000) | 0 | 0 | 0 | 0 | 0 | |||||||||||||||
Level 1 Assets ($000) | NA | 0 | 0 | 1,253 | 0 | |||||||||||||||
Level 2 Assets ($000) | NA | 102,266 | 107,246 | 94,790 | 101,562 | |||||||||||||||
Level 3 Assets ($000) | NA | 5,103 | 5,470 | 95,932 | 11,140 | |||||||||||||||
Level 1 Liabilities ($000) | NA | NA | NA | NA | NA | |||||||||||||||
Level 2 Liabilities ($000) | NA | NA | NA | NA | NA | |||||||||||||||
Level 3 Liabilities ($000) | NA | NA | NA | NA | NA | |||||||||||||||
FTE Employees (actual) | 43 | 51 | 67 | 114 | 111 | |||||||||||||||
Copyright 2011, SNL Financial LC
California United Bank (OTCBB: CUNB)
Balance Sheet
Period Ended Accounting Principle | 2007 FY 12/31/2007 U.S. GAAP | 2008 FY 12/31/2008 U.S. GAAP | 2009 FY 12/31/2009 U.S. GAAP | 2010 FY 12/31/2010 U.S. GAAP | 2011 FQ3 YTD 9/30/2011 U.S. GAAP | |||||||||||||||
Mark-to-Market Info ($000) | ||||||||||||||||||||
Cash & Short-term Assets Equity Adj | 0 | 0 | 0 | 0 | 0 | |||||||||||||||
AFS Securities Equity Adj | 0 | 0 | 0 | 0 | 0 | |||||||||||||||
HTM Securities Equity Adj | 0 | 0 | (25 | ) | 0 | 0 | ||||||||||||||
Securities Equity Adj | 0 | 0 | (25 | ) | 0 | 0 | ||||||||||||||
Loans AFS Equity Adj | 0 | 0 | 0 | 0 | 0 | |||||||||||||||
Net Loans Equity Adj | (229 | ) | (1,520 | ) | 4,684 | 624 | 2,361 | |||||||||||||
Other Assets Equity Adj | 0 | 0 | 0 | 0 | 0 | |||||||||||||||
Financial Asset Equity Adj | (229 | ) | (1,520 | ) | 4,659 | 624 | 2,361 | |||||||||||||
Deposits Equity Adj | (116 | ) | (1,177 | ) | 0 | 0 | 0 | |||||||||||||
FHLB Borrowings Equity Adj | (133 | ) | (603 | ) | (395 | ) | 0 | 0 | ||||||||||||
Total Debt Equity Adj | (133 | ) | (603 | ) | (395 | ) | 0 | 0 | ||||||||||||
Other Liabilities Equity Adj | 0 | 0 | 0 | 0 | 0 | |||||||||||||||
Financial Liability Equity Adj | (249 | ) | (1,780 | ) | (395 | ) | 0 | 0 | ||||||||||||
Off-balance Sheet Fair Value Adjustment | NA | NA | NA | NA | NA | |||||||||||||||
Mark-to-Market Equity | 52,797 | 53,343 | 60,166 | 67,898 | 82,693 | |||||||||||||||
Mark-to-Market Book Value | 10.85 | 10.81 | 12.12 | 11.43 | 12.35 | |||||||||||||||
Mark-to-Market Net Income | 125 | (929 | ) | 8,309 | (5,923 | ) | NA | |||||||||||||
Mark-to-Market EPS ($) | 0.04 | (0.18 | ) | 1.67 | (1.17 | ) | 0.00 | |||||||||||||
Annualized Growth Rates (%) | ||||||||||||||||||||
Asset Growth | 45.87 | 45.84 | 20.43 | 65.58 | 6.24 | |||||||||||||||
Gross Loans HFI Growth | 69.13 | 43.71 | 13.44 | 59.92 | 13.86 | |||||||||||||||
Deposit Growth | 64.42 | 28.61 | 40.95 | 90.00 | 2.83 | |||||||||||||||
Average Balances ($000) | ||||||||||||||||||||
Avg Gross Loans HFI | 137,566 | 197,645 | 238,175 | 291,073 | 434,737 | |||||||||||||||
Avg Loans HFS | 0 | 0 | 0 | 0 | 0 | |||||||||||||||
Average Loans, Gross of Reserves | 137,566 | 197,645 | 238,175 | 291,073 | 434,737 | |||||||||||||||
Avg Securities | 39,308 | 75,464 | 136,143 | 93,589 | 110,066 | |||||||||||||||
Avg Other Int Earn Assets | 28,523 | 26,202 | 36,327 | 142,591 | 189,608 | |||||||||||||||
Avg Secs & Other Int Earn Assets | 67,831 | 101,666 | 172,470 | 236,180 | 299,674 | |||||||||||||||
Avg Interest Earning Assets | 205,397 | 299,311 | 410,645 | 527,253 | 734,411 | |||||||||||||||
Avg Assets | 215,296 | 311,889 | 423,275 | 547,883 | 781,979 | |||||||||||||||
Avg CDs | 10,486 | 16,611 | 62,635 | 52,079 | 60,687 | |||||||||||||||
Avg Other Interest-bearing Deposits | 99,999 | 132,655 | 145,897 | 220,827 | 289,413 | |||||||||||||||
Avg Interest-bearing Deposits | 110,485 | 149,266 | 208,532 | 272,906 | 350,100 | |||||||||||||||
Avg Debt | 12,247 | 48,700 | 60,300 | 47,297 | 26,524 | |||||||||||||||
Avg Interest-bearing Liabs | 122,732 | 197,966 | 268,832 | 320,203 | 376,624 | |||||||||||||||
Avg Noninterest-bearing Deposits | 38,909 | 57,285 | 96,033 | 166,849 | 328,057 | |||||||||||||||
Avg Total Deposits | 149,394 | 206,551 | 304,565 | 439,755 | 678,157 | |||||||||||||||
Avg Preferred Equity | 0 | 0 | 0 | 0 | 0 | |||||||||||||||
Avg Common Equity | 52,449 | 54,871 | 56,592 | 59,102 | 75,330 | |||||||||||||||
Avg Equity | 52,449 | 54,871 | 56,592 | 59,102 | 75,330 | |||||||||||||||
Copyright 2011, SNL Financial LC
California United Bank (OTCBB: CUNB)
Income Statement
| 2007 FY | 2008 FY | 2009 FY | 2010 FY | 2011 FQ3 YTD | ||||||||||||||||
| Period Ended | 12/31/2007 | 12/31/2008 | 12/31/2009 | 12/31/2010 | 9/30/2011 | |||||||||||||||
| Accounting Principle | U.S. GAAP | U.S. GAAP | U.S. GAAP | U.S. GAAP | U.S. GAAP | |||||||||||||||
(in $000) | ||||||||||||||||||||
Interest Income | 14,668 | 17,158 | 20,131 | 20,566 | 21,414 | |||||||||||||||
Interest Expense | 4,527 | 4,046 | 2,537 | 2,191 | 1,062 | |||||||||||||||
Net Interest Income | 10,141 | 13,112 | 17,594 | 18,375 | 20,352 | |||||||||||||||
FTE Net Interest Income | NA | NA | NA | NA | NA | |||||||||||||||
Provision for Loan Losses | 730 | 1,185 | 3,461 | 2,542 | 661 | |||||||||||||||
Trading Account Income | 0 | 0 | 0 | 0 | 0 | |||||||||||||||
Foreign Exchange Income | 0 | 0 | 0 | 0 | 0 | |||||||||||||||
Trust Revenue | 0 | 0 | 0 | 0 | 0 | |||||||||||||||
Service Charges on Deposits | 147 | 398 | 774 | 970 | 1,360 | |||||||||||||||
Gain on Sale of Loans (FAS 140) | NA | NA | NA | 0 | 0 | |||||||||||||||
Loan Fees & Charges | NA | NA | NA | NA | NA | |||||||||||||||
Bank-owned Life Insurance Revenue | NA | NA | NA | 0 | NA | |||||||||||||||
Insurance Revenue | NA | NA | NA | 0 | 0 | |||||||||||||||
Investment Banking & Brokerage | 82 | 107 | 25 | 0 | 0 | |||||||||||||||
Other Noninterest Income | 171 | 182 | 142 | 248 | 417 | |||||||||||||||
Total Noninterest Income | 400 | 687 | 941 | 1,218 | 1,777 | |||||||||||||||
Realized Gain on Securities | 5 | (1,040 | ) | (408 | ) | (107 | ) | 85 | ||||||||||||
Nonrecurring Revenue | 0 | 0 | 0 | 0 | 0 | |||||||||||||||
Compensation & Benefits | 6,034 | 7,573 | 7,582 | 12,083 | 11,834 | |||||||||||||||
Occupancy & Equipment | 1,478 | 1,460 | 1,560 | 2,038 | 2,308 | |||||||||||||||
Marketing and Promotion Expense | 190 | 223 | 233 | 193 | 93 | |||||||||||||||
Professional Fees | 758 | 762 | 885 | 747 | 783 | |||||||||||||||
Tech & Communications Expense | 439 | 490 | 618 | 1,175 | 1,095 | |||||||||||||||
Amrt of Intang & Goodwill Impair | 0 | 0 | 0 | 0 | 103 | |||||||||||||||
Foreclosure & Repo | 0 | 0 | 0 | 0 | 0 | |||||||||||||||
Other Expense | 888 | 1,453 | 2,234 | 3,728 | 2,985 | |||||||||||||||
Total Noninterest Expense | 9,787 | 11,961 | 13,112 | 19,964 | 19,201 | |||||||||||||||
Nonrecurring Expense | 0 | 0 | 185 | 406 | 225 | |||||||||||||||
Pre-Provision Net Revenue | 754 | 1,838 | 5,423 | (371 | ) | 2,928 | ||||||||||||||
Non-FTE Pre-Provision Net Revenue | 754 | 1,838 | 5,423 | (371 | ) | 2,928 | ||||||||||||||
Net Income before Taxes | 29 | (387 | ) | 1,369 | (3,426 | ) | 2,127 | |||||||||||||
Provision for Taxes | 0 | (2,280 | ) | 624 | (1,143 | ) | 966 | |||||||||||||
Effective Tax Rate (%) | 0.00 | NM | 45.58 | NM | 45.42 | |||||||||||||||
Min Int & Oth after-tax Items | 0 | 0 | 0 | 0 | 0 | |||||||||||||||
Extraordinary Items | 0 | 0 | 0 | 0 | 0 | |||||||||||||||
Net Income | 29 | 1,893 | 745 | (2,283 | ) | 1,161 | ||||||||||||||
Net Income Attributable to Noncontrolling Int | 0 | 0 | 0 | 0 | 0 | |||||||||||||||
Net Income Attributable to Parent | 29 | 1,893 | 745 | (2,283 | ) | 1,161 | ||||||||||||||
Preferred Dividends | 0 | 0 | 0 | 0 | 0 | |||||||||||||||
Other Preferred Dividends after Net Income | 0 | 0 | 0 | 0 | 0 | |||||||||||||||
Other Changes to Net Income | 0 | 0 | 0 | 0 | 0 | |||||||||||||||
Net Income Avail to Common | 29 | 1,893 | 745 | (2,283 | ) | 1,161 | ||||||||||||||
Copyright 2011, SNL Financial LC
California United Bank (OTCBB: CUNB)
Income Statement
| 2007 FY | 2008 FY | 2009 FY | 2010 FY | 2011 FQ3 YTD | ||||||||||||||||
| Period Ended | 12/31/2007 | 12/31/2008 | 12/31/2009 | 12/31/2010 | 9/30/2011 | |||||||||||||||
| Accounting Principle | U.S. GAAP | U.S. GAAP | U.S. GAAP | U.S. GAAP | U.S. GAAP | |||||||||||||||
Net Income for Diluted EPS | 29 | 1,893 | 745 | (2,283 | ) | 1,161 | ||||||||||||||
EPS after Extra ($) | 0.01 | 0.37 | 0.15 | (0.45 | ) | 0.17 | ||||||||||||||
EPS after Extra Growth (%) | NM | NM | (59.5 | ) | NM | NM | ||||||||||||||
Pre-Provision Earnings Per Share ($) | 0.17 | 0.23 | 0.71 | (0.05 | ) | 0.28 | ||||||||||||||
Interest Income/ Expense Detail | ||||||||||||||||||||
Interest Income Earned On: | ||||||||||||||||||||
Interest Earned on Loans | 10,986 | 12,118 | 12,659 | 15,650 | 18,617 | |||||||||||||||
Int Inc: Securities | 2,216 | 4,355 | 7,350 | 4,543 | 2,311 | |||||||||||||||
Int Inc: Other Earn Assets | 1,466 | 685 | 122 | 373 | 486 | |||||||||||||||
Int Inc: Secs & Oth Earn Assets | 3,682 | 5,040 | 7,472 | 4,916 | 2,797 | |||||||||||||||
Int Inc: Total Earn Assets | 14,668 | 17,158 | 20,131 | 20,566 | 21,414 | |||||||||||||||
Interest Expense Incurred On: | ||||||||||||||||||||
Int Exp: CDs | 444 | 441 | 831 | 457 | 204 | |||||||||||||||
Int Exp: Other Deposits | 3,513 | 2,272 | 868 | 1,192 | 778 | |||||||||||||||
Int Exp: Total Deposits | 3,957 | 2,713 | 1,699 | 1,649 | 982 | |||||||||||||||
Int Exp: Debt | 570 | 1,333 | 838 | 542 | 80 | |||||||||||||||
Int Exp: Total Int-bearing Liab | 4,527 | 4,046 | 2,537 | 2,191 | 1,062 | |||||||||||||||
Copyright 2011, SNL Financial LC
Premier Commercial Bancorp (OTCBB: PCBP)
Financial Highlights
| 2007 FY | 2008 FY | 2009 FY | 2010 FY | 2011 FQ3 YTD | ||||||||||||||||
| Period Ended | 12/31/2007 | 12/31/2008 | 12/31/2009 | 12/31/2010 | 9/30/2011 | |||||||||||||||
| Accounting Principle | U.S. GAAP | U.S. GAAP | U.S. GAAP | U.S. GAAP | U.S. GAAP | |||||||||||||||
Balance Sheet ($000) | ||||||||||||||||||||
Total Assets | 357,154 | 405,532 | 367,807 | 433,230 | 449,752 | |||||||||||||||
Total Net Loans | 292,591 | 352,060 | 327,645 | 304,568 | 307,394 | |||||||||||||||
Total Deposits | 289,165 | 296,157 | 288,115 | 364,874 | 386,028 | |||||||||||||||
Equity Attributable to Parent Company | 35,441 | 37,368 | 38,108 | 39,395 | 41,275 | |||||||||||||||
Total Equity | 35,441 | 37,368 | 38,108 | 39,395 | 41,275 | |||||||||||||||
Profitability (%) | ||||||||||||||||||||
Net Income ($000) | 3,450 | 1,541 | 224 | 607 | 955 | |||||||||||||||
Net Income Attributable to Parent ($000) | 3,450 | 1,541 | 224 | 607 | 955 | |||||||||||||||
ROAA | 1.05 | 0.42 | 0.06 | 0.15 | 0.29 | |||||||||||||||
Core ROAA | 0.72 | 0.42 | 0.08 | 0.15 | 0.30 | |||||||||||||||
ROAE | 10.94 | 4.22 | 0.59 | 1.55 | 3.16 | |||||||||||||||
ROATCE | 10.94 | 4.22 | 0.59 | 1.55 | 3.16 | |||||||||||||||
Core ROAE | 7.11 | 4.22 | 0.90 | 1.55 | 3.27 | |||||||||||||||
Net Interest Margin | 4.22 | 3.77 | 3.39 | 3.14 | 2.62 | |||||||||||||||
Reported: Net Interest Margin | NA | NA | NA | NA | NA | |||||||||||||||
Efficiency Ratio | 75.13 | 79.37 | 71.65 | 79.86 | 73.38 | |||||||||||||||
Noninterest Inc/ Operating Rev | 25.71 | 16.02 | 15.92 | 12.98 | 32.23 | |||||||||||||||
Balance Sheet Ratios/ Capital (%) | ||||||||||||||||||||
Loans/ Deposits | 102.42 | 120.32 | 116.20 | 85.61 | 81.56 | |||||||||||||||
Securities/ Assets | 4.12 | 4.30 | 5.19 | 10.44 | 12.63 | |||||||||||||||
Total Equity/ Total Assets | 9.92 | 9.21 | 10.36 | 9.09 | 9.18 | |||||||||||||||
Tangible Equity/ Tangible Assets | 9.92 | 9.21 | 10.36 | 9.09 | 9.18 | |||||||||||||||
Tang Common Equity/ Tang Assets | 9.92 | 9.21 | 10.36 | 9.09 | 9.18 | |||||||||||||||
Tier 1 Common Capital Ratio | NA | NA | NA | NA | NA | |||||||||||||||
Tier 1 Ratio | NA | NA | NA | NA | NA | |||||||||||||||
Risk-based Capital Ratio | NA | 13.70 | 15.08 | 15.70 | NA | |||||||||||||||
Leverage Ratio (Bank, BHC Only) | NA | NA | NA | NA | NA | |||||||||||||||
Core Cap/ Tang Assets (OTS Only) | NA | NA | NA | NA | NA | |||||||||||||||
Asset Quality (%) | ||||||||||||||||||||
NPAs/ Assets | 0.37 | 0.14 | 2.04 | 1.83 | 0.80 | |||||||||||||||
NPAs & 90+ PD/ Assets | 0.37 | 0.14 | 2.04 | 1.83 | 0.80 | |||||||||||||||
NPAs/ Loans & REO | 0.45 | 0.16 | 2.24 | 2.54 | 1.14 | |||||||||||||||
Nonaccrual & 90+ & OREO/ Assets | 0.00 | 0.00 | 1.81 | 1.83 | 0.80 | |||||||||||||||
NPAs & 90+ PD/ Loans & REO | 0.45 | 0.16 | 2.24 | 2.54 | 1.14 | |||||||||||||||
NPA & Loans 90+/ Tangible Common Equity + LLR | 3.43 | 1.33 | 16.58 | 16.80 | 7.39 | |||||||||||||||
NCOs/ Avg Loans | 0.00 | 0.00 | 0.33 | 0.39 | 0.93 | |||||||||||||||
Loan Loss Reserves/ Gross Loans | 1.20 | 1.20 | 2.14 | 2.50 | 2.36 | |||||||||||||||
Reserves/ NPAs | 266.07 | 772.07 | 95.30 | 98.44 | 206.64 | |||||||||||||||
Loan Loss Provision/ NCO | NM | NM | 350.09 | 151.57 | 82.38 | |||||||||||||||
Copyright 2011, SNL Financial LC
Premier Commercial Bancorp (OTCBB: PCBP)
Financial Highlights
| 2007 FY | 2008 FY | 2009 FY | 2010 FY | 2011 FQ3 YTD | ||||||||||||||||
| Period Ended | 12/31/2007 | 12/31/2008 | 12/31/2009 | 12/31/2010 | 9/30/2011 | |||||||||||||||
| Accounting Principle | U.S. GAAP | U.S. GAAP | U.S. GAAP | U.S. GAAP | U.S. GAAP | |||||||||||||||
Per Share Information ($) | ||||||||||||||||||||
Common Shares Outstanding (actual) | 3,324,754 | 3,355,768 | 3,402,323 | 3,523,024 | 3,523,024 | |||||||||||||||
Avg Diluted Shares (actual) | 3,666,909 | 3,669,048 | 3,585,856 | 3,474,744 | 3,523,024 | |||||||||||||||
Basic Book Value per Share | 10.66 | 11.14 | 11.20 | 11.18 | 11.72 | |||||||||||||||
Reported: Book Value | NA | NA | NA | NA | NA | |||||||||||||||
Basic Tangible Book Value per Share | 10.66 | 11.14 | 11.20 | 11.18 | 11.72 | |||||||||||||||
Reported: Tangible Book Value | NA | NA | NA | NA | NA | |||||||||||||||
Common Dividends Declared per Share | 0.0000 | 0.0000 | 0.0000 | 0.0000 | 0.0000 | |||||||||||||||
EPS after Extra | 0.94 | 0.42 | 0.06 | 0.17 | 0.27 | |||||||||||||||
EPS after Extra Growth (%) | 104.3 | (55.3 | ) | (85.7 | ) | 183.3 | 107.7 | |||||||||||||
Core EPS | 0.64 | 0.42 | 0.09 | 0.17 | 0.28 | |||||||||||||||
Core EPS Growth (%) | 37.6 | (34.3 | ) | (78.2 | ) | 86.1 | 115.3 | |||||||||||||
Diluted EPS before Amortization | 0.94 | 0.42 | 0.06 | 0.17 | 0.27 | |||||||||||||||
Pre-Provision Earnings Per Share | 0.78 | 0.57 | 0.77 | 0.52 | 0.61 | |||||||||||||||
Copyright 2011, SNL Financial LC
Premier Commercial Bancorp (OTCBB: PCBP)
Performance Analysis
| 2007 FY | 2008 FY | 2009 FY | 2010 FY | 2011 FQ3 YTD | ||||||||||||||||
| Period Ended | 12/31/2007 | 12/31/2008 | 12/31/2009 | 12/31/2010 | 9/30/2011 | |||||||||||||||
| Accounting Principle | U.S. GAAP | U.S. GAAP | U.S. GAAP | U.S. GAAP | U.S. GAAP | |||||||||||||||
Profitability Ratios (%) | ||||||||||||||||||||
ROAA | 1.05 | 0.42 | 0.06 | 0.15 | 0.29 | |||||||||||||||
ROAE | 10.94 | 4.22 | 0.59 | 1.55 | 3.16 | |||||||||||||||
ROATCE | 10.94 | 4.22 | 0.59 | 1.55 | 3.16 | |||||||||||||||
ROACE | 10.94 | 4.22 | 0.59 | 1.55 | 3.16 | |||||||||||||||
ROATE | 10.94 | 4.22 | 0.59 | 1.55 | 3.16 | |||||||||||||||
Profit Margin | 22.04 | 15.99 | 2.78 | 6.44 | 11.81 | |||||||||||||||
Net Interest Margin | 4.22 | 3.77 | 3.39 | 3.14 | 2.62 | |||||||||||||||
Reported: Net Interest Margin | NA | NA | NA | NA | NA | |||||||||||||||
Yield: Interest Earning Assets | 7.54 | 6.29 | 5.16 | 4.61 | 3.76 | |||||||||||||||
Cost of Interest-bearing Liab | NA | NA | NA | NA | NA | |||||||||||||||
Interest Spread | NA | NA | NA | NA | NA | |||||||||||||||
Net Interest Income/ Avg Assets | 4.01 | 3.57 | 3.25 | 2.98 | 2.70 | |||||||||||||||
Noninterest Income/ Avg Assets | 1.39 | 0.68 | 0.62 | 0.44 | 1.29 | |||||||||||||||
Net Operating Expense/ Avg Assets | 2.67 | 2.70 | 2.15 | 2.29 | 1.64 | |||||||||||||||
Noninterest Inc/ Operating Rev | 25.71 | 16.02 | 15.92 | 12.98 | 32.23 | |||||||||||||||
Overhead Ratio | 66.52 | 75.43 | 66.28 | 76.86 | 60.72 | |||||||||||||||
Efficiency Ratio | 75.13 | 79.37 | 71.65 | 79.86 | 73.38 | |||||||||||||||
Net Nonrecurring Income/ NIBT | 0.00 | 0.08 | (70.31 | ) | 0.00 | 0.00 | ||||||||||||||
Yield/ Cost Detail (%) | ||||||||||||||||||||
Yield Earned On: | ||||||||||||||||||||
Yield: Total Loans | 7.83 | 6.43 | 5.52 | 5.29 | 5.32 | |||||||||||||||
Yield: Securities | 3.83 | 4.31 | 3.64 | 2.32 | NA | |||||||||||||||
Yield: Oth Int-earn Assets | 6.63 | 4.74 | 0.62 | 0.46 | NA | |||||||||||||||
Yield: Interest Earning Assets | 7.54 | 6.29 | 5.16 | 4.61 | 3.76 | |||||||||||||||
Cost Incurred By: | ||||||||||||||||||||
Int Cost: CDs | 4.98 | 3.92 | 2.82 | 2.49 | NA | |||||||||||||||
Int Cost: Other Deposits | 3.58 | 2.94 | 2.29 | 1.86 | NA | |||||||||||||||
Int Cost: Int-bearing Deposits | 4.02 | 3.27 | 2.47 | 1.98 | NA | |||||||||||||||
Int Cost: Total Deposits | 3.12 | 2.40 | 1.88 | 1.44 | 1.13 | |||||||||||||||
Int Cost: Debt | NA | NA | NA | NA | NA | |||||||||||||||
Cost of Interest-bearing Liab | NA | NA | NA | NA | NA | |||||||||||||||
Cost of Funds | NA | NA | NA | NA | NA | |||||||||||||||
Core Income | ||||||||||||||||||||
Core Income | 2,344 | 1,540 | 341 | 607 | 990 | |||||||||||||||
Core EPS ($) | 0.64 | 0.42 | 0.09 | 0.17 | 0.28 | |||||||||||||||
Core EPS before Amortization ($) | 0.64 | 0.42 | 0.09 | 0.17 | 0.28 | |||||||||||||||
Core ROAA (%) | 0.72 | 0.42 | 0.08 | 0.15 | 0.30 | |||||||||||||||
Core ROAE (%) | 7.11 | 4.22 | 0.90 | 1.55 | 3.27 | |||||||||||||||
Copyright 2011, SNL Financial LC
Premier Commercial Bancorp (OTCBB: PCBP)
Performance Analysis
| 2007 FY | 2008 FY | 2009 FY | 2010 FY | 2011 FQ3 YTD | ||||||||||||||||
| Period Ended | 12/31/2007 | 12/31/2008 | 12/31/2009 | 12/31/2010 | 9/30/2011 | |||||||||||||||
| Accounting Principle | U.S. GAAP | U.S. GAAP | U.S. GAAP | U.S. GAAP | U.S. GAAP | |||||||||||||||
Share and Per Share Info ($) | ||||||||||||||||||||
Basic EPS before Extra | 0.71 | 0.46 | 0.07 | 0.17 | 0.27 | |||||||||||||||
Basic EPS after Extra | 1.04 | 0.46 | 0.07 | 0.17 | 0.27 | |||||||||||||||
EPS before Extra | 0.64 | 0.42 | 0.06 | 0.17 | 0.27 | |||||||||||||||
EPS after Extra | 0.94 | 0.42 | 0.06 | 0.17 | 0.27 | |||||||||||||||
Diluted EPS before Amortization | 0.94 | 0.42 | 0.06 | 0.17 | 0.27 | |||||||||||||||
Basic Book Value per Share | 10.66 | 11.14 | 11.20 | 11.18 | 11.72 | |||||||||||||||
Basic Tangible Book Value per Share | 10.66 | 11.14 | 11.20 | 11.18 | 11.72 | |||||||||||||||
Common Dividends Declared per Share | 0.0000 | 0.0000 | 0.0000 | 0.0000 | 0.0000 | |||||||||||||||
Dividend Payout Ratio (%) | 0.00 | 0.00 | 0.00 | 0.00 | 0.00 | |||||||||||||||
Avg Diluted Shares Out (actual) | 3,666,909 | 3,669,048 | 3,585,856 | 3,474,744 | 3,523,024 | |||||||||||||||
Common Shares Outstanding (actual) | 3,324,754 | 3,355,768 | 3,402,323 | 3,523,024 | 3,523,024 | |||||||||||||||
Market Info and Historical Pricing | ||||||||||||||||||||
Closing Price ($) | 14.75 | 8.50 | 7.49 | 7.50 | 9.15 | |||||||||||||||
Price/ LTM EPS (x) | 15.7 | 20.2 | NM | 44.1 | 29.5 | |||||||||||||||
Price/ Book (%) | 138.4 | 76.3 | 66.9 | 67.1 | 78.1 | |||||||||||||||
Price/ Tangible Book (%) | 138.4 | 76.3 | 66.9 | 67.1 | 78.1 | |||||||||||||||
Market Capitalization ($M) | 49.0 | 28.5 | 25.5 | 26.4 | 32.2 | |||||||||||||||
SNL U.S. Bank Index at Period End | 492.85 | 268.30 | 260.81 | 290.08 | 198.89 | |||||||||||||||
S&P 500 at Period End | 1,468.36 | 903.25 | 1,115.10 | 1,257.64 | 1,131.42 | |||||||||||||||
DJIA at Period End | 13,264.82 | 8,776.39 | 10,428.05 | 11,577.51 | 10,913.38 | |||||||||||||||
Copyright 2011, SNL Financial LC
Premier Commercial Bancorp (OTCBB: PCBP)
Balance Sheet
| 2007 FY | 2008 FY | 2009 FY | 2010 FY | 2011 FQ3 YTD | ||||||||||||||||
| Period Ended | 12/31/2007 | 12/31/2008 | 12/31/2009 | 12/31/2010 | 9/30/2011 | |||||||||||||||
| Accounting Principle | U.S. GAAP | U.S. GAAP | U.S. GAAP | U.S. GAAP | U.S. GAAP | |||||||||||||||
Assets ($000) | ||||||||||||||||||||
Cash and Due from Banks | 7,408 | 17,846 | 6,287 | 17,021 | 24,417 | |||||||||||||||
Fed Funds Sold | 29,490 | 4,985 | 2,275 | 54,475 | 48,040 | |||||||||||||||
Deposits at Financial Institutions | 0 | 0 | 0 | 0 | 0 | |||||||||||||||
Securities Purchased, to Resell | 0 | 0 | 0 | 0 | 0 | |||||||||||||||
Other Cash & Cash Equivalents | 0 | 0 | 0 | 0 | 0 | |||||||||||||||
Cash and Cash Equivalents | 36,898 | 22,831 | 8,562 | 71,496 | 72,457 | |||||||||||||||
Trading Account Securities | 0 | 0 | 0 | 0 | 0 | |||||||||||||||
Available for Sale Securities | 9,280 | 13,210 | 12,388 | 39,260 | 51,880 | |||||||||||||||
Held to Maturity Securities | 5,438 | 4,212 | 2,482 | 1,942 | 1,182 | |||||||||||||||
Other Securities | 0 | 0 | 4,204 | 4,015 | 3,736 | |||||||||||||||
Total Cash & Securities | 51,616 | 40,253 | 27,636 | 116,713 | 129,255 | |||||||||||||||
Gross Loans Held for Investment | 296,151 | 356,344 | 334,796 | 312,374 | 314,831 | |||||||||||||||
Loan Loss Reserve | 3,560 | 4,285 | 7,151 | 7,806 | 7,437 | |||||||||||||||
Loans Held for Sale, before Reserves | 0 | 0 | 0 | 0 | 0 | |||||||||||||||
Total Net Loans | 292,591 | 352,060 | 327,645 | 304,568 | 307,394 | |||||||||||||||
Memo: Covered Loans | 0 | 0 | 0 | 0 | 0 | |||||||||||||||
Memo: Covered OREO | 0 | 0 | 0 | 0 | 0 | |||||||||||||||
Memo: Covered Securities | 0 | 0 | 0 | 0 | 0 | |||||||||||||||
Memo: Covered Assets | 0 | 0 | 0 | 0 | 0 | |||||||||||||||
Real Estate Owned and Held for Investment | 0 | 0 | 0 | 0 | 0 | |||||||||||||||
Goodwill | 0 | 0 | 0 | 0 | 0 | |||||||||||||||
Core Deposit Intangibles | 0 | 0 | 0 | 0 | 0 | |||||||||||||||
Other Intangibles | 0 | 0 | 0 | 0 | 0 | |||||||||||||||
Intangible Assets other than Goodwill | 0 | 0 | 0 | 0 | 0 | |||||||||||||||
Total Intangible Assets | 0 | 0 | 0 | 0 | 0 | |||||||||||||||
Loan Servicing Rights | 0 | 0 | 0 | 0 | 0 | |||||||||||||||
Credit Card Rights | 0 | NA | NA | NA | NA | |||||||||||||||
Other Loan Servicing Rights | 0 | NA | NA | NA | NA | |||||||||||||||
Total Servicing Rights | 0 | 222 | 318 | 360 | 1,057 | |||||||||||||||
Memo: Consolidated VIE Assets | NA | NA | NA | NA | 0 | |||||||||||||||
Fixed Assets | 1,475 | 1,209 | 857 | 584 | 502 | |||||||||||||||
Interest Receivable | 1,790 | 1,627 | 1,458 | 1,414 | 1,605 | |||||||||||||||
Prepaid Expense | 0 | 312 | 0 | NA | NA | |||||||||||||||
Bank-owned Life Insurance | NA | NA | NA | 3,478 | 3,567 | |||||||||||||||
Other Assets | 9,682 | 9,850 | 9,893 | 6,112 | 6,372 | |||||||||||||||
Total Other Assets | 12,947 | 12,998 | 12,208 | 11,588 | 12,046 | |||||||||||||||
Total Assets | 357,154 | 405,532 | 367,807 | 433,230 | 449,752 | |||||||||||||||
Copyright 2011, SNL Financial LC
Premier Commercial Bancorp (OTCBB: PCBP)
Balance Sheet
| 2007 FY | 2008 FY | 2009 FY | 2010 FY | 2011 FQ3 YTD | ||||||||||||||||
| Period Ended | 12/31/2007 | 12/31/2008 | 12/31/2009 | 12/31/2010 | 9/30/2011 | |||||||||||||||
| Accounting Principle | U.S. GAAP | U.S. GAAP | U.S. GAAP | U.S. GAAP | U.S. GAAP | |||||||||||||||
Liabilities ($000) | ||||||||||||||||||||
Total Deposits | 289,165 | 296,157 | 288,115 | 364,874 | 386,028 | |||||||||||||||
FHLB Borrowings | 15,000 | 50,000 | 13,000 | 0 | 0 | |||||||||||||||
Senior Debt | 15,000 | 50,000 | 23,000 | 8,788 | 0 | |||||||||||||||
Trust Preferred (FAS 150) | 12,372 | 12,372 | 12,372 | 12,372 | 12,372 | |||||||||||||||
Total Subordinated Debt | 12,372 | 12,372 | 12,372 | 12,372 | 12,372 | |||||||||||||||
Redeemable Financial Instruments (FAS 150) | 0 | 0 | 0 | 0 | 0 | |||||||||||||||
Total Debt | 27,372 | 62,372 | 35,372 | 21,160 | 12,372 | |||||||||||||||
Memo: Consolidated VIE Liabilities | NA | NA | NA | NA | 0 | |||||||||||||||
Total Other Liabilities | 5,175 | 9,635 | 6,212 | 7,801 | 10,077 | |||||||||||||||
Total Liabilities | 321,713 | 368,164 | 329,699 | 393,835 | 408,477 | |||||||||||||||
Mezzanine ($000) | ||||||||||||||||||||
Redeemable Preferred | 0 | 0 | 0 | 0 | 0 | |||||||||||||||
Trust Preferred Securities | 0 | 0 | 0 | 0 | 0 | |||||||||||||||
Total Minority Interest | 0 | 0 | 0 | 0 | 0 | |||||||||||||||
Other Mezzanine Items | 0 | 0 | 0 | 0 | 0 | |||||||||||||||
Total Mezzanine Level Items | 0 | 0 | 0 | 0 | 0 | |||||||||||||||
Equity ($000) | ||||||||||||||||||||
TARP Preferred Equity | 0 | 0 | 0 | 0 | 0 | |||||||||||||||
Other Preferred Equity | 0 | 0 | 0 | 0 | 0 | |||||||||||||||
Total Preferred Equity | 0 | 0 | 0 | 0 | 0 | |||||||||||||||
Common Equity | 35,441 | 37,368 | 38,108 | 39,395 | 41,275 | |||||||||||||||
Equity Attributable to Parent Company | 35,441 | 37,368 | 38,108 | 39,395 | 41,275 | |||||||||||||||
Noncontrolling Interests | 0 | 0 | 0 | 0 | 0 | |||||||||||||||
Total Equity | 35,441 | 37,368 | 38,108 | 39,395 | 41,275 | |||||||||||||||
Net Unrealized Gain | 19 | 151 | 69 | 11 | 402 | |||||||||||||||
Tot Acc Other Comprehensive Inc | (9 | ) | 123 | 41 | (17 | ) | 374 | |||||||||||||
Balance Sheet Analysis (%) | ||||||||||||||||||||
Gross Loans HFI/ Total Assets | 82.92 | 87.87 | 91.02 | 72.10 | 70.00 | |||||||||||||||
Loans/ Deposits | 102.42 | 120.32 | 116.20 | 85.61 | 81.56 | |||||||||||||||
Loan Loss Reserves/ Gross Loans | 1.20 | 1.20 | 2.14 | 2.50 | 2.36 | |||||||||||||||
Reserves/ Loans Held For Investment | 1.20 | 1.20 | 2.14 | 2.50 | 2.36 | |||||||||||||||
One Year Gap/ Assets | NA | NA | NA | NA | NA | |||||||||||||||
1-4 Loans Serviced for Others ($000) | 0 | 0 | 0 | 0 | 0 | |||||||||||||||
FTE Employees (actual) | 66 | 62 | 56 | 56 | 57 | |||||||||||||||
Annualized Growth Rates (%) | ||||||||||||||||||||
Asset Growth | 4.55 | 13.55 | (9.30 | ) | 17.79 | 5.08 | ||||||||||||||
Gross Loans HFI Growth | 10.23 | 20.33 | (6.05 | ) | (6.70 | ) | 1.05 | |||||||||||||
Deposit Growth | 0.48 | 2.42 | (2.72 | ) | 26.64 | 7.73 | ||||||||||||||
Copyright 2011, SNL Financial LC
Premier Commercial Bancorp (OTCBB: PCBP)
Balance Sheet
| 2007 FY | 2008 FY | 2009 FY | 2010 FY | 2011 FQ3 YTD | ||||||||||||||||
| Period Ended | 12/31/2007 | 12/31/2008 | 12/31/2009 | 12/31/2010 | 9/30/2011 | |||||||||||||||
| Accounting Principle | U.S. GAAP | U.S. GAAP | U.S. GAAP | U.S. GAAP | U.S. GAAP | |||||||||||||||
Average Balances ($000) | ||||||||||||||||||||
Avg Gross Loans HFI | 280,437 | 321,910 | 351,677 | 325,742 | 300,213 | |||||||||||||||
Avg Loans HFS | 0 | 0 | 0 | 0 | 0 | |||||||||||||||
Average Loans, Gross of Reserves | 280,437 | 321,910 | 351,677 | 325,742 | 300,213 | |||||||||||||||
Avg Securities | 18,274 | 13,860 | 14,266 | 22,445 | NA | |||||||||||||||
Avg Other Int Earn Assets | 12,280 | 11,487 | 23,339 | 40,861 | NA | |||||||||||||||
Avg Secs & Other Int Earn Assets | 30,554 | 25,347 | 37,606 | 63,307 | 159,404 | |||||||||||||||
Avg Interest Earning Assets | 310,991 | 347,257 | 389,283 | 389,049 | 459,617 | |||||||||||||||
Avg Assets | 327,278 | 366,626 | 405,806 | 410,564 | 444,755 | |||||||||||||||
Avg CDs | 73,114 | 81,503 | 80,221 | 46,498 | NA | |||||||||||||||
Avg Other Interest-bearing Deposits | 158,891 | 158,902 | 156,273 | 204,604 | NA | |||||||||||||||
Avg Interest-bearing Deposits | 232,005 | 240,405 | 236,494 | 251,102 | NA | |||||||||||||||
Avg Debt | NA | NA | NA | NA | NA | |||||||||||||||
Avg Interest-bearing Liabs | NA | NA | NA | NA | NA | |||||||||||||||
Avg Noninterest-bearing Deposits | 67,217 | 86,782 | 73,295 | 94,634 | NA | |||||||||||||||
Avg Total Deposits | 299,222 | 327,187 | 309,790 | 345,737 | 409,336 | |||||||||||||||
Avg Preferred Equity | 0 | 0 | 0 | 0 | 0 | |||||||||||||||
Avg Common Equity | 31,543 | 36,488 | 37,781 | 39,042 | 40,353 | |||||||||||||||
Avg Equity | 31,543 | 36,488 | 37,781 | 39,042 | 40,353 | |||||||||||||||
Copyright 2011, SNL Financial LC
Premier Commercial Bancorp (OTCBB: PCBP)
Income Statement
| 2007 FY | 2008 FY | 2009 FY | 2010 FY | 2011 FQ3 YTD | ||||||||||||||||
Period Ended Accounting Principle | 12/31/2007 U.S. GAAP | 12/31/2008 U.S. GAAP | 12/31/2009 U.S. GAAP | 12/31/2010 U.S. GAAP | 9/30/2011 U.S. GAAP | |||||||||||||||
(in $000) | ||||||||||||||||||||
Interest Income | 23,463 | 21,832 | 20,079 | 17,932 | 12,975 | |||||||||||||||
Interest Expense | 10,334 | 8,731 | 6,888 | 5,698 | 3,954 | |||||||||||||||
Net Interest Income | 13,129 | 13,101 | 13,191 | 12,234 | 9,021 | |||||||||||||||
FTE Net Interest Income | 13,129 | NA | NA | NA | NA | |||||||||||||||
Provision for Loan Losses | 500 | 725 | 4,012 | 1,925 | 1,725 | |||||||||||||||
Trading Account Income | 0 | 0 | 0 | 0 | 0 | |||||||||||||||
Foreign Exchange Income | 0 | 0 | 0 | 0 | 0 | |||||||||||||||
Trust Revenue | 0 | 0 | 0 | 0 | 0 | |||||||||||||||
Service Charges on Deposits | 109 | 247 | 352 | 353 | 343 | |||||||||||||||
Gain on Sale of Loans (FAS 140) | 914 | 94 | 859 | 669 | 3,236 | |||||||||||||||
Loan Fees & Charges | 0 | 0 | 0 | NA | NA | |||||||||||||||
Bank-owned Life Insurance Revenue | 0 | 117 | 117 | 119 | 89 | |||||||||||||||
Insurance Revenue | 0 | 0 | 0 | 0 | 0 | |||||||||||||||
Investment Banking & Brokerage | 0 | 0 | 0 | 0 | 0 | |||||||||||||||
Other Noninterest Income | 3,521 | 2,041 | 1,170 | 684 | 623 | |||||||||||||||
Total Noninterest Income | 4,544 | 2,499 | 2,498 | 1,825 | 4,290 | |||||||||||||||
Realized Gain on Securities | 13 | 0 | 0 | 0 | (54 | ) | ||||||||||||||
Nonrecurring Revenue | 0 | 2 | 0 | 0 | 0 | |||||||||||||||
Compensation & Benefits | 7,272 | 6,881 | 6,272 | 6,144 | 5,500 | |||||||||||||||
Occupancy & Equipment | 1,492 | 1,478 | 1,515 | 1,426 | 1,035 | |||||||||||||||
Marketing and Promotion Expense | NA | NA | NA | NA | NA | |||||||||||||||
Professional Fees | NA | 150 | 164 | 524 | 350 | |||||||||||||||
Tech & Communications Expense | 331 | 427 | 438 | 566 | 505 | |||||||||||||||
Amrt of Intang & Goodwill Impair | 0 | 0 | 0 | 0 | 0 | |||||||||||||||
Foreclosure & Repo | NA | NA | NA | 0 | 246 | |||||||||||||||
Other Expense | 4,182 | 3,445 | 2,852 | 2,568 | 2,378 | |||||||||||||||
Total Noninterest Expense | 13,277 | 12,381 | 11,241 | 11,228 | 10,014 | |||||||||||||||
Nonrecurring Expense | 0 | 0 | 180 | 0 | 0 | |||||||||||||||
Pre-Provision Net Revenue | 4,396 | 3,219 | 4,448 | 2,831 | 3,297 | |||||||||||||||
Non-FTE Pre-Provision Net Revenue | 4,396 | 3,219 | 4,448 | 2,831 | 3,297 | |||||||||||||||
Net Income before Taxes | 3,909 | 2,496 | 256 | 906 | 1,518 | |||||||||||||||
Provision for Taxes | 1,557 | 955 | 32 | 299 | 563 | |||||||||||||||
Effective Tax Rate (%) | 39.83 | 38.26 | 12.50 | 33.00 | 37.09 | |||||||||||||||
Min Int & Oth after-tax Items | NA | 0 | 0 | 0 | 0 | |||||||||||||||
Extraordinary Items | 1,098 | 0 | 0 | 0 | 0 | |||||||||||||||
Net Income | 3,450 | 1,541 | 224 | 607 | 955 | |||||||||||||||
Net Income Attributable to Noncontrolling Int | 0 | 0 | 0 | 0 | 0 | |||||||||||||||
Net Income Attributable to Parent | 3,450 | 1,541 | 224 | 607 | 955 | |||||||||||||||
Preferred Dividends | 0 | 0 | 0 | 0 | 0 | |||||||||||||||
Other Preferred Dividends after Net Income | 0 | 0 | 0 | 0 | 0 | |||||||||||||||
Other Changes to Net Income | 0 | 0 | 0 | 0 | 0 | |||||||||||||||
Net Income Avail to Common | 3,450 | 1,541 | 224 | 607 | 955 | |||||||||||||||
Copyright 2011, SNL Financial LC
Premier Commercial Bancorp (OTCBB: PCBP)
Income Statement
| 2007 FY | 2008 FY | 2009 FY | 2010 FY | 2011 FQ3 YTD | ||||||||||||||||
Period Ended Accounting Principle | 12/31/2007 U.S. GAAP | 12/31/2008 U.S. GAAP | 12/31/2009 U.S. GAAP | 12/31/2010 U.S. GAAP | 9/30/2011 U.S. GAAP | |||||||||||||||
Net Income for Diluted EPS | 3,450 | 1,541 | 224 | 607 | 955 | |||||||||||||||
EPS after Extra ($) | 0.94 | 0.42 | 0.06 | 0.17 | 0.27 | |||||||||||||||
EPS after Extra Growth (%) | 104.3 | (55.3 | ) | (85.7 | ) | 183.3 | 107.7 | |||||||||||||
Pre-Provision Earnings Per Share ($) | 0.78 | 0.57 | 0.77 | 0.52 | 0.61 | |||||||||||||||
Interest Income/ Expense Detail | ||||||||||||||||||||
Interest Income Earned On: | ||||||||||||||||||||
Interest Earned on Loans | 21,950 | 20,690 | 19,415 | 17,223 | 11,971 | |||||||||||||||
Int Inc: Securities | 699 | 598 | 519 | 521 | 779 | |||||||||||||||
Int Inc: Other Earn Assets | 814 | 544 | 145 | 188 | 225 | |||||||||||||||
Int Inc: Secs & Oth Earn Assets | 1,513 | 1,142 | 664 | 709 | 1,004 | |||||||||||||||
Int Inc: Total Earn Assets | 23,463 | 21,832 | 20,079 | 17,932 | 12,975 | |||||||||||||||
Interest Expense Incurred On: | ||||||||||||||||||||
Int Exp: CDs | 3,640 | 3,196 | 2,260 | 1,159 | 1,115 | |||||||||||||||
Int Exp: Other Deposits | 5,692 | 4,665 | 3,578 | 3,812 | 2,347 | |||||||||||||||
Int Exp: Total Deposits | 9,332 | 7,861 | 5,838 | 4,971 | 3,462 | |||||||||||||||
Int Exp: Debt | 1,002 | 870 | 1,050 | 727 | 492 | |||||||||||||||
Int Exp: Total Int-bearing Liab | 10,334 | 8,731 | 6,888 | 5,698 | 3,954 | |||||||||||||||
Copyright 2011, SNL Financial LC