Exhibit 99.1
Investor Presentation First Quarter 2013 Results
Litigation negatively number of forward-looking which could risks and liquidity risks; are less obligations; the or
|
 |
Forward-Looking Statements This presentation contains certain forward-looking information about CU Bancorp and California United Bank (collectively the “Company”) that is intended to be covered by the safe harbor for “forward-looking statements” provided by the Private Securities Reform Act of 1995. All statements other than statements of historical fact are forward-looking statements. Such statements involve inherent risks and uncertainties, many of which are difficult to predict and are generally beyond the control of the Company. There are a important factors that could cause actual results to differ materially from those expressed in, implied or projected by, such statements. Risks and uncertainties include but are not limited to lower than expected revenues; credit quality deterioration cause an increase in the allowance for loan losses and a reduction in net earnings; increased competitive pressure among depository institutions; a change in the interest rate environment which could reduce interest margins; asset/liability repricing general economic conditions, either nationally or in the market areas in which the Company does or anticipates doing business favorable than expected; environmental conditions, including natural disasters, may disrupt our business, impede our operations, impact the values of collateral security for the Company’s loans or impair the ability of our borrowers to support their debt economic and regulatory effects of the continuing war on terrorism and other events of war; legislative, accounting or regulatory requirements or changes adversely affecting the Company’s business; and changes in the securities markets. If any of these risks uncertainties materializes or if any of the assumptions underlying such forward-looking statements proves to be incorrect, the Company’s results could differ materially from those expressed in, implied or projected by such forward-looking statements. The Company assumes no obligation to update such forward-looking statements. For a more complete discussion of risks and uncertainties, read the Company’s annual report on Form 10-K, quarterly reports on Form 10-Q and other reports filed by the Company with the SEC. The documents filed with the SEC may be obtained on the Investor Relations page of the Company’s website at www.cunb.com. These documents may also be obtained free of charge from CU Bancorp by directing a request to CU Bancorp, 15821 Ventura Boulevard, Suite 100, Encino, California 91436, Attention: Investor Relations. Telephone 818 257-7700.
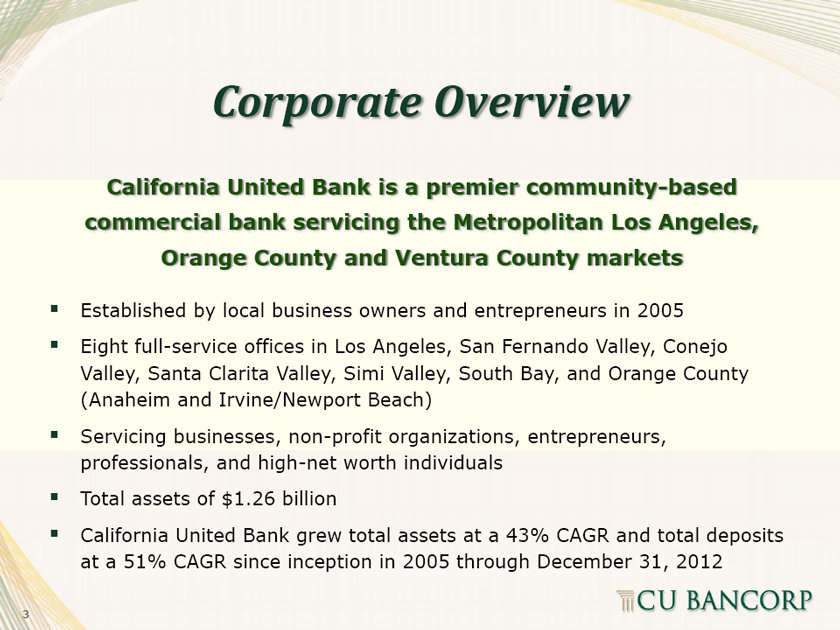
Corporate Overview California United Bank is a premier community-based commercial bank servicing the Metropolitan Los Angeles, Orange County and Ventura County markets Established by local business owners and entrepreneurs in 2005 Eight full-service offices in Los Angeles, San Fernando Valley, Conejo Valley, Santa Clarita Valley, Simi Valley, South Bay, and Orange County (Anaheim and Irvine/Newport Beach) Servicing businesses, non-profit organizations, entrepreneurs, professionals, and high-net worth individuals Total assets of $1.26 billion California United Bank grew total assets at a 43% CAGR and total deposits at a 51% CAGR since inception in 2005 through December 31, 2012
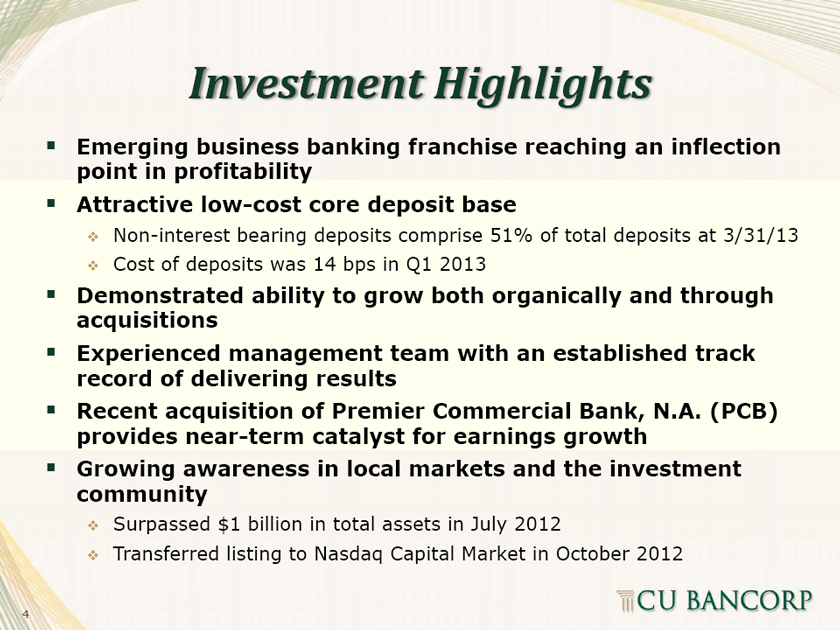
Investment Highlights Surpassed $1 billion in total assets in July 2012 Capital Market in October 2012 Non-interest bearing deposits comprise 51% of total deposits at 3/31/13 Cost of deposits was 14 bps in Q1 2013 Transferred listing to Nasdaq
Emerging business banking franchise reaching an inflection point in profitability Attractive low-cost core deposit base Demonstrated ability to grow both organically and through acquisitions Experienced management team with an established track record of delivering results Recent acquisition of Premier Commercial Bank, N.A. (PCB) provides near-term catalyst for earnings growth Growing awareness in local markets and the investment community
Strategic Geographic Locations
Loan Acquired from
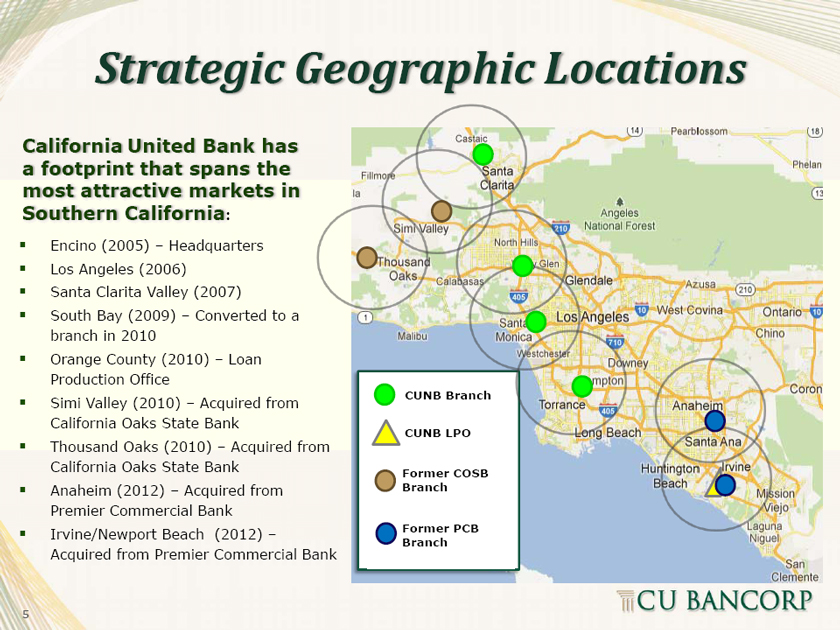
United Bank has : Headquarters Converted to a Acquired from Acquired from (2012) –California a footprint that spans the most attractive markets in Southern California Encino (2005) – Los Angeles (2006) Santa Clarita Valley (2007) South Bay (2009) – branch in 2010 Orange County (2010) – Production Office Simi Valley (2010) – California Oaks State Bank Thousand Oaks (2010) – California Oaks State Bank Anaheim (2012) – Premier Commercial Bank Irvine/Newport Beach Acquired from Premier Commercial Bank
CUNB Branch CUNB LPO Former COSB Branch Former PCB Branch
th
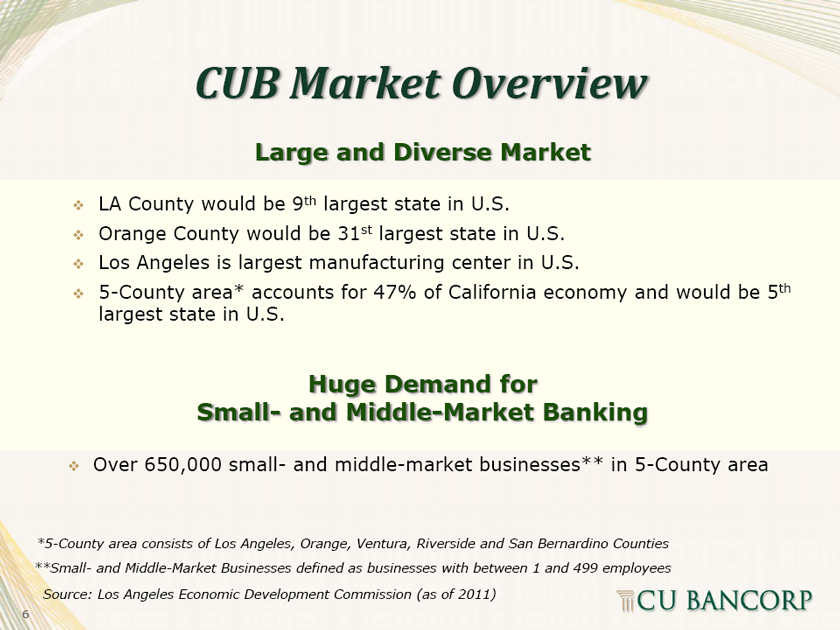
largest state in U.S. largest state in U.S. st Huge Demand for Large and Diverse Market th and Middle-Market Banking and middle-market businesses** in 5-County area
CUB Market Overview LA County would be 9 Orange County would be 31 Los Angeles is largest manufacturing center in U.S. 5-County area* accounts for 47% of California economy and would be 5 largest state in U.S. Small— Over 650,000 small— and Middle-Market Businesses defined as businesses with between 1 and 499 employees
*5-County area consists of Los Angeles, Orange, Ventura, Riverside and San Bernardino Counties **Small—Source: Los Angeles Economic Development Commission (as of 2011)
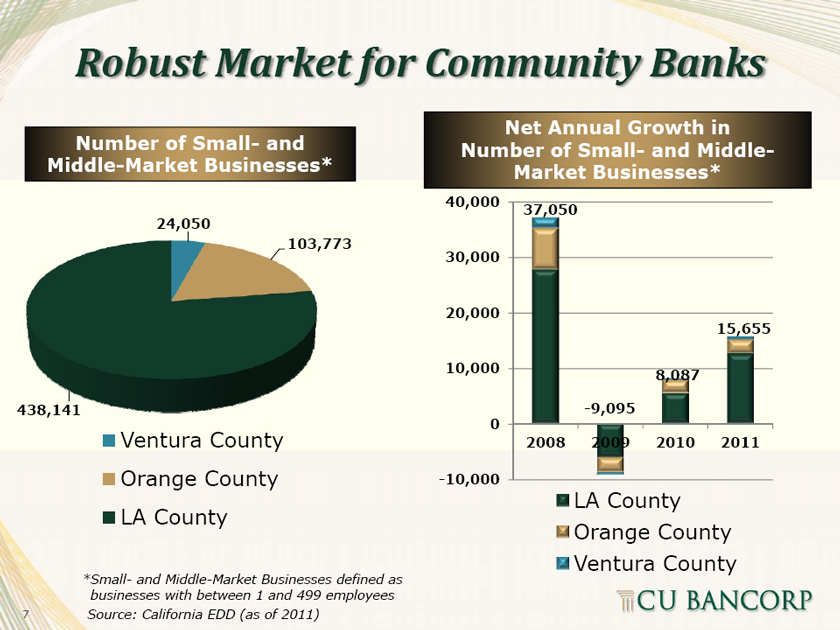
Robust Market for Community Banks
and Number of Small—Middle-Market Businesses*
103,773
24,050 Ventura County Orange County LA County and Middle-Market Businesses defined as businesses with between 1 and 499 employees Source: California EDD (as of 2011) *Small-
438,141 7
Net Annual Growth in and Middle—Market Businesses* Number of Small-
15,655 2011 8,087 2010
-9,095 2009 LA County Orange County Ventura County
37,050 2008 40,000 30,000 20,000 10,000 0 —10,000
Why We Are Different Strong growth combined with stellar asset quality Formula lines of credit Asset-based lending Demonstrated ability to identify, acquire and successfully integrate banks Multiple experienced banking teams added from competitors since 2010
CUNB has been engaged in the successful practice of business banking since its inception We have the ability to do larger, more complex financings than similar sized banks Executive team has extensive experience building high performing banks Proven ability to attract top bankers Local advisory boards guide the Bank in its respective business communities
Our Customers Our customer base reflects the diversity of industries in Southern California Majority of customers participate in the manufacturing, distribution and services industries annual sales (excluding SBA borrowers)
Typical customer has between $10 million and $60 million in Typical loan commitment ranges between $1 million and $5 million (excluding SBA loans) Majority of new customers come from larger banks Most new business generation results from warm leads provided by referral sources
9
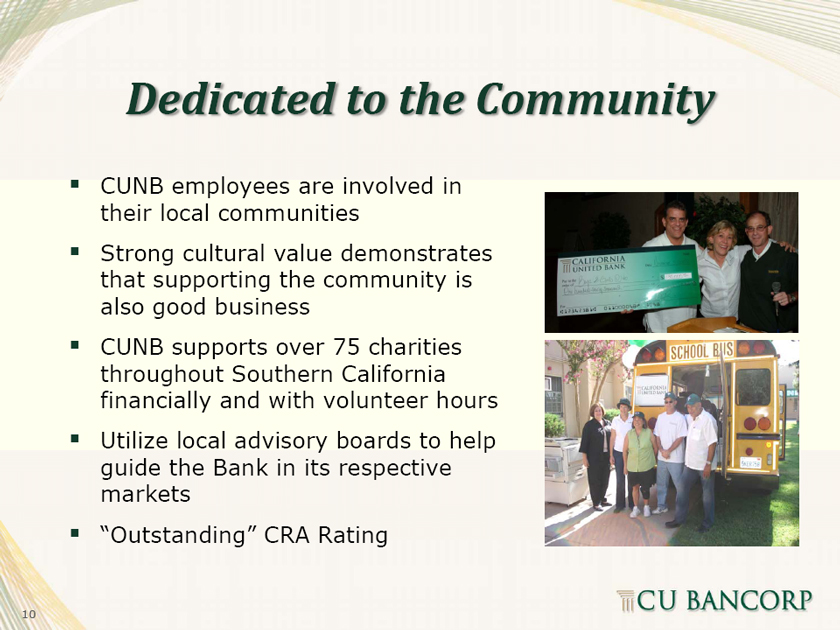
Dedicated to the Community CUNB employees are involved in their local communities Strong cultural value demonstrates that supporting the community is also good business CUNB supports over 75 charities throughout Southern California financially and with volunteer hours Utilize local advisory boards to help guide the Bank in its respective markets “Outstanding” CRA Rating
10
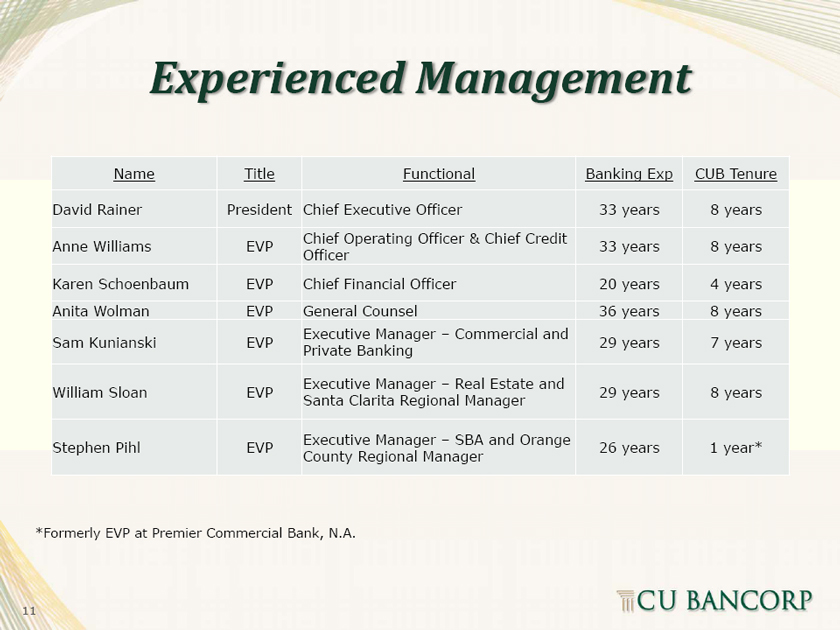
Experienced Management
Tenure
8 | | years 8 years 4 years 8 years 7 years 8 years 1 year* |
CUB
Exp
33 years 33 years 20 years 36 years 29 years 29 years 26 years
Banking e Commercial and Real Estate and SBA and Orang Functional Executive Manager – Santa Clarita Regional Manager Executive Manager – County Regional Manager Chief Executive Officer Chief Operating Officer & Chief Credit Officer Chief Financial Officer General Counsel Executive Manager – Private Banking Title President EVP EVP EVP EVP EVP EVP
Name David Rainer Anne Williams Karen Schoenbaum Anita Wolman Sam Kunianski William Sloan Stephen Pihl *Formerly EVP at Premier Commercial Bank, N.A.
11
banking of decades three . The same Executive Team that
Market
California
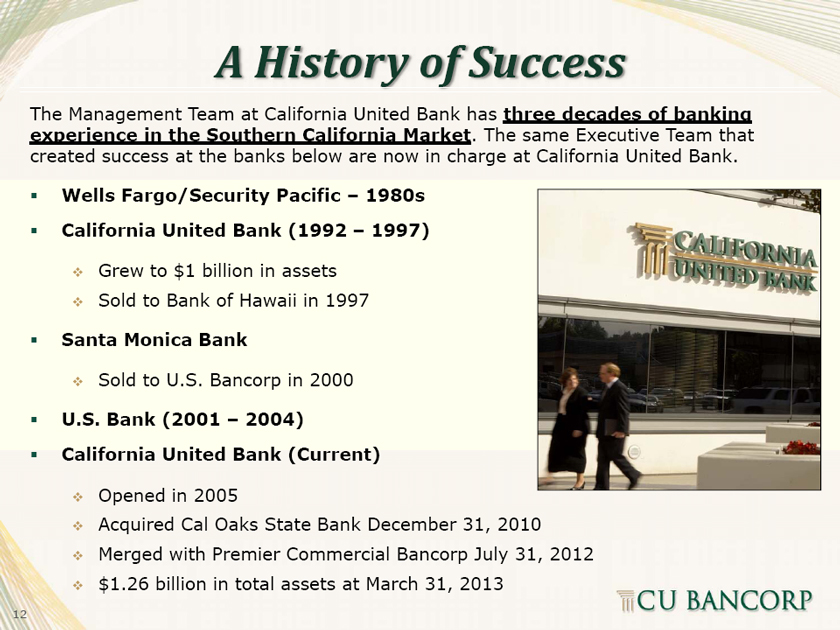
A History of Success
Southern the in
The Management Team at California United Bank has created success at the banks below are now in charge at California United Bank. experience
1980s 1997)
Sold to U.S. Bancorp in 2000 2004)
Grew to $1 billion in assets Sold to Bank of Hawaii in 1997 Opened in 2005 Acquired Cal Oaks State Bank December 31, 2010 Merged with Premier Commercial Bancorp July 31, 2012 $1.26 billion in total assets at March 31, 2013
Wells Fargo/Security Pacific – California United Bank (1992 – Santa Monica Bank U.S. Bank (2001 – California United Bank (Current)
12
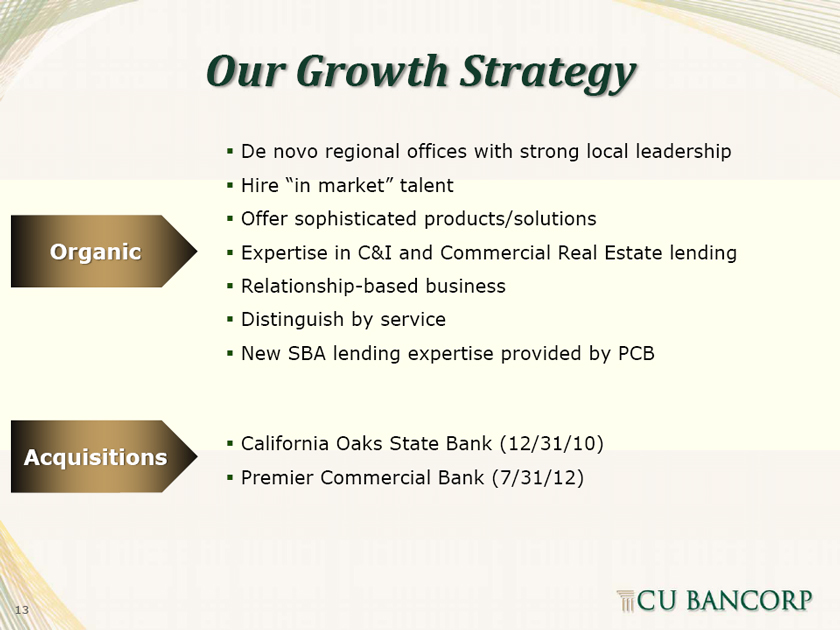
Our Growth Strategy
Organic
De novo regional offices with strong local leadership Hire “in market” talent Offer sophisticated products/solutions Expertise in C&I and Commercial Real Estate lending Relationship-based business Distinguish by service New SBA lending expertise provided by PCB
Acquisitions
California Oaks State Bank (12/31/10) Premier Commercial Bank (7/31/12)
13
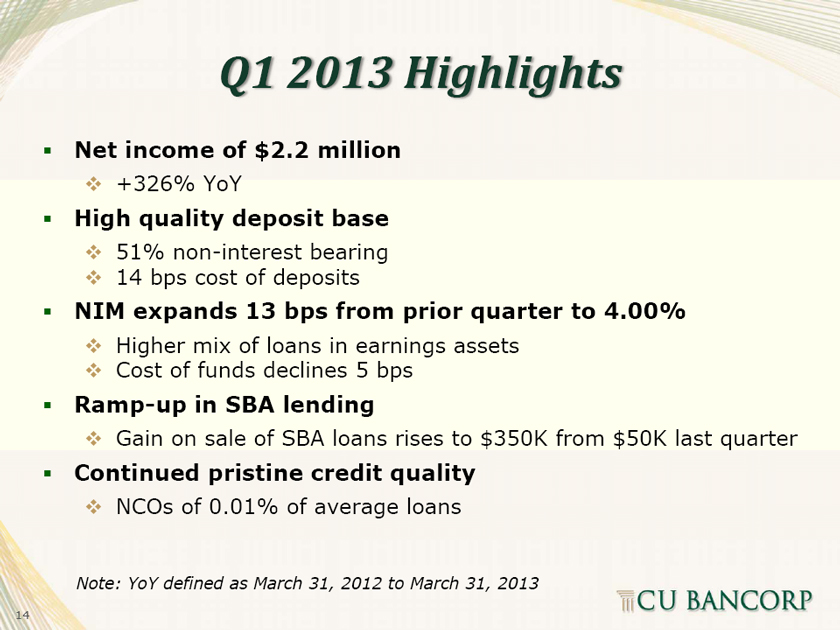
Q1 2013 Highlights Cost of funds declines 5 bps Gain on sale of SBA loans rises to $350K from $50K last quarter NCOs of 0.01% of average loans defined as March 31, 2012 to March 31, 2013 +326% YoY 51% non-interest bearing 14 bps cost of deposits Higher mix of loans in earnings assets
Net income of $2.2 million High quality deposit base NIM expands 13 bps from prior quarter to 4.00% Ramp-up in SBA lending Continued pristine credit quality Note: YoY
14
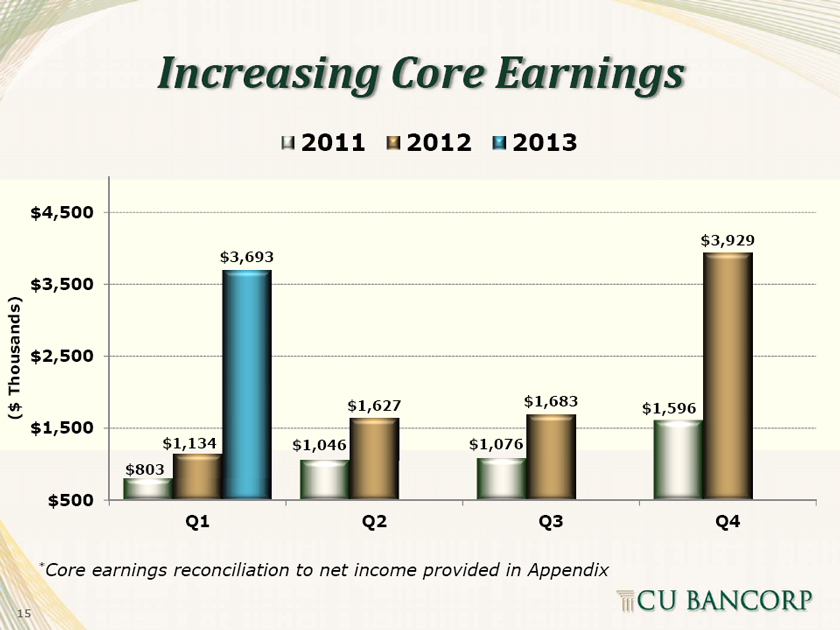
$3,929 Q4 $1,596 2013 $1,683 Q3 $1,076
2012
$1,627 Q2 2011 $1,046 $3,693
Increasing Core Earnings $1,134 Q1
$803
$500 Core earnings reconciliation to net income provided in Appendix $4,500 $3,500 $2,500 $1,500 *
15
Thousands) ($
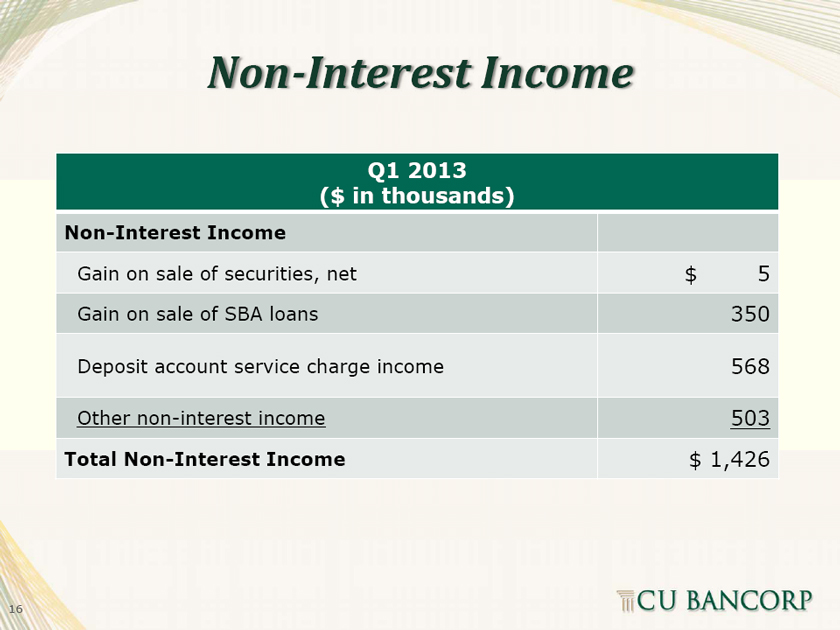
Q1 2013 ($ in thousands) income
Non-Interest Income
interest account service charge income —non on sale of securities, net Gain on sale of SBA loans
Non-Interest Income Gain Deposit Other Total Non-Interest Income
16
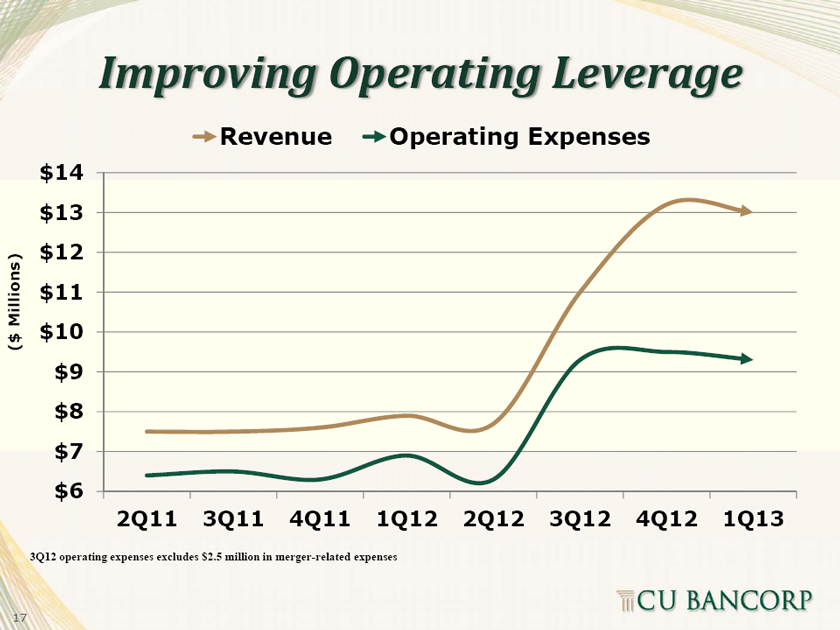
1Q13 4Q12 3Q12
Operating Expenses 2Q12 1Q12
Revenue 4Q11 3Q11
Improving Operating Leverage 2Q11
$14 $13 $12 $11 $10 $9 $8 $7 $6 3Q12 operating expenses excludes $2.5 million in merger-related expenses
17
Millions) ($
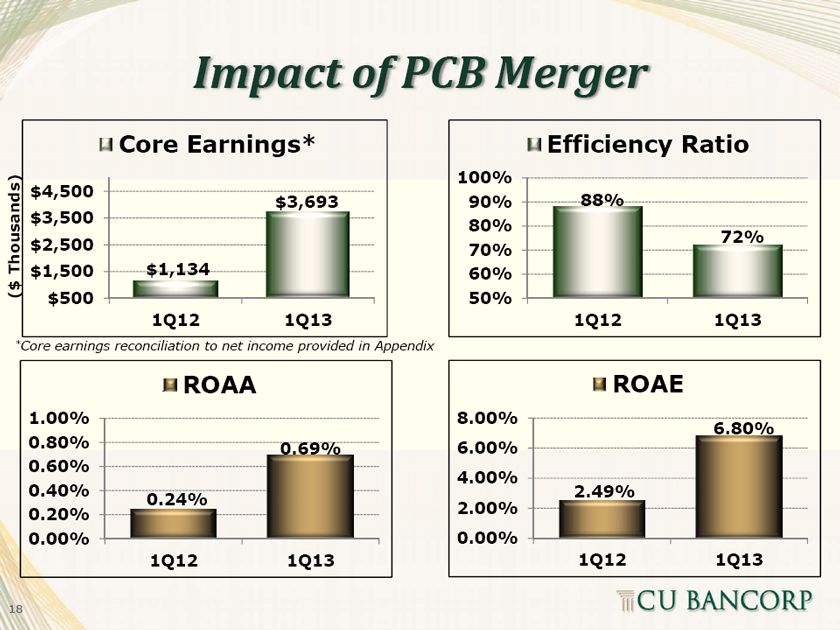
Impact of PCB Merger
$3,693 1Q13
Core Earnings* $1,134 1Q12
$4,500 $3,500 $2,500 $1,500 $500 Core earnings reconciliation to net income provided in Appendix
Thousands) ($ *
72% 1Q13
Efficiency Ratio 88% 1Q12
100% 90% 80% 70% 60% 50%
0.69% 1Q13
ROAA
0.24% 1Q12 1.00% 0.80% 0.60% 0.40% 0.20% 0.00%
6.80% 1Q13
ROAE
2.49% 1Q12 8.00% 6.00% 4.00% 2.00% 0.00%
18
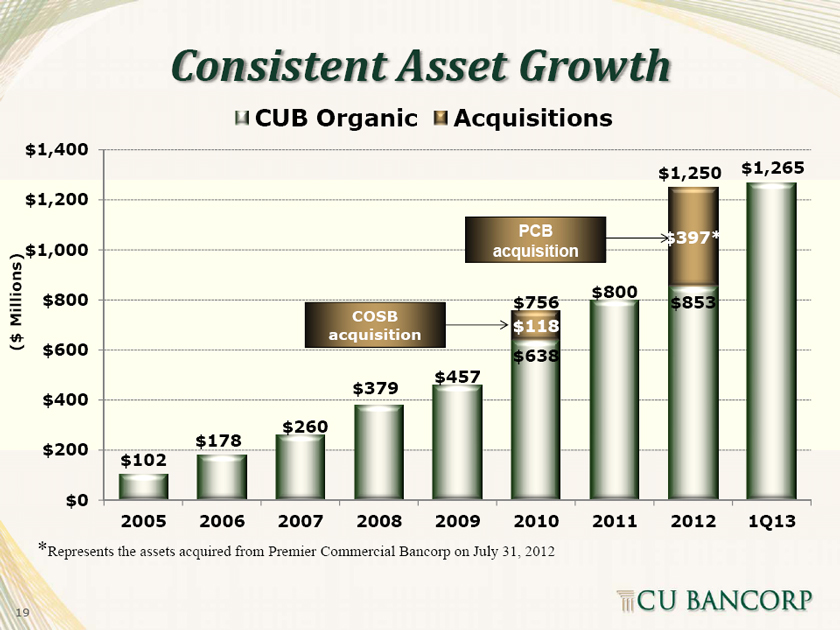
$1,265 1Q13 $1,250 $397* $853 2012 $800 2011 Acquisitions PCB acquisition $756 $118 $638 2010 $457 2009
COSB acquisition $379 2008
CUB Organic $260 2007
Consistent Asset Growth $178 2006
$102 2005 $800 $600 $400 $200 $0 Represents the assets acquired from Premier Commercial Bancorp on July 31, 2012 $1,400 $1,200 $1,000 *
19
Millions) ($
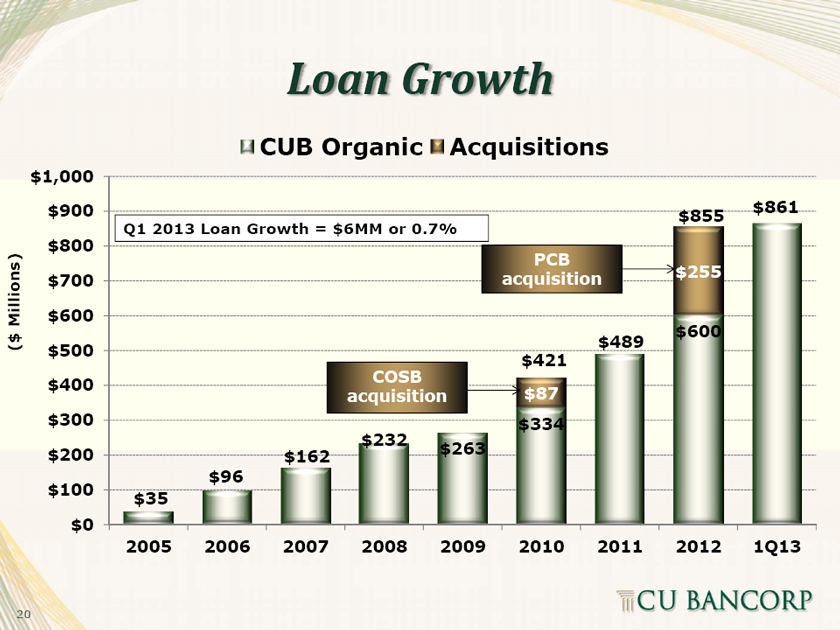
$861 1Q13 $855 $255 $600 2012 $489 2011 Acquisitions PCB acquisition $421 $87 $334 2010 $263 2009 Loan Growth COSB acquisition $232 2008
CUB Organic $162 2007
$96 2006
Q1 2013 Loan Growth = $6MM or 0.7% $35 2005 $1,000 $900 $800 $700 $600 $500 $400 $300 $200 $100 $0
20
Millions) ($
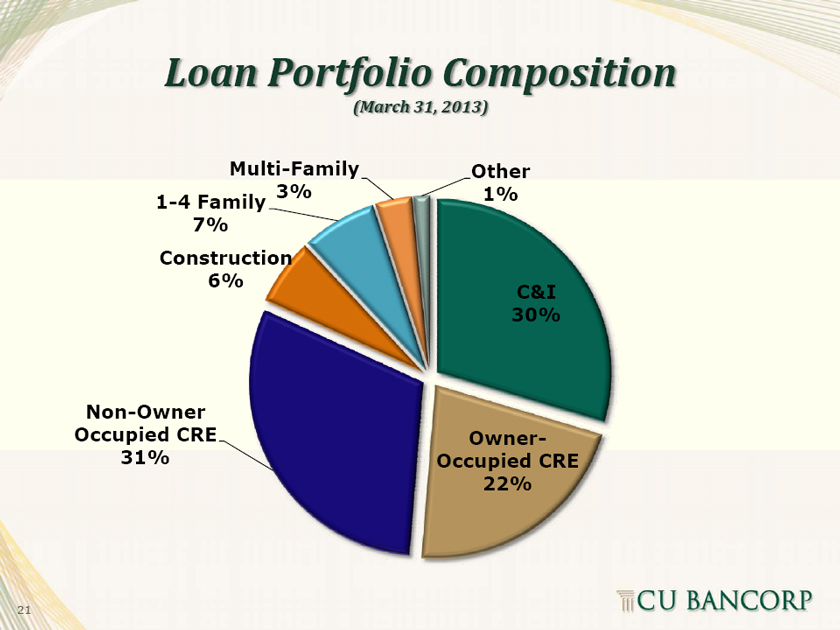
C&I 30%
Other 1% Owner—Occupied CRE 22%
(March 31, 2013)
Multi-Family 3% Loan Portfolio Composition 1-4 Family 7% Construction 6%
Non-Owner Occupied CRE 31%
21
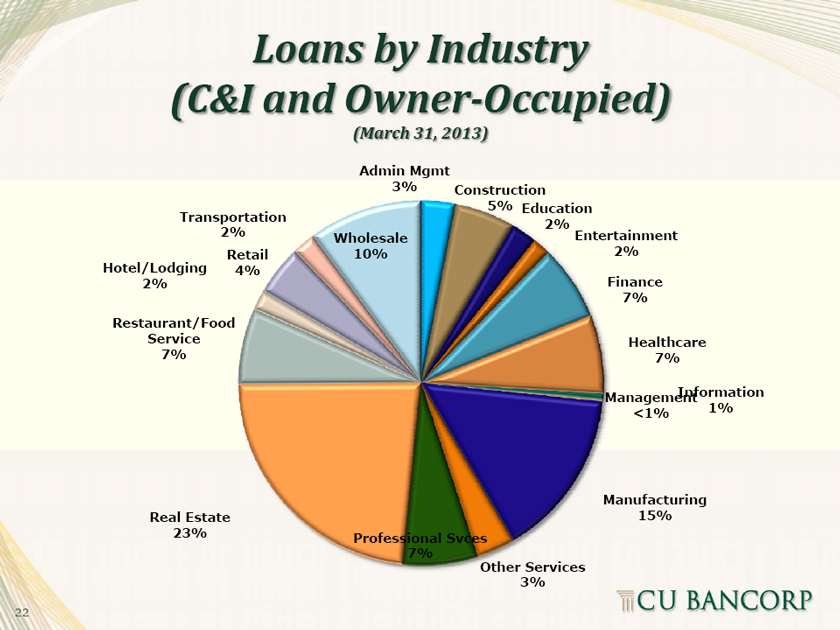
Information 1%
Healthcare 7% <1% 15% Entertainment 2% Finance 7% Management Manufacturing Education 2%
3% Construction 5% Other Services 7% Admin Mgmt 3% Loans by Industry (March 31, 2013) Wholesale 10% Professional Svces Retail 4% Transportation 2%
(C&I and Owner-Occupied) Service 7% Real Estate 23%
Hotel/Lodging 2% Restaurant/Food
22
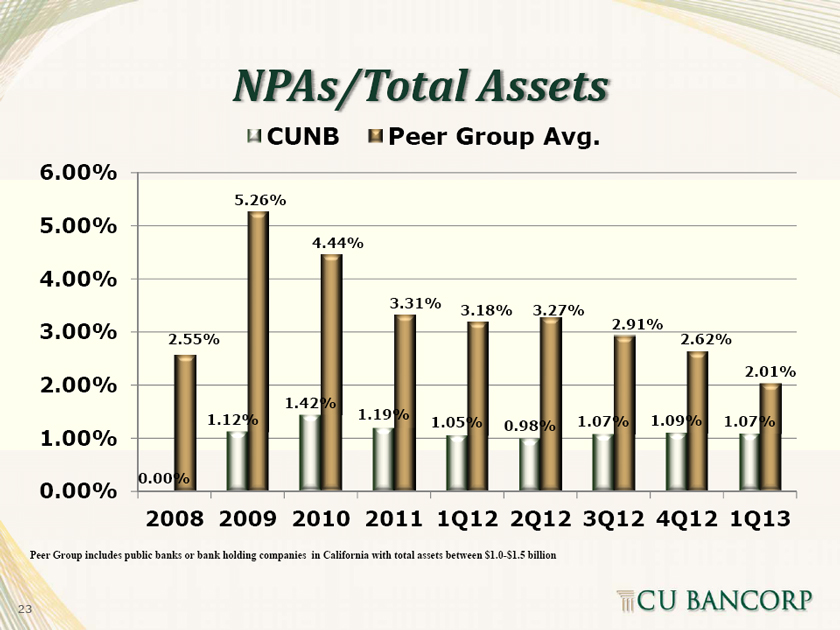
2.01% 1.07% 2.62% 1.09% 2.91% 1.07% 3.27% 0.98%
3.18% 1Q12 2Q12 3Q12 4Q12 1Q13
1.05%
Peer Group Avg. 3.31% 2011
1.19%
4.44% 2010 in California with total assets between $1.0-$1.5 billion
CUNB 1.42%
NPAs/Total Assets 5.26% 2009
1.12%
2.55% 2008 0.00%
6.00% 5.00% 4.00% 3.00% 2.00% 1.00% 0.00% Peer Group includes public banks or bank holding companies
23
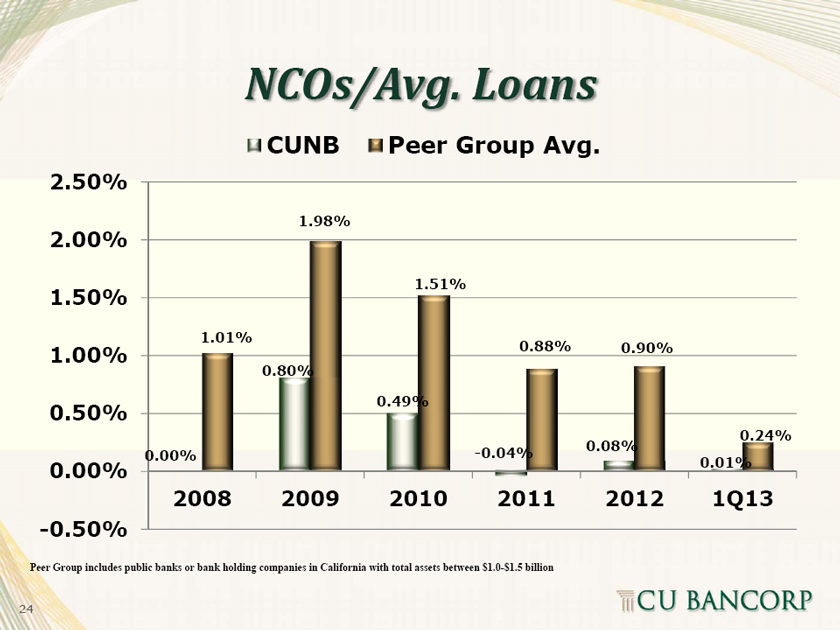
0.24% 1Q13 0.01% 0.90% 2012 0.08% 0.88% 2011—0.04%
Peer Group Avg. 1.51% 2010
0.49%
CUNB 1.98% 2009
NCOs/Avg. Loans 0.80%
1.01% 2008 0.00%
2.50% 2.00% 1.50% 1.00% 0.50% 0.00% —0.50% Peer Group includes public banks or bank holding companies in California with total assets between $1.0-$1.5 billion
24
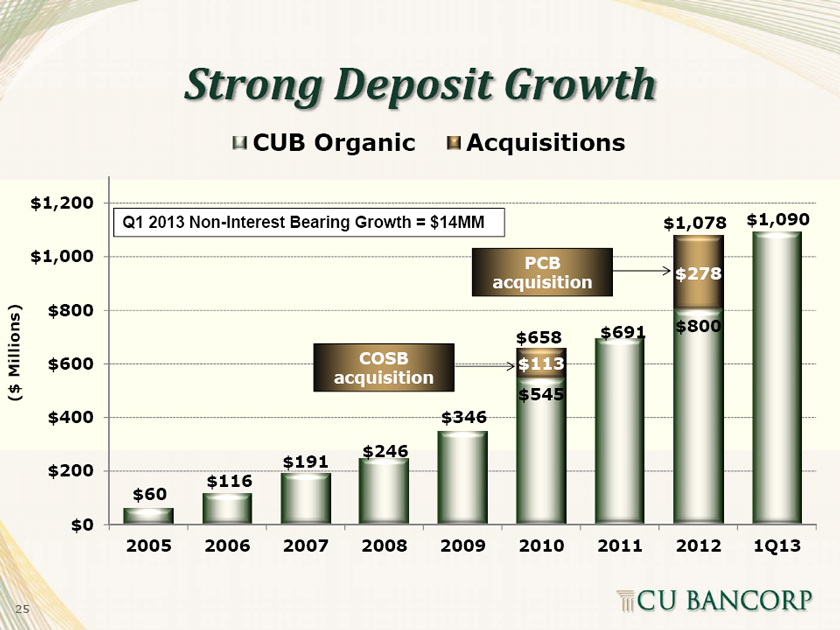
$1,090 1Q13 $1,078 $278 $800 2012 $691 2011 Acquisitions PCB acquisition $658 $113 $545 2010 $346 2009 COSB acquisition $246 2008
CUB Organic $191 2007
Strong Deposit Growth $116 2006
Q1 2013 Non-Interest Bearing Growth = $14MM $60 2005 $1,200 $1,000 $800 $600 $400 $200 $0
25
Millions) ($
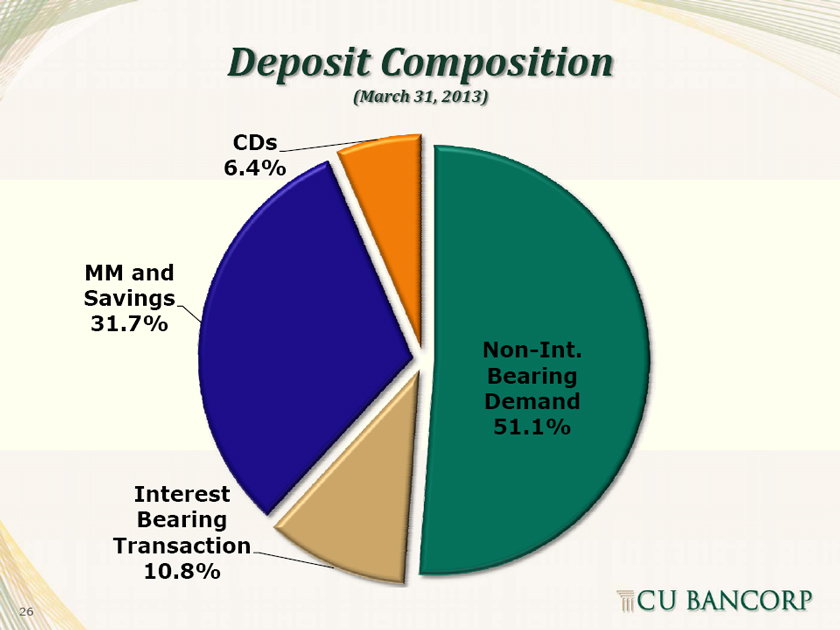
Non-Int. Bearing Demand 51.1%
(March 31, 2013)
Deposit Composition CDs 6.4%
Interest Bearing Transaction 10.8% MM and Savings 31.7%
26
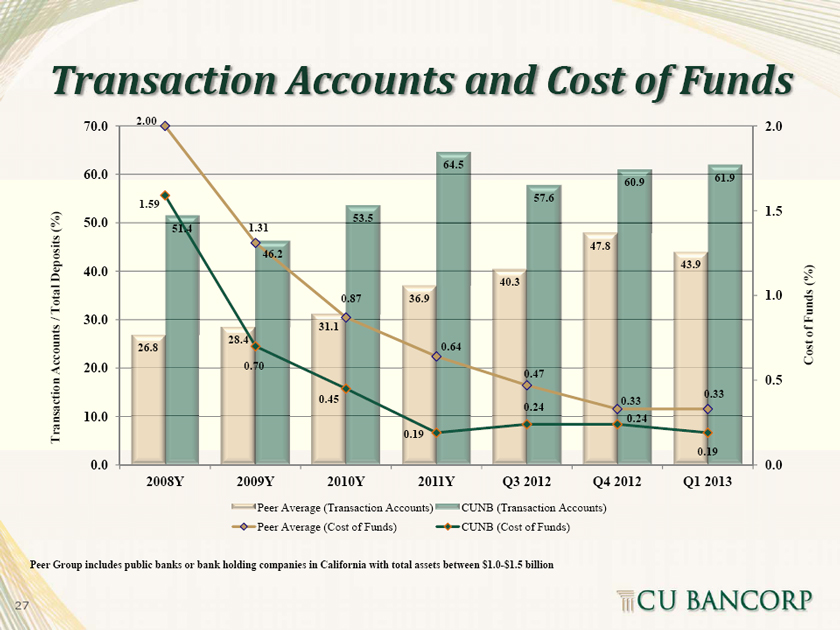
Cost of Funds (%)
2.0 1.5 1.0 0.5 0.0
61.9
0.33 0.19 Q1 2013 43.9
60.9 0.33 0.24 Q4 2012 47.8
57.6 0.47 0.24 Q3 2012
40.3 CUNB (Transaction Accounts) CUNB (Cost of Funds)
64.5 0.64 2011Y
36.9 0.19 53.5 0.87 2010Y
31.1 0.45
46.2 Peer Average (Transaction Accounts) Peer Average (Cost of Funds)
1.31 0.70 2009Y
28.4
51.4 2008Y
2.00 1.59 26.8
Transaction Accounts and Cost of Funds 70.0 60.0 50.0 40.0 30.0 20.0 10.0 0.0
(%)Deposits / Total Accounts Transaction Peer Group includes public banks or bank holding companies in California with total assets between $1.0-$1.5 billion
27
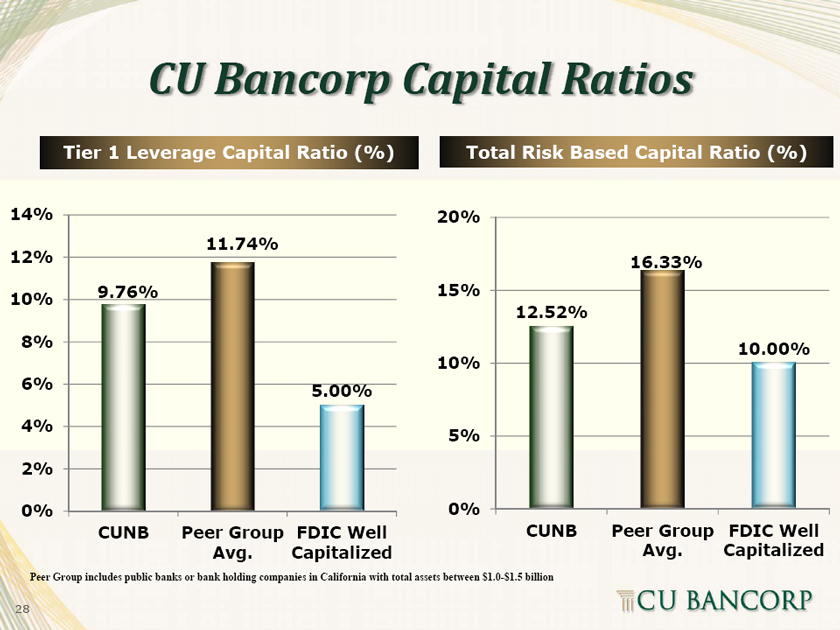
CU Bancorp Capital Ratios
5.00% FDIC Well Capitalized 11.74% Peer Group Avg.
Tier 1 Leverage Capital Ratio (%) 9.76% CUNB
14% 12% 10% 8% 6% 4% 2% 0%
10.00% FDIC Well Capitalized 16.33% Peer Group Avg.
Total Risk Based Capital Ratio (%) 12.52% CUNB
20% 15% 10% 5% 0%
Peer Group includes public banks or bank holding companies in California with total assets between $1.0-$1.5 billion
28
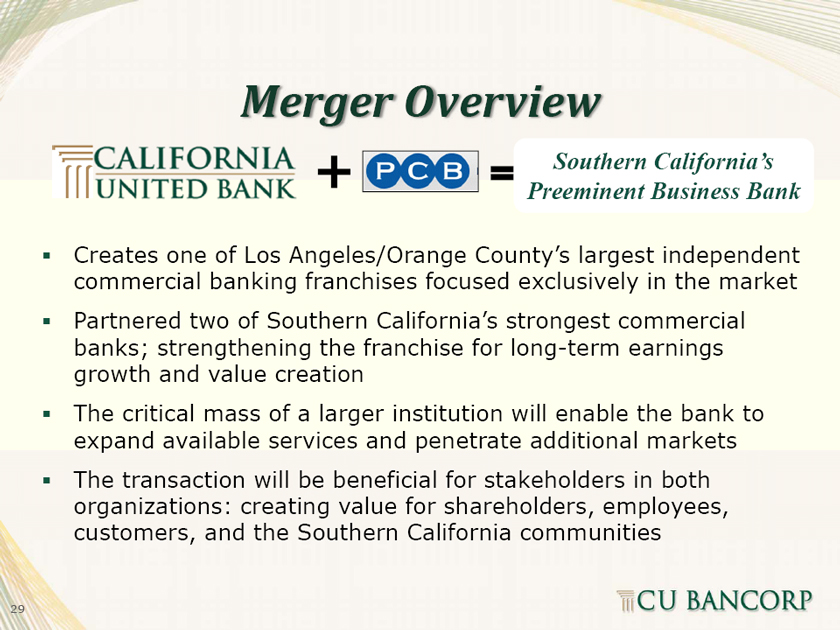
Southern California’s Preeminent Business Bank
Merger Overview Creates one of Los Angeles/Orange County’s largest independent commercial banking franchises focused exclusively in the market
Partnered two of Southern California’s strongest commercial banks; strengthening the franchise for long-term earnings growth and value creation The critical mass of a larger institution will enable the bank to expand available services and penetrate additional markets The transaction will be beneficial for stakeholders in both organizations: creating value for shareholders, employees, customers, and the Southern California communities
29
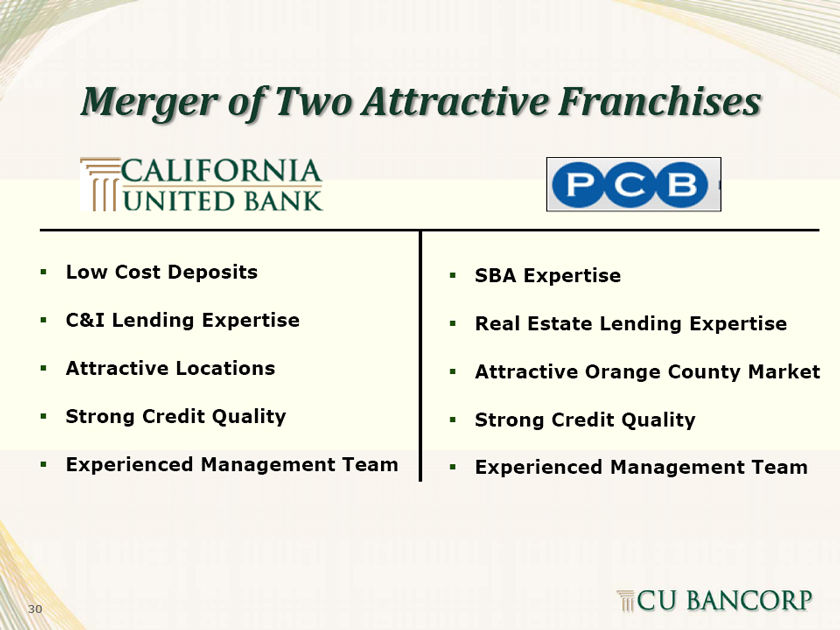
Merger of Two Attractive Franchises
Low Cost Deposits C&I Lending Expertise Attractive Locations Strong Credit Quality Experienced Management Team
SBA Expertise Real Estate Lending Expertise Attractive Orange County Market Strong Credit Quality Experienced Management Team
30
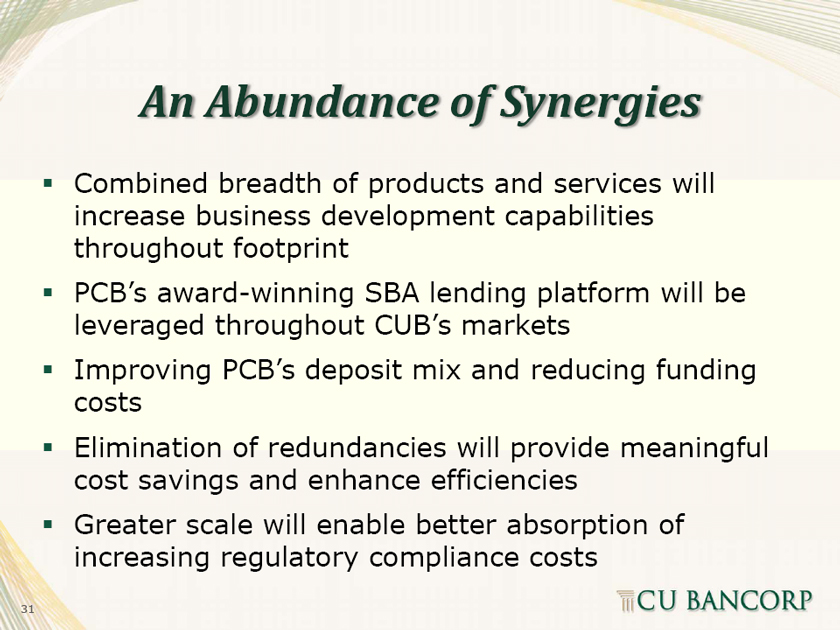
An Abundance of Synergies Combined breadth of products and services will increase business development capabilities throughout footprint leveraged throughout CUB’s markets increasing regulatory compliance costs PCB’s award-winning SBA lending platform will be Improving PCB’s deposit mix and reducing funding costs Elimination of redundancies will provide meaningful cost savings and enhance efficiencies Greater scale will enable better absorption of
31
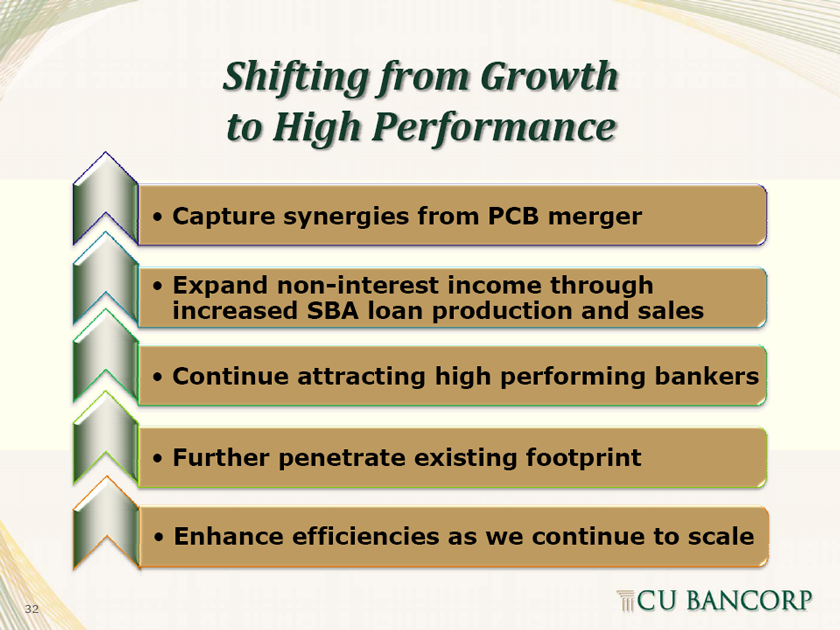
Shifting from Growth to High Performance Capture synergies from PCB merger Expand non-interest income through increased SBA loan production and sales Continue attracting high performing bankers Further penetrate existing footprint Enhance efficiencies as we continue to scale
• • • • •
32
Contact Information Karen Schoenbaum, CFO kschoenbaum@cunb.com (818) 257-7700 For more information, please contact:
33
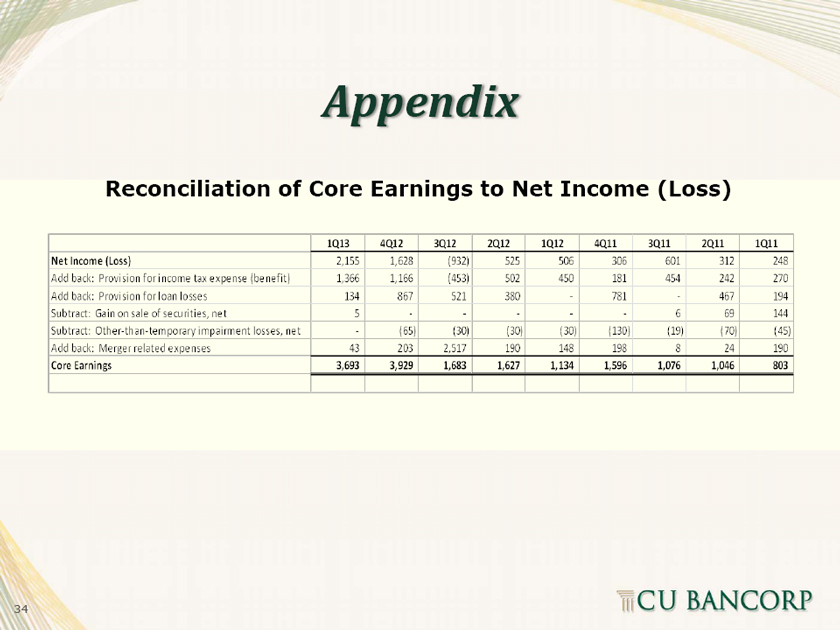
Appendix Reconciliation of Core Earnings to Net Income (Loss)
34