|
Exhibit 99.1 
|
Exhibit 99.1
CU Bancorp
Investor Presentation
as of March 31, 2014
… a better banking experience
Forward-Looking Statements
This presentation contains forward-looking statements about CU Bancorp (the “Company”) for which the Company claims the protection of the safe harbor provisions contained in the Private Securities Litigation Reform Act of 1995, including forward-looking statements relating to the Company’s current business plan and expectations regarding future operating results. Forward-looking statements are based on management’s knowledge and belief as of today and include information concerning the Company’s possible or assumed future financial condition, and its results of operations, business and earnings outlook. These forward-looking statements are subject to risks and uncertainties. A number of factors, some of which are beyond the Company’s ability to control or predict, could cause future results to differ materially from those contemplated by such forward-looking statements. These factors include (1) difficult and adverse conditions in the global and domestic capital and credit markets and the state of California, (2) significant costs or changes in business practices required by new banking laws or regulations such as those related to Basel III, (3) weakness in general business and economic conditions, which may affect, among other things, the level of growth, income, non-performing assets, charge-offs and provision expense, (4) changes in market rates and prices which may adversely impact the value of financial products, (5) changes in the interest rate environment and market liquidity which may reduce interest margins and impact funding sources, (6) competition in the Company’s markets, (7) changes in the financial performance and/or condition of the Company’s borrowers, (8) increases in Federal Deposit Insurance Corporation premiums due to market developments and regulatory changes, (9) earthquake, fire, pandemic, drought or other natural disasters, (10) changes in accounting policies or procedures as may be required by the Financial Accounting Standards Board or regulatory agencies, (11) international instability, downgrading or defaults on sovereign debt, including that of the United States of America or increased oil prices, (12) additional downgrades of securities issued by U.S. government sponsored or supported entities such as Fannie Mae and Freddie Mac, (13) the impact of the Dodd-Frank Act, (14) the effect of U.S. federal government debt, budget and tax matters, (15) changes in the level of early payoffs on acquired loans and the amount of fair value discount on these loans recognized each quarter, and (16) the success of the Company at managing the risks involved in the foregoing.
Forward-looking statements speak only as of the date they are made, and the Company does not undertake to update forward-looking statements to reflect circumstances or events that occur after the date the statements are made, or to update earnings guidance, including the factors that influence earnings.
For a more complete discussion of these risks and uncertainties, see CU Bancorp’s reports on Form 10-K and 10-Q as filed with the
Securities and Exchange Commission and the Company’s press releases.
2
Investment Highlights ……………………….……… 4
Earnings Review …………………….……………… 13
Appendix ……………………….…………………… 22
3
Investment Highlights
Premier community-based business banking franchise serving large and diverse market
Strong organic loan growth
Attractive low-cost core deposit base
Exceptional credit quality
Growing visibility in the investment community
4
Premier Business Banking Franchise
$1.4 billion in assets, achieved by experienced management team* in nine years, through organic growth and two successful acquisitions
14th largest publicly-owned bank by assets in combined Los Angeles, Orange and Ventura counties 268th largest publicly-owned bank by assets in U.S.
Asset CAGR of 39% since inception in 2005 through 12/31/13
Footprint includes eight branches covering L.A., Orange and Ventura counties
*See appendix for management experience
5
Sophisticated Relationship Management Team offers
Solutions for Small- and Medium-Sized Businesses
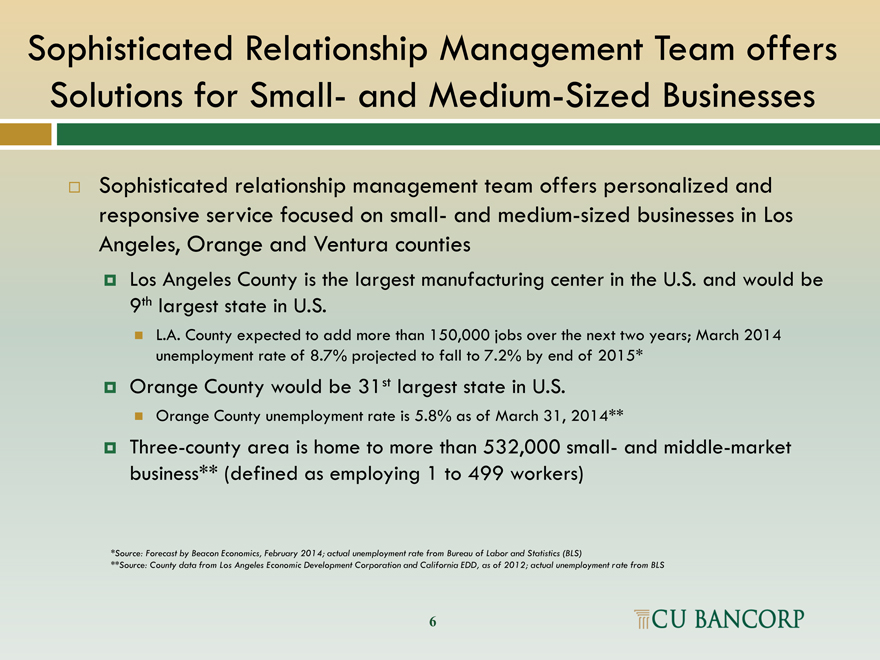
Sophisticated relationship management team offers personalized and responsive service focused on small- and medium-sized businesses in Los Angeles, Orange and Ventura counties
Los Angeles County is the largest manufacturing center in the U.S. and would be 9th largest state in U.S.
L.A. County expected to add more than 150,000 jobs over the next two years; March 2014 unemployment rate of 8.7% projected to fall to 7.2% by end of 2015*
Orange County would be 31st largest state in U.S.
Orange County unemployment rate is 5.8% as of March 31, 2014**
Three-county area is home to more than 532,000 small- and middle-market business** (defined as employing 1 to 499 workers)
*Source: Forecast by Beacon Economics, February 2014; actual unemployment rate from Bureau of Labor and Statistics (BLS)
**Source: County data from Los Angeles Economic Development Corporation and California EDD, as of 2012; actual unemployment rate from BLS
6
Franchise Growth Strategies
Organic Growth
Offer expertise in C&I and commercial real estate lending to small and middle-market businesses Provide customers with sophisticated products and solutions Leverage relationship-based banking approach and superior service Grow SBA lending platform expertise acquired in recent acquisition
Continue recruiting “in market” talent from competitors
Growth by Acquisition
Strong management team experienced with successful, accretive acquisitions
California Oaks State Bank (12/31/10) Premier Commercial Bank (7/31/12)
7
Strategic Geographic Locations
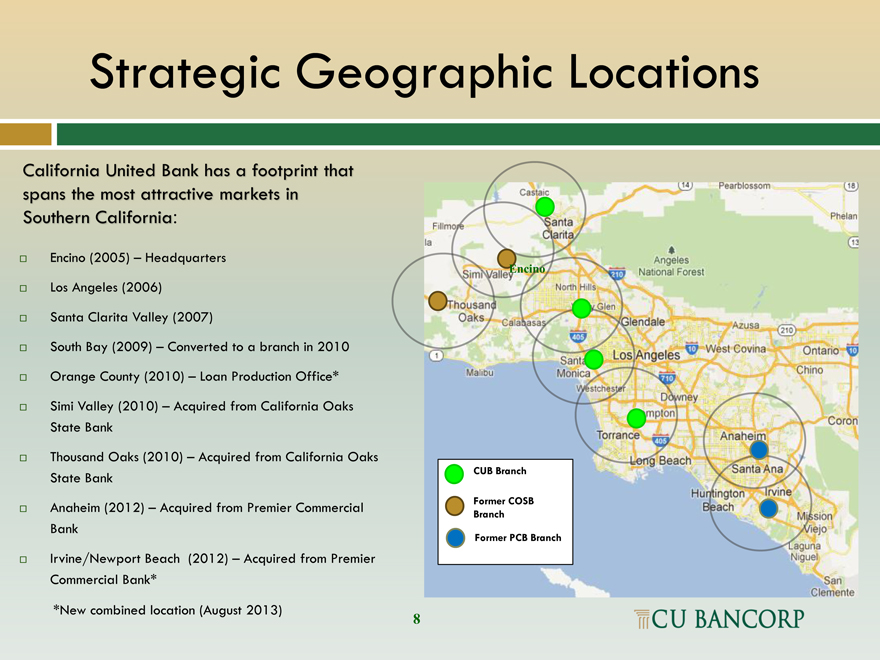
California United Bank has a footprint that spans the most attractive markets in Southern California:
Encino (2005) – Headquarters Los Angeles (2006) Santa Clarita Valley (2007)
South Bay (2009) – Converted to a branch in 2010
Orange County (2010) – Loan Production Office*
Simi Valley (2010) – Acquired from California Oaks State Bank
Thousand Oaks (2010) – Acquired from California Oaks State Bank
Anaheim (2012) – Acquired from Premier Commercial Bank
Irvine/Newport Beach (2012) – Acquired from Premier Commercial Bank*
*New combined location (August 2013)
Encino
CUB Branch
Former COSB Branch
Former PCB Branch
8
Strong Organic Loan Growth
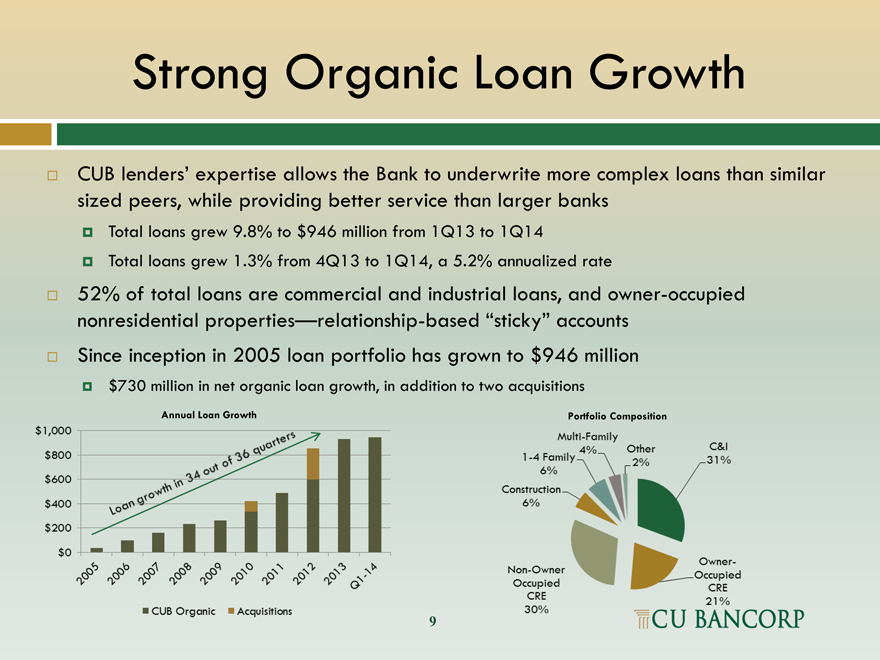
CUB lenders’ expertise allows the Bank to underwrite more complex loans than similar sized peers, while providing better service than larger banks
Total loans grew 9.8% to $946 million from 1Q13 to 1Q14
Total loans grew 1.3% from 4Q13 to 1Q14, a 5.2% annualized rate
52% of total loans are commercial and industrial loans, and owner-occupied nonresidential properties—relationship-based sticky accounts Since inception in 2005 loan portfolio has grown to $946 million
$730 million in net organic loan growth, in addition to two acquisitions
Annual Loan Growth
Portfolio Composition
$1,000
$800
$600
$400
$200
$0
2005
2006
2007
2008
2009
2010
2011
2012
2013
Q1-14
CUB Organic
Acquisitions
Multi-Family 4%
1-4 Family 6%
Construction 6%
Non-Owner Occupied CRE 30%
Other 2%
C&I 31%
Owner-Occupied CRE 21%
9
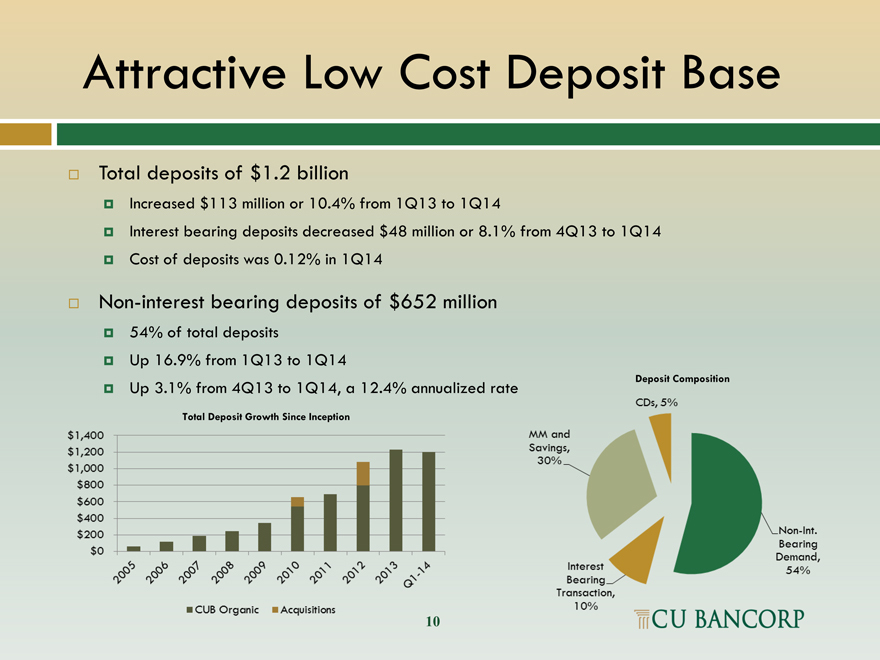
Attractive Low Cost Deposit Base
Total deposits of $1.2 billion
Increased $113 million or 10.4% from 1Q13 to 1Q14
Interest bearing deposits decreased $48 million or 8.1% from 4Q13 to 1Q14
Cost of deposits was 0.12% in 1Q14
Non-interest bearing deposits of $652 million
54% of total deposits
Up 16.9% from 1Q13 to 1Q14
Up 3.1% from 4Q13 to 1Q14, a 12.4% annualized ra
Total Deposit Growth Since Inception
$1,400
$1,200
$1,000
$800
$600
$400
$200
$0
2005
2006
2007
2008
2009
2010
2011
2012
2013
Q1-14
CUB Organic Acquisitions
Deposit Composition
CDs, 5%
MMand Saving 30%
Interest Bearing Transaction, 10%
Non-Int. Bearing Demand, 54%
10
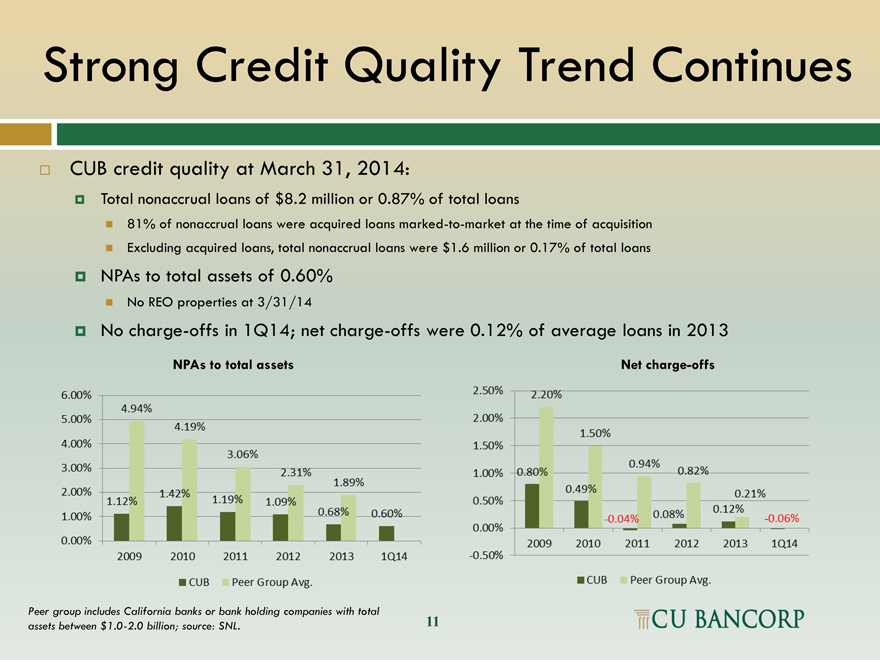
Strong Credit Quality Trend Continues
CUB credit quality at March 31, 2014:
Total nonaccrual loans of $8.2 million or 0.87% of total loans
81% of nonaccrual loans were acquired loans marked-to-market at the time of acquisition Excluding acquired loans, total nonaccrual loans were $1.6 million or 0.17% of total loans
NPAs to total assets of 0.60%
No REO properties at 3/31/14
No charge-offs in 1Q14; net charge-offs were 0.12% of average loans in 2013
Peer group includes California banks or bank holding companies with total assets between $1.0-2.0 billion; source: SNL.
6.00% 5.00% 4.00% 3.00% 2.00% 1.00% 0.00% 2009 2010 2011 2012 2013 1Q14
4.94% 4.19% 3.06% 2.31% 1.89% 0.60% 1.12% 1.42% 1.19% 1.09% 0.68%
CUB Peer Group Avg.
Net charge-offs
2.50% 2.00% 1.50% 1.00% 0.50% 0.00% -0.50% 2009 2010 2011 2012 2013 1Q14
2.20% 1.50% 0.94% 0.82% 0.21% -0.06%
0.80% 0.49% -0.04% 0.08% 0.12%
CUB Peer Group Avg.
11
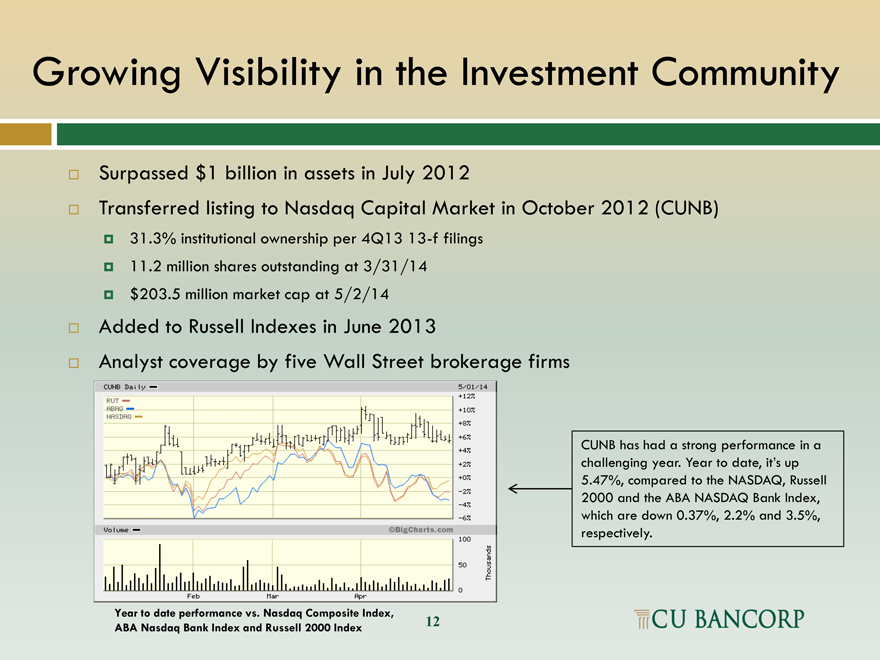
Growing Visibility in the Investment Community
Surpassed $1 billion in assets in July 2012
Transferred listing to Nasdaq Capital Market in October 2012 (CUNB)
31.3% institutional ownership per 4Q13 13-f filings 11.2 million shares outstanding at 3/31/14 $203.5 million market cap at 5/2/14
Added to Russell Indexes in June 2013
Analyst coverage by five Wall Street brokerage firms
CUNB has had a strong performance in a challenging year. Year to date, it’s up
5.47%, compared to the NASDAQ, Russell 2000 and the ABA NASDAQ Bank Index, which are down 0.37%, 2.2% and 3.5%, respectively.
Year to date performance vs. Nasdaq Composite Index,
ABA Nasdaq Bank Index and Russell 2000 Index 12
0 50 100 -6% -4% +0% +% +6% +8% +10% +12%
Feb Mar Apr
Volume – CUNB Daily – 5/01/14
RUT ABAQ NASDAQ
Thousands
12
Earnings Review First Quarter 2014
13
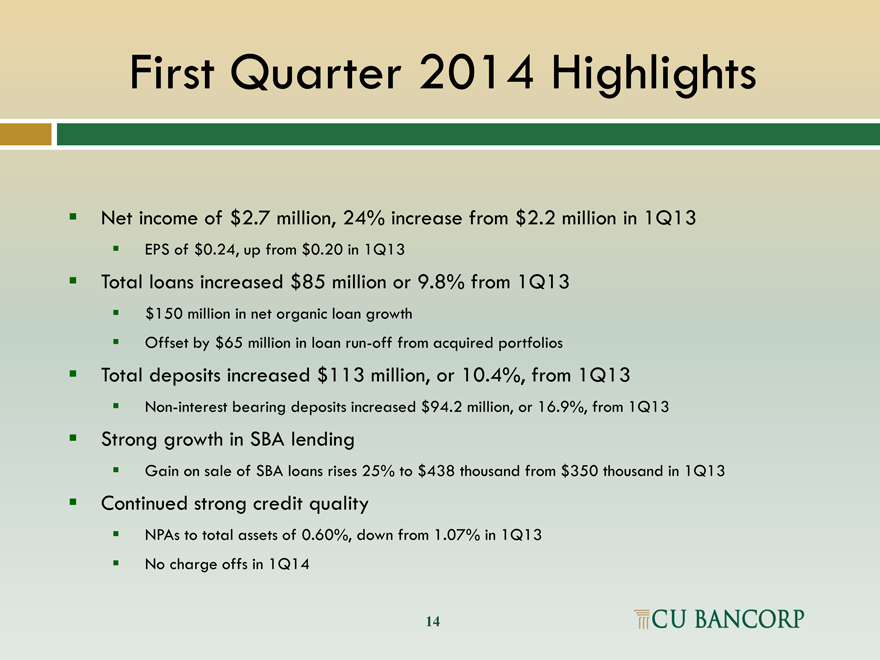
First Quarter 2014 Highlights
Net income of $2.7 million, 24% increase from $2.2 million in 1Q13
EPS of $0.24, up from $0.20 in 1Q13
Total loans increased $85 million or 9.8% from 1Q13
$150 million in net organic loan growth
Offset by $65 million in loan run-off from acquired portfolios
Total deposits increased $113 million, or 10.4%, from 1Q13
Non-interest bearing deposits increased $94.2 million, or 16.9%, from 1Q13
Strong growth in SBA lending
Gain on sale of SBA loans rises 25% to $438 thousand from $350 thousand in 1Q13
Continued strong credit quality
NPAs to total assets of 0.60%, down from 1.07% in 1Q13 No charge offs in 1Q14
14
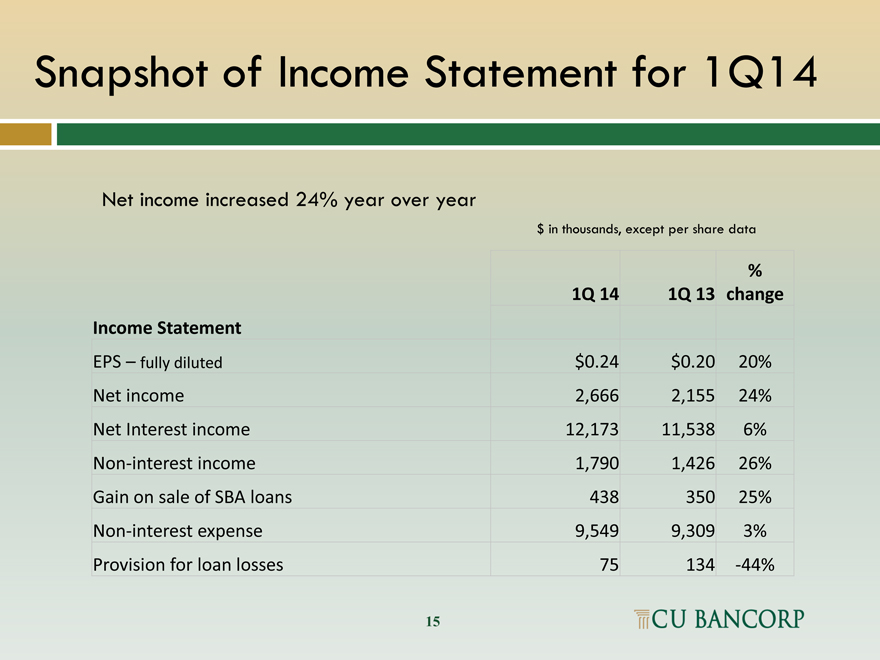
Snapshot of Income Statement for 1Q14
Net income increased 24% year over year
$ in thousands, except per share data
%
1Q 14 1Q 13 change
Income Statement
EPS – fully diluted $0.24 $0.20 20%
Net income 2,666 2,155 24%
Net Interest income 12,173 11,538 6%
Non-interest income 1,790 1,426 26%
Gain on sale of SBA loans 438 350 25%
Non-interest expense 9,549 9,309 3%
Provision for loan losses 75 134 -44%
15
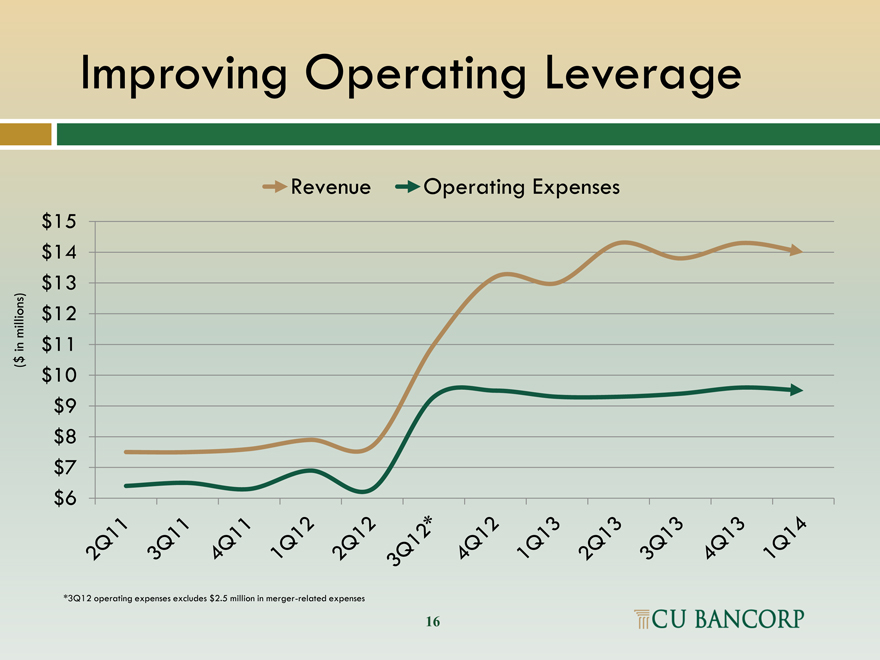
Improving Operating Leverage
Revenue
Operating Expenses
($ in millions)
$15 $14 $13 $12 $11 $10 $9 $8 $7 $6
2Q11
3Q11
4Q11
1Q12
2Q12
3Q12*
4Q12
1Q13
2Q13
3Q13
4Q13
1Q14
*3Q12 operating expenses excludes $2.5 million in merger-related expenses
16
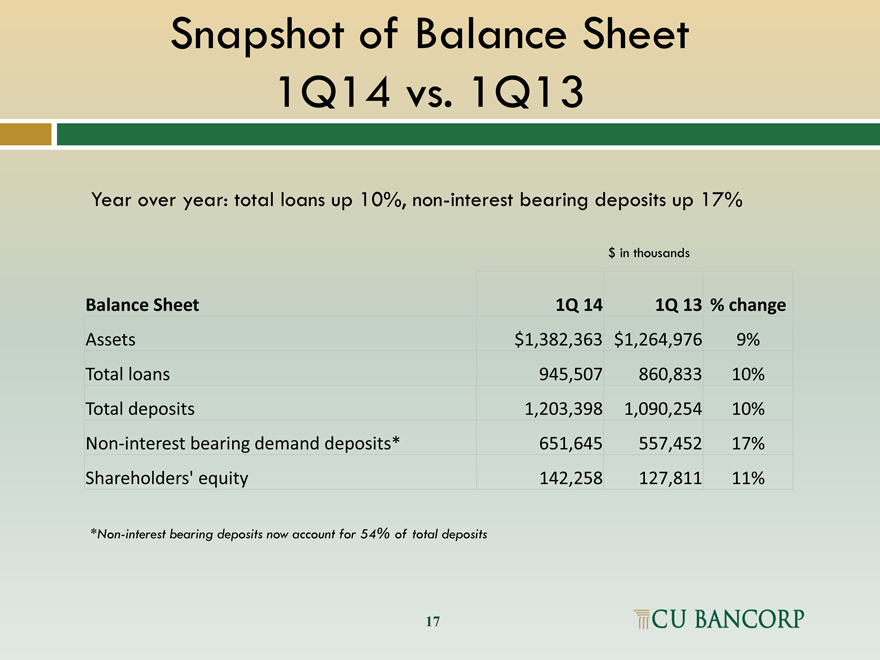
Snapshot of Balance Sheet
1Q14 vs. 1Q13
Year over year: total loans up 10%, non-interest bearing deposits up 17%
$ in thousands
Balance Sheet 1Q 14 1Q 13 % change
Assets $1,382,363 $1,264,976 9%
Total loans 945,507 860,833 10%
Total deposits 1,203,398 1,090,254 10%
Non-interest bearing demand deposits* 651,645 557,452 17%
Shareholders’ equity 142,258 127,811 11%
*Non-interest bearing deposits now account for 54% of total deposits
17
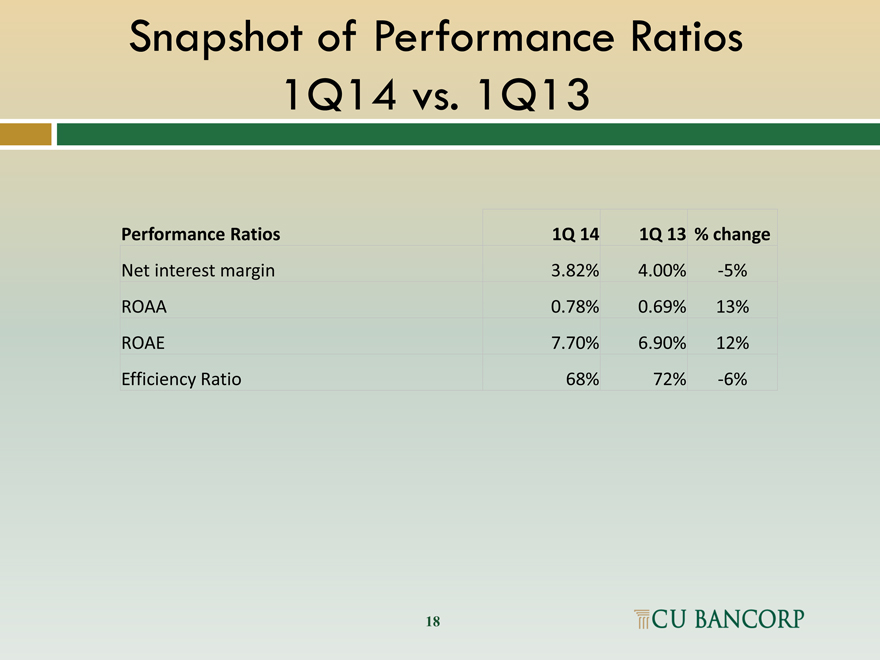
Snapshot of Performance Ratios
1Q14 vs. 1Q13
Performance Ratios 1Q 14 1Q 13 % change
Net interest margin 3.82% 4.00% -5%
ROAA 0.78% 0.69% 13%
ROAE 7.70% 6.90% 12%
Efficiency Ratio 68% 72% -6%
18
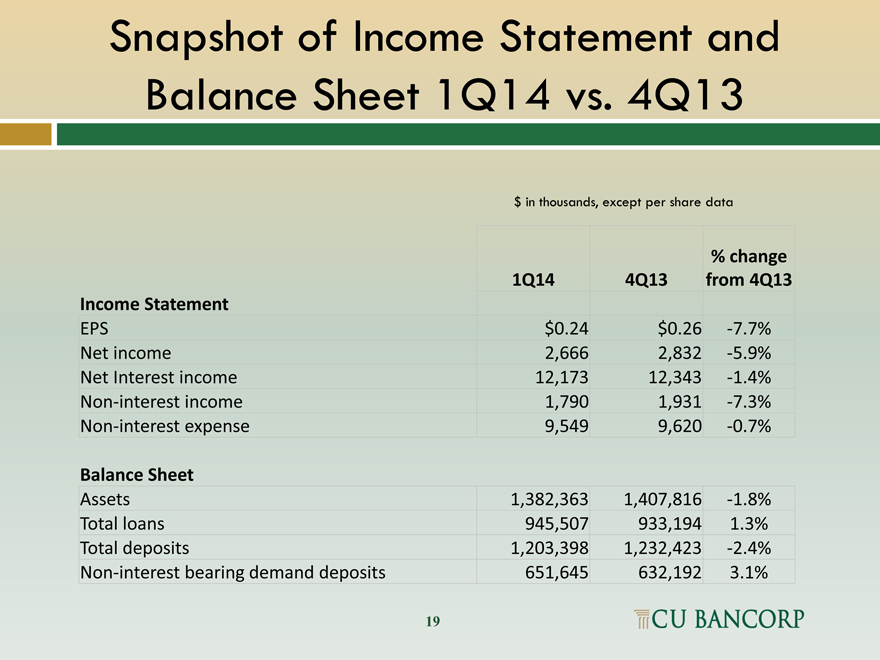
Snapshot of Income Statement and
Balance Sheet 1Q14 vs. 4Q13
$ in thousands, except per share data
% change
1Q14 4Q13 from 4Q13
Income Statement
EPS $0.24 $0.26 -7.7%
Net income 2,666 2,832 -5.9%
Net Interest income 12,173 12,343 -1.4%
Non-interest income 1,790 1,931 -7.3%
Non-interest expense 9,549 9,620 -0.7%
Balance Sheet
Assets 1,382,363 1,407,816 -1.8%
Total loans 945,507 933,194 1.3%
Total deposits 1,203,398 1,232,423 -2.4%
Non-interest bearing demand deposits 651,645 632,192 3.1%
19
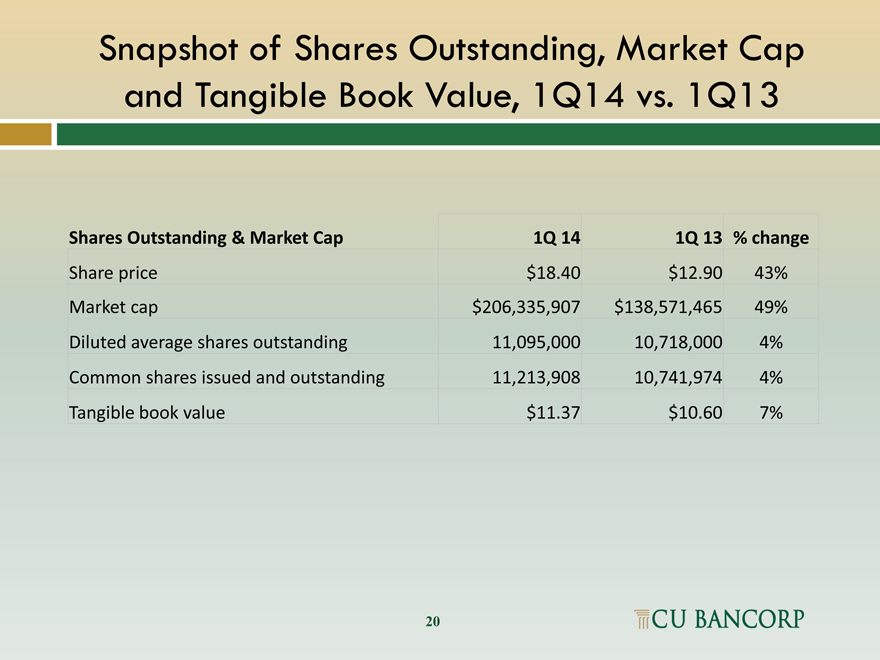
Snapshot of Shares Outstanding, Market Cap and Tangible Book Value, 1Q14 vs. 1Q13
Shares Outstanding & Market Cap 1Q 14 1Q 13 % change
Share price $18.40 $12.90 43%
Market cap $206,335,907 $138,571,465 49%
Diluted average shares outstanding 11,095,000 10,718,000 4%
Common shares issued and outstanding 11,213,908 10,741,974 4%
Tangible book value $11.37 $10.60 7%
20
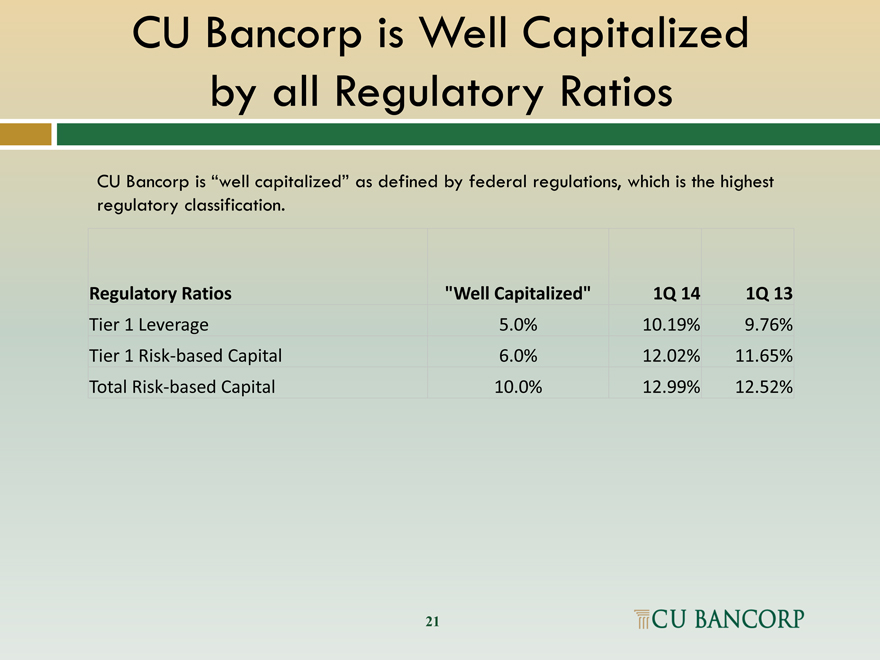
CU Bancorp is Well Capitalized
by all Regulatory Ratios
CU Bancorp is “well capitalized” as defined by federal regulations, which is the highest regulatory classification.
Regulatory Ratios “Well Capitalized” 1Q 14 1Q 13
Tier 1 Leverage 5.0% 10.19% 9.76%
Tier 1 Risk-based Capital 6.0% 12.02% 11.65%
Total Risk-based Capital 10.0% 12.99% 12.52%
21
Appendix
22
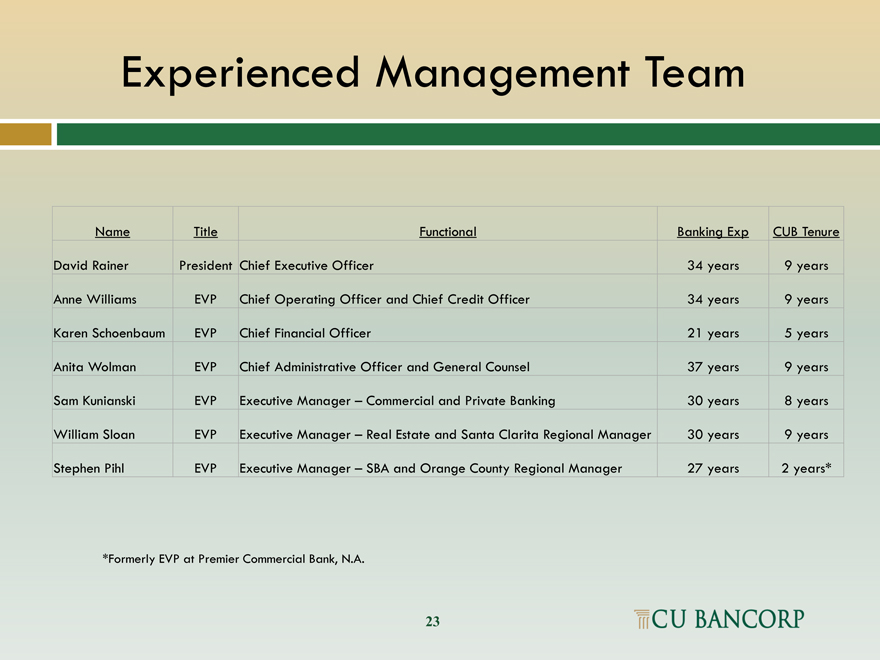
Experienced Management Team
Name Title Functional Banking Exp CUB Tenure
David Rainer President Chief Executive Officer 34 years 9 years
Anne Williams EVP Chief Operating Officer and Chief Credit Officer 34 years 9 years
Karen Schoenbaum EVP Chief Financial Officer 21 years 5 years
Anita Wolman EVP Chief Administrative Officer and General Counsel 37 years 9 years
Sam Kunianski EVP Executive Manager – Commercial and Private Banking 30 years 8 years
William Sloan EVP Executive Manager – Real Estate and Santa Clarita Regional Manager 30 years 9 years
Stephen Pihl EVP Executive Manager – SBA and Orange County Regional Manager 27 years 2 years*
*Formerly EVP at Premier Commercial Bank, N.A.
23
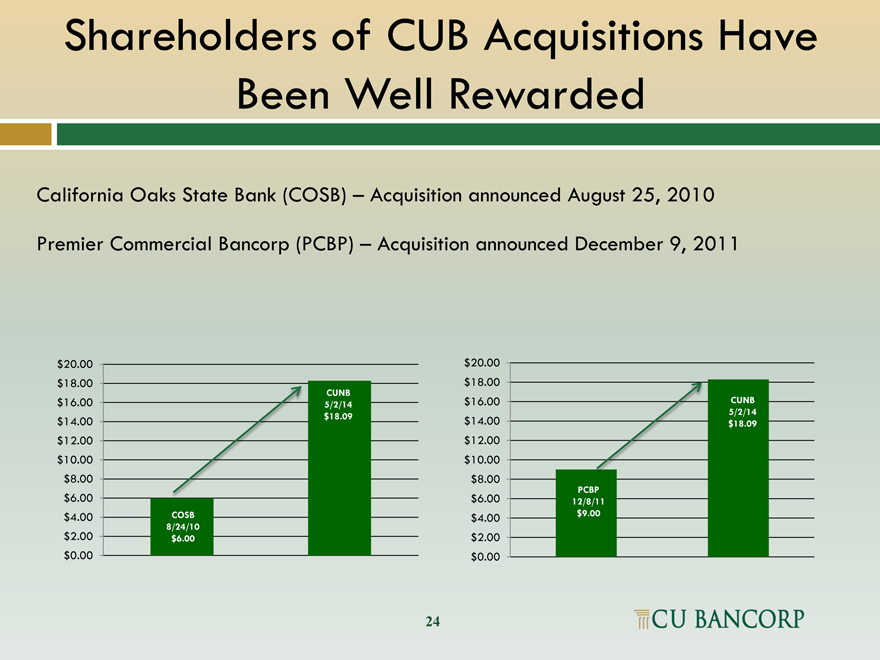
Shareholders of CUB Acquisitions Have
Been Well Rewarded
California Oaks State Bank (COSB) – Acquisition announced August 25, 2010
Premier Commercial Bancorp (PCBP) – Acquisition announced December 9, 2011
$20.00
$18.00
CUNB
$16.00 5/2/14
$14.00 $18.09
$12.00
$10.00
$8.00
$6.00
$4.00 COSB
8/24/10
$2.00 $6.00
$0.00
$20.00
$18.00
$16.00 CUNB
5/2/14
$14.00 $18.09
$12.00
$10.00
$8.00
PCBP
$6.00 12/8/11
$4.00 $9.00
$2.00
$0.00
24
Asset Quality & Allowance for Loan Losses
$ in thousands
Asset Quality 1Q 14 1Q 13 % change
Organic loans on non-accrual $1,585 $1,747 -9%
Acquired loans on non-accrual 6,642 8,727 -24%
sub total 8,227 10,474 -21%
REO 0 3,112 -100%
total non-accrual loans & REO 8,227 13,586 -39%
Net charge offs (recoveries) YTD (145) 96 -251%
Non-accrual loans as % of total loans 0.87% 1.22% -29%
Total non-accrual loans & REO as % of assets 0.60% 1.07% -44%
Allowance for loan losses as % of total loans 1.14% 1.03% 11%
ALL as % of total loans (exluding acquired loans) 1.48% 1.52% -3%
Net YTD charge-offs (recoveries) as % of avg YTD loans -0.02% 0.01% -300%
ALL as % of non-accrual organic loans 682.0% 506.1% 35%
ALL as % of total non-accrual loans (organic & acquired) 131.6% 84.4% 56%
25
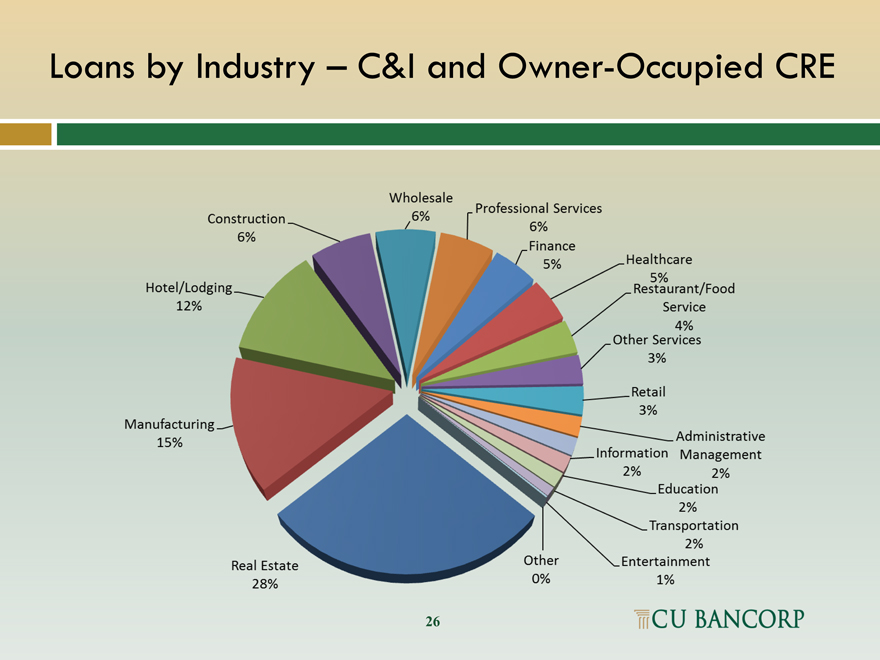
Loans by Industry – C&I and Owner-Occupied CRE
Construction 6%
Hotel/Lodging 12%
Manufacturing 15%
Real Estate 28%
Wholesale 6%
Professional Services 6%
Finance 5%
Healthcare 5%
Restaurant/Food Service 4%
Other Services 3%
Retail 3%
Administrative Management 2%
Education 2%
Information 2%
Transportation 2%
Entertainment 1%
Other 0%
26
Customer Profile
Our customer base reflects the diversity of industries in Southern California
Significant percentage of customers involved in the manufacturing, distribution and services industries
Typical customer has between $10 million and $60 million in annual sales (excluding SBA borrowers)
Typical loan commitment ranges between $1 million and $5 million (excluding SBA loans)
Majority of new customers come from larger banks
Most new business generation results from warm leads provided by referral sources
27